Embed Size (px)
Citation preview
MyHVnet Newsletter
Special focus on 2016 MyHVnet Colloquium
Featured in this Issue:
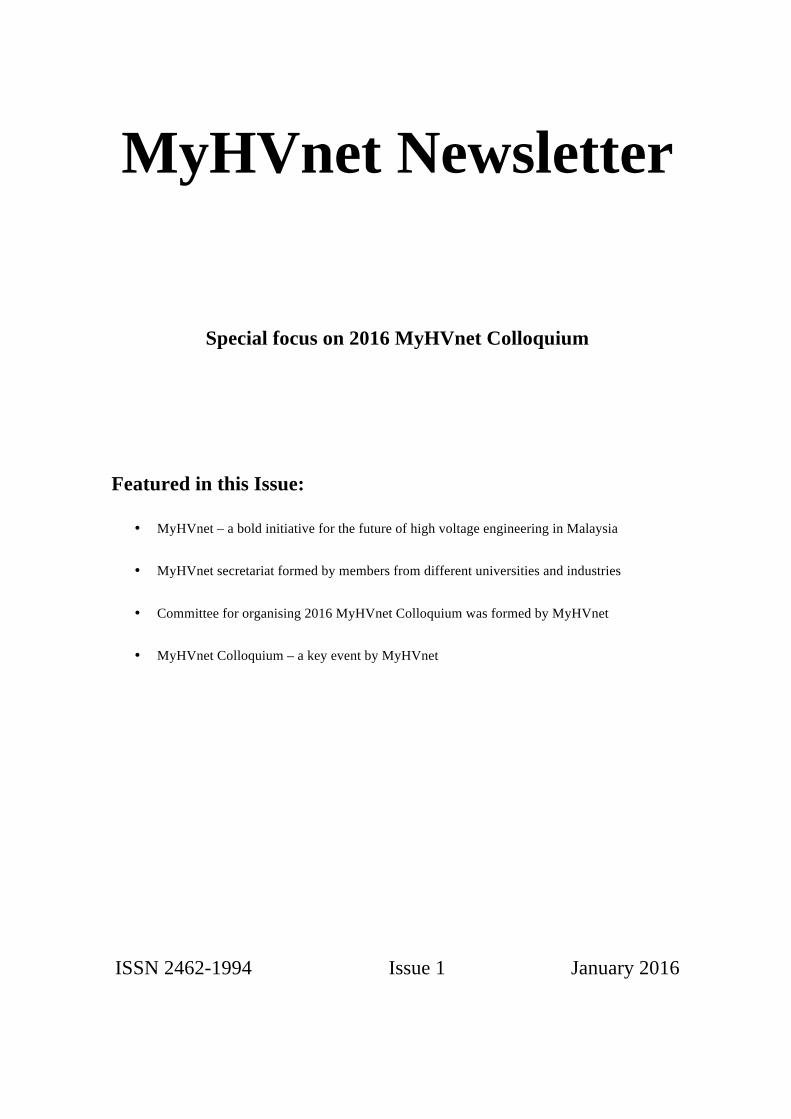
• MyHVnet – a bold initiative for the future of high voltage engineering in Malaysia
• MyHVnet secretariat formed by members from different universities and industries
• Committee for organising 2016 MyHVnet Colloquium was formed by MyHVnet
• MyHVnet Colloquium – a key event by MyHVnet
ISSN 2462-1994 Issue 1 January 2016

MyHVnet Newsletter
Special focus on 2016 MyHVnet Colloquium
Contents
MyHVnet – a bold initiative for the future of high voltage engineering in Malaysia ……………. 1
MyHVnet secretariat formed by members from different universities and industries …………… 2
Committee for organising 2016 MyHVnet Colloquium was formed by MyHVnet ……………… 6
Advertisements ……………………………………………………………………………………. 7
Messages from the Chairs of 2016 MyHVnet Colloquium ………………………………………. 10
Discussion Corners ……………………………………………………………………………….. 11
MyHVnet Colloquium – a key event by MyHVnet ………………………………………………. 17
ISSN 2462-1994 Issue 1 January 2016
About MyHVnet Newsletter
MyHVnet Newsletter is an annual newsletter published by the Institute of High Voltage and High Current (IVAT), Universiti Teknologi Malaysia (UTM) and Malaysian High Voltage Network (MyHVnet), with ISSN no. 2462-1994. The newsletter is an initiative by IVAT and MyHVnet for the dissemination of high voltage related news, with particular emphasis on MyHVnet’s activities. The newsletter aims to comprehend the objectives of MyHVnet, i.e., to serve as a platform for the discussion of high voltage related research and development among member organisations; to raise the awareness of the research and development capabilities of member organisations to high voltage related industries; and to lobby for high voltage related research funding.
Editorial Board
Advisor: Prof. Dr. Zulkurnain Abdul Malek (Universiti Teknologi Malaysia)
Editor-in-chief:
Dr. Lau Kwan Yiew (Universiti Teknologi Malaysia)
Editors: Dr. Mohd Hafizi Ahmad (Universiti Teknologi Malaysia)
Dr. Zulkarnain Ahmad Noorden (Universiti Teknologi Malaysia)
Contributors: Members of MyHVnet
Copyright
Copyright of contents in MyHVnet Newsletter belongs exclusively to the Institute of High Voltage and High Current and Malaysian High Voltage Network. The copyright covers the rights to reproduce the newsletter, including reprints, electronic reproductions or any other reproductions of similar nature.
1
MyHVnet – a bold initiative for the future of high voltage engineering in Malaysia
High voltage research and development activities continue to prosper in Malaysia due to rapid
urbanisation across the country. Each year, an enormous amount of expenditure is allocated for the
development of high voltage infrastructure and its relevant expertise to ensure its sustainability. This
indirectly leads to an increasing number of players, both at the university and industry levels. While
this certainly brings positive impact to the field of high voltage engineering, it can, sometimes, be
difficult for interested parties to approach the right experts in a specific high voltage related area, e.g.,
lightning protection, condition monitoring and diagnosis, and insulation design. Consequently, more
effective research and development activities related to high voltage engineering may have been
hindered.
To address the above issue, the possibility of setting up an informal networking group
relevant to high voltage engineering has been looked into. This leads to the idea of the establishment
of Malaysian High Voltage Network (MyHVnet) in 2014. MyHVnet will hopefully serve as a “one-
stop” platform for members from various organisations (universities and industries) across Malaysia
for the effective communication of high voltage related research and development.
The main objectives of the establishment of MyHVnet are:
i. To serve as a platform for the discussion of high voltage related research and development
among member organisations.
ii. To raise the awareness of the research and development capabilities of member organisations
to high voltage related industries.
iii. To lobby for high voltage related research funding.
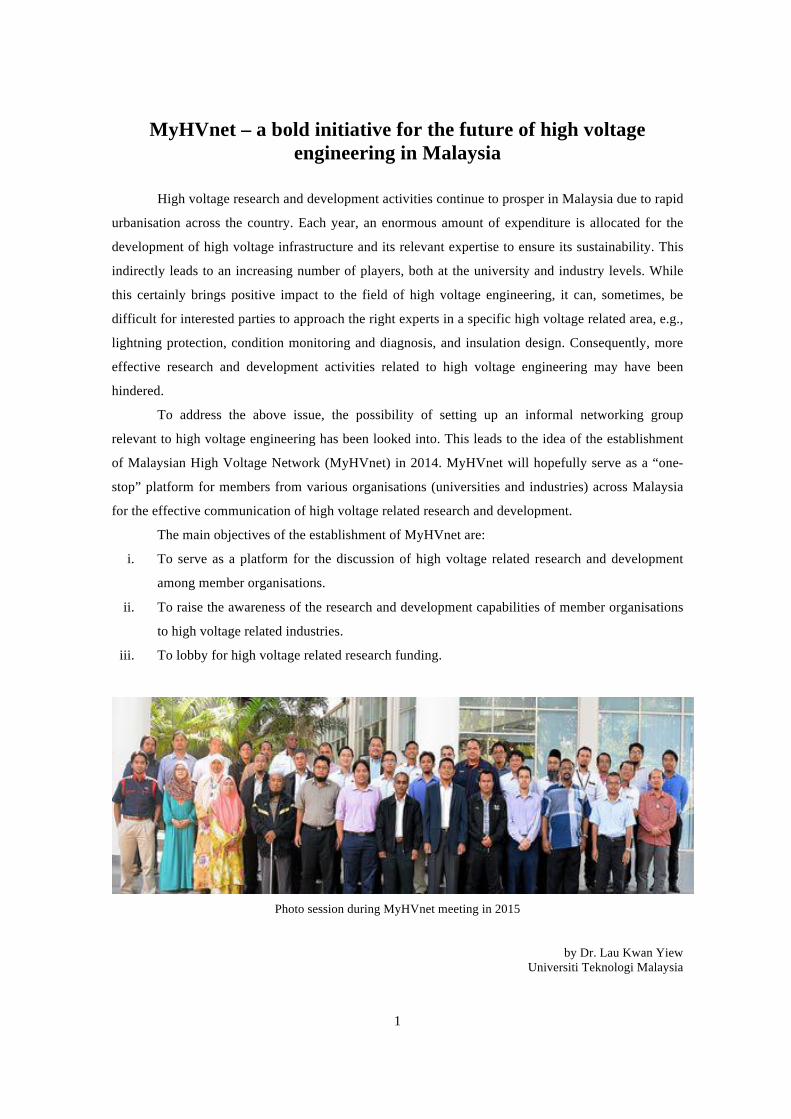
Photo session during MyHVnet meeting in 2015
by Dr. Lau Kwan Yiew Universiti Teknologi Malaysia
2
MyHVnet secretariat formed by members from different universities and industries
The first MyHVnet meeting was successfully held at Universiti Teknologi Malaysia, Johor on
26th January 2015. The meeting was attended by nearly 40 players in high voltage related research and
development from various Malaysian organisations, including TNB Research Sdn. Bhd., AM SGB
Sdn. Bhd., Universiti Sains Malaysia, Universiti Malaya, Universiti Putra Malaysia, Universiti
Teknologi Malaysia, Universiti Malaysia Pahang, Universiti Malaysia Perlis, Universiti Malaysia
Sabah, Universiti Teknikal Malaysia Melaka, Universiti Tun Hussein Onn Malaysia, Universiti
Tenaga Nasional, and Universiti Kuala Lumpur. From the meeting, a collective agreement among the
member organisations was reached for the selection of committee members of MyHVnet. For the term
2015-2016, the committee members of MyHVnet comprise:
Chairman:
Prof. Dr. Zulkurnain Abdul Malek (Universiti Teknologi Malaysia)
Co-chairman:
Prof. Ir. Dr. Mohd Zainal Abidin Ab Kadir (Universiti Putra Malaysia)
Secretary I:
Dr. Lau Kwan Yiew (Universiti Teknologi Malaysia)
Secretary II:
Dr. Wan Fatinhamamah Wan Ahmad (Universiti Putra Malaysia)
Treasurer:
Dr. Nuriziani Hussin (Universiti Malaysia Perlis)
EXCOMM Members:
Mr. Mohd Nor Khaidir Hussein (TNB Research Sdn. Bhd.)
Mr. Abidin Buang (AM SGB Sdn. Bhd.)
Assoc. Prof. Dr. Mohd Kamarol Mohd Jamil (Universiti Sains Malaysia)
Dr. Hazlee Illias (Universiti Malaya)
Dr. Zulkarnain Ahmad Noorden (Universiti Teknologi Malaysia)
Dr. Hidayat Zainuddin (Universiti Teknikal Malaysia Melaka)
Dr. Azrul Mohd Ariffin (Universiti Tenaga Nasional)
(continued on page 3…)
3
(…continued from page 2)
Meanwhile, the current Organisational Membership of MyHVnet comprises:
1. AM SGB Sdn. Bhd. – Mr. Abidin Buang
2. Multimedia University – Assoc. Prof. Dr. Normiza Mohamad Nor
3. TNB Research Sdn. Bhd. – Mr. Mohd Nur Khaidir Hussein
4. Universiti Kuala Lumpur – Dr. Mohd Fahmi Hussin
5. Universiti Malaya (UM) – Dr. Hazlee Illias
6. Universiti Malaysia Pahang (UMP) – Dr. Amir Izzani Mohamed
7. Universiti Malaysia Perlis (UNIMAP) – Dr. Nuriziani Hussin
8. Universiti Putra Malaysia (UPM) – Prof. Ir. Dr. Mohd Zainal Abidin Ab Kadir
9. Universiti Pertahanan Nasional Malaysia (UPNM) – Dr. Mohd Taufiq Ishak
10. Universiti Sains Malaysia (USM) – Assoc. Prof. Dr. Mohd Kamarol Mohd Jamil
11. Universiti Teknikal Malaysia Melaka (UTeM) – Dr. Aminudin Aman
12. Universiti Teknologi Malaysia (UTM) – Prof. Dr. Zulkurnain Abdul Malek
13. Universiti Tenaga Nasional (UNITEN) – Dr. Azrul Mohd Ariffin
14. Universiti Tun Hussein Onn Malaysia (UTHM) – Dr. Muhammad Saufi Kamarudin
Individual Members of MyHVnet can be found in the following list:
Member Organisation Research Interest
1. Mr. Abidin Buang AM SGB Sdn. Bhd. High voltage engineering.
2. Dr. Aminudin Aman Universiti Teknikal Malaysia Melaka (UTeM)
High voltage, instrumentation & control and power systems.
3. Dr. Amir Izzani Mohamed
Universiti Malaysia Pahang (UMP)
Space charge, electrical breakdown, fluent treatment, thermoelectric, transient luminous event (TLE).
4. Mr. Azralmukmin Azmi Universiti Malaysia Perlis (UNIMAP)
Optimization, soft computing, artificial intelligence, power system, power electronic.
5. Dr. Azrul Mohd Ariffin Universiti Tenaga Nasional (UNITEN)
Dielectrics, degradation processes and phenomena, insulation measurement and testing.
6. Prof. Chandima Gomes Universiti Putra Malaysia (UPM)
Lightning protection, HV engineering and discharge physics, EMI/EMC, grounding and bonding.
7. Mrs. Hana Abdull Halim Universiti Malaysia Perlis (UNIMAP)
Transients in power systems, power system quality, power system equipment, high voltage generation and measurement.
8. Dr. Haziah Abdul Hamid Universiti Malaysia Perlis (UNIMAP)
High voltage engineering, switching transients, insulation coordination.
9. Dr. Hazlee Illias Universiti Malaya (UM)
Partial discharge testing and measurement, soil resistivity measurement, condition monitoring on high voltage insulation, dielectric material characterisations, modelling of phenomena in dielectric materials.
(continued on page 4…)
4
(…continued from page 3)
10. Dr. Hidayat Zainuddin Universiti Teknikal Malaysia Melaka (UTeM)
Partial discharge, liquid, solid, interface, finite element modelling.
11. Mr. Huzainie Shafi Abd Halim
TNB Research Sdn. Bhd. (TNBR)
High voltage engineering.
12. Dr. Jasronita Jasni Universiti Putra Malaysia (UPM)
Power system, power stability and lightning protection.
13. Ms. Kuan Tze Mei Universiti Tenaga Nasional (UNITEN)
High voltage engineering.
14. Dr. Lau Kwan Yiew Universiti Teknologi Malaysia (UTM)
High voltage engineering, dielectric materials, renewable energy systems.
15. Dr. Mahdi Izadi Universiti Putra Malaysia (UPM)
Lightning electromagnetic fields, HV engineering , lighting physics, EMI/EMC and transformer.
16. Dr. Miszaina Osman Universiti Tenaga Nasional (UNITEN)
High voltage engineering.
17. Assoc. Prof. Dr. Mohamed Afendi Mohamed Piah
Universiti Teknologi Malaysia (UTM)
High voltage insulation diagnostic, electrical discharges and surface tracking phenomena, polymer nanocomposite insulating materials, insulator condition monitoring.
18. Dr. Mohd Fahmi Hussin Universiti Kuala Lumpur (UNIKL)
High voltage engineering.
19. Assoc. Prof. Dr. Mohd Muhridza Yaacob
Universiti Teknologi Malaysia (UTM)
High voltage insulation and condition monitoring.
20. Dr. Mohd Hafizi Ahmad Universiti Teknologi Malaysia (UTM)
High voltage insulation, mathematical modelling, partial discharge, water treeing, and electrical treeing phenomenon in polymeric-based, microcomposites and nanocomposites insulating materials.
21. Assoc. Prof. Dr. Mohd Kamarol Mohd Jamil
Universiti Sains Malaysia (USM)
Partial Discharge, Biodegradible oil, Nanocomposite, VCB and busbar.
22. Mr. Mohd Nur Khaidir Hussein
TNB Research Sdn. Bhd. (TNBR)
High voltage engineering.
23. Dr. Mohd Taufiq Ishak Universiti Pertahanan Nasional Malaysia (UPNM)
Power transformer, dielectric insulation, renewable energy, partial discharge, thermal modelling.
24. Prof. Ir. Dr. Mohd Zainal Abidin Ab Kadir
Universiti Putra Malaysia (UPM)
High Voltage Engineering, Lightning Protection, EMC/EMI, Power System Transients, Renewable Energy and Smart Grid.
25. Dr. Muhammad Abu Bakar Sidik
Universiti Teknologi Malaysia (UTM)
EMC & EMI, power system insulation contamination, lightning protection & grounding system, application for micro-controller in high voltage devices, development of application software in high voltage engineering.
26. Dr. Muhammad Mokhzaini Azizan
Universiti Malaysia Perlis (UNIMAP)
Distribution power transformer, power transformer, power transformer insulation.
27. Dr. Muhammad Safwan Abd rahman
Universiti Tenaga Nasional (UNITEN)
High voltage engineering.
(continued on page 5…)
5
(continued from page 4…)
28. Dr. Muhammad Saufi Kamarudin
Universiti Tun Hussein Onn Malaysia (UTHM)
Gas discharge, dielectrics and electrical insulation, HV surge arresters.
29. Dr. Muzamir Isa Universiti Malaysia Perlis (UNIMAP)
Partial discharge detection & location technique, high voltage insulation material, cable & transformer condition monitoring.
30. Dr. Norhafiz Azis Universiti Putra Malaysia (UPM)
Transformer condition monitoring, insulation ageing and diagnostics, asset management, alternative insulation materials for high voltage power equipment.
31. Assoc. Prof. Dr. Normiza Mohamad Nor
Multimedia University (MMU)
High voltage engineering.
32. Dr. Noor Azlinda Ahmad Universiti Teknologi Malaysia (UTM)
Lightning characterisation, electromagnetic field & radio frequency emission.
33. Dr. Nor Asiah Muhamad Universiti Teknologi Malaysia (UTM)
Condition monitoring high voltage equipment, high voltage dielectric insulation material test , HV equipment faults diagnosis.
34. Dr. Nouruddeen Bashir Umar
Universiti Teknologi Malaysia (UTM)
Condition monitoring and diagnostics, dielectrics and electrical insulation, renewable energy.
35. Dr. Nuriziani Hussin Universiti Malaysia Perlis (UNIMAP)
High voltage, cable and transformer insulation, vegetable oils, space charge.
36. Ms. Suhaila Sulaiman Universiti Tenaga Nasional (UNITEN)
High voltage engineering.
37. Dr. Wan Fatinhamamah Wan Ahmad
Universiti Putra Malaysia (UPM)
Grounding system, lightning protection system, EMC, TLM, RF EMF.
38. Mr. Wan Ismail Ibrahim Universiti Malaysia Pahang (UMP)
High voltage engineering.
39. Dr. Yanuar Zulardiansyah Arief
Universiti Teknologi Malaysia (UTM)
Partial discharge detection and degradation phenomena of polymeric insulating material, nanodielectric composite, renewable and biodegradable material as electrical insulation, and high voltage engineering insulation technology.
40. Dr. Zikri Abadi Baharudin
Universiti Teknikal Malaysia Melaka (UTeM)
High voltage engineering.
41. Assoc. Prof. Dr. Zolkafle Buntat
Universiti Teknologi Malaysia (UTM)
Ozone generation, electrical discharge, high voltage.
42. Dr. Zulkarnain Ahmad Noorden
Universiti Teknologi Malaysia (UTM)
Energy storage technology (supercapacitor), Power equipment diagnosis & high voltage generation.
43. Prof. Dr. Zulkurnain Abdul Malek
Universiti Teknologi Malaysia (UTM)
HV systems, overvoltage protection system & insulation co-ordination, measurement techniques, HV surge arresters, magnetic engineering.
44. Dr. Zuraimy Adzis Universiti Teknologi Malaysia (UTM)
HV engineering, accredited HV laboratory management, HV electrical safety, lightning electromagnetics and protection.
by Dr. Lau Kwan Yiew Universiti Teknologi Malaysia
6
Committee for organising 2016 MyHVnet Colloquium was formed by MyHVnet
On 11th June 2015, a meeting was held by MyHVnet Committeee Members at Universiti
Teknologi Malaysia, Kuala Lumpur to plan for one of their most-anticipated events, i.e., 2016
MyHVnet Colloquium. Several agenda were discussed for paving the way to the success of the
colloquium. Four areas of high voltage engineering, i.e., lightning, insulation and electrical discharges,
condition monitoring, and transformers were decided to be the main tracks of the colloquium. A
specific committee for the 2016 MyHVnet Colloquium was formed and the committee comprises:
General Chair: Prof. Dr. Zulkurnain Abdul Malek (UTM)
Organising Chairs: Dr. Lau Kwan Yiew (UTM) Dr. Nor Asiah Muhamad (UTM)
Secretary: Dr. Azrul Mohd Ariffin (UNITEN)
Technical Programme Chairs: Tracks: Lightning : Prof. Ir. Dr. Mohd Zainal Abidin Ab Kadir (UPM) Insulation and electrical discharges : Dr. Hazlee Azil IIlias (UM) Condition monitoring : Dr. Hidayat Zainuddin (UTeM) Transformers : Mr. Mohd Aizam Talib (TNBR) Other high voltage related areas : Dr. Muzamir Isa (UNIMAP)
Finance and Registration Chairs: Assoc. Prof. Dr. Mohd Muhridza Yaacob (UTM) Dr. Noor Azlinda Ahmad (UTM)
Publication Chairs: Assoc. Prof. Dr. Zolkafle Buntat (UTM) Dr. Mohd Hafizi Ahmad (UTM) Dr. Nouruddeen Bashir Umar (UTM)
Local Arrangement Chairs: Dr. Zulkarnain Ahmad Noorden (UTM) Dr. Yanuar Zulardiansyah Arief (UTM) Dr. Zuraimy Adzis (UTM)
Publicity and Website Chairs Assoc. Prof. Dr. Mohamed Afendi Mohamed Piah (UTM) Dr. Muhammad Abu Bakar Sidik (UTM) Dr. Norhafiz Azis (UPM) Dr. Mona Riza Mohd Esa (UTM) Mr. Mohd Nazren Mohd Ghazali (UTM)
Sponsorship and Exhibition Chair Mr. Mohd Nur Khaidir Hussein (TNBR)
by Dr. Azrul Mohd Ariffin Universiti Tenaga Nasional

The 2016 MyHVnet Colloquium will be held at Universiti Teknologi Malaysia, Johor Bahru on 25 January 2016. This is the first colloquium organised by MyHVnet (Malaysian High Voltage Network) since its informal inception in 2015 by members from various Malaysian organisations, including TNB Research Sdn. Bhd., AM SGB Sdn. Bhd., Universiti Sains Malaysia, Universiti Malaya, Universiti Putra Malaysia, Universiti Teknologi Malaysia, Universiti Malaysia Pahang, Universiti Malaysia Perlis, Universiti Malaysia Sabah, Universiti Teknikal Malaysia Melaka, Universiti Tun Hussein Onn Malaysia, Universiti Tenaga Nasional, and Universiti Kuala Lumpur.
MyHVnet currently welcomes paper submission in the form of one-page extended abstract for presentation at the 2016 MyHVnet Colloquium, with the following topics:
• Lightning • Insulation and electrical discharges • Condition monitoring • Transformers • Other high voltage related areas
The important dates are as follows:
• Paper submission deadline: 25 November 2015 • Notification of acceptance: 11 December 2015 • Registration deadline: 24 December 2015 • Final camera ready deadline: 24 December 2015 • Colloquium date: 25 January 2016
Registration Fee
RM 100.00 per participant (Max 2 papers per participant)
Submission
1-page extended abstract (the format can be downloaded from http://ivat.utm.my/myhvnet/news/)
Contact Person
For paper submission : Dr. Mohd Hafizi Ahmad ([email protected])
For general enquiries: Dr. Lau Kwan Yiew ([email protected]) or Dr. Nor Asiah Muhamad ([email protected])
General Chair Prof. Dr. Zulkurnain Abdul Malek (UTM) Organising Chairs Dr. Lau Kwan Yiew (UTM) Dr. Nor Asiah Muhamad (UTM) Secretary Dr. Azrul Mohd Ariffin (UNITEN) Technical Programme Chairs Tracks: Lightning:
Prof. Ir. Dr. Mohd Zainal Abidin Ab Kadir (UPM) Insulation and electrical discharges:
Dr. Hazlee Azil Illias (UM) Condition monitoring:
Dr. Hidayat Zainuddin (UTeM) Transformers:
Mr. Mohd Aizam Talib (TNBR) Other high voltage related areas :
Dr. Muzamir Isa (UNIMAP) Finance and Registration Chairs Dr. Noor Azlinda Ahmad (UTM) Assoc. Prof. Dr. Mohd Muhridza Yaacob (UTM) Publication Chairs Dr. Mohd Hafizi Ahmad (UTM) Dr. Nouruddeen Bashir Umar (UTM) Assoc. Prof. Dr. Zolkafle Buntat (UTM) Local Arrangement Chairs Dr. Zulkarnain Ahmad Noorden (UTM) Dr. Yanuar Zulardiansyah Arief (UTM) Dr. Zuraimy Adzis (UTM) Publicity and Website Chairs Dr. Muhammad Abu Bakar Sidik (UTM) Dr. Norhafiz Azis (UPM) Dr. Mona Riza Mohd Esa (UTM) Assoc. Prof. Dr. Mohamed Afendi Mohamed Piah (UTM) Mr. Mohd Nazren Mohd Ghazali (UTM) Sponsorship and Exhibition Chair Mr. Mohd Nur Khaidir Hussein (TNBR)
For more information about MyHVnet, please visit MyHVnet webpage: http://ivat.utm.my/myhvnet/
Latest updates: RM 50.00 per non-presenting participantLatest updates: RM 50.00 per non-presenting participantLatest updates: RM 50.00 per non-presenting participantLatest updates: RM 50.00 per non-presenting participant

8
Fast and competent calibration services, either in-house or on-site
For more information, contact: ————————————————————————————————-
Institute of High Voltage and High Current (IVAT) Block P06
Universiti Teknologi Malaysia 81310 Johor Bahru, Johor
Malaysia Tel: +60 7 553 5615 (Ms. Norhidayu), Fax: +60 7 557 8150, E-mail: [email protected]
Website: ivat.utm.my
⇒Calibration certificate is guaranteed in 3 working days upon receipt of payment
⇒Calibration job can be completed within a day or less
⇒Trusted name in high voltage calibration – IVAT is accredited to ISO/IEC 17025
⇒Willing to travel to the North, South, East and West of Peninsular Malaysia and even to Sabah and Sarawak to fulfill your calibration requirement
⇒Competitive price
Accredited scope:
AC – up to 180 kV rms DC – up to 180 kV
Impulse – 50 kV to 140 kV High current – up to 1000 A
Calibration services by IVAT Ensure consistency of your equipment with regularly scheduled calibration
Testing and Consultation Services at UMHVL The University of Malaya High Voltage Laboratory (UMHVL) is now offering testing and consultation services to industries and academic institutions at affordable price!
The testing services include:
§ Partial discharge test § Oil breakdown strength test § Cable fault location test § Leakage current test § Thermal imaging test § Soil resistivity measurement
Consultation services are offered in the following research areas:
§ Partial discharge phenomena § Condition monitoring of high voltage equipment § Modelling of high voltage equipment § Dielectric material characterisations
For more information, please contact the Head of UMHVL, Dr. Hazlee Illias at [email protected] (tel. 0379674483) or visit http://umhvl.um.edu.my/.

9
Testing services by IVAT As a testing laboratory, the Institute of High Voltage and High Current (IVAT) wishes to be able to cater for the needs of electrical energy sectors.
Facilities Our facilities define our services. Our facilities determine our capabilities and limits to our services.
The Laboratory is about 5-storey high (25 metres), with a floor area of around 400 metre square (20 metres by 20 metres). The largest access to the laboratory is a 5-metre wide and a 10-metre high automatic vertically folded door. Within the floor area, a 20-tonne crane is available to move things around.
Testing Equipment We are equipped mainly with a 280 kV AC/DC HV generation and measurement set (for withstand test and equipped with a wet testing modular), a 2 MV impulse generation and a partial discharge measurement system (equipped with oil filled termination for cables).
Accreditation is also an advantage for us in ensuring a quality system that covers both the technical and managerial aspects of running a testing laboratory. We are in pursuit to be
accredited to all available electrical tests and are at the moment seeking more product specific tests to cater for the need for a third party evaluation.
Special Tests will be considered upon request and technical reviews will be done prior to quotations. Requests for research purposes will be considered with possible cost exemption upon an agreement/understanding between the laboratory and potential universities.
Please do not hesitate to forward all your enquiries to [email protected]
The photos are for illustrative purposes only. Please check with us for details on the accredited scope of testing.
Training and consultancy services by IVAT The Institute of High Voltage and High Current (IVAT) regularly organises training workshops/seminars/short courses for students, engineers, technical managers, technical supervisors, technicians, personnel and researchers involved in electrical power industry. Some popular modules include:
•Electrical Safety Seminar
•Fundamentals of High Voltage Technology
•Three-day Short Course on High Voltage Testing Techniques and Safety
•Two-day Short Course on Grounding Systems
•Short Course on Lightning Protection for High and Low Voltage Systems
•Short Course on Partial Discharge Phenomena
IVAT also offers consultancy services for the following research areas:
•Lightning protection systems for buildings
•Protection systems for electrical power networks
•Grounding systems installations
•High voltage products development
•Low voltage and telecommunication surge protective devices
“Various courses for 2016 are currently on offer!” Please contact Ms. Norhidayu / Ms. Elliyana NOW!
Tel: +60 7 553 5615 / +60 7 553 5452
10
Messages from the Chairs of 2016 MyHVnet Colloquium
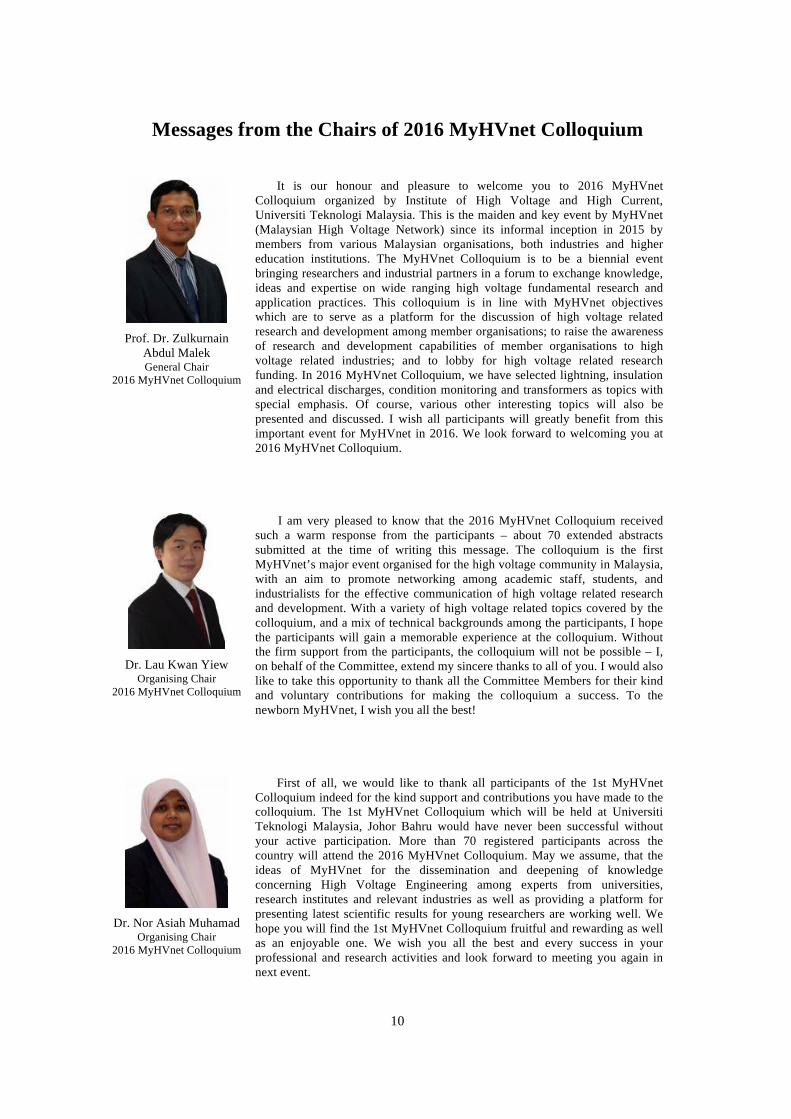
Prof. Dr. Zulkurnain Abdul Malek General Chair
2016 MyHVnet Colloquium
It is our honour and pleasure to welcome you to 2016 MyHVnet Colloquium organized by Institute of High Voltage and High Current, Universiti Teknologi Malaysia. This is the maiden and key event by MyHVnet (Malaysian High Voltage Network) since its informal inception in 2015 by members from various Malaysian organisations, both industries and higher education institutions. The MyHVnet Colloquium is to be a biennial event bringing researchers and industrial partners in a forum to exchange knowledge, ideas and expertise on wide ranging high voltage fundamental research and application practices. This colloquium is in line with MyHVnet objectives which are to serve as a platform for the discussion of high voltage related research and development among member organisations; to raise the awareness of research and development capabilities of member organisations to high voltage related industries; and to lobby for high voltage related research funding. In 2016 MyHVnet Colloquium, we have selected lightning, insulation and electrical discharges, condition monitoring and transformers as topics with special emphasis. Of course, various other interesting topics will also be presented and discussed. I wish all participants will greatly benefit from this important event for MyHVnet in 2016. We look forward to welcoming you at 2016 MyHVnet Colloquium.
Dr. Lau Kwan Yiew Organising Chair
2016 MyHVnet Colloquium
I am very pleased to know that the 2016 MyHVnet Colloquium received such a warm response from the participants – about 70 extended abstracts submitted at the time of writing this message. The colloquium is the first MyHVnet’s major event organised for the high voltage community in Malaysia, with an aim to promote networking among academic staff, students, and industrialists for the effective communication of high voltage related research and development. With a variety of high voltage related topics covered by the colloquium, and a mix of technical backgrounds among the participants, I hope the participants will gain a memorable experience at the colloquium. Without the firm support from the participants, the colloquium will not be possible – I, on behalf of the Committee, extend my sincere thanks to all of you. I would also like to take this opportunity to thank all the Committee Members for their kind and voluntary contributions for making the colloquium a success. To the newborn MyHVnet, I wish you all the best!
Dr. Nor Asiah Muhamad Organising Chair
2016 MyHVnet Colloquium
First of all, we would like to thank all participants of the 1st MyHVnet Colloquium indeed for the kind support and contributions you have made to the colloquium. The 1st MyHVnet Colloquium which will be held at Universiti Teknologi Malaysia, Johor Bahru would have never been successful without your active participation. More than 70 registered participants across the country will attend the 2016 MyHVnet Colloquium. May we assume, that the ideas of MyHVnet for the dissemination and deepening of knowledge concerning High Voltage Engineering among experts from universities, research institutes and relevant industries as well as providing a platform for presenting latest scientific results for young researchers are working well. We hope you will find the 1st MyHVnet Colloquium fruitful and rewarding as well as an enjoyable one. We wish you all the best and every success in your professional and research activities and look forward to meeting you again in next event.

11
Discussion Corner 1
Challenges in condition monitoring
Introduction
Nowadays, an increasing need for electrical energy has forced utilities to focus on increasing
the reliability of power equipment particularly the aging ones. The reliability of equipment is
typically associated with the quality of the insulation systems. Utilities are interested in accurately
determining the condition of the equipment, and ultimately their expected remaining life span. This
should assist them to derive appropriate decision including shutdown for servicing, permanent
maintenance and replacement of parts or the whole set of equipment. However, there are many
challenges in the condition monitoring. The following section will address some of the challenges.
Challenges in condition monitoring
Despite advances in monitoring technologies in recent years, one still cannot avoid unexpected
faults and failures in the insulation system. This is because utilities often encounter inconclusive and
confusing diagnostic testing results, thus, leading to wrong or inappropriate actions. Such actions
may be associated with safety issue consequences or uneconomical solutions. It is not an easy task to
overcome this problem due to several factors such as [1, 2]:
1. it requires a complete understanding of the diagnostic technologies
2. it requires a complete understanding of defect and faulty conditions
3. change of diagnostic parameters may be caused by both dangerous and harmless phenomena
4. uncertainty and stochastic conditions within an insulation system
5. different materials and parameters like electrical and temperature stresses may have different
range of measured value
6. a lot of site data and laboratory work are needed
Traditionally, trend analysis is a widely used method to interpret the results of diagnostic
measurement. Normally, an increasing trend of data quantities such as water content, gas
concentration and etc. over time indicates a serious problem or at least suggesting further
investigation is needed. On the other hand, the decreasing trend or the absence of an increasing trend
is regarded as a healthy condition. However, without denying the effectiveness of this analysis
technique, it should also be borne in mind that such trending patterns may not provide a reliable
indication. Some laboratory [3] and onsite [4] data related to this finding have been reported.
(continued on page 12…)
12
(…continued from page 11)
Therefore, characterizing the defect and faulty conditions in insulation systems of high voltage
equipment is very important for effective condition-based monitoring programs. The characteristics
may provide useful information about the degradation of insulating system rather than just the data
quantities. The characterization study can be done by correlating the defect and faulty conditions with
the data trending based on different materials and parameters as well as the related phenomena. In
addition, verification with different diagnostic technologies can also be undertaken.
Conclusions
In conclusion, there are a lot work to be done to increase the reliability of power equipment
via effective condition monitoring. This can be done by collaboration among stakeholders to obtain
as much data as possible from sites and experiments.
References
[1] J.C.H. Mejia, “Characterization of real power cable defects by diagnostic measurements,” PhD thesis,
Georgia Institute of Technology, 2008.
[2] H. Zainuddin, “Study of surface discharge behavior at the oil-pressboard interface,” PhD thesis,
University of Southampton, 2013.
[3] H. Zainuddin, P.L. Lewin and P.M. Mitchinson, “Partial discharge characteristics of surface tracking on oil-
impregnated pressboard under AC voltages,” in IEEE 2013 International Conference on Solid Dielectrics,
Bologna, Italy, 30 June - 4 July 2013, pp. 1016-1019.
[4] E. MacKanzie and E.C. i Bricha, “Transformer monitoring: field results from an integrated on-line
transformer tank and bushing monitoring system,” The Grid Modernization Journal, pp. 16-24, 11th Ed., 2013.
by Dr. Hidayat Zainuddin Universiti Teknikal Malaysia Melaka
13
Discussion Corner 2
Asset management of transformer fleet: an overview
The ability to extend life expectancies by effective asset management can have a major
impact on capital investment planning programs. Power transformers represent the bulk of the asset
value for distribution and transmission utilities. Traditional asset management strategies for
transformers revolves greatly on time based maintenance methodologies and transformer oil
monitoring. With increased demands for electricity power transformers are operated at or beyond its
nameplate value. It is therefore imperative to manage power transformers to attain optimum
utilization and thereby maximising the return on investment without lowering their production and
availability levels.
Tenaga Nasional Berhad (TNB), the largest power utility in Malaysia presently operated and
managed enormous numbers of transformers within its electrical network with average age over 30
years. Due to the long service life of these aging assets, increases the risk of failure of in-service
transformer which can cause interruption of power supply and results to revenue losses as well as
potentially dangerous to utility personnel through explosions and fire.
To have a better management of these strategic assets, TNB has been performing a fleet
condition assessment to determine the condition and risk of entire transformer fleet. Such an accurate
fleet assessment has helped TNB to decide on an effective and low cost maintenance strategy and to
define the associated maintenance and replacement budget. To find out more about the challenges and
experiences of TNB to create an effective maintenance plan for their entire transformer population,
follow my talk at the 2016 MyHVnet Colloquium.
by Mr. Mohd Aizam Talib
Tenaga Nasional Berhad Research
14
Discussion Corner 3
Comparison of partial discharge models in condition based monitoring
An important and essential diagnostic tool for insulation systems in condition monitoring is
partial discharge (PD) measurement. However, the PD modelling is also important because it helps in
attaining a better understanding of PD phenomenon. The critical parameters and physical mechanisms
affecting PD events under different conditions of defects and stresses can be identified. The relations
of defect characteristics, insulation design parameters and test conditions with PD activities can also
be derived.
In my upcoming talk at the 2016 MyHVnet Colloquium, several PD models that have been
developed in the past and present will be discussed. PD models can be divided into three main
categories, namely the three-capacitance model or so called ‘abc’ model, the analytical-based
approach model (the induced charge concept model) and the finite element analysis (FEA) models.
The development, advantages and disadvantages of each PD model will be detailed and presented.
The simulation results using these models are compared with the measurement results that have been
obtained in order to observe any differences between the models’ parameter values. Finally, the most
suitable conditions for each model that can be used when modelling PD activities are identified.
by Dr. Hazlee Azil Illias University of Malaya
15
Discussion Corner 4
The Evaluation of Lightning Return Stroke Current Using Measured Fields
The evaluation and characterisation of lightning current is an important issue for the design of
proper protection devices for power systems. In order to record the lightning current wave shape,
different methods have been used in past years which can be classified into two main groups, namely,
direct measuring methods and inverse procedure methods. In direct measuring methods, the lightning
current is measured directly by setting instruments at the striking point on the top of towers for natural
lightning or ground rods for triggered lightning. In this method the number of lightning occurrences is
limited. On the other hand, the lightning current can be evaluated using inverse procedure algorithms
and based on measured electromagnetic fields by which this method can cover a greater number of
lightning occurrences compared to direct measuring methods. Several studies have been undertaken
on inverse procedure algorithms which usually consider the current peak and also the current value at
a limited number of frequencies. Likewise, a number of inverse procedure algorithms are limited to
only far distances with respect to the lightning based on the radiation field component. In our study,
an inverse procedure algorithm is proposed to evaluate the lightning return stroke current wave shape
using measured electromagnetic fields directly in the time domain. The proposed method takes into
consideration all the field components which cover the full shape of the current. Thus the method can
be helpful for preparing a lightning current data bank and setting a proper protection level for a power
system based on local information. To get more details about our work, see you at 2016 MyHVnet
Colloquium.
by Dr. Mahdi Izadi Universiti Putra Malaysia
16
Discussion Corner 5
Partial Discharge Location Technique for Covered-Conductor Overhead Distribution Lines
Covered-conductor (CC) overhead lines are commonly used in medium voltage (MV)
networks because the loads are widely distributed in the forested terrain. Such parts of the network are
exposed to leaning trees which produce partial discharges (PDs) in CC lines.
Our work presents a technique to locate the PD source on CC overhead distribution line
networks. The algorithm is developed and tested using a simulated study and experimental
measurements. The Electromagnetic Transient Program-Alternative Transient Program (EMTP-ATP)
is used to simulate and analyze a three-phase PD monitoring system, while MATLAB is used for
post-processing of the high frequency signals which were measured. A Rogowski coil is used as the
measuring sensor. A multi-end correlation-based technique for PD location is implemented using the
theory of maximum correlation factor in order to find the time difference of arrival (TDOA) between
signal arrivals at three synchronized measuring points. The three stages of signal analysis used are: 1)
denoising by applying discrete wavelet transform (DWT); 2) extracting the PD features using the
absolute or windowed standard deviation (STD) and; 3) locating the PD point. The advantage of this
technique is the ability to locate the PD source without the need to know the first arrival time and the
propagation velocity of the signals. In addition, the faulty section of the CC line between three
measuring points can also be identified based on the degrees of correlation.
An experimental analysis is performed to evaluate the PD measurement system performance
for PD location on CC overhead lines. The measuring set-up is arranged in a high voltage (HV)
laboratory. A multi-end measuring method is chosen as a technique to locate the PD source point on
the line. A power transformer 110/20 kV was used to energize the AC voltage up to 11.5 kV/phase
(20 kV system). The tests were designed to cover different conditions such as offline and online
measurements.
Our work evaluates the possibility of using a Rogowski coil for locating faults in MV
distribution lines and a test bench of a 20 kV distribution network is developed. Different fault
scenarios are simulated including earth and phase faults, arcing faults and faults caused by leaning
trees. Our results favourably show the possibility of using a Rogowski coil for locating faults in
distribution networks. To find out more about our work, join us at the 2016 MyHVnet Colloquium.
by Dr. Muzamir Isa Universiti Malaysia Perlis
17
MyHVnet Colloquium – a key event by MyHVnet
MyHVnet Colloquium is a key event organised by Malaysian High Voltage Network
(MyHVnet). The colloquium is planned to be held biennially to promote networking among academic
staff, students, and industrialists for the effective communication of high voltage related research and
development. The 2016 MyHVnet Colloquium will be held at the Institute of High Voltage and High
Current, Universiti Teknologi Malaysia on 25th January 2016. The 2016 MyHVnet Colloquium is the
first colloquium organised by MyHVnet since its informal inception in 2015 by members from
various Malaysian organisations, including TNB Research Sdn. Bhd., AM SGB Sdn. Bhd., Universiti
Sains Malaysia, Universiti Malaya, Universiti Putra Malaysia, Universiti Teknologi Malaysia,
Universiti Malaysia Pahang, Universiti Malaysia Perlis, Universiti Malaysia Sabah, Universiti
Teknikal Malaysia Melaka, Universiti Tun Hussein Onn Malaysia, Universiti Tenaga Nasional, and
Universiti Kuala Lumpur. In the 2016 MyHVnet Colloquium, lightning, insulation and electrical
discharges, condition monitoring, and transformers have been selected as the main topics of interest.
The list of extended abstracts is as follows. Details of the abstracts can be found in pages that follow.
NO. TITLE AUTHORS
P0001 THE INFLUENCE OF NANO-ALUMINA WITH SIR/EPDM COMPOSITE ON DIELECTRIC AND TENSILE STRENGTH AS HV INSULATOR
M. FAIRUS, M. HAFIZ, NOOR SYAZWANI MANSOR, M. MARIATTI, AND M. KAMAROL
P0002 ELECTRICAL TREE GROWTH IN SIR WITH THE INCLUSION OF NANO ALUMINA
M. HAFIZ, M. FAIRUS, M. MARIATTI, AND M. KAMAROL
P0003 SIMULATION ANALYSIS OF LEAKAGE CURRENT ON POLYMER NANOCOMPOSITE UNDER TRACKING TEST CONDITIONS
F. L. MUHAMEDIN, AND M. A. M. PIAH
P0004 COMPARISON STUDY BETWEEN PALM OIL AND OLIVE OIL: BREAKDOWN VOLTAGE AND VISCOSITY
S. S. JUNIAN, M. Z. H. MAKMUD, A. R. HARON, P. IBRAHIM, A. ANUAR
P0005 LOW FREQUENCY ANTENNA EVALUATION TO DETECT TRANSIENT LUMINOUS EVENTS (TLES)
H. G. CHAN AND A. I. MOHAMED
P0006 EVALUATION OF THERMAL EFFECT ON DIELECTRIC PROPERTIES OF PALM OIL AS LIQUID INSULATION
P. LANGGAYANG, M. Z. H. MAKMUD, M. S. SARJADI, A. S. A. HAMID, AND Y. Z. ARIEF
P0007 ENHANCED PARTIAL DISCHARGE RESISTANCE OF LDPE/BORON NITRIDE NANOCOMPOSITES
A. ZEOL, M. H. AHMAD, AND N. A. AWANG
P0008 MAIN FACTORS AFFECTING UNDERGROUND CABLES CURRENTS RATINGS
S. H. ALWAN, J. JASNI, M. Z. A. AB KADIR, AND N.H. AZIZ
P0009 EFFECTS OF TEST PARAMETERS ON THE BREAKDOWN STRENGTH OF MELINEX FILMS
S. N. PUZI, K. Y. LAU AND Z. A. NOORDEN
(continued on page 18…)
18
(…continued from page 17)
P0010 THE EFFECT OF LOW NANOSILICA CONTENT ON THE BREAKDOWN STRENGTH OF LDPE
J. R. JOM, K. Y. LAU AND M. H. AHMAD
P0011 THE INFLUENCE OF MATERIAL PROCESSING ON THE BREAKDOWN STRENGTH OF PE/SIO2 NANOCOMPOSITES
M. A. MATTIEW, K.Y. LAU AND N. A. MUHAMAD
P0012 TNBR LIGHTNING DETECTION SYSTEM NETWORK: THE LATEST GENERATION OF LIGHTNING SENSORS AND THE OPTIMUM PLACEMENT FOR ENHANCED DETECTION PERFORMANCE
N. MOHD HATTA, N. ABDULLAH, M.P. YAHAYA, N.A. ABD RAHMAN, AND M.S. REFFIN
P0013 COMPARISON BETWEEN THE SPACE CHARGE TECHNIQUE
N. K. LUDIN, AND A. I. MOHAMED
P0014 ANALYSIS OF TRANSFORMER HEALTH INDEX USING SCORING AND RANKING METHOD
A. AZMI, J. JASNI, N. AZIS, AND M. A. TALIB
P0015 DEVELOPMENT OF 500KV EXTERNALLY GAPPED LINE ARRESTER (EGLA) SPECIFICATION IN TNB MALAYSIA
I.M. RAWI, M.Z.A. AB. KADIR, C. GOMES AND N. AZIS
P0016 FIELD EVALUATION OF SOLID INSULATED SWITCHGEAR IN MALAYSIA
M. D. M. AMIR, AND IR. SANURI ISHAK
P0017 INVESTIGATIONS ON THE CHARACTERISTICS OF MALAYSIAN SOILS UNDER HIGH IMPULSE CONDITIONS
M. S. REFFIN, N. MOHAMAD NOR, N.A. ABDUL RAHMAN, N. ABDULLAH, M.P. YAHAYA AND N. MOHD HATTA
P0018 ANALYSIS ON FAULT CURRENT DISTRIBUTION FACTOR FOR 33KV OVERHEAD LINE AND UNDERGROUND CABLE SYSTEMS
N.A. ABD RAHMAN, N. ABDULLAH, M. P. YAHAYA, N. MOHD HATTA, , M. S. REFFIN, A. M. AHMAD MARICAN
P0019 CONSIDERING THE EFFECT OF HUMIDITY ON THE ELECTRIC FIELDS VALUES ON POLYMER INSULATOR
M. S. ABD RAHMAN, M. Z. A. AB KADIR AND M. IZADI
P0020 DEVELOPMENT OF AN IMPROVED THERMAL MODEL FOR TRANSFORMERS
M.H ROSLAN , N. AZIS, M.Z.A. AB KADIR, J. JASNI, M.T ISHAK
P0021 AN OVERVIEW OF TRANSFORMER THERMAL MODELLING FOR HOT-SPOT CALCULATION
Z. IBRAHIM, M.Z.A. AB KADIR, M. IZADI
P0022 MONITORING OF ATMOSPHERIC ELECTRIC FIELD BASED ON LIGHTNING DETECTION IN VARIOUS WEATHER
S. S. T. OTHMAN, J. JASNI, N. AZIS, M. N. MOHTAR, M. Z. A. AB KADIR
P0023 A STUDY ON THE PERFORMANCES OF TRANSFORMERS UNDER FERRORESONANCE EFFECT
A. AHMAD, N.AZIS, J. JASNI, M. Z. AB KADIR AND S. P. ANG
P0024 A PRELIMINARY STUDY ON THE LIGHTNING BREAKDOWN VOLTAGE OF PALM OIL UNDER PRESENCE TIO2
S.F.M NOR, N. AZIS, M.Z.A. AB KADIR, J. JASNI, R.YUNUS, M.T ISHAK, Z.YAAKUB
P0025 COMPARATIVE STUDY ON PDC PATTERNS OF MINERAL-BASED OIL AND PALM-BASED OIL IN SERVICE TRANSFORMER
M. F. H. M. TAIB, Y. Z. ARIEF, N. A MUHAMAD AND M. H. AHMAD
P0026 POLARISATION/ DEPOLARISATION CURRENT ANALYSIS ON ARTIFICIALLY DEGRADED CABLES
S. SULAIMAN, A. MOHD ARIFFIN AND D. T. KIEN
(…continued on page 19)
19
(…continued from page 18)
P0027 A COMPARATIVE STUDY OF CREEPAGE DISCHARGE PHENOMENA BETWEEN PALM AND MINERAL OILS
N. A. OTHMAN, H. ZAINUDDIN AND A. AMAN
P0028 STUDY OF BREAKDOWN VOLTAGE OF PALM OIL BASED NANOFLUIDS
M. S. MOHAMAD, H. ZAINUDDIN, S.A. GHANI AND I. S. CHAIRUL
P0029 THERMAL AND LEAKAGE CURRENT BEHAVIOR OF POLYMERIC MATERIAL UNDER THE EFFECT OF CONDUCTIVITY, FLOWRATE AND VOLTAGE
M. A. ABDULLAH, A. AMAN AND H. ZAINUDDIN
P0030 AN OVERVIEW FOR NEW APPROACH OF TRANSFORMERS ASSET MANAGEMENT USING HEALTH INDEX
M. S. YAHAYA, N. AZIS, J. JASNI, M. A. TALIB
P0031 A COMPARATIVE STUDY OF VOLTAGE STABILITY FOR THE OPTIMIZATION OF DISTRIBUTED GENERATION
MARYAM MIRZAEI, JASRONITA JASNI
P0032 LIGHTNING CURRENT DISTRIBUTION IN A TOWER WITH UNIFORM AND NONUNIFORM SOILS
M. MOKHTARI, S. N. A ZAKARIA, Z. ABDUL-MALEK, AND C. L. WOOI
P0033 EFFECTS OF FREQUENCY DEPENDENT SOIL ELECTRICAL PROPERTIES ON INDUCED TRANSIENT VOLTAGES OF BURIED PIPELINES
M. MOKHTARI, F. HO AND Z. ABDUL-MALEK
P0034 STUDY OF BREAKDOWN BEHAVIOR OF MINERAL OIL WITH SUSPENDED CELLULOSE PARTICLES UNDER DC VOLTAGE
M.H.S. ZAINODDIN, H. ZAINUDDIN AND A. AMAN
P0035 SOIL STRUCTURE EFFECTS ON AC TOTAL INTERFERENCE IN PIPELINES IN PARALLEL WITH TRANSMISSION LINES
ALI I. EL GAYAR , ZULKURNAIN ABDUL-MALEK
P0036 TRANSMISSION EFFICIENCY BENEFIT OF USING HYBRID PHASE SHIFTER TO COUNTERACT WIND FARM’S DYNAMICS
S. E. GASIM MOHAMED1, J. JASNI, M. A. M. RADZI AND H. HIZAM
P0037 APPLICATION OF NEURAL-FUZZY NETWORK ON DETERMINATION OF TRANSFORMERS HEALTH INDEX
E. J. KADIM , N. AZIS, J. JASNI, S. A. AHMAD, M. Z. A. AB KADIR, AND M. A. TALIB
P0038 OPTIMAL ESTIMATION OF DISTRIBUTED GENERATION LOCATION
Z. ABDULKAREEM, W. F. H., WAN AHMAD, J. JASNI, N. I. ABDUL WAHAB
P0039 CHAOTIC PULSE TRAIN PRIOR TO CLOUD-TO-GROUND LIGHTNING IN TROPICAL REGION
C.L. WOOI, Z. ABDUL-MALEK, N.A. AHMAD, Z. ZAKARIA, M. MOKHTARI, A.H. KHAVARI
P0040 LABORATORY TEST OF THE DEVELOPED NEW VOLTAGE IMPULSE TRANSDUCER
M. F. HUSSIN
P0041 SIMULATION STUDY ON BREAKDOWN PROCESS IN GIS LOW PRESURE CHAMBER USING SF6/N2 GAS INSULATION
N. F. KASRI, M.N.KHAIDIR, HARRIEZAN AHMAD, N.A. MUHAMAD, M. AFENDI M. PIAH
P0042 FORMATION OF FULGURITE-LIKE STRUCTURES UNDER HV CONDITIONS: WITH SPECIAL ATTENTION TO THE EFFECTS ON ELECTRICAL EARTHING SYSTEM
ZULKIFLI BIN BURHANUDDIN, CHANDIMA GOMES, M Z K ZAINAL AB KADIR AND NORHAFIZ AZIZ
(…continued on page 20)
20
(…continued from page 19)
P0043 EFFECT OF GROUND REFLECTION FACTOR ON THE LIGHTNING CURRENT ALONG A TALL STRUCTURE
N.RAMELI, M.Z.A AB.KADIR, M.IZADI, CHANDIMA GOMES AND N.AZIS
P0044 VOLTAGE BREAKDOWN CHARACTERISTICS OF THE POLYMER INSULATOR UNDER DIFFERENT CONDITIONS AND DIFFERENT IMPULSE POLARITIES
F. A. JAMALUDIN, M.Z.A AB KADIR, M. IZADI, N. AZIS , J.JASNI AND M.S. B ABD RAHMAN
P0045 A STUDY ON COMPARING THE PERFORMANCE OF BENTONITE, KENAF AND ZEOLITE TO REDUCE EARTH RESISTANCE
W. L., LAI, W. F. H., WAN AHMAD, J., JASNI AND M. Z. A., AB KADIR
P0046 TEMPERATURE EFFECT ON THE ELECTRIAL PERFORMANCE OF SOLAR PANELS
N.I. AHMAD, M. Z. AB KADIR, M. IZADI, N.H. ZAINI, M.A.M RADZI AND N. AZIS
P0047 CONSIDERING ON THE INDUCED VOLTAGE ON THE PIPELINE ASSOCIATED WITH 275KV TRANSMISSION LINE IN PRESENCE OF LIGHTNING ( 3-PAGE)
SOON CHAI CHIA, MOHD ZAINAL ABIDIN AB KADIR AND MAHDI IZADI
P0048 EFFECT OF CONTAMINATION ON THE PERFORMANCE OF CORONA RING TO POLYMER INSULATOR (4-PAGE)
H.K.TSONG, M.Z.A.AB KADIR, M.IZADI, W.F.H.WAN AHMAD
P0049 CHARACTERIZATION OF TREE GROWTH IN SILICONE RUBBER BY FRACTAL DIMENSION AND LACUNARITY UNDER ENVIRONMENTAL STRESS
M. S. MOHD FUA’AD, M. H. AHMAD, M. A. B. SIDIK, Z. BUNTAT
P0050 LIGHTNING CURRENT SIGNATURES THAT MAY ENHANCE THE TRIGGERING POSSIBILITIES OF WILD FIRES
ASHEN GOMES, MEHDI IZADI, HALIMATUSAADIAH RUSLI AND CHANDIMA GOMES
P0051 SWITCHING TRANSIENTS DUE TO A FIVE STEP SHUNT CAPACITOR BANK IN LV DISTRIBUTION SYSTEMS
S. G. MOHAMMAD, C. GOMES, M. Z. A. AB KADIR, J. JASNI, M. IZADI
P0052 DEVELOPMENT OF PD MEASUREMENT SYSTEM IN HIGH VOLTAGE TRANSFORMER
A.KIASATINA, D. ISHAK, A. A. ZUHAIRI, M. KAMAROL
P0053 ATMOSPHERIC PLASMA DISCHARGE TREATMENT ON ACTIVATED CARBON ELECTRODE FOR ULTRACAPACITOR
MOHD FERDAUS MOHAMMAD YAACOB, ZULKARNAIN AHMAD NOORDEN, MOHD HAFIZI AHMAD AND LAU KWAN YIEW
P0054 ZINC OXIDE SURGE ARRESTER MODELING USING FINITE ELEMENT ANALYSIS: MEASUREMENT AND SIMULATION
A.H. KHAVARI, Z. ABDUL-MALEK,C.L. WOOI AND M. MOKHTARI
P0055 TRANSFORMER LIFE MANAGEMENT: DIAGNOSTIC AND CONDITION ASSESSMENT OF IN-SERVICE TRANSFORMER
MOHD AIZAM TALIB, ABU SUFIAN ABU BAKAR
P0056 SPACE CHARGE DISTRIBUTION OF GLASS INSULATOR STRING UNDER DIFFERENT CONTAMINATION LEVELS
N. A. OTHMAN, M. A. M. PIAH AND Z. ADZIS
P0057 POLARISATION / DEPOLARISATION CURRENT ANALYSIS ON FIELD AGED CABLES
S. SULAIMAN, A. MOHD ARIFFIN AND D. T. KIEN
P0058 COMPARATIVE STUDY ON BREAKDOWN VOLTAGE TEST OF MINERAL-BASED OIL AND PALM-BASED OIL USING WEIBULL ANALYSIS
M.F.H.M. TAIB, Y.Z.ARIEF, N.A. MUHAMMAD
(…continued on page 21)
21
(…continued from page 20)
P0059 THE EFFECT OF VISCOSITY REDUCTION VIA SONICATION PROCESS ON RELATIVE PERMITTIVITY OF PALM OIL IMPREGNATED PAPER
S.M. YUSOF, N. HUSSIN, M. ISA
P0060 IDENTIFICATION OF VARIOUS DEFECTS IN ARCING TAP SWITCH USING VIBRO ACOUSTUC TECHNIQUE IN ON LOAD TAP CHANGER
M.A.A.AZIZ, Y.A. SUBRAMANIAM, M.A.M.TALIB
P0061 PLASMA ENHANCED ON PARTIAL DISCHARGE CHARACTERISTICS OF LDPE/BN NANOCOMPOSITES AS HIGH VOLTAGE INSULATION MATERIAL
N. A. AWANG, M. H. AHMAD, Y. Z ARIEF, A. ZEOL, I. H. ZAKARIA, F. N. MUSA
P0062 PLASMA TREATED OIL-BASED NANOFLUIDS FOR POWER TRANSFORMER APPLICATION
I. H. ZAKARIA, M. H. AHMAD, Y. Z. ARIEF, N. A. AWANG, F. N. MUSA
P0063 SYNTHESIS OF CARBON NANOTUBES BY METHANE ARC DISCHARGE AND ITS APPLICATION AS HUMIDITY SENSOR
Z. AZMAN, Z. BUNTAT, N. SAHARI
P0064 TRANSMISSION LINE SURFACE DISCHARGE DETECTION USING UV PULSE METHOD
S.M.I. SUHAIMI, N. BASHIR, NOVIZON
P0065 PARTIAL DISCHARGE CHARACTERISTICS ON LDPE AND PP DIELECTRIC MATERIALS
S.Z. DABBAK, H.A. ILLIAS, B.C. ANG
P0066 VOLTAGE AND CURRENT DISTRIBUTION ON THE SURFACE OF BUILDINGS WITH CYLINDRICAL SYMMETRY IN THE EVENT OF A LIGHTNING STRIKE TO THE TOP
A. GOMES, M. IZADI, C. GOMES AND M. Z. A. AB KADIR
P0067 EFFECT OF ATMOSPHERIC PRESSURE DBD PLASMA TREATMENT ON MWCNTS IN CO2 SENSING APPLICATION
N. SAHARI, Z. BUNTAT, AND Z. AZMAN
P0068 MEASUREMENT OF LEAKAGE CURRENT IN 11KV ZINC OXIDE SURGE ARRESTERS
N.A.A LATIFF, H.A. ILLIAS AND S. DABBAK
P0069 WAVELET ANALYSIS OF LIGHTNING NEGATIVE RETURN STROKE
Z. ZAKARIA, N.A.AHMAD, Z. ABDUL-MALEK, C.L. WOOI
P0070 INFLUENCE OF ELECTRODE SHAPES ON THE ELECTRIC FIELD DISTRIBUTION IN CORONA DISCHARGE
HAZLEE AZIL ILLIAS, GAMIL AL-TAMIMI, NORRIMA MOKHTAR
P0071 DESIGNING UHF PARTIAL DISCHARGE SENSOR USING FDTD MODELLING
M. S. S. RAHMAN, A. M. ISHAK, M. T. ISHAK
by Dr. Mohd Hafizi Ahmad Universiti Teknologi Malaysia
Extended Abstract for 2016 MyHVnet Colloquium
THE INFLUENCE OF NANO-ALUMINA WITH SIR/EPDM COMPOSITE ON DIELECTRIC AND TENSILE
STRENGTH AS HV INSULATOR M.Fairus1*, M.Hafiz1, Noor Syazwani Mansor1, M.Mariatti2, M.Kamarol 1
1School of Electrical and Electronic Engineering, Universiti Sains Malaysia, Penang, Malaysia 2School of Materials and Mineral Resources Engineering, Universiti Sains Malaysia, Penang, Malaysia
*E-mail: [email protected]
Abstract – This paper presents the dielectric and tensile strength of new SiR/EPDM composite with various nano-Alumina (Al2O3) loading concentration as HV insulator. The new nano-composite was investigated according to the IEC 60243-1 and ASTM D412-06a standard. Result showed that, the SiR/EPDM composite with 1 Vol% loading concentration of nano-Alumina gives the highest dielectric and tensile strength at 35.28 kV/mm & 11.58 Mpa, respectively as compared to the unfilled batch . Hence, the presence of 1 Vol% of nano-Alumina into SiR/EPDM composite significantly has improved the dielectric & tensile strength of new nano-composite. Keywords –Dielectric, tensile strengths, SiR/EPDM, nano-alumina, ASTM D412-06a, IEC 60243-1.
INTRODUCTION
In the past couple years, the developments of new polymeric synthesis with SiR/EPDM with 50:50 ratios polymeric composite yields the optimal electrical and mechanical properties especially for the weather shed insulator [1]. Thus, the dielectric and tensile strength has been investigated due to it play an important role in determining its efficiency as HV insulator. Nano-Alumina has been chosen due to their superior material characteristic that has high thermal conductivity, high electrical resistivity and low cost. In addition, the influence of nano-Alumina with SiR/EPDM balanced composite still undiscovered yet.
METHODOLOGY The dielectric and tensile strength were tested
under room temperature as per IEC 60243-1 & ASTM D412 standards. An average of ten specimens were measured on each composition for both experiment.
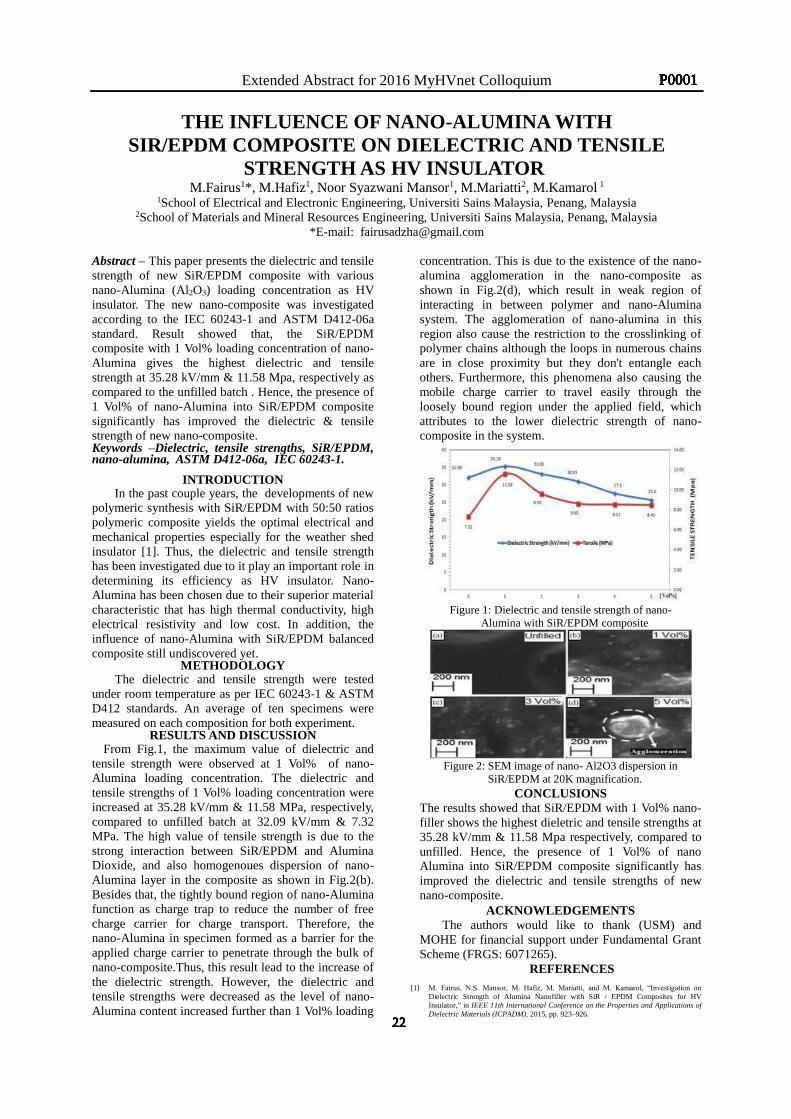
RESULTS AND DISCUSSION From Fig.1, the maximum value of dielectric and
tensile strength were observed at 1 Vol% of nano-Alumina loading concentration. The dielectric and tensile strengths of 1 Vol% loading concentration were increased at 35.28 kV/mm & 11.58 MPa, respectively, compared to unfilled batch at 32.09 kV/mm & 7.32 MPa. The high value of tensile strength is due to the strong interaction between SiR/EPDM and Alumina Dioxide, and also homogenoues dispersion of nano-Alumina layer in the composite as shown in Fig.2(b). Besides that, the tightly bound region of nano-Alumina function as charge trap to reduce the number of free charge carrier for charge transport. Therefore, the nano-Alumina in specimen formed as a barrier for the applied charge carrier to penetrate through the bulk of nano-composite.Thus, this result lead to the increase of the dielectric strength. However, the dielectric and tensile strengths were decreased as the level of nano-Alumina content increased further than 1 Vol% loading
concentration. This is due to the existence of the nano-alumina agglomeration in the nano-composite as shown in Fig.2(d), which result in weak region of interacting in between polymer and nano-Alumina system. The agglomeration of nano-alumina in this region also cause the restriction to the crosslinking of polymer chains although the loops in numerous chains are in close proximity but they don't entangle each others. Furthermore, this phenomena also causing the mobile charge carrier to travel easily through the loosely bound region under the applied field, which attributes to the lower dielectric strength of nano-composite in the system.
Figure 1: Dielectric and tensile strength of nano-
Alumina with SiR/EPDM composite
Figure 2: SEM image of nano- Al2O3 dispersion in
SiR/EPDM at 20K magnification. CONCLUSIONS
The results showed that SiR/EPDM with 1 Vol% nano-filler shows the highest dieletric and tensile strengths at 35.28 kV/mm & 11.58 Mpa respectively, compared to unfilled. Hence, the presence of 1 Vol% of nano Alumina into SiR/EPDM composite significantly has improved the dielectric and tensile strengths of new nano-composite.
ACKNOWLEDGEMENTS The authors would like to thank (USM) and
MOHE for financial support under Fundamental Grant Scheme (FRGS: 6071265).
REFERENCES
[1] M. Fairus, N.S. Mansor, M. Hafiz, M. Mariatti, and M. Kamarol, “Investigation on Dielectric Strength of Alumina Nanofiller with SiR / EPDM Composites for HV Insulator,” in IEEE 11th International Conference on the Properties and Applications of Dielectric Materials (ICPADM), 2015, pp. 923–926.
22
P0001
22
P0001
22
P0001
22
P0001
22
P0001
22
P0001
22
P0001
22
P0001
Extended Abstract for 2016 MyHVnet Colloquium
ELECTRICAL TREE GROWTH IN SIR WITH THE INCLUSION OF NANO ALUMINA
M.Hafiz1*, M.Fairus1, M.Mariatti2, M.Kamarol 1
1School of Electrical and Electronic Engineering, Universiti Sains Malaysia, Penang, Malaysia 2School of Materials and Mineral Resources Engineering, Universiti Sains Malaysia, Penang, Malaysia
*E-mail: [email protected]
Abstract – This paper presents the behaviour of electrical tree growth at room temperature in silicone rubber (SiR) nanocomposites with the inclusion of nano-alumina. At 30 minutes after tree inception voltage (TIV), SiR/Alumina nanocomposites shows better propagation rate compared to unfilled SiR. Observation results show that Bush tree type pattern appear more regularly in SiR/Alumina nanocomposites while in unfilled SiR, Branch tree type can be observed frequently. This result indicates that the amount of nano-alumina up to 2vol% prolong the electrical tree growth rate and electrical tree structure tend to appear in Bush tree type pattern regularly. Keywords –Electrical tree, Nanocomposites
INTRODUCTION Silicon rubber (SIR) is well known as among the
best high voltage cable insulation since it offers superb electrical properties for wide range of temperature and voltage application. However electrical tree will initiate by given continous stress especially at defect areas such as voids, contaminations and sharp edges which finally will lead to cable failure.
For a fast development of nano technology, filler has a big potential in enhancing the dielectric material. Alapati et al have mentioned that nano-alumina could be used as a filler to redart and prolong the initiation and propagation of electrical tree [1].
Thus for this paper, the study focuses more on the behavior of electrical tree growth in unfilled SiR as well as in SiR/Alumina anocomposites.The roles of nano-alumina as electrical tree resistance in SiR/ Nanocomposites are discussed.
METHODOLOGY Block test specimen mould with a dimension of
20mm x 14mm x 1mm were prepared. A needle plane electrode with diameter of 0.25mm with 30 degree tip angle and 5µm tip radius was attached into each mould with 2mm gaps between needle tip and grounded electrode. Fully set up of experiment can be refered to M.Hafiz et al [2].
RESULTS AND DISCUSSION
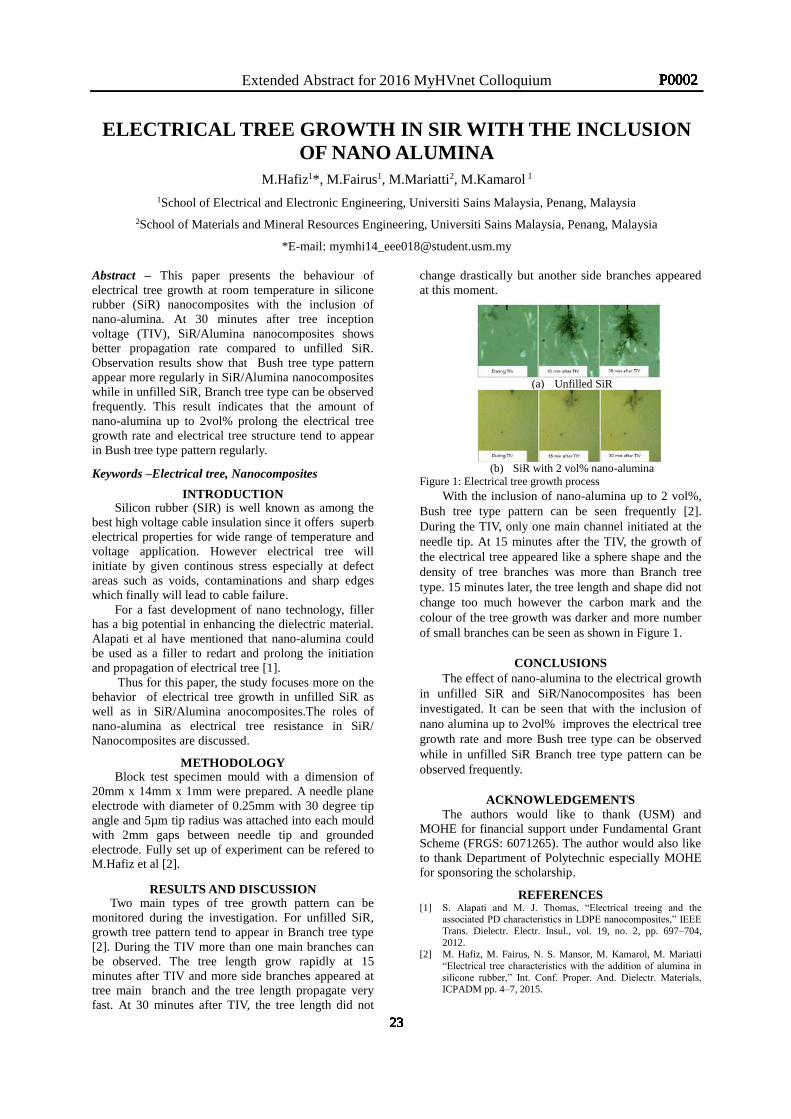
Two main types of tree growth pattern can be monitored during the investigation. For unfilled SiR, growth tree pattern tend to appear in Branch tree type [2]. During the TIV more than one main branches can be observed. The tree length grow rapidly at 15 minutes after TIV and more side branches appeared at tree main branch and the tree length propagate very fast. At 30 minutes after TIV, the tree length did not
change drastically but another side branches appeared at this moment.
(a) Unfilled SiR
(b) SiR with 2 vol% nano-alumina
Figure 1: Electrical tree growth process With the inclusion of nano-alumina up to 2 vol%,
Bush tree type pattern can be seen frequently [2]. During the TIV, only one main channel initiated at the needle tip. At 15 minutes after the TIV, the growth of the electrical tree appeared like a sphere shape and the density of tree branches was more than Branch tree type. 15 minutes later, the tree length and shape did not change too much however the carbon mark and the colour of the tree growth was darker and more number of small branches can be seen as shown in Figure 1.
CONCLUSIONS
The effect of nano-alumina to the electrical growth in unfilled SiR and SiR/Nanocomposites has been investigated. It can be seen that with the inclusion of nano alumina up to 2vol% improves the electrical tree growth rate and more Bush tree type can be observed while in unfilled SiR Branch tree type pattern can be observed frequently.
ACKNOWLEDGEMENTS
The authors would like to thank (USM) and MOHE for financial support under Fundamental Grant Scheme (FRGS: 6071265). The author would also like to thank Department of Polytechnic especially MOHE for sponsoring the scholarship.
REFERENCES [1] S. Alapati and M. J. Thomas, “Electrical treeing and the
associated PD characteristics in LDPE nanocomposites,” IEEE Trans. Dielectr. Electr. Insul., vol. 19, no. 2, pp. 697–704, 2012.
[2] M. Hafiz, M. Fairus, N. S. Mansor, M. Kamarol, M. Mariatti “Electrical tree characteristics with the addition of alumina in silicone rubber,” Int. Conf. Proper. And. Dielectr. Materials, ICPADM pp. 4–7, 2015.
23
P0002
23
P0002
23
P0002
23
P0002
23
P0002
23
P0002
23
P0002
23
P0002
Extended Abstract for 2016 MyHVnet Colloquium
Simulation Analysis of Leakage Current on Polymer Nanocomposite under Tracking Test Conditions
F. L. Muhamedin1,* and M. A. M. Piah1 1Institute of High Voltage and High Current, Universiti Teknologi Malaysia, 81310 Johor Bahru, Malaysia.
*E-mail: [email protected] Abstract – The generation of surface discharge due to extensive flow of leakage current (LC) on the insulator surface under wetted contaminants resulted in material degradation in terms of surface tracking. The modeling of inclined plane tracking (IPT) test with conditions of IEC 60587 standard in the field simulation was conducted. The distribution of LC on LLDPE-NR blends with different nanofiller loadings of aluminium hydroxide (Al(OH)3) were studied using finite element method (FEM) analysis. The outcome of the IPT test results was used as references in the field study. The results from both, field simulation and experimental work showed a good correlation and therefore, the field simulation work can be used as another option in investigating the surface tracking resistance.
Keywords – IEC 60587 IPT test, Surface discharge, Finite Element Software, Leakage current
INTRODUCTION Inclined plane tracking (IPT) test is a standard test
to evaluate the surface tracking and erosion performances of polymeric materials. From the IPT test, the LC monitoring was used as measurement at the deterioration level of materials. This is because the LC are proportional to degradation of polymer materials [1]. Previously, the study in the field simulation are mainly on the partial discharge phenemona [2]. The research on the surface tracking using field methods are scantily. Thus, in this paper, the field works was conducted for exploring the similarity of actual IPT test results in terms of leakage current.
METHODOLOGY In the field simulation, the plane parallel 2D model
of a rectangular sample with size of 50 mm x 120 mm and thickness of 5 mm were drawn according to IEC 60587 standard[3].The high voltage was connected at upper electrode and grounded at bottom electrode and path of contaminant solution were drawn on the insulator surface. The controlled parameters in the simulation were applied voltage, electric conductivity and permittivity of insulation samples and contaminant solution. The models are solved by finite element analysis software of Quickfield. Meanwhile, the compounds of linear low density polyethylene (LLDPE) and natural rubber (NR) blend of 4:1 ratio with 1%wt, 3%wt, 5%wt and 7%wt of aluminium hydroxide (Al(OH)3)) nanofiller are tested on IPT test at 4.5 kV with contaminant flow rate of 0.60 ml/min.
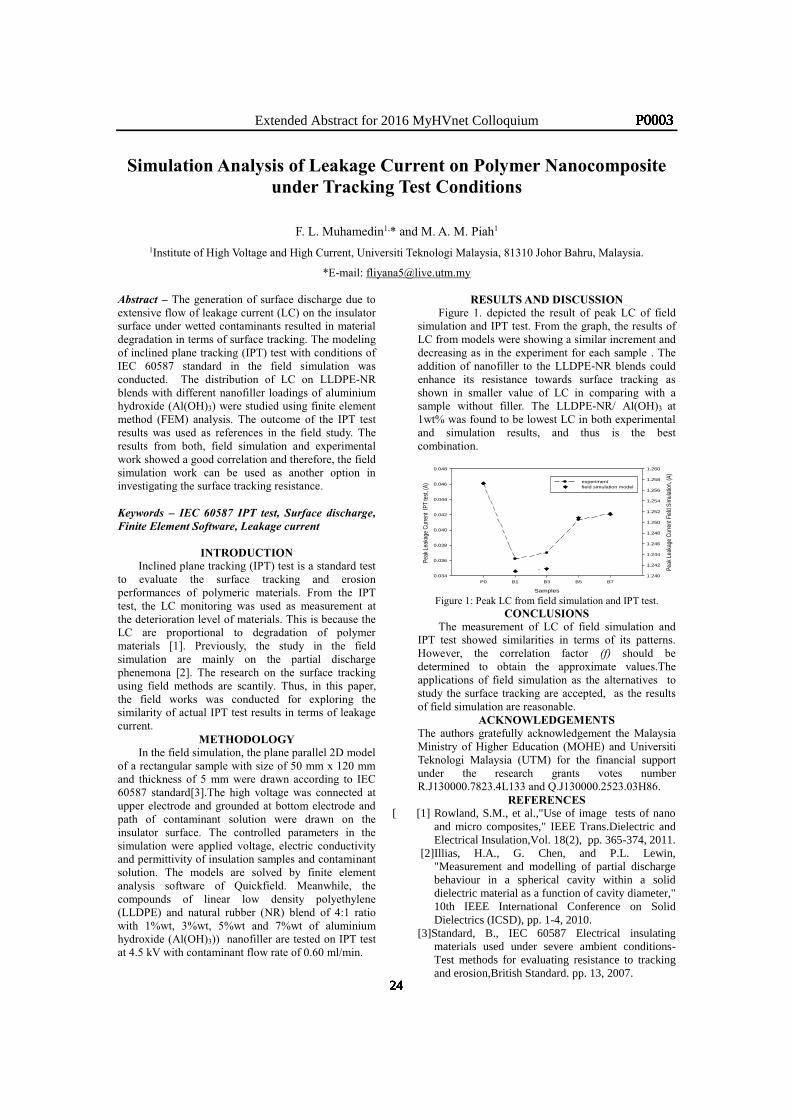
RESULTS AND DISCUSSION Figure 1. depicted the result of peak LC of field
simulation and IPT test. From the graph, the results of LC from models were showing a similar increment and decreasing as in the experiment for each sample . The addition of nanofiller to the LLDPE-NR blends could enhance its resistance towards surface tracking as shown in smaller value of LC in comparing with a sample without filler. The LLDPE-NR/ Al(OH)3 at 1wt% was found to be lowest LC in both experimental and simulation results, and thus is the best combination.
Samples
P0 B1 B3 B5 B7
Peak
Lea
kage
Cur
rent
IPT
test
, (A)
0.034
0.036
0.038
0.040
0.042
0.044
0.046
0.048
Peak
Lea
kage
Cur
rent
Fie
ld S
imul
atio
n, (A
)
1.240
1.242
1.244
1.246
1.248
1.250
1.252
1.254
1.256
1.258
1.260
experimentfield simulation model
Figure 1: Peak LC from field simulation and IPT test. CONCLUSIONS
The measurement of LC of field simulation and IPT test showed similarities in terms of its patterns. However, the correlation factor (f) should be determined to obtain the approximate values.The applications of field simulation as the alternatives to study the surface tracking are accepted, as the results of field simulation are reasonable.
ACKNOWLEDGEMENTS The authors gratefully acknowledgement the Malaysia Ministry of Higher Education (MOHE) and Universiti Teknologi Malaysia (UTM) for the financial support under the research grants votes number R.J130000.7823.4L133 and Q.J130000.2523.03H86.
REFERENCES [ [1] Rowland, S.M., et al.,"Use of image tests of nano
and micro composites," IEEE Trans.Dielectric and Electrical Insulation,Vol. 18(2), pp. 365-374, 2011.
[2]Illias, H.A., G. Chen, and P.L. Lewin, "Measurement and modelling of partial discharge behaviour in a spherical cavity within a solid dielectric material as a function of cavity diameter," 10th IEEE International Conference on Solid Dielectrics (ICSD), pp. 1-4, 2010.
[3]Standard, B., IEC 60587 Electrical insulating materials used under severe ambient conditions-Test methods for evaluating resistance to tracking and erosion,British Standard. pp. 13, 2007.
24
P0003
24
P0003
24
P0003
24
P0003
24
P0003
24
P0003
24
P0003
24
P0003
Extended Abstract for 2016 MyHVnet Colloquium
COMPARISON STUDY BETWEEN PALM OIL AND OLIVE OIL: BREAKDOWN VOLTAGE AND VISCOSITY
S. S. Junian1,*, M. Z. H. Makmud1,2, A. R. Haron2, P. Ibrahim2, A. Anuar1 1Complex of Science and Technology, Faculty of Science and Natural Resources, Universiti Malaysia Sabah.
2High Voltage Laboratory, Faculty of Engineering, Universiti Malaysia Sabah.
*E-mail: [email protected] Abstract –This paper presents a comparison of the dielectric and physical properties between palm oil (PO) and olive oil to be used as insulating oil. Breakdown voltage (BDV) are done according to IEC Standard 156, while Viscosity test is done using Brookfield Digital Viscometer Model DV-II. Olive oil has highest BDV voltage, followed by PO. Viscosity of PO is lower than olive oil at 80oC. Meanwhile, POFA significantly increased the viscosity of PO than unfilled PO.
Keywords –Breakdown voltage, Palm oil, Olive oil, Viscosity
INTRODUCTION
Insulating oil, such as mineral oil, is widely used in High Voltage (HV) system to be used as electrical insulation, circuit breaker and served as coolant to protect power transformer from getting hot [1]. Environmental concerns have encouraged the development and use of biodegradable oil to replace mineral oil [2].
METHODOLOGY
Table 1 shows the samples formulation. Sample PO PO2 PO4 PO6 Olive
oil Content of POFA (phr)
None 2 4 6 None
Table 1: Samples formulation.
RESULTS AND DISCUSSION
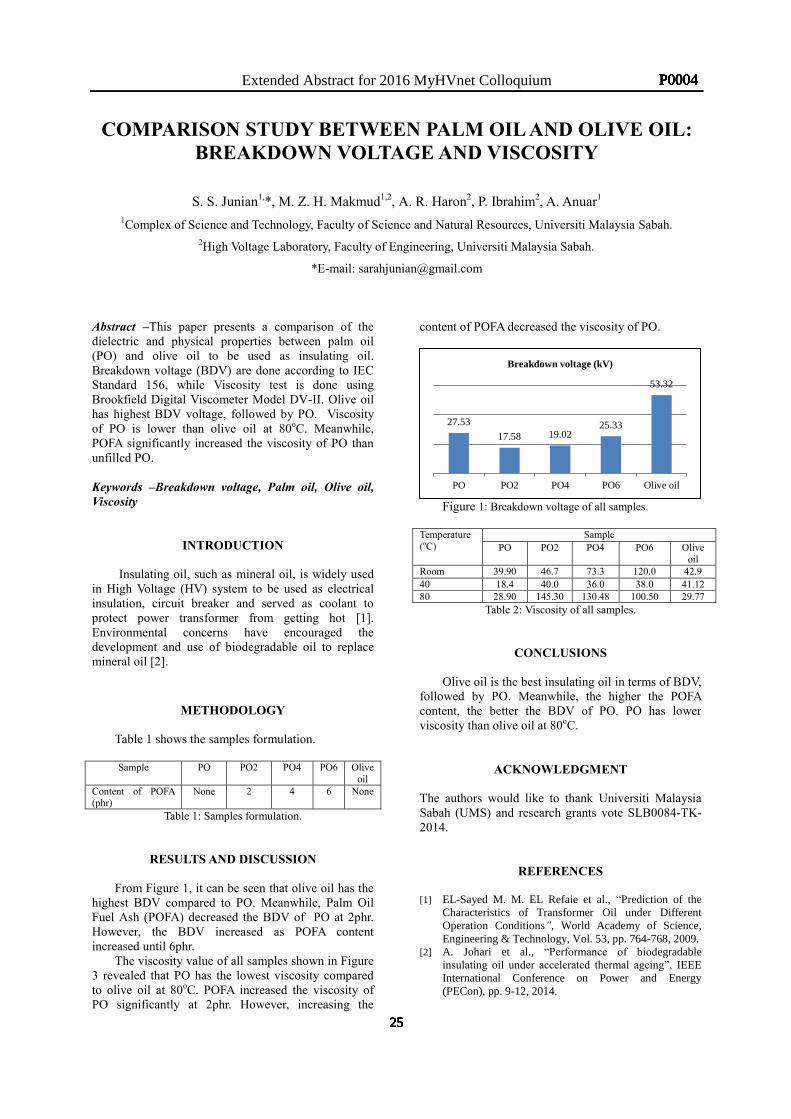
From Figure 1, it can be seen that olive oil has the highest BDV compared to PO. Meanwhile, Palm Oil Fuel Ash (POFA) decreased the BDV of PO at 2phr. However, the BDV increased as POFA content increased until 6phr.
The viscosity value of all samples shown in Figure 3 revealed that PO has the lowest viscosity compared to olive oil at 80oC. POFA increased the viscosity of PO significantly at 2phr. However, increasing the
content of POFA decreased the viscosity of PO.
Figure 1: Breakdown voltage of all samples.
Temperature (oC)
Sample PO PO2 PO4 PO6 Olive
oil Room 39.90 46.7 73.3 120.0 42.9 40 18.4 40.0 36.0 38.0 41.12 80 28.90 145.30 130.48 100.50 29.77
Table 2: Viscosity of all samples.
CONCLUSIONS
Olive oil is the best insulating oil in terms of BDV, followed by PO. Meanwhile, the higher the POFA content, the better the BDV of PO. PO has lower viscosity than olive oil at 80oC.
ACKNOWLEDGMENT
The authors would like to thank Universiti Malaysia Sabah (UMS) and research grants vote SLB0084-TK-2014.
REFERENCES
[1] EL-Sayed M. M. EL Refaie et al., “Prediction of the
Characteristics of Transformer Oil under Different Operation Conditions”, World Academy of Science, Engineering & Technology, Vol. 53, pp. 764-768, 2009.
[2] A. Johari et al., “Performance of biodegradable insulating oil under accelerated thermal ageing”, IEEE International Conference on Power and Energy (PECon), pp. 9-12, 2014.
27.53
17.58 19.02 25.33
53.32
PO PO2 PO4 PO6 Olive oil
Breakdown voltage (kV)
25
P0004
25
P0004
25
P0004
25
P0004
25
P0004
25
P0004
25
P0004
25
P0004
Extended Abstract for 2016 MyHVnet Colloquium
LOW FREQUENCY ANTENNA EVALUATION TO DETECT TRANSIENT LUMINOUS EVENTS (TLEs)
H. G. Chan1,* and A. I. Mohamed1,* 1 Sustainable Energy & Power Electronic Research Cluster (SuPER),
Faculty of Electrical and Electronics Engineering, Universiti Malaysia Pahang (UMP), 26600 Pekan, Pahang, Malaysia. *E-mail: [email protected], [email protected]
Abstract – TLEs are described as short lived electrical breakdown phenomena and listed in very low frequency (VLF) categories. It can be detected using a VLF antenna. This paper discloses a study to evaluate a VLF loop and monopole antenna with different specifications used to detect the signal frequency of TLEs partially in UMP Pekan campus. The smaller size loop antenna and the longer length of the monopole antenna are able in detecting VLF. Characteristics of the antennas are concluded at the end of the paper.
Keywords – TLEs, VLF Loop Antenna, Monopole Antenna, Network Analyser, Antenna Evaluation
INTRODUCTION
TLEs are the types of lightning located at the upper atmosphere [1]. Its frequency is within extremely low frequency (ELF) to VLF [2], hence, a VLF antenna is suitable to use for detecting TLEs signal. This paper discusses the performance of VLF antenna for detecting TLEs signal and to understand the operating frequency of antenna in different size, length, and number of loops.
METHODOLOGY A Network Analyser (E5071C) was used in this
project to analyse the operating frequency response for each different types of antenna such as 89 loops antenna and 6 meter monopole antenna. A block diagram of setup was shown in Figure 1.
Figure 1: A setup for evaluating antenna.
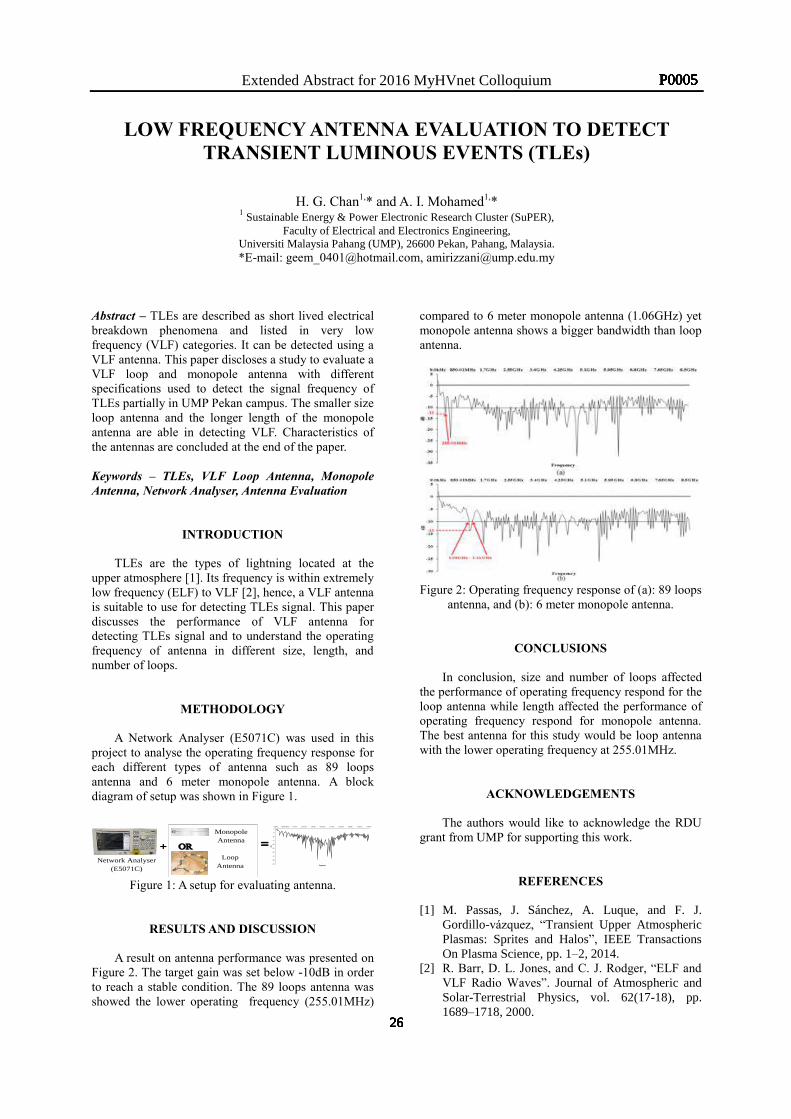
RESULTS AND DISCUSSION
A result on antenna performance was presented on Figure 2. The target gain was set below -10dB in order to reach a stable condition. The 89 loops antenna was showed the lower operating frequency (255.01MHz)
compared to 6 meter monopole antenna (1.06GHz) yet monopole antenna shows a bigger bandwidth than loop antenna.
Figure 2: Operating frequency response of (a): 89 loops
antenna, and (b): 6 meter monopole antenna.
CONCLUSIONS
In conclusion, size and number of loops affected the performance of operating frequency respond for the loop antenna while length affected the performance of operating frequency respond for monopole antenna. The best antenna for this study would be loop antenna with the lower operating frequency at 255.01MHz.
ACKNOWLEDGEMENTS The authors would like to acknowledge the RDU
grant from UMP for supporting this work.
REFERENCES
[1] M. Passas, J. Sánchez, A. Luque, and F. J.
Gordillo-vázquez, “Transient Upper Atmospheric Plasmas: Sprites and Halos”, IEEE Transactions On Plasma Science, pp. 1–2, 2014.
[2] R. Barr, D. L. Jones, and C. J. Rodger, “ELF and VLF Radio Waves”. Journal of Atmospheric and Solar-Terrestrial Physics, vol. 62(17-18), pp. 1689–1718, 2000.
Monopole Antenna
Loop Antenna -45
-40
-35
-30
-25
-20
-15
-10
-5
09.0kHz 850.01MHz 1.7GHz 2.55GHz 3.4GHz 4.25GHz 5.1GHz 5.95GHz 6.8GHz 7.65GHz 8.5GHz
dB
Frequency
Network Analyser (E5071C)
26
P0005
26
P0005
26
P0005
26
P0005
26
P0005
26
P0005
26
P0005
26
P0005
Extended Abstract for 2016 MyHVnet Colloquium
EVALUATION OF THERMAL EFFECT ON DIELECTRIC PROPERTIES OF PALM OIL AS LIQUID INSULATION
P. Langgayang1,*, M. Z. H. Makmud1, M. S. Sarjadi1, A. S. A. Hamid1, Y. Z. Arief2 1Complex of Science and Technology, Faculty of Science and Natural Resources, Universiti Malaysia Sabah.
2Institute of High Voltage and High Current, Faculty of Electrical Engineering, Universiti Teknologi Malaysia.
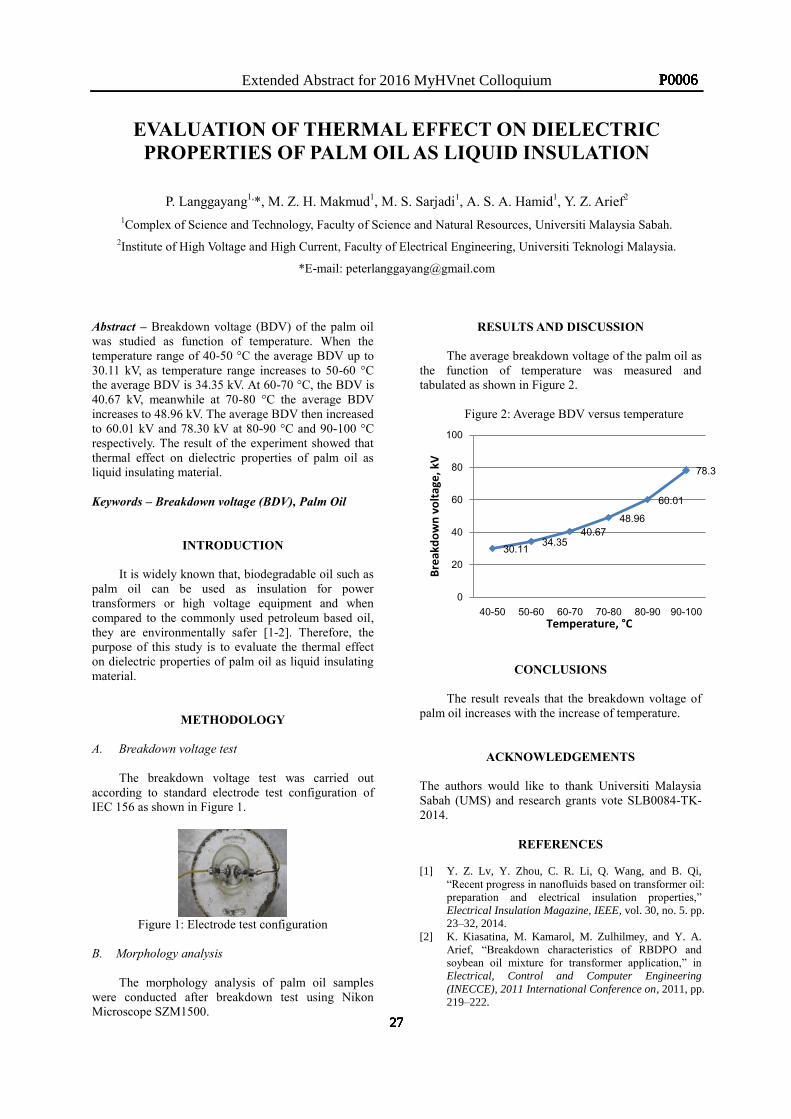
*E-mail: [email protected] Abstract – Breakdown voltage (BDV) of the palm oil was studied as function of temperature. When the temperature range of 40-50 °C the average BDV up to 30.11 kV, as temperature range increases to 50-60 °C the average BDV is 34.35 kV. At 60-70 °C, the BDV is 40.67 kV, meanwhile at 70-80 °C the average BDV increases to 48.96 kV. The average BDV then increased to 60.01 kV and 78.30 kV at 80-90 °C and 90-100 °C respectively. The result of the experiment showed that thermal effect on dielectric properties of palm oil as liquid insulating material.
Keywords – Breakdown voltage (BDV), Palm Oil
INTRODUCTION
It is widely known that, biodegradable oil such as palm oil can be used as insulation for power transformers or high voltage equipment and when compared to the commonly used petroleum based oil, they are environmentally safer [1-2]. Therefore, the purpose of this study is to evaluate the thermal effect on dielectric properties of palm oil as liquid insulating material.
METHODOLOGY
A. Breakdown voltage test
The breakdown voltage test was carried out according to standard electrode test configuration of IEC 156 as shown in Figure 1.
Figure 1: Electrode test configuration
B. Morphology analysis
The morphology analysis of palm oil samples were conducted after breakdown test using Nikon Microscope SZM1500.
RESULTS AND DISCUSSION
The average breakdown voltage of the palm oil as the function of temperature was measured and tabulated as shown in Figure 2.
Figure 2: Average BDV versus temperature
CONCLUSIONS
The result reveals that the breakdown voltage of palm oil increases with the increase of temperature.
ACKNOWLEDGEMENTS
The authors would like to thank Universiti Malaysia Sabah (UMS) and research grants vote SLB0084-TK-2014.
REFERENCES
[1] Y. Z. Lv, Y. Zhou, C. R. Li, Q. Wang, and B. Qi,
“Recent progress in nanofluids based on transformer oil: preparation and electrical insulation properties,” Electrical Insulation Magazine, IEEE, vol. 30, no. 5. pp. 23–32, 2014.
[2] K. Kiasatina, M. Kamarol, M. Zulhilmey, and Y. A. Arief, “Breakdown characteristics of RBDPO and soybean oil mixture for transformer application,” in Electrical, Control and Computer Engineering (INECCE), 2011 International Conference on, 2011, pp. 219–222.
30.11 34.35 40.67
48.96 60.01
78.3
0
20
40
60
80
100
40-50 50-60 60-70 70-80 80-90 90-100
Brea
kdow
n vo
ltage
, kV
Temperature, °C
27
P0006
27
P0006
27
P0006
27
P0006
27
P0006
27
P0006
27
P0006
27
P0006
Extended Abstract for 2016 MyHVnet Colloquium
ENHANCED PARTIAL DSICHARGE RESISTANCE OF LDPE/BORON NITRIDE NANOCOMPOSITE
A. Zeol1, M. H. Ahmad1 and N.A. Awang1 1Institute of High Voltage and High Current, Universiti Teknologi Malaysia, 81310 Johor Bahru, Malaysia.
*E-mail: [email protected], [email protected],[email protected] Abstract - Partial Discharge (PD) is pre-breakdown phenomenon that occurs in microvoids or defects that exist inside the polymeric insulation cables. In view of foregoing, nanocomposites materials are applied in preventing insulation breakdown due to the PD activities. Thus, this study aimed to investigate the effect 5 wt% of Boron (BN) filler concentration on PD characteristics using CIGRE Method II electrode configuration. The results revealed that Low density polyethylene (LDPE) nanocomposite with addition of BN filler was better in PD resistance compared to neat LPDE polymer sample. By adding an inorganic component inside the organic component, it has changed the properties of the materials electrically. Keywords – Partial Dischare (PD) characterisitcs, Polymer Nanocomposite, LDPE, Boron Nitirde.
INTRODUCTION In high voltage equipment, the failures of
insulation depend on the insulating materials. Polymers have been serving successfully in various types of industry in the word including biomedical, aerospace, semiconductor and also as insulation materials in high voltage equipment. In high voltage equipment, power cables and its accessories are always exposed to prebreakdown phenomenon known as partial discharge (PD). PD occurs when there are microvoids or defects that exists inside the cable and its accessories insualtion. To improve the performance of the cable insulation against PD, polymeric nanocomposites have been introduced by adding nanofiller into the insulating material [1]. Previously, many researchers have used conventional oxide based nanofiller such as silicone dioxide (SiO2), Magnesium oxide (MgO) and Zinc dioxide (ZnO) which contain oxygen atom thereby leading to oxidative degradation process. Therefore, nitride based nanofiller, Boron nitride was used in this study and it was more suitable compare to the other oxide based nanofiller. Boron nitride does not contain oxygen atom that will lead to oxidation process and it has high electrical resistance also very good as a electrical insulator [2].
METHODOLOGY
LDPE was employed as insulating material in this study. It was supplied by Titan Chemical Sdn Bhd. The nanofiller used was Boron Nitride (BN) and it was purchased from Nanocor with size of 137nm. The percentage of BN nanofiller in this study was 5wt% . The mixture of LDPE and BN nanofiller was conducted under several process to produce a homogeneous mixture. PD resistance performance was
conducted using CIGRE method II system which consists of a cavity in the middle of molded sphere electrode by applying 6kV rms for 60 minutes.
RESULTS AND DISCUSSION From Figure 1, it can be seen that the PD occurred
between zero crossing and the peak of both half cycles for both types of the sample. Also, it was observed that, the PD magnitude value and PD number in pure LDPE sample was higher than the LDPE nanocomposite sample.
Figure 1: NQP pattern of LDPE/BN nanocomposite at
6kVrms
CONCLUSIONS PD characterisitcs on untreated LDPE/BN
nanocomposite has been carried out in this work. The results revealed that the additions of untreated BN filler show a decreasing in the PD magnitude and the PD number as compared to the neat LDPE sample.
ACKNOWLEDGEMENTS The authors would like to acknowledge Universiti
Teknologi Malaysia (UTM) for providing the facilities and the Ministry of Higher Education (MOHE), Malaysia for the Research Grants Vot 4F599 for financial support and advice during this research work.
REFERENCES
[1]T. Tanaka, G. C. Montanari, and R. Mulhaupt, “Polymer nanocomposites as dielectrics and electrical insulation-perspectives for processing technologies, material characterization and future applications,” IEEE Trans. Dielectr. Electr. Insul., vol. 11, no. 5, pp. 763–784, Oct. 2004.
[2] [2]T. Heid, S. Savoie, C. Vanga, M. Frechette, E. David, N. Freebody, and A. Vaughan, “Surface resistance of epoxy/BN micro- and Meso-composites exposed to electrical discharges,” in 2013 IEEE International Conference on Solid Dielectrics (ICSD), 2013, pp. 872–875.
28
P0007
28
P0007
28
P0007
28
P0007
28
P0007
28
P0007
28
P0007
28
P0007
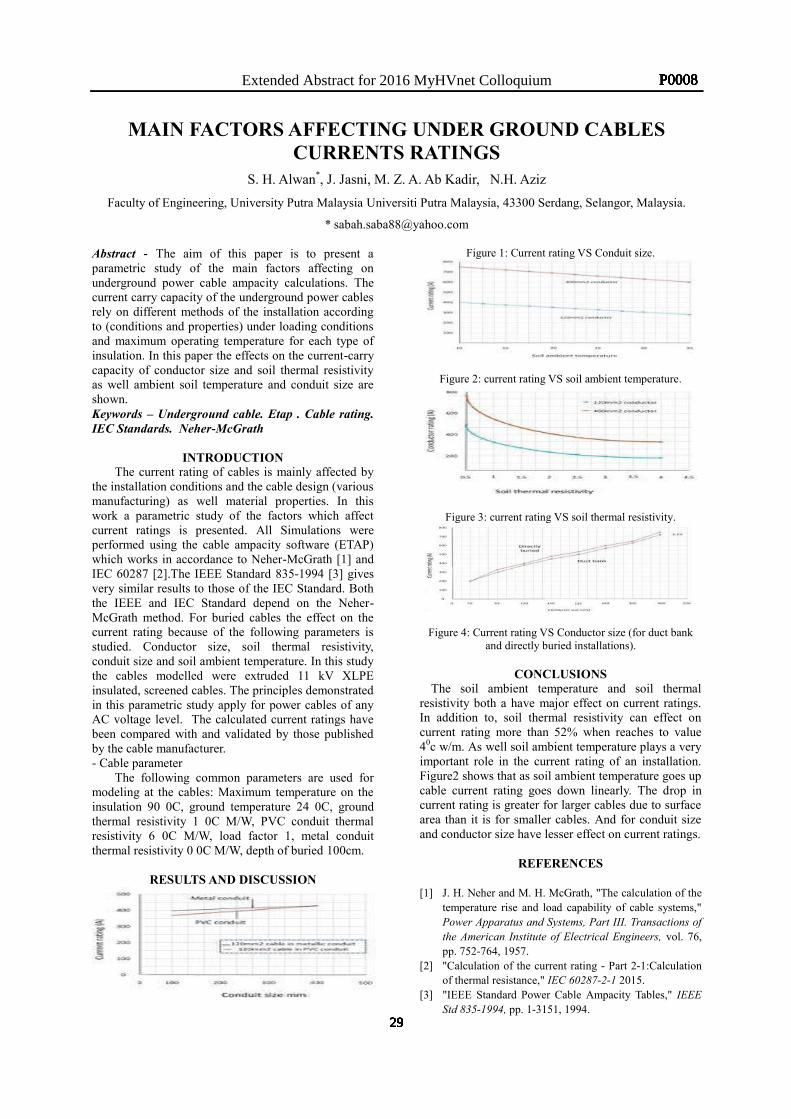
Extended Abstract for 2016 MyHVnet Colloquium
MAIN FACTORS AFFECTING UNDER GROUND CABLES CURRENTS RATINGS
S. H. Alwan*, J. Jasni, M. Z. A. Ab Kadir, N.H. Aziz
Faculty of Engineering, University Putra Malaysia Universiti Putra Malaysia, 43300 Serdang, Selangor, Malaysia.
* [email protected] Abstract - The aim of this paper is to present a parametric study of the main factors affecting on underground power cable ampacity calculations. The current carry capacity of the underground power cables rely on different methods of the installation according to (conditions and properties) under loading conditions and maximum operating temperature for each type of insulation. In this paper the effects on the current-carry capacity of conductor size and soil thermal resistivity as well ambient soil temperature and conduit size are shown. Keywords – Underground cable. Etap . Cable rating. IEC Standards. Neher-McGrath
INTRODUCTION The current rating of cables is mainly affected by
the installation conditions and the cable design (various manufacturing) as well material properties. In this work a parametric study of the factors which affect current ratings is presented. All Simulations were performed using the cable ampacity software (ETAP) which works in accordance to Neher-McGrath [1] and IEC 60287 [2].The IEEE Standard 835-1994 [3] gives very similar results to those of the IEC Standard. Both the IEEE and IEC Standard depend on the Neher-McGrath method. For buried cables the effect on the current rating because of the following parameters is studied. Conductor size, soil thermal resistivity, conduit size and soil ambient temperature. In this study the cables modelled were extruded 11 kV XLPE insulated, screened cables. The principles demonstrated in this parametric study apply for power cables of any AC voltage level. The calculated current ratings have been compared with and validated by those published by the cable manufacturer. - Cable parameter
The following common parameters are used for modeling at the cables: Maximum temperature on the insulation 90 0C, ground temperature 24 0C, ground thermal resistivity 1 0C M/W, PVC conduit thermal resistivity 6 0C M/W, load factor 1, metal conduit thermal resistivity 0 0C M/W, depth of buried 100cm.
RESULTS AND DISCUSSION
Figure 1: Current rating VS Conduit size.
Figure 2: current rating VS soil ambient temperature.
Figure 3: current rating VS soil thermal resistivity.
Figure 4: Current rating VS Conductor size (for duct bank and directly buried installations).
CONCLUSIONS
The soil ambient temperature and soil thermal resistivity both a have major effect on current ratings. In addition to, soil thermal resistivity can effect on current rating more than 52% when reaches to value 40c w/m. As well soil ambient temperature plays a very important role in the current rating of an installation. Figure2 shows that as soil ambient temperature goes up cable current rating goes down linearly. The drop in current rating is greater for larger cables due to surface area than it is for smaller cables. And for conduit size and conductor size have lesser effect on current ratings.
REFERENCES
[1] J. H. Neher and M. H. McGrath, "The calculation of the
temperature rise and load capability of cable systems," Power Apparatus and Systems, Part III. Transactions of the American Institute of Electrical Engineers, vol. 76, pp. 752-764, 1957.
[2] "Calculation of the current rating - Part 2-1:Calculation of thermal resistance," IEC 60287-2-1 2015.
[3] "IEEE Standard Power Cable Ampacity Tables," IEEE Std 835-1994, pp. 1-3151, 1994.
29
P0008
29
P0008
29
P0008
29
P0008
29
P0008
29
P0008
29
P0008
29
P0008
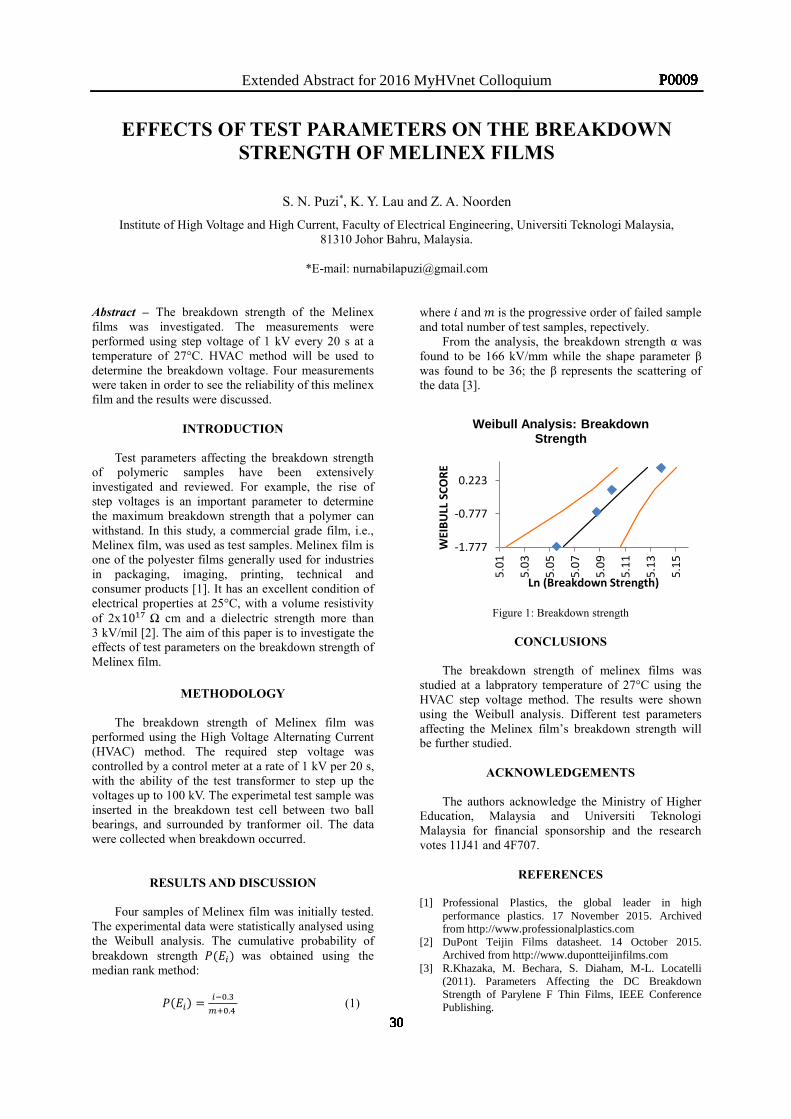
Extended Abstract for 2016 MyHVnet Colloquium
EFFECTS OF TEST PARAMETERS ON THE BREAKDOWN STRENGTH OF MELINEX FILMS
S. N. Puzi*, K. Y. Lau and Z. A. Noorden
Institute of High Voltage and High Current, Faculty of Electrical Engineering, Universiti Teknologi Malaysia, 81310 Johor Bahru, Malaysia.
*E-mail: [email protected]
Abstract – The breakdown strength of the Melinex films was investigated. The measurements were performed using step voltage of 1 kV every 20 s at a temperature of 27°C. HVAC method will be used to determine the breakdown voltage. Four measurements were taken in order to see the reliability of this melinex film and the results were discussed.
INTRODUCTION
Test parameters affecting the breakdown strength of polymeric samples have been extensively investigated and reviewed. For example, the rise of step voltages is an important parameter to determine the maximum breakdown strength that a polymer can withstand. In this study, a commercial grade film, i.e., Melinex film, was used as test samples. Melinex film is one of the polyester films generally used for industries in packaging, imaging, printing, technical and consumer products [1]. It has an excellent condition of electrical properties at 25°C, with a volume resistivity of 2x10¹⁷ Ω cm and a dielectric strength more than 3 kV/mil [2]. The aim of this paper is to investigate the effects of test parameters on the breakdown strength of Melinex film.
METHODOLOGY
The breakdown strength of Melinex film was
performed using the High Voltage Alternating Current (HVAC) method. The required step voltage was controlled by a control meter at a rate of 1 kV per 20 s, with the ability of the test transformer to step up the voltages up to 100 kV. The experimetal test sample was inserted in the breakdown test cell between two ball bearings, and surrounded by tranformer oil. The data were collected when breakdown occurred.
RESULTS AND DISCUSSION
Four samples of Melinex film was initially tested.
The experimental data were statistically analysed using the Weibull analysis. The cumulative probability of breakdown strength 𝑃(𝐸𝑖) was obtained using the median rank method:
𝑃(𝐸𝑖) = 𝑖−0.3𝑚+0.4
(1)
where 𝑖 and 𝑚 is the progressive order of failed sample and total number of test samples, repectively.
From the analysis, the breakdown strength α was found to be 166 kV/mm while the shape parameter β was found to be 36; the β represents the scattering of the data [3].
Figure 1: Breakdown strength
CONCLUSIONS
The breakdown strength of melinex films was
studied at a labpratory temperature of 27°C using the HVAC step voltage method. The results were shown using the Weibull analysis. Different test parameters affecting the Melinex film’s breakdown strength will be further studied.
ACKNOWLEDGEMENTS The authors acknowledge the Ministry of Higher
Education, Malaysia and Universiti Teknologi Malaysia for financial sponsorship and the research votes 11J41 and 4F707.
REFERENCES [1] Professional Plastics, the global leader in high
performance plastics. 17 November 2015. Archived from http://www.professionalplastics.com
[2] DuPont Teijin Films datasheet. 14 October 2015. Archived from http://www.dupontteijinfilms.com
[3] R.Khazaka, M. Bechara, S. Diaham, M-L. Locatelli (2011). Parameters Affecting the DC Breakdown Strength of Parylene F Thin Films, IEEE Conference Publishing.
-1.777
-0.777
0.2235.
01
5.03
5.05
5.07
5.09
5.11
5.13
5.15
WEI
BULL
SCO
RE
Ln (Breakdown Strength)
Weibull Analysis: Breakdown Strength
30
P0009
30
P0009
30
P0009
30
P0009
30
P0009
30
P0009
30
P0009
30
P0009
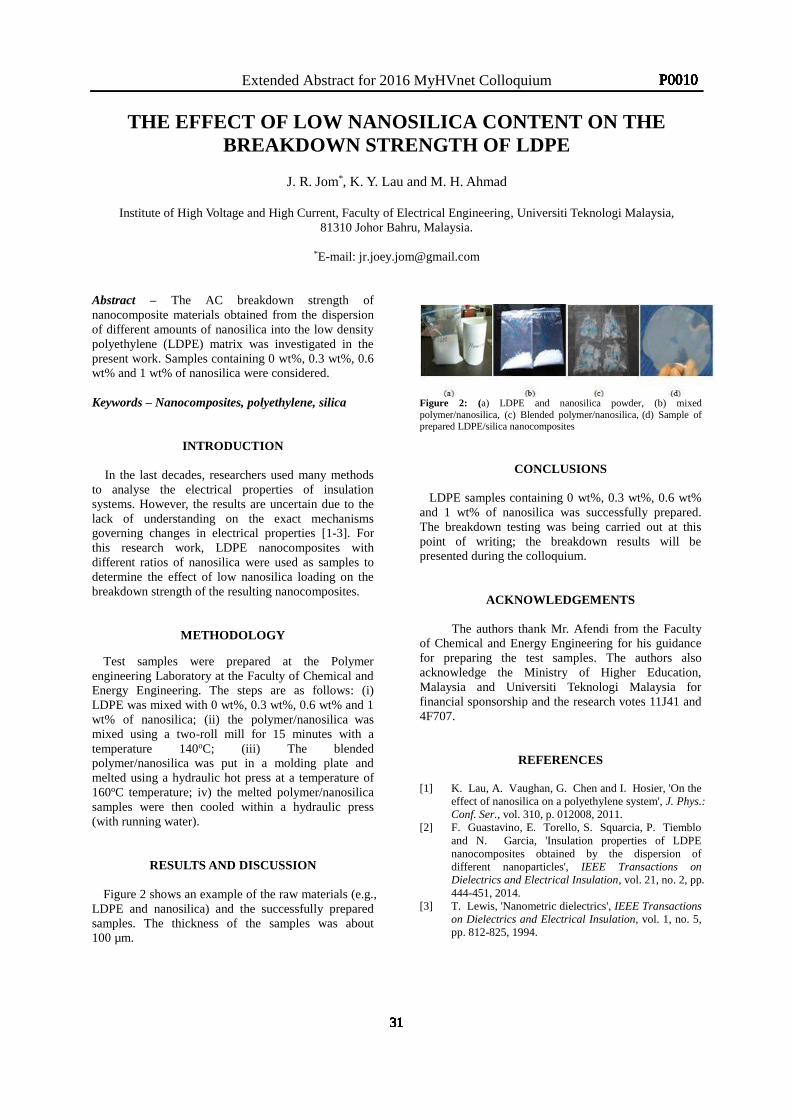
Extended Abstract for 2016 MyHVnet Colloquium
THE EFFECT OF LOW NANOSILICA CONTENT ON THE BREAKDOWN STRENGTH OF LDPE
J. R. Jom*, K. Y. Lau and M. H. Ahmad
Institute of High Voltage and High Current, Faculty of Electrical Engineering, Universiti Teknologi Malaysia,
81310 Johor Bahru, Malaysia.
*E-mail: [email protected] Abstract – The AC breakdown strength of nanocomposite materials obtained from the dispersion of different amounts of nanosilica into the low density polyethylene (LDPE) matrix was investigated in the present work. Samples containing 0 wt%, 0.3 wt%, 0.6 wt% and 1 wt% of nanosilica were considered. Keywords – Nanocomposites, polyethylene, silica
INTRODUCTION In the last decades, researchers used many methods to analyse the electrical properties of insulation systems. However, the results are uncertain due to the lack of understanding on the exact mechanisms governing changes in electrical properties [1-3]. For this research work, LDPE nanocomposites with different ratios of nanosilica were used as samples to determine the effect of low nanosilica loading on the breakdown strength of the resulting nanocomposites.
METHODOLOGY
Test samples were prepared at the Polymer engineering Laboratory at the Faculty of Chemical and Energy Engineering. The steps are as follows: (i) LDPE was mixed with 0 wt%, 0.3 wt%, 0.6 wt% and 1 wt% of nanosilica; (ii) the polymer/nanosilica was mixed using a two-roll mill for 15 minutes with a temperature 140oC; (iii) The blended polymer/nanosilica was put in a molding plate and melted using a hydraulic hot press at a temperature of 160oC temperature; iv) the melted polymer/nanosilica
samples were then cooled within a hydraulic press (with running water).
RESULTS AND DISCUSSION
Figure 2 shows an example of the raw materials (e.g., LDPE and nanosilica) and the successfully prepared samples. The thickness of the samples was about 100 µm.
Figure 2: (a) LDPE and nanosilica powder, (b) mixed polymer/nanosilica, (c) Blended polymer/nanosilica, (d) Sample of prepared LDPE/silica nanocomposites
CONCLUSIONS
LDPE samples containing 0 wt%, 0.3 wt%, 0.6 wt% and 1 wt% of nanosilica was successfully prepared. The breakdown testing was being carried out at this point of writing; the breakdown results will be presented during the colloquium.
ACKNOWLEDGEMENTS
The authors thank Mr. Afendi from the Faculty of Chemical and Energy Engineering for his guidance for preparing the test samples. The authors also acknowledge the Ministry of Higher Education, Malaysia and Universiti Teknologi Malaysia for financial sponsorship and the research votes 11J41 and 4F707.
REFERENCES
[1] K. Lau, A. Vaughan, G. Chen and I. Hosier, 'On the
effect of nanosilica on a polyethylene system', J. Phys.: Conf. Ser., vol. 310, p. 012008, 2011.
[2] F. Guastavino, E. Torello, S. Squarcia, P. Tiemblo and N. Garcia, 'Insulation properties of LDPE nanocomposites obtained by the dispersion of different nanoparticles', IEEE Transactions on Dielectrics and Electrical Insulation, vol. 21, no. 2, pp. 444-451, 2014.
[3] T. Lewis, 'Nanometric dielectrics', IEEE Transactions on Dielectrics and Electrical Insulation, vol. 1, no. 5, pp. 812-825, 1994.
31
P0010
31
P0010
31
P0010
31
P0010
31
P0010
31
P0010
31
P0010
31
P0010
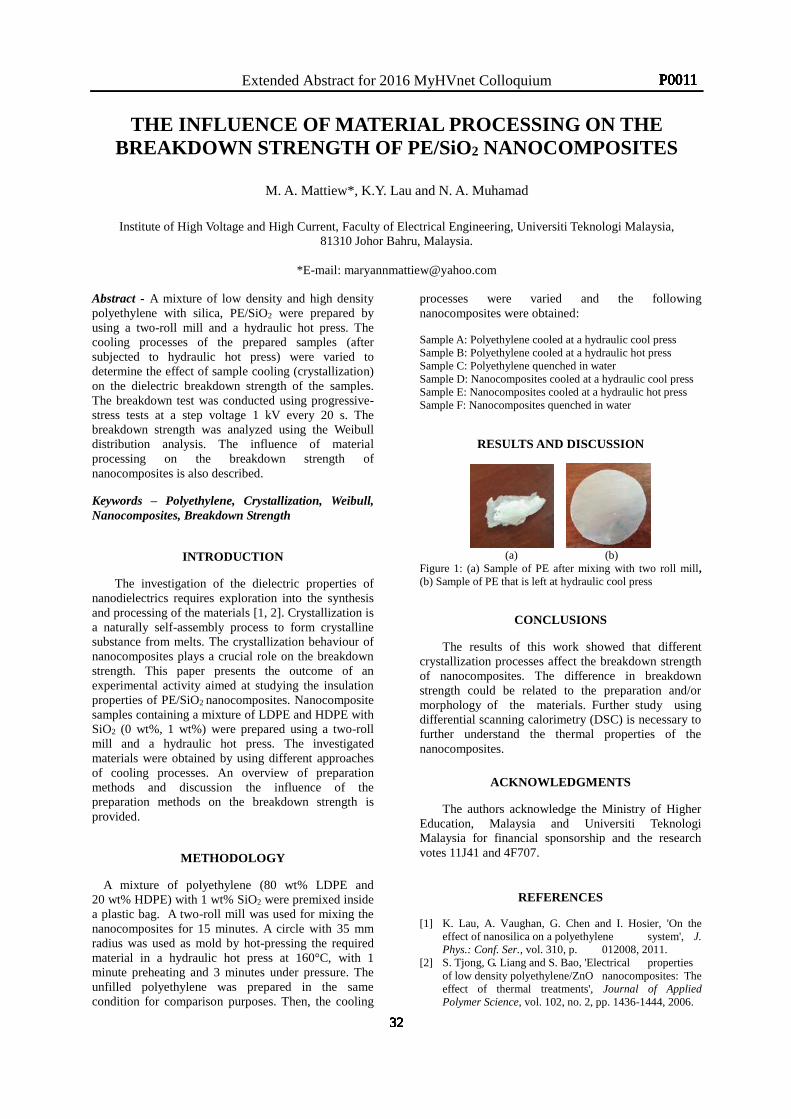
Extended Abstract for 2016 MyHVnet Colloquium
THE INFLUENCE OF MATERIAL PROCESSING ON THE BREAKDOWN STRENGTH OF PE/SiO2 NANOCOMPOSITES
M. A. Mattiew*, K.Y. Lau and N. A. Muhamad
Institute of High Voltage and High Current, Faculty of Electrical Engineering, Universiti Teknologi Malaysia, 81310 Johor Bahru, Malaysia.
*E-mail: [email protected]
Abstract - A mixture of low density and high density polyethylene with silica, PE/SiO2 were prepared by using a two-roll mill and a hydraulic hot press. The cooling processes of the prepared samples (after subjected to hydraulic hot press) were varied to determine the effect of sample cooling (crystallization) on the dielectric breakdown strength of the samples. The breakdown test was conducted using progressive-stress tests at a step voltage 1 kV every 20 s. The breakdown strength was analyzed using the Weibull distribution analysis. The influence of material processing on the breakdown strength of nanocomposites is also described.
Keywords – Polyethylene, Crystallization, Weibull, Nanocomposites, Breakdown Strength
INTRODUCTION
The investigation of the dielectric properties of nanodielectrics requires exploration into the synthesis and processing of the materials [1, 2]. Crystallization is a naturally self-assembly process to form crystalline substance from melts. The crystallization behaviour of nanocomposites plays a crucial role on the breakdown strength. This paper presents the outcome of an experimental activity aimed at studying the insulation properties of PE/SiO2 nanocomposites. Nanocomposite samples containing a mixture of LDPE and HDPE with SiO2 (0 wt%, 1 wt%) were prepared using a two-roll mill and a hydraulic hot press. The investigated materials were obtained by using different approaches of cooling processes. An overview of preparation methods and discussion the influence of the preparation methods on the breakdown strength is provided.
METHODOLOGY
A mixture of polyethylene (80 wt% LDPE and 20 wt% HDPE) with 1 wt% SiO2 were premixed inside a plastic bag. A two-roll mill was used for mixing the nanocomposites for 15 minutes. A circle with 35 mm radius was used as mold by hot-pressing the required material in a hydraulic hot press at 160°C, with 1 minute preheating and 3 minutes under pressure. The unfilled polyethylene was prepared in the same condition for comparison purposes. Then, the cooling
processes were varied and the following nanocomposites were obtained:
Sample A: Polyethylene cooled at a hydraulic cool press Sample B: Polyethylene cooled at a hydraulic hot press Sample C: Polyethylene quenched in water Sample D: Nanocomposites cooled at a hydraulic cool press Sample E: Nanocomposites cooled at a hydraulic hot press Sample F: Nanocomposites quenched in water
RESULTS AND DISCUSSION
(a) (b)
Figure 1: (a) Sample of PE after mixing with two roll mill, (b) Sample of PE that is left at hydraulic cool press
CONCLUSIONS
The results of this work showed that different crystallization processes affect the breakdown strength of nanocomposites. The difference in breakdown strength could be related to the preparation and/or morphology of the materials. Further study using differential scanning calorimetry (DSC) is necessary to further understand the thermal properties of the nanocomposites.
ACKNOWLEDGMENTS
The authors acknowledge the Ministry of Higher Education, Malaysia and Universiti Teknologi Malaysia for financial sponsorship and the research votes 11J41 and 4F707.
REFERENCES
[1] K. Lau, A. Vaughan, G. Chen and I. Hosier, 'On the effect of nanosilica on a polyethylene system', J. Phys.: Conf. Ser., vol. 310, p. 012008, 2011.
[2] S. Tjong, G. Liang and S. Bao, 'Electrical properties of low density polyethylene/ZnO nanocomposites: The effect of thermal treatments', Journal of Applied Polymer Science, vol. 102, no. 2, pp. 1436-1444, 2006.
32
P0011
32
P0011
32
P0011
32
P0011
32
P0011
32
P0011
32
P0011
32
P0011
Extended Abstract for 2016 MyHVnet Colloquium
TNBR Lightning Detection System Network: The Latest Generation of Lightning Sensors and the Optimum Placement for Enhanced Detection Performance
N. Mohd Hatta*, N. Abdullah, M.P. Yahaya, N.A. Abd Rahman, M.S. Reffin TNB Research Sdn. Bhd., Malaysia. *E-mail: [email protected]
Abstract –TNB Research Sdn. Bhd. (TNBR) has installed a Lightning Detection System Network (LDSN) in the Peninsular Malaysia in 1994. The first network upgrade was carried out in 2003 with lightning sensors of improved location accuracy and detection efficiency. After eight years of operations, in 2011, the sensors were further upgraded in stages to the latest generation of sensors available from Vaisala Inc., USA. The latest sensor generation technology, the LDSN upgrades and the network performance enhancement will be presented. The optimum lightning sensor placement aspect and the sensor siting and verification work will be discussed. Keywords– lightning sensor, lightning detection system network, optimum placement, enhanced performance
INTRODUCTION Lightning data are important inputs in many
mitigation initiatives undertaken by utilities to study and reduce the impacts of lightning on power systems. TNBR has been providing lightning data to TNB and external customers for various purposes since the inception of LDSN in 1995. It is crucial for TNBR to continuously enhance the reliability and quality of lightning data as to meet the customer growing demands and expectations. This is achieved through a series of LDSN upgrades using the latest generation of lightning sensors optimally placed in the Peninsular Malaysia.
NETWORK IMPLEMENTATION The first LDSN which was installed and
commissioned in 1995 has been described in [1,2]. In 2003, the upgraded LDSN comprises of five IMPACT-ESP sensors and two LPATS-IV sensors. IMPACT- ESP used the combination of both Time-Of-Arrival (TOA) and Magnetic Direction Finding (MDF) techniques to achieve improved detection performance with the location accuracy of 500m and detection efficiency of 95%.
In 2011, two sensors were upgraded to the latest generation of sensor, which is LS7001 model. LS7001 uses essentially the same detection techniques as that of IMPACT ESP. However, the location accuracy of this sensor is further improved to 250m, while the detection efficiency is maintained at 95%. This sensor also offers greater communication flexibility including 10BaseT, USB, and Optical. The present LDSN which was upgaded recently in Aug 2015 comprises of five latest generation of sensor family which are LS7001 and LS7002 models.
LIGHTNING SENSOR SITING Lightning sensor siting was performed in March
2015 with the aim of determining the best sites for the LS7002 sensors for LDSN to achieve the intended detection performance with consideration of the coverage area and its geometry and the location of present sensors. The sensor site acceptance criteria are:
i. Availability of power supply & telecommunication
services ii. Presence of nearby physical objects potentially
obstructing the sensor operations iii. Soil conductivity and grounding impedance of the
potential building for the sensor installation iv. Presence of electrical noises and RF which may
interfere with the sensor operation v. Relative locations and orientation of the other
sensors in the LDSN vi. Presence of power line harmonics, B-field and E-
fields Fifteen sites were preliminarily identified but they
were later shorlisted to twelve following the initial site surveys. Three sites were not considered because they failed on noise level limit acceptance criteria. Five sites passed all site acceptance criteria and sensors can be set-up to operate with Gain 8 Detection Sensitivity Level and three with Gain 6. Whilst the remaining four sites failed one or more site acceptance criteria. The identified eight sites that passed the acceptance criteria were then analysed to determine the the final two sites for LS7002 sensors that give the optimum detection performance.
CONCLUSIONS
The placement of lightning sensors in crucial for the detection performance of the LDSN. With their optimum placement, the present LDSN achieves enhanced quality of lighting data for various applications and purposes.
REFERENCES [1] M. P. Yahaya, et. al., “Lightning Detection System
in Malaysia,” Proc. National Technical Seminar on Standardization and Development of Lightning Protection Technologies- Malaysian Environment, Malaysia, 6-7 Nov, 1996.
[2] Abdullah, N, et. al. “Implementation and Use of Lightning Detection Network in Malaysia”, Proc. 2nd IEEE International Conference on Power and Energy (PECon 08), 1-3 Dec, 2008, Malaysia.
[3] Tyler, L.B et. al, “Improved Cloud-to-Ground and Intracloud Lightning Detection with the LS7002 Advanced Total Lightning Sensor”, ILDC, 18-21 Mar 2014, Arizona, USA.
33
P0012
33
P0012
33
P0012
33
P0012
33
P0012
33
P0012
33
P0012
33
P0012
Extended Abstract for 2016 MyHVnet Colloquium
COMPARISON BETWEEN THE SPACE CHARGE TECHNIQUE N. K. Ludin1,*, A. I. Mohamed2
1Faculty of Electrical and Electronic Engineering, Universiti Malaysia Pahang, 26600 Pahang, Malaysia.
*E-mail: [email protected], [email protected]
Abstract – Space charge in solid insulating material give an affect to high-field conduction and breakdown phenomena. Previously, there are a few non-destructive techniques that being used to measured the space charge in insulating polymers which are Thermal Step method (TSM), Laser induced Pressure Pulse method (LIPP) and Pulse Electro-acoustic method (PEA). In this paper, comparison between the space charge techniques will be reviewed. From the previous study, PEA method is the best method by refering to their advantage such as low noise, easy to setup, and high resolution. Keywords – Space Charge, PEA, LIPP, TSM, Insulating Material
INTRODUCTION
The accumulation of space charge in insulating material can effect their electrical conduction and breakdown properties. Practical methods to determine the space charge in electrical insulation was developed during last four decades [4]. The methods that mainly used nowadays are TSM [1], LIPP [2], and PEA method [3]. The TSM was proposed in the early of 1980s by Toureille. For the LIPP technique, it was developed by Lewiner and coworker by late 1980s. Then for the PEA method, it was developed by Takada. PEA method also first develop at the end of 1980s, however this method has been improving continuously by researcher nowadays around the world.
METHODS AND DISCUSSION
The non-destructive space charge
measurement techniques mentioned above are explained in this part. One of the technique is TSM which this technique determine space charge in thick and thin dielectric samples. The experimental is simple but the numerical techniques required for analysed the data is complex [5]. The next technique is LIPP which is based on pressure pulse technique. This technique is complex to setup compared to PEA but it has high resolution. However, this technique implement higher cost. The PEA technique is developed based on different principle. Instead of using laser pulse source as in LIPP method, a high voltage pulse source is used in PEA method. These technique is prefered in Japan compared to the other technique that popular in Europe and North- America. PEA technique only required low cost, easy to setup and has low noise. Nowadays,
improvement for this technique including electronics sensitivity, better piezo-tranducers had lead to contemporary spatial resolution ≤ 10 μm. The PEA technique consists in detecting acoustic waves generated by space charges when they are subjected to an impulse of electric field. By compared to other techniques as LIPP and TSM, the PEA technique is the only one being not based on the relative displacement of the space charge in respect to the electrodes.
CONCLUSION AND FUTURE WORK
As a conclusion, PEA technique is the best way to measure space charge in insulating materials nowadays. The use of PEA technique is very flexible and their principle is simple to understand which is the techniques does not required a complex mathematical treatment like LIPP. For the future works, sample will prepared by adding up the plasma treatment during the sample preparation.
ACKNOWLEDGEMENTS
I would like to thanks to my supervisor for his
helpful comment during finished this writing.
REFERENCES
[1] A. S. DeReggi, C. M. Guttman, F. I Mopsik, G. T. Davis and M. Broadhurst, “Determination of Charge in Polarization Distribution across Polymer Electrets by the Thermal Pulse Method and Fourier Analysis”, Phys. Rev. Lett. Vol. 40, pp.413-416, 1978. [2] R. Gerhard-Multhaupt, “Analysis of Pressure-wave Methods for the Non destructive Determination of Spatial Charge or Field Distribution in Dielectrics”, Phys. Rev. B, Vol. 27, pp. 2494-2503,1983. [3] T. Takada, T. Sakai. Measurement of Electric Fields at a Dielectric/Electrode Interface Using an Acoustic Transducer Technique. IEEE Trans. Electrical Insulation, vol. EI-18, no. 6, pp. 619– 628,1983. [4] Y. Li, T. Takada. 1997. Progress in Space Charge Measurement of Solid Insulating Materials in Japan. IEEE Electrical Insulation Magazine, vol. 10, no. 5, pp. 16–28, 1997. [5] M. Abou-Dakka, S.S. Bamji, A.T. Bulinski, “Space Charge Distribution in XLPE by TSM, Using The Inverse Matrix Technique”, IEEE Transaction on Dielectric and Elrctrical Insulation, vol. 4, no. 3, pp. 314–320, 1997.
34
P0013
34
P0013
34
P0013
34
P0013
34
P0013
34
P0013
34
P0013
34
P0013
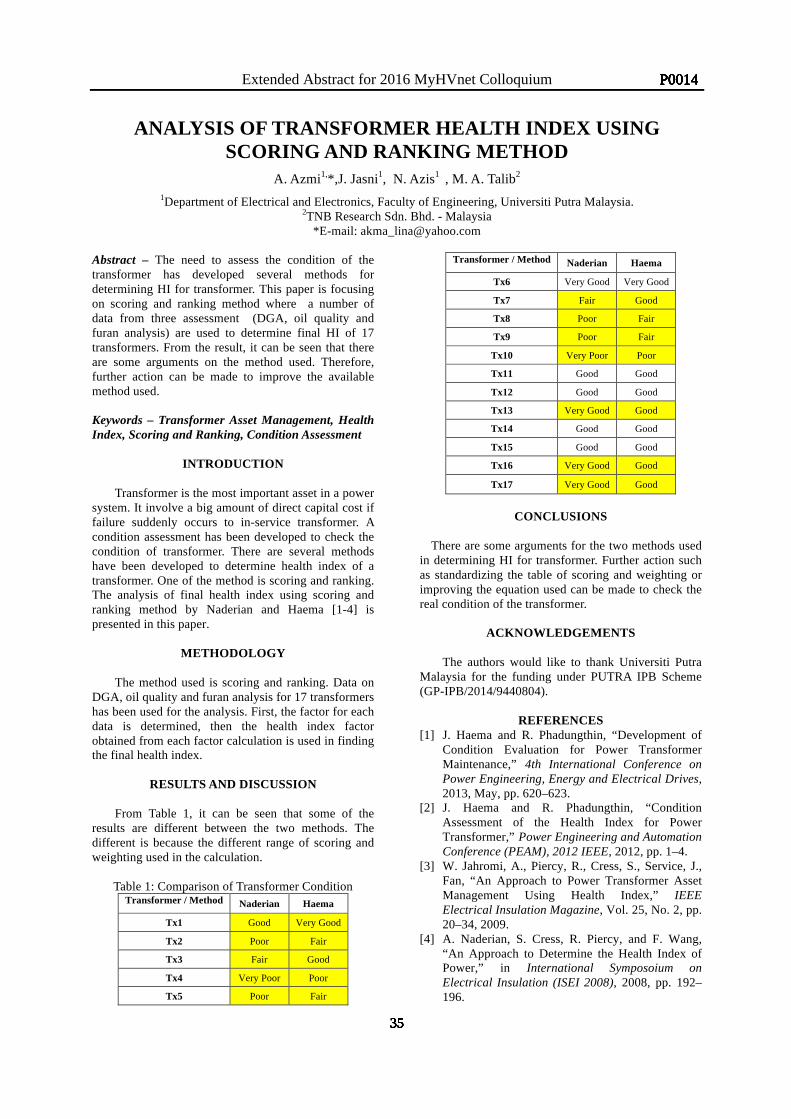
Extended Abstract for 2016 MyHVnet Colloquium
ANALYSIS OF TRANSFORMER HEALTH INDEX USING SCORING AND RANKING METHOD
A. Azmi1,*,J. Jasni1, N. Azis1 , M. A. Talib2
1Department of Electrical and Electronics, Faculty of Engineering, Universiti Putra Malaysia. 2TNB Research Sdn. Bhd. - Malaysia
*E-mail: [email protected] Abstract – The need to assess the condition of the transformer has developed several methods for determining HI for transformer. This paper is focusing on scoring and ranking method where a number of data from three assessment (DGA, oil quality and furan analysis) are used to determine final HI of 17 transformers. From the result, it can be seen that there are some arguments on the method used. Therefore, further action can be made to improve the available method used.
Keywords – Transformer Asset Management, Health Index, Scoring and Ranking, Condition Assessment
INTRODUCTION
Transformer is the most important asset in a power system. It involve a big amount of direct capital cost if failure suddenly occurs to in-service transformer. A condition assessment has been developed to check the condition of transformer. There are several methods have been developed to determine health index of a transformer. One of the method is scoring and ranking. The analysis of final health index using scoring and ranking method by Naderian and Haema [1-4] is presented in this paper.
METHODOLOGY The method used is scoring and ranking. Data on
DGA, oil quality and furan analysis for 17 transformers has been used for the analysis. First, the factor for each data is determined, then the health index factor obtained from each factor calculation is used in finding the final health index.
RESULTS AND DISCUSSION
From Table 1, it can be seen that some of the results are different between the two methods. The different is because the different range of scoring and weighting used in the calculation.
Table 1: Comparison of Transformer Condition
Transformer / Method Naderian Haema
Tx1 Good Very Good
Tx2 Poor Fair
Tx3 Fair Good
Tx4 Very Poor Poor
Tx5 Poor Fair
Transformer / Method Naderian Haema
Tx6 Very Good Very Good
Tx7 Fair Good
Tx8 Poor Fair
Tx9 Poor Fair
Tx10 Very Poor Poor
Tx11 Good Good
Tx12 Good Good
Tx13 Very Good Good
Tx14 Good Good
Tx15 Good Good
Tx16 Very Good Good
Tx17 Very Good Good
CONCLUSIONS
There are some arguments for the two methods used
in determining HI for transformer. Further action such as standardizing the table of scoring and weighting or improving the equation used can be made to check the real condition of the transformer.
ACKNOWLEDGEMENTS The authors would like to thank Universiti Putra
Malaysia for the funding under PUTRA IPB Scheme (GP-IPB/2014/9440804).
REFERENCES [1] J. Haema and R. Phadungthin, “Development of
Condition Evaluation for Power Transformer Maintenance,” 4th International Conference on Power Engineering, Energy and Electrical Drives, 2013, May, pp. 620–623.
[2] J. Haema and R. Phadungthin, “Condition Assessment of the Health Index for Power Transformer,” Power Engineering and Automation Conference (PEAM), 2012 IEEE, 2012, pp. 1–4.
[3] W. Jahromi, A., Piercy, R., Cress, S., Service, J., Fan, “An Approach to Power Transformer Asset Management Using Health Index,” IEEE Electrical Insulation Magazine, Vol. 25, No. 2, pp. 20–34, 2009.
[4] A. Naderian, S. Cress, R. Piercy, and F. Wang, “An Approach to Determine the Health Index of Power,” in International Symposoium on Electrical Insulation (ISEI 2008), 2008, pp. 192–196.
35
P0014
35
P0014
35
P0014
35
P0014
35
P0014
35
P0014
35
P0014
35
P0014
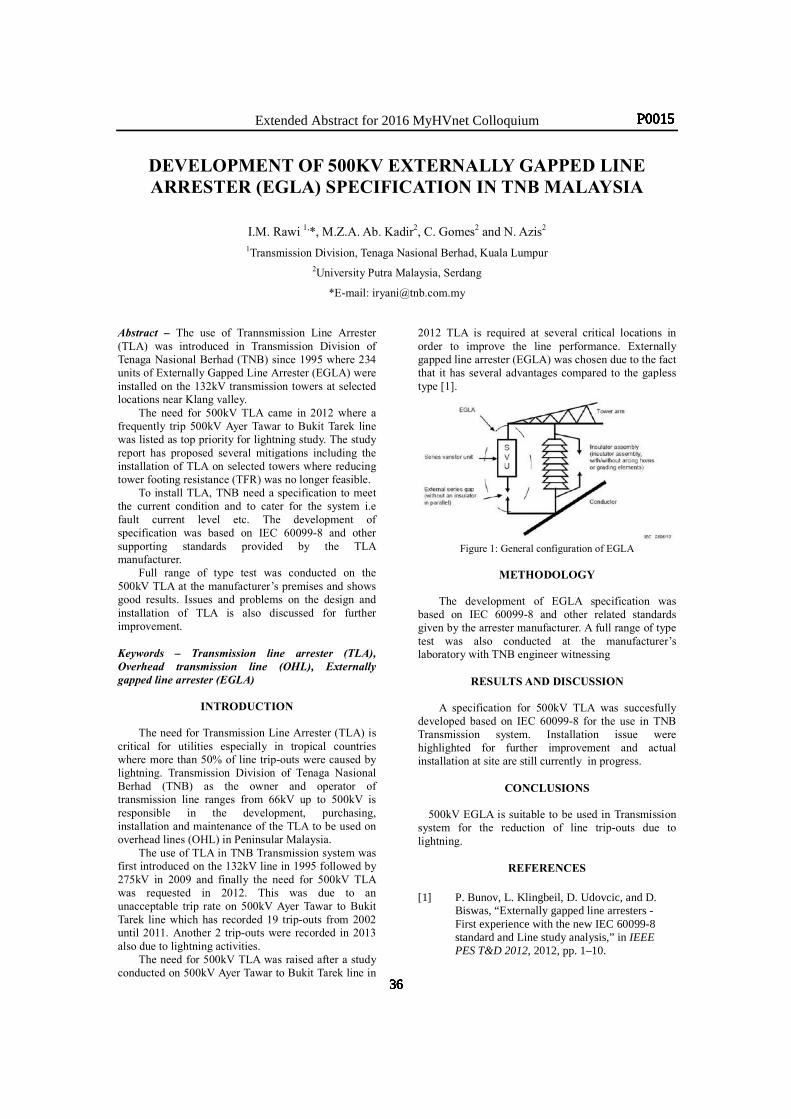
Extended Abstract for 2016 MyHVnet Colloquium
DEVELOPMENT OF 500KV EXTERNALLY GAPPED LINE ARRESTER (EGLA) SPECIFICATION IN TNB MALAYSIA
I.M. Rawi 1,*, M.Z.A. Ab. Kadir2, C. Gomes2 and N. Azis2 1Transmission Division, Tenaga Nasional Berhad, Kuala Lumpur
2University Putra Malaysia, Serdang
*E-mail: [email protected] Abstract – The use of Trannsmission Line Arrester (TLA) was introduced in Transmission Division of Tenaga Nasional Berhad (TNB) since 1995 where 234 units of Externally Gapped Line Arrester (EGLA) were installed on the 132kV transmission towers at selected locations near Klang valley.
The need for 500kV TLA came in 2012 where a frequently trip 500kV Ayer Tawar to Bukit Tarek line was listed as top priority for lightning study. The study report has proposed several mitigations including the installation of TLA on selected towers where reducing tower footing resistance (TFR) was no longer feasible.
To install TLA, TNB need a specification to meet the current condition and to cater for the system i.e fault current level etc. The development of specification was based on IEC 60099-8 and other supporting standards provided by the TLA manufacturer.
Full range of type test was conducted on the 500kV TLA at the manufacturer’s premises and shows good results. Issues and problems on the design and installation of TLA is also discussed for further improvement.
Keywords – Transmission line arrester (TLA), Overhead transmission line (OHL), Externally gapped line arrester (EGLA)
INTRODUCTION
The need for Transmission Line Arrester (TLA) is critical for utilities especially in tropical countries where more than 50% of line trip-outs were caused by lightning. Transmission Division of Tenaga Nasional Berhad (TNB) as the owner and operator of transmission line ranges from 66kV up to 500kV is responsible in the development, purchasing, installation and maintenance of the TLA to be used on overhead lines (OHL) in Peninsular Malaysia.
The use of TLA in TNB Transmission system was first introduced on the 132kV line in 1995 followed by 275kV in 2009 and finally the need for 500kV TLA was requested in 2012. This was due to an unacceptable trip rate on 500kV Ayer Tawar to Bukit Tarek line which has recorded 19 trip-outs from 2002 until 2011. Another 2 trip-outs were recorded in 2013 also due to lightning activities.
The need for 500kV TLA was raised after a study conducted on 500kV Ayer Tawar to Bukit Tarek line in
2012 TLA is required at several critical locations in order to improve the line performance. Externally gapped line arrester (EGLA) was chosen due to the fact that it has several advantages compared to the gapless type [1].
Figure 1: General configuration of EGLA
METHODOLOGY
The development of EGLA specification was
based on IEC 60099-8 and other related standards given by the arrester manufacturer. A full range of type test was also conducted at the manufacturer’s laboratory with TNB engineer witnessing
RESULTS AND DISCUSSION
A specification for 500kV TLA was succesfully developed based on IEC 60099-8 for the use in TNB Transmission system. Installation issue were highlighted for further improvement and actual installation at site are still currently in progress.
CONCLUSIONS
500kV EGLA is suitable to be used in Transmission
system for the reduction of line trip-outs due to lightning.
REFERENCES
[1] P. Bunov, L. Klingbeil, D. Udovcic, and D. Biswas, “Externally gapped line arresters - First experience with the new IEC 60099-8 standard and Line study analysis,” in IEEE PES T&D 2012, 2012, pp. 1–10.
36
P0015
36
P0015
36
P0015
36
P0015
36
P0015
36
P0015
36
P0015
36
P0015
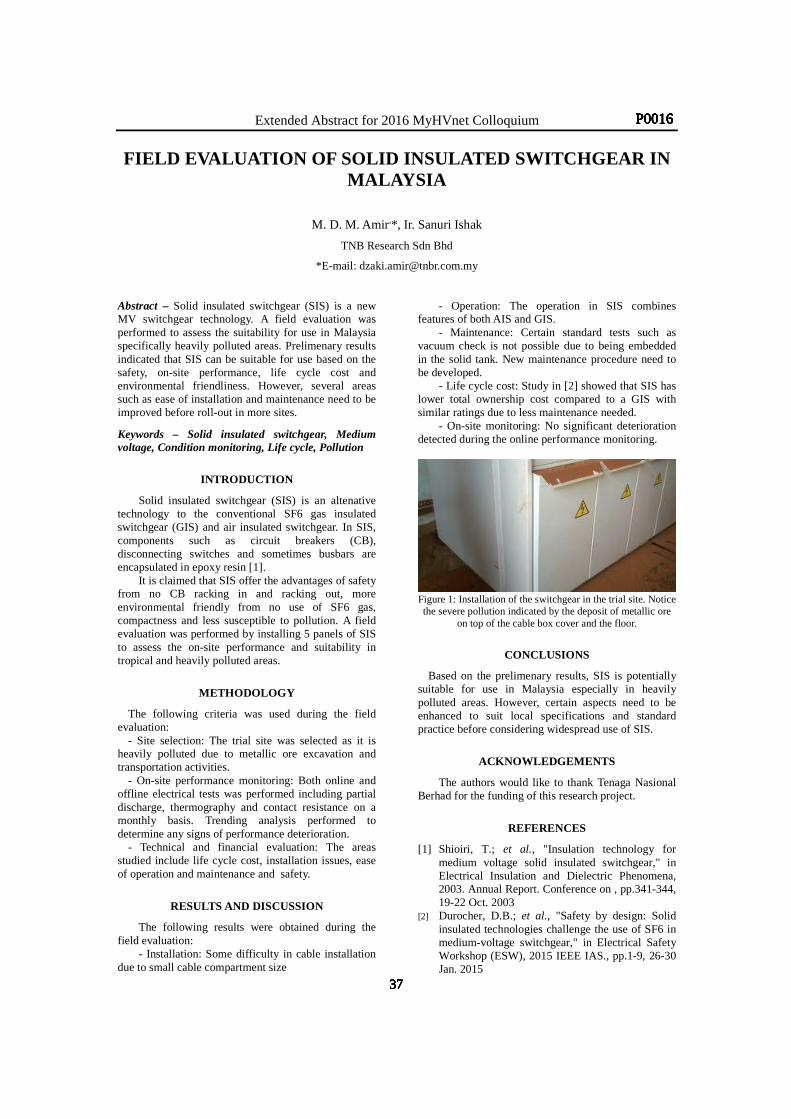
Extended Abstract for 2016 MyHVnet Colloquium
FIELD EVALUATION OF SOLID INSULATED SWITCHGEAR IN MALAYSIA
M. D. M. Amir,*, Ir. Sanuri Ishak
TNB Research Sdn Bhd
*E-mail: [email protected]
Abstract – Solid insulated switchgear (SIS) is a new MV switchgear technology. A field evaluation was performed to assess the suitability for use in Malaysia specifically heavily polluted areas. Prelimenary results indicated that SIS can be suitable for use based on the safety, on-site performance, life cycle cost and environmental friendliness. However, several areas such as ease of installation and maintenance need to be improved before roll-out in more sites.
Keywords – Solid insulated switchgear, Medium voltage, Condition monitoring, Life cycle, Pollution
INTRODUCTION
Solid insulated switchgear (SIS) is an altenative technology to the conventional SF6 gas insulated switchgear (GIS) and air insulated switchgear. In SIS, components such as circuit breakers (CB), disconnecting switches and sometimes busbars are encapsulated in epoxy resin [1].
It is claimed that SIS offer the advantages of safety from no CB racking in and racking out, more environmental friendly from no use of SF6 gas, compactness and less susceptible to pollution. A field evaluation was performed by installing 5 panels of SIS to assess the on-site performance and suitability in tropical and heavily polluted areas.
METHODOLOGY
The following criteria was used during the field evaluation:
- Site selection: The trial site was selected as it is heavily polluted due to metallic ore excavation and transportation activities.
- On-site performance monitoring: Both online and offline electrical tests was performed including partial discharge, thermography and contact resistance on a monthly basis. Trending analysis performed to determine any signs of performance deterioration.
- Technical and financial evaluation: The areas studied include life cycle cost, installation issues, ease of operation and maintenance and safety.
RESULTS AND DISCUSSION
The following results were obtained during the field evaluation:
- Installation: Some difficulty in cable installation due to small cable compartment size
- Operation: The operation in SIS combines features of both AIS and GIS.
- Maintenance: Certain standard tests such as vacuum check is not possible due to being embedded in the solid tank. New maintenance procedure need to be developed.
- Life cycle cost: Study in [2] showed that SIS has lower total ownership cost compared to a GIS with similar ratings due to less maintenance needed.
- On-site monitoring: No significant deterioration detected during the online performance monitoring.
Figure 1: Installation of the switchgear in the trial site. Notice the severe pollution indicated by the deposit of metallic ore
on top of the cable box cover and the floor.
CONCLUSIONS
Based on the prelimenary results, SIS is potentially suitable for use in Malaysia especially in heavily polluted areas. However, certain aspects need to be enhanced to suit local specifications and standard practice before considering widespread use of SIS.
ACKNOWLEDGEMENTS
The authors would like to thank Tenaga Nasional Berhad for the funding of this research project.
REFERENCES
[1] Shioiri, T.; et al., "Insulation technology for medium voltage solid insulated switchgear," in Electrical Insulation and Dielectric Phenomena, 2003. Annual Report. Conference on , pp.341-344, 19-22 Oct. 2003
[2] Durocher, D.B.; et al., "Safety by design: Solid insulated technologies challenge the use of SF6 in medium-voltage switchgear," in Electrical Safety Workshop (ESW), 2015 IEEE IAS., pp.1-9, 26-30 Jan. 2015
37
P0016
37
P0016
37
P0016
37
P0016
37
P0016
37
P0016
37
P0016
37
P0016
Extended Abstract for 2016 MyHVnet Colloquium
Investigations on the Characteristics of Malaysian Soils under High Impulse Conditions
M. S. Reffin1,*, N. Mohamad Nor2, N.A. Abdul Rahman3, N. Abdullah4, M.P. Yahaya5 and N. Mohd Hatta6 1,3,4,5,6 TNB Research Sdn. Bhd, Kajang, 43000 Selangor, Malaysia
2 Multimedia University, Cyberjaya, Malaysia *E-mail: [email protected]
Abstract - Soil resistivity is one of the main
characteristics that determines the value of ground resistance under the steady state and transient conditions. Soil resistivity is influenced by the types of soil, water and salts in it and the gap between solid grain size in the soil. It has been well accepted that under high impulse conditions, soil would behave non-linearly due to soil ionisation process. The objectives of this paper are to investigate the types of soil that are typically used in Malaysia such as sand and clay under high impulse conditions and to investigate which soil will experience ionisation , hence reducing the earth resistance much further than that at steady-state, and at higher current magnitudes.
Keywords – Soil Ionization, Impulse Conditions, Non-linear, Soil Resistivity, Earthing Systems
INTRODUCTION Studies [1-5] showed that grounding sytems
become non-linear under transient fault condition. Nor et al [1] found that the resistance decreased with increasing current magnitudes with two peaks current were observed. This includes soil ionization phenomena which corresponds to 5.5 kV/cm Ec value for different percentages of water content in sand. Highest rate of resistance change were observed for sand with 1% water content (high resistivity soil). Soil ionization phenomenon is obvious for soil with higher RDC value compared to those with lower RDC. Petropoulous [2] carried out soil ionization experiment using different electrodes and found the impulse resistance decreased with charging voltages. Cooray et al [3] discussed soil ionization initiation process that consists of electrical discharges that occur in the air gaps between soil.
Sekioka et al [4] carried out an experimental study to investigate the behaviour of rod electrode with different soil conditions under impulse condition. Three sites were selected and they found that highest resistance reduction was observed for site with highest RDC. Similarly, Miyazaki et al. [5] investigated soil ionization by field measurements and showed that the occurence rate of soil ionization phenomenon is higher for earthing systems with high RDC. In this project, an optimum design of grounding system can be achieved if the soil properties that will experience ionization can be identified. With ionisation process occuring in soil, resistance will be expected to reduce, hence more effective earthing systems can be obtained. In this study, breakdown voltage for each type of soils will be determined, which provides an indication which soil
types has the most ionisation process.
METHODOLOGY Two types of soils (clay and sand), which are
among the soils where the power transmissions towers in Malaysia are typically constructed at will be studied under power frequency and impulse conditions by means of field measurements. Earth tester will be used to measure the earth resistance at steady-state, and a portable impulse voltage generator, with 50kV 1.2/50µs for the earthing systems under impulse conditions.
RESULTS AND DISCUSSION The observed V-I waveforms and traces during
soil ionization process obtained during field tests for different soil types including the discharge activities, soil breakdown voltage and impulse impedance reduction will be discussed.
CONCLUSIONS It is expected that a higher reduction of impulse
impedance with impulse current magnitude and that more pre-ionisation processes would occur in sand-type of soil due to the presence of voids inside the soil.
ACKNOWLEDGEMENTS
The authors would like to express the highest gratitude to TNB Research Sdn. Bhd. for funding this research project.
REFERENCES
[1] N. M. Nor, A. Haddad, H. Griffiths, “Characterization of Ionization Phenomena in Soils Under Fast Impulses”, IEEE Trans. Power Del., vol. 21, no. 1, pp. 353–361, Jan. 2006.
[2] G. M. Petropoulos, “The High-Voltage Characteristics of Earth Resistances”, Journal of the IEE, Part 11, Vol. 95, pp. 172-174, February 1948.
[3] V. Cooray, M. Zitnik, M. Manyahi, R. Montano, M. Rahman, Y. Liu, Journal of Electrostatics 60, pp. 193-202, 2004.
[4] S. Sekioka, T. Sonoda, A. Ametani, “Experimental Study of Current-Dependent Grounding Resistance of Rod Electrode”, IEEE Trans. Power Del., vol. 20, no. 2, pp. 1569–1576, Apr. 2005.
[5] T. Miyazaki, S. Okabe, S. Sekioka, “An Experimental Validation of Lightning Performance in Distribution Lines”, IEEE Trans. Power Del., vol. 23, no. 4, pp. 2182–2190, Oct. 2008.
38
P0017
38
P0017
38
P0017
38
P0017
38
P0017
38
P0017
38
P0017
38
P0017
Extended Abstract for 2016 MyHVnet Colloquium
ANALYSIS ON FAULT CURRENT DISTRIBUTION FACTOR FOR 33kV OVERHEAD LINE AND UNDERGROUND CABLE
SYSTEMS
N.A. Abd Rahman1*, N. Abdullah1 , M. P. Yahaya1 , N. Mohd Hatta1 , M. S. Reffin1 and A.M. Ahmad Marican2
1TNB Research Sdn. Bhd., Malaysia 2DCS Engineering Sdn. Bhd., Malaysia. *E-mail: [email protected]
Abstract – A common practice in designing substation earthing system is to use the total fault current in the analysis. This will leads to possible uneconomical overdesigned earthing systems. Under most of the conditions, the total fault current in sibstation doestn’t discharged entirely in the substation earthing system. Therefore, an investigation was conducted to determine the actual grid current, Ig, which will flows into the earth and later will affect the design of substation earthing system. This paper will focus on fault current distribution factor, Sf, for 33kV system. The overhead line and underground cable systems will be compared.
Keywords – Fault current, grid current, fault current distribution factor, overhead line system, underground cable system
INTRODUCTION The earth potential rise (EPR) is the product of
the substation’s earth impedance and the current flowing through the earth impedance. Therefore, the fault current forms a very important component in the design and analysis of an earthing system. The fault current forms one of the major tasks in achieving an earthing design which complies to the safety requirements.
During a single-phase-to-earth fault in a substation, fault current returns to the source through the earth and any available parallel paths. For an overhead line system, part of the fault current will flow through the earth wire, while for an underground cable system the cable sheaths will conduct a proportion of the fault current back to the source. Since the EPR is only due to the current flowing through the earth, Ig, the distribution of the fault current between the earth and the parallel paths will need to be calculated to correctly determine the magnitude of current which will give rise to the prospective EPR.
METHODOLOGY Two types of 33kV systems were analysed and
compared in these simulation works. The simulation works are using CDEGS software. The comparison is made between 33kV overhead line system and underground cable system.
The 33kV overhead line system of using 150mm2
Silmalec type fo phase conductor and 7/14 SWG steel for earth wires were used in the simulation. While, for underground cable system, the phase conductor of 630mm2 aluminium core and copper screen wire (59 numbers, each 2.51mm diameter) were used.
The various factors that are affecting the fault current distribution factor, Sf, were investigated. The affecting factors are line length, soil resistivity along the line, faulted substation earth impedance, source substation earth impedance and tower footing resistance (TFR).
RESULTS AND DISCUSSION Sf increases when overhead line length and TFR
values are increased. On the other hand, Sf decreases when soil resistivity along the line, faults & source substations are increased.
The effect of these affecting factors give similar behaviour as for underground cable system. However, the value of Sf is increadibly different where Sf for underground cable is much lower than overhead line systems.
CONCLUSIONS
The fault current distribution factor, Sf, for 33kV overhead line system is much higher than the 33kV underground cable system. The main contribution to the magnitude of Sf is their availability of the fault current return path where the overhead line system has smaller earth wires size while underground cable system has bigger cable sheaths size.
ACKNOWLEDGEMENTS
The authors would like to express the highest gratitude to TNB Research Sdn. Bhd. for funding this research project.
REFERENCES
[1] C. Li, X. Wei, Y. Li & F.P. Dawalibi, “A Parametric Analysis of Fault Current Division Between Overhead Wires and Substation Grounding Systems,” .
[2] Evaluating Ground Fault Current Distribution in Station, Towers and Ground Wire”, IEEE Transactions on Power Delivery, Vol. 13, No. 1, January 1998.
39
P0018
39
P0018
39
P0018
39
P0018
39
P0018
39
P0018
39
P0018
39
P0018
Extended Abstract for 2016 MyHVnet Colloquium
Considering The Effect Of Humidity On The Electric Fields Values On Polymer Insulator
M. S. Abd Rahman*, M. Z. A. AB Kadir and M. Izadi Centre for Electromagnetic and Lightning Protection Research (CELP),
Faculty of Engineering, Universiti Putra Malaysia, 43400, UPM, Serdang, Selangor, Malaysia
*E-mail: [email protected] Abstract – This paper has reviewed the importance of insulator in power system to ensure the reliability of the system. Also the paper has focused on the variation of local contaminants that potentially harmful to the insulator performance. Simulation result on different humidity has shown clear effect of conductive contaminants to insulator. Keywords – Insulator, Contaminants, Electric Fields,
INTRODUCTION
Reliability of electrical is nesessarily important. Therefore it is mandatory to find the weak points of the system thus optimize it. This include ensuring the insulation of the system to work properly during all possible condition [1].
Considering on outdoor insulator, the sheds give place for the air-borne contaminant to deposited on the surface hence shorten the leakage distance and reduced the breakdown voltage of insulator.
METHODOLOGY According to IEC standard [2], active pollution or
known as permanently conductive pollution while inert pollution may become conductive when absorb water. The example can be found in Table 1.
Table 1: Example of surface contaminant [2]
Surface Contaminant
Example
Active Pollution
NaCl, NaSO4, MgCl, fly ash, SO2, SO3, NOx, metallic deposits, bird dropping, acid rain, wet cement, algricultural, fog
Inert Pollution Clay, Kaolin
It should be mentioned, overhead line has been installed in many places across mountainous terrain (Banjaran Titiwangsa, etc) and rugged area throughout the country. Commonly, these places are mostly surrounded by fog (humidity 90%RH) that considered as conductive which can develop wetting on insulator surface [3]. The effect of humidity on polymer insulator shown in Figure 1 presented in the results.
Figure 1: 10kV polymer insulator
RESULTS AND DISCUSSION
Figure 2: Electric field on insulator surface under different
humidity level
Based on Figure 2, simulation of 33kV polymer insulator depicted the increase of electric field on insulator surface up to 661.59% under humidity foggy condition (humidity 90%) compare to normal humidity.
CONCLUSIONS
Some potentially harmful contaminants were
reviewed. It is important to consider on several conductive contaminants during insulator test since different contaminants may affect the insulator performance in different ways.
REFERENCES
[1] P. Chowdhuri, "Lightning-induced voltages on multiconductor overhead lines," Power Delivery, IEEE Transactions on, vol. 5, pp. 658-667, 1990.
[2] I. E. Commission, "IEC 60815-1: Selection and dimensioning of high voltage for polluted conditions, part 1: definitions, information and general principles," ed: Geneva, Switzerland: International Organization for Standardization, 2002.
[3] K. M. Elovitz, "Understanding what humidity does and why," ASHRAE journal, vol. 41, p. 84, 1999.
40
P0019
40
P0019
40
P0019
40
P0019
40
P0019
40
P0019
40
P0019
40
P0019
2016 MyHVnet Colloquium
Development of an Improved Thermal Model for Transformers M.H Roslan1,2* , N. Azis2, M.Z.A. Ab Kadir2, J. Jasni2, M.T Ishak1
1Faculty of Engineering, Universiti Pertahanan Nasional Malaysia, 57000 Kem Sg Besi, Malaysia. 2Centre for Electromagnetic and Lightning Protection, Universiti Putra Malaysia, 43300 Serdang, Malaysia.
*E-mail: [email protected]
Abstract – Hot-spot temperature is the most important parameter in transformers and crucial for asset management purpose. It can be determined based on either empirical or network thermal modelling. This paper presents a review on transformer hot-spot temperature equations based on IEC and IEEE loading guide. A study is also proposed to improve the existing thermal model which could approximetly give the quick information on the hot-spot temperature for transformers in-service.
Keywords –Hot-spot temperature, Thermal ageing,
Loss of life and Transformers.
INTRODUCTION
One of the most important parameters in transformers is the hot-spot temperature and consists of ambient temperature rise, the top-oil temperature rise and the hot-spot temperature rise over the top-oil temperature[1, 2]. Based on the hot-spot temperature, the loss of life of transformers can be estimated which in turn could be used to determine the state of ageing.
According to IEC 60076-7, there are 2 methods that can be used to detemine the hot-spot temperature which are exponential and differential approaches[3]. The exponential method is suitable for a load variation according to a step function. It is also suited for determination of the heat transfer parameters by test and for simplified scenarios.In this method, the hot-spot temperature can be calculated as the sum of the ambient temperature, the top oil temperature rise in the tank, and the temperature difference between the hot-spot and top oil in the tank[3]. For the differential equation method, the hot-spot temperature is determine based on heat transfer differential equations principle and it is applicable for arbitrarily time-varying load factor and time-varying ambient temperature [3]. The hot-spot temperature can be calculated as sum of the top oil temperature in the tank and hot-spot to top oil gradient at the load considered.
According to IEEE C57.91-1995, there are 2 methods available that can be used to determine hot-spot temperature known as clause 7 and annex G methods. According to Clause 7 method, an assumption is made where the temperature of the top oil is the same as the temperature of the oil exiting the winding ducts [1]. The hot-spot temperature can be calculated as the sum of the ambient temperature, the top oil temperature rise over the ambient and the winding hot-spot temperature rise over the top oil [4]. For annex G method, the equation derived based on fluid flow conditions occuring in the transformer
during transient conditions [4]. The hot-spot temperature can be calculated as the sum of the ambient temperature, bottom oil temperature rise over the ambient, oil temperature rise over the bottom oil at the hot-spot location and the winding hot-spot temperature rise over the oil at the hot-spot location [4]. The next part of the study would be on the development of an improved thermal model of transformers.
METHODOLOGY
In this study, an improved thermal model will be proposed that could be used to determine the hot-spot temperature with minimum number of inputs. The aim is mainly to cater most of old assests that do not have or lost their initial testing and design information. The proposed model will take into consideration the existing models in the standards as well as research models from previous studies.
CONCLUSIONS It is anticipated that the proposed model could assists asset managers and engineers on determination of the hot-spot temperatures of transformers in-service based on the existing information.
ACKNOWLEDGEMENTS
The authors would like to thank Ministry of Education, Universiti Pertahanan Nasional Malaysia and Universiti Putra Malaysia for the funding under FRGS scheme and PUTRA grant schemes. Special thanks to Malaysia Transformer Manufacturing Sdn. Bhd. for the technical support.
REFERENCES
[1] Mohd TaufiqIshak and Zhongdong Wang, “Transformer Hot-spot Temperature Calculationusing IEEE Loading Guide”,2008 International Conference on Condition Monitoring and Diagnosis, Beijing, China, April 21-24, 2008
[2] Dejan Susa, MattiLehtonen, and HasseNordman,“Dynamic Thermal Modelling of Power Transformers”,IEEE Transactions on Power Delivery, Vol. 20, No. 1, January 2005
[3] IEC 60076-7, “Loading Guide for Oil-Immersed Power Transformers”
[4] IEEE C57.91-1995, “IEEE Guide for Loading Mineral-Oil-Immersed Transformers”
41
P0020
41
P0020
41
P0020
41
P0020
41
P0020
41
P0020
41
P0020Extended Abstract for 2016 MyHVnet Colloquium
41
P0020
Extended Abstract for 2016 MyHVnet Colloquium
AN OVERVIEW OF TRANSFORMER THERMAL MODELLING FOR HOT-SPOT CALCULATION.
Z. Ibrahim1,2*, M.Z.A. Ab Kadir1, M. Izadi1 1Centre for Electromagnetic and Lightning Protection Research (CELP), Universiti Putra Malaysia, 43300 Serdang,
Selangor, Malaysia. 2Faculty of Engineering Technology, Universiti Teknikal Malaysia Melaka, 76100 Durian Tunggal, Melaka Malaysia.
*E-mail: [email protected] Abstract – In large electrical power system network, transformers can be condered as the heart of the system. As such, it is crucial to ensure that they do not prematurely fail. Numerous research have been conducted to monitor the performance of the power transformer. One of them is using themal model as the input for the prediction of their lifespan. In this paper an overview of determining hot-spot temperature of transformers are briefly decribe. These methods are based on the thermal model in IEC 60076-7 and IEEE Std. C57.91-1995. To date, Computational Fluid Dynamic (CFD) is the most advanced technique in thermal modelling. In this thermal model study, it is expected that the a new model could aid the asset manager in managing especially aging transformers.
Keywords – transformer, thermal model, hot-spot temperature, CFD, lifespan.
INTRODUCTION
Thermal modelling in transformer plays a crucial role in determining hot-spot and top-oil temperatures. The hot-spot temperature is then use to estimate the lifetime of transformer. However details of transformer specific parameters are required in order to calculate the hot-spot and the top-oil temperature. This could be very difficult to power utilities’ asset engineer is the absence of the transformer parameters i.e. from normal heat run test report. This will in turn needs a simplified thermal model that could elliminate some parameters. Basically there are two main methods in thermal modelling for hot-spot calculation emperically. They are IEC 60076-7[1] and IEEE Std. C57.91-1995 [2]. Eventhough, these two methods are international standards for hot-spot temperature calculation, they may be oversimplified due to presumptions made for thermal constants and other specific parameters[1][3][4]. Therefore, they may not be equally valid for all transformers and for all loading conditions[2]. CFD is another method for thermal modelling and it is very comprehensive study. One disadvantage of CFD is time consuming. Closely tied to transformer specific parameters is the main problem of the thermal model methods as described. It is anticipated a new simple model based on thermal model could accurately calculate the hot-spot temperature.
METHODOLOGY
In this research, both empirical and CFD thermal models will be extensively studied. Later, a thermal study based on a distribution transformer will be conducted . Results obtained will be compared to conclude this research activity.
RESULTS AND DISCUSSION
It is hope that a new simple model based on the thermal model adopted by standards in [1] and [2] for thermal modelling is achieved. It is also anticipated the new model will not rely too much on the transformer specific parameters for the hot-spot calculation. The thermal model should be as simple as possible without loosing representativeness of major phenomena involved.
CONCLUSIONS
A new model is expected to increase the
accuracy of hot-spot factor under nonlinear load, ambient temperature and transformer location. This can be achieved by know-how in heat transfer theory and thermal-electric analogy and also by the aid of CFD. Thus, this new model could help asset manager to foresee further action in the near future.
ACKNOWLEDGEMENTS
The authors would like to express their sincere
gratitude to UTeM, CELP of UPM and PUTRA grant scheme for the technical and financial support of this research.
REFERENCES
[1] IEC 60076-7:, “Loading guide for Oil-Immersed Power
Transformer,” 2005. [2] IEEE Std C57.91-1995, “IEEE Guide for Loading
Mineral-Oil- Immersed Transformers,” 1995. [3] D. Feng, Z. Wang, and P. Jarman, “Evaluation of Power
Transformers ’ Effective Hot-Spot Factors by Thermal Modeling of Scrapped Units,” vol. 29, no. 5, pp. 2077–2085, 2014.
[4] D. Susa, M. Lehtonen, and H. Nordman, “Dynamic thermal modelling of power transformers,” IEEE Power Eng. Soc. Gen. Meet. 2005., vol. 20, no. 1, pp. 197–204,2005 .
42
P0021
42
P0021
42
P0021
42
P0021
42
P0021
42
P0021
42
P0021
42
P0021
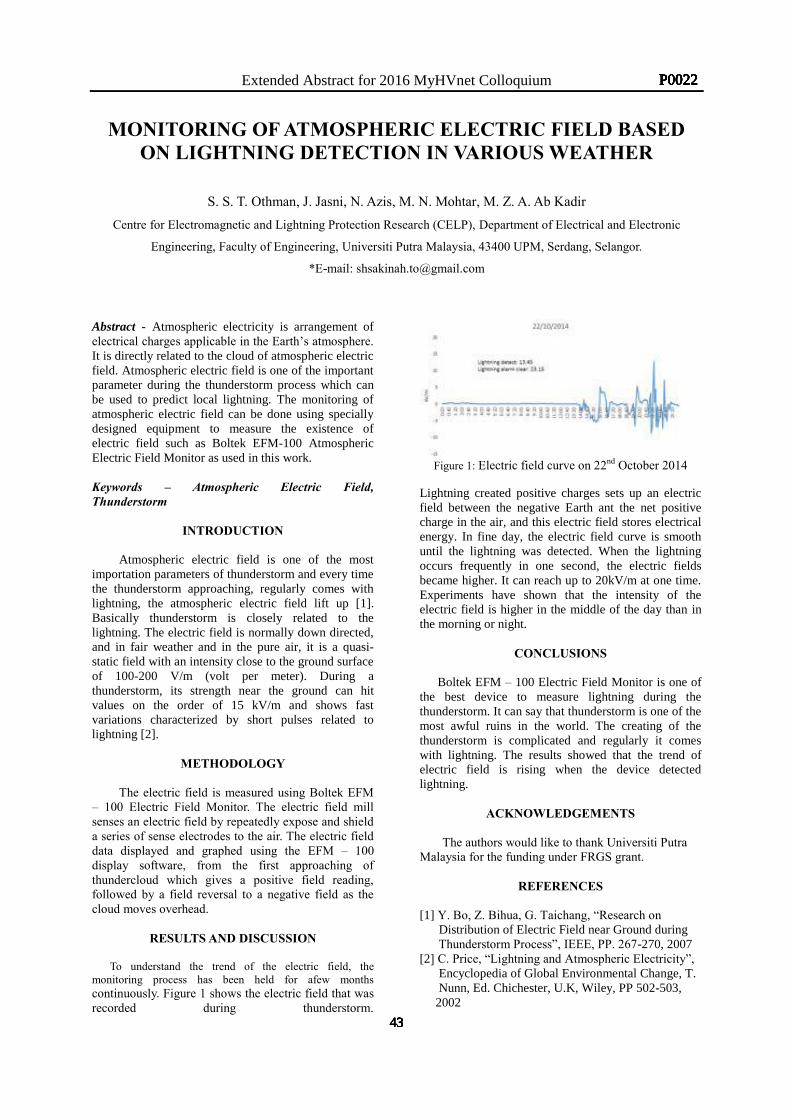
Extended Abstract for 2016 MyHVnet Colloquium
MONITORING OF ATMOSPHERIC ELECTRIC FIELD BASED ON LIGHTNING DETECTION IN VARIOUS WEATHER
S. S. T. Othman, J. Jasni, N. Azis, M. N. Mohtar, M. Z. A. Ab Kadir
Centre for Electromagnetic and Lightning Protection Research (CELP), Department of Electrical and Electronic
Engineering, Faculty of Engineering, Universiti Putra Malaysia, 43400 UPM, Serdang, Selangor.
*E-mail: [email protected] Abstract - Atmospheric electricity is arrangement of electrical charges applicable in the Earth’s atmosphere. It is directly related to the cloud of atmospheric electric field. Atmospheric electric field is one of the important parameter during the thunderstorm process which can be used to predict local lightning. The monitoring of atmospheric electric field can be done using specially designed equipment to measure the existence of electric field such as Boltek EFM-100 Atmospheric Electric Field Monitor as used in this work. Keywords – Atmospheric Electric Field, Thunderstorm
INTRODUCTION
Atmospheric electric field is one of the most importation parameters of thunderstorm and every time the thunderstorm approaching, regularly comes with lightning, the atmospheric electric field lift up [1]. Basically thunderstorm is closely related to the lightning. The electric field is normally down directed, and in fair weather and in the pure air, it is a quasi-static field with an intensity close to the ground surface of 100-200 V/m (volt per meter). During a thunderstorm, its strength near the ground can hit values on the order of 15 kV/m and shows fast variations characterized by short pulses related to lightning [2].
METHODOLOGY The electric field is measured using Boltek EFM
– 100 Electric Field Monitor. The electric field mill senses an electric field by repeatedly expose and shield a series of sense electrodes to the air. The electric field data displayed and graphed using the EFM – 100 display software, from the first approaching of thundercloud which gives a positive field reading, followed by a field reversal to a negative field as the cloud moves overhead.
RESULTS AND DISCUSSION
To understand the trend of the electric field, the monitoring process has been held for afew months continuously. Figure 1 shows the electric field that was recorded during thunderstorm.
Figure 1: Electric field curve on 22nd October 2014
Lightning created positive charges sets up an electric field between the negative Earth ant the net positive charge in the air, and this electric field stores electrical energy. In fine day, the electric field curve is smooth until the lightning was detected. When the lightning occurs frequently in one second, the electric fields became higher. It can reach up to 20kV/m at one time. Experiments have shown that the intensity of the electric field is higher in the middle of the day than in the morning or night.
CONCLUSIONS
Boltek EFM – 100 Electric Field Monitor is one of the best device to measure lightning during the thunderstorm. It can say that thunderstorm is one of the most awful ruins in the world. The creating of the thunderstorm is complicated and regularly it comes with lightning. The results showed that the trend of electric field is rising when the device detected lightning.
ACKNOWLEDGEMENTS
The authors would like to thank Universiti Putra
Malaysia for the funding under FRGS grant.
REFERENCES
[1] Y. Bo, Z. Bihua, G. Taichang, “Research on Distribution of Electric Field near Ground during Thunderstorm Process”, IEEE, PP. 267-270, 2007 [2] C. Price, “Lightning and Atmospheric Electricity”, Encyclopedia of Global Environmental Change, T. Nunn, Ed. Chichester, U.K, Wiley, PP 502-503, 2002
43
P0022
43
P0022
43
P0022
43
P0022
43
P0022
43
P0022
43
P0022
43
P0022
Extended Abstract for 2016 MyHVnet Colloquium
A STUDY ON THE PERFORMANCES OF TRANSFORMERS UNDER FERRORESONANCE EFFECT
A. Ahmad1,*, N.Azis1, J. Jasni1, M. Z. Ab Kadir1 and S. P. Ang2 1Centre for Electromagnetic & Lightning Protection, Universiti Putra Malaysia, 43300 Serdang, Selangor, Malaysia.
2Institut Teknologi Brunei, Jalan Tungku Link, Gadong BE1410, Brunei Darussalam
*E-mail: [email protected] Abstract – Ferroresonance is a disturbance that occurs in transformers and involves with high levels of overvoltage and overcurrents distortion. It is important to understand this event since it could lead to failures if no proper mitigation is done. There are several studies that have been carried out previously to study the effect of this event on transformers through different approaches. This paper reviews on some of the previous ferroresonance studies on transformers. A study is also proposed to examine the effect ferroresonance on the core performance of transformers. Keywords – Ferroresonance, transformers, core modelling
INTRODUCTION Ferroresonance is a complex nonlinear electrical
phenomenon that can cause dielectric and thermal problems for electrical equipment. This effect may take place when the core of an inductive device becomes saturated and its flux current characteristic becomes nonlinear [1].
Normally, ferroresonance is observed after some transient disturbance such as lightning strikes, switching operations, during system unbalance and faults. This incident of ferroresonance is very dangerous for the system which could cause failures in transformers, cable and arrester.
Several mitigation techniques have been proposed to overcome the ferroresonance issues in transformers. One of the study through time domain simulation found that by connecting the MOV arrester at the transformers poles, the ferroresonance overvoltage could be significantly suppressed [2]. It is also found that the introduction of nonlinear core losess could also cause ferroresonance and overvoltage which lead the system become chaotic [3]. This event could be reduced through introduction of circuit breaker shunt resistance [4]. A study on the insertion of air gap into magnetic core showed that the ferroresonance occurrence could be reduced [5]. In addition, by increasing the air gap length, the magnetizing could be linearized and reduce the possibility of ferroresonance [5].
METHODOLOGY One of the aims of the research project is to look into
the performance of the transformer under the effect of
ferroresonance. The magnetic core of the transformer will be modeled through finite element software. The magnetic field, energy and temperature of the core subjected to ferroresonance will be studied. The performances using 3 and 5 limbs transformer cores will also be examined.
CONCLUSIONS It is anticipated that the study will be able to provide
a much clear insight on the performance of transformers under the effect of ferroresonance based on the core studies. Through this study, a solution can be proposed to overcome this event either through configuration of the circuit arrangement or suggestion on an improved core design of transformers.
ACKNOWLEDGEMENTS The authors would like to thank Universiti Putra
Malaysia for the funding under PUTRA grant schemes.
REFERENCES
[1] S. P. Ang, “Ferroresonance Simulation of Transmission Systems”, PhD Dissertation, Faculty of Engineering and Physical Sciences, University of Manchester, 2010.
[2] H. Radmanesh, M. Nademi and M. Nademi, “Ferroresonance Phenomena in Unloaded Transformers Applying MOV”, International Journal of Computer and Electrical Engineering, Vol. 4, No. 5, 2012
[3] H. Radmanesh, M. Rostami and J. Khalilpour, “Ferroresonance in Voltage Transformer Considering Linear and Nonlinear Core Losses Effect” , International Journal of Computer and Electrical Engineering, Vol. 4, No. 5, October 2012
[4] H. Radmanesh, M. Nademi and M. Nademi, “Circuit Breaker Shunt Resistance Effect on Ferroresonance in Voltage Transformer Including Nonlinear Core Losses”, International Journal of Computer and Electrical Engineering, Vol. 4, No. 5, October 2012.
[5] D. Krajtner, I. Žiger, " Influence of HV inductive voltage transformers core design to the ferroresonance occurrence probability," International Conference on Power Systems Transients (IPST2015) in Cavtat, Croatia June 15-18, 2015.
44
P0023
44
P0023
44
P0023
44
P0023
44
P0023
44
P0023
44
P0023
44
P0023
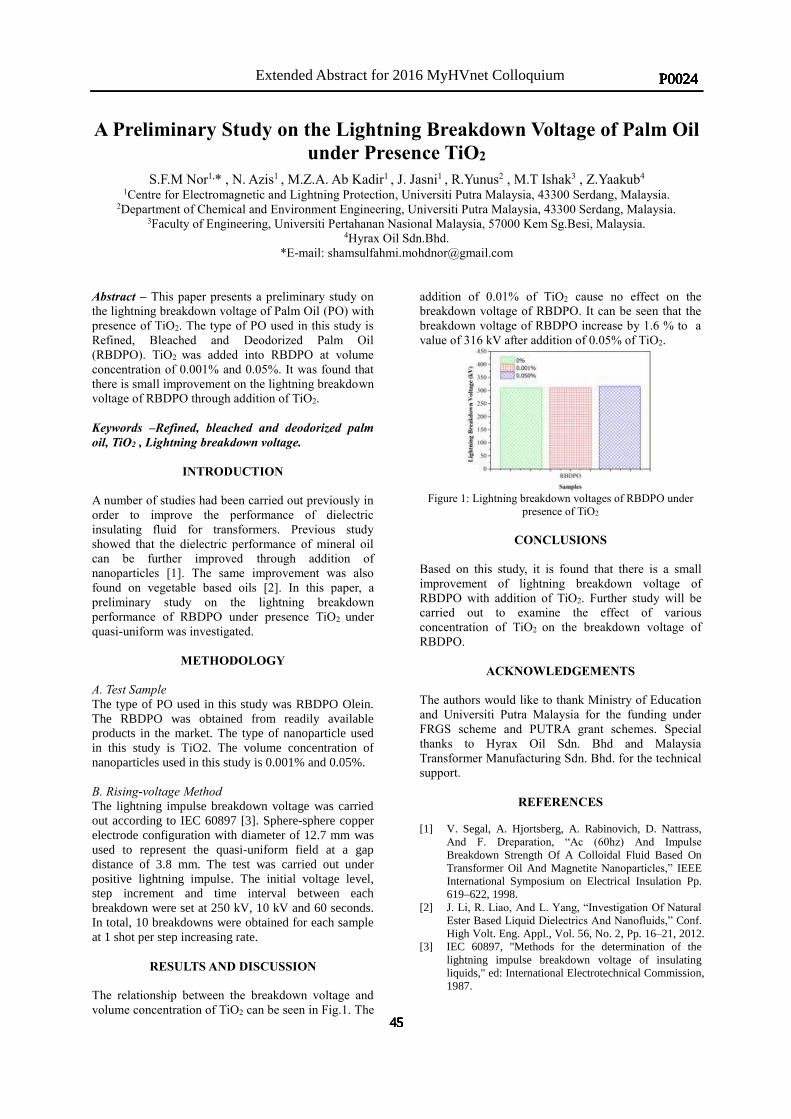
2016 MyHVnet Colloquium
A Preliminary Study on the Lightning Breakdown Voltage of Palm Oil under Presence TiO2
S.F.M Nor1,* , N. Azis1 , M.Z.A. Ab Kadir1 , J. Jasni1 , R.Yunus2 , M.T Ishak3 , Z.Yaakub4 1Centre for Electromagnetic and Lightning Protection, Universiti Putra Malaysia, 43300 Serdang, Malaysia.
2Department of Chemical and Environment Engineering, Universiti Putra Malaysia, 43300 Serdang, Malaysia. 3Faculty of Engineering, Universiti Pertahanan Nasional Malaysia, 57000 Kem Sg.Besi, Malaysia.
4Hyrax Oil Sdn.Bhd. *E-mail: [email protected]
Abstract – This paper presents a preliminary study on the lightning breakdown voltage of Palm Oil (PO) with presence of TiO2. The type of PO used in this study is Refined, Bleached and Deodorized Palm Oil (RBDPO). TiO2 was added into RBDPO at volume concentration of 0.001% and 0.05%. It was found that there is small improvement on the lightning breakdown voltage of RBDPO through addition of TiO2.
Keywords –Refined, bleached and deodorized palm oil, TiO2 , Lightning breakdown voltage.
INTRODUCTION
A number of studies had been carried out previously in order to improve the performance of dielectric insulating fluid for transformers. Previous study showed that the dielectric performance of mineral oil can be further improved through addition of nanoparticles [1]. The same improvement was also found on vegetable based oils [2]. In this paper, a preliminary study on the lightning breakdown performance of RBDPO under presence TiO2 under quasi-uniform was investigated.
METHODOLOGY
A. Test Sample The type of PO used in this study was RBDPO Olein. The RBDPO was obtained from readily available products in the market. The type of nanoparticle used in this study is TiO2. The volume concentration of nanoparticles used in this study is 0.001% and 0.05%. B. Rising-voltage Method The lightning impulse breakdown voltage was carried out according to IEC 60897 [3]. Sphere-sphere copper electrode configuration with diameter of 12.7 mm was used to represent the quasi-uniform field at a gap distance of 3.8 mm. The test was carried out under positive lightning impulse. The initial voltage level, step increment and time interval between each breakdown were set at 250 kV, 10 kV and 60 seconds. In total, 10 breakdowns were obtained for each sample at 1 shot per step increasing rate.
RESULTS AND DISCUSSION The relationship between the breakdown voltage and volume concentration of TiO2 can be seen in Fig.1. The
addition of 0.01% of TiO2 cause no effect on the breakdown voltage of RBDPO. It can be seen that the breakdown voltage of RBDPO increase by 1.6 % to a value of 316 kV after addition of 0.05% of TiO2.
Figure 1: Lightning breakdown voltages of RBDPO under
presence of TiO2
CONCLUSIONS Based on this study, it is found that there is a small improvement of lightning breakdown voltage of RBDPO with addition of TiO2. Further study will be carried out to examine the effect of various concentration of TiO2 on the breakdown voltage of RBDPO.
ACKNOWLEDGEMENTS
The authors would like to thank Ministry of Education and Universiti Putra Malaysia for the funding under FRGS scheme and PUTRA grant schemes. Special thanks to Hyrax Oil Sdn. Bhd and Malaysia Transformer Manufacturing Sdn. Bhd. for the technical support.
REFERENCES [1] V. Segal, A. Hjortsberg, A. Rabinovich, D. Nattrass,
And F. Dreparation, “Ac (60hz) And Impulse Breakdown Strength Of A Colloidal Fluid Based On Transformer Oil And Magnetite Nanoparticles,” IEEE International Symposium on Electrical Insulation Pp. 619–622, 1998.
[2] J. Li, R. Liao, And L. Yang, “Investigation Of Natural Ester Based Liquid Dielectrics And Nanofluids,” Conf. High Volt. Eng. Appl., Vol. 56, No. 2, Pp. 16–21, 2012.
[3] IEC 60897, "Methods for the determination of the lightning impulse breakdown voltage of insulating liquids," ed: International Electrotechnical Commission, 1987.
45
P0024
45
P0024Extended Abstract for 2016 MyHVnet Colloquium
45
P0024
45
P0024
45
P0024
45
P0024
45
P0024
45
P0024
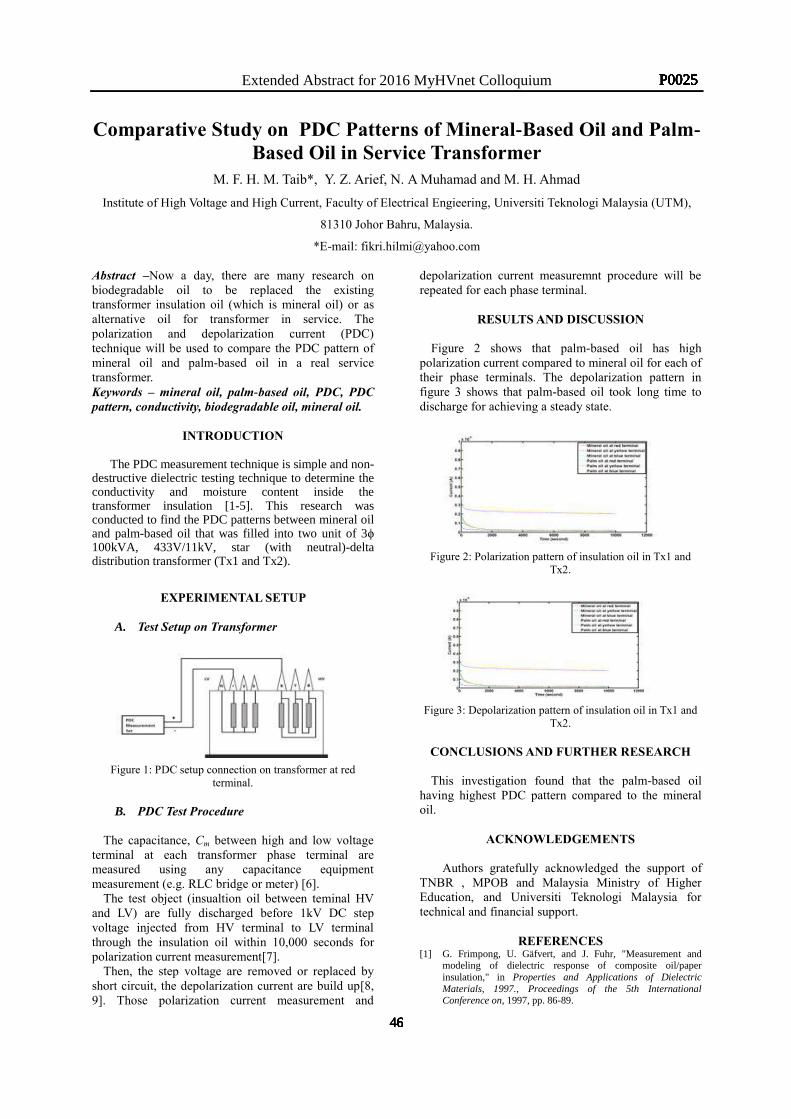
Extended Abstract for 2016 MyHVnet Colloquium
Comparative Study on PDC Patterns of Mineral-Based Oil and Palm-Based Oil in Service Transformer
M. F. H. M. Taib*, Y. Z. Arief, N. A Muhamad and M. H. Ahmad
Institute of High Voltage and High Current, Faculty of Electrical Engieering, Universiti Teknologi Malaysia (UTM),
81310 Johor Bahru, Malaysia.
*E-mail: [email protected] Abstract –Now a day, there are many research on biodegradable oil to be replaced the existing transformer insulation oil (which is mineral oil) or as alternative oil for transformer in service. The polarization and depolarization current (PDC) technique will be used to compare the PDC pattern of mineral oil and palm-based oil in a real service transformer. Keywords – mineral oil, palm-based oil, PDC, PDC pattern, conductivity, biodegradable oil, mineral oil.
INTRODUCTION
The PDC measurement technique is simple and non-destructive dielectric testing technique to determine the conductivity and moisture content inside the transformer insulation [1-5]. This research was conducted to find the PDC patterns between mineral oil and palm-based oil that was filled into two unit of 3ϕ 100kVA, 433V/11kV, star (with neutral)-delta distribution transformer (Tx1 and Tx2).
EXPERIMENTAL SETUP
A. Test Setup on Transformer
Figure 1: PDC setup connection on transformer at red
terminal.
B. PDC Test Procedure
The capacitance, Cm between high and low voltage terminal at each transformer phase terminal are measured using any capacitance equipment measurement (e.g. RLC bridge or meter) [6].
The test object (insualtion oil between teminal HV and LV) are fully discharged before 1kV DC step voltage injected from HV terminal to LV terminal through the insulation oil within 10,000 seconds for polarization current measurement[7].
Then, the step voltage are removed or replaced by short circuit, the depolarization current are build up[8, 9]. Those polarization current measurement and
depolarization current measuremnt procedure will be repeated for each phase terminal.
RESULTS AND DISCUSSION
Figure 2 shows that palm-based oil has high polarization current compared to mineral oil for each of their phase terminals. The depolarization pattern in figure 3 shows that palm-based oil took long time to discharge for achieving a steady state.
Figure 2: Polarization pattern of insulation oil in Tx1 and
Tx2.
Figure 3: Depolarization pattern of insulation oil in Tx1 and
Tx2.
CONCLUSIONS AND FURTHER RESEARCH
This investigation found that the palm-based oil having highest PDC pattern compared to the mineral oil.
ACKNOWLEDGEMENTS
Authors gratefully acknowledged the support of
TNBR , MPOB and Malaysia Ministry of Higher Education, and Universiti Teknologi Malaysia for technical and financial support.
REFERENCES
[1] G. Frimpong, U. Gäfvert, and J. Fuhr, "Measurement and modeling of dielectric response of composite oil/paper insulation," in Properties and Applications of Dielectric Materials, 1997., Proceedings of the 5th International Conference on, 1997, pp. 86-89.
46
P0025
46
P0025
46
P0025
46
P0025
46
P0025
46
P0025
46
P0025
46
P0025
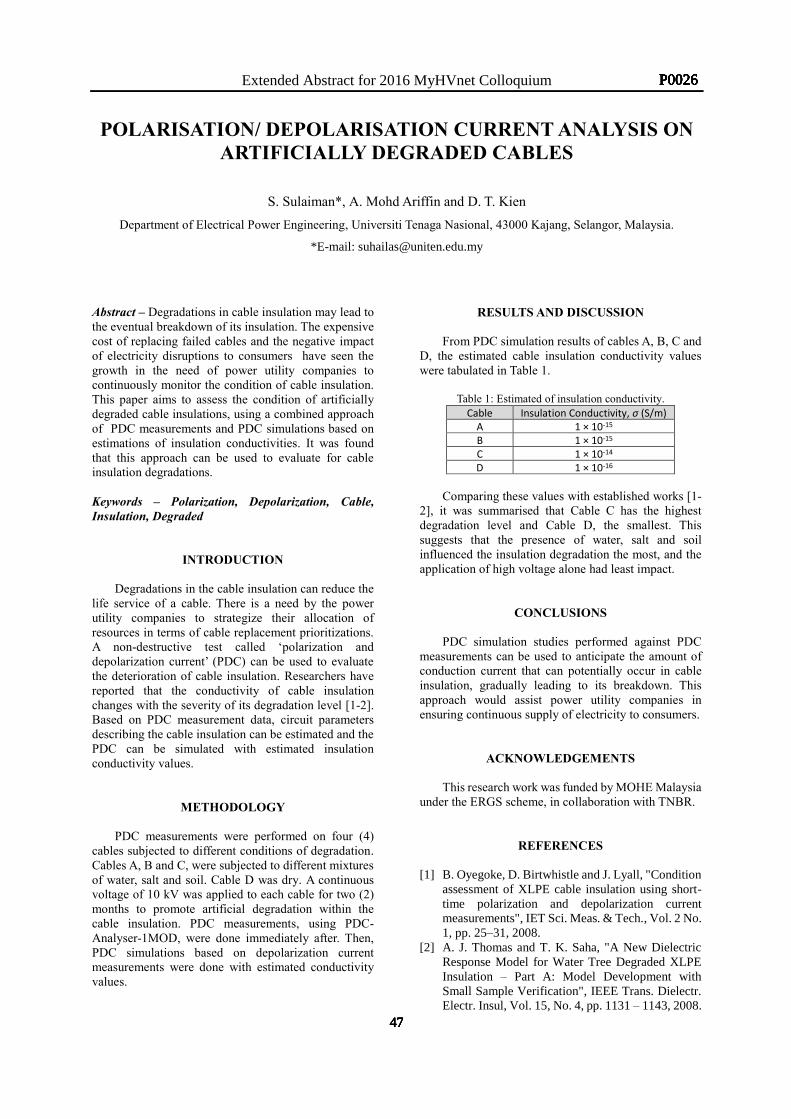
Extended Abstract for 2016 MyHVnet Colloquium
POLARISATION/ DEPOLARISATION CURRENT ANALYSIS ON ARTIFICIALLY DEGRADED CABLES
S. Sulaiman*, A. Mohd Ariffin and D. T. Kien
Department of Electrical Power Engineering, Universiti Tenaga Nasional, 43000 Kajang, Selangor, Malaysia.
*E-mail: [email protected]
Abstract – Degradations in cable insulation may lead to the eventual breakdown of its insulation. The expensive cost of replacing failed cables and the negative impact of electricity disruptions to consumers have seen the growth in the need of power utility companies to continuously monitor the condition of cable insulation. This paper aims to assess the condition of artificially degraded cable insulations, using a combined approach of PDC measurements and PDC simulations based on estimations of insulation conductivities. It was found that this approach can be used to evaluate for cable insulation degradations.
Keywords – Polarization, Depolarization, Cable, Insulation, Degraded
INTRODUCTION
Degradations in the cable insulation can reduce the life service of a cable. There is a need by the power utility companies to strategize their allocation of resources in terms of cable replacement prioritizations. A non-destructive test called ‘polarization and depolarization current’ (PDC) can be used to evaluate the deterioration of cable insulation. Researchers have reported that the conductivity of cable insulation changes with the severity of its degradation level [1-2]. Based on PDC measurement data, circuit parameters describing the cable insulation can be estimated and the PDC can be simulated with estimated insulation conductivity values.
METHODOLOGY PDC measurements were performed on four (4)
cables subjected to different conditions of degradation. Cables A, B and C, were subjected to different mixtures of water, salt and soil. Cable D was dry. A continuous voltage of 10 kV was applied to each cable for two (2) months to promote artificial degradation within the cable insulation. PDC measurements, using PDC-Analyser-1MOD, were done immediately after. Then, PDC simulations based on depolarization current measurements were done with estimated conductivity values.
RESULTS AND DISCUSSION
From PDC simulation results of cables A, B, C and D, the estimated cable insulation conductivity values were tabulated in Table 1.
Table 1: Estimated of insulation conductivity.
Cable Insulation Conductivity, σ (S/m) A 1 × 10-15 B 1 × 10-15 C 1 × 10-14 D 1 × 10-16
Comparing these values with established works [1-
2], it was summarised that Cable C has the highest degradation level and Cable D, the smallest. This suggests that the presence of water, salt and soil influenced the insulation degradation the most, and the application of high voltage alone had least impact.
CONCLUSIONS
PDC simulation studies performed against PDC measurements can be used to anticipate the amount of conduction current that can potentially occur in cable insulation, gradually leading to its breakdown. This approach would assist power utility companies in ensuring continuous supply of electricity to consumers.
ACKNOWLEDGEMENTS This research work was funded by MOHE Malaysia
under the ERGS scheme, in collaboration with TNBR.
REFERENCES
[1] B. Oyegoke, D. Birtwhistle and J. Lyall, "Condition assessment of XLPE cable insulation using short-time polarization and depolarization current measurements", IET Sci. Meas. & Tech., Vol. 2 No. 1, pp. 25–31, 2008.
[2] A. J. Thomas and T. K. Saha, "A New Dielectric Response Model for Water Tree Degraded XLPE Insulation – Part A: Model Development with Small Sample Verification", IEEE Trans. Dielectr. Electr. Insul, Vol. 15, No. 4, pp. 1131 – 1143, 2008.
47
P0026
47
P0026
47
P0026
47
P0026
47
P0026
47
P0026
47
P0026
47
P0026
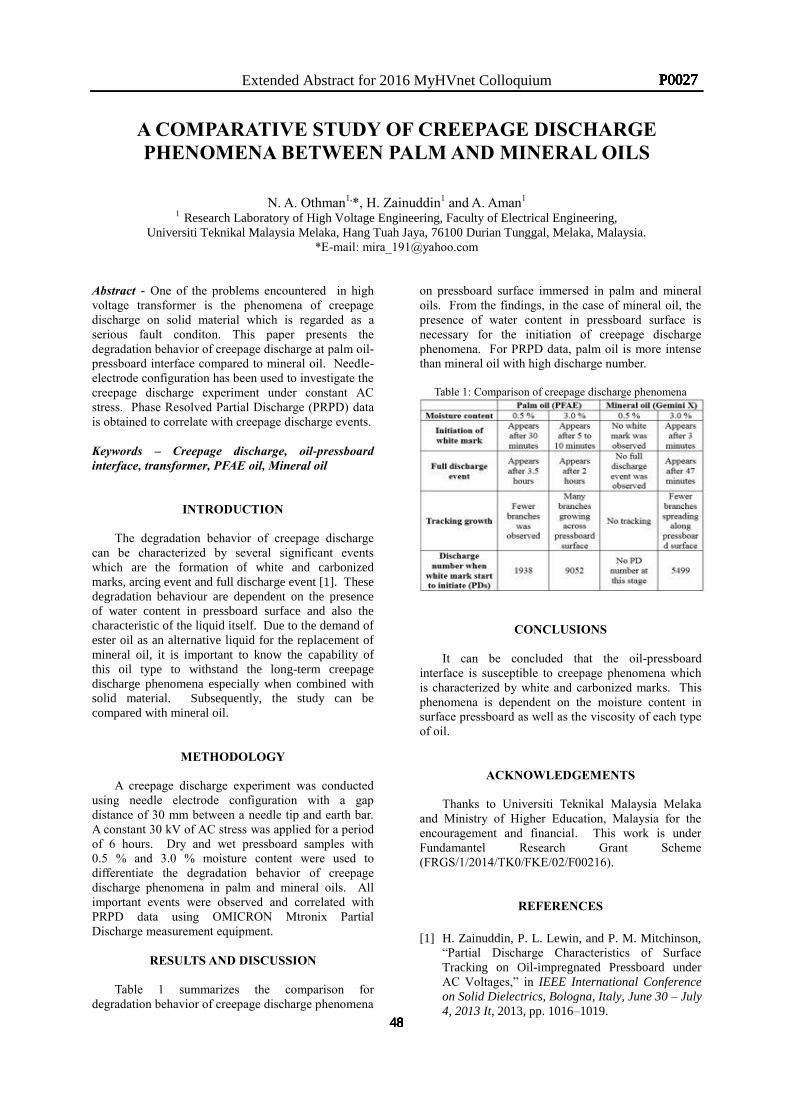
Extended Abstract for 2016 MyHVnet Colloquium
A COMPARATIVE STUDY OF CREEPAGE DISCHARGE PHENOMENA BETWEEN PALM AND MINERAL OILS
N. A. Othman1,*, H. Zainuddin1 and A. Aman1
1 Research Laboratory of High Voltage Engineering, Faculty of Electrical Engineering, Universiti Teknikal Malaysia Melaka, Hang Tuah Jaya, 76100 Durian Tunggal, Melaka, Malaysia.
*E-mail: [email protected] Abstract - One of the problems encountered in high voltage transformer is the phenomena of creepage discharge on solid material which is regarded as a serious fault conditon. This paper presents the degradation behavior of creepage discharge at palm oil-pressboard interface compared to mineral oil. Needle-electrode configuration has been used to investigate the creepage discharge experiment under constant AC stress. Phase Resolved Partial Discharge (PRPD) data is obtained to correlate with creepage discharge events. Keywords – Creepage discharge, oil-pressboard interface, transformer, PFAE oil, Mineral oil
INTRODUCTION
The degradation behavior of creepage discharge can be characterized by several significant events which are the formation of white and carbonized marks, arcing event and full discharge event [1]. These degradation behaviour are dependent on the presence of water content in pressboard surface and also the characteristic of the liquid itself. Due to the demand of ester oil as an alternative liquid for the replacement of mineral oil, it is important to know the capability of this oil type to withstand the long-term creepage discharge phenomena especially when combined with solid material. Subsequently, the study can be compared with mineral oil.
METHODOLOGY A creepage discharge experiment was conducted
using needle electrode configuration with a gap distance of 30 mm between a needle tip and earth bar. A constant 30 kV of AC stress was applied for a period of 6 hours. Dry and wet pressboard samples with 0.5 % and 3.0 % moisture content were used to differentiate the degradation behavior of creepage discharge phenomena in palm and mineral oils. All important events were observed and correlated with PRPD data using OMICRON Mtronix Partial Discharge measurement equipment.
RESULTS AND DISCUSSION
Table 1 summarizes the comparison for degradation behavior of creepage discharge phenomena
on pressboard surface immersed in palm and mineral oils. From the findings, in the case of mineral oil, the presence of water content in pressboard surface is necessary for the initiation of creepage discharge phenomena. For PRPD data, palm oil is more intense than mineral oil with high discharge number.
Table 1: Comparison of creepage discharge phenomena
CONCLUSIONS
It can be concluded that the oil-pressboard interface is susceptible to creepage phenomena which is characterized by white and carbonized marks. This phenomena is dependent on the moisture content in surface pressboard as well as the viscosity of each type of oil.
ACKNOWLEDGEMENTS
Thanks to Universiti Teknikal Malaysia Melaka
and Ministry of Higher Education, Malaysia for the encouragement and financial. This work is under Fundamantel Research Grant Scheme (FRGS/1/2014/TK0/FKE/02/F00216).
REFERENCES
[1] H. Zainuddin, P. L. Lewin, and P. M. Mitchinson, “Partial Discharge Characteristics of Surface Tracking on Oil-impregnated Pressboard under AC Voltages,” in IEEE International Conference on Solid Dielectrics, Bologna, Italy, June 30 – July 4, 2013 It, 2013, pp. 1016–1019.
48
P0027
48
P0027
48
P0027
48
P0027
48
P0027
48
P0027
48
P0027
48
P0027
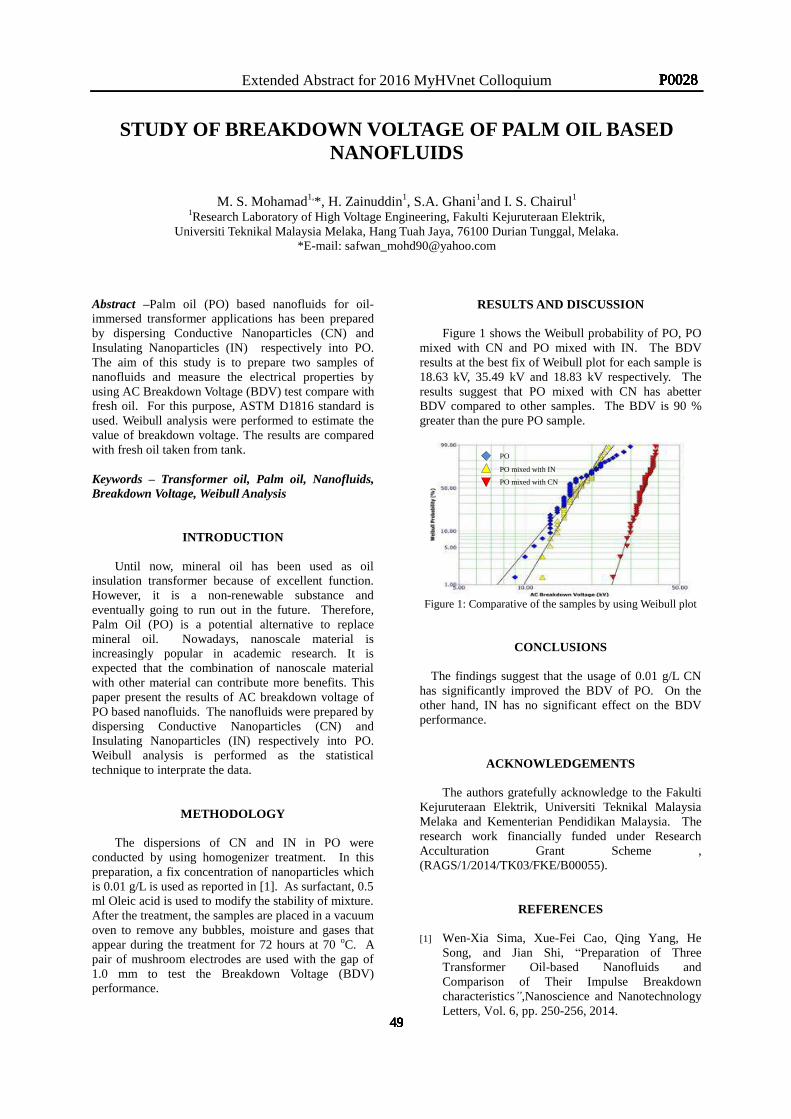
Extended Abstract for 2016 MyHVnet Colloquium
STUDY OF BREAKDOWN VOLTAGE OF PALM OIL BASED NANOFLUIDS
M. S. Mohamad1,*, H. Zainuddin1, S.A. Ghani1and I. S. Chairul1 1Research Laboratory of High Voltage Engineering, Fakulti Kejuruteraan Elektrik,
Universiti Teknikal Malaysia Melaka, Hang Tuah Jaya, 76100 Durian Tunggal, Melaka. *E-mail: [email protected]
Abstract –Palm oil (PO) based nanofluids for oil-immersed transformer applications has been prepared by dispersing Conductive Nanoparticles (CN) and Insulating Nanoparticles (IN) respectively into PO. The aim of this study is to prepare two samples of nanofluids and measure the electrical properties by using AC Breakdown Voltage (BDV) test compare with fresh oil. For this purpose, ASTM D1816 standard is used. Weibull analysis were performed to estimate the value of breakdown voltage. The results are compared with fresh oil taken from tank.
Keywords – Transformer oil, Palm oil, Nanofluids, Breakdown Voltage, Weibull Analysis
INTRODUCTION
Until now, mineral oil has been used as oil insulation transformer because of excellent function. However, it is a non-renewable substance and eventually going to run out in the future. Therefore, Palm Oil (PO) is a potential alternative to replace mineral oil. Nowadays, nanoscale material is increasingly popular in academic research. It is expected that the combination of nanoscale material with other material can contribute more benefits. This paper present the results of AC breakdown voltage of PO based nanofluids. The nanofluids were prepared by dispersing Conductive Nanoparticles (CN) and Insulating Nanoparticles (IN) respectively into PO. Weibull analysis is performed as the statistical technique to interprate the data.
METHODOLOGY The dispersions of CN and IN in PO were
conducted by using homogenizer treatment. In this preparation, a fix concentration of nanoparticles which is 0.01 g/L is used as reported in [1]. As surfactant, 0.5 ml Oleic acid is used to modify the stability of mixture. After the treatment, the samples are placed in a vacuum oven to remove any bubbles, moisture and gases that appear during the treatment for 72 hours at 70 oC. A pair of mushroom electrodes are used with the gap of 1.0 mm to test the Breakdown Voltage (BDV) performance.
RESULTS AND DISCUSSION
Figure 1 shows the Weibull probability of PO, PO mixed with CN and PO mixed with IN. The BDV results at the best fix of Weibull plot for each sample is 18.63 kV, 35.49 kV and 18.83 kV respectively. The results suggest that PO mixed with CN has abetter BDV compared to other samples. The BDV is 90 % greater than the pure PO sample.
Figure 1: Comparative of the samples by using Weibull plot
CONCLUSIONS
The findings suggest that the usage of 0.01 g/L CN has significantly improved the BDV of PO. On the other hand, IN has no significant effect on the BDV performance.
ACKNOWLEDGEMENTS The authors gratefully acknowledge to the Fakulti
Kejuruteraan Elektrik, Universiti Teknikal Malaysia Melaka and Kementerian Pendidikan Malaysia. The research work financially funded under Research Acculturation Grant Scheme , (RAGS/1/2014/TK03/FKE/B00055).
REFERENCES
[1] Wen-Xia Sima, Xue-Fei Cao, Qing Yang, He Song, and Jian Shi, “Preparation of Three Transformer Oil-based Nanofluids and Comparison of Their Impulse Breakdown characteristics”,Nanoscience and Nanotechnology Letters, Vol. 6, pp. 250-256, 2014.
PO
PO mixed with IN
PO mixed with CN
49
P0028
49
P0028
49
P0028
49
P0028
49
P0028
49
P0028
49
P0028
49
P0028
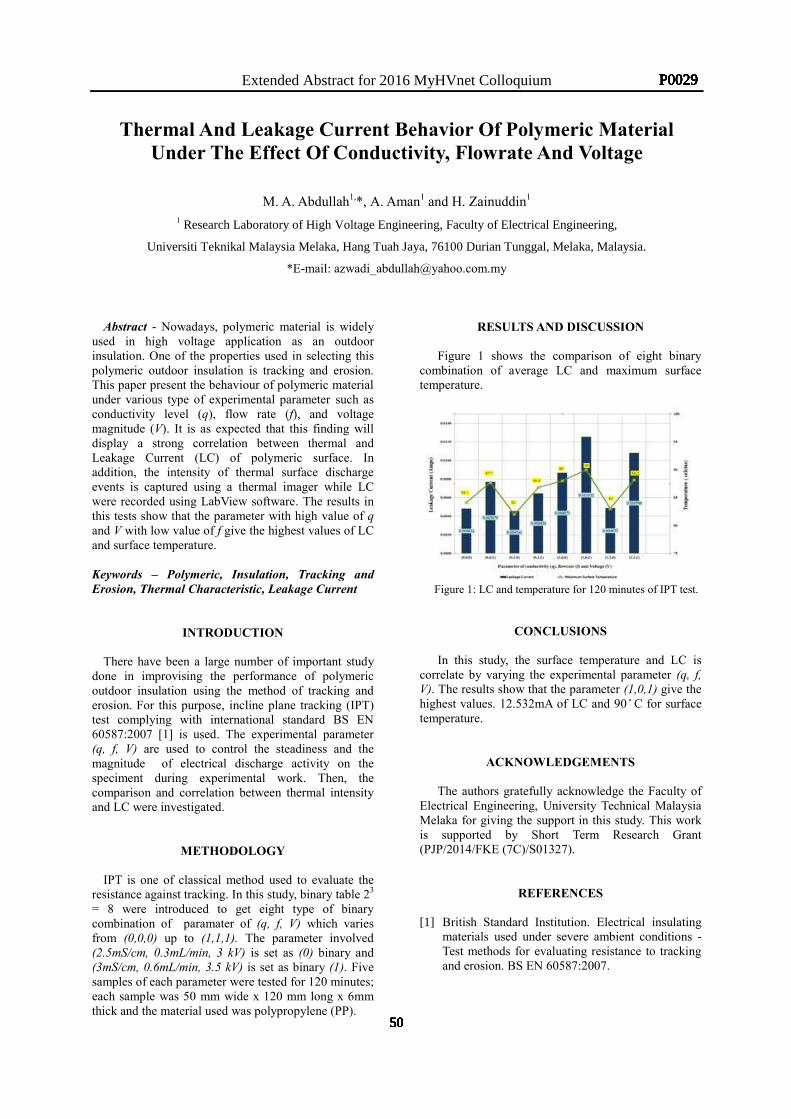
Extended Abstract for 2016 MyHVnet Colloquium
Thermal And Leakage Current Behavior Of Polymeric Material Under The Effect Of Conductivity, Flowrate And Voltage
M. A. Abdullah1,*, A. Aman1 and H. Zainuddin1 1 Research Laboratory of High Voltage Engineering, Faculty of Electrical Engineering,
Universiti Teknikal Malaysia Melaka, Hang Tuah Jaya, 76100 Durian Tunggal, Melaka, Malaysia.
*E-mail: [email protected]
Abstract - Nowadays, polymeric material is widely used in high voltage application as an outdoor insulation. One of the properties used in selecting this polymeric outdoor insulation is tracking and erosion. This paper present the behaviour of polymeric material under various type of experimental parameter such as conductivity level (q), flow rate (f), and voltage magnitude (V). It is as expected that this finding will display a strong correlation between thermal and Leakage Current (LC) of polymeric surface. In addition, the intensity of thermal surface discharge events is captured using a thermal imager while LC were recorded using LabView software. The results in this tests show that the parameter with high value of q and V with low value of f give the highest values of LC and surface temperature.
Keywords – Polymeric, Insulation, Tracking and Erosion, Thermal Characteristic, Leakage Current
INTRODUCTION
There have been a large number of important study done in improvising the performance of polymeric outdoor insulation using the method of tracking and erosion. For this purpose, incline plane tracking (IPT) test complying with international standard BS EN 60587:2007 [1] is used. The experimental parameter (q, f, V) are used to control the steadiness and the magnitude of electrical discharge activity on the speciment during experimental work. Then, the comparison and correlation between thermal intensity and LC were investigated.
METHODOLOGY
IPT is one of classical method used to evaluate the resistance against tracking. In this study, binary table 23 = 8 were introduced to get eight type of binary combination of paramater of (q, f, V) which varies from (0,0,0) up to (1,1,1). The parameter involved (2.5mS/cm, 0.3mL/min, 3 kV) is set as (0) binary and (3mS/cm, 0.6mL/min, 3.5 kV) is set as binary (1). Five samples of each parameter were tested for 120 minutes; each sample was 50 mm wide x 120 mm long x 6mm thick and the material used was polypropylene (PP).
RESULTS AND DISCUSSION
Figure 1 shows the comparison of eight binary combination of average LC and maximum surface temperature.
Figure 1: LC and temperature for 120 minutes of IPT test.
CONCLUSIONS
In this study, the surface temperature and LC is correlate by varying the experimental parameter (q, f, V). The results show that the parameter (1,0,1) give the highest values. 12.532mA of LC and 90 C for surface temperature.
ACKNOWLEDGEMENTS
The authors gratefully acknowledge the Faculty of Electrical Engineering, University Technical Malaysia Melaka for giving the support in this study. This work is supported by Short Term Research Grant (PJP/2014/FKE (7C)/S01327).
REFERENCES
[1] British Standard Institution. Electrical insulating materials used under severe ambient conditions -Test methods for evaluating resistance to tracking and erosion. BS EN 60587:2007.
50
P0029
50
P0029
50
P0029
50
P0029
50
P0029
50
P0029
50
P0029
50
P0029
Extended Abstract for 2016 MyHVnet Colloquium
AN OVERVIEW FOR NEW APPROACH OF TRANSFORMERS ASSET MANAGEMENT USING HEALTH INDEX
M. S. Yahaya1,*, N. Azis2 , J. Jasni2, M. A. Talib3, 1Faculty of Engineering Technology, Universiti Teknikal Malaysia Melaka, 76100 Durian Tunggal, Melaka Malaysia. 2Centre for Electromagnetic & Lightning Protection, Universiti Putra Malaysia, 43300 Serdang, Selangor, Malaysia.
3TNB Research Sdn Bhd, 43300 Kajang, Selangor, Malaysia.
*E-mail: [email protected] Abstract - Transformers are one of the electrical equipment that has a critical role in the power system. In order to avoid power system outage, information that provides the transformer condition is vital. Transformer asset management activities are numerous and researchers tackle them from different view. This study will focuses on a new approach of transformer Health Index (HI). An improved HI will be developed based on the transformers historical and maintenance data and also existing literature knowledge. The relationship between industries based HI and insulation ageing related failure will be explored. Multiple parameters for power transformer will be considered in developing the new approach of HI. The assessment of the remaining life of transformers based on both industries and research approaches will be linked together. It is anticipated that the outcome of the study could aid the asset manager for better decision making of transformers asset Keywords –Transformers, Health Index, Thermal Ageing, Remaining Life, Asset Management
INTRODUCTION
Most of the utilities nowadays used HI scoring based method to manage their transformers assets. It is mostly based on the historical and maintenance data [1-2]. In others perspective, the understanding on ageing mechanisms of transformers is essential to quantify the remaining life. Based on this approach, the degradation model of transformers could be determined and assist with the condition assessment. Both methods have their own advantages and disadvantages. Several studies have identified several parameters that are essential for HI assessment such as oil quality, dissolved gas analysis, furanic compounds and external conditions and factors [1-2]. On the other hand, the research model was developed based accelerated thermal ageing. Coupled with the existing thermal modelling such as IEC 60076-7 2005 and IEEE Std C57.91-1995, the research model could provide an approximate condition of transformers. The aim of this research is to determine the relationship between the scoring based model with the thermal and chemical ageing model of insulation in order to predict the health of the transformer.
METHODOLOGY
In this study, an improved HI will be developed. Multiple parameters which include transformers historical and transformer data and also existing literature knowledge will be considered. The condition of paper insulation based on thermal degradation will be considered in modelling the HI. This research will study on a realistic HI formulation method for transformers using readily available data. By using a multi-criteria analysis approach and suitable mathematical methods, the significant parameters and factors will be combined into an idealised HI. The case study will be performed based on the available data of transformer for the new approach of HI.
RESULTS AND DISCUSSION
In this project, it is expected the new approach that could link between the lab ageing and in-service ageing. This would be achieved through an improved formulation of HI which considered the previous research knowledges. The concepts of insulation degradation and ageing will be considered as a significant factor to the HI scoring based method.
CONCLUSIONS
A new method of defining the reliability of transformer expected to be proposed based on the insulation degradation model and HI scoring based method which mostly used by utilities. This model expected to be tested with the available real data in order to determine the model reliability.
ACKNOWLEDGEMENTS The authors would like to express their sincere
gratitude to MOHE, UTeM and PUTRA grant scheme for the technical and financial support of this research.
REFERENCES
[1] A. Jahromi, R. Piercy, S. Cress, J. Service, and W. Fan, “An approach to power transformer asset management using health index,” IEEE Electr. Insul. Mag., vol. 25, no. 2, pp. 20–34, Mar. 2009.
[2] M. A. Martins, “Condition and risk assessment of power transformers: a general approach to calculate a Health Index,” Ciência Tecnol. dos Mater., vol. 26, no. 1, pp. 9–16, 2014.
51
P0030
51
P0030
51
P0030
51
P0030
51
P0030
51
P0030
51
P0030
51
P0030
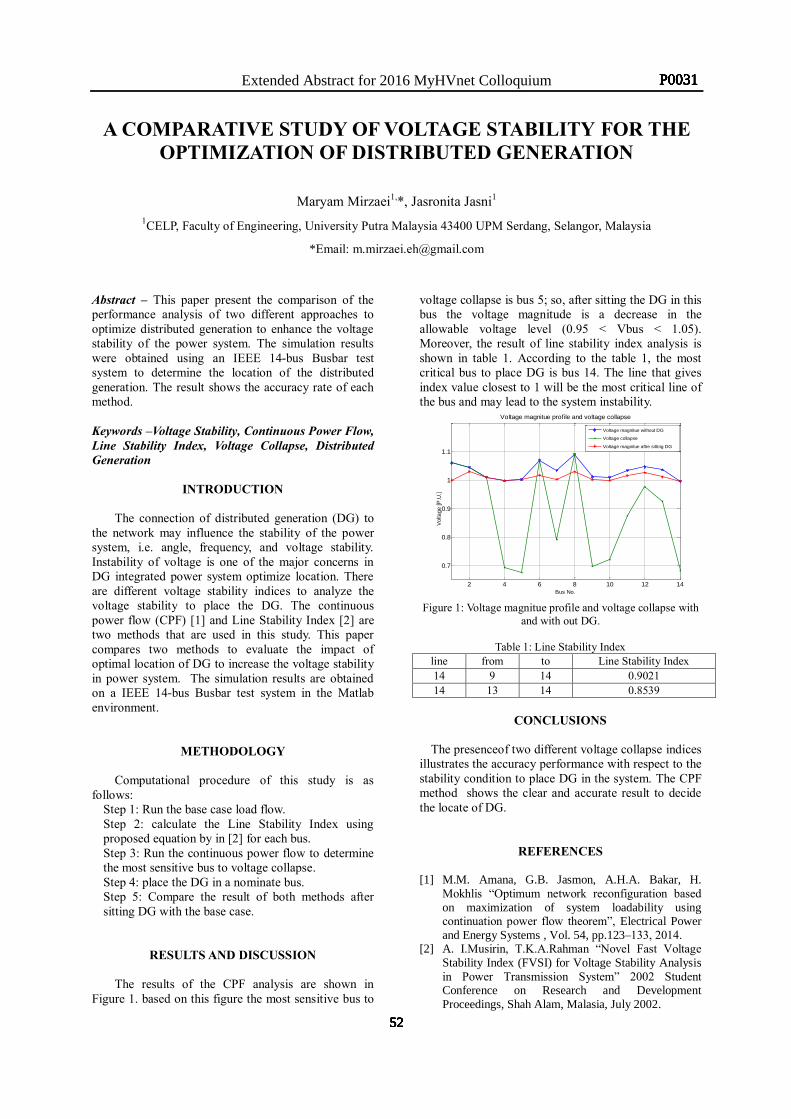
Extended Abstract for 2016 MyHVnet Colloquium
A COMPARATIVE STUDY OF VOLTAGE STABILITY FOR THE OPTIMIZATION OF DISTRIBUTED GENERATION
Maryam Mirzaei1,*, Jasronita Jasni1 1CELP, Faculty of Engineering, University Putra Malaysia 43400 UPM Serdang, Selangor, Malaysia
*Email: [email protected]
Abstract – This paper present the comparison of the performance analysis of two different approaches to optimize distributed generation to enhance the voltage stability of the power system. The simulation results were obtained using an IEEE 14-bus Busbar test system to determine the location of the distributed generation. The result shows the accuracy rate of each method.
Keywords –Voltage Stability, Continuous Power Flow, Line Stability Index, Voltage Collapse, Distributed Generation
INTRODUCTION
The connection of distributed generation (DG) to the network may influence the stability of the power system, i.e. angle, frequency, and voltage stability. Instability of voltage is one of the major concerns in DG integrated power system optimize location. There are different voltage stability indices to analyze the voltage stability to place the DG. The continuous power flow (CPF) [1] and Line Stability Index [2] are two methods that are used in this study. This paper compares two methods to evaluate the impact of optimal location of DG to increase the voltage stability in power system. The simulation results are obtained on a IEEE 14-bus Busbar test system in the Matlab environment.
METHODOLOGY Computational procedure of this study is as
follows: Step 1: Run the base case load flow. Step 2: calculate the Line Stability Index using proposed equation by in [2] for each bus. Step 3: Run the continuous power flow to determine the most sensitive bus to voltage collapse. Step 4: place the DG in a nominate bus. Step 5: Compare the result of both methods after sitting DG with the base case.
RESULTS AND DISCUSSION
The results of the CPF analysis are shown in Figure 1. based on this figure the most sensitive bus to
voltage collapse is bus 5; so, after sitting the DG in this bus the voltage magnitude is a decrease in the allowable voltage level (0.95 < Vbus < 1.05). Moreover, the result of line stability index analysis is shown in table 1. According to the table 1, the most critical bus to place DG is bus 14. The line that gives index value closest to 1 will be the most critical line of the bus and may lead to the system instability.
Figure 1: Voltage magnitue profile and voltage collapse with
and with out DG.
Table 1: Line Stability Index line from to Line Stability Index 14 9 14 0.9021 14 13 14 0.8539
CONCLUSIONS
The presenceof two different voltage collapse indices
illustrates the accuracy performance with respect to the stability condition to place DG in the system. The CPF method shows the clear and accurate result to decide the locate of DG.
REFERENCES
[1] M.M. Amana, G.B. Jasmon, A.H.A. Bakar, H. Mokhlis “Optimum network reconfiguration based on maximization of system loadability using continuation power flow theorem”, Electrical Power and Energy Systems , Vol. 54, pp.123–133, 2014.
[2] A. I.Musirin, T.K.A.Rahman “Novel Fast Voltage Stability Index (FVSI) for Voltage Stability Analysis in Power Transmission System” 2002 Student Conference on Research and Development Proceedings, Shah Alam, Malasia, July 2002.
2 4 6 8 10 12 14
0.7
0.8
0.9
1
1.1
Voltage magnitue profile and voltage collapse
Bus No.
Vol
tage
[P.U
.]
Voltage magnitue without DG
Voltage collapse
Voltage magnitue aftre sitting DG
52
P0031
52
P0031
52
P0031
52
P0031
52
P0031
52
P0031
52
P0031
52
P0031
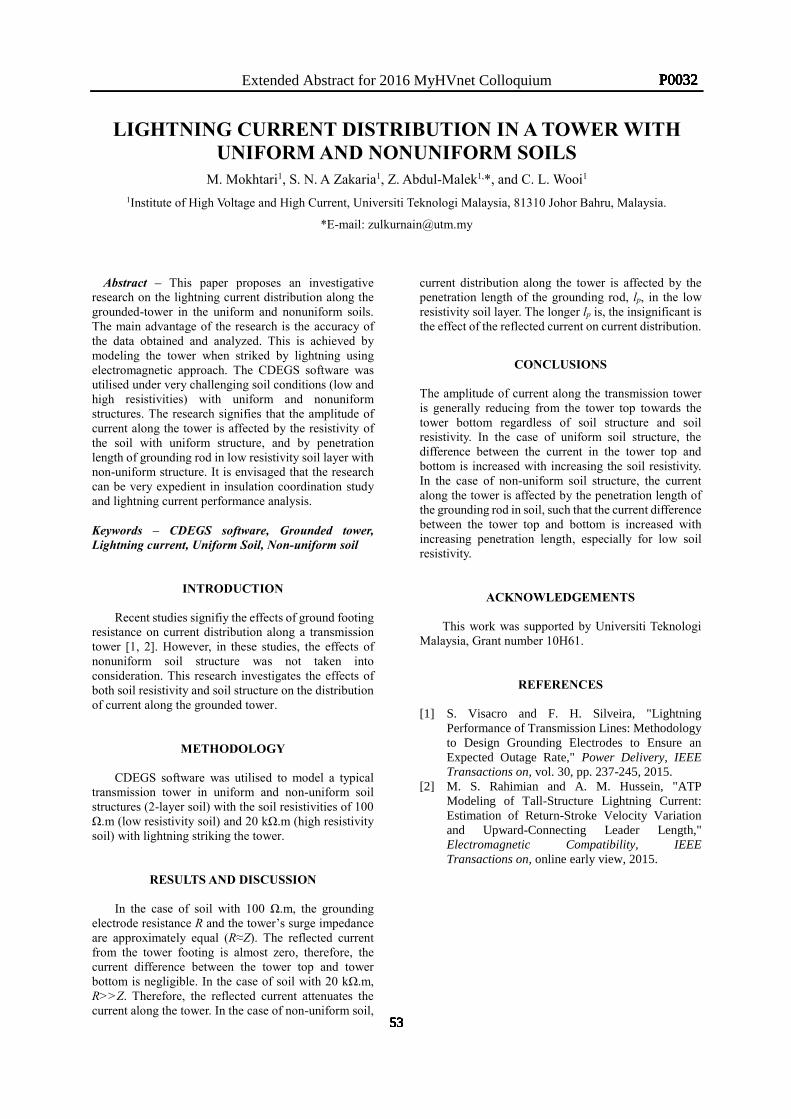
Extended Abstract for 2016 MyHVnet Colloquium
LIGHTNING CURRENT DISTRIBUTION IN A TOWER WITH UNIFORM AND NONUNIFORM SOILS
M. Mokhtari1, S. N. A Zakaria1, Z. Abdul-Malek1,*, and C. L. Wooi1 1Institute of High Voltage and High Current, Universiti Teknologi Malaysia, 81310 Johor Bahru, Malaysia.
*E-mail: [email protected]
Abstract – This paper proposes an investigative research on the lightning current distribution along the grounded-tower in the uniform and nonuniform soils. The main advantage of the research is the accuracy of the data obtained and analyzed. This is achieved by modeling the tower when striked by lightning using electromagnetic approach. The CDEGS software was utilised under very challenging soil conditions (low and high resistivities) with uniform and nonuniform structures. The research signifies that the amplitude of current along the tower is affected by the resistivity of the soil with uniform structure, and by penetration length of grounding rod in low resistivity soil layer with non-uniform structure. It is envisaged that the research can be very expedient in insulation coordination study and lightning current performance analysis.
Keywords – CDEGS software, Grounded tower, Lightning current, Uniform Soil, Non-uniform soil
INTRODUCTION
Recent studies signifiy the effects of ground footing resistance on current distribution along a transmission tower [1, 2]. However, in these studies, the effects of nonuniform soil structure was not taken into consideration. This research investigates the effects of both soil resistivity and soil structure on the distribution of current along the grounded tower.
METHODOLOGY CDEGS software was utilised to model a typical
transmission tower in uniform and non-uniform soil structures (2-layer soil) with the soil resistivities of 100 Ω.m (low resistivity soil) and 20 kΩ.m (high resistivity soil) with lightning striking the tower.
RESULTS AND DISCUSSION
In the case of soil with 100 Ω.m, the grounding electrode resistance R and the tower’s surge impedance are approximately equal (R≈Z). The reflected current from the tower footing is almost zero, therefore, the current difference between the tower top and tower bottom is negligible. In the case of soil with 20 kΩ.m, R>>Z. Therefore, the reflected current attenuates the current along the tower. In the case of non-uniform soil,
current distribution along the tower is affected by the penetration length of the grounding rod, lp, in the low resistivity soil layer. The longer lp is, the insignificant is the effect of the reflected current on current distribution.
CONCLUSIONS
The amplitude of current along the transmission tower is generally reducing from the tower top towards the tower bottom regardless of soil structure and soil resistivity. In the case of uniform soil structure, the difference between the current in the tower top and bottom is increased with increasing the soil resistivity. In the case of non-uniform soil structure, the current along the tower is affected by the penetration length of the grounding rod in soil, such that the current difference between the tower top and bottom is increased with increasing penetration length, especially for low soil resistivity.
ACKNOWLEDGEMENTS This work was supported by Universiti Teknologi
Malaysia, Grant number 10H61.
REFERENCES [1] S. Visacro and F. H. Silveira, "Lightning
Performance of Transmission Lines: Methodology to Design Grounding Electrodes to Ensure an Expected Outage Rate," Power Delivery, IEEE Transactions on, vol. 30, pp. 237-245, 2015.
[2] M. S. Rahimian and A. M. Hussein, "ATP Modeling of Tall-Structure Lightning Current: Estimation of Return-Stroke Velocity Variation and Upward-Connecting Leader Length," Electromagnetic Compatibility, IEEE Transactions on, online early view, 2015.
53
P0032
53
P0032
53
P0032
53
P0032
53
P0032
53
P0032
53
P0032
53
P0032
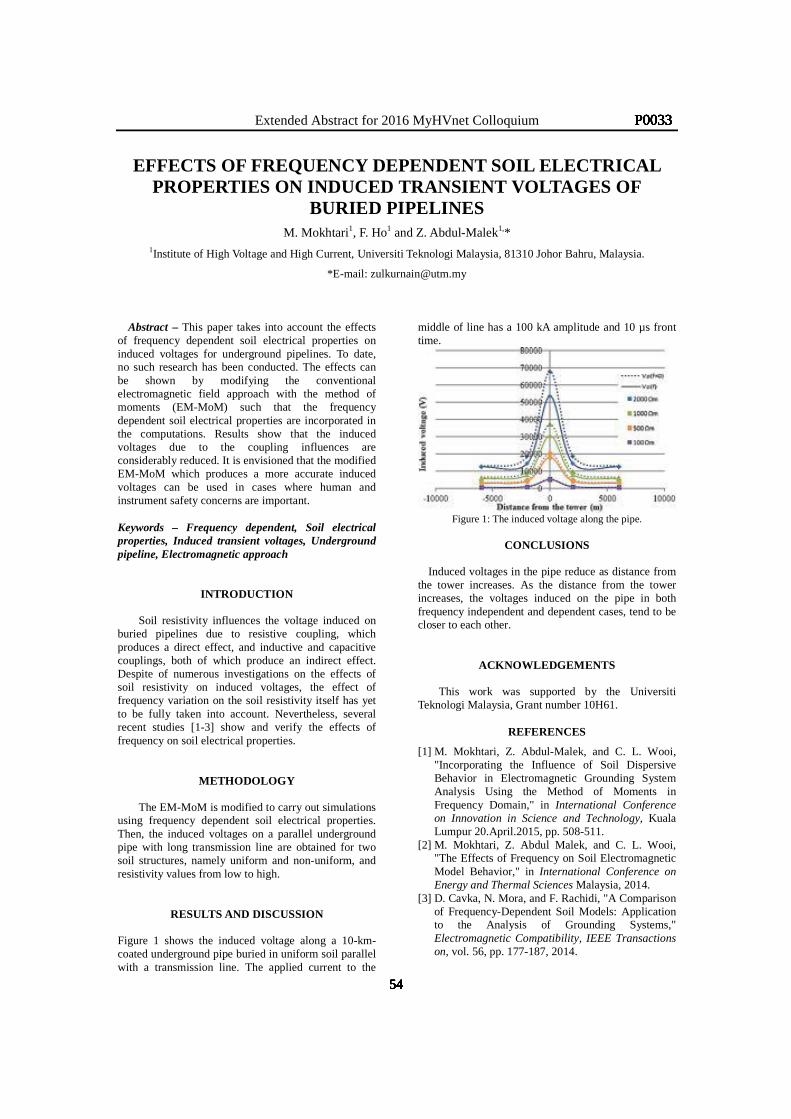
Extended Abstract for 2016 MyHVnet Colloquium
EFFECTS OF FREQUENCY DEPENDENT SOIL ELECTRICAL PROPERTIES ON INDUCED TRANSIENT VOLTAGES OF
BURIED PIPELINES
M. Mokhtari1, F. Ho1 and Z. Abdul-Malek1,* 1Institute of High Voltage and High Current, Universiti Teknologi Malaysia, 81310 Johor Bahru, Malaysia.
*E-mail: [email protected]
Abstract – This paper takes into account the effects of frequency dependent soil electrical properties on induced voltages for underground pipelines. To date, no such research has been conducted. The effects can be shown by modifying the conventional electromagnetic field approach with the method of moments (EM-MoM) such that the frequency dependent soil electrical properties are incorporated in the computations. Results show that the induced voltages due to the coupling influences are considerably reduced. It is envisioned that the modified EM-MoM which produces a more accurate induced voltages can be used in cases where human and instrument safety concerns are important.
Keywords – Frequency dependent, Soil electrical properties, Induced transient voltages, Underground pipeline, Electromagnetic approach
INTRODUCTION
Soil resistivity influences the voltage induced on buried pipelines due to resistive coupling, which produces a direct effect, and inductive and capacitive couplings, both of which produce an indirect effect. Despite of numerous investigations on the effects of soil resistivity on induced voltages, the effect of frequency variation on the soil resistivity itself has yet to be fully taken into account. Nevertheless, several recent studies [1-3] show and verify the effects of frequency on soil electrical properties.
METHODOLOGY The EM-MoM is modified to carry out simulations
using frequency dependent soil electrical properties. Then, the induced voltages on a parallel underground pipe with long transmission line are obtained for two soil structures, namely uniform and non-uniform, and resistivity values from low to high.
RESULTS AND DISCUSSION
Figure 1 shows the induced voltage along a 10-km-coated underground pipe buried in uniform soil parallel with a transmission line. The applied current to the
middle of line has a 100 kA amplitude and 10 µs front time.
Figure 1: The induced voltage along the pipe.
CONCLUSIONS
Induced voltages in the pipe reduce as distance from
the tower increases. As the distance from the tower increases, the voltages induced on the pipe in both frequency independent and dependent cases, tend to be closer to each other.
ACKNOWLEDGEMENTS This work was supported by the Universiti
Teknologi Malaysia, Grant number 10H61.
REFERENCES
[1] M. Mokhtari, Z. Abdul-Malek, and C. L. Wooi, "Incorporating the Influence of Soil Dispersive Behavior in Electromagnetic Grounding System Analysis Using the Method of Moments in Frequency Domain," in International Conference on Innovation in Science and Technology, Kuala Lumpur 20.April.2015, pp. 508-511.
[2] M. Mokhtari, Z. Abdul Malek, and C. L. Wooi, "The Effects of Frequency on Soil Electromagnetic Model Behavior," in International Conference on Energy and Thermal Sciences Malaysia, 2014.
[3] D. Cavka, N. Mora, and F. Rachidi, "A Comparison of Frequency-Dependent Soil Models: Application to the Analysis of Grounding Systems," Electromagnetic Compatibility, IEEE Transactions on, vol. 56, pp. 177-187, 2014.
54
P0033
54
P0033
54
P0033
54
P0033
54
P0033
54
P0033
54
P0033
54
P0033
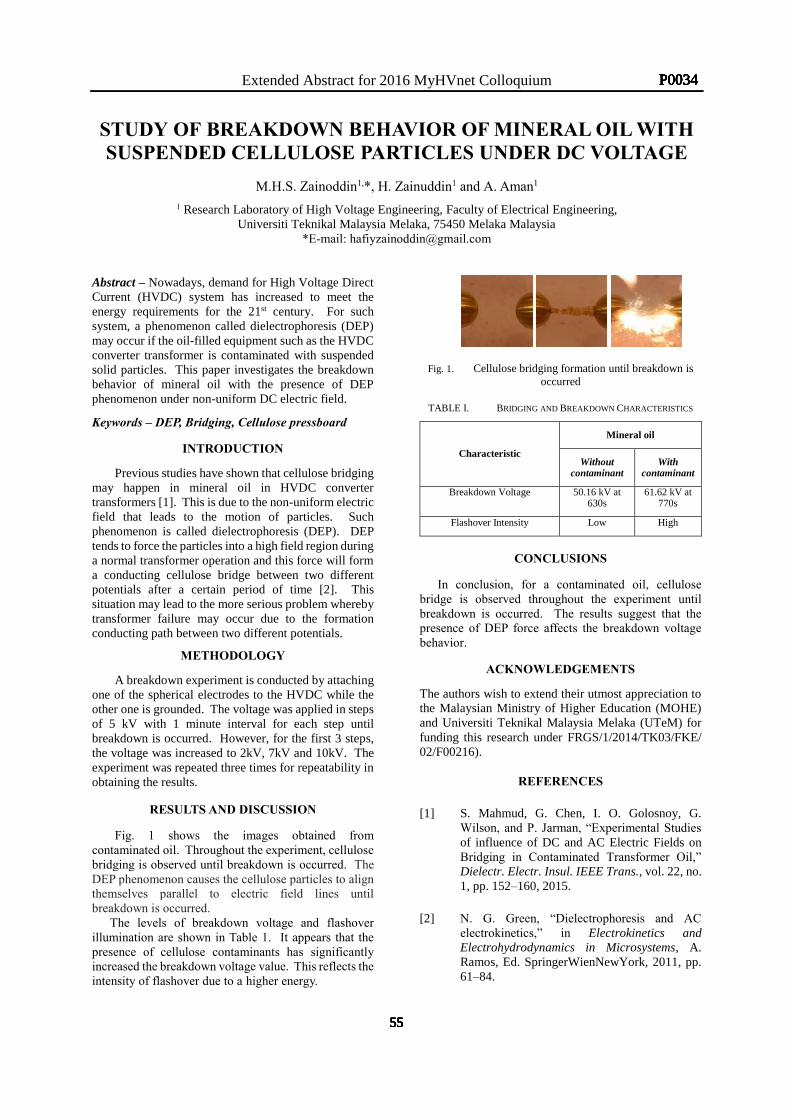
Extended Abstract for 2016 MyHVnet Colloquium
STUDY OF BREAKDOWN BEHAVIOR OF MINERAL OIL WITH SUSPENDED CELLULOSE PARTICLES UNDER DC VOLTAGE
M.H.S. Zainoddin1,*, H. Zainuddin1 and A. Aman1
1 Research Laboratory of High Voltage Engineering, Faculty of Electrical Engineering, Universiti Teknikal Malaysia Melaka, 75450 Melaka Malaysia
*E-mail: [email protected] Abstract – Nowadays, demand for High Voltage Direct Current (HVDC) system has increased to meet the energy requirements for the 21st century. For such system, a phenomenon called dielectrophoresis (DEP) may occur if the oil-filled equipment such as the HVDC converter transformer is contaminated with suspended solid particles. This paper investigates the breakdown behavior of mineral oil with the presence of DEP phenomenon under non-uniform DC electric field.
Keywords – DEP, Bridging, Cellulose pressboard
INTRODUCTION
Previous studies have shown that cellulose bridging may happen in mineral oil in HVDC converter transformers [1]. This is due to the non-uniform electric field that leads to the motion of particles. Such phenomenon is called dielectrophoresis (DEP). DEP tends to force the particles into a high field region during a normal transformer operation and this force will form a conducting cellulose bridge between two different potentials after a certain period of time [2]. This situation may lead to the more serious problem whereby transformer failure may occur due to the formation conducting path between two different potentials.
METHODOLOGY
A breakdown experiment is conducted by attaching one of the spherical electrodes to the HVDC while the other one is grounded. The voltage was applied in steps of 5 kV with 1 minute interval for each step until breakdown is occurred. However, for the first 3 steps, the voltage was increased to 2kV, 7kV and 10kV. The experiment was repeated three times for repeatability in obtaining the results.
RESULTS AND DISCUSSION
Fig. 1 shows the images obtained from contaminated oil. Throughout the experiment, cellulose bridging is observed until breakdown is occurred. The DEP phenomenon causes the cellulose particles to align themselves parallel to electric field lines until breakdown is occurred. The levels of breakdown voltage and flashover illumination are shown in Table 1. It appears that the presence of cellulose contaminants has significantly increased the breakdown voltage value. This reflects the intensity of flashover due to a higher energy.
Fig. 1. Cellulose bridging formation until breakdown is occurred
TABLE I. BRIDGING AND BREAKDOWN CHARACTERISTICS
Characteristic
Mineral oil
Without contaminant
With contaminant
Breakdown Voltage 50.16 kV at 630s
61.62 kV at 770s
Flashover Intensity Low High
CONCLUSIONS
In conclusion, for a contaminated oil, cellulose
bridge is observed throughout the experiment until breakdown is occurred. The results suggest that the presence of DEP force affects the breakdown voltage behavior.
ACKNOWLEDGEMENTS
The authors wish to extend their utmost appreciation to the Malaysian Ministry of Higher Education (MOHE) and Universiti Teknikal Malaysia Melaka (UTeM) for funding this research under FRGS/1/2014/TK03/FKE/ 02/F00216).
REFERENCES
[1] S. Mahmud, G. Chen, I. O. Golosnoy, G. Wilson, and P. Jarman, “Experimental Studies of influence of DC and AC Electric Fields on Bridging in Contaminated Transformer Oil,” Dielectr. Electr. Insul. IEEE Trans., vol. 22, no. 1, pp. 152–160, 2015.
[2] N. G. Green, “Dielectrophoresis and AC electrokinetics,” in Electrokinetics and Electrohydrodynamics in Microsystems, A. Ramos, Ed. SpringerWienNewYork, 2011, pp. 61–84.
55
P0034
55
P0034
55
P0034
55
P0034
55
P0034
55
P0034
55
P0034
55
P0034
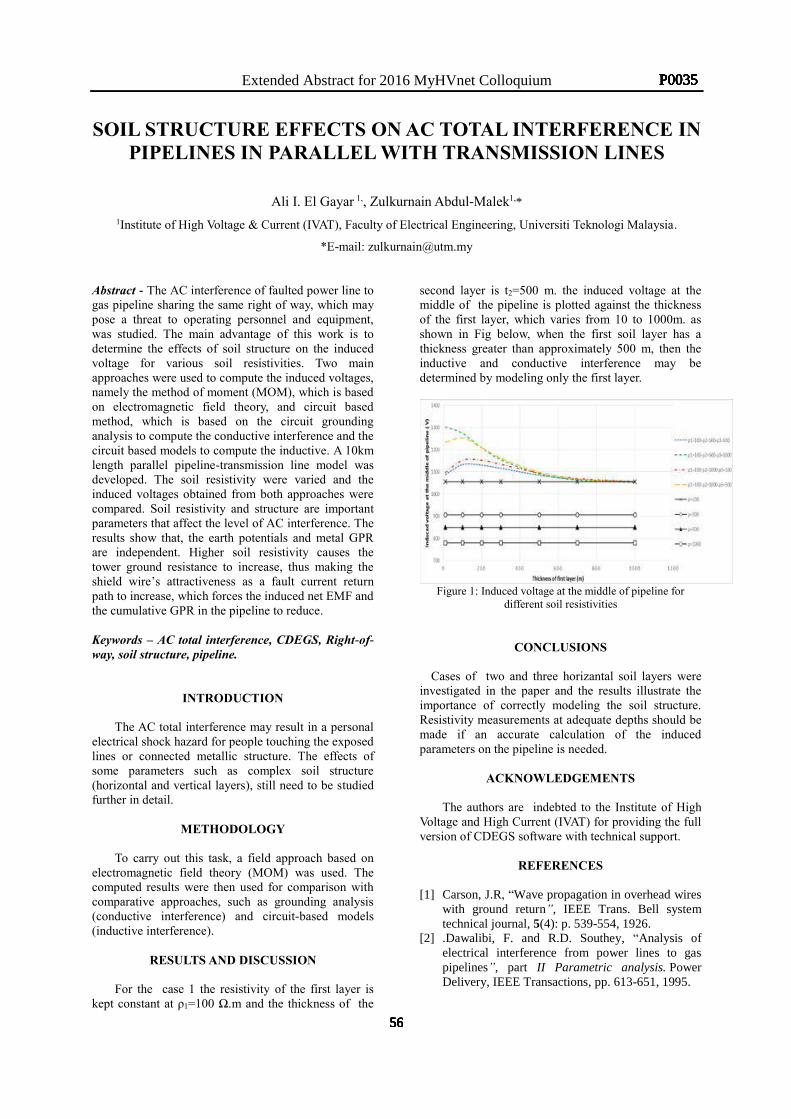
Extended Abstract for 2016 MyHVnet Colloquium
SOIL STRUCTURE EFFECTS ON AC TOTAL INTERFERENCE IN PIPELINES IN PARALLEL WITH TRANSMISSION LINES
Ali I. El Gayar 1,, Zulkurnain Abdul-Malek1,* 1Institute of High Voltage & Current (IVAT), Faculty of Electrical Engineering, Universiti Teknologi Malaysia.
*E-mail: [email protected] Abstract - The AC interference of faulted power line to gas pipeline sharing the same right of way, which may pose a threat to operating personnel and equipment, was studied. The main advantage of this work is to determine the effects of soil structure on the induced voltage for various soil resistivities. Two main approaches were used to compute the induced voltages, namely the method of moment (MOM), which is based on electromagnetic field theory, and circuit based method, which is based on the circuit grounding analysis to compute the conductive interference and the circuit based models to compute the inductive. A 10km length parallel pipeline-transmission line model was developed. The soil resistivity were varied and the induced voltages obtained from both approaches were compared. Soil resistivity and structure are important parameters that affect the level of AC interference. The results show that, the earth potentials and metal GPR are independent. Higher soil resistivity causes the tower ground resistance to increase, thus making the shield wire’s attractiveness as a fault current return path to increase, which forces the induced net EMF and the cumulative GPR in the pipeline to reduce.
Keywords – AC total interference, CDEGS, Right-of-way, soil structure, pipeline.
INTRODUCTION
The AC total interference may result in a personal electrical shock hazard for people touching the exposed lines or connected metallic structure. The effects of some parameters such as complex soil structure (horizontal and vertical layers), still need to be studied further in detail.
METHODOLOGY To carry out this task, a field approach based on
electromagnetic field theory (MOM) was used. The computed results were then used for comparison with comparative approaches, such as grounding analysis (conductive interference) and circuit-based models (inductive interference).
RESULTS AND DISCUSSION
For the case 1 the resistivity of the first layer is kept constant at ρ1=100 Ω.m and the thickness of the
second layer is t2=500 m. the induced voltage at the middle of the pipeline is plotted against the thickness of the first layer, which varies from 10 to 1000m. as shown in Fig below, when the first soil layer has a thickness greater than approximately 500 m, then the inductive and conductive interference may be determined by modeling only the first layer.
Figure 1: Induced voltage at the middle of pipeline for
different soil resistivities
CONCLUSIONS
Cases of two and three horizantal soil layers were investigated in the paper and the results illustrate the importance of correctly modeling the soil structure. Resistivity measurements at adequate depths should be made if an accurate calculation of the induced parameters on the pipeline is needed.
ACKNOWLEDGEMENTS The authors are indebted to the Institute of High
Voltage and High Current (IVAT) for providing the full version of CDEGS software with technical support.
REFERENCES
[1] Carson, J.R, “Wave propagation in overhead wires with ground return”, IEEE Trans. Bell system technical journal, 5(4): p. 539-554, 1926.
[2] .Dawalibi, F. and R.D. Southey, “Analysis of electrical interference from power lines to gas pipelines”, part II Parametric analysis. Power Delivery, IEEE Transactions, pp. 613-651, 1995.
56
P0035
56
P0035
56
P0035
56
P0035
56
P0035
56
P0035
56
P0035
56
P0035
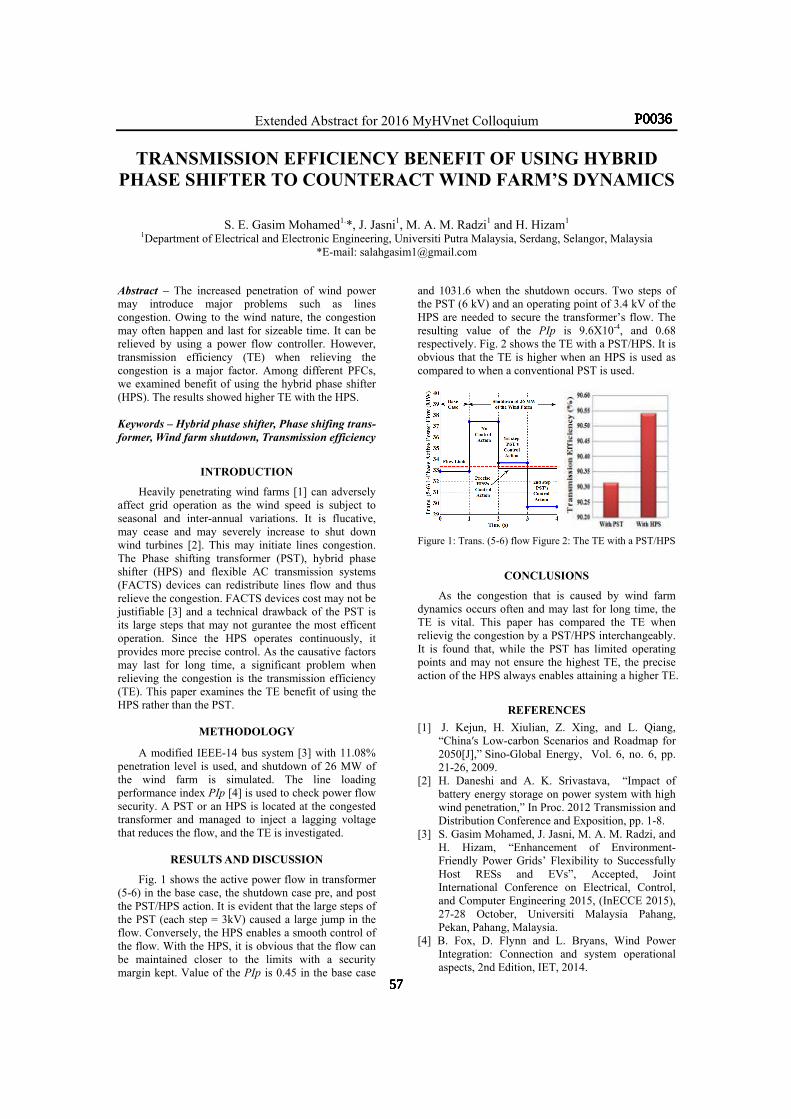
Extended Abstract for 2016 MyHVnet Colloquium
TRANSMISSION EFFICIENCY BENEFIT OF USING HYBRID PHASE SHIFTER TO COUNTERACT WIND FARM’S DYNAMICS
S. E. Gasim Mohamed1.*, J. Jasni1, M. A. M. Radzi1 and H. Hizam1 1Department of Electrical and Electronic Engineering, Universiti Putra Malaysia, Serdang, Selangor, Malaysia
*E-mail: [email protected]
Abstract – The increased penetration of wind power may introduce major problems such as lines congestion. Owing to the wind nature, the congestion may often happen and last for sizeable time. It can be relieved by using a power flow controller. However, transmission efficiency (TE) when relieving the congestion is a major factor. Among different PFCs, we examined benefit of using the hybrid phase shifter (HPS). The results showed higher TE with the HPS.
Keywords – Hybrid phase shifter, Phase shifing trans-former, Wind farm shutdown, Transmission efficiency
INTRODUCTION
Heavily penetrating wind farms [1] can adversely affect grid operation as the wind speed is subject to seasonal and inter-annual variations. It is flucative, may cease and may severely increase to shut down wind turbines [2]. This may initiate lines congestion. The Phase shifting transformer (PST), hybrid phase shifter (HPS) and flexible AC transmission systems (FACTS) devices can redistribute lines flow and thus relieve the congestion. FACTS devices cost may not be justifiable [3] and a technical drawback of the PST is its large steps that may not gurantee the most efficent operation. Since the HPS operates continuously, it provides more precise control. As the causative factors may last for long time, a significant problem when relieving the congestion is the transmission efficiency (TE). This paper examines the TE benefit of using the HPS rather than the PST.
METHODOLOGY
A modified IEEE-14 bus system [3] with 11.08% penetration level is used, and shutdown of 26 MW of the wind farm is simulated. The line loading performance index PIp [4] is used to check power flow security. A PST or an HPS is located at the congested transformer and managed to inject a lagging voltage that reduces the flow, and the TE is investigated.
RESULTS AND DISCUSSION
Fig. 1 shows the active power flow in transformer (5-6) in the base case, the shutdown case pre, and post the PST/HPS action. It is evident that the large steps of the PST (each step = 3kV) caused a large jump in the flow. Conversely, the HPS enables a smooth control of the flow. With the HPS, it is obvious that the flow can be maintained closer to the limits with a security margin kept. Value of the PIp is 0.45 in the base case
and 1031.6 when the shutdown occurs. Two steps of the PST (6 kV) and an operating point of 3.4 kV of the HPS are needed to secure the transformer’s flow. The resulting value of the PIp is 9.6X10⁻⁴, and 0.68 respectively. Fig. 2 shows the TE with a PST/HPS. It is obvious that the TE is higher when an HPS is used as compared to when a conventional PST is used.
Figure 1: Trans. (5-6) flow Figure 2: The TE with a PST/HPS
CONCLUSIONS
As the congestion that is caused by wind farm dynamics occurs often and may last for long time, the TE is vital. This paper has compared the TE when relievig the congestion by a PST/HPS interchangeably. It is found that, while the PST has limited operating points and may not ensure the highest TE, the precise action of the HPS always enables attaining a higher TE.
REFERENCES
[1] J. Kejun, H. Xiulian, Z. Xing, and L. Qiang, “China′s Low-carbon Scenarios and Roadmap for 2050[J],” Sino-Global Energy, Vol. 6, no. 6, pp. 21-26, 2009.
[2] H. Daneshi and A. K. Srivastava, “Impact of battery energy storage on power system with high wind penetration,” In Proc. 2012 Transmission and Distribution Conference and Exposition, pp. 1-8.
[3] S. Gasim Mohamed, J. Jasni, M. A. M. Radzi, and H. Hizam, “Enhancement of Environment-Friendly Power Grids’ Flexibility to Successfully Host RESs and EVs”, Accepted, Joint International Conference on Electrical, Control, and Computer Engineering 2015, (InECCE 2015), 27-28 October, Universiti Malaysia Pahang, Pekan, Pahang, Malaysia.
[4] B. Fox, D. Flynn and L. Bryans, Wind Power Integration: Connection and system operational aspects, 2nd Edition, IET, 2014.
57
P0036
57
P0036
57
P0036
57
P0036
57
P0036
57
P0036
57
P0036
57
P0036

Extended Abstract for 2016 MyHVnet Colloquium
APPLICATION OF NEURAL-FUZZY NETWORK ON DETERMINATION OF TRANSFORMERS HEALTH INDEX
E. J. Kadim 1,*, N. Azis1, J. Jasni1, S. A. Ahmad1, M. Z. A. Ab Kadir1, and M. A. Talib2 1Centre for Electromagnetic & Lightning Protection, Universiti Putra Malaysia, 43300 Serdang, Selangor, Malaysia.
2TNB Research Sdn Bhd, 43300 Kajang, Selangor, Malaysia.
Abstract – In this paper, an assessment of transformers
Health Index (HI) based on Neural-Fuzzy (NF) network is presented. The condition parameters used for this study were dissolved gases, furanic compounds and oil quality. These data were obtained from previous literature and used for both training and testing. Three different ranges of testing and training were used. A comparison was carried out with the utility HI obtained from previous study. It is found that the percentage of matching HI increases as the training data increases. Keywords – Health Index, Transformers Condition, Neural Fuzzy network.
INTRODUCTION There are a few studies that have been carried out to
implement artificial intelligence for determination of transformers HI. One of the study implemented fuzzy logic system to determine the HI transformers at voltage level of 69 kV and below [1]. In this system, 6 membership function and 33 rules were used for defuzzification process [1]. Other fuzzy system study used the fuzzy support vector machine to determine the HI of transformers [2]. A study was also carried out to implement artificial neural network to determine HI [3]. Feed forward topology with four layers and 11 input data which include oil quality parameters and combustible gases were used. This study used 59 for training and 29 for testing [3].
METHODOLOGY
The ANFIS toolbox in MATLAB is used to carry out
the network. Three different ranges were used in this study which were (60% training - 40% testing), (70% training - 30% testing), and (80% training - 20% testing). The HI obtained from the NF network is then compared with the utilities HI.
RESULTS AND DISCUSSION
The best result obtained from NF network is from the
combination of (80% training - 20% testing). The training error was less than 0.1% after 5 epochs, and the testing error was 15%. The percentage of matched result based on this combination is 85%. Fig. 1 shows the comparison of the three ranges output.
Figure 1: Comparison of three ranges output.
CONCLUSIONS
In this study, an initial study to implement NF network to determine transformers HI is presented. It is found that as the training data is increased, the percentage of matching HI is increased. Further study will be carried out to examine under different data obtained from other utilities.
ACKNOWLEDGEMENTS
The authors would like to thank Ministry of Education and Universiti Putra Malaysia for the funding under FRGS and PUTRA grant schemes.
REFERENCES
[1] A. E. B. Abu-Elanien, M. M. A. Salama, and M. Ibrahim, "Calculation of a Health Index for Oil-Immersed Transformers Rated Under 69 kV Using Fuzzy Logic," Power Delivery, IEEE Transactions on, vol. 27, pp. 2029-2036, 2012.
[2] A. D. Ashkezari, M. Hui, T. K. Saha, and C. Ekanayake, "Application of fuzzy support vector machine for determining the health index of the insulation system of in-service power transformers," Dielectrics and Electrical Insulation, IEEE Transactions on, vol. 20, pp. 965-973, 2013.
[3] A. E. B. Abu-Elanien, M. M. A. Salama, and M. Ibrahim, "Determination of transformer health condition using artificial neural networks," in Innovations in Intelligent Systems and Applications (INISTA), 2011 International Symposium on, 2011, pp. 1-5.
0%
20%
40%
60%
80%
100%
40%-60% 30%-70% 20%-80%Pe
rcen
tage
of M
atch
ed O
utpu
tRanges of Testing and Training Data
Matched Output Unmatched Output
58
P0037
58
P0037
58
P0037
58
P0037
58
P0037
58
P0037
58
P0037
58
P0037
OPTIMAL ESTIMATION OF DISTRIBUTED GENERATION LOCATION
Z. Abdulkareem, W. F. H., Wan Ahmad, J. Jasni, N. I. Abdul Wahab Centre of Electromagnetic and Lighting Protection Research (CELP),
Department of Electrical and Electronic Engineering, Faculty of Engineering, Universiti Putra Malaysia, 43400 UPM Serdang, Selangor, Malaysia
Email: [email protected]
ABSTRACT Renewable DG has received a lot of interest as a result of their various benefits. The advantages of DG include environmental protection and enhancement of reliability, safety and stability that make it as the most critical item on Smart Grid. The site and size of DGs play the main crucial role of their positive and negative effects on smart grid. The collected data from smart grid system will be used to find an algorithm to determine the best location of DG. The expected outcome will be improvement in reliability, security, and efficiency of the power system. Beside reduction in losses, dropping in the peak of demand and greenhouse gas emission that are representing the clear undesirable effects of using the main primary sources to generate electricity power.
I. INTRODUCTION
The future grid will bring smaller Distributed Generations (DGs) into the grid and the grid should be more flexible to any changes from the renewable sources in the system .The renewable resources are expected to be integrated at any location in the grid. One of the main incentives for smart grids is to enhance the reliability of the power system by integrating small-scale resources, renewable sources, and reconfiguring the distribution system to be a unidirectional network. The complexity of the future distribution systems will require enhanced techniques to evaluate the reliability and minimize the frequency and duration of the outages. Several studies discussed the effect of the DG in the load and system reliability indices [1, 2]. Furthermore, the widespread use of DG will force the distribution system to become bidirectional, thereby creating more challenges in designing and operating the system [3]. (DG) provides many advantages in term of improvements in losses, reliability, or both. In addition, there are many DGs locations that can lead to minimize fault current in the event of faults and provide the necessary control to solve problems [4, 5].
II. METHODOLGY
The distribution power system traditionally designed for radial power flow. However, with the introduction
of DG, the power flow becomes bidirectional. As a result, conventional power analysis tools and techniques are not able to properly assess the impact of DG on the electrical system. This is due to the presence of DG on the distribution system creates problems related to safety, protection, reliability, and security of the electrical system. Moreover, DG affects the voltages, short circuit currents and losses. Also, DG effects on the power distributed system that are depend on its location and size.
Hence, it is our aim to investigate the behaviour of a practical test case from Malaysian power systems. And to simulate a flexible and accurate method for estimating the optimal DG location based on practical data in the Smart Grid. Also, to compare with other previous works in terms of reliability, complexity, size, stability and to report best practice.
Data on DG and Smart Grid obtained from several locations in Selangor, Focusing the low voltage power system will be used in a simulation to estimate the optimal location by using Matlab. These results are evaluated by comparing with previous similar works.
REFERENCES
[1] P. M. Costa, M. A. Matos, “Reliability of distribution networks with microgrids,” IEEE in Power Tech, Russia, pp. 1-7,2005. [2] I. S. Bae and J. O. Kim, “Reliability
evaluation of customers in a microgrid,” IEEE Trans. Power Syst., vol. 23, no. 3, pp. 1416–1422, 2008.
[3] Eduardo, S. G. Di Santo, and M. A. Saidel,
“A review on smart grids and experiences in Brazil,” Renew. Sustain. Energy Rev., vol. 52, pp. 1072–1082, 2015.
[4] M. Kumawat, “Distributed Networks : A
Review,” 2015. [5] S. N. Singh and N. Jain, “Distributed Generation in Power Systems : An Overview and,” 24rth Indian Eng. Congr., 2009
59
P0038Extended Abstract for 2016 MyHVnet Colloquium
59
P0038
59
P0038
59
P0038
59
P0038
59
P0038
59
P0038
59
P0038_____________________________________________________________________
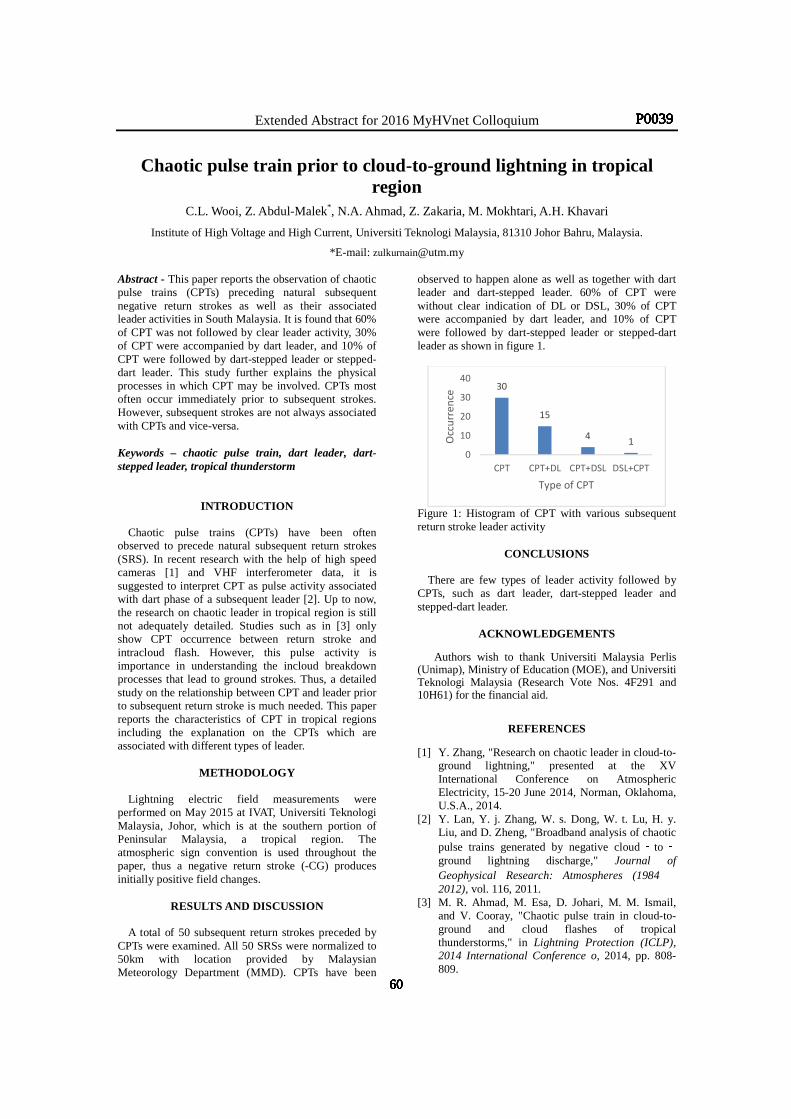
Extended Abstract for 2016 MyHVnet Colloquium
Chaotic pulse train prior to cloud-to-ground lightning in tropical region
C.L. Wooi, Z. Abdul-Malek*, N.A. Ahmad, Z. Zakaria, M. Mokhtari, A.H. Khavari
Institute of High Voltage and High Current, Universiti Teknologi Malaysia, 81310 Johor Bahru, Malaysia.
*E-mail: [email protected] Abstract - This paper reports the observation of chaotic pulse trains (CPTs) preceding natural subsequent negative return strokes as well as their associated leader activities in South Malaysia. It is found that 60% of CPT was not followed by clear leader activity, 30% of CPT were accompanied by dart leader, and 10% of CPT were followed by dart-stepped leader or stepped-dart leader. This study further explains the physical processes in which CPT may be involved. CPTs most often occur immediately prior to subsequent strokes. However, subsequent strokes are not always associated with CPTs and vice-versa.
Keywords – chaotic pulse train, dart leader, dart-stepped leader, tropical thunderstorm
INTRODUCTION
Chaotic pulse trains (CPTs) have been often observed to precede natural subsequent return strokes (SRS). In recent research with the help of high speed cameras [1] and VHF interferometer data, it is suggested to interpret CPT as pulse activity associated with dart phase of a subsequent leader [2]. Up to now, the research on chaotic leader in tropical region is still not adequately detailed. Studies such as in [3] only show CPT occurrence between return stroke and intracloud flash. However, this pulse activity is importance in understanding the incloud breakdown processes that lead to ground strokes. Thus, a detailed study on the relationship between CPT and leader prior to subsequent return stroke is much needed. This paper reports the characteristics of CPT in tropical regions including the explanation on the CPTs which are associated with different types of leader.
METHODOLOGY
Lightning electric field measurements were
performed on May 2015 at IVAT, Universiti Teknologi Malaysia, Johor, which is at the southern portion of Peninsular Malaysia, a tropical region. The atmospheric sign convention is used throughout the paper, thus a negative return stroke (-CG) produces initially positive field changes.
RESULTS AND DISCUSSION
A total of 50 subsequent return strokes preceded by CPTs were examined. All 50 SRSs were normalized to 50km with location provided by Malaysian Meteorology Department (MMD). CPTs have been
observed to happen alone as well as together with dart leader and dart-stepped leader. 60% of CPT were without clear indication of DL or DSL, 30% of CPT were accompanied by dart leader, and 10% of CPT were followed by dart-stepped leader or stepped-dart leader as shown in figure 1.
Figure 1: Histogram of CPT with various subsequent return stroke leader activity
CONCLUSIONS
There are few types of leader activity followed by CPTs, such as dart leader, dart-stepped leader and stepped-dart leader.
ACKNOWLEDGEMENTS
Authors wish to thank Universiti Malaysia Perlis
(Unimap), Ministry of Education (MOE), and Universiti Teknologi Malaysia (Research Vote Nos. 4F291 and 10H61) for the financial aid.
REFERENCES
[1] Y. Zhang, "Research on chaotic leader in cloud-to-
ground lightning," presented at the XV International Conference on Atmospheric Electricity, 15-20 June 2014, Norman, Oklahoma, U.S.A., 2014.
[2] Y. Lan, Y. j. Zhang, W. s. Dong, W. t. Lu, H. y. Liu, and D. Zheng, "Broadband analysis of chaotic pulse trains generated by negative cloud toground lightning discharge," Journal of Geophysical Research: Atmospheres (19842012), vol. 116, 2011.
[3] M. R. Ahmad, M. Esa, D. Johari, M. M. Ismail, and V. Cooray, "Chaotic pulse train in cloud-to-ground and cloud flashes of tropical thunderstorms," in Lightning Protection (ICLP), 2014 International Conference o, 2014, pp. 808-809.
30
15
4 10
10
20
30
40
CPT CPT+DL CPT+DSL DSL+CPT
Occ
urre
nce
Type of CPT
60
P0039
60
P0039
60
P0039
60
P0039
60
P0039
60
P0039
60
P0039
60
P0039
Extended Abstract for 2016 MyHVnet Colloquium
LABORATORY TEST OF THE DEVELOPED NEW VOLTAGE IMPULSE TRANSDUCER
M. F. Hussin Electrical Section, Universiti Kuala Lumpur, 53100 Gombak, Selangor, Malaysia.
*E-mail: [email protected] Abstract – A voltage transducer is developed in this work. The transducer principle is adopted from capacitive divider measurment technique and utilised the distribution of electric field around overhead line conductor. Laboratory tests are carried out to study the transducer characteristics and performance, ensuring the practicallity of the transducer prior intsalling it in the real overhead line enviroment. Low magnitude impulse voltages are used to evaluate the trasnducer and low magnitude ac voltages are used to corroborate the results acquired from the impulse tests. Keywords – Voltage transducer, Impulse, Overhead Line, Faults
INTRODUCTION
A common practice adopted for fault location on the overhead line (OHL) is isolation and trial re-closure of the suspected faulted lines [1]. This practice is time consuming and also over stressing the line which could subsequently lead to additional failure of the high voltage system. In this work a voltage transducer is developed for faults monitoring on the OHL that is capable of measuring different types of voltages such as impulse and ac voltages. The novelty of this developed trasnducer is connected to the HV line instead of the ground.
LABORATORY TEST SETUP The laboratory test setup was based on a single
phase overhead line configuration. Figure 1 shows the the schematic diagram of the test setup using the develeoped transducer. The tests were caaried out by inserting capacitor (Ci) between the HV conductor and the sensing probe and the optical fibre system is used to transmit the output data.
Figure 1: The schematic test setup.
RESULTS AND DISCUSSION
Figure 2 and Figure 3 show the measured output voltages obtained from the developed trasnducer for low magnitude impulse and ac voltage tests. The Ci value inserted in the trasnducer is 10nF. A good correspondence of voltage shapes can be obsrved for both impulse and ac voltage measurement. This demonstrates the suitability of the developed trasnducer for measurments of different types of voltages.
Figure 2: Output voltage from impulse test.
Figure 3: Output voltage from ac test.
CONCLUSIONS
The tests conducted using the developed trasnducer
demonstrate that the amplitudes of the output voltages remained the same regardless of whether impulse or ac voltages are applied to the test setup.
REFERENCES
[1] J.H. Evans, “Overhead Line Fault Current
Indicators- Are They Cost Effective”, IEE Colloquium on Improving Supply security on 11kV Overhead Networks, London, UK, pp. 14/1-14/5, 22 May 1990.
61
P0040
61
P0040
61
P0040
61
P0040
61
P0040
61
P0040
61
P0040
61
P0040

Extended Abstract for 2016 MyHVnet Colloquium
SIMULATION STUDY ON BREAKDOWN PROCESS IN GIS LOW PRESURE CHAMBER USING SF6/N2 GAS INSULATION N. F. Kasri1,*, M.N.Khaidir2*, Harriezan Ahmad2*, N.A. Muhamad1*, M. Afendi M. Piah1*
1Institute of High Voltage and High Current, Universiti Teknologi Malaysia, 81310 Johor Bahru, Malaysia. 2TNB Research Sdn Bhd, No 1 Lorong Ayer Hitam, Kawasan Institusi Penyelidikan, 43000 Kajang, Selangor.
*E-mail: [email protected]; [email protected]; [email protected]; [email protected]; [email protected]
Abstract - The study on Gas Insulated Switchgear (GIS) is still unfinished due to the lack of information of the gas properties itself which is sulphur hexafluoride, SF6 mainly. Due to the green house effect caused by SF6, gas mixing methods is used. Nitrogen, N2 come in the picture with the hope of reducing it and maintain the properties at least 90% of the pure SF6. This paper is focusing on the low pressure GIS chamber simulation using COMSOL Multiphysics software. The aim is to simulate the breakdown process of the mix gas SF6/N2 in the ratio of 10:90.
Keywords – arc quenching and insulation, gas mixture, GIS, low pressure chamber, SF6/N2 mixture
INTRODUCTION
The idea of mix gas used in GIS is not a new approaches in order to replace pure SF6 gas. The reason is SF6 promote global warming that can caused a lot of problem to the nature [1]. To preserve the properties of pure SF6 which can quench the arc and good insulation, a mix with N2 is considered.
The study of SF6/N2 mixtures may result in perfect substitution for pure SF6 in GIS. The result shows that the gas mixtures obtain analogous insulation and arc interruption in the ratio of 90% of N2 – 10% of SF6 [2]. The pressure play an important role, as study has shown that the higher the pressure, the higher voltage it can withstands before breakdown [3].
METHODOLOGY The simulation is raplicating the practical work
that has been done in Tenaga Nasional Berhad Research (TNBR). Low pressure GIS chamber is used and combination of SF6/N2 is inserted in the chamber as an insulation medium.
The platform to run the simulation is done in the COMSOL Multiphysic software. The geometry of the chamber is draw as close as possible to the actual GIS cahmber by using Autodesk Inventor.
The voltage supply is set to 7kV on the left electrode while the middle is supply with 6kV and the right electrode is grounded to complete the circuit.
RESULTS AND DISCUSSION
The simulation result shows that the voltage distribution in GIS chamber but focus on the electrode
part only. The estimation area that will occur breakdown is determined by observing the changes in the electric field represented by the different colour. Figure 1 shows the voltage distribution in GIS chamber.
Figure 1: Voltage distribution in GIS chamber.
CONCLUSIONS
This study is an attempt to understand the
breakdown process by observing the voltage and electric field distribution in the chamber. However, it is just an early stage to conclude the actual phenomenon.
ACKNOWLEDGEMENTS
This research is sponsored by Akaun Amanah Industri Bekalan Elektrik (AAIBE) and it is done by TNB Research Sdn. Bhd and Universiti Teknologi Malaysia (UTM).
REFERENCES
[1] W. Boeck, T. Blackburn, and A. Cookson, "N2/SF6 mixtures for gas insulated systems," ELECTRA, 2004.
[2] W. Sima, J. Shi, and Q. Yang, "SURFACE DISCHARGE SIMULATION IN SF 6 AND N 2 MIXTURES WITH A PLASMACHEMICAL MODEL," Surface Review and Letters, vol. 21, p. 1450010, 2014.
[3] Y. Hoshina, M. Sato, H. Murase, M. Toyada, and A. Kobayashi, "Dielectric properties of SF6/N2 gas mixtures on a full scale model of the gas-insulated busbar," in Power Engineering Society Winter Meeting, 2000. IEEE, 2000, pp. 2129-2134
62
P0041
62
P0041
62
P0041
62
P0041
62
P0041
62
P0041
62
P0041
62
P0041

Extended Abstract for 2016 MyHVnet Colloquium
FORMATION OF FULGURITE-LIKE STRUCTURES UNDER HV CONDITIONS: WITH SPECIAL ATTENTION TO THE EFFECTS
ON ELECTRICAL EARTHING SYSTEM
Zulkifli bin Burhanuddin, Chandima Gomes*, M Z K Zainal Ab Kadir and Norhafiz Aziz
Centre for Electromagnetics and Lightning Protection, Universiti Putra Malaysia, 43400, Selangor, Malaysia.
*E-mail: [email protected] Abstract - Fulgurites are natural tubes of glass formed by the fusion of silica sand or rock from a lightning strike. The fulgurites have been produced artificially in HV conditions in the past. Recent studies have found that fulguritic structures can be formed in some other materials, such as bentonite and cement, as well. These fulgurites can change the overall physical and electrical properties of the original materials. Thus, formation of fulgurites can modify the performance of electrical earthing systems, both ordinary and those improvised with backfill materials. This study investigates the fulgurite formation under alternating, direct and impulse current application. Bentonite and sand were tested under high voltage conditions. The type of fulgurites and their effects on electrical earthing systems were studied by analyzing the resistivity and permittivity of original materials and fulgurites. It has been found that fulgurites formation has a severe effect on the earth resistance of grounding systems.
Keywords – Fulgurites, bentonite, resistivity, high voltage, impulse current
INTRODUCTION
In the recent years, laboratory experiments done for some other purposes have revealed that fulgurite-like formation is possible in materials other than sand under the application of high voltage waveforms. The most prominent observation of the formation of fulgurite has been reported during the AC testing for sand and bentonite and the researchers have attributed such to the material ionization at high temperatures of backfill materials. It has been envisaged with physical appearance that fulgurites may have physical and electrical properties different to those of their original materials. If it is such, then the fulgurite formation may significantly alter the performance of earthing systems, both buried in soil and encased in backfill materials. This study looks into this aspect in detail.
METHODOLOGY A 10-cm layaer of sand, bentonite and a mixture of
the two were sepeartely applied alternating voltage (AV), direct voltage (DV) and impulse voltage by AC, DC and Marx generators respectively. The materials were kept in a perspex container with aluminium plate that acts as the ground electrode, placed at the botom of the container. HV has been applied in a rod-palne
configuration. Temperature of the material surface has been measured immediately after the application of HV. The original material and the powdered form of the obtained fulgurites have been tested for their resistivity and permittivity.
RESULTS AND DISCUSSION
Fulgurites were formed in all three materials in the application of DV and only in few cases in the application of AV. No such formation was found under impulse conditions. Fulgurite formed have significantly different electrical properties compared with their original material. The formation of fulgurites and surface temperature at the end of the application of HV has a positive correlation.
Figure 1: Fulgurites formed in bentonite.
CONCLUSIONS
Artificail fulgurites are formed in sand, bentonite and their mixtures under the application of direct and alternative high voltage. Their electrical properties are significantly different from those of repective original materials.
REFERENCES
[1] S. C. Lim, C. Gomes, M. Z. A Ab. Kadir,
“Characterizing of Bentonite with Chemical, Physical and Electrical Perspectives for Improvement of Electrical Grounding Systems”, International Journal of Electrochemical Science, Vol. 8, pp. 11429 – 11447, 2013
63
P0042
63
P0042
63
P0042
63
P0042
63
P0042
63
P0042
63
P0042
63
P0042
Extended Abstract for 2016 MyHVnet Colloquium
EFFECT OF GROUND REFLECTION FACTOR ON THE LIGHTNING CURRENT ALONG A TALL STRUCTURE
N.Rameli1,*, M.Z.A Ab.Kadir2, M.Izadi2, Chandima Gomes2 and N.Azis2 1Centre for Electromagnetic and Lightning Protection Research (CELP), Department of Electrical and Electronic
Engineering,Faculty of Engineering, Universiti Putra Malaysia, 43400, UPM Serdang, Selangor, Malaysia. 2University Putra Malaysia
*E-mail: [email protected] Abstract - A direct lightning strike on a tall structure may result in damage to the equipment that is installed along the structure. This is due by the behaviour of lightning current value and wave shape along the structure. One parameter that may influence this behaviour is grounded reflection factor. Previous studies have assumed that the ground reflection factor is a constant value. However, this factor depends on the correlation between the tower and ground impedance. A modelling of lightning striking to a tall structure was done by considering on the Engineering model. The result indicates that the attenuation and multiple peak of current along the structure are generated for the differences of ground reflection factors. Thus, the results of this paper may be of benefit setting an appropriate protection level when considering the installation of such telecommunication towers. Keywords – lightning, tall structure, ground reflection factor, ground impedance, soil resistivity
INTRODUCTION
Lightning is a common phenomenon that occurs in the atmosphere. According to [1], tall structure may expose to frequent of lightning strike that may contribute to physical damage to structures. Such a strike, phenomena of propagation of lightning current along the structure and channel will create whereby the values of current and wave shape are different. The differences of these are mostly influenced by the effect of ground reflection factor (GRF) [2]. This reflection factor relies on the correlation between the ground and tower impedance whereby the ground impedances are dependent on the effect of soil resistivity. Thus, the GRF can be appropriately generated based on the soil resistivity effect of the tall structure, by means that most of the previous study was used these factors in constant value[3]. Therefore, the aim of this paper is to consider the effect of GRF on the lightning current along a tall structure.
METHODOLOGY
A modelling of lightning current of the tall structure was done with consideration of engineering model that expressed in Eq (1) [4].
!(#$, &) = (1 − +,) ∑ .+,/+0/!1 2ℎ, & − 45678 − 9/4
8 : +</=>
+,/+0/? !1 2ℎ, & − 4?678 − 9/4
8 :! (1)
Where:+, and +0 are the top and ground current reflection respectively, " is the number of reflection current,ℎ is the tower height, # is the speed of light, $ is the return stroke speed and P(z$ − h) is for the engineering current model.
RESULTS AND DISCUSSION
Figure 1 shows the difference of lightning current wave shape along the structure with respect to variation of ground reflection factors. An attenuation peak of the current at a positive GRF value is generated and it is quickly dissipated for GRF with negative sign value. Thus, this significant behaviour is important when considering the installation of equipment such as cables and antenna along the length of the structure.
Figure 1: Lightning current along the structure at the difference of GRF.
CONCLUSIONS
The variation of GRF has an effect on the peak and wave shape of lightning current along the structure. An attenuation peak is generated for different value of GRF. Thus, it is indicated that the variation of GRF value needs to be considered for the protection schemes of a structure when installing equipment along the structure.
REFERENCES [1] V. Cooray, An Introduction to Lightning: Springer, 2015. [2] J. Bermudez, et al., "Determination of reflection coefficients at the top
and bottom of elevated strike objects struck by lightning," Journal of Geophysical Research: Atmospheres (1984–2012), vol. 108, 2003.
[3] I. Boev and W. Janischewskyj, "Determination of current within the lightning path in the case of lightning to a tall object," Electromagnetic Compatibility, IEEE Transactions on, vol. 53, pp. 131-139, 2011.
[4] F. Rachidi, et al., "Effect of vertically extended strike object on the distribution of current along the lightning channel," Journal of Geophysical Research: Atmospheres (1984–2012), vol. 107, pp. ACL 16-1-ACL 16-6, 2002.
0 0.1 0.2 0.3 0.4 0.5 0.6 0.7 0.8 0.9 1
x 10-5
0
5
10
15
20
25
30
Time (second)
Cur
rent
(kA
)
GRF1=0.9622GRF2=0.9024
GRF3=0.8461
GRF4=-0.1239
GRF5=-0.7303GRF6=-0.8554
64
P0043
64
P0043
64
P0043
64
P0043
64
P0043
64
P0043
64
P0043
64
P0043
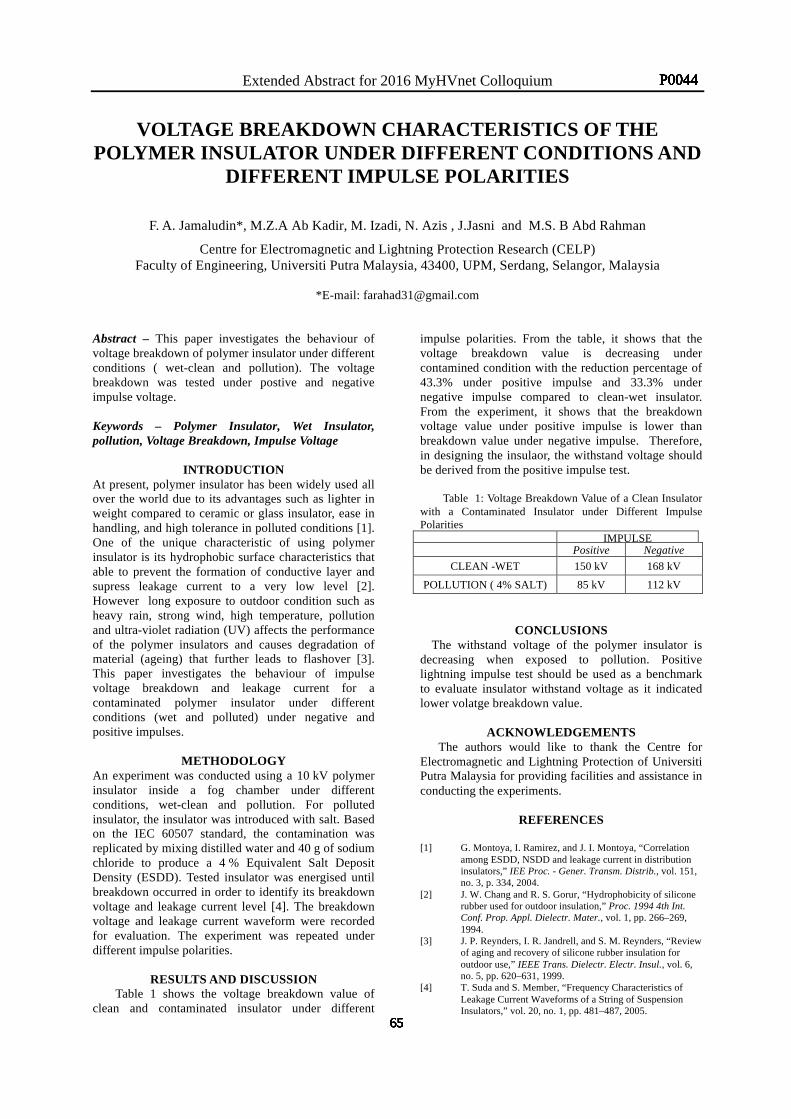
Extended Abstract for 2016 MyHVnet Colloquium
VOLTAGE BREAKDOWN CHARACTERISTICS OF THE POLYMER INSULATOR UNDER DIFFERENT CONDITIONS AND
DIFFERENT IMPULSE POLARITIES
F. A. Jamaludin*, M.Z.A Ab Kadir, M. Izadi, N. Azis , J.Jasni and M.S. B Abd Rahman
Centre for Electromagnetic and Lightning Protection Research (CELP) Faculty of Engineering, Universiti Putra Malaysia, 43400, UPM, Serdang, Selangor, Malaysia
*E-mail: [email protected]
Abstract – This paper investigates the behaviour of voltage breakdown of polymer insulator under different conditions ( wet-clean and pollution). The voltage breakdown was tested under postive and negative impulse voltage.
Keywords – Polymer Insulator, Wet Insulator, pollution, Voltage Breakdown, Impulse Voltage
INTRODUCTION At present, polymer insulator has been widely used all over the world due to its advantages such as lighter in weight compared to ceramic or glass insulator, ease in handling, and high tolerance in polluted conditions [1]. One of the unique characteristic of using polymer insulator is its hydrophobic surface characteristics that able to prevent the formation of conductive layer and supress leakage current to a very low level [2]. However long exposure to outdoor condition such as heavy rain, strong wind, high temperature, pollution and ultra-violet radiation (UV) affects the performance of the polymer insulators and causes degradation of material (ageing) that further leads to flashover [3]. This paper investigates the behaviour of impulse voltage breakdown and leakage current for a contaminated polymer insulator under different conditions (wet and polluted) under negative and positive impulses.
METHODOLOGY An experiment was conducted using a 10 kV polymer insulator inside a fog chamber under different conditions, wet-clean and pollution. For polluted insulator, the insulator was introduced with salt. Based on the IEC 60507 standard, the contamination was replicated by mixing distilled water and 40 g of sodium chloride to produce a 4 % Equivalent Salt Deposit Density (ESDD). Tested insulator was energised until breakdown occurred in order to identify its breakdown voltage and leakage current level [4]. The breakdown voltage and leakage current waveform were recorded for evaluation. The experiment was repeated under different impulse polarities.
RESULTS AND DISCUSSION Table 1 shows the voltage breakdown value of
clean and contaminated insulator under different
impulse polarities. From the table, it shows that the voltage breakdown value is decreasing under contamined condition with the reduction percentage of 43.3% under positive impulse and 33.3% under negative impulse compared to clean-wet insulator. From the experiment, it shows that the breakdown voltage value under positive impulse is lower than breakdown value under negative impulse. Therefore, in designing the insulaor, the withstand voltage should be derived from the positive impulse test.
Table 1: Voltage Breakdown Value of a Clean Insulator
with a Contaminated Insulator under Different Impulse Polarities
IMPULSE Positive Negative
CLEAN -WET 150 kV 168 kV
POLLUTION ( 4% SALT) 85 kV 112 kV
CONCLUSIONS The withstand voltage of the polymer insulator is
decreasing when exposed to pollution. Positive lightning impulse test should be used as a benchmark to evaluate insulator withstand voltage as it indicated lower volatge breakdown value.
ACKNOWLEDGEMENTS
The authors would like to thank the Centre for Electromagnetic and Lightning Protection of Universiti Putra Malaysia for providing facilities and assistance in conducting the experiments.
REFERENCES
[1] G. Montoya, I. Ramirez, and J. I. Montoya, “Correlation among ESDD, NSDD and leakage current in distribution insulators,” IEE Proc. - Gener. Transm. Distrib., vol. 151, no. 3, p. 334, 2004.
[2] J. W. Chang and R. S. Gorur, “Hydrophobicity of silicone rubber used for outdoor insulation,” Proc. 1994 4th Int. Conf. Prop. Appl. Dielectr. Mater., vol. 1, pp. 266–269, 1994.
[3] J. P. Reynders, I. R. Jandrell, and S. M. Reynders, “Review of aging and recovery of silicone rubber insulation for outdoor use,” IEEE Trans. Dielectr. Electr. Insul., vol. 6, no. 5, pp. 620–631, 1999.
[4] T. Suda and S. Member, “Frequency Characteristics of Leakage Current Waveforms of a String of Suspension Insulators,” vol. 20, no. 1, pp. 481–487, 2005.
65
P0044
65
P0044
65
P0044
65
P0044
65
P0044
65
P0044
65
P0044
65
P0044
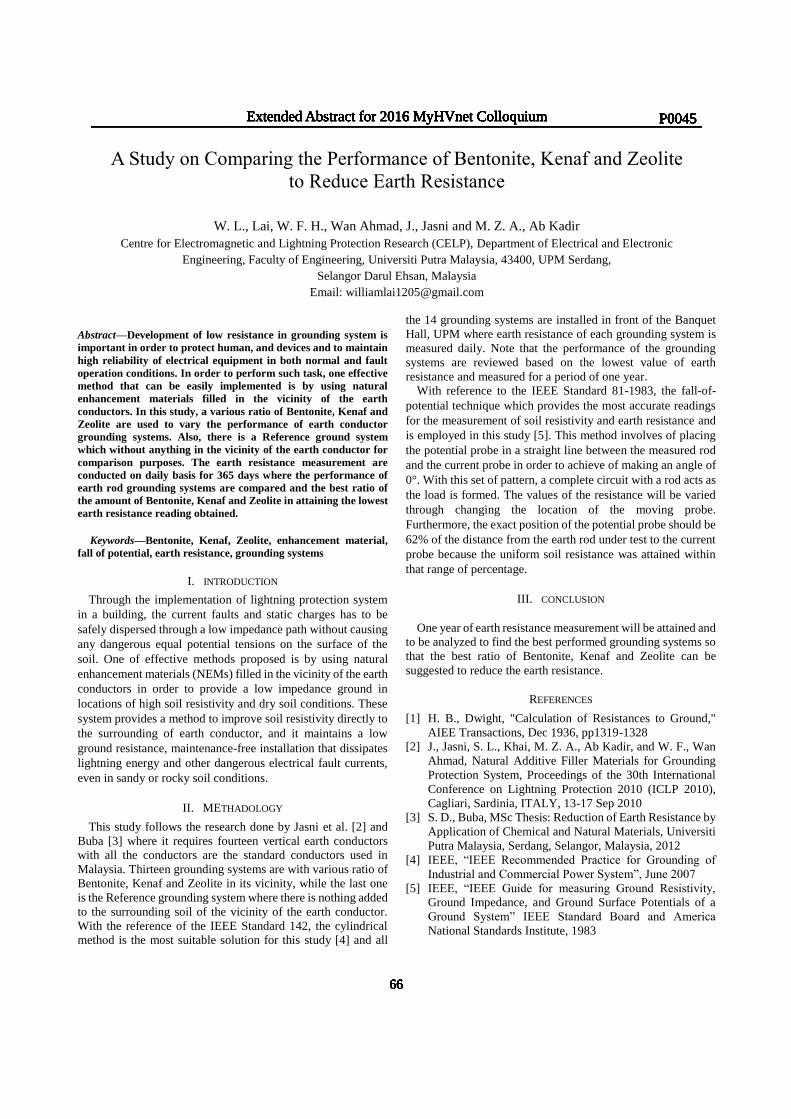
Abstract—Development of low resistance in grounding system is important in order to protect human, and devices and to maintain high reliability of electrical equipment in both normal and fault operation conditions. In order to perform such task, one effective method that can be easily implemented is by using natural enhancement materials filled in the vicinity of the earth conductors. In this study, a various ratio of Bentonite, Kenaf and Zeolite are used to vary the performance of earth conductor grounding systems. Also, there is a Reference ground system which without anything in the vicinity of the earth conductor for comparison purposes. The earth resistance measurement are conducted on daily basis for 365 days where the performance of earth rod grounding systems are compared and the best ratio of the amount of Bentonite, Kenaf and Zeolite in attaining the lowest earth resistance reading obtained.
Keywords—Bentonite, Kenaf, Zeolite, enhancement material, fall of potential, earth resistance, grounding systems
I. INTRODUCTION
Through the implementation of lightning protection system in a building, the current faults and static charges has to be safely dispersed through a low impedance path without causing any dangerous equal potential tensions on the surface of the soil. One of effective methods proposed is by using natural enhancement materials (NEMs) filled in the vicinity of the earth conductors in order to provide a low impedance ground in locations of high soil resistivity and dry soil conditions. These system provides a method to improve soil resistivity directly to the surrounding of earth conductor, and it maintains a low ground resistance, maintenance-free installation that dissipates lightning energy and other dangerous electrical fault currents, even in sandy or rocky soil conditions.
II. METHADOLOGY
This study follows the research done by Jasni et al. [2] and Buba [3] where it requires fourteen vertical earth conductors with all the conductors are the standard conductors used in Malaysia. Thirteen grounding systems are with various ratio of Bentonite, Kenaf and Zeolite in its vicinity, while the last one is the Reference grounding system where there is nothing added to the surrounding soil of the vicinity of the earth conductor. With the reference of the IEEE Standard 142, the cylindrical method is the most suitable solution for this study [4] and all
the 14 grounding systems are installed in front of the Banquet Hall, UPM where earth resistance of each grounding system is measured daily. Note that the performance of the grounding systems are reviewed based on the lowest value of earth resistance and measured for a period of one year.
With reference to the IEEE Standard 81-1983, the fall-of-potential technique which provides the most accurate readings for the measurement of soil resistivity and earth resistance and is employed in this study [5]. This method involves of placing the potential probe in a straight line between the measured rod and the current probe in order to achieve of making an angle of 0°. With this set of pattern, a complete circuit with a rod acts as the load is formed. The values of the resistance will be varied through changing the location of the moving probe. Furthermore, the exact position of the potential probe should be 62% of the distance from the earth rod under test to the current probe because the uniform soil resistance was attained within that range of percentage.
III. CONCLUSION
One year of earth resistance measurement will be attained and to be analyzed to find the best performed grounding systems so that the best ratio of Bentonite, Kenaf and Zeolite can be suggested to reduce the earth resistance.
REFERENCES
[1] H. B., Dwight, "Calculation of Resistances to Ground," AIEE Transactions, Dec 1936, pp1319-1328
[2] J., Jasni, S. L., Khai, M. Z. A., Ab Kadir, and W. F., Wan Ahmad, Natural Additive Filler Materials for Grounding Protection System, Proceedings of the 30th International Conference on Lightning Protection 2010 (ICLP 2010), Cagliari, Sardinia, ITALY, 13-17 Sep 2010
[3] S. D., Buba, MSc Thesis: Reduction of Earth Resistance by Application of Chemical and Natural Materials, Universiti Putra Malaysia, Serdang, Selangor, Malaysia, 2012
[4] IEEE, “IEEE Recommended Practice for Grounding of Industrial and Commercial Power System”, June 2007
[5] IEEE, “IEEE Guide for measuring Ground Resistivity, Ground Impedance, and Ground Surface Potentials of a Ground System” IEEE Standard Board and America National Standards Institute, 1983
A Study on Comparing the Performance of Bentonite, Kenaf and Zeolite to Reduce Earth Resistance
W. L., Lai, W. F. H., Wan Ahmad, J., Jasni and M. Z. A., Ab Kadir Centre for Electromagnetic and Lightning Protection Research (CELP), Department of Electrical and Electronic
Engineering, Faculty of Engineering, Universiti Putra Malaysia, 43400, UPM Serdang, Selangor Darul Ehsan, Malaysia
Email: [email protected]
Extended Abstract for 2016 MyHVnet Colloquium_____________________________________________________________________
66
P0045Extended Abstract for 2016 MyHVnet Colloquium_____________________________________________________________________
66
P0045Extended Abstract for 2016 MyHVnet Colloquium_____________________________________________________________________
66
P0045Extended Abstract for 2016 MyHVnet Colloquium_____________________________________________________________________
66
P0045Extended Abstract for 2016 MyHVnet Colloquium_____________________________________________________________________
66
P0045Extended Abstract for 2016 MyHVnet Colloquium_____________________________________________________________________
66
P0045Extended Abstract for 2016 MyHVnet Colloquium_____________________________________________________________________
66
P0045Extended Abstract for 2016 MyHVnet Colloquium_____________________________________________________________________
66
P0045
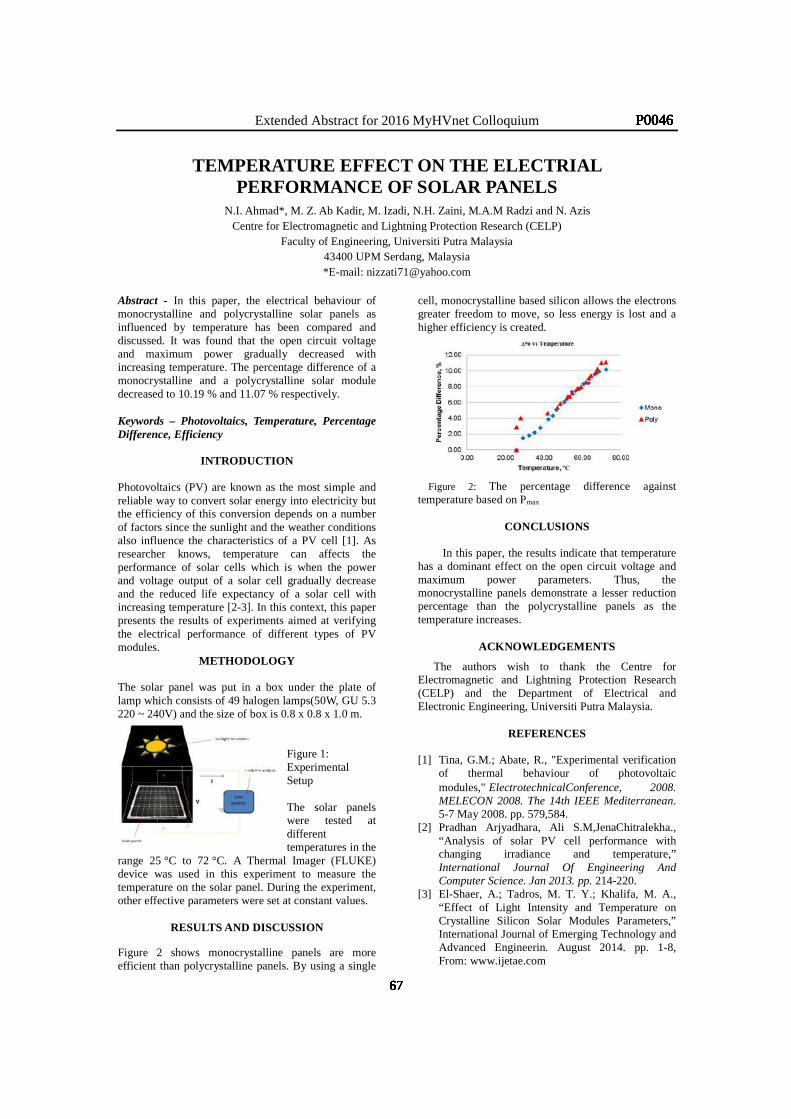
Extended Abstract for 2016 MyHVnet Colloquium
TEMPERATURE EFFECT ON THE ELECTRIAL PERFORMANCE OF SOLAR PANELS
N.I. Ahmad*, M. Z. Ab Kadir, M. Izadi, N.H. Zaini, M.A.M Radzi and N. Azis Centre for Electromagnetic and Lightning Protection Research (CELP)
Faculty of Engineering, Universiti Putra Malaysia 43400 UPM Serdang, Malaysia *E-mail: [email protected]
Abstract - In this paper, the electrical behaviour of monocrystalline and polycrystalline solar panels as influenced by temperature has been compared and discussed. It was found that the open circuit voltage and maximum power gradually decreased with increasing temperature. The percentage difference of a monocrystalline and a polycrystalline solar module decreased to 10.19 % and 11.07 % respectively. Keywords – Photovoltaics, Temperature, Percentage Difference, Efficiency
INTRODUCTION Photovoltaics (PV) are known as the most simple and reliable way to convert solar energy into electricity but the efficiency of this conversion depends on a number of factors since the sunlight and the weather conditions also influence the characteristics of a PV cell [1]. As researcher knows, temperature can affects the performance of solar cells which is when the power and voltage output of a solar cell gradually decrease and the reduced life expectancy of a solar cell with increasing temperature [2-3]. In this context, this paper presents the results of experiments aimed at verifying the electrical performance of different types of PV modules.
METHODOLOGY The solar panel was put in a box under the plate of lamp which consists of 49 halogen lamps(50W, GU 5.3 220 ~ 240V) and the size of box is 0.8 x 0.8 x 1.0 m.
Figure 1: Experimental Setup The solar panels were tested at different temperatures in the
range 25 °C to 72 °C. A Thermal Imager (FLUKE) device was used in this experiment to measure the temperature on the solar panel. During the experiment, other effective parameters were set at constant values.
RESULTS AND DISCUSSION
Figure 2 shows monocrystalline panels are more efficient than polycrystalline panels. By using a single
cell, monocrystalline based silicon allows the electrons greater freedom to move, so less energy is lost and a higher efficiency is created.
Figure 2: The percentage difference against
temperature based on Pmax
CONCLUSIONS
In this paper, the results indicate that temperature has a dominant effect on the open circuit voltage and maximum power parameters. Thus, the monocrystalline panels demonstrate a lesser reduction percentage than the polycrystalline panels as the temperature increases.
ACKNOWLEDGEMENTS
The authors wish to thank the Centre for Electromagnetic and Lightning Protection Research (CELP) and the Department of Electrical and Electronic Engineering, Universiti Putra Malaysia.
REFERENCES
[1] Tina, G.M.; Abate, R., "Experimental verification of thermal behaviour of photovoltaic modules," ElectrotechnicalConference, 2008. MELECON 2008. The 14th IEEE Mediterranean. 5-7 May 2008. pp. 579,584.
[2] Pradhan Arjyadhara, Ali S.M,JenaChitralekha., “Analysis of solar PV cell performance with changing irradiance and temperature,” International Journal Of Engineering And Computer Science. Jan 2013. pp. 214-220.
[3] El-Shaer, A.; Tadros, M. T. Y.; Khalifa, M. A., “Effect of Light Intensity and Temperature on Crystalline Silicon Solar Modules Parameters,” International Journal of Emerging Technology and Advanced Engineerin. August 2014. pp. 1-8, From: www.ijetae.com
67
P0046
67
P0046
67
P0046
67
P0046
67
P0046
67
P0046
67
P0046
67
P0046
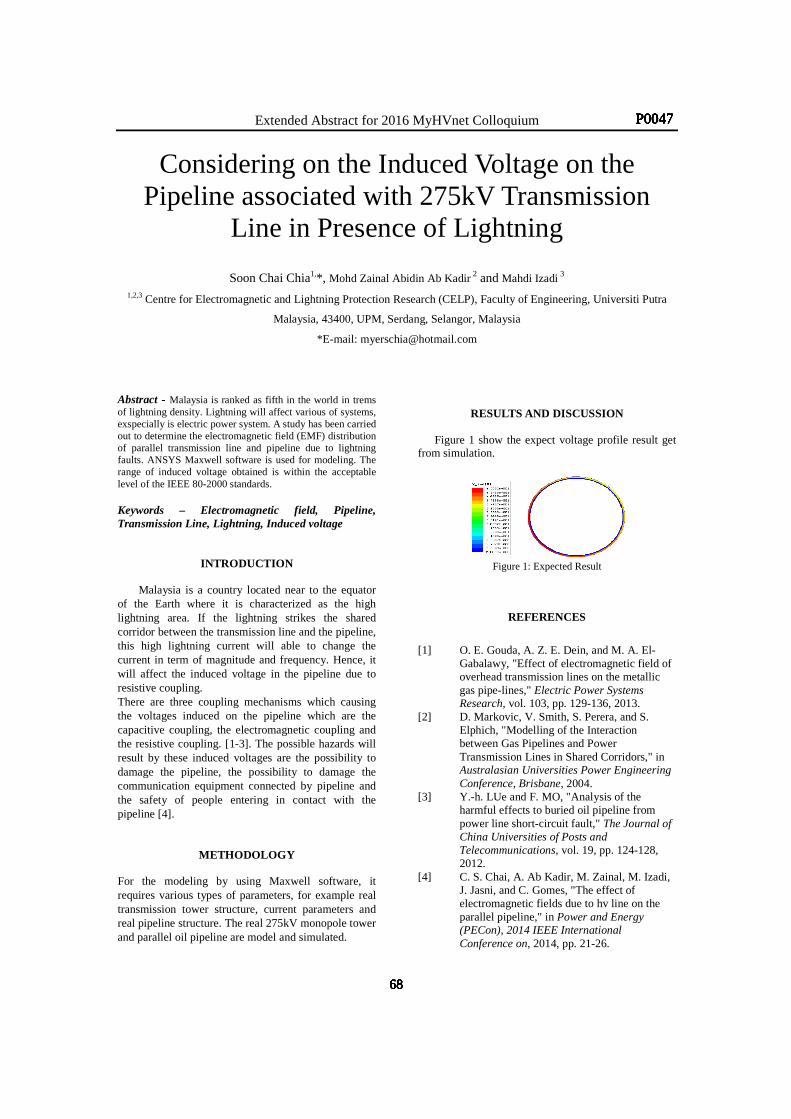
Extended Abstract for 2016 MyHVnet Colloquium
Considering on the Induced Voltage on the Pipeline associated with 275kV Transmission
Line in Presence of Lightning
Soon Chai Chia1,*, Mohd Zainal Abidin Ab Kadir 2 and Mahdi Izadi 3 1,2,3 Centre for Electromagnetic and Lightning Protection Research (CELP), Faculty of Engineering, Universiti Putra
Malaysia, 43400, UPM, Serdang, Selangor, Malaysia
*E-mail: [email protected]
Abstract - Malaysia is ranked as fifth in the world in trems of lightning density. Lightning will affect various of systems, exspecially is electric power system. A study has been carried out to determine the electromagnetic field (EMF) distribution of parallel transmission line and pipeline due to lightning faults. ANSYS Maxwell software is used for modeling. The range of induced voltage obtained is within the acceptable level of the IEEE 80-2000 standards.
Keywords – Electromagnetic field, Pipeline, Transmission Line, Lightning, Induced voltage
INTRODUCTION
Malaysia is a country located near to the equator of the Earth where it is characterized as the high lightning area. If the lightning strikes the shared corridor between the transmission line and the pipeline, this high lightning current will able to change the current in term of magnitude and frequency. Hence, it will affect the induced voltage in the pipeline due to resistive coupling. There are three coupling mechanisms which causing the voltages induced on the pipeline which are the capacitive coupling, the electromagnetic coupling and the resistive coupling. [1-3]. The possible hazards will result by these induced voltages are the possibility to damage the pipeline, the possibility to damage the communication equipment connected by pipeline and the safety of people entering in contact with the pipeline [4].
METHODOLOGY
For the modeling by using Maxwell software, it requires various types of parameters, for example real transmission tower structure, current parameters and real pipeline structure. The real 275kV monopole tower and parallel oil pipeline are model and simulated.
RESULTS AND DISCUSSION
Figure 1 show the expect voltage profile result get
from simulation.
Figure 1: Expected Result
REFERENCES
[1] O. E. Gouda, A. Z. E. Dein, and M. A. El-Gabalawy, "Effect of electromagnetic field of overhead transmission lines on the metallic gas pipe-lines," Electric Power Systems Research, vol. 103, pp. 129-136, 2013.
[2] D. Markovic, V. Smith, S. Perera, and S. Elphich, "Modelling of the Interaction between Gas Pipelines and Power Transmission Lines in Shared Corridors," in Australasian Universities Power Engineering Conference, Brisbane, 2004.
[3] Y.-h. LUe and F. MO, "Analysis of the harmful effects to buried oil pipeline from power line short-circuit fault," The Journal of China Universities of Posts and Telecommunications, vol. 19, pp. 124-128, 2012.
[4] C. S. Chai, A. Ab Kadir, M. Zainal, M. Izadi, J. Jasni, and C. Gomes, "The effect of electromagnetic fields due to hv line on the parallel pipeline," in Power and Energy (PECon), 2014 IEEE International Conference on, 2014, pp. 21-26.
68
P0047
68
P0047
68
P0047
68
P0047
68
P0047
68
P0047
68
P0047
68
P0047
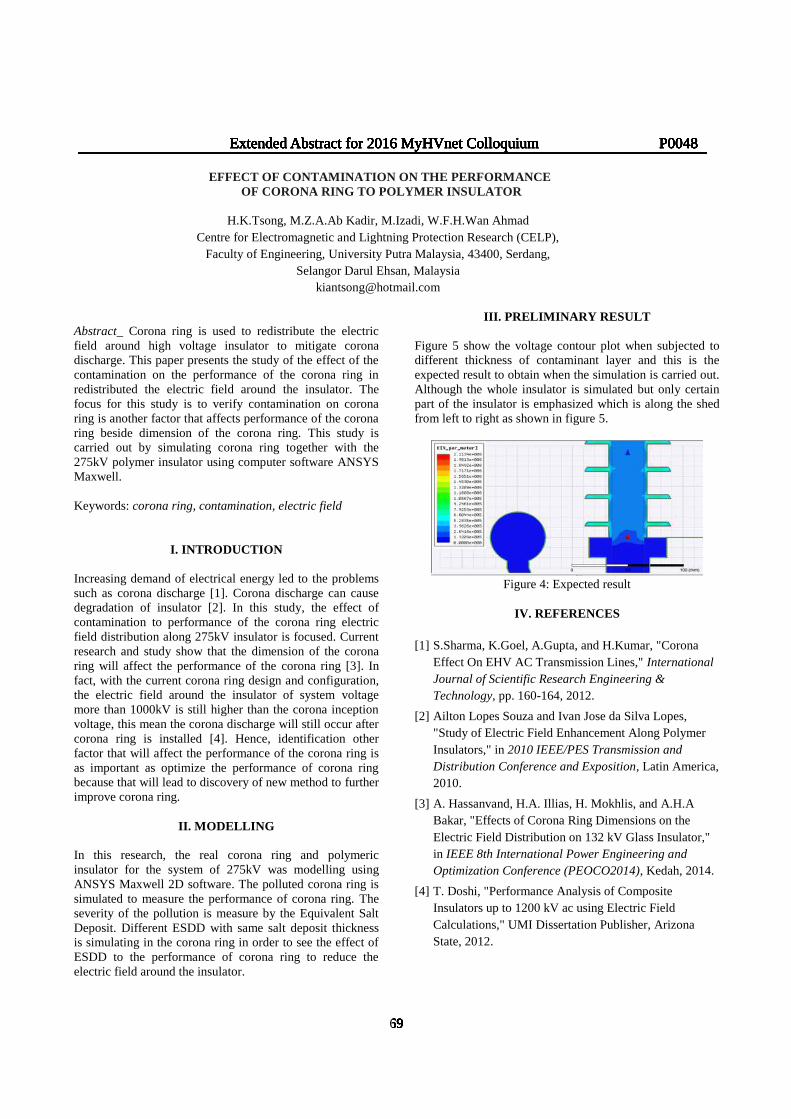
1
EFFECT OF CONTAMINATION ON THE PERFORMANCE OF CORONA RING TO POLYMER INSULATOR
H.K.Tsong, M.Z.A.Ab Kadir, M.Izadi, W.F.H.Wan Ahmad
Centre for Electromagnetic and Lightning Protection Research (CELP), Faculty of Engineering, University Putra Malaysia, 43400, Serdang,
Selangor Darul Ehsan, Malaysia [email protected]
Abstract_ Corona ring is used to redistribute the electric field around high voltage insulator to mitigate corona discharge. This paper presents the study of the effect of the contamination on the performance of the corona ring in redistributed the electric field around the insulator. The focus for this study is to verify contamination on corona ring is another factor that affects performance of the corona ring beside dimension of the corona ring. This study is carried out by simulating corona ring together with the 275kV polymer insulator using computer software ANSYS Maxwell. Keywords: corona ring, contamination, electric field
I. INTRODUCTION Increasing demand of electrical energy led to the problems such as corona discharge [1]. Corona discharge can cause degradation of insulator [2]. In this study, the effect of contamination to performance of the corona ring electric field distribution along 275kV insulator is focused. Current research and study show that the dimension of the corona ring will affect the performance of the corona ring [3]. In fact, with the current corona ring design and configuration, the electric field around the insulator of system voltage more than 1000kV is still higher than the corona inception voltage, this mean the corona discharge will still occur after corona ring is installed [4]. Hence, identification other factor that will affect the performance of the corona ring is as important as optimize the performance of corona ring because that will lead to discovery of new method to further improve corona ring.
II. MODELLING In this research, the real corona ring and polymeric insulator for the system of 275kV was modelling using ANSYS Maxwell 2D software. The polluted corona ring is simulated to measure the performance of corona ring. The severity of the pollution is measure by the Equivalent Salt Deposit. Different ESDD with same salt deposit thickness is simulating in the corona ring in order to see the effect of ESDD to the performance of corona ring to reduce the electric field around the insulator.
III. PRELIMINARY RESULT
Figure 5 show the voltage contour plot when subjected to different thickness of contaminant layer and this is the expected result to obtain when the simulation is carried out. Although the whole insulator is simulated but only certain part of the insulator is emphasized which is along the shed from left to right as shown in figure 5.
Figure 4: Expected result
IV. REFERENCES
[1] S.Sharma, K.Goel, A.Gupta, and H.Kumar, "Corona
Effect On EHV AC Transmission Lines," International Journal of Scientific Research Engineering & Technology, pp. 160-164, 2012.
[2] Ailton Lopes Souza and Ivan Jose da Silva Lopes, "Study of Electric Field Enhancement Along Polymer Insulators," in 2010 IEEE/PES Transmission and Distribution Conference and Exposition, Latin America, 2010.
[3] A. Hassanvand, H.A. Illias, H. Mokhlis, and A.H.A Bakar, "Effects of Corona Ring Dimensions on the Electric Field Distribution on 132 kV Glass Insulator," in IEEE 8th International Power Engineering and Optimization Conference (PEOCO2014), Kedah, 2014.
[4] T. Doshi, "Performance Analysis of Composite Insulators up to 1200 kV ac using Electric Field Calculations," UMI Dissertation Publisher, Arizona State, 2012.
_____________________________________________________________________Extended Abstract for 2016 MyHVnet Colloquium
69
P0048_____________________________________________________________________Extended Abstract for 2016 MyHVnet Colloquium
69
P0048_____________________________________________________________________Extended Abstract for 2016 MyHVnet Colloquium
69
P0048_____________________________________________________________________Extended Abstract for 2016 MyHVnet Colloquium
69
P0048_____________________________________________________________________Extended Abstract for 2016 MyHVnet Colloquium
69
P0048_____________________________________________________________________Extended Abstract for 2016 MyHVnet Colloquium
69
P0048_____________________________________________________________________Extended Abstract for 2016 MyHVnet Colloquium
69
P0048_____________________________________________________________________Extended Abstract for 2016 MyHVnet Colloquium
69
P0048
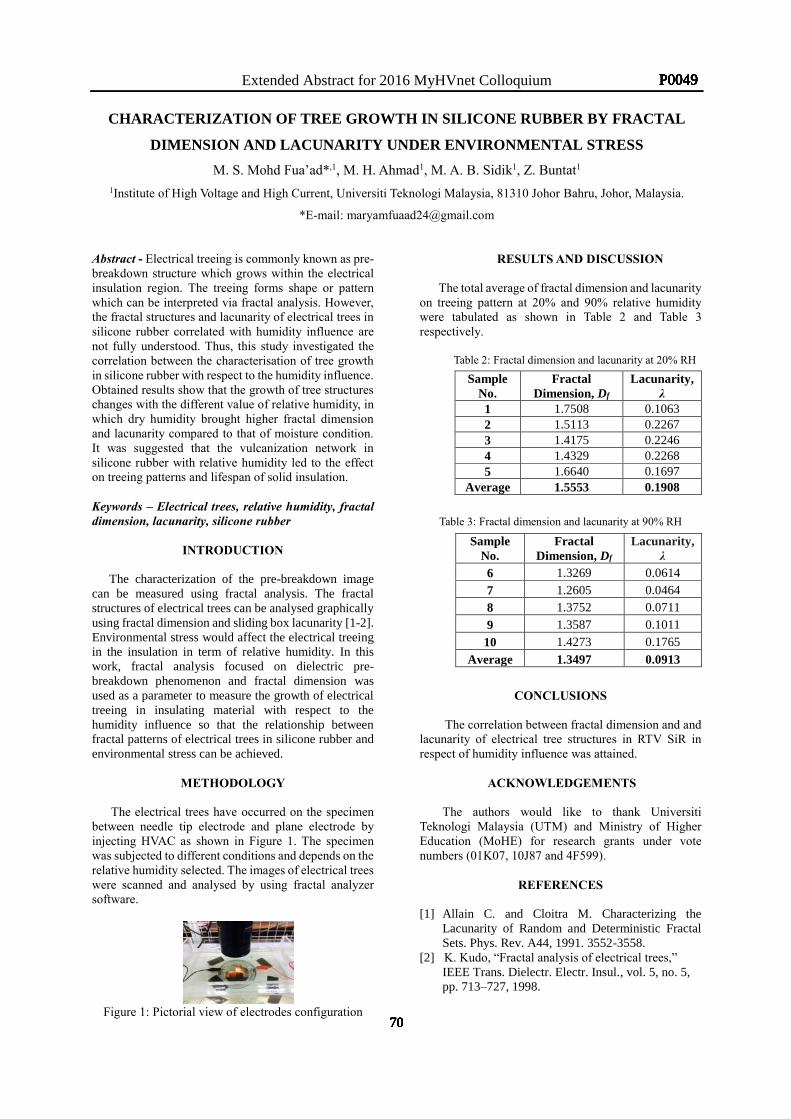
Extended Abstract for 2016 MyHVnet Colloquium
CHARACTERIZATION OF TREE GROWTH IN SILICONE RUBBER BY FRACTAL
DIMENSION AND LACUNARITY UNDER ENVIRONMENTAL STRESS
M. S. Mohd Fua’ad*,1, M. H. Ahmad1, M. A. B. Sidik1, Z. Buntat1 1Institute of High Voltage and High Current, Universiti Teknologi Malaysia, 81310 Johor Bahru, Johor, Malaysia.
*E-mail: [email protected] Abstract - Electrical treeing is commonly known as pre-breakdown structure which grows within the electrical insulation region. The treeing forms shape or pattern which can be interpreted via fractal analysis. However, the fractal structures and lacunarity of electrical trees in silicone rubber correlated with humidity influence are not fully understood. Thus, this study investigated the correlation between the characterisation of tree growth in silicone rubber with respect to the humidity influence. Obtained results show that the growth of tree structures changes with the different value of relative humidity, in which dry humidity brought higher fractal dimension and lacunarity compared to that of moisture condition. It was suggested that the vulcanization network in silicone rubber with relative humidity led to the effect on treeing patterns and lifespan of solid insulation. Keywords – Electrical trees, relative humidity, fractal dimension, lacunarity, silicone rubber
INTRODUCTION
The characterization of the pre-breakdown image can be measured using fractal analysis. The fractal structures of electrical trees can be analysed graphically using fractal dimension and sliding box lacunarity [1-2]. Environmental stress would affect the electrical treeing in the insulation in term of relative humidity. In this work, fractal analysis focused on dielectric pre-breakdown phenomenon and fractal dimension was used as a parameter to measure the growth of electrical treeing in insulating material with respect to the humidity influence so that the relationship between fractal patterns of electrical trees in silicone rubber and environmental stress can be achieved.
METHODOLOGY
The electrical trees have occurred on the specimen between needle tip electrode and plane electrode by injecting HVAC as shown in Figure 1. The specimen was subjected to different conditions and depends on the relative humidity selected. The images of electrical trees were scanned and analysed by using fractal analyzer software.
Figure 1: Pictorial view of electrodes configuration
RESULTS AND DISCUSSION The total average of fractal dimension and lacunarity on treeing pattern at 20% and 90% relative humidity were tabulated as shown in Table 2 and Table 3 respectively. Table 2: Fractal dimension and lacunarity at 20% RH
Table 3: Fractal dimension and lacunarity at 90% RH
CONCLUSIONS
The correlation between fractal dimension and and lacunarity of electrical tree structures in RTV SiR in respect of humidity influence was attained.
ACKNOWLEDGEMENTS The authors would like to thank Universiti
Teknologi Malaysia (UTM) and Ministry of Higher Education (MoHE) for research grants under vote numbers (01K07, 10J87 and 4F599).
REFERENCES
[1] Allain C. and Cloitra M. Characterizing the
Lacunarity of Random and Deterministic Fractal Sets. Phys. Rev. A44, 1991. 3552-3558.
[2] K. Kudo, “Fractal analysis of electrical trees,” IEEE Trans. Dielectr. Electr. Insul., vol. 5, no. 5, pp. 713–727, 1998.
Sample No.
Fractal Dimension, Df
Lacunarity, λ
1 1.7508 0.1063 2 1.5113 0.2267 3 1.4175 0.2246 4 1.4329 0.2268 5 1.6640 0.1697
Average 1.5553 0.1908
Sample No.
Fractal Dimension, Df
Lacunarity, λ
6 1.3269 0.0614
7 1.2605 0.0464 8 1.3752 0.0711
9 1.3587 0.1011
10 1.4273 0.1765
Average 1.3497 0.0913
70
P0049
70
P0049
70
P0049
70
P0049
70
P0049
70
P0049
70
P0049
70
P0049
Extended Abstract for 2016 MyHVnet Colloquium
LIGHTNING CURRENT SIGNATURES THAT MAY ENHANCE THE TRIGGERING POSSIBILITIES OF WILD FIRES
Ashen Gomes, Mehdi Izadi, Halimatusaadiah Rusli and Chandima Gomes*
Centre for Electromagnetics and Lightning Protection, Universiti Putra Malaysia, 43400, Selangor, Malaysia.
*E-mail: [email protected] Abstract Positive lightning with large peak impulse current and long duration of both impulse and continuing current has a much higher probability of triggering fire in the lightning struck object or environment in the proximity, than its negative counterpart. Most often, positive lightning has been observed from the anvil part of the cumulonimbus clouds which spreads many kilometers beyond the rain base. Hence, thunderstorms occurring in temperate regions, especially during the winter where positive lightning has a high percentage, need to have an added weighting factor in developing the probabilistic model. The characteristics of the wood structure of the major types of tall trees in a given forest should also be considered as a deciding factor in predicting the triggering of forest fires. Apart from having low ignition temperature, dry wood may significantly increase the firing probability due to the ultra-high resistivity. The change of energy dissipation may increase by 106 times when some wood change from wet conditions to dry conditions. Hence lightning occurring under dry and wet conditions may have much larger difference in forest fire triggering probability than what has been stipulated in the literature. This paper emphasizes that in the development of predictive models for lightning-triggered forest fires, there are many factors to be considered, rather than taking only the lightning density and precipitation level into account..
Keywords – Fulgurites, bentonite, resistivity, high voltage, impulse current
INTRODUCTION
The very few statistical models developed in predicting lightning-triggered forest fires have serious drawbacks as they do not take into account some key factors such as the types of lightning and energy content of lightning currents. In the event of a lightning stepped leader propagating towards a forest, the canopy level of the trees acts as streamer inception points, thus bi-directional answering leaders are initiated that connect the stepped leader tip and the ground. Out of several such points, most often, only one will be successful in intercepting with the tip of the stepped leader. In the return stroke phase, which follows the interception of answering leader from the tree top and the stepped leader, many hazards are possible due to the large energy dissipation and potential drop along the current path which takes either aerial route outside the bark of
the tree or inside the infinitesimally conducting materials of the tree such as middle-wood (mostly in the event of palm-type trees) or loosely bound natural fibers.
METHODOLOGY
Heidler function has been selected as the current model to represent negative first stroke, negative subsequent stroke and positive stroke. For the total range of possible parameters (both impulse and continuing currents) are used to compute the statistical distribution of thermal energy and power (per unit resistance) of several fuel types. With data available on fuel types and possible atmospheric conditions (fuel condition) correlation has been built up between the types of lightning and the fuel.
RESULTS AND DISCUSSION
Results show that irrespective of the peak current
or type of lightning, the continuing current plays the major role in triggering forest fires in all fuel types. The peak current has a significant effect only in the case of positive lightning. The dependance of the triggering probability on the weather condition is quite strong as a given forest turns towards a more inflamable fuel type with prolonged periods of low or no precipitation. The results could be extended to develop a model that will be able to predict the probability of fire inception, once the lightning/arc parameters and fuel parameters are given.
CONCLUSIONS
The results of this study shows the most vital
parameters of lightning current that is responsible for the iginition of forest fires. The outcomes also show that for a given lightning type and current signature the probability of triggering fire depends on the fuel type, which in turn is related to the prevailing weather.
REFERENCES
[1] [5] Simpson, C. C., Sharples, J. J., Evans, J. P., and
McCabe, M. F.: Large eddy simulation of atypical wildland fire spread on leeward slopes, Int. J. Wildland Fire, 22, 599–614, 2013
[2] [6] D. R. Brillinger1, H. K. Preisler and J. W. Benoit, Probabilistic risk assessment for wildfires, Environmetrics, 17: 623–633, 2006
71
P0050
71
P0050
71
P0050
71
P0050
71
P0050
71
P0050
71
P0050
71
P0050
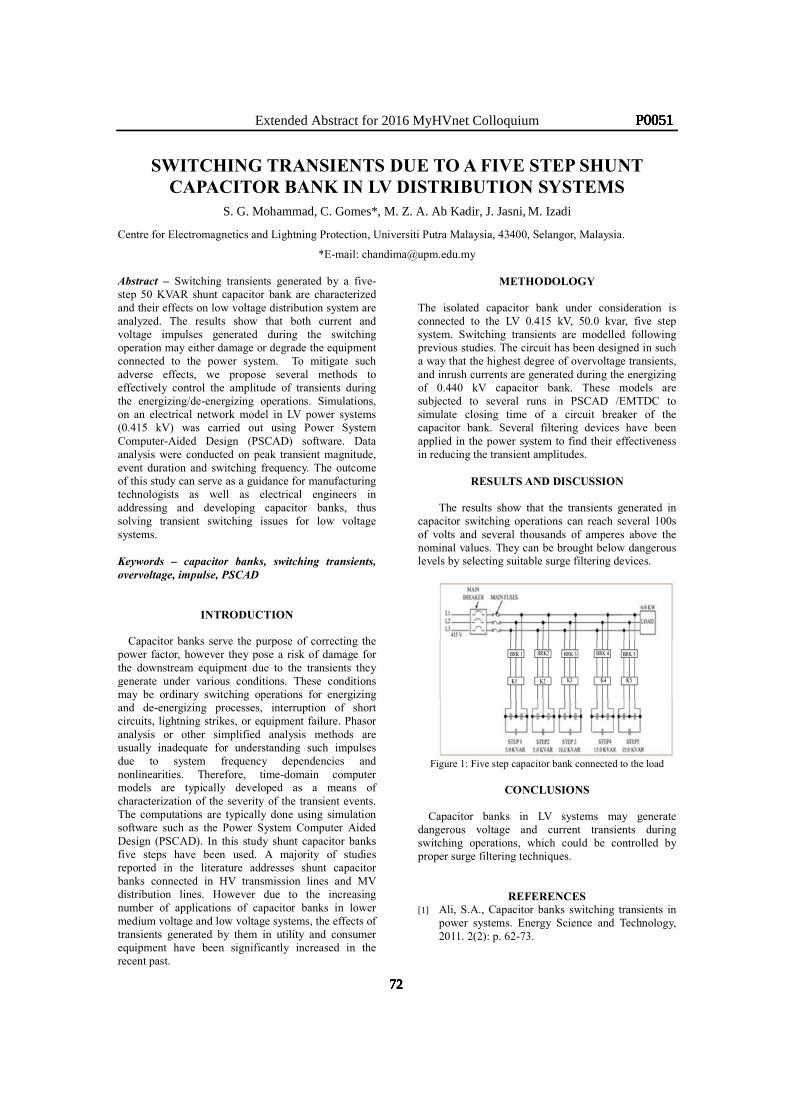
Extended Abstract for 2016 MyHVnet Colloquium
SWITCHING TRANSIENTS DUE TO A FIVE STEP SHUNT CAPACITOR BANK IN LV DISTRIBUTION SYSTEMS
S. G. Mohammad, C. Gomes*, M. Z. A. Ab Kadir, J. Jasni, M. Izadi
Centre for Electromagnetics and Lightning Protection, Universiti Putra Malaysia, 43400, Selangor, Malaysia.
*E-mail: [email protected] Abstract – Switching transients generated by a five-step 50 KVAR shunt capacitor bank are characterized and their effects on low voltage distribution system are analyzed. The results show that both current and voltage impulses generated during the switching operation may either damage or degrade the equipment connected to the power system. To mitigate such adverse effects, we propose several methods to effectively control the amplitude of transients during the energizing/de-energizing operations. Simulations, on an electrical network model in LV power systems (0.415 kV) was carried out using Power System Computer-Aided Design (PSCAD) software. Data analysis were conducted on peak transient magnitude, event duration and switching frequency. The outcome of this study can serve as a guidance for manufacturing technologists as well as electrical engineers in addressing and developing capacitor banks, thus solving transient switching issues for low voltage systems. Keywords – capacitor banks, switching transients, overvoltage, impulse, PSCAD
INTRODUCTION
Capacitor banks serve the purpose of correcting the power factor, however they pose a risk of damage for the downstream equipment due to the transients they generate under various conditions. These conditions may be ordinary switching operations for energizing and de-energizing processes, interruption of short circuits, lightning strikes, or equipment failure. Phasor analysis or other simplified analysis methods are usually inadequate for understanding such impulses due to system frequency dependencies and nonlinearities. Therefore, time-domain computer models are typically developed as a means of characterization of the severity of the transient events. The computations are typically done using simulation software such as the Power System Computer Aided Design (PSCAD). In this study shunt capacitor banks five steps have been used. A majority of studies reported in the literature addresses shunt capacitor banks connected in HV transmission lines and MV distribution lines. However due to the increasing number of applications of capacitor banks in lower medium voltage and low voltage systems, the effects of transients generated by them in utility and consumer equipment have been significantly increased in the recent past.
METHODOLOGY
The isolated capacitor bank under consideration is connected to the LV 0.415 kV, 50.0 kvar, five step system. Switching transients are modelled following previous studies. The circuit has been designed in such a way that the highest degree of overvoltage transients, and inrush currents are generated during the energizing of 0.440 kV capacitor bank. These models are subjected to several runs in PSCAD /EMTDC to simulate closing time of a circuit breaker of the capacitor bank. Several filtering devices have been applied in the power system to find their effectiveness in reducing the transient amplitudes.
RESULTS AND DISCUSSION
The results show that the transients generated in capacitor switching operations can reach several 100s of volts and several thousands of amperes above the nominal values. They can be brought below dangerous levels by selecting suitable surge filtering devices.
Figure 1: Five step capacitor bank connected to the load
CONCLUSIONS
Capacitor banks in LV systems may generate
dangerous voltage and current transients during switching operations, which could be controlled by proper surge filtering techniques.
REFERENCES [1] Ali, S.A., Capacitor banks switching transients in
power systems. Energy Science and Technology, 2011. 2(2): p. 62-73.
72
P0051
72
P0051
72
P0051
72
P0051
72
P0051
72
P0051
72
P0051
72
P0051
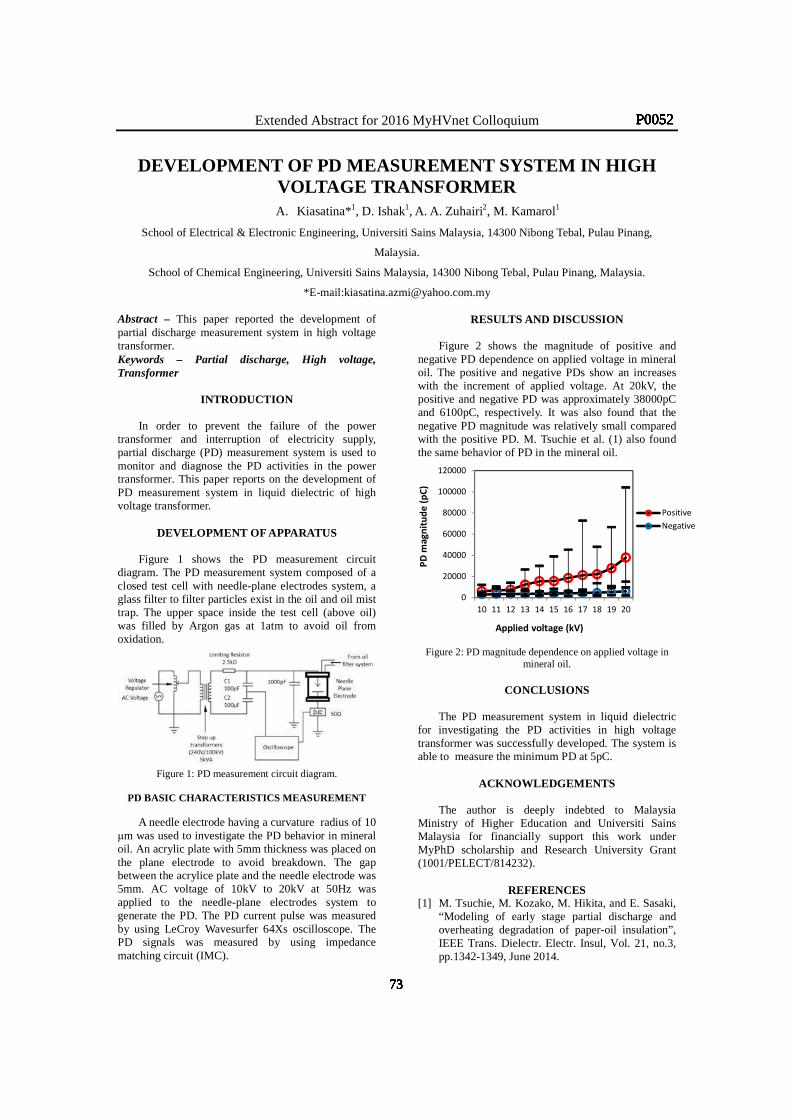
Extended Abstract for 2016 MyHVnet Colloquium
DEVELOPMENT OF PD MEASUREMENT SYSTEM IN HIGH VOLTAGE TRANSFORMER A. Kiasatina*1, D. Ishak1, A. A. Zuhairi2, M. Kamarol1
School of Electrical & Electronic Engineering, Universiti Sains Malaysia, 14300 Nibong Tebal, Pulau Pinang,
Malaysia.
School of Chemical Engineering, Universiti Sains Malaysia, 14300 Nibong Tebal, Pulau Pinang, Malaysia.
*E-mail:[email protected]
Abstract – This paper reported the development of partial discharge measurement system in high voltage transformer. Keywords – Partial discharge, High voltage, Transformer
INTRODUCTION
In order to prevent the failure of the power transformer and interruption of electricity supply, partial discharge (PD) measurement system is used to monitor and diagnose the PD activities in the power transformer. This paper reports on the development of PD measurement system in liquid dielectric of high voltage transformer.
DEVELOPMENT OF APPARATUS
Figure 1 shows the PD measurement circuit
diagram. The PD measurement system composed of a closed test cell with needle-plane electrodes system, a glass filter to filter particles exist in the oil and oil mist trap. The upper space inside the test cell (above oil) was filled by Argon gas at 1atm to avoid oil from oxidation.
Figure 1: PD measurement circuit diagram.
PD BASIC CHARACTERISTICS MEASUREMENT
A needle electrode having a curvature radius of 10
µm was used to investigate the PD behavior in mineral oil. An acrylic plate with 5mm thickness was placed on the plane electrode to avoid breakdown. The gap between the acrylice plate and the needle electrode was 5mm. AC voltage of 10kV to 20kV at 50Hz was applied to the needle-plane electrodes system to generate the PD. The PD current pulse was measured by using LeCroy Wavesurfer 64Xs oscilloscope. The PD signals was measured by using impedance matching circuit (IMC).
RESULTS AND DISCUSSION
Figure 2 shows the magnitude of positive and negative PD dependence on applied voltage in mineral oil. The positive and negative PDs show an increases with the increment of applied voltage. At 20kV, the positive and negative PD was approximately 38000pC and 6100pC, respectively. It was also found that the negative PD magnitude was relatively small compared with the positive PD. M. Tsuchie et al. (1) also found the same behavior of PD in the mineral oil.
Figure 2: PD magnitude dependence on applied voltage in
mineral oil.
CONCLUSIONS
The PD measurement system in liquid dielectric for investigating the PD activities in high voltage transformer was successfully developed. The system is able to measure the minimum PD at 5pC.
ACKNOWLEDGEMENTS
The author is deeply indebted to Malaysia
Ministry of Higher Education and Universiti Sains Malaysia for financially support this work under MyPhD scholarship and Research University Grant (1001/PELECT/814232).
REFERENCES [1] M. Tsuchie, M. Kozako, M. Hikita, and E. Sasaki,
“Modeling of early stage partial discharge and overheating degradation of paper-oil insulation”, IEEE Trans. Dielectr. Electr. Insul, Vol. 21, no.3, pp.1342-1349, June 2014.
0
20000
40000
60000
80000
100000
120000
10 11 12 13 14 15 16 17 18 19 20
PositiveNegative
PD m
agni
tude
(pC)
Applied voltage (kV)
73
P0052
73
P0052
73
P0052
73
P0052
73
P0052
73
P0052
73
P0052
73
P0052
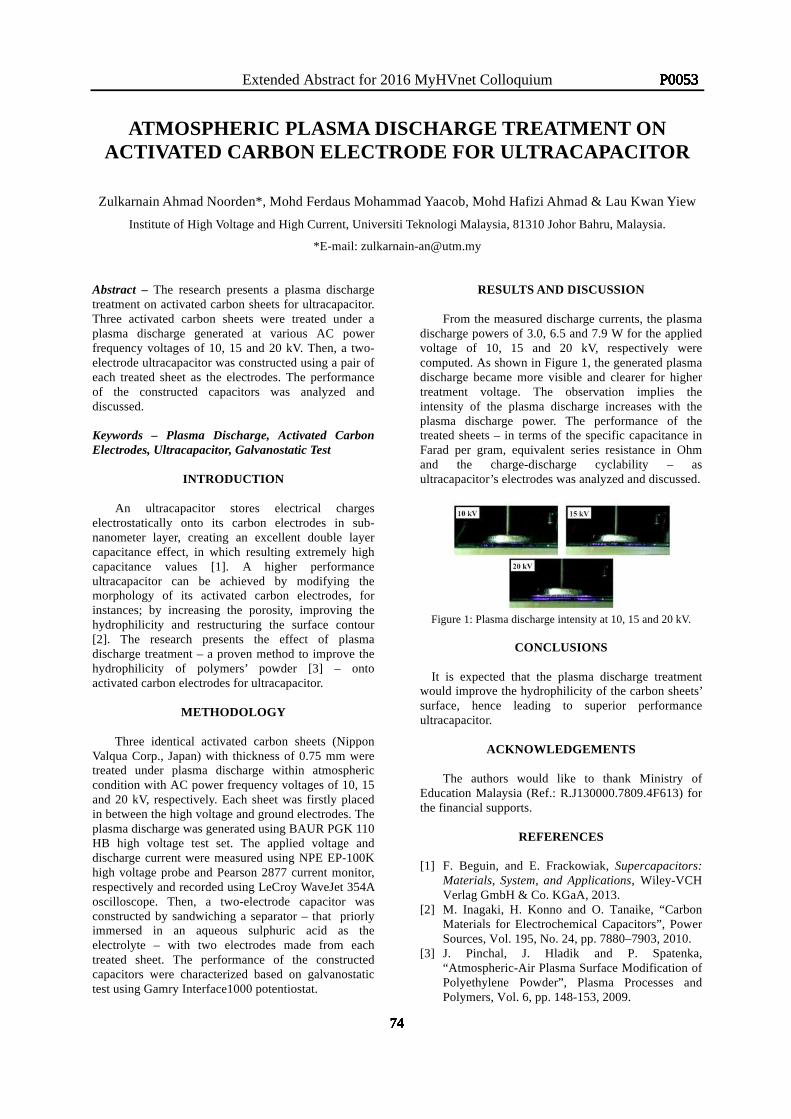
Extended Abstract for 2016 MyHVnet Colloquium
ATMOSPHERIC PLASMA DISCHARGE TREATMENT ON ACTIVATED CARBON ELECTRODE FOR ULTRACAPACITOR
Zulkarnain Ahmad Noorden*, Mohd Ferdaus Mohammad Yaacob, Mohd Hafizi Ahmad & Lau Kwan Yiew
Institute of High Voltage and High Current, Universiti Teknologi Malaysia, 81310 Johor Bahru, Malaysia.
*E-mail: [email protected] Abstract – The research presents a plasma discharge treatment on activated carbon sheets for ultracapacitor. Three activated carbon sheets were treated under a plasma discharge generated at various AC power frequency voltages of 10, 15 and 20 kV. Then, a two-electrode ultracapacitor was constructed using a pair of each treated sheet as the electrodes. The performance of the constructed capacitors was analyzed and discussed.
Keywords – Plasma Discharge, Activated Carbon Electrodes, Ultracapacitor, Galvanostatic Test
INTRODUCTION
An ultracapacitor stores electrical charges electrostatically onto its carbon electrodes in sub-nanometer layer, creating an excellent double layer capacitance effect, in which resulting extremely high capacitance values [1]. A higher performance ultracapacitor can be achieved by modifying the morphology of its activated carbon electrodes, for instances; by increasing the porosity, improving the hydrophilicity and restructuring the surface contour [2]. The research presents the effect of plasma discharge treatment – a proven method to improve the hydrophilicity of polymers’ powder [3] – onto activated carbon electrodes for ultracapacitor.
METHODOLOGY
Three identical activated carbon sheets (Nippon
Valqua Corp., Japan) with thickness of 0.75 mm were treated under plasma discharge within atmospheric condition with AC power frequency voltages of 10, 15 and 20 kV, respectively. Each sheet was firstly placed in between the high voltage and ground electrodes. The plasma discharge was generated using BAUR PGK 110 HB high voltage test set. The applied voltage and discharge current were measured using NPE EP-100K high voltage probe and Pearson 2877 current monitor, respectively and recorded using LeCroy WaveJet 354A oscilloscope. Then, a two-electrode capacitor was constructed by sandwiching a separator – that priorly immersed in an aqueous sulphuric acid as the electrolyte – with two electrodes made from each treated sheet. The performance of the constructed capacitors were characterized based on galvanostatic test using Gamry Interface1000 potentiostat.
RESULTS AND DISCUSSION
From the measured discharge currents, the plasma discharge powers of 3.0, 6.5 and 7.9 W for the applied voltage of 10, 15 and 20 kV, respectively were computed. As shown in Figure 1, the generated plasma discharge became more visible and clearer for higher treatment voltage. The observation implies the intensity of the plasma discharge increases with the plasma discharge power. The performance of the treated sheets – in terms of the specific capacitance in Farad per gram, equivalent series resistance in Ohm and the charge-discharge cyclability – as ultracapacitor’s electrodes was analyzed and discussed.
Figure 1: Plasma discharge intensity at 10, 15 and 20 kV.
CONCLUSIONS
It is expected that the plasma discharge treatment
would improve the hydrophilicity of the carbon sheets’ surface, hence leading to superior performance ultracapacitor.
ACKNOWLEDGEMENTS The authors would like to thank Ministry of
Education Malaysia (Ref.: R.J130000.7809.4F613) for the financial supports.
REFERENCES
[1] F. Beguin, and E. Frackowiak, Supercapacitors:
Materials, System, and Applications, Wiley-VCH Verlag GmbH & Co. KGaA, 2013.
[2] M. Inagaki, H. Konno and O. Tanaike, “Carbon Materials for Electrochemical Capacitors”, Power Sources, Vol. 195, No. 24, pp. 7880–7903, 2010.
[3] J. Pinchal, J. Hladik and P. Spatenka, “Atmospheric-Air Plasma Surface Modification of Polyethylene Powder”, Plasma Processes and Polymers, Vol. 6, pp. 148-153, 2009.
74
P0053
74
P0053
74
P0053
74
P0053
74
P0053
74
P0053
74
P0053
74
P0053
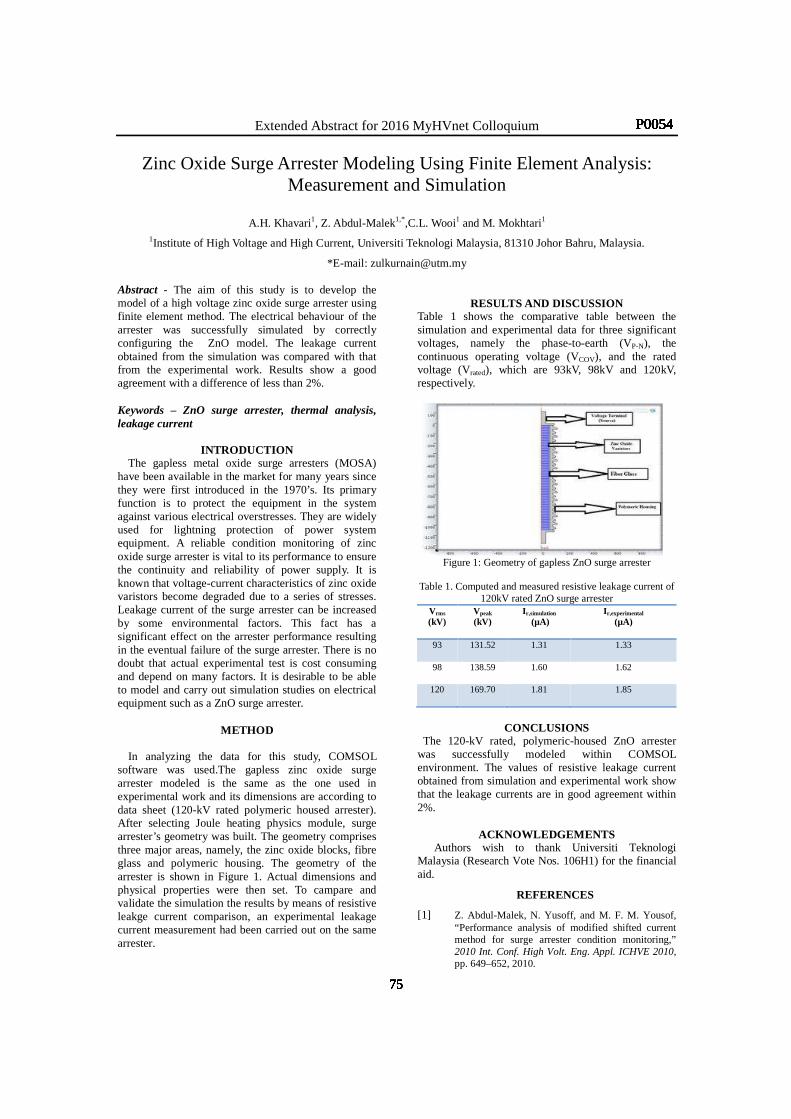
Extended Abstract for 2016 MyHVnet Colloquium
Zinc Oxide Surge Arrester Modeling Using Finite Element Analysis: Measurement and Simulation
A.H. Khavari1, Z. Abdul-Malek1,*,C.L. Wooi1 and M. Mokhtari1
1Institute of High Voltage and High Current, Universiti Teknologi Malaysia, 81310 Johor Bahru, Malaysia.
*E-mail: [email protected]
Abstract - The aim of this study is to develop the model of a high voltage zinc oxide surge arrester using finite element method. The electrical behaviour of the arrester was successfully simulated by correctly configuring the ZnO model. The leakage current obtained from the simulation was compared with that from the experimental work. Results show a good agreement with a difference of less than 2%. Keywords – ZnO surge arrester, thermal analysis, leakage current
INTRODUCTION The gapless metal oxide surge arresters (MOSA)
have been available in the market for many years since they were first introduced in the 1970’s. Its primary function is to protect the equipment in the system against various electrical overstresses. They are widely used for lightning protection of power system equipment. A reliable condition monitoring of zinc oxide surge arrester is vital to its performance to ensure the continuity and reliability of power supply. It is known that voltage-current characteristics of zinc oxide varistors become degraded due to a series of stresses. Leakage current of the surge arrester can be increased by some environmental factors. This fact has a significant effect on the arrester performance resulting in the eventual failure of the surge arrester. There is no doubt that actual experimental test is cost consuming and depend on many factors. It is desirable to be able to model and carry out simulation studies on electrical equipment such as a ZnO surge arrester.
METHOD
In analyzing the data for this study, COMSOL software was used.The gapless zinc oxide surge arrester modeled is the same as the one used in experimental work and its dimensions are according to data sheet (120-kV rated polymeric housed arrester). After selecting Joule heating physics module, surge arrester’s geometry was built. The geometry comprises three major areas, namely, the zinc oxide blocks, fibre glass and polymeric housing. The geometry of the arrester is shown in Figure 1. Actual dimensions and physical properties were then set. To campare and validate the simulation the results by means of resistive leakge current comparison, an experimental leakage current measurement had been carried out on the same arrester.
RESULTS AND DISCUSSION
Table 1 shows the comparative table between the simulation and experimental data for three significant voltages, namely the phase-to-earth (VP-N), the continuous operating voltage (VCOV), and the rated voltage (Vrated), which are 93kV, 98kV and 120kV, respectively.
Figure 1: Geometry of gapless ZnO surge arrester
Table 1. Computed and measured resistive leakage current of
120kV rated ZnO surge arrester Vrms
(kV) Vpeak
(kV) Ir,simulation
(µA) Ir,experimental
(µA)
93 131.52 1.31 1.33
98 138.59 1.60 1.62
120 169.70 1.81 1.85
CONCLUSIONS
The 120-kV rated, polymeric-housed ZnO arrester was successfully modeled within COMSOL environment. The values of resistive leakage current obtained from simulation and experimental work show that the leakage currents are in good agreement within 2%.
ACKNOWLEDGEMENTS Authors wish to thank Universiti Teknologi
Malaysia (Research Vote Nos. 106H1) for the financial aid.
REFERENCES
[1] Z. Abdul-Malek, N. Yusoff, and M. F. M. Yousof, “Performance analysis of modified shifted current method for surge arrester condition monitoring,” 2010 Int. Conf. High Volt. Eng. Appl. ICHVE 2010, pp. 649–652, 2010.
75
P0054
75
P0054
75
P0054
75
P0054
75
P0054
75
P0054
75
P0054
75
P0054
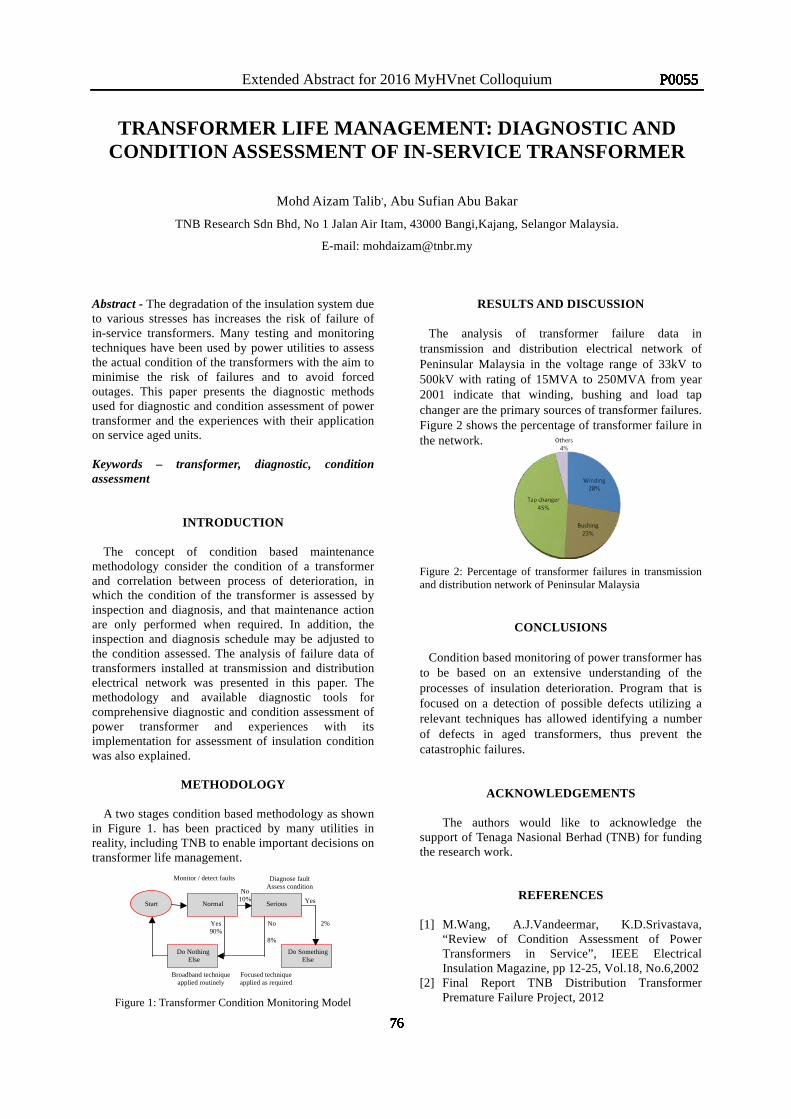
Extended Abstract for 2016 MyHVnet Colloquium
TRANSFORMER LIFE MANAGEMENT: DIAGNOSTIC AND CONDITION ASSESSMENT OF IN-SERVICE TRANSFORMER
Mohd Aizam Talib,, Abu Sufian Abu Bakar
TNB Research Sdn Bhd, No 1 Jalan Air Itam, 43000 Bangi,Kajang, Selangor Malaysia.
E-mail: [email protected] Abstract - The degradation of the insulation system due to various stresses has increases the risk of failure of in-service transformers. Many testing and monitoring techniques have been used by power utilities to assess the actual condition of the transformers with the aim to minimise the risk of failures and to avoid forced outages. This paper presents the diagnostic methods used for diagnostic and condition assessment of power transformer and the experiences with their application on service aged units.
Keywords – transformer, diagnostic, condition assessment
INTRODUCTION
The concept of condition based maintenance methodology consider the condition of a transformer and correlation between process of deterioration, in which the condition of the transformer is assessed by inspection and diagnosis, and that maintenance action are only performed when required. In addition, the inspection and diagnosis schedule may be adjusted to the condition assessed. The analysis of failure data of transformers installed at transmission and distribution electrical network was presented in this paper. The methodology and available diagnostic tools for comprehensive diagnostic and condition assessment of power transformer and experiences with its implementation for assessment of insulation condition was also explained.
METHODOLOGY
A two stages condition based methodology as shown in Figure 1. has been practiced by many utilities in reality, including TNB to enable important decisions on transformer life management.
Figure 1: Transformer Condition Monitoring Model
RESULTS AND DISCUSSION
The analysis of transformer failure data in transmission and distribution electrical network of Peninsular Malaysia in the voltage range of 33kV to 500kV with rating of 15MVA to 250MVA from year 2001 indicate that winding, bushing and load tap changer are the primary sources of transformer failures. Figure 2 shows the percentage of transformer failure in the network.
Figure 2: Percentage of transformer failures in transmission and distribution network of Peninsular Malaysia
CONCLUSIONS
Condition based monitoring of power transformer has to be based on an extensive understanding of the processes of insulation deterioration. Program that is focused on a detection of possible defects utilizing a relevant techniques has allowed identifying a number of defects in aged transformers, thus prevent the catastrophic failures.
ACKNOWLEDGEMENTS The authors would like to acknowledge the
support of Tenaga Nasional Berhad (TNB) for funding the research work.
REFERENCES
[1] M.Wang, A.J.Vandeermar, K.D.Srivastava, “Review of Condition Assessment of Power Transformers in Service”, IEEE Electrical Insulation Magazine, pp 12-25, Vol.18, No.6,2002
[2] Final Report TNB Distribution Transformer Premature Failure Project, 2012
Asset Management Conference for Electric Utilities, 20-22 March 2013, Kuala Lumpur, Malaysia
Page 3 of 6
4.0 TRANSFORMER MONITORING AND DIAGNOSTIC
Life management of power transformer involves a chain of decisions made over through its service life and aimed at safe, reliable and cost effective transformer operation. There are three important tasks that need to be address. The first is incipient failure detection, the second is the identification of transformer malfunction or faulty states and the third is strategic planning, includes among its goal efficient operation and maintenance scheduling, maintenance activities that are necessary to ensure high availability and consideration for the repair or replacement. A two stages condition based methodology as shown in Figure 5. has been proposed [17] to enable important decisions on transformer life management to be made by utilities. Such an approach has been practiced by many utilities in reality, including TNB. Figure 5. Transformer condition based monitoring (CBM) model [17] The main objective of the first stage is to identify transformers which are operating normally so that precious resources are only applied where they are needed. The monitoring techniques used at this stage must be applied regularly, should be inexpensive, ideally on-line and sensitive on any potential problem that can be detected at an early stage. The second stage process, which may be described as diagnosis or condition assessment, would normally carried out on those few transformers, probably less than 10%, which could not be classified as normal. There are different types of diagnostic techniques may be employed to CBM depending upon on its purposes for evaluating the transformer insulation. A summary some of the techniques and their field application was listed in Table 2. Diagnostic Technique Application
DGA Appearance of overheating,
partial discharge and arcing, ageing of oil and paper
Dielectric Dissipation Factor
Dielectric losses in insulation system, moisture, ageing
Partial Discharge Localised defects, deterioration of insulation system
Furfural Ageing of paper insulation Degree of Polymerization
Ageing of paper insulation
Dielectric Spectroscopy
Moisture in paper, ageing of insulation system
Polarization Depolarization Current
Moisture in paper, ageing of insulation system
Frequency Response Analysis
Mechanical condition of winding and core
Moisture Content, Acidity, Interfacial Tension
Oil quality analysis, contamination, oxidation
Table 2. Transformer diagnostic techniques and its application A transformer can be considered as a consist of different components with a number of functional subsystem. Thus, the diagnostic tool or techniques as explained above should be able to diagnose the condition each of the components. Figure 6. shows the diagnostic test chart that can be applied on different components of the transformer.
Figure 6. Transformer diagnostic test chart
5.0 EXPERIENCES ON TRANSFORMER CONDITION ASSESSMENT
5.1 Case Study 1
Start
Normal
Serious
Do Something Else
Do Nothing Else
Monitor / detect faults
Broadband technique applied routinely
Focused technique applied as required
Diagnose fault Assess condition
Yes 90%
No 10%
Yes
No 2%
8%
Bushing • Dielectric loss • Capacitance • Thermography
Oil • Dissolved Gases
Analysis • Dielectric strength • Acidity • Interfacial tension • Water Content • Furans
Winding • Capacitance • Dielectric loss • Partial discharge • Insulation resistance • Ratio/Polarity/Phase • Winding resistance • Leakage reactance • Frequency Response • Recovery Voltage • Frequency Dielectric • Polarization Depolarization • Degree of Polymerization
Tap Changer • Ratio • Dynamic resistance • Motor current • Dielectric strength • Moisture
Core • Excitation current • Frequency Response • Excitation current
Tank and Associated Devices • Visual
inspection • Thermography • Calibration
!
76
P0055
76
P0055
76
P0055
76
P0055
76
P0055
76
P0055
76
P0055
76
P0055
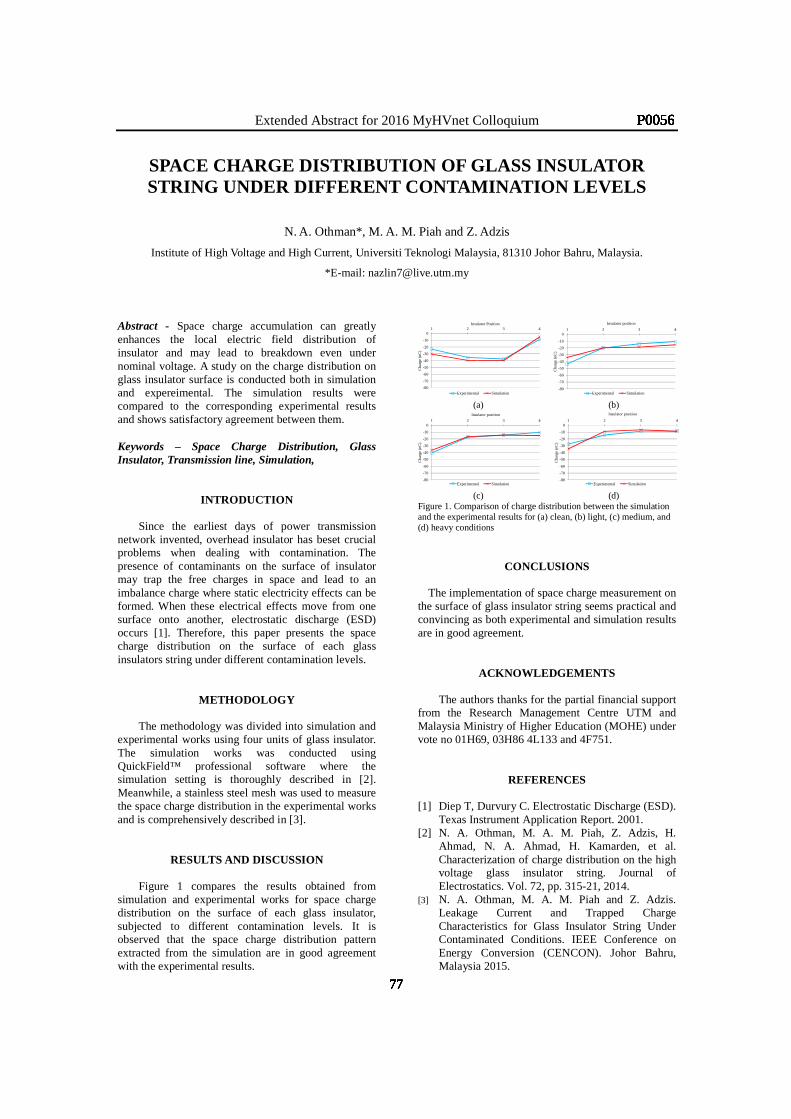
Extended Abstract for 2016 MyHVnet Colloquium
SPACE CHARGE DISTRIBUTION OF GLASS INSULATOR STRING UNDER DIFFERENT CONTAMINATION LEVELS
N. A. Othman*, M. A. M. Piah and Z. Adzis
Institute of High Voltage and High Current, Universiti Teknologi Malaysia, 81310 Johor Bahru, Malaysia.
*E-mail: [email protected] Abstract - Space charge accumulation can greatly enhances the local electric field distribution of insulator and may lead to breakdown even under nominal voltage. A study on the charge distribution on glass insulator surface is conducted both in simulation and expereimental. The simulation results were compared to the corresponding experimental results and shows satisfactory agreement between them.
Keywords – Space Charge Distribution, Glass Insulator, Transmission line, Simulation,
INTRODUCTION
Since the earliest days of power transmission network invented, overhead insulator has beset crucial problems when dealing with contamination. The presence of contaminants on the surface of insulator may trap the free charges in space and lead to an imbalance charge where static electricity effects can be formed. When these electrical effects move from one surface onto another, electrostatic discharge (ESD) occurs [1]. Therefore, this paper presents the space charge distribution on the surface of each glass insulators string under different contamination levels.
METHODOLOGY The methodology was divided into simulation and
experimental works using four units of glass insulator. The simulation works was conducted using QuickField™ professional software where the simulation setting is thoroughly described in [2]. Meanwhile, a stainless steel mesh was used to measure the space charge distribution in the experimental works and is comprehensively described in [3].
RESULTS AND DISCUSSION
Figure 1 compares the results obtained from simulation and experimental works for space charge distribution on the surface of each glass insulator, subjected to different contamination levels. It is observed that the space charge distribution pattern extracted from the simulation are in good agreement with the experimental results.
(a) (b)
(c) (d)
Figure 1. Comparison of charge distribution between the simulation and the experimental results for (a) clean, (b) light, (c) medium, and (d) heavy conditions
CONCLUSIONS
The implementation of space charge measurement on the surface of glass insulator string seems practical and convincing as both experimental and simulation results are in good agreement.
ACKNOWLEDGEMENTS The authors thanks for the partial financial support
from the Research Management Centre UTM and Malaysia Ministry of Higher Education (MOHE) under vote no 01H69, 03H86 4L133 and 4F751.
REFERENCES
[1] Diep T, Durvury C. Electrostatic Discharge (ESD). Texas Instrument Application Report. 2001.
[2] N. A. Othman, M. A. M. Piah, Z. Adzis, H. Ahmad, N. A. Ahmad, H. Kamarden, et al. Characterization of charge distribution on the high voltage glass insulator string. Journal of Electrostatics. Vol. 72, pp. 315-21, 2014.
[3] N. A. Othman, M. A. M. Piah and Z. Adzis. Leakage Current and Trapped Charge Characteristics for Glass Insulator String Under Contaminated Conditions. IEEE Conference on Energy Conversion (CENCON). Johor Bahru, Malaysia 2015.
-80
-70
-60
-50
-40
-30
-20
-10
01 2 3 4
Cha
rge
(nC
)
Insulator Position
Experimental Simulation-80
-70
-60
-50
-40
-30
-20
-10
01 2 3 4
Cha
rge
(nC
)
Insulator position
Experimental Simulation
-80
-70
-60
-50
-40
-30
-20
-10
01 2 3 4
Cha
rge
(nC
)Insulator position
Experimental Simulation-80
-70
-60
-50
-40
-30
-20
-10
01 2 3 4
Cha
rge
(nC
)
Insulator position
Experimental Simulation
77
P0056
77
P0056
77
P0056
77
P0056
77
P0056
77
P0056
77
P0056
77
P0056
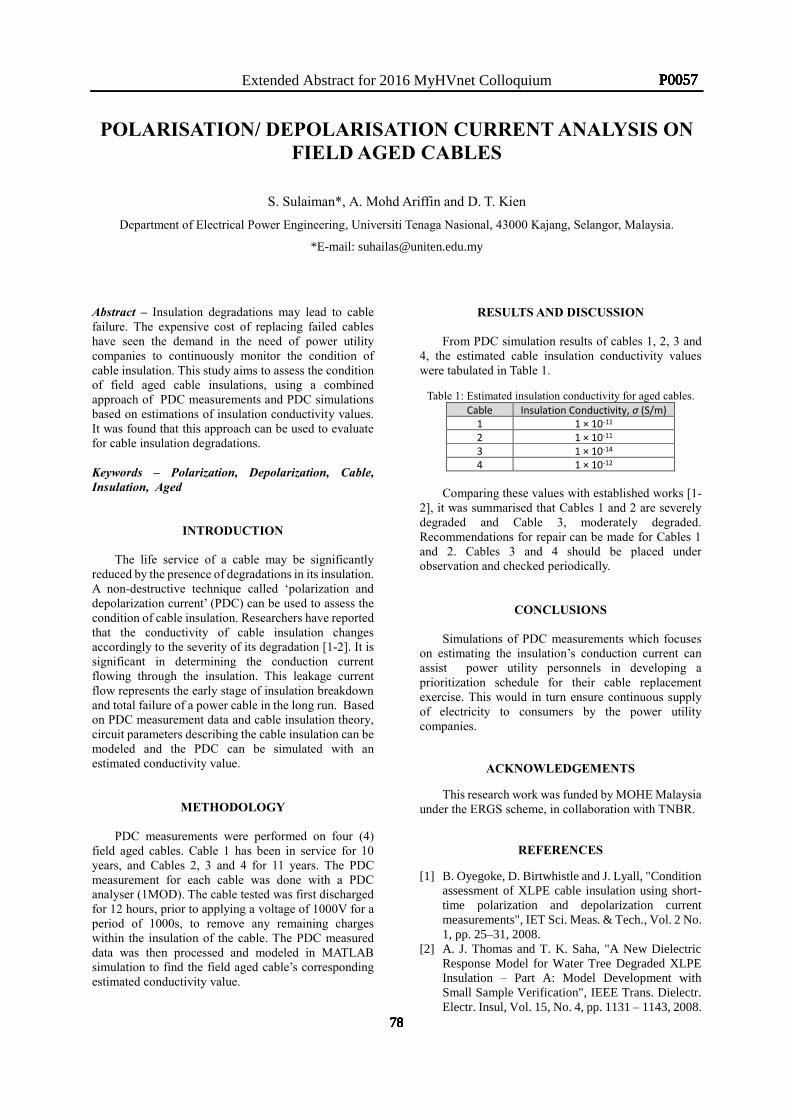
Extended Abstract for 2016 MyHVnet Colloquium
POLARISATION/ DEPOLARISATION CURRENT ANALYSIS ON FIELD AGED CABLES
S. Sulaiman*, A. Mohd Ariffin and D. T. Kien
Department of Electrical Power Engineering, Universiti Tenaga Nasional, 43000 Kajang, Selangor, Malaysia.
*E-mail: [email protected]
Abstract – Insulation degradations may lead to cable failure. The expensive cost of replacing failed cables have seen the demand in the need of power utility companies to continuously monitor the condition of cable insulation. This study aims to assess the condition of field aged cable insulations, using a combined approach of PDC measurements and PDC simulations based on estimations of insulation conductivity values. It was found that this approach can be used to evaluate for cable insulation degradations.
Keywords – Polarization, Depolarization, Cable, Insulation, Aged
INTRODUCTION
The life service of a cable may be significantly reduced by the presence of degradations in its insulation. A non-destructive technique called ‘polarization and depolarization current’ (PDC) can be used to assess the condition of cable insulation. Researchers have reported that the conductivity of cable insulation changes accordingly to the severity of its degradation [1-2]. It is significant in determining the conduction current flowing through the insulation. This leakage current flow represents the early stage of insulation breakdown and total failure of a power cable in the long run. Based on PDC measurement data and cable insulation theory, circuit parameters describing the cable insulation can be modeled and the PDC can be simulated with an estimated conductivity value.
METHODOLOGY PDC measurements were performed on four (4)
field aged cables. Cable 1 has been in service for 10 years, and Cables 2, 3 and 4 for 11 years. The PDC measurement for each cable was done with a PDC analyser (1MOD). The cable tested was first discharged for 12 hours, prior to applying a voltage of 1000V for a period of 1000s, to remove any remaining charges within the insulation of the cable. The PDC measured data was then processed and modeled in MATLAB simulation to find the field aged cable’s corresponding estimated conductivity value.
RESULTS AND DISCUSSION
From PDC simulation results of cables 1, 2, 3 and 4, the estimated cable insulation conductivity values were tabulated in Table 1.
Table 1: Estimated insulation conductivity for aged cables.
Cable Insulation Conductivity, σ (S/m) 1 1 × 10-11 2 1 × 10-11 3 1 × 10-14 4 1 × 10-12
Comparing these values with established works [1-
2], it was summarised that Cables 1 and 2 are severely degraded and Cable 3, moderately degraded. Recommendations for repair can be made for Cables 1 and 2. Cables 3 and 4 should be placed under observation and checked periodically.
CONCLUSIONS
Simulations of PDC measurements which focuses on estimating the insulation’s conduction current can assist power utility personnels in developing a prioritization schedule for their cable replacement exercise. This would in turn ensure continuous supply of electricity to consumers by the power utility companies.
ACKNOWLEDGEMENTS This research work was funded by MOHE Malaysia
under the ERGS scheme, in collaboration with TNBR.
REFERENCES
[1] B. Oyegoke, D. Birtwhistle and J. Lyall, "Condition assessment of XLPE cable insulation using short-time polarization and depolarization current measurements", IET Sci. Meas. & Tech., Vol. 2 No. 1, pp. 25–31, 2008.
[2] A. J. Thomas and T. K. Saha, "A New Dielectric Response Model for Water Tree Degraded XLPE Insulation – Part A: Model Development with Small Sample Verification", IEEE Trans. Dielectr. Electr. Insul, Vol. 15, No. 4, pp. 1131 – 1143, 2008.
78
P0057
78
P0057
78
P0057
78
P0057
78
P0057
78
P0057
78
P0057
78
P0057
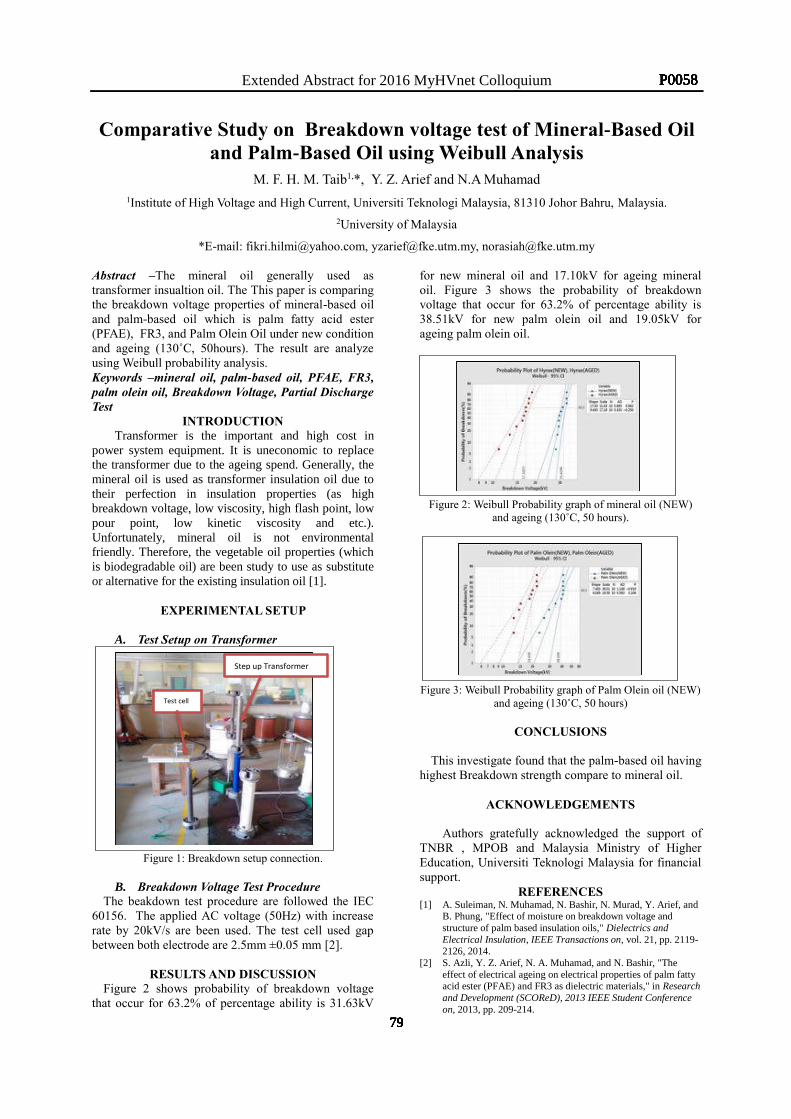
Extended Abstract for 2016 MyHVnet Colloquium
Comparative Study on Breakdown voltage test of Mineral-Based Oil and Palm-Based Oil using Weibull Analysis
M. F. H. M. Taib1,*, Y. Z. Arief and N.A Muhamad 1Institute of High Voltage and High Current, Universiti Teknologi Malaysia, 81310 Johor Bahru, Malaysia.
2University of Malaysia
*E-mail: [email protected], [email protected], [email protected] Abstract –The mineral oil generally used as transformer insualtion oil. The This paper is comparing the breakdown voltage properties of mineral-based oil and palm-based oil which is palm fatty acid ester (PFAE), FR3, and Palm Olein Oil under new condition and ageing (130˚C, 50hours). The result are analyze using Weibull probability analysis. Keywords –mineral oil, palm-based oil, PFAE, FR3, palm olein oil, Breakdown Voltage, Partial Discharge Test
INTRODUCTION Transformer is the important and high cost in
power system equipment. It is uneconomic to replace the transformer due to the ageing spend. Generally, the mineral oil is used as transformer insulation oil due to their perfection in insulation properties (as high breakdown voltage, low viscosity, high flash point, low pour point, low kinetic viscosity and etc.). Unfortunately, mineral oil is not environmental friendly. Therefore, the vegetable oil properties (which is biodegradable oil) are been study to use as substitute or alternative for the existing insulation oil [1].
EXPERIMENTAL SETUP
A. Test Setup on Transformer
Figure 1: Breakdown setup connection.
B. Breakdown Voltage Test Procedure
The beakdown test procedure are followed the IEC 60156. The applied AC voltage (50Hz) with increase rate by 20kV/s are been used. The test cell used gap between both electrode are 2.5mm ±0.05 mm [2].
RESULTS AND DISCUSSION Figure 2 shows probability of breakdown voltage
that occur for 63.2% of percentage ability is 31.63kV
for new mineral oil and 17.10kV for ageing mineral oil. Figure 3 shows the probability of breakdown voltage that occur for 63.2% of percentage ability is 38.51kV for new palm olein oil and 19.05kV for ageing palm olein oil.
Figure 2: Weibull Probability graph of mineral oil (NEW)
and ageing (130˚C, 50 hours).
Figure 3: Weibull Probability graph of Palm Olein oil (NEW)
and ageing (130˚C, 50 hours)
CONCLUSIONS
This investigate found that the palm-based oil having highest Breakdown strength compare to mineral oil.
ACKNOWLEDGEMENTS
Authors gratefully acknowledged the support of
TNBR , MPOB and Malaysia Ministry of Higher Education, Universiti Teknologi Malaysia for financial support.
REFERENCES [1] A. Suleiman, N. Muhamad, N. Bashir, N. Murad, Y. Arief, and
B. Phung, "Effect of moisture on breakdown voltage and structure of palm based insulation oils," Dielectrics and Electrical Insulation, IEEE Transactions on, vol. 21, pp. 2119-2126, 2014.
[2] S. Azli, Y. Z. Arief, N. A. Muhamad, and N. Bashir, "The effect of electrical ageing on electrical properties of palm fatty acid ester (PFAE) and FR3 as dielectric materials," in Research and Development (SCOReD), 2013 IEEE Student Conference on, 2013, pp. 209-214.
Test cell
Step up Transformer
79
P0058
79
P0058
79
P0058
79
P0058
79
P0058
79
P0058
79
P0058
79
P0058
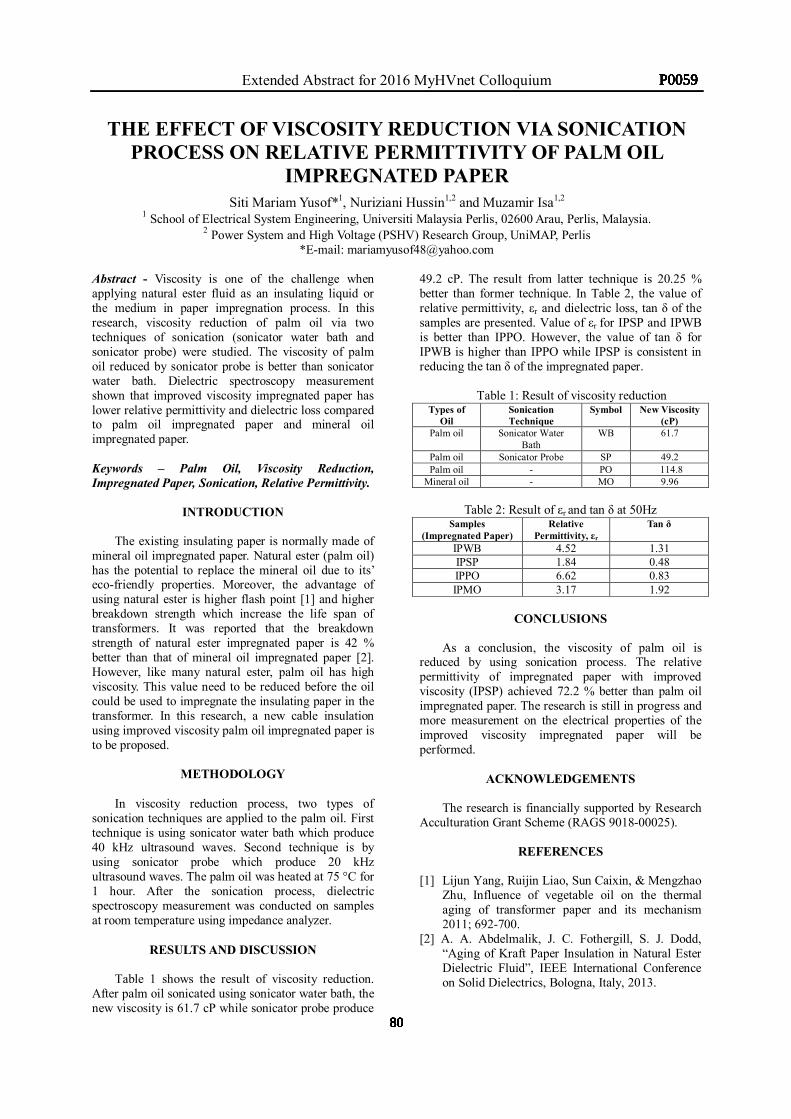
Extended Abstract for 2016 MyHVnet Colloquium
THE EFFECT OF VISCOSITY REDUCTION VIA SONICATION PROCESS ON RELATIVE PERMITTIVITY OF PALM OIL
IMPREGNATED PAPER Siti Mariam Yusof*1, Nuriziani Hussin1,2 and Muzamir Isa1,2
1 School of Electrical System Engineering, Universiti Malaysia Perlis, 02600 Arau, Perlis, Malaysia. 2 Power System and High Voltage (PSHV) Research Group, UniMAP, Perlis
*E-mail: [email protected] Abstract - Viscosity is one of the challenge when applying natural ester fluid as an insulating liquid or the medium in paper impregnation process. In this research, viscosity reduction of palm oil via two techniques of sonication (sonicator water bath and sonicator probe) were studied. The viscosity of palm oil reduced by sonicator probe is better than sonicator water bath. Dielectric spectroscopy measurement shown that improved viscosity impregnated paper has lower relative permittivity and dielectric loss compared to palm oil impregnated paper and mineral oil impregnated paper.
Keywords – Palm Oil, Viscosity Reduction, Impregnated Paper, Sonication, Relative Permittivity.
INTRODUCTION
The existing insulating paper is normally made of mineral oil impregnated paper. Natural ester (palm oil) has the potential to replace the mineral oil due to its’ eco-friendly properties. Moreover, the advantage of using natural ester is higher flash point [1] and higher breakdown strength which increase the life span of transformers. It was reported that the breakdown strength of natural ester impregnated paper is 42 % better than that of mineral oil impregnated paper [2]. However, like many natural ester, palm oil has high viscosity. This value need to be reduced before the oil could be used to impregnate the insulating paper in the transformer. In this research, a new cable insulation using improved viscosity palm oil impregnated paper is to be proposed.
METHODOLOGY
In viscosity reduction process, two types of sonication techniques are applied to the palm oil. First technique is using sonicator water bath which produce 40 kHz ultrasound waves. Second technique is by using sonicator probe which produce 20 kHz ultrasound waves. The palm oil was heated at 75 °C for 1 hour. After the sonication process, dielectric spectroscopy measurement was conducted on samples at room temperature using impedance analyzer.
RESULTS AND DISCUSSION
Table 1 shows the result of viscosity reduction. After palm oil sonicated using sonicator water bath, the new viscosity is 61.7 cP while sonicator probe produce
49.2 cP. The result from latter technique is 20.25 % better than former technique. In Table 2, the value of relative permittivity, εr and dielectric loss, tan δ of the samples are presented. Value of εr for IPSP and IPWB is better than IPPO. However, the value of tan δ for IPWB is higher than IPPO while IPSP is consistent in reducing the tan δ of the impregnated paper.
Table 1: Result of viscosity reduction
Types of Oil
Sonication Technique
Symbol
New Viscosity (cP)
Palm oil Sonicator Water Bath
WB 61.7
Palm oil Sonicator Probe SP 49.2 Palm oil - PO 114.8
Mineral oil - MO 9.96
Table 2: Result of εr and tan δ at 50Hz Samples
(Impregnated Paper) Relative
Permittivity, εr
Tan δ
IPWB 4.52 1.31 IPSP 1.84 0.48 IPPO 6.62 0.83 IPMO 3.17 1.92
CONCLUSIONS
As a conclusion, the viscosity of palm oil is
reduced by using sonication process. The relative permittivity of impregnated paper with improved viscosity (IPSP) achieved 72.2 % better than palm oil impregnated paper. The research is still in progress and more measurement on the electrical properties of the improved viscosity impregnated paper will be performed.
ACKNOWLEDGEMENTS
The research is financially supported by Research
Acculturation Grant Scheme (RAGS 9018-00025).
REFERENCES
[1] Lijun Yang, Ruijin Liao, Sun Caixin, & Mengzhao Zhu, Influence of vegetable oil on the thermal aging of transformer paper and its mechanism 2011; 692-700.
[2] A. A. Abdelmalik, J. C. Fothergill, S. J. Dodd, “Aging of Kraft Paper Insulation in Natural Ester Dielectric Fluid”, IEEE International Conference on Solid Dielectrics, Bologna, Italy, 2013.
80
P0059
80
P0059
80
P0059
80
P0059
80
P0059
80
P0059
80
P0059
80
P0059
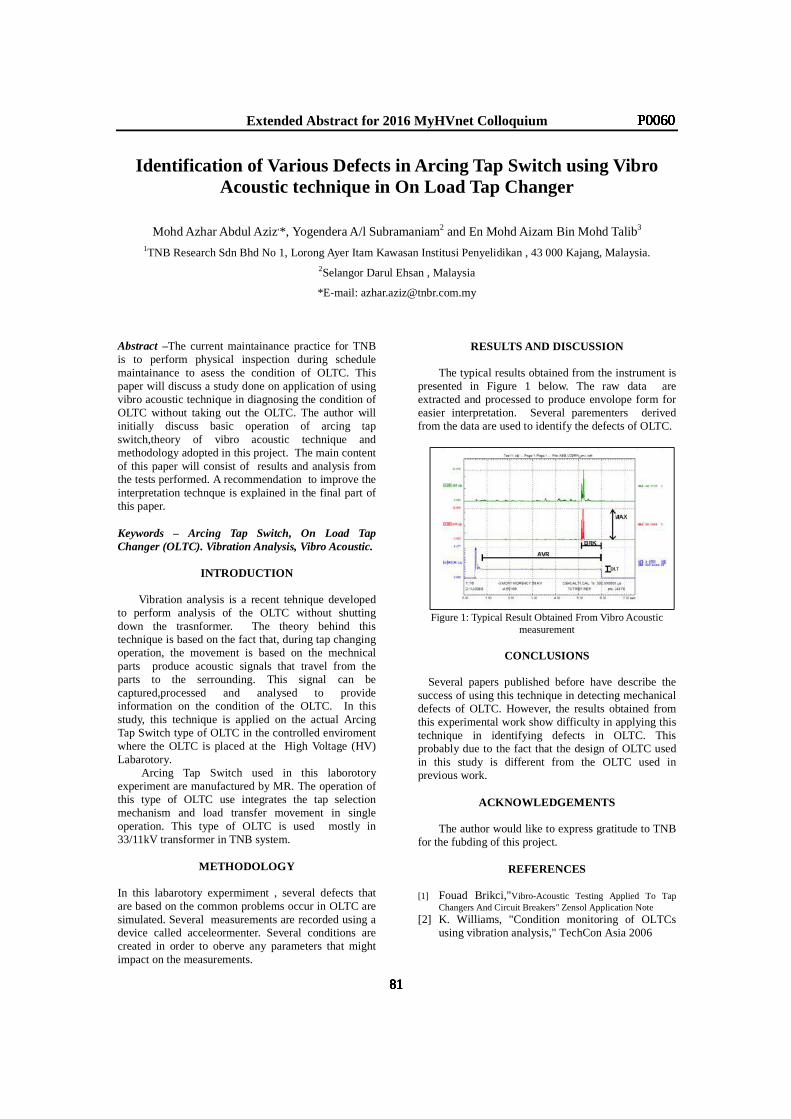
Extended Abstract for 2016 MyHVnet Colloquium
Identification of Various Defects in Arcing Tap Switch using Vibro Acoustic technique in On Load Tap Changer
Mohd Azhar Abdul Aziz,*, Yogendera A/l Subramaniam2 and En Mohd Aizam Bin Mohd Talib3 1TNB Research Sdn Bhd No 1, Lorong Ayer Itam Kawasan Institusi Penyelidikan , 43 000 Kajang, Malaysia.
2Selangor Darul Ehsan , Malaysia
*E-mail: [email protected] Abstract –The current maintainance practice for TNB is to perform physical inspection during schedule maintainance to asess the condition of OLTC. This paper will discuss a study done on application of using vibro acoustic technique in diagnosing the condition of OLTC without taking out the OLTC. The author will initially discuss basic operation of arcing tap switch,theory of vibro acoustic technique and methodology adopted in this project. The main content of this paper will consist of results and analysis from the tests performed. A recommendation to improve the interpretation technque is explained in the final part of this paper.
Keywords – Arcing Tap Switch, On Load Tap Changer (OLTC). Vibration Analysis, Vibro Acoustic.
INTRODUCTION
Vibration analysis is a recent tehnique developed to perform analysis of the OLTC without shutting down the trasnformer. The theory behind this technique is based on the fact that, during tap changing operation, the movement is based on the mechnical parts produce acoustic signals that travel from the parts to the serrounding. This signal can be captured,processed and analysed to provide information on the condition of the OLTC. In this study, this technique is applied on the actual Arcing Tap Switch type of OLTC in the controlled enviroment where the OLTC is placed at the High Voltage (HV) Labarotory.
Arcing Tap Switch used in this laborotory experiment are manufactured by MR. The operation of this type of OLTC use integrates the tap selection mechanism and load transfer movement in single operation. This type of OLTC is used mostly in 33/11kV transformer in TNB system.
METHODOLOGY In this labarotory expermiment , several defects that are based on the common problems occur in OLTC are simulated. Several measurements are recorded using a device called acceleormenter. Several conditions are created in order to oberve any parameters that might impact on the measurements.
RESULTS AND DISCUSSION
The typical results obtained from the instrument is presented in Figure 1 below. The raw data are extracted and processed to produce envolope form for easier interpretation. Several parementers derived from the data are used to identify the defects of OLTC.
Figure 1: Typical Result Obtained From Vibro Acoustic
measurement
CONCLUSIONS
Several papers published before have describe the success of using this technique in detecting mechanical defects of OLTC. However, the results obtained from this experimental work show difficulty in applying this technique in identifying defects in OLTC. This probably due to the fact that the design of OLTC used in this study is different from the OLTC used in previous work.
ACKNOWLEDGEMENTS
The author would like to express gratitude to TNB
for the fubding of this project.
REFERENCES
[1] Fouad Brikci,"Vibro-Acoustic Testing Applied To Tap Changers And Circuit Breakers" Zensol Application Note
[2] K. Williams, "Condition monitoring of OLTCs using vibration analysis," TechCon Asia 2006
81
P0060
81
P0060
81
P0060
81
P0060
81
P0060
81
P0060
81
P0060
81
P0060
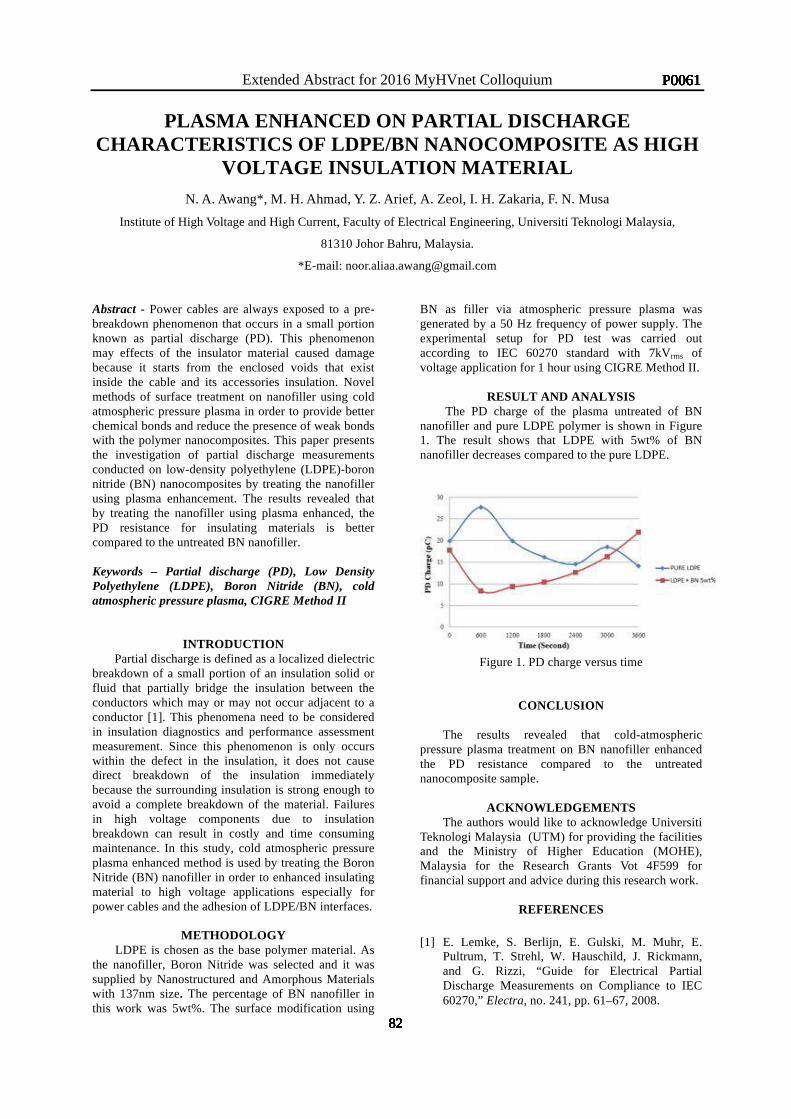
Extended Abstract for 2016 MyHVnet Colloquium
PLASMA ENHANCED ON PARTIAL DISCHARGE CHARACTERISTICS OF LDPE/BN NANOCOMPOSITE AS HIGH
VOLTAGE INSULATION MATERIAL
N. A. Awang*, M. H. Ahmad, Y. Z. Arief, A. Zeol, I. H. Zakaria, F. N. Musa
Institute of High Voltage and High Current, Faculty of Electrical Engineering, Universiti Teknologi Malaysia,
81310 Johor Bahru, Malaysia.
*E-mail: [email protected]
Abstract - Power cables are always exposed to a pre-breakdown phenomenon that occurs in a small portion known as partial discharge (PD). This phenomenon may effects of the insulator material caused damage because it starts from the enclosed voids that exist inside the cable and its accessories insulation. Novel methods of surface treatment on nanofiller using cold atmospheric pressure plasma in order to provide better chemical bonds and reduce the presence of weak bonds with the polymer nanocomposites. This paper presents the investigation of partial discharge measurements conducted on low-density polyethylene (LDPE)-boron nitride (BN) nanocomposites by treating the nanofiller using plasma enhancement. The results revealed that by treating the nanofiller using plasma enhanced, the PD resistance for insulating materials is better compared to the untreated BN nanofiller. Keywords – Partial discharge (PD), Low Density Polyethylene (LDPE), Boron Nitride (BN), cold atmospheric pressure plasma, CIGRE Method II
INTRODUCTION Partial discharge is defined as a localized dielectric breakdown of a small portion of an insulation solid or fluid that partially bridge the insulation between the conductors which may or may not occur adjacent to a conductor [1]. This phenomena need to be considered in insulation diagnostics and performance assessment measurement. Since this phenomenon is only occurs within the defect in the insulation, it does not cause direct breakdown of the insulation immediately because the surrounding insulation is strong enough to avoid a complete breakdown of the material. Failures in high voltage components due to insulation breakdown can result in costly and time consuming maintenance. In this study, cold atmospheric pressure plasma enhanced method is used by treating the Boron Nitride (BN) nanofiller in order to enhanced insulating material to high voltage applications especially for power cables and the adhesion of LDPE/BN interfaces.
METHODOLOGY LDPE is chosen as the base polymer material. As
the nanofiller, Boron Nitride was selected and it was supplied by Nanostructured and Amorphous Materials with 137nm size. The percentage of BN nanofiller in this work was 5wt%. The surface modification using
BN as filler via atmospheric pressure plasma was generated by a 50 Hz frequency of power supply. The experimental setup for PD test was carried out according to IEC 60270 standard with 7kVrms of voltage application for 1 hour using CIGRE Method II.
RESULT AND ANALYSIS The PD charge of the plasma untreated of BN nanofiller and pure LDPE polymer is shown in Figure 1. The result shows that LDPE with 5wt% of BN nanofiller decreases compared to the pure LDPE.
Figure 1. PD charge versus time
CONCLUSION The results revealed that cold-atmospheric
pressure plasma treatment on BN nanofiller enhanced the PD resistance compared to the untreated nanocomposite sample.
ACKNOWLEDGEMENTS
The authors would like to acknowledge Universiti Teknologi Malaysia (UTM) for providing the facilities and the Ministry of Higher Education (MOHE), Malaysia for the Research Grants Vot 4F599 for financial support and advice during this research work.
REFERENCES
[1] E. Lemke, S. Berlijn, E. Gulski, M. Muhr, E. Pultrum, T. Strehl, W. Hauschild, J. Rickmann, and G. Rizzi, “Guide for Electrical Partial Discharge Measurements on Compliance to IEC 60270,” Electra, no. 241, pp. 61–67, 2008.
P0061
82
P0061
82
P0061
82
P0061
82
P0061
82
P0061
82
P0061
82
P0061
82
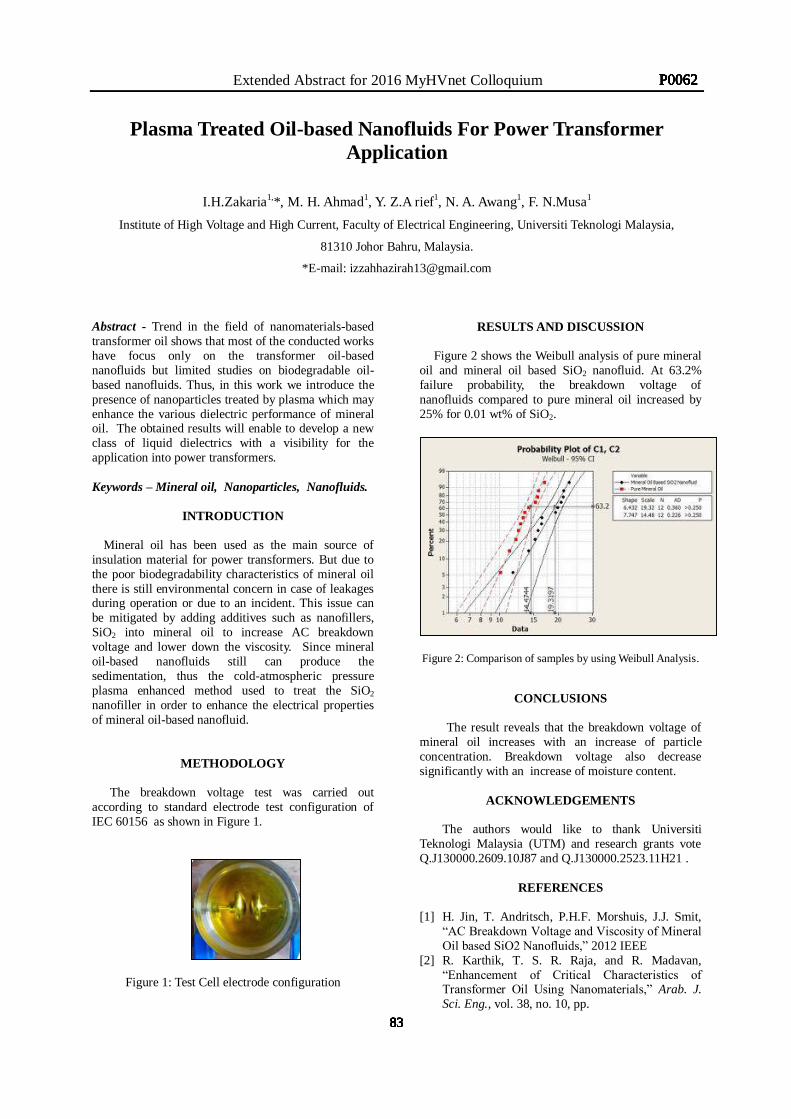
Extended Abstract for 2016 MyHVnet Colloquium
Plasma Treated Oil-based Nanofluids For Power Transformer Application
I.H.Zakaria1,*, M. H. Ahmad1, Y. Z.A rief1, N. A. Awang1, F. N.Musa1
Institute of High Voltage and High Current, Faculty of Electrical Engineering, Universiti Teknologi Malaysia,
81310 Johor Bahru, Malaysia.
*E-mail: [email protected] Abstract - Trend in the field of nanomaterials-based transformer oil shows that most of the conducted works have focus only on the transformer oil-based nanofluids but limited studies on biodegradable oil-based nanofluids. Thus, in this work we introduce the presence of nanoparticles treated by plasma which may enhance the various dielectric performance of mineral oil. The obtained results will enable to develop a new class of liquid dielectrics with a visibility for the application into power transformers.
Keywords – Mineral oil, Nanoparticles, Nanofluids.
INTRODUCTION
Mineral oil has been used as the main source of insulation material for power transformers. But due to the poor biodegradability characteristics of mineral oil there is still environmental concern in case of leakages during operation or due to an incident. This issue can be mitigated by adding additives such as nanofillers, SiO2 into mineral oil to increase AC breakdown voltage and lower down the viscosity. Since mineral oil-based nanofluids still can produce the sedimentation, thus the cold-atmospheric pressure plasma enhanced method used to treat the SiO2
nanofiller in order to enhance the electrical properties of mineral oil-based nanofluid.
METHODOLOGY
The breakdown voltage test was carried out according to standard electrode test configuration of IEC 60156 as shown in Figure 1.
Figure 1: Test Cell electrode configuration
RESULTS AND DISCUSSION
Figure 2 shows the Weibull analysis of pure mineral oil and mineral oil based SiO2 nanofluid. At 63.2% failure probability, the breakdown voltage of nanofluids compared to pure mineral oil increased by 25% for 0.01 wt% of SiO2.
Figure 2: Comparison of samples by using Weibull Analysis.
CONCLUSIONS
The result reveals that the breakdown voltage of mineral oil increases with an increase of particle concentration. Breakdown voltage also decrease significantly with an increase of moisture content.
ACKNOWLEDGEMENTS
The authors would like to thank Universiti
Teknologi Malaysia (UTM) and research grants vote Q.J130000.2609.10J87 and Q.J130000.2523.11H21 .
REFERENCES
[1] H. Jin, T. Andritsch, P.H.F. Morshuis, J.J. Smit,
“AC Breakdown Voltage and Viscosity of Mineral Oil based SiO2 Nanofluids,” 2012 IEEE
[2] R. Karthik, T. S. R. Raja, and R. Madavan, “Enhancement of Critical Characteristics of Transformer Oil Using Nanomaterials,” Arab. J. Sci. Eng., vol. 38, no. 10, pp.
83
P0062
83
P0062
83
P0062
83
P0062
83
P0062
83
P0062
83
P0062
83
P0062
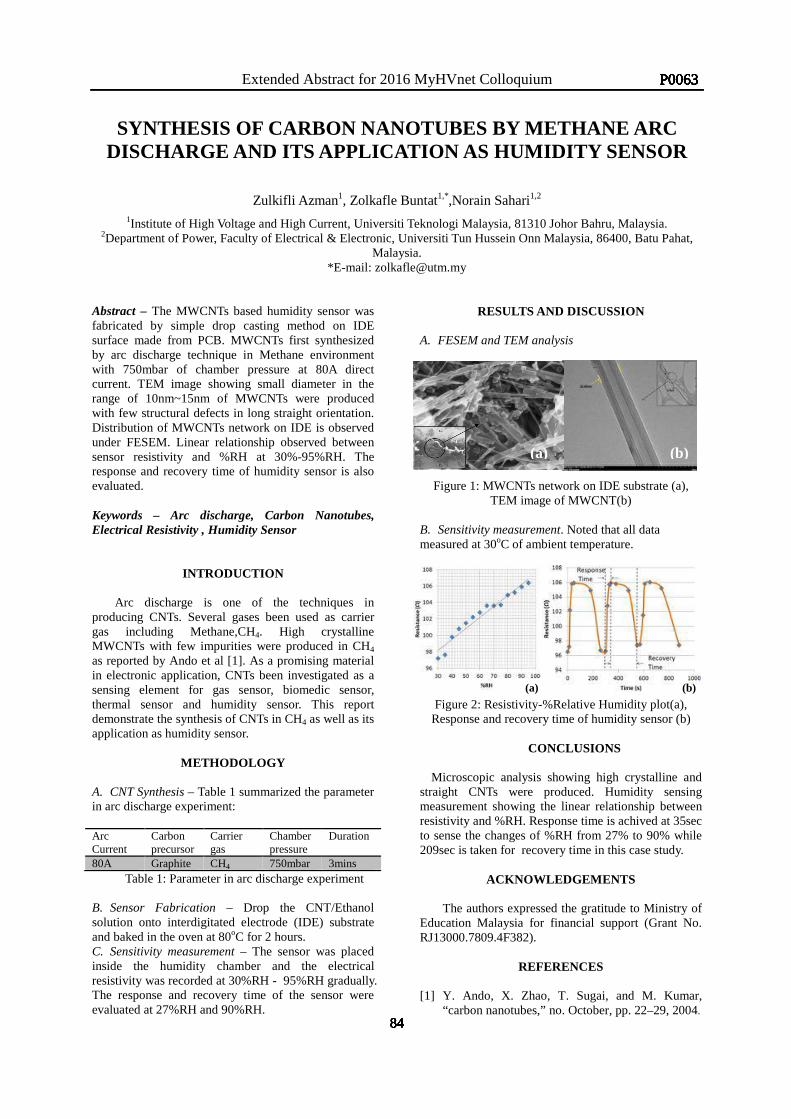
Extended Abstract for 2016 MyHVnet Colloquium
SYNTHESIS OF CARBON NANOTUBES BY METHANE ARC DISCHARGE AND ITS APPLICATION AS HUMIDITY SENSOR
Zulkifli Azman1, Zolkafle Buntat1,*,Norain Sahari1,2 1Institute of High Voltage and High Current, Universiti Teknologi Malaysia, 81310 Johor Bahru, Malaysia.
2Department of Power, Faculty of Electrical & Electronic, Universiti Tun Hussein Onn Malaysia, 86400, Batu Pahat, Malaysia.
*E-mail: [email protected] Abstract – The MWCNTs based humidity sensor was fabricated by simple drop casting method on IDE surface made from PCB. MWCNTs first synthesized by arc discharge technique in Methane environment with 750mbar of chamber pressure at 80A direct current. TEM image showing small diameter in the range of 10nm~15nm of MWCNTs were produced with few structural defects in long straight orientation. Distribution of MWCNTs network on IDE is observed under FESEM. Linear relationship observed between sensor resistivity and %RH at 30%-95%RH. The response and recovery time of humidity sensor is also evaluated.
Keywords – Arc discharge, Carbon Nanotubes, Electrical Resistivity , Humidity Sensor
INTRODUCTION
Arc discharge is one of the techniques in producing CNTs. Several gases been used as carrier gas including Methane,CH4. High crystalline MWCNTs with few impurities were produced in CH4 as reported by Ando et al [1]. As a promising material in electronic application, CNTs been investigated as a sensing element for gas sensor, biomedic sensor, thermal sensor and humidity sensor. This report demonstrate the synthesis of CNTs in CH4 as well as its application as humidity sensor.
METHODOLOGY
A. CNT Synthesis – Table 1 summarized the parameter in arc discharge experiment: Arc Current
Carbon precursor
Carrier gas
Chamber pressure
Duration
80A Graphite CH4 750mbar 3mins Table 1: Parameter in arc discharge experiment
B. Sensor Fabrication – Drop the CNT/Ethanol solution onto interdigitated electrode (IDE) substrate and baked in the oven at 80oC for 2 hours. C. Sensitivity measurement – The sensor was placed inside the humidity chamber and the electrical resistivity was recorded at 30%RH - 95%RH gradually. The response and recovery time of the sensor were evaluated at 27%RH and 90%RH.
RESULTS AND DISCUSSION
A. FESEM and TEM analysis
Figure 1: MWCNTs network on IDE substrate (a), TEM image of MWCNT(b)
B. Sensitivity measurement. Noted that all data measured at 30oC of ambient temperature.
Figure 2: Resistivity-%Relative Humidity plot(a), Response and recovery time of humidity sensor (b)
CONCLUSIONS
Microscopic analysis showing high crystalline and
straight CNTs were produced. Humidity sensing measurement showing the linear relationship between resistivity and %RH. Response time is achived at 35sec to sense the changes of %RH from 27% to 90% while 209sec is taken for recovery time in this case study.
ACKNOWLEDGEMENTS The authors expressed the gratitude to Ministry of
Education Malaysia for financial support (Grant No. RJ13000.7809.4F382).
REFERENCES [1] Y. Ando, X. Zhao, T. Sugai, and M. Kumar,
“carbon nanotubes,” no. October, pp. 22–29, 2004.
(b) (a)
(a) (b)
84
P0063
84
P0063
84
P0063
84
P0063
84
P0063
84
P0063
84
P0063
84
P0063
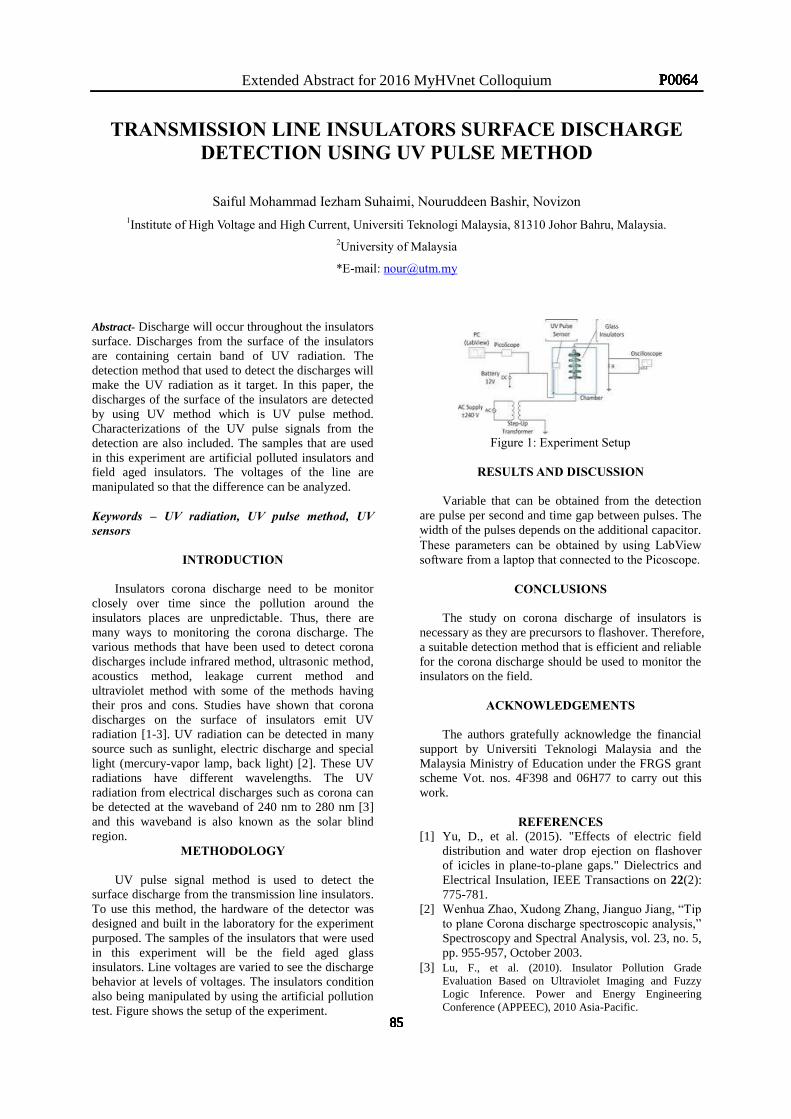
Extended Abstract for 2016 MyHVnet Colloquium
TRANSMISSION LINE INSULATORS SURFACE DISCHARGE DETECTION USING UV PULSE METHOD
Saiful Mohammad Iezham Suhaimi, Nouruddeen Bashir, Novizon 1Institute of High Voltage and High Current, Universiti Teknologi Malaysia, 81310 Johor Bahru, Malaysia.
2University of Malaysia
*E-mail: [email protected] Abstract- Discharge will occur throughout the insulators surface. Discharges from the surface of the insulators are containing certain band of UV radiation. The detection method that used to detect the discharges will make the UV radiation as it target. In this paper, the discharges of the surface of the insulators are detected by using UV method which is UV pulse method. Characterizations of the UV pulse signals from the detection are also included. The samples that are used in this experiment are artificial polluted insulators and field aged insulators. The voltages of the line are manipulated so that the difference can be analyzed.
Keywords – UV radiation, UV pulse method, UV sensors
INTRODUCTION
Insulators corona discharge need to be monitor closely over time since the pollution around the insulators places are unpredictable. Thus, there are many ways to monitoring the corona discharge. The various methods that have been used to detect corona discharges include infrared method, ultrasonic method, acoustics method, leakage current method and ultraviolet method with some of the methods having their pros and cons. Studies have shown that corona discharges on the surface of insulators emit UV radiation [1-3]. UV radiation can be detected in many source such as sunlight, electric discharge and special light (mercury-vapor lamp, back light) [2]. These UV radiations have different wavelengths. The UV radiation from electrical discharges such as corona can be detected at the waveband of 240 nm to 280 nm [3] and this waveband is also known as the solar blind region.
METHODOLOGY
UV pulse signal method is used to detect the surface discharge from the transmission line insulators. To use this method, the hardware of the detector was designed and built in the laboratory for the experiment purposed. The samples of the insulators that were used in this experiment will be the field aged glass insulators. Line voltages are varied to see the discharge behavior at levels of voltages. The insulators condition also being manipulated by using the artificial pollution test. Figure shows the setup of the experiment.
Figure 1: Experiment Setup
RESULTS AND DISCUSSION
Variable that can be obtained from the detection
are pulse per second and time gap between pulses. The width of the pulses depends on the additional capacitor.
These
These parameters can be obtained by using LabView software from a laptop that connected to the Picoscope.
CONCLUSIONS
The study on corona discharge of insulators is
necessary as they are precursors to flashover. Therefore, a suitable detection method that is efficient and reliable for the corona discharge should be used to monitor the insulators on the field.
ACKNOWLEDGEMENTS
The authors gratefully acknowledge the financial support by Universiti Teknologi Malaysia and the Malaysia Ministry of Education under the FRGS grant scheme Vot. nos. 4F398 and 06H77 to carry out this work.
REFERENCES
[1] Yu, D., et al. (2015). "Effects of electric field distribution and water drop ejection on flashover of icicles in plane-to-plane gaps." Dielectrics and Electrical Insulation, IEEE Transactions on 22(2): 775-781.
[2] Wenhua Zhao, Xudong Zhang, Jianguo Jiang, “Tip to plane Corona discharge spectroscopic analysis,” Spectroscopy and Spectral Analysis, vol. 23, no. 5, pp. 955-957, October 2003.
[3] Lu, F., et al. (2010). Insulator Pollution Grade Evaluation Based on Ultraviolet Imaging and Fuzzy Logic Inference. Power and Energy Engineering Conference (APPEEC), 2010 Asia-Pacific.
85
P0064
85
P0064
85
P0064
85
P0064
85
P0064
85
P0064
85
P0064
85
P0064
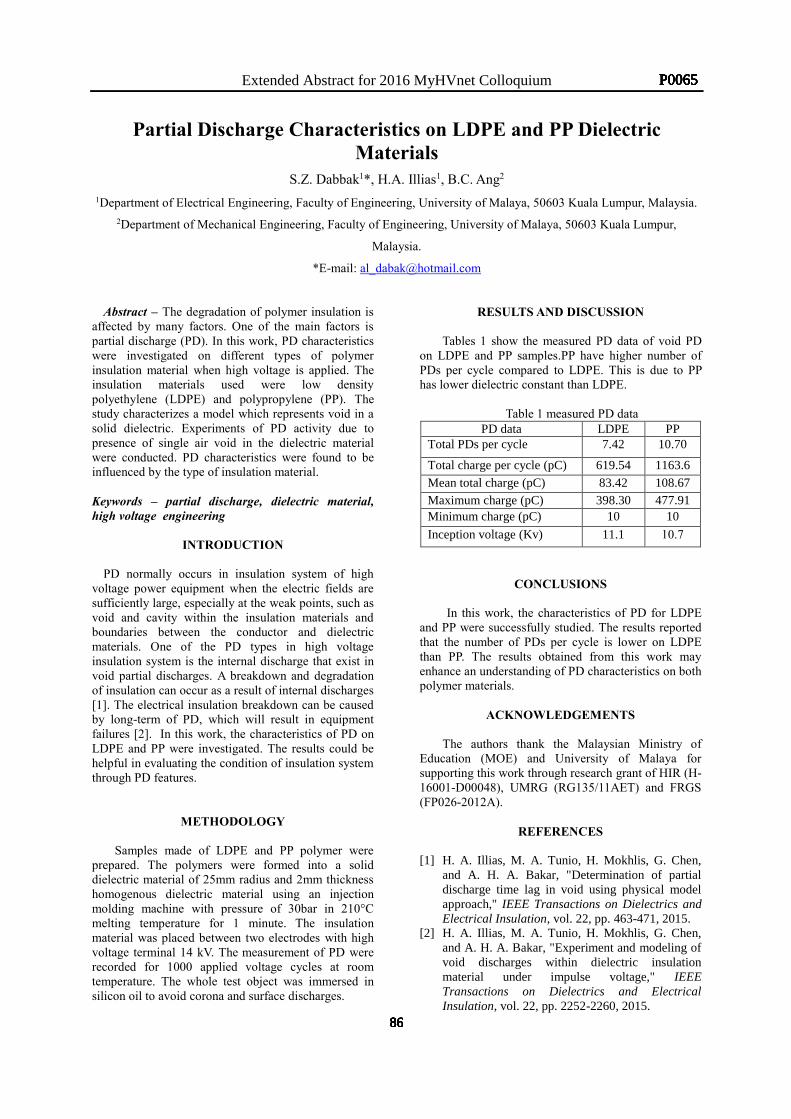
Extended Abstract for 2016 MyHVnet Colloquium
Partial Discharge Characteristics on LDPE and PP Dielectric Materials
S.Z. Dabbak1*, H.A. Illias1, B.C. Ang2 1Department of Electrical Engineering, Faculty of Engineering, University of Malaya, 50603 Kuala Lumpur, Malaysia.
2Department of Mechanical Engineering, Faculty of Engineering, University of Malaya, 50603 Kuala Lumpur,
Malaysia.
*E-mail: [email protected]
Abstract – The degradation of polymer insulation is affected by many factors. One of the main factors is partial discharge (PD). In this work, PD characteristics were investigated on different types of polymer insulation material when high voltage is applied. The insulation materials used were low density polyethylene (LDPE) and polypropylene (PP). The study characterizes a model which represents void in a solid dielectric. Experiments of PD activity due to presence of single air void in the dielectric material were conducted. PD characteristics were found to be influenced by the type of insulation material.
Keywords – partial discharge, dielectric material, high voltage engineering
INTRODUCTION
PD normally occurs in insulation system of high voltage power equipment when the electric fields are sufficiently large, especially at the weak points, such as void and cavity within the insulation materials and boundaries between the conductor and dielectric materials. One of the PD types in high voltage insulation system is the internal discharge that exist in void partial discharges. A breakdown and degradation of insulation can occur as a result of internal discharges [1]. The electrical insulation breakdown can be caused by long-term of PD, which will result in equipment failures [2]. In this work, the characteristics of PD on LDPE and PP were investigated. The results could be helpful in evaluating the condition of insulation system through PD features.
METHODOLOGY
Samples made of LDPE and PP polymer were prepared. The polymers were formed into a solid dielectric material of 25mm radius and 2mm thickness homogenous dielectric material using an injection molding machine with pressure of 30bar in 210°C melting temperature for 1 minute. The insulation material was placed between two electrodes with high voltage terminal 14 kV. The measurement of PD were recorded for 1000 applied voltage cycles at room temperature. The whole test object was immersed in silicon oil to avoid corona and surface discharges.
RESULTS AND DISCUSSION
Tables 1 show the measured PD data of void PD on LDPE and PP samples.PP have higher number of PDs per cycle compared to LDPE. This is due to PP has lower dielectric constant than LDPE.
Table 1 measured PD data
PD data LDPE PP Total PDs per cycle 7.42 10.70
Total charge per cycle (pC) 619.54 1163.6
Mean total charge (pC) 83.42 108.67 Maximum charge (pC) 398.30 477.91 Minimum charge (pC) 10 10
Inception voltage (Kv) 11.1 10.7
CONCLUSIONS
In this work, the characteristics of PD for LDPE and PP were successfully studied. The results reported that the number of PDs per cycle is lower on LDPE than PP. The results obtained from this work may enhance an understanding of PD characteristics on both polymer materials.
ACKNOWLEDGEMENTS
The authors thank the Malaysian Ministry of
Education (MOE) and University of Malaya for supporting this work through research grant of HIR (H-16001-D00048), UMRG (RG135/11AET) and FRGS (FP026-2012A).
REFERENCES
[1] H. A. Illias, M. A. Tunio, H. Mokhlis, G. Chen,
and A. H. A. Bakar, "Determination of partial discharge time lag in void using physical model approach," IEEE Transactions on Dielectrics and Electrical Insulation, vol. 22, pp. 463-471, 2015.
[2] H. A. Illias, M. A. Tunio, H. Mokhlis, G. Chen, and A. H. A. Bakar, "Experiment and modeling of void discharges within dielectric insulation material under impulse voltage," IEEE Transactions on Dielectrics and Electrical Insulation, vol. 22, pp. 2252-2260, 2015.
86
P0065
86
P0065
86
P0065
86
P0065
86
P0065
86
P0065
86
P0065
86
P0065
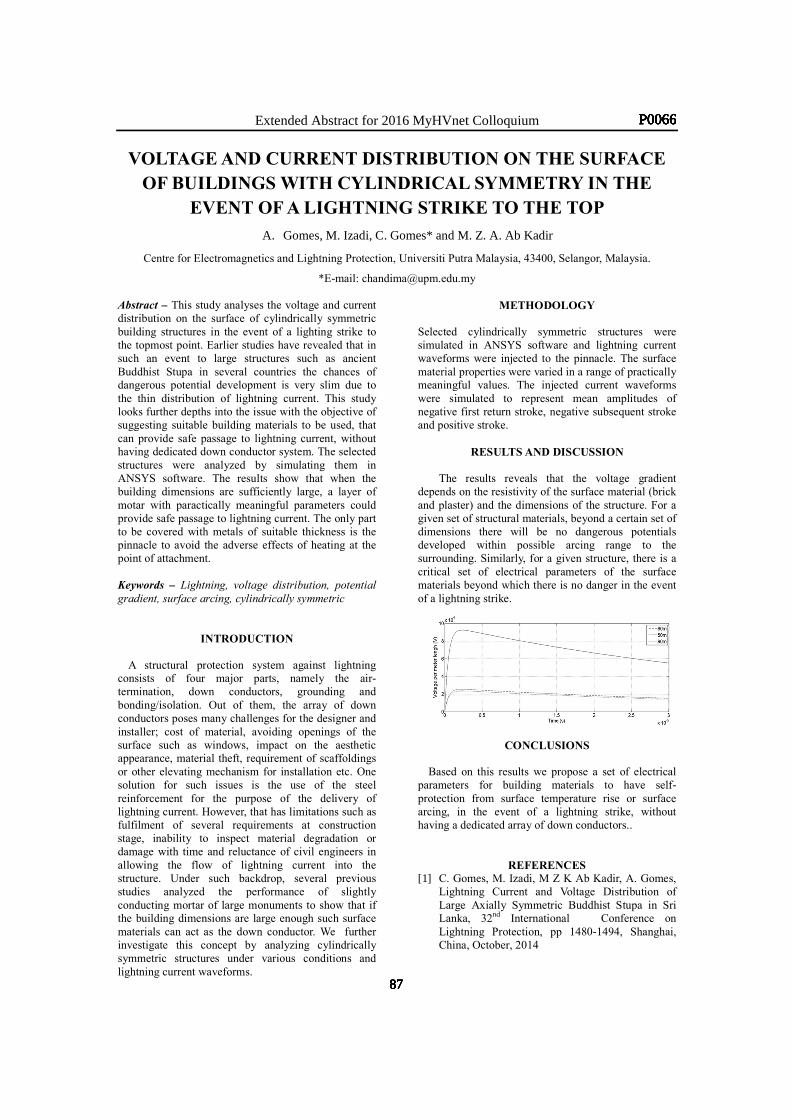
Extended Abstract for 2016 MyHVnet Colloquium
VOLTAGE AND CURRENT DISTRIBUTION ON THE SURFACE OF BUILDINGS WITH CYLINDRICAL SYMMETRY IN THE
EVENT OF A LIGHTNING STRIKE TO THE TOP A. Gomes, M. Izadi, C. Gomes* and M. Z. A. Ab Kadir
Centre for Electromagnetics and Lightning Protection, Universiti Putra Malaysia, 43400, Selangor, Malaysia.
*E-mail: [email protected] Abstract – This study analyses the voltage and current distribution on the surface of cylindrically symmetric building structures in the event of a lighting strike to the topmost point. Earlier studies have revealed that in such an event to large structures such as ancient Buddhist Stupa in several countries the chances of dangerous potential development is very slim due to the thin distribution of lightning current. This study looks further depths into the issue with the objective of suggesting suitable building materials to be used, that can provide safe passage to lightning current, without having dedicated down conductor system. The selected structures were analyzed by simulating them in ANSYS software. The results show that when the building dimensions are sufficiently large, a layer of motar with paractically meaningful parameters could provide safe passage to lightning current. The only part to be covered with metals of suitable thickness is the pinnacle to avoid the adverse effects of heating at the point of attachment. Keywords – Lightning, voltage distribution, potential gradient, surface arcing, cylindrically symmetric
INTRODUCTION
A structural protection system against lightning consists of four major parts, namely the air-termination, down conductors, grounding and bonding/isolation. Out of them, the array of down conductors poses many challenges for the designer and installer; cost of material, avoiding openings of the surface such as windows, impact on the aesthetic appearance, material theft, requirement of scaffoldings or other elevating mechanism for installation etc. One solution for such issues is the use of the steel reinforcement for the purpose of the delivery of lightning current. However, that has limitations such as fulfilment of several requirements at construction stage, inability to inspect material degradation or damage with time and reluctance of civil engineers in allowing the flow of lightning current into the structure. Under such backdrop, several previous studies analyzed the performance of slightly conducting mortar of large monuments to show that if the building dimensions are large enough such surface materials can act as the down conductor. We further investigate this concept by analyzing cylindrically symmetric structures under various conditions and lightning current waveforms.
METHODOLOGY
Selected cylindrically symmetric structures were simulated in ANSYS software and lightning current waveforms were injected to the pinnacle. The surface material properties were varied in a range of practically meaningful values. The injected current waveforms were simulated to represent mean amplitudes of negative first return stroke, negative subsequent stroke and positive stroke.
RESULTS AND DISCUSSION
The results reveals that the voltage gradient depends on the resistivity of the surface material (brick and plaster) and the dimensions of the structure. For a given set of structural materials, beyond a certain set of dimensions there will be no dangerous potentials developed within possible arcing range to the surrounding. Similarly, for a given structure, there is a critical set of electrical parameters of the surface materials beyond which there is no danger in the event of a lightning strike.
CONCLUSIONS
Based on this results we propose a set of electrical parameters for building materials to have self-protection from surface temperature rise or surface arcing, in the event of a lightning strike, without having a dedicated array of down conductors..
REFERENCES [1] C. Gomes, M. Izadi, M Z K Ab Kadir, A. Gomes,
Lightning Current and Voltage Distribution of Large Axially Symmetric Buddhist Stupa in Sri Lanka, 32nd International Conference on Lightning Protection, pp 1480-1494, Shanghai, China, October, 2014
87
P0066
87
P0066
87
P0066
87
P0066
87
P0066
87
P0066
87
P0066
87
P0066
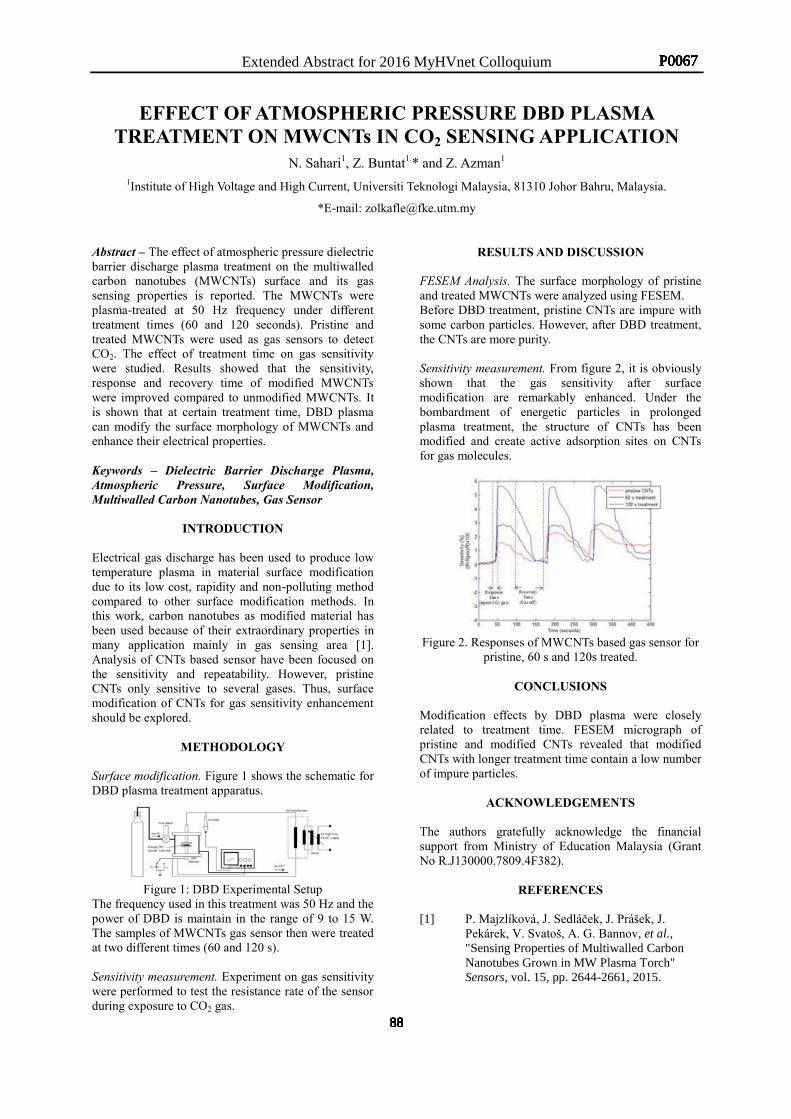
Extended Abstract for 2016 MyHVnet Colloquium
EFFECT OF ATMOSPHERIC PRESSURE DBD PLASMA TREATMENT ON MWCNTs IN CO2 SENSING APPLICATION
N. Sahari1, Z. Buntat1.* and Z. Azman1 1Institute of High Voltage and High Current, Universiti Teknologi Malaysia, 81310 Johor Bahru, Malaysia.
*E-mail: [email protected] Abstract – The effect of atmospheric pressure dielectric barrier discharge plasma treatment on the multiwalled carbon nanotubes (MWCNTs) surface and its gas sensing properties is reported. The MWCNTs were plasma-treated at 50 Hz frequency under different treatment times (60 and 120 seconds). Pristine and treated MWCNTs were used as gas sensors to detect CO2. The effect of treatment time on gas sensitivity were studied. Results showed that the sensitivity, response and recovery time of modified MWCNTs were improved compared to unmodified MWCNTs. It is shown that at certain treatment time, DBD plasma can modify the surface morphology of MWCNTs and enhance their electrical properties.
Keywords – Dielectric Barrier Discharge Plasma, Atmospheric Pressure, Surface Modification, Multiwalled Carbon Nanotubes, Gas Sensor
INTRODUCTION
Electrical gas discharge has been used to produce low temperature plasma in material surface modification due to its low cost, rapidity and non-polluting method compared to other surface modification methods. In this work, carbon nanotubes as modified material has been used because of their extraordinary properties in many application mainly in gas sensing area [1]. Analysis of CNTs based sensor have been focused on the sensitivity and repeatability. However, pristine CNTs only sensitive to several gases. Thus, surface modification of CNTs for gas sensitivity enhancement should be explored.
METHODOLOGY
Surface modification. Figure 1 shows the schematic for DBD plasma treatment apparatus.
Figure 1: DBD Experimental Setup
The frequency used in this treatment was 50 Hz and the power of DBD is maintain in the range of 9 to 15 W. The samples of MWCNTs gas sensor then were treated at two different times (60 and 120 s). Sensitivity measurement. Experiment on gas sensitivity were performed to test the resistance rate of the sensor during exposure to CO2 gas.
RESULTS AND DISCUSSION
FESEM Analysis. The surface morphology of pristine and treated MWCNTs were analyzed using FESEM. Before DBD treatment, pristine CNTs are impure with some carbon particles. However, after DBD treatment, the CNTs are more purity.
Sensitivity measurement. From figure 2, it is obviously shown that the gas sensitivity after surface modification are remarkably enhanced. Under the bombardment of energetic particles in prolonged plasma treatment, the structure of CNTs has been modified and create active adsorption sites on CNTs for gas molecules.
Figure 2. Responses of MWCNTs based gas sensor for
pristine, 60 s and 120s treated.
CONCLUSIONS
Modification effects by DBD plasma were closely related to treatment time. FESEM micrograph of pristine and modified CNTs revealed that modified CNTs with longer treatment time contain a low number of impure particles.
ACKNOWLEDGEMENTS
The authors gratefully acknowledge the financial support from Ministry of Education Malaysia (Grant No R.J130000.7809.4F382).
REFERENCES
[1] P. Majzlíková, J. Sedláček, J. Prášek, J.
Pekárek, V. Svatoš, A. G. Bannov, et al., "Sensing Properties of Multiwalled Carbon Nanotubes Grown in MW Plasma Torch" Sensors, vol. 15, pp. 2644-2661, 2015.
88
P0067
88
P0067
88
P0067
88
P0067
88
P0067
88
P0067
88
P0067
88
P0067
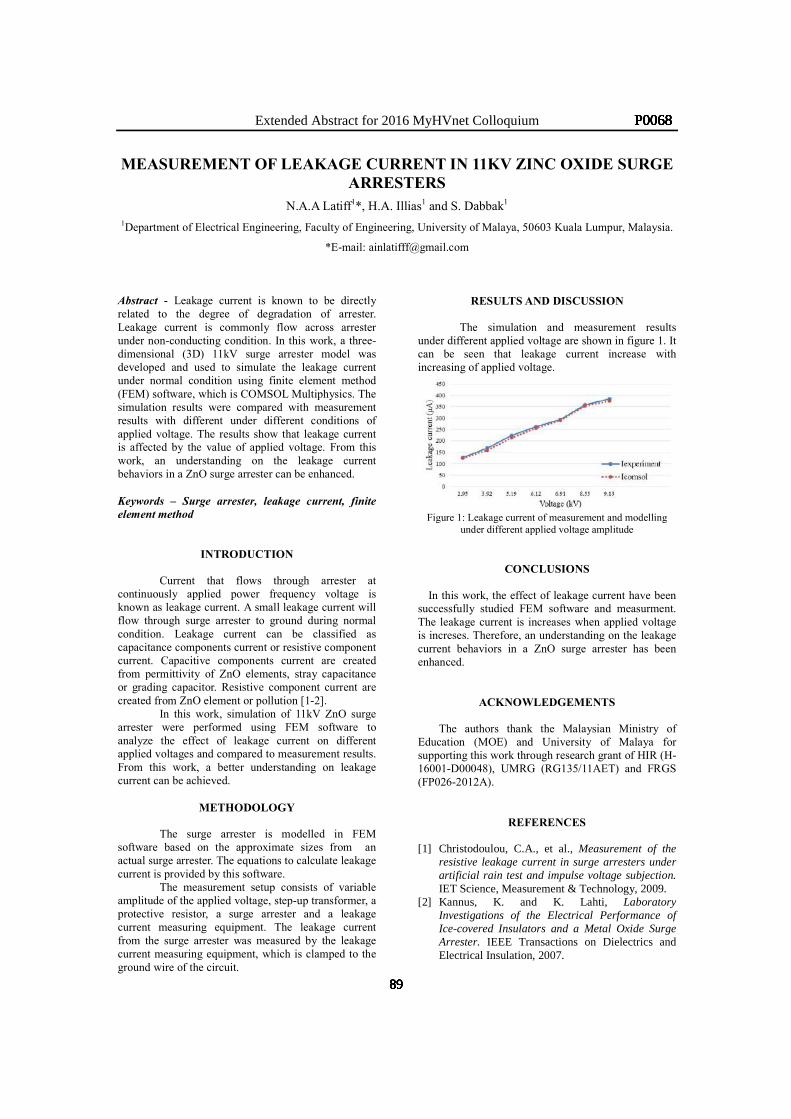
Extended Abstract for 2016 MyHVnet Colloquium
MEASUREMENT OF LEAKAGE CURRENT IN 11KV ZINC OXIDE SURGE ARRESTERS
N.A.A Latiff1*, H.A. Illias1 and S. Dabbak1 1Department of Electrical Engineering, Faculty of Engineering, University of Malaya, 50603 Kuala Lumpur, Malaysia.
*E-mail: [email protected] Abstract - Leakage current is known to be directly related to the degree of degradation of arrester. Leakage current is commonly flow across arrester under non-conducting condition. In this work, a three-dimensional (3D) 11kV surge arrester model was developed and used to simulate the leakage current under normal condition using finite element method (FEM) software, which is COMSOL Multiphysics. The simulation results were compared with measurement results with different under different conditions of applied voltage. The results show that leakage current is affected by the value of applied voltage. From this work, an understanding on the leakage current behaviors in a ZnO surge arrester can be enhanced. Keywords – Surge arrester, leakage current, finite element method
INTRODUCTION
Current that flows through arrester at continuously applied power frequency voltage is known as leakage current. A small leakage current will flow through surge arrester to ground during normal condition. Leakage current can be classified as capacitance components current or resistive component current. Capacitive components current are created from permittivity of ZnO elements, stray capacitance or grading capacitor. Resistive component current are created from ZnO element or pollution [1-2].
In this work, simulation of 11kV ZnO surge arrester were performed using FEM software to analyze the effect of leakage current on different applied voltages and compared to measurement results. From this work, a better understanding on leakage current can be achieved.
METHODOLOGY
The surge arrester is modelled in FEM
software based on the approximate sizes from an actual surge arrester. The equations to calculate leakage current is provided by this software.
The measurement setup consists of variable amplitude of the applied voltage, step-up transformer, a protective resistor, a surge arrester and a leakage current measuring equipment. The leakage current from the surge arrester was measured by the leakage current measuring equipment, which is clamped to the ground wire of the circuit.
RESULTS AND DISCUSSION
The simulation and measurement results under different applied voltage are shown in figure 1. It can be seen that leakage current increase with increasing of applied voltage.
Figure 1: Leakage current of measurement and modelling
under different applied voltage amplitude
CONCLUSIONS
In this work, the effect of leakage current have been successfully studied FEM software and measurment. The leakage current is increases when applied voltage is increses. Therefore, an understanding on the leakage current behaviors in a ZnO surge arrester has been enhanced.
ACKNOWLEDGEMENTS
The authors thank the Malaysian Ministry of Education (MOE) and University of Malaya for supporting this work through research grant of HIR (H-16001-D00048), UMRG (RG135/11AET) and FRGS (FP026-2012A).
REFERENCES
[1] Christodoulou, C.A., et al., Measurement of the resistive leakage current in surge arresters under artificial rain test and impulse voltage subjection. IET Science, Measurement & Technology, 2009.
[2] Kannus, K. and K. Lahti, Laboratory Investigations of the Electrical Performance of Ice-covered Insulators and a Metal Oxide Surge Arrester. IEEE Transactions on Dielectrics and Electrical Insulation, 2007.
89
P0068
89
P0068
89
P0068
89
P0068
89
P0068
89
P0068
89
P0068
89
P0068
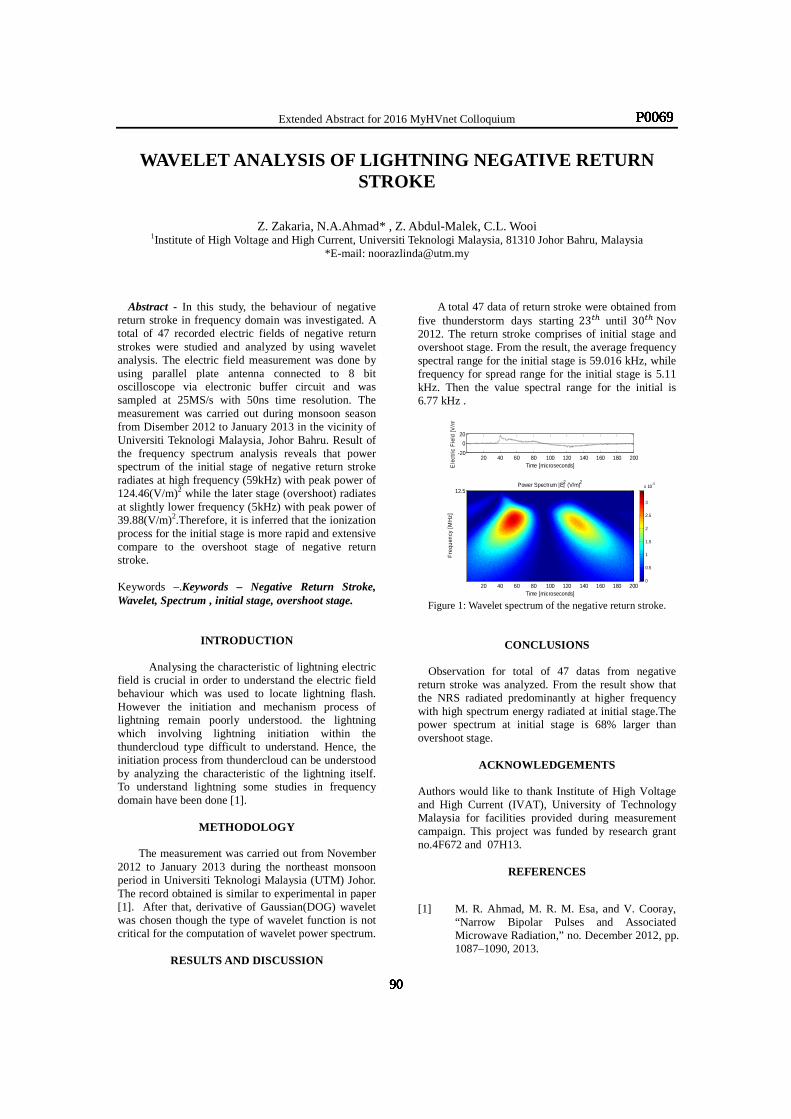
Extended Abstract for 2016 MyHVnet Colloquium
WAVELET ANALYSIS OF LIGHTNING NEGATIVE RETURN STROKE
Z. Zakaria, N.A.Ahmad* , Z. Abdul-Malek, C.L. Wooi 1Institute of High Voltage and High Current, Universiti Teknologi Malaysia, 81310 Johor Bahru, Malaysia
*E-mail: [email protected]
Abstract - In this study, the behaviour of negative return stroke in frequency domain was investigated. A total of 47 recorded electric fields of negative return strokes were studied and analyzed by using wavelet analysis. The electric field measurement was done by using parallel plate antenna connected to 8 bit oscilloscope via electronic buffer circuit and was sampled at 25MS/s with 50ns time resolution. The measurement was carried out during monsoon season from Disember 2012 to January 2013 in the vicinity of Universiti Teknologi Malaysia, Johor Bahru. Result of the frequency spectrum analysis reveals that power spectrum of the initial stage of negative return stroke radiates at high frequency (59kHz) with peak power of 124.46(V/m)2 while the later stage (overshoot) radiates at slightly lower frequency (5kHz) with peak power of 39.88(V/m)2.Therefore, it is inferred that the ionization process for the initial stage is more rapid and extensive compare to the overshoot stage of negative return stroke.
Keywords –.Keywords – Negative Return Stroke, Wavelet, Spectrum , initial stage, overshoot stage.
INTRODUCTION
Analysing the characteristic of lightning electric field is crucial in order to understand the electric field behaviour which was used to locate lightning flash. However the initiation and mechanism process of lightning remain poorly understood. the lightning which involving lightning initiation within the thundercloud type difficult to understand. Hence, the initiation process from thundercloud can be understood by analyzing the characteristic of the lightning itself. To understand lightning some studies in frequency domain have been done [1].
METHODOLOGY
The measurement was carried out from November
2012 to January 2013 during the northeast monsoon period in Universiti Teknologi Malaysia (UTM) Johor. The record obtained is similar to experimental in paper [1]. After that, derivative of Gaussian(DOG) wavelet was chosen though the type of wavelet function is not critical for the computation of wavelet power spectrum.
RESULTS AND DISCUSSION
A total 47 data of return stroke were obtained from five thunderstorm days starting 23#$ until 30#$ Nov 2012. The return stroke comprises of initial stage and overshoot stage. From the result, the average frequency spectral range for the initial stage is 59.016 kHz, while frequency for spread range for the initial stage is 5.11 kHz. Then the value spectral range for the initial is 6.77 kHz .
Figure 1: Wavelet spectrum of the negative return stroke.
CONCLUSIONS
Observation for total of 47 datas from negative return stroke was analyzed. From the result show that the NRS radiated predominantly at higher frequency with high spectrum energy radiated at initial stage.The power spectrum at initial stage is 68% larger than overshoot stage.
ACKNOWLEDGEMENTS
Authors would like to thank Institute of High Voltage and High Current (IVAT), University of Technology Malaysia for facilities provided during measurement campaign. This project was funded by research grant no.4F672 and 07H13.
REFERENCES
[1] M. R. Ahmad, M. R. M. Esa, and V. Cooray, “Narrow Bipolar Pulses and Associated Microwave Radiation,” no. December 2012, pp. 1087–1090, 2013.
20 40 60 80 100 120 140 160 180 200-20
0
20
Ele
ctric
Fie
ld [V
/m]
Time [microseconds]
Power Spectrum |E|2 (V/m)2
Time [microseconds]
Fre
quen
cy [
MH
z]
20 40 60 80 100 120 140 160 180 200
12.5
0
0.5
1
1.5
2
2.5
3
x 10-5
90
P0069
90
P0069
90
P0069
90
P0069
90
P0069
90
P0069
90
P0069
90
P0069
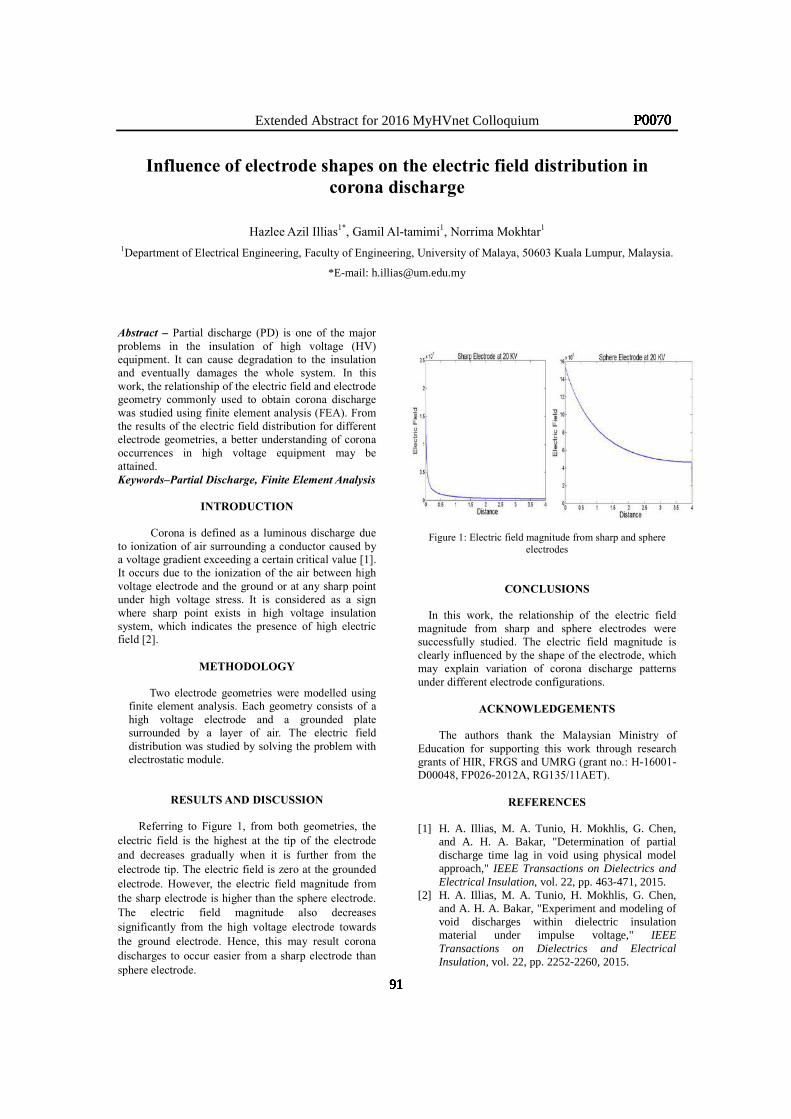
Extended Abstract for 2016 MyHVnet Colloquium
Influence of electrode shapes on the electric field distribution in corona discharge
Hazlee Azil Illias1*, Gamil Al-tamimi1, Norrima Mokhtar1 1Department of Electrical Engineering, Faculty of Engineering, University of Malaya, 50603 Kuala Lumpur, Malaysia.
*E-mail: [email protected]
Abstract – Partial discharge (PD) is one of the major problems in the insulation of high voltage (HV) equipment. It can cause degradation to the insulation and eventually damages the whole system. In this work, the relationship of the electric field and electrode geometry commonly used to obtain corona discharge was studied using finite element analysis (FEA). From the results of the electric field distribution for different electrode geometries, a better understanding of corona occurrences in high voltage equipment may be attained. Keywords–Partial Discharge, Finite Element Analysis
INTRODUCTION
Corona is defined as a luminous discharge due
to ionization of air surrounding a conductor caused by a voltage gradient exceeding a certain critical value [1]. It occurs due to the ionization of the air between high voltage electrode and the ground or at any sharp point under high voltage stress. It is considered as a sign where sharp point exists in high voltage insulation system, which indicates the presence of high electric field [2].
METHODOLOGY
Two electrode geometries were modelled using finite element analysis. Each geometry consists of a high voltage electrode and a grounded plate surrounded by a layer of air. The electric field distribution was studied by solving the problem with electrostatic module.
RESULTS AND DISCUSSION
Referring to Figure 1, from both geometries, the electric field is the highest at the tip of the electrode and decreases gradually when it is further from the electrode tip. The electric field is zero at the grounded electrode. However, the electric field magnitude from the sharp electrode is higher than the sphere electrode. The electric field magnitude also decreases significantly from the high voltage electrode towards the ground electrode. Hence, this may result corona discharges to occur easier from a sharp electrode than sphere electrode.
Figure 1: Electric field magnitude from sharp and sphere electrodes
CONCLUSIONS
In this work, the relationship of the electric field magnitude from sharp and sphere electrodes were successfully studied. The electric field magnitude is clearly influenced by the shape of the electrode, which may explain variation of corona discharge patterns under different electrode configurations.
ACKNOWLEDGEMENTS The authors thank the Malaysian Ministry of
Education for supporting this work through research grants of HIR, FRGS and UMRG (grant no.: H-16001-D00048, FP026-2012A, RG135/11AET).
REFERENCES
[1] H. A. Illias, M. A. Tunio, H. Mokhlis, G. Chen,
and A. H. A. Bakar, "Determination of partial discharge time lag in void using physical model approach," IEEE Transactions on Dielectrics and Electrical Insulation, vol. 22, pp. 463-471, 2015.
[2] H. A. Illias, M. A. Tunio, H. Mokhlis, G. Chen, and A. H. A. Bakar, "Experiment and modeling of void discharges within dielectric insulation material under impulse voltage," IEEE Transactions on Dielectrics and Electrical Insulation, vol. 22, pp. 2252-2260, 2015.
91
P0070
91
P0070
91
P0070
91
P0070
91
P0070
91
P0070
91
P0070
91
P0070
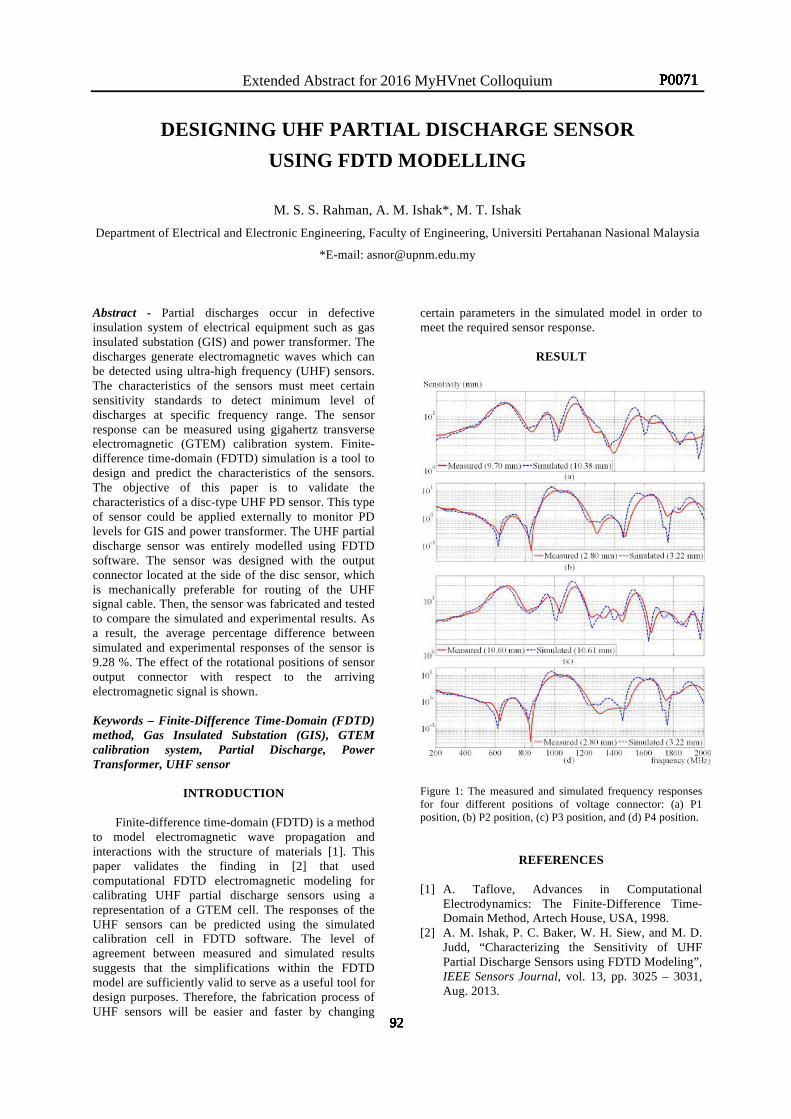
Extended Abstract for 2016 MyHVnet Colloquium
DESIGNING UHF PARTIAL DISCHARGE SENSOR
USING FDTD MODELLING
M. S. S. Rahman, A. M. Ishak*, M. T. Ishak
Department of Electrical and Electronic Engineering, Faculty of Engineering, Universiti Pertahanan Nasional Malaysia
*E-mail: [email protected] Abstract - Partial discharges occur in defective insulation system of electrical equipment such as gas insulated substation (GIS) and power transformer. The discharges generate electromagnetic waves which can be detected using ultra-high frequency (UHF) sensors. The characteristics of the sensors must meet certain sensitivity standards to detect minimum level of discharges at specific frequency range. The sensor response can be measured using gigahertz transverse electromagnetic (GTEM) calibration system. Finite-difference time-domain (FDTD) simulation is a tool to design and predict the characteristics of the sensors. The objective of this paper is to validate the characteristics of a disc-type UHF PD sensor. This type of sensor could be applied externally to monitor PD levels for GIS and power transformer. The UHF partial discharge sensor was entirely modelled using FDTD software. The sensor was designed with the output connector located at the side of the disc sensor, which is mechanically preferable for routing of the UHF signal cable. Then, the sensor was fabricated and tested to compare the simulated and experimental results. As a result, the average percentage difference between simulated and experimental responses of the sensor is 9.28 %. The effect of the rotational positions of sensor output connector with respect to the arriving electromagnetic signal is shown.
Keywords – Finite-Difference Time-Domain (FDTD) method, Gas Insulated Substation (GIS), GTEM calibration system, Partial Discharge, Power Transformer, UHF sensor
INTRODUCTION
Finite-difference time-domain (FDTD) is a method to model electromagnetic wave propagation and interactions with the structure of materials [1]. This paper validates the finding in [2] that used computational FDTD electromagnetic modeling for calibrating UHF partial discharge sensors using a representation of a GTEM cell. The responses of the UHF sensors can be predicted using the simulated calibration cell in FDTD software. The level of agreement between measured and simulated results suggests that the simplifications within the FDTD model are sufficiently valid to serve as a useful tool for design purposes. Therefore, the fabrication process of UHF sensors will be easier and faster by changing
certain parameters in the simulated model in order to meet the required sensor response.
RESULT
Figure 1: The measured and simulated frequency responses for four different positions of voltage connector: (a) P1 position, (b) P2 position, (c) P3 position, and (d) P4 position.
REFERENCES [1] A. Taflove, Advances in Computational
Electrodynamics: The Finite-Difference Time-Domain Method, Artech House, USA, 1998.
[2] A. M. Ishak, P. C. Baker, W. H. Siew, and M. D. Judd, “Characterizing the Sensitivity of UHF Partial Discharge Sensors using FDTD Modeling”, IEEE Sensors Journal, vol. 13, pp. 3025 – 3031, Aug. 2013.
92
P0071
92
P0071
92
P0071
92
P0071
92
P0071
92
P0071
92
P0071
92
P0071


Institute of High Voltage and High Current (IVAT)
Block P06 Universiti Teknologi Malaysia
81310 Johor Bahru, Johor Malaysia
Phone: +60 7 553 5615 Fax: +60 7 557 8150
E-mail: [email protected] Website: ivat.utm.my
Malaysian High Voltage Network (MyHVnet)
A network for members from various organisations across Malaysia for the
effective communication of high voltage related research and
development.
E-mail: [email protected] Website: ivat.utm.my/myhvnet
and
Published by:


