Embed Size (px)
Citation preview

1651
Pure Appl. Chem., Vol. 78, No. 9, pp. 1651–1665, 2006.doi:10.1351/pac200678091651© 2006 IUPAC
Nanorods of CoP, CdS, and ZnS*
P. John Thomas, Paul Christian, Steven Daniels, Yang Li,Y. S. Wang†, and Paul O’Brien‡
School of Chemistry, The University of Manchester, Oxford Road, Manchester,M13 9PL, UK
Abstract: Simple thermolysis routes to CdS, ZnS, and CoP nanorods have been developed inour laboratory. The structural properties of the nanorods obtained were elucidated by meansof X-ray diffraction (XRD) and high-resolution transmission electron microscopy(HR-TEM). Arguments and calculations in support of the contention that intrinsic rather thanextrinsic factors influence the solution-phase growth of nanorods are presented.
Keywords: nanorods; nanowires; crystal growth; nanomaterials; nanocrystals; particle syn-thesis.
INTRODUCTION
Nanowires, nanorods, and other nanodimensional material have been intensely researched in recentyears because of their unique properties. At nanometric sizes, quantum confinement effects can comeinto play and affect most notably the electronic properties [1]. The growth of interest in this area hasfurthered our understanding of natural phenomena and has paved the way for building nanodevices withpotential to impact our everyday life.
A key step in the advance of nanoscience is devising synthetic strategies to yield nanodimensionalmatter with good control over shape and size. Nanorods and nanowires of metals, chalcogenides, andoxides have been obtained by different methods [2]. Many of these methods rely on templates such asporous alumina to direct the growth. There are some examples of solution-phase methods of growingnanowires or nanorods without the use of any template. CdS nanorods have been obtained by thermol-ysis of single-source precursors such as xanthates (Cd(C2H5OCS2)2) [3], dithiocarbamates(Cd(S2CNEt2)2) [4], and thiosemicarbazide (Cd[NH2CSNHNH2]2Cl2) [5] in coordinating solvents attemperatures in the range of 120–300 °C. The CdS nanorods thus produced adopt the hexagonalwurtzite form. Nanorods of magnetic Fe, Co, and Ni phosphides have been synthesized by a thermoly-sis process involving sequential or continual injection of metal-triphenylphosphine complex into a hotcoordinating solvent mixture [6,7]. ZnS nanorods have been obtained in aqueous solution by the use ofa liquid crystal as template [8]. Building on our experience with solution-phase synthesis of semicon-ducting nanocrystalline material, we have developed simple synthetic routes to semiconductornanorods. In this paper, we report on the synthesis of CdS, ZnS, and CoP nanorods. The structural prop-erties of the nanorods obtained were elucidated by means of X-ray diffraction (XRD) and high-resolu-tion transmission electron microscopy (HR-TEM). We also present arguments and calculations in sup-
*Paper based on a presentation at the 3rd IUPAC Workshop on Advanced Materials (WAM III), Stellenbosch, South Africa,5–9 September 2005. Other presentations are published in this issue, pp. 1619–1801.†Permanent address: Department of Physics, Beijing Normal University, Beijing 1000875, P.R. China‡Corresponding author: E-mail: [email protected]

port of the contention that intrinsic rather than extrinsic factors influence the solution-phase growth ofnanorods.
EXPERIMENTAL
CoP nanorods
In a typical reaction, a vigorously stirred mixture of hexadecylamine (HDA) (15 g, 98 %) and tri-n-octylphosphineoxide (TOPO) (15 g, 99 %) under vacuum was kept at 140 °C for 1 h to remove water.The mixture was cooled to 100 °C, and cobaltacetylacetonate (0.128 g, 0.5 mmol) and tetradecyl-phosphonic acid (TDPA) (0.5 g, 98 %) were added and stirred magnetically under a flow of nitrogen.The temperature was slowly increased to 340 °C over 1 h, and the solution was maintained at this tem-perature for 3 h. The color of the solution changed from an initial transparent violet to turbid darkbrown. The solution was then allowed to cool to 60 °C. An excess of ethanol was added to the solutionto give a black precipitate, which was separated by centrifugation and dried under vacuum. The blackpowder could easily be redispersed in organic solvents, such as chloroform, hexane, and toluene.Experiments were carried out with different weight ratios of HDA and TOPO and at different temper-atures.
CdS nanorods
Anhydrous cadmium acetate was dissolved in octylamine (10 ml). A stoichiometric amount of sulfurwas dissolved in octylamine (10 ml). In a typical reaction, HDA (100 g) was degassed under reducedpressure for 1 h at 140 °C then brought up to atmospheric pressure under nitrogen. The reaction mix-ture was held at 140 °C, and the sulfur-containing solution (1 ml) injected followed by the cadmium ac-etate solution (1 ml). The reaction was left to proceed for 15 min, after which the remaining reagentswere added at a rate of 3.17 ml/h over approximately 3 h. The reaction mixture was then maintained at140 °C for a further 10 h. After cooling, the particles were precipitated by the addition of dry methanoland isolated by centrifugation. The product was then redissolved in toluene and reprecipitated withmethanol. Reactions were carried out with different concentrations of cadmium acetate.
ZnS nanorods
In a typical reaction, 100 g HDA was degassed at 120 °C for 1 h, and then heated under nitrogen to 140or 180 °C. Two separate dropping funnels containing solutions of sulfur (1 g, 0.32 mol) in octylamine(30 ml) and zinc acetate dihydrate (3.18 g, 0.32 mol) in octylamine (30 ml) were used to control the ad-dition of the precursors. 1 ml of the zinc stock solution was added followed by 1 ml of the sulfur stocksolution under vigorous stirring, and the mixture was kept at 140 °C for 30 min. The rest of the stocksolutions were then added simultaneously at the same temperature over a period of 20 min. After com-plete addition, the solution was stirred for a further 2 h. Then the solution was cooled to 80 °C and theZnS nanorods were precipitated by the addition of excess ethanol and washed three times with acetoneto remove unreacted residuals.
Characterization
X-ray powder diffraction studies were conducted on a Bruker D8 AXS diffractometer using mono-chromated Cu-Kα radiation or a Philips PW 3020 with Co-Kα radiation with a Fe filter. Samples wereprepared by depositing the nanorods solids on either glass or Si substrates. TEM analyses were carriedon Philips CM200, 200KV DX4EDS and Technai FEG-TEM 300 kV microscopes. Samples were dis-solved in toluene and filtered, and a drop of the nanorod solution was then placed on a TEM grid and
P. J. THOMAS et al.
© 2006 IUPAC, Pure and Applied Chemistry 78, 1651–1665
1652

allowed to dry. Photoluminescence spectra were measured using a Horiba Fluorolog-3 (FL3-22) spec-trometer. Luminescence measurements were carried out using samples dispersed in chloroform.
RESULTS AND DISCUSSION
CoP nanorods
A typical XRD pattern from the black solid obtained by decomposing cobalt acetylacetonate and HDPAin TOPO/HDA mixture under the conditions detailed above are shown in Fig. 1. All the prominentpeaks in the pattern can be matched to orthorhombic CoP (JCPDS No: 29-0497). The unit cell dimen-sions were determined from the above pattern by Rietveld analysis and were found to be a = 0.5074 nmand c = 0.3279 nm. The unit cell dimensions closely match the reported values of a = 0.5077 nm andc = 0.3281 nm.
TEM images of CoP samples obtained using HAD:TOPO weight ratios of 1:1 and 1:2 are shownin Fig. 2. The images reveal that the samples are exclusively made of nanowires with a uniform diam-eter and length. The nanowires that obtained a HDA:TOPO ratio of 1:2 were found to be ~10 nm indiameter and 100 ± 10 nm in length (Fig. 2A). An increase in the amount to HDA (HAD:TOPO weightratio 1:1) leads to an increase in the length of nanowires, accompanied by a small decrease in thediameters of the nanowires. The nanowires obtained with a HDA:TOPO ratio of 1:2 are 7 nm in diam-eter and 400 ± 20 nm in length (Fig. 2B). Clearly, the weight ratio of the constituent solvents plays akey role in determining the dimensions of the nanowires. It is noteworthy that the nanowires tend toform an ordered arrangement with the long axes parallel to one another, perhaps due to their magneticnature. Reactions carried out with pure TOPO or pure HDA as solvent yield no nanowires. A mixed re-action system consisting of TOPO and HDA is essential for promoting anisotropic growth.
Reaction temperature is another key factor in the formation of the CoP nanowires. The reactiontemperature has to be sufficiently high to cleave the bonds between carbon and phosphorus in thealkylphosphonic acid (TDPA) to enable it to act as a phosphide source [9–11]. We found that tempera-tures in excess of 320 °C suffice to cleave the bonds and facilitate the formation of CoP. At tempera-
© 2006 IUPAC, Pure and Applied Chemistry 78, 1651–1665
Nanorods of CoP, CdS, and ZnS 1653
Fig. 1 XRD pattern of the sample obtained using HDA:TOPO weight ratio of 1:1. The peaks corresponding to thestandard pattern of orthorhombic CoP (JCPDS No: 29-0497) are shown.

tures lower than 320 °C, no CoP was obtained. We also have found that CoP nanostructures can onlybe prepared from phosphonic acids with long-chain carbon substituents; the methyl or ethylphosphonicacids are more thermally stable.
It is well known that technical-grade TOPO contains alkylphosphonic acids as impurities [12,13].We found that replacing pure TOPO and TDPA with technical-grade TOPO (15 g, 90 %, Aldrich) alsoyields CoP nanowires. Thus, unpurified TOPO can serve as an effective capping agent and phosphorussource. This observation is significant as pure TOPO and alkylphosphonic acid are much more expen-sive than crude TOPO.
HR-TEM helps us understand the structure of nanowires. The HR-TEM image and a diffractionpattern obtained from a CoP nanowire with diameter of 7 nm are shown in Fig. 3. The regularity of thelattice planes in the HR-TEM image (Fig. 3A) indicates that the CoP nanowires are single-crystalline.The spacing between adjacent fringes is 0.283 nm and corresponds to the (011) planes of orthorhombicCoP. The preferred orientation of nanowires is parallel to the (011) plane. Further evidence for the sin-gle-crystalline nature of the nanowires could be obtained from the power spectrum of the HR-TEMimage obtained by fast Fourier diffraction, which reveals clear spots that can be matched with the char-acteristic pattern associated with the wurtzite-orthorhombic crystalline structure of CoP. The reciprocallattice peaks obtained from the power spectrum are compatible with a lattice constant of 0.289 nm.Selected area electron diffraction (SAED) patterns reveal diffuse rings (Fig. 3B) that can be indexed to(011), (111), (211), (103), and (301) planes of the orthorhombic CoP.
P. J. THOMAS et al.
© 2006 IUPAC, Pure and Applied Chemistry 78, 1651–1665
1654
Fig. 2 TEM images of CoP nanowires prepared with HDA:TOPO weight ratios of (A)1:2 and (B)1:1.

CdS nanorods
Four samples (A–D) were prepared using different concentrations of cadmium acetate. The concentra-tions used and related properties of the samples are summarized in Table 1. Typical XRD patterns ofsamples A and B are shown in Fig. 4. The patterns reveal that the phase of CdS is dependent on the con-centration of the cadmium source employed. At low concentrations (sample A), CdS is present in thethermodynamically stable hexagonal phase. X-ray pattern reveals that a 70 % increase in the concen-tration of Cd source results in a dramatic collapse of the hexagonal phase and emergence of the cubicphase. The above indication from XRD is suggestive rather than conclusive. The peaks in the diffrac-tion patterns of nanocrystalline samples are broadened by the finite size effects. Furthermore, the sim-ilarities in the pattern between cubic and hexagonal forms of CdS thwart unequivocal phase assign-ments in these cases. Despite these limitations, we believe that the change in phase indicated by theX-ray patterns do correspond to a phase change, since similar reaction conditions were for preparingboth samples. It is possible that sample B is polytypical with a cubic phase being predominant. We be-lieve that a change in the predominant phase to cubic results from a more rapid reaction due to the moreconcentrated solution.
Table 1
Sample Quantity of Final concn. MCd(ac)2 mmol
A 1.3 0.011B 2.2 0.018C 21.7 0.181D 31.6* 0.198
*Added as three injections of 10 ml.
© 2006 IUPAC, Pure and Applied Chemistry 78, 1651–1665
Nanorods of CoP, CdS, and ZnS 1655
Fig. 3 (A) HR-TEM image of a 7-nm-diameter CoP nanowire. The inset shows a fast Fourier transform of theHR-TEM image. (B) SAED pattern from an assembly of CoP nanowires.

TEM images reveal interesting changes in the morphology of the samples (see Fig. 5). Sample A,corresponding to the lowest concentration consists of large numbers of spherical particles with diame-ters of 3.5 nm. At the highest concentration (sample D), nanorods with diameters of ~7 nm and lengthsof ~25 nm as well as nanocrystals with diameters of ~7 nm are seen. At intermediate concentrations,nanocrystals and nanorods with diameters of 4 nm (sample B) and 6.5 nm (sample C) are present.Nanorods are seen in all samples, but their abundances vary with concentration. Nanorods constitute72 % of sample D. Sample C was made up of ~15 % nanorods. The percentage of nanorods was lessthan 5 % in samples A and B. Optical bandgaps of the dispersions were obtained by extrapolation ofthe absorption onsets. The bandgaps shift to red with increase in concentration. Sample A has a bandgapof 446 nm, while sample D possesses a bandgap of 481 nm.
P. J. THOMAS et al.
© 2006 IUPAC, Pure and Applied Chemistry 78, 1651–1665
1656
Fig. 4 XRD patterns showing the hexagonal phase of sample A and cubic phase of sample B. The inset is at higherresolution.

All the samples were luminescent (see Fig. 6). The emission peaks exhibit a red shift with in-crease in concentration, reflecting the change in the optical bandgaps. The emission maximums aresample A: 465 nm, sample B: 489 nm, sample C: 599 nm, sample D: 504 nm. The quantum yield var-ied from 2.3–0.1 % with no apparent trend.
© 2006 IUPAC, Pure and Applied Chemistry 78, 1651–1665
Nanorods of CoP, CdS, and ZnS 1657
Fig. 5 TEM images of samples A–D. Scale bar shows 85 nm.

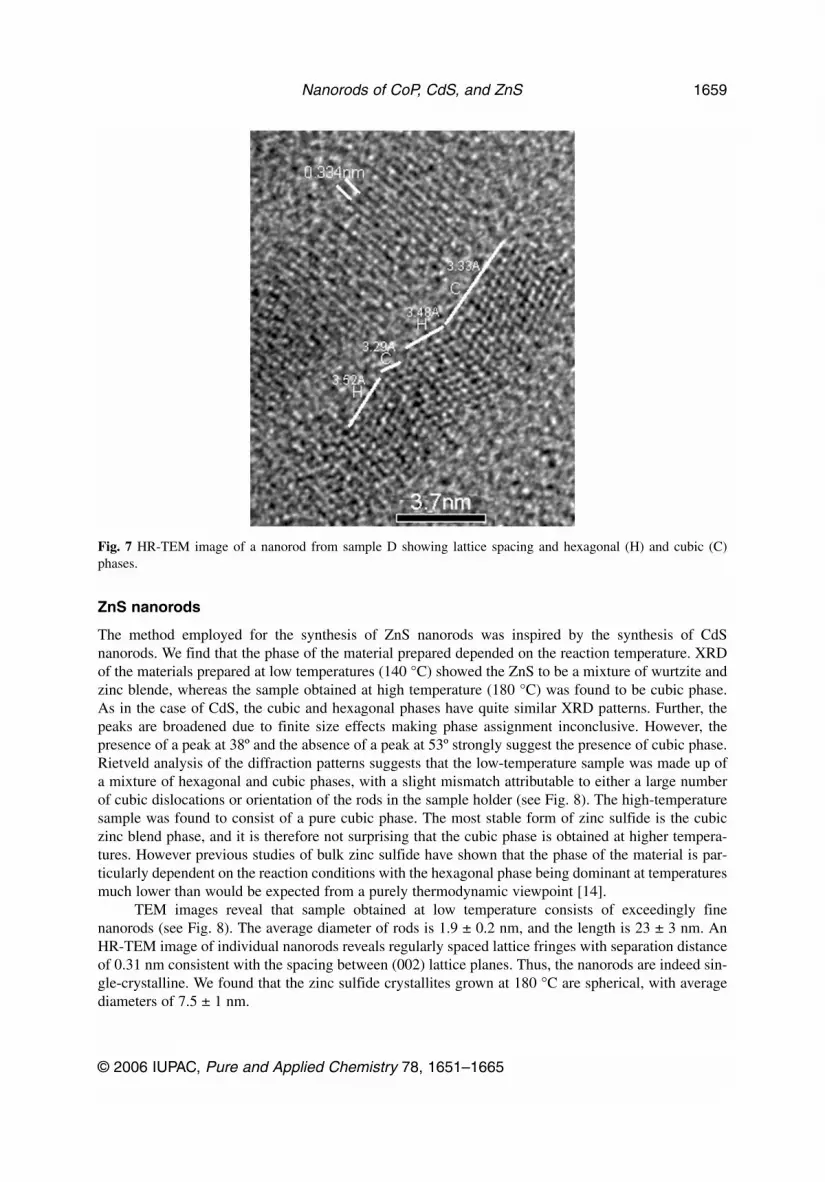
We were intrigued by the cubic phase adopted by the nanorods since almost all previously syn-thesized CdS nanorods are hexagonal [3–5,8]. Close inspection of the structure of the nanorods byHR-TEM reveals a more complicated picture. The cubic and hexagonal forms of CdS share similar lat-tice spacings for the (111) and (002) planes of 0.336 nm. However, the (100) plane for the hexagonalform is significantly larger (0.359 nm). Analysis of the lattice spacing of sample D by HR-TEM demon-strates the unperturbed 3.34-nm lattice spacing perpendicular to the long axis of the rod (Fig. 7, top).This is consistent with both the cubic (111) and hexagonal (002) planes (Fig. 7, center). However, lat-tice planes running parallel to the long axis show significant variations. Measurements at several pointsshow a combination of lattice spacings of 0.333 and 0.352 nm (±0.005 nm). Thus, the nanorods ratherthan being single-crystalline consist of a mixture of the cubic and hexagonal phases. However, giventhe absence of reflection corresponding to the (103) plane in the XRD pattern, it seems plausible thatthe cubic phase is the dominant form in samples B, C, and D. These results are best rationalized as beingdue to a change in control of the reaction from close to thermodynamic at the lower concentrations toa kinetic regime at higher temperatures.
P. J. THOMAS et al.
© 2006 IUPAC, Pure and Applied Chemistry 78, 1651–1665
1658
Fig. 6 Photoluminescence spectra for samples A–D, excited at 380 nm (* indicates Raman scattering from solvent).
ZnS nanorods
The method employed for the synthesis of ZnS nanorods was inspired by the synthesis of CdSnanorods. We find that the phase of the material prepared depended on the reaction temperature. XRDof the materials prepared at low temperatures (140 °C) showed the ZnS to be a mixture of wurtzite andzinc blende, whereas the sample obtained at high temperature (180 °C) was found to be cubic phase.As in the case of CdS, the cubic and hexagonal phases have quite similar XRD patterns. Further, thepeaks are broadened due to finite size effects making phase assignment inconclusive. However, thepresence of a peak at 38º and the absence of a peak at 53º strongly suggest the presence of cubic phase.Rietveld analysis of the diffraction patterns suggests that the low-temperature sample was made up ofa mixture of hexagonal and cubic phases, with a slight mismatch attributable to either a large numberof cubic dislocations or orientation of the rods in the sample holder (see Fig. 8). The high-temperaturesample was found to consist of a pure cubic phase. The most stable form of zinc sulfide is the cubiczinc blend phase, and it is therefore not surprising that the cubic phase is obtained at higher tempera-tures. However previous studies of bulk zinc sulfide have shown that the phase of the material is par-ticularly dependent on the reaction conditions with the hexagonal phase being dominant at temperaturesmuch lower than would be expected from a purely thermodynamic viewpoint [14].
TEM images reveal that sample obtained at low temperature consists of exceedingly finenanorods (see Fig. 8). The average diameter of rods is 1.9 ± 0.2 nm, and the length is 23 ± 3 nm. AnHR-TEM image of individual nanorods reveals regularly spaced lattice fringes with separation distanceof 0.31 nm consistent with the spacing between (002) lattice planes. Thus, the nanorods are indeed sin-gle-crystalline. We found that the zinc sulfide crystallites grown at 180 °C are spherical, with averagediameters of 7.5 ± 1 nm.
© 2006 IUPAC, Pure and Applied Chemistry 78, 1651–1665
Nanorods of CoP, CdS, and ZnS 1659
Fig. 7 HR-TEM image of a nanorod from sample D showing lattice spacing and hexagonal (H) and cubic (C)phases.

The UV/vis spectra of the nanorods grown at 140 °C and nanodots grown at 180 °C are shown inFig. 9. The onset of the absorption changes from 300 nm for the nanorods to 320 nm for the dots. Thenanorods, therefore, have a higher bandgap than the nanocrystals.
P. J. THOMAS et al.
© 2006 IUPAC, Pure and Applied Chemistry 78, 1651–1665
1660
Fig. 8 XRD patterns of ZnS samples obtained at 140 °C (top) and at 180 °C (bottom). Fitted wurtzite and zincblende fits are also shown.

Fundamental factors influencing the growth of nanorods
In the solution phase, nanorods of semicondutors and metals have been obtained using a variety ofreagents under a multitude of conditions without the use of any templates. In this light, we consideredit likely that intrinsic rather than extrinsic factors determine anisotropic growth of nanomaterials. Wewere also inspired by the success of the concept of magic numbers in the formation of noble gas andmetal clusters. We have modeled the anisotropic growth of rods based simply on the number of atomsin the structure to see if anisotropic growth becomes favorable in certain size regime. The end result ofthe calculation is plot that is a landscape for anisotropic growth based on percentage of surface atoms(SAPs).
In our model, nanorods were assumed to grow out of a tetrahedral seed, which follows cubic closepacking (CCP). The growth of the seed stops once the rods start growing. Rods follow either cubic orhexagonally close packed schemes and have either a triangular or hexagonal morphology. The assump-tions were made based on structural observations obtained from tetrapods of chalcogenide nanocrystals.The number of surface atoms was calculated for each configuration using an iterative process, whicharrives at individual configurations by layer-by-layer stacking of atoms. The changes in the SAPs ac-companying the growth of a triangular rod from a tetrahedral seed of two different sizes are shown inFig. 10. Perhaps contrary to intuition, we see that the growth of rod actually results in a drop in theSAPs. Such a drop means that growth of rod from the face of the seed reduces the internal energy. Thus,the need to conserve the number of surface atoms could provide impetus to an anisotropic growth
© 2006 IUPAC, Pure and Applied Chemistry 78, 1651–1665
Nanorods of CoP, CdS, and ZnS 1661
Fig. 9 TEM image of ZnS nanorods obtained at 140 °C (top). An HR-TEM image of a single ZnS nanorod is shownat the bottom.

process. In order to compare the growth of rods at different sizes, a characteristic change in the SAPswas sought to be associated with rods of different sizes. We believe that ∆SAPmax, the maximum gainin the percentage of surface atoms accompanying the growth of the branch of a particular size, couldprovide a quantity that is a measure of relief in internal energy accompanying the growth of nanorods.In other words, we assume that ∆SAPmax is directly proportional to the gain in internal energy. Thechanges in the ∆SAPmax, accompanying the growth of triangular and hexagonal rods following eitherthe cubic or hexagonal close packing (HCP) schemes are shown in Fig. 11. The dimensions of thenanorods were estimated assuming that the material was CdS. It is seen that the growth of triangularCCP branches succeed in producing the maximum ∆SAPmax of 6.5 % at a size of ~3 nm. Such a dif-ference in ∆SAPmax is indeed highly significant. Major changes in morphology are triggered by lesserdifferences in the fraction of surface atoms [15–18]. ∆SAPmax is strongly size-dependent, suggestingthat the anisotropic growth of nanorods is fundamentally size-selective with certain favored sizes. In areal growth process, the solubility of the growing seed is an important factor which can influence thepopulation of seeds and could bring in its own size-dependence. For that reason, the plots in Fig. 11 areonly to be taken as broad indicators of the size-regime in which anisotropic growth processes are ther-modynamically favored.
P. J. THOMAS et al.
© 2006 IUPAC, Pure and Applied Chemistry 78, 1651–1665
1662
Fig. 10 Electronic absorption spectra of ZnS nanorods grown at 140 °C (solid line) and ZnS nanocrystals grown at180 °C (dashed line).

© 2006 IUPAC, Pure and Applied Chemistry 78, 1651–1665
Nanorods of CoP, CdS, and ZnS 1663
Fig. 11 Plot showing the changes in the SAP accompanying the growth of a triangular rod out of a tetrahedral seedat different nuclearities. The seed is indicated by a solid line, while the branches are indicated with dotted lines.The dimensions of the triangular rods are the same as that of the triangular face of the tetrahedral seed.

CONCLUSIONS
A simple method employing Co(acac)2 and long-chain alkylphosphonic acid in the presence of HDAand TOPO at high temperatures has been developed to synthesize CoP nanowires with a high aspectratio. Technical grade TOPO can be a replacement for the combination of alkylphosphonic acid and pu-
P. J. THOMAS et al.
© 2006 IUPAC, Pure and Applied Chemistry 78, 1651–1665
1664
Fig. 12 Plot showing the ∆SAPmax that can be associated with rods of different morphologies growing out of atetrahedral seed. The plots at the top correspond to rods adopting a CCP, while the ones at the bottom correspondto HCP. The dimensions of the triangular rods are the same as that of the triangular face of the tetrahedral seed.The hexagonal rod’s dimensions correspond to the largest hexagon that can be fitted on the triangular face of thetetrahedral seed. The seed always adopts CCP. The nanorod diameters were arrived at considering the latticeconstants of CdS.

rified TOPO in the synthetic scheme. The length and diameter of the nanowires can be varied by chang-ing the HAD:TOPO ratio.
Predominantly cubic CdS nanowires were obtained by the use of simple precursors such as cad-mium acetate and S. The morphology of the nanocryatalline matter produced is strongly dependent onthe concentration of the reagents, with rods being the dominant product at high concentrations. Thismethod can be extended to prepare single-crystalline ZnS nanorods.
Fundamental factors such as the need to conserve the number of surface atoms could provide adriving force for anisotropic growth processes producing nanorods. The change in the percentage ofsurface atoms accompanying the growth of nanorods from a seed is strongly size-dependent and isbroadly indicative of a size-regime in which anisotropic growth is thermodynamically favorable.
REFERENCES
1. C. N. R. Rao, G. U. Kulkarni, P. J. Thomas, P. P. Edwards. Chem. Eur. J. 8, 28 (2002).2. C. N. R. Rao, F. L. Deepak, G. Gundiah, A. Govindaraj. Prog. Solid State Chem. 31, 5 (2003).3. Y. Li, X. Li, C. Yang, Y. Li. J. Mater. Chem. 13, 2641 (2003).4. Y.-W. Jun, S.-M. Lee, N.-J. Kang, J. Cheon. J. Am. Chem. Soc. 123, 5150 (2001).5. P. S. Nair, T. Radhakrishnan, N. Revaprasadu, G. A. Kolawole, P. O’Brien. Chem. Commun. 564
(2002).6. C. Qian, F. Kim, L. Ma, F. Tsui, P. Yang, J. Liu. J. Am. Chem. Soc. 126, 1195 (2004).7. J. Park, B. Koo, K. Y. Yoon, Y. Hwang, M. Kang, J. Park, T. Hyeon. J. Am. Chem. Soc. 127, 8433
(2005).8. X. Wang, P. Gao, J. Li, C. J. Summers, J. L. Wang. Adv. Mater. 14, 1732 (2002).9. L. D. Freedman, G. O. Doak. Chem. Rev. 57, 479 (1957).
10. H. Z. Lecher, T. H. Chao, K. C. Whitehouse, R. A. Greenwood. J. Am. Chem. Soc. 76, 1045(1954).
11. J. McElwee, R. Helmy, A. Y. Fadeev. J. Colloid Interface Sci. 285, 551 (2005).12. X. G. Peng, L. Manna, W. D. Yang, J. Wickham, E. Scher, A. Kadavanich, A. P. Alivisatos.
Nature 404, 59 (2000). 13. M. Kolosky, J. Vialle. J. Chromatogr. 299, 436 (1984).14. S. D. Scott, H. L. Barnes. Geochem. Cosmochim. Acta 36, 1275 (1972).15. T. P. Martin. Phys. Rep. 273, 199 (1996).16. U. Naher, U. Zimmermann, T. P. Martin. J. Chem. Phys. 99, 2256 (1993).17. J. G. Allpress, J. V. Sanders. Aust. J. Phys. 23, 23 (1970).18. V. Kumar. Prog. Crystal Growth Charact. 34, 95 (1997).
© 2006 IUPAC, Pure and Applied Chemistry 78, 1651–1665
Nanorods of CoP, CdS, and ZnS 1665


