Embed Size (px)
Citation preview
Nanosecond-Timescale Conformational Dynamics of the Humana7 Nicotinic Acetylcholine Receptor
Xiaolin Cheng,* Ivaylo Ivanov,*y Hailong Wang,z Steven M. Sine,z and J. Andrew McCammon*y
*Howard Hughes Medical Institute, National Science Foundation Center for Theoretical Biophysics, Department of Chemistry andBiochemistry, and yDepartment of Pharmacology, University of California, San Diego, La Jolla, California; and zReceptor BiologyLaboratory, Department of Physiology and Biomedical Engineering, Mayo Clinic College of Medicine, Rochester, Minnesota
ABSTRACT We explore the conformational dynamics of a homology model of the human a7 nicotinic acetylcholine receptorusing molecular dynamics simulation and analyses of root mean-square fluctuations, block partitioning of segmental motion, andprincipal component analysis. The results reveal flexible regions and concerted global motions of the subunits encompassingextracellular and transmembrane domains of the subunits. The most relevant motions comprise a bending, hinged at the b10-M1region, accompanied by concerted tilting of the M2 helices that widens the intracellular end of the channel. Despite the nanosecondtimescale, the observations suggest that tilting of the M2 helices may initiate opening of the pore. The results also reveal directcoupling between a twisting motion of the extracellular domain and dynamic changes of M2. Covariance analysis of interresiduemotions shows that this coupling arises through a network of residues within the Cys and M2-M3 loops where Phe135 is stabilizedwithin a hydrophobic pocket formed by Leu270 and Ile271. The resulting concerted motion causes a downward shift of the M2 helicesthat disrupts a hydrophobic girdle formed by 99 and 139 residues.
INTRODUCTION
Fast synaptic transmission depends on postsynaptic receptors
to detect nerve-released transmitter molecules and subse-
quently change the membrane potential of the receiving cell.
Postsynaptic receptors of the Cys-loop superfamily are found
throughout the nervous system, where they mediate either
excitation or inhibition. Each receptor in the superfamily
contains five pseudosymmetric subunits, each containing a
signature sequence of 13 residues bordered by cysteines that
form a disulfide-bonded loop at the junction of extracellular
and pore domains. Fundamental steps in receptor activation
include neurotransmitter recognition, coupling of recognition
to opening of the ion pore, and passive flow of ions through
the pore (1). Insight into these fundamental steps advanced
recently due to structural determinations that defined the over-
all atomic architecture and allowed construction of atomic-scale
models. However, our understanding of structural motions
underlying receptor activation is just beginning to develop.
Both experimental and computational approaches have
probed structural motions underlying Cys-loop receptor func-
tion, and have focused on three main structural domains.
Motions in the binding domain have been inferred from x-ray
structures of apo and agonist-bound forms of acetylcholine
binding protein (AChBP), and suggest that a hairpin structure
known as the C-loop traps the agonist within the aromatic-rich
binding pocket (2,3). A trapping motion of the C-loop was
also suggested by agonist-dependent changes in accessibility
of intrinsic tryptophans to a fluorescence quencher (4), hydro-
gen-deuterium exchange (5), and chemical shift by NMR (6).
Molecular dynamics (MD) simulations of AChBP or of
models of the homopentameric a7 nicotinic acetylcholine
receptor (nAChR) show that without agonist bound, the
C-loop is highly flexible, but that with agonist bound it be-
comes restricted in the trapping conformation (4,7).
The junction of the neurotransmitter binding and pore
domains is structurally well situated to couple agonist binding
to gating of the pore. Its role in coupling has been assessed
from changes in solvent accessibility of cysteine-substituted
residues (8,9) and functional consequences of disulfide trap-
ping (10,11). Within the core of the binding-pore junction,
conserved Arg and Glu residues form a crucial functional link
between binding and gating domains (12), and targeted MD
simulations of a model of the a7 receptor suggest that the salt
bridge stabilizes further when the C-loop changes from open
to trapping conformations (13). Additional structural ele-
ments in the binding-pore junction also contribute to the
coupling process, including the Cys, b1-b2, and b8-b9 loops
from the binding domain, and the M2-M3 loop from the pore
domain (14).
Structural changes in the pore were inferred from
cryoelectron microscopy (cryo-EM) of the Torpedo receptor
with and without bound ACh, and suggested a rotation of the
five pore-lining a-helices, causing collapse of a central
hydrophobic girdle (15). However, subsequent studies have
yielded a mixed picture. A simple dilation mechanism was
suggested by assessment of residues that line the pore in the
open state by measuring the ability of protons to block the
channel after lysine substitution (16), whereas placement of
Zn21 binding sites at various levels in the pore suggested
a tilting of the M2 helices (17).
doi: 10.1529/biophysj.107.109843
Submitted March 29, 2007, and accepted for publication June 8, 2007.
Address reprint requests to Xiaolin Cheng, Dept. of Chemistry and
Biochemistry, University of California, San Diego, 9500 Gilman Dr., La
Jolla, CA 92093. Tel.: 858-822-0169; Fax: 858-534-4974; E-mail:
Editor: Jose Onuchic.
� 2007 by the Biophysical Society
0006-3495/07/10/2622/13 $2.00
2622 Biophysical Journal Volume 93 October 2007 2622–2634
Insights into global motions underlying gating have
emerged from rate-equilibrium free-energy relationship (RE-
FER) analyses of the gating transition state, which suggest a
cascadelike conformational change from the binding site to
the pore (18). Normal-mode analysis probing the intrinsic
flexibility of the receptor suggested that an inherent quater-
nary twisting motion may accompany gating (19,20). Dy-
namics studies of a model of the a7 ligand-binding domain
revealed asymmetrical positioning of the subunits in the apo
and antagonist bound states, but showed symmetrical position-
ing with agonist bound (21,22).
Up to now, only one MD simulation has been performed on
the nAChR containing both ligand-binding and transmem-
brane domains (7). In that simulation, the receptor showed a
twist-to-close motion in which movements of the C-loop
correlated with a 10� rotation and inward movement of two
nonadjacent subunits. However, because a full receptor
structure was not available at that time, the simulation started
from a chimeric model based on coordinates from AChBP
(23) and the transmembrane domain from the TorpedonAChR (24). Here, we carry out MD simulation on a new
homology model of a7 based on the cryo-EM structure of the
Torpedo nAChR. The resulting model differs substantially
from the previous one, particularly at the interface dividing
binding and pore domains (20), and the concerted global
motions that emerge also differ from those previously sug-
gested (7). The results also reveal dynamic coupling between
the signature Cys-loop and the M2-M3 linker that may con-
tribute to gating of the channel.
METHODS
Homology modeling
The homology model of the human a7 acetylcholine receptor was
constructed with Modeller v8.0 (25,26) based on the 4.0-A resolution
cryo-EM structure of Torpedo nAChR (PDB code 2BG9). Details of the
modeling procedure were described previously (20). Briefly, the modeled
structure contained 1835 residues comprising the ligand-binding and
transmembrane domains, as well as part of the cytoplasmic vestibule that
spans M3 and M4. Fivefold symmetry was not imposed when modeling the
pentameric structure. In the final model, the C-loops in two alternating
subunits (A and D subunits) had the open conformation, as observed for the
two a-subunits of the Torpedo structure, whereas the remaining three
subunits (B, C, and E) showed the more contracted C-loop conformation
based on the b, d, and g subunits. The final models were evaluated with
PROCHECK (27) and Prosa 2003 (28).
MD simulations
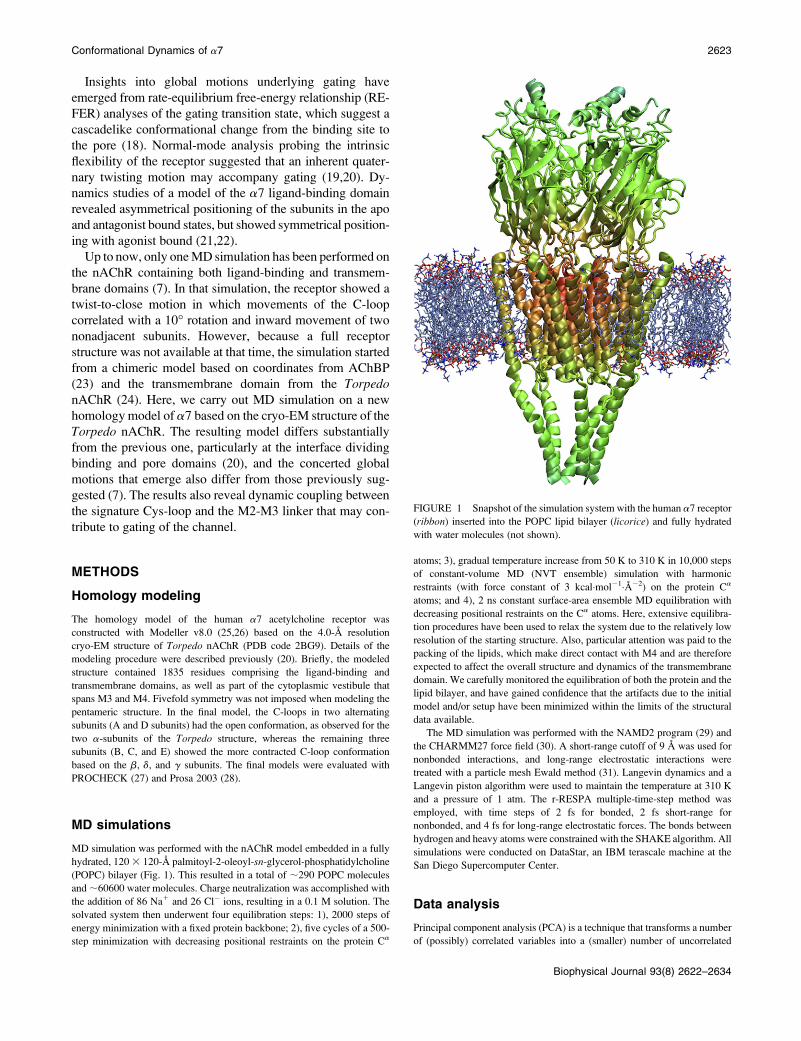
MD simulation was performed with the nAChR model embedded in a fully
hydrated, 120 3 120-A palmitoyl-2-oleoyl-sn-glycerol-phosphatidylcholine
(POPC) bilayer (Fig. 1). This resulted in a total of ;290 POPC molecules
and ;60600 water molecules. Charge neutralization was accomplished with
the addition of 86 Na1 and 26 Cl� ions, resulting in a 0.1 M solution. The
solvated system then underwent four equilibration steps: 1), 2000 steps of
energy minimization with a fixed protein backbone; 2), five cycles of a 500-
step minimization with decreasing positional restraints on the protein Ca
atoms; 3), gradual temperature increase from 50 K to 310 K in 10,000 steps
of constant-volume MD (NVT ensemble) simulation with harmonic
restraints (with force constant of 3 kcal�mol�1�A�2) on the protein Ca
atoms; and 4), 2 ns constant surface-area ensemble MD equilibration with
decreasing positional restraints on the Ca atoms. Here, extensive equilibra-
tion procedures have been used to relax the system due to the relatively low
resolution of the starting structure. Also, particular attention was paid to the
packing of the lipids, which make direct contact with M4 and are therefore
expected to affect the overall structure and dynamics of the transmembrane
domain. We carefully monitored the equilibration of both the protein and the
lipid bilayer, and have gained confidence that the artifacts due to the initial
model and/or setup have been minimized within the limits of the structural
data available.
The MD simulation was performed with the NAMD2 program (29) and
the CHARMM27 force field (30). A short-range cutoff of 9 A was used for
nonbonded interactions, and long-range electrostatic interactions were
treated with a particle mesh Ewald method (31). Langevin dynamics and a
Langevin piston algorithm were used to maintain the temperature at 310 K
and a pressure of 1 atm. The r-RESPA multiple-time-step method was
employed, with time steps of 2 fs for bonded, 2 fs short-range for
nonbonded, and 4 fs for long-range electrostatic forces. The bonds between
hydrogen and heavy atoms were constrained with the SHAKE algorithm. All
simulations were conducted on DataStar, an IBM terascale machine at the
San Diego Supercomputer Center.
Data analysis
Principal component analysis (PCA) is a technique that transforms a number
of (possibly) correlated variables into a (smaller) number of uncorrelated
FIGURE 1 Snapshot of the simulation system with the human a7 receptor
(ribbon) inserted into the POPC lipid bilayer (licorice) and fully hydrated
with water molecules (not shown).
Conformational Dynamics of a7 2623
Biophysical Journal 93(8) 2622–2634
variables called principal components while retaining those characteristics of
the data set that contribute most to its variance. This method is based on the
analysis of the covariance matrix G obtained from the MD trajectory data.
The elements of the covariance matrix G are defined as
Gij ¼ ÆðxiðtÞ � ÆxiðtÞæÞ3ðxjðtÞ � ÆxjðtÞæÞæ; (1)
where xi(t) and xj(t) are the Cartesian coordinates for atoms i and j,
respectively, at time t. The angle brackets denote the time average over the
entire trajectory. Diagonalization of the covariance matrix G yields the set of
eigenvectors fnig called principal components and associated eigenvalues
flig. Each eigenvalue li represents the mean-square fluctuations along the
principal component ni. From the root mean-square fluctuations it is possible
to define effective frequencies veffi for the principal components as follows:
veff
i ¼ffiffiffiffiffiffiffiffikBT
li
r: (2)
In the case of a harmonic energy surface, results from normal-mode analysis
and PCA are identical provided that the root mean-square fluctuations are
converged. For an anharmonic energy surface, the extent to which the
principal modes resemble normal modes is dependent on how readily the
surface can be represented by a harmonic approximation.
In our calculation, PCA was performed on the Ca atoms of individual
subunits using the GROMACS suite of programs (32). The entire 10-ns
trajectory is used in PCA. Before the analysis, each frame is superimposed to
the first frame to remove the rotational and translational degrees of freedom.
The eigenvectors fnig were ordered according to magnitude of the root
mean-square fluctuation flig(or the respective effective frequency veffi ).
The TLS (Translation/Libration/Screw) formalism was originally devel-
oped to predict thermal parameters of small molecules subjected to x-ray
crystallography, but it was later successfully extended to describing rigid-
body motion of large groups of atoms in proteins, such as flexible-loop and
domain motions. We have used the TLSMD web server (33) (http://
skuld.bmsc.washington.edu/;tlsmd/) for our rigid-body motion analysis. In
this treatment, the optimal multigroup TLS partition along a protein chain is
obtained by optimizing the thermal parameters predicted by the trial TLS
models against the input ones (i.e., as observed in a crystallographic
electron-density map or MD trajectory data). Diffraction or simulation
studies yield information not only about mean atomic positions but also
about the probability density functions of atomic displacement from these
mean positions. The thermal parameters, including isotropic or anisotropic
atomic displacement parameters, are defined as the mean-square displace-
ments using Gaussian approximations of the probability density functions.
The TLSMD program first generates all possible partitions up to a specified
maximum number of TLS segments. For each of these segments, its rigid-
body displacement parameters (TLS model) are optimized such that they
best reproduce the input thermal parameters of the atoms contained in this
segment. Then the residual between the predicted (based on the derived TLS
model) and the input thermal parameters is computed. The residuals from all
the segments are added together to give the sum of residuals for any given
partition. After exhausting every possible sequence of continuous TLS
segments for the chain, the partition with the lowest residual sum is chosen
as the optimal TLS model. In our analysis, the input thermal parameters are
the atomic displacement parameters calculated from the MD trajectory data
using the GROMACS program.
Cross-correlation analysis was applied to correlate motions between any
pair of residues in the a7 receptor model. The cross-correlation coefficient
Cij, between atoms i and j, is a measure of the correlated nature of their
atomic fluctuations and is computed as follows:
Cij ¼ ÆDri 3 Drjæ=ðÆDri 3 DriæÆDrj 3 DrjæÞ1=2; (3)
where Dri and Drj are the displacement vectors for atoms i and j,
respectively. The angle brackets denote an average over the trajectory. The
value of Cij ranges from �1 to 1 with the correlated (positive) residue pair
moving in the same direction, and the anticorrelated (negative) pair moving
in the opposite direction. The extent of correlation between motions of
Ca atoms was calculated using the GROMACS program.
Pore-radius profiles were determined with the HOLE (34) program. Both
lateral and radial tilting angles were calculated for all five M2 helices. Using
a rigid-body fitting procedure, the lateral tilting angle was defined as the
angle between the principal axis of M2 and the membrane normal (and in the
local tangent plane to the cylinder wall of the five M2 helices (see Fig. 8 a)),
and the radial tilting angle was defined as the angle perpendicular to the
cylinder wall (see Fig. 8 b). All figures were prepared with the program
VMD (35).
RESULTS
Root mean-square fluctuation
The root mean-square deviation relative to the starting struc-
ture gradually levels off after the initial 2–3 ns (Supplemen-
tary Material, Fig. S1), indicating that the homology model
provides a reasonable starting structure for the simulation.
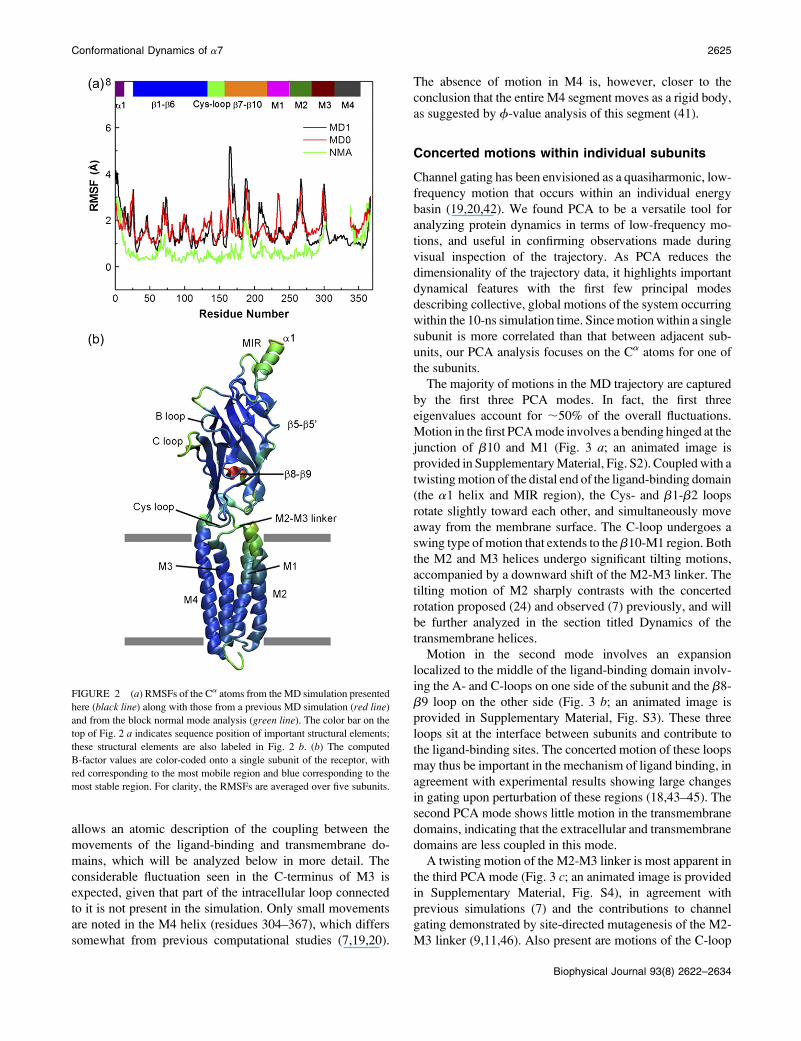
Fig. 2 a illustrates the root mean-square fluctuations (RMSFs)
of the Ca atoms from the current simulation (black line), along
with the results from previous MD simulation (7) (red line)
and normal-mode analysis (green line) (20). Considerable sim-
ilarity is observed for both MD simulations, which confirms
that the intrinsic flexibility of the protein is not sensitive to
its precise structure. Compared with the two MD simulations,
the normal-mode result shows some major differences. This
is not surprising, given that the normal-mode analysis employs
a simple representation of system, lacking explicit solvent, ions,
and the bilayer, and may thus be biased for certain regions (e.g.,
the exaggerated motion in M4, less mobility in b8-b9).
The computed B-factor values are color-coded onto the
three-dimensional structure of one subunit for easy visuali-
zation (Fig. 2 b). Clearly, most secondary structural elements,
such as the b-strands in the extracelluar domain, exhibit low
flexibility. A region that fluctuates most significantly is the
C-loop, which is found to move away from the binding pocket
in all five subunits except in the E subunit. This result is
consistent with those pf previous experimental (4) and
computational (21) studies, which indicate that the C-loop
is flexible when the ligand is not present. Another region that
displays significant flexibility is the b8-b9 loop, consistent
with disorder of this region in the cryo-EM structure (36).
Other mobile regions within the extracellular domain include
the Cys-loop, the b1-b2 linker, the b5-b59 loop and the
N-terminus. Both the conserved Cys-loop and the b1-b2
linker are essential for channel gating of the nAChR (37,38),
and their movements are thus expected to play a role in cou-
pling ligand binding to channel gating.
In the transmembrane domain, considerable mobility is
seen for two regions. One is the M2-M3 linker and the other
is the C-terminus of M3. The mobility of the M2-M3 linker
is consistent with earlier experimental findings that residues
on the M2-M3 linker change their contacting environments
during the transition from the resting to the open state (39,40),
suggesting that it undergoes some conformational change. It
is of import that the observed motion of the M2-M3 linker
2624 Cheng et al.
Biophysical Journal 93(8) 2622–2634
allows an atomic description of the coupling between the
movements of the ligand-binding and transmembrane do-
mains, which will be analyzed below in more detail. The
considerable fluctuation seen in the C-terminus of M3 is
expected, given that part of the intracellular loop connected
to it is not present in the simulation. Only small movements
are noted in the M4 helix (residues 304–367), which differs
somewhat from previous computational studies (7,19,20).
The absence of motion in M4 is, however, closer to the
conclusion that the entire M4 segment moves as a rigid body,
as suggested by f-value analysis of this segment (41).
Concerted motions within individual subunits
Channel gating has been envisioned as a quasiharmonic, low-
frequency motion that occurs within an individual energy
basin (19,20,42). We found PCA to be a versatile tool for
analyzing protein dynamics in terms of low-frequency mo-
tions, and useful in confirming observations made during
visual inspection of the trajectory. As PCA reduces the
dimensionality of the trajectory data, it highlights important
dynamical features with the first few principal modes
describing collective, global motions of the system occurring
within the 10-ns simulation time. Since motion within a single
subunit is more correlated than that between adjacent sub-
units, our PCA analysis focuses on the Ca atoms for one of
the subunits.
The majority of motions in the MD trajectory are captured
by the first three PCA modes. In fact, the first three
eigenvalues account for ;50% of the overall fluctuations.
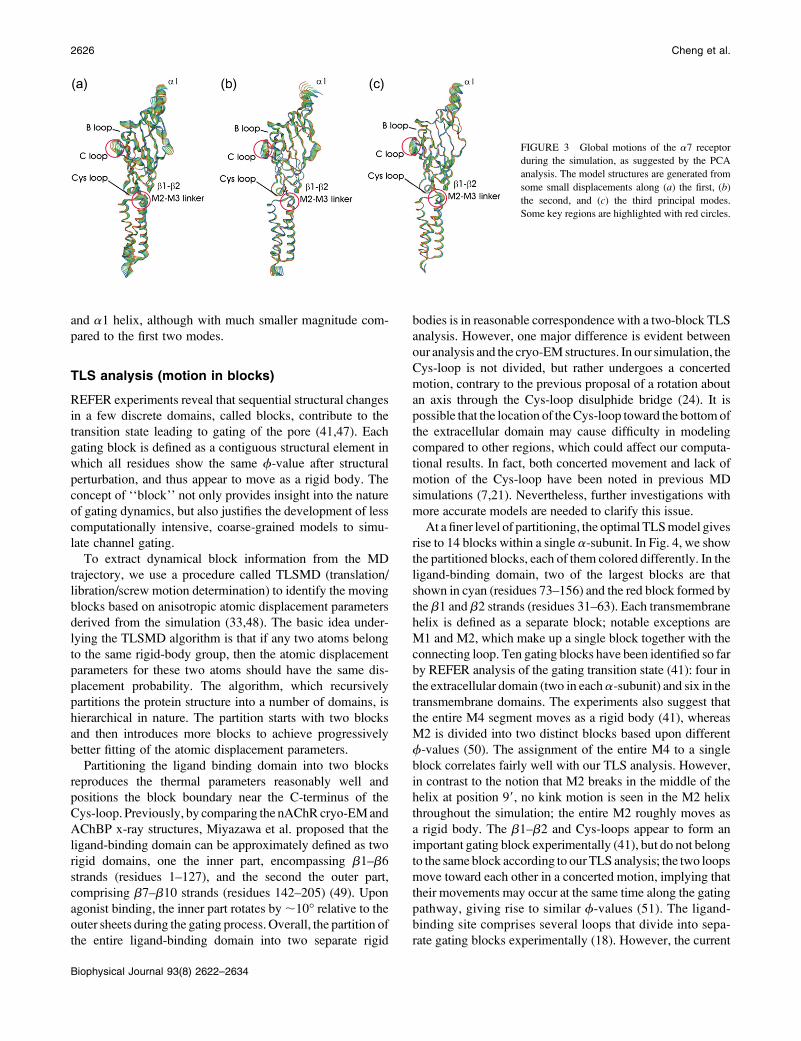
Motion in the first PCA mode involves a bending hinged at the
junction of b10 and M1 (Fig. 3 a; an animated image is
provided in Supplementary Material, Fig. S2). Coupled with a
twisting motion of the distal end of the ligand-binding domain
(the a1 helix and MIR region), the Cys- and b1-b2 loops
rotate slightly toward each other, and simultaneously move
away from the membrane surface. The C-loop undergoes a
swing type of motion that extends to the b10-M1 region. Both
the M2 and M3 helices undergo significant tilting motions,
accompanied by a downward shift of the M2-M3 linker. The
tilting motion of M2 sharply contrasts with the concerted
rotation proposed (24) and observed (7) previously, and will
be further analyzed in the section titled Dynamics of the
transmembrane helices.
Motion in the second mode involves an expansion
localized to the middle of the ligand-binding domain involv-
ing the A- and C-loops on one side of the subunit and the b8-
b9 loop on the other side (Fig. 3 b; an animated image is
provided in Supplementary Material, Fig. S3). These three
loops sit at the interface between subunits and contribute to
the ligand-binding sites. The concerted motion of these loops
may thus be important in the mechanism of ligand binding, in
agreement with experimental results showing large changes
in gating upon perturbation of these regions (18,43–45). The
second PCA mode shows little motion in the transmembrane
domains, indicating that the extracellular and transmembrane
domains are less coupled in this mode.
A twisting motion of the M2-M3 linker is most apparent in
the third PCA mode (Fig. 3 c; an animated image is provided
in Supplementary Material, Fig. S4), in agreement with
previous simulations (7) and the contributions to channel
gating demonstrated by site-directed mutagenesis of the M2-
M3 linker (9,11,46). Also present are motions of the C-loop
FIGURE 2 (a) RMSFs of the Ca atoms from the MD simulation presented
here (black line) along with those from a previous MD simulation (red line)
and from the block normal mode analysis (green line). The color bar on the
top of Fig. 2 a indicates sequence position of important structural elements;
these structural elements are also labeled in Fig. 2 b. (b) The computed
B-factor values are color-coded onto a single subunit of the receptor, with
red corresponding to the most mobile region and blue corresponding to the
most stable region. For clarity, the RMSFs are averaged over five subunits.
Conformational Dynamics of a7 2625
Biophysical Journal 93(8) 2622–2634
and a1 helix, although with much smaller magnitude com-
pared to the first two modes.
TLS analysis (motion in blocks)
REFER experiments reveal that sequential structural changes
in a few discrete domains, called blocks, contribute to the
transition state leading to gating of the pore (41,47). Each
gating block is defined as a contiguous structural element in
which all residues show the same f-value after structural
perturbation, and thus appear to move as a rigid body. The
concept of ‘‘block’’ not only provides insight into the nature
of gating dynamics, but also justifies the development of less
computationally intensive, coarse-grained models to simu-
late channel gating.
To extract dynamical block information from the MD
trajectory, we use a procedure called TLSMD (translation/
libration/screw motion determination) to identify the moving
blocks based on anisotropic atomic displacement parameters
derived from the simulation (33,48). The basic idea under-
lying the TLSMD algorithm is that if any two atoms belong
to the same rigid-body group, then the atomic displacement
parameters for these two atoms should have the same dis-
placement probability. The algorithm, which recursively
partitions the protein structure into a number of domains, is
hierarchical in nature. The partition starts with two blocks
and then introduces more blocks to achieve progressively
better fitting of the atomic displacement parameters.
Partitioning the ligand binding domain into two blocks
reproduces the thermal parameters reasonably well and
positions the block boundary near the C-terminus of the
Cys-loop. Previously, by comparing the nAChR cryo-EM and
AChBP x-ray structures, Miyazawa et al. proposed that the
ligand-binding domain can be approximately defined as two
rigid domains, one the inner part, encompassing b1–b6
strands (residues 1–127), and the second the outer part,
comprising b7–b10 strands (residues 142–205) (49). Upon
agonist binding, the inner part rotates by ;10� relative to the
outer sheets during the gating process. Overall, the partition of
the entire ligand-binding domain into two separate rigid
bodies is in reasonable correspondence with a two-block TLS
analysis. However, one major difference is evident between
our analysis and the cryo-EM structures. In our simulation, the
Cys-loop is not divided, but rather undergoes a concerted
motion, contrary to the previous proposal of a rotation about
an axis through the Cys-loop disulphide bridge (24). It is
possible that the location of the Cys-loop toward the bottom of
the extracellular domain may cause difficulty in modeling
compared to other regions, which could affect our computa-
tional results. In fact, both concerted movement and lack of
motion of the Cys-loop have been noted in previous MD
simulations (7,21). Nevertheless, further investigations with
more accurate models are needed to clarify this issue.
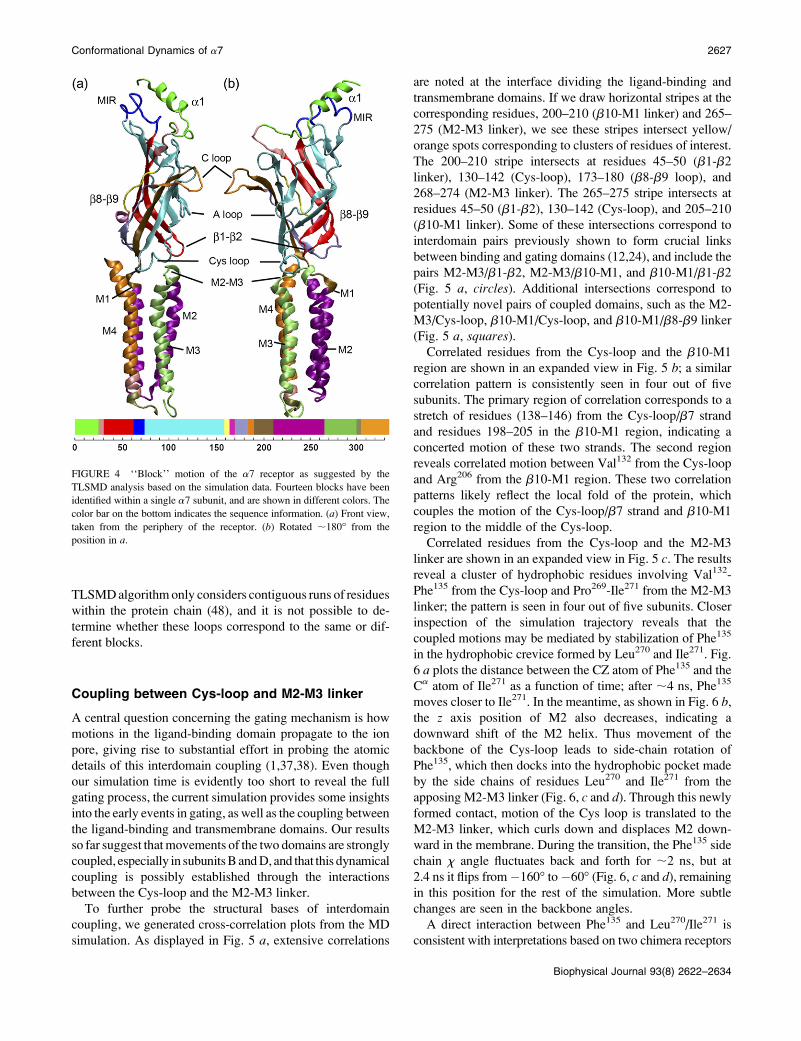
At a finer level of partitioning, the optimal TLS model gives
rise to 14 blocks within a single a-subunit. In Fig. 4, we show
the partitioned blocks, each of them colored differently. In the
ligand-binding domain, two of the largest blocks are that
shown in cyan (residues 73–156) and the red block formed by
the b1 and b2 strands (residues 31–63). Each transmembrane
helix is defined as a separate block; notable exceptions are
M1 and M2, which make up a single block together with the
connecting loop. Ten gating blocks have been identified so far
by REFER analysis of the gating transition state (41): four in
the extracellular domain (two in each a-subunit) and six in the
transmembrane domains. The experiments also suggest that
the entire M4 segment moves as a rigid body (41), whereas
M2 is divided into two distinct blocks based upon different
f-values (50). The assignment of the entire M4 to a single
block correlates fairly well with our TLS analysis. However,
in contrast to the notion that M2 breaks in the middle of the
helix at position 99, no kink motion is seen in the M2 helix
throughout the simulation; the entire M2 roughly moves as
a rigid body. The b1–b2 and Cys-loops appear to form an
important gating block experimentally (41), but do not belong
to the same block according to our TLS analysis; the two loops
move toward each other in a concerted motion, implying that
their movements may occur at the same time along the gating
pathway, giving rise to similar f-values (51). The ligand-
binding site comprises several loops that divide into sepa-
rate gating blocks experimentally (18). However, the current
FIGURE 3 Global motions of the a7 receptor
during the simulation, as suggested by the PCA
analysis. The model structures are generated from
some small displacements along (a) the first, (b)
the second, and (c) the third principal modes.
Some key regions are highlighted with red circles.
2626 Cheng et al.
Biophysical Journal 93(8) 2622–2634
TLSMD algorithm only considers contiguous runs of residues
within the protein chain (48), and it is not possible to de-
termine whether these loops correspond to the same or dif-
ferent blocks.
Coupling between Cys-loop and M2-M3 linker
A central question concerning the gating mechanism is how
motions in the ligand-binding domain propagate to the ion
pore, giving rise to substantial effort in probing the atomic
details of this interdomain coupling (1,37,38). Even though
our simulation time is evidently too short to reveal the full
gating process, the current simulation provides some insights
into the early events in gating, as well as the coupling between
the ligand-binding and transmembrane domains. Our results
so far suggest that movements of the two domains are strongly
coupled, especially in subunits B and D, and that this dynamical
coupling is possibly established through the interactions
between the Cys-loop and the M2-M3 linker.
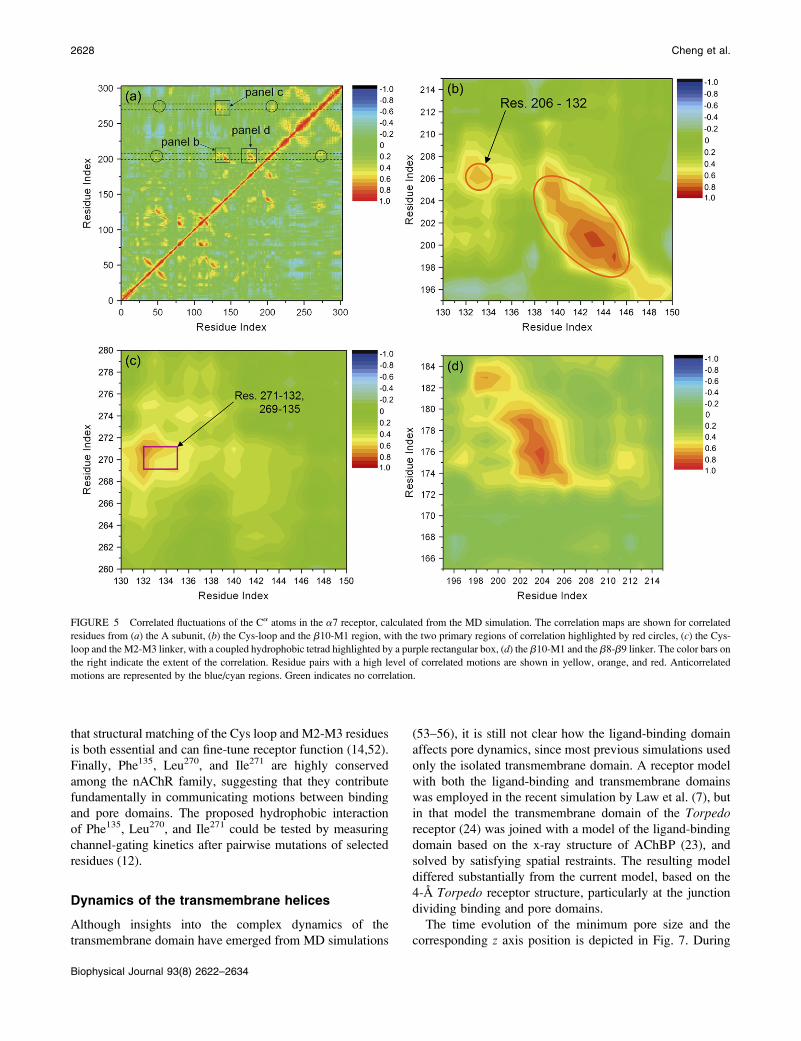
To further probe the structural bases of interdomain
coupling, we generated cross-correlation plots from the MD
simulation. As displayed in Fig. 5 a, extensive correlations
are noted at the interface dividing the ligand-binding and
transmembrane domains. If we draw horizontal stripes at the
corresponding residues, 200–210 (b10-M1 linker) and 265–
275 (M2-M3 linker), we see these stripes intersect yellow/
orange spots corresponding to clusters of residues of interest.
The 200–210 stripe intersects at residues 45–50 (b1-b2
linker), 130–142 (Cys-loop), 173–180 (b8-b9 loop), and
268–274 (M2-M3 linker). The 265–275 stripe intersects at
residues 45–50 (b1-b2), 130–142 (Cys-loop), and 205–210
(b10-M1 linker). Some of these intersections correspond to
interdomain pairs previously shown to form crucial links
between binding and gating domains (12,24), and include the
pairs M2-M3/b1-b2, M2-M3/b10-M1, and b10-M1/b1-b2
(Fig. 5 a, circles). Additional intersections correspond to
potentially novel pairs of coupled domains, such as the M2-
M3/Cys-loop, b10-M1/Cys-loop, and b10-M1/b8-b9 linker
(Fig. 5 a, squares).
Correlated residues from the Cys-loop and the b10-M1
region are shown in an expanded view in Fig. 5 b; a similar
correlation pattern is consistently seen in four out of five
subunits. The primary region of correlation corresponds to a
stretch of residues (138–146) from the Cys-loop/b7 strand
and residues 198–205 in the b10-M1 region, indicating a
concerted motion of these two strands. The second region
reveals correlated motion between Val132 from the Cys-loop
and Arg206 from the b10-M1 region. These two correlation
patterns likely reflect the local fold of the protein, which
couples the motion of the Cys-loop/b7 strand and b10-M1
region to the middle of the Cys-loop.
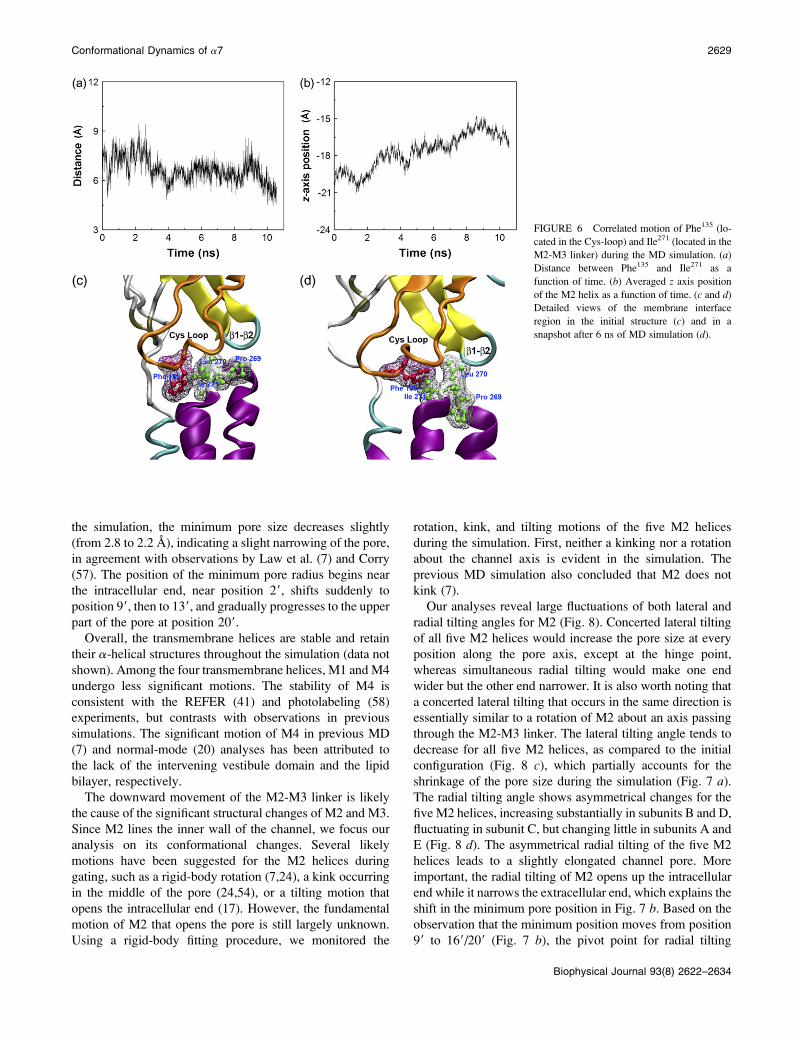
Correlated residues from the Cys-loop and the M2-M3
linker are shown in an expanded view in Fig. 5 c. The results
reveal a cluster of hydrophobic residues involving Val132-
Phe135 from the Cys-loop and Pro269-Ile271 from the M2-M3
linker; the pattern is seen in four out of five subunits. Closer
inspection of the simulation trajectory reveals that the
coupled motions may be mediated by stabilization of Phe135
in the hydrophobic crevice formed by Leu270 and Ile271. Fig.
6 a plots the distance between the CZ atom of Phe135 and the
Ca atom of Ile271 as a function of time; after ;4 ns, Phe135
moves closer to Ile271. In the meantime, as shown in Fig. 6 b,
the z axis position of M2 also decreases, indicating a
downward shift of the M2 helix. Thus movement of the
backbone of the Cys-loop leads to side-chain rotation of
Phe135, which then docks into the hydrophobic pocket made
by the side chains of residues Leu270 and Ile271 from the
apposing M2-M3 linker (Fig. 6, c and d). Through this newly
formed contact, motion of the Cys loop is translated to the
M2-M3 linker, which curls down and displaces M2 down-
ward in the membrane. During the transition, the Phe135 side
chain x angle fluctuates back and forth for ;2 ns, but at
2.4 ns it flips from�160� to�60� (Fig. 6, c and d), remaining
in this position for the rest of the simulation. More subtle
changes are seen in the backbone angles.
A direct interaction between Phe135 and Leu270/Ile271 is
consistent with interpretations based on two chimera receptors
FIGURE 4 ‘‘Block’’ motion of the a7 receptor as suggested by the
TLSMD analysis based on the simulation data. Fourteen blocks have been
identified within a single a7 subunit, and are shown in different colors. The
color bar on the bottom indicates the sequence information. (a) Front view,
taken from the periphery of the receptor. (b) Rotated ;180� from the
position in a.
Conformational Dynamics of a7 2627
Biophysical Journal 93(8) 2622–2634
that structural matching of the Cys loop and M2-M3 residues
is both essential and can fine-tune receptor function (14,52).
Finally, Phe135, Leu270, and Ile271 are highly conserved
among the nAChR family, suggesting that they contribute
fundamentally in communicating motions between binding
and pore domains. The proposed hydrophobic interaction
of Phe135, Leu270, and Ile271 could be tested by measuring
channel-gating kinetics after pairwise mutations of selected
residues (12).
Dynamics of the transmembrane helices
Although insights into the complex dynamics of the
transmembrane domain have emerged from MD simulations
(53–56), it is still not clear how the ligand-binding domain
affects pore dynamics, since most previous simulations used
only the isolated transmembrane domain. A receptor model
with both the ligand-binding and transmembrane domains
was employed in the recent simulation by Law et al. (7), but
in that model the transmembrane domain of the Torpedoreceptor (24) was joined with a model of the ligand-binding
domain based on the x-ray structure of AChBP (23), and
solved by satisfying spatial restraints. The resulting model
differed substantially from the current model, based on the
4-A Torpedo receptor structure, particularly at the junction
dividing binding and pore domains.
The time evolution of the minimum pore size and the
corresponding z axis position is depicted in Fig. 7. During
FIGURE 5 Correlated fluctuations of the Ca atoms in the a7 receptor, calculated from the MD simulation. The correlation maps are shown for correlated
residues from (a) the A subunit, (b) the Cys-loop and the b10-M1 region, with the two primary regions of correlation highlighted by red circles, (c) the Cys-
loop and the M2-M3 linker, with a coupled hydrophobic tetrad highlighted by a purple rectangular box, (d) the b10-M1 and the b8-b9 linker. The color bars on
the right indicate the extent of the correlation. Residue pairs with a high level of correlated motions are shown in yellow, orange, and red. Anticorrelated
motions are represented by the blue/cyan regions. Green indicates no correlation.
2628 Cheng et al.
Biophysical Journal 93(8) 2622–2634
the simulation, the minimum pore size decreases slightly
(from 2.8 to 2.2 A), indicating a slight narrowing of the pore,
in agreement with observations by Law et al. (7) and Corry
(57). The position of the minimum pore radius begins near
the intracellular end, near position 29, shifts suddenly to
position 99, then to 139, and gradually progresses to the upper
part of the pore at position 209.
Overall, the transmembrane helices are stable and retain
their a-helical structures throughout the simulation (data not
shown). Among the four transmembrane helices, M1 and M4
undergo less significant motions. The stability of M4 is
consistent with the REFER (41) and photolabeling (58)
experiments, but contrasts with observations in previous
simulations. The significant motion of M4 in previous MD
(7) and normal-mode (20) analyses has been attributed to
the lack of the intervening vestibule domain and the lipid
bilayer, respectively.
The downward movement of the M2-M3 linker is likely
the cause of the significant structural changes of M2 and M3.
Since M2 lines the inner wall of the channel, we focus our
analysis on its conformational changes. Several likely
motions have been suggested for the M2 helices during
gating, such as a rigid-body rotation (7,24), a kink occurring
in the middle of the pore (24,54), or a tilting motion that
opens the intracellular end (17). However, the fundamental
motion of M2 that opens the pore is still largely unknown.
Using a rigid-body fitting procedure, we monitored the
rotation, kink, and tilting motions of the five M2 helices
during the simulation. First, neither a kinking nor a rotation
about the channel axis is evident in the simulation. The
previous MD simulation also concluded that M2 does not
kink (7).
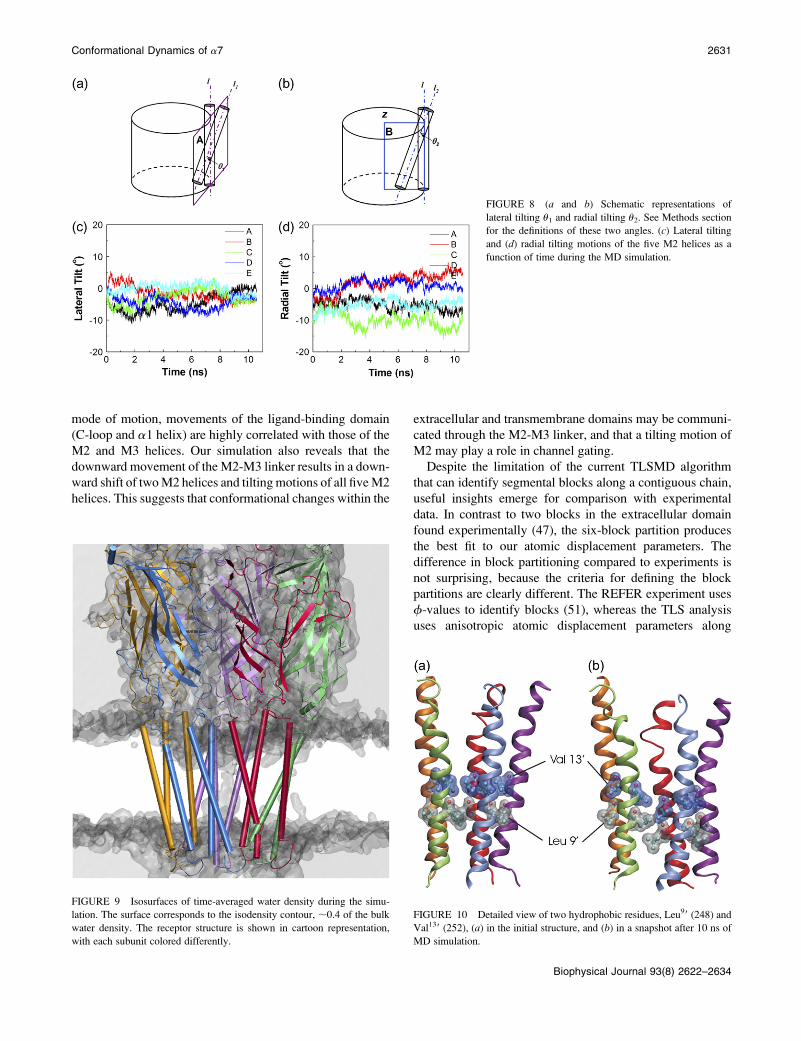
Our analyses reveal large fluctuations of both lateral and
radial tilting angles for M2 (Fig. 8). Concerted lateral tilting
of all five M2 helices would increase the pore size at every
position along the pore axis, except at the hinge point,
whereas simultaneous radial tilting would make one end
wider but the other end narrower. It is also worth noting that
a concerted lateral tilting that occurs in the same direction is
essentially similar to a rotation of M2 about an axis passing
through the M2-M3 linker. The lateral tilting angle tends to
decrease for all five M2 helices, as compared to the initial
configuration (Fig. 8 c), which partially accounts for the
shrinkage of the pore size during the simulation (Fig. 7 a).
The radial tilting angle shows asymmetrical changes for the
five M2 helices, increasing substantially in subunits B and D,
fluctuating in subunit C, but changing little in subunits A and
E (Fig. 8 d). The asymmetrical radial tilting of the five M2
helices leads to a slightly elongated channel pore. More
important, the radial tilting of M2 opens up the intracellular
end while it narrows the extracellular end, which explains the
shift in the minimum pore position in Fig. 7 b. Based on the
observation that the minimum position moves from position
99 to 169/209 (Fig. 7 b), the pivot point for radial tilting
FIGURE 6 Correlated motion of Phe135 (lo-
cated in the Cys-loop) and Ile271 (located in the
M2-M3 linker) during the MD simulation. (a)
Distance between Phe135 and Ile271 as a
function of time. (b) Averaged z axis position
of the M2 helix as a function of time. (c and d)
Detailed views of the membrane interface
region in the initial structure (c) and in a
snapshot after 6 ns of MD simulation (d).
Conformational Dynamics of a7 2629
Biophysical Journal 93(8) 2622–2634
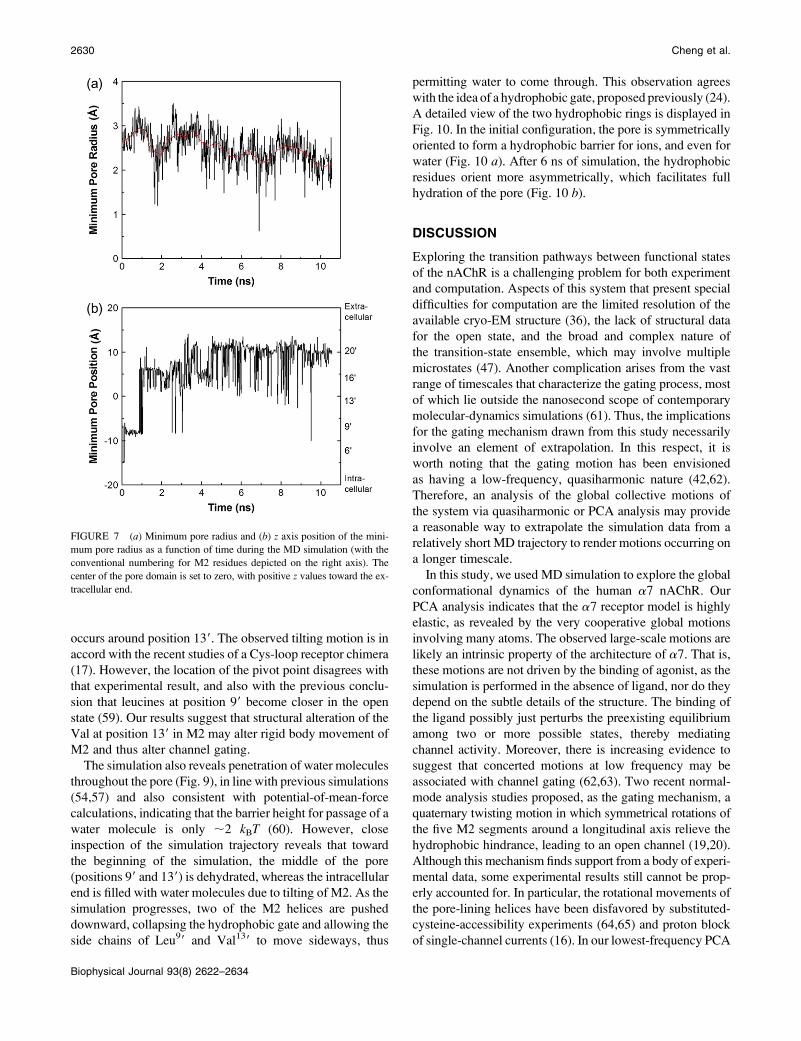
occurs around position 139. The observed tilting motion is in
accord with the recent studies of a Cys-loop receptor chimera
(17). However, the location of the pivot point disagrees with
that experimental result, and also with the previous conclu-
sion that leucines at position 99 become closer in the open
state (59). Our results suggest that structural alteration of the
Val at position 139 in M2 may alter rigid body movement of
M2 and thus alter channel gating.
The simulation also reveals penetration of water molecules
throughout the pore (Fig. 9), in line with previous simulations
(54,57) and also consistent with potential-of-mean-force
calculations, indicating that the barrier height for passage of a
water molecule is only ;2 kBT (60). However, close
inspection of the simulation trajectory reveals that toward
the beginning of the simulation, the middle of the pore
(positions 99 and 139) is dehydrated, whereas the intracellular
end is filled with water molecules due to tilting of M2. As the
simulation progresses, two of the M2 helices are pushed
downward, collapsing the hydrophobic gate and allowing the
side chains of Leu99 and Val139 to move sideways, thus
permitting water to come through. This observation agrees
with the idea of a hydrophobic gate, proposed previously (24).
A detailed view of the two hydrophobic rings is displayed in
Fig. 10. In the initial configuration, the pore is symmetrically
oriented to form a hydrophobic barrier for ions, and even for
water (Fig. 10 a). After 6 ns of simulation, the hydrophobic
residues orient more asymmetrically, which facilitates full
hydration of the pore (Fig. 10 b).
DISCUSSION
Exploring the transition pathways between functional states
of the nAChR is a challenging problem for both experiment
and computation. Aspects of this system that present special
difficulties for computation are the limited resolution of the
available cryo-EM structure (36), the lack of structural data
for the open state, and the broad and complex nature of
the transition-state ensemble, which may involve multiple
microstates (47). Another complication arises from the vast
range of timescales that characterize the gating process, most
of which lie outside the nanosecond scope of contemporary
molecular-dynamics simulations (61). Thus, the implications
for the gating mechanism drawn from this study necessarily
involve an element of extrapolation. In this respect, it is
worth noting that the gating motion has been envisioned
as having a low-frequency, quasiharmonic nature (42,62).
Therefore, an analysis of the global collective motions of
the system via quasiharmonic or PCA analysis may provide
a reasonable way to extrapolate the simulation data from a
relatively short MD trajectory to render motions occurring on
a longer timescale.
In this study, we used MD simulation to explore the global
conformational dynamics of the human a7 nAChR. Our
PCA analysis indicates that the a7 receptor model is highly
elastic, as revealed by the very cooperative global motions
involving many atoms. The observed large-scale motions are
likely an intrinsic property of the architecture of a7. That is,
these motions are not driven by the binding of agonist, as the
simulation is performed in the absence of ligand, nor do they
depend on the subtle details of the structure. The binding of
the ligand possibly just perturbs the preexisting equilibrium
among two or more possible states, thereby mediating
channel activity. Moreover, there is increasing evidence to
suggest that concerted motions at low frequency may be
associated with channel gating (62,63). Two recent normal-
mode analysis studies proposed, as the gating mechanism, a
quaternary twisting motion in which symmetrical rotations of
the five M2 segments around a longitudinal axis relieve the
hydrophobic hindrance, leading to an open channel (19,20).
Although this mechanism finds support from a body of experi-
mental data, some experimental results still cannot be prop-
erly accounted for. In particular, the rotational movements of
the pore-lining helices have been disfavored by substituted-
cysteine-accessibility experiments (64,65) and proton block
of single-channel currents (16). In our lowest-frequency PCA
FIGURE 7 (a) Minimum pore radius and (b) z axis position of the mini-
mum pore radius as a function of time during the MD simulation (with the
conventional numbering for M2 residues depicted on the right axis). The
center of the pore domain is set to zero, with positive z values toward the ex-
tracellular end.
2630 Cheng et al.
Biophysical Journal 93(8) 2622–2634
mode of motion, movements of the ligand-binding domain
(C-loop and a1 helix) are highly correlated with those of the
M2 and M3 helices. Our simulation also reveals that the
downward movement of the M2-M3 linker results in a down-
ward shift of two M2 helices and tilting motions of all five M2
helices. This suggests that conformational changes within the
extracellular and transmembrane domains may be communi-
cated through the M2-M3 linker, and that a tilting motion of
M2 may play a role in channel gating.
Despite the limitation of the current TLSMD algorithm
that can identify segmental blocks along a contiguous chain,
useful insights emerge for comparison with experimental
data. In contrast to two blocks in the extracellular domain
found experimentally (47), the six-block partition produces
the best fit to our atomic displacement parameters. The
difference in block partitioning compared to experiments is
not surprising, because the criteria for defining the block
partitions are clearly different. The REFER experiment uses
f-values to identify blocks (51), whereas the TLS analysis
uses anisotropic atomic displacement parameters along
FIGURE 9 Isosurfaces of time-averaged water density during the simu-
lation. The surface corresponds to the isodensity contour, ;0.4 of the bulk
water density. The receptor structure is shown in cartoon representation,
with each subunit colored differently.
FIGURE 8 (a and b) Schematic representations of
lateral tilting u1 and radial tilting u2. See Methods section
for the definitions of these two angles. (c) Lateral tilting
and (d) radial tilting motions of the five M2 helices as a
function of time during the MD simulation.
FIGURE 10 Detailed view of two hydrophobic residues, Leu99 (248) and
Val139 (252), (a) in the initial structure, and (b) in a snapshot after 10 ns of
MD simulation.
Conformational Dynamics of a7 2631
Biophysical Journal 93(8) 2622–2634
consecutive segments of the protein chain (48). Moreover,
our 10-ns simulation likely only samples the local confor-
mational space from the presumed closed state, whereas the
observed dynamics may represent part of the gating motion
due to the elasticity of the protein.
Overall, a fully water-filled pore is observed in the
simulation. However, toward the beginning of the simulation,
the pore is only partially hydrated for ;1–2 ns. Consistent
with previous observations, the dry region is not the
narrowest, but actually the most hydrophobic one (99 and
139 positions). The dry region starts to be occupied with water
molecules when the side chains of Leu99 and Val139 move
sideways in response to downward motions of two M2
helices. Whereas no significant kinking of M2 occurs, tilting
of M2 is observed within 10 ns of the simulation. The
concerted tilting of all five M2 helices widens the intracellular
end of the pore, suggesting that tilting of M2 may be involved
in early stages of channel dynamics, leading to gating.
Another striking observation is a hydrophobic coupling
between the Cys-loop (Phe135) and the M2-M3 linker (Leu270/
Ile271), which acts as a pivot point linking the structural re-
arrangements in the ligand-binding domain to the motion of
the transmembrane domain.
Finally, the ligand-binding domain greatly impacts the
dynamics of the transmembrane helices. The ligand-binding
domain not only initiates the motion that is translated to the
pore domain, but also provides an important environment for
several connecting loops located at the interface dividing
binding and pore domains. Previous simulations of the
transmembrane helices showed partial unfolding of the two
helical ends of the transmembrane segments (53,56), which
could lead to unrealistic movements of the transmembrane
domains, especially the M2 and M3 helices.
CONCLUSION
In summary, consistent global motion of the a7 acetylcho-
line receptor is observed from various analyses of a 10-ns
MD simulation. The low-frequency global motion involves a
bending motion hinged at the b10-M1 region, accompanied
by tilting motions of the five M2 helices. Outward move-
ments of the C-loop—which, it has been proposed, acts as a
handle of a lever—correlate strongly with the tilting motions
of the transmembrane helices. The observed motion provides
a possible model of dynamical coupling that may indicate the
start of the gating step. Our simulation results suggest several
experimental tests of our inferences. First, the interaction
between Phe135 in the Cys-loop and Leu270/Ile271 in the
M2-M3 linker, identified computationally, could be tested
using natural and unnatural amino acid substitution. Second,
mutating Val139 residues might impair M2 tilting and alter
channel gating. Third, it is predicted that M1 and M2 move
together and thus should have similar f-values. Future
studies of the a7 receptor will benefit from a close interplay
between experimental approaches and simulation, and likely
require a more detailed structural understanding of the chan-
nel in the closed and open states.
SUPPLEMENTARY MATERIAL
To view all of the supplemental files associated with this
article, visit www.biophysj.org.
We thank Richard Law for providing us with the original RMSF data
presented in Fig. 2 a.
I.I. acknowledges financial support from the Burroughs Wellcome Fund in
the form of a La Jolla Interfaces in Science fellowship. Support to J.A.M.
for this project was provided partly by the National Science Foundation
(NSF), National Institutes of Health, San Diego Supercomputer Center,
Howard Hughes Medical Institute, National Biomedical Computation
Resource, and NSF Center for Theoretical Biological Physics.
REFERENCES
1. Sine, S. M., and A. G. Engel. 2006. Recent advances in Cys-loopreceptor structure and function. Nature. 440:448–455.
2. Celie, P. H., S. E. van Rossum-Fikkert, W. J. van Dijk, K. Brejc, A. B.Smit, and T. K. Sixma. 2004. Nicotine and carbamylcholine binding tonicotinic acetylcholine receptors as studied in AChBP crystal struc-tures. Neuron. 41:907–914.
3. Hansen, S. B., G. Sulzenbacher, T. Huxford, P. Marchot, P. Taylor, andY. Bourne. 2005. Structures of Aplysia AChBP complexes withnicotinic agonists and antagonists reveal distinctive binding interfacesand conformations. EMBO J. 24:3635–3646.
4. Gao, F., N. Bren, T. P. Burghardt, S. Hansen, R. H. Henchman, P.Taylor, J. A. McCammon, and S. M. Sine. 2005. Agonist-mediatedconformational changes in acetylcholine-binding protein revealed bysimulation and intrinsic tryptophan fluorescence. J. Biol. Chem.280:8443–8451.
5. Shi, J., J. R. Koeppe, E. A. Komives, and P. Taylor. 2006. Ligand-induced conformational changes in the acetylcholine-binding proteinanalyzed by hydrogen-deuterium exchange mass spectrometry. J. Biol.Chem. 281:12170–12177.
6. Gao, F., G. Mer, M. Tonelli, S. B. Hansen, T. P. Burghardt, P. Taylor,and S. M. Sine. 2006. Solution NMR of acetylcholine binding proteinreveals agonist-mediated conformational change of the C-loop. Mol.Pharmacol. 70:1230–1235.
7. Law, R. J., R. H. Henchman, and J. A. McCammon. 2005. A gatingmechanism proposed from a simulation of a human a7 nicotinicacetylcholine receptor. Proc. Natl. Acad. Sci. USA. 102:6813–6818.
8. Karlin, A., and M. H. Akabas. 1998. Substituted-cysteine accessibilitymethod. Methods Enzymol. 293:123–145.
9. Bera, A. K., M. Chatav, and M. H. Akabas. 2002. GABA(A) receptorM2-M3 loop secondary structure and changes in accessibility duringchannel gating. J. Biol. Chem. 277:43002–43010.
10. Horenstein, J., D. A. Wagner, C. Czajkowski, and M. H. Akabas. 2001.Protein mobility and GABA-induced conformational changes inGABA(A) receptor pore-lining M2 segment. Nat. Neurosci. 4:477–485.
11. Kash, T. L., A. Jenkins, J. C. Kelley, J. R. Trudell, and N. L. Harrison.2003. Coupling of agonist binding to channel gating in the GABA(A)receptor. Nature. 421:272–275.
12. Lee, W. Y., and S. M. Sine. 2005. Principal pathway coupling agonistbinding to channel gating in nicotinic receptors. Nature. 438:243–247.
13. Cheng, X., H. Wang, B. Grant, S. M. Sine, and J. A. McCammon.2006. Targeted molecular dynamics study of C-loop closure andchannel gating in nicotinic receptors. PLoS Comput. Biol. 2:e134.
2632 Cheng et al.
Biophysical Journal 93(8) 2622–2634
14. Bouzat, C., F. Gumilar, G. Spitzmaul, H. L. Wang, D. Rayes, S. B.Hansen, P. Taylor, and S. M. Sine. 2004. Coupling of agonist bindingto channel gating in an ACh-binding protein linked to an ion channel.Nature. 430:896–900.
15. Unwin, N. 1995. Acetylcholine receptor channel imaged in the openstate. Nature. 373:37–43.
16. Cymes, G. D., Y. Ni, and C. Grosman. 2005. Probing ion-channelpores one proton at a time. Nature. 438:975–980.
17. Paas, Y., G. Gibor, R. Grailhe, N. Savatier-Duclert, V. Dufresne, M.Sunesen, L. P. de Carvalho, J. P. Changeux, and B. Attali. 2005. Poreconformations and gating mechanism of a Cys-loop receptor. Proc.Natl. Acad. Sci. USA. 102:15877–15882.
18. Grosman, C., M. Zhou, and A. Auerbach. 2000. Mapping the conforma-tional wave of acetylcholine receptor channel gating. Nature. 403:773–776.
19. Taly, A., M. Delarue, T. Grutter, M. Nilges, N. Le Novere, P. J.Corringer, and J. P. Changeux. 2005. Normal mode analysis suggests aquaternary twist model for the nicotinic receptor gating mechanism.Biophys. J. 88:3954–3965.
20. Cheng, X., B. Lu, B. Grant, R. J. Law, and J. A. McCammon. 2006.Channel opening motion of a7 nicotinic acetylcholine receptor assuggested by normal mode analysis. J. Mol. Biol. 355:310–324.
21. Henchman, R. H., H. L. Wang, S. M. Sine, P. Taylor, and J. A.McCammon. 2003. Asymmetric structural motions of the homomerica7 nicotinic receptor ligand binding domain revealed by moleculardynamics simulation. Biophys. J. 85:3007–3018.
22. Henchman, R. H., H. L. Wang, S. M. Sine, P. Taylor, and J. A.McCammon. 2005. Ligand-induced conformational change in the a7nicotinic receptor ligand binding domain. Biophys. J. 88:2564–2576.
23. Brejc, K., W. J. van Dijk, R. V. Klaassen, M. Schuurmans, J. van DerOost, A. B. Smit, and T. K. Sixma. 2001. Crystal structure of an ACh-binding protein reveals the ligand-binding domain of nicotinicreceptors. Nature. 411:269–276.
24. Miyazawa, A., Y. Fujiyoshi, and N. Unwin. 2003. Structure and gatingmechanism of the acetylcholine receptor pore. Nature. 423:949–955.
25. Sali, A., and T. L. Blundell. 1993. Comparative protein modelling bysatisfaction of spatial restraints. J. Mol. Biol. 234:779–815.
26. Sali, A., L. Potterton, F. Yuan, H. van Vlijmen, and M. Karplus. 1995.Evaluation of comparative protein modeling by MODELLER. Pro-teins. 23:318–326.
27. Laskowski, R. A., M. W. MacArthur, D. S. Moss, and J. M. Thornton.1993. PROCHECK: a program to check the stereochemical quality ofprotein structures. J. Appl. Crystallogr. 26:283–291.
28. Sippl, M. J. 1993. Recognition of errors in three-dimensional structuresof proteins. Protein. 17:355–362.
29. Phillips, J. C., R. Braun, W. Wang, J. Gumbart, E. Tajkhorshid, E.Villa, C. Chipot, R. D. Skeel, L. Kale, and K. Schulten. 2005. Scalablemolecular dynamics with NAMD. J. Comput. Chem. 26:1781–1802.
30. MacKerrell, A. D., D. Bashford, M. Bellott, R. L. Dunbrack, J. D.Evanseck, M. J. Field, S. Fischer, J. Gao, H. Guo, S. Ha, D. Joseph-McCarthy, L. Kuchnir, K. Kuczera, F. T. K. Lau, C. Mattos, S.Michnick, T. Ngo, D. T. Nguyen, B. Prodhom, W. E. Reiher III, B.Roux, M. Schlenkrich, J. C. Smith, R. Stote, J. Straub, M. Watanabe,M. Watanabe, D. Yin, and M. Karplus. 1998. All-atom empiricalpotential for molecular modeling and dynamics studies of proteins.J. Phys. Chem. B. 102:3586–3616.
31. Darden, T., D. York, and L. Pedersen. 1993. Particle mesh Ewald: AnN log (N) method for Ewald sums in large systems. J. Chem. Phys.98:10089–10092.
32. Van Der Spoel, D., E. Lindahl, B. Hess, G. Groenhof, A. E. Mark, andH. J. Berendsen. 2005. GROMACS: fast, flexible, and free. J. Comput.Chem. 26:1701–1718.
33. Painter, J., and E. A. Merritt. 2006. TLSMD web server for thegeneration of multi-group TLS models. J. Appl. Crystallogr. 39:109–111.
34. Smart, O. S., J. G. Neduvelil, X. Wang, B. A. Wallace, and M. S.Sansom. 1996. HOLE: a program for the analysis of the pore dimensionsof ion channel structural models. J. Mol. Graph. 14:354–360.
35. Humphrey, W., A. Dalke, and K. Schulten. 1996. VMD: visualmolecular dynamics. J. Mol. Graph. Model. 14:33–38.
36. Unwin, N. 2005. Refined structure of the nicotinic acetylcholinereceptor at 4A resolution. J. Mol. Biol. 346:967–989.
37. Lester, H. A., M. I. Dibas, D. S. Dahan, J. F. Leite, and D. A.Dougherty. 2004. Cys-loop receptors: new twists and turns. TrendsNeurosci. 27:329–336.
38. Absalom, N. L., T. M. Lewis, and P. R. Schofield. 2004. Mechanismsof channel gating of the ligand-gated ion channel superfamily inferredfrom protein structure. Exp. Physiol. 89:145–153.
39. Dahan, D. S., M. I. Dibas, E. J. Petersson, V. C. Auyeung, B. Chanda,F. Bezanilla, D. A. Dougherty, and H. A. Lester. 2004. A fluorophoreattached to nicotinic acetylcholine receptor b M2 detects productivebinding of agonist to the ad site. Proc. Natl. Acad. Sci. USA.101:10195–10200.
40. Wick, M. J., S. J. Mihic, S. Ueno, M. P. Mascia, J. R. Trudell, S. J.Brozowski, Q. Ye, N. L. Harrison, and R. A. Harris. 1998. Mutationsof gamma-aminobutyric acid and glycine receptors change alcoholcutoff: evidence for an alcohol receptor? Proc. Natl. Acad. Sci. USA.95:6504–6509.
41. Mitra, A., T. D. Bailey, and A. L. Auerbach. 2004. Structural dynamicsof the M4 transmembrane segment during acetylcholine receptorgating. Structure. 12:1909–1918.
42. Miyashita, O., J. N. Onuchic, and P. G. Wolynes. 2003. Nonlinearelasticity, proteinquakes, and the energy landscapes of functionaltransitions in proteins. Proc. Natl. Acad. Sci. USA. 100:12570–12575.
43. Galzi, J. L., D. Bertrand, A. Devillers-Thiery, F. Revah, S. Bertrand,and J. P. Changeux. 1991. Functional significance of aromatic aminoacids from three peptide loops of the a7 neuronal nicotinic receptor siteinvestigated by site-directed mutagenesis. FEBS Lett. 294:198–202.
44. Corringer, P. J., N. Le Novere, and J. P. Changeux. 2000. Nicotinic receptorsat the amino acid level. Annu. Rev. Pharmacol. Toxicol. 40:431–458.
45. Mukhtasimova, N., C. Free, and S. M. Sine. 2005. Initial coupling ofbinding to gating mediated by conserved residues in the musclenicotinic receptor. J. Gen. Physiol. 126:23–39.
46. Campos-Caro, A., S. Sala, J. J. Ballesta, F. Vicente-Agullo, M. Criado,and F. Sala. 1996. A single residue in the M2-M3 loop is a majordeterminant of coupling between binding and gating in neuronalnicotinic receptors. Proc. Natl. Acad. Sci. USA. 93:6118–6123.
47. Auerbach, A. 2005. Gating of acetylcholine receptor channels:brownian motion across a broad transition state. Proc. Natl. Acad.Sci. USA. 102:1408–1412.
48. Painter, J., and E. A. Merritt. 2006. Optimal description of a proteinstructure in terms of multiple groups undergoing TLS motion. ActaCrystallogr. D. 62:439–450.
49. Unwin, N., A. Miyazawa, J. Li, and Y. Fujiyoshi. 2002. Activation ofthe nicotinic acetylcholine receptor involves a switch in conformationof the a subunits. J. Mol. Biol. 319:1165–1176.
50. Cymes, G. D., C. Grosman, and A. Auerbach. 2002. Structure of thetransition state of gating in the acetylcholine receptor channel pore: af-value analysis. Biochemistry. 41:5548–5555.
51. Zhou, Y., J. E. Pearson, and A. Auerbach. 2005. f-value analysis of alinear, sequential reaction mechanism: theory and application to ionchannel gating. Biophys. J. 89:3680–3685.
52. Grutter, T., L. P. de Carvalho, V. Dufresne, A. Taly, S. J. Edelstein,and J. P. Changeux. 2005. Molecular tuning of fast gating inpentameric ligand-gated ion channels. Proc. Natl. Acad. Sci. USA.102:18207–18212.
53. Xu, Y., F. J. Barrantes, X. Luo, K. Chen, J. Shen, and H. Jiang. 2005.Conformational dynamics of the nicotinic acetylcholine receptorchannel: a 35-ns molecular dynamics simulation study. J. Am. Chem.Soc. 127:1291–1299.
54. Hung, A., K. Tai, and M. S. Sansom. 2005. Molecular dynamicssimulation of the M2 helices within the nicotinic acetylcholine receptortransmembrane domain: structure and collective motions. Biophys. J.88:3321–3333.
Conformational Dynamics of a7 2633
Biophysical Journal 93(8) 2622–2634
55. Saladino, A. C., Y. Xu, and P. Tang. 2005. Homology modeling andmolecular dynamics simulations of transmembrane domain structure ofhuman neuronal nicotinic acetylcholine receptor. Biophys. J. 88:1009–1017.
56. Saiz, L., and M. L. Klein. 2005. The transmembrane domain of theacetylcholine receptor: insights from simulations on synthetic peptidemodels. Biophys. J. 88:959–970.
57. Corry, B. 2006. An energy-efficient gating mechanism in theacetylcholine receptor channel suggested by molecular and Browniandynamics. Biophys. J. 90:799–810.
58. Leite, J. F., M. P. Blanton, M. Shahgholi, D. A. Dougherty, and H. A.Lester. 2003. Conformation-dependent hydrophobic photolabeling ofthe nicotinic receptor: electrophysiology-coordinated photochemistryand mass spectrometry. Proc. Natl. Acad. Sci. USA. 100:13054–13059.
59. Kearney, P. C., H. Zhang, W. Zhong, D. A. Dougherty, and H. A.Lester. 1996. Determinants of nicotinic receptor gating in natural andunnatural side chain structures at the M2 99 position. Neuron. 17:1221–1229.
60. Beckstein, O., and M. S. Sansom. 2006. A hydrophobic gate in an ionchannel: the closed state of the nicotinic acetylcholine receptor. Phys.Biol. 3:147–159.
61. Chakrapani, S., and A. Auerbach. 2005. A speed limit for conforma-tional change of an allosteric membrane protein. Proc. Natl. Acad. Sci.USA. 102:87–92.
62. Valadie, H., J. J. Lacapcre, Y. H. Sanejouand, and C. Etchebest. 2003.Dynamical properties of the MscL of Escherichia coli: a normal modeanalysis. J. Mol. Biol. 332:657–674.
63. Shen, Y., Y. Kong, and J. Ma. 2002. Intrinsic flexibility and gatingmechanism of the potassium channel KcsA. Proc. Natl. Acad. Sci.USA. 99:1949–1953.
64. Wilson, G. G., and A. Karlin. 1998. The location of the gate in theacetylcholine receptor channel. Neuron. 20:1269–1281.
65. Wilson, G. G., and A. Karlin. 2001. Acetylcholine receptor channelstructure in the resting, open, and desensitized states probed with thesubstituted-cysteine-accessibility method. Proc. Natl. Acad. Sci. USA.98:1241–1248.
2634 Cheng et al.
Biophysical Journal 93(8) 2622–2634