Embed Size (px)
Citation preview
PRAGUE ECONOMIC PAPERS, 2, 2006 � 135
NATIONAL ACCOUNTS DATA AND MACROECONOMICANALYSIS: A COMPARATIVE STUDY OF THE CZECHREPUBLIC, GERMANY, GREECE, IRELAND ANDSLOVENIA
Maks Tajnikar, Nina Ponikvar *
Abstract:In this paper there are analysed the characteristics of various important macroeconomicvariables in the Slovenian economy and compared with the macroeconomic developmentin the Czech Republic, Germany, Greece and Ireland in two periods of 1997-1999 and2000-2002. The main objectives of the paper are to observe changes in the macroecono-mic variables of the analysed countries during the observed periods, to determine the sour-ces of any differences in macroeconomic characteristics between Slovenia and the otheranalysed countries and, finally, to suggest some steps and measures to improve the mac-roeconomic situation of these countries. Data from national accounts are used in the ana-lysis. In terms of methodology, the paper is based on post-Keynesian economic theory andits long-term economic model of a market economy with private ownership. Based on theanalysis it was concluded that in all analysed countries there should be a greater empha-sis on tax policy to create an incentive for investing and saving, on incomes policy to con-trol the dynamics of nominal wages, and on technological policy as a prerequisite for im-proved economic efficiency.
Keywords: long-run macroeconomic model, national accounts, post-Keynesian economictheory, Slovenia, Czech Republic, Germany, Greece, Ireland
JEL Classification: B 500, E 120
1. Introduction
In this paper there are analysed the characteristics of the most important macroeco-nomic variables in the Slovenian economy in two separate periods and comparedagainst macroeconomic situations found in the Czech Republic, Germany, Greeceand Ireland. The focus is firstly to observe changes in the macroeconomic develop-ment of the analysed countries during the research periods, secondly to determinethe sources of any differences in macroeconomic characteristics between Slovenia
*) University of Ljubljana, 17, Kardeljeva Sq., SI – 1000 Ljubljana (e-mail: [email protected], [email protected]).
136 � PRAGUE ECONOMIC PAPERS, 2, 2006
and other observed countries and, thirdly, to suggest measures to improve theirmacroeconomic situations. The authors therefore try to identify those macroecono-mic variables that are crucial from the economic policy point of view. Data fromnational accounts are used as the starting point of the analysis. When properly com-bined with a suitable economic model, the data allow us to closely examine natio-nal macroeconomic conditions and to forecast macroeconomic dynamics.
In methodological terms, the paper is based on post-Keynesian economic theoryand its long-term economic model of a market economy with private ownership(Robinson and Eatwell, 1973; Robinson, 1962; Tajnikar, 1996, 2000). In this mo-del’s long-term analysis, the key economic aggregates are investment and the invest-ment rate, the growth of labour and production capacities, the technical progress,the nominal and real wages, the price level and the propensity to save. In the shortrun, aggregate data on consumption, capacity utilisation, production costs and otherelements of effective demand are also important. Through this analysis, long-termeconomic changes crucial to the macroeconomic situation can be explained andunderstood on the basis of short-term data.
2. Data
The starting point of the analysis involves data drawn from the tables “Relationsamong Product, Income, Savings and Net Lending Aggregates” and “Cost Compo-nents of the Gross Domestic Product” taken from the United Nations’ NationalAccounts Statistics (2003, 2005). Fundamental aggregates in the analysis are grossdomestic product (GDP) and gross national disposable income (GDY). Togetherwith the current account balance (X), the latter gives domestic aggregate consum-ption (Y). Domestic savings are defined as the difference between real gross natio-nal disposable income and final consumption expenditure (Yd). On the other hand,total savings (S) also include the current account balance. By profits in the econo-my (Pr) there are understood the gross operating surplus, which is the sum of theconsumption of fixed capital and the net operating surplus. The difference betweenGDP and profits, defined as above, represents household and state incomes. In themodel, the latter are called wages – real wages (Wr) and nominal wages (Wn). Inthe macroeconomic model applied in the analysis, the number of people employed(L) and the value of capital (K) in national economies are also used.
Capital is a category that is formed from gross investment (I). The value of as-sets in national economies (K) would therefore be a suitable variable to use in themodel. Even theoretically, capital is not a factor of production that is easy to define(Arestis, 1992, p. 65; Garegnani, 1970) and it becomes even more difficult to mea-sure and assess it in practice. Since Slovenian statistics do not include data on as-sets and the international statistics also do not include them, even if data on assetswere available for some countries, the value of assets (capital) had to be estimatedotherwise. The value of assets for the analysed countries was calculated from theconsumption of fixed capital by assuming and applying a uniform depreciation ratefor all countries. The depreciation rate applied of 4.18792% was calculated fromSlovenian survey data from 1999 (Statistical Office of the Republic of Slovenia,2001). Therefore, the estimated capital value in national economies is based on thepresumption that the depreciation rate was the same for all the countries and for all
PRAGUE ECONOMIC PAPERS, 2, 2006 � 137
of the analysed years. Calculating asset value on the basis of fixed capital consump-tion might be theoretically unacceptable to some and the assumption of a uniformdepreciation rate too daring by others. However, no alternative solution could befound to estimate the value of capital (K) according to the available statistical dataand the results obtained by applying the post-Keynesian model could be different ifsome other capital measurement was applied.
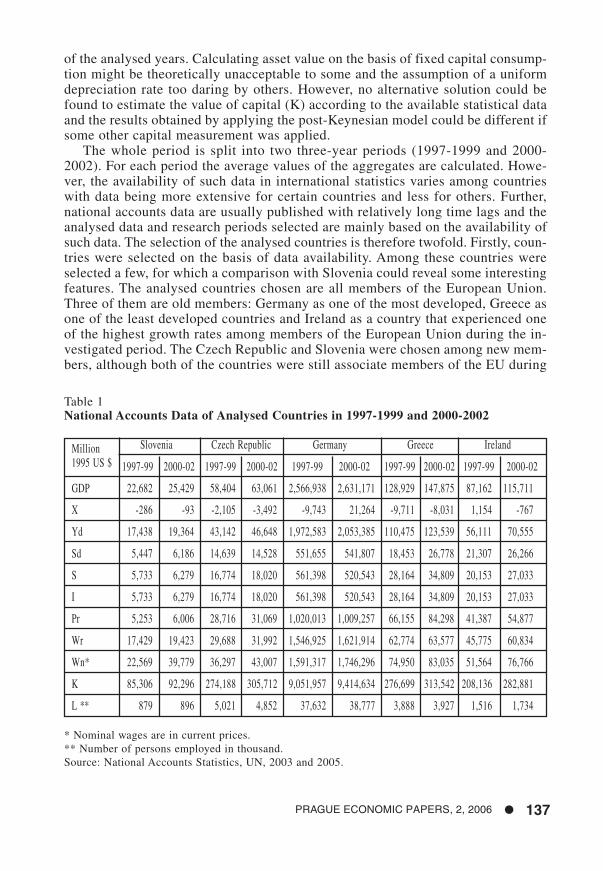
The whole period is split into two three-year periods (1997-1999 and 2000-2002). For each period the average values of the aggregates are calculated. Howe-ver, the availability of such data in international statistics varies among countrieswith data being more extensive for certain countries and less for others. Further,national accounts data are usually published with relatively long time lags and theanalysed data and research periods selected are mainly based on the availability ofsuch data. The selection of the analysed countries is therefore twofold. Firstly, coun-tries were selected on the basis of data availability. Among these countries wereselected a few, for which a comparison with Slovenia could reveal some interestingfeatures. The analysed countries chosen are all members of the European Union.Three of them are old members: Germany as one of the most developed, Greece asone of the least developed countries and Ireland as a country that experienced oneof the highest growth rates among members of the European Union during the in-vestigated period. The Czech Republic and Slovenia were chosen among new mem-bers, although both of the countries were still associate members of the EU during
Table 1National Accounts Data of Analysed Countries in 1997-1999 and 2000-2002
Million Slovenia Czech Republic Germany Greece Ireland
1995 US $ 1997-99 2000-02 1997-99 2000-02 1997-99 2000-02 1997-99 2000-02 1997-99 2000-02
GDP 22,682 25,429 58,404 63,061 2,566,938 2,631,171 128,929 147,875 87,162 115,711
X -286 -93 -2,105 -3,492 -9,743 21,264 -9,711 -8,031 1,154 -767
Yd 17,438 19,364 43,142 46,648 1,972,583 2,053,385 110,475 123,539 56,111 70,555
Sd 5,447 6,186 14,639 14,528 551,655 541,807 18,453 26,778 21,307 26,266
S 5,733 6,279 16,774 18,020 561,398 520,543 28,164 34,809 20,153 27,033
I 5,733 6,279 16,774 18,020 561,398 520,543 28,164 34,809 20,153 27,033
Pr 5,253 6,006 28,716 31,069 1,020,013 1,009,257 66,155 84,298 41,387 54,877
Wr 17,429 19,423 29,688 31,992 1,546,925 1,621,914 62,774 63,577 45,775 60,834
Wn* 22,569 39,779 36,297 43,007 1,591,317 1,746,296 74,950 83,035 51,564 76,766
K 85,306 92,296 274,188 305,712 9,051,957 9,414,634 276,699 313,542 208,136 282,881
L ** 879 896 5,021 4,852 37,632 38,777 3,888 3,927 1,516 1,734
* Nominal wages are in current prices.** Number of persons employed in thousand.Source: National Accounts Statistics, UN, 2003 and 2005.
138 � PRAGUE ECONOMIC PAPERS, 2, 2006
the research period. In Table 1 there are the averages of the aggregates from natio-nal accounts data for each investigated period for Slovenia, the Czech Republic,Germany, Greece and Ireland for the periods 1997-1999 and 2000-2002. All aggre-gates are in fixed US dollar prices from 1995.
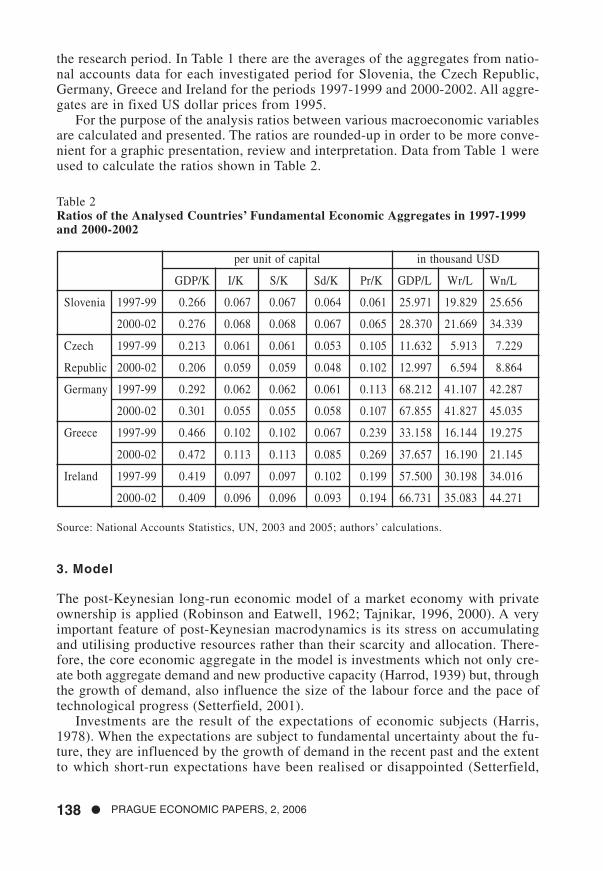
For the purpose of the analysis ratios between various macroeconomic variablesare calculated and presented. The ratios are rounded-up in order to be more conve-nient for a graphic presentation, review and interpretation. Data from Table 1 wereused to calculate the ratios shown in Table 2.
Table 2Ratios of the Analysed Countries’ Fundamental Economic Aggregates in 1997-1999and 2000-2002
per unit of capital in thousand USD
GDP/K I/K S/K Sd/K Pr/K GDP/L Wr/L Wn/L
Slovenia 1997-99 0.266 0.067 0.067 0.064 0.061 25.971 19.829 25.656
2000-02 0.276 0.068 0.068 0.067 0.065 28.370 21.669 34.339
Czech 1997-99 0.213 0.061 0.061 0.053 0.105 11.632 5.913 7.229
Republic 2000-02 0.206 0.059 0.059 0.048 0.102 12.997 6.594 8.864
Germany 1997-99 0.292 0.062 0.062 0.061 0.113 68.212 41.107 42.287
2000-02 0.301 0.055 0.055 0.058 0.107 67.855 41.827 45.035
Greece 1997-99 0.466 0.102 0.102 0.067 0.239 33.158 16.144 19.275
2000-02 0.472 0.113 0.113 0.085 0.269 37.657 16.190 21.145
Ireland 1997-99 0.419 0.097 0.097 0.102 0.199 57.500 30.198 34.016
2000-02 0.409 0.096 0.096 0.093 0.194 66.731 35.083 44.271
Source: National Accounts Statistics, UN, 2003 and 2005; authors’ calculations.
3. Model
The post-Keynesian long-run economic model of a market economy with privateownership is applied (Robinson and Eatwell, 1962; Tajnikar, 1996, 2000). A veryimportant feature of post-Keynesian macrodynamics is its stress on accumulatingand utilising productive resources rather than their scarcity and allocation. There-fore, the core economic aggregate in the model is investments which not only cre-ate both aggregate demand and new productive capacity (Harrod, 1939) but, throughthe growth of demand, also influence the size of the labour force and the pace oftechnological progress (Setterfield, 2001).
Investments are the result of the expectations of economic subjects (Harris,1978). When the expectations are subject to fundamental uncertainty about the fu-ture, they are influenced by the growth of demand in the recent past and the extentto which short-run expectations have been realised or disappointed (Setterfield,
PRAGUE ECONOMIC PAPERS, 2, 2006 � 139
1999). On the one hand, investments determine the necessary savings that are for-med from incomes according to the propensities to save of different groups of eco-nomic subjects. By definition, in every economy investments must equal savings.When the savings of domestic economic subjects are insufficient, a deficit in thecurrent account appears (Kalecki, 1954, p. 49). With domestic economic subjects’given propensity to save, investments determine both the domestic income and cur-rent account balance. A negative current account is therefore a consequence of aninsufficient propensity to save, considering the given income distribution amongeconomic subjects. According to the Pasinetti paradox, savings from profits are cru-cial for the value of domestic aggregate savings (Pasinetti, 1962, 1974). We thushave a relationship between accumulation and profits, where the causation runs fromthe latter to the former (Arestis, 1992, p. 212). If profits are expressed per unit ofcapital, we talk about the profit rate. The profit rate divides gross domestic productinto profits and real wages. The latter are therefore a residual, after investmentsdetermine profits (Kalecki, 1954). The more efficient the economy, the higher realwages can be (per unit of labour) at a given profit rate.
Aggregate demand or, more concretely, discretionary expenditure in which in-vestment plays an important role, is the moving force of aggregate output growthand employment (Arestis, 1992). Investments relative to existing capital representthe investment rate and determine the growth of gross domestic product. With anunaltered technical structure, the investment rate through output growth also deter-mines the growth of employed labour.
Thus, with all other economic categories remaining unchanged the investmentrate reflects the aggregate demand for labour. Together with the supply of labour,demand for labour in the labour market determines nominal wages. Although no-minal and real wages are influenced by the investment rate, there is no reason forboth wage categories (real and nominal) to be the same as they are also influencedby other factors. The discrepancy between – according to the investment rate – fe-asible real wages and nominal wages is suppressed by prices, which complete twocircles of the economic influence of the investment rate. Money prices are therefo-re the result of a complex power struggle – between both capital and labour, andamong capitalists (Wray, 2001).
3.1. Graphical Presentation of the Model
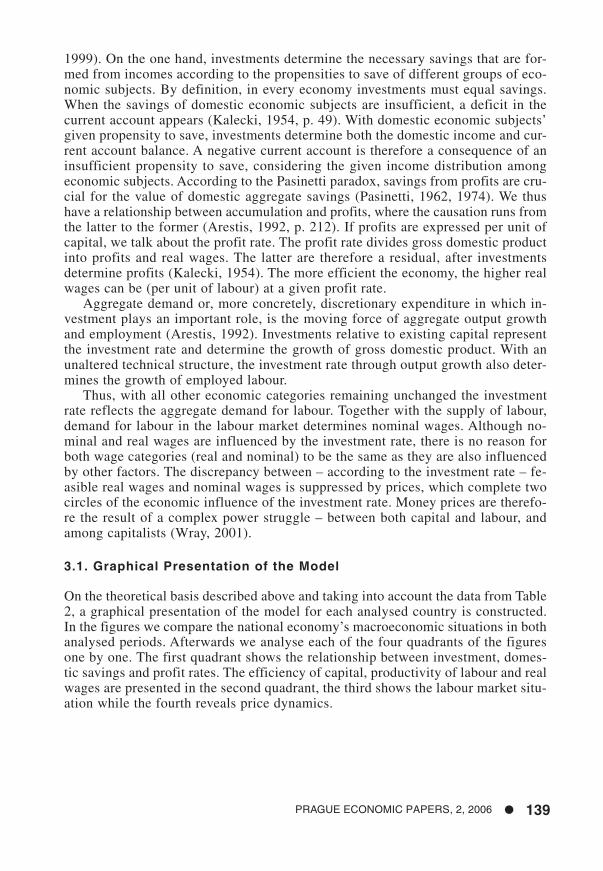
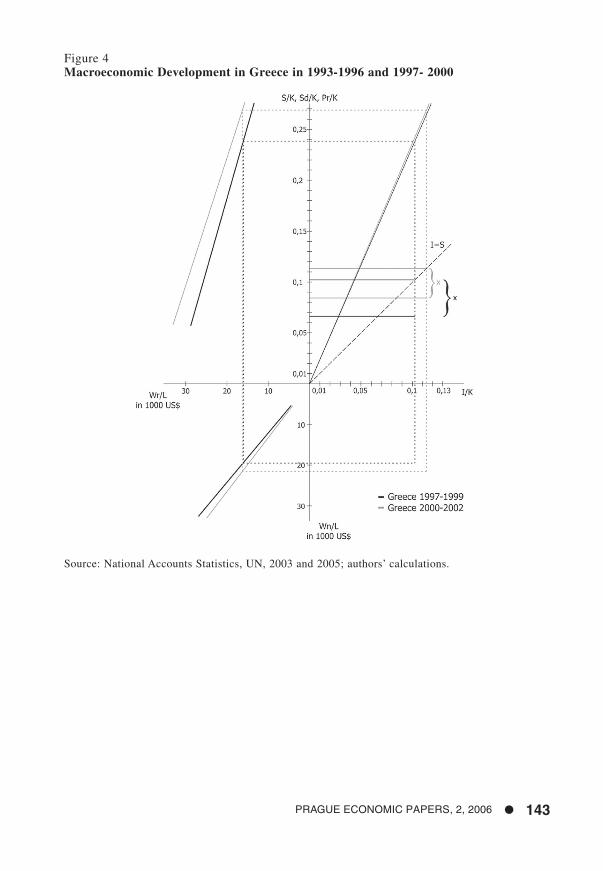
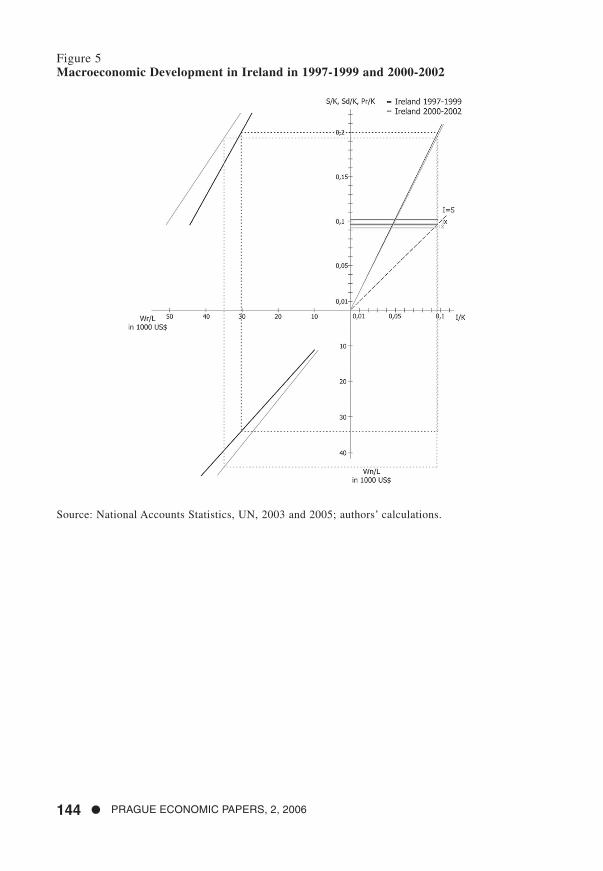
On the theoretical basis described above and taking into account the data from Table2, a graphical presentation of the model for each analysed country is constructed.In the figures we compare the national economy’s macroeconomic situations in bothanalysed periods. Afterwards we analyse each of the four quadrants of the figuresone by one. The first quadrant shows the relationship between investment, domes-tic savings and profit rates. The efficiency of capital, productivity of labour and realwages are presented in the second quadrant, the third shows the labour market situ-ation while the fourth reveals price dynamics.
140 � PRAGUE ECONOMIC PAPERS, 2, 2006
Figure 1Macroeconomic Development in Slovenia in 1997-1999 and 2000-2002
Source: National Accounts Statistics, UN, 2003 and 2005; authors’ calculations.
PRAGUE ECONOMIC PAPERS, 2, 2006 � 141
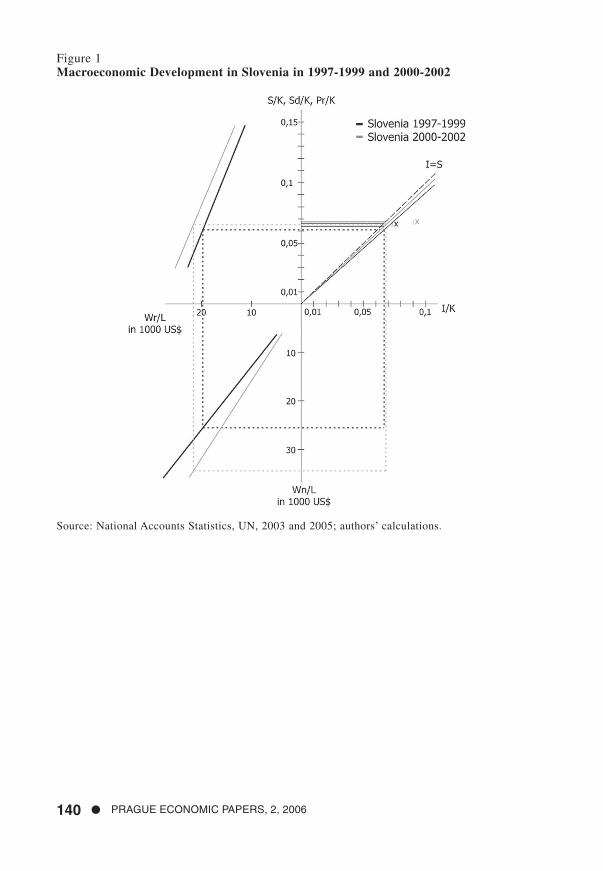
Figure 2Macroeconomic Development in Czech Republic in 1997-1999 and 2000-2002
Source: National Accounts Statistics, UN, 2003 and 2005; authors’ calculations.
Czech Rep. 1997-1999Czech Rep. 2000-2002
142 � PRAGUE ECONOMIC PAPERS, 2, 2006
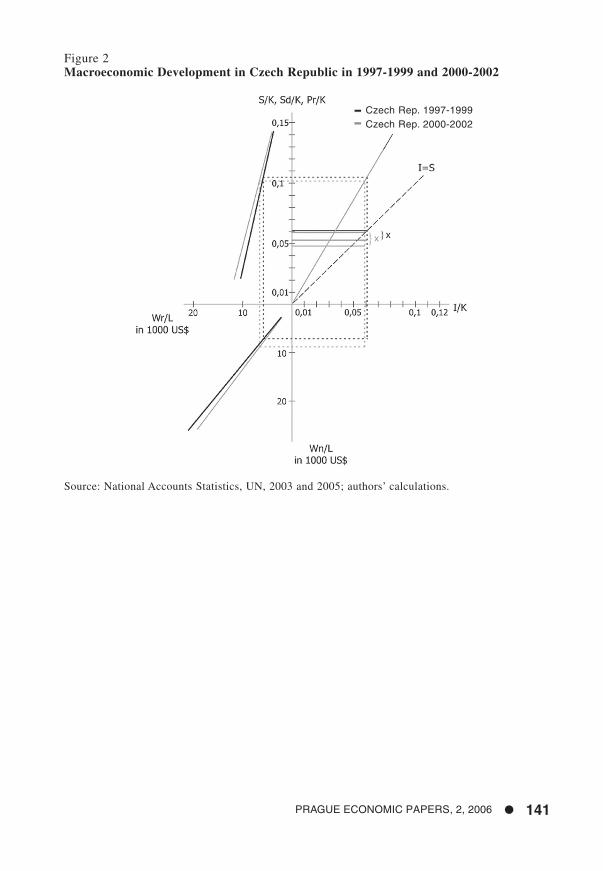
Figure 3Macroeconomic Development in Germany in 1997-1999 and 2000-2002
Source: National Accounts Statistics, UN, 2003 and 2005; authors’ calculations.
PRAGUE ECONOMIC PAPERS, 2, 2006 � 143
Figure 4Macroeconomic Development in Greece in 1993-1996 and 1997- 2000
Source: National Accounts Statistics, UN, 2003 and 2005; authors’ calculations.
144 � PRAGUE ECONOMIC PAPERS, 2, 2006
Figure 5Macroeconomic Development in Ireland in 1997-1999 and 2000-2002
Source: National Accounts Statistics, UN, 2003 and 2005; authors’ calculations.
PRAGUE ECONOMIC PAPERS, 2, 2006 � 145
3.2. Investments, Savings and Profits
We can observe the investments, savings and growth of each analysed country inthe first quadrant of Figures 1-5. Since investments allow production capacities togrow, the level of investment in a national economy is a very important issue. Em-pirical analyses show (e.g. Hussein, Thirlwall, 2000) that a large proportion ofgrowth is explained by the rate of investing. On the other hand, the profit rate andprofit share significantly explain investment spending and growth of the capitalstock (Glyn, 1997, Seguino 1999-2000).
When investments are the outcome of economic expectations, investment pessi-mism can be seen in countries with low investment rates. According to an empiri-cal study for Slovenia (Tajnikar, Ogrin, 2001), the large share of this pessimism islinked to the acceleration principle. A fall in gross domestic product growth affectsinvestment activity. However, it can be empirically established that investment de-cisions in Slovenia are influenced by profit expectations. Unfortunately, the unde-fined and unsuitable ownership structure in Slovenia is only able to lead to weakprofit motives. In these circumstances, economic subjects only invest when demand(short-term factor) leads to full capacity utilisation (Tajnikar, Ogrin, 2001).
From the ratios and figures presented above, we can in investment-rate termsrank countries from that with the highest investment rate (I/K) to that with the lowestin the 1997-1999 period in the following order: Greece, Ireland, Slovenia, Germa-ny and the Czech Republic. In the second investigated period of 2000-2002 it wasrevealed a similar situation, with Germany and the Czech Republic swapping theirplaces in the ranking. The investment rate was very similar and relatively low in theCzech Republic, Germany and Slovenia. Greece had the highest investment rate inboth periods, closely followed by Ireland. Germany experienced a relatively highdecrease in the investment rate between the two investigated periods, while in othercountries there were no substantial changes in the height of the investment rate.Nevertheless, we have to acknowledge, that when ranking the countries accordingto their investment rates, a low investment rate measured by the ratio I/K in a parti-cular country, does not necessarily mean that investment expenditures are low. Whena national economy holds a large amount of capital and invests substantially, theinvestment rate might still be relatively low. On the other hand, a national economywith a low capital level could have a high investment rate even when investing mo-derately.
By definition, investment equals saving in every economy. With the exceptionof Ireland in the 1997-1999 period and Germany in the 2000-2000 period, in all ofthe analysed countries domestic savings (Sd) were insufficient to cover investments(I) and a negative current account (X) appeared as a result. In Ireland the positivecurrent account balance in the first period turned into negative in the second perioddue to smaller propensity to save from domestic income and thus decrease in do-mestic savings at almost unaltered investment rate. In Germany, where the propen-sity to save from domestic income even lessened between the analysed periods, thepositive current account is mainly the consequence of more modest investment ac-tivity, reflecting in smaller investment rate.
At a given investment rate the current account deficit is lower when the propen-sity to save is higher. Of all analysed countries the propensity to save was highest
146 � PRAGUE ECONOMIC PAPERS, 2, 2006
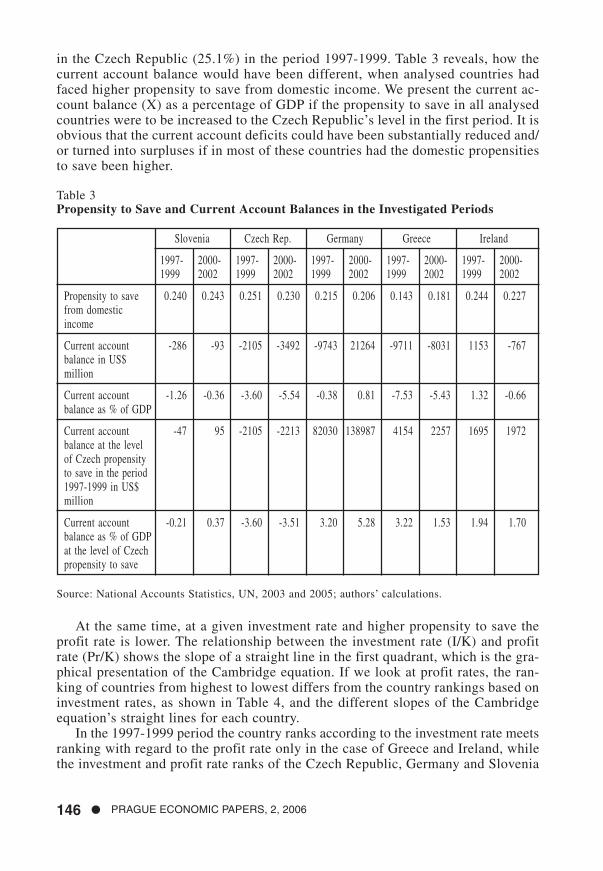
in the Czech Republic (25.1%) in the period 1997-1999. Table 3 reveals, how thecurrent account balance would have been different, when analysed countries hadfaced higher propensity to save from domestic income. We present the current ac-count balance (X) as a percentage of GDP if the propensity to save in all analysedcountries were to be increased to the Czech Republic’s level in the first period. It isobvious that the current account deficits could have been substantially reduced and/or turned into surpluses if in most of these countries had the domestic propensitiesto save been higher.
Table 3Propensity to Save and Current Account Balances in the Investigated Periods
Slovenia Czech Rep. Germany Greece Ireland
1997- 2000- 1997- 2000- 1997- 2000- 1997- 2000- 1997- 2000-1999 2002 1999 2002 1999 2002 1999 2002 1999 2002
Propensity to save 0.240 0.243 0.251 0.230 0.215 0.206 0.143 0.181 0.244 0.227from domesticincome
Current account -286 -93 -2105 -3492 -9743 21264 -9711 -8031 1153 -767balance in US$million
Current account -1.26 -0.36 -3.60 -5.54 -0.38 0.81 -7.53 -5.43 1.32 -0.66balance as % of GDP
Current account -47 95 -2105 -2213 82030 138987 4154 2257 1695 1972balance at the levelof Czech propensityto save in the period1997-1999 in US$million
Current account -0.21 0.37 -3.60 -3.51 3.20 5.28 3.22 1.53 1.94 1.70balance as % of GDPat the level of Czechpropensity to save
Source: National Accounts Statistics, UN, 2003 and 2005; authors’ calculations.
At the same time, at a given investment rate and higher propensity to save theprofit rate is lower. The relationship between the investment rate (I/K) and profitrate (Pr/K) shows the slope of a straight line in the first quadrant, which is the gra-phical presentation of the Cambridge equation. If we look at profit rates, the ran-king of countries from highest to lowest differs from the country rankings based oninvestment rates, as shown in Table 4, and the different slopes of the Cambridgeequation’s straight lines for each country.
In the 1997-1999 period the country ranks according to the investment rate meetsranking with regard to the profit rate only in the case of Greece and Ireland, whilethe investment and profit rate ranks of the Czech Republic, Germany and Slovenia
PRAGUE ECONOMIC PAPERS, 2, 2006 � 147
do not correspond. Relative high propensity to save from domestic income and adeficit in current account allowed Slovenia to finance a higher investment rate at alower profit rate than Germany and the Czech Republic. Greece was evidently ableto finance its high investment rate through and high profit rate a high current ac-count deficit. The Irish investment could have been higher at a given propensity tosave and at a given profit rate when the deficit in the current account occurred.
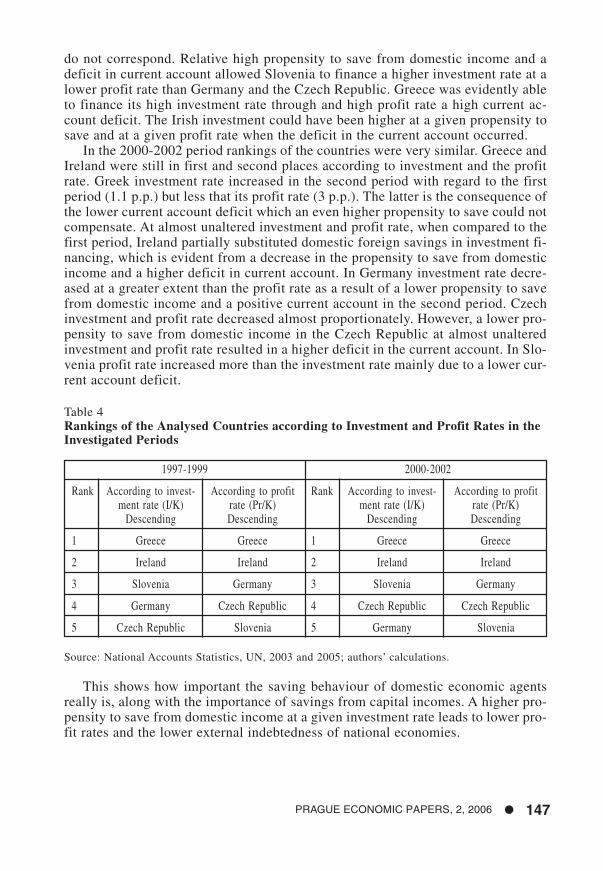
In the 2000-2002 period rankings of the countries were very similar. Greece andIreland were still in first and second places according to investment and the profitrate. Greek investment rate increased in the second period with regard to the firstperiod (1.1 p.p.) but less that its profit rate (3 p.p.). The latter is the consequence ofthe lower current account deficit which an even higher propensity to save could notcompensate. At almost unaltered investment and profit rate, when compared to thefirst period, Ireland partially substituted domestic foreign savings in investment fi-nancing, which is evident from a decrease in the propensity to save from domesticincome and a higher deficit in current account. In Germany investment rate decre-ased at a greater extent than the profit rate as a result of a lower propensity to savefrom domestic income and a positive current account in the second period. Czechinvestment and profit rate decreased almost proportionately. However, a lower pro-pensity to save from domestic income in the Czech Republic at almost unalteredinvestment and profit rate resulted in a higher deficit in the current account. In Slo-venia profit rate increased more than the investment rate mainly due to a lower cur-rent account deficit.
This shows how important the saving behaviour of domestic economic agentsreally is, along with the importance of savings from capital incomes. A higher pro-pensity to save from domestic income at a given investment rate leads to lower pro-fit rates and the lower external indebtedness of national economies.
Table 4Rankings of the Analysed Countries according to Investment and Profit Rates in theInvestigated Periods
1997-1999 2000-2002
Rank According to invest- According to profit Rank According to invest- According to profitment rate (I/K) rate (Pr/K) ment rate (I/K) rate (Pr/K)
Descending Descending Descending Descending
1 Greece Greece 1 Greece Greece
2 Ireland Ireland 2 Ireland Ireland
3 Slovenia Germany 3 Slovenia Germany
4 Germany Czech Republic 4 Czech Republic Czech Republic
5 Czech Republic Slovenia 5 Germany Slovenia
Source: National Accounts Statistics, UN, 2003 and 2005; authors’ calculations.
148 � PRAGUE ECONOMIC PAPERS, 2, 2006
3.3. Efficiency and Real Households and State Incomes
The second quadrant of the figures shows changes in economic efficiency and chan-ges in the real incomes of households and the state. The straight line Wr-Pr revealsthe economy’s efficiency. We can observe the economic efficiency of the analysedcountries in both absolute terms and from the relative factor efficiency aspect.
The straight lines Wr-Pr in the second quadrant of the figures reveal the levelsof real incomes of households and the state per employee that can be earned at agiven profit rate. The greater the absolute efficiency of the economy, the higher realwages can be at a given profit rate. Economic efficiency depends on both the utili-sation of capital and labour. The economy is more efficient the more the straight lineWr-Pr is on the left side of the second quadrant of the figure.
We can see that the efficiency lines of Germany and Ireland are most distant fromthe origin in the 1993-1996 period as well as in 1997-2000, which shows the highesteconomic efficiency of these two countries at that time. Greece followed closelybehind. Closest to the origin lies the straight line Wr-Pr of the Czech Republic.Efficiency in Slovenia is higher than in the Czech Republic, although it still lagsfar behind compared to the most efficient countries Germany and Ireland. In thesecond period the situation remained almost the same. However, we also have toconsider relative factor efficiency before any conclusions.
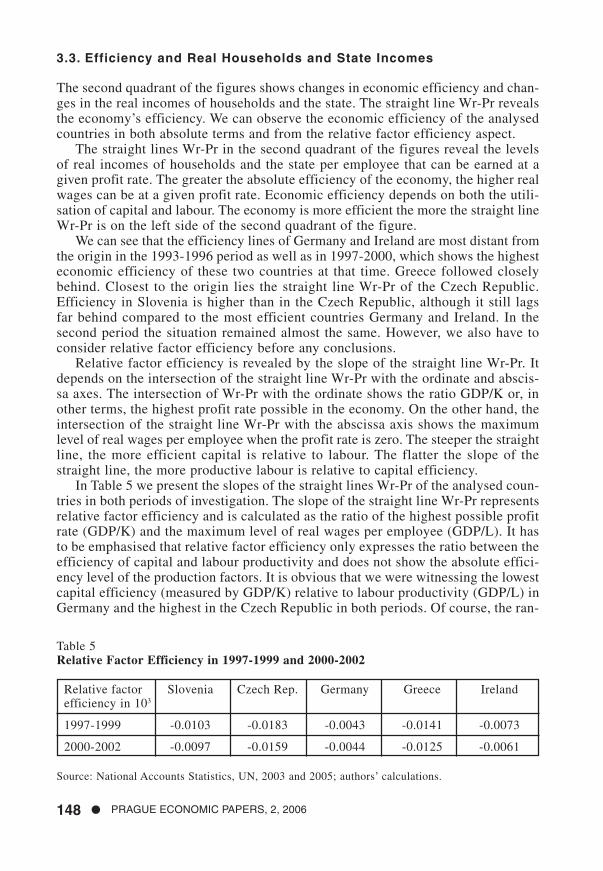
Relative factor efficiency is revealed by the slope of the straight line Wr-Pr. Itdepends on the intersection of the straight line Wr-Pr with the ordinate and abscis-sa axes. The intersection of Wr-Pr with the ordinate shows the ratio GDP/K or, inother terms, the highest profit rate possible in the economy. On the other hand, theintersection of the straight line Wr-Pr with the abscissa axis shows the maximumlevel of real wages per employee when the profit rate is zero. The steeper the straightline, the more efficient capital is relative to labour. The flatter the slope of thestraight line, the more productive labour is relative to capital efficiency.
In Table 5 we present the slopes of the straight lines Wr-Pr of the analysed coun-tries in both periods of investigation. The slope of the straight line Wr-Pr representsrelative factor efficiency and is calculated as the ratio of the highest possible profitrate (GDP/K) and the maximum level of real wages per employee (GDP/L). It hasto be emphasised that relative factor efficiency only expresses the ratio between theefficiency of capital and labour productivity and does not show the absolute effici-ency level of the production factors. It is obvious that we were witnessing the lowestcapital efficiency (measured by GDP/K) relative to labour productivity (GDP/L) inGermany and the highest in the Czech Republic in both periods. Of course, the ran-
Table 5Relative Factor Efficiency in 1997-1999 and 2000-2002
Relative factor Slovenia Czech Rep. Germany Greece Irelandefficiency in 103
1997-1999 -0.0103 -0.0183 -0.0043 -0.0141 -0.0073
2000-2002 -0.0097 -0.0159 -0.0044 -0.0125 -0.0061
Source: National Accounts Statistics, UN, 2003 and 2005; authors’ calculations.
PRAGUE ECONOMIC PAPERS, 2, 2006 � 149
king of the countries would be the opposite if we measured labour productivity re-lative to capital efficiency.
When observed alone (Table 2), the labour productivity (GDP/L) was the highestin Germany, followed by Ireland and Greece, while the lowest level was found inthe Czech Republic during 1997-2002. All of the analysed countries experienced thegrowth of labour productivity during the two analysed periods. The ratio betweenthe lowest labour productivity (the Czech Republic) among the analysed countriesand the highest (Germany) is 1 : 5.9 in the first and 1 : 5.2 in the second period.This ratio reflects the huge gap in labour productivity in the analysed countries.However, over time the differences in labour productivity are slowly becoming smal-ler. According to Table 2, there are also quite large differences in capital efficiency(GDP/K) among the analysed countries. However, they are much smaller than thosein labour productivity. The ratio between the lowest capital efficiency among theanalysed countries (the Czech Republic) and the highest (Greece) is approximately1 : 2.2 in the period 1997-1999 and 1 : 2.3 in the period 2000-2002. We can see thatthe trend of the differences in the capital efficiency is quite the opposite to the trendof the labour productivity. The increase in the gap in the capital efficiency shouldbe of great concern.
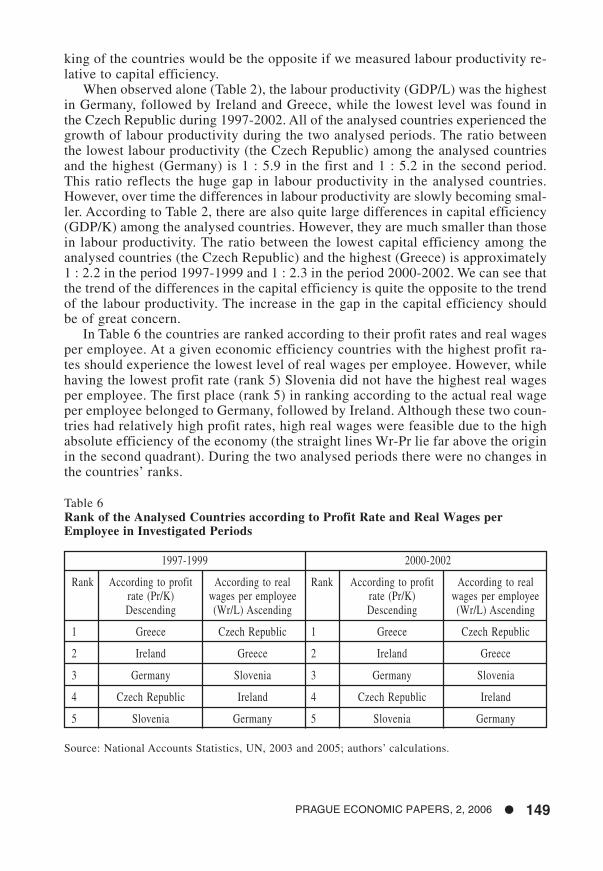
In Table 6 the countries are ranked according to their profit rates and real wagesper employee. At a given economic efficiency countries with the highest profit ra-tes should experience the lowest level of real wages per employee. However, whilehaving the lowest profit rate (rank 5) Slovenia did not have the highest real wagesper employee. The first place (rank 5) in ranking according to the actual real wageper employee belonged to Germany, followed by Ireland. Although these two coun-tries had relatively high profit rates, high real wages were feasible due to the highabsolute efficiency of the economy (the straight lines Wr-Pr lie far above the originin the second quadrant). During the two analysed periods there were no changes inthe countries’ ranks.
Table 6Rank of the Analysed Countries according to Profit Rate and Real Wages perEmployee in Investigated Periods
1997-1999 2000-2002
Rank According to profit According to real Rank According to profit According to realrate (Pr/K) wages per employee rate (Pr/K) wages per employeeDescending (Wr/L) Ascending Descending (Wr/L) Ascending
1 Greece Czech Republic 1 Greece Czech Republic
2 Ireland Greece 2 Ireland Greece
3 Germany Slovenia 3 Germany Slovenia
4 Czech Republic Ireland 4 Czech Republic Ireland
5 Slovenia Germany 5 Slovenia Germany
Source: National Accounts Statistics, UN, 2003 and 2005; authors’ calculations.
150 � PRAGUE ECONOMIC PAPERS, 2, 2006
It is quite obvious from Table 6 that higher profit rates do not always result inlower real wages per employee due to large differences in the absolute efficiencyof the analysed countries. If all of the countries had the efficiency straight line ofGermany then the real wages of their workers could be much higher at their givenprofit rates. This shows the importance of the position and slope of the straight lineWr-Pr. In other words, the absolute efficiency of an economy and the relative effi-ciency of factors of production are crucial from the factor income level viewpoint.
3.4. Labour Market, Employment and Money Wages
The investment rate influences the growth of production capacities. When the rela-tionship between capital and labour is unaltered, investments must lead to the gre-ater employment of labour. Therefore, a higher investment rate should also increa-se the rate of employment. In other words, there is a positive relationship betweenemployment and autonomous expenditures, especially investment (Atesoglu, 2000).Higher employment leads to greater labour demand. With a given level of laboursupply, this should affect the nominal price of labour.
We can observe the demand for labour (investment rate) and nominal wages inthe fourth quadrant of the figures. As there were no substantial changes in the ran-kings of the analysed countries according to investment rates and nominal wageslevels during the periods, we can draw similar conclusions for the whole period1997-2002. It is obvious that in a cross-country comparison we cannot find the the-oretical linkage of a higher investment rate leading to higher nominal wages peremployee. Greece with the highest investment rate had one of the lowest nominalwages per employee among the analysed countries. On the other hand in Germany,where the investment rate is one of the lowest, the nominal wages per worker arethe highest. The theoretical foundation that a higher investment rate leads to largerdemand for labour and therefore to higher nominal wages per employee does nothold in the cross-country analysis. Only when the price levels were equal amongthe analysed countries a higher investment rate would lead to higher nominal wages.When the price levels are not the same across countries, price level growth is notonly the consequence of the real-to-nominal wage relationship.
When we observe each of the analysed countries separately we can find the the-oretical relationship of a higher investment rate leading to higher nominal wagesonly in Slovenia and Greece. But even for the Slovenian labour market in the se-cond half of the 1990s the research shows (Tajnikar, 2000) that the excess supplyof labour was not large enough to put a cap on nominal wage growth. This pointsout the inability of the labour market to function properly and that nominal wageswere often defined regardless of labour market circumstances. This was clearly thecase of Slovenia during the period of investigation, when the problem remained ofincomes that were not determined in the market (e.g. the state administration’semployees, pensioners, and public service employees). Wages in the business sec-tor were in the investigated period still too closely tied to the incomes of firms byvirtue of the high share of internal ownership seen in the business sector. The la-bour market was evidently highly imperfect as it required a high level of unemploy-ment to stabilise nominal wages in the economy. A more detailed analysis for other
PRAGUE ECONOMIC PAPERS, 2, 2006 � 151
analysed countries might show similar or other reasons for the absence of the theo-retical relations of the observed variables in practice.
3.5. Prices
In the third quadrant of the model the slope of the straight line represents prices or,more precisely, the GDP deflator. The steeper the straight line, the higher is the le-vel of prices in the economy. The difference in dynamics – according to the invest-ment rate – of feasible real wages and nominal wages is suppressed by prices. Inthis way, the two-way influence of the investment rate is completed by prices. Witheverything else being given, higher investments lead to higher price level growth(McClain, Nichols, 1993-94). Empirical investigations (Atesoglu, 2000, 1997) alsosupport the positive (one-to-one) cointegration between inflation and the rate ofgrowth in unit labour costs with the cointegration coefficient of the wage cost-mar-kup equation close to one. These results demonstrate the reliability of the wage-costmarkup model of inflation.
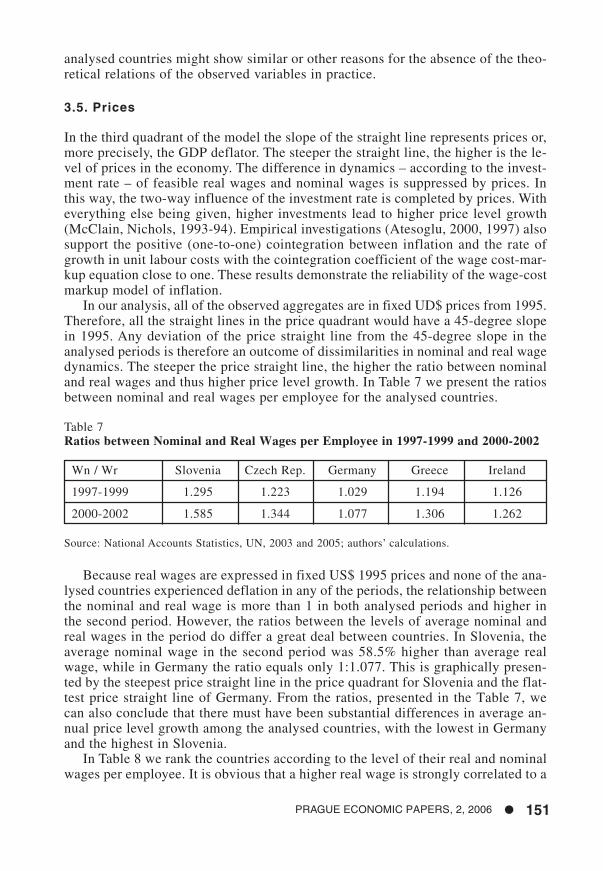
In our analysis, all of the observed aggregates are in fixed UD$ prices from 1995.Therefore, all the straight lines in the price quadrant would have a 45-degree slopein 1995. Any deviation of the price straight line from the 45-degree slope in theanalysed periods is therefore an outcome of dissimilarities in nominal and real wagedynamics. The steeper the price straight line, the higher the ratio between nominaland real wages and thus higher price level growth. In Table 7 we present the ratiosbetween nominal and real wages per employee for the analysed countries.
Table 7Ratios between Nominal and Real Wages per Employee in 1997-1999 and 2000-2002
Wn / Wr Slovenia Czech Rep. Germany Greece Ireland
1997-1999 1.295 1.223 1.029 1.194 1.126
2000-2002 1.585 1.344 1.077 1.306 1.262
Source: National Accounts Statistics, UN, 2003 and 2005; authors’ calculations.
Because real wages are expressed in fixed US$ 1995 prices and none of the ana-lysed countries experienced deflation in any of the periods, the relationship betweenthe nominal and real wage is more than 1 in both analysed periods and higher inthe second period. However, the ratios between the levels of average nominal andreal wages in the period do differ a great deal between countries. In Slovenia, theaverage nominal wage in the second period was 58.5% higher than average realwage, while in Germany the ratio equals only 1:1.077. This is graphically presen-ted by the steepest price straight line in the price quadrant for Slovenia and the flat-test price straight line of Germany. From the ratios, presented in the Table 7, wecan also conclude that there must have been substantial differences in average an-nual price level growth among the analysed countries, with the lowest in Germanyand the highest in Slovenia.
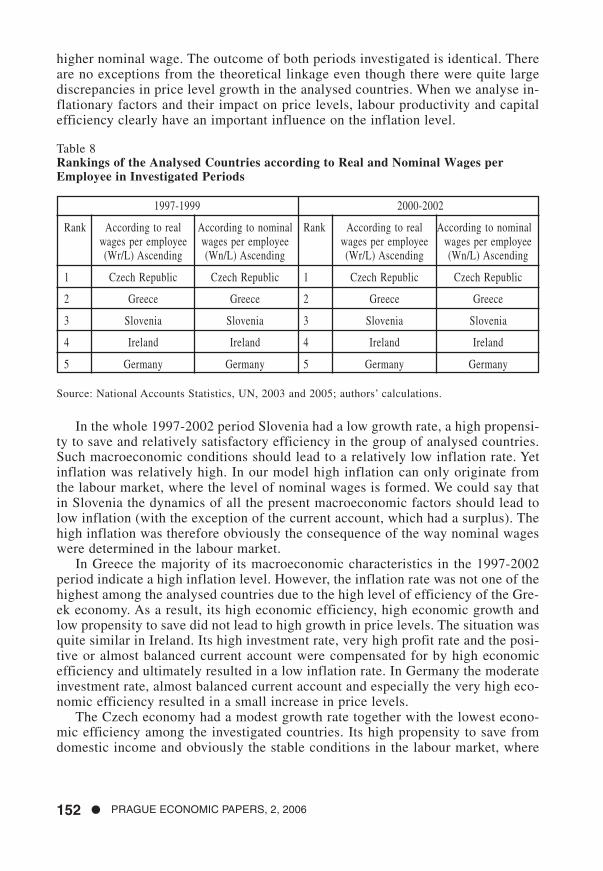
In Table 8 we rank the countries according to the level of their real and nominalwages per employee. It is obvious that a higher real wage is strongly correlated to a
152 � PRAGUE ECONOMIC PAPERS, 2, 2006
higher nominal wage. The outcome of both periods investigated is identical. Thereare no exceptions from the theoretical linkage even though there were quite largediscrepancies in price level growth in the analysed countries. When we analyse in-flationary factors and their impact on price levels, labour productivity and capitalefficiency clearly have an important influence on the inflation level.
In the whole 1997-2002 period Slovenia had a low growth rate, a high propensi-ty to save and relatively satisfactory efficiency in the group of analysed countries.Such macroeconomic conditions should lead to a relatively low inflation rate. Yetinflation was relatively high. In our model high inflation can only originate fromthe labour market, where the level of nominal wages is formed. We could say thatin Slovenia the dynamics of all the present macroeconomic factors should lead tolow inflation (with the exception of the current account, which had a surplus). Thehigh inflation was therefore obviously the consequence of the way nominal wageswere determined in the labour market.
In Greece the majority of its macroeconomic characteristics in the 1997-2002period indicate a high inflation level. However, the inflation rate was not one of thehighest among the analysed countries due to the high level of efficiency of the Gre-ek economy. As a result, its high economic efficiency, high economic growth andlow propensity to save did not lead to high growth in price levels. The situation wasquite similar in Ireland. Its high investment rate, very high profit rate and the posi-tive or almost balanced current account were compensated for by high economicefficiency and ultimately resulted in a low inflation rate. In Germany the moderateinvestment rate, almost balanced current account and especially the very high eco-nomic efficiency resulted in a small increase in price levels.
The Czech economy had a modest growth rate together with the lowest econo-mic efficiency among the investigated countries. Its high propensity to save fromdomestic income and obviously the stable conditions in the labour market, where
Table 8Rankings of the Analysed Countries according to Real and Nominal Wages perEmployee in Investigated Periods
1997-1999 2000-2002
Rank According to real According to nominal Rank According to real According to nominalwages per employee wages per employee wages per employee wages per employee(Wr/L) Ascending (Wn/L) Ascending (Wr/L) Ascending (Wn/L) Ascending
1 Czech Republic Czech Republic 1 Czech Republic Czech Republic
2 Greece Greece 2 Greece Greece
3 Slovenia Slovenia 3 Slovenia Slovenia
4 Ireland Ireland 4 Ireland Ireland
5 Germany Germany 5 Germany Germany
Source: National Accounts Statistics, UN, 2003 and 2005; authors’ calculations.
PRAGUE ECONOMIC PAPERS, 2, 2006 � 153
nominal wages are determined, prevented the price level to increase even faster inthe 1997-2002 period.
4. Sources of Differences between Slovenia and Other Countries andRecommendations for Economic Policy
Macroeconomic efficiency and stability are usually measured by employment, pri-ce-level stability and real income growth. Our model does not allow us to addressemployment issues but it does enable us to investigate economic efficiency, thecurrent account balance, levels of real and nominal wages and price stability innational economies.
From the figures, as interpreted above, it is evident that there are several impor-tant differences in the macroeconomic situations of the countries analysed. If wetake Slovenia as a reference country, the Czech Republic and Germany have lowerand Ireland and Greece have higher investment rates in both analysed periods. Sin-ce investments increase production capacities, low investment rates could providea warning sign of investment pessimism and a potential recession. Improving theinvestment expectations and raising the investment level are therefore areas onwhich economic policy should focus with its investment policy.
With the exception of the Czech Republic and Ireland in the first period, theanalysed countries have a lower propensity to save from domestic income than Slo-venia. In countries with the lowest propensity to save (Greece,) this leads to relati-vely high current account deficits. Current account deficits appear as a supplementto domestic savings for financing domestic investments. Although the Slovenianpropensity to save grew between the periods, the increase in domestic savings wasinsufficient to cover the increase in investments and the investment rate. As a re-sult, the current account was still in deficit in the second period, although the defi-cit decreased. A higher propensity to save from domestic savings could therefore atleast partly resolve negative current account issues. Foreign capital inflows are ano-ther important option because they do not add to the external indebtedness of acountry. At a given investment rate the profit rate can be lower and real wages thushigher, together with a lower current account deficit when the propensity to savefrom domestic incomes is higher. Evidently, the macroeconomic policy must focuson the propensity to make domestic savings. Boosting the propensity to save is theonly solution for stabilising foreign debt. At the same time, it is crucial for raisingthe real incomes of households and the state, and for price stability (e.g. Schmidt-Hebbel and Serven, 1999).
It is also very clear that there are no particular advantages of nominal wagegrowth. In the short run, some structural changes among different income classesare possible although they are limited in the long run. In the longer term, nominalwage growth only causes inflation. In the investigated period Slovenia experiencedthe highest increase in price levels. At the same time, Slovenia had a lower invest-ment rate that Greece and Ireland. The latter should be reflected in lower inflationas regard to Greece and Ireland through lower economic growth, via lower labourdemand and lower nominal wages. However, this was not the case of Slovenia wherethe excess labour supply could not stabilise the nominal wage growth. Incomespolicy has to be complemented with labour market policy in order to achieve grea-
154 � PRAGUE ECONOMIC PAPERS, 2, 2006
ter nominal wage stability and lower unemployment rates in countries like Slove-nia. This is especially important as studies (e.g. Atesoglu, 1996) indicate the signi-ficance of low inflation rates for maintaining high rates of economic growth.
Raising the efficiency of some of the analysed economies is also crucial for achi-eving higher real incomes and price stability. Although the comparison between thetwo periods shows that all countries experienced at least some improvements ineconomic efficiency (least of all in the Czech Republic), there are still vast discre-pancies among them. An increase in economic efficiency – graphically a shift of theWr-Pr efficiency line away from the origin – allows real incomes to grow and easespressure on price levels. In both of the analysed periods Germany and Ireland werethe countries with the highest economic efficiency. The structure of investments isof great importance for improving the efficiency of national economies. Economicpolicy should take measures to promote technical progress that boosts the effecti-veness of employing capital (Kitson and Michie, 2000). On the other hand, the intro-duction of economic measures to raise labour productivity is particularly urgent inthe Czech Republic.
Based on analysis presented above, we can therefore conclude that in more orless all of the analysed countries there should be a greater emphasis on tax policyto create incentives to invest and save, on incomes policy to control the dynamicsof the nominal wage-price relation to avoid cost inflation, as well as on investmentpolicy and technological policy as prerequisites for enhanced economic efficiency.
References
Arestis, P. The Post-Keynesian Approach to Economics. Aldershot: Edward Elgar, 1992.
Atesoglu, H.S. “A Demand-Oriented Explanation of Economic Growth in Germany.” Journal ofPost-Keynesian Economics, 1996, 19(1), pp. 101-111.
“A Post-Keynesian Explanation of United States Inflation.” Journal of Post Keynesi-an Economics, 1997, 19(4), pp. 639-649.
“Income, Employment, Inflation and Money in the United States.” Journal of PostKeynesian Economics, 2000, 22(4), pp. 639-646.
Carvalho, F.J. C. Mr Keynes and the Post Keynesians. Aldershot: Edward Elgar, 1992.
Garegnani, P. “Heterogeneous Capital, the Production Function and the Theory of Distribution.”Review of Economic Studies, 1970.
Harris, D. J. Capital Accumulation and Income Distribution. Palo Alto: Stanford University Press,1978.
Harrod, R.F. “An Essay in Dynamics Theory.” Economic Journal, 1939, 49, pp. 14-33.
Hussein, K. and Thirlwall, A.P. “The AK Model of “New” Growth Theory in the Harrod-DomarGrowth Equation: Investment and Growth Revisited.” Journal of Post Keynesian Economics,2000, 22 (3), pp. 427-436.
Kalecki, M. Theory of Economic Dynamics; An Essay on Cyclical and Long-Run Changes inCapitalist Economy. London: Unwin Brothers, 1954.
Kitson, M. and Michie, J. The Political Economy of Competitiveness. London and New York:Routledge, 2000.
McClain, K.T. and Nichols, L.M. “On the Relation between Investment and Inflation: SomeResults from Cointegration, Causation, and Sign Tests.” Journal of Post Keynesian Economics,1993-94 16(2), pp. 205-220.
PRAGUE ECONOMIC PAPERS, 2, 2006 � 155
Pasinetti, L. L. “Rate of Profit and Income Distribution in Relation to the Rate of EconomicGrowth.” Review of Economic Studies, 1962, pp. 267-279.
Growth and Income Distribution, Essays in Economic Theory. Cambridge: Cam-bridge University Press, 1974.
Robinson, J. Essays in the Theory of Economic Growth. New York: St Martin’s Press, 1962.
Robinson, J., Eatwell, J. An Introduction to Modern Economics. London: McGraw-Hill, 1973.
Schmidt-Hebbel, K., Serven, L. The Economics of Saving and Growth. Cambridge: CambridgeUniversity Press, 1999.
Seguino, S. “The Investment Function Revisited: Disciplining Capital in South Korea.” Journal ofPost-Keynesian Economics, 1999-2000, 22 (2), pp. 313-338.
Setterfield, M.A. “Expectations, Path Dependence and Effective Demand: A MacroeconomicModel Along Keynesian Lines.” Journal of Post-Keynesian Economics, 1999, 21(3), pp. 479-501.
“Macrodynamics.” in Holt, R. and Pressman, S. (eds.). A New Guide to Post-Keynesian Economics. London and New York: Routledge, 2001, pp. 92-101.
Statistical Office of the Republic of Slovenia. A New Millennium – New Phenomena: HaveStatisticians Been Able to Understand and Measure Them? Ljubljana: Statistical Office of theRepublic of Slovenia, 2001.
Statistical Office of the Republic of Slovenia. Rapid Reports, No. 308, National Accounts. Ljublja-na: Statistical Office of the Republic of Slovenia, 2003.
Statistical Office of the Republic of Slovenia. Rapid Reports, No. 262, National Accounts. Ljublja-na: Statistical Office of the Republic of Slovenia, 2005.
Tajnikar, M. and Ogrin, N. “Post-Keynesian Explanation of the Transitional Adaptation of theInvestment Function in Slovenia” in Fourth International Conference on ‘Enterprise in Transiti-on’ Proceedings. Split: Faculty of Economics Split, 2001.
Tajnikar M. “From a Labour-Managed Economy to a Market Economy: A Contribution to EconomicTransformation.” Atlantic Economic Journal, 2000, 28(1), pp. 93-103.
United Nations, Department of Economic and Social Affairs, Statistics Division. National AccountsStatistics: Main Aggregates and Detailed Tables, 2002-2003. New York: United Nations, 2005.
United Nations, Department of Economic and Social Affairs, Statistics Division. National AccountsStatistics: Main Aggregates and Detailed Tables, 2001. New York: United Nations, 2003.
Wray, L.R. “Money and Inflation.” in Holt, R. and Pressman, S. (eds.) A New Guide to Post-Keynesian Economics. London and New York: Routledge, 2001, pp. 79-91.


