Embed Size (px)
Citation preview
NationalAssessmentProgram –
ICT LiteracyYears 6 & 10
Report
2011

NATIONAL ASSESSMENT
PROGRAM
ICT LiteracyYears 6 and 10 Report 2011
ACER Staff
John Ainley from ACER was the project director of the project that resulted in this report. Chris Freeman was the project manager and Julian Fraillon was the assessment manager. This public report was written by John Ainley, Julian Fraillon, Eveline Gebhardt and Wolfram Schulz. The assessment development team was led by Julian Fraillon and Daniel Duckworth. The sampling and analysis team comprised Eveline Gebhardt, Wolfram Schulz and Martin Murphy. The information technology team from ACER comprised Daryl Nguyen, Jafaruddin Lie, Scott Haines and Phooi Lai. The information technology consultants from SoNET Systems were Mike Janic and Stephen Birchall. Chris Freeman, Kate O’Malley and Warren Herbs managed the survey operations.
© Australian Curriculum, Assessment and
Reporting Authority 2012
This work is copyright. You may download,
display, print and reproduce this material in
unaltered form only (retaining this notice)
for your personal, non-commercial use or
use within your organisation.
All other rights are reserved. Requests and
inquiries concerning reproduction and rights
should be addressed to:
ACARA Copyright Administration, ACARA
Level 10, 255 Pitt Street
Sydney, NSW 2000
Email: [email protected]
Contents
LIST OF TABLES i
LIST OF FIGURES iv
ACKNOWLEDGEMENTS v
FOREWORD vi
EXECUTIVE SUMMARY viii
1 INTRODUCTION 1ICT in the Educational Goals for Young Australians 1ICT in the National Assessment Program 2What is Assessed in ICT Literacy 3Stages in the 2011 National Assessment of ICT Literacy 4Structure of the Report 6
2 ASSESSING ICT LITERACY 7ICT Literacy Assessment Domain 7Assessment Instrument 13Delivery Methods 17Sample 18Administration 23Summary 24
3 A NATIONAL PROFILE OF ICT LITERACY 25Developing the ICT Literacy Scale 25Describing the NAP – ICT Literacy Scale 27The Proficient Standards 31Comparisons of Student Performance by Year Level 32Comparisons of 2011 Student Achievement with 2005 and 2008 33Illustrative Examples of Proficiency for the NAP – ICT Literacy Scale 36Summary 47
4 PATTERNS OF ICT LITERACY 49Performance in ICT Literacy between States and Territories 49Comparisons of Means and Distributions for Year 6 and 10 across Assessment Cycles and States and Territories 50Comparison of Year 10 Means and Distributions 52Percentages Attaining the Proficient Standards 53Percentages of Students in Proficiency Levels 55ICT Literacy by Student Background 59Summary 67
5 STUDENT USE OF ICT 69Background 69Experience of Using ICT 71Access to Computer Resources 72Frequency of Computer use 73Using Computer Applications 77Conclusion 86
6 STUDENT PERCEPTIONS OF ICT 89Student Interest in and Enjoyment of Using ICT 90Student ICT Self-efficacy 92Influences on ICT Literacy 95Conclusion 98
7 CONCLUSION 99ICT Literacy in 2011 100Changes over Six Years 100To What Extent are Digital Divides Evident 101Differences in ICT Literacy among Jurisdictions 102Computer Use at Home and at School 103Increased Computer Use 103Student Perceptions about Using ICT 103Summary 104
REFERENCES 105
i
List of Tables
Table ES.1 NAP – ICT Literacy Scale Proficiency Level Descriptors and Percentage Achievement by Year Level xiv
Table ES.2 Mean Scores on ICT Literacy in 2011 for Year 6 and Year 10 by Jurisdiction in 2011 xviii
Table ES.3 Percentages of Year 6 and Year 10 Students at or above the Proficient Standard on the ICT Literacy Scale by Jurisdiction in 2011 xviii
Table 2.1 Information and Communication Technology Literacy Progress Map 10
Table 2.2 Mapping of NAP – ICT Literacy Assessment Domain, Statements of Learning and ICT General Capability 12
Table 2.3 Assessment Modules and Large Tasks 14
Table 2.4 Numbers of Students and Schools in the Target and Achieved Samples 19
Table 2.5 National Percentage Distribution of Sample Characteristics (Weighted) 21
Table 3.1 Cut-points for Proficiency Levels 27
Table 3.2 NAP – ICT Literacy scale Proficiency Level descriptors and percentage distribution of students by Year Level 29
Table 3.3 ICT Literacy mean scale scores for Years 6 and 10 from 2005 to 2011 33
Table 3.4 Percentage distribution of Year 6 and Year 10 students across Proficiency Levels on the ICT Literacy scale from 2005 to 2011 34
Table 3.5 Percentages of Year 6 and Year 10 students attaining the Proficient Standard in ICT Literacy from 2005 to 2011 36
Table 3.6 Saving Electricity Student Assessment Module – Overview and Large Task 37
Table 3.7 Art Show Student Assessment Module – Overview and Large Task 38
Table 4.1 Year 6 and Year 10 means and mean differences with confidence intervals for ICT Literacy, nationally and by State and Territory, 2011 50
Table 4.2 Means and mean differences with confidence intervals in Year 6 for ICT Literacy, nationally and by State and Territory in 2011, 2008 and 2005 51
Table 4.3 Pairwise comparisons of Year 6 mean performance on the ICT Literacy scale between States and Territories, 2011 51
ii
Table 4.4 Means and Mean differences with confidence intervals in Year 10 for ICT Literacy, nationally and by State and Territory in 2011, 2008 and 2005 52
Table 4.5 Pairwise comparisons of Year 10 mean performance on the ICT Literacy scale between States and Territories in 2011 52
Table 4.6 Percentages of Year 6 Students attaining the proficient standard on the ICT Literacy scale, nationally and by State and Territory in 2011, 2008 and 2005 54
Table 4.7 Percentages of Year 10 students attaining the Proficient Standard on the ICT Literacy scale, nationally and by State and Territory in 2011, 2008 and 2005 54
Table 4.8 Percentage distribution of Year 6 students over Proficiency Levels by Jurisdiction 57
Table 4.9 Percentage distribution of Year 10 students over Proficiency Levels by Jurisdiction 58
Table 4.10 Mean performance of males and females in Year 6 and Year 10 on the ICT Literacy scale by State and Territory in 2011, and comparison of national means in 2011 with 2005 and 2008 59
Table 4.11 National percentages of males and females in Year 6 and Year 10 attaining the Proficient Standards on the ITC Literacy scale in 2011, 2008 and 2005 60
Table 4.12 Mean scores and percentages attaining the Proficient Standards for Indigenous and Non-Indigenous Year 6 and 10 students on the ICT Literacy scale in 2011 61
Table 4.13 Mean scores and percentages attaining the Proficient Standards for Year 6 and 10 students on the ICT Literacy scale by language spoken at home in 2011 62
Table 4.14 Mean scores and percentages attaining the Proficient Standards for Year 6 and 10 students on the ICT Literacy scale by country of birth in 2011 63
Table 4.15 Mean scores and percentages attaining the Proficient Standards of Year 6 and Year 10 Students in comparison with 2005 and 2008 by geographic location of school in 2011 64
Table 4.16 Mean scores and percentages for Year 6 and Year 10 Students attaining the Proficient Standards on the ICT Literacy scale by categories of parental occupation in 2011 65
Table 4.17 Mean scores and percentages for Year 6 and Year 10 students attaining the Proficient Standards on the ICT Literacy scale by categories of parental education in 2011 66
iii
Table 5.1 Distributions of students’ years of experience of using computers in 2011 shown as percentages for each category 71
Table 5.2 Percentages of students with more than five years experience of using computers in 2011, 2008 and 2005 71
Table 5.3 Percentages of students with more than five years experience of using computers by specified characteristics in 2011 72
Table 5.4 Distributions of availability of computers at home in 2011 72
Table 5.5 Percentages of students using different types of computer systems at home and school in 2011 73
Table 5.6 Percentage frequency of computer use at home and school for Year 6 and Year 10 students in 2011 74
Table 5.7 Percentage of Year 6 and Year 10 students using computers almost every day or more at home and at school by background in 2011 74
Table 5.8 Frequency percentages of use of computer-based study utilities in 2011 78
Table 5.9 Frequency percentages of use of computer-based entertainment applications in 2011 80
Table 5.10 Frequency percentages of use of computer-based communication purposes in 2011 82
Table 5.11 Frequency percentages of use of technological computer tasks in 2011 83
Table 5.12 Mean scores on indices of home use of types of computer applications for male and female students in Year 6 and Year 10 (2011) 84
Table 5.13 Mean scores on indices of school use of types of computer applications for male and female students in Year 6 and Year 10 (2011) 86
Table 6.1 Year 6 and Year 10 category percentages for Interest and Enjoyment in working with computers in 2011 90
Table 6.2 Year 6 and Year 10 scale score averages for Interest and Enjoyment in working with computers overall, and by sex in 2011 91
Table 6.3 Year 6 and Year 10 ICT Literacy by tertile groups of Interest and Enjoyment in working with computers 92
Table 6.4 Category percentages on questions about Confidence in Using ICT 93
Table 6.5 Year 6 and Year 10 scale score averages for ICT Self-Efficacy overall, and by sex 94
Table 6.6 Year 6 and Year 10 ICT Literacy by tertile groups of Confidence in Using ICT 94
Table 6.7 Path analysis of influences on ICT Literacy and ICT Self-Efficacy 97
iv
List of Figures
Figure ES1 Distribution of Students across Proficiency Levels by Year Level xvi
Figure ES 2 Distributions across Proficiency Levels for Year 6 and 10 Students from 2005 to 2011 xviii
Figure 3.1 Distributions of student ICT Literacy and task difficulties in 2011 26
Figure 3.2 Distribution of ICT Literacy across Proficiency Levels by Year level in 2011 32
Figure 3.3 Distributions across Proficiency Levels for Year 6 and 10 students from 2005 to 2011 35
Figure 3.4 Level 3 Example 1 41
Figure 3.5 Level 3 Example 2 41
Figure 3.6 Level 3 Example 3 42
Figure 3.7 Level 2 Example 1 43
Figure 3.8 Level 2 Example 2 43
Figure 3.9 Level 2 Example 3 44
Figure 3.10 Level 1 Example 1 45
Figure 3.11 Level 1 Example 2 46
Figure 3.12 Level 1 Example 3 47
Figure 4.1 Percentages of Year 6 students attaining the Year 6 Proficient Standard, nationally and by State and Territory in 2011, 2008 and 2005 54
Figure 4.2 Percentages of Year 10 students attaining the Year 10 Proficient Standard, nationally and by State and Territory in 2011, 2008 and 2005 55
Figure 5.1 Differences in home use of types of computer applications for male and female students in Year 6 and Year 10 (2011) 85
Figure 5.2 Differences in school use of types of computer applications for male and female students in Year 6 and Year 10 (2011) 86
Figure 6.1 Year 6 and Year 10 Interest and Enjoyment in working with computers by sex (2011) 91
Figure 6.2 Conceptual path model of influences on ICT Literacy 96
v
Acknowledgements
National Assessment Program – ICT Literacy Review Committee MembersListed below are the main review committee members for jurisdictions,
school sectors and specialist areas. Through their participation in the review
committee during the development and implementation of the project they
made a valuable contribution to its success.
ChairMichelle Robins
ACARA
State and Territory Representatives
New South Wales
Tanya Manix / Lyndall Foster /
Brian Elliott
Victoria
Paula Christophersen
Queensland
Trish McGregor
Western Australia
Deborah Bevan
South Australia
Kym Linke / Gawain Duncan
Tasmania
Larissa Brenner
ACT
Mark Huxley
Northern Territory
Andrew Street / Marcia Harvey
Australian Government RepresentativesSue Blackall / Robyn McMillan
Indigenous education specialistLana Micallef
Language background other than English specialistHanya Stefaniuk
Catholic school sector representativeLiam Garvey
Independent school sector representativeJan Clarke
Performance, Measurement and Reporting Taskforce memberSusan Dennett
Benchmarking and Educational Measurement UnitPeter Bruce
ACARAJennifer Lau / Bronwyn Davies
vi
Foreword
This report presents the findings from the National Assessment Program –
Information and Communications Technologies (ICT) Literacy conducted
under the auspices of the national council of education ministers, the
Ministerial Council for Education, Early Childhood Development and Youth
Affairs (MCEECDYA), now known as the Standing Council on School Education
and Early Childhood (SCCEEC) in 2011.
Under the National Assessment Program, national samples of Year 6 and Year 10
students were assessed to determine their levels of confidence, creativity and
skill development in the use of information and communication technologies.
This report compares the results of Australian school students by state and
territory and student sub-groups, and provides details of their achievement
against an ICT literacy scale. It also enables the most recent achievements of
students to be compared against those from the previous national assessments
of ICT literacy, conducted first in 2005 and again in 2008.
In addition, a survey of student access to and use of computers was conducted
alongside the ICT Literacy assessment. With assessment results showing that
computer use by students had increased considerably over the six years from
2005 to 2011, this survey provides interesting and useful insights into how young
people are using their access to new technologies, both in schools and at home.
The national sample assessments are a product of the collaboration and
dedication of senior educators across all States and Territories and all
sectors of Australian schooling. The Australian Curriculum, Assessment and
Reporting Authority (ACARA) acknowledges the work of the Information
vii
Communications Technologies Review Committee and the project staff at
the Australian Council for Educational Research (ACER) in the development,
trialling and implementation of this National Assessment Program. ACARA also
thanks the many principals, teacher and students at government, Catholic and
independent schools across Australia who took part in the trial assessment in
2010 and the main study in 2011.
A Technical Report will be made available to researchers, and a set of School
Release Materials for teachers to use within the classroom. I commend this
report to Members of Parliament, teachers, educators and the community, as it
provides valuable information on students’ abilities to access, synthesise and
present information as well as determining their understanding of the impact
of these information communication technologies on society.
Professor Barry McGaw AO
Chair
Australian Curriculum, Assessment and Reporting Authority
viii
Some terms used in this report
Term Definition Notes
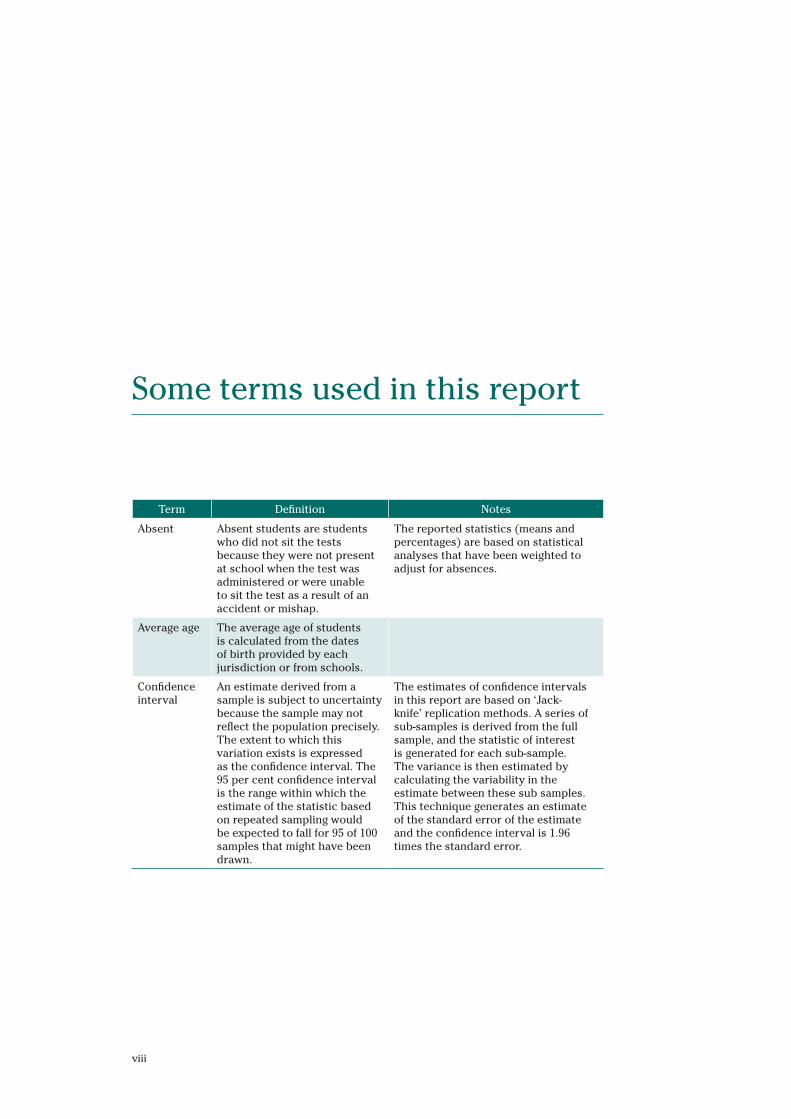
Absent Absent students are students who did not sit the tests because they were not present at school when the test was administered or were unable to sit the test as a result of an accident or mishap.
The reported statistics (means and percentages) are based on statistical analyses that have been weighted to adjust for absences.
Average age The average age of students is calculated from the dates of birth provided by each jurisdiction or from schools.
Confidence interval
An estimate derived from a sample is subject to uncertainty because the sample may not reflect the population precisely. The extent to which this variation exists is expressed as the confidence interval. The 95 per cent confidence interval is the range within which the estimate of the statistic based on repeated sampling would be expected to fall for 95 of 100 samples that might have been drawn.
The estimates of confidence intervals in this report are based on ‘Jack-knife’ replication methods. A series of sub-samples is derived from the full sample, and the statistic of interest is generated for each sub-sample. The variance is then estimated by calculating the variability in the estimate between these sub samples. This technique generates an estimate of the standard error of the estimate and the confidence interval is 1.96 times the standard error.
ix
Term Definition Notes
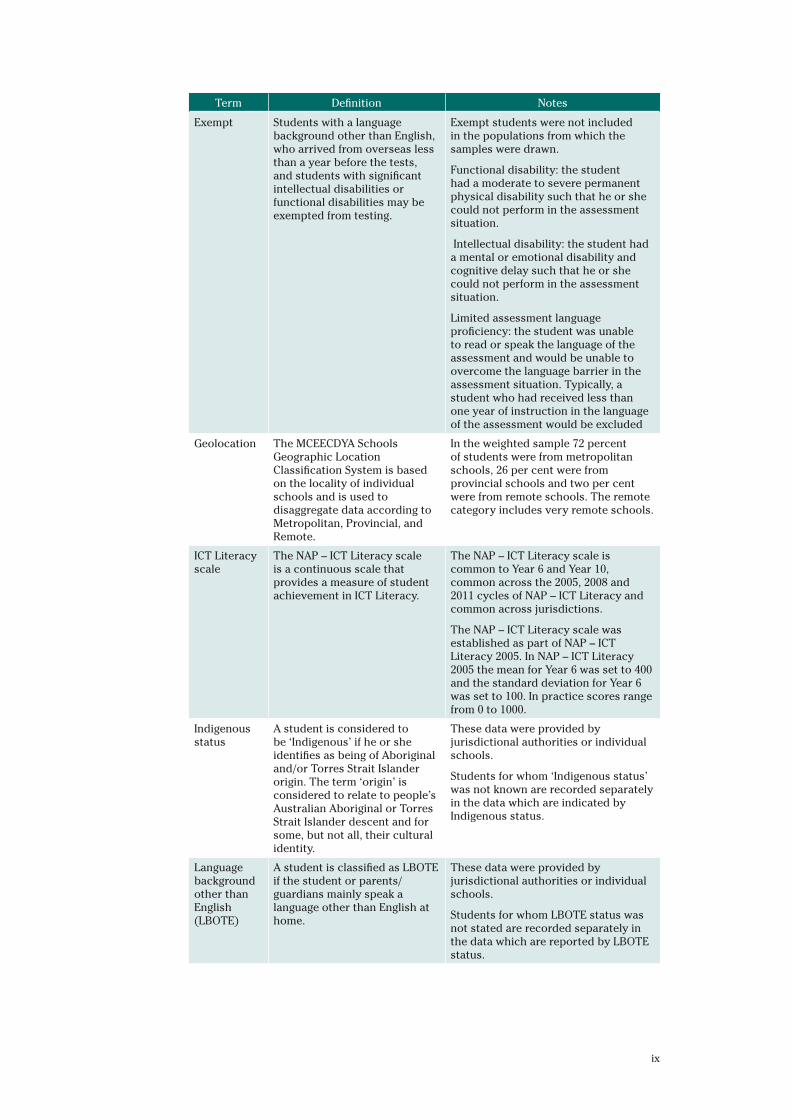
Exempt Students with a language background other than English, who arrived from overseas less than a year before the tests, and students with significant intellectual disabilities or functional disabilities may be exempted from testing.
Exempt students were not included in the populations from which the samples were drawn.
Functional disability: the student had a moderate to severe permanent physical disability such that he or she could not perform in the assessment situation.
Intellectual disability: the student had a mental or emotional disability and cognitive delay such that he or she could not perform in the assessment situation.
Limited assessment language proficiency: the student was unable to read or speak the language of the assessment and would be unable to overcome the language barrier in the assessment situation. Typically, a student who had received less than one year of instruction in the language of the assessment would be excluded
Geolocation The MCEECDYA Schools Geographic Location Classification System is based on the locality of individual schools and is used to disaggregate data according to Metropolitan, Provincial, and Remote.
In the weighted sample 72 percent of students were from metropolitan schools, 26 per cent were from provincial schools and two per cent were from remote schools. The remote category includes very remote schools.
ICT Literacy scale
The NAP – ICT Literacy scale is a continuous scale that provides a measure of student achievement in ICT Literacy.
The NAP – ICT Literacy scale is common to Year 6 and Year 10, common across the 2005, 2008 and 2011 cycles of NAP – ICT Literacy and common across jurisdictions.
The NAP – ICT Literacy scale was established as part of NAP – ICT Literacy 2005. In NAP – ICT Literacy 2005 the mean for Year 6 was set to 400 and the standard deviation for Year 6 was set to 100. In practice scores range from 0 to 1000.
Indigenous status
A student is considered to be ‘Indigenous’ if he or she identifies as being of Aboriginal and/or Torres Strait Islander origin. The term ‘origin’ is considered to relate to people’s Australian Aboriginal or Torres Strait Islander descent and for some, but not all, their cultural identity.
These data were provided by jurisdictional authorities or individual schools.
Students for whom ‘Indigenous status’ was not known are recorded separately in the data which are indicated by Indigenous status.
Language background other than English (LBOTE)
A student is classified as LBOTE if the student or parents/ guardians mainly speak a language other than English at home.
These data were provided by jurisdictional authorities or individual schools.
Students for whom LBOTE status was not stated are recorded separately in the data which are reported by LBOTE status.
x
Term Definition Notes
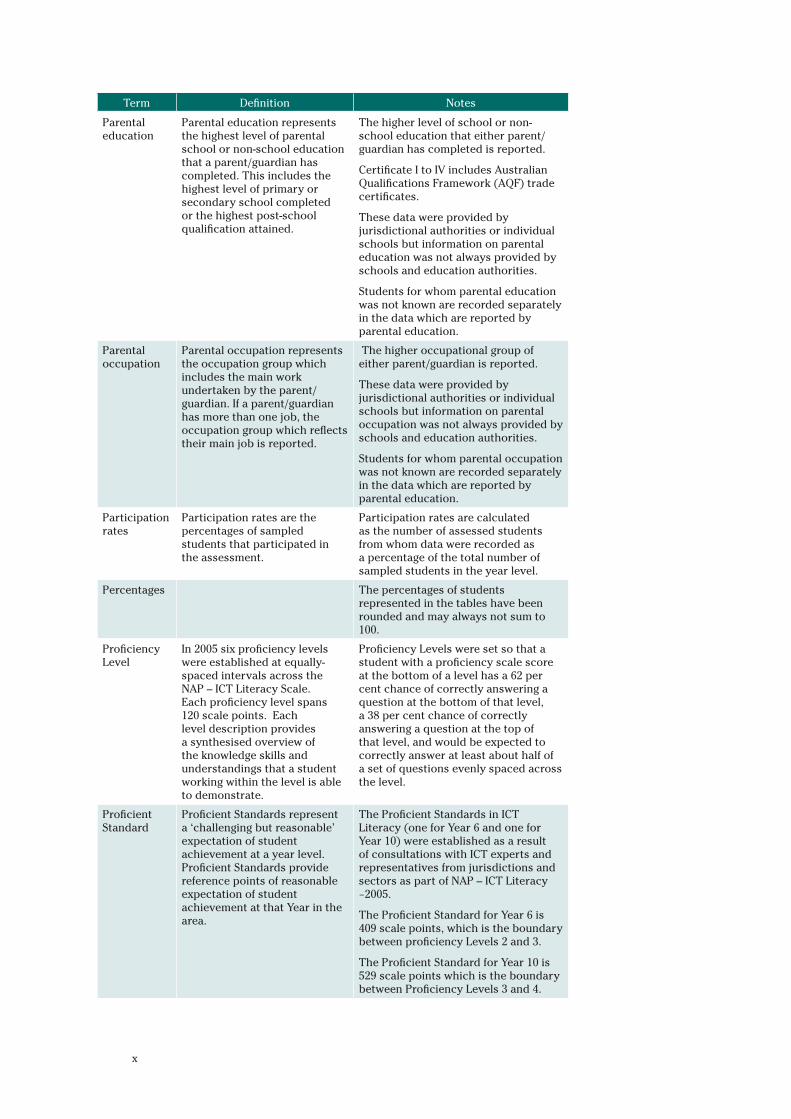
Parental education
Parental education represents the highest level of parental school or non-school education that a parent/guardian has completed. This includes the highest level of primary or secondary school completed or the highest post-school qualification attained.
The higher level of school or non-school education that either parent/guardian has completed is reported.
Certificate I to IV includes Australian Qualifications Framework (AQF) trade certificates.
These data were provided by jurisdictional authorities or individual schools but information on parental education was not always provided by schools and education authorities.
Students for whom parental education was not known are recorded separately in the data which are reported by parental education.
Parental occupation
Parental occupation represents the occupation group which includes the main work undertaken by the parent/guardian. If a parent/guardian has more than one job, the occupation group which reflects their main job is reported.
The higher occupational group of either parent/guardian is reported.
These data were provided by jurisdictional authorities or individual schools but information on parental occupation was not always provided by schools and education authorities.
Students for whom parental occupation was not known are recorded separately in the data which are reported by parental education.
Participation rates
Participation rates are the percentages of sampled students that participated in the assessment.
Participation rates are calculated as the number of assessed students from whom data were recorded as a percentage of the total number of sampled students in the year level.
Percentages The percentages of students represented in the tables have been rounded and may always not sum to 100.
Proficiency Level
In 2005 six proficiency levels were established at equally-spaced intervals across the NAP – ICT Literacy Scale. Each proficiency level spans 120 scale points. Each level description provides a synthesised overview of the knowledge skills and understandings that a student working within the level is able to demonstrate.
Proficiency Levels were set so that a student with a proficiency scale score at the bottom of a level has a 62 per cent chance of correctly answering a question at the bottom of that level, a 38 per cent chance of correctly answering a question at the top of that level, and would be expected to correctly answer at least about half of a set of questions evenly spaced across the level.
Proficient Standard
Proficient Standards represent a ‘challenging but reasonable’ expectation of student achievement at a year level. Proficient Standards provide reference points of reasonable expectation of student achievement at that Year in the area.
The Proficient Standards in ICT Literacy (one for Year 6 and one for Year 10) were established as a result of consultations with ICT experts and representatives from jurisdictions and sectors as part of NAP – ICT Literacy −2005.
The Proficient Standard for Year 6 is 409 scale points, which is the boundary between proficiency Levels 2 and 3.
The Proficient Standard for Year 10 is 529 scale points which is the boundary between Proficiency Levels 3 and 4.
xi
Term Definition Notes
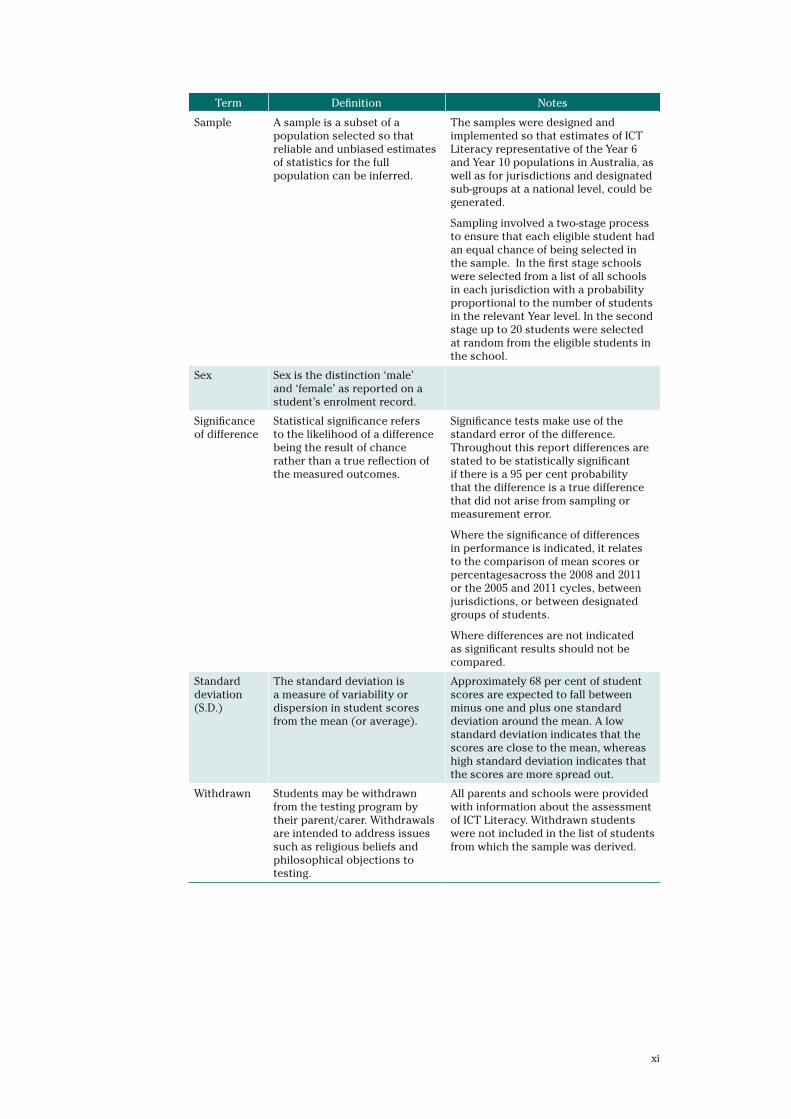
Sample A sample is a subset of a population selected so that reliable and unbiased estimates of statistics for the full population can be inferred.
The samples were designed and implemented so that estimates of ICT Literacy representative of the Year 6 and Year 10 populations in Australia, as well as for jurisdictions and designated sub-groups at a national level, could be generated.
Sampling involved a two-stage process to ensure that each eligible student had an equal chance of being selected in the sample. In the first stage schools were selected from a list of all schools in each jurisdiction with a probability proportional to the number of students in the relevant Year level. In the second stage up to 20 students were selected at random from the eligible students in the school.
Sex Sex is the distinction ‘male’ and ‘female’ as reported on a student’s enrolment record.
Significance of difference
Statistical significance refers to the likelihood of a difference being the result of chance rather than a true reflection of the measured outcomes.
Significance tests make use of the standard error of the difference. Throughout this report differences are stated to be statistically significant if there is a 95 per cent probability that the difference is a true difference that did not arise from sampling or measurement error.
Where the significance of differences in performance is indicated, it relates to the comparison of mean scores or percentagesacross the 2008 and 2011 or the 2005 and 2011 cycles, between jurisdictions, or between designated groups of students.
Where differences are not indicated as significant results should not be compared.
Standard deviation (S.D.)
The standard deviation is a measure of variability or dispersion in student scores from the mean (or average).
Approximately 68 per cent of student scores are expected to fall between minus one and plus one standard deviation around the mean. A low standard deviation indicates that the scores are close to the mean, whereas high standard deviation indicates that the scores are more spread out.
Withdrawn Students may be withdrawn from the testing program by their parent/carer. Withdrawals are intended to address issues such as religious beliefs and philosophical objections to testing.
All parents and schools were provided with information about the assessment of ICT Literacy. Withdrawn students were not included in the list of students from which the sample was derived.
xii
Executive Summary
ICT in the educational goals for young AustraliansThe Melbourne Declaration on Educational Goals for Young Australians
(MCEETYA, 2008) includes the following statement as part of its preamble.
Rapid and continuing advances in information and communication
technologies (ICT) are changing the ways people share, use, develop and
process information and technology. In this digital age, young people need
to be highly skilled in the use of ICT. While schools already employ these
technologies in learning, there is a need to increase their effectiveness
significantly over the next decade.
Goal 2 of that declaration stated that successful learners “have the essential skills
in literacy and numeracy and are creative and productive users of technology,
especially ICT, as a foundation for success in all learning areas.” It is a goal
that represents a continuation of a theme from the earlier Adelaide Declaration
on Australia’s National Goals for Schooling (MCEETYA, 1999): when students
leave school they should be “confident, creative and productive users of new
technologies, particularly information and communication technologies, and
understand the impact of those technologies on society”. The goal is manifest in
the Australian Curriculum where capability in information and communication
technology (ICT) is identified as one of the general capabilities that will assist
students to live and work successfully in the twenty-first century (ACARA,
2102).
xiii
Three cycles of ICT Literacy assessmentThis current report is based on the third cycle of national assessments of ICT
Literacy (NAP – ICT Literacy 2011), which was conducted in October 2011. It
provides information about ICT Literacy among Australian school students in
2011 and reports changes in ICT Literacy from 2005 (the time of the first cycle)
through 2008 to 2011. It reports on ICT Literacy nationally, for jurisdictions and
for particular groups of students.
The assessment was conducted using a computer-based performance
assessment tool that was developed for use in the 2005 survey and
subsequently extended to embrace new developments in ICT contexts,
assessment and delivery methods. The assessment survey was based on a
nationally representative sample of 11,023 students from Years 6 and 10: 5,710
from Year 6 and 5,313 from Year 10. These students were sampled randomly
from 649 schools.
Defining ICT LiteracyThe definition of ICT Literacy adopted by MCEETYA (later MCEECDYA and now
the SCSEEC1) for use in the National Assessment Program was: “the ability of
individuals to use ICT appropriately to access, manage, integrate and evaluate
information, develop new understandings, and communicate with others in
order to participate effectively in society” (MCEETYA, 2005). This definition,
together with an elaboration through a set of six key processes, and a broad
description of progress according to three strands form the basis of the
NAP – ICT Literacy Assessment Domain (MCEETYA, 2005). This conceptual
underpinning describes the foundation of the work across the three cycles
of NAP – ICT Literacy. It emphasises the interaction of information literacy
with computer technology. ICT Literacy has become increasingly regarded as a
broad set of generalisable and transferable capabilities that are used to manage
and communicate cross-disciplinary information using computer technology.
Even though advances in hardware and software technologies have meant
that the contexts in which ICT Literacy can be demonstrated are changing, the
core capabilities that are the basis of the NAP – ICT Literacy assessments have
remained consistently relevant.
Assessment MethodThe assessment for NAP – ICT Literacy 2011 was computer-based and included
a combination of simulated and authentic software applications, multiple
choice and text response items, grouped into seven modules each with its
own unifying theme that provided an authentic rationale for completing the
1 Standing Council on School Education and Early Childhood
xiv
tasks beyond their inclusion in a test. The assessment was structured to be
congruent with the 2005 and 2008 assessments so as to provide a basis for
comparison with those assessments. The format of the ICT Literacy assessment
in 2011 was the same as in 2008 and 2005 so that the on-screen environment
experienced by the student remained consistent.
Each module followed a linear narrative sequence designed to reflect students’
typical ‘real world’ use of ICT. The modules included a range of school-based
and out-of-school-based themes. Six of the seven modules included large tasks
to be completed using purpose-built software applications; three modules
were ‘trend’ modules as used in either or both of 2005 and 2008 and four of the
modules were newly developed for use in 2011. The newly developed modules
included content such as video and webpage editing and collaborative
workspaces that reflect more recent developments in the software contexts in
which students use ICT.
The six modules that included large tasks were as follows:
• In the Sports Picnic module students helped to plan a school sports picnic.
They used a Blog web-site and a comparative search engine to identify
a venue and to select sports’ equipment that meet given criteria. They
used tailored graphics software to produce invitations to the picnic that
included a map generated by using embedded mapping software.
• In the Friend’s PC module students helped a friend to manage software on
a PC. They searched for and installed specific photo management software,
changed settings for antivirus software, organised a photo collection and
edited a photo according to given instructions.
• In the Saving Electricity module students were assigned a school project
that required them to raise awareness about saving electricity. They first
researched the topic from given web resources and then used their research
as the basis for creating an original information video. They created the
video by editing given video clips and adding their own text and effects
with the purpose of encouraging and educating others about how to save
electricity.
• In the Wiki Builder module students were given the task of updating the wiki
page of a local sports club. They received content by email to be included
in and edit the wiki. They edited and formatted existing information, and
added new information and functions to the wiki.
• In the Language Preservation module (which was for Year 10 students only)
students participated in a national project to help preserve Indigenous
Australian languages. They were assigned several tasks in a collaborative
workspace to collect and edit information on a specific Indigenous
Australian language. Students then used collaboration software to schedule
a meeting with other students working on the project according to given
parameters.
• In the Art Show module (which was for Year 10 students only) students
were given the role as manager of the part of their school’s website that
xv
promotes their school’s art show. They downloaded and managed images
from a camera, managed communication through a webmail account and
then edited and added content to the website according to a given set of
instructions.
The General Skills module was an extension of a module that had been used
in NAP – ICT Literacy 2005 and 2008. It consisted of discrete tasks based on
general computing skills but did not contain a large task. The tasks in the
module typically deal with everyday tasks using commonly used software
applications such as word processing and spreadsheet software. The module
also included some questions about basic aspects of computer use.
Delivering the AssessmentsNAP – ICT Literacy 2011 was delivered to students using USB sticks (one per
student). The testing software itself was entirely web-based and could be
delivered using the internet. The USB delivery method was employed to account
for variations in school-based internet connectivity and computing resources
which meant that a web-based delivery of the instruments would not have
guaranteed an equivalent test-taking experience for each participating student.
The lack of dependence on internet delivery also allowed for multimedia videos
to be included in the test instrument (by removing concerns over connection
speeds) and minimised the setup requirements for administration at schools
(e.g. through network security and installation of uniform browser types).
The total time for administration of the four test modules and the student
questionnaire was approximately two hours including 15 minutes for students
to be introduced to the testing system with a guided set of practice questions.
Measuring ICT Literacy in 2011The process of deriving measures of ICT Literacy in 2011 involved analysing
student responses to the sets of tasks they were assigned. This led to the
computation of achievement scores based on those analyses, using link items
between Year 6 and Year 10 to equate scores and placing student scores on
the scale that had been developed in 2005. In addition to reporting in terms of
scale scores ICT Literacy is also reported in terms of Proficiency Levels and
whether student achievement was at or above the Proficient Standard defined
for the Year level.
Computing achievement scores from performance of tasks
Item response modelling (the Rasch model) was used to analyse student
responses. A benefit of using Rasch model was that the difficulty of the tasks
in the assessment and the performance of students could be placed on the
xvi
same scale regardless of which modules were completed by students. This
was possible because there were sufficient students completing each possible
combination of modules. In addition the Rasch model provided the basis for
equating of student performance on the same scale over time (in this case
across the 2005, 2008 and 2011 cycles).
Linking between Year 6 and Year 10
Common questions were also included in the assessments of Year 6 and Year
10 (in each of the 2005, 2008 and 2011 cycles). In NAP – ICT Literacy 2011 five
of the seven modules were completed by students in both Year 6 and Year
10 and two were undertaken by Year 10 students only. Sixty of the tasks that
were common to Year 6 and Year 10 had characteristics that were suitable for
defining the link between Year 6 and Year 10.
Linking across assessment cycles
The NAP – ICT Literacy 2011 test includes three modules that were used in NAP
– ICT Literacy 2008, one of which had also been used in the NAP – ICT Literacy
2005. These trend modules were chosen because of their continuing relevance
over time. Furthermore, items were used for linking only if the student data
in response to the tasks were empirically comparable with the data provided
by students assessed in previous administrations. Thirty of the tasks in these
modules had characteristics that were suitable for defining the link across the
cycles.
ICT Literacy scale
A reporting scale for ICT Literacy was established in 2005 with a mean scale
score of 400 and a standard deviation of 100 scale score units for the Year 6
cohort. The mean and standard deviation among Year 10 students in 2005 were
determined by their performance to the parameters set for Year 6. Results for
subsequent cycles of NAP – ICT Literacy have been reported on the scale that
had been established in 2005.
ICT Literacy profile
It was also possible to describe students’ ICT Literacy in terms of proficiency
levels. In 2005 six proficiency levels were established at equally-spaced intervals
across the NAP – ICT Literacy Scale. The cut scores for each proficiency level
were defined in 2005 and those same cut-scores were applied to the 2011
data. Descriptions, based on the content of the tasks corresponding to the
difficulty range in each level, were developed to characterise typical student
performance at each level. As a set, the descriptions represent growth in ICT
Literacy. The newly developed assessment modules for NAP – ICT Literacy
2011 enabled the detailed ICT Literacy proficiency descriptors to be updated
with some new examples of ICT Literacy achievement.
xvii
Four of the assessment modules (Saving Electricity, Wiki Builder, Language
Preservation and Art Show) were newly developed modules that included tasks
such as video and webpage editing and the use of collaborative workspaces (see
page viii) reflecting more recent developments in the software which students
use. Even the newly developed modules included new software contexts that
were consistent with the proficiency level descriptions established in NAP –
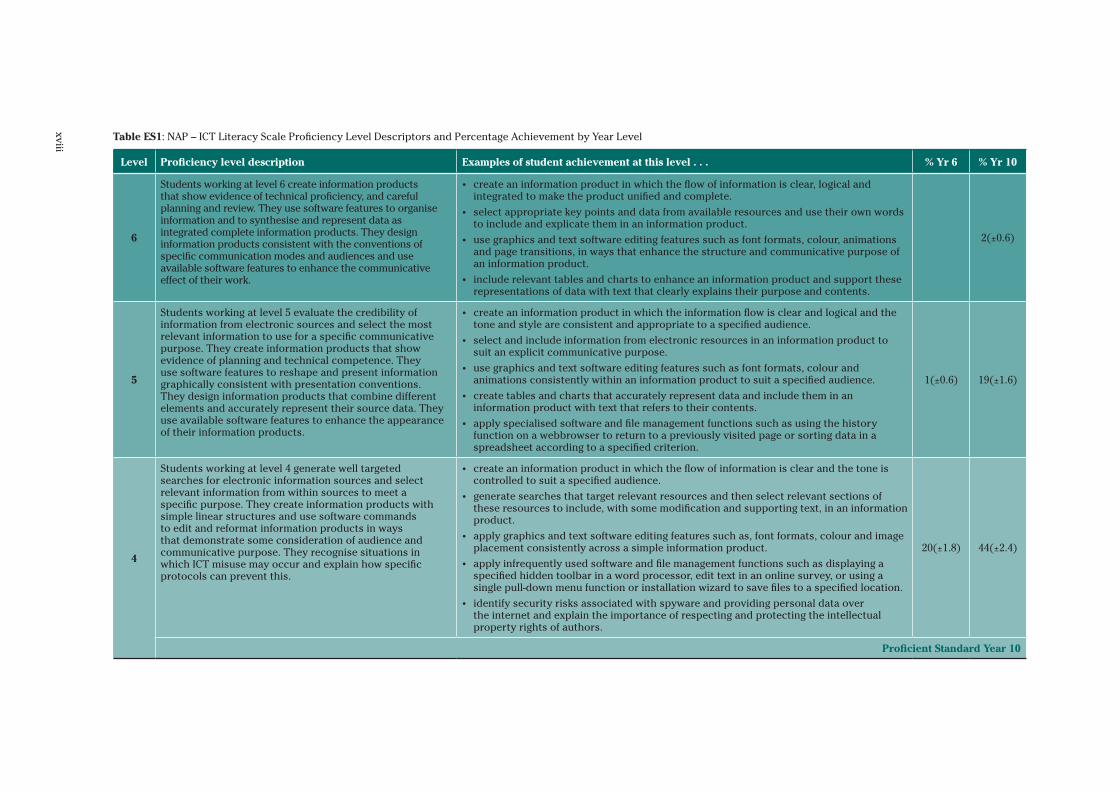
ICTL05 that have remained valid since then and are shown in Table ES 1.
Table ES 1 includes the described NAP – ICT Literacy Scale together with
examples of student achievement at each proficiency level. Each level
description provides a synthesised overview of the knowledge, skills and
understandings that a student working within the level is able to demonstrate.
The levels were set so that a student with a proficiency scale score at the
bottom of a level has a 62 per cent chance of correctly answering a question at
the bottom of that level, a 38 per cent chance of correctly answering a question
at the top of that level, and would be expected to correctly answer about half
of a set of questions within the level. The scale represents a hierarchy of the
knowledge, skills and understanding included in the construct of ICT Literacy.
Overall, higher levels on the scale refer to more complex applications of
knowledge skills and understandings in ICT Literacy. The scale is developmental
in the sense that students are assumed to be typically able to demonstrate
achievement of the skills and cognition described in the scale below as well as
at their measured level of achievement.
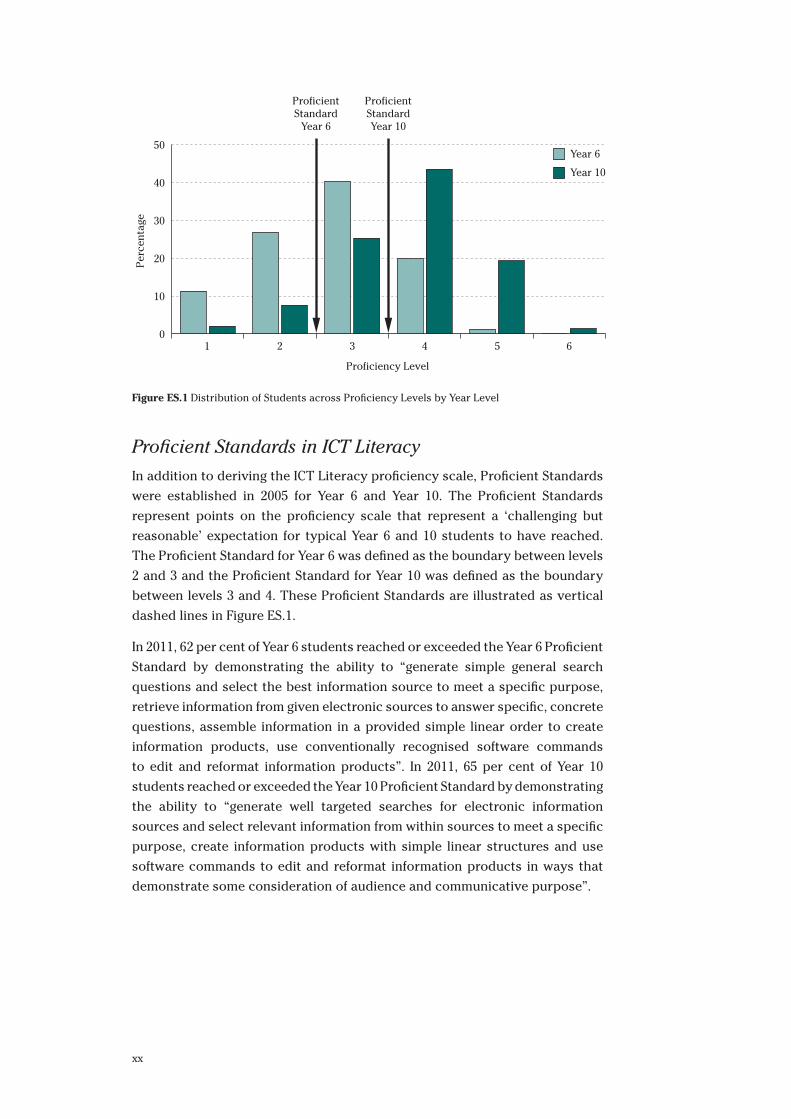
Figure ES 1 also shows the percentage of students who demonstrated
achievement at each proficiency level and the Proficient Standard Year 6 and
Year 10 for each year level. These data show that overall Year 10 students
are operating approximately one proficiency level higher than Year 6 students.
The separation of Year 6 and Year 10 students is shown in Figure ES1. Only 21
per cent of Year 6 students performed at Level 4 or above compared to 67 per
cent of Year 10 students. In contrast 38 per cent of Year 6 students performed
at Level 2 or below compared to ten per cent of Year 10 students.
xviii
Table ES1: NAP – ICT Literacy Scale Proficiency Level Descriptors and Percentage Achievement by Year Level
Level Proficiency level description Examples of student achievement at this level . . . % Yr 6 % Yr 10
6
Students working at level 6 create information products that show evidence of technical proficiency, and careful planning and review. They use software features to organise information and to synthesise and represent data as integrated complete information products. They design information products consistent with the conventions of specific communication modes and audiences and use available software features to enhance the communicative effect of their work.
• create an information product in which the flow of information is clear, logical and integrated to make the product unified and complete.
• select appropriate key points and data from available resources and use their own words to include and explicate them in an information product.
• use graphics and text software editing features such as font formats, colour, animations and page transitions, in ways that enhance the structure and communicative purpose of an information product.
• include relevant tables and charts to enhance an information product and support these representations of data with text that clearly explains their purpose and contents.
2(±0.6)
5
Students working at level 5 evaluate the credibility of information from electronic sources and select the most relevant information to use for a specific communicative purpose. They create information products that show evidence of planning and technical competence. They use software features to reshape and present information graphically consistent with presentation conventions. They design information products that combine different elements and accurately represent their source data. They use available software features to enhance the appearance of their information products.
• create an information product in which the information flow is clear and logical and the tone and style are consistent and appropriate to a specified audience.
• select and include information from electronic resources in an information product to suit an explicit communicative purpose.
• use graphics and text software editing features such as font formats, colour and animations consistently within an information product to suit a specified audience.
• create tables and charts that accurately represent data and include them in an information product with text that refers to their contents.
• apply specialised software and file management functions such as using the history function on a webbrowser to return to a previously visited page or sorting data in a spreadsheet according to a specified criterion.
1(±0.6) 19(±1.6)
4
Students working at level 4 generate well targeted searches for electronic information sources and select relevant information from within sources to meet a specific purpose. They create information products with simple linear structures and use software commands to edit and reformat information products in ways that demonstrate some consideration of audience and communicative purpose. They recognise situations in which ICT misuse may occur and explain how specific protocols can prevent this.
• create an information product in which the flow of information is clear and the tone is controlled to suit a specified audience.
• generate searches that target relevant resources and then select relevant sections of these resources to include, with some modification and supporting text, in an information product.
• apply graphics and text software editing features such as, font formats, colour and image placement consistently across a simple information product.
• apply infrequently used software and file management functions such as displaying a specified hidden toolbar in a word processor, edit text in an online survey, or using a single pull-down menu function or installation wizard to save files to a specified location.
• identify security risks associated with spyware and providing personal data over the internet and explain the importance of respecting and protecting the intellectual property rights of authors.
20(±1.8) 44(±2.4)
Proficient Standard Year 10
xix
Level Proficiency level description Examples of student achievement at this level . . . % Yr 6 % Yr 10
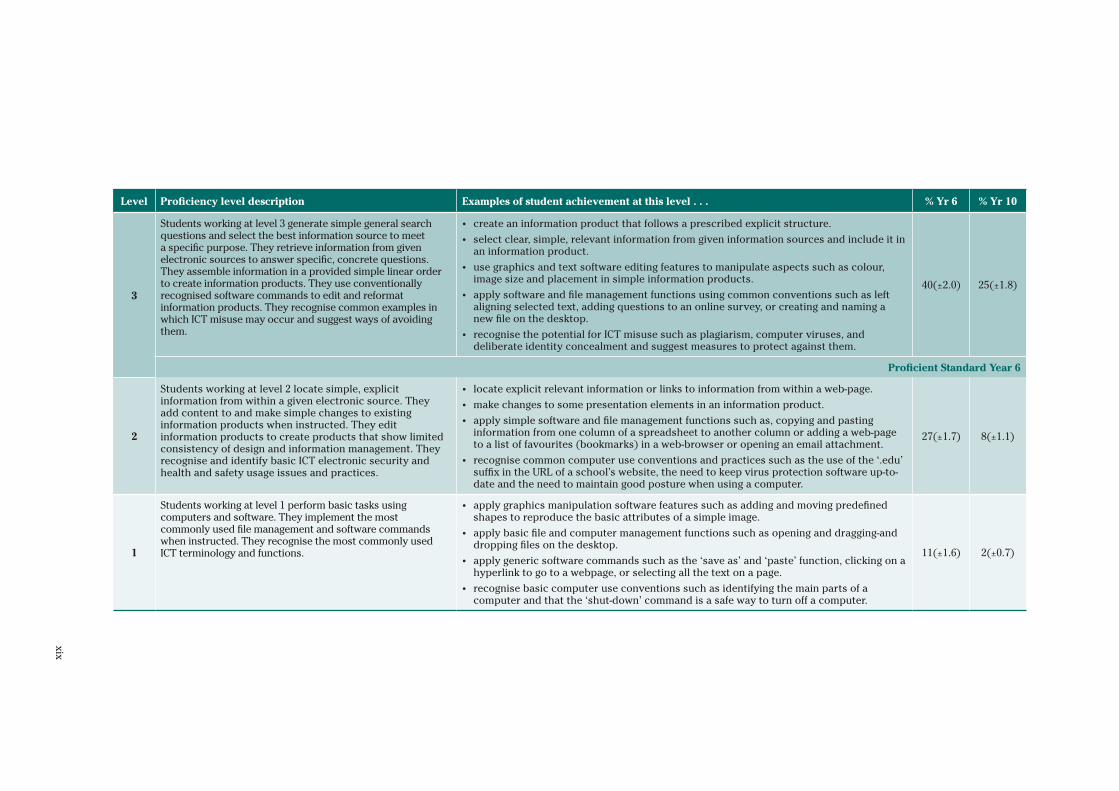
3
Students working at level 3 generate simple general search questions and select the best information source to meet a specific purpose. They retrieve information from given electronic sources to answer specific, concrete questions. They assemble information in a provided simple linear order to create information products. They use conventionally recognised software commands to edit and reformat information products. They recognise common examples in which ICT misuse may occur and suggest ways of avoiding them.
• create an information product that follows a prescribed explicit structure.
• select clear, simple, relevant information from given information sources and include it in an information product.
• use graphics and text software editing features to manipulate aspects such as colour, image size and placement in simple information products.
• apply software and file management functions using common conventions such as left aligning selected text, adding questions to an online survey, or creating and naming a new file on the desktop.
• recognise the potential for ICT misuse such as plagiarism, computer viruses, and deliberate identity concealment and suggest measures to protect against them.
40(±2.0) 25(±1.8)
Proficient Standard Year 6
2
Students working at level 2 locate simple, explicit information from within a given electronic source. They add content to and make simple changes to existing information products when instructed. They edit information products to create products that show limited consistency of design and information management. They recognise and identify basic ICT electronic security and health and safety usage issues and practices.
• locate explicit relevant information or links to information from within a web-page.
• make changes to some presentation elements in an information product.
• apply simple software and file management functions such as, copying and pasting information from one column of a spreadsheet to another column or adding a web-page to a list of favourites (bookmarks) in a web-browser or opening an email attachment.
• recognise common computer use conventions and practices such as the use of the ‘.edu’ suffix in the URL of a school’s website, the need to keep virus protection software up-to-date and the need to maintain good posture when using a computer.
27(±1.7) 8(±1.1)
1
Students working at level 1 perform basic tasks using computers and software. They implement the most commonly used file management and software commands when instructed. They recognise the most commonly used ICT terminology and functions.
• apply graphics manipulation software features such as adding and moving predefined shapes to reproduce the basic attributes of a simple image.
• apply basic file and computer management functions such as opening and dragging-and dropping files on the desktop.
• apply generic software commands such as the ‘save as’ and ‘paste’ function, clicking on a hyperlink to go to a webpage, or selecting all the text on a page.
• recognise basic computer use conventions such as identifying the main parts of a computer and that the ‘shut-down’ command is a safe way to turn off a computer.
11(±1.6) 2(±0.7)
xx
0
10
20
30
40
50
2 3
Per
cent
age
Proficiency Level
4
ProficientStandard
Year 6
ProficientStandardYear 10
5 61
Year 6
Year 10
Figure ES.1 Distribution of Students across Proficiency Levels by Year Level
Proficient Standards in ICT Literacy
In addition to deriving the ICT Literacy proficiency scale, Proficient Standards
were established in 2005 for Year 6 and Year 10. The Proficient Standards
represent points on the proficiency scale that represent a ‘challenging but
reasonable’ expectation for typical Year 6 and 10 students to have reached.
The Proficient Standard for Year 6 was defined as the boundary between levels
2 and 3 and the Proficient Standard for Year 10 was defined as the boundary
between levels 3 and 4. These Proficient Standards are illustrated as vertical
dashed lines in Figure ES.1.
In 2011, 62 per cent of Year 6 students reached or exceeded the Year 6 Proficient
Standard by demonstrating the ability to “generate simple general search
questions and select the best information source to meet a specific purpose,
retrieve information from given electronic sources to answer specific, concrete
questions, assemble information in a provided simple linear order to create
information products, use conventionally recognised software commands
to edit and reformat information products”. In 2011, 65 per cent of Year 10
students reached or exceeded the Year 10 Proficient Standard by demonstrating
the ability to “generate well targeted searches for electronic information
sources and select relevant information from within sources to meet a specific
purpose, create information products with simple linear structures and use
software commands to edit and reformat information products in ways that
demonstrate some consideration of audience and communicative purpose”.
xxi
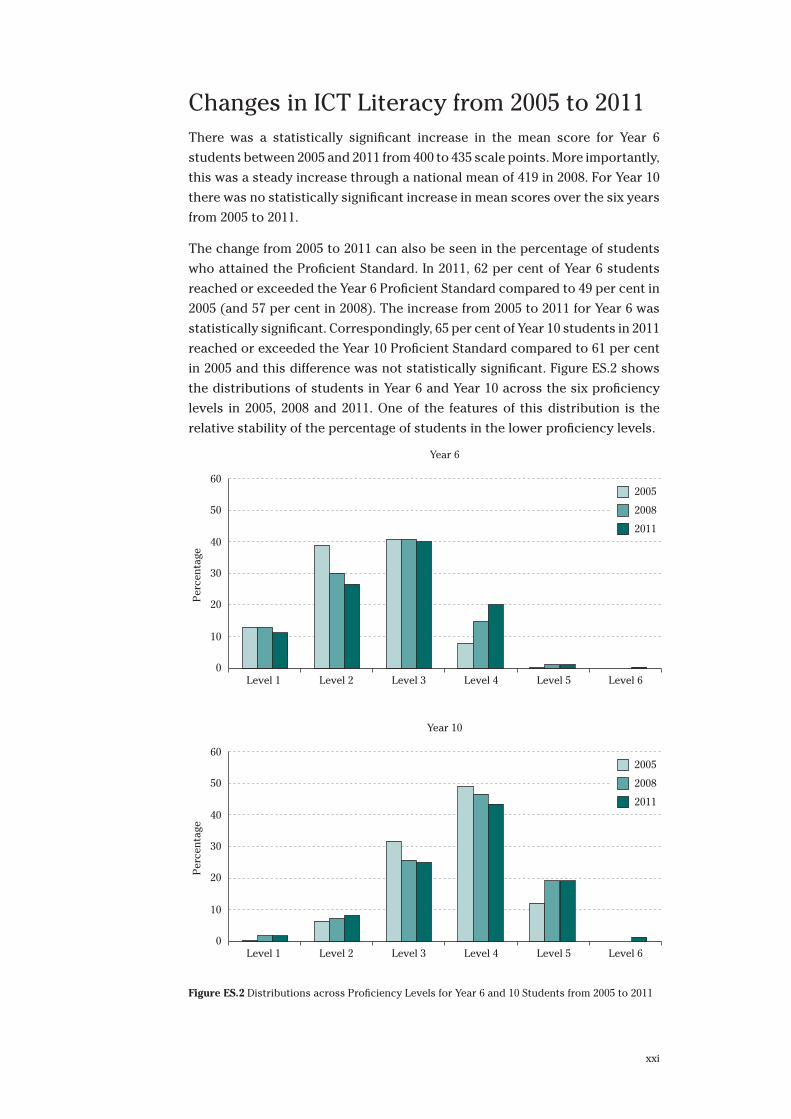
Changes in ICT Literacy from 2005 to 2011There was a statistically significant increase in the mean score for Year 6
students between 2005 and 2011 from 400 to 435 scale points. More importantly,
this was a steady increase through a national mean of 419 in 2008. For Year 10
there was no statistically significant increase in mean scores over the six years
from 2005 to 2011.
The change from 2005 to 2011 can also be seen in the percentage of students
who attained the Proficient Standard. In 2011, 62 per cent of Year 6 students
reached or exceeded the Year 6 Proficient Standard compared to 49 per cent in
2005 (and 57 per cent in 2008). The increase from 2005 to 2011 for Year 6 was
statistically significant. Correspondingly, 65 per cent of Year 10 students in 2011
reached or exceeded the Year 10 Proficient Standard compared to 61 per cent
in 2005 and this difference was not statistically significant. Figure ES.2 shows
the distributions of students in Year 6 and Year 10 across the six proficiency
levels in 2005, 2008 and 2011. One of the features of this distribution is the
relative stability of the percentage of students in the lower proficiency levels.
0
10
20
30
40
60
50
Level 2 Level 3
Per
cent
age
Level 4 Level 5
Year 6
Level 6Level 1
2005
2008
2011
0
10
20
30
40
60
50
Level 2 Level 3
Per
cent
age
Level 4 Level 5
Year 10
Level 6Level 1
2005
2008
2011
Figure ES.2 Distributions across Proficiency Levels for Year 6 and 10 Students from 2005 to 2011
xxii
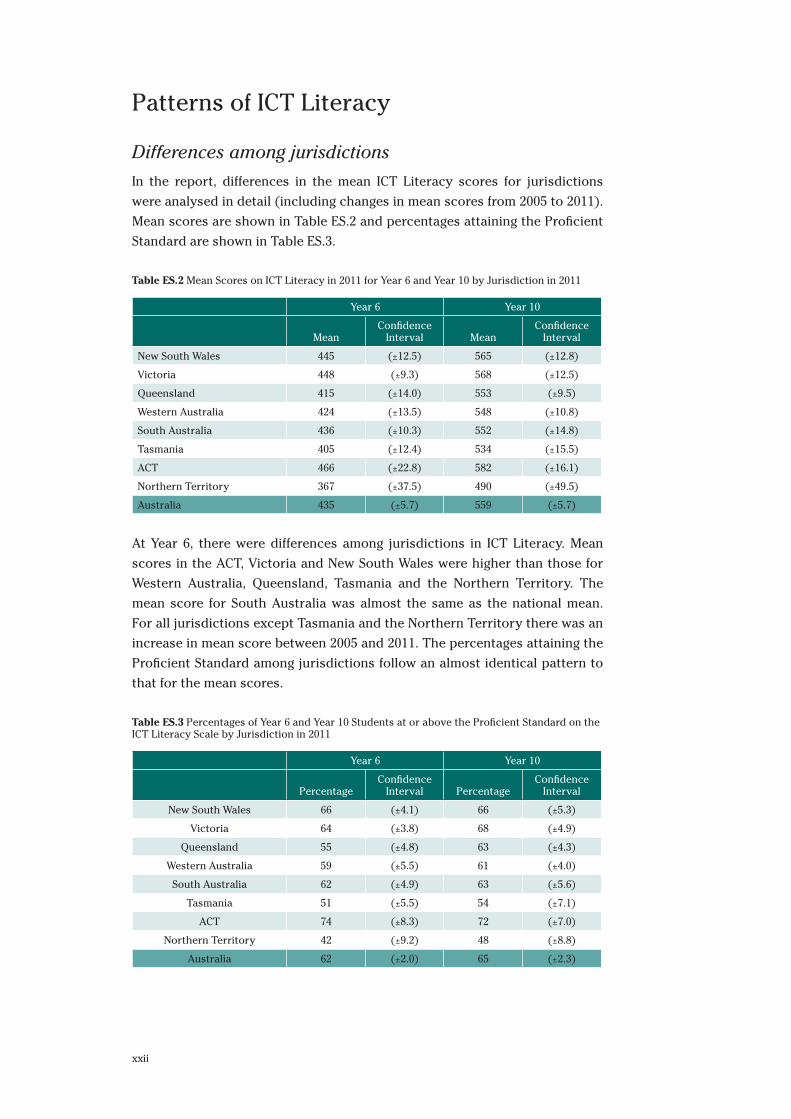
Patterns of ICT Literacy
Differences among jurisdictions
In the report, differences in the mean ICT Literacy scores for jurisdictions
were analysed in detail (including changes in mean scores from 2005 to 2011).
Mean scores are shown in Table ES.2 and percentages attaining the Proficient
Standard are shown in Table ES.3.
Table ES.2 Mean Scores on ICT Literacy in 2011 for Year 6 and Year 10 by Jurisdiction in 2011
Year 6 Year 10
MeanConfidence
Interval MeanConfidence
Interval
New South Wales 445 (±12.5) 565 (±12.8)
Victoria 448 (±9.3) 568 (±12.5)
Queensland 415 (±14.0) 553 (±9.5)
Western Australia 424 (±13.5) 548 (±10.8)
South Australia 436 (±10.3) 552 (±14.8)
Tasmania 405 (±12.4) 534 (±15.5)
ACT 466 (±22.8) 582 (±16.1)
Northern Territory 367 (±37.5) 490 (±49.5)
Australia 435 (±5.7) 559 (±5.7)
At Year 6, there were differences among jurisdictions in ICT Literacy. Mean
scores in the ACT, Victoria and New South Wales were higher than those for
Western Australia, Queensland, Tasmania and the Northern Territory. The
mean score for South Australia was almost the same as the national mean.
For all jurisdictions except Tasmania and the Northern Territory there was an
increase in mean score between 2005 and 2011. The percentages attaining the
Proficient Standard among jurisdictions follow an almost identical pattern to
that for the mean scores.
Table ES.3 Percentages of Year 6 and Year 10 Students at or above the Proficient Standard on the ICT Literacy Scale by Jurisdiction in 2011
Year 6 Year 10
PercentageConfidence
Interval PercentageConfidence
Interval
New South Wales 66 (±4.1) 66 (±5.3)
Victoria 64 (±3.8) 68 (±4.9)
Queensland 55 (±4.8) 63 (±4.3)
Western Australia 59 (±5.5) 61 (±4.0)
South Australia 62 (±4.9) 63 (±5.6)
Tasmania 51 (±5.5) 54 (±7.1)
ACT 74 (±8.3) 72 (±7.0)
Northern Territory 42 (±9.2) 48 (±8.8)
Australia 62 (±2.0) 65 (±2.3)
xxiii
In Year 10 the range in mean scores for ICT Literacy was smaller than in Year
6. On average, ICT Literacy scores in the ACT, Victoria and New South Wales
were higher than in Tasmania and the Northern Territory. A similar pattern
was evident for the percentages of students in these jurisdictions attaining the
Proficient Standard.
It was evident that jurisdictional mean ICT literacy scores are associated with
social and demographic characteristics of jurisdictions (as reflected in ICSEA
scores). However, this study was not designed to gather systematic information
about the teaching of ICT literacy from teachers, schools and education
authorities and it is not possible to comment on the extent to which such factors
may be related to both socio-demographic factors and ICT literacy. Assembling
systematic data about the teaching and learning of ICT literacy in a way that
enables them to be linked to outcomes remains a task for future investigations.
Differences associated with student characteristics
Student background characteristics were related to ICT Literacy and the
patterns are similar in Year 6 and Year 10. There was a large effect associated
with parental occupation and education. In Year 6, 50 per cent of students with
parents in ‘unskilled manual, office and sales’ occupational groups attained
the Proficient Standard compared to 79 per cent of students with parents from
the ‘senior managers and professionals’ occupational group. In Year 10 the
corresponding figures were 57 per cent and 78 per cent. Among Year 6 students,
44 per cent of students whose parents had attained Year 10 at school reached
or exceeded the Proficient Standard compared to 79 per cent among those
who had at least one parent with a university degree. For Year 10 students the
corresponding percentages were 54 per cent and 78 per cent.
There is also a substantial gap in ICT Literacy between Indigenous and non-
Indigenous students. In Year 6, 31 per cent of Indigenous students attained the
Proficient Standard compared to 64 per cent of non-Indigenous students. At
Year 10, the corresponding percentages were 36 per cent and 66 per cent.
There was also evidence of differences in ICT Literacy among geographic
locations. At both Year 6 and Year 10 higher ICT Literacy scores were recorded
for metropolitan students than for students in provincial areas who, in turn
recorded higher scores than those in remote areas. The percentages of Year
6 students attaining the Proficient Standard were 66, 51 and 45 per cent for
metropolitan, provincial and remote respectively. Among Year 10 students the
percentages attaining the Proficient Standard for metropolitan, provincial and
remote locations were 67, 58 and 47 per cent.
Consistent with the pattern observed in 2008, females recorded higher levels
of ICT Literacy than males. Even though female students expressed lower
levels of interest and enjoyment than males in computing, they expressed
similar levels of confidence in their ability to carry out ICT-based tasks without
assistance, and they achieved higher scores on ICT Literacy than males. There
xxiv
were no differences between students speaking a language other than English
at home and those with an English-speaking background.
ICT use at Home and School Students used computers more frequently at home than at school. Sixty per
cent of Year 6 students use computers at home almost every day or more
frequently, compared with 27 per cent at school. The corresponding figures for
Year 10 students were 82 per cent and 51 per cent. Study utilities (especially
preparing documents and searching the internet for information) were
frequently used by students both at school and at home (almost equally) in
both Year 6 and Year 10 (although more frequently in Year 10 than Year 6).
Communication applications (emailing or chatting) were also frequently used
by students but much more at home than at school and more by Year 10 than
by Year 6 students. Students also used entertainment applications (obtaining
and listening to music) quite frequently at home but rarely at school.
Over the six years from 2005 to 2011 computer use by students had increased
considerably. The percentage of students using computers frequently (almost
every day or greater) at home increased from 43 to 60 per cent among Year 6
students and from 58 to 83 per cent among Year 10 students. The percentages
using computers frequently at school increased from 14 per cent to 28 per
cent among Year 6 students and from 18 per cent to 51 per cent among Year 10
students.
Students Perceptions of Using ICTStudents indicated a high level of interest and enjoyment in using computers.
Males recorded higher levels of interest than females and Year 6 students
expressed greater interest in using ICT than Year 10 students. Year 6 and Year
10 students showed themselves confident that they could easily download
music from the internet, upload files to a website and create a multi-media
presentation (with sound, pictures, video). They were less confident about
their ability to construct a web page or create a database. There were no
differences between males and females in terms of confidence in using ICT, but
there were significant differences between Year 6 and Year 10: Year 10 students
expressed higher levels of confidence in using ICT than Year 6 students.
ConclusionOver the six years from 2005 to 2011 there have been some important changes
in the context of the assessment of ICT Literacy. One of these is that there has
been continued growth in the extent to which young people have access to and
xxv
use ICT at home and at school. Australian teenagers continue to have access
to, and use, ICT to a greater extent than their peers in many other countries
and are among the highest users of ICT in the OECD (OECD, 2011).
In general, the results from NAP – ICT Literacy 2011 indicate that Australian
students are well prepared for these aspects of contemporary life. Overall, 62
per cent of Year 6 students attained the Proficient Standard for that year level
by being able to: “generate simple general search questions and select the
best information source to meet a specific purpose, retrieve information from
given electronic sources to answer specific, concrete questions, assemble
information in a provided simple linear order to create information products,
use conventionally recognised software commands to edit and reformat
information products”. Sixty-five per cent of Year 10 students reached or
exceeded the Proficient Standard for Year 10 by indicating that they were able
to: “generate well targeted searches for electronic information sources and
select relevant information from within sources to meet a specific purpose,
create information products with simple linear structures and use software
commands to edit and reformat information products in ways that demonstrate
some consideration of audience and communicative purpose”.
Moreover, from 2005 to 2011 there was an improvement in the ICT Literacy of
Year 6 students. However, this was not the case among Year 10 students. The
different trajectories in ICT Literacy for Year 6 and Year 10 should generate
further enquiry about causes of these changes. The results from NAP – ICT
Literacy 2011 also indicate considerable variation among students in ICT
Literacy. Many students use ICT in a relatively limited way and this is reflected
in their overall level of ICT Literacy. Even in Year 6, where there has been a
general improvement in ICT Literacy, the proportion of low achieving students
has remained relatively constant since 2005. In Year 10 the percentage of
students demonstrating achievement at Levels 1 and 2 of the distribution (i.e.
below the Year 6 Proficient Standard) has increased from six per cent to 10 per
cent.
There are also differences associated with socioeconomic background,
Indigenous status and geographic location that were also evident in previous
cycles and need to be addressed if all young Australians are to be creative and
productive users of technology.

1
Chapter 1 Introduction
ICT in the Educational Goals for Young AustraliansIn December 2008, State, Territory and Commonwealth Ministers of Education,
meeting as the Ministerial Council on Education, Employment, Training and
Youth Affairs (MCEETYA)2, adopted the Melbourne Declaration on Educational
Goals for Young Australians which was intended to set the direction for
Australian schooling for the next decade (MCEETYA, 2008). As part of its
preamble the Melbourne Declaration included the following statement.
Rapid and continuing advances in information and communication
technologies (ICT) are changing the ways people share, use, develop and
process information and technology. In this digital age, young people need
to be highly skilled in the use of ICT. While schools already employ these
technologies in learning, there is a need to increase their effectiveness
significantly over the next decade.
Goal 2 of the Melbourne Declaration stated that “all young Australians become
successful learners, confident and creative individuals, and active and informed
citizens.” It went on to elaborate that successful learners should “have the
essential skills in literacy and numeracy and are creative and productive users
of technology, especially ICT, as a foundation for success in all learning areas.”
2 Subsequently the Ministerial Council on Education, Early Childhood Development and Youth Affairs (MCEECDYA).
2
These views represent a continuation of a theme from the earlier Adelaide
Declaration of Australia’s National Goals for Schooling which stated that when
students left school they should be: “confident, creative and productive users
of new technologies, particularly information and communication technologies,
and understand the impact of those technologies on society” (MCEETYA, 1999).
In the Australian Curriculum, information and communication technology (ICT)
capability is identified as one of the seven general capabilities that will assist
students to live and work successfully in the twenty-first century (ACARA,
2102). In that context ICT capability is conceptualised as being concerned
with using ICT for purposes such as information access and management,
information creation and presentation, problem solving, communication,
creative expression, and empirical reasoning. It is seen as applying ICT to
research, creating multimedia information products, analysing data, designing
solutions to problems, controlling processes and devices, and computation
while working both independently and in collaboration with others (ACARA,
2012). The statement also identifies safe working as part of the capability.
ICT in the National Assessment ProgramA companion document to the Melbourne Declaration outlines strategies
intended to support the implementation of its educational goals over a four-year
period from 2009 through 2012 (MCEETYA, 2009). This includes a commitment
to evaluation through a national assessment program, comprising national tests
in literacy and numeracy across the school population in specified Year levels,
sample assessments in science literacy, civics and citizenship, and ICT literacy’
and participation in relevant international testing programs (MCEETYA, 2009).
The National Assessment Program originated with the work of the MCEETYA
National Education Performance Monitoring Taskforce (NEPMT), and later the
Performance Measurement and Reporting Taskforce (PMRT), which developed
key performance measures to monitor and report on progress towards the
achievement of goals for schooling on a nationally comparable basis. Sample-
based assessment surveys were initiated in Science Literacy, Civics and
Citizenship, and ICT Literacy on a rolling triennial basis. The first of these was
the sample assessment of Science Literacy in Year 6 conducted in 2003. The
first national assessment in Civics and Citizenship was conducted in 2004 and
the first national assessment in ICT Literacy was conducted in 2005.
The 2005 sample assessment of ICT literacy (NAP – ICTL05) was conducted among
students in Year 6 and Year 10 (MCEETYA, 2007). It was computer-based and
combined tasks requiring the performance of specific functions within software
simulations with the creation of products using live applications in a rotated set
of thematic modules. The inclusion of “large” tasks that were completed using
multiple functions within live software broke new ground. When completing
these large tasks, students typically needed to select, assimilate and synthesise
3
the information they had been working with in the lead-up tasks and reframe the
information to fulfil a specified communicative purpose. Previously, assessment
methods that provided for analysing higher-level abilities (such as rubric-
scored portfolios) had proven to be very difficult to apply across classrooms.
Data gathered in the 2005 assessment were used to establish the (continuous)
NAP – ICT Literacy scale and Proficient Standards for Year 6 and Year 10 which
constitute the reportable key performance measures in ICT Literacy.
The second cycle of the national assessments of ICT Literacy (NAP –
ICTL08) extended this approach of performance assessment to incorporate
developments in ICT and the Statements of Learning for Information and
Communication Technologies developed through the Australian Education
Systems Official Committee (AESOC) on behalf of MCEETYA (AESOC, 2006).
The second cycle also incorporated tasks that reflected changes in the nature
of ICT that had emerged over three years (MCEETYA, 2010). NAP – ICT Literacy
2011 is the third assessment cycle in ICT Literacy. It is linked to the two previous
cycles but incorporates additional features resulting from new developments
in the field, including multimedia video applications and collaborative use of
ICT through wikis and other applications.
A key feature of these assessments is the inclusion of “link” items across
cycles: items that are common to two or more adjacent cycles. These link items
provide the basis for measuring change over time. In addition the national
assessments in ICT literacy include common items between the Year 6 and
Year 10 assessments, thus providing an opportunity to construct a scale to
describe achievement across both year levels and to assess the difference in
performance of students in these two year levels in each cycle.
What is Assessed in ICT LiteracyThe definition of ICT Literacy adopted by MCEETYA for use in the National
Assessment Program was:
the ability of individuals to use ICT appropriately to access, manage,
integrate and evaluate information, develop new understandings, and
communicate with others in order to participate effectively in society
(MCEETYA, 2005).
This definition, together with an elaboration through a set of six key processes
and a broad description of progress according to three strands, form the
basis of the NAP – ICT Literacy Assessment Domain (MCEETYA, 2005), which
consistently describes the foundation of the work across the three cycles of
NAP – ICT Literacy.
At its inception, the NAP – ICT Literacy Assessment Domain was influenced
by work conducted by the Educational Testing Service (ETS) to develop a
framework for ICT literacy (ETS, 2002).
4
Since this initial work undertaken by ETS, there has been growing interest
in the assessment of ICT Literacy-related competencies in Australia and
internationally (Erstad, 2006; 2010). The European Commission articulated
“digital competence” as a core competence (European Commission, 2006) and
two international projects have emerged in which Australia is participating:
the Assessment and Teaching of 21st Century Skills (Griffin, McGaw and
Care, 2012) and the International Computer and Information Literacy Study
(ICILS) commissioned by the International Association for the Evaluation of
Educational Achievement (IEA).
Continuing advances in hardware and software technologies have meant that
the contexts in which ICT Literacy can be demonstrated are in constant flux.
Despite this, the core capabilities that are the basis of the NAP – ICT Literacy
assessments have remained consistently relevant in the field and congruent
with curriculum developments in Australia – the most recent of which is the
introduction of ICT capability in the Australian Curriculum.
ICT Literacy continues to be regarded as a broad set of cross-disciplinary
capabilities that are used to manage and communicate information. Binkley
et al. (2012: 52) have synthesised and documented the operational definitions
of ICT literacy that have developed over the past decade. Consistent with
the argument of Markauskaite (2006) these combine aspects of technological
expertise with concepts of information literacy and extend to include ways
in which collected information can be transformed and used to communicate
ideas (see Catts & Lau 2008). ICT literacy has not focused on programming but
on computer use (with computers being seen as an important sub-domain of
ICT). More recent writing about information literacy has adopted and largely
subsumed computer (or ICT) literacy now that digital technologies have
developed as primary information management resources.
Stages in the 2011 National Assessment of ICT LiteracyThe first stage of the 2011 national assessment was a review of the contexts
in which ICT Literacy could be demonstrated by young people to inform the
development of assessment contexts for inclusion in the 2011 assessment.
This stage involved analysis of key documents, and gathering information on
the ICT applications that were used by young people at school and at home.
This work was conducted in consultation with the NAP – ICT Literacy Review
Committee. Most of these activities took place in the first six months of 2010.
As a consequence of this work it was decided to develop material that involved
multimedia applications and collaboration and knowledge sharing tools.
The second stage was the development of instruments and technologies for
delivery. In NAP – ICT Literacy the items and tasks were embedded in 20-minute
test “modules” each of which had its own unifying theme. The assessment
5
instruments were designed to include secure trend modules and tasks that had
been used in the 2005 and 2008 national assessments as well as new modules
and tasks specifically developed for 2011. For most of the trend modules it was
planned to include them in their original forms, but it was decided to extend
and enhance one trend module designed in 2005 to assess students’ “general
skills” with a view to maintaining the ongoing usefulness of this module. The
selection of trend modules was based on analyses of data from previous
assessments and was carried out with reference to the equating design for
the study. The development of new modules and tasks took place over the
period from March to December 2010 and included cognitive laboratories with
small groups of students. At the same time there was a redevelopment of the
student questionnaire material that resulted in collecting data on the use of
ICT applications separately regarding the school and home context (rather
than just a combined home and school usage) as well as including a measure
of student confidence in using ICT. The response categories for computer use
were changed so as to reflect the increased usage by students and the list of
ICT applications was updated to better reflect contemporary patterns of use.
In addition, the scale measuring interest and enjoyment when using computers
was revised.
The second stage included review, development and testing of the delivery
method to be employed so as to allow the inclusion of tasks that involve
multimedia and richer stimulus material. To serve this end the software was
written to make use of web-applications and a web server. Four approaches to
delivery were developed: delivery on USB drives, delivery using a notebook
operating as a local server, delivery by mini-labs, and delivery through a web-
based internet connection. As a result of testing of these methods focus was
given to delivery via USB drives augmented by sets of portable computers
(mini-labs) where schools did not have appropriate computer resources. The
software was designed to operate through a web-based internet connection
but school connectivity was, in general, not adequate for this to be used
(especially for multimedia tasks). With the method that was adopted, the USB
drive acts as a server to the student’s computer.
The third stage consisted in the field trial of the instruments which was
conducted with about 1500 students in 82 schools from five jurisdictions
between March and the beginning of April 2011. A supplementary operational
test was conducted in June 2011 in Queensland (where it was not possible to
conduct the field trial at the same time as in other jurisdictions).
The fourth stage involved a revision of the instruments on the basis of
the analyses of field trial data. This activity involved an evaluation of the
characteristics of each task to determine whether it should be deleted from
the scaling, deleted from the main study test or (in the case of partial credit
items) have the scoring categories modified. One of the modules included in
the field trial was dropped from the main study, one was retained for Year 10
students only and others underwent modification.
6
The fifth stage included the preparation, delivery and scoring of the main
survey. Preparation occurred from June 2011, the main survey was conducted
from 26 September to 28 November 2011, and scoring the assessments from 14
November to early December (with most being completed by 25 November).
Data files for analysis were compiled between January and February 2012.
Student background data were collected from schools and education systems
during the course of the survey with follow-up activities extending into 2012.
The sixth stage involved the analyses of data and writing of the reports for this
study. This final stage took place between February and June 2012.
Structure of the Report This report is one of the key outcomes of the NAP – ICT Literacy 2011 project. It
is meant to be used by educators and policy makers to provide a profile of ICT
Literacy at Year 6 and Year 10 across Australia. It is accompanied by a technical
report that provides more detailed information about the developmental
and analytical procedures, which provide the basis for this report. Sample
assessment modules are made available as School Release Materials and are
accompanied by scoring guides.
Following this brief introduction the report proceeds with Chapter 2 which
outlines the way in which ICT Literacy was assessed. The chapter describes
the framework, the assessment instrument, the method of delivering the
assessment and the sample that was surveyed.
Chapter 3 presents a national profile of ICT Literacy. It discusses the ICT Literacy
scale and the six proficiency levels that are used to describe the achievement
of students. It discusses the relationship of results in 2011 to those obtained
in 2008 and 2005 including measures of ICT Literacy for Year 6 and Year 10 in
2005, 2008 and 2011.
Chapter 4 describes patterns of ICT Literacy among jurisdictions and in
relation to sex, parental occupation and education, Indigenous status, language
background and geographic location.
Chapter 5 is concerned with student use of ICT at home and at school. It
includes a detailed analysis of the applications most frequently used by
students, student interest in computers and confidence in using ICT.
Chapter 6 focuses on students’ perceptions of using ICT. In particular it reports
analyses of students’ interest and enjoyment in using ICT and students’ sense
of confidence in using ICT. It also explores the relationships between these
aspects of student perceptions, their experience of and access to ICT resources
and their ICT Literacy.
Chapter 7 provides an overview of the findings and a discussion of the
implications of those findings.
7
Chapter 2 Assessing ICT Literacy
NAP – ICT Literacy 2011 was based on the assessment domain used in the two
previous assessment cycles in 2005 and 2008. As was the case in those two
previous cycles, the assessment instrument was computer-based and included
a seamless combination of simulated and authentic software applications. The
assessment as a whole was structured to be congruent with the 2005 and 2008
assessments to provide a basis for comparison with those assessments. This
chapter outlines some key features of the NAP – ICT Literacy 2011 assessment.
It contains a brief description of the assessment domain that framed the ICT
Literacy assessment without repeating the detail that was elaborated in the
report of the 2008 assessment (MCEETYA, 2010). The assessment instrument,
and the tasks incorporated in that instrument, are described with an emphasis
on the new tasks and how all the tasks embodied as much authenticity as
possible. In addition the chapter provides information on how the assessment
was delivered, making maximum possible use of school computing resources.
Finally, the chapter describes the designed and achieved sample of students
who participated in the assessment.
ICT Literacy Assessment Domain
Definition
Prior to the 2005 national assessment, the Ministerial Council on Education,
Employment, Training and Youth Affairs (MCEETYA) defined ICT as technologies
8
used for accessing, gathering, manipulation and presentation or communication
of information and adopted the following definition of ICT Literacy.
The ability of individuals to use ICT appropriately to access, manage,
integrate and evaluate information, develop new understandings, and
communicate with others in order to participate effectively in society
(MCEETYA, 2005).
This definition, which draws heavily on the Framework for ICT Literacy
developed by the International ICT Literacy Panel in 2003 and the OECD PISA
ICT Literacy Feasibility Study (International ICT Literacy Panel, 2002), was the
basis for the 2005 assessment and remained the basis for the 2008 assessment.
In addition, while ICT could be broadly defined to include a range of tools and
systems, these assessments focused primarily on the use of computers rather
than other forms of ICT.
Framework
The 2005 assessment domain envisaged ICT literacy as comprising a set of six
integrated key processes:
1. accessing information (identifying information requirements and knowing
how to find and retrieve information);
2. managing information (organising and storing information for retrieval and
reuse);
3. evaluating (reflecting on the processes used to design and construct ICT
solutions and judgements regarding the integrity, relevance and usefulness
of information);
4. developing new understandings (creating information and knowledge by
synthesising, adapting, applying, designing, inventing or authoring);
5. communicating (exchanging information by sharing knowledge and
creating information products to suit the audience, the context and the
medium); and
6. using ICT appropriately (critical, reflective and strategic ICT decisions and
considering social, legal and ethical issues).
Conceptions of progress
Any assessment is underpinned by a conception of progress in the area being
assessed. This assessment of ICT literacy was based on a hierarchy of what
students typically know and can do. It was articulated in a progress map
described in terms of levels of increasing complexity and sophistication in
using ICT. For convenience, students’ skills and understandings were described
in bands of proficiency. Each band described skills and understandings
that are progressively more demanding. The progress map is a generalised
developmental sequence that enables information on the full range of student
performance to be collected and reported. Student achievement of the different
9
ICT Literacy processes can only be demonstrated by taking into account the
communicative context, purpose and consequences of the medium. As such,
the ICT Literacy progress map was based on three “strands”: a) working with
information; b) creating and sharing information; and c) using ICT responsibly.
• In Working with Information, students progress from using key words to
retrieve information from a specified source, through identifying search
question terms and suitable sources, to using a range of specialised
sourcing tools and seeking confirmation of the credibility of information
from external sources.
• In Creating and Sharing Information, students progress from using functions
within software to edit, format, adapt and generate work for a specific
purpose, through integrating and interpreting information from multiple
sources with the selection and combination of software and tools, to using
specialised tools to control, expand and author information, producing
representations of complex phenomena.
• In Using ICT Responsibly, students progress from understanding and using
basic terminology and uses of ICT in everyday life, through recognising
responsible use of ICT in particular contexts, to understanding the impact
and influence of ICT over time and the social, economic and ethical issues
associated with its use.
In each of the strands there were six proficiency levels hypothesised. These
were not proposed as discrete steps that are discontinuous but as a means of
representing progress within each strand. The proficiency levels in each strand
are shown in Table 2.1. Sample tasks are available in the released materials
from the 2005, 2008 and 2011assessments.
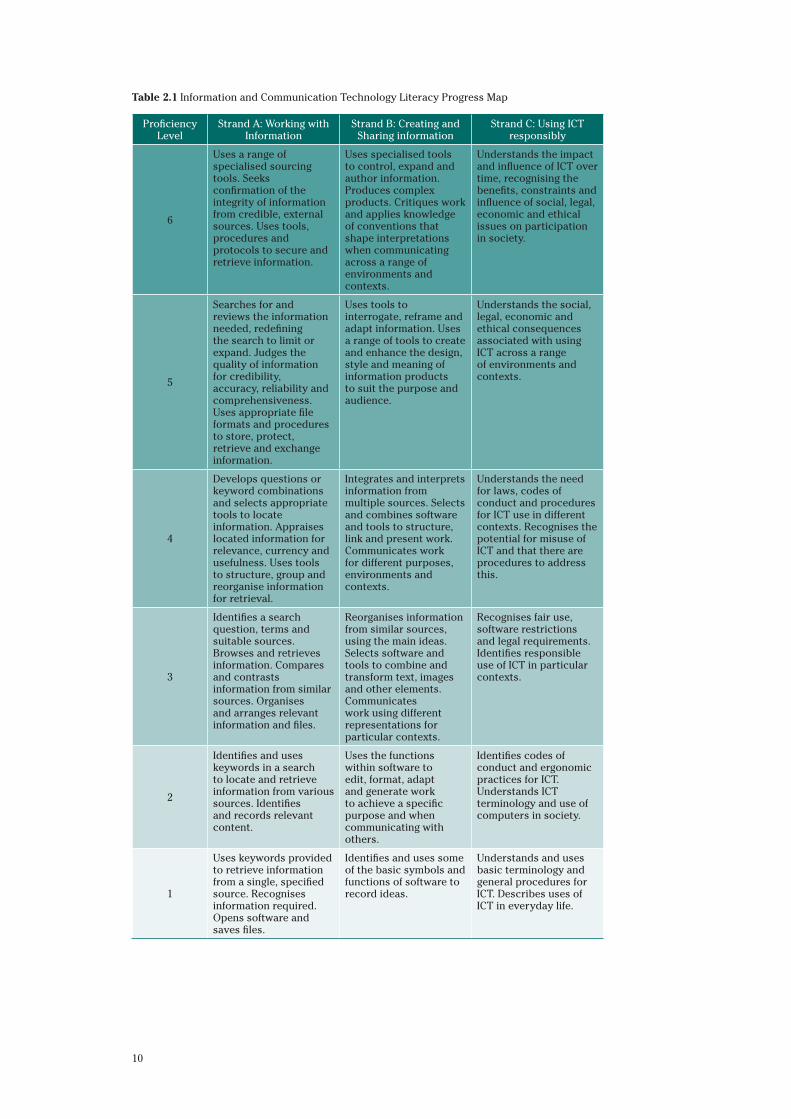
10
Table 2.1 Information and Communication Technology Literacy Progress Map
Proficiency Level
Strand A: Working with Information
Strand B: Creating and Sharing information
Strand C: Using ICT responsibly
6
Uses a range of specialised sourcing tools. Seeks confirmation of the integrity of information from credible, external sources. Uses tools, procedures and protocols to secure and retrieve information.
Uses specialised tools to control, expand and author information. Produces complex products. Critiques work and applies knowledge of conventions that shape interpretations when communicating across a range of environments and contexts.
Understands the impact and influence of ICT over time, recognising the benefits, constraints and influence of social, legal, economic and ethical issues on participation in society.
5
Searches for and reviews the information needed, redefining the search to limit or expand. Judges the quality of information for credibility, accuracy, reliability and comprehensiveness. Uses appropriate file formats and procedures to store, protect, retrieve and exchange information.
Uses tools to interrogate, reframe and adapt information. Uses a range of tools to create and enhance the design, style and meaning of information products to suit the purpose and audience.
Understands the social, legal, economic and ethical consequences associated with using ICT across a range of environments and contexts.
4
Develops questions or keyword combinations and selects appropriate tools to locate information. Appraises located information for relevance, currency and usefulness. Uses tools to structure, group and reorganise information for retrieval.
Integrates and interprets information from multiple sources. Selects and combines software and tools to structure, link and present work. Communicates work for different purposes, environments and contexts.
Understands the need for laws, codes of conduct and procedures for ICT use in different contexts. Recognises the potential for misuse of ICT and that there are procedures to address this.
3
Identifies a search question, terms and suitable sources. Browses and retrieves information. Compares and contrasts information from similar sources. Organises and arranges relevant information and files.
Reorganises information from similar sources, using the main ideas. Selects software and tools to combine and transform text, images and other elements. Communicates work using different representations for particular contexts.
Recognises fair use, software restrictions and legal requirements. Identifies responsible use of ICT in particular contexts.
2
Identifies and uses keywords in a search to locate and retrieve information from various sources. Identifies and records relevant content.
Uses the functions within software to edit, format, adapt and generate work to achieve a specific purpose and when communicating with others.
Identifies codes of conduct and ergonomic practices for ICT. Understands ICT terminology and use of computers in society.
1
Uses keywords provided to retrieve information from a single, specified source. Recognises information required. Opens software and saves files.
Identifies and uses some of the basic symbols and functions of software to record ideas.
Understands and uses basic terminology and general procedures for ICT. Describes uses of ICT in everyday life.
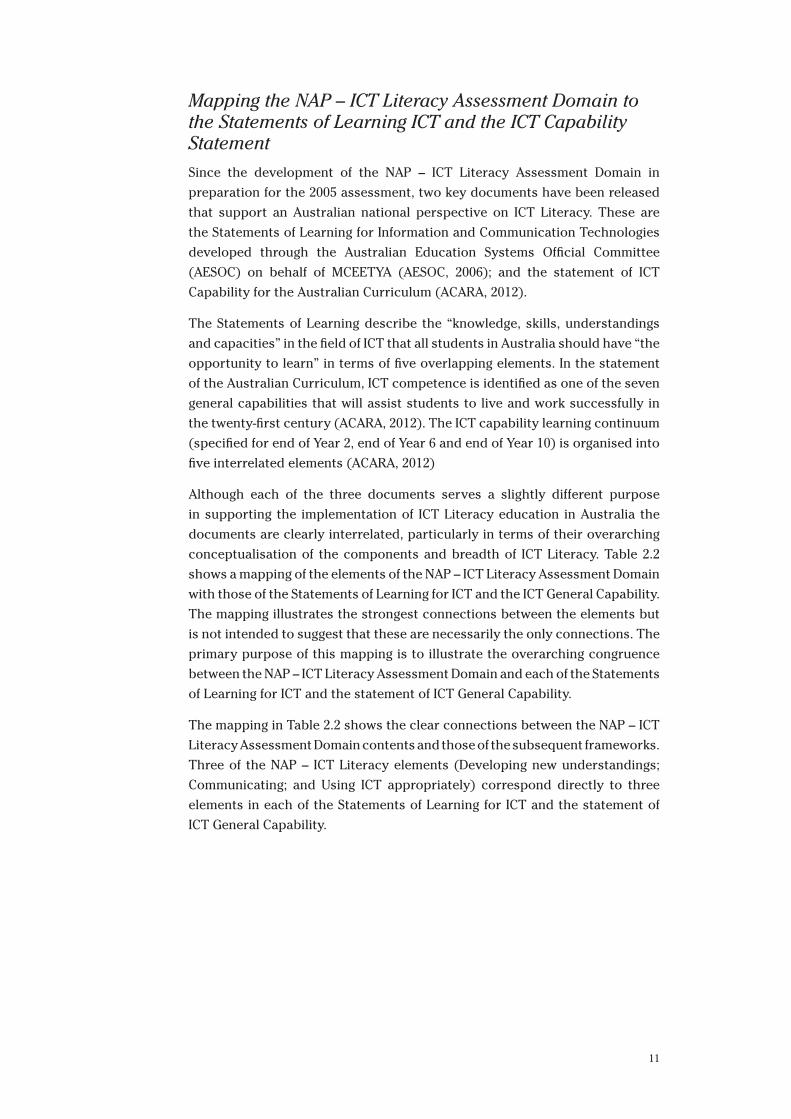
11
Mapping the NAP – ICT Literacy Assessment Domain to the Statements of Learning ICT and the ICT Capability Statement
Since the development of the NAP – ICT Literacy Assessment Domain in
preparation for the 2005 assessment, two key documents have been released
that support an Australian national perspective on ICT Literacy. These are
the Statements of Learning for Information and Communication Technologies
developed through the Australian Education Systems Official Committee
(AESOC) on behalf of MCEETYA (AESOC, 2006); and the statement of ICT
Capability for the Australian Curriculum (ACARA, 2012).
The Statements of Learning describe the “knowledge, skills, understandings
and capacities” in the field of ICT that all students in Australia should have “the
opportunity to learn” in terms of five overlapping elements. In the statement
of the Australian Curriculum, ICT competence is identified as one of the seven
general capabilities that will assist students to live and work successfully in
the twenty-first century (ACARA, 2012). The ICT capability learning continuum
(specified for end of Year 2, end of Year 6 and end of Year 10) is organised into
five interrelated elements (ACARA, 2012)
Although each of the three documents serves a slightly different purpose
in supporting the implementation of ICT Literacy education in Australia the
documents are clearly interrelated, particularly in terms of their overarching
conceptualisation of the components and breadth of ICT Literacy. Table 2.2
shows a mapping of the elements of the NAP – ICT Literacy Assessment Domain
with those of the Statements of Learning for ICT and the ICT General Capability.
The mapping illustrates the strongest connections between the elements but
is not intended to suggest that these are necessarily the only connections. The
primary purpose of this mapping is to illustrate the overarching congruence
between the NAP – ICT Literacy Assessment Domain and each of the Statements
of Learning for ICT and the statement of ICT General Capability.
The mapping in Table 2.2 shows the clear connections between the NAP – ICT
Literacy Assessment Domain contents and those of the subsequent frameworks.
Three of the NAP – ICT Literacy elements (Developing new understandings;
Communicating; and Using ICT appropriately) correspond directly to three
elements in each of the Statements of Learning for ICT and the statement of
ICT General Capability.
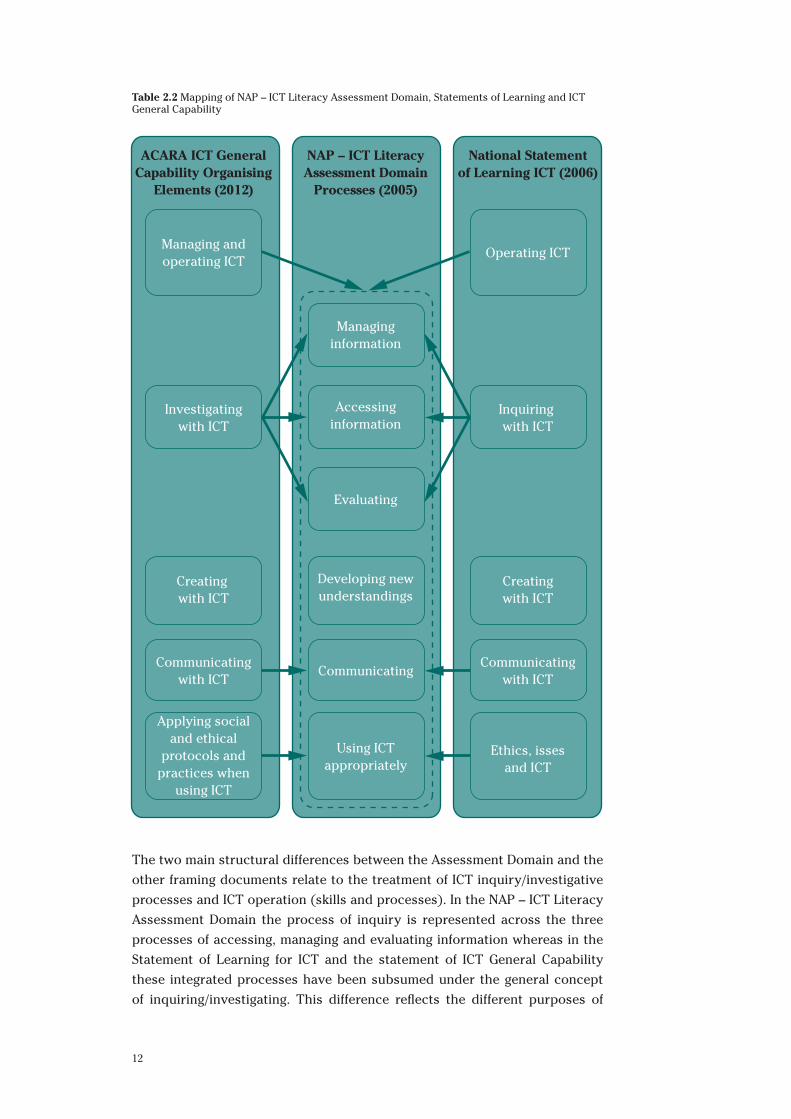
12
Table 2.2 Mapping of NAP – ICT Literacy Assessment Domain, Statements of Learning and ICT General Capability
ACARA ICT GeneralCapability Organising
Elements (2012)
NAP – ICT LiteracyAssessment Domain
Processes (2005)
Managinginformation
Accessinginformation
Evaluating
National Statementof Learning ICT (2006)
Managing andoperating ICT
Operating ICT
Investigatingwith ICT
Inquiring with ICT
Developing newunderstandings
Creating with ICT
Creatingwith ICT
CommunicatingCommunicating
with ICTCommunicating
with ICT
Using ICTappropriately
Applying socialand ethical
protocols andpractices when
using ICT
Ethics, issesand ICT
The two main structural differences between the Assessment Domain and the
other framing documents relate to the treatment of ICT inquiry/investigative
processes and ICT operation (skills and processes). In the NAP – ICT Literacy
Assessment Domain the process of inquiry is represented across the three
processes of accessing, managing and evaluating information whereas in the
Statement of Learning for ICT and the statement of ICT General Capability
these integrated processes have been subsumed under the general concept
of inquiring/investigating. This difference reflects the different purposes of
13
the documents. The Statement of Learning for ICT and the statement of ICT
General Capability have a focus on curriculum implementation that supports
an integration of the processes of accessing, evaluating and managing
information. However, a purpose of the Assessment Domain is to provide a
framework for the development of assessment tasks and items that target each
of these components and represent them as discrete elements. This aspect of
the Assessment Domain underpins the processes of assessment design and
reporting that are central to the National Assessment Program.
The Statement of Learning for ICT and the statement of ICT General Capability
each also describe a discrete element relating to operating (and managing)
ICT. While there are some differences in the elaborations of these between
the two documents, their general essence relates to the application of
technical knowledge and skills to work with information. This concept is
the global unifier across the NAP – ICT Literacy Assessment Domain and
this has been represented using the dotted line around the elements of the
Assessment Domain shown in Table 2.2. All the tasks in the NAP – ICT Literacy
assessment instrument require students to demonstrate operational skills and
understandings. Because the test is an authentic representation of ICT use,
the global theme of ICT operation is embedded in each task and is inferred
across all aspects of student performance. In the case of the NAP – ICT Literacy
Assessment Domain, the inclusion of an overarching element relating to
operational use would be redundant because of the nature of the assessment
program whereas in the Statement of Learning for ICT and the statement of ICT
General Capability it is of course an essential component to inform curriculum.
In summary, the elements of ICT learning specified in the ICT Capability
Statement in the Australian Curriculum and the Statements of Learning for ICT
were consistent with the elements for assessment described in the NAP – ICT
Literacy Assessment Domain. Differences of structure across the documents
reflect their different primary purposes to inform assessment (in the case
of the Assessment Domain) or curriculum (in the case of the Statements of
Learning for ICT and the statement of ICT Capability).
Assessment Instrument
Design
The assessment instrument used in NAP – ICT Literacy 2011 was based on
the design principles established for NAP – ICT Literacy 2005. The assessment
instrument consisted of seven discrete test modules each of which could be
completed in a maximum of 20 minutes (controlled by the testing software).
Each module followed a linear narrative sequence designed to reflect students’
typical ‘real world’ use of ICT. The modules included a range of school-based
and out-of-school-based themes.
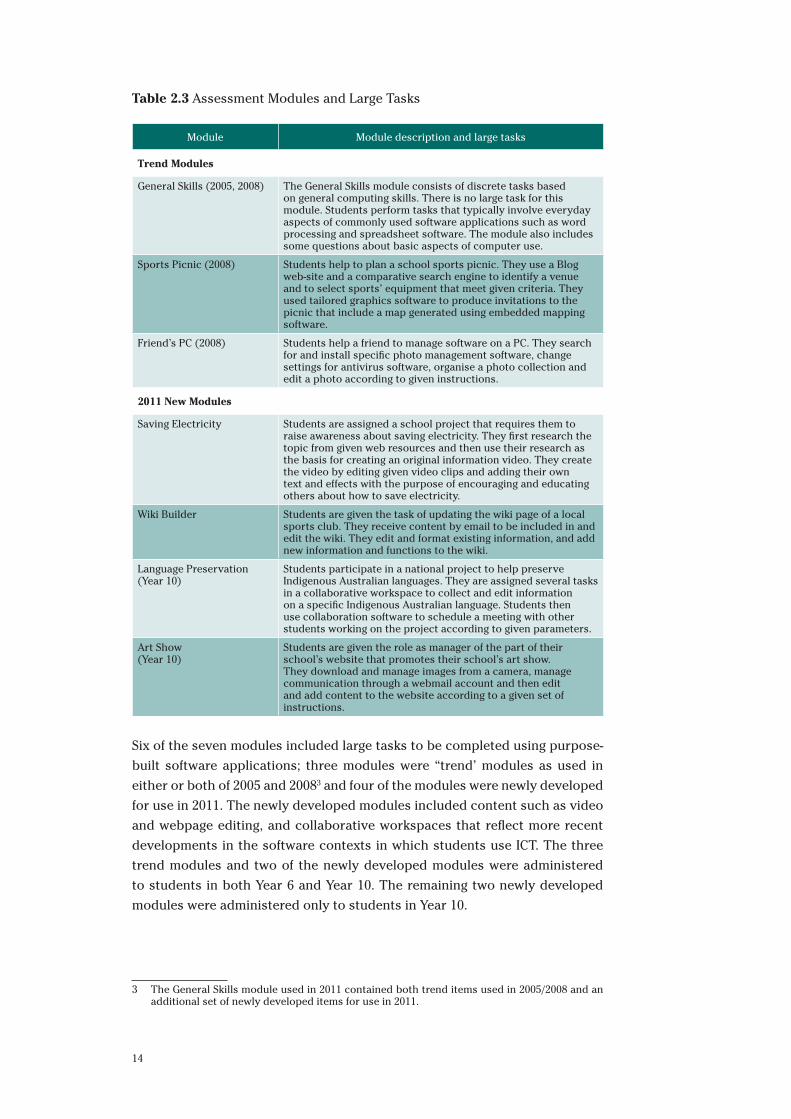
14
Table 2.3 Assessment Modules and Large Tasks
Module Module description and large tasks
Trend Modules
General Skills (2005, 2008) The General Skills module consists of discrete tasks based on general computing skills. There is no large task for this module. Students perform tasks that typically involve everyday aspects of commonly used software applications such as word processing and spreadsheet software. The module also includes some questions about basic aspects of computer use.
Sports Picnic (2008) Students help to plan a school sports picnic. They use a Blog web-site and a comparative search engine to identify a venue and to select sports’ equipment that meet given criteria. They used tailored graphics software to produce invitations to the picnic that include a map generated using embedded mapping software.
Friend’s PC (2008) Students help a friend to manage software on a PC. They search for and install specific photo management software, change settings for antivirus software, organise a photo collection and edit a photo according to given instructions.
2011 New Modules
Saving Electricity Students are assigned a school project that requires them to raise awareness about saving electricity. They first research the topic from given web resources and then use their research as the basis for creating an original information video. They create the video by editing given video clips and adding their own text and effects with the purpose of encouraging and educating others about how to save electricity.
Wiki Builder Students are given the task of updating the wiki page of a local sports club. They receive content by email to be included in and edit the wiki. They edit and format existing information, and add new information and functions to the wiki.
Language Preservation (Year 10)
Students participate in a national project to help preserve Indigenous Australian languages. They are assigned several tasks in a collaborative workspace to collect and edit information on a specific Indigenous Australian language. Students then use collaboration software to schedule a meeting with other students working on the project according to given parameters.
Art Show (Year 10)
Students are given the role as manager of the part of their school’s website that promotes their school’s art show. They download and manage images from a camera, manage communication through a webmail account and then edit and add content to the website according to a given set of instructions.
Six of the seven modules included large tasks to be completed using purpose-
built software applications; three modules were “trend’ modules as used in
either or both of 2005 and 20083 and four of the modules were newly developed
for use in 2011. The newly developed modules included content such as video
and webpage editing, and collaborative workspaces that reflect more recent
developments in the software contexts in which students use ICT. The three
trend modules and two of the newly developed modules were administered
to students in both Year 6 and Year 10. The remaining two newly developed
modules were administered only to students in Year 10.
3 The General Skills module used in 2011 contained both trend items used in 2005/2008 and an additional set of newly developed items for use in 2011.
15
Each student was administered two trend and two new modules appropriate
to their year level. The modules were randomly assigned to the students. The
themes of the modules and their associated large tasks are summarised in
Table 2.3.
Trend modules: A basis for measuring change
The three trend modules – General Skills, Sports Picnic and Friends PC – were
included in the 2011 instrument to enable direct comparisons between the
performance of students in 2011 with those of previous cycles of NAP – ICT
Literacy. The modules were chosen on the basis that their contents have
remained relevant over time and that the student data in response to the tasks
was empirically comparable with the data provided by students across their
previous administrations (see the Technical Report for more detail of these
empirical analyses).
The General Skills module was developed for NAP – ICT Literacy 2005 as a
“gatepost” test of basic ICT skills and was completed as the first module by all
students. In 2005 it was used to direct a very small proportion of students to
the two easiest remaining test modules. The module comprised a set of basic
computing skills tasks and was very easy for the vast majority of students in
both Years 6 and 10. Despite this, the module provided robust data over the
cycles of NAP – ICT Literacy and it was retained in 2008 although no longer as a
gatepost test. In 2011, the module was augmented by a set of newly developed
items with the dual purposes of increasing the length of the module to match
the other six and to increase the overall difficulty of this module. The newly
developed items related to the manipulation of data in a spreadsheet to
support the generation of graphs. These questions proved to be challenging
for the students at both year levels.
The Sports Picnic and Friend’s PC modules were developed for use in the 2008
assessment. The Sport’s Picnic module reflects the development during the
middle part of the decade of web-based communication devices such as Blogs,
web-based databases that could sort and filter information and web-based
mapping software. The large task in the Sports Picnic module required students
to make use of given information and an unfamiliar piece of design software
(that made use of conventional software features) to create an invitation for a
specified purpose and audience.
The Friend’s PC module had a focus on software skills reliant on knowledge
and application of software and interface design conventions. Students were
required to complete a series of technical tasks relating to setting up software
on a computer and finally make use of a piece of image editing software to
make specified changes to an image.
16
New modules: providing for changes in ICT
The newly developed modules for use in 2011 were designed to ensure that the
full breadth and range of the assessment domain were represented in the NAP –
ICT Literacy test instrument with a focus on ensuring that the modules referenced
more recent developments in the types of software students could be expected
to be using. In consultation with the NAP – ICT Literacy Review Committee it
was decided that one module should include a large task containing complex
multimedia (video) content. Although it would have been technically feasible
to use audio content as well as (or instead of) video, the practical challenges
associated with delivering audio-based national assessments using school
computer resources precluded audio from being included in the test modules.
The four newly developed modules were: Saving Electricity; Wiki Builder;
Language Preservation; and Art Show.
Two of the modules, Language Preservation and Saving Electricity, had a focus
on investigation. In Saving Electricity, students in Years 6 and 10 were first
required to make use of note-taking software to select (on the basis of credibility
and usefulness) information from a set of web-based resources. Students were
then required to make use of this information to create an information video by
editing existing footage and adding their own captions and effects. In Language
Preservation (Year 10 only) students were required to make use of a range
of web-based tools (including collaboration software) to collect and correct
information before scheduling a web-based meeting with their ‘collaborators’.
Language Preservation was used only at Year 10 because of the conceptual
sophistication and reading level of the module content.
The Wiki Builder (Years 6 and 10 students) and Art Show (Year 10 students only)
modules required students to play the role of content manager for web-based
resources. The focus on these modules related to students’ decision-making
around the selection and inclusion of appropriate content and the technical
processes of adding content to web-based resources using software that reflected
standard design interface conventions. The Wiki Builder module was suitable
for use at both year levels because it provided scaffolding for students in the
information management tasks and more importantly in the large task of editing
the Wiki. The large task was primarily a technical task to meet a set of design
specifications. By contrast, the Art Show module, used only at Year 10, typically
included a more open set of tasks relating to the decisions around appropriateness
of content and the final design and construction of the web-page.
17
Delivery Methods
Assessment system
The software developed by SoNET systems contained all the assessment
modules and a management system that confirmed the identity of the selected
student, asked basic registration information, assigned each student to four
modules appropriate to their year level and collected responses to a student
questionnaire. In 2011 this was delivered to students using USB sticks (one
per student). The testing software itself was entirely web-based and could
be delivered using the internet. The USB delivery method was employed to
account for variations in school-based internet connectivity and computing
resources which meant that internet delivery of the instruments could not
guarantee that each student would have an equivalent test-taking experience4.
The lack of dependence on internet delivery also allowed for multimedia video
to be included in the test instrument (by removing concerns over connection
speeds) and minimised the setup required at schools (e.g. through network
security and installation of uniform browser types).
A different back-end delivery software system has been used in each of the three
cycles of NAP – ICT Literacy. Despite this, the on-screen environment experienced
by the student has remained consistent throughout. The student screen had three
main sections: a surrounding border of test-taking information and navigation
facilities; a central information section that could house stimulus materials for
students to read or (simulated or live) software applications; and a lower section
containing the instructional and interrogative text of the assessment items and
the response areas for multiple-choice and constructed response items. The
assessment items were presented in a linear sequence to students. Students were
not permitted to return to previously completed items because, in some cases,
later items in a sequence provide clues or even answers to earlier items.
The administration for each student involved completing a tutorial of ten minutes
(which provided an introduction to the system and practice questions), four
test modules each of 20 minutes duration and the student questionnaire of ten
minutes. There was provision for four five-minute breaks between test modules.
Flexible delivery
Special provisions were made as part of NAP – ICT Literacy 2011 for eight
schools in very remote locations. These provisions were made to take account
of the distances involved in accessing these schools, to better target the
instrument and to provide opportunity for higher participation rates. The
provisions include the modifications to the assessment and modifications to
the method of administration.
4 The NAP – ICT Literacy data require students to have the same test-taking experiences (speed, screen display, time allowed etc.) in order to support use of the data for the purpose of comparing student achievement within and across the assessment cycles.
18
In the assessment instrument the number of modules to be completed by each
student was reduced from four to three and the timer was removed from the
application to allow students additional time to complete the tasks5. In addition
the teacher was permitted to read the instructions and questions to students
(similar to the provision in the regular delivery for test administrators to read
instructions and questions to students requiring support).
The main change to the administration of the assessment was that teachers,
rather than test administrators, administer the assessment. Teachers were trained
using a video, telephone and written materials and a helpdesk was maintained
for these schools and teachers. The USB drives containing the assessment
softwares were posted to the schools, the results of the assessment were saved
directly to the USB drives and the drive was returned by post. Teachers were
able to administer the assessment to small groups of students or to individuals
when it was possible and appropriate over a period of several weeks.
Sample The samples were designed and implemented so that estimates of ICT Literacy
representative of the Year 6 and Year 10 populations in Australia, as well as for
States and Territories and designated sub-groups at a national level, could be
generated.
Sample design
The sampling procedure followed the cluster sampling procedures established
for national sample surveys conducted by the Performance Measurement
and Reporting Taskforce (Murphy & Schulz, 2006). Cluster sampling is cost-
effective because a group of students from the same school can be surveyed
at the same time, rather than possibly just one or two students if a simple
random sample of students from the population were to be drawn. Sampling
involves a two-stage process to ensure that each eligible student has an equal
chance of being selected in the sample. Compared to the NAP – ICTL survey
conducted in 2008 the sample size in 2011 was increased so as to provide a
higher level of precision (i.e. smaller confidence intervals).
Sampling process
In the first stage of sampling, schools were selected from a list of all schools
in each State or Territory with a probability proportional to the number of
students in the relevant Year level enrolled at that school. The list of schools
was stratified by a number of characteristics to ensure that the sample was
5 Reducing the number of modules did not impact on the validity of the data because there were sufficient tasks to provide estimates on the same ICTL scale. Additional time may have had a very small impact for this small number (22) of students but the tests were designed to be completed well within the allotted time by most students.
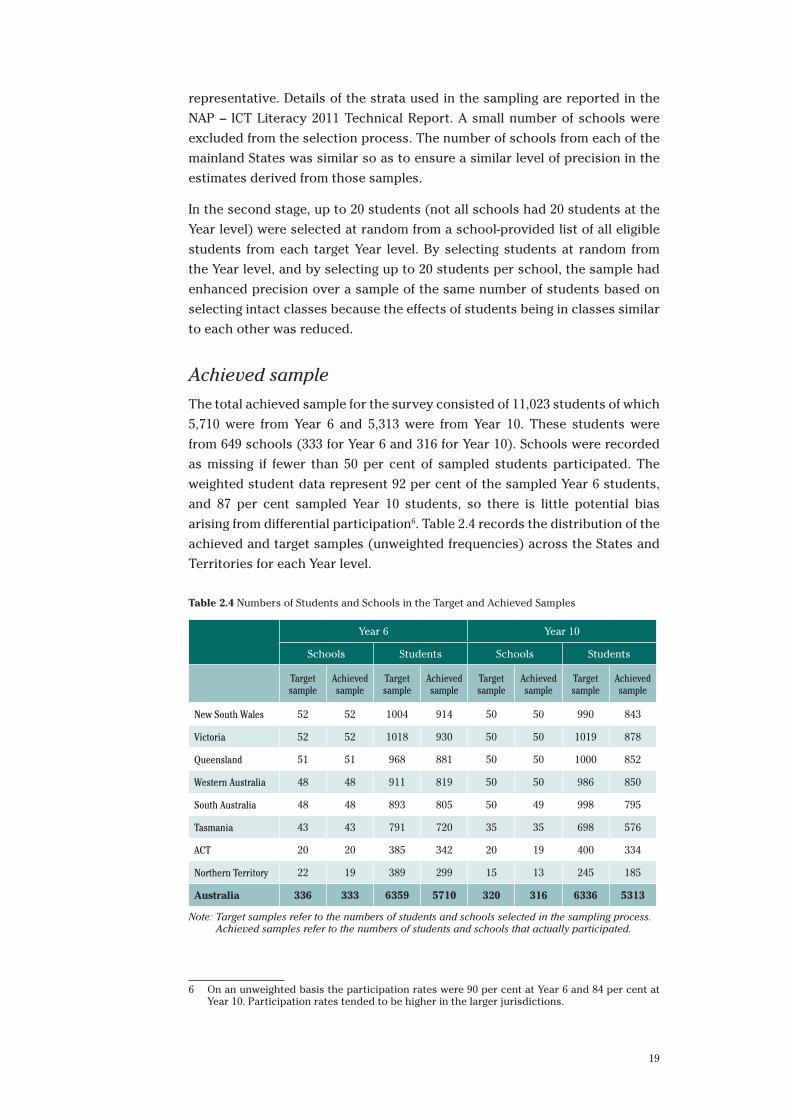
19
representative. Details of the strata used in the sampling are reported in the
NAP – ICT Literacy 2011 Technical Report. A small number of schools were
excluded from the selection process. The number of schools from each of the
mainland States was similar so as to ensure a similar level of precision in the
estimates derived from those samples.
In the second stage, up to 20 students (not all schools had 20 students at the
Year level) were selected at random from a school-provided list of all eligible
students from each target Year level. By selecting students at random from
the Year level, and by selecting up to 20 students per school, the sample had
enhanced precision over a sample of the same number of students based on
selecting intact classes because the effects of students being in classes similar
to each other was reduced.
Achieved sample
The total achieved sample for the survey consisted of 11,023 students of which
5,710 were from Year 6 and 5,313 were from Year 10. These students were
from 649 schools (333 for Year 6 and 316 for Year 10). Schools were recorded
as missing if fewer than 50 per cent of sampled students participated. The
weighted student data represent 92 per cent of the sampled Year 6 students,
and 87 per cent sampled Year 10 students, so there is little potential bias
arising from differential participation6. Table 2.4 records the distribution of the
achieved and target samples (unweighted frequencies) across the States and
Territories for each Year level.
Table 2.4 Numbers of Students and Schools in the Target and Achieved Samples
Year 6 Year 10
Schools Students Schools Students
Target sample
Achieved sample
Target sample
Achieved sample
Target sample
Achieved sample
Target sample
Achieved sample
New South Wales 52 52 1004 914 50 50 990 843
Victoria 52 52 1018 930 50 50 1019 878
Queensland 51 51 968 881 50 50 1000 852
Western Australia 48 48 911 819 50 50 986 850
South Australia 48 48 893 805 50 49 998 795
Tasmania 43 43 791 720 35 35 698 576
ACT 20 20 385 342 20 19 400 334
Northern Territory 22 19 389 299 15 13 245 185
Australia 336 333 6359 5710 320 316 6336 5313
Note: Target samples refer to the numbers of students and schools selected in the sampling process. Achieved samples refer to the numbers of students and schools that actually participated.
6 On an unweighted basis the participation rates were 90 per cent at Year 6 and 84 per cent at Year 10. Participation rates tended to be higher in the larger jurisdictions.
20
The average achieved cluster size was 17 students per school. The achieved
cluster size was less than 20 because some schools had fewer than 20 students
at the Year level and some Year 10 students were unavailable for the assessment
due to absence or having left school for the year (although return visits were
made to a number of schools to assess absentees).
Details of the social and demographic characteristics of students in the
sample are recorded in Table 2.5. Missing data is an issue when data regarding
background characteristics are gathered on the basis of information supplied by
parents through schools or school systems. Missing data for all characteristics
except parental education and occupation are 10 per cent or less. For parental
education and occupation data were missing for approximately 22 per cent of
students. The level of missing data for parental education and occupation is
similar to the levels reported in NAP – CC 2010 (where the levels were 22 and
17 per cent for parental occupation at Years 6 and 10 respectively and 21 and
17 per cent for parental education).
Calculating the precision of estimates
For any survey there is a level of uncertainty regarding the extent to which
an estimate measured from the sample of students is the same as the true
value of the parameter for the population. An estimate derived from a sample
is subject to uncertainty because the sample may not reflect the population
precisely. If a statistic was estimated from different samples drawn from the
same population of students the observed values for the statistic would vary
from sample to sample. The extent to which this variation exists is expressed
as the confidence interval. The 95 per cent confidence interval is the range
within which the estimate of the statistic based on repeated sampling would
be expected to fall for 95 of 100 samples that might have been drawn. The
survey sample design in this study involves clustering, stratification, and
disproportionate allocation, which mean that it is not appropriate to use
the estimates of confidence intervals through standard software procedures
because these generally assume a simple random sample and will therefore
underestimate the real confidence intervals. The estimates of confidence
intervals in this report are based on ‘Jack-knife’ replication methods. In
replication methods a series of sub-samples is derived from the full sample,
and the statistic of interest is generated for each sub-sample. The variance
is then estimated by calculating the variability in the estimate between these
sub samples. This technique generates an estimate of the standard error of the
estimate and the confidence interval is 1.96 times the standard error. Further
details are provided in the NAP – ICT Literacy 2011 Technical Report.
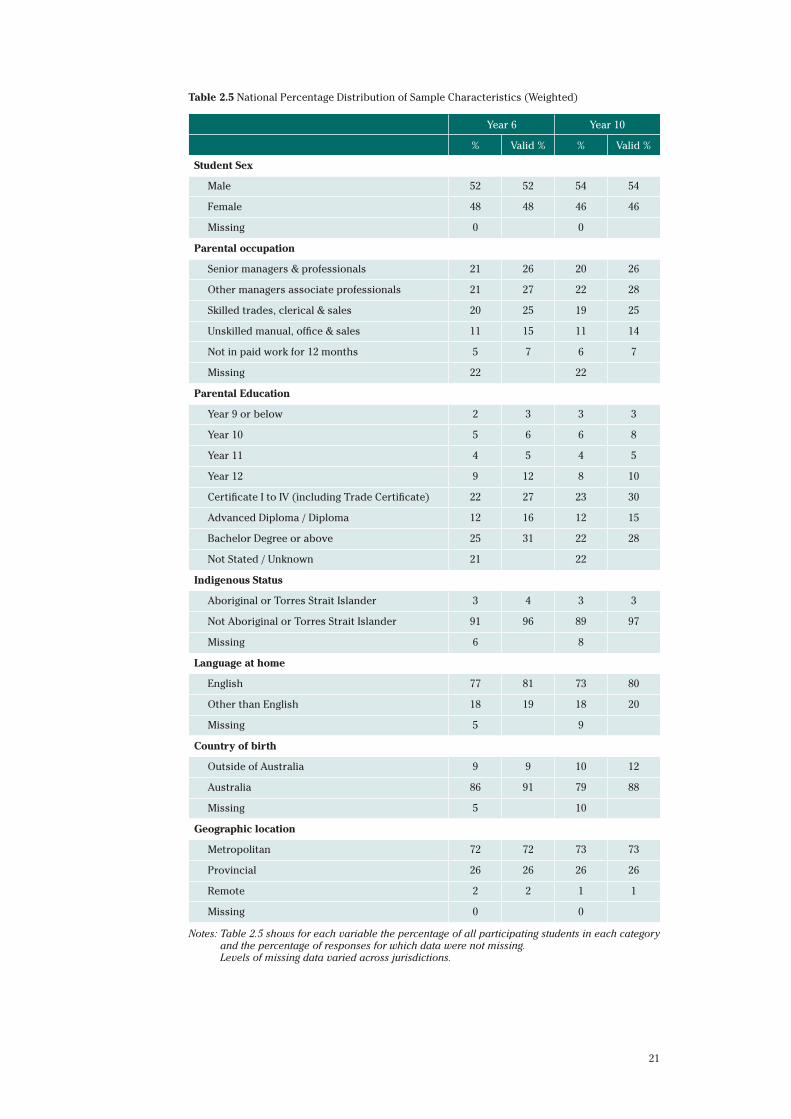
21
Table 2.5 National Percentage Distribution of Sample Characteristics (Weighted)
Year 6 Year 10
% Valid % % Valid %
Student Sex
Male 52 52 54 54
Female 48 48 46 46
Missing 0 0
Parental occupation
Senior managers & professionals 21 26 20 26
Other managers associate professionals 21 27 22 28
Skilled trades, clerical & sales 20 25 19 25
Unskilled manual, office & sales 11 15 11 14
Not in paid work for 12 months 5 7 6 7
Missing 22 22
Parental Education
Year 9 or below 2 3 3 3
Year 10 5 6 6 8
Year 11 4 5 4 5
Year 12 9 12 8 10
Certificate I to IV (including Trade Certificate) 22 27 23 30
Advanced Diploma / Diploma 12 16 12 15
Bachelor Degree or above 25 31 22 28
Not Stated / Unknown 21 22
Indigenous Status
Aboriginal or Torres Strait Islander 3 4 3 3
Not Aboriginal or Torres Strait Islander 91 96 89 97
Missing 6 8
Language at home
English 77 81 73 80
Other than English 18 19 18 20
Missing 5 9
Country of birth
Outside of Australia 9 9 10 12
Australia 86 91 79 88
Missing 5 10
Geographic location
Metropolitan 72 72 73 73
Provincial 26 26 26 26
Remote 2 2 1 1
Missing 0 0
Notes: Table 2.5 shows for each variable the percentage of all participating students in each category and the percentage of responses for which data were not missing. Levels of missing data varied across jurisdictions.
22
Estimating the significance of differences
When appropriate, differences in means were tested for significance. This
was done to avoid reporting differences that were only the result of random
fluctuations due to the process of sampling. Statistical significance refers to
the likelihood of a difference being the result of chance rather than a true
reflection of the measured outcomes. Significance tests make use of the
standard error of the difference instead of simply reviewing possible overlap
between confidence intervals because even in case of overlap differences
might still be statistically significant. Throughout this report differences are
stated to be statistically significant if there is a 95 per cent probability that the
difference is a true difference that did not arise from sampling or measurement
error.
The size of differences
In large samples it is possible that relatively small differences are statistically
significant even if the differences themselves have little importance. Another
way of looking at differences is to consider the effect size. Effect size is useful
when considering the differences between measured scores (such as NAP –
ICT Literacy scores or questionnaire scale scores) across groups. Effect size
provides a comparison of the difference in average scores between two groups
with reference to the degree to which the scores vary within the groups. When
the effect size is large it means that the difference between average scores
is large relative to the spread of the scores, and is therefore ‘important’.
Conversely, when the effect size is small, it means that that the observed
difference is relatively small compared to the spread of the scores and arguably
less ‘important’.
The effect size is the difference between group means divided by the standard
deviation. These values can be classified as small, moderate or large. When
first proposed an effect size of 0.2 was considered small (average growth in one
year), an effect size of 0.5 was considered moderate and 0.8 as large (Cohen,
1969). However, following the conventions that have developed in research
and measurement, the precedent of NAP – CC10 and the spread of significant
mean differences in NAP – ICT Literacy, this report has adopted the following
categories as descriptors: 0.1 is regarded a small effect, 0.3 a moderate effect
and 0.5 a large effect. Descriptors relating score point differences to standard
deviations are used in the report when informative.
For the NAP – ICT Literacy scale, the approximate difference in performance
between Year 6 and Year 10 students is between 120 and 150 points depending
on the cycle. Consequently, given the Year 6 standard deviation from 2005 of
100 score points, a moderate effect on the NAP – ICT Literacy scale roughly
corresponds to the average growth in one school year or 30 scale points. For
the questionnaire scales a moderate effect is roughly three scale points given
that the Year 6 standard deviation was set at 10 score points.
23
AdministrationSo as to ensure the smooth operation of the system and to assure data quality,
test administrators travelled to each school with sets of USB drives to be used
with school computers to administer the assessment. Each administrator also
had one notebook computer, with wireless internet connection through the
NextG network, available for management of the assessment and uploading
data at the end of the session. In 13 per cent of schools with Year 6 students
and 11 per cent of schools with Year 10 students it was necessary to provide
sets of ten laptop computers for the test administration.
The assessment was usually administered to groups of ten students in two
testing sessions during the school day. In some schools it was possible to
have 20 students complete the assessment in one session. Students sampled
for the assessment were withdrawn from regular classes and completed the
assessment in a designated area of the school where the computer equipment
was located. The administration took place between 26 September and 28
November 2011 with the peak activity being between mid-October and early
November. For eight very remote schools using the flexible delivery option
there was a wide period, rather than a fixed time, for administration.
SummaryThe NAP – ICT Literacy 2011 assessment was developed to reflect ongoing
changes in technologies and in national and international conceptualisations
of ICT-related literacies without compromising its essential link to the two
previous cycles of NAP – ICT Literacy. The assessment domain that underpins
NAP – ICT Literacy is congruent with the Statements of Learning for Information
and Communication Technologies and the statement of ICT Capability for the
Australian Curriculum, which are two more recently developed documents
that guide Australian national perspectives on ICT – Literacy teaching and
learning.
The assessment was designed so that there was a core of three modules that
had been used in previous cycles of NAP – ICT Literacy and four new modules
developed for inclusion in 2011. This design enables the measurement of
changes in ICT Literacy over the three cycles of NAP – ICT Literacy as well as
to allow the assessment to take account of new developments in ICT software,
hardware and use. In 2011 the assessment was administered using USB sticks
to maintain measurement equivalence across students although the software
itself is web-based and could be delivered using the internet.
The total achieved sample for the survey consisted of 11,023 students of which
5,710 were from Year 6 and 5,313 were from Year 10. These students were from
649 schools (333 for Year 6 and 316 for Year 10). These numbers represent
92 per cent of the sampled Year 6 students and 87 per cent sampled Year 10

24
students so there is little potential bias arising from differential participation.
Table 2.4 records the distribution of the achieved sample (in unweighted
frequencies) across the States and Territories for each Year level.
25
Chapter 3 A National Profile of ICT Literacy
This chapter first describes the development of the NAP – ICT Literacy Scale
followed by discussion of student achievement on this scale at the national
level. It then uses example items taken from the 2011 test to illustrate the
different levels of proficiency described on the scale.
Developing the ICT Literacy ScaleThe NAP – ICT Literacy Scale was established in 2005 on the basis of the test
contents and psychometric data collected during the inaugural NAP – ICT
Literacy assessment. The scale comprises six proficiency levels that are used
to describe the achievement of students both at Year 6 and Year 10.
The empirical scale
The Rasch Item Response Theory (IRT) model was used to establish the
empirical component of the scale. This is the same model that has also been
used to establish the empirical scales in the National Assessment Program
– Science Literacy, Civics and Citizenship (NAP – CC), and in the National
Assessment Program – Literacy and Numeracy (NAPLAN). More information
about the scaling model and procedures is provided in the NAP – ICT Literacy
2011 Technical Report.
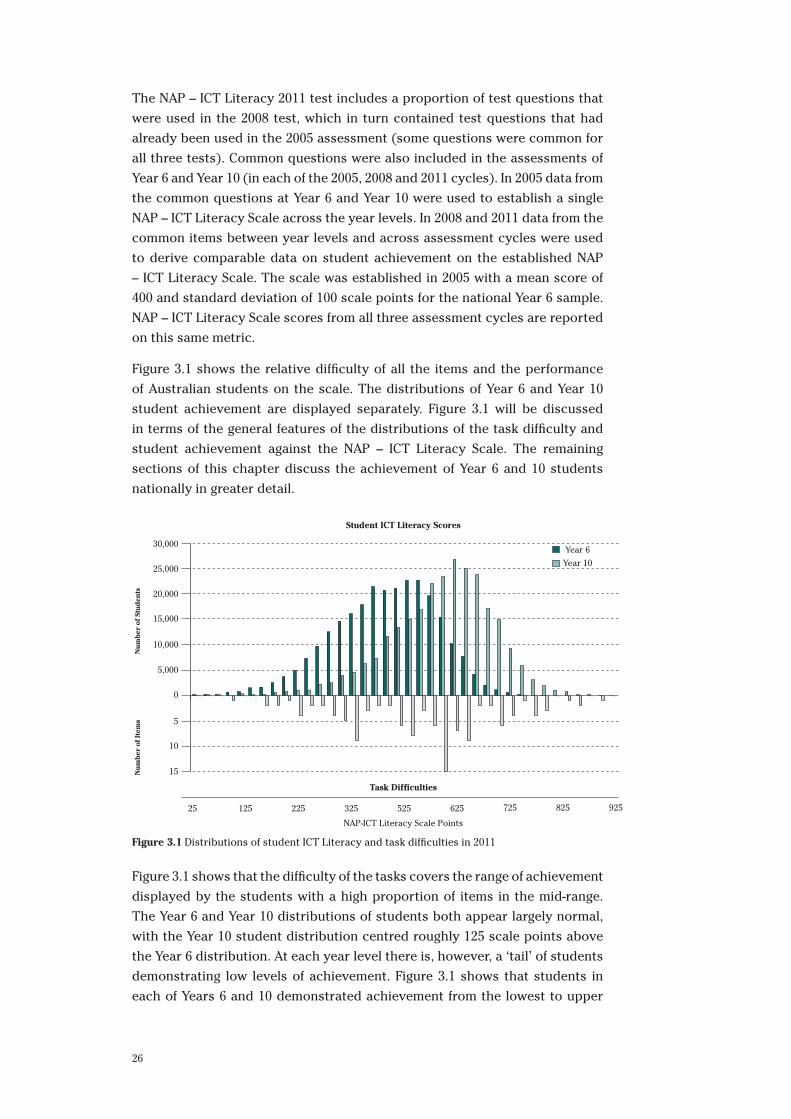
26
The NAP – ICT Literacy 2011 test includes a proportion of test questions that
were used in the 2008 test, which in turn contained test questions that had
already been used in the 2005 assessment (some questions were common for
all three tests). Common questions were also included in the assessments of
Year 6 and Year 10 (in each of the 2005, 2008 and 2011 cycles). In 2005 data from
the common questions at Year 6 and Year 10 were used to establish a single
NAP – ICT Literacy Scale across the year levels. In 2008 and 2011 data from the
common items between year levels and across assessment cycles were used
to derive comparable data on student achievement on the established NAP
– ICT Literacy Scale. The scale was established in 2005 with a mean score of
400 and standard deviation of 100 scale points for the national Year 6 sample.
NAP – ICT Literacy Scale scores from all three assessment cycles are reported
on this same metric.
Figure 3.1 shows the relative difficulty of all the items and the performance
of Australian students on the scale. The distributions of Year 6 and Year 10
student achievement are displayed separately. Figure 3.1 will be discussed
in terms of the general features of the distributions of the task difficulty and
student achievement against the NAP – ICT Literacy Scale. The remaining
sections of this chapter discuss the achievement of Year 6 and 10 students
nationally in greater detail.
92582572562552532522512525
0
5,000
10,000
20,000
25,000
30,000
NAP-ICT Literacy Scale Points
Nu
mb
er o
f St
ud
ents
Nu
mb
er o
f It
ems
15,000
5
10
15
Student ICT Literacy Scores
Task Difficulties
Year 6
Year 10
Figure 3.1 Distributions of student ICT Literacy and task difficulties in 2011
Figure 3.1 shows that the difficulty of the tasks covers the range of achievement
displayed by the students with a high proportion of items in the mid-range.
The Year 6 and Year 10 distributions of students both appear largely normal,
with the Year 10 student distribution centred roughly 125 scale points above
the Year 6 distribution. At each year level there is, however, a ‘tail’ of students
demonstrating low levels of achievement. Figure 3.1 shows that students in
each of Years 6 and 10 demonstrated achievement from the lowest to upper
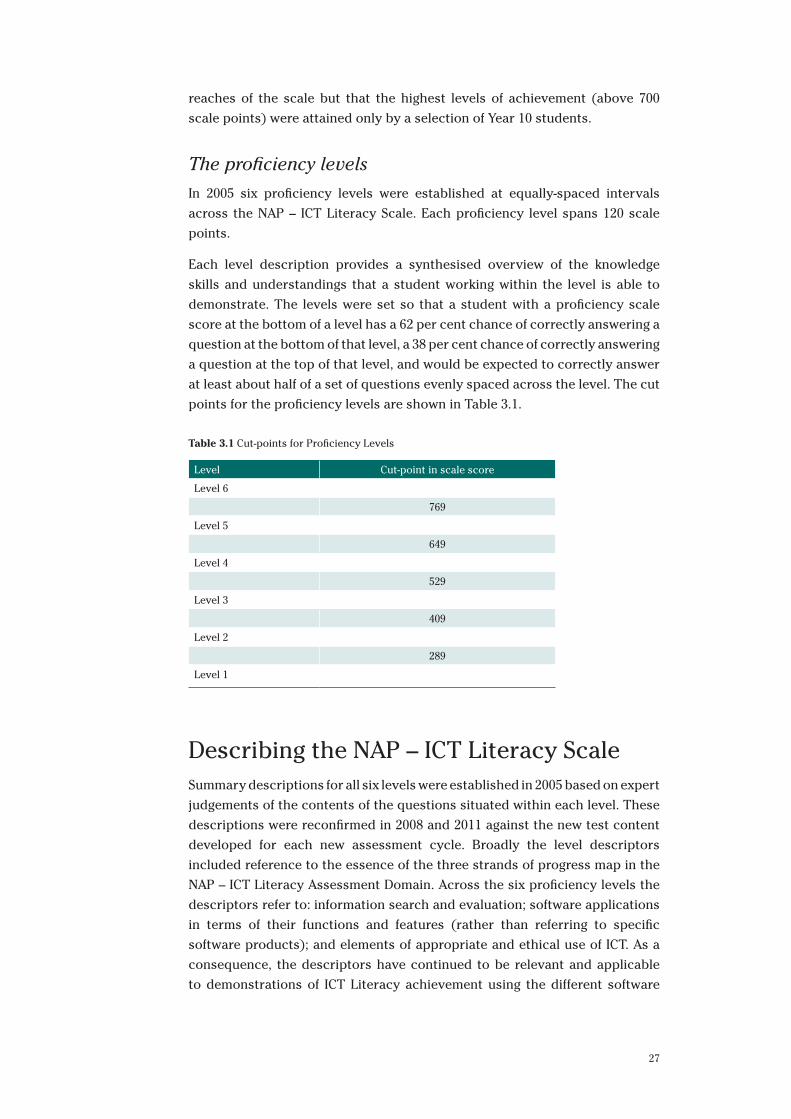
27
reaches of the scale but that the highest levels of achievement (above 700
scale points) were attained only by a selection of Year 10 students.
The proficiency levels
In 2005 six proficiency levels were established at equally-spaced intervals
across the NAP – ICT Literacy Scale. Each proficiency level spans 120 scale
points.
Each level description provides a synthesised overview of the knowledge
skills and understandings that a student working within the level is able to
demonstrate. The levels were set so that a student with a proficiency scale
score at the bottom of a level has a 62 per cent chance of correctly answering a
question at the bottom of that level, a 38 per cent chance of correctly answering
a question at the top of that level, and would be expected to correctly answer
at least about half of a set of questions evenly spaced across the level. The cut
points for the proficiency levels are shown in Table 3.1.
Table 3.1 Cut-points for Proficiency Levels
Level Cut-point in scale score
Level 6
769
Level 5
649
Level 4
529
Level 3
409
Level 2
289
Level 1
Describing the NAP – ICT Literacy ScaleSummary descriptions for all six levels were established in 2005 based on expert
judgements of the contents of the questions situated within each level. These
descriptions were reconfirmed in 2008 and 2011 against the new test content
developed for each new assessment cycle. Broadly the level descriptors
included reference to the essence of the three strands of progress map in the
NAP – ICT Literacy Assessment Domain. Across the six proficiency levels the
descriptors refer to: information search and evaluation; software applications
in terms of their functions and features (rather than referring to specific
software products); and elements of appropriate and ethical use of ICT. As a
consequence, the descriptors have continued to be relevant and applicable
to demonstrations of ICT Literacy achievement using the different software
28
contexts that have evolved over the three cycles of NAP – ICT Literacy. The
assessment modules, and the tasks those modules contain, were updated to
reflect new software contexts and applications but the underlying construct
has remained constant. This principle is followed in most assessment studies
that extend over several cycles and are concerned with measuring change. It is
accepted that changes in methods and content are necessary for assessments
to remain relevant but that maintaining the meaning of the construct is a
necessary condition for measuring change (von Davier & Mazzeo 2009).
The NAP – ICT Literacy scale represents a hierarchy of the knowledge, skills
and understanding included in the construct of ICT Literacy. Overall, higher
levels on the scale refer to more complex applications of knowledge, skills and
understandings in ICT Literacy. The scale is developmental in the sense that
students are assumed to be typically able to demonstrate achievement of the
skills and cognition described in the scale below as well as at their measured
level of achievement.
Table 3.2 includes the described NAP – ICT Literacy Scale together with
examples of student achievement at each proficiency level. Table 3.2 also
shows the percentage of students who demonstrated achievement at each
proficiency level and the Proficient Standard Year 6 and Year 10 for each year
level. The Proficient Standards and student achievement in relation to the
Proficiency Levels are discussed in the following sections.
The Proficient StandardsOne of the purposes of the NAP sample studies (in ICT Literacy, Civics and
Citizenship and Science Literacy) is to report on student attainment of
Proficient Standards as Key Performance Measures. Proficient Standards
represent a ‘challenging but reasonable’ expectation of student achievement
at that year level. Proficient Standards provide reference points of reasonable
expectation of student achievement at that Year in the area. This is different
to the definition of either a benchmark or a National Minimum Standard which
refers to minimum competence. The Proficient Standards in ICT Literacy (one
for Year 6 and one for Year 10) were established as a result of consultations
with ICT experts and representatives from all states and territories and all
school sectors as part of the 2005 cycle. The standards setting group included
practicing teachers with specific ICT expertise, ICT curriculum experts and
educational assessment experts. The procedures followed by the group are
outlined in the report of NAP – ICT Literacy for 2005 (MCEETYA, 2007: 46-47)7.
7 Technically the group followed a combined modified-Angoff method and Bookmark method to set the Proficient Standards.
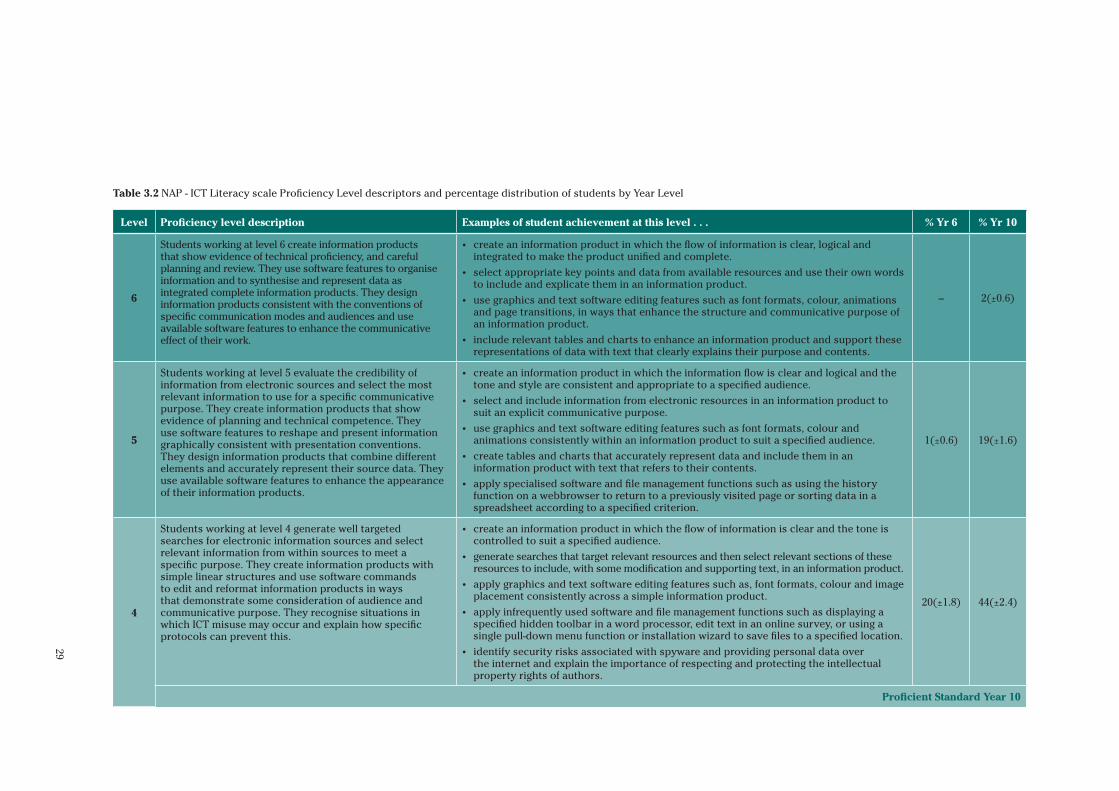
29
Table 3.2 NAP - ICT Literacy scale Proficiency Level descriptors and percentage distribution of students by Year Level
Level Proficiency level description Examples of student achievement at this level . . . % Yr 6 % Yr 10
6
Students working at level 6 create information products that show evidence of technical proficiency, and careful planning and review. They use software features to organise information and to synthesise and represent data as integrated complete information products. They design information products consistent with the conventions of specific communication modes and audiences and use available software features to enhance the communicative effect of their work.
• create an information product in which the flow of information is clear, logical and integrated to make the product unified and complete.
• select appropriate key points and data from available resources and use their own words to include and explicate them in an information product.
• use graphics and text software editing features such as font formats, colour, animations and page transitions, in ways that enhance the structure and communicative purpose of an information product.
• include relevant tables and charts to enhance an information product and support these representations of data with text that clearly explains their purpose and contents.
– 2(±0.6)
5
Students working at level 5 evaluate the credibility of information from electronic sources and select the most relevant information to use for a specific communicative purpose. They create information products that show evidence of planning and technical competence. They use software features to reshape and present information graphically consistent with presentation conventions. They design information products that combine different elements and accurately represent their source data. They use available software features to enhance the appearance of their information products.
• create an information product in which the information flow is clear and logical and the tone and style are consistent and appropriate to a specified audience.
• select and include information from electronic resources in an information product to suit an explicit communicative purpose.
• use graphics and text software editing features such as font formats, colour and animations consistently within an information product to suit a specified audience.
• create tables and charts that accurately represent data and include them in an information product with text that refers to their contents.
• apply specialised software and file management functions such as using the history function on a webbrowser to return to a previously visited page or sorting data in a spreadsheet according to a specified criterion.
1(±0.6) 19(±1.6)
4
Students working at level 4 generate well targeted searches for electronic information sources and select relevant information from within sources to meet a specific purpose. They create information products with simple linear structures and use software commands to edit and reformat information products in ways that demonstrate some consideration of audience and communicative purpose. They recognise situations in which ICT misuse may occur and explain how specific protocols can prevent this.
• create an information product in which the flow of information is clear and the tone is controlled to suit a specified audience.
• generate searches that target relevant resources and then select relevant sections of these resources to include, with some modification and supporting text, in an information product.
• apply graphics and text software editing features such as, font formats, colour and image placement consistently across a simple information product.
• apply infrequently used software and file management functions such as displaying a specified hidden toolbar in a word processor, edit text in an online survey, or using a single pull-down menu function or installation wizard to save files to a specified location.
• identify security risks associated with spyware and providing personal data over the internet and explain the importance of respecting and protecting the intellectual property rights of authors.
20(±1.8) 44(±2.4)
Proficient Standard Year 10
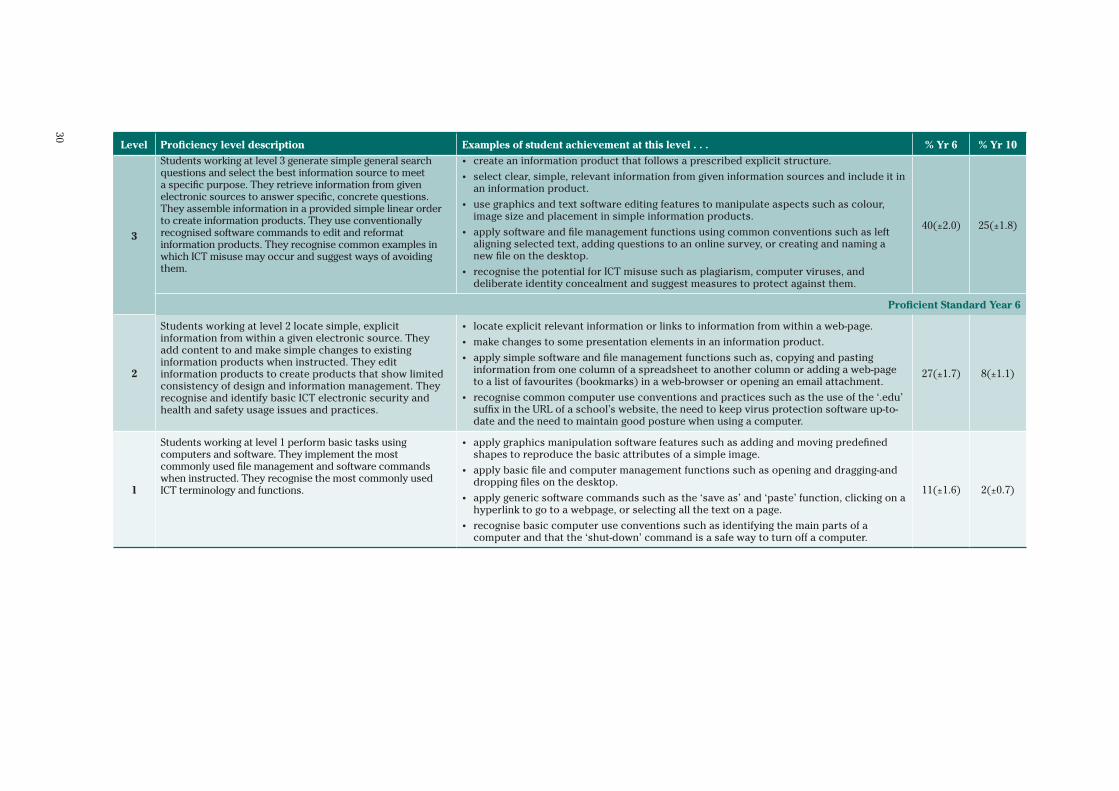
30
Level Proficiency level description Examples of student achievement at this level . . . % Yr 6 % Yr 10
3
Students working at level 3 generate simple general search questions and select the best information source to meet a specific purpose. They retrieve information from given electronic sources to answer specific, concrete questions. They assemble information in a provided simple linear order to create information products. They use conventionally recognised software commands to edit and reformat information products. They recognise common examples in which ICT misuse may occur and suggest ways of avoiding them.
• create an information product that follows a prescribed explicit structure.
• select clear, simple, relevant information from given information sources and include it in an information product.
• use graphics and text software editing features to manipulate aspects such as colour, image size and placement in simple information products.
• apply software and file management functions using common conventions such as left aligning selected text, adding questions to an online survey, or creating and naming a new file on the desktop.
• recognise the potential for ICT misuse such as plagiarism, computer viruses, and deliberate identity concealment and suggest measures to protect against them.
40(±2.0) 25(±1.8)
Proficient Standard Year 6
2
Students working at level 2 locate simple, explicit information from within a given electronic source. They add content to and make simple changes to existing information products when instructed. They edit information products to create products that show limited consistency of design and information management. They recognise and identify basic ICT electronic security and health and safety usage issues and practices.
• locate explicit relevant information or links to information from within a web-page.
• make changes to some presentation elements in an information product.
• apply simple software and file management functions such as, copying and pasting information from one column of a spreadsheet to another column or adding a web-page to a list of favourites (bookmarks) in a web-browser or opening an email attachment.
• recognise common computer use conventions and practices such as the use of the ‘.edu’ suffix in the URL of a school’s website, the need to keep virus protection software up-to-date and the need to maintain good posture when using a computer.
27(±1.7) 8(±1.1)
1
Students working at level 1 perform basic tasks using computers and software. They implement the most commonly used file management and software commands when instructed. They recognise the most commonly used ICT terminology and functions.
• apply graphics manipulation software features such as adding and moving predefined shapes to reproduce the basic attributes of a simple image.
• apply basic file and computer management functions such as opening and dragging-and dropping files on the desktop.
• apply generic software commands such as the ‘save as’ and ‘paste’ function, clicking on a hyperlink to go to a webpage, or selecting all the text on a page.
• recognise basic computer use conventions such as identifying the main parts of a computer and that the ‘shut-down’ command is a safe way to turn off a computer.
11(±1.6) 2(±0.7)
31
Two Proficient Standards, one for Year 6 and one for Year 10, were established in
2005 on the NAP – ICT Literacy Scale. Each standard is a point on the scale that
is at the boundary between two proficiency levels and defines a ‘challenging
but reasonable expectation of student performance at that year level. The
Proficient Standard for Year 6 is 409 scale points, which is the boundary
between levels 2 and 3 on the NAP – ICT Literacy Scale. The Proficient Standard
for Year 10 is 529 scale points which is the boundary between levels 3 and 4
on the scale. Year 6 students performing at Level 3 and above, and Year 10
students performing at Level 4 and above, have consequently met or exceeded
their relevant Proficient Standard.
Sixty-two per cent of Year 6 students and 65 per cent of Year 10 students met
or exceeded the relevant Proficient Standard in 2011. Overall, nearly two-thirds
of Australian students in Years 6 and 10 have met or exceeded the Proficient
Standard for NAP – ICT Literacy in 2011.
Comparisons of Student Performance by Year Level
Comparison of Means
The mean score of Year 6 students was 435 scale points and that of Year 10
students was 559 scale points. Students in Year 10 achieved, on average,
124 scale points more than students in Year 6. This difference is statistically
significant and is congruent with the overall difference of approximately one
proficiency level between the achievement of students at Year 6 and Year 10
shown in Figure 3.2.
Comparison by Proficiency Level
The percentages of students demonstrating achievement of each proficiency
level in Years 6 and 10 are presented in Table 3.1. These percentages are also
displayed graphically in Figure 3.2 together with the location of the Proficient
Standard for each year level. Appendix 1 records the distribution of students
across proficiency levels for each jurisdiction.
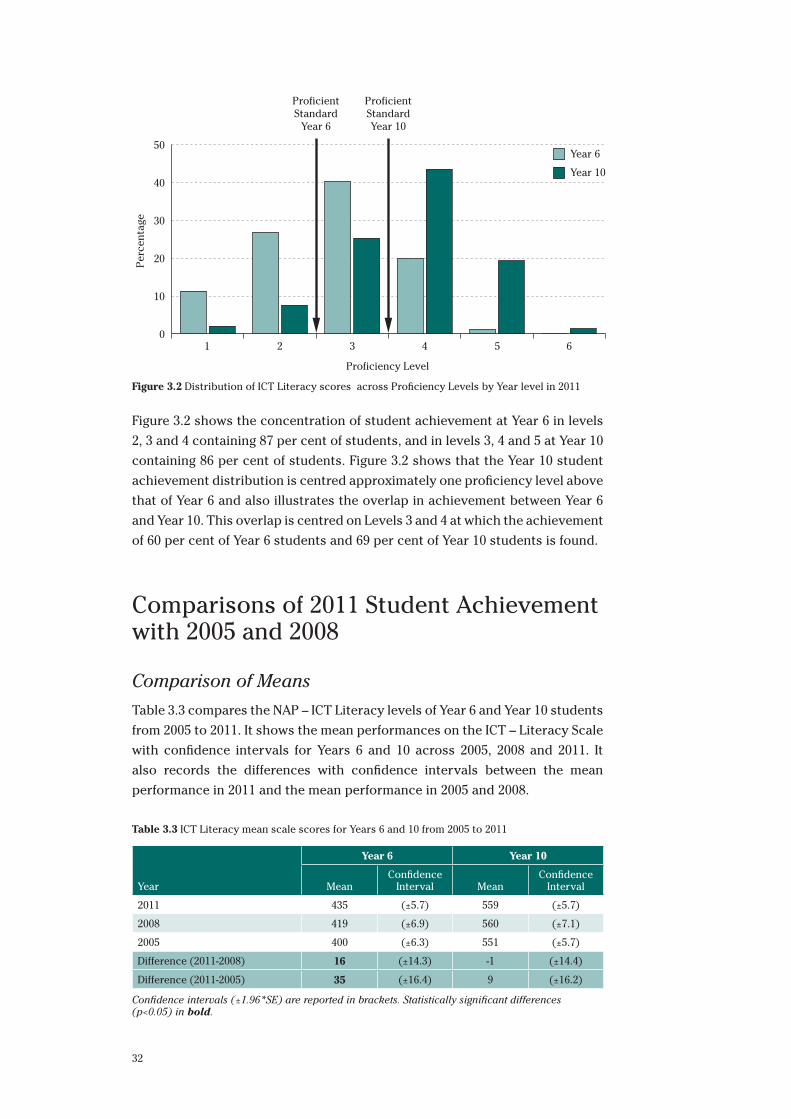
32
0
10
20
30
40
50
2 3
Per
cent
age
Proficiency Level
4
ProficientStandard
Year 6
ProficientStandardYear 10
5 61
Year 6
Year 10
Figure 3.2 Distribution of ICT Literacy scores across Proficiency Levels by Year level in 2011
Figure 3.2 shows the concentration of student achievement at Year 6 in levels
2, 3 and 4 containing 87 per cent of students, and in levels 3, 4 and 5 at Year 10
containing 86 per cent of students. Figure 3.2 shows that the Year 10 student
achievement distribution is centred approximately one proficiency level above
that of Year 6 and also illustrates the overlap in achievement between Year 6
and Year 10. This overlap is centred on Levels 3 and 4 at which the achievement
of 60 per cent of Year 6 students and 69 per cent of Year 10 students is found.
Comparisons of 2011 Student Achievement with 2005 and 2008
Comparison of Means
Table 3.3 compares the NAP – ICT Literacy levels of Year 6 and Year 10 students
from 2005 to 2011. It shows the mean performances on the ICT – Literacy Scale
with confidence intervals for Years 6 and 10 across 2005, 2008 and 2011. It
also records the differences with confidence intervals between the mean
performance in 2011 and the mean performance in 2005 and 2008.
Table 3.3 ICT Literacy mean scale scores for Years 6 and 10 from 2005 to 2011
Year
Year 6 Year 10
MeanConfidence
Interval MeanConfidence
Interval
2011 435 (±5.7) 559 (±5.7)
2008 419 (±6.9) 560 (±7.1)
2005 400 (±6.3) 551 (±5.7)
Difference (2011-2008) 16 (±14.3) -1 (±14.4)
Difference (2011-2005) 35 (±16.4) 9 (±16.2)
Confidence intervals (±1.96*SE) are reported in brackets. Statistically significant differences (p<0.05) in bold.
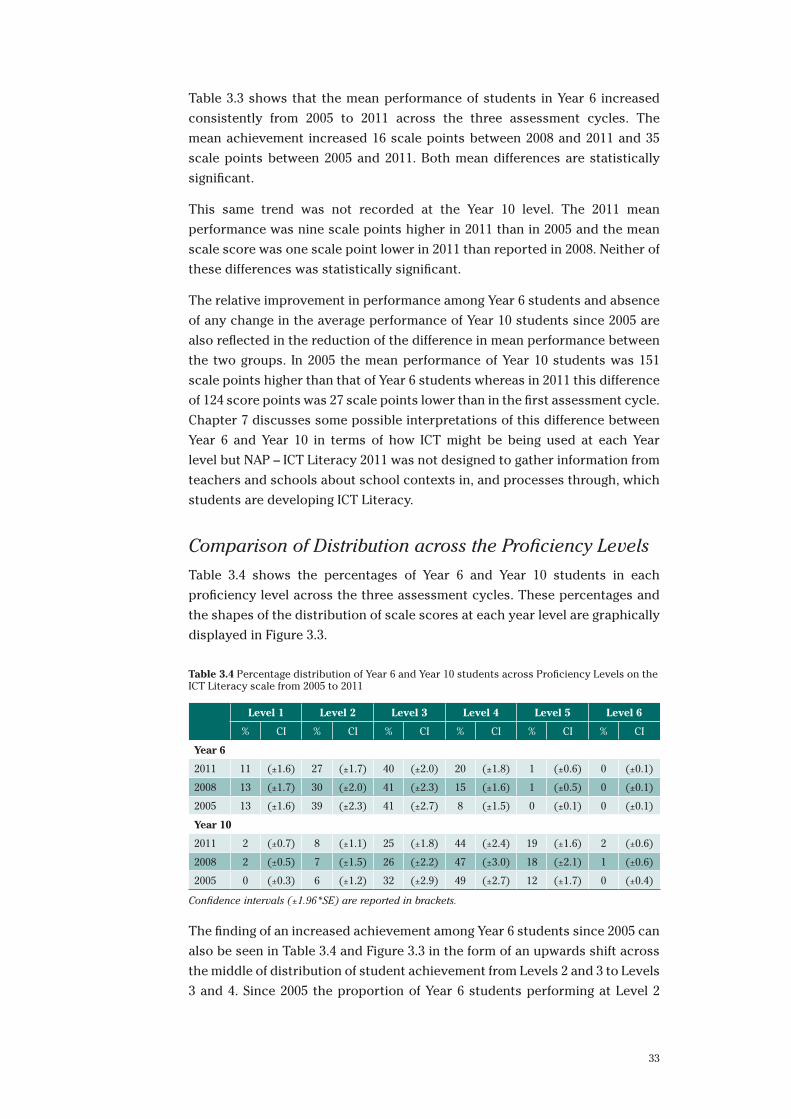
33
Table 3.3 shows that the mean performance of students in Year 6 increased
consistently from 2005 to 2011 across the three assessment cycles. The
mean achievement increased 16 scale points between 2008 and 2011 and 35
scale points between 2005 and 2011. Both mean differences are statistically
significant.
This same trend was not recorded at the Year 10 level. The 2011 mean
performance was nine scale points higher in 2011 than in 2005 and the mean
scale score was one scale point lower in 2011 than reported in 2008. Neither of
these differences was statistically significant.
The relative improvement in performance among Year 6 students and absence
of any change in the average performance of Year 10 students since 2005 are
also reflected in the reduction of the difference in mean performance between
the two groups. In 2005 the mean performance of Year 10 students was 151
scale points higher than that of Year 6 students whereas in 2011 this difference
of 124 score points was 27 scale points lower than in the first assessment cycle.
Chapter 7 discusses some possible interpretations of this difference between
Year 6 and Year 10 in terms of how ICT might be being used at each Year
level but NAP – ICT Literacy 2011 was not designed to gather information from
teachers and schools about school contexts in, and processes through, which
students are developing ICT Literacy.
Comparison of Distribution across the Proficiency Levels
Table 3.4 shows the percentages of Year 6 and Year 10 students in each
proficiency level across the three assessment cycles. These percentages and
the shapes of the distribution of scale scores at each year level are graphically
displayed in Figure 3.3.
Table 3.4 Percentage distribution of Year 6 and Year 10 students across Proficiency Levels on the ICT Literacy scale from 2005 to 2011
Level 1 Level 2 Level 3 Level 4 Level 5 Level 6
% CI % CI % CI % CI % CI % CI
Year 6
2011 11 (±1.6) 27 (±1.7) 40 (±2.0) 20 (±1.8) 1 (±0.6) 0 (±0.1)
2008 13 (±1.7) 30 (±2.0) 41 (±2.3) 15 (±1.6) 1 (±0.5) 0 (±0.1)
2005 13 (±1.6) 39 (±2.3) 41 (±2.7) 8 (±1.5) 0 (±0.1) 0 (±0.1)
Year 10
2011 2 (±0.7) 8 (±1.1) 25 (±1.8) 44 (±2.4) 19 (±1.6) 2 (±0.6)
2008 2 (±0.5) 7 (±1.5) 26 (±2.2) 47 (±3.0) 18 (±2.1) 1 (±0.6)
2005 0 (±0.3) 6 (±1.2) 32 (±2.9) 49 (±2.7) 12 (±1.7) 0 (±0.4)
Confidence intervals (±1.96*SE) are reported in brackets.
The finding of an increased achievement among Year 6 students since 2005 can
also be seen in Table 3.4 and Figure 3.3 in the form of an upwards shift across
the middle of distribution of student achievement from Levels 2 and 3 to Levels
3 and 4. Since 2005 the proportion of Year 6 students performing at Level 2
34
decreased by 12 percentage points and there was a corresponding increase
of 12 percentage points of students performing at Level 4. The proportion of
students performing at Level 3 remained stable (decreasing by one percentage
point). The same can be said about the proportions of students achieving at
lower end of the achievement distribution (Level 1).
A similar but less marked shift can be seen in the distribution of achievement
of Year 10 students. There was an increase of seven percentage points in the
proportion of students performing at Level 5 since 2005 and corresponding
decreases of seven percentage points at Level 3 and five percentage points at
Level 4. The proportions of students performing at Levels 1 and 2 combined
increased from 2005 to 2011. The percentage of students performing at Level 6
remained very small throughout this time period.
Overall the shift in Year 6 achievement across the middle of the Year 6
distribution was large enough to be reflected in significant increases in the
mean scale scores and percentage of students meeting or exceeding the
Proficient Standard since 2011. The similar, but less marked, shift at Year 10
was not sufficient to be reflected as significant differences across the other
reported measures of change when balanced against the overall shape of the
distribution of student achievement. Since 2005, the proportion of students in
Year 6 performing at or below Level 2 (i.e. below the Year 6 Proficient Standard)
has decreased from 52 per cent to 38 per cent whereas the proportion of
Year 10 students has increased from 6 per cent to 10 per cent. It appears
from the data that there has been little if any change in the proportion of low
achieving students at Year 10 since 2005. Chapter 7 discusses some possible
interpretations of these patterns of change.
At both year levels the upward shifts across the centre of the distributions of
student performance were larger between 2005 and 2008 than between 2008
and 2011.
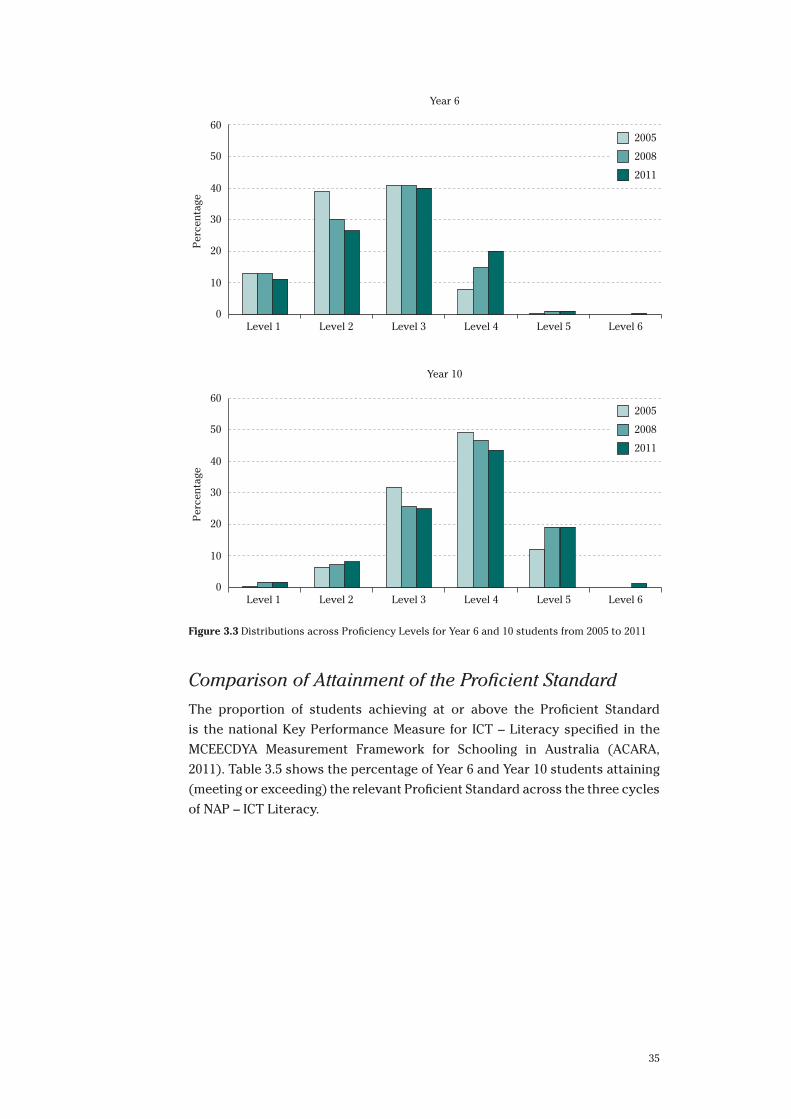
35
0
10
20
30
40
60
50
Level 2 Level 3
Per
cent
age
Level 4 Level 5
Year 6
Level 6Level 1
2005
2008
2011
0
10
20
30
40
60
50
Level 2 Level 3
Per
cent
age
Level 4 Level 5
Year 10
Level 6Level 1
2005
2008
2011
Figure 3.3 Distributions across Proficiency Levels for Year 6 and 10 students from 2005 to 2011
Comparison of Attainment of the Proficient Standard
The proportion of students achieving at or above the Proficient Standard
is the national Key Performance Measure for ICT – Literacy specified in the
MCEECDYA Measurement Framework for Schooling in Australia (ACARA,
2011). Table 3.5 shows the percentage of Year 6 and Year 10 students attaining
(meeting or exceeding) the relevant Proficient Standard across the three cycles
of NAP – ICT Literacy.
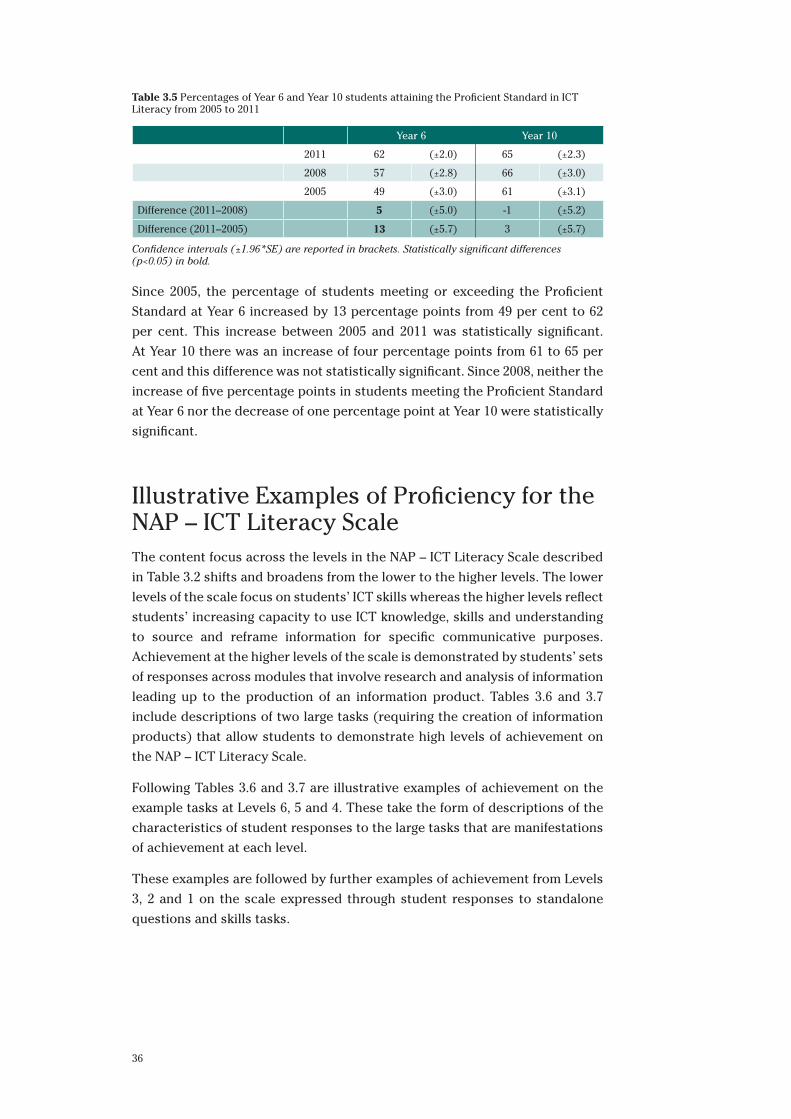
36
Table 3.5 Percentages of Year 6 and Year 10 students attaining the Proficient Standard in ICT Literacy from 2005 to 2011
Year 6 Year 10
2011 62 (±2.0) 65 (±2.3)
2008 57 (±2.8) 66 (±3.0)
2005 49 (±3.0) 61 (±3.1)
Difference (2011–2008) 5 (±5.0) -1 (±5.2)
Difference (2011–2005) 13 (±5.7) 3 (±5.7)
Confidence intervals (±1.96*SE) are reported in brackets. Statistically significant differences (p<0.05) in bold.
Since 2005, the percentage of students meeting or exceeding the Proficient
Standard at Year 6 increased by 13 percentage points from 49 per cent to 62
per cent. This increase between 2005 and 2011 was statistically significant.
At Year 10 there was an increase of four percentage points from 61 to 65 per
cent and this difference was not statistically significant. Since 2008, neither the
increase of five percentage points in students meeting the Proficient Standard
at Year 6 nor the decrease of one percentage point at Year 10 were statistically
significant.
Illustrative Examples of Proficiency for the NAP – ICT Literacy ScaleThe content focus across the levels in the NAP – ICT Literacy Scale described
in Table 3.2 shifts and broadens from the lower to the higher levels. The lower
levels of the scale focus on students’ ICT skills whereas the higher levels reflect
students’ increasing capacity to use ICT knowledge, skills and understanding
to source and reframe information for specific communicative purposes.
Achievement at the higher levels of the scale is demonstrated by students’ sets
of responses across modules that involve research and analysis of information
leading up to the production of an information product. Tables 3.6 and 3.7
include descriptions of two large tasks (requiring the creation of information
products) that allow students to demonstrate high levels of achievement on
the NAP – ICT Literacy Scale.
Following Tables 3.6 and 3.7 are illustrative examples of achievement on the
example tasks at Levels 6, 5 and 4. These take the form of descriptions of the
characteristics of student responses to the large tasks that are manifestations
of achievement at each level.
These examples are followed by further examples of achievement from Levels
3, 2 and 1 on the scale expressed through student responses to standalone
questions and skills tasks.
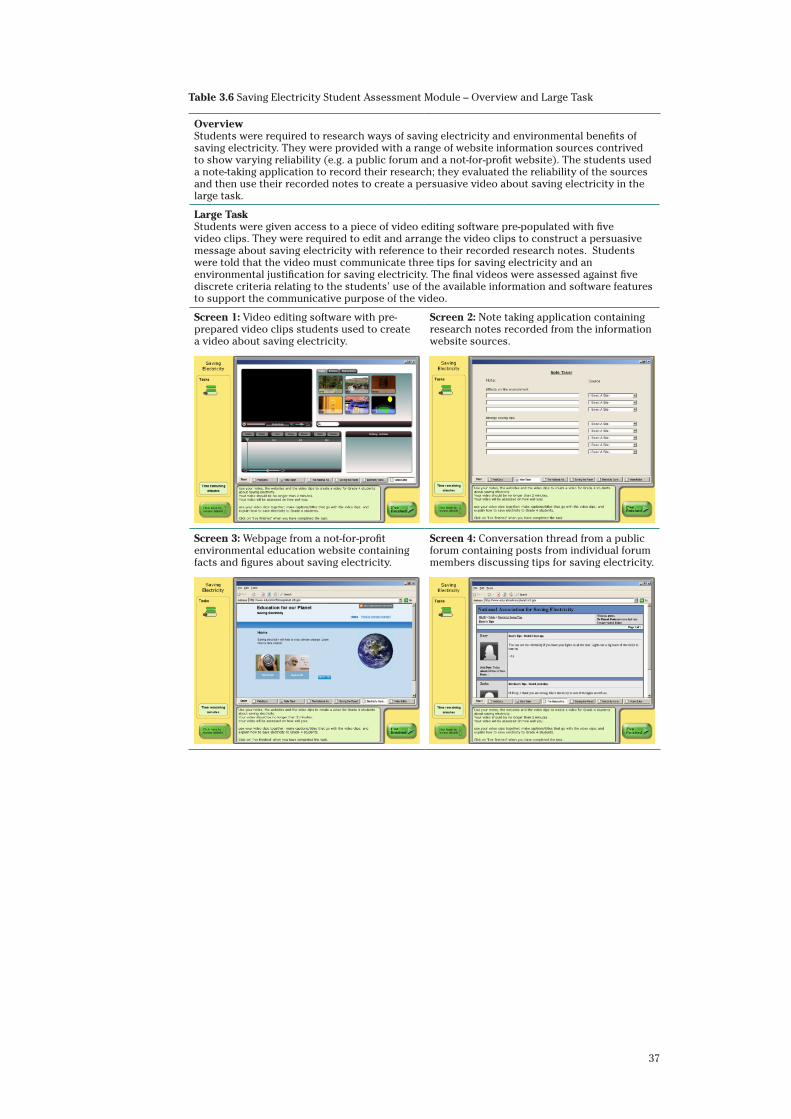
37
Table 3.6 Saving Electricity Student Assessment Module – Overview and Large Task
Overview Students were required to research ways of saving electricity and environmental benefits of saving electricity. They were provided with a range of website information sources contrived to show varying reliability (e.g. a public forum and a not-for-profit website). The students used a note-taking application to record their research; they evaluated the reliability of the sources and then use their recorded notes to create a persuasive video about saving electricity in the large task.
Large Task Students were given access to a piece of video editing software pre-populated with five video clips. They were required to edit and arrange the video clips to construct a persuasive message about saving electricity with reference to their recorded research notes. Students were told that the video must communicate three tips for saving electricity and an environmental justification for saving electricity. The final videos were assessed against five discrete criteria relating to the students’ use of the available information and software features to support the communicative purpose of the video.
Screen 1: Video editing software with pre-prepared video clips students used to create a video about saving electricity.
Screen 2: Note taking application containing research notes recorded from the information website sources.
Screen 3: Webpage from a not-for-profit environmental education website containing facts and figures about saving electricity.
Screen 4: Conversation thread from a public forum containing posts from individual forum members discussing tips for saving electricity.
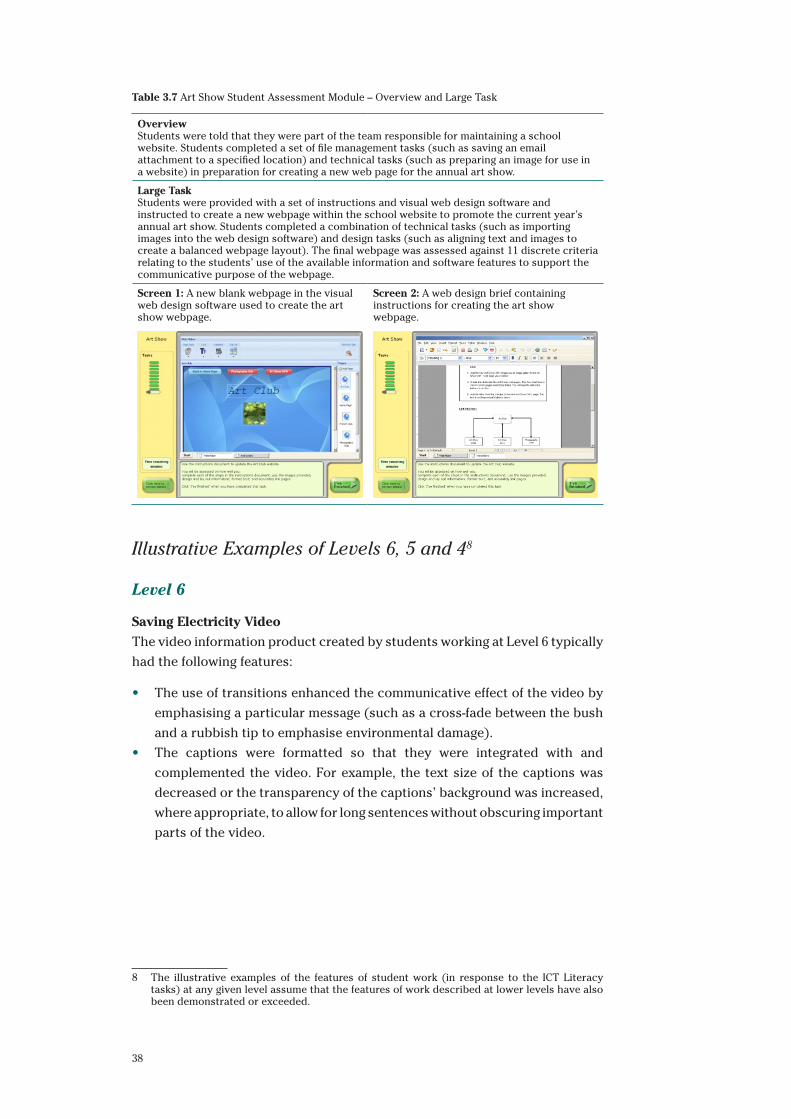
38
Table 3.7 Art Show Student Assessment Module – Overview and Large Task
OverviewStudents were told that they were part of the team responsible for maintaining a school website. Students completed a set of file management tasks (such as saving an email attachment to a specified location) and technical tasks (such as preparing an image for use in a website) in preparation for creating a new web page for the annual art show.
Large Task Students were provided with a set of instructions and visual web design software and instructed to create a new webpage within the school website to promote the current year’s annual art show. Students completed a combination of technical tasks (such as importing images into the web design software) and design tasks (such as aligning text and images to create a balanced webpage layout). The final webpage was assessed against 11 discrete criteria relating to the students’ use of the available information and software features to support the communicative purpose of the webpage.
Screen 1: A new blank webpage in the visual web design software used to create the art show webpage.
Screen 2: A web design brief containing instructions for creating the art show webpage.
Illustrative Examples of Levels 6, 5 and 48
Level 6
Saving Electricity Video
The video information product created by students working at Level 6 typically
had the following features:
• The use of transitions enhanced the communicative effect of the video by
emphasising a particular message (such as a cross-fade between the bush
and a rubbish tip to emphasise environmental damage).
• The captions were formatted so that they were integrated with and
complemented the video. For example, the text size of the captions was
decreased or the transparency of the captions’ background was increased,
where appropriate, to allow for long sentences without obscuring important
parts of the video.
8 The illustrative examples of the features of student work (in response to the ICT Literacy tasks) at any given level assume that the features of work described at lower levels have also been demonstrated or exceeded.
39
Level 5
Saving Electricity Video
The research notes and video information product created by students
working at Level 5 typically had the following features:
• The research notes demonstrated breadth and critical evaluation by
including all relevant points and omitting points from unreliable sources.
• The sequence of video clips and use of captions clearly communicated a
tip for saving energy which was justified by an environmental benefit.
Art Show Webpage
The art show webpage created by students working at Level 5 typically had the
following features:
• The overall layout of the elements on the webpage adheres to established
web design principles and is consistent with the layout used on the other
pages in the website.
• The colour formatting of the navigation buttons was consistent and the
layout was balanced.
• The title was formatted (using colour and text size) to show clear contrast
with the other elements on the webpage.
Level 4
Saving Electricity Video
The video information product created by students working at Level 4 typically
had the following features:
• Video captions were created but their layout (such as size or positioning)
created some interference with parts of the video.
Art Show Webpage
The art show webpage created by students working at Level 4 typically had the
following features:
• Specified relevant images were imported using the web design software
features.
• Inserted images were aligned symmetrically and demonstrated balance
with the webpage layout.
• Text was copied from a document and pasted into the webpage accurately.
• A background image was applied to the webpage.
• A title was included without formatting to support its relationship to other
elements on the page.
• Most webpage elements were placed and aligned consistently with some
overlapping or unusual gaps between elements.
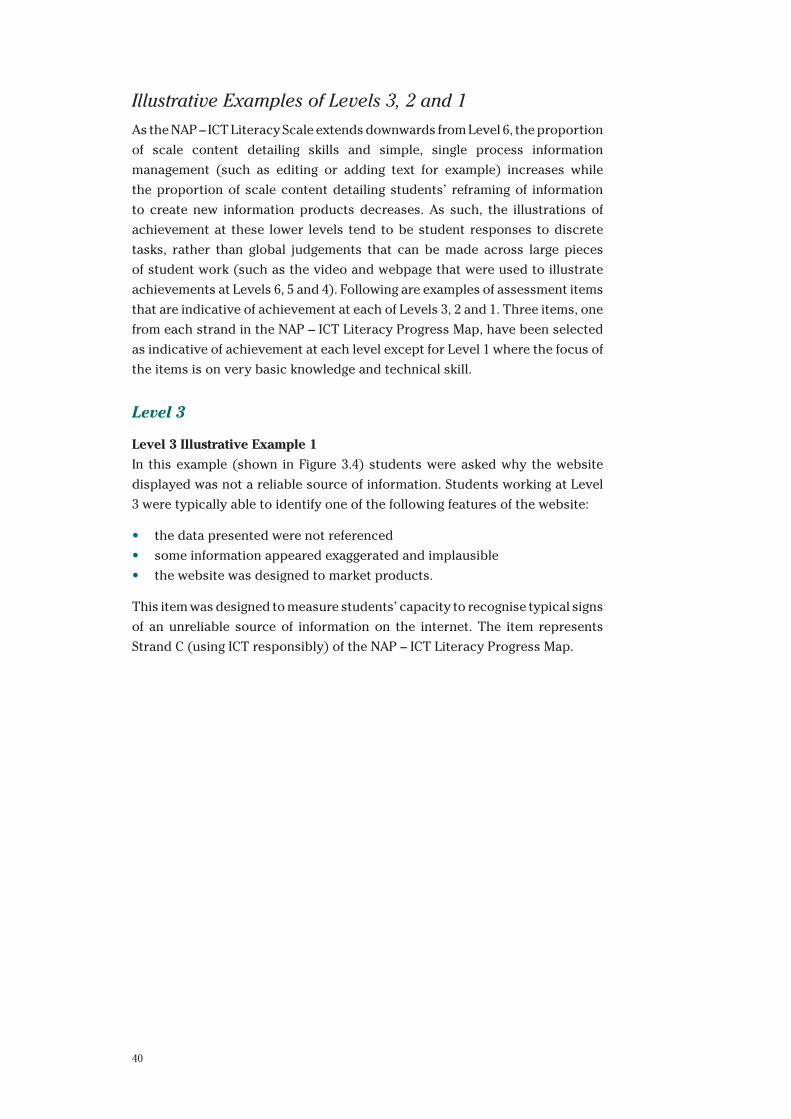
40
Illustrative Examples of Levels 3, 2 and 1
As the NAP – ICT Literacy Scale extends downwards from Level 6, the proportion
of scale content detailing skills and simple, single process information
management (such as editing or adding text for example) increases while
the proportion of scale content detailing students’ reframing of information
to create new information products decreases. As such, the illustrations of
achievement at these lower levels tend to be student responses to discrete
tasks, rather than global judgements that can be made across large pieces
of student work (such as the video and webpage that were used to illustrate
achievements at Levels 6, 5 and 4). Following are examples of assessment items
that are indicative of achievement at each of Levels 3, 2 and 1. Three items, one
from each strand in the NAP – ICT Literacy Progress Map, have been selected
as indicative of achievement at each level except for Level 1 where the focus of
the items is on very basic knowledge and technical skill.
Level 3
Level 3 Illustrative Example 1
In this example (shown in Figure 3.4) students were asked why the website
displayed was not a reliable source of information. Students working at Level
3 were typically able to identify one of the following features of the website:
• the data presented were not referenced
• some information appeared exaggerated and implausible
• the website was designed to market products.
This item was designed to measure students’ capacity to recognise typical signs
of an unreliable source of information on the internet. The item represents
Strand C (using ICT responsibly) of the NAP – ICT Literacy Progress Map.
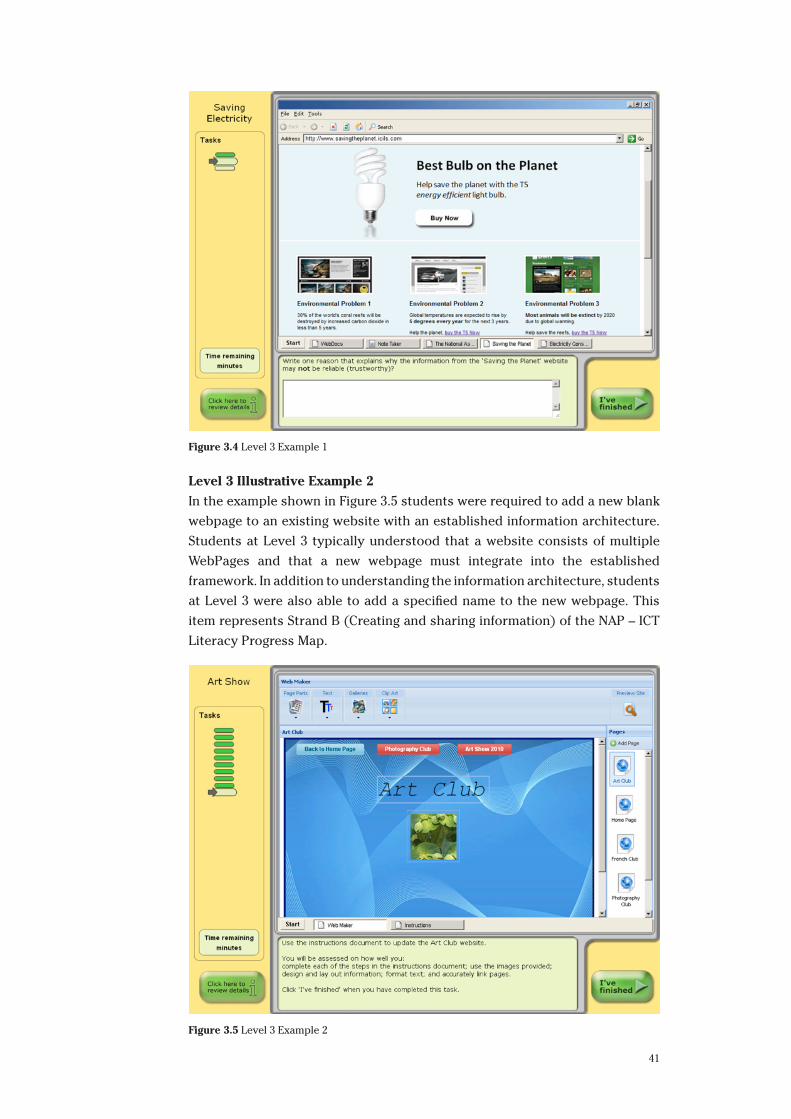
41
Figure 3.4 Level 3 Example 1
Level 3 Illustrative Example 2
In the example shown in Figure 3.5 students were required to add a new blank
webpage to an existing website with an established information architecture.
Students at Level 3 typically understood that a website consists of multiple
WebPages and that a new webpage must integrate into the established
framework. In addition to understanding the information architecture, students
at Level 3 were also able to add a specified name to the new webpage. This
item represents Strand B (Creating and sharing information) of the NAP – ICT
Literacy Progress Map.
Figure 3.5 Level 3 Example 2
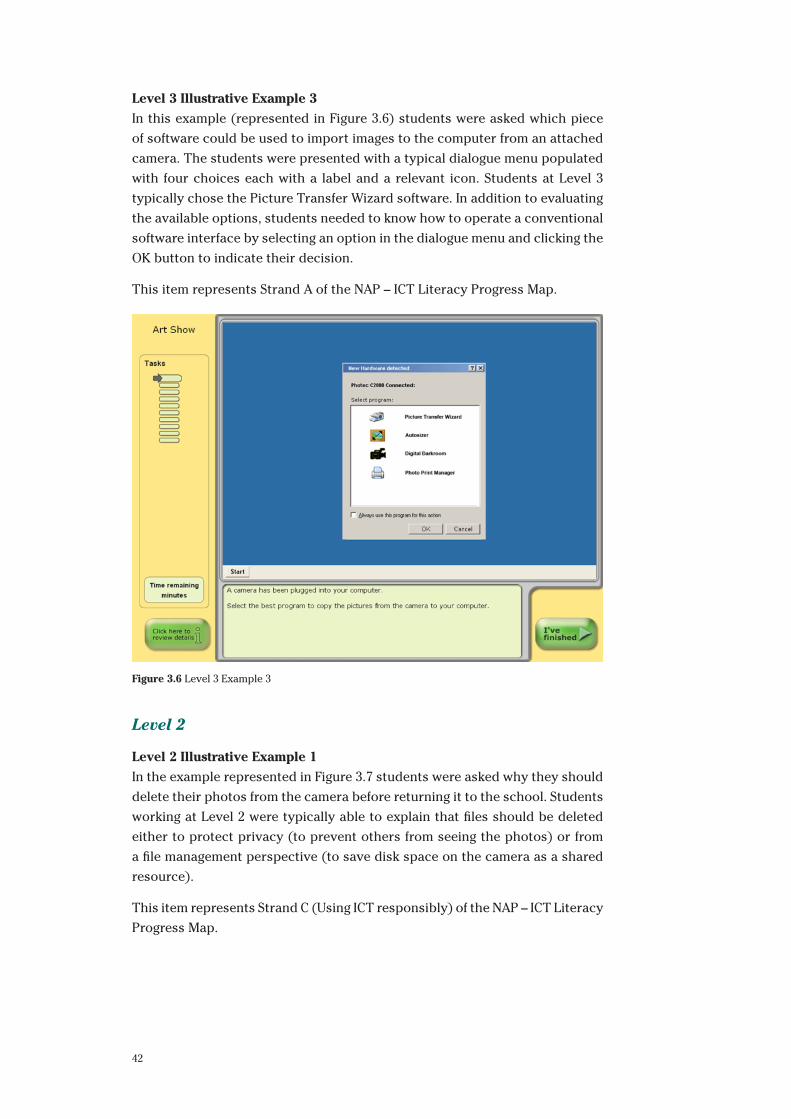
42
Level 3 Illustrative Example 3
In this example (represented in Figure 3.6) students were asked which piece
of software could be used to import images to the computer from an attached
camera. The students were presented with a typical dialogue menu populated
with four choices each with a label and a relevant icon. Students at Level 3
typically chose the Picture Transfer Wizard software. In addition to evaluating
the available options, students needed to know how to operate a conventional
software interface by selecting an option in the dialogue menu and clicking the
OK button to indicate their decision.
This item represents Strand A of the NAP – ICT Literacy Progress Map.
Figure 3.6 Level 3 Example 3
Level 2
Level 2 Illustrative Example 1
In the example represented in Figure 3.7 students were asked why they should
delete their photos from the camera before returning it to the school. Students
working at Level 2 were typically able to explain that files should be deleted
either to protect privacy (to prevent others from seeing the photos) or from
a file management perspective (to save disk space on the camera as a shared
resource).
This item represents Strand C (Using ICT responsibly) of the NAP – ICT Literacy
Progress Map.
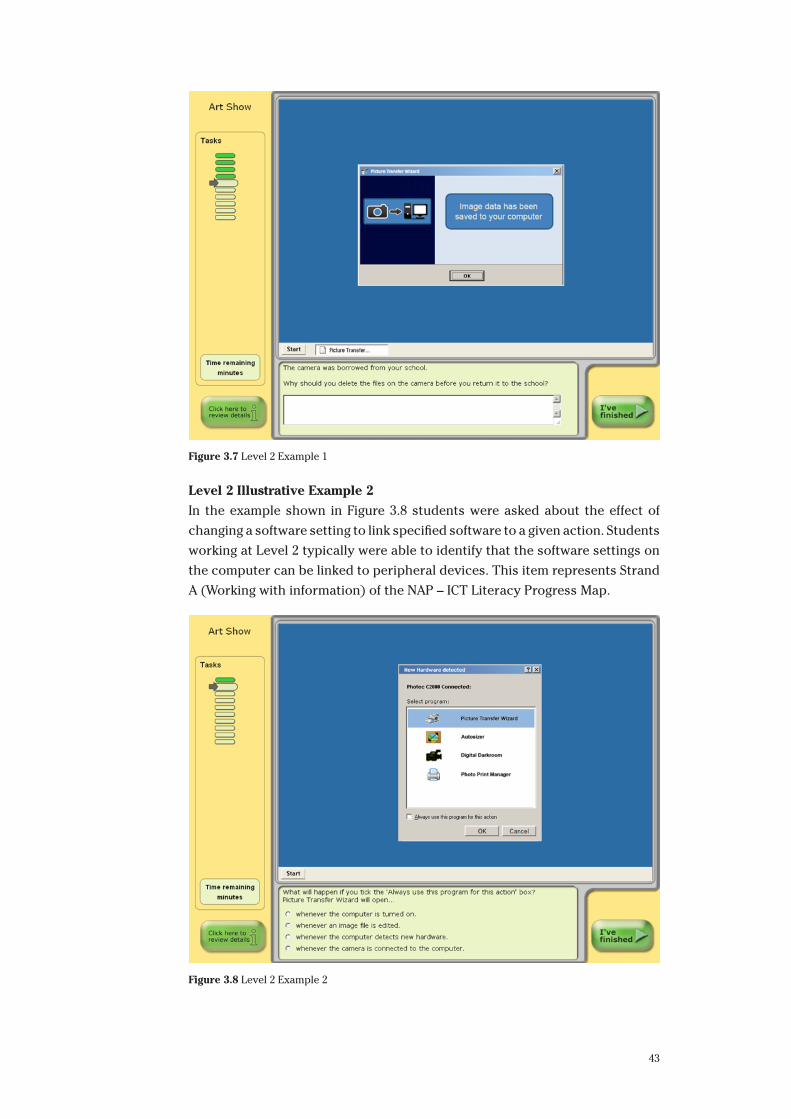
43
Figure 3.7 Level 2 Example 1
Level 2 Illustrative Example 2
In the example shown in Figure 3.8 students were asked about the effect of
changing a software setting to link specified software to a given action. Students
working at Level 2 typically were able to identify that the software settings on
the computer can be linked to peripheral devices. This item represents Strand
A (Working with information) of the NAP – ICT Literacy Progress Map.
Figure 3.8 Level 2 Example 2
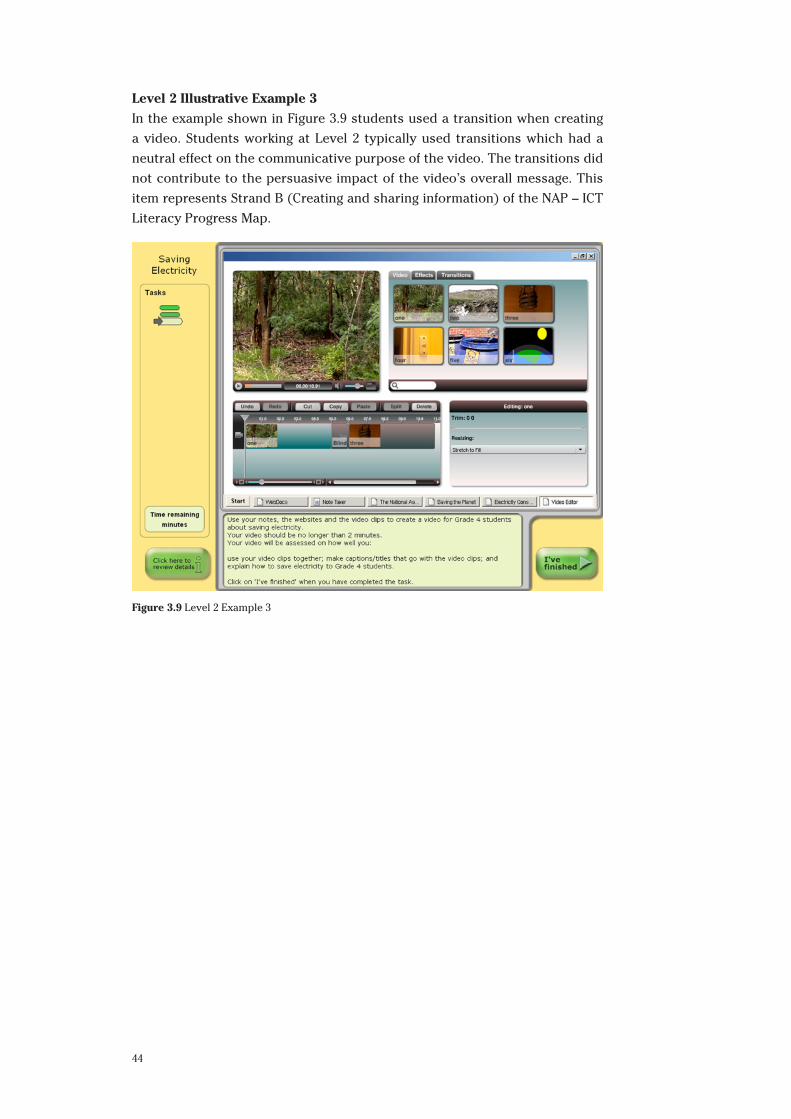
44
Level 2 Illustrative Example 3
In the example shown in Figure 3.9 students used a transition when creating
a video. Students working at Level 2 typically used transitions which had a
neutral effect on the communicative purpose of the video. The transitions did
not contribute to the persuasive impact of the video’s overall message. This
item represents Strand B (Creating and sharing information) of the NAP – ICT
Literacy Progress Map.
Figure 3.9 Level 2 Example 3
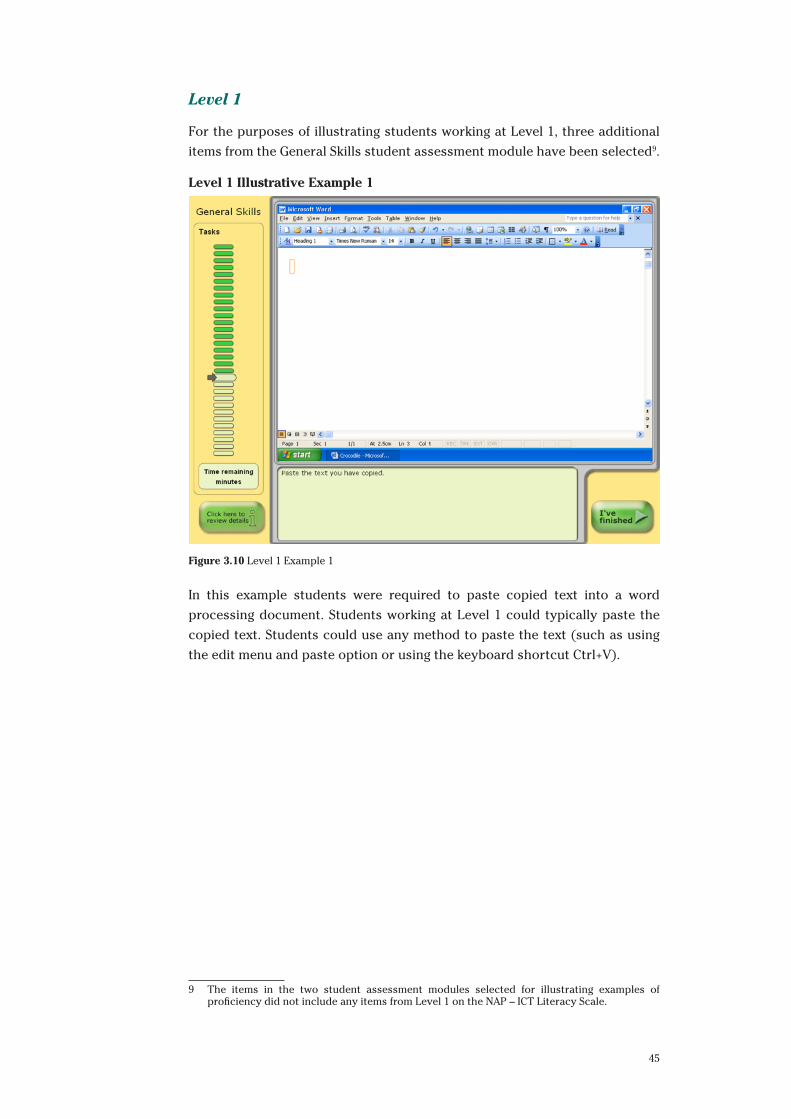
45
Level 1
For the purposes of illustrating students working at Level 1, three additional
items from the General Skills student assessment module have been selected9.
Level 1 Illustrative Example 1
Figure 3.10 Level 1 Example 1
In this example students were required to paste copied text into a word
processing document. Students working at Level 1 could typically paste the
copied text. Students could use any method to paste the text (such as using
the edit menu and paste option or using the keyboard shortcut Ctrl+V).
9 The items in the two student assessment modules selected for illustrating examples of proficiency did not include any items from Level 1 on the NAP – ICT Literacy Scale.
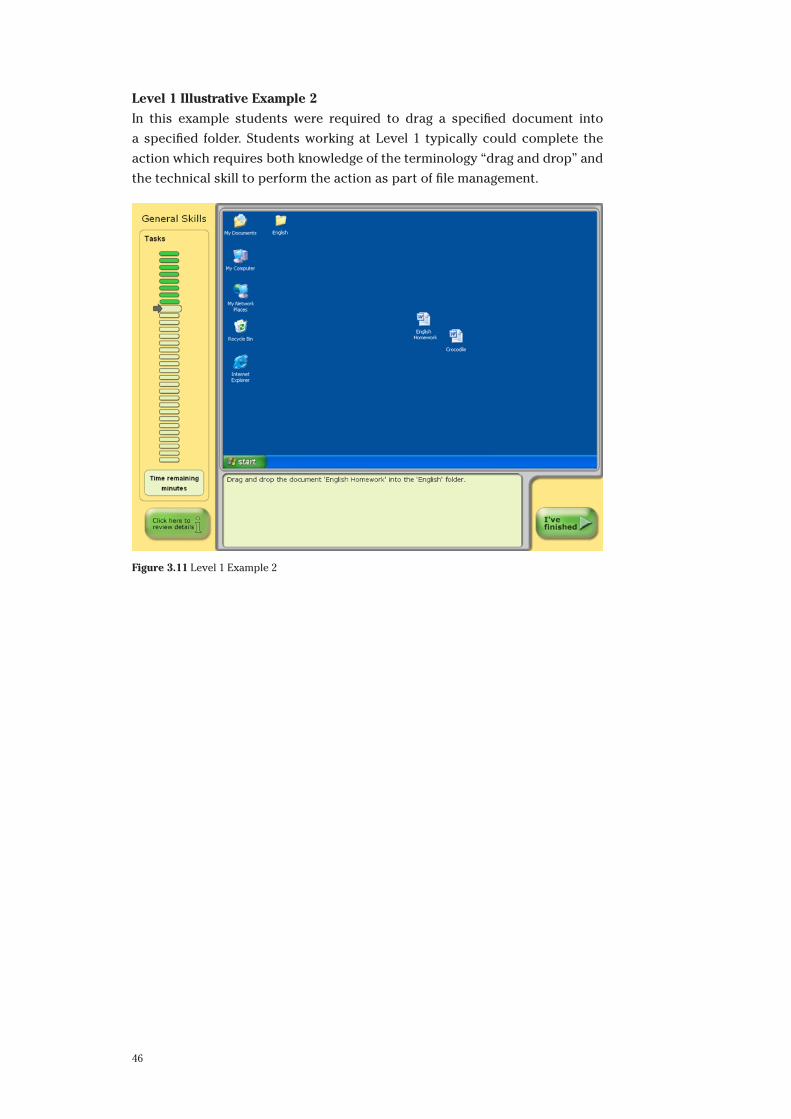
46
Level 1 Illustrative Example 2
In this example students were required to drag a specified document into
a specified folder. Students working at Level 1 typically could complete the
action which requires both knowledge of the terminology “drag and drop” and
the technical skill to perform the action as part of file management.
Figure 3.11 Level 1 Example 2
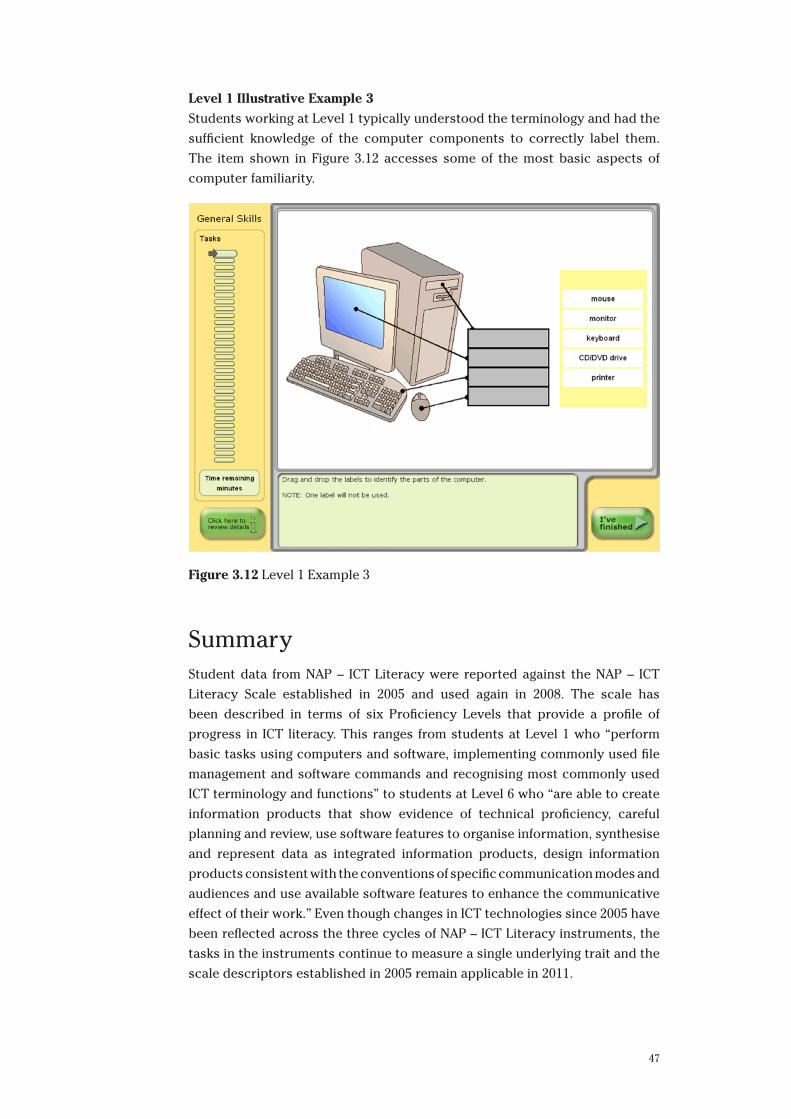
47
Level 1 Illustrative Example 3
Students working at Level 1 typically understood the terminology and had the
sufficient knowledge of the computer components to correctly label them.
The item shown in Figure 3.12 accesses some of the most basic aspects of
computer familiarity.
Figure 3.12 Level 1 Example 3
SummaryStudent data from NAP – ICT Literacy were reported against the NAP – ICT
Literacy Scale established in 2005 and used again in 2008. The scale has
been described in terms of six Proficiency Levels that provide a profile of
progress in ICT literacy. This ranges from students at Level 1 who “perform
basic tasks using computers and software, implementing commonly used file
management and software commands and recognising most commonly used
ICT terminology and functions” to students at Level 6 who “are able to create
information products that show evidence of technical proficiency, careful
planning and review, use software features to organise information, synthesise
and represent data as integrated information products, design information
products consistent with the conventions of specific communication modes and
audiences and use available software features to enhance the communicative
effect of their work.” Even though changes in ICT technologies since 2005 have
been reflected across the three cycles of NAP – ICT Literacy instruments, the
tasks in the instruments continue to measure a single underlying trait and the
scale descriptors established in 2005 remain applicable in 2011.
48
Two Proficient Standards, one for Year 6 and one for Year 10, were established
in 2005 on the NAP – ICT Literacy Scale. The Proficient Standard for Year 6 is
the boundary between Levels 2 and 3 on the NAP – ICT Literacy Scale. The
Proficient Standard for Year 10 is the boundary between Levels 3 and 4 on the
scale. Sixty-two per cent of Year 6 students and 65 per cent of Year 10 students
met or exceeded the relevant Proficient Standard in 2011.
Since 2005, the percentage of students meeting or exceeding the Proficient
Standard at Year 6 increased by 13 percentage points from 49 per cent to 62
per cent. This increase between 2005 and 2011 was statistically significant.
Since 2005 there has been no significant change in the percentage of Year 10
students meeting or exceeding the Proficient Standard.
Students in Year 10 achieved, on average, 124 scale points more than students
in Year 6. This difference is statistically significant. Overall the achievement
of students in Year 10 is roughly one Proficiency Level above those in Year 6.
Despite this difference, there is considerable overlap between the distributions
of achievement of Year 6 and Year 10 students. Levels 2, 3 and 4 account for the
achievement of 87 per cent of Year 6 students and Levels 3, 4 and 5 account for
the achievement of 86 per cent of Year 10 students. The achievement overlap
between Years 6 and 10 is centred on Levels 3 and 4 at which the achievement
of 60 per cent of Year 6 students and 69 per cent of Year 10 students is found.
Since 2005 the mean performance of students in Year 6 has increased
consistently across the three assessment cycles. The mean achievement
increased 16 scale points between 2008 and 2011 and 35 scale points between
2005 and 2011. Both mean differences are statistically significant. This same
trend was not recorded at the Year 10 level with no changes over time since
2005 being statistically significant. Consequent to these findings, the difference
between mean performance of Year 10 and Year 6 students has decreased from
151 scale points in 2005 to 124 scale points in 2011.
At each year level there appears to have been some increase in the achievement
of students across the middle three Proficiency Levels (Levels 2, 3 and 4 for Year
6 and Levels 3,4 and 5 for Year 10) since 2005 and that this increase has been
more marked at Year 6 than Year 10. This increase is matched by a reduction
in the proportion of Year 6 students achieving below the Year 6 Proficient
Standard. In contrast, despite the tendency to increased achievement across
the middle of the Year 10 distribution, the proportion of Year 10 students
achieving below Level 2 (i.e. below the Year 6 Proficient Standard) has not
decreased since 2005.
49
Chapter 4 Patterns of ICT Literacy
Chapter 3 has outlined the development of the ICT Literacy scale, its proficiency
levels and descriptors, as well as student achievement at the national level. This
chapter describes the association of student performance in this learning area
with a number of factors, including the level of schooling, geographic location,
gender, language spoken at home, country of birth, Indigenous background,
parental education and occupation.
The first part of this chapter describes differences in proficiency between
students across States and Territories as well as across year levels. The second
part presents differences in student performance according to background
characteristics of students and school.
Performance in ICT Literacy between States and Territories
Year 6 and Year 10 Mean Distribution by State and Territory
Table 4.1 shows the average ICT Literacy scores in Year 6 and Year 10 for each
State and Territory. Each estimate is accompanied by its 95 per cent confidence
interval indicating its level of precision. Differences in the size of confidence
intervals result from differences in sample sizes across and variation in test
performance within jurisdictions (information on participation rates and
sample sizes is provided in Chapter 2).
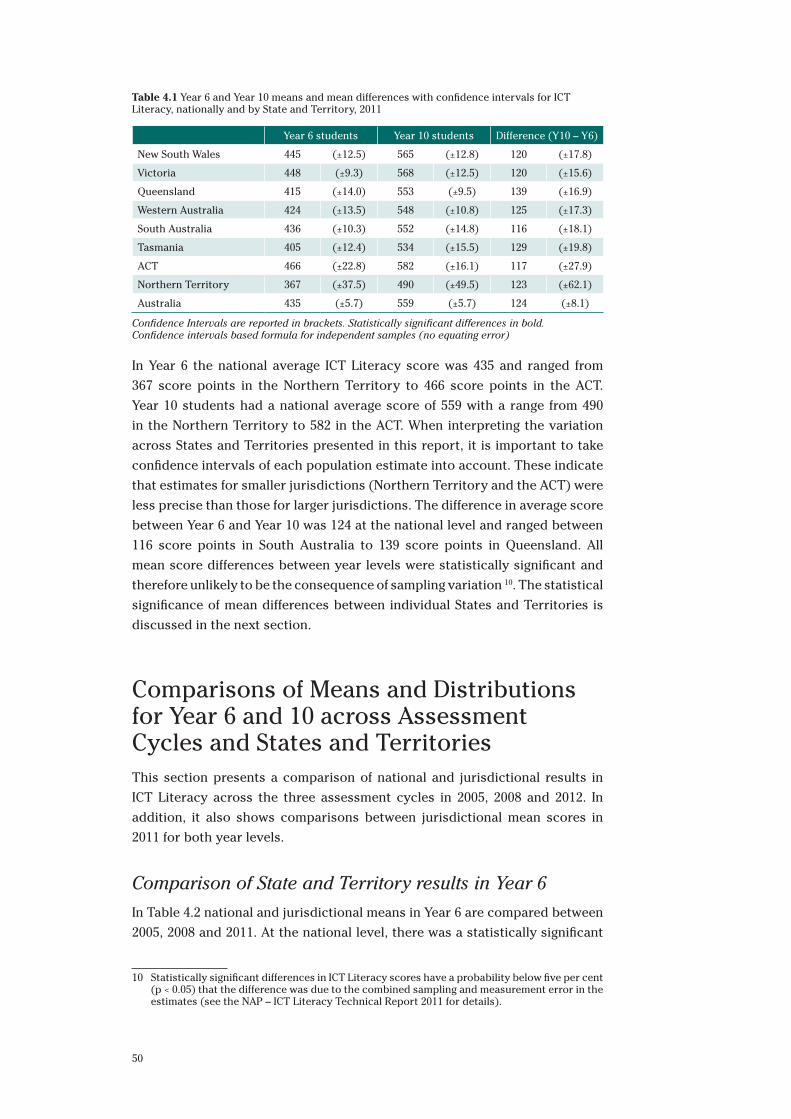
50
Table 4.1 Year 6 and Year 10 means and mean differences with confidence intervals for ICT Literacy, nationally and by State and Territory, 2011
Year 6 students Year 10 students Difference (Y10 – Y6)
New South Wales 445 (±12.5) 565 (±12.8) 120 (±17.8)
Victoria 448 (±9.3) 568 (±12.5) 120 (±15.6)
Queensland 415 (±14.0) 553 (±9.5) 139 (±16.9)
Western Australia 424 (±13.5) 548 (±10.8) 125 (±17.3)
South Australia 436 (±10.3) 552 (±14.8) 116 (±18.1)
Tasmania 405 (±12.4) 534 (±15.5) 129 (±19.8)
ACT 466 (±22.8) 582 (±16.1) 117 (±27.9)
Northern Territory 367 (±37.5) 490 (±49.5) 123 (±62.1)
Australia 435 (±5.7) 559 (±5.7) 124 (±8.1)
Confidence Intervals are reported in brackets. Statistically significant differences in bold. Confidence intervals based formula for independent samples (no equating error)
In Year 6 the national average ICT Literacy score was 435 and ranged from
367 score points in the Northern Territory to 466 score points in the ACT.
Year 10 students had a national average score of 559 with a range from 490
in the Northern Territory to 582 in the ACT. When interpreting the variation
across States and Territories presented in this report, it is important to take
confidence intervals of each population estimate into account. These indicate
that estimates for smaller jurisdictions (Northern Territory and the ACT) were
less precise than those for larger jurisdictions. The difference in average score
between Year 6 and Year 10 was 124 at the national level and ranged between
116 score points in South Australia to 139 score points in Queensland. All
mean score differences between year levels were statistically significant and
therefore unlikely to be the consequence of sampling variation 10. The statistical
significance of mean differences between individual States and Territories is
discussed in the next section.
Comparisons of Means and Distributions for Year 6 and 10 across Assessment Cycles and States and TerritoriesThis section presents a comparison of national and jurisdictional results in
ICT Literacy across the three assessment cycles in 2005, 2008 and 2012. In
addition, it also shows comparisons between jurisdictional mean scores in
2011 for both year levels.
Comparison of State and Territory results in Year 6
In Table 4.2 national and jurisdictional means in Year 6 are compared between
2005, 2008 and 2011. At the national level, there was a statistically significant
10 Statistically significant differences in ICT Literacy scores have a probability below five per cent (p < 0.05) that the difference was due to the combined sampling and measurement error in the estimates (see the NAP – ICT Literacy Technical Report 2011 for details).
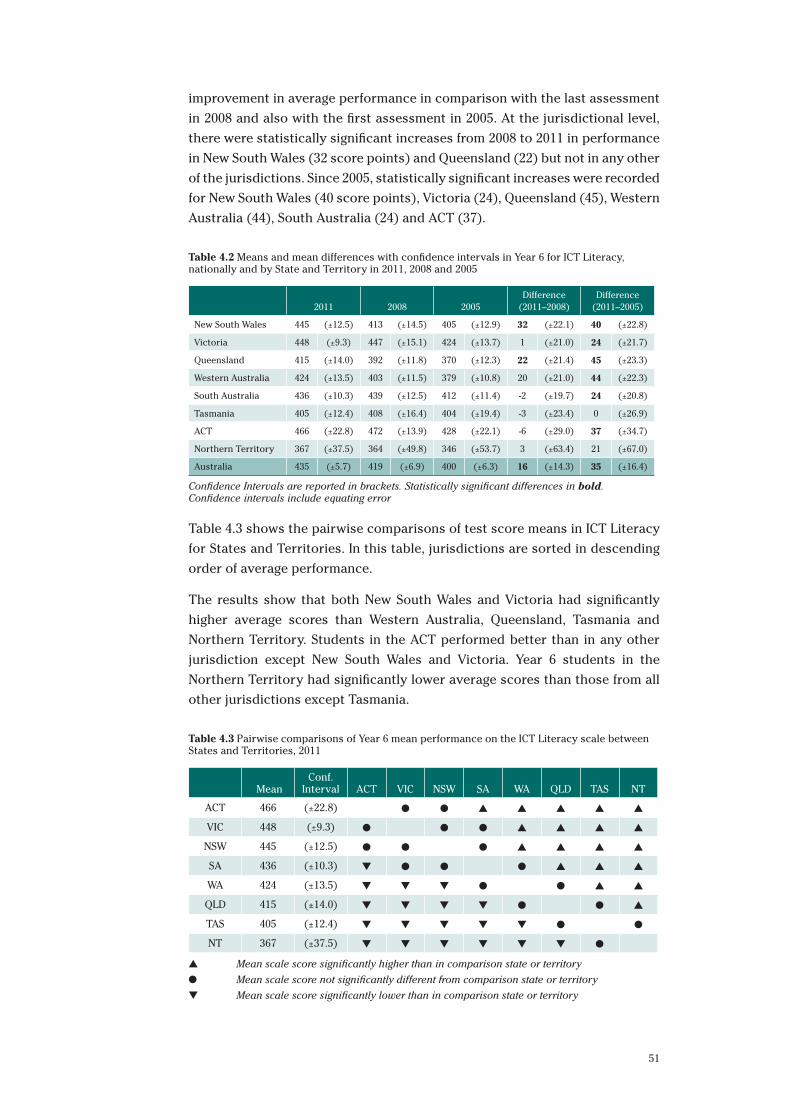
51
improvement in average performance in comparison with the last assessment
in 2008 and also with the first assessment in 2005. At the jurisdictional level,
there were statistically significant increases from 2008 to 2011 in performance
in New South Wales (32 score points) and Queensland (22) but not in any other
of the jurisdictions. Since 2005, statistically significant increases were recorded
for New South Wales (40 score points), Victoria (24), Queensland (45), Western
Australia (44), South Australia (24) and ACT (37).
Table 4.2 Means and mean differences with confidence intervals in Year 6 for ICT Literacy, nationally and by State and Territory in 2011, 2008 and 2005
2011 2008 2005Difference
(2011–2008)Difference
(2011–2005)
New South Wales 445 (±12.5) 413 (±14.5) 405 (±12.9) 32 (±22.1) 40 (±22.8)
Victoria 448 (±9.3) 447 (±15.1) 424 (±13.7) 1 (±21.0) 24 (±21.7)
Queensland 415 (±14.0) 392 (±11.8) 370 (±12.3) 22 (±21.4) 45 (±23.3)
Western Australia 424 (±13.5) 403 (±11.5) 379 (±10.8) 20 (±21.0) 44 (±22.3)
South Australia 436 (±10.3) 439 (±12.5) 412 (±11.4) -2 (±19.7) 24 (±20.8)
Tasmania 405 (±12.4) 408 (±16.4) 404 (±19.4) -3 (±23.4) 0 (±26.9)
ACT 466 (±22.8) 472 (±13.9) 428 (±22.1) -6 (±29.0) 37 (±34.7)
Northern Territory 367 (±37.5) 364 (±49.8) 346 (±53.7) 3 (±63.4) 21 (±67.0)
Australia 435 (±5.7) 419 (±6.9) 400 (±6.3) 16 (±14.3) 35 (±16.4)
Confidence Intervals are reported in brackets. Statistically significant differences in bold. Confidence intervals include equating error
Table 4.3 shows the pairwise comparisons of test score means in ICT Literacy
for States and Territories. In this table, jurisdictions are sorted in descending
order of average performance.
The results show that both New South Wales and Victoria had significantly
higher average scores than Western Australia, Queensland, Tasmania and
Northern Territory. Students in the ACT performed better than in any other
jurisdiction except New South Wales and Victoria. Year 6 students in the
Northern Territory had significantly lower average scores than those from all
other jurisdictions except Tasmania.
Table 4.3 Pairwise comparisons of Year 6 mean performance on the ICT Literacy scale between States and Territories, 2011
MeanConf.
Interval ACT VIC NSW SA WA QLD TAS NT
ACT 466 (±22.8) ● ● ▲ ▲ ▲ ▲ ▲
VIC 448 (±9.3) ● ● ● ▲ ▲ ▲ ▲
NSW 445 (±12.5) ● ● ● ▲ ▲ ▲ ▲
SA 436 (±10.3) ▼ ● ● ● ▲ ▲ ▲
WA 424 (±13.5) ▼ ▼ ▼ ● ● ▲ ▲
QLD 415 (±14.0) ▼ ▼ ▼ ▼ ● ● ▲
TAS 405 (±12.4) ▼ ▼ ▼ ▼ ▼ ● ●
NT 367 (±37.5) ▼ ▼ ▼ ▼ ▼ ▼ ●
▲ Mean scale score significantly higher than in comparison state or territory
● Mean scale score not significantly different from comparison state or territory
▼ Mean scale score significantly lower than in comparison state or territory
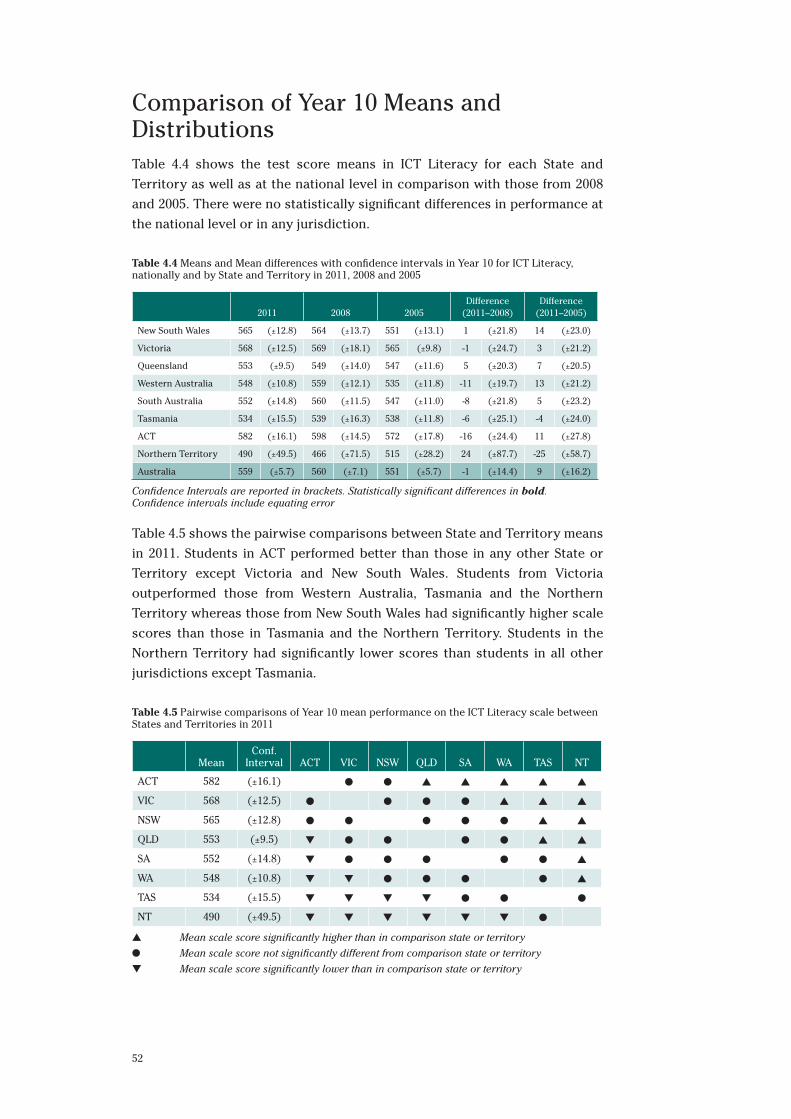
52
Comparison of Year 10 Means and Distributions Table 4.4 shows the test score means in ICT Literacy for each State and
Territory as well as at the national level in comparison with those from 2008
and 2005. There were no statistically significant differences in performance at
the national level or in any jurisdiction.
Table 4.4 Means and Mean differences with confidence intervals in Year 10 for ICT Literacy, nationally and by State and Territory in 2011, 2008 and 2005
2011 2008 2005Difference
(2011–2008)Difference
(2011–2005)
New South Wales 565 (±12.8) 564 (±13.7) 551 (±13.1) 1 (±21.8) 14 (±23.0)
Victoria 568 (±12.5) 569 (±18.1) 565 (±9.8) -1 (±24.7) 3 (±21.2)
Queensland 553 (±9.5) 549 (±14.0) 547 (±11.6) 5 (±20.3) 7 (±20.5)
Western Australia 548 (±10.8) 559 (±12.1) 535 (±11.8) -11 (±19.7) 13 (±21.2)
South Australia 552 (±14.8) 560 (±11.5) 547 (±11.0) -8 (±21.8) 5 (±23.2)
Tasmania 534 (±15.5) 539 (±16.3) 538 (±11.8) -6 (±25.1) -4 (±24.0)
ACT 582 (±16.1) 598 (±14.5) 572 (±17.8) -16 (±24.4) 11 (±27.8)
Northern Territory 490 (±49.5) 466 (±71.5) 515 (±28.2) 24 (±87.7) -25 (±58.7)
Australia 559 (±5.7) 560 (±7.1) 551 (±5.7) -1 (±14.4) 9 (±16.2)
Confidence Intervals are reported in brackets. Statistically significant differences in bold. Confidence intervals include equating error
Table 4.5 shows the pairwise comparisons between State and Territory means
in 2011. Students in ACT performed better than those in any other State or
Territory except Victoria and New South Wales. Students from Victoria
outperformed those from Western Australia, Tasmania and the Northern
Territory whereas those from New South Wales had significantly higher scale
scores than those in Tasmania and the Northern Territory. Students in the
Northern Territory had significantly lower scores than students in all other
jurisdictions except Tasmania.
Table 4.5 Pairwise comparisons of Year 10 mean performance on the ICT Literacy scale between States and Territories in 2011
MeanConf.
Interval ACT VIC NSW QLD SA WA TAS NT
ACT 582 (±16.1) ● ● ▲ ▲ ▲ ▲ ▲
VIC 568 (±12.5) ● ● ● ● ▲ ▲ ▲
NSW 565 (±12.8) ● ● ● ● ● ▲ ▲
QLD 553 (±9.5) ▼ ● ● ● ● ▲ ▲
SA 552 (±14.8) ▼ ● ● ● ● ● ▲
WA 548 (±10.8) ▼ ▼ ● ● ● ● ▲
TAS 534 (±15.5) ▼ ▼ ▼ ▼ ● ● ●
NT 490 (±49.5) ▼ ▼ ▼ ▼ ▼ ▼ ●
▲ Mean scale score significantly higher than in comparison state or territory
● Mean scale score not significantly different from comparison state or territory
▼ Mean scale score significantly lower than in comparison state or territory
53
Percentages Attaining the Proficient StandardsThe information in this section draws on the distribution of students’
performance across proficiency levels as described in Chapter 3. In the
first national assessment of ICT Literacy in 2005 six proficiency bands were
established for both year levels ranging from Level 1 to Level 6. Percentages
of students within these bands and their confidence intervals were computed
nationally as well as by State and Territory for each year level. The Proficient
Standard was reached if a Year 6 student’s score was above Level 2 or if a
Year 10 student’s score was above Level 3 and this section focuses on the
percentages of students attaining the Proficient Standards, which are the Key
Performance Measures for ICT Literacy (ACARA, 2011). This section focuses
on the percentages of students attaining the proficient standard in each
jurisdiction.
Year 6 Percentages Attaining the Proficient Standard
Table 4.6 records the percentages of Year 6 students who attained the Proficient
Standard (above Level 2). ACT had the highest percentage of Year 6 students
reaching the Proficient Standard in 2011 (74%) whereas the lowest percentage
(42%) was among students from the Northern Territory. The largest increase
in percentage of students reaching the Proficient Standard was recorded for
New South Wales. These data show statistically significant increases in the
percentage of Year 6 students attaining the Proficient Standard since 2005 at
the national level as well as in four of the jurisdictions.
Table 4.6 also presents data concerning the percentages of students attaining the
Year 6 Proficient Standard in 2005 and 2011. Statistically significant differences
between the percentages attaining the Proficient Standard in 2005 and 2011 are
shown in bold. Statistically significant increases in the percentages of students
reaching the Proficient Standard since 2008 were recorded only for New South
Wales and Western Australia whereas the increase at the national level was not
statistically significant.
Figure 4.1 displays these patterns in graphical form.
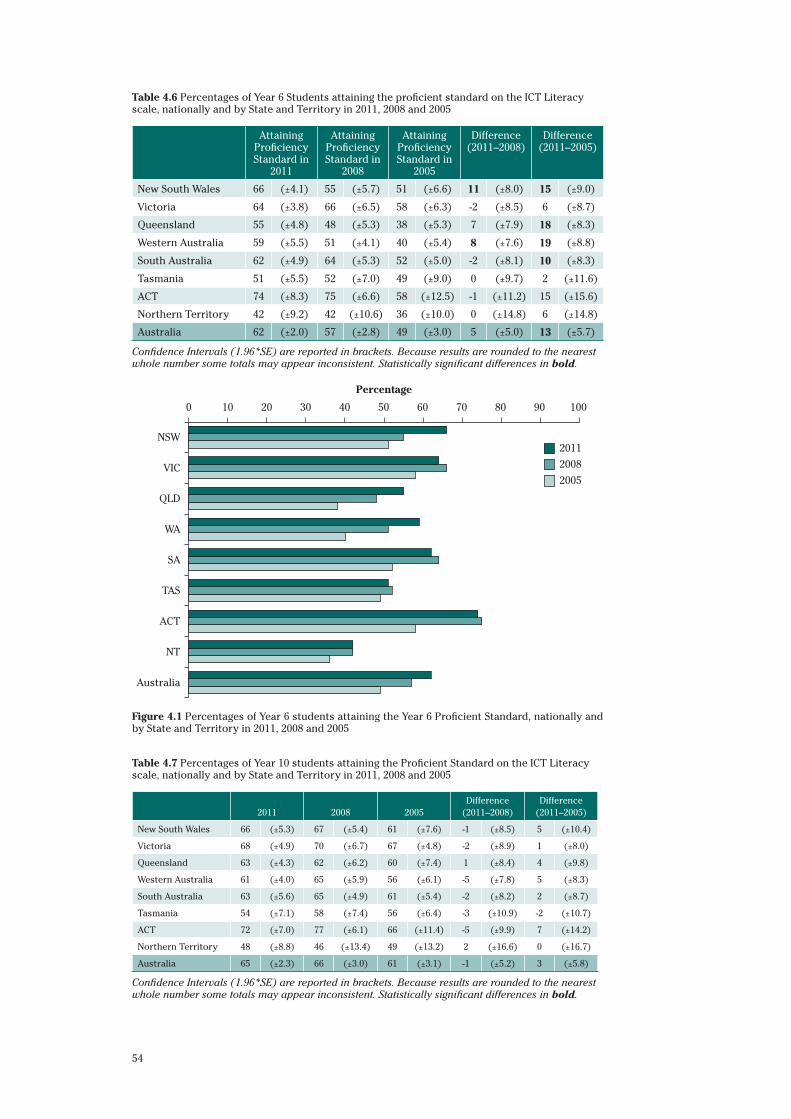
54
Table 4.6 Percentages of Year 6 Students attaining the proficient standard on the ICT Literacy scale, nationally and by State and Territory in 2011, 2008 and 2005
Attaining Proficiency Standard in
2011
Attaining Proficiency Standard in
2008
Attaining Proficiency Standard in
2005
Difference (2011–2008)
Difference (2011–2005)
New South Wales 66 (±4.1) 55 (±5.7) 51 (±6.6) 11 (±8.0) 15 (±9.0)
Victoria 64 (±3.8) 66 (±6.5) 58 (±6.3) -2 (±8.5) 6 (±8.7)
Queensland 55 (±4.8) 48 (±5.3) 38 (±5.3) 7 (±7.9) 18 (±8.3)
Western Australia 59 (±5.5) 51 (±4.1) 40 (±5.4) 8 (±7.6) 19 (±8.8)
South Australia 62 (±4.9) 64 (±5.3) 52 (±5.0) -2 (±8.1) 10 (±8.3)
Tasmania 51 (±5.5) 52 (±7.0) 49 (±9.0) 0 (±9.7) 2 (±11.6)
ACT 74 (±8.3) 75 (±6.6) 58 (±12.5) -1 (±11.2) 15 (±15.6)
Northern Territory 42 (±9.2) 42 (±10.6) 36 (±10.0) 0 (±14.8) 6 (±14.8)
Australia 62 (±2.0) 57 (±2.8) 49 (±3.0) 5 (±5.0) 13 (±5.7)
Confidence Intervals (1.96*SE) are reported in brackets. Because results are rounded to the nearest whole number some totals may appear inconsistent. Statistically significant differences in bold.
Percentage
0 10 20 30 40 50 60 70 80 90 100
NSW
VIC
QLD
WA
SA
TAS
ACT
NT
Australia
2005
2008
2011
Figure 4.1 Percentages of Year 6 students attaining the Year 6 Proficient Standard, nationally and by State and Territory in 2011, 2008 and 2005
Table 4.7 Percentages of Year 10 students attaining the Proficient Standard on the ICT Literacy scale, nationally and by State and Territory in 2011, 2008 and 2005
2011 2008 2005Difference
(2011–2008)Difference
(2011–2005)
New South Wales 66 (±5.3) 67 (±5.4) 61 (±7.6) -1 (±8.5) 5 (±10.4)
Victoria 68 (±4.9) 70 (±6.7) 67 (±4.8) -2 (±8.9) 1 (±8.0)
Queensland 63 (±4.3) 62 (±6.2) 60 (±7.4) 1 (±8.4) 4 (±9.8)
Western Australia 61 (±4.0) 65 (±5.9) 56 (±6.1) -5 (±7.8) 5 (±8.3)
South Australia 63 (±5.6) 65 (±4.9) 61 (±5.4) -2 (±8.2) 2 (±8.7)
Tasmania 54 (±7.1) 58 (±7.4) 56 (±6.4) -3 (±10.9) -2 (±10.7)
ACT 72 (±7.0) 77 (±6.1) 66 (±11.4) -5 (±9.9) 7 (±14.2)
Northern Territory 48 (±8.8) 46 (±13.4) 49 (±13.2) 2 (±16.6) 0 (±16.7)
Australia 65 (±2.3) 66 (±3.0) 61 (±3.1) -1 (±5.2) 3 (±5.8)
Confidence Intervals (1.96*SE) are reported in brackets. Because results are rounded to the nearest whole number some totals may appear inconsistent. Statistically significant differences in bold.
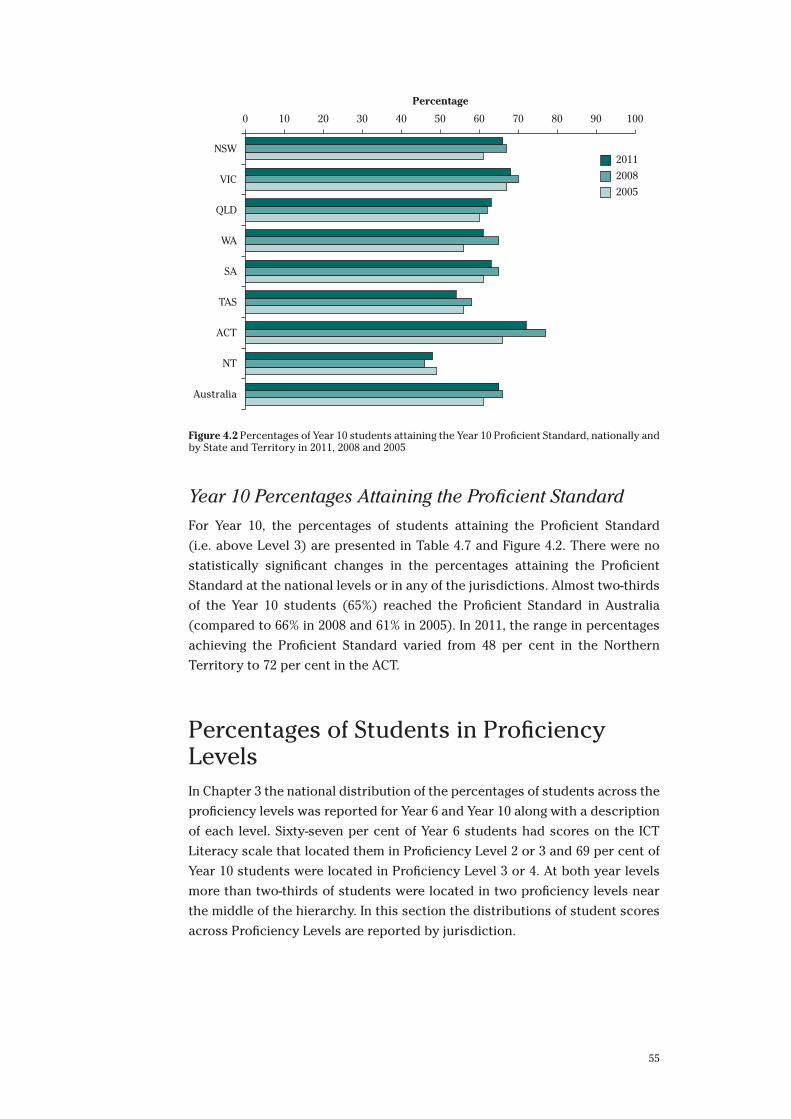
55
Percentage
0 10 20 30 40 50 60 70 80 90 100
NSW
VIC
QLD
WA
SA
TAS
ACT
NT
Australia
2005
2008
2011
Figure 4.2 Percentages of Year 10 students attaining the Year 10 Proficient Standard, nationally and by State and Territory in 2011, 2008 and 2005
Year 10 Percentages Attaining the Proficient Standard
For Year 10, the percentages of students attaining the Proficient Standard
(i.e. above Level 3) are presented in Table 4.7 and Figure 4.2. There were no
statistically significant changes in the percentages attaining the Proficient
Standard at the national levels or in any of the jurisdictions. Almost two-thirds
of the Year 10 students (65%) reached the Proficient Standard in Australia
(compared to 66% in 2008 and 61% in 2005). In 2011, the range in percentages
achieving the Proficient Standard varied from 48 per cent in the Northern
Territory to 72 per cent in the ACT.
Percentages of Students in Proficiency LevelsIn Chapter 3 the national distribution of the percentages of students across the
proficiency levels was reported for Year 6 and Year 10 along with a description
of each level. Sixty-seven per cent of Year 6 students had scores on the ICT
Literacy scale that located them in Proficiency Level 2 or 3 and 69 per cent of
Year 10 students were located in Proficiency Level 3 or 4. At both year levels
more than two-thirds of students were located in two proficiency levels near
the middle of the hierarchy. In this section the distributions of student scores
across Proficiency Levels are reported by jurisdiction.
56
Changes in the Distribution of Year 6 Students across Proficiency Levels
Table 4.8 records the percentage distribution of Year 6 students across
proficiency levels in 2011 as well as corresponding data for 2008 and 2005. In
this table Proficiency Levels 4, 5 and 6 have been combined because of the very
small numbers of students in Proficiency Levels 5 and 6 for many jurisdictions.
In 2011 there were 11 per cent of Year 6 students with scores located in
Proficiency Level 1. Within jurisdictions, this percentage ranged from seven
per cent in the ACT and eight per cent in Victoria to 29 per cent in the Northern
Territory. From 2008 to 2011, and from 2005 to 2011, there were no significant
changes in the percentages of Year 6 students in Proficiency Level 1 in any
jurisdiction or nationally.
Twenty-one per cent of all Year 6 students in Australia attained Level 4 or
above. This percentage ranged from 13 per cent in Tasmania and 14 per cent
in the Northern Territory to 30 per cent in the ACT. There were significant
increases in the percentages of Year 6 students in Proficiency Levels 4, 5 and
6 in most jurisdictions. Between 2008 and 2011 there were increases in New
South Wales and Queensland, as well as nationally. Between 2005 and 2011
there were increases in all jurisdictions except Tasmania, as well as nationally.
Changes in the Distribution of Year 10 Students across Proficiency Levels
Table 4.9 records the percentage distribution of Year 10 students across
Proficiency Levels in 2011 as well as corresponding data for 2008 and 2005. In
this table Proficiency Levels 1 and 2 as well as 5 and 6 have been combined
because of the very small numbers of students in Proficiency Levels 1 and 6
for many jurisdictions.
In 2011 there were ten per cent of Year 10 students with scores located in
Proficiency Levels 1 and 2 and 21 per cent with scores located in Proficiency
Levels 5 and 6. The percentages of the low performers ranged from seven, eight
and nine per cent in the ACT, New South Wales and Victoria, respectively, to 24
per cent in the Northern Territory. The high performers ranged from ten per
cent in the Northern Territory to 28 per cent in the ACT.
From 2008 to 2011 there was a significant increase in the percentage of Year 10
students in Proficiency Levels 1 and 2 in Western Australia, but not in any other
jurisdiction or nationally. From 2005 to 2011 there was a significant increase in
Queensland and South Australia, as well as nationally.
The percentage of Year 10 students in the highest proficiency levels did not
change significantly between 2008 to 2011 in any jurisdiction or nationally. From
2005 to 2011 there was a significant increase in New South Wales, Queensland,
Western Australia and South Australia, as well as nationally.
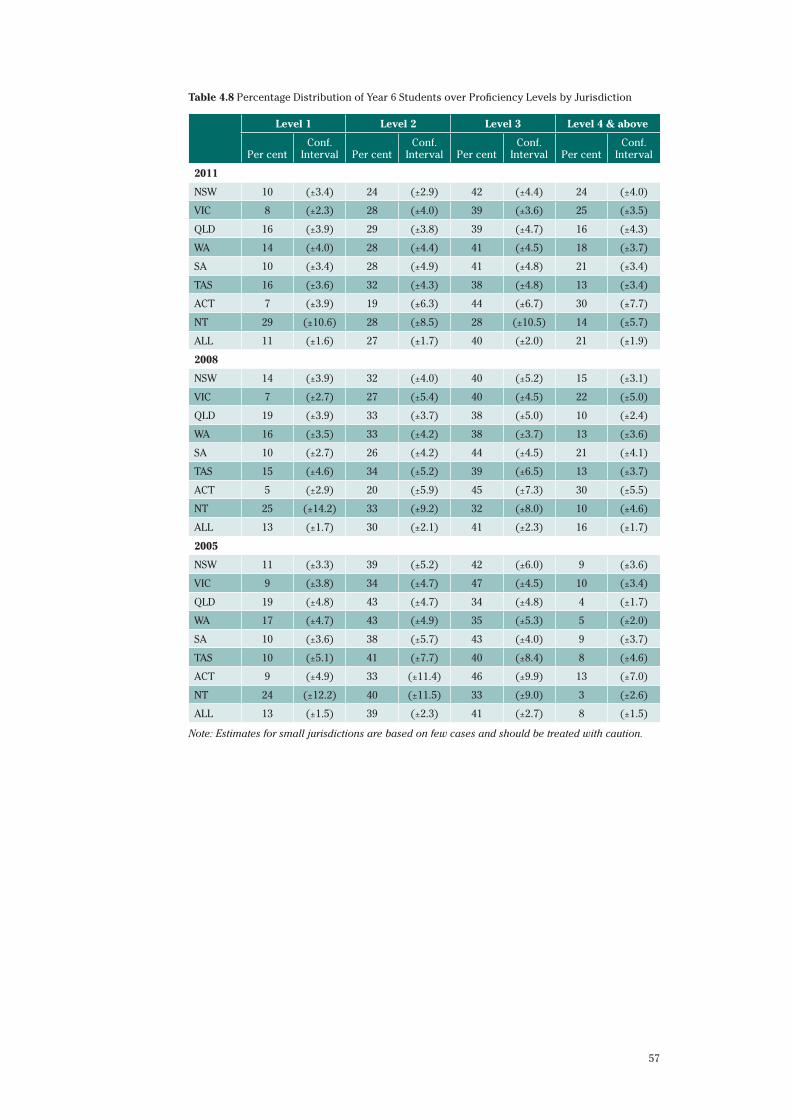
57
Table 4.8 Percentage Distribution of Year 6 Students over Proficiency Levels by Jurisdiction
Level 1 Level 2 Level 3 Level 4 & above
Per centConf.
Interval Per centConf.
Interval Per centConf.
Interval Per centConf.
Interval
2011
NSW 10 (±3.4) 24 (±2.9) 42 (±4.4) 24 (±4.0)
VIC 8 (±2.3) 28 (±4.0) 39 (±3.6) 25 (±3.5)
QLD 16 (±3.9) 29 (±3.8) 39 (±4.7) 16 (±4.3)
WA 14 (±4.0) 28 (±4.4) 41 (±4.5) 18 (±3.7)
SA 10 (±3.4) 28 (±4.9) 41 (±4.8) 21 (±3.4)
TAS 16 (±3.6) 32 (±4.3) 38 (±4.8) 13 (±3.4)
ACT 7 (±3.9) 19 (±6.3) 44 (±6.7) 30 (±7.7)
NT 29 (±10.6) 28 (±8.5) 28 (±10.5) 14 (±5.7)
ALL 11 (±1.6) 27 (±1.7) 40 (±2.0) 21 (±1.9)
2008
NSW 14 (±3.9) 32 (±4.0) 40 (±5.2) 15 (±3.1)
VIC 7 (±2.7) 27 (±5.4) 40 (±4.5) 22 (±5.0)
QLD 19 (±3.9) 33 (±3.7) 38 (±5.0) 10 (±2.4)
WA 16 (±3.5) 33 (±4.2) 38 (±3.7) 13 (±3.6)
SA 10 (±2.7) 26 (±4.2) 44 (±4.5) 21 (±4.1)
TAS 15 (±4.6) 34 (±5.2) 39 (±6.5) 13 (±3.7)
ACT 5 (±2.9) 20 (±5.9) 45 (±7.3) 30 (±5.5)
NT 25 (±14.2) 33 (±9.2) 32 (±8.0) 10 (±4.6)
ALL 13 (±1.7) 30 (±2.1) 41 (±2.3) 16 (±1.7)
2005
NSW 11 (±3.3) 39 (±5.2) 42 (±6.0) 9 (±3.6)
VIC 9 (±3.8) 34 (±4.7) 47 (±4.5) 10 (±3.4)
QLD 19 (±4.8) 43 (±4.7) 34 (±4.8) 4 (±1.7)
WA 17 (±4.7) 43 (±4.9) 35 (±5.3) 5 (±2.0)
SA 10 (±3.6) 38 (±5.7) 43 (±4.0) 9 (±3.7)
TAS 10 (±5.1) 41 (±7.7) 40 (±8.4) 8 (±4.6)
ACT 9 (±4.9) 33 (±11.4) 46 (±9.9) 13 (±7.0)
NT 24 (±12.2) 40 (±11.5) 33 (±9.0) 3 (±2.6)
ALL 13 (±1.5) 39 (±2.3) 41 (±2.7) 8 (±1.5)
Note: Estimates for small jurisdictions are based on few cases and should be treated with caution.
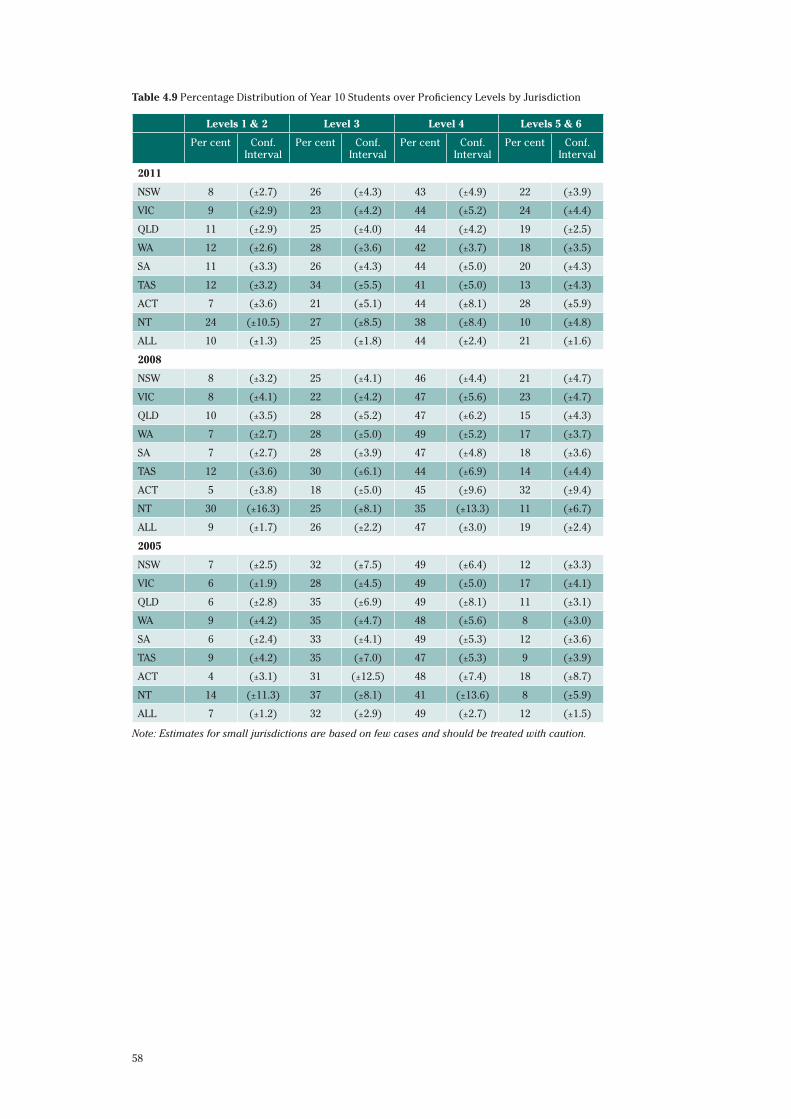
58
Table 4.9 Percentage Distribution of Year 10 Students over Proficiency Levels by Jurisdiction
Levels 1 & 2 Level 3 Level 4 Levels 5 & 6
Per cent Conf. Interval
Per cent Conf. Interval
Per cent Conf. Interval
Per cent Conf. Interval
2011
NSW 8 (±2.7) 26 (±4.3) 43 (±4.9) 22 (±3.9)
VIC 9 (±2.9) 23 (±4.2) 44 (±5.2) 24 (±4.4)
QLD 11 (±2.9) 25 (±4.0) 44 (±4.2) 19 (±2.5)
WA 12 (±2.6) 28 (±3.6) 42 (±3.7) 18 (±3.5)
SA 11 (±3.3) 26 (±4.3) 44 (±5.0) 20 (±4.3)
TAS 12 (±3.2) 34 (±5.5) 41 (±5.0) 13 (±4.3)
ACT 7 (±3.6) 21 (±5.1) 44 (±8.1) 28 (±5.9)
NT 24 (±10.5) 27 (±8.5) 38 (±8.4) 10 (±4.8)
ALL 10 (±1.3) 25 (±1.8) 44 (±2.4) 21 (±1.6)
2008
NSW 8 (±3.2) 25 (±4.1) 46 (±4.4) 21 (±4.7)
VIC 8 (±4.1) 22 (±4.2) 47 (±5.6) 23 (±4.7)
QLD 10 (±3.5) 28 (±5.2) 47 (±6.2) 15 (±4.3)
WA 7 (±2.7) 28 (±5.0) 49 (±5.2) 17 (±3.7)
SA 7 (±2.7) 28 (±3.9) 47 (±4.8) 18 (±3.6)
TAS 12 (±3.6) 30 (±6.1) 44 (±6.9) 14 (±4.4)
ACT 5 (±3.8) 18 (±5.0) 45 (±9.6) 32 (±9.4)
NT 30 (±16.3) 25 (±8.1) 35 (±13.3) 11 (±6.7)
ALL 9 (±1.7) 26 (±2.2) 47 (±3.0) 19 (±2.4)
2005
NSW 7 (±2.5) 32 (±7.5) 49 (±6.4) 12 (±3.3)
VIC 6 (±1.9) 28 (±4.5) 49 (±5.0) 17 (±4.1)
QLD 6 (±2.8) 35 (±6.9) 49 (±8.1) 11 (±3.1)
WA 9 (±4.2) 35 (±4.7) 48 (±5.6) 8 (±3.0)
SA 6 (±2.4) 33 (±4.1) 49 (±5.3) 12 (±3.6)
TAS 9 (±4.2) 35 (±7.0) 47 (±5.3) 9 (±3.9)
ACT 4 (±3.1) 31 (±12.5) 48 (±7.4) 18 (±8.7)
NT 14 (±11.3) 37 (±8.1) 41 (±13.6) 8 (±5.9)
ALL 7 (±1.2) 32 (±2.9) 49 (±2.7) 12 (±1.5)
Note: Estimates for small jurisdictions are based on few cases and should be treated with caution.
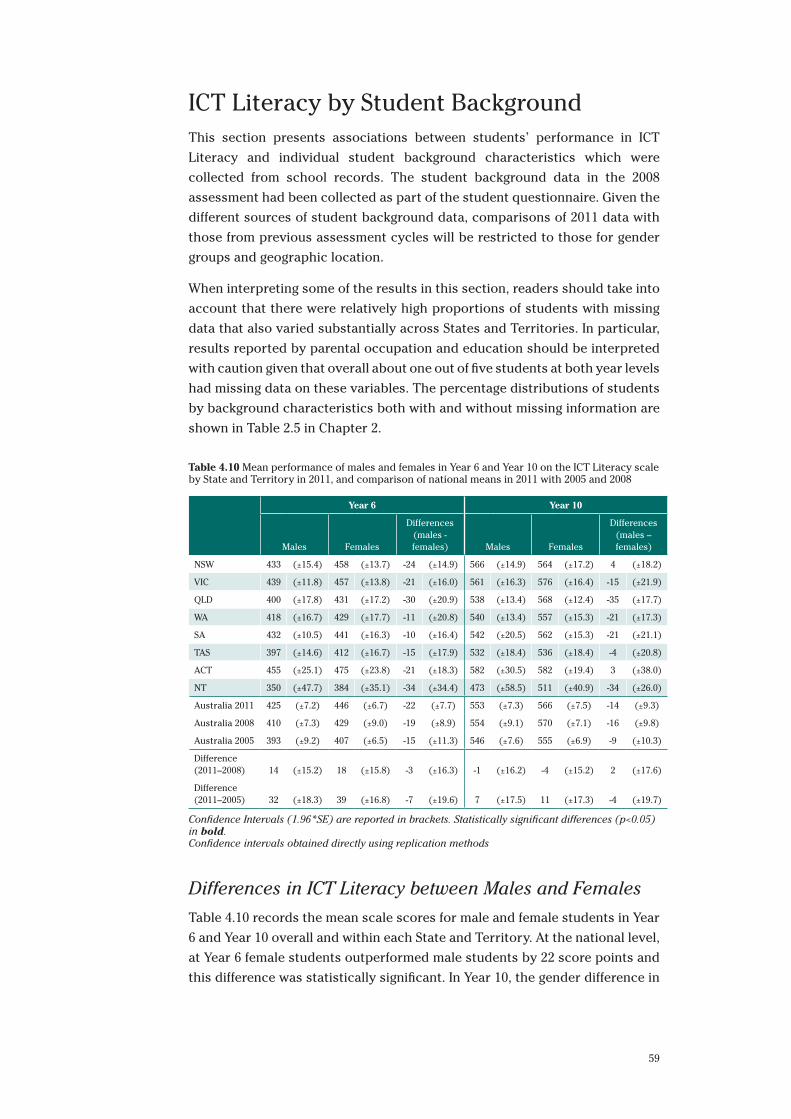
59
ICT Literacy by Student BackgroundThis section presents associations between students’ performance in ICT
Literacy and individual student background characteristics which were
collected from school records. The student background data in the 2008
assessment had been collected as part of the student questionnaire. Given the
different sources of student background data, comparisons of 2011 data with
those from previous assessment cycles will be restricted to those for gender
groups and geographic location.
When interpreting some of the results in this section, readers should take into
account that there were relatively high proportions of students with missing
data that also varied substantially across States and Territories. In particular,
results reported by parental occupation and education should be interpreted
with caution given that overall about one out of five students at both year levels
had missing data on these variables. The percentage distributions of students
by background characteristics both with and without missing information are
shown in Table 2.5 in Chapter 2.
Table 4.10 Mean performance of males and females in Year 6 and Year 10 on the ICT Literacy scale by State and Territory in 2011, and comparison of national means in 2011 with 2005 and 2008
Year 6 Year 10
Males Females
Differences (males - females) Males Females
Differences (males – females)
NSW 433 (±15.4) 458 (±13.7) -24 (±14.9) 566 (±14.9) 564 (±17.2) 4 (±18.2)
VIC 439 (±11.8) 457 (±13.8) -21 (±16.0) 561 (±16.3) 576 (±16.4) -15 (±21.9)
QLD 400 (±17.8) 431 (±17.2) -30 (±20.9) 538 (±13.4) 568 (±12.4) -35 (±17.7)
WA 418 (±16.7) 429 (±17.7) -11 (±20.8) 540 (±13.4) 557 (±15.3) -21 (±17.3)
SA 432 (±10.5) 441 (±16.3) -10 (±16.4) 542 (±20.5) 562 (±15.3) -21 (±21.1)
TAS 397 (±14.6) 412 (±16.7) -15 (±17.9) 532 (±18.4) 536 (±18.4) -4 (±20.8)
ACT 455 (±25.1) 475 (±23.8) -21 (±18.3) 582 (±30.5) 582 (±19.4) 3 (±38.0)
NT 350 (±47.7) 384 (±35.1) -34 (±34.4) 473 (±58.5) 511 (±40.9) -34 (±26.0)
Australia 2011 425 (±7.2) 446 (±6.7) -22 (±7.7) 553 (±7.3) 566 (±7.5) -14 (±9.3)
Australia 2008 410 (±7.3) 429 (±9.0) -19 (±8.9) 554 (±9.1) 570 (±7.1) -16 (±9.8)
Australia 2005 393 (±9.2) 407 (±6.5) -15 (±11.3) 546 (±7.6) 555 (±6.9) -9 (±10.3)
Difference (2011–2008) 14 (±15.2) 18 (±15.8) -3 (±16.3) -1 (±16.2) -4 (±15.2) 2 (±17.6)
Difference (2011–2005) 32 (±18.3) 39 (±16.8) -7 (±19.6) 7 (±17.5) 11 (±17.3) -4 (±19.7)
Confidence Intervals (1.96*SE) are reported in brackets. Statistically significant differences (p<0.05) in bold. Confidence intervals obtained directly using replication methods
Differences in ICT Literacy between Males and Females
Table 4.10 records the mean scale scores for male and female students in Year
6 and Year 10 overall and within each State and Territory. At the national level,
at Year 6 female students outperformed male students by 22 score points and
this difference was statistically significant. In Year 10, the gender difference in
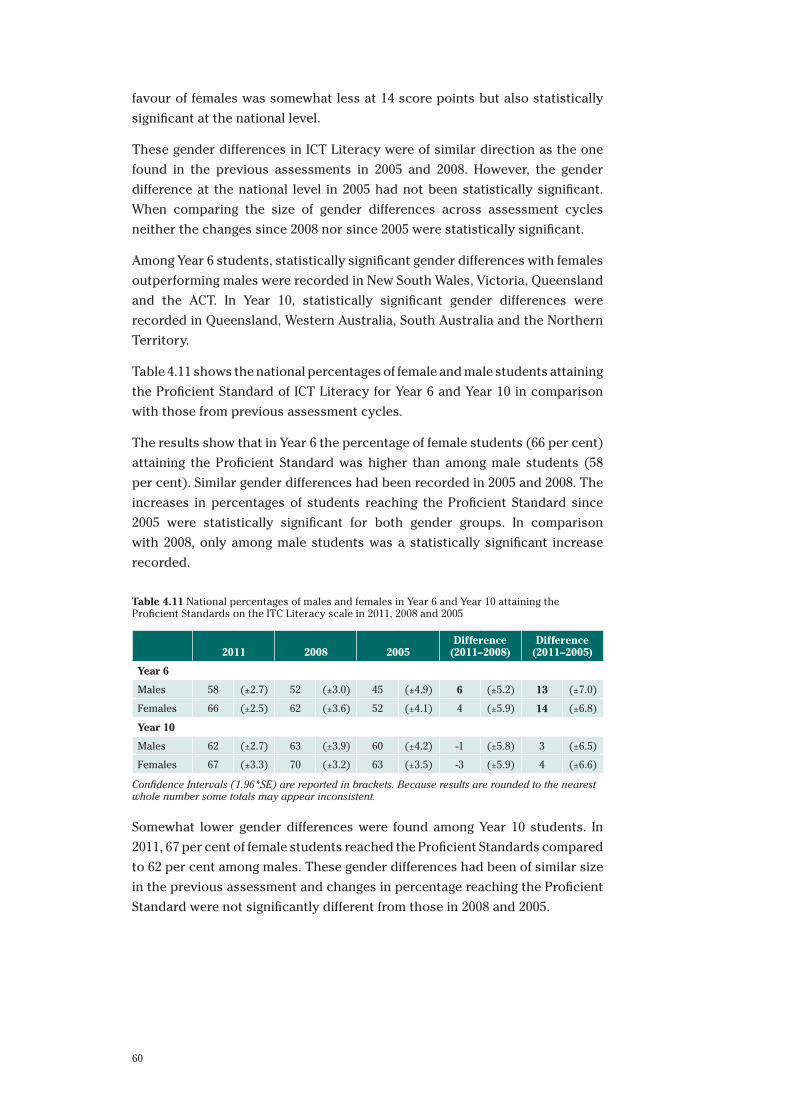
60
favour of females was somewhat less at 14 score points but also statistically
significant at the national level.
These gender differences in ICT Literacy were of similar direction as the one
found in the previous assessments in 2005 and 2008. However, the gender
difference at the national level in 2005 had not been statistically significant.
When comparing the size of gender differences across assessment cycles
neither the changes since 2008 nor since 2005 were statistically significant.
Among Year 6 students, statistically significant gender differences with females
outperforming males were recorded in New South Wales, Victoria, Queensland
and the ACT. In Year 10, statistically significant gender differences were
recorded in Queensland, Western Australia, South Australia and the Northern
Territory.
Table 4.11 shows the national percentages of female and male students attaining
the Proficient Standard of ICT Literacy for Year 6 and Year 10 in comparison
with those from previous assessment cycles.
The results show that in Year 6 the percentage of female students (66 per cent)
attaining the Proficient Standard was higher than among male students (58
per cent). Similar gender differences had been recorded in 2005 and 2008. The
increases in percentages of students reaching the Proficient Standard since
2005 were statistically significant for both gender groups. In comparison
with 2008, only among male students was a statistically significant increase
recorded.
Table 4.11 National percentages of males and females in Year 6 and Year 10 attaining the Proficient Standards on the ITC Literacy scale in 2011, 2008 and 2005
2011 2008 2005Difference
(2011–2008)Difference
(2011–2005)
Year 6
Males 58 (±2.7) 52 (±3.0) 45 (±4.9) 6 (±5.2) 13 (±7.0)
Females 66 (±2.5) 62 (±3.6) 52 (±4.1) 4 (±5.9) 14 (±6.8)
Year 10
Males 62 (±2.7) 63 (±3.9) 60 (±4.2) -1 (±5.8) 3 (±6.5)
Females 67 (±3.3) 70 (±3.2) 63 (±3.5) -3 (±5.9) 4 (±6.6)
Confidence Intervals (1.96*SE) are reported in brackets. Because results are rounded to the nearest whole number some totals may appear inconsistent.
Somewhat lower gender differences were found among Year 10 students. In
2011, 67 per cent of female students reached the Proficient Standards compared
to 62 per cent among males. These gender differences had been of similar size
in the previous assessment and changes in percentage reaching the Proficient
Standard were not significantly different from those in 2008 and 2005.
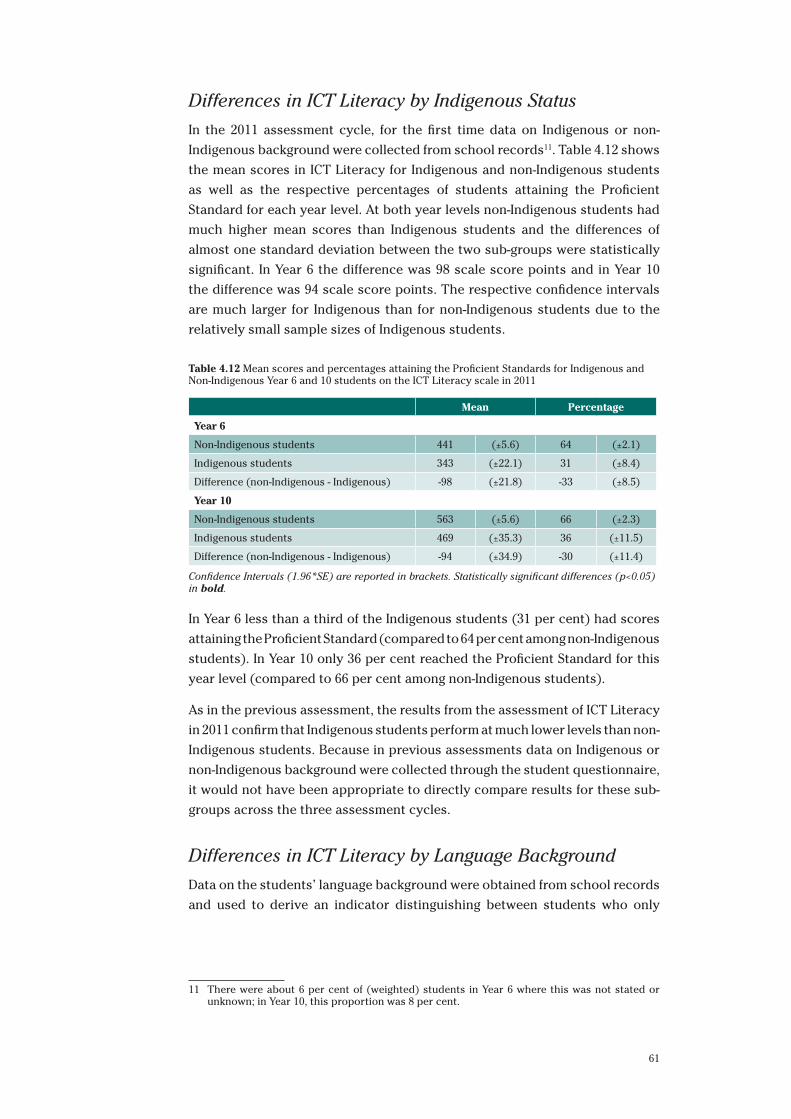
61
Differences in ICT Literacy by Indigenous Status
In the 2011 assessment cycle, for the first time data on Indigenous or non-
Indigenous background were collected from school records11. Table 4.12 shows
the mean scores in ICT Literacy for Indigenous and non-Indigenous students
as well as the respective percentages of students attaining the Proficient
Standard for each year level. At both year levels non-Indigenous students had
much higher mean scores than Indigenous students and the differences of
almost one standard deviation between the two sub-groups were statistically
significant. In Year 6 the difference was 98 scale score points and in Year 10
the difference was 94 scale score points. The respective confidence intervals
are much larger for Indigenous than for non-Indigenous students due to the
relatively small sample sizes of Indigenous students.
Table 4.12 Mean scores and percentages attaining the Proficient Standards for Indigenous and Non-Indigenous Year 6 and 10 students on the ICT Literacy scale in 2011
Mean Percentage
Year 6
Non-Indigenous students 441 (±5.6) 64 (±2.1)
Indigenous students 343 (±22.1) 31 (±8.4)
Difference (non-Indigenous - Indigenous) -98 (±21.8) -33 (±8.5)
Year 10
Non-Indigenous students 563 (±5.6) 66 (±2.3)
Indigenous students 469 (±35.3) 36 (±11.5)
Difference (non-Indigenous - Indigenous) -94 (±34.9) -30 (±11.4)
Confidence Intervals (1.96*SE) are reported in brackets. Statistically significant differences (p<0.05) in bold.
In Year 6 less than a third of the Indigenous students (31 per cent) had scores
attaining the Proficient Standard (compared to 64 per cent among non-Indigenous
students). In Year 10 only 36 per cent reached the Proficient Standard for this
year level (compared to 66 per cent among non-Indigenous students).
As in the previous assessment, the results from the assessment of ICT Literacy
in 2011 confirm that Indigenous students perform at much lower levels than non-
Indigenous students. Because in previous assessments data on Indigenous or
non-Indigenous background were collected through the student questionnaire,
it would not have been appropriate to directly compare results for these sub-
groups across the three assessment cycles.
Differences in ICT Literacy by Language Background
Data on the students’ language background were obtained from school records
and used to derive an indicator distinguishing between students who only
11 There were about 6 per cent of (weighted) students in Year 6 where this was not stated or unknown; in Year 10, this proportion was 8 per cent.
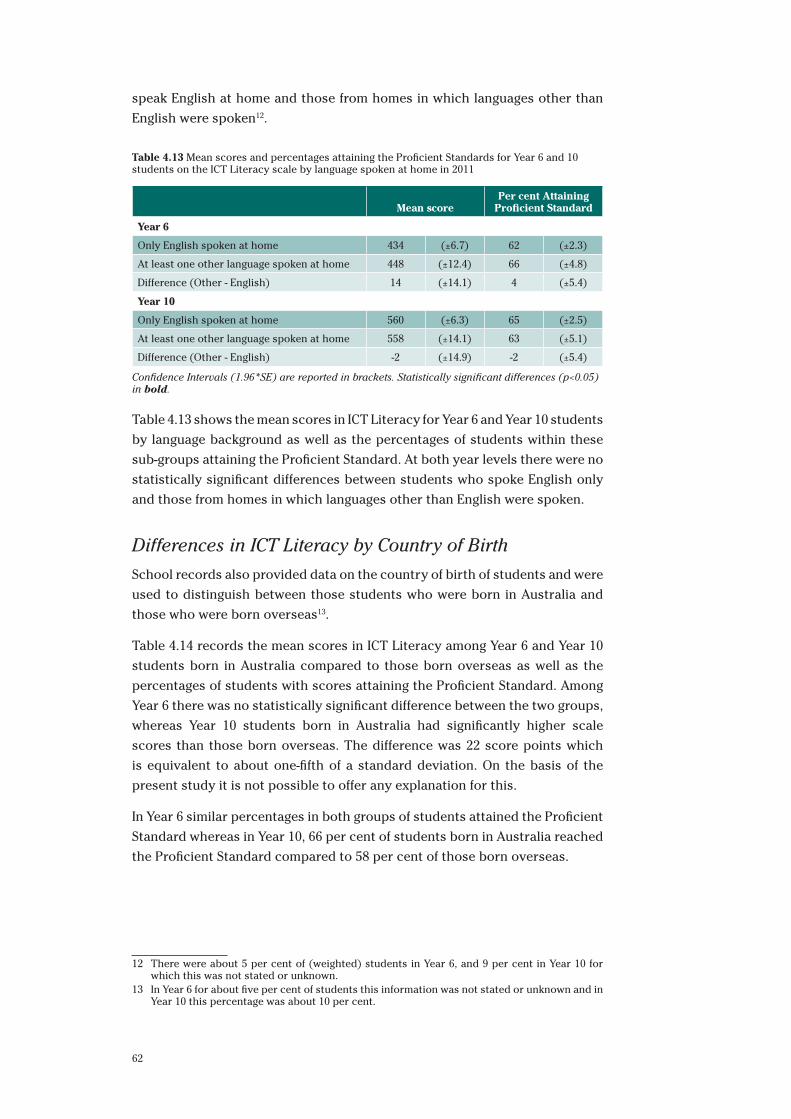
62
speak English at home and those from homes in which languages other than
English were spoken12.
Table 4.13 Mean scores and percentages attaining the Proficient Standards for Year 6 and 10 students on the ICT Literacy scale by language spoken at home in 2011
Mean scorePer cent Attaining
Proficient Standard
Year 6
Only English spoken at home 434 (±6.7) 62 (±2.3)
At least one other language spoken at home 448 (±12.4) 66 (±4.8)
Difference (Other - English) 14 (±14.1) 4 (±5.4)
Year 10
Only English spoken at home 560 (±6.3) 65 (±2.5)
At least one other language spoken at home 558 (±14.1) 63 (±5.1)
Difference (Other - English) -2 (±14.9) -2 (±5.4)
Confidence Intervals (1.96*SE) are reported in brackets. Statistically significant differences (p<0.05) in bold.
Table 4.13 shows the mean scores in ICT Literacy for Year 6 and Year 10 students
by language background as well as the percentages of students within these
sub-groups attaining the Proficient Standard. At both year levels there were no
statistically significant differences between students who spoke English only
and those from homes in which languages other than English were spoken.
Differences in ICT Literacy by Country of Birth
School records also provided data on the country of birth of students and were
used to distinguish between those students who were born in Australia and
those who were born overseas13.
Table 4.14 records the mean scores in ICT Literacy among Year 6 and Year 10
students born in Australia compared to those born overseas as well as the
percentages of students with scores attaining the Proficient Standard. Among
Year 6 there was no statistically significant difference between the two groups,
whereas Year 10 students born in Australia had significantly higher scale
scores than those born overseas. The difference was 22 score points which
is equivalent to about one-fifth of a standard deviation. On the basis of the
present study it is not possible to offer any explanation for this.
In Year 6 similar percentages in both groups of students attained the Proficient
Standard whereas in Year 10, 66 per cent of students born in Australia reached
the Proficient Standard compared to 58 per cent of those born overseas.
12 There were about 5 per cent of (weighted) students in Year 6, and 9 per cent in Year 10 for which this was not stated or unknown.
13 In Year 6 for about five per cent of students this information was not stated or unknown and in Year 10 this percentage was about 10 per cent.
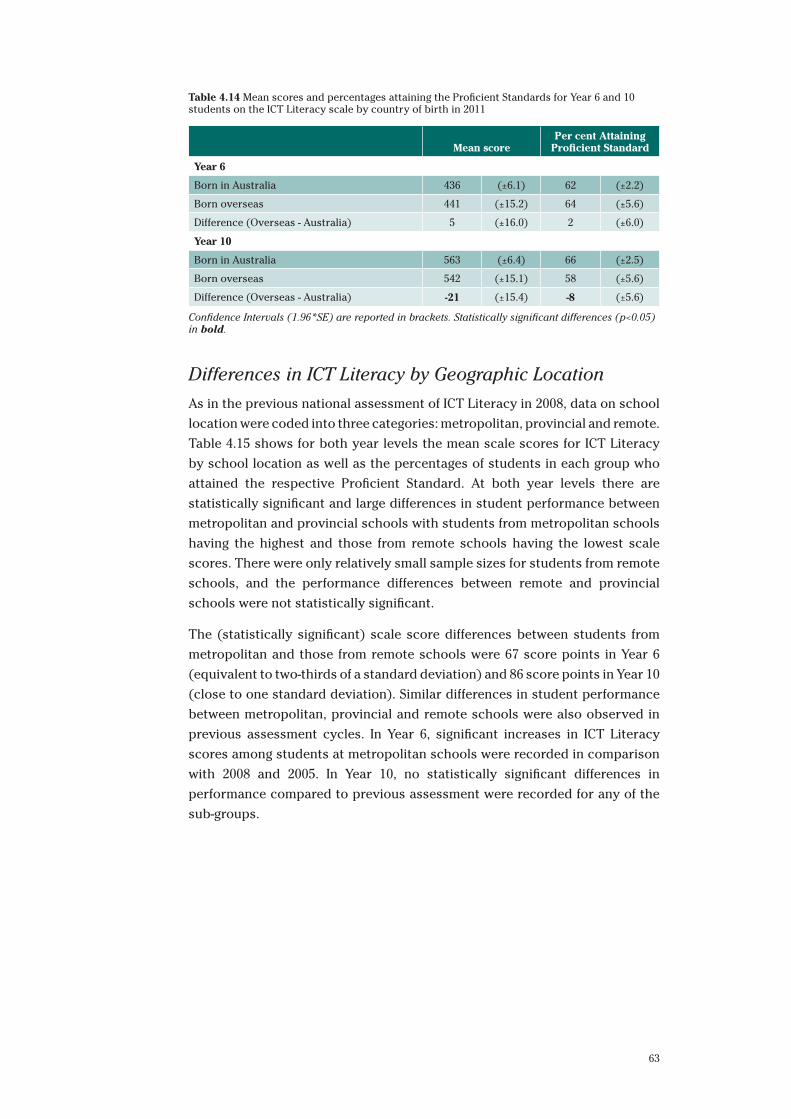
63
Table 4.14 Mean scores and percentages attaining the Proficient Standards for Year 6 and 10 students on the ICT Literacy scale by country of birth in 2011
Mean scorePer cent Attaining
Proficient Standard
Year 6
Born in Australia 436 (±6.1) 62 (±2.2)
Born overseas 441 (±15.2) 64 (±5.6)
Difference (Overseas - Australia) 5 (±16.0) 2 (±6.0)
Year 10
Born in Australia 563 (±6.4) 66 (±2.5)
Born overseas 542 (±15.1) 58 (±5.6)
Difference (Overseas - Australia) -21 (±15.4) -8 (±5.6)
Confidence Intervals (1.96*SE) are reported in brackets. Statistically significant differences (p<0.05) in bold.
Differences in ICT Literacy by Geographic Location
As in the previous national assessment of ICT Literacy in 2008, data on school
location were coded into three categories: metropolitan, provincial and remote.
Table 4.15 shows for both year levels the mean scale scores for ICT Literacy
by school location as well as the percentages of students in each group who
attained the respective Proficient Standard. At both year levels there are
statistically significant and large differences in student performance between
metropolitan and provincial schools with students from metropolitan schools
having the highest and those from remote schools having the lowest scale
scores. There were only relatively small sample sizes for students from remote
schools, and the performance differences between remote and provincial
schools were not statistically significant.
The (statistically significant) scale score differences between students from
metropolitan and those from remote schools were 67 score points in Year 6
(equivalent to two-thirds of a standard deviation) and 86 score points in Year 10
(close to one standard deviation). Similar differences in student performance
between metropolitan, provincial and remote schools were also observed in
previous assessment cycles. In Year 6, significant increases in ICT Literacy
scores among students at metropolitan schools were recorded in comparison
with 2008 and 2005. In Year 10, no statistically significant differences in
performance compared to previous assessment were recorded for any of the
sub-groups.
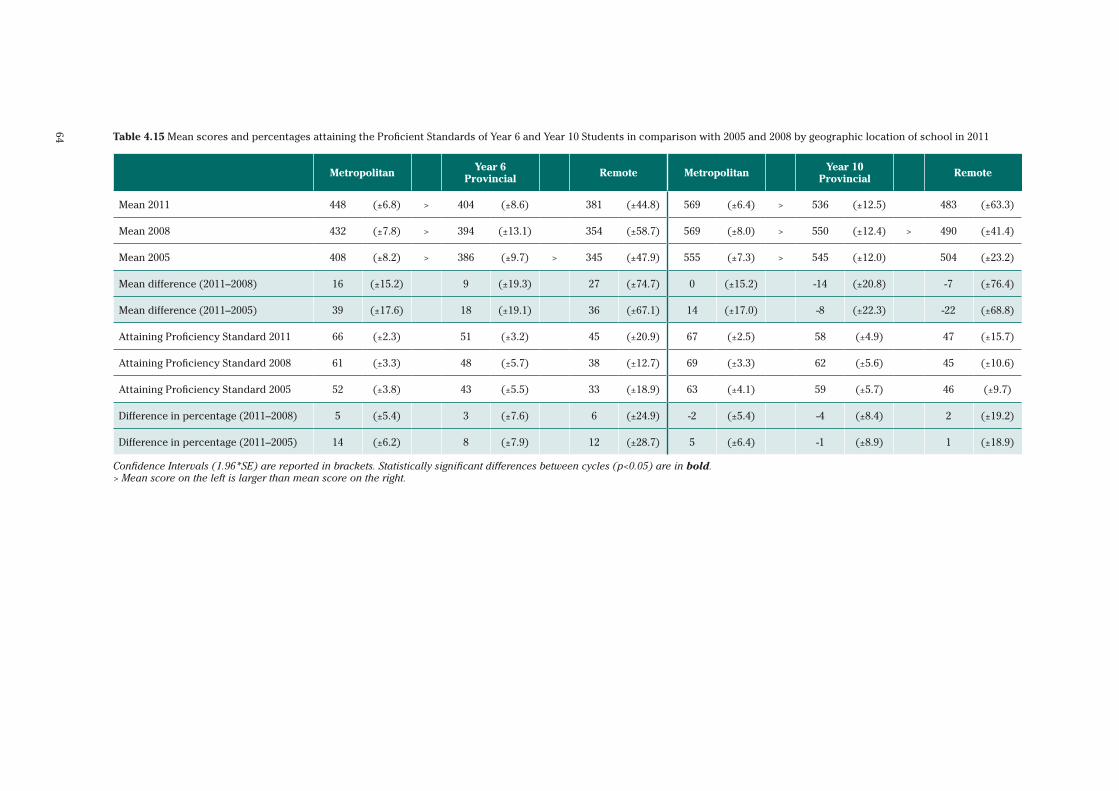
64 Table 4.15 Mean scores and percentages attaining the Proficient Standards of Year 6 and Year 10 Students in comparison with 2005 and 2008 by geographic location of school in 2011
Metropolitan Year 6 Provincial Remote Metropolitan Year 10
Provincial Remote
Mean 2011 448 (±6.8) > 404 (±8.6) 381 (±44.8) 569 (±6.4) > 536 (±12.5) 483 (±63.3)
Mean 2008 432 (±7.8) > 394 (±13.1) 354 (±58.7) 569 (±8.0) > 550 (±12.4) > 490 (±41.4)
Mean 2005 408 (±8.2) > 386 (±9.7) > 345 (±47.9) 555 (±7.3) > 545 (±12.0) 504 (±23.2)
Mean difference (2011–2008) 16 (±15.2) 9 (±19.3) 27 (±74.7) 0 (±15.2) -14 (±20.8) -7 (±76.4)
Mean difference (2011–2005) 39 (±17.6) 18 (±19.1) 36 (±67.1) 14 (±17.0) -8 (±22.3) -22 (±68.8)
Attaining Proficiency Standard 2011 66 (±2.3) 51 (±3.2) 45 (±20.9) 67 (±2.5) 58 (±4.9) 47 (±15.7)
Attaining Proficiency Standard 2008 61 (±3.3) 48 (±5.7) 38 (±12.7) 69 (±3.3) 62 (±5.6) 45 (±10.6)
Attaining Proficiency Standard 2005 52 (±3.8) 43 (±5.5) 33 (±18.9) 63 (±4.1) 59 (±5.7) 46 (±9.7)
Difference in percentage (2011–2008) 5 (±5.4) 3 (±7.6) 6 (±24.9) -2 (±5.4) -4 (±8.4) 2 (±19.2)
Difference in percentage (2011–2005) 14 (±6.2) 8 (±7.9) 12 (±28.7) 5 (±6.4) -1 (±8.9) 1 (±18.9)
Confidence Intervals (1.96*SE) are reported in brackets. Statistically significant differences between cycles (p<0.05) are in bold. > Mean score on the left is larger than mean score on the right.
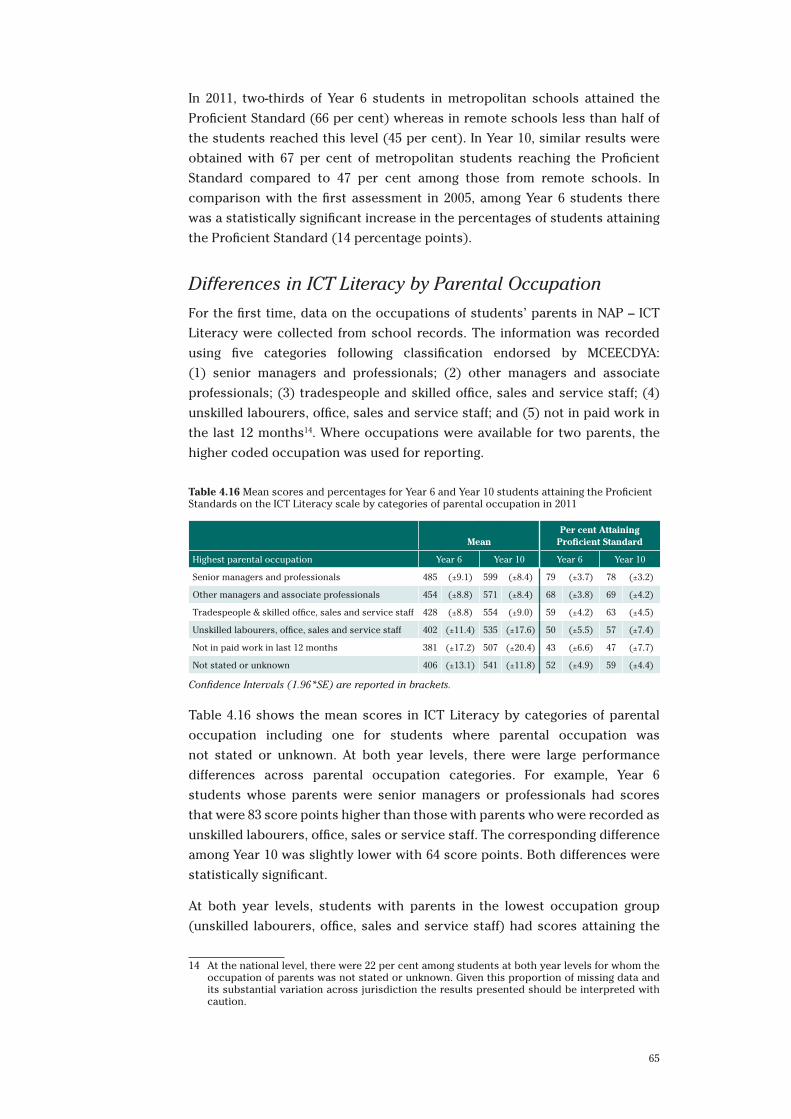
65
In 2011, two-thirds of Year 6 students in metropolitan schools attained the
Proficient Standard (66 per cent) whereas in remote schools less than half of
the students reached this level (45 per cent). In Year 10, similar results were
obtained with 67 per cent of metropolitan students reaching the Proficient
Standard compared to 47 per cent among those from remote schools. In
comparison with the first assessment in 2005, among Year 6 students there
was a statistically significant increase in the percentages of students attaining
the Proficient Standard (14 percentage points).
Differences in ICT Literacy by Parental Occupation
For the first time, data on the occupations of students’ parents in NAP – ICT
Literacy were collected from school records. The information was recorded
using five categories following classification endorsed by MCEECDYA:
(1) senior managers and professionals; (2) other managers and associate
professionals; (3) tradespeople and skilled office, sales and service staff; (4)
unskilled labourers, office, sales and service staff; and (5) not in paid work in
the last 12 months14. Where occupations were available for two parents, the
higher coded occupation was used for reporting.
Table 4.16 Mean scores and percentages for Year 6 and Year 10 students attaining the Proficient Standards on the ICT Literacy scale by categories of parental occupation in 2011
Mean
Per cent Attaining Proficient Standard
Highest parental occupation Year 6 Year 10 Year 6 Year 10
Senior managers and professionals 485 (±9.1) 599 (±8.4) 79 (±3.7) 78 (±3.2)
Other managers and associate professionals 454 (±8.8) 571 (±8.4) 68 (±3.8) 69 (±4.2)
Tradespeople & skilled office, sales and service staff 428 (±8.8) 554 (±9.0) 59 (±4.2) 63 (±4.5)
Unskilled labourers, office, sales and service staff 402 (±11.4) 535 (±17.6) 50 (±5.5) 57 (±7.4)
Not in paid work in last 12 months 381 (±17.2) 507 (±20.4) 43 (±6.6) 47 (±7.7)
Not stated or unknown 406 (±13.1) 541 (±11.8) 52 (±4.9) 59 (±4.4)
Confidence Intervals (1.96*SE) are reported in brackets.
Table 4.16 shows the mean scores in ICT Literacy by categories of parental
occupation including one for students where parental occupation was
not stated or unknown. At both year levels, there were large performance
differences across parental occupation categories. For example, Year 6
students whose parents were senior managers or professionals had scores
that were 83 score points higher than those with parents who were recorded as
unskilled labourers, office, sales or service staff. The corresponding difference
among Year 10 was slightly lower with 64 score points. Both differences were
statistically significant.
At both year levels, students with parents in the lowest occupation group
(unskilled labourers, office, sales and service staff) had scores attaining the
14 At the national level, there were 22 per cent among students at both year levels for whom the occupation of parents was not stated or unknown. Given this proportion of missing data and its substantial variation across jurisdiction the results presented should be interpreted with caution.
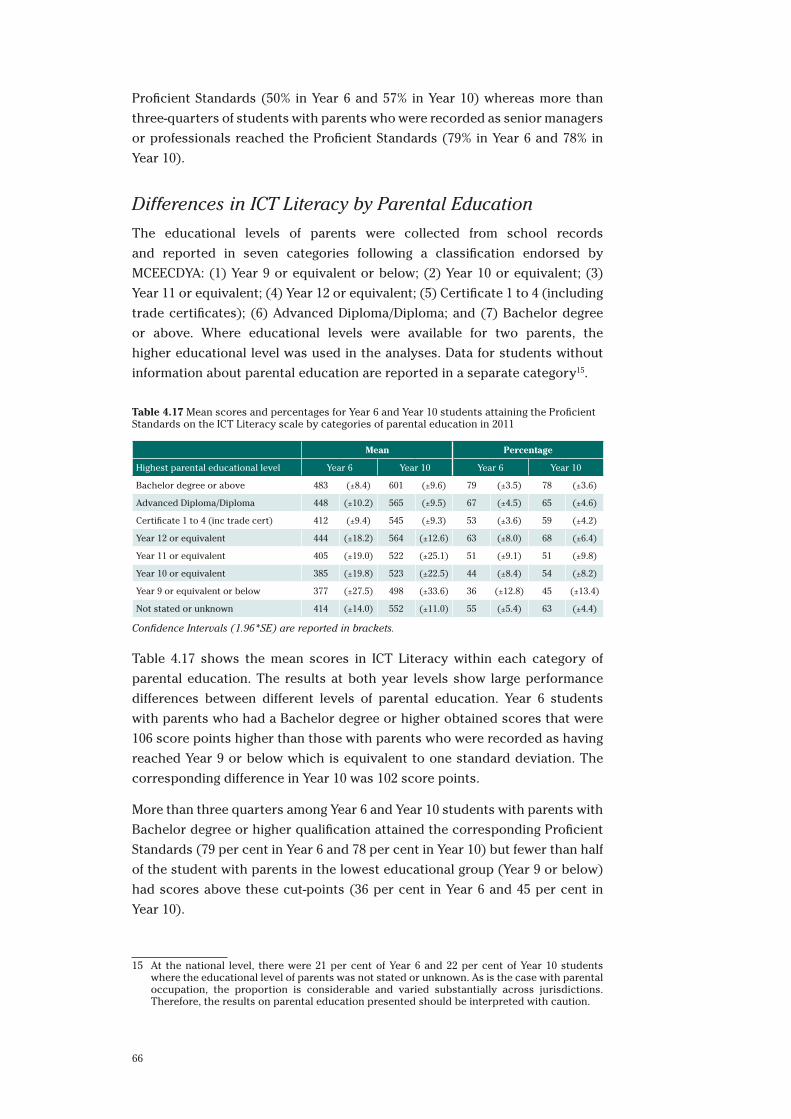
66
Proficient Standards (50% in Year 6 and 57% in Year 10) whereas more than
three-quarters of students with parents who were recorded as senior managers
or professionals reached the Proficient Standards (79% in Year 6 and 78% in
Year 10).
Differences in ICT Literacy by Parental Education
The educational levels of parents were collected from school records
and reported in seven categories following a classification endorsed by
MCEECDYA: (1) Year 9 or equivalent or below; (2) Year 10 or equivalent; (3)
Year 11 or equivalent; (4) Year 12 or equivalent; (5) Certificate 1 to 4 (including
trade certificates); (6) Advanced Diploma/Diploma; and (7) Bachelor degree
or above. Where educational levels were available for two parents, the
higher educational level was used in the analyses. Data for students without
information about parental education are reported in a separate category15.
Table 4.17 Mean scores and percentages for Year 6 and Year 10 students attaining the Proficient Standards on the ICT Literacy scale by categories of parental education in 2011
Mean Percentage
Highest parental educational level Year 6 Year 10 Year 6 Year 10
Bachelor degree or above 483 (±8.4) 601 (±9.6) 79 (±3.5) 78 (±3.6)
Advanced Diploma/Diploma 448 (±10.2) 565 (±9.5) 67 (±4.5) 65 (±4.6)
Certificate 1 to 4 (inc trade cert) 412 (±9.4) 545 (±9.3) 53 (±3.6) 59 (±4.2)
Year 12 or equivalent 444 (±18.2) 564 (±12.6) 63 (±8.0) 68 (±6.4)
Year 11 or equivalent 405 (±19.0) 522 (±25.1) 51 (±9.1) 51 (±9.8)
Year 10 or equivalent 385 (±19.8) 523 (±22.5) 44 (±8.4) 54 (±8.2)
Year 9 or equivalent or below 377 (±27.5) 498 (±33.6) 36 (±12.8) 45 (±13.4)
Not stated or unknown 414 (±14.0) 552 (±11.0) 55 (±5.4) 63 (±4.4)
Confidence Intervals (1.96*SE) are reported in brackets.
Table 4.17 shows the mean scores in ICT Literacy within each category of
parental education. The results at both year levels show large performance
differences between different levels of parental education. Year 6 students
with parents who had a Bachelor degree or higher obtained scores that were
106 score points higher than those with parents who were recorded as having
reached Year 9 or below which is equivalent to one standard deviation. The
corresponding difference in Year 10 was 102 score points.
More than three quarters among Year 6 and Year 10 students with parents with
Bachelor degree or higher qualification attained the corresponding Proficient
Standards (79 per cent in Year 6 and 78 per cent in Year 10) but fewer than half
of the student with parents in the lowest educational group (Year 9 or below)
had scores above these cut-points (36 per cent in Year 6 and 45 per cent in
Year 10).
15 At the national level, there were 21 per cent of Year 6 and 22 per cent of Year 10 students where the educational level of parents was not stated or unknown. As is the case with parental occupation, the proportion is considerable and varied substantially across jurisdictions. Therefore, the results on parental education presented should be interpreted with caution.
67
SummaryThe results from the assessment in 2011 show increases in ICT Literacy scores
between the two year levels of over one standard deviation as well as little
variation in this increase across States and Territories. Across jurisdictions,
the results show considerable variation in mean student test scores. Year
6 students from the ACT, New South Wales and Victoria had significantly
higher test scores than those in all other jurisdictions, whereas students in
the Northern Territory showed significantly lower levels of ICT Literacy than
in all jurisdictions except Tasmania. In Year 10, ACT students showed higher
test performance than in all other jurisdictions except New South Wales and
Victoria whereas those from the Northern Territory had significantly lower
average scores than those from all other jurisdictions except Tasmania.
Among Year 6, national average scores increased significantly compared to
both 2008 and 2005. At the level of States and Territories average performance
increased significantly for all jurisdictions except Tasmania and the Northern
Territory. At Year 10, however, neither at the national nor jurisdictional level
were there any statistically significant differences in ICT Literacy scores
between 2011 and previous cycles.
Differences between male and female students were similar to previous
assessments. At the national level, female students outperformed male
students by about one-fifth of a standard deviation in Year 6 and by only slightly
more than a tenth of a standard deviation in Year 10. At both year levels, non-
Indigenous students scored higher than Indigenous students by almost one
standard deviation.
No statistically significant differences were found when comparing the
performance of students recorded as speaking another language at home
with those recorded as speaking only English at home. Statistically significant
differences between students recorded as born in Australia and those
recorded as born overseas were only found in Year 10, where students born
in Australia outperformed those born overseas by one-fifth of a standard
deviation.
Students’ ICT Literacy scores varied considerably by geographic location
with those attending schools in metropolitan areas showing the highest
performance levels and those attending schools in remote areas the lowest
levels. The difference between metropolitan and remote school students was
equivalent to more than two-thirds of a standard deviation in Year 6 and more
than three-quarters of a standard deviation in Year 10. These differences could
have been the result of the influence of other background factors associated
with location.
Students with parents of higher occupational and educational status had
considerably higher ICT Literacy scores than students from lower socio-
economic backgrounds. The difference between students whose parents were

68
senior managers or professionals and students with parents who were unskilled
labourers, office, sales or service staff was between three-fifths and four-fifths
of a standard deviation. The difference between students with parents who
were university graduates and those whose parents had attained Year 10 was
more than four-fifths of a standard deviation.
69
Chapter 5 Student Use of ICT
NAP – ICT Literacy 2011 included, in addition to the assessment tools, a
questionnaire concerning students’ use of ICT at home and at school, their
experience of using ICT, and their access to ICT resources. This computer-based
questionnaire was administered following the assessment of ICT Literacy. Results
from the questionnaire provide information about these aspects of familiarity
with ICT from nationally representative samples of Year 6 and Year 10 students.
The survey based on this questionnaire provides information about access
to, and use of, ICT by students in Australia. Moreover, that information can be
linked to student perceptions of ICT as well as to their ICT Literacy. This chapter
focuses on student use of ICT. Chapter 6 examines student perceptions of ICT.
BackgroundOver more than thirty years there has been rapid growth in the availability
and use of computer-based information and communication technology (ICT).
The use of digital information and communication technology has become
ubiquitous in a short space of time and permeates many occupations and most
homes. The most recent survey of household use of information technology in
Australia, conducted in 2010 and 2011, indicates that 83 per cent of households
had access to a computer at home (increased from 73 per cent in 2006–07)
and 79 per cent of households had access (mostly broadband) to the internet
(increased from 64 per cent in 2006–07 [ABS, 2011]. According to this survey,
computer access at home is even more common in households with children
under 15 years of age: 95 per cent of these households have computer access.
70
Even though computer and internet access varies among jurisdictions (from a
low of 76 per cent to a high of 91 per cent), and is associated with household
income, the uptake of information technologies in Australian homes has been
widespread: 77 per cent of households report using the internet every day and
a further 20 per cent report using it every week.
The most recent survey of ICT familiarity conducted as part of the Programme
for International Student Assessment (PISA) shows that in 2009, 99 per cent of
15-year-old Australian students in Year 10 had a computer at home compared to
91 per cent in 2000 (OECD, 2011: 300). Within Australia there was no difference
between boys and girls in this indicator of access to computers, and only small
differences associated with socioeconomic background were reported (OECD,
2011: 302).The average for the 27 participating countries that were members of
the Organisation of Economic Co-operation and Development (OECD) was 94
per cent in 2009 compared to 77 per cent in 2000. Other data from PISA in 2009
indicated that 96 per cent of 15-year-old students in Australia had access to the
internet at home compared to an OECD average of 89 per cent (OECD, 2011:
303). There was no difference in internet access between boys and girls but a
difference of ten percentage points between students from the top and bottom
quarter of the socioeconomic background distribution. Findings from the Trends
in International Mathematics and Science Study (TIMSS) also reported high
levels of access at home among primary school students in 2007. Eighty-four per
cent of Australian Year 4 students (89 per cent in Year 8) had a computer with a
connection to the internet at home (Mullis, Martin & Foy, 2008). The percentage
of Australian Year 4 students who indicated that they have a computer at home
is similar to the percentage in the United States, England and the Netherlands.
Just as there has been widespread adoption of ICT across the community, there
has been a corresponding growth in the availability and use of ICT in schools
and school systems. A report for the United States Department of Education
documents the policies and practices that have been adopted in 22 countries
(including Australia) to encourage the educational application of ICT (Bakia,
Murphy, Anderson & Trinidad, 2011). The report highlights the role of Australia’s
“Digital Education Revolution”, as well as initiatives at state and territory level, in
supporting changes in teaching and learning in Australian schools. It encompasses
infrastructure investments, enhanced connectivity, the development of digital
resources and professional development for teachers and school leaders.
The IEA Second International Technology in Education Study (SITES) indicates
that Australian science and mathematics teachers are relatively frequent users
of ICT compared with their counterparts in other countries (Ainley, Eveleigh,
Freeman & O’Malley, 2010). A higher percentage of Year 8 science teachers in
Australian secondary schools reported to have used ICT in the previous year
than in most other countries participating in the survey (similar to Singapore,
Hong Kong SAR, and Alberta Canada). In addition, Australia was among those
countries with the highest percentage of Year 8 mathematics teachers who
reported using ICT (second only to Norway).
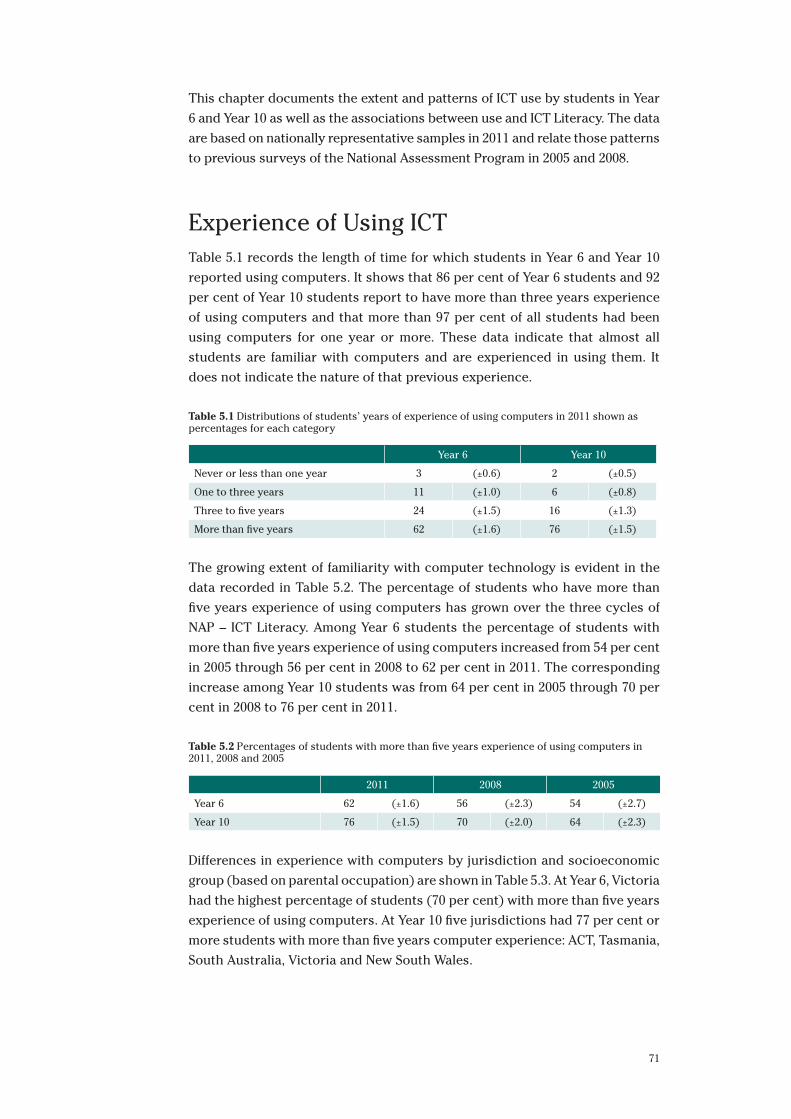
71
This chapter documents the extent and patterns of ICT use by students in Year
6 and Year 10 as well as the associations between use and ICT Literacy. The data
are based on nationally representative samples in 2011 and relate those patterns
to previous surveys of the National Assessment Program in 2005 and 2008.
Experience of Using ICTTable 5.1 records the length of time for which students in Year 6 and Year 10
reported using computers. It shows that 86 per cent of Year 6 students and 92
per cent of Year 10 students report to have more than three years experience
of using computers and that more than 97 per cent of all students had been
using computers for one year or more. These data indicate that almost all
students are familiar with computers and are experienced in using them. It
does not indicate the nature of that previous experience.
Table 5.1 Distributions of students’ years of experience of using computers in 2011 shown as percentages for each category
Year 6 Year 10
Never or less than one year 3 (±0.6) 2 (±0.5)
One to three years 11 (±1.0) 6 (±0.8)
Three to five years 24 (±1.5) 16 (±1.3)
More than five years 62 (±1.6) 76 (±1.5)
The growing extent of familiarity with computer technology is evident in the
data recorded in Table 5.2. The percentage of students who have more than
five years experience of using computers has grown over the three cycles of
NAP – ICT Literacy. Among Year 6 students the percentage of students with
more than five years experience of using computers increased from 54 per cent
in 2005 through 56 per cent in 2008 to 62 per cent in 2011. The corresponding
increase among Year 10 students was from 64 per cent in 2005 through 70 per
cent in 2008 to 76 per cent in 2011.
Table 5.2 Percentages of students with more than five years experience of using computers in 2011, 2008 and 2005
2011 2008 2005
Year 6 62 (±1.6) 56 (±2.3) 54 (±2.7)
Year 10 76 (±1.5) 70 (±2.0) 64 (±2.3)
Differences in experience with computers by jurisdiction and socioeconomic
group (based on parental occupation) are shown in Table 5.3. At Year 6, Victoria
had the highest percentage of students (70 per cent) with more than five years
experience of using computers. At Year 10 five jurisdictions had 77 per cent or
more students with more than five years computer experience: ACT, Tasmania,
South Australia, Victoria and New South Wales.
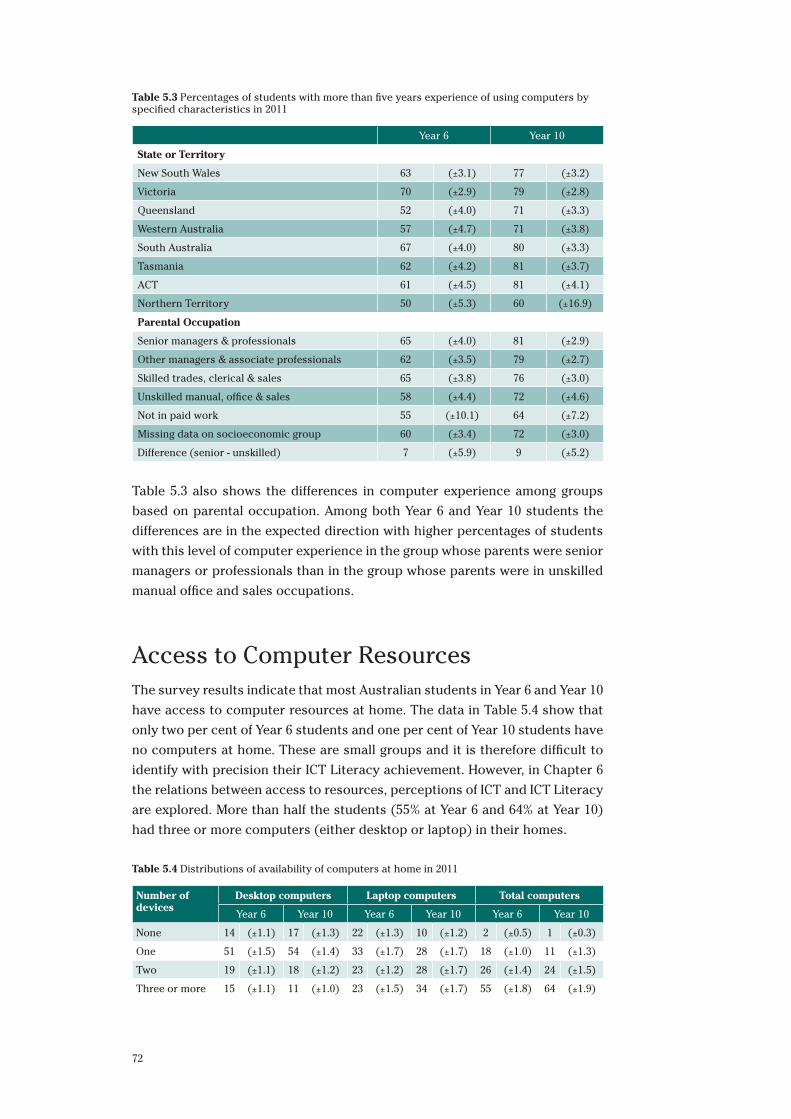
72
Table 5.3 Percentages of students with more than five years experience of using computers by specified characteristics in 2011
Year 6 Year 10
State or Territory
New South Wales 63 (±3.1) 77 (±3.2)
Victoria 70 (±2.9) 79 (±2.8)
Queensland 52 (±4.0) 71 (±3.3)
Western Australia 57 (±4.7) 71 (±3.8)
South Australia 67 (±4.0) 80 (±3.3)
Tasmania 62 (±4.2) 81 (±3.7)
ACT 61 (±4.5) 81 (±4.1)
Northern Territory 50 (±5.3) 60 (±16.9)
Parental Occupation
Senior managers & professionals 65 (±4.0) 81 (±2.9)
Other managers & associate professionals 62 (±3.5) 79 (±2.7)
Skilled trades, clerical & sales 65 (±3.8) 76 (±3.0)
Unskilled manual, office & sales 58 (±4.4) 72 (±4.6)
Not in paid work 55 (±10.1) 64 (±7.2)
Missing data on socioeconomic group 60 (±3.4) 72 (±3.0)
Difference (senior - unskilled) 7 (±5.9) 9 (±5.2)
Table 5.3 also shows the differences in computer experience among groups
based on parental occupation. Among both Year 6 and Year 10 students the
differences are in the expected direction with higher percentages of students
with this level of computer experience in the group whose parents were senior
managers or professionals than in the group whose parents were in unskilled
manual office and sales occupations.
Access to Computer ResourcesThe survey results indicate that most Australian students in Year 6 and Year 10
have access to computer resources at home. The data in Table 5.4 show that
only two per cent of Year 6 students and one per cent of Year 10 students have
no computers at home. These are small groups and it is therefore difficult to
identify with precision their ICT Literacy achievement. However, in Chapter 6
the relations between access to resources, perceptions of ICT and ICT Literacy
are explored. More than half the students (55% at Year 6 and 64% at Year 10)
had three or more computers (either desktop or laptop) in their homes.
Table 5.4 Distributions of availability of computers at home in 2011
Number of devices
Desktop computers Laptop computers Total computers
Year 6 Year 10 Year 6 Year 10 Year 6 Year 10
None 14 (±1.1) 17 (±1.3) 22 (±1.3) 10 (±1.2) 2 (±0.5) 1 (±0.3)
One 51 (±1.5) 54 (±1.4) 33 (±1.7) 28 (±1.7) 18 (±1.0) 11 (±1.3)
Two 19 (±1.1) 18 (±1.2) 23 (±1.2) 28 (±1.7) 26 (±1.4) 24 (±1.5)
Three or more 15 (±1.1) 11 (±1.0) 23 (±1.5) 34 (±1.7) 55 (±1.8) 64 (±1.9)
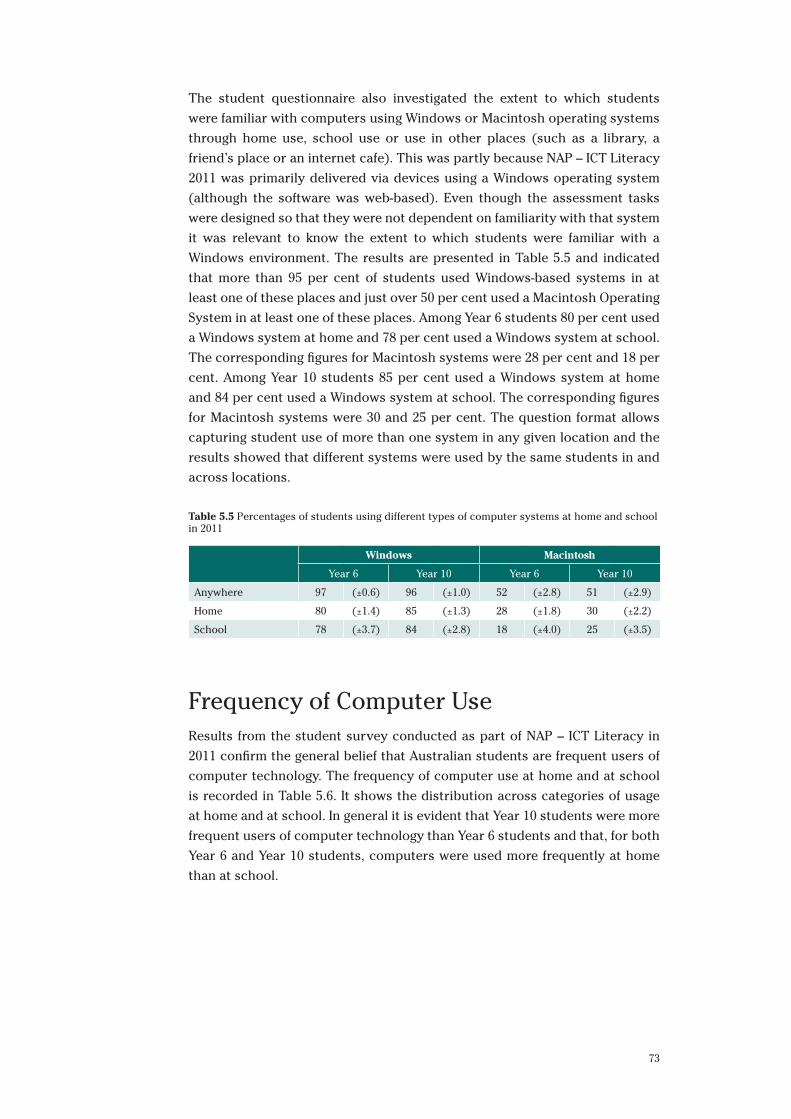
73
The student questionnaire also investigated the extent to which students
were familiar with computers using Windows or Macintosh operating systems
through home use, school use or use in other places (such as a library, a
friend’s place or an internet cafe). This was partly because NAP – ICT Literacy
2011 was primarily delivered via devices using a Windows operating system
(although the software was web-based). Even though the assessment tasks
were designed so that they were not dependent on familiarity with that system
it was relevant to know the extent to which students were familiar with a
Windows environment. The results are presented in Table 5.5 and indicated
that more than 95 per cent of students used Windows-based systems in at
least one of these places and just over 50 per cent used a Macintosh Operating
System in at least one of these places. Among Year 6 students 80 per cent used
a Windows system at home and 78 per cent used a Windows system at school.
The corresponding figures for Macintosh systems were 28 per cent and 18 per
cent. Among Year 10 students 85 per cent used a Windows system at home
and 84 per cent used a Windows system at school. The corresponding figures
for Macintosh systems were 30 and 25 per cent. The question format allows
capturing student use of more than one system in any given location and the
results showed that different systems were used by the same students in and
across locations.
Table 5.5 Percentages of students using different types of computer systems at home and school in 2011
Windows Macintosh
Year 6 Year 10 Year 6 Year 10
Anywhere 97 (±0.6) 96 (±1.0) 52 (±2.8) 51 (±2.9)
Home 80 (±1.4) 85 (±1.3) 28 (±1.8) 30 (±2.2)
School 78 (±3.7) 84 (±2.8) 18 (±4.0) 25 (±3.5)
Frequency of Computer UseResults from the student survey conducted as part of NAP – ICT Literacy in
2011 confirm the general belief that Australian students are frequent users of
computer technology. The frequency of computer use at home and at school
is recorded in Table 5.6. It shows the distribution across categories of usage
at home and at school. In general it is evident that Year 10 students were more
frequent users of computer technology than Year 6 students and that, for both
Year 6 and Year 10 students, computers were used more frequently at home
than at school.
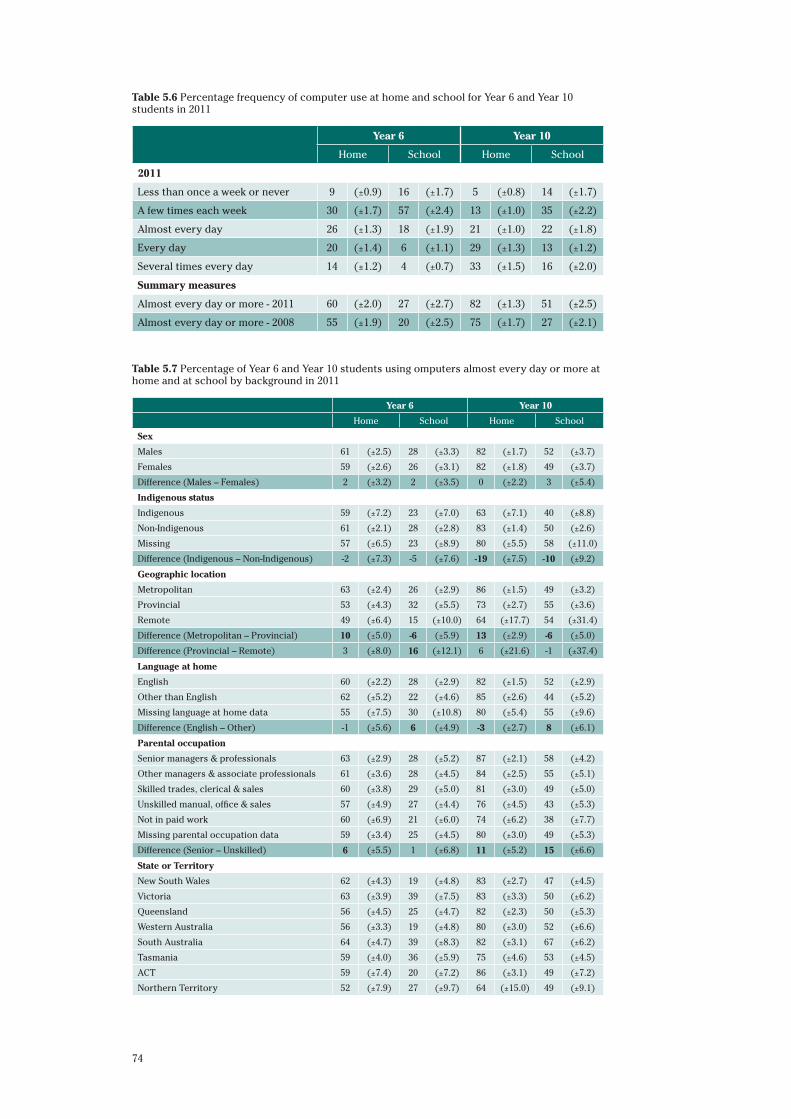
74
Table 5.6 Percentage frequency of computer use at home and school for Year 6 and Year 10 students in 2011
Year 6 Year 10
Home School Home School
2011
Less than once a week or never 9 (±0.9) 16 (±1.7) 5 (±0.8) 14 (±1.7)
A few times each week 30 (±1.7) 57 (±2.4) 13 (±1.0) 35 (±2.2)
Almost every day 26 (±1.3) 18 (±1.9) 21 (±1.0) 22 (±1.8)
Every day 20 (±1.4) 6 (±1.1) 29 (±1.3) 13 (±1.2)
Several times every day 14 (±1.2) 4 (±0.7) 33 (±1.5) 16 (±2.0)
Summary measures
Almost every day or more - 2011 60 (±2.0) 27 (±2.7) 82 (±1.3) 51 (±2.5)
Almost every day or more - 2008 55 (±1.9) 20 (±2.5) 75 (±1.7) 27 (±2.1)
Table 5.7 Percentage of Year 6 and Year 10 students using omputers almost every day or more at home and at school by background in 2011
Year 6 Year 10
Home School Home School
Sex
Males 61 (±2.5) 28 (±3.3) 82 (±1.7) 52 (±3.7)
Females 59 (±2.6) 26 (±3.1) 82 (±1.8) 49 (±3.7)
Difference (Males – Females) 2 (±3.2) 2 (±3.5) 0 (±2.2) 3 (±5.4)
Indigenous status
Indigenous 59 (±7.2) 23 (±7.0) 63 (±7.1) 40 (±8.8)
Non-Indigenous 61 (±2.1) 28 (±2.8) 83 (±1.4) 50 (±2.6)
Missing 57 (±6.5) 23 (±8.9) 80 (±5.5) 58 (±11.0)
Difference (Indigenous – Non-Indigenous) -2 (±7.3) -5 (±7.6) -19 (±7.5) -10 (±9.2)
Geographic location
Metropolitan 63 (±2.4) 26 (±2.9) 86 (±1.5) 49 (±3.2)
Provincial 53 (±4.3) 32 (±5.5) 73 (±2.7) 55 (±3.6)
Remote 49 (±6.4) 15 (±10.0) 64 (±17.7) 54 (±31.4)
Difference (Metropolitan – Provincial) 10 (±5.0) -6 (±5.9) 13 (±2.9) -6 (±5.0)
Difference (Provincial – Remote) 3 (±8.0) 16 (±12.1) 6 (±21.6) -1 (±37.4)
Language at home
English 60 (±2.2) 28 (±2.9) 82 (±1.5) 52 (±2.9)
Other than English 62 (±5.2) 22 (±4.6) 85 (±2.6) 44 (±5.2)
Missing language at home data 55 (±7.5) 30 (±10.8) 80 (±5.4) 55 (±9.6)
Difference (English – Other) -1 (±5.6) 6 (±4.9) -3 (±2.7) 8 (±6.1)
Parental occupation
Senior managers & professionals 63 (±2.9) 28 (±5.2) 87 (±2.1) 58 (±4.2)
Other managers & associate professionals 61 (±3.6) 28 (±4.5) 84 (±2.5) 55 (±5.1)
Skilled trades, clerical & sales 60 (±3.8) 29 (±5.0) 81 (±3.0) 49 (±5.0)
Unskilled manual, office & sales 57 (±4.9) 27 (±4.4) 76 (±4.5) 43 (±5.3)
Not in paid work 60 (±6.9) 21 (±6.0) 74 (±6.2) 38 (±7.7)
Missing parental occupation data 59 (±3.4) 25 (±4.5) 80 (±3.0) 49 (±5.3)
Difference (Senior – Unskilled) 6 (±5.5) 1 (±6.8) 11 (±5.2) 15 (±6.6)
State or Territory
New South Wales 62 (±4.3) 19 (±4.8) 83 (±2.7) 47 (±4.5)
Victoria 63 (±3.9) 39 (±7.5) 83 (±3.3) 50 (±6.2)
Queensland 56 (±4.5) 25 (±4.7) 82 (±2.3) 50 (±5.3)
Western Australia 56 (±3.3) 19 (±4.8) 80 (±3.0) 52 (±6.6)
South Australia 64 (±4.7) 39 (±8.3) 82 (±3.1) 67 (±6.2)
Tasmania 59 (±4.0) 36 (±5.9) 75 (±4.6) 53 (±4.5)
ACT 59 (±7.4) 20 (±7.2) 86 (±3.1) 49 (±7.2)
Northern Territory 52 (±7.9) 27 (±9.7) 64 (±15.0) 49 (±9.1)
75
Differences between Year 6 and Year 10
It can be seen from Table 5.6 that 82 per cent of Year 10 students reported
using a computer at home almost every day, every day or several times every
day. Among Year 6 students the corresponding figure was 60 per cent. Fifty-one
per cent of Year 10 students reported using computers at school every day or
several times every day. The corresponding figure for Year 6 students was 27
per cent. This represents a higher percentage of frequent use for Year 10 than
for Year 6 students. The data in Table 5.6 also indicate that daily home use of
computers was reported as much more frequent than daily school use.
Changes between 2008 and 2011 in frequent use
Although the response scale was not the same as the one used in NAP – ICT
Literacy 2008 it is possible to compare the percentages of students who reported
using computers “almost every day” or more frequently across the two cycles
(see Table 5.2 of the NAP – ICT Literacy 2008 Report)16. These data indicate
an increase in the percentage of students using computers this frequently at
home and at school. The percentages using computers this frequently at home
increased from 55 per cent to 60 per cent among Year 6 students and from 75
per cent to 82 per cent among Year 10 students. The percentages of computer
use this frequently at school increased from 20 per cent to 27 per cent among
Year 6 students and from 27 per cent to 51 per cent among Year 10 students17.
Differences in frequent use among groups of students
The percentages of students who report use of computers “almost every
day”, “every day” or “several times every day” provide convenient summary
measures of frequency of computer use for comparisons among groups of
students. Computer use of at least “almost every day” will be referred to as
an indication of frequent computer use. Overall, 60 per cent of Year 6 students
and 82 per cent of Year 10 students are frequent computer users at home.
Correspondingly 27 per cent of Year 6 students and 51 per cent of Year 10
students are frequent computer users at school. Comparisons among groups
of students are recorded in Table 5.7.
There were no significant differences between females and males in the
percentage who are frequent computer users either among Year 6 or Year 10
students or in terms of home or school use. There were also no significant
differences between Indigenous and non-Indigenous students at Year 6, but
differences in Year 10 were statistically significant for both home and school
use. At Year 10, the percentage of non-Indigenous frequent computer users at
school was ten percentage points higher than the corresponding percentage of
16 For NAP – ICT Literacy 2008 the two categories were “almost every day” and “at least once each day” and for NAP – ICT Literacy 2011 the three categories were “almost every day”, “every day” and “several times every day”.
17 Differences between these figures and the apparent sums of the data in Table 5.7 arise as a result of rounding.
76
Indigenous students. The corresponding difference at home was 19 percentage
points. The emergence of an apparent gap in computer use between Indigenous
and non-Indigenous students in secondary school is a matter for further
investigation.
There were some differences in the percentages of frequent computer users
associated with geographic location. For all contexts, Year 6 and Year 10 at
home and at school, the percentages of students who were frequent computer
users were greater in metropolitan than provincial locations. The differences
tended, however, to be greater with regard to home use (10 and 13 percentage
points) than school use (six percentage points at each year level). Statistically
significant differences between provincial and remote locations were only
found for school computer use among Year 6 students.
At Year 6, there were no significant differences in the percentages of frequent
computer users between students who were recorded as mainly speaking a
language other than English at home and English-speaking students. At Year
10, there was a slightly higher percentage of frequent users in the group that
mainly speaks another language at home than in the group that mainly speaks
English at home. The difference at school was in the opposite direction for both
year levels. Students with an English speaking background were more frequent
computer users than students with a non-English speaking background.
Regarding differences by parental occupation, the table shows the difference
between the highest (senior managers or professionals) and lowest (unskilled
manual, office and sales) occupation groups. There were no significant
differences in the percentages of frequent computer users at school between
these two groups among Year 6 students. However, there were significant
differences between these two groups regarding the use of computers at home
at Year 6 (with a difference of six percentage points) and for both home and
school computer use at Year 10. Among Year 10 students the percentages of
students reporting frequent computer use in the highest occupation group
were higher than in the lowest group (11 and 15 percentage points for home
and school respectively).
Differences among jurisdictions in the extent of frequent use of computers
There were differences among jurisdictions in the percentage of students who
reported frequent computer use at home and school at both year levels. The
range was 12 percentage points from lowest to highest. The percentages of
Year 6 students who reported frequent home computer use were highest in
South Australia (64 per cent), Victoria (63 per cent) and New South Wales (62
per cent) and lowest in Queensland (56 per cent), Western Australia (56 per
cent) and the Northern Territory (52 per cent). There were larger differences at
school among jurisdictions in the percentages of Year 6 students who reported
frequent computer use. The range was 20 percentage points from highest to
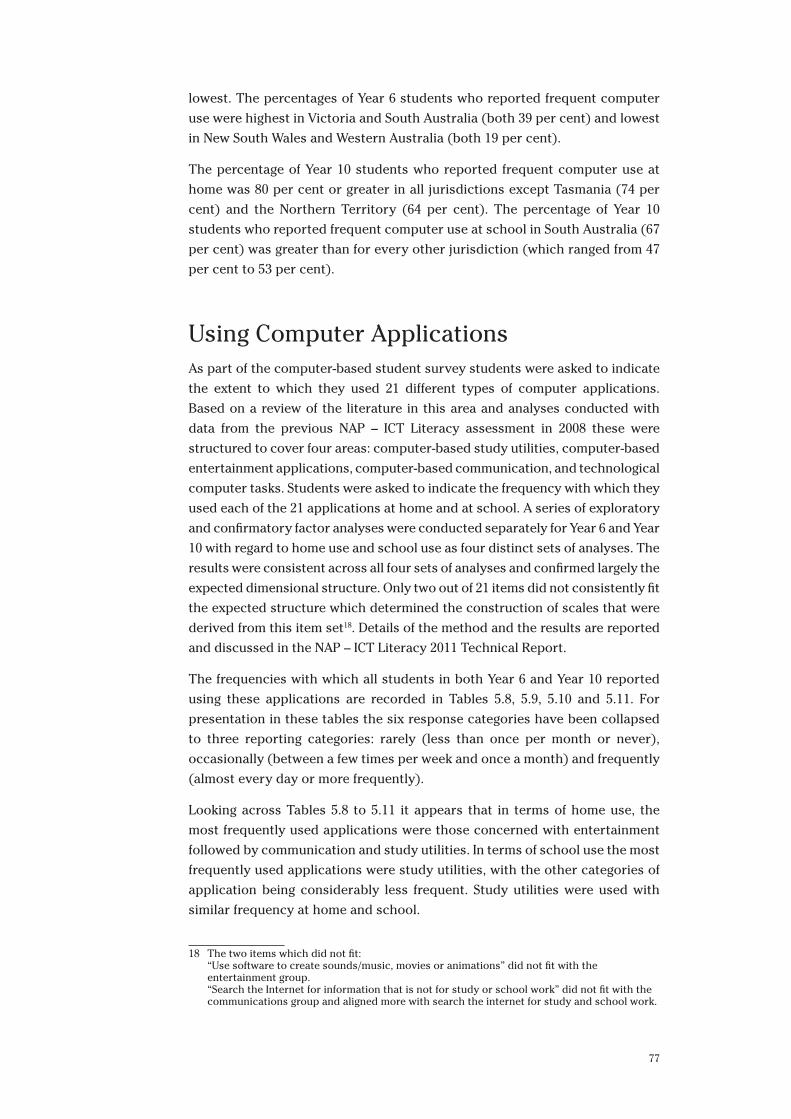
77
lowest. The percentages of Year 6 students who reported frequent computer
use were highest in Victoria and South Australia (both 39 per cent) and lowest
in New South Wales and Western Australia (both 19 per cent).
The percentage of Year 10 students who reported frequent computer use at
home was 80 per cent or greater in all jurisdictions except Tasmania (74 per
cent) and the Northern Territory (64 per cent). The percentage of Year 10
students who reported frequent computer use at school in South Australia (67
per cent) was greater than for every other jurisdiction (which ranged from 47
per cent to 53 per cent).
Using Computer ApplicationsAs part of the computer-based student survey students were asked to indicate
the extent to which they used 21 different types of computer applications.
Based on a review of the literature in this area and analyses conducted with
data from the previous NAP – ICT Literacy assessment in 2008 these were
structured to cover four areas: computer-based study utilities, computer-based
entertainment applications, computer-based communication, and technological
computer tasks. Students were asked to indicate the frequency with which they
used each of the 21 applications at home and at school. A series of exploratory
and confirmatory factor analyses were conducted separately for Year 6 and Year
10 with regard to home use and school use as four distinct sets of analyses. The
results were consistent across all four sets of analyses and confirmed largely the
expected dimensional structure. Only two out of 21 items did not consistently fit
the expected structure which determined the construction of scales that were
derived from this item set18. Details of the method and the results are reported
and discussed in the NAP – ICT Literacy 2011 Technical Report.
The frequencies with which all students in both Year 6 and Year 10 reported
using these applications are recorded in Tables 5.8, 5.9, 5.10 and 5.11. For
presentation in these tables the six response categories have been collapsed
to three reporting categories: rarely (less than once per month or never),
occasionally (between a few times per week and once a month) and frequently
(almost every day or more frequently).
Looking across Tables 5.8 to 5.11 it appears that in terms of home use, the
most frequently used applications were those concerned with entertainment
followed by communication and study utilities. In terms of school use the most
frequently used applications were study utilities, with the other categories of
application being considerably less frequent. Study utilities were used with
similar frequency at home and school.
18 The two items which did not fit: “Use software to create sounds/music, movies or animations” did not fit with the entertainment group. “Search the Internet for information that is not for study or school work” did not fit with the communications group and aligned more with search the internet for study and school work.
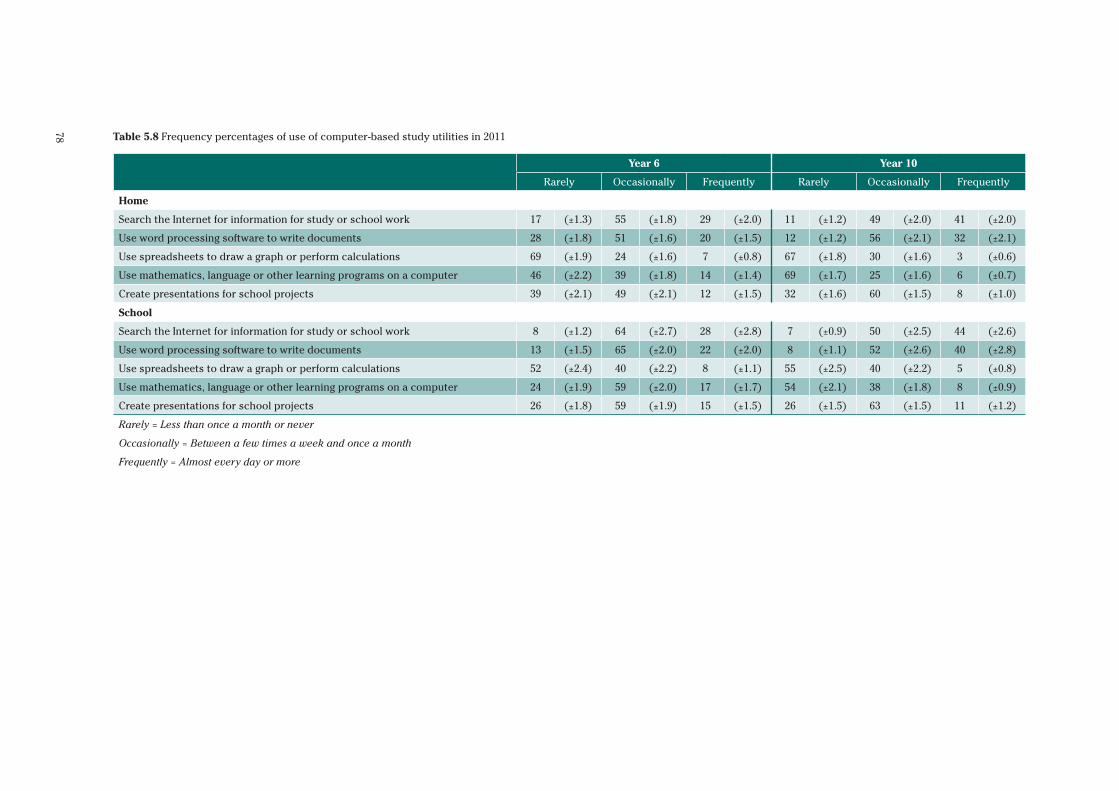
78 Table 5.8 Frequency percentages of use of computer-based study utilities in 2011
Year 6 Year 10
Rarely Occasionally Frequently Rarely Occasionally Frequently
Home
Search the Internet for information for study or school work 17 (±1.3) 55 (±1.8) 29 (±2.0) 11 (±1.2) 49 (±2.0) 41 (±2.0)
Use word processing software to write documents 28 (±1.8) 51 (±1.6) 20 (±1.5) 12 (±1.2) 56 (±2.1) 32 (±2.1)
Use spreadsheets to draw a graph or perform calculations 69 (±1.9) 24 (±1.6) 7 (±0.8) 67 (±1.8) 30 (±1.6) 3 (±0.6)
Use mathematics, language or other learning programs on a computer 46 (±2.2) 39 (±1.8) 14 (±1.4) 69 (±1.7) 25 (±1.6) 6 (±0.7)
Create presentations for school projects 39 (±2.1) 49 (±2.1) 12 (±1.5) 32 (±1.6) 60 (±1.5) 8 (±1.0)
School
Search the Internet for information for study or school work 8 (±1.2) 64 (±2.7) 28 (±2.8) 7 (±0.9) 50 (±2.5) 44 (±2.6)
Use word processing software to write documents 13 (±1.5) 65 (±2.0) 22 (±2.0) 8 (±1.1) 52 (±2.6) 40 (±2.8)
Use spreadsheets to draw a graph or perform calculations 52 (±2.4) 40 (±2.2) 8 (±1.1) 55 (±2.5) 40 (±2.2) 5 (±0.8)
Use mathematics, language or other learning programs on a computer 24 (±1.9) 59 (±2.0) 17 (±1.7) 54 (±2.1) 38 (±1.8) 8 (±0.9)
Create presentations for school projects 26 (±1.8) 59 (±1.9) 15 (±1.5) 26 (±1.5) 63 (±1.5) 11 (±1.2)
Rarely = Less than once a month or never
Occasionally = Between a few times a week and once a month
Frequently = Almost every day or more
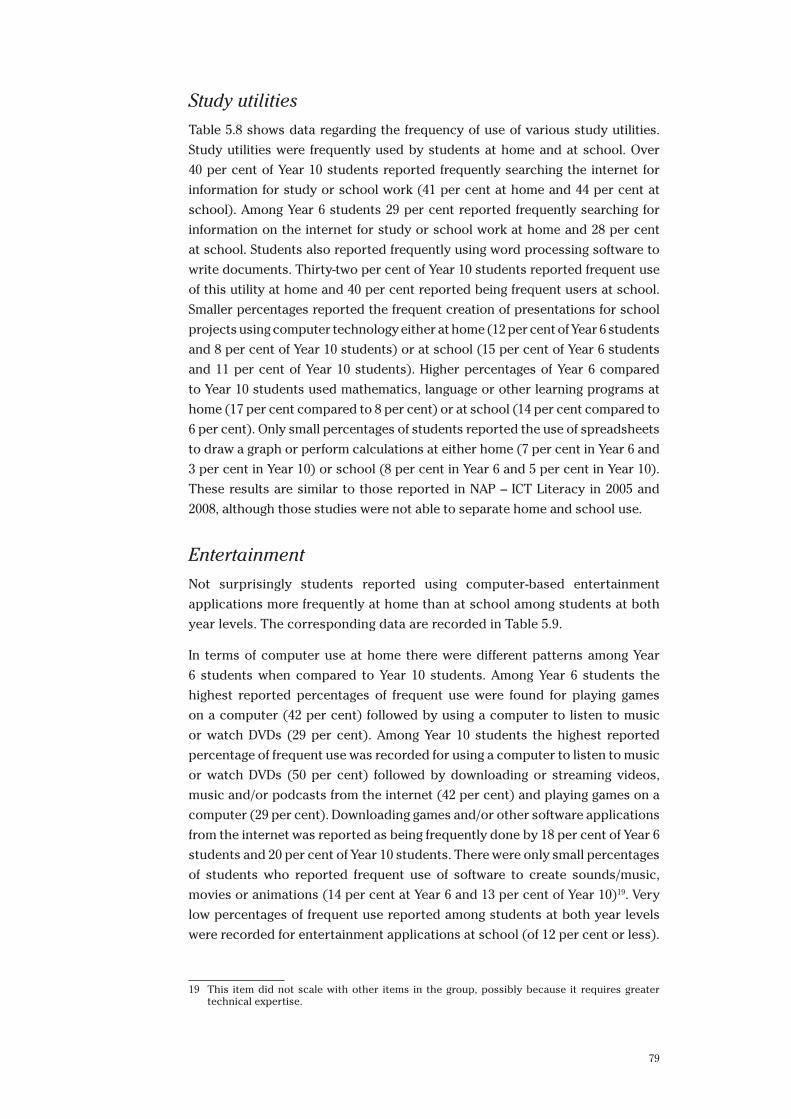
79
Study utilities
Table 5.8 shows data regarding the frequency of use of various study utilities.
Study utilities were frequently used by students at home and at school. Over
40 per cent of Year 10 students reported frequently searching the internet for
information for study or school work (41 per cent at home and 44 per cent at
school). Among Year 6 students 29 per cent reported frequently searching for
information on the internet for study or school work at home and 28 per cent
at school. Students also reported frequently using word processing software to
write documents. Thirty-two per cent of Year 10 students reported frequent use
of this utility at home and 40 per cent reported being frequent users at school.
Smaller percentages reported the frequent creation of presentations for school
projects using computer technology either at home (12 per cent of Year 6 students
and 8 per cent of Year 10 students) or at school (15 per cent of Year 6 students
and 11 per cent of Year 10 students). Higher percentages of Year 6 compared
to Year 10 students used mathematics, language or other learning programs at
home (17 per cent compared to 8 per cent) or at school (14 per cent compared to
6 per cent). Only small percentages of students reported the use of spreadsheets
to draw a graph or perform calculations at either home (7 per cent in Year 6 and
3 per cent in Year 10) or school (8 per cent in Year 6 and 5 per cent in Year 10).
These results are similar to those reported in NAP – ICT Literacy in 2005 and
2008, although those studies were not able to separate home and school use.
Entertainment
Not surprisingly students reported using computer-based entertainment
applications more frequently at home than at school among students at both
year levels. The corresponding data are recorded in Table 5.9.
In terms of computer use at home there were different patterns among Year
6 students when compared to Year 10 students. Among Year 6 students the
highest reported percentages of frequent use were found for playing games
on a computer (42 per cent) followed by using a computer to listen to music
or watch DVDs (29 per cent). Among Year 10 students the highest reported
percentage of frequent use was recorded for using a computer to listen to music
or watch DVDs (50 per cent) followed by downloading or streaming videos,
music and/or podcasts from the internet (42 per cent) and playing games on a
computer (29 per cent). Downloading games and/or other software applications
from the internet was reported as being frequently done by 18 per cent of Year 6
students and 20 per cent of Year 10 students. There were only small percentages
of students who reported frequent use of software to create sounds/music,
movies or animations (14 per cent at Year 6 and 13 per cent of Year 10)19. Very
low percentages of frequent use reported among students at both year levels
were recorded for entertainment applications at school (of 12 per cent or less).
19 This item did not scale with other items in the group, possibly because it requires greater technical expertise.
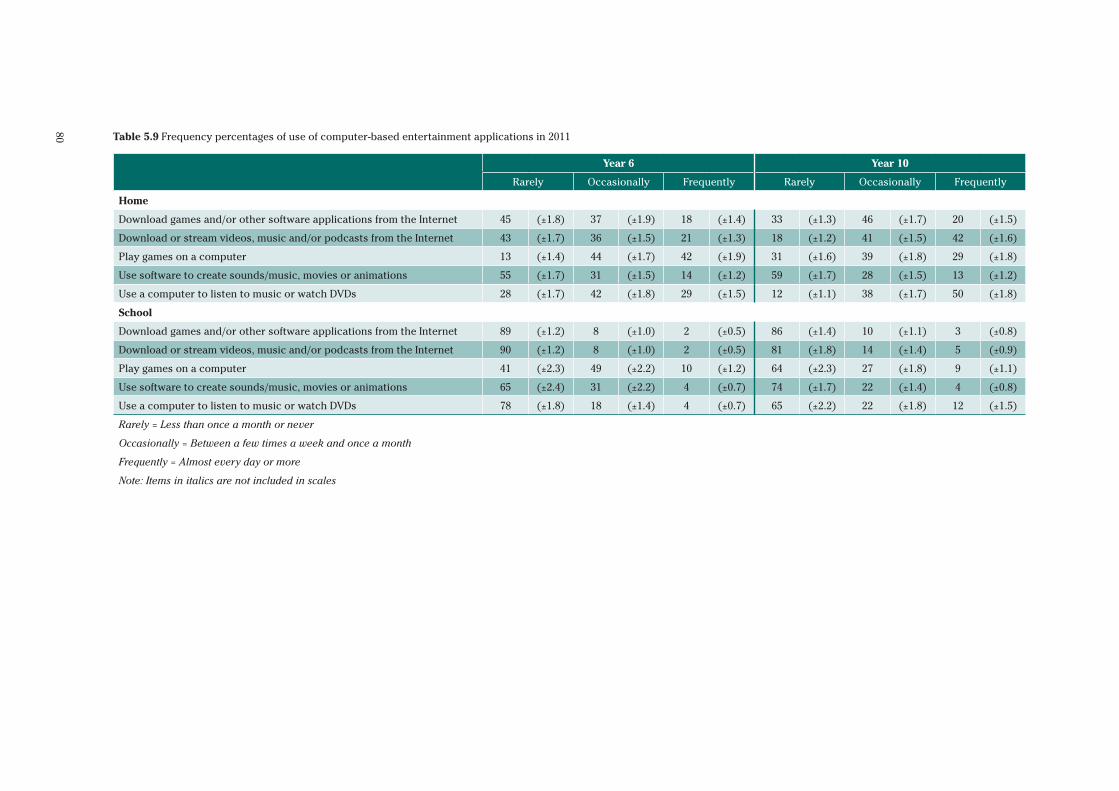
80 Table 5.9 Frequency percentages of use of computer-based entertainment applications in 2011
Year 6 Year 10
Rarely Occasionally Frequently Rarely Occasionally Frequently
Home
Download games and/or other software applications from the Internet 45 (±1.8) 37 (±1.9) 18 (±1.4) 33 (±1.3) 46 (±1.7) 20 (±1.5)
Download or stream videos, music and/or podcasts from the Internet 43 (±1.7) 36 (±1.5) 21 (±1.3) 18 (±1.2) 41 (±1.5) 42 (±1.6)
Play games on a computer 13 (±1.4) 44 (±1.7) 42 (±1.9) 31 (±1.6) 39 (±1.8) 29 (±1.8)
Use software to create sounds/music, movies or animations 55 (±1.7) 31 (±1.5) 14 (±1.2) 59 (±1.7) 28 (±1.5) 13 (±1.2)
Use a computer to listen to music or watch DVDs 28 (±1.7) 42 (±1.8) 29 (±1.5) 12 (±1.1) 38 (±1.7) 50 (±1.8)
School
Download games and/or other software applications from the Internet 89 (±1.2) 8 (±1.0) 2 (±0.5) 86 (±1.4) 10 (±1.1) 3 (±0.8)
Download or stream videos, music and/or podcasts from the Internet 90 (±1.2) 8 (±1.0) 2 (±0.5) 81 (±1.8) 14 (±1.4) 5 (±0.9)
Play games on a computer 41 (±2.3) 49 (±2.2) 10 (±1.2) 64 (±2.3) 27 (±1.8) 9 (±1.1)
Use software to create sounds/music, movies or animations 65 (±2.4) 31 (±2.2) 4 (±0.7) 74 (±1.7) 22 (±1.4) 4 (±0.8)
Use a computer to listen to music or watch DVDs 78 (±1.8) 18 (±1.4) 4 (±0.7) 65 (±2.2) 22 (±1.8) 12 (±1.5)
Rarely = Less than once a month or never
Occasionally = Between a few times a week and once a month
Frequently = Almost every day or more
Note: Items in italics are not included in scales
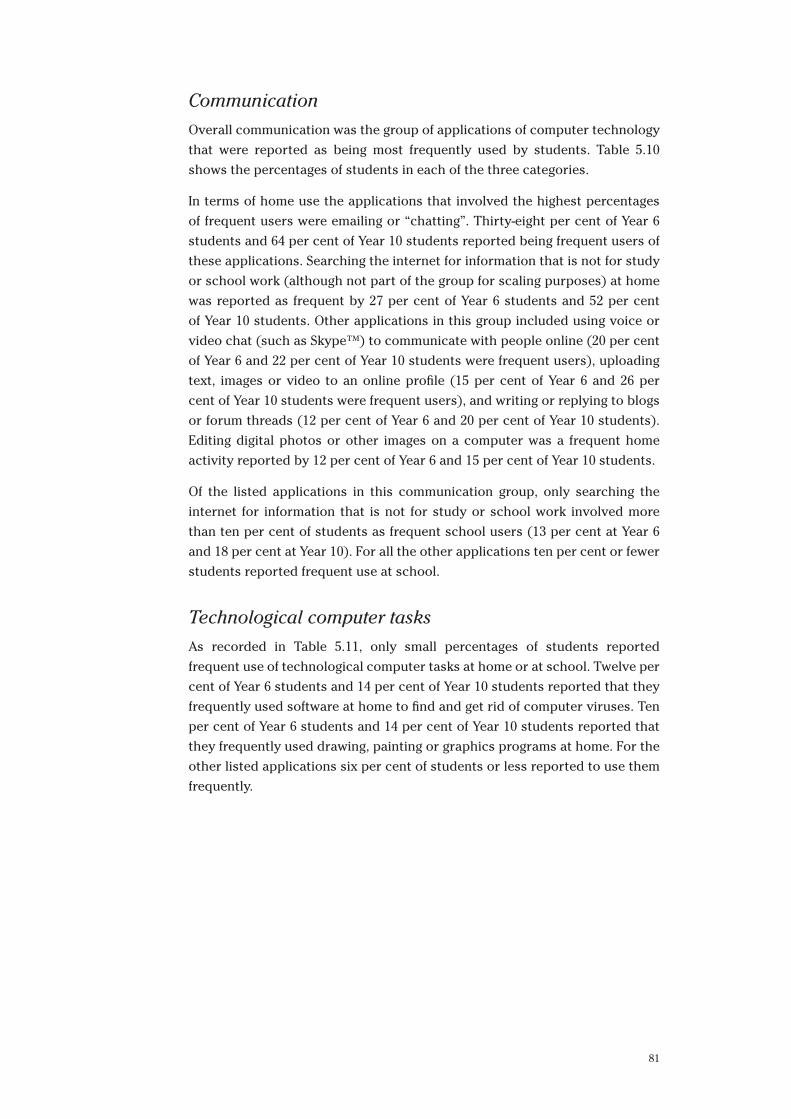
81
Communication
Overall communication was the group of applications of computer technology
that were reported as being most frequently used by students. Table 5.10
shows the percentages of students in each of the three categories.
In terms of home use the applications that involved the highest percentages
of frequent users were emailing or “chatting”. Thirty-eight per cent of Year 6
students and 64 per cent of Year 10 students reported being frequent users of
these applications. Searching the internet for information that is not for study
or school work (although not part of the group for scaling purposes) at home
was reported as frequent by 27 per cent of Year 6 students and 52 per cent
of Year 10 students. Other applications in this group included using voice or
video chat (such as Skype™) to communicate with people online (20 per cent
of Year 6 and 22 per cent of Year 10 students were frequent users), uploading
text, images or video to an online profile (15 per cent of Year 6 and 26 per
cent of Year 10 students were frequent users), and writing or replying to blogs
or forum threads (12 per cent of Year 6 and 20 per cent of Year 10 students).
Editing digital photos or other images on a computer was a frequent home
activity reported by 12 per cent of Year 6 and 15 per cent of Year 10 students.
Of the listed applications in this communication group, only searching the
internet for information that is not for study or school work involved more
than ten per cent of students as frequent school users (13 per cent at Year 6
and 18 per cent at Year 10). For all the other applications ten per cent or fewer
students reported frequent use at school.
Technological computer tasks
As recorded in Table 5.11, only small percentages of students reported
frequent use of technological computer tasks at home or at school. Twelve per
cent of Year 6 students and 14 per cent of Year 10 students reported that they
frequently used software at home to find and get rid of computer viruses. Ten
per cent of Year 6 students and 14 per cent of Year 10 students reported that
they frequently used drawing, painting or graphics programs at home. For the
other listed applications six per cent of students or less reported to use them
frequently.
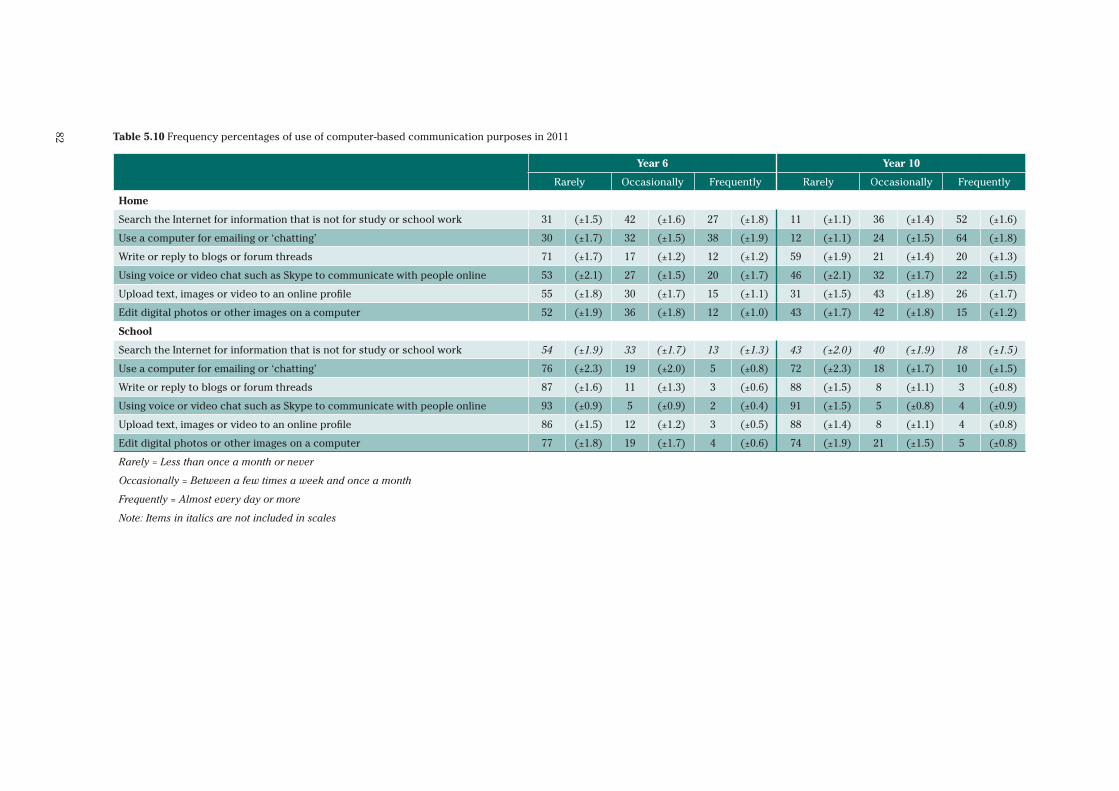
82 Table 5.10 Frequency percentages of use of computer-based communication purposes in 2011
Year 6 Year 10
Rarely Occasionally Frequently Rarely Occasionally Frequently
Home
Search the Internet for information that is not for study or school work 31 (±1.5) 42 (±1.6) 27 (±1.8) 11 (±1.1) 36 (±1.4) 52 (±1.6)
Use a computer for emailing or ‘chatting’ 30 (±1.7) 32 (±1.5) 38 (±1.9) 12 (±1.1) 24 (±1.5) 64 (±1.8)
Write or reply to blogs or forum threads 71 (±1.7) 17 (±1.2) 12 (±1.2) 59 (±1.9) 21 (±1.4) 20 (±1.3)
Using voice or video chat such as Skype to communicate with people online 53 (±2.1) 27 (±1.5) 20 (±1.7) 46 (±2.1) 32 (±1.7) 22 (±1.5)
Upload text, images or video to an online profile 55 (±1.8) 30 (±1.7) 15 (±1.1) 31 (±1.5) 43 (±1.8) 26 (±1.7)
Edit digital photos or other images on a computer 52 (±1.9) 36 (±1.8) 12 (±1.0) 43 (±1.7) 42 (±1.8) 15 (±1.2)
School
Search the Internet for information that is not for study or school work 54 (±1.9) 33 (±1.7) 13 (±1.3) 43 (±2.0) 40 (±1.9) 18 (±1.5)
Use a computer for emailing or ‘chatting’ 76 (±2.3) 19 (±2.0) 5 (±0.8) 72 (±2.3) 18 (±1.7) 10 (±1.5)
Write or reply to blogs or forum threads 87 (±1.6) 11 (±1.3) 3 (±0.6) 88 (±1.5) 8 (±1.1) 3 (±0.8)
Using voice or video chat such as Skype to communicate with people online 93 (±0.9) 5 (±0.9) 2 (±0.4) 91 (±1.5) 5 (±0.8) 4 (±0.9)
Upload text, images or video to an online profile 86 (±1.5) 12 (±1.2) 3 (±0.5) 88 (±1.4) 8 (±1.1) 4 (±0.8)
Edit digital photos or other images on a computer 77 (±1.8) 19 (±1.7) 4 (±0.6) 74 (±1.9) 21 (±1.5) 5 (±0.8)
Rarely = Less than once a month or never
Occasionally = Between a few times a week and once a month
Frequently = Almost every day or more
Note: Items in italics are not included in scales
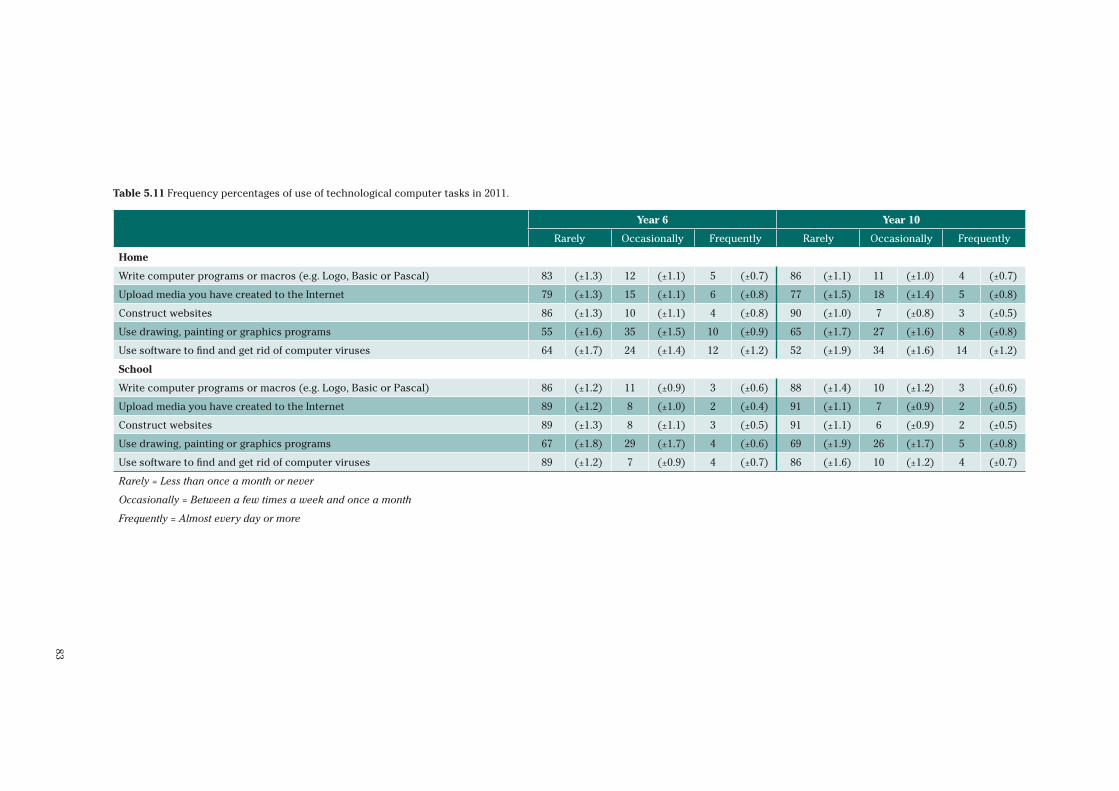
83
Table 5.11 Frequency percentages of use of technological computer tasks in 2011.
Year 6 Year 10
Rarely Occasionally Frequently Rarely Occasionally Frequently
Home
Write computer programs or macros (e.g. Logo, Basic or Pascal) 83 (±1.3) 12 (±1.1) 5 (±0.7) 86 (±1.1) 11 (±1.0) 4 (±0.7)
Upload media you have created to the Internet 79 (±1.3) 15 (±1.1) 6 (±0.8) 77 (±1.5) 18 (±1.4) 5 (±0.8)
Construct websites 86 (±1.3) 10 (±1.1) 4 (±0.8) 90 (±1.0) 7 (±0.8) 3 (±0.5)
Use drawing, painting or graphics programs 55 (±1.6) 35 (±1.5) 10 (±0.9) 65 (±1.7) 27 (±1.6) 8 (±0.8)
Use software to find and get rid of computer viruses 64 (±1.7) 24 (±1.4) 12 (±1.2) 52 (±1.9) 34 (±1.6) 14 (±1.2)
School
Write computer programs or macros (e.g. Logo, Basic or Pascal) 86 (±1.2) 11 (±0.9) 3 (±0.6) 88 (±1.4) 10 (±1.2) 3 (±0.6)
Upload media you have created to the Internet 89 (±1.2) 8 (±1.0) 2 (±0.4) 91 (±1.1) 7 (±0.9) 2 (±0.5)
Construct websites 89 (±1.3) 8 (±1.1) 3 (±0.5) 91 (±1.1) 6 (±0.9) 2 (±0.5)
Use drawing, painting or graphics programs 67 (±1.8) 29 (±1.7) 4 (±0.6) 69 (±1.9) 26 (±1.7) 5 (±0.8)
Use software to find and get rid of computer viruses 89 (±1.2) 7 (±0.9) 4 (±0.7) 86 (±1.6) 10 (±1.2) 4 (±0.7)
Rarely = Less than once a month or never
Occasionally = Between a few times a week and once a month
Frequently = Almost every day or more
84
Comparing use between males and females and between Year levels
In order to compare the use of different types of applications by different sub-
groups of students a set of four scales were derived for home and school use.
These were based on the list of items described in the previous section. Item
response theory was used to derive weighted likelihood estimates for each
scale. These scale scores were transformed to a metric where the national
mean score for Year 6 students was 50 with a standard deviation of 10. The
scaling analyses and procedures for these items are detailed in the NAP – ICT
Literacy 2011 Technical Report. The reliabilities (Cronbach’s alpha) for these
scales, which are recorded in Table 5.12 and 5.13, range from 0.69 to 0.8220.
Table 5.12 Mean scores on indices of home use of types of computer applications for male and female students in Year 6 and Year 10 (2011)
All students Males Females
Difference (males – females)
Reliability coefficient for scale
Year 6
Communication 50 (±0.4) 50 (±0.5) 51 (±0.5) -1.0 (±0.7) 0.82
Entertainment use 50 (±0.4) 51 (±0.5) 49 (±0.5) 2.0 (±0.7) 0.74
Study utilities 50 (±0.5) 49 (±0.6) 51 (±0.5) -2.0 (±0.6) 0.77
Computer technology 50 (±0.4) 50 (±0.5) 50 (±0.5) 0.3 (±0.7) 0.77
Year 10
Communication 55 (±0.3) 54 (±0.5) 55 (±0.4) -0.4 (±0.6) 0.77
Entertainment use 53 (±0.3) 55 (±0.5) 51 (±0.4) 4.1 (±0.7) 0.74
Study utilities 51 (±0.4) 50 (±0.6) 51 (±0.5) -1.1 (±0.8) 0.80
Computer technology 49 (±0.4) 51 (±0.6) 48 (±0.5) 2.7 (±0.8) 0.80
Difference (Year 10 – Year 6)
Communication 4.6 (±0.5) 4.9 (±0.7) 4.2 (±0.7) 0.6 (±0.9)
Entertainment use 2.9 (±0.5) 3.8 (±0.7) 1.8 (±0.7) 2.0 (±1.0)
Study utilities 0.7 (±0.6) 1.1 (±0.8) 0.2 (±0.7) 0.9 (±1.0)
Computer technology -0.5 (±0.5) 0.6 (±0.8) -1.8 (±0.7) 2.4 (±1.0)
Table 5.12 records the scale scores for the frequency of home use of computer
applications. Those data indicate that Year 10 students reported more frequent
home use for three of the application groups (communication, entertainment
and study utilities) and less frequent use of the technological computer
applications than Year 6 students. The differences (Year 10 – Year 6) between
the year levels were 4.6 score points (almost half a standard deviation) for
communication, 2.9 score points (more than a quarter of a standard deviation)
for entertainment use, 0.7 score points (less than a tenth of a standard
deviation) for study utilities and –0.5 score points for computer technology.
At both Year 6 and Year 10 males reported more frequent home use of
entertainment applications (this includes playing games) whereas females
20 The weakest scale is that concerned with entertainment applications at school for Year 6 students but the corresponding scale for Year 10 students is highly reliable.
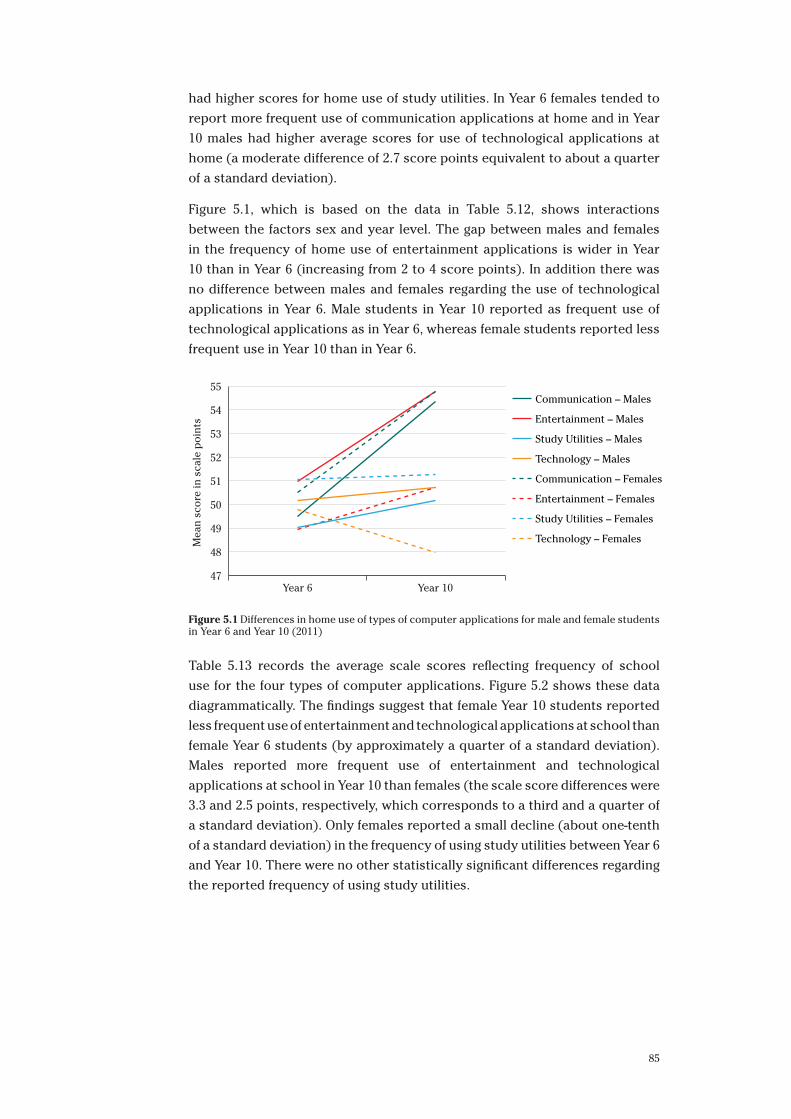
85
had higher scores for home use of study utilities. In Year 6 females tended to
report more frequent use of communication applications at home and in Year
10 males had higher average scores for use of technological applications at
home (a moderate difference of 2.7 score points equivalent to about a quarter
of a standard deviation).
Figure 5.1, which is based on the data in Table 5.12, shows interactions
between the factors sex and year level. The gap between males and females
in the frequency of home use of entertainment applications is wider in Year
10 than in Year 6 (increasing from 2 to 4 score points). In addition there was
no difference between males and females regarding the use of technological
applications in Year 6. Male students in Year 10 reported as frequent use of
technological applications as in Year 6, whereas female students reported less
frequent use in Year 10 than in Year 6.
47
48
49
50
52
53
54
51
55
Year 10
Mea
n sc
ore
in s
cale
poi
nts
Year 6
Communication – Males
Entertainment – Males
Study Utilities – Males
Technology – Males
Communication – Females
Entertainment – Females
Study Utilities – Females
Technology – Females
Figure 5.1 Differences in home use of types of computer applications for male and female students in Year 6 and Year 10 (2011)
Table 5.13 records the average scale scores reflecting frequency of school
use for the four types of computer applications. Figure 5.2 shows these data
diagrammatically. The findings suggest that female Year 10 students reported
less frequent use of entertainment and technological applications at school than
female Year 6 students (by approximately a quarter of a standard deviation).
Males reported more frequent use of entertainment and technological
applications at school in Year 10 than females (the scale score differences were
3.3 and 2.5 points, respectively, which corresponds to a third and a quarter of
a standard deviation). Only females reported a small decline (about one-tenth
of a standard deviation) in the frequency of using study utilities between Year 6
and Year 10. There were no other statistically significant differences regarding
the reported frequency of using study utilities.
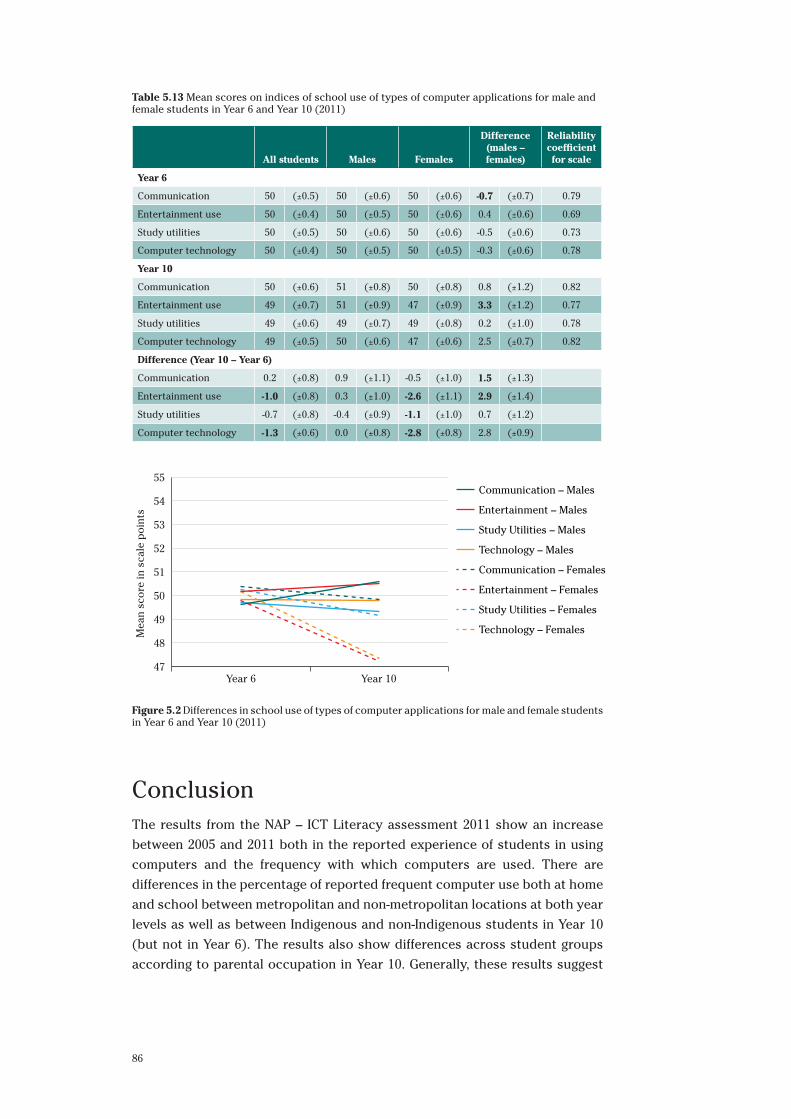
86
Table 5.13 Mean scores on indices of school use of types of computer applications for male and female students in Year 6 and Year 10 (2011)
All students Males Females
Difference (males – females)
Reliability coefficient for scale
Year 6
Communication 50 (±0.5) 50 (±0.6) 50 (±0.6) -0.7 (±0.7) 0.79
Entertainment use 50 (±0.4) 50 (±0.5) 50 (±0.6) 0.4 (±0.6) 0.69
Study utilities 50 (±0.5) 50 (±0.6) 50 (±0.6) -0.5 (±0.6) 0.73
Computer technology 50 (±0.4) 50 (±0.5) 50 (±0.5) -0.3 (±0.6) 0.78
Year 10
Communication 50 (±0.6) 51 (±0.8) 50 (±0.8) 0.8 (±1.2) 0.82
Entertainment use 49 (±0.7) 51 (±0.9) 47 (±0.9) 3.3 (±1.2) 0.77
Study utilities 49 (±0.6) 49 (±0.7) 49 (±0.8) 0.2 (±1.0) 0.78
Computer technology 49 (±0.5) 50 (±0.6) 47 (±0.6) 2.5 (±0.7) 0.82
Difference (Year 10 – Year 6)
Communication 0.2 (±0.8) 0.9 (±1.1) -0.5 (±1.0) 1.5 (±1.3)
Entertainment use -1.0 (±0.8) 0.3 (±1.0) -2.6 (±1.1) 2.9 (±1.4)
Study utilities -0.7 (±0.8) -0.4 (±0.9) -1.1 (±1.0) 0.7 (±1.2)
Computer technology -1.3 (±0.6) 0.0 (±0.8) -2.8 (±0.8) 2.8 (±0.9)
47
48
49
50
52
53
54
51
55
Year 10
Mea
n sc
ore
in s
cale
poi
nts
Year 6
Communication – Males
Entertainment – Males
Study Utilities – Males
Technology – Males
Communication – Females
Entertainment – Females
Study Utilities – Females
Technology – Females
Figure 5.2 Differences in school use of types of computer applications for male and female students in Year 6 and Year 10 (2011)
ConclusionThe results from the NAP – ICT Literacy assessment 2011 show an increase
between 2005 and 2011 both in the reported experience of students in using
computers and the frequency with which computers are used. There are
differences in the percentage of reported frequent computer use both at home
and school between metropolitan and non-metropolitan locations at both year
levels as well as between Indigenous and non-Indigenous students in Year 10
(but not in Year 6). The results also show differences across student groups
according to parental occupation in Year 10. Generally, these results suggest
87
that there were background-related differences in opportunities for students
to become part of the digital world.
It is also evident that there were differences in the way students reported
using different types of computer applications. Those patterns of use differ
between home use and school use, between Year 6 and Year 10, and between
males and females. Generally, students reported the use of study utilities with
similar frequency at home and school but students in Year 10 reported more
frequent use of this type of application than those in Year 6. Communication
applications were reported to be much more frequently used at home than at
school and were reported as more frequently used by Year 10 students than
by Year 6 students. The use of entertainment applications was reported to be
more frequent in the home context than at school. Only a small percentage of
students reported higher frequencies of using technological applications.

88
89
Chapter 6 Student Perceptions of ICT
In addition to providing information about student use of ICT, the student
questionnaire was designed to provide data that would inform judgements
about two important aspects of students’ perceptions of working with ICT.
These aspects were the extent to which students were interested in and
enjoyed working with ICT and students’ confidence in using ICT (which is
referred to as ICT self-efficacy). There is a body of research literature that
suggests that, on average, students are interested in and enjoy working with
ICT. In part this may be as a result of students experiencing a greater sense of
control (or self regulation) over their learning when they use ICT and because
of the opportunities for students to experience multiple representations of
information (Lajoie & Azevado, 2006). It also affords students the opportunity
for “serious play” through which they can seek and interpret information. Data
collected in NAP – ICT Literacy 2008 showed that students reported being
positively disposed to working with ICT (MCEETYA, 2008).
There is a further body of research and theory regarding self efficacy and its
relationship to measured achievement in a number of learning areas (Bandura,
1989). More recently there has been a number of studies that investigated
students’ sense of confidence in using ICT, or “ICT self-efficacy” (OECD, 2010).
The 2009 cycle of PISA included a measure of ICT self-efficacy as part of the
main survey as well as an electronic reading assessment which was a widely
adopted national option. In the 29 countries that implemented the electronic
reading assessment it was found that ICT self-efficacy was positively associated
with measured achievement. NAP – ICT Literacy 2011 included a measure of
ICT self-efficacy as well as measured achievement in ICT Literacy.
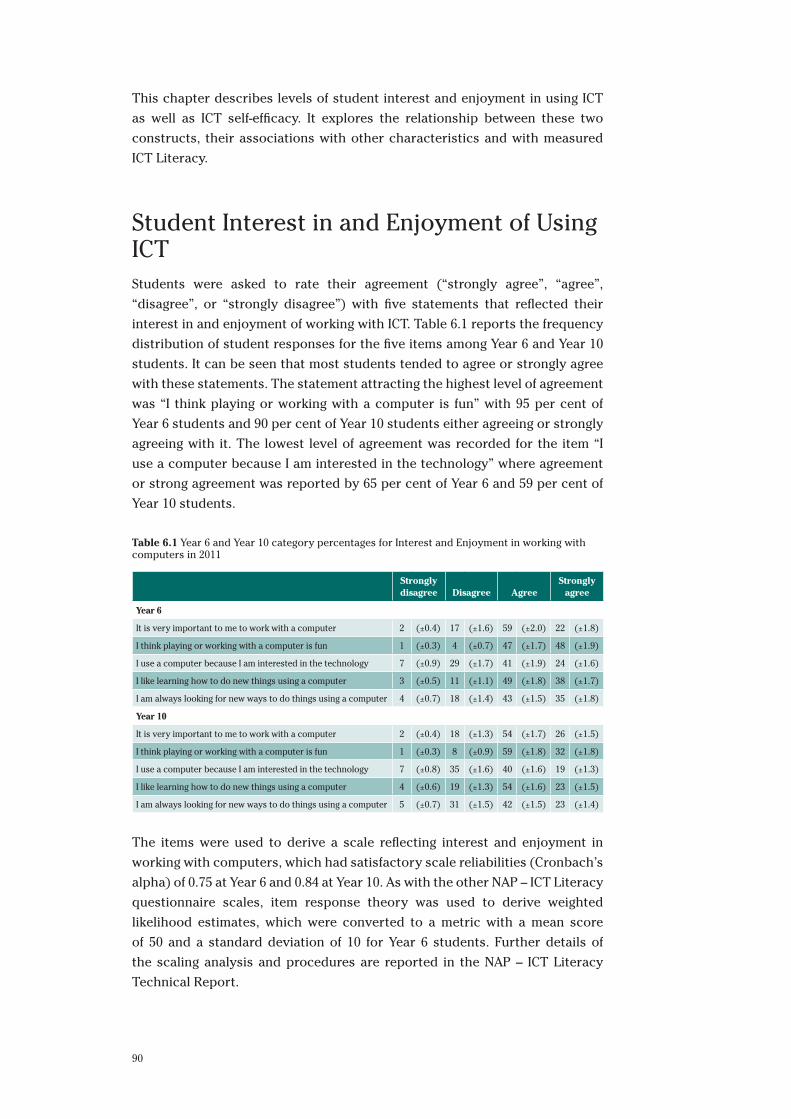
90
This chapter describes levels of student interest and enjoyment in using ICT
as well as ICT self-efficacy. It explores the relationship between these two
constructs, their associations with other characteristics and with measured
ICT Literacy.
Student Interest in and Enjoyment of Using ICTStudents were asked to rate their agreement (“strongly agree”, “agree”,
“disagree”, or “strongly disagree”) with five statements that reflected their
interest in and enjoyment of working with ICT. Table 6.1 reports the frequency
distribution of student responses for the five items among Year 6 and Year 10
students. It can be seen that most students tended to agree or strongly agree
with these statements. The statement attracting the highest level of agreement
was “I think playing or working with a computer is fun” with 95 per cent of
Year 6 students and 90 per cent of Year 10 students either agreeing or strongly
agreeing with it. The lowest level of agreement was recorded for the item “I
use a computer because I am interested in the technology” where agreement
or strong agreement was reported by 65 per cent of Year 6 and 59 per cent of
Year 10 students.
Table 6.1 Year 6 and Year 10 category percentages for Interest and Enjoyment in working with computers in 2011
Strongly disagree Disagree Agree
Strongly agree
Year 6
It is very important to me to work with a computer 2 (±0.4) 17 (±1.6) 59 (±2.0) 22 (±1.8)
I think playing or working with a computer is fun 1 (±0.3) 4 (±0.7) 47 (±1.7) 48 (±1.9)
I use a computer because I am interested in the technology 7 (±0.9) 29 (±1.7) 41 (±1.9) 24 (±1.6)
I like learning how to do new things using a computer 3 (±0.5) 11 (±1.1) 49 (±1.8) 38 (±1.7)
I am always looking for new ways to do things using a computer 4 (±0.7) 18 (±1.4) 43 (±1.5) 35 (±1.8)
Year 10
It is very important to me to work with a computer 2 (±0.4) 18 (±1.3) 54 (±1.7) 26 (±1.5)
I think playing or working with a computer is fun 1 (±0.3) 8 (±0.9) 59 (±1.8) 32 (±1.8)
I use a computer because I am interested in the technology 7 (±0.8) 35 (±1.6) 40 (±1.6) 19 (±1.3)
I like learning how to do new things using a computer 4 (±0.6) 19 (±1.3) 54 (±1.6) 23 (±1.5)
I am always looking for new ways to do things using a computer 5 (±0.7) 31 (±1.5) 42 (±1.5) 23 (±1.4)
The items were used to derive a scale reflecting interest and enjoyment in
working with computers, which had satisfactory scale reliabilities (Cronbach’s
alpha) of 0.75 at Year 6 and 0.84 at Year 10. As with the other NAP – ICT Literacy
questionnaire scales, item response theory was used to derive weighted
likelihood estimates, which were converted to a metric with a mean score
of 50 and a standard deviation of 10 for Year 6 students. Further details of
the scaling analysis and procedures are reported in the NAP – ICT Literacy
Technical Report.
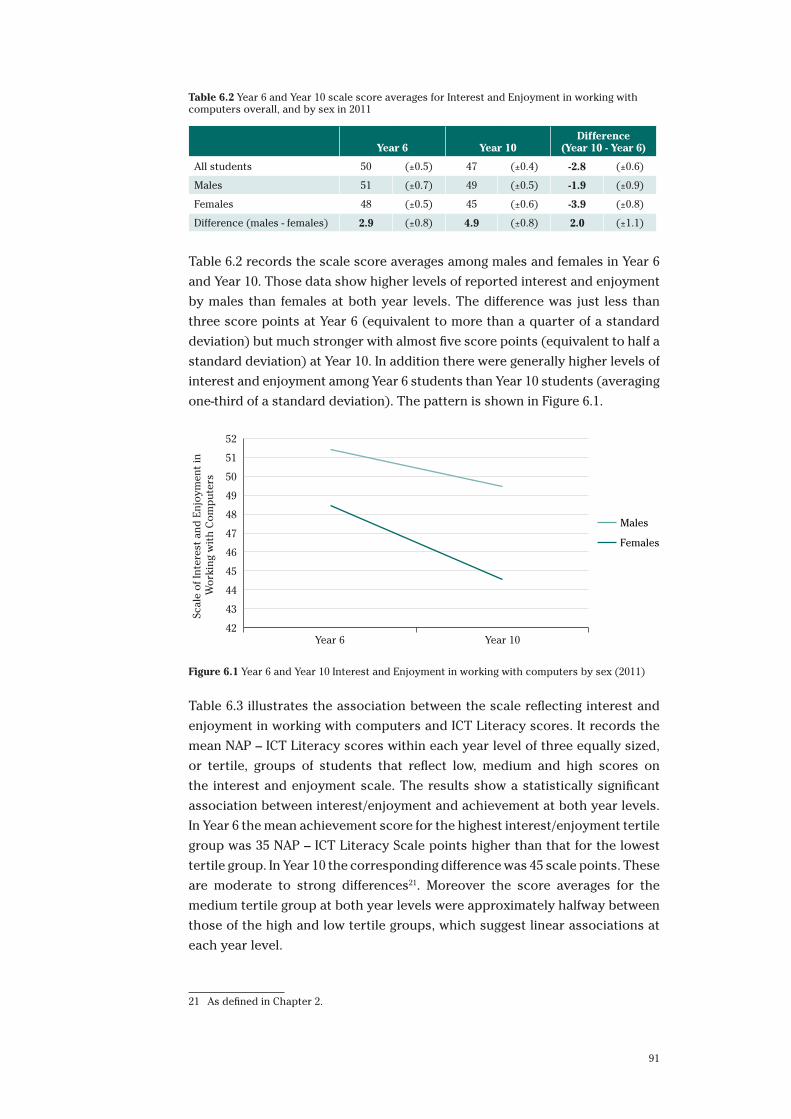
91
Table 6.2 Year 6 and Year 10 scale score averages for Interest and Enjoyment in working with computers overall, and by sex in 2011
Year 6 Year 10Difference
(Year 10 - Year 6)
All students 50 (±0.5) 47 (±0.4) -2.8 (±0.6)
Males 51 (±0.7) 49 (±0.5) -1.9 (±0.9)
Females 48 (±0.5) 45 (±0.6) -3.9 (±0.8)
Difference (males - females) 2.9 (±0.8) 4.9 (±0.8) 2.0 (±1.1)
Table 6.2 records the scale score averages among males and females in Year 6
and Year 10. Those data show higher levels of reported interest and enjoyment
by males than females at both year levels. The difference was just less than
three score points at Year 6 (equivalent to more than a quarter of a standard
deviation) but much stronger with almost five score points (equivalent to half a
standard deviation) at Year 10. In addition there were generally higher levels of
interest and enjoyment among Year 6 students than Year 10 students (averaging
one-third of a standard deviation). The pattern is shown in Figure 6.1.
42
43
44
45
46
48
49
50
51
47
52
Year 10
Scal
e of
Inte
rest
and
Enj
oym
ent
in
Wor
king
wit
h C
omp
uter
s
Year 6
Males
Females
Figure 6.1 Year 6 and Year 10 Interest and Enjoyment in working with computers by sex (2011)
Table 6.3 illustrates the association between the scale reflecting interest and
enjoyment in working with computers and ICT Literacy scores. It records the
mean NAP – ICT Literacy scores within each year level of three equally sized,
or tertile, groups of students that reflect low, medium and high scores on
the interest and enjoyment scale. The results show a statistically significant
association between interest/enjoyment and achievement at both year levels.
In Year 6 the mean achievement score for the highest interest/enjoyment tertile
group was 35 NAP – ICT Literacy Scale points higher than that for the lowest
tertile group. In Year 10 the corresponding difference was 45 scale points. These
are moderate to strong differences21. Moreover the score averages for the
medium tertile group at both year levels were approximately halfway between
those of the high and low tertile groups, which suggest linear associations at
each year level.
21 As defined in Chapter 2.
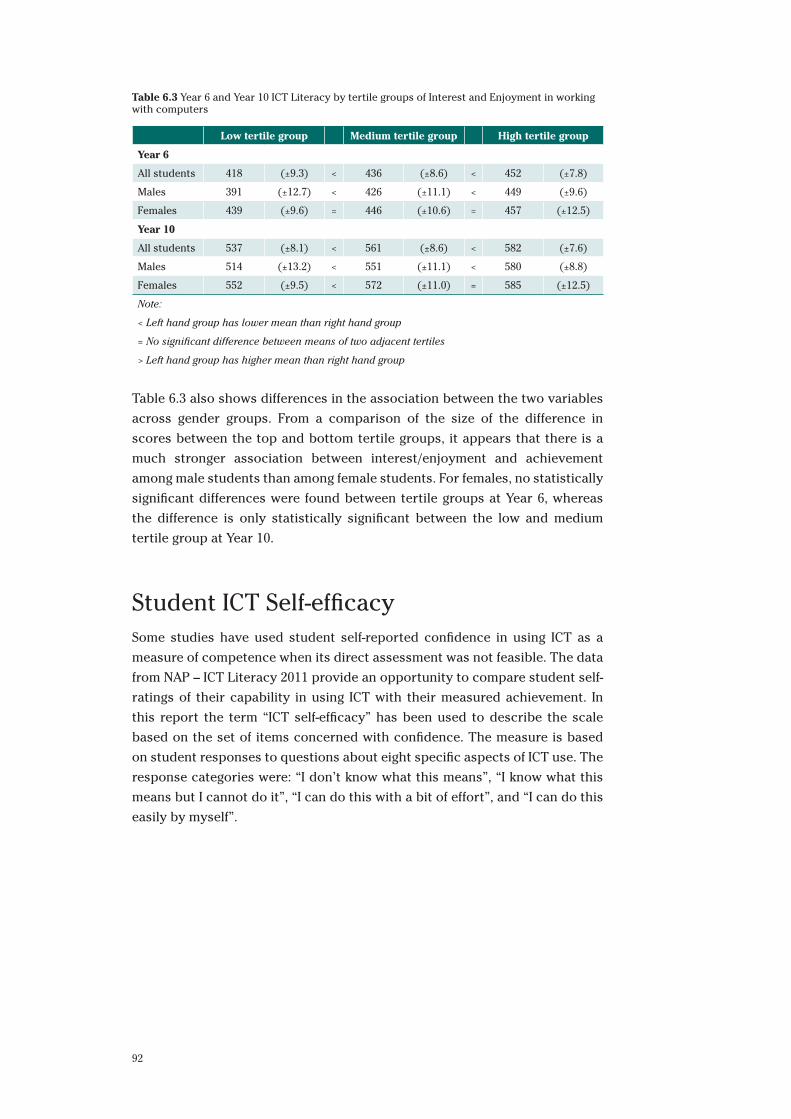
92
Table 6.3 Year 6 and Year 10 ICT Literacy by tertile groups of Interest and Enjoyment in working with computers
Low tertile group Medium tertile group High tertile group
Year 6
All students 418 (±9.3) < 436 (±8.6) < 452 (±7.8)
Males 391 (±12.7) < 426 (±11.1) < 449 (±9.6)
Females 439 (±9.6) = 446 (±10.6) = 457 (±12.5)
Year 10
All students 537 (±8.1) < 561 (±8.6) < 582 (±7.6)
Males 514 (±13.2) < 551 (±11.1) < 580 (±8.8)
Females 552 (±9.5) < 572 (±11.0) = 585 (±12.5)
Note:
< Left hand group has lower mean than right hand group
= No significant difference between means of two adjacent tertiles
> Left hand group has higher mean than right hand group
Table 6.3 also shows differences in the association between the two variables
across gender groups. From a comparison of the size of the difference in
scores between the top and bottom tertile groups, it appears that there is a
much stronger association between interest/enjoyment and achievement
among male students than among female students. For females, no statistically
significant differences were found between tertile groups at Year 6, whereas
the difference is only statistically significant between the low and medium
tertile group at Year 10.
Student ICT Self-efficacySome studies have used student self-reported confidence in using ICT as a
measure of competence when its direct assessment was not feasible. The data
from NAP – ICT Literacy 2011 provide an opportunity to compare student self-
ratings of their capability in using ICT with their measured achievement. In
this report the term “ICT self-efficacy” has been used to describe the scale
based on the set of items concerned with confidence. The measure is based
on student responses to questions about eight specific aspects of ICT use. The
response categories were: “I don’t know what this means”, “I know what this
means but I cannot do it”, “I can do this with a bit of effort”, and “I can do this
easily by myself”.
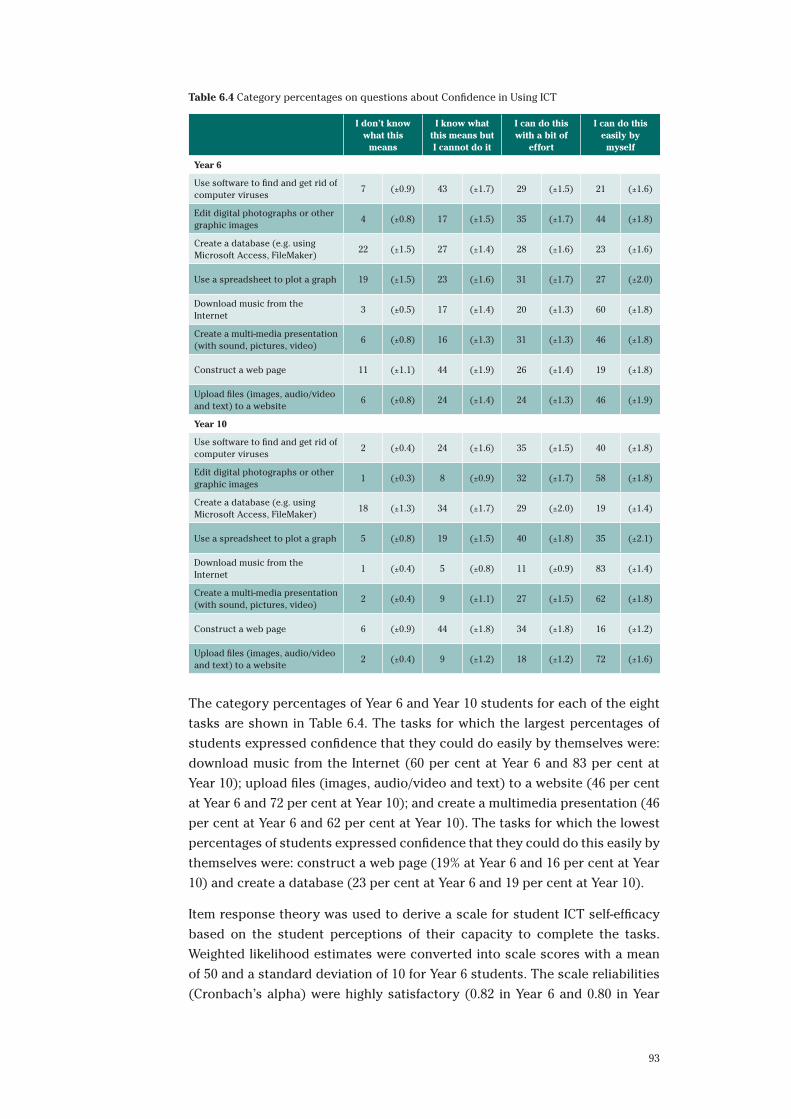
93
Table 6.4 Category percentages on questions about Confidence in Using ICT
I don’t know what this
means
I know what this means but I cannot do it
I can do this with a bit of
effort
I can do this easily by myself
Year 6
Use software to find and get rid of computer viruses
7 (±0.9) 43 (±1.7) 29 (±1.5) 21 (±1.6)
Edit digital photographs or other graphic images
4 (±0.8) 17 (±1.5) 35 (±1.7) 44 (±1.8)
Create a database (e.g. using Microsoft Access, FileMaker)
22 (±1.5) 27 (±1.4) 28 (±1.6) 23 (±1.6)
Use a spreadsheet to plot a graph 19 (±1.5) 23 (±1.6) 31 (±1.7) 27 (±2.0)
Download music from the Internet
3 (±0.5) 17 (±1.4) 20 (±1.3) 60 (±1.8)
Create a multi-media presentation (with sound, pictures, video)
6 (±0.8) 16 (±1.3) 31 (±1.3) 46 (±1.8)
Construct a web page 11 (±1.1) 44 (±1.9) 26 (±1.4) 19 (±1.8)
Upload files (images, audio/video and text) to a website
6 (±0.8) 24 (±1.4) 24 (±1.3) 46 (±1.9)
Year 10
Use software to find and get rid of computer viruses
2 (±0.4) 24 (±1.6) 35 (±1.5) 40 (±1.8)
Edit digital photographs or other graphic images
1 (±0.3) 8 (±0.9) 32 (±1.7) 58 (±1.8)
Create a database (e.g. using Microsoft Access, FileMaker)
18 (±1.3) 34 (±1.7) 29 (±2.0) 19 (±1.4)
Use a spreadsheet to plot a graph 5 (±0.8) 19 (±1.5) 40 (±1.8) 35 (±2.1)
Download music from the Internet
1 (±0.4) 5 (±0.8) 11 (±0.9) 83 (±1.4)
Create a multi-media presentation (with sound, pictures, video)
2 (±0.4) 9 (±1.1) 27 (±1.5) 62 (±1.8)
Construct a web page 6 (±0.9) 44 (±1.8) 34 (±1.8) 16 (±1.2)
Upload files (images, audio/video and text) to a website
2 (±0.4) 9 (±1.2) 18 (±1.2) 72 (±1.6)
The category percentages of Year 6 and Year 10 students for each of the eight
tasks are shown in Table 6.4. The tasks for which the largest percentages of
students expressed confidence that they could do easily by themselves were:
download music from the Internet (60 per cent at Year 6 and 83 per cent at
Year 10); upload files (images, audio/video and text) to a website (46 per cent
at Year 6 and 72 per cent at Year 10); and create a multimedia presentation (46
per cent at Year 6 and 62 per cent at Year 10). The tasks for which the lowest
percentages of students expressed confidence that they could do this easily by
themselves were: construct a web page (19% at Year 6 and 16 per cent at Year
10) and create a database (23 per cent at Year 6 and 19 per cent at Year 10).
Item response theory was used to derive a scale for student ICT self-efficacy
based on the student perceptions of their capacity to complete the tasks.
Weighted likelihood estimates were converted into scale scores with a mean
of 50 and a standard deviation of 10 for Year 6 students. The scale reliabilities
(Cronbach’s alpha) were highly satisfactory (0.82 in Year 6 and 0.80 in Year
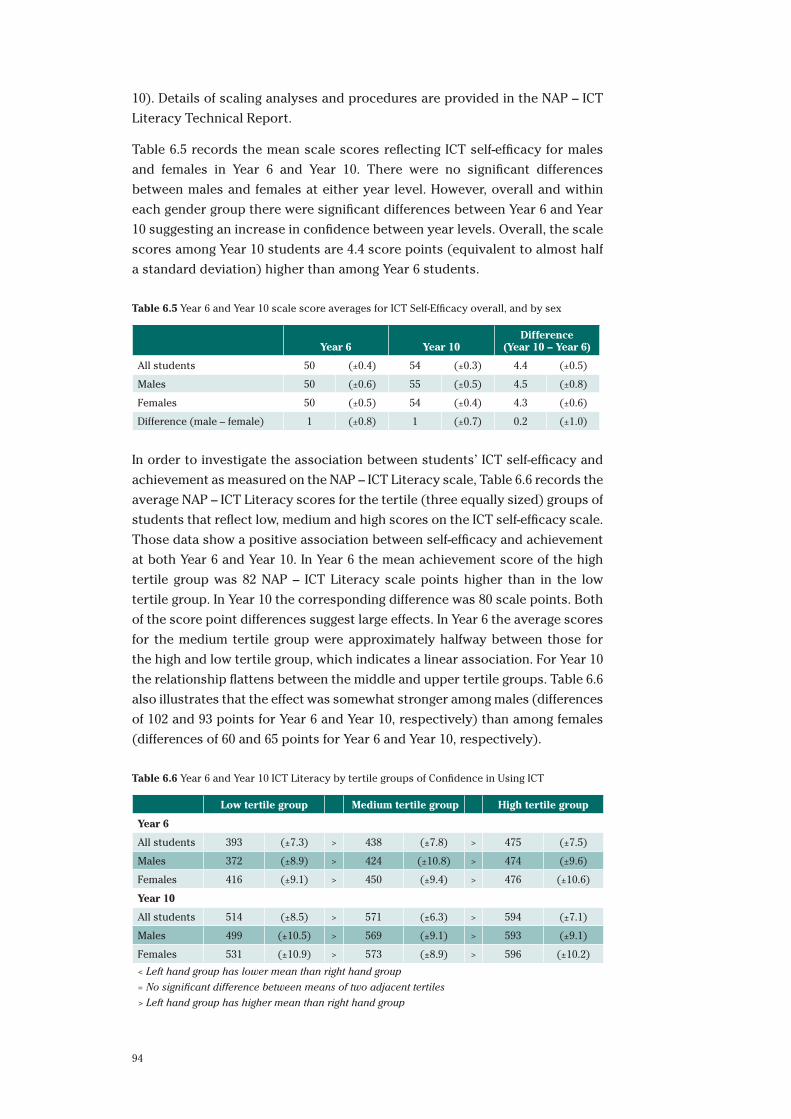
94
10). Details of scaling analyses and procedures are provided in the NAP – ICT
Literacy Technical Report.
Table 6.5 records the mean scale scores reflecting ICT self-efficacy for males
and females in Year 6 and Year 10. There were no significant differences
between males and females at either year level. However, overall and within
each gender group there were significant differences between Year 6 and Year
10 suggesting an increase in confidence between year levels. Overall, the scale
scores among Year 10 students are 4.4 score points (equivalent to almost half
a standard deviation) higher than among Year 6 students.
Table 6.5 Year 6 and Year 10 scale score averages for ICT Self-Efficacy overall, and by sex
Year 6 Year 10Difference
(Year 10 – Year 6)
All students 50 (±0.4) 54 (±0.3) 4.4 (±0.5)
Males 50 (±0.6) 55 (±0.5) 4.5 (±0.8)
Females 50 (±0.5) 54 (±0.4) 4.3 (±0.6)
Difference (male – female) 1 (±0.8) 1 (±0.7) 0.2 (±1.0)
In order to investigate the association between students’ ICT self-efficacy and
achievement as measured on the NAP – ICT Literacy scale, Table 6.6 records the
average NAP – ICT Literacy scores for the tertile (three equally sized) groups of
students that reflect low, medium and high scores on the ICT self-efficacy scale.
Those data show a positive association between self-efficacy and achievement
at both Year 6 and Year 10. In Year 6 the mean achievement score of the high
tertile group was 82 NAP – ICT Literacy scale points higher than in the low
tertile group. In Year 10 the corresponding difference was 80 scale points. Both
of the score point differences suggest large effects. In Year 6 the average scores
for the medium tertile group were approximately halfway between those for
the high and low tertile group, which indicates a linear association. For Year 10
the relationship flattens between the middle and upper tertile groups. Table 6.6
also illustrates that the effect was somewhat stronger among males (differences
of 102 and 93 points for Year 6 and Year 10, respectively) than among females
(differences of 60 and 65 points for Year 6 and Year 10, respectively).
Table 6.6 Year 6 and Year 10 ICT Literacy by tertile groups of Confidence in Using ICT
Low tertile group Medium tertile group High tertile group
Year 6
All students 393 (±7.3) > 438 (±7.8) > 475 (±7.5)
Males 372 (±8.9) > 424 (±10.8) > 474 (±9.6)
Females 416 (±9.1) > 450 (±9.4) > 476 (±10.6)
Year 10
All students 514 (±8.5) > 571 (±6.3) > 594 (±7.1)
Males 499 (±10.5) > 569 (±9.1) > 593 (±9.1)
Females 531 (±10.9) > 573 (±8.9) > 596 (±10.2)
< Left hand group has lower mean than right hand group
= No significant difference between means of two adjacent tertiles
> Left hand group has higher mean than right hand group
95
Influences on ICT LiteracyIt was a matter of interest to understand how various aspects of student use of
ICT were related to interest and enjoyment, ICT self-efficacy and achievement
on the NAP – ICT Literacy scale. These factors are correlated with each other
and a multivariate technique called path analysis (see for example Kaplan,
2009) was used to estimate the strength of the relationships among these
elements. For the analyses, the scale scores were standardised to a mean of
zero and a standard deviation of one within each year level whereas categorical
variables were included using their original categories22. This process provided
comparable bases on which to base interpretations of estimates.
The final model included three different blocks of variables. The first block
consisted of precursors: sex, geographic location, numbers of computers at
home (resources), and years of experience in using computers. The second
block consisted of one intermediate variable – students’ interest and enjoyment
of working with computers – that influences ICT Literacy and ICT self-efficacy.
The third block consisted of two criterion (or outcome) variables: ICT Literacy
and ICT self-efficacy. Given that it is likely that there is a reciprocal relationship
between feelings of confidence and actual knowledge, the association between
ICT self-efficacy and ICT Literacy is shown as a correlation without making
assumptions about its causal direction. The model assumes that the precursors
would affect the two outcomes directly and through their influence on students’
interest and enjoyment23. The conceptual path model is shown in Figure 6.2.
The net effects are shown in Table 6.724. The results need to be interpreted
in conjunction with Figure 6.2, which represents schematically the pattern of
relationships. The results for the model in Year 6 were generally very similar
to those for Year 1025. The model explained 11 per cent of the total variance in
ICT Literacy in Year 6 and 16 per cent in Year 10. The model explained 17 per
cent of the variance in ICT self-efficacy in Year 6 and 20 per cent in Year 10, the
respective variance explanation for interest and enjoyment of working with
computers was five per cent in Year 6 and eight per cent in Year 10.
22 For this analysis: Geographic location was collapsed to two categories (1=metropolitan, 0=non-metropolitan) because there are too few cases in the remote category to provide enough power to generate statistical significance for reasonable effect sizes. Sex was coded 0 for males and 1 for females. Number of computers had the categories 0, 1, 2, 3 or more. Experience in years included the values 0, 2, 4, 6.
23 The path model was specified as a multi-level model with students nested within schools. Among the precursor variables in block 1, sex, computer resources and years of experience were student-level factors and geographic location a school-level factor. The estimation of model estimates was carried out using the MPLUS software package (see Muthén & Muthén, 2006). Further details on the model are provided in the NAP – ICT Literacy Technical Report 2011.
24 These results are represented as unstandardised path coefficients (and their associated standard errors) and are expressed in terms of standard deviation units of the relevant predicted variable (ICT literacy, self-efficacy or interest) because these scales were transformed to have a standard deviation of one and because the original scales had different metrics.
25 Only one difference was observed: number of computers at home was a weak predictor of achievement in Year 10 but not in Year 6.
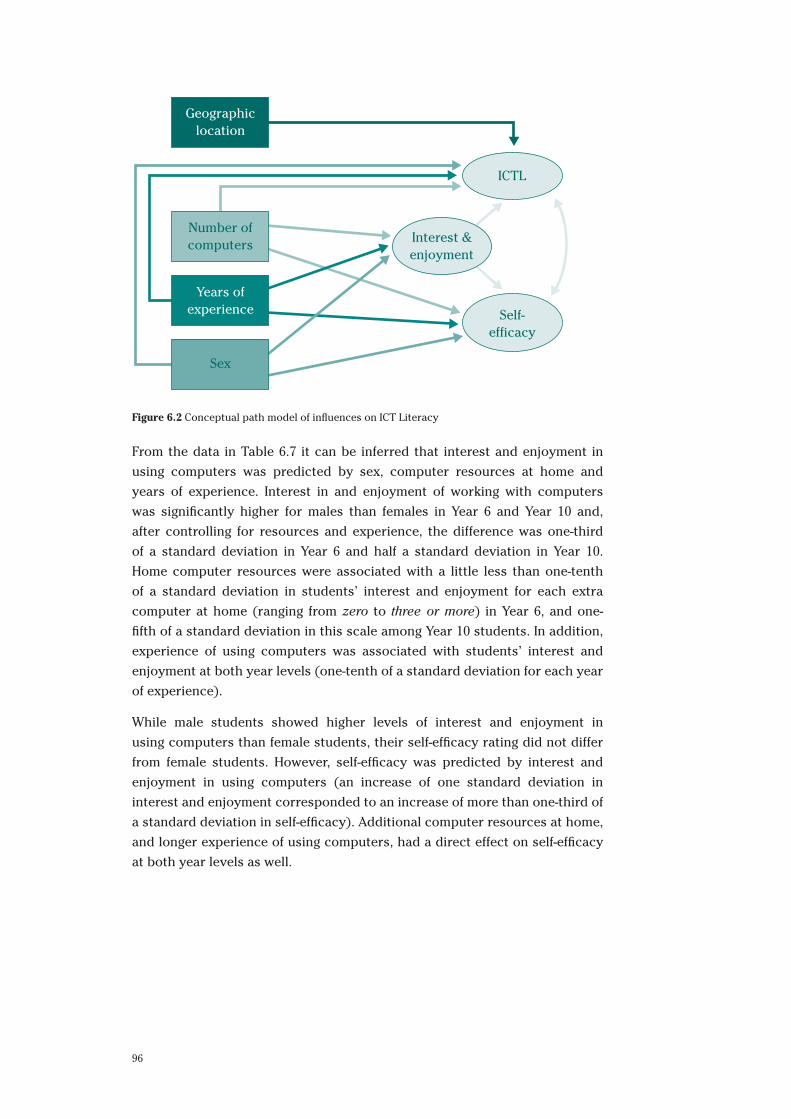
96
Geographiclocation
Number ofcomputers
ICTL
Self-efficacy
Interest &enjoyment
Years ofexperience
Sex
Figure 6.2 Conceptual path model of influences on ICT Literacy
From the data in Table 6.7 it can be inferred that interest and enjoyment in
using computers was predicted by sex, computer resources at home and
years of experience. Interest in and enjoyment of working with computers
was significantly higher for males than females in Year 6 and Year 10 and,
after controlling for resources and experience, the difference was one-third
of a standard deviation in Year 6 and half a standard deviation in Year 10.
Home computer resources were associated with a little less than one-tenth
of a standard deviation in students’ interest and enjoyment for each extra
computer at home (ranging from zero to three or more) in Year 6, and one-
fifth of a standard deviation in this scale among Year 10 students. In addition,
experience of using computers was associated with students’ interest and
enjoyment at both year levels (one-tenth of a standard deviation for each year
of experience).
While male students showed higher levels of interest and enjoyment in
using computers than female students, their self-efficacy rating did not differ
from female students. However, self-efficacy was predicted by interest and
enjoyment in using computers (an increase of one standard deviation in
interest and enjoyment corresponded to an increase of more than one-third of
a standard deviation in self-efficacy). Additional computer resources at home,
and longer experience of using computers, had a direct effect on self-efficacy
at both year levels as well.
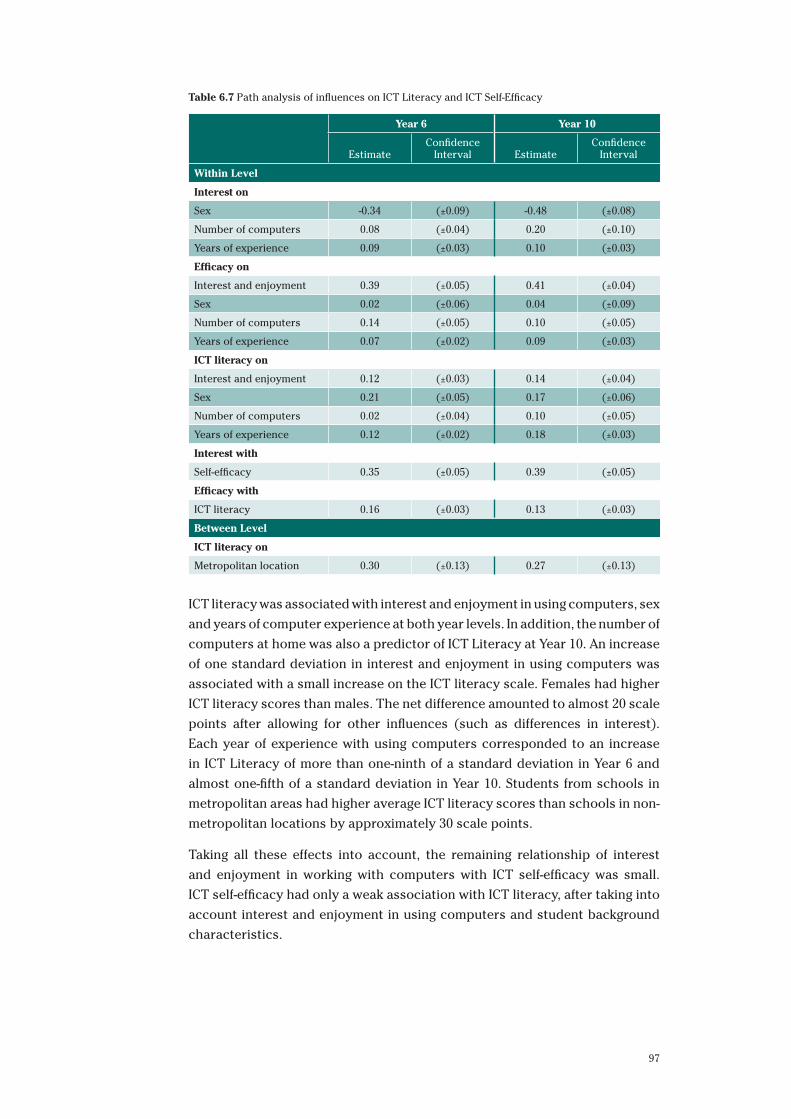
97
Table 6.7 Path analysis of influences on ICT Literacy and ICT Self-Efficacy
Year 6 Year 10
EstimateConfidence
Interval EstimateConfidence
Interval
Within Level
Interest on
Sex -0.34 (±0.09) -0.48 (±0.08)
Number of computers 0.08 (±0.04) 0.20 (±0.10)
Years of experience 0.09 (±0.03) 0.10 (±0.03)
Efficacy on
Interest and enjoyment 0.39 (±0.05) 0.41 (±0.04)
Sex 0.02 (±0.06) 0.04 (±0.09)
Number of computers 0.14 (±0.05) 0.10 (±0.05)
Years of experience 0.07 (±0.02) 0.09 (±0.03)
ICT literacy on
Interest and enjoyment 0.12 (±0.03) 0.14 (±0.04)
Sex 0.21 (±0.05) 0.17 (±0.06)
Number of computers 0.02 (±0.04) 0.10 (±0.05)
Years of experience 0.12 (±0.02) 0.18 (±0.03)
Interest with
Self-efficacy 0.35 (±0.05) 0.39 (±0.05)
Efficacy with
ICT literacy 0.16 (±0.03) 0.13 (±0.03)
Between Level
ICT literacy on
Metropolitan location 0.30 (±0.13) 0.27 (±0.13)
ICT literacy was associated with interest and enjoyment in using computers, sex
and years of computer experience at both year levels. In addition, the number of
computers at home was also a predictor of ICT Literacy at Year 10. An increase
of one standard deviation in interest and enjoyment in using computers was
associated with a small increase on the ICT literacy scale. Females had higher
ICT literacy scores than males. The net difference amounted to almost 20 scale
points after allowing for other influences (such as differences in interest).
Each year of experience with using computers corresponded to an increase
in ICT Literacy of more than one-ninth of a standard deviation in Year 6 and
almost one-fifth of a standard deviation in Year 10. Students from schools in
metropolitan areas had higher average ICT literacy scores than schools in non-
metropolitan locations by approximately 30 scale points.
Taking all these effects into account, the remaining relationship of interest
and enjoyment in working with computers with ICT self-efficacy was small.
ICT self-efficacy had only a weak association with ICT literacy, after taking into
account interest and enjoyment in using computers and student background
characteristics.
98
ConclusionThe data from the NAP – ICT Literacy questionnaire 2011 confirm the widely
held view that students enjoy working with and are interested in ICT in the
form of computers and are confident in the capacity to use ICT. Student
experience of ICT appeared to be associated with interest and enjoyment of
using computers, with ICT self-efficacy, and with ICT Literacy. Female students
expressed lower levels of interest and enjoyment than males in computing
but similar confidence in their ability to carry out ICT-based tasks without
assistance. However, they recorded higher scores on ICT Literacy than males.
After controlling for sex, years of experience, computer resources and ICT
interest and enjoyment, the relationship between ICT self-efficacy and ICT
Literacy was not strong which suggests that self-reports from students about
their abilities of using ICT should not be used as substitutes for a direct
assessment of their abilities.
99
Chapter 7 Conclusion
Developments in information and communication technology (ICT) have
changed, and continue to change, the education, work and social lives of people.
These developments have led education authorities in many countries to see
competence in ICT as a key preparation for young peoples’ futures. In many
countries there have been substantial investments in ICT through programs
such as the Digital Education Revolution in Australia, the National Educational
Technology Plan in the United States (U. S. Department of Education, 2010) and
corresponding initiatives in many other countries (Bakia et al., 2011). Alongside
these initiatives the past decade has seen ICT-based assessment grow as a field
for development and research. As a result of those developments it has become
evident that ICT provides possibilities for new approaches to assessment
(Griffin, McGaw & Care, 2012; Mayrath et al., 2012). Education authorities in
several countries have established assessment programs so that they can
measure and track how well students are prepared for the digital age. The
Australian National Assessment Program in ICT Literacy was one of the first
large-scale assessment programs in this field and has contributed to national
and international developments in ICT-based assessment. After three cycles
(spanning six years) of the National Assessment Program in ICT Literacy it is
opportune to look at the current levels of ICT literacy among Australian Year
6 and Year 10 students, to reflect on changes that have taken place over six
years, and to take stock of what has not changed.
100
ICT Literacy in 2011 The first cycle of NAP – ICT Literacy conducted in 2005 not only provided
achievement data from nationally representative samples of students in Year
6 and Year 10 but also enabled a Proficient Standard to be defined for each of
those year levels. Those Proficient Standards (which accompany a profile of
ICT Literacy covering both year levels) have continued as a reference against
which to report student achievement and monitor changes over time.
Overall, 62 percent of Year 6 students in 2011 attained the Proficient Standard
for Year 6 by being able to: “generate simple general search questions and select
the best information source to meet a specific purpose, retrieve information
from given electronic sources to answer specific, concrete questions, assemble
information in a provided simple linear order to create information products,
use conventionally recognised software commands to edit and reformat
information products”.
Sixty-five percent of Year 10 students reached or exceeded the Proficient
Standard for Year 10 by giving evidence that they were able to: “generate
well targeted searches for electronic information sources and select relevant
information from within sources to meet a specific purpose, create information
products with simple linear structures and use software commands to edit and
reformat information products in ways that demonstrate some consideration
of audience and communicative purpose”.
Although there is a difference in the average achievement of students in Year
6 and Year 10 there is overlap between the achievements demonstrated by the
two groups. The difference in average achievement between Year 6 and Year
10 is considerable: 124 points on the NAP – ICT Literacy Scale. Despite this
difference in average achievement, 21 per cent of Year 6 students achieved at a
level above the Year 10 Proficient Standard and 10 per cent of Year 10 students
achieved at a level below the Year 6 Proficient Standard. Across Levels 3 and
4 of the NAP – ICT Literacy Scale 60 per cent of Year 6 student achievement
overlaps with 69 per cent of Year 10 student achievement.
Changes over Six YearsFrom 2005 to 2011 the ICT Literacy achievement of Year 6 students has
improved. The mean score on the NAP – ICT Literacy scale for Year 6 students
increased by 35 scale points from 400 in 2005 to 435 in 2011: a significant
increase of moderate size. Moreover the increase in average achievement in
Year 6 has been steady: increasing by 19 points from 2005 to 2008 and by a
further 16 points from 2008 to 2011. Both of these increases are statistically
significant. Expressed in a different metric the percentage of Year 6 students
attaining the Proficient Standard increased from 49 per cent in 2005 to 62 per
cent in 2011.
101
This overall increase in the achievement of Year 6 students is not uniform
across the distribution of achievement. Achievement around the middle and
upper levels of the distribution has increased. However, the proportion of low
achieving students has remained relatively constant: since 2005 the percentage
of students achieving at Level 1 has only decreased by two per cent.
Among Year 10 students ICT literacy has not changed over the same period.
The apparent changes from a mean score of 551 scale points in 2005 through
560 in 2008 to 559 in 2011 are fluctuations within the range of uncertainty and
one cannot be sure that they reflect true changes in the achievement of Year
10 students. Despite the lack of overall change in the mean achievement of
Year 10 students since 2005, there was some evidence in the data that the
distribution of achievement has changed over this time. This change is
similar to that observed at Year 6 with an upward shift in the achievement of
students around or above the Proficient Standard, but not at the lower levels
of the achievement distribution. Since 2005 the proportion of Year 10 students
demonstrating achievement at Levels 1 and 2 of the distribution (i.e. below
the Year 6 Proficient Standard) has increased from six per cent to 10 per cent.
The difference between Year 6 and Year 10 in changes over six years provokes
speculation about the source of those differences. This difference is not likely
to have risen from a ceiling effect in the scale (or the assessment instrument)
for Year 10 students because there is no evidence of the top two proficiency
levels being populated by large percentages of students (in fact the top level
contains just two per cent of students). Nor is it apparently associated with
overall frequency of use of computers: a greater percentage of Year 10 students
are frequent (almost every day or more frequently) users of computers than
Year 6 students at home (82 per cent compared to 60 per cent) and at school (51
per cent compared to 27 per cent). Similar differences in frequency of use of ICT
were evident at each year level over the three cycles of NAP – ICT Literacy. It is
possible that Year 6 students are being taught about how to make use of a range
of applications of ICT but that Year 10 students are making use of applications in
familiar ways. To understand the difference in changes over time would require
more detailed information about what is taught in school and how it is taught.
To What Extent are Digital Divides Evident?The term “digital divide” has emerged as a term encapsulating inequalities
between groups in access to, use of, or knowledge of ICT (Norris, 2001).
The results from NAP – ICT Literacy 2011 indicate that student backgrounds
are related to ICT literacy to a similar extent in Year 6 and Year 10. Parental
occupation and parental education contribute to sizeable differences in ICT
literacy. For example, in Year 6, 50 per cent of students whose parents were
from the “unskilled manual, office and sales occupational” groups attained the
Proficient Standard compared to 79 per cent of students whose parents were
from the “senior managers and professionals” occupational group. In Year 10
102
the corresponding figures are 57 per cent and 79 per cent. These differences
are similar to the differences reported in NAP – ICT Literacy in 2005 and 2008.
Similar differences are also evident in relation to parental education. Thus
there is evidence of a divide linked to parental occupation and education in
the extent to which students are being prepared with skills for a digital future.
There was also a substantial divide between the ICT literacy of Indigenous and
non-Indigenous students. In Year 6, 31 per cent of Indigenous students attained
the Proficient Standard compared to 64 per cent of non-Indigenous students.
At Year 10, the corresponding percentages were 36 and 66 per cent. In other
words, approximately half the percentage of Indigenous students attained the
Proficient Standard in ICT Literacy compared to non-Indigenous students. This
must have ramifications for differences in access to opportunities in education
and work.
There was also evidence of differences in ICT literacy among geographic
locations. On average, metropolitan students recorded higher ICT literacy
scores than students in provincial areas who, in turn, recorded higher average
scores than those in remote areas. The differences in the percentages in each
geographic location are very similar to those reported from the 2005 and 2008
surveys. A higher percentage of females than males attained the Proficient
Standard in ICT literacy at both Year 6 and Year 10 but the difference was small.
There were no differences at all between students for whom a language other
than English was mainly spoken at home and other students.
Differences in ICT Literacy among JurisdictionsAt Year 6, there were differences among jurisdictions in ICT literacy. Mean
scores in the ACT, Victoria and New South Wales were higher than those for
Western Australia, Queensland, Tasmania and the Northern Territory. In Year
10 the range in mean scores for ICT literacy was smaller than in Year 6. ICT
Literacy scores were higher, on average, in the ACT, Victoria, New South Wales
than in Tasmania and the Northern Territory. The patterns in the jurisdictional
mean ICT literacy scores reflect differences in social and demographic
characteristics of jurisdictions and may also be influenced by approaches to
the ways in which ICT literacy is taught. Concerning the former it can be seen
that the correlations with mean ICSEA scores are high (0.88 at Year 6 and 0.92
at Year10). However, even within these strong associations (that are consistent
with the results of the individual level analyses contained in this report) it is
evident that the slope of the relationship is greater at Year 6 than at Year 10 and
that there are some departures from the linear relationship. It remains open
for further investigation to ascertain the extent to which approaches to ICT
literacy in schools (that may be dependent on resources) may be associated
with observed jurisdictional level correlations.
103
Computer Use at Home and at SchoolStudents in Year 6 and Year 10 used computers more frequently at home
than at school. One indicator of this is the percentage of students who use
computers frequently (almost every day or more frequently). Sixty per cent
of Year 6 students were frequent computer users at home compared with 27
per cent at school. Among Year 10 students the corresponding figures were 82
per cent and 51 per cent. Study utilities (especially preparing documents and
search the internet for information) were frequently used by students at both
school and home (almost equally) and in both Year 6 and Year 10 (although
more frequently in Year 10 than Year 6). Communication applications (emailing
or chatting) were also frequently used by students but much more at home
than at school and more by Year 10 than Year 6 students. Entertainment
applications (obtaining and listening to music) were also frequently used at
home but rarely at school.
Increased Computer UseOver the six years from 2005 to 2011 computer use by students had increased.
The percentage of students using computers frequently (almost every day
or greater) at home increased from 43 to 60 per cent among Year 6 students
and from 58 to 83 per cent among Year 10 students. The percentages using
computers frequently at school increased from 14 per cent to 28 per cent among
Year 6 students and from 18 per cent to 51 per cent among Year 10 students.
Correspondingly the percentage of students who had been using computer
technology for more than five years has grown over the three cycles of the NAP
– ICT Literacy. It is clear that computer use has grown over six years but it is
not as clear about the benefits that accrue to students from this increased use.
Student Perceptions about Using ICTStudents indicated a high level of interest and enjoyment in using computers,
with males recording higher levels of interest than females and Year 6 students
expressing greater interest than Year 10 students. There was no association
between interest and parental occupation or education. Year 6 and Year 10
students expressed confidence that they could easily download music from
the internet, upload files to a website and create a multimedia presentation
(with sound, pictures, video). They were less confident about their ability
to construct a web page or create a database. There were no significant
differences between males and females in terms of confidence with ICT, but
there were significant differences between Year 6 and Year 10: Year 10 students
expressed greater confidence in using ICT than Year 6 students. Interest in
using computers was moderately strongly correlated with confidence in using
ICT and both were associated with ICT literacy.
104
SummaryTwo of the challenges that concern the growing use of ICT in education, work
and society are the capability of young Australians to use ICT and ensuring
that all young Australians are able to benefit from ICT on an equitable basis.
The results from NAP – ICT literacy 2011 indicate that from 2005 to 2011 there
was an improvement in the ICT literacy of Year 6 students but no change in the
ICT literacy of Year 10 students. There are also substantial differences in the
ICT literacy of Year 6 and Year 10 students suggesting that considerable growth
in ICT proficiency takes place over four years from Year 6 to Year 10, although
questions remain about why the type of learning growth shown at Year 6
between 2005 and 2011 has not been mirrored at Year 10 level. If ICT literacy is
to continue to improve then the form of assessment will be a powerful driver
of that improvement as well as a means to evaluate the extent to which ICT
literacy is improving.
The results from NAP – ICT Literacy 2011 also indicate considerable variation
among students within each year level in ICT literacy. Many students use ICT in
a relatively limited way and this is reflected in their overall level of ICT literacy.
There are differences associated with socioeconomic background, Indigenous
status and remote geographic locations that deserve attention. For both Year 6
and Year 10 there has been an increase in the frequency with which computers
are used at home and at school, and their experience of using computers, but
only among Year 6 students has that greater familiarity been accompanied by
improved ICT literacy.
105
References
Ainley, J., Eveleigh, F., Freeman, C., & O’Malley, K. (2010). ICT in the Teaching of Science and Mathematics in Year 8 in Australia: report from the IEA Second International Technology in Education Study (SITES) survey. ACER Research Monograph 64. Camberwell, Vic: ACER.
Australian Bureau of Statistics (ABS) (2011). Household Use of Information Technology, Australia, 2010–11 (Catalogue No. 8146.0). Canberra: Author.
Australian Curriculum and Reporting Authority (ACARA) (2011). Measurement Framework for Schooling in Australia 2010. Sydney: Author. Available: http://www.acara.edu.au/reporting/measurement_framework_for_schooling.html
Australian Curriculum and Reporting Authority (ACARA) (2012). The Australian Curriculum: Information and Communication Technology (ICT) capability. Sydney: Author. Available: http://www.australiancurriculum.edu.au/GeneralCapabilities/Information-and-Communication-Technology-capability/
Australian Education Systems Officials Committee (AESOC) (2006). Statements of Learning for Information and Communication Technologies (ICT). Carlton: Curriculum Corporation.
Bakia, M., Murphy, R., Anderson, K., & Trinidad, G. (2011). International Experiences with Technology in Education: Final Report. Washington, DC: US Department of Education.
Bandura, A. (1993). Perceived self-efficacy in cognitive development and functioning. Educational Psychologist, 28(2), 117−148.
Binkley, M., Erstad, E., Herman, J., Raizen, S., Ripley, M., Miller-Ricci, M., & Rumble, M. (2012). Defining 21st century skills. In P. Griffin, B. McGaw, and E. Care (Eds.), Assessment and Teaching of 21st Century Skills. Dordrecht: Springer.
Catts, R. and J. Lau (2008). Towards Information Literacy Indicators. Paris, UNESCO.
Cohen, J. (1969). Statistical Power Analysis for the Behavioral Sciences. New York: Academic Press.
Erstad, O. (2006). A new direction? Digital literacy, student participation and curriculum reform in Norway. Education and Information Technologies, 11(3-4), 415–429.
Erstad, O. (2010). Conceptions of technology literacy and fluency. In P. Peterson, E. Baker, and B. McGaw (Eds.) International Encyclopedia of Education (3rd Edition) Oxford Elsevier.
European Commission (2006). Key Competences for Lifelong Learning. Official Journal of the European Union. Brussels, Author
Griffin, P., McGaw, B, & Care, E. (2012). Assessment and Teaching of 21st Century Skills. Dordrecht: Springer.
106
International ICT Literacy Panel (Educational Testing Service) (2002). Digital Transformation: A Framework for ICT Literacy. Princeton, NJ: Educational Testing Service.
Kaplan, D. (2009). Structural Equation Modelling: Foundations and Extensions, 2nd edition. Thousand Oaks, CA: Sage.
Lajoie, F., & Azevedo, R. (2006). Teaching and learning in technology rich environments. In P. Alexander and P. Winne (Eds.), Handbook of Educational Psychology (2nd Ed.), pp. 803–821. Mahwah, NJ: Erlbaum.
Markauskaite, L. (2006). Towards an integrated analytic framework of information and communications technology literacy: From intended to implemented and achieved dimensions. Information Research, 11, 1–20.
Mayrath, M., Clarke-Midura, J., Robinson, D., & Schraw, G. (Eds.) (2012). Technology-Based Assessments for 21st Century Skills: Theoretical and Practical Implications from Modern Research. Information Age Publishing. Charlotte, NC: Information Age Publishing.
Ministerial Council on Education, Employment, Training and Youth Affairs (MCEETYA) (1999). National Goals for Schooling in the Twenty First Century. Curriculum Corporation: Melbourne.
Ministerial Council on Education, Employment, Training and Youth Affairs (MCEETYA) (2005). National Assessment Program Information and Communication Technology Literacy Years 6 and 10: An Assessment Domain for ICT Literacy. Carlton: Curriculum Corporation.
Ministerial Council on Education, Employment, Training and Youth Affairs (MCEETYA) (2007). National Assessment Program – ICT Literacy Years 6 & 10 2005 Report, Carlton: Curriculum Corporation.
Ministerial Council on Education, Employment, Training and Youth Affairs (MCEETYA) (2008). Melbourne Declaration on Educational Goals for Young Australians. Carlton: Curriculum Corporation.
Ministerial Council on Education, Employment, Training and Youth Affairs (MCEETYA) (2009). MCEETYA Four Year Plan, 2009–2012. Melbourne: MCEETYA.
Ministerial Council on Education, Employment, Training and Youth Affairs (MCEETYA) (2010). National Assessment Program – ICT Literacy Years 6 & 10 2008 Report, Carlton: Curriculum Corporation.
Mullis, I., Martin, M., & Foy, P. (2008). TIMSS 2007 International Mathematics Report: Findings from IEA’s Trends in International Mathematics and Science Study at the Fourth and Eighth Grades. Amsterdam: IEA.
Murphy, M. & Schulz, W. (2006). Sampling for National Surveys in Education. Carlton: Curriculum Corporation.
Muthén, B., & Muthén, L. (2010). MPLus: Statistical Analysis with Latent Variables. Muthén and Muthén: Los Angeles.
Norris, P. (2001). Digital divide: Civic engagement, information poverty and the Internet world-wide. Cambridge, MA: Cambridge Univ. Press.
Organisation for Economic Cooperation and Development (OECD) (2010). PISA 2009 Results: Students On-Line Digital Technologies and Performance. Paris: OECD.

107
United States Department of Education Office of Educational Technology (2010). Transforming American Education Powered by Technology: National Education Technology Plan 2010. Washington, DC: Author.
von Davier, M., & Mazzeo, J. (2009). Review of PISA Test Design: Recommendations for Fostering Stability in Assessment Results. Paper presented at the PISA Research Conference, Kiel, Germany.
©AustralianCurriculum,AssessmentandReportingAuthority2012
Thisworkiscopyright.Youmaydownload,display,printandreproducethismaterialinunalteredformonly(retainingthisnotice)foryourpersonal,non-commercialuseorusewithinyourorganisation.
Allotherrightsarereserved.Requestsandinquiriesconcerningreproductionandrightsshouldbeaddressedto:
ACARACopyrightAdministration,ACARALevel10,255PittStreetSydney,NSW2000
Email:[email protected]
ACER Staff John AinleyfromACERwastheprojectdirectoroftheprojectthatresultedinthisreport.ChrisFreemanwastheprojectmanagerandJulianFraillonwastheassessmentmanager.ThispublicreportwaswrittenbyJohnAinley,JulianFraillon,EvelineGebhardtandWolframSchulz.TheassessmentdevelopmentteamwasledbyJulianFraillonandDanielDuckworth.ThesamplingandanalysisteamcomprisedEvelineGebhardt,WolframSchulzandMartinMurphy.TheinformationtechnologyteamfromACERcomprisedDarylNguyen,JafaruddinLie,ScottHainesandPhooiLaiChan.TheinformationtechnologyconsultantsfromSoNETSystemswereMikeJanicandStephenBirchall.ChrisFreeman,KateO’MalleyandWarrenHerbsmanagedthesurveyoperations.


