Embed Size (px)
Citation preview
Qual Quant (2013) 47:1287–1314DOI 10.1007/s11135-011-9591-1
National minorities and their representation in socialsurveys: which practices make a difference?
Francesco Laganà · Guy Elcheroth · Sandra Penic ·Brian Kleiner · Nicole Fasel
Published online: 29 September 2011© Springer Science+Business Media B.V. 2011
Abstract This paper presents a systematic study of survey mechanisms that produce orreduce minority bias in social surveys. It extends the work of Lipps et al. (2011) who havedemonstrated that, in the Swiss context, the more an ethno-national minority communitydiffers, socio-culturally and socio-economically, from the national majority, the less it islikely to be represented in its proper proportion in the major national surveys. Minority biasfurthermore has a vertical dimension: socio-economic bias against individuals from the mostdeprived backgrounds becomes extreme within ethno-national minority communities. Usingdata from the Swiss Labour Force Survey, the Swiss Household Panel, and the Swiss sam-ple of the European Social Survey, in the present work we empirically assess the impact ofthree types of survey practices on minority bias: (1) strategies to increase overall responserates of the whole population indiscriminately from its minority status, (2) the use of pre-and post-stratification measures that take into account the overall share of foreigners in thenational population, and (3) the conduct of interviews in a wider range of languages, in orderto facilitate survey response among certain (linguistic) minorities. Our findings show that
F. Laganà (B) · G. Elcheroth · S. PenicLife Course and Inequalities Research Center (LINES), Institute of Social Sciences,University of Lausanne, Bâtiment Vidy, 1015 Lausanne, Switzerlande-mail: [email protected]
G. Elcherothe-mail: [email protected]
S. Penice-mail: [email protected]
F. Laganà · B. KleinerFORS – Swiss Centre of Expertise in the Social Sciences,Bâtiment Vidy, 1015 Lausanne, Switzerland
B. Kleinere-mail: [email protected]
N. FaselDepartment of Social Psychology, University of Lausanne, Bâtiment Vidy, 1015 Lausanne, Switzerlande-mail: [email protected]
123
1288 F. Laganà et al.
efforts to increase overall response rates can, paradoxically, create even more minority bias.On the other hand, they suggest that a combination of stratified sampling and a wider rangeof survey languages can have a positive effect in reducing survey bias, both between andwithin national categories. We conclude that measures that take into account and adapt tothe social and cultural heterogeneity of surveyed populations do make a difference, whereasadditional efforts that only replicate existing routine practices can be counter-productive.
Keywords Survey Methodology · Sampling bias · Ethno-national minorities · Responserates · Survey languages · Stratified sampling
AbbreviationsSLFS Swiss Labour Force SurveySHP Swiss Household PanelESS European Social Survey
1 Introduction and overview
During the last decades, processes of globalisation have led to an increase in both the mag-nitude and diversity of migration flows toward Western countries (see Castles and Miller1993; Koser and Lutz 1998). As a consequence, many Western European societies in partic-ular display growing linguistic, ethnic, and cultural heterogeneity. Nowadays, this tendency isaccompanied throughout an increasing number of host countries by pervasive public discourseabout “new” social problems related to immigration and integration issues. For representativesurvey research, this contemporary background generates two inter-related challenges: onthe one hand, to build an empirical knowledge-base for the study of social dynamics withinculturally diversified contexts (a pivotal concern for social scientists), and on the other hand,to gather data that allow computing of accurate social indicators, with regard to the situa-tion of the entire population (a pivotal concern for official statistics). A correct representa-tion of ethno-national minorities in social surveys is a fundamental condition to meet bothtypes of challenges. However, the literature shows that ethnic minorities may not be accu-rately represented. There are, systematically, higher non-response rates in cross sectionalsurveys (see Feskens et al. 2007 for the Netherlands; Deding et al. 2008 for Denmark) due tofewer contacts and more refusals (Nielsen and Pedersen 2000; Camarota and Capizzano 2004;Jakobsen 2004; Eisner and Ribeaud 2007), as well as higher attrition rates in longitudinalsurveys (Peracchi and Depalo 2006).
Recently, a multi-disciplinary working group has started to investigate this issue in Swit-zerland as well. This group scrutinises three major surveys that inform official statistics orsocial scientific research: the Swiss Labour Force Survey (SLFS), the Swiss Household PanelSurvey (SHP), and the European Social Survey in Switzerland (ESS). The present work pur-sues the line of research started by Lipps et al. (2011) who have described social factors andcleavages that structure bias across national minorities in Switzerland. More specifically ittries to open the black box of survey processes and practices that can produce, amplify, orredress such biases. Therefore, before we explain the goals and questions that have orientedthe present work, let us first review the key findings that constitute our starting point.
Lipps et al. (2011) have highlighted that, on average, nationwide Swiss surveys are sys-tematically and strongly biased against the fifth of the countries’ population that does nothold Swiss citizenship. At the same time, these analyses demonstrated that, as far as survey
123
National minorities and their representation in social surveys 1289
participation is concerned, there is no such thing as a homogenous population of foreigners inSwitzerland. Nationals from the linguistically, economically, and socially similar neighbour-ing countries are generally well represented in Swiss surveys. But large minority groups,such as nationals from the area of former Yugoslavia or Turkey, are dramatically underrepre-sented. In addition to strong heterogeneity between national categories, there also appears tobe important heterogeneity within these categories: under-representation tends to be the mostpronounced for members of national minorities with lower levels of education. The authorsfurther found a significant interaction between educational attainment and nationality onattrition in longitudinal surveys: the difference in attrition rates between Swiss and nationalminorities is greatest for the least educated. But these analyses also showed that under-repre-sentation of national minorities cannot be reduced to the sole issue of education or social class.
In fact the authors found that, overall, social class—identified by individuals’ occupa-tions—only very partially mediates the large differences in non-response or attrition betweenSwiss citizens and members from certain national minority groups. Hence, we need to look forother explanatory factors that may account for the specific exclusion from national surveys ofsocially disadvantaged members of communities from former Yugoslavian, Turkish, or, moregenerally, non-western European origin. This is what the present work aims to contribute: asystematic analysis of survey practices that produce or reduce bias against minority communi-ties as a whole, and against the most vulnerable layers within these communities, in particular.
Switzerland represents an interesting site, within the larger Western European context, tostudy survey practices in a culturally diversified society. In fact, the tendency toward diver-sification, stratification, and polarisation of the migration process (Castles and Miller 1993)is particularly pronounced here. For historical and socio-economic reasons, Switzerland hasbeen characterized by two kinds of migrations: on the one hand, a highly skilled migrationfrom northern Europe and, on the other hand, unskilled migrations from Italy in the 50s,Spain in the 60s, and Portugal and Ex-Yugoslavia in the 80s and early 90s (Piguet 2004).In addition, the new legislative frame on Swiss immigration policies further accentuates theheterogeneity of inward migration flows (Gross 2006).
1.1 Research goals: why do we need to know more about survey practices that affectminority bias?
Let us now stress the main reasons why the findings of Lipps et al. (2011) should not leave usindifferent, but rather should urge us to have a closer look on the mechanisms that lead to theunder-representation of certain national minorities. First of all, there are direct consequencesfor the interpretation of official national statistics. Many social indicators are meant to reflectthe situation of vulnerable populations in a country, either directly—such as poverty rates andvarious social exclusion indices—or indirectly, such as inequality and development indices,which are sensitive to the number of cases at the bottom of a given distribution of prosperity orwell-being. Rather obviously, there is a problem when these indicators are based on surveydata that exclude large segments of the socially disadvantaged population of non-westernEuropean origin—i.e., a numerically important part of the residential population, which isparticularly at risk.
There are only two options for social statisticians to handle such a situation, and bothare less than optimal. One is to ignore the biased composition of the sample and to makestraightforward inferences from the distribution of survey responses to the reality of the pop-ulation. This will inevitably result in too conservative estimates of poverty or inequalities,and in statistics that embellish social reality rather than reflect it. The other option is to
123
1290 F. Laganà et al.
carry out some kind of posterior adjustment of the data and give more weight to the surveyresponses from participants that belong to an under-represented social category than to thosethat belong to a well- or even over-represented category. As a means to redress the bias ofinterest here, such procedures thus attempt to use information available on a participatingminority within the minority, in order to correct for the absence of the many who did not par-ticipate. This implies at least two critical assumptions: (a) that the categories used to weightthe data are defined appropriately to catch the relevant cleavages along which inclusion inversus exclusion from the survey process actually operates, and (b) that within each categoryparticipating members are equivalent to non-participating members (at least with regard torelevant variables). If we want these procedures (at least for any descriptive purposes) ofdata adjustment to become a scientific practice, then we need scientific knowledge about thecircumstances under which the two assumptions apply.
Once we have arrived at this point, we have already encircled the second reason to studythe mechanisms that lead to minority bias: acknowledging the phenomenon not only high-lights the necessity to handle its consequences, but also creates the opportunity to learn moreabout the dynamics of sampling and surveying in general.
National minorities’ under-representation in social surveys can be conceived of as theconsequence of a “failure” in one of the steps in the process of gaining respondent sur-vey selection and participation. Interestingly then, by revealing what surveys are unable toachieve, minority bias can teach us something about the way they work. For example, effec-tive survey processes are likely to rely on a series of implicit assumptions about seeminglytrivial things like residential arrangements and daily routines, meaningful interactions andlegitimate requests, relevant incentives and appropriate behaviour. Cumulative experiencesof survey researchers and interviewers might have well calibrated these assumptions, and thepractices they inform, for the majority of the population. But nevertheless—or even preciselyfor this reason—the same set of assumptions can be rather disconnected from the social real-ity experienced by various minority groups within the same population. As we will furtherdevelop in the remainder of this paper, this conceptual perspective will actually help us todraw a line between “remedies” that are likely to make a difference with respect to minoritybias and those that will not.
1.2 Research questions
Bearing these goals in mind, we designed the present research to clarify how minority biasrelates to three different types of survey practices: (a) efforts to enhance overall responserates, (b) pre- and post-survey stratification and, (c) the increase of linguistic plurality. Foreach of these relationships, we sought to address a pair of operational research questions.
Although overall high response rates are generally thought of as a necessary condition forrepresentative samples, the issue of how response rates precisely relate to survey bias is stillcontroversial. In a state of the art synthesis, Groves (2006) found meta-analytical evidence fora moderate positive correlation only (of 0.33), between nonresponse rates and nonresponsebias across 30 different methodological studies and 235 different variables. Important for ourown research perspective, the author noted that the “vast majority of variation in relative non-response bias lies within surveys, not among them” (p. 659). In other words, if high responserates do go hand in hand with the reduction of some biases, this does not imply that theyconstitute a magic solution for all, or even most, types of biases (given that 100% responserates are never obtained and even rarely approached). In particular, it is at least premature to
123
National minorities and their representation in social surveys 1291
exclude that minority bias could fall into the category of biases that resist (relatively) highresponse rates.
Furthermore, higher response rates are not obtained spontaneously: they require addi-tional efforts and resources. Non-contact rates can be diminished by increasing the numbersof calls or visits, refusal rates by re-contacting non-respondents in order to “convert” theminto respondents. In an insightful experiment, Peytchev et al. (2009) found, however, thata higher number of calls resulted in less survey bias only when associated with changes insurvey protocols. Additional efforts paid off when something else could be proposed to ini-tial non-respondents (a shorter questionnaire, more incentives…). Conversely, keeping thesurvey protocol the same resulted in recruiting the same type of respondents—and hence inreproducing the same biases—even with more efforts and higher overall response rates.
The pessimistic assumption that more of the same practices will not result in different out-comes can thus be opposed to the optimistic assumption that more efforts pay off, even whenit comes to reducing specific biases. In addition, differences between individual interview-ers provide an interesting angle to push further the investigation of the “more-of-the-same”problem. It is common sense among survey researchers that more experienced interviewersshould have developed more skills to recruit respondents and hence produce higher responserates. For example, analysing interviewer effects in the ESS, Lipps and Pollien (2011) foundthat more experienced or more senior interviewers had better performances in terms of overallresponse rates than newcomers. At the same time, when interviewers have been socialisedwithin a given survey environment for a longer period of time, they are more likely to inter-nalise any standard practices, including practices that create minority bias so systematicallyin surveys. Then, again, we can oppose the pessimistic view that more experienced inter-viewers will be the most likely to reproduce more of the same practices and biases, to theoptimistic assumption that experience leads to better skills and performances. Two questionsfor empirical investigation can thus be kept at this stage:
Question 1: Do additional efforts to establish contact or convert reluctant respondents resultin less minority bias?Question 2: Are more experienced interviewers more capable of reducing minority bias?
The next pair of questions addresses the relationship between minority bias and surveystratification, which can intervene both before and after data collection. Post-stratification hasbecome a standard survey practice, which derives both its advantages and weaknesses fromthe fact that it does not influence the fieldwork itself. As a consequence, costs are minimal,and suboptimal solutions will not affect the quality of the data, only of outcome of specificanalyses of these data. On the other hand, there are at least two things that post-stratificationweights can never achieve: they are unable to redress bias against a group of people as longas these people are (almost) completely absent from the dataset and/or as long as the groupis not recognised as such when post-stratification weights are computed. As the aim of thepresent work is to describe routine practices rather than to prescribe ideal practices, we willfocus here on the most commonly used post-stratification weights and assess how (neglect of)minority bias affects the population structure that underlies most prominent survey findingsin Switzerland.
Next, we will have a closer look at, to our knowledge, the only instance of a major regularSwiss survey that stratifies the sample by the main national categories before data collection:the SLFS foreigner sample. Evidently, such ambitious sampling procedures solve the prob-lem of unequal representation across national categories. But what will be their impact onunequal representation within national categories? As Lipps et al. (2011) have shown, themost striking consequence of minority bias is that the minority bias is mostly concentrated
123
1292 F. Laganà et al.
among socially disadvantaged respondents of non-western European countries. Will unequalrepresentation of socio-economically defined subgroups within non-western European com-munities even be exaggerated when high pressure on interviewers to fulfil the target size ofthe national strata, leads them to concentrate their efforts on the “easiest” recruits within eachnationality? Or will the confrontation of interviewers with a critical mass of members of anational community facilitate a learning process, and eventually enable them to communi-cate more efficiently, even with socially disadvantaged members of the same community?To summarise both issues, then:
Question 3: Do institutionalised weighting procedures result in statistical estimates free ofminority bias?Question 4: Does the correction of bias between national categories, by way of stratifiedsampling, also affect bias within national categories (either positively or negatively)?
Finally, we will address the rather straightforward issue of whether it makes a differencewhen surveys are offered in the native languages of respondents. Again, the SLFS has beenholding a distinctive place among regular national surveys, since it progressively increasedthe number of survey languages from three to eight over the last decade. Normally, onewould expect this costly measure to result in better representation of those minority groupsthat were part of recent immigrations from countries without a national language in commonwith the host country, such as Turkish or former Yugoslavian communities in Switzerland.Furthermore, there is an expectation that linguistic barriers are more difficult to surpass forindividuals with less social and educational resources and, hence, that removing these barriersshould also result in less bias within national categories. As we will study these issues bothcross-sectionally and longitudinally, the last pair of questions can be formulated as follows:
Question 5: Do more survey languages help to recruit members from minority groups, inparticular among the socially disadvantaged?Question 6: Do more survey languages help to keep (socially disadvantaged) membersfrom minority groups in the sample for longitudinal studies?
1.3 Research strategy
1.3.1 How did we choose data sources and analytical approaches?
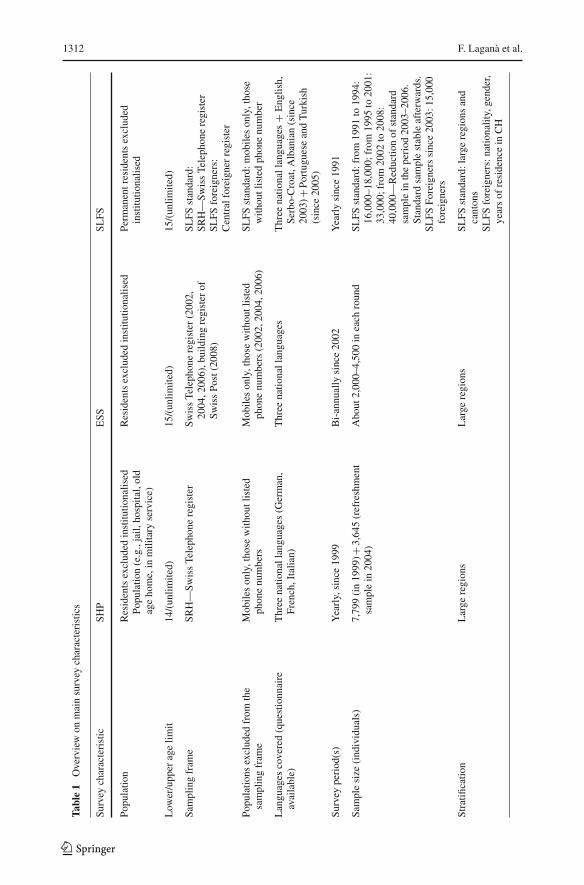
Data from three pre-eminent national surveys served as the empirical basis to our analyses:the SLFS, the SHP and the Swiss part of the ESS. These surveys share the goal of pro-viding data that are representative of the country’s resident population, by way of rigorousprobability sampling. Each of them devotes considerable effort and high-level methodolog-ical monitoring to achieve this goal. They are all part of different prestigious internationalresearch programs and networks, aiming to ensure comparable and high-quality data acrossEurope, and beyond. By focusing on these three leading surveys, our goal was not to blameparticular projects for neglecting the issue of minority bias, but to show that the problem isso pervasive that we can easily find it even when considering survey research at its best.
The other reasons that motivated our choice have more to do with what distinguishes eachof the three surveys than with what they have in common (see Appendix Table 1 for detailedcomparative information on the main characteristics of the three surveys). The SLFS, whichis conducted yearly since 1991 by the Swiss federal statistical office and focuses on incomeand working conditions, and the SHP, launched in 1999 as a joint academic and administrativeinitiative to provide a more comprehensive data source on the dynamics of living conditions,
123
National minorities and their representation in social surveys 1293
are pivotal to the construction of official social statistics both directly (as the SLFS) andindirectly (as the SHP). Both provide post-stratification weights to enhance the accuracy ofpopulation-level inferences based on these datasets. Micro-data users of the SLFS even haveto commit themselves legally to publish only indicators based on weighted data—a strikingillustration of the federal administration’s faith in these weights. For a relevant test of theimpact of the minority bias, not only on survey data, but on survey outcomes that matter,these two surveys are essential, and the cross-sectional weights provided with the survey dataallow us to address Question 3. Furthermore, as mentioned in the previous section, SFLS isunique both because of the stratified foreigner sample introduced in 2003 (relevant for Ques-tion 4), and because of the language experiment started the same year (relevant for Questions5 and 6). A final interesting feature common to the two surveys is their longitudinal design:while SHP is a fully-fledged yearly panel study, SLFS includes a five-year rotating panel. Asa consequence, these datasets allow us to study minority biases not only in cross-sectionalsurvey inclusion/exclusion, but also in survey retention/attrition.
Our choice to further broaden investigations to the ESS was above all motivated by thefact that this survey has incorporated the single most important national initiative to increaseresponse rates. Conducted bi-annually since 2002, this comparative survey on social condi-tions and social attitudes is a good example of an international survey which closely mon-itors national response rates and strongly encourages national research teams to implementmeasures to increase response rates. Setting an ambitious 70% target rate, the internationalguidelines to this survey are in line with a classic assumption of survey research: as non-respondents distort random selection procedures, fewer non-respondents should imply fewerdistortions and hence bring surveys closer to ideal conditions of unbiased probability sam-pling. In Switzerland, after a “bad start” in 2002 (an overall response rate of 34% at the bottomof the international ranking), a series of rather expensive measures were implemented duringthe following waves to bring response rates closer to the target, including virtually endlessattempts to establish contact, specific strategies to convert non-cooperative eligible, and morework carried out by more experienced interviewers. These measures had a clear effect: forthe three subsequent waves, response rates near 50% were observed, which is remarkablyhigh for the Swiss context. This survey therefore provides a privileged opportunity to testempirically whether such (relatively successful) measures to improve response rates actuallylead to less biased samples—and to answer Questions 1 and 2. Additionally, ESS data broughtalong their own specific asset: the availability of particularly well-documented contact andinterviewer data, which allowed for much more detailed analyses of the impact of surveyeffort than what was attainable in the case of the other two surveys.
1.3.2 Indicators of minority bias
While minority bias is the common construct motivating all of our analyses, the concreteoperationalisation of “bias” had to be accommodated flexibly to the opportunities and con-straints inherent to each individual dataset. The foremost overall limitation set to our workstems from the absence (so far) of a nationwide Swiss population registry. As telephone and/orbuilding registers were used as sampling frames in all three surveys, information on nation-ality or class background of non-respondents is systematically lacking. As a consequence,we could assess minority bias only indirectly, through a comparison between the populationstructure according to census data, on the one hand, and survey data, on the other hand.
We estimated the magnitude of cross-sectional bias by dividing the odds of arandomly selected individual in the sample to be part of a specific (sub)category by the oddsof a randomly selected individual in the population to be part of the same (sub)category.
123
1294 F. Laganà et al.
Thus, the measure used is an odds ratio. The advantage of calculating odds as an indicator ofbias—as compared to differences between percentages, for example—is that they are inde-pendent from marginal distributions. To distinguish bias that affects a given ethno-nationalminority community as a whole from the bias affecting a given social subcategory withinthe ethno-national community, we computed two types of indicators: bias between nationalminorities and bias within national minorities.
The bias between national minorities is defined as the ratio between the odds of a selectedindividual to be part of a national minority in the survey and the respective odds in thepopulation. Let therefore be j a national category, s j and n respectively the sample size forthis national category and the overall sample size for the survey. Furthermore, let C j be thepopulation size for national category j and N the overall population size (according to censusdata). The between bias for the national category j is estimated as follows:
Between_Bias j |n =[s j/(n − s j )
]
[C j/(N − C j )
] (1)
Sometimes, the interest lies more in comparing one national category to another, e.g., aparticular national minority to the national majority group. When this was the goal of theanalyses, we used Eq. 2 to compute an indicator of relative bias, where the sample size s j
and population size C j of a national category j (e.g., nationals from the former Yugoslavia)is compared to the sample size sk and population size Ck of a reference category k (e.g.,Swiss nationals). Please note that this indicator includes an estimate of the gross samplesize (ngross), which can be computed when sufficiently detailed contact data are availableto determine the total number of eligible units in the initial sampling frame (that can bea list of addresses). In Eq. 2,
C jN stands for the population share of the national minority
andC jN ngross provides an estimate of the number of members of the national category
j that would be in an unbiased gross sample. The resulting indicator of relative bias thusexpresses the ratio between the odds of a member of the national reference category k to beincluded in the net sample, and the corresponding odds of a member of the national minoritycategory j :
Relative_Biask| j =sk/
(CkN ngross − sk
)
s j/(
C jN ngross − s j
) (2)
The bias within a given national minority is defined as the ratio between the odds of a ran-domly selected individual to be part of the social subcategory i of the ethno-national minoritycommunity j in the sample, and the corresponding odds in the population. Therefore, let j bea national category (e.g. former-Yugoslavs) and i a specific category of the interest variable(e.g. respondents with elementary education), si j the number of sample cases that fall into theresulting subcategory (e.g. number of former-Yugoslav with low levels of education) and Ci j
the corresponding number of cases in the population. Let n. j and N. j further be the overallsample size respectively in the survey and the population value registered in census for thenational minority j . The within bias is estimated as follows:
Within_Biasi j | j =[si j/
(n. j − si j
)]
[Ci j/(N. j − Ci j )
] (3)
To have an estimation of the overall bias against a socially and ethno-nationally definedsub-category, we need to combine within-bias toward the subcategory within an ethno-national
123
National minorities and their representation in social surveys 1295
community and between-bias affecting this community as a whole. The indicator of overallbias is therefore given by the product of the two types of bias mentioned in the formulasabove.
Biasi j |n =[si j/
(n. j − si j
)]
[Ci j/(N. j − Ci j )
] ×[s j/(n − s j )
]
[C j/(N − C j )
] (4)
Using the general formula presented in Eq. 4 it is possible to estimate all three types ofbias: (a) bias between national categories—when we fix within bias to 1, (b) bias within agiven national minority—that we obtain by fixing between bias to 1, and (c) the interactionbetween the two kinds of biases, that gives us an estimation of the overall bias with respectto the total population.
The obtained value is then a product between odds ratio. Since the odds ratio can varybetween 0 and +∞ and is equal to 1 when the two odds (in the census and in the survey) areequal, we will have an asymmetric distribution for under- and over-representation. For thisreason, we also rescaled odds ratio to a logarithmic distribution. The overall bias formulapresented in Eq. 4 can be redefined as follows:
ln(Biasi j ) = ln
( [si j/
(n − si j
)]
[Ci j/(N − Ci j )
]
)
+ ln
( [s j/(n − s j )
]
[C j/(N − C j )
]
)
(5)
As explained before the two terms of the equation identify respectively the within and thebetween bias. We can derive from this formula that a value of 0 in the two terms indicatesthat the sample share of the educational subcategory equals its population share (i.e., there isno bias), whereas values below 0 indicates that the subcategory is under-represented in thesample, and values above 0 that it is over-represented.1
The limitation that we found in modelling the bias did not apply for the study of bias inattrition processes in SHP and SLFS, which made the longitudinal approach an even morevaluable complement to our work because it allows for fine-grained analyses of the indi-vidual correlates of survey participation. In this case, the method that we used to analyseunder-representation is the binomial logistic regression.
1.3.3 Variables used in the analyses
The use of different surveys and the need of harmonization to make them comparable withthe census data obliged us to be flexible in the recoding and definition of variables. In thepresent section we focus on the main variables and recoding used throughout all the analyses(cross-sectional and longitudinal).
The classification used to distinguish between different types of national minorities con-siders criteria of geographical, linguistic and cultural proximity with the Swiss group (relevantfor the Italian, French and German minority), the historical importance in the process of immi-gration to Switzerland (Spanish, Portuguese, Turkish, Former-Yugoslavs and Albanian), andgeographical distance for the groups constituting the residual component of immigration,coming from the rest of Europe, Americas, Africa and Asia, or Oceania. Dependently ondata characteristics and surveys sample sizes, these groups have been aggregated into largercategories in order to allow for more robust analyses. However in all the analyses we kept the
1 Equations 4 and 5 differ only in the scale on which the bias is estimated. This difference becomes morerelevant when confidence intervals are generated to identify the degree of uncertainty of our bias estimates.Computing the confidence intervals in the logarithmic scale allows us to have symmetric estimates of biasprecision, which is not possible when confidence intervals are estimated in the natural scale.
123
1296 F. Laganà et al.
Former-Yugoslavs and Albanian—who represent the main national minority in Switzerland,in terms of language and social vulnerability—as a separate category.
Education has been recoded into three levels (No education/Secondary I, Secondary II,Tertiary). Individuals who are still in training were classified in a fourth, residual category(whose results, being marginal for our analyses, are not presented here).
As in Lipps et al. (2011), the effect of social class, used as a control variable in the analysisof language plurality and attrition, is measured by the International Standard Classificationof occupations. We recoded the first three one-digit categories of ISCO classification into themain category “Higher non manual”, the categories 4 and 5 into “Lower non manual” andfinally the categories 6, 7, 8, and 9 into the category of “Manual occupations. Additionally,in order to include in the analyses also those who are not employed, we gathered in onecategory (not in labor force) the non-active and the unemployed.
2 Procedures and findings
2.1 Minority bias and strategies to enhance responses rates in the European Social Surveyin Switzerland
To address Question 1, we analysed contact data from four waves of the ESS in Switzerland,conducted between 2002 and 2008. The key variable of these analyses, national affiliation,could easily be established for respondents, by matching contact and response data. The cor-responding survey items first distinguish between Swiss citizens and foreigners. Among thelatter, one national affiliation was recorded (which implies that bi-national respondents hadto choose which nationality to report), and allowed us to categorise foreigners into three cate-gories: nationals from neighbouring countries (France, Germany, Austria, Liechtenstein andItaly), nationals from one of the countries of the former Yugoslavia or Albania, and a residualcategory including nationals from all other countries. In order to allow for sufficiently largesample sizes for minority groups, contact data were aggregated across the four waves of theSwiss ESS, resulting in a total number of 18.008 estimated eligible and 7.767 respondents,of whom 959 belonged to a national minority (i.e., did not have Swiss citizenship at the timeof the survey).
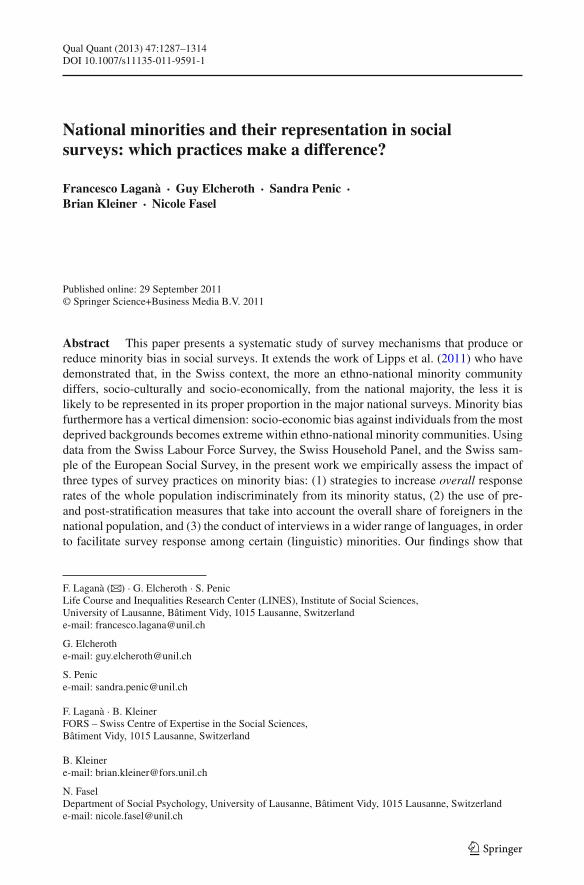
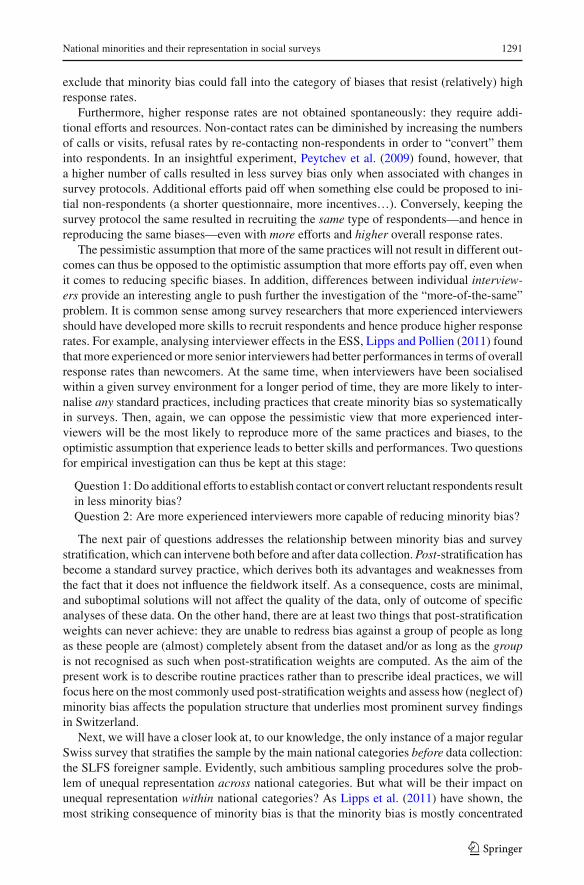
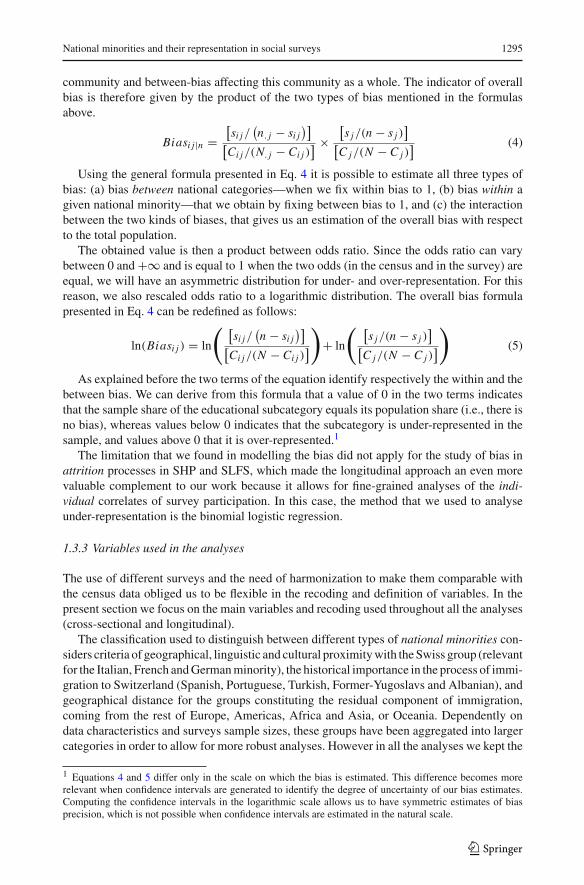
ESS contact data include detailed information on the outcomes of each single attempt toestablish contact with a target respondent. As shown in Fig. 1, these data allow simulatingresponse rates for different categories of target respondents, as a function of the number ofattempts to establish contact. These findings clearly illustrate the importance of numerousvisits or phone calls in order to achieve optimal response rates. For example, if the instruc-tion had been to stop efforts to establish contact or cooperation after three attempts, overall,response rates would only have been about half as high as they have been in effect under thedemanding ESS fieldwork conditions. It is not exceptional that a respondent could still beincluded in the sample even after ten or more unsuccessful attempts had already been madebefore at the same address. But the same findings also suggest that the payoff of these effortsvaries across different national categories. While response rates for Swiss citizens steadilyraise and only reach their limit—close to 50%, around the twentieth attempt to establish con-tact—response rates hit a ceiling earlier and dramatically lower—at only 15 %—for nationalsfrom the former Yugoslavia or Albania.
Overall, it looks as if the “closer” (which can be read here as geographic, linguistic, oreconomic closeness) a national category comes to the national majority, the higher its selec-tion probability in the sample and the more likely it is to benefit from supplementary efforts
123
National minorities and their representation in social surveys 1297
Fig. 1 Estimated cumulative response rates for four waves of ESS in Switzerland (2002–2008), by numberof attempts to establish contact or cooperation, and citizenship of target respondents
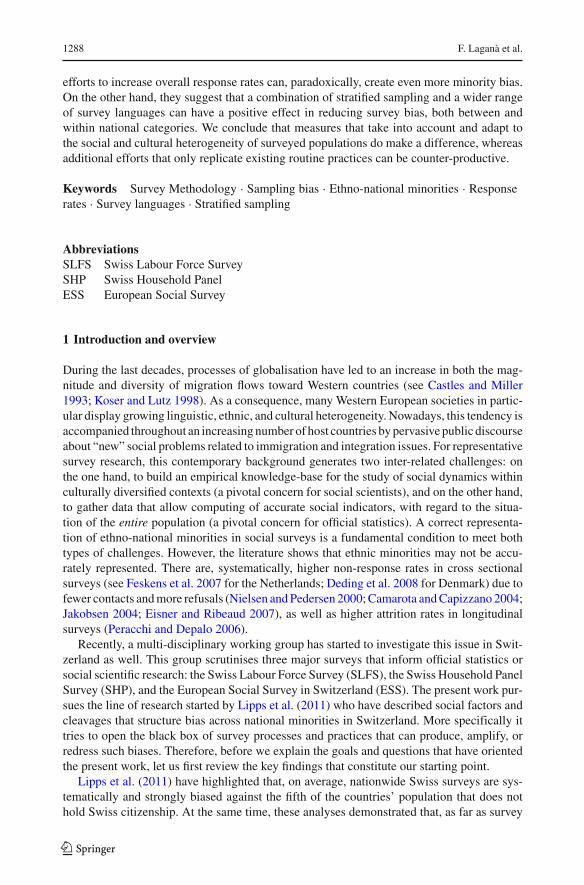
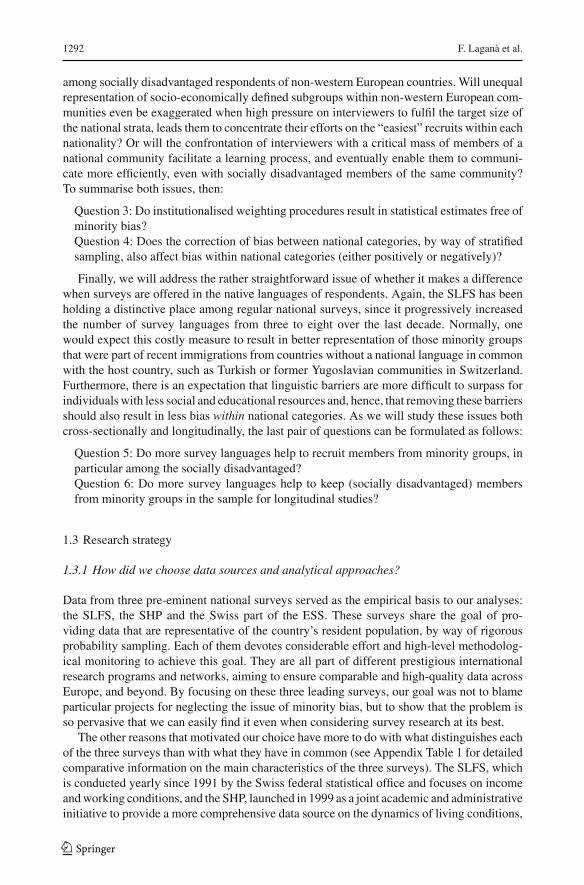
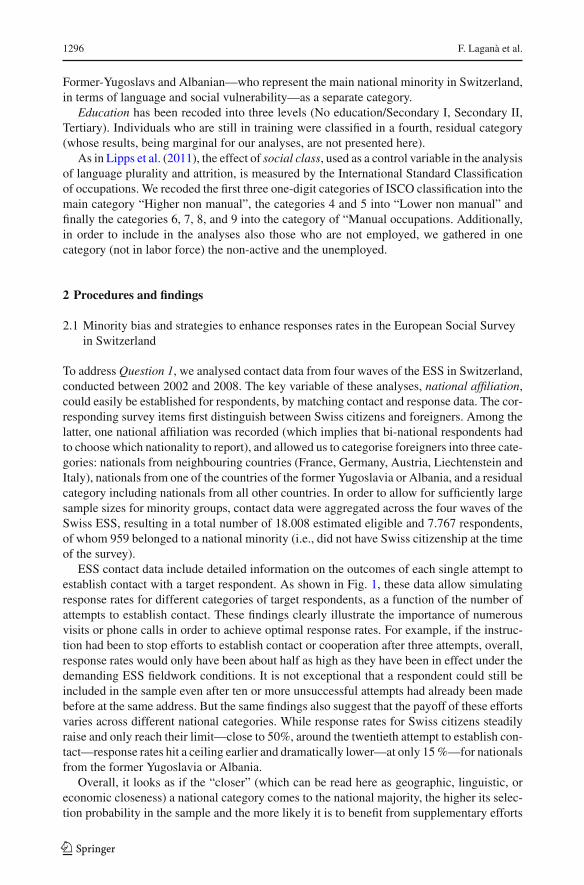
Fig. 2 Estimated relative sampling bias for four waves of ESS in Switzerland (2002–2008), by number ofattempts to establish contact and citizenship of target respondents
to establish contact or cooperation. This impression is further corroborated by Fig. 2, whichrepresents the same information under the form of (cumulative) relative bias: the odds of aSwiss citizen to be included in the sample after a given number of efforts, divided by thecorresponding odds for three different categories of foreigners (following Eq. 2). Only in onecase does the bias diminishes with increasing efforts: between the second and the fifth attempt
123
1298 F. Laganà et al.
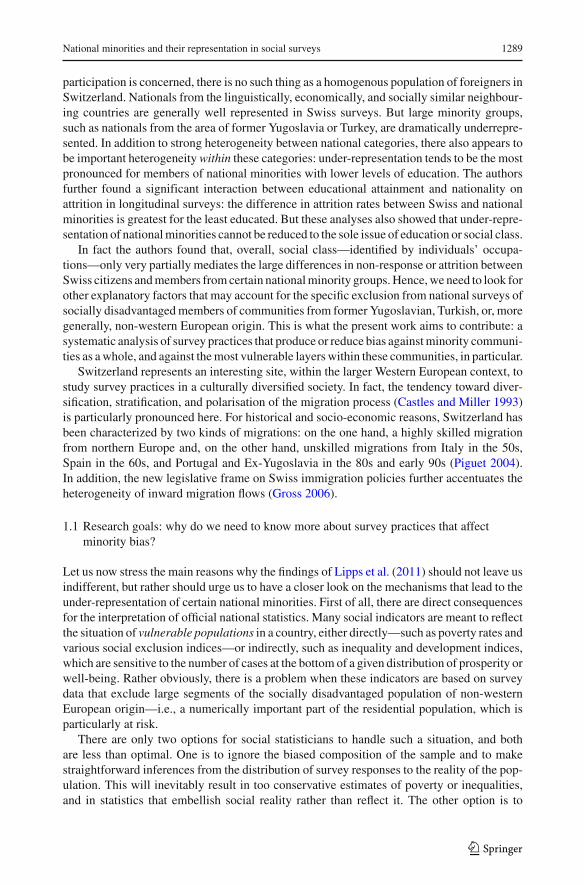
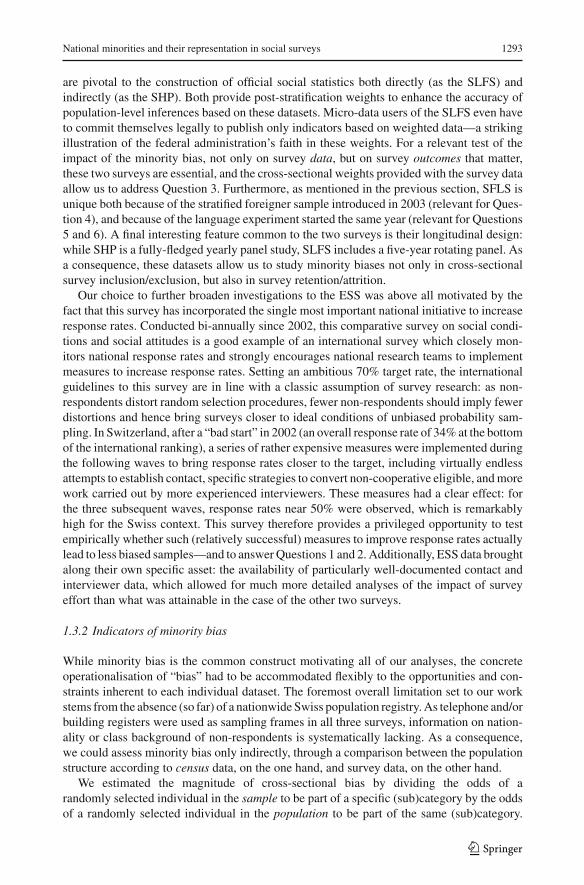
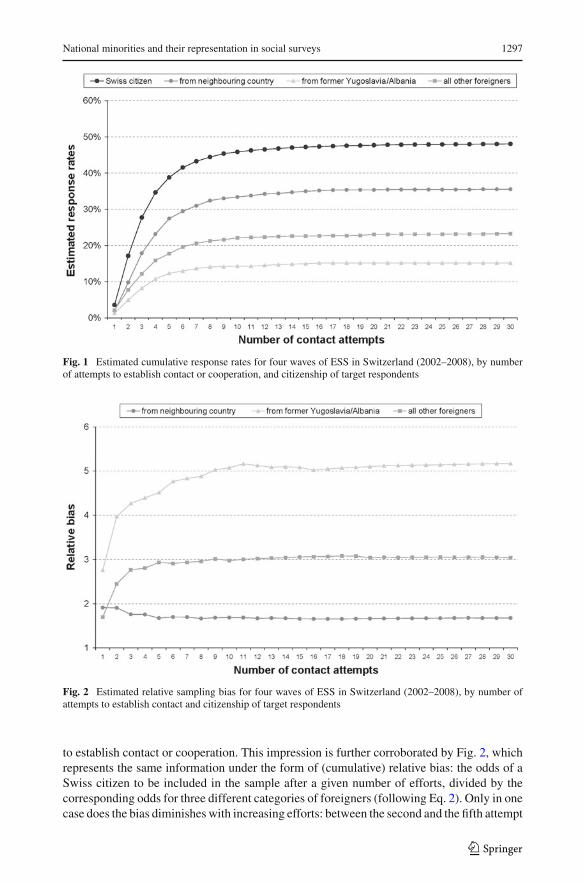
Fig. 3 Estimated relative sampling bias for four waves of ESS in Switzerland (2002–2008), respondentscooperating at first request and converted respondents, by citizenship
to establish contact, the odds of nationals from neighbouring countries come slightly closerto those of Swiss citizens. At the opposite end, unfavourable odds ratios for nationals fromthe former Yusgoslavia/Albania steadily increase and reach a peak after 11 attempts. Undersuch high effort conditions, ironically, bias against this minority group becomes extreme andtheir odds to be included in the sample are five times lower than the odds of Swiss citizens.
More specifically, it appears that an increase in contact attempts from 5 to 10 (whichroughly corresponds to the difference between standard and demanding fieldwork), bene-fits more or less equally to all other categories, but substantially less to this particularlyunderrepresented minority group.
Further analyses focussed on the specific effects of attempts to convert eligible individualswho did not want to cooperate at a first request. Figure 3 compares estimated sampling bias forthe three categories of foreigners, between respondents who cooperated at first request—thelevel of bias that would have been obtained if no conversion strategy had been implemented—and converted respondents, who cooperated at a second, third, fourth, or even fifth requestonly. In order to control for the fact that bias among initial respondents results in a dispropor-tionately high number of foreigners being left in the frame from which individuals are drawnfor a second request, numbers of previous recruits within each category were subtractedfrom the corresponding numbers of estimated eligible before calculating these odds ratios.Outcomes show only very subtle differences for bias against nationals from neighbouringcountries—which is slightly lower among converted than among immediate respondents—oragainst nationals from the former Yugoslavia/Albania, which is even slightly higher amongconverts. The only substantial difference can be observed among the more heterogeneousgroup of nationals from the remaining countries: while the bias among these foreigners isless than 3 in standard conditions, their odds to be ‘converted’ are 4 times lower than those ofSwiss citizens. All-in-all, these findings highlight that conversion strategies increase the gapbetween nationals from Switzerland or one of its neighbouring countries, on the one hand,and nationals from more remote countries, on the other hand.
123
National minorities and their representation in social surveys 1299
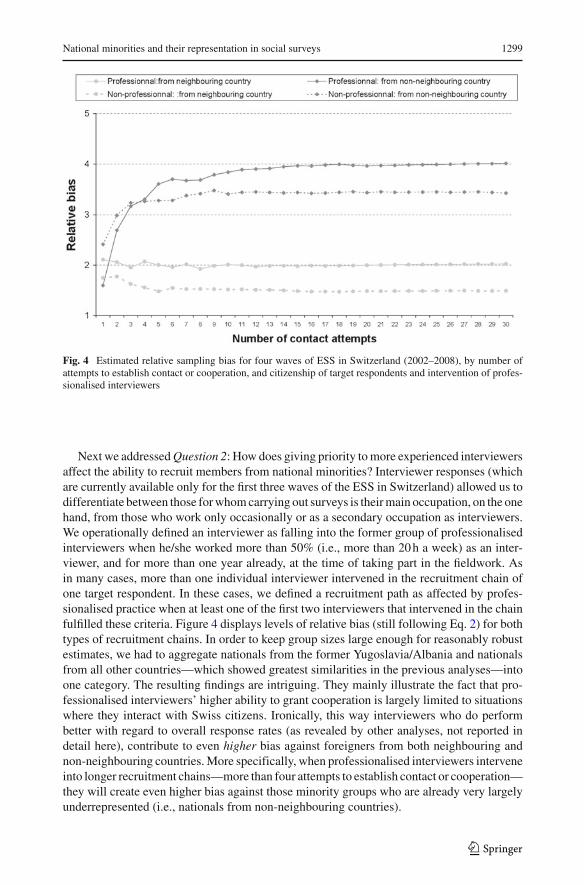
Fig. 4 Estimated relative sampling bias for four waves of ESS in Switzerland (2002–2008), by number ofattempts to establish contact or cooperation, and citizenship of target respondents and intervention of profes-sionalised interviewers
Next we addressed Question 2: How does giving priority to more experienced interviewersaffect the ability to recruit members from national minorities? Interviewer responses (whichare currently available only for the first three waves of the ESS in Switzerland) allowed us todifferentiate between those for whom carrying out surveys is their main occupation, on the onehand, from those who work only occasionally or as a secondary occupation as interviewers.We operationally defined an interviewer as falling into the former group of professionalisedinterviewers when he/she worked more than 50% (i.e., more than 20 h a week) as an inter-viewer, and for more than one year already, at the time of taking part in the fieldwork. Asin many cases, more than one individual interviewer intervened in the recruitment chain ofone target respondent. In these cases, we defined a recruitment path as affected by profes-sionalised practice when at least one of the first two interviewers that intervened in the chainfulfilled these criteria. Figure 4 displays levels of relative bias (still following Eq. 2) for bothtypes of recruitment chains. In order to keep group sizes large enough for reasonably robustestimates, we had to aggregate nationals from the former Yugoslavia/Albania and nationalsfrom all other countries—which showed greatest similarities in the previous analyses—intoone category. The resulting findings are intriguing. They mainly illustrate the fact that pro-fessionalised interviewers’ higher ability to grant cooperation is largely limited to situationswhere they interact with Swiss citizens. Ironically, this way interviewers who do performbetter with regard to overall response rates (as revealed by other analyses, not reported indetail here), contribute to even higher bias against foreigners from both neighbouring andnon-neighbouring countries. More specifically, when professionalised interviewers interveneinto longer recruitment chains—more than four attempts to establish contact or cooperation—they will create even higher bias against those minority groups who are already very largelyunderrepresented (i.e., nationals from non-neighbouring countries).
123
1300 F. Laganà et al.
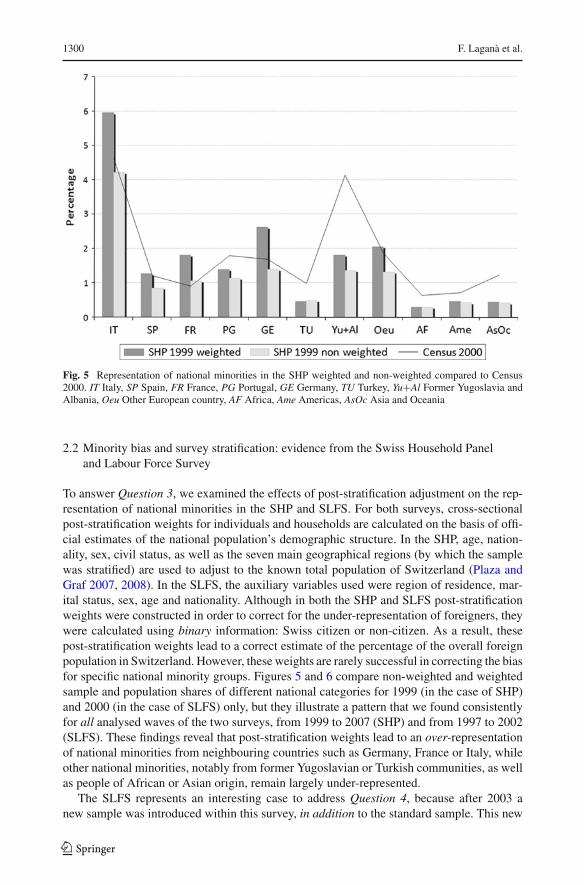
Fig. 5 Representation of national minorities in the SHP weighted and non-weighted compared to Census2000. IT Italy, SP Spain, FR France, PG Portugal, GE Germany, TU Turkey, Yu+Al Former Yugoslavia andAlbania, Oeu Other European country, AF Africa, Ame Americas, AsOc Asia and Oceania
2.2 Minority bias and survey stratification: evidence from the Swiss Household Paneland Labour Force Survey
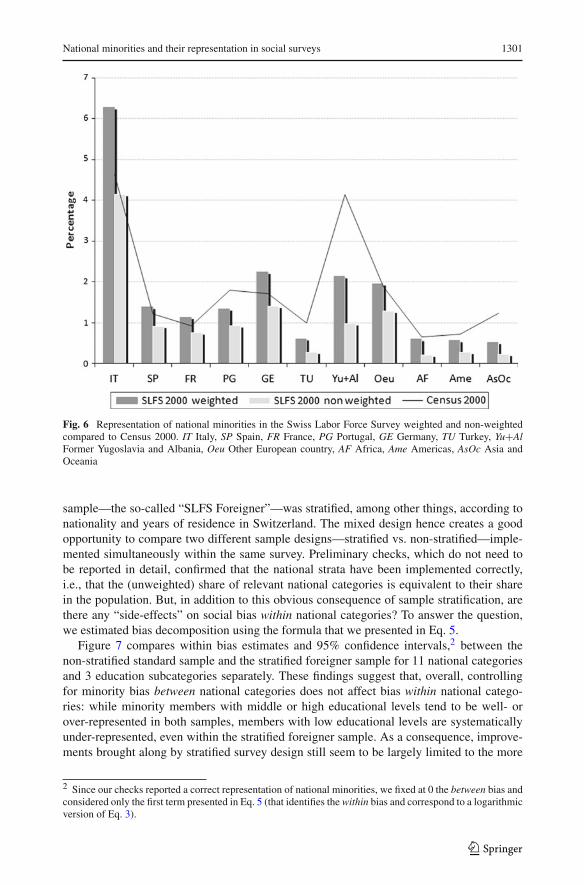
To answer Question 3, we examined the effects of post-stratification adjustment on the rep-resentation of national minorities in the SHP and SLFS. For both surveys, cross-sectionalpost-stratification weights for individuals and households are calculated on the basis of offi-cial estimates of the national population’s demographic structure. In the SHP, age, nation-ality, sex, civil status, as well as the seven main geographical regions (by which the samplewas stratified) are used to adjust to the known total population of Switzerland (Plaza andGraf 2007, 2008). In the SLFS, the auxiliary variables used were region of residence, mar-ital status, sex, age and nationality. Although in both the SHP and SLFS post-stratificationweights were constructed in order to correct for the under-representation of foreigners, theywere calculated using binary information: Swiss citizen or non-citizen. As a result, thesepost-stratification weights lead to a correct estimate of the percentage of the overall foreignpopulation in Switzerland. However, these weights are rarely successful in correcting the biasfor specific national minority groups. Figures 5 and 6 compare non-weighted and weightedsample and population shares of different national categories for 1999 (in the case of SHP)and 2000 (in the case of SLFS) only, but they illustrate a pattern that we found consistentlyfor all analysed waves of the two surveys, from 1999 to 2007 (SHP) and from 1997 to 2002(SLFS). These findings reveal that post-stratification weights lead to an over-representationof national minorities from neighbouring countries such as Germany, France or Italy, whileother national minorities, notably from former Yugoslavian or Turkish communities, as wellas people of African or Asian origin, remain largely under-represented.
The SLFS represents an interesting case to address Question 4, because after 2003 anew sample was introduced within this survey, in addition to the standard sample. This new
123
National minorities and their representation in social surveys 1301
Fig. 6 Representation of national minorities in the Swiss Labor Force Survey weighted and non-weightedcompared to Census 2000. IT Italy, SP Spain, FR France, PG Portugal, GE Germany, TU Turkey, Yu+AlFormer Yugoslavia and Albania, Oeu Other European country, AF Africa, Ame Americas, AsOc Asia andOceania
sample—the so-called “SLFS Foreigner”—was stratified, among other things, according tonationality and years of residence in Switzerland. The mixed design hence creates a goodopportunity to compare two different sample designs—stratified vs. non-stratified—imple-mented simultaneously within the same survey. Preliminary checks, which do not need tobe reported in detail, confirmed that the national strata have been implemented correctly,i.e., that the (unweighted) share of relevant national categories is equivalent to their sharein the population. But, in addition to this obvious consequence of sample stratification, arethere any “side-effects” on social bias within national categories? To answer the question,we estimated bias decomposition using the formula that we presented in Eq. 5.
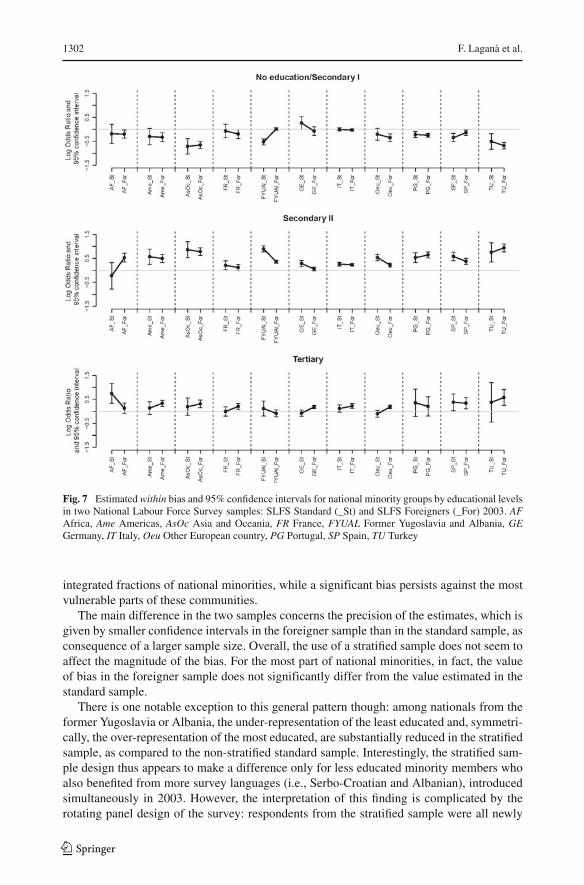
Figure 7 compares within bias estimates and 95% confidence intervals,2 between thenon-stratified standard sample and the stratified foreigner sample for 11 national categoriesand 3 education subcategories separately. These findings suggest that, overall, controllingfor minority bias between national categories does not affect bias within national catego-ries: while minority members with middle or high educational levels tend to be well- orover-represented in both samples, members with low educational levels are systematicallyunder-represented, even within the stratified foreigner sample. As a consequence, improve-ments brought along by stratified survey design still seem to be largely limited to the more
2 Since our checks reported a correct representation of national minorities, we fixed at 0 the between bias andconsidered only the first term presented in Eq. 5 (that identifies the within bias and correspond to a logarithmicversion of Eq. 3).
123
1302 F. Laganà et al.
Fig. 7 Estimated within bias and 95% confidence intervals for national minority groups by educational levelsin two National Labour Force Survey samples: SLFS Standard (_St) and SLFS Foreigners (_For) 2003. AFAfrica, Ame Americas, AsOc Asia and Oceania, FR France, FYUAL Former Yugoslavia and Albania, GEGermany, IT Italy, Oeu Other European country, PG Portugal, SP Spain, TU Turkey
integrated fractions of national minorities, while a significant bias persists against the mostvulnerable parts of these communities.
The main difference in the two samples concerns the precision of the estimates, which isgiven by smaller confidence intervals in the foreigner sample than in the standard sample, asconsequence of a larger sample size. Overall, the use of a stratified sample does not seem toaffect the magnitude of the bias. For the most part of national minorities, in fact, the valueof bias in the foreigner sample does not significantly differ from the value estimated in thestandard sample.
There is one notable exception to this general pattern though: among nationals from theformer Yugoslavia or Albania, the under-representation of the least educated and, symmetri-cally, the over-representation of the most educated, are substantially reduced in the stratifiedsample, as compared to the non-stratified standard sample. Interestingly, the stratified sam-ple design thus appears to make a difference only for less educated minority members whoalso benefited from more survey languages (i.e., Serbo-Croatian and Albanian), introducedsimultaneously in 2003. However, the interpretation of this finding is complicated by therotating panel design of the survey: respondents from the stratified sample were all newly
123
National minorities and their representation in social surveys 1303
recruited in 2003, whereas the majority of respondents from the non-stratified standard sam-ple had already been recruited in earlier years, when no additional survey languages had beenavailable.3 In the following section, we analyse the impact of survey languages in more detailand try, in particular, to isolate it from the impact of the sample design.
2.3 Minority bias and the language experiment in the Swiss Labour Force Survey
When surveys are not offered in the native languages of particular linguistic subgroups, sam-pled individuals from these subgroups may opt out due to poor understanding of the availablesurvey language(s). To deal with these issues, the SLFS launched a language experiment in2003. Before that year, the survey was offered only in the three Swiss national languages,German, French, and Italian. In 2003, the SLFS first included the additional languages ofEnglish, Serbo-Croatian, and Albanian. To these three languages, Portuguese and Turkishwere further added in 2005. According to a methodological report of the SLFS (Widmer2004), the aim was to reduce as far as possible survey non-participation due to linguisticbarriers. In practice however, first contacts with target respondents were still established inone of the three national languages (depending on the region). Interviewers who detected apossible linguistic problem could suggest the possibility of having the survey conducted inEnglish, Serbo-Croatian, or Albanian. If desired by the respondent, the call was then trans-ferred to the appropriate centre.4 In 2003, 13% of the SLFS cases in the foreigner sample(2.240 interviews) were conducted in one of these three additional languages. In 2005, withthe availability of two new translations, 329 interviews were conducted in Portuguese and 238in Turkish, while 2.854 interviews were conducted in Serbo-Croatian, Albanian, or English.
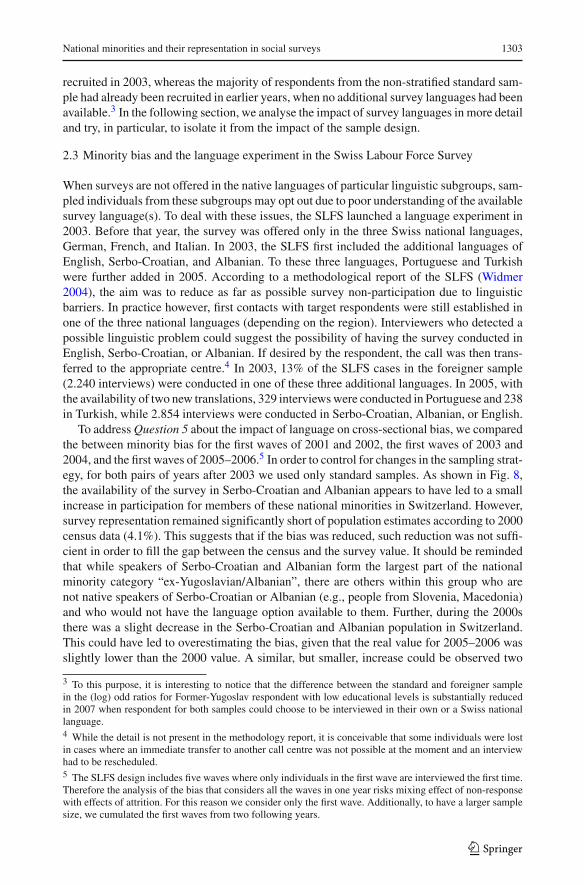
To address Question 5 about the impact of language on cross-sectional bias, we comparedthe between minority bias for the first waves of 2001 and 2002, the first waves of 2003 and2004, and the first waves of 2005–2006.5 In order to control for changes in the sampling strat-egy, for both pairs of years after 2003 we used only standard samples. As shown in Fig. 8,the availability of the survey in Serbo-Croatian and Albanian appears to have led to a smallincrease in participation for members of these national minorities in Switzerland. However,survey representation remained significantly short of population estimates according to 2000census data (4.1%). This suggests that if the bias was reduced, such reduction was not suffi-cient in order to fill the gap between the census and the survey value. It should be remindedthat while speakers of Serbo-Croatian and Albanian form the largest part of the nationalminority category “ex-Yugoslavian/Albanian”, there are others within this group who arenot native speakers of Serbo-Croatian or Albanian (e.g., people from Slovenia, Macedonia)and who would not have the language option available to them. Further, during the 2000sthere was a slight decrease in the Serbo-Croatian and Albanian population in Switzerland.This could have led to overestimating the bias, given that the real value for 2005–2006 wasslightly lower than the 2000 value. A similar, but smaller, increase could be observed two
3 To this purpose, it is interesting to notice that the difference between the standard and foreigner samplein the (log) odd ratios for Former-Yugoslav respondent with low educational levels is substantially reducedin 2007 when respondent for both samples could choose to be interviewed in their own or a Swiss nationallanguage.4 While the detail is not present in the methodology report, it is conceivable that some individuals were lostin cases where an immediate transfer to another call centre was not possible at the moment and an interviewhad to be rescheduled.5 The SLFS design includes five waves where only individuals in the first wave are interviewed the first time.Therefore the analysis of the bias that considers all the waves in one year risks mixing effect of non-responsewith effects of attrition. For this reason we consider only the first wave. Additionally, to have a larger samplesize, we cumulated the first waves from two following years.
123
1304 F. Laganà et al.
Fig. 8 Estimated between bias and 95% confidence intervals in three samples of SLFS, before (Sake 2001–2002) and after the introduction of the questionnaire in English, Serbo-Croat and Albanian (Sake 2003–2004)and Turkish and Portuguese (Sake 2005–2006). Only standard samples from 1 from 1st waves. F-YuAl FormerYugoslavia and Albania, OnC Other non neighbouring country, PG Portugal, TU Turkey
years later for Portuguese and Turkish respondents. Finally, minority bias even disappearedfor national minorities from other non neighbouring country, probably as a consequence ofthe introduction of English as a survey language.
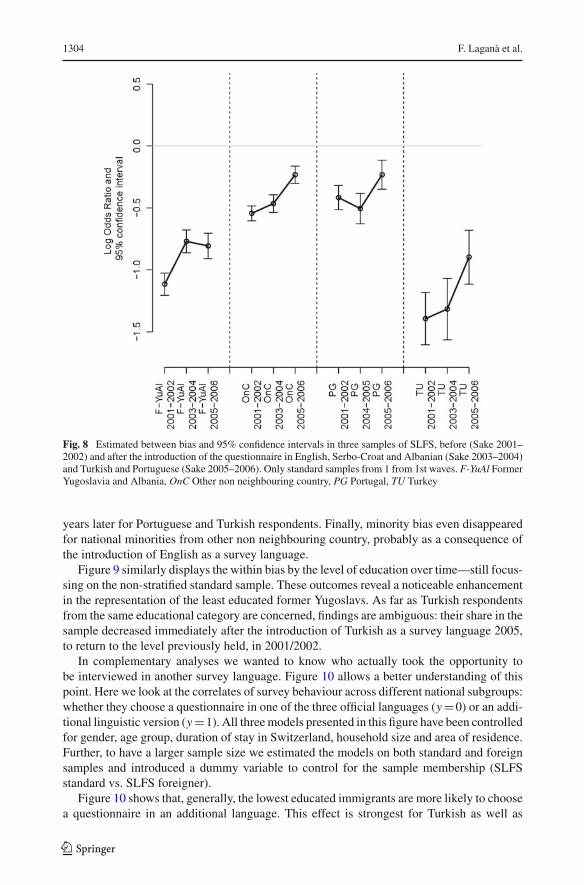
Figure 9 similarly displays the within bias by the level of education over time—still focus-sing on the non-stratified standard sample. These outcomes reveal a noticeable enhancementin the representation of the least educated former Yugoslavs. As far as Turkish respondentsfrom the same educational category are concerned, findings are ambiguous: their share in thesample decreased immediately after the introduction of Turkish as a survey language 2005,to return to the level previously held, in 2001/2002.
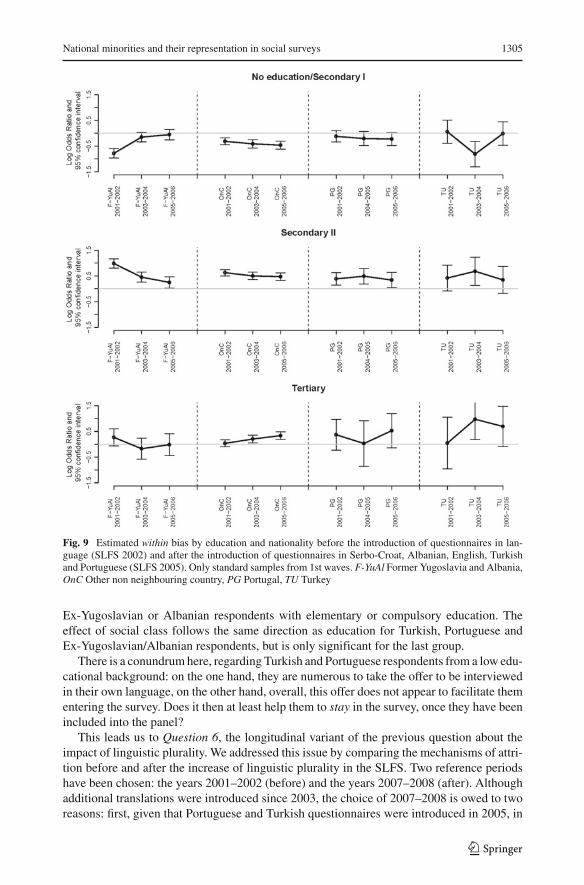
In complementary analyses we wanted to know who actually took the opportunity tobe interviewed in another survey language. Figure 10 allows a better understanding of thispoint. Here we look at the correlates of survey behaviour across different national subgroups:whether they choose a questionnaire in one of the three official languages (y =0) or an addi-tional linguistic version (y =1). All three models presented in this figure have been controlledfor gender, age group, duration of stay in Switzerland, household size and area of residence.Further, to have a larger sample size we estimated the models on both standard and foreignsamples and introduced a dummy variable to control for the sample membership (SLFSstandard vs. SLFS foreigner).
Figure 10 shows that, generally, the lowest educated immigrants are more likely to choosea questionnaire in an additional language. This effect is strongest for Turkish as well as
123
National minorities and their representation in social surveys 1305
Fig. 9 Estimated within bias by education and nationality before the introduction of questionnaires in lan-guage (SLFS 2002) and after the introduction of questionnaires in Serbo-Croat, Albanian, English, Turkishand Portuguese (SLFS 2005). Only standard samples from 1st waves. F-YuAl Former Yugoslavia and Albania,OnC Other non neighbouring country, PG Portugal, TU Turkey
Ex-Yugoslavian or Albanian respondents with elementary or compulsory education. Theeffect of social class follows the same direction as education for Turkish, Portuguese andEx-Yugoslavian/Albanian respondents, but is only significant for the last group.
There is a conundrum here, regarding Turkish and Portuguese respondents from a low edu-cational background: on the one hand, they are numerous to take the offer to be interviewedin their own language, on the other hand, overall, this offer does not appear to facilitate thementering the survey. Does it then at least help them to stay in the survey, once they have beenincluded into the panel?
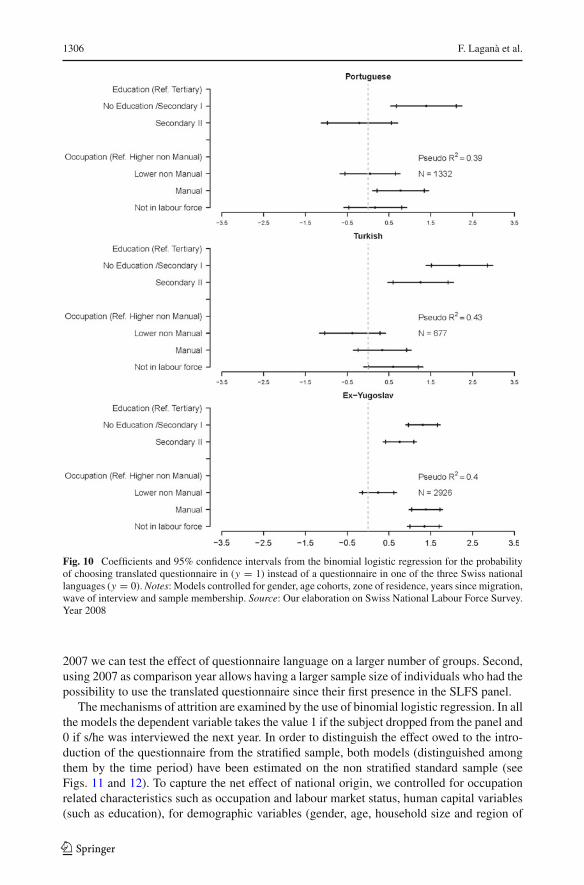
This leads us to Question 6, the longitudinal variant of the previous question about theimpact of linguistic plurality. We addressed this issue by comparing the mechanisms of attri-tion before and after the increase of linguistic plurality in the SLFS. Two reference periodshave been chosen: the years 2001–2002 (before) and the years 2007–2008 (after). Althoughadditional translations were introduced since 2003, the choice of 2007–2008 is owed to tworeasons: first, given that Portuguese and Turkish questionnaires were introduced in 2005, in
123
1306 F. Laganà et al.
Fig. 10 Coefficients and 95% confidence intervals from the binomial logistic regression for the probabilityof choosing translated questionnaire in (y = 1) instead of a questionnaire in one of the three Swiss nationallanguages (y = 0). Notes: Models controlled for gender, age cohorts, zone of residence, years since migration,wave of interview and sample membership. Source: Our elaboration on Swiss National Labour Force Survey.Year 2008
2007 we can test the effect of questionnaire language on a larger number of groups. Second,using 2007 as comparison year allows having a larger sample size of individuals who had thepossibility to use the translated questionnaire since their first presence in the SLFS panel.
The mechanisms of attrition are examined by the use of binomial logistic regression. In allthe models the dependent variable takes the value 1 if the subject dropped from the panel and0 if s/he was interviewed the next year. In order to distinguish the effect owed to the intro-duction of the questionnaire from the stratified sample, both models (distinguished amongthem by the time period) have been estimated on the non stratified standard sample (seeFigs. 11 and 12). To capture the net effect of national origin, we controlled for occupationrelated characteristics such as occupation and labour market status, human capital variables(such as education), for demographic variables (gender, age, household size and region of
123
National minorities and their representation in social surveys 1307
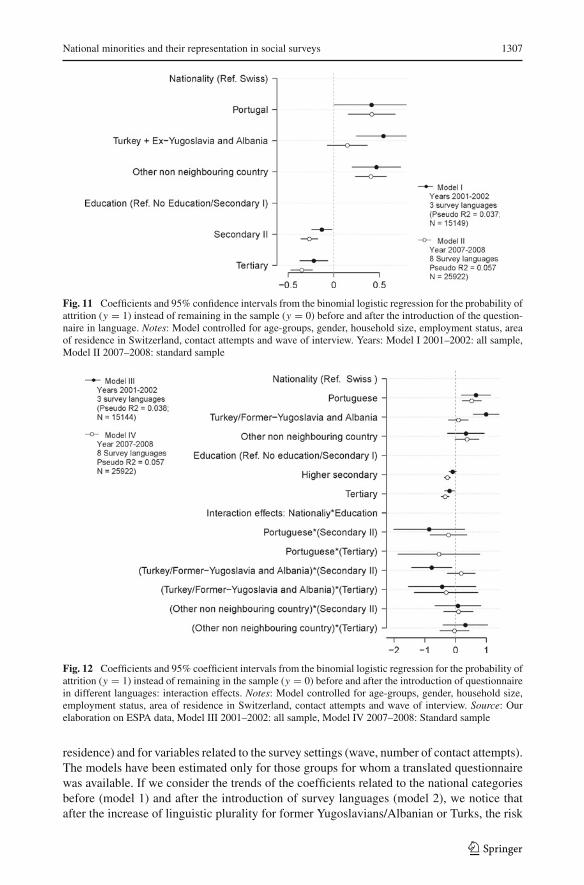
Fig. 11 Coefficients and 95% confidence intervals from the binomial logistic regression for the probability ofattrition (y = 1) instead of remaining in the sample (y = 0) before and after the introduction of the question-naire in language. Notes: Model controlled for age-groups, gender, household size, employment status, areaof residence in Switzerland, contact attempts and wave of interview. Years: Model I 2001–2002: all sample,Model II 2007–2008: standard sample
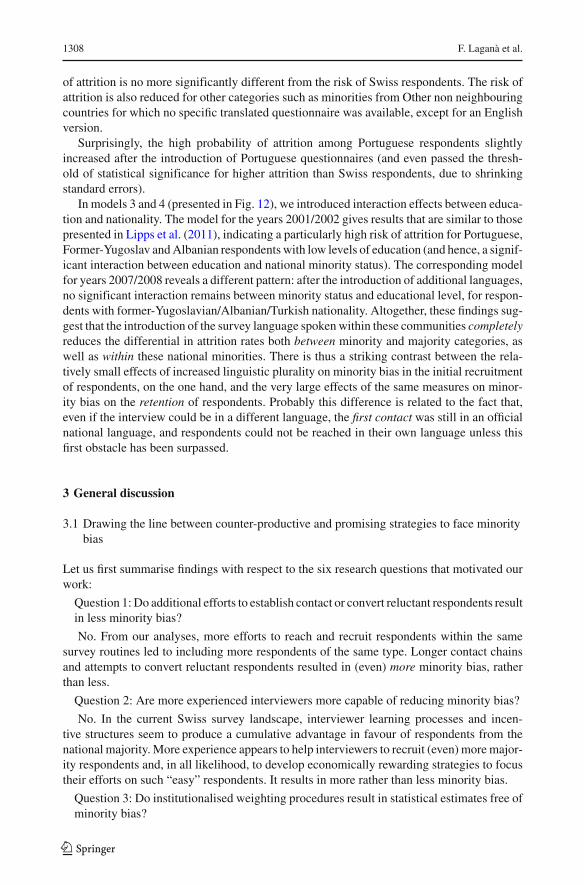
Fig. 12 Coefficients and 95% coefficient intervals from the binomial logistic regression for the probability ofattrition (y = 1) instead of remaining in the sample (y = 0) before and after the introduction of questionnairein different languages: interaction effects. Notes: Model controlled for age-groups, gender, household size,employment status, area of residence in Switzerland, contact attempts and wave of interview. Source: Ourelaboration on ESPA data, Model III 2001–2002: all sample, Model IV 2007–2008: Standard sample
residence) and for variables related to the survey settings (wave, number of contact attempts).The models have been estimated only for those groups for whom a translated questionnairewas available. If we consider the trends of the coefficients related to the national categoriesbefore (model 1) and after the introduction of survey languages (model 2), we notice thatafter the increase of linguistic plurality for former Yugoslavians/Albanian or Turks, the risk
123
1308 F. Laganà et al.
of attrition is no more significantly different from the risk of Swiss respondents. The risk ofattrition is also reduced for other categories such as minorities from Other non neighbouringcountries for which no specific translated questionnaire was available, except for an Englishversion.
Surprisingly, the high probability of attrition among Portuguese respondents slightlyincreased after the introduction of Portuguese questionnaires (and even passed the thresh-old of statistical significance for higher attrition than Swiss respondents, due to shrinkingstandard errors).
In models 3 and 4 (presented in Fig. 12), we introduced interaction effects between educa-tion and nationality. The model for the years 2001/2002 gives results that are similar to thosepresented in Lipps et al. (2011), indicating a particularly high risk of attrition for Portuguese,Former-Yugoslav and Albanian respondents with low levels of education (and hence, a signif-icant interaction between education and national minority status). The corresponding modelfor years 2007/2008 reveals a different pattern: after the introduction of additional languages,no significant interaction remains between minority status and educational level, for respon-dents with former-Yugoslavian/Albanian/Turkish nationality. Altogether, these findings sug-gest that the introduction of the survey language spoken within these communities completelyreduces the differential in attrition rates both between minority and majority categories, aswell as within these national minorities. There is thus a striking contrast between the rela-tively small effects of increased linguistic plurality on minority bias in the initial recruitmentof respondents, on the one hand, and the very large effects of the same measures on minor-ity bias on the retention of respondents. Probably this difference is related to the fact that,even if the interview could be in a different language, the first contact was still in an officialnational language, and respondents could not be reached in their own language unless thisfirst obstacle has been surpassed.
3 General discussion
3.1 Drawing the line between counter-productive and promising strategies to face minoritybias
Let us first summarise findings with respect to the six research questions that motivated ourwork:
Question 1: Do additional efforts to establish contact or convert reluctant respondents resultin less minority bias?
No. From our analyses, more efforts to reach and recruit respondents within the samesurvey routines led to including more respondents of the same type. Longer contact chainsand attempts to convert reluctant respondents resulted in (even) more minority bias, ratherthan less.
Question 2: Are more experienced interviewers more capable of reducing minority bias?
No. In the current Swiss survey landscape, interviewer learning processes and incen-tive structures seem to produce a cumulative advantage in favour of respondents from thenational majority. More experience appears to help interviewers to recruit (even) more major-ity respondents and, in all likelihood, to develop economically rewarding strategies to focustheir efforts on such “easy” respondents. It results in more rather than less minority bias.
Question 3: Do institutionalised weighting procedures result in statistical estimates free ofminority bias?
123

National minorities and their representation in social surveys 1309
No. In Switzerland, a common procedure consists in adjusting survey data for the cumu-lative share of all foreigners, merged into a single statistical category. This results in theover-representation of immigrants from close and economically prosperous sending coun-tries, while the remaining immigrant communities are still largely underrepresented. As aplausible consequence, weighted statistical estimates remain largely conservative—and dif-ficult to interpret—indicators regarding the situation of vulnerable populations.
Question 4: Does the correction of bias between national categories, by way of stratifiedsampling, also affect bias within national categories (either positively or negatively)?
Probably not, but it might depend on the overall survey context. The larger part of theevidence suggests that sampling with national strata is neutral with regard to bias withinnational minority groups. But in combination with more linguistic plurality, it might alsohave positive effects on the representation of socially disadvantaged groups within nationalcategories. We still need more evidence on possible desirable spill-over effects, but it is safeto dismiss counter-productive side effects.
Question 5: Do additional survey languages help to recruit members from minority groups,in particular among the socially disadvantaged?
Yes, but only to a limited extent. It seems that as long as first contacts are still establishedin national languages, this might remain a critical obstacle to enhancing the representation ofminority communities overall, and of the socially disadvantaged within these communities,in a more consequential way.
Question 6: Do more survey languages help to keep (socially disadvantaged) membersfrom minority groups in the sample or longitudinal studies?
Yes. Once minority respondents have been included in a panel study, they are as likelyas majority respondents to remain in, provided that they can be interviewed in their ownlanguage. This is true for socially disadvantaged as well as for other minority members.
Overall, these findings suggest that great caution should be exercised with regard to theway (additional) resources are invested in survey research. As long as they are used to domore of the same, it is very unlikely that we will be able to overcome minority bias. Andas long as our surveys are biased against national minorities, we cannot expect that officialstatistical indicators will be able to tell the full story about the scope and human cost ofphenomena like social inequalities, precariousness or poverty. A simple rule of thumb canbe derived from the insights gained here: The more there is an ethnic cleavage involved in agiven social problem (in the direction of a disadvantage for ethnic minorities), the more weare likely to underestimate the problem.
These findings also instruct us that survey quality is not one-dimensional, but that therecan be conflicts between different prescriptions, e.g., between overall high response ratesand low minority bias. The important lesson to learn is hence that survey strategies are notright or wrong per se, but in relation to specific goals. If these goals prioritise having anappropriate picture of minority groups, standard methodological guidelines are not enough.The cost-effectiveness of specific measures, such as more linguistic plurality, can only beassessed with regard to clearly defined research priorities.
Future research on minority bias should now ideally move from descriptive to experi-mental research on survey practices. To avoid the pitfalls of the more-of-the-same routines,we need to be creative: to try out and assess alternative survey practices, including differenthiring, training, and incentive schemes for interviewers, multi-lingual contact procedures, as
123
1310 F. Laganà et al.
well as multi-stratified sampling strategies that are based on sociological theory about rele-vant social cleavages and communities. A critical resource for implementing such samplingstrategies can be a general population register (as it is available in Switzerland since October2010). Register-based sampling frames allow for a better coverage of specific types of hard-to-reach populations (e.g., that are not included in telephone register data) and can providethe required information on individuals to stratify the sample by theory-driven criteria. At thesame time, we need to broaden the research question from which practices make a differenceto how practices make a difference—which implies integrating a more ethnographic compo-nent into the way we look at the impact of these factors on the quality of interactions betweeninterviewers and respondents. For example, effective survey processes are likely to rely ona series of implicit assumptions about seemingly trivial things like residential arrangementsand daily routines, meaningful interactions and legitimate requests, relevant incentives andappropriate behaviour. Cumulative experiences of survey researchers and interviewers mighthave well calibrated these assumptions, and the practices they inform, for the majority of thepopulation. Nevertheless or even precisely for this reason—the same set of assumptions canbe rather disconnected from the social reality experienced by various minority groups withinthe same population.
3.2 Can the study of minority bias in surveys help to understand the broader dynamicsof ethnic exclusion?
The present work and findings may lead to a scientific crossroad, where an interest in surveymethods meets a substantive interest in processes that create, reproduce, or reduce socialseparation between national majority and minority communities more generally. As a matterof fact, these outcomes lead us to reflect critically on the way in which practices that result inexclusion of certain minority groups from participation in surveys are themselves embeddedin much wider social practices, which similarly result in the exclusion of the same groupsfrom other fields of social participation. In a context of pervasive public discourse on so-called “immigration” or “integration” issues, there is an understandable public expectationthat social scientists should help to develop a clearer understanding of the social dynamics atstake. In this light, it is unfortunate that to date we can only admit [on the basis of the findingsreported here, as well as in Lipps et al. (2011)] that major social surveys currently do not helpmuch to get a more accurate picture of the living circumstances, concerns, or aspirations ofkey minority communities in the country: the available data are not only particularly sparse(with the notable exception of the SLFS foreigner sample that started in 2003), they are alsodistorted in ways that we only start to understand.
But if the outcomes of these surveys do not yet very much enlighten the social realityof certain minority groups, a closer look at processes that produced these outcomes doesshed an interesting light on certain facets of the relations between majority and minoritycommunities. If we aim to understand how the fate of certain communities can be put out ofpublic sight—i.e., excluded from the way the national community represents itself in nationalstatistical indicators—even without a purposeful strategy to achieve such an outcome—thereis an opportunity to take here: to start in our own backyard and study the dynamics ofcommunity segregation in the production of survey-based evidence. Such an approach alsochanges the focus of our interest from individuals to interactions, regarding non-participationin surveys as well as in other forms of social interaction. As long as we think about surveynonresponse as being only about the attributes of (non-) respondents (their motivation, skills,or availability), we are indeed likely to think the same about overall social disconnected-
123
National minorities and their representation in social surveys 1311
ness, seen then as a lack of will or capacity to integrate in the host society. But once westart conceiving survey nonresponse as the product of an interaction between interviewersand respondents at a micro-level, and between social researchers and various sub-nationalcommunities at a meso-level, we recognise two active parts in the process, and its outcomesbecome dependent on the overlap of routines, goals, strategies, and assumptions betweenboth parts.
Broadening the theoretical context from minority exclusion in surveys to the social exclu-sion of minorities more generally goes hand in hand with broadening the geographic contextof the phenomena. There is something typically Western-European about the associationbetween “minorities” and “immigration”. In this part of the world, more than elsewhere, doso-called ethnic minorities stem from relatively recent waves of immigration, and are largelyconfounded with the non-citizen population—particularly in countries with restrictive natu-ralisation policies, like Switzerland.
Furthermore, just as Swiss migration policies represent a more pronounced version of ageneral trend in Western Europe, a similar argument can be made about the (lack of inclu-sion) of the resulting minority groups in social surveys. National surveys have been foundto be biased against ethno-national minorities across most European countries (Deding et al.2008; Feskens et al. 2006, 2007; Peracchi and Depalo 2006). At the same time, there hasbeen a remarkable increase in social surveys whose boundaries are those of a nation-state. Toa certain extent, the relatively recent institutionalisation of international social surveys—ofwhich the ESS, conducted first in 2002, is a perfect example—might, ironically, even havecontributed to reinforce this tendency. As a matter of fact, internationally designed surveysare typically implemented nationally: the funding of the fieldwork is national, and so aresurvey agencies and interviewer networks, the sampling frames and selection procedures,questionnaire versions, and (in case of the ESS) academic supervision of methodologicalpractices.
In that sense, the major social surveys have become part of an institutionalised set ofroutine practices that take for granted the nation-state as their natural context and providerof resources (and, maybe, even a sense of purpose): methodological nationalism (Wimmerand Schiller 2002) is embedded in the larger banal nationalism that constitutes the unnoticedstructuring background of so many of our daily routines (Billig 1995). The most intriguingconsequences of current survey routines that we have highlighted here stem from their ten-dency to implicitly identify the national population with the national majority (and, thereby,to produce national statistics that blur the situation of national minorities). The insights thatwe have gained from studying the resulting processes therefore also open an interestingperspective to learn more about “minority bias” in a much more general sense.
Acknowledgments The authors would like to thank Lavinia Gianettoni, Oliver Lipps and Alexandre Pollienfor their thoughtful comments on the findings presented in this paper and for a series of stimulating discussionson the role of national minorities in Swiss surveys.
Appendix
See Table 1.
123
1312 F. Laganà et al.
Tabl
e1
Ove
rvie
won
mai
nsu
rvey
char
acte
rist
ics
Surv
eych
arac
teri
stic
SHP
ESS
SLFS
Popu
latio
nR
esid
ents
excl
uded
inst
itutio
nalis
edPo
pula
tion
(e.g
.,ja
il,ho
spita
l,ol
dag
eho
me,
inm
ilita
ryse
rvic
e)
Res
iden
tsex
clud
edin
stitu
tiona
lised
Perm
anen
tres
iden
tsex
clud
edin
stitu
tiona
lised
Low
er/u
pper
age
limit
14/(
unlim
ited)
15/(
unlim
ited)
15/(
unlim
ited)
Sam
plin
gfr
ame
SRH
—Sw
iss
Tele
phon
ere
gist
erSw
iss
Tele
phon
ere
gist
er(2
002,
2004
,200
6),b
uild
ing
regi
ster
ofSw
iss
Post
(200
8)
SLFS
stan
dard
:SR
H—
Swis
sTe
leph
one
regi
ster
SLFS
fore
igne
rs:
Cen
tral
fore
igne
rre
gist
er
Popu
latio
nsex
clud
edfr
omth
esa
mpl
ing
fram
eM
obile
son
ly,t
hose
with
outl
iste
dph
one
num
bers
Mob
iles
only
,tho
sew
ithou
tlis
ted
phon
enu
mbe
rs(2
002,
2004
,200
6)SL
FSst
anda
rd:m
obile
son
ly,t
hose
with
outl
iste
dph
one
num
ber
Lan
guag
esco
vere
d(q
uest
ionn
aire
avai
labl
e)T
hree
natio
nall
angu
ages
(Ger
man
,Fr
ench
,Ita
lian)
Thr
eena
tiona
llan
guag
esT
hree
natio
nall
angu
ages
+E
nglis
h,Se
rbo-
Cro
at,A
lban
ian
(sin
ce20
03)+
Port
ugue
sean
dT
urki
sh(s
ince
2005
)
Surv
eype
riod
(s)
Yea
rly,
sinc
e19
99B
i-an
nual
lysi
nce
2002
Yea
rly
sinc
e19
91
Sam
ple
size
(ind
ivid
uals
)7,
799
(in
1999
)+3,
645
(ref
resh
men
tsa
mpl
ein
2004
)A
bout
2,00
0–4,
500
inea
chro
und
SLFS
stan
dard
:fro
m19
91to
1994
:16
,000
–18,
000;
from
1995
to20
01:
33,0
00;f
rom
2002
to20
08:
40,0
00—
Red
uctio
nof
stan
dard
sam
ple
inth
epe
riod
2003
–200
6.St
anda
rdsa
mpl
est
able
afte
rwar
ds.
SLFS
Fore
igne
rssi
nce
2003
:15,
000
fore
igne
rs
Stra
tifica
tion
Lar
gere
gion
sL
arge
regi
ons
SLFS
stan
dard
:lar
gere
gion
san
dca
nton
sSL
FSfo
reig
ners
:nat
iona
lity,
gend
er,
year
sof
resi
denc
ein
CH
123
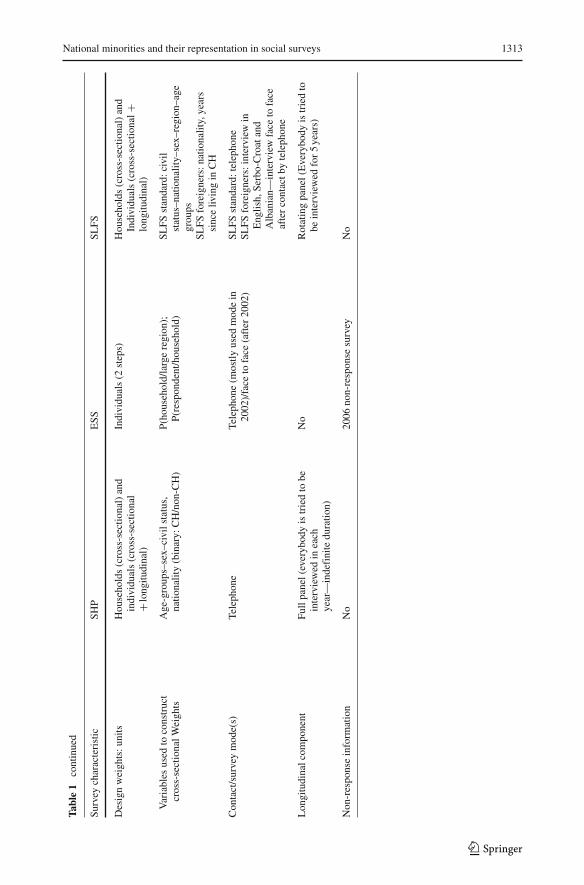
National minorities and their representation in social surveys 1313
Tabl
e1
cont
inue
d
Surv
eych
arac
teri
stic
SHP
ESS
SLFS
Des
ign
wei
ghts
:uni
tsH
ouse
hold
s(c
ross
-sec
tiona
l)an
din
divi
dual
s(c
ross
-sec
tiona
l+l
ongi
tudi
nal)
Indi
vidu
als
(2st
eps)
Hou
seho
lds
(cro
ss-s
ectio
nal)
and
Indi
vidu
als
(cro
ss-s
ectio
nal+
long
itudi
nal)
Var
iabl
esus
edto
cons
truc
tcr
oss-
sect
iona
lWei
ghts
Age
-gro
ups–
sex–
civi
lsta
tus,
natio
nalit
y(b
inar
y:C
H/n
on-C
H)
P(ho
useh
old/
larg
ere
gion
);P(
resp
onde
nt/h
ouse
hold
)SL
FSst
anda
rd:c
ivil
stat
us–n
atio
nalit
y–se
x–re
gion
–age
grou
psSL
FSfo
reig
ners
:nat
iona
lity,
year
ssi
nce
livin
gin
CH
Con
tact
/sur
vey
mod
e(s)
Tele
phon
eTe
leph
one
(mos
tlyus
edm
ode
in20
02)/
face
tofa
ce(a
fter
2002
)SL
FSst
anda
rd:t
elep
hone
SLFS
fore
igne
rs:i
nter
view
inE
nglis
h,Se
rbo-
Cro
atan
dA
lban
ian—
inte
rvie
wfa
ceto
face
afte
rco
ntac
tby
tele
phon
e
Lon
gitu
dina
lcom
pone
ntFu
llpa
nel(
ever
ybod
yis
trie
dto
bein
terv
iew
edin
each
year
—in
defi
nite
dura
tion)
No
Rot
atin
gpa
nel(
Eve
rybo
dyis
trie
dto
bein
terv
iew
edfo
r5
year
s)
Non
-res
pons
ein
form
atio
nN
o20
06no
n-re
spon
sesu
rvey
No
123
1314 F. Laganà et al.
References
Billig, M.: Banal Nationalism. Sage, London (1995)Camarota, S., Capizzano, J.: Assessing the Quality of Data Collected on the Foreign Born: An Evaluation of
the American Community Survey (ACS). Technical Report, Center for Immigration Studies, Washington(2004)
Castles, S., Miller, J.M.: The Age of Migrations. 2nd edn. MacMillan Press Ltd., Basingstoke (1993)Deding, M., Fridberg, T., Jakobsen, V.: Non-response in a survey among immigrants in Denmark. Surv. Res.
Methods 2(3), 107–121 (2008)Eisner, M., Ribeaud, D.: Conducting a criminological survey in a cultural diverse context: lessons from the
Zurich Project on the social development of children. Eur. J. Criminol. 4(3), 271–298 (2007)Feskens, R., Hox, J., Lensvelt-Mulders, G., Schmeets, H.: Collecting data among ethnic minorities in an
international perspective. Field Methods 18(3), 284–304 (2006)Feskens, R., Hox, J., Lensvelt-Mulders, G., Schmeets, H.: Non-response among ethnic minorities: a multivar-
iate analysis. J. Off. Stat. 23(3), 387–408 (2007)Gross, D.: Immigration policy and foreign population in Switzerland. World Bank Policy Research Working
Paper 3853 (2006)Groves, R.M.: Nonreponse rates and nonresponse bias in household surveys. Public Opin. Q. 70(5), 646–
675 (2006)Jakobsen, V.: Young immigrants from the former Yugoslavia, Turkey and Pakistan: educational attainment,
wages and employment. PhD thesis, Department of Economics, Aarhus School of Business, Aarhus(2004)
Koser, K., Lutz, H.: The new migrations in Europe. Social Construction and Social Realities. MacMillan,London (1998)
Lipps, O., Pollien, A.: Effects of interviewer experience on components of nonresponse in the European SocialSurvey. Field Methods. 23(2), 156–172 (2011)
Lipps, O., Laganà, F., Pollien, A., Gianettoni, L.: National minorities and their representation in Swiss surveys(I): Providing evidence and analyzing causes for their under-representation. FORS Working Paper Series,paper 2011–2. FORS, Lausanne (2011)
Nielsen, N.K., Pedersen, S.: Databeskrivelse (in Danish). In: Mogensen, G.V., Matthiesen, P.C. (eds.) Inte-gration i Danmark omkring årtusindeskiftet. The Rockwool Foundation Research Unit, University ofAarhus Publisher, Aarhus (2000)
Peracchi, F., Depalo, D.: Labor market outcomes of natives and immigrants: evidence from the ECHP. SocialProtection Discussion Paper No. 0615, World Bank, Washington (2006)
Peytchev, A., Baxter, R., Carley-Baxter, L.: Not all survey effort is equal. Reduction of nonresponse bias andnonresponse error. Public Opin. Q. 73(4), 785–806 (2009)
Piguet, E.: L’immigration en Suisse. Cinquante ans d’entreouverture. Presses Polytechniques et UniversitairesRomandes, Lausanne (2004)
Plaza, S., Graf, E.: Reccomandations et Exemples Pratiques Concernant l’application des Pondérations. PanelSuisse de Manages, Neuchâtel (2007)
Plaza, S., Graf, E.: Executive summary. Recommendations and practical examples for using weighting. FORS,Lausanne (2008)
Widmer, R.F.: L’enquête Suisse sur la Population Active, Concepts—Bases Méthodologiques, ConsidérationsPratiques. Office Fédérale de la Statistique, Neuchâtel (2004)
Wimmer, A., Schiller, N.: Methodological nationalism and beyond: nation state building, migration and thesocial sciences. Glob. Netw. 2(4), 301–334 (2002)
123


