Embed Size (px)
Citation preview

Natural Landmark Detection forVisually-Guided Robot Navigation
Enric Celaya, Jose-Luis Albarral, Pablo Jimenez, and Carme Torras
Institut de Robotica i Informatica Industrial (CSIC-UPC). Barcelona, Spain{celaya, albarral, jimenez, torras}@iri.upc.edu
Abstract. The main difficulty to attain fully autonomous robot nav-igation outdoors is the fast detection of reliable visual references, andtheir subsequent characterization as landmarks for immediate and un-ambiguous recognition. Aimed at speed, our strategy has been to tracksalient regions along image streams by just performing on-line pixel sam-pling. Persistent regions are considered good candidates for landmarks,which are then characterized by a set of subregions with given color andnormalized shape. They are stored in a database for posterior recogni-tion during the navigation process. Some experimental results showinglandmark-based navigation of the legged robot Lauron III in an outdoorsetting are provided.
1 Introduction
Indoor robot navigation has received a great deal of attention, and many of theproposed approaches are now successfully used in industrial settings and otherspecific applications like hospital couriers or museum guides. Such applicationsare often strongly dependent on known structured features present in each spe-cific environment [1]. Currently the research interest is rapidly shifting towardsservice robots able to work in cooperation with humans in more general situa-tions not especially well suited for robot operation. Often, robots are requiredto navigate in unknown and unstructured outdoor environments, where littleassumptions can be made about the kind of objects or structures that can beused for robot guidance.
In such outdoor applications, partly teleoperated robots able to reach au-tonomously a destination marked by a human operator on the image as seen bythe robot are agreed to be very handy. Then, updating the target as the robotadvances, permits long-range journeys. Our visually-guided navigation approachprovides this performance by relying on natural landmarks.
Most related works use point-based visual features, leading to large landmarkdatabases and high numbers of lookups to attain localization. These drawbacksare palliated by recurring to more involved feature detectors, such as the scale-invariant feature transform (SIFT) [2], and by selecting a maximally-informativesubset of landmarks [3]. We explore the alternative approach of relying on only afew region-based features, similarly to [4, 5]. The former of these previous works

builds an environmental model incrementally by using color and stereo rangeinformation, while the latter uses a multi-resolution visual attention mechanismto extract image regions most salient in terms of color contrast.
Saliency detection in our system is also based on color, but instead of pro-cessing entire static frames, our algorithm can be applied directly to the dy-namic image stream acquired while the robot moves. Thus, it can be thought asimplementing a form of visual memory that replicates the phenomenon of thepersistence of images in the retina of the animals’ eyes. Salient regions are usedas a filter for the search of visual landmarks in the image.
The paper is structured as follows: Section 2 describes our visually-guidednavigation context in which the landmark detection system is to be used. Section3 introduces our approach to natural landmark detection and identification,showing some results for real images taken by a mobile robot in an outdoorsetting. Finally, some conclusions and future work are pointed out in Section 4.
2 An Approach to Visually-Guided Navigation
We developed a visually-guided navigation system [6] in which a user controlsthe robot by signaling the navigation target in the images received from a cam-era transported by the robot. This form of navigation control is convenient forexploration purposes or when there is no previous map of the environment, sit-uations in which systems like GPS, even if available, become useless and can bediscarded. The user can decide the next target for the robot and change it asnew views of the environment become available.
Fig. 1 shows the two main windows of the navigation interface: The CameraWindow and the Robot Control Interface. In the Camera Window, the user cansee the images taken from the camera of the robot and control its gaze directionto observe the environment. The user may select the current navigation targetby clicking on the image with the mouse.
Fig. 1. Camera window and Robot Control Interface.

One of the problems we had to face while designing our visually-guided navi-gation system was how to specify the navigation target. Ideally, what we wantedis to allow the user to select any object in sight and use it as the current target.The problem with this approach is that, what can be a clearly identifiable objectfor the user, may not be easily recognized by an artificial vision system, so thatit can be lost very soon. Another difficulty that appears with the definition ofthe target by pointing at it consists in determining what exact area of the imagehas to be considered as the target object. Our strategy to solve these problemsconsists in limiting the selection of possible targets to those that the robot isable to identify with its visual recognition system. Thus, it is the system thatfirst shows to the user the set of available landmarks, and the user may selectone of them as the target.
Additionally, landmarks detected by the visual system can be used by alandmark-based navigation system (like e.g., that of [7]) to plan a feasible pathto the goal in those cases in which obstacles in the way to the goal do not allowa direct approach to it.
3 Natural Landmarks
We relied on the assumption that useful landmarks must be salient, i.e., theymust constitute distinctive regions in the image, so that its repeated detectionand identification is facilitated. The saliency of a region is not determined bythe absolute value of any intrinsic magnitude, but rather by the contrast ordifference of this value with respect to the value of the same magnitude in thesurroundings [8]. This is also known as opponency [9].
Many variables can be used to define the saliency of a region, like colorcomponents, intensity, or feature orientation. Works like [10] compute saliency asa combination of the opponency values of these three variables. In what follows,we present a very simple approach that just considers RGB color values, but thesame idea could be used with more informative features.
3.1 Detecting Salient Regions
We take an approach to image processing that is inspired in the visual system ofliving organisms. A key difference between natural eyes and artificial vision sys-tems is that in the eye, individual light receptors fire asynchronously, giving riseto a continuous image flow that can not be naturally decomposed into separateindividual image shots. In contrast, artificial systems work in a strictly sequen-tial way taking one frame after another, each involving all individual receptorsupdated at fixed frequency. Our approach emulates the asynchronous process ofthe eye by taking pixels at random from the image with a frequency which is notrelated with that of frame acquisition. Thus, the input image is treated as a con-tinuously varying source of information with no distinction between successiveframes.

One advantage of this approach is that the process is independent of theframe rate of the acquisition system, which can be safely ignored in the imageprocessing task. This avoids any need of synchronization between image acqui-sition and image processing. Another advantage is that the processing cost isindependent of image resolution: the same number of pixels per second will beprocessed whatever the number of pixels of the image is. Image size or resolutionaffects only the probability that a given pixel is examined in a given period oftime.
To detect saliency, the information of individual pixels is used only statis-tically and stored in local units that cover different regions of the image. Thisapproach allows us to implement a form of visual memory that replicates thephenomenon of the persistence of images in the retina: Units can persist as longas new pixels keep them active, decreasing in strength until disappearing if theyare not fed enough by appropriate inputs. The system is robust to sporadic noisyframes, since most units will not be substantially perturbed by noisy pixel valuesand will keep the essential information through the next uncorrupted frame.
Units have elliptic receptive fields in the image plane, which adapt throughsuccessive updates to cover regions whose pixels have similar colors. These el-lipses arise naturally from considering normal distributions for pixels taken atrandom from each region: the center Uxy = (Ux, Uy) of the ellipse correspondsto the mean value of the pixels’ positions, whereas its dimensions (the major andthe minor axis) and orientation are determined by the covariances. Each unitalso has a spherical receptive field in the RGB color space with a fixed radius,which is a parameter of the system, and whose center adapts to approach theaverage color value of the input pixels to which the unit responded.
Each unit U is defined with the following attributes:
– Center vector Uxy and covariance matrix ΣXY in the image plane,– Center vector Urgb in the color space,– Contrast CU , a scalar that measures saliency, as explained in point 2) below,– Creation date CreacU , to record the time from which the unit exists,– Counter UpdatesU for the number of times a unit has been updated,– Counter InsideU for the number of times an input pixel has fallen inside the
receptive field of the unit in the image plane, and– Strength SU , a scalar that estimates the current proportion between the
number of pixels to which the unit responds and those lying into the unit’sreceptive field in the image plane.
Description of the Saliency Detection Algorithm. In the main loop ofthe algorithm, a random input pixel I is selected and, for each unit U , its Maha-lanobis distance in the image coordinates and Euclidean distance in color spaceare computed as:
Mdistxy(U, I) =√
(Ixy −Uxy)>Σ−1XY (Ixy −Uxy), (1)
where ΣXY is the covariance matrix of unit U , and
Edist2RGB(U, I) =∑
i
(Ii −Ui)2, with i ∈ {r, g, b}. (2)
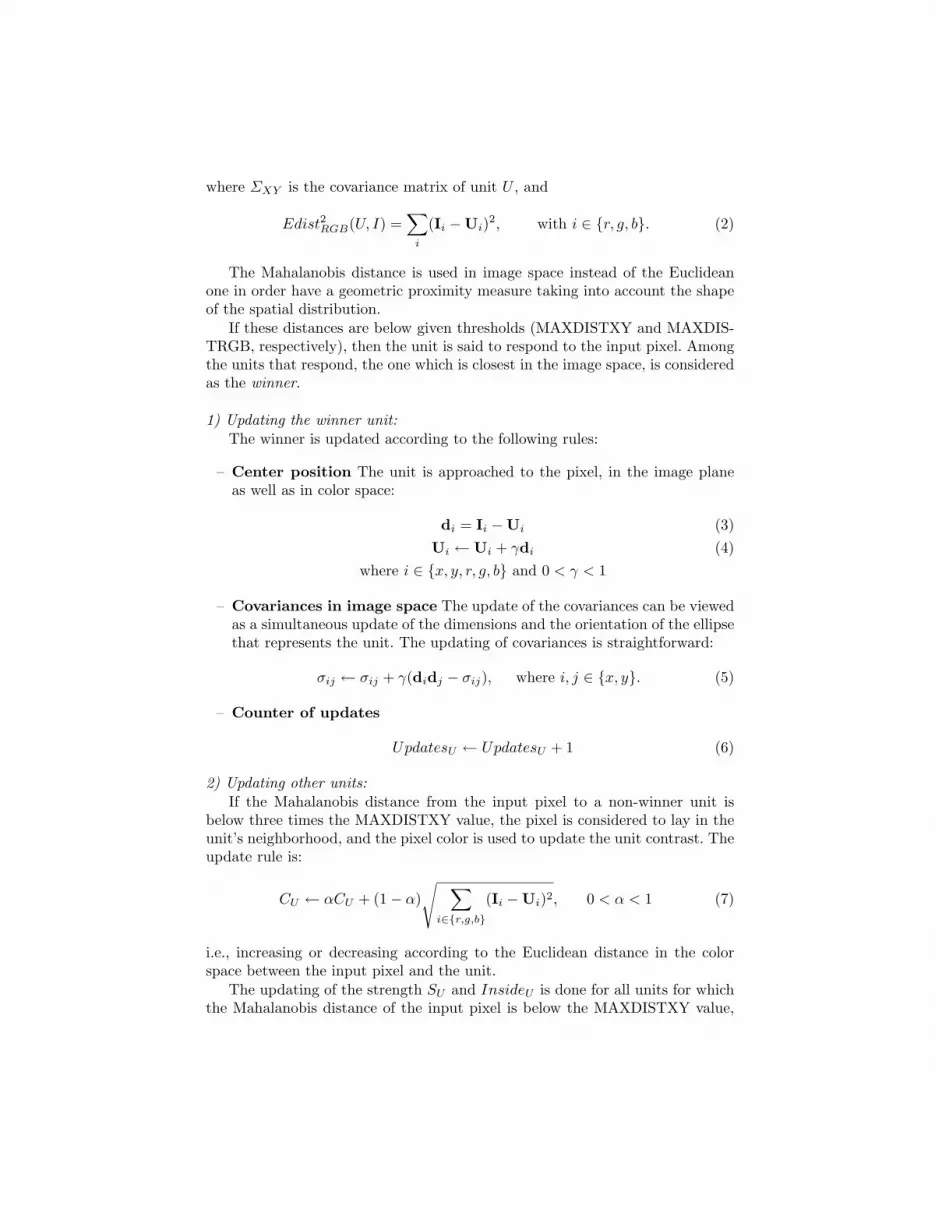
The Mahalanobis distance is used in image space instead of the Euclideanone in order have a geometric proximity measure taking into account the shapeof the spatial distribution.
If these distances are below given thresholds (MAXDISTXY and MAXDIS-TRGB, respectively), then the unit is said to respond to the input pixel. Amongthe units that respond, the one which is closest in the image space, is consideredas the winner.
1) Updating the winner unit:The winner is updated according to the following rules:
– Center position The unit is approached to the pixel, in the image planeas well as in color space:
di = Ii −Ui (3)Ui ← Ui + γdi (4)
where i ∈ {x, y, r, g, b} and 0 < γ < 1
– Covariances in image space The update of the covariances can be viewedas a simultaneous update of the dimensions and the orientation of the ellipsethat represents the unit. The updating of covariances is straightforward:
σij ← σij + γ(didj − σij), where i, j ∈ {x, y}. (5)
– Counter of updates
UpdatesU ← UpdatesU + 1 (6)
2) Updating other units:If the Mahalanobis distance from the input pixel to a non-winner unit is
below three times the MAXDISTXY value, the pixel is considered to lay in theunit’s neighborhood, and the pixel color is used to update the unit contrast. Theupdate rule is:
CU ← αCU + (1− α)√ ∑
i∈{r,g,b}(Ii −Ui)2, 0 < α < 1 (7)
i.e., increasing or decreasing according to the Euclidean distance in the colorspace between the input pixel and the unit.
The updating of the strength SU and InsideU is done for all units for whichthe Mahalanobis distance of the input pixel is below the MAXDISTXY value,

i.e., the pixel is in the receptive field of the unit. While InsideU is simply incre-mented by one, the strength is increased when the unit responds to the input(i.e., also chromatically) according to:
SU ← βSU + (1− β), with 0 < β < 1. (8)
If the unit does not respond to the input color, SU is decreased according to:
SU ← βSU (9)
3) Reallocation of units:To avoid a proliferation of useless units, the maximum number of them is lim-
ited by a parameter of the system, which may be adjusted depending on imagecomplexity and the intended level of detail of the result. When the maximumnumber of units is reached, in order to allow the creation of new ones corre-sponding to interesting regions not yet captured by any unit, older ones mustbe removed. When this is the case, the less useful unit is selected according tothe following criteria: First, the unit with the lowest strength value is sought.If its strength is below a certain value, it is assumed that the region it is rep-resenting is no longer there, and the unit can be reallocated for the new input.If no low-strength unit is found, the reallocation will only take place provided acontrast estimation of the unit to be created is above that of the lowest-contrastunit. Such contrast estimation is given by the distance in color space of the inputpixel to its spatially closest unit.
New units are initialized with center vectors given by the values of the inputpixel, with a circular shape in the image plane, and a radius equal to its distanceto the closest unit.
4) Merging of units:When two units respond to a given pixel, they are probably representing
different parts of the same region and have to be merged together. For themerged unit, the center values and covariances are computed as a weighted sumof those of the original units. The weights are proportional to the respective areaand strength, thus roughly corresponding to the “mass”, or number of pixels eachunit responds to:
Weight(U) = Area(U)SU (10)
The area is computed from the covariances as
Area(U) =√
((σxx + σyy + ∆) · (σxx + σyy −∆)) (11)
where ∆ =√
(σxx − σyy)2 + 4σ2xy
The contrast of the merged unit is set to the highest contrast value of the twooriginal ones, and for the strength, the weighted sum of the strengths is made,this time using the respective values of UpdatesU as weights.
5) Output of the system:

As for the output of the system, less relevant units are filtered out beforebeing output as salient regions. To this end, units covering too large regions ofthe image are discarded, as they usually capture the background and are notuseful for navigation. Regions that are too small are also discarded to removeisolated pixels or noise. Finally, units that have not been updated a minimumnumber of times are not considered, since they are still not reliable enough.From the remaining units, those with contrast values above a given thresholdare selected for output as corresponding to salient regions.
3.2 Landmark Characterization
Salient regions are not considered as landmarks by themselves, but as easilyrecognizable pointers potentially denoting the presence of a landmark, whichusually will present a richer structure than a single uniform region. We define alandmark as a set of uniform color regions, each of them with a characteristiccolor and shape.
Each region R composing a landmark L is defined with the following at-tributes:
– Center vector Rrgb in the color space,– Geometrical central moments µ20, µ11 and µ02 of the region,– Squared patch Rpatch to store a normalized version of the region’s mask.
With a desired frequency, the current image frame is analyzed in order tocharacterize the landmark associated with the salient region defined by each unitU , according to the following steps:
1) Region mask determination:Every pixel I in the image for which the unit responds is included into the
salient region’s mask.
maskU (I) = 1 ⇔{
Mdistxy(U, I) ≤ MAXDISTXYEdistRGB(U, I) ≤ MAXDISTRGB
(12)
In a second step, the region mask is expanded, possibly beyond the limitsof the ellipse, by a growing process that includes those pixels connected to themask that also satisfy the color constraint.
2) Landmark layout:Once the region mask is obtained, we define the landmark layout as the con-
vex hull of the mask. This allows to include regions of different colors into thelandmark, and not only the single color region that was found as salient.
3) Extraction of relevant regions of the landmark:The landmark layout is subject to a non-exhaustive segmentation process
which tries to obtain its most relevant regions. The goal is to obtain a descriptionof the landmark consisting in a small number of significant regions that cover

the most part of the area, excluding too small regions from the description. Thisis obtained by a process of color-based region growing initiated at successiverandomly chosen seeds within the landmark layout. The process stops as soonas at least 80% of the landmark area has been segmented, or after a given numberof seeds, determined in proportion to the region size, has been used.
During the growing process the region’s color is updated as new pixels areincluded in the region’s mask Rmask:
di = Ii −Ri (13)Ri ← Ri + γdi with i ∈ {r, g, b} (14)γ = 1
Rweight+1 (15)
Rweight ← Rweight + 1 (16)
4) Region merging:In order to make the segmentation more robust to initial seed selection, a
post-process of merging is done, which joins those neighboring regions whosecolors are similar enough. The result of merging two regions Ra and Rb is a newregion Rc obtained as follows:
Rcmask = Ra
mask ∪Rbmask (17)
Rcweight = Ra
weight + Rbweight, (18)
Rci =
RaweightR
ai +Rb
weightRbi
Rcweight
with i ∈ {r, g, b} (19)
After this, regions representing a too small fraction of the landmark area areremoved.
5) Region normalization:Each region is normalized to a patch of 40x40 pixels to make its description
invariant to changes in scale and moderate perspective deformations. For this,the geometric central moments of order 2 are computed, from which the equiv-alent ellipse axes are found providing a rotation angle to align the region, andscale factors for the x and y dimensions.
The geometrical moments are computed as:
mij =∑
x
∑y xiyjRmask(x, y) (20)
µij =∑
x
∑y(x− x)i(y − y)jRmask(x, y) (21)
where x = m10m00
, y = m01m00
from which the equivalent ellipse orientation and axes are obtained:
θ = 12arctan( 2µ11
µ20−µ02), (22)
w =√
µ20+µ02+∆2m00
and h =√
µ20+µ02−∆2m00
, (23)
where ∆ =√
(µ20 − µ02)2 + 4µ211.

The region mask normalization (translation, rotation and scaling) into asquare patch Rpatch is done in the following way:
Rpatch(x′, y′) = Rmask(x, y) (24)
(x′, y′)t = M ∗ (x, y)t + b (25)
M =[
sxcos(θ) sxsin(θ)−sysin(θ) sycos(θ)
], b =
[txsxcos(θ) + tysxsin(θ)−txsysin(θ) + tysycos(θ)
](26)
where: tx = −x ty = −y sx = 402w sy = 40
2h
Finally, a landmark description is stored as a set of regions, each defined byits characteristic color, its geometric moments and the normalized 40x40 regionmask.
3.3 Landmark Identification
In order to identify previously encountered landmarks and update their descrip-tion with the new view, each newly found landmark is compared against alllandmarks currently in the landmark database. The comparison between twolandmarks is done by trying to match the regions that form each landmark.Each region of the new landmark is compared with all regions of the storedlandmark. Region comparison is performed according to two features: color andshape. The color match is simpler to test and is made first so as to act as afilter for the second test. Regions passing the color match filter are tested forshape similarity by computing the normalized cross-correlation NCC of the cor-responding normalized masks:
NCC =
∑x
∑y Ra
patch(x, y)Rbpatch(x, y)√∑
x
∑y(Ra
patch(x, y))2∑
x
∑y(Rb
patch(x, y))2(27)
If the shape similarity of two regions is higher than a threshold (defined as 85%),the correspondence between the two regions is added to a list of correspondences.This list may contain multiple matches for each landmark region, leaving thedisambiguation of the correct matches for a later process of global coherence.A new landmark is identified with a landmark stored in the database if thepercentage of matching regions is above 50%.
Non identified landmarks are added to the landmark database as new de-tected landmarks, so that they can be identified in later stages of the navigationprocess.
3.4 Experimental Results
The landmark detection and identification system was tested on real imagestaken during the navigation of a legged robot Lauron III (Figure 2). The SalienceDetection algorithm was executed on the whole video sequence, while the pro-cesses of Landmark Characterization and Landmark Identification were onlyperformed on the six isolated frames shown in Figure 3.
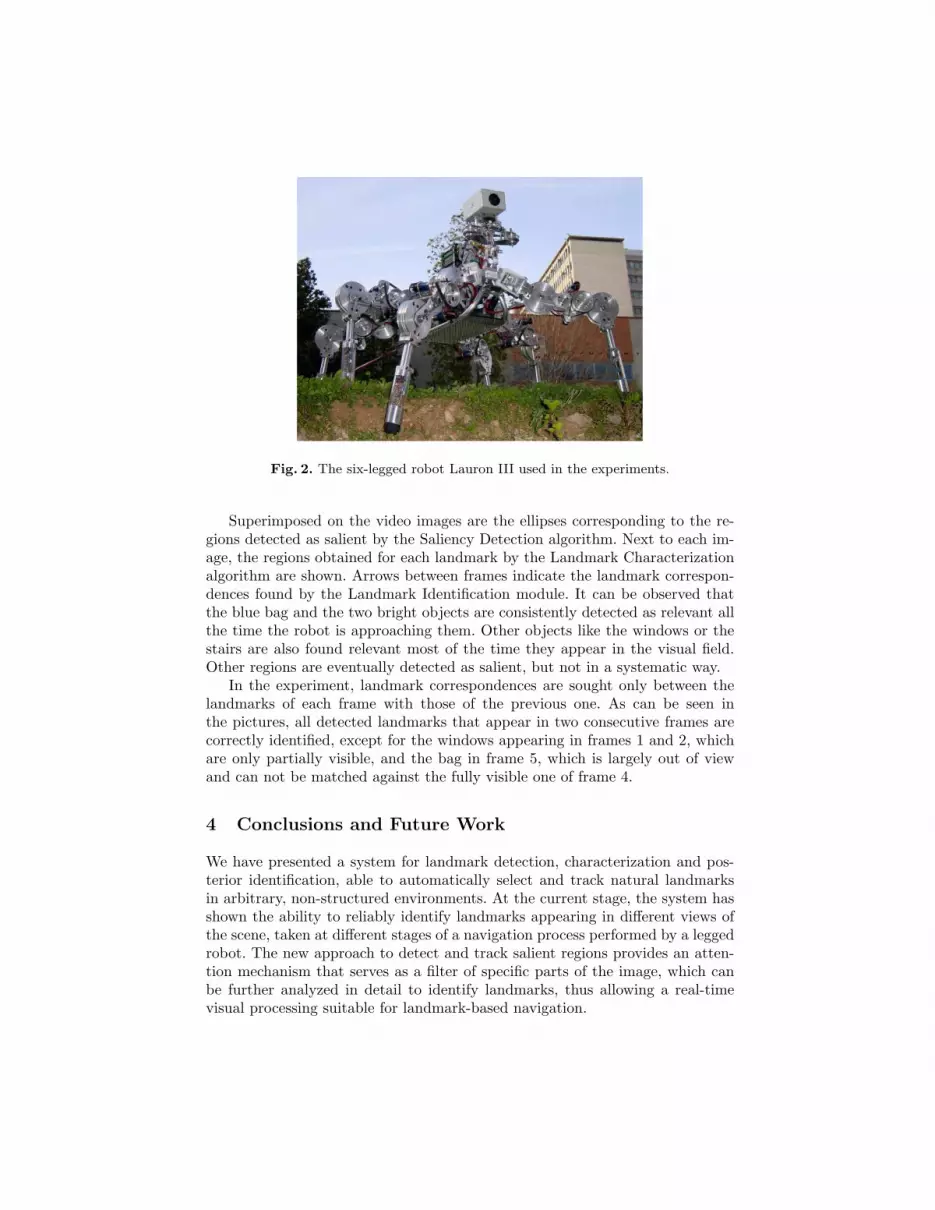
Fig. 2. The six-legged robot Lauron III used in the experiments.
Superimposed on the video images are the ellipses corresponding to the re-gions detected as salient by the Saliency Detection algorithm. Next to each im-age, the regions obtained for each landmark by the Landmark Characterizationalgorithm are shown. Arrows between frames indicate the landmark correspon-dences found by the Landmark Identification module. It can be observed thatthe blue bag and the two bright objects are consistently detected as relevant allthe time the robot is approaching them. Other objects like the windows or thestairs are also found relevant most of the time they appear in the visual field.Other regions are eventually detected as salient, but not in a systematic way.
In the experiment, landmark correspondences are sought only between thelandmarks of each frame with those of the previous one. As can be seen inthe pictures, all detected landmarks that appear in two consecutive frames arecorrectly identified, except for the windows appearing in frames 1 and 2, whichare only partially visible, and the bag in frame 5, which is largely out of viewand can not be matched against the fully visible one of frame 4.
4 Conclusions and Future Work
We have presented a system for landmark detection, characterization and pos-terior identification, able to automatically select and track natural landmarksin arbitrary, non-structured environments. At the current stage, the system hasshown the ability to reliably identify landmarks appearing in different views ofthe scene, taken at different stages of a navigation process performed by a leggedrobot. The new approach to detect and track salient regions provides an atten-tion mechanism that serves as a filter of specific parts of the image, which canbe further analyzed in detail to identify landmarks, thus allowing a real-timevisual processing suitable for landmark-based navigation.
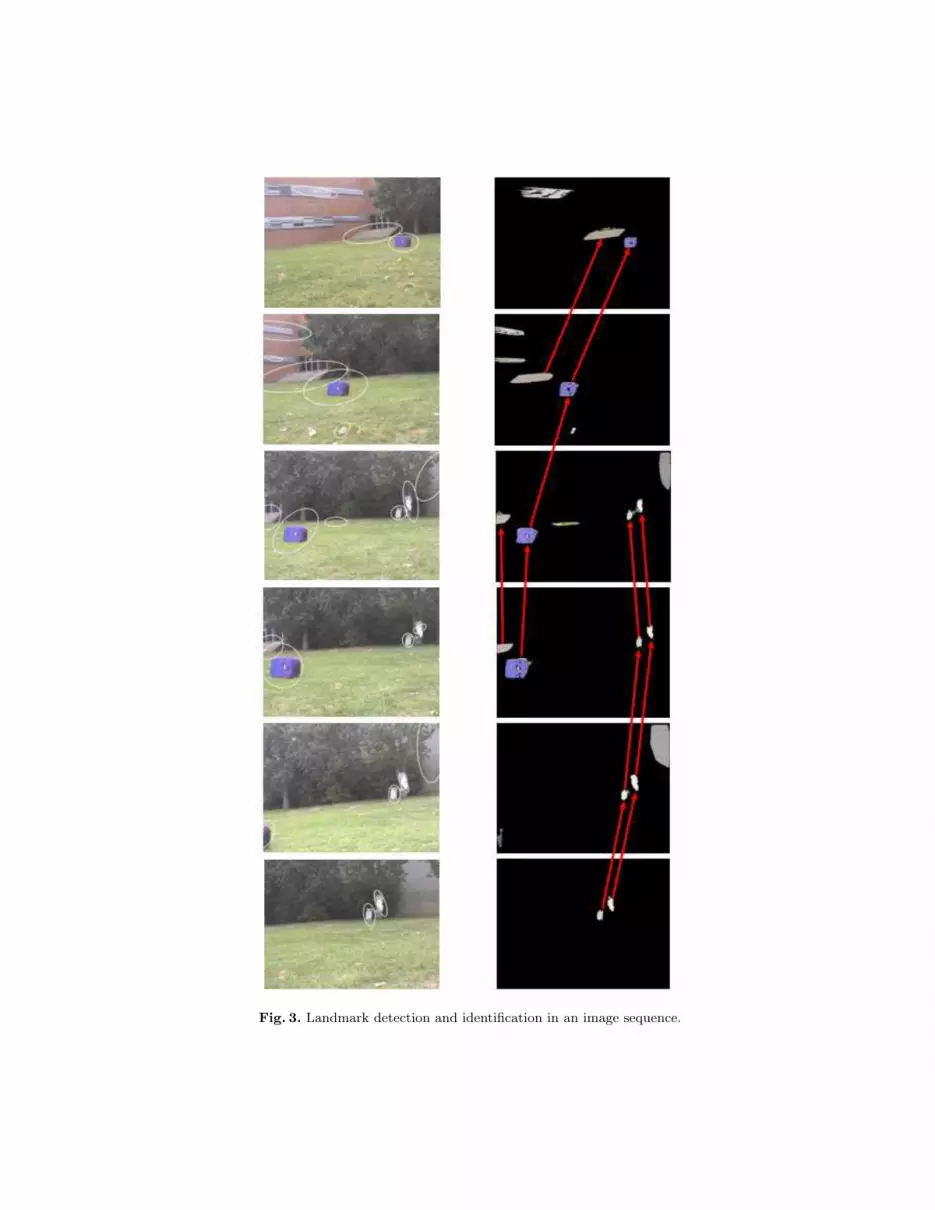
Fig. 3. Landmark detection and identification in an image sequence.

Further work is needed to make the landmark characterization more robustto large differences in the viewpoint and illumination conditions that may beexpected during the travel of the robot in outdoor environments. As a futureenhancement, a landmark could be represented by a collection of views takenform different locations at different stages of the navigation, thus coping with theproblem of the appearance/disappearance of regions when changing the pointof view. Another improvement concerns the algorithm for landmark matching:when the number of matched regions between two landmarks is not enough toassess a landmark identification, the missing regions could be actively sought inthe landmark to confirm the correctness of the match.
Acknowledgements. This work has been supported by the Spanish Ministeriode Ciencia y Tecnologıa and FEDER under the project SIRVENT (DPI2003-05193-C02-01).
References
1. G. DeSouza and A. Kak: Vision for mobile robot navigation: a survey. PAMI,24(2):237-267, 2002.
2. D. Lowe: Distinctive Image Features from Scale-Invariant Keypoints, InternationalJournal of Computer Vision, vol. 60, 2004, pp 91-110.
3. P. Sala, R. Sim, A. Shokoufandeh, and S. Dickinson: Landmark Selection for Vision-Based Navigation, IEEE Trans. on Robotics, vol. 22, n. 2, 2006, pp. 334-349.
4. R. Murrieta-Cid, C. Parra and M. Devy: Visual navigation in natural environments:from range and color data to a landmark-based model. Autonomous Robots, vol.13, n. 2, 2002, pp. 143-168.
5. E. Todt and C. Torras: Detecting Salient Cues Through Illumination-InvariantColor Ratios, Robotics and Autonomous Systems, vol. 48, n. 2-3, 2004, pp 111-130.
6. E. Celaya, J-L. Albarral, P. Jimenez, and C. Torras: Visually-Guided Robot Nav-igation: From Artificial To Natural Landmarks, 6th International Conference onField and Service Robotics, Chamonix, France, July 2007.
7. D. Busquets, C. Sierra, and R. Lopez de Mantaras: A multi-agent approach toqualitative landmark-based navigation, Autonomous Robots, vol. 15, 2003, pp 129-153.
8. H.-C. Nothdurft: Saliency from Feature Contrast: Additivity Across Dimensions,Vision Research, vol. 40, 2000, pp 1183-1201.
9. E. Todt and C. Torras: Detection of natural landmarks through multiscale oppo-nent features, in 15th International Conference on Pattern Recognition, Barcelona,Spain, 2000, pp. 976-979.
10. L. Itti, C. Koch and E. Niebur: A Model of Saliency-based visual Attention forRapid Scene Analysis, IEEE Transactions on Pattern Analysis and Machine In-telligence, vol. 20, n. 11, 1998, pp 1254-1259.