Embed Size (px)
Citation preview
ARTICLE
Received 3 Jan 2014 | Accepted 2 May 2014 | Published 9 Jun 2014
Restricted VH/VL usage and limited mutationsin gluten-specific IgA of coeliac disease lesionplasma cellsØyvind Steinsbø1, Carole J. Henry Dunand2, Min Huang2, Luka Mesin1, Marlene Salgado-Ferrer2,
Knut E.A. Lundin1,3, Jørgen Jahnsen4, Patrick C. Wilson2 & Ludvig M. Sollid1
Coeliac disease (CD), an enteropathy caused by cereal gluten ingestion, is characterized by
CD4þ T cells recognizing deamidated gluten and by antibodies reactive to gluten or the
self-antigen transglutaminase 2 (TG2). TG2-specific immunoglobulin A (IgA) of plasma cells
(PCs) from CD lesions have limited somatic hypermutation (SHM). Here we report that
gluten-specific IgA of lesion-resident PCs share this feature. Monoclonal antibodies were
expression cloned from single PCs of patients either isolated from cultures with reactivity to
complex deamidated gluten antigen or by sorting with gluten peptide tetramers. Typically, the
antibodies bind gluten peptides related to T-cell epitopes and many have higher reactivity to
deamidated peptides. There is restricted VH and VL combination and usage among the
antibodies. Limited SHM suggests that a common factor governs the mutation level in PCs
producing TG2- and gluten-specific IgA. The antibodies have potential use for diagnosis of
CD and for detection of gluten.
DOI: 10.1038/ncomms5041 OPEN
1 Centre for Immune Regulation and Department of Immunology, University of Oslo and Oslo University Hospital-Rikshospitalet, 0372 Oslo, Norway.2 Department of Medicine, Section of Rheumatology, Committee on Immunology, The Knapp Center for Lupus and Immunology Research, University ofChicago, Chicago, Illinois 60637, USA. 3 Department of Gastroenterology, Oslo University Hospital-Rikshospitalet, 0372 Oslo, Norway. 4Division ofMedicine, Department of Gastroenterology, Akershus University Hospital, 1478 Lørenskog, Norway. Correspondence and requests for materials should beaddressed to L.M.S. (email: [email protected]).
NATURE COMMUNICATIONS | 5:4041 | DOI: 10.1038/ncomms5041 | www.nature.com/naturecommunications 1
& 2014 Macmillan Publishers Limited. All rights reserved.
Coeliac disease (CD) is a chronic T-cell-mediated inflam-matory enteropathy resulting from an inappropriateimmune response to dietary gluten proteins (consisting
of gliadin and glutenin components) of wheat, barley and rye.The disorder is controlled by gluten, as elimination of gluten fromthe diet leads to disease remission and resolution of the smallintestinal disease lesion, whereas gluten provocation leads toreoccurrence of disease and pathology1. Distinct features of thedisease are cell-mediated immunity to gluten and highly specifichumoral responses to both gluten and the self-antigentransglutaminase 2 (TG2)2. Leukocyte infiltrations in the CDlesion reflect these immunological features; gluten-reactiveCD4þ T cells recognizing deamidated gluten peptides in thecontext of the disease associated HLA-DQ2 and HLA-DQ8molecules3 as well as plasma cells (PCs) secreting gluten-specificor TG2-specific immunoglobulin A (IgA) and IgM antibodies arefound in the intestinal lamina propria of CD patients4,5.
Antibodies to gluten and TG2 have become increasinglyimportant for the diagnostic workup of CD6,7. In children,histological assessment of biopsies in many cases is no longerconsidered mandatory due to high diagnostic accuracy ofserologic assays7. A similar diagnostic pathway has also beensuggested for adults8. Serologic testing is informative whensubjects are consuming a gluten-containing diet. Antibodies bothto gluten9 and TG2 (ref. 10) disappear within months afterintroduction of a gluten-free diet. The parallel fluctuation ofantibodies to gluten and TG2 in serum and at the plasma cell levelin the intestine11 in response to dietary gluten suggests that theproduction of these antibodies is regulated in a coordinated way.
The epitopes recognized by gluten-reactive CD4þ T cells of CDpatients are well characterized. Typically, the T-cell epitopes harbour
glutamate residues, which have been introduced by TG2-mediateddeamidation of certain glutamine residues12. Less is known aboutgluten B-cell epitopes. Some epitopes have been characterized bystudying polyclonal serum antibody reactivity to synthetic peptidesof gliadin proteins13 and by bacterial cell-displayed peptidelibraries14. Deamidation is also relevant for the B-cell epitopes,and serum antibody reactivity is higher to deamidated than thecorresponding native (non-deamidated) peptides13,15.
Gliadin B-cell epitopes appear to be situated in proximityand/or to overlap with gliadin T-cell epitopes13,15. Furthermore,serum IgA antibodies to TG2, and likely also to deamidatedgliadin, only occur in subjects who are HLA-DQ2 or HLA-DQ8(ref. 16). The HLA dependence of the antibody production andthe colocalization of T-cell epitopes and B-cell epitopes suggestthat the antibody response to gluten in CD is T cell dependent.Similarly, the HLA dependence of TG2 antibodies suggests T-cellinvolvement for their formation. Thus, it was surprising that theTG2 IgA expression cloned from CD lesions displayed limitedsomatic hypermutation (SHM)5.
In order to shed further light on the humoral immunity in CD,we have characterized the gluten-specific IgA antibody responseof CD that happens in parallel to the autoantibody response toTG2. We have pursued two complementary approaches toidentify gliadin-specific IgAþ PCs from small intestinal biopsiesof subjects with untreated CD (UCD). In one, we isolated gliadin-specific PCs by culturing single PCs and screening the culturesupernatants for IgA reactivity to complex gliadin antigen in anepitope unbiased fashion. In another, we analysed and sortedsingle IgAþ PCs with complexes of fluorescent streptavidinand biotinylated synthetic gliadin peptides by flow cytometry.We generated a panel of human monoclonal antibodies (hmAbs)
CD27 CD19FSC
IgM
CD
3 an
d C
D14
SS
C
0 Days 2 Days
5
10
20
0
25
15
[IgA
] ng
ml–1
IgA+ PCs SCSs IgA+ PCs SCSs
ND ND ND
4 week2 week
[IgA
] ng
ml–1
100
200
0
300
ND ND ND ND ND ND
0 week
F+ F–
1 week
F+ F– F+ F–
3 week
F+ F– F+ F–
a
c
b
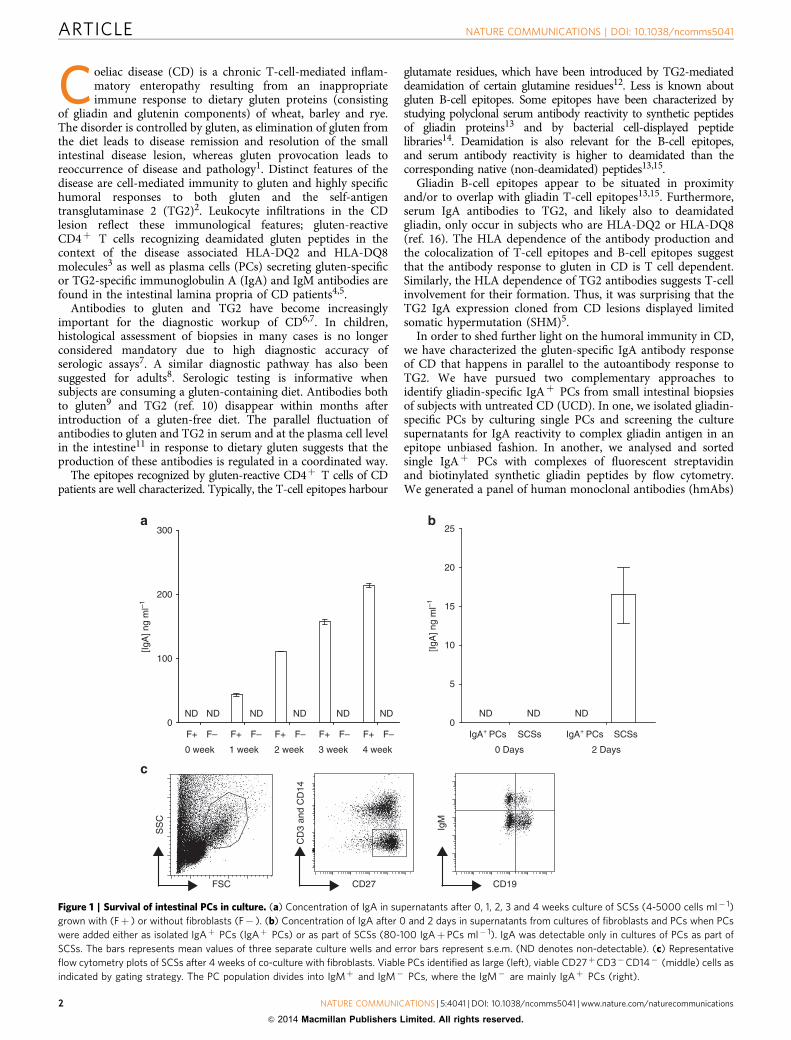
Figure 1 | Survival of intestinal PCs in culture. (a) Concentration of IgA in supernatants after 0, 1, 2, 3 and 4 weeks culture of SCSs (4-5000 cells ml� 1)
grown with (Fþ ) or without fibroblasts (F� ). (b) Concentration of IgA after 0 and 2 days in supernatants from cultures of fibroblasts and PCs when PCs
were added either as isolated IgAþ PCs (IgAþ PCs) or as part of SCSs (80-100 IgAþ PCs ml� 1). IgA was detectable only in cultures of PCs as part of
SCSs. The bars represents mean values of three separate culture wells and error bars represent s.e.m. (ND denotes non-detectable). (c) Representative
flow cytometry plots of SCSs after 4 weeks of co-culture with fibroblasts. Viable PCs identified as large (left), viable CD27þCD3�CD14� (middle) cells as
indicated by gating strategy. The PC population divides into IgMþ and IgM� PCs, where the IgM� are mainly IgAþ PCs (right).
ARTICLE NATURE COMMUNICATIONS | DOI: 10.1038/ncomms5041
2 NATURE COMMUNICATIONS | 5:4041 | DOI: 10.1038/ncomms5041 | www.nature.com/naturecommunications
& 2014 Macmillan Publishers Limited. All rights reserved.
from single PCs specific for gliadin and report that theseantibodies have restricted VH and VL usage and limited SHM.These results give insights into the mechanisms of the productionof gluten-specific and TG2-specific IgA antibodies in CD andsuggest that the limited somatic mutation in both populations iscontrolled by similar factor(s).
ResultsIntestinal PCs secreting IgA reactive with gliadin. In vitroculture was a critical step for isolation of PCs producing anti-bodies reactive with heat/acid-treated chymotrypsin-digestedgliadin (hereafter termed CT-gliadin for short). Three conditionsof PC cultures were compared. Single-cell suspensions (SCSs)from intestinal biopsies were generated, and PCs were culturedeither as SCSs, as SCSs in co-culture with human intestinalfibroblasts or as PCs isolated by flow cytometry in co-culture withfibroblasts. The concentration of IgA in supernatants of cultureswith SCSs together with fibroblasts increased with a constant rateover at least 4 weeks (Fig. 1a), suggesting that the majority ofPCs survived in these cultures. We did not observe any increaseof IgA in supernatants of cultures of SCSs alone (Fig. 1a) or flowcytometry sorted PCs cultured with fibroblasts (Fig. 1b). In co-cultures of SCSs and fibroblasts, we observed that intestinal PCssurvived for weeks, and viable CD19þCD27þ PCs were detectedby flow cytometry after 4 weeks of culture (Fig. 1c). PCs did notproliferate in these cultures, as tested in a BrdU incorporationassay. Based on these findings, the system of co-culturing SCSsand fibroblasts was selected for further experiments.
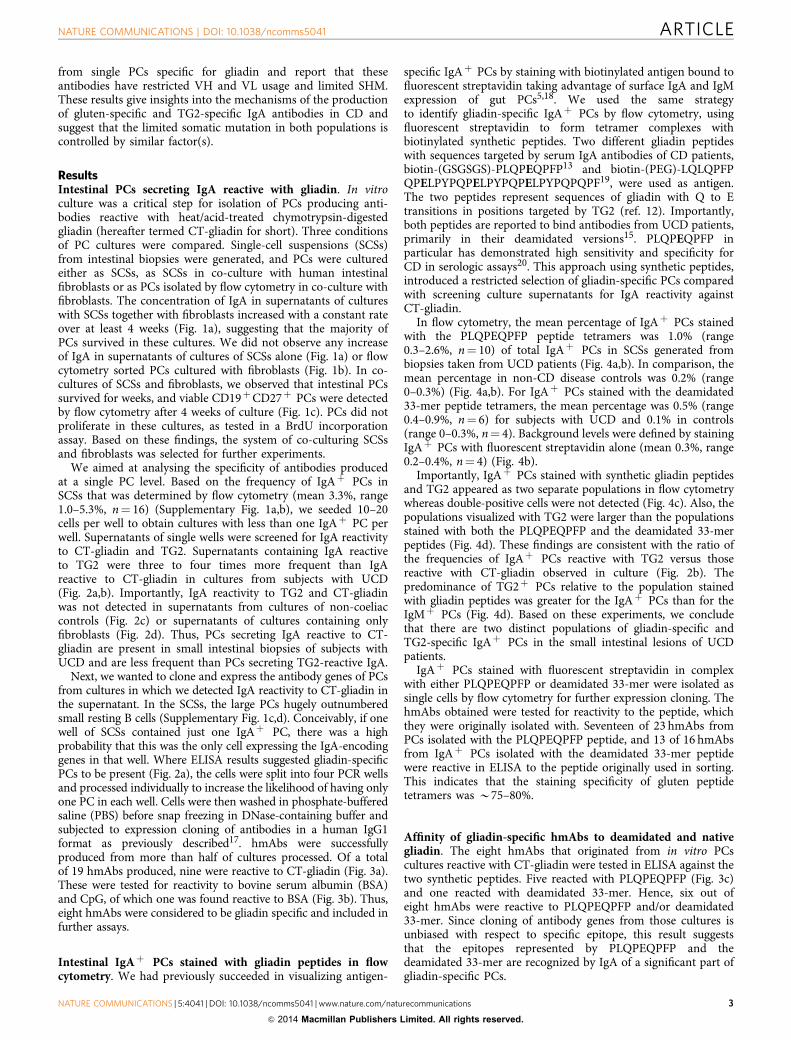
We aimed at analysing the specificity of antibodies producedat a single PC level. Based on the frequency of IgAþ PCs inSCSs that was determined by flow cytometry (mean 3.3%, range1.0–5.3%, n¼ 16) (Supplementary Fig. 1a,b), we seeded 10–20cells per well to obtain cultures with less than one IgAþ PC perwell. Supernatants of single wells were screened for IgA reactivityto CT-gliadin and TG2. Supernatants containing IgA reactiveto TG2 were three to four times more frequent than IgAreactive to CT-gliadin in cultures from subjects with UCD(Fig. 2a,b). Importantly, IgA reactivity to TG2 and CT-gliadinwas not detected in supernatants from cultures of non-coeliaccontrols (Fig. 2c) or supernatants of cultures containing onlyfibroblasts (Fig. 2d). Thus, PCs secreting IgA reactive to CT-gliadin are present in small intestinal biopsies of subjects withUCD and are less frequent than PCs secreting TG2-reactive IgA.
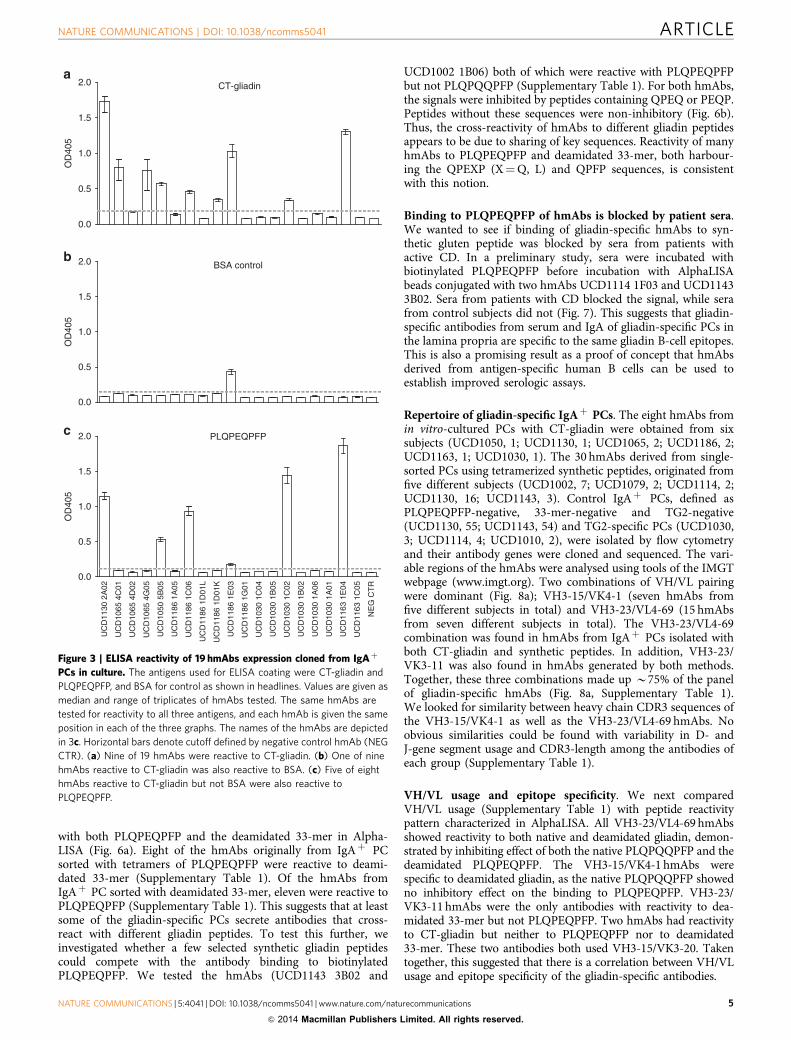
Next, we wanted to clone and express the antibody genes of PCsfrom cultures in which we detected IgA reactivity to CT-gliadin inthe supernatant. In the SCSs, the large PCs hugely outnumberedsmall resting B cells (Supplementary Fig. 1c,d). Conceivably, if onewell of SCSs contained just one IgAþ PC, there was a highprobability that this was the only cell expressing the IgA-encodinggenes in that well. Where ELISA results suggested gliadin-specificPCs to be present (Fig. 2a), the cells were split into four PCR wellsand processed individually to increase the likelihood of having onlyone PC in each well. Cells were then washed in phosphate-bufferedsaline (PBS) before snap freezing in DNase-containing buffer andsubjected to expression cloning of antibodies in a human IgG1format as previously described17. hmAbs were successfullyproduced from more than half of cultures processed. Of a totalof 19 hmAbs produced, nine were reactive to CT-gliadin (Fig. 3a).These were tested for reactivity to bovine serum albumin (BSA)and CpG, of which one was found reactive to BSA (Fig. 3b). Thus,eight hmAbs were considered to be gliadin specific and included infurther assays.
Intestinal IgAþ PCs stained with gliadin peptides in flowcytometry. We had previously succeeded in visualizing antigen-
specific IgAþ PCs by staining with biotinylated antigen bound tofluorescent streptavidin taking advantage of surface IgA and IgMexpression of gut PCs5,18. We used the same strategyto identify gliadin-specific IgAþ PCs by flow cytometry, usingfluorescent streptavidin to form tetramer complexes withbiotinylated synthetic peptides. Two different gliadin peptideswith sequences targeted by serum IgA antibodies of CD patients,biotin-(GSGSGS)-PLQPEQPFP13 and biotin-(PEG)-LQLQPFPQPELPYPQPELPYPQPELPYPQPQPF19, were used as antigen.The two peptides represent sequences of gliadin with Q to Etransitions in positions targeted by TG2 (ref. 12). Importantly,both peptides are reported to bind antibodies from UCD patients,primarily in their deamidated versions15. PLQPEQPFP inparticular has demonstrated high sensitivity and specificity forCD in serologic assays20. This approach using synthetic peptides,introduced a restricted selection of gliadin-specific PCs comparedwith screening culture supernatants for IgA reactivity againstCT-gliadin.
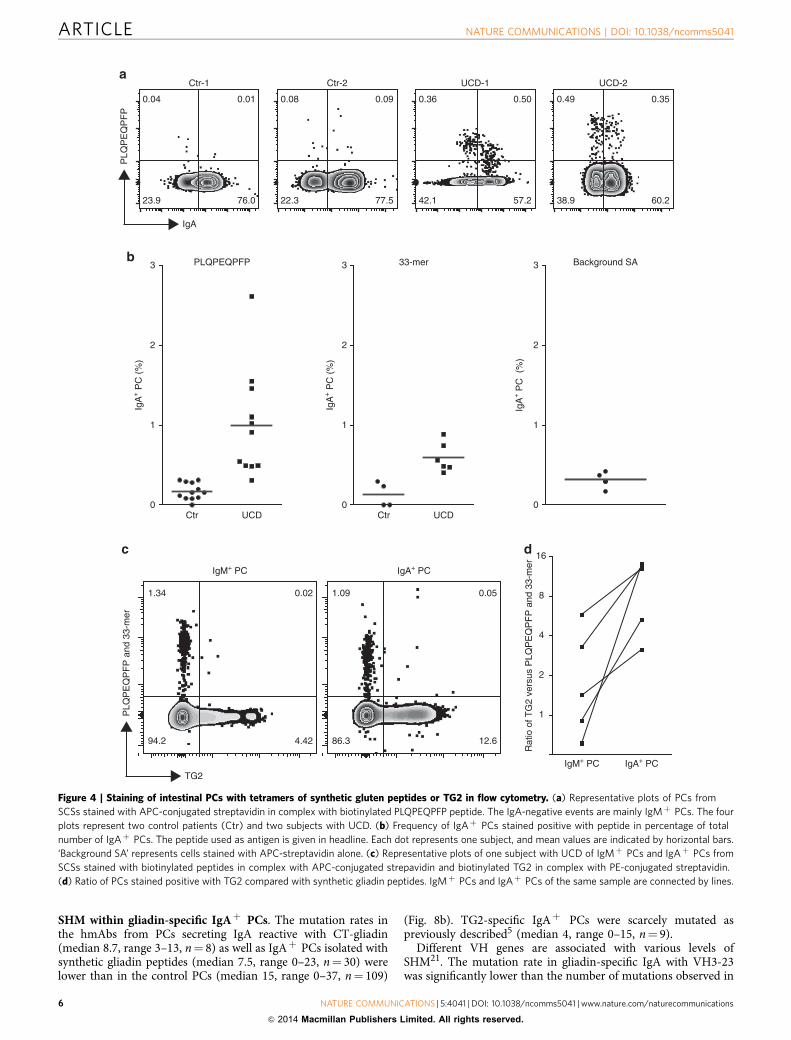
In flow cytometry, the mean percentage of IgAþ PCs stainedwith the PLQPEQPFP peptide tetramers was 1.0% (range0.3–2.6%, n¼ 10) of total IgAþ PCs in SCSs generated frombiopsies taken from UCD patients (Fig. 4a,b). In comparison, themean percentage in non-CD disease controls was 0.2% (range0–0.3%) (Fig. 4a,b). For IgAþ PCs stained with the deamidated33-mer peptide tetramers, the mean percentage was 0.5% (range0.4–0.9%, n¼ 6) for subjects with UCD and 0.1% in controls(range 0–0.3%, n¼ 4). Background levels were defined by stainingIgAþ PCs with fluorescent streptavidin alone (mean 0.3%, range0.2–0.4%, n¼ 4) (Fig. 4b).
Importantly, IgAþ PCs stained with synthetic gliadin peptidesand TG2 appeared as two separate populations in flow cytometrywhereas double-positive cells were not detected (Fig. 4c). Also, thepopulations visualized with TG2 were larger than the populationsstained with both the PLQPEQPFP and the deamidated 33-merpeptides (Fig. 4d). These findings are consistent with the ratio ofthe frequencies of IgAþ PCs reactive with TG2 versus thosereactive with CT-gliadin observed in culture (Fig. 2b). Thepredominance of TG2þ PCs relative to the population stainedwith gliadin peptides was greater for the IgAþ PCs than for theIgMþ PCs (Fig. 4d). Based on these experiments, we concludethat there are two distinct populations of gliadin-specific andTG2-specific IgAþ PCs in the small intestinal lesions of UCDpatients.
IgAþ PCs stained with fluorescent streptavidin in complexwith either PLQPEQPFP or deamidated 33-mer were isolated assingle cells by flow cytometry for further expression cloning. ThehmAbs obtained were tested for reactivity to the peptide, whichthey were originally isolated with. Seventeen of 23 hmAbs fromPCs isolated with the PLQPEQPFP peptide, and 13 of 16 hmAbsfrom IgAþ PCs isolated with the deamidated 33-mer peptidewere reactive in ELISA to the peptide originally used in sorting.This indicates that the staining specificity of gluten peptidetetramers was B75–80%.
Affinity of gliadin-specific hmAbs to deamidated and nativegliadin. The eight hmAbs that originated from in vitro PCscultures reactive with CT-gliadin were tested in ELISA against thetwo synthetic peptides. Five reacted with PLQPEQPFP (Fig. 3c)and one reacted with deamidated 33-mer. Hence, six out ofeight hmAbs were reactive to PLQPEQPFP and/or deamidated33-mer. Since cloning of antibody genes from those cultures isunbiased with respect to specific epitope, this result suggeststhat the epitopes represented by PLQPEQPFP and thedeamidated 33-mer are recognized by IgA of a significant part ofgliadin-specific PCs.
NATURE COMMUNICATIONS | DOI: 10.1038/ncomms5041 ARTICLE
NATURE COMMUNICATIONS | 5:4041 | DOI: 10.1038/ncomms5041 | www.nature.com/naturecommunications 3
& 2014 Macmillan Publishers Limited. All rights reserved.
The specificity of all hmAbs reactive to one of the two syntheticpeptides in ELISA was further characterized in AlphaLISA. Incontrast to ELISA, where synthetic peptide was used as a coatingantigen, the AlphaLISA format detected monovalent binding ofhmAbs to soluble biotinylated synthetic peptide. Three of thehmAbs (UCD1002 1D03, UCD1143 1E01, UCD1130 4A04),originally from IgAþ PC sorted with tetramers of PLQPEQPFPand reactive to PLQPEQPFP in ELISA, were not reactive inAlphaLISA. One of the hmAbs (UCD1130 3B04) from IgAþ PCsorted with 33-mer and reactive to deamidated 33-mer in ELISAwas not reactive in AlphaLISA. These four antibodies, notreactive in AlphaLISA, gave the lowest signals in the peptide-based ELISA and with signals that were lower than to the CT-gliadin antigen (Supplementary Fig. 2), suggesting that thesynthetic peptides may not represent the complete epitope(s) ofthese four antibodies.
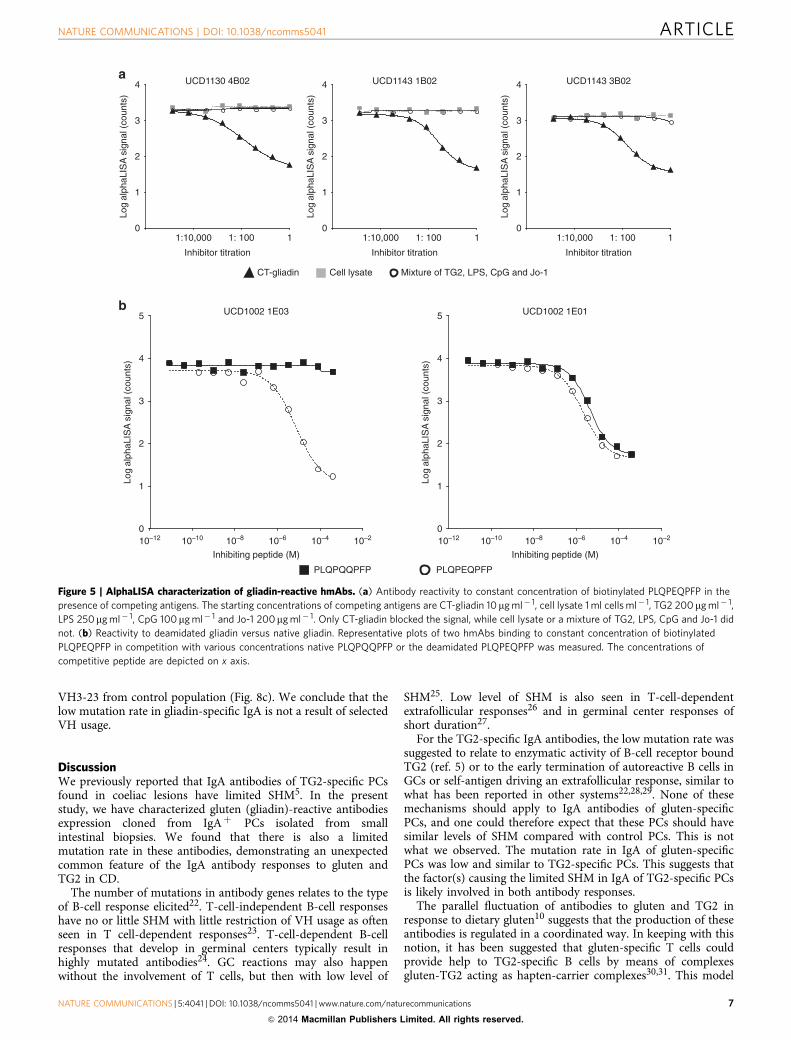
Polyreactivity was assessed by using cell lysate as well as amixture of Jo-1, TG2, CpG and LPS as competing antigens. Ineither case, the binding of hmAbs to the synthetic peptides was
maintained (Fig. 5a). In contrast, the signal was blocked byCT-gliadin (Fig. 5a). We conclude that the hmAbs reactive toPLQPEQPFP or deamidated 33-mer are specific to gliadin andnot polyreactive.
The reactivity of hmAbs to deamidated versus native gliadinwas tested in a competitive AlphaLISA assay. Binding of hmAbsto biotinylated synthetic deamidated gliadin peptide (eitherPLQPEQPFP or the deamidated 33-mer) was tested against thehomologous peptide in either deamidated or native (non-deamidated) versions. Gliadin-specific hmAbs divided into twogroups, either only reactive to deamidated gliadin or reactive withboth deamidated and native gliadin (Fig. 5b). None of the hmAbshad higher reactivity to native than to deamidated gliadin.Because some of the hmAbs were not reactive to the nativegliadin peptide, this suggests that induction of gliadin-specific Bcells in vivo likely happens in the presence of deamidated gliadin.
Gliadin-specific hmAbs bind gliadin peptides with sharedsequences. We observed that some of the hmAbs were reactive
0.8
0.4
0.2
0.0
0.6
OD
405
OD
405
0.6
0.0
0.2
0.4
0.8
OD
405
0.6
0.2
0.4
0.8
0.4
0.2
0.0
0.6
OD
405
OD
405
0.6
0.0
0.2
0.4
0.8 Ctr 20 cells per wellCT-gliadin IgA
Ctr 20 (left) or 80 (right) cells per wellTG2 IgA
Ctr 80 cells per wellCT-gliadin IgA
Background: only fibroblastsCT-gliadin IgA
c
d
Rat
io o
f TG
2 ve
rsus
CT-
glia
din
0
2
8
4
OD
405
0.6
0.0
0.2
0.4
0.8
OD
405
0.6
0.0
0.2
0.4
0.8
0.8
0.4
0.2
0.0
0.6
OD
405
0.8
0.4
0.2
0.0
0.6
OD
405
UCD 80 cells per wellTG2 IgA
UCD 20 cells per wellTG2 IgA
UCD 80 cells per wellCT-gliadin IgA
UCD 20 cells per wellCT-gliadin IgA
a b
Figure 2 | Supernatant reactivity to CT-gliadin and TG2 by ELISA. IgA reactivity to antigen in representative cultures of SCSs from (a) subjects with
UCD. (b) The ratio of culture supernatants with IgA reactivity to TG2 versus CT-gliadin, where the dots represent different subjects with UCD (n¼ 8).
Horizontal bar indicates mean value. (c) IgA reactivity to antigen in one representative of two tested non-CD controls (Ctr). (d) The background level
was defined by signal in supernatants of cultures of fibroblasts only. In the headline are shown the number of cells of SCSs per culture well and antigen
used as coating antigen in ELISA. Each column represents one well.
ARTICLE NATURE COMMUNICATIONS | DOI: 10.1038/ncomms5041
4 NATURE COMMUNICATIONS | 5:4041 | DOI: 10.1038/ncomms5041 | www.nature.com/naturecommunications
& 2014 Macmillan Publishers Limited. All rights reserved.
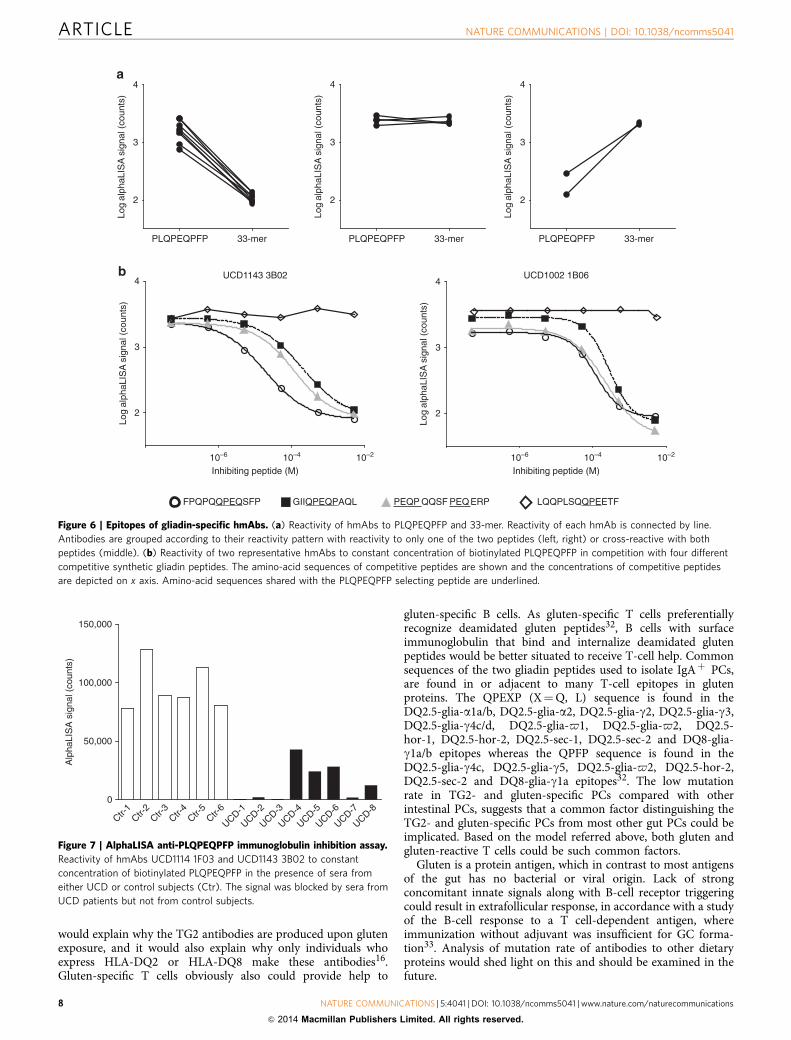
with both PLQPEQPFP and the deamidated 33-mer in Alpha-LISA (Fig. 6a). Eight of the hmAbs originally from IgAþ PCsorted with tetramers of PLQPEQPFP were reactive to deami-dated 33-mer (Supplementary Table 1). Of the hmAbs fromIgAþ PC sorted with deamidated 33-mer, eleven were reactive toPLQPEQPFP (Supplementary Table 1). This suggests that at leastsome of the gliadin-specific PCs secrete antibodies that cross-react with different gliadin peptides. To test this further, weinvestigated whether a few selected synthetic gliadin peptidescould compete with the antibody binding to biotinylatedPLQPEQPFP. We tested the hmAbs (UCD1143 3B02 and
UCD1002 1B06) both of which were reactive with PLQPEQPFPbut not PLQPQQPFP (Supplementary Table 1). For both hmAbs,the signals were inhibited by peptides containing QPEQ or PEQP.Peptides without these sequences were non-inhibitory (Fig. 6b).Thus, the cross-reactivity of hmAbs to different gliadin peptidesappears to be due to sharing of key sequences. Reactivity of manyhmAbs to PLQPEQPFP and deamidated 33-mer, both harbour-ing the QPEXP (X¼Q, L) and QPFP sequences, is consistentwith this notion.
Binding to PLQPEQPFP of hmAbs is blocked by patient sera.We wanted to see if binding of gliadin-specific hmAbs to syn-thetic gluten peptide was blocked by sera from patients withactive CD. In a preliminary study, sera were incubated withbiotinylated PLQPEQPFP before incubation with AlphaLISAbeads conjugated with two hmAbs UCD1114 1F03 and UCD11433B02. Sera from patients with CD blocked the signal, while serafrom control subjects did not (Fig. 7). This suggests that gliadin-specific antibodies from serum and IgA of gliadin-specific PCs inthe lamina propria are specific to the same gliadin B-cell epitopes.This is also a promising result as a proof of concept that hmAbsderived from antigen-specific human B cells can be used toestablish improved serologic assays.
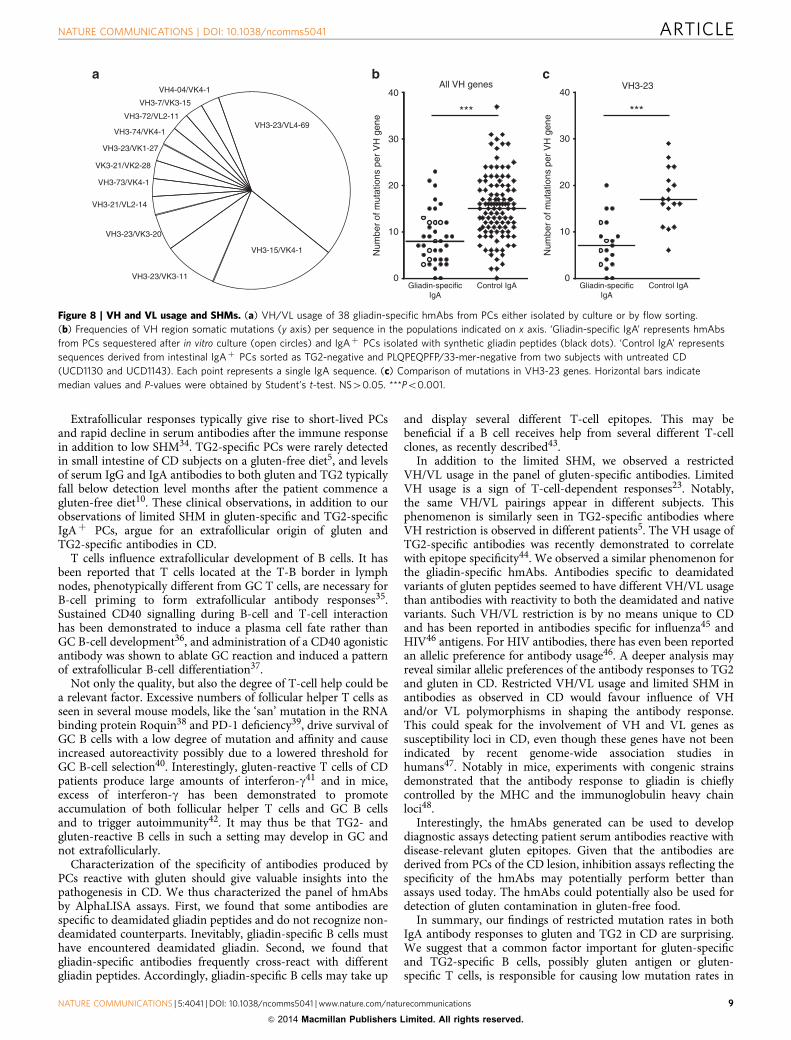
Repertoire of gliadin-specific IgAþ PCs. The eight hmAbs fromin vitro-cultured PCs with CT-gliadin were obtained from sixsubjects (UCD1050, 1; UCD1130, 1; UCD1065, 2; UCD1186, 2;UCD1163, 1; UCD1030, 1). The 30 hmAbs derived from single-sorted PCs using tetramerized synthetic peptides, originated fromfive different subjects (UCD1002, 7; UCD1079, 2; UCD1114, 2;UCD1130, 16; UCD1143, 3). Control IgAþ PCs, defined asPLQPEQPFP-negative, 33-mer-negative and TG2-negative(UCD1130, 55; UCD1143, 54) and TG2-specific PCs (UCD1030,3; UCD1114, 4; UCD1010, 2), were isolated by flow cytometryand their antibody genes were cloned and sequenced. The vari-able regions of the hmAbs were analysed using tools of the IMGTwebpage (www.imgt.org). Two combinations of VH/VL pairingwere dominant (Fig. 8a); VH3-15/VK4-1 (seven hmAbs fromfive different subjects in total) and VH3-23/VL4-69 (15 hmAbsfrom seven different subjects in total). The VH3-23/VL4-69combination was found in hmAbs from IgAþ PCs isolated withboth CT-gliadin and synthetic peptides. In addition, VH3-23/VK3-11 was also found in hmAbs generated by both methods.Together, these three combinations made up B75% of the panelof gliadin-specific hmAbs (Fig. 8a, Supplementary Table 1).We looked for similarity between heavy chain CDR3 sequences ofthe VH3-15/VK4-1 as well as the VH3-23/VL4-69 hmAbs. Noobvious similarities could be found with variability in D- andJ-gene segment usage and CDR3-length among the antibodies ofeach group (Supplementary Table 1).
VH/VL usage and epitope specificity. We next comparedVH/VL usage (Supplementary Table 1) with peptide reactivitypattern characterized in AlphaLISA. All VH3-23/VL4-69 hmAbsshowed reactivity to both native and deamidated gliadin, demon-strated by inhibiting effect of both the native PLQPQQPFP and thedeamidated PLQPEQPFP. The VH3-15/VK4-1 hmAbs werespecific to deamidated gliadin, as the native PLQPQQPFP showedno inhibitory effect on the binding to PLQPEQPFP. VH3-23/VK3-11hmAbs were the only antibodies with reactivity to dea-midated 33-mer but not PLQPEQPFP. Two hmAbs had reactivityto CT-gliadin but neither to PLQPEQPFP nor to deamidated33-mer. These two antibodies both used VH3-15/VK3-20. Takentogether, this suggested that there is a correlation between VH/VLusage and epitope specificity of the gliadin-specific antibodies.
BSA control2.0
1.5
1.0
0.5
0.0
OD
405
2.0
1.5
1.0
0.5
0.0
PLQPEQPFP
OD
405
OD
405
2.0
1.5
1.0
0.5
0.0
CT-gliadin
NE
G C
TR
UC
D11
63 1
C05
UC
D11
63 1
E04
UC
D10
30 1
A01
UC
D10
30 1
A06
UC
D10
30 1
B02
UC
D10
30 1
C02
UC
D10
30 1
B05
UC
D10
30 1
C04
UC
D11
86 1
G01
UC
D11
86 1
E03
UC
D11
86 1
D01
K
UC
D11
86 1
D01
L
UC
D11
86 1
C06
UC
D11
86 1
A05
UC
D10
50 5
B05
UC
D10
65 4
G05
UC
D10
65 4
D02
UC
D10
65 4
C01
UC
D11
30 2
A02
a
b
c
Figure 3 | ELISA reactivity of 19 hmAbs expression cloned from IgAþ
PCs in culture. The antigens used for ELISA coating were CT-gliadin and
PLQPEQPFP, and BSA for control as shown in headlines. Values are given as
median and range of triplicates of hmAbs tested. The same hmAbs are
tested for reactivity to all three antigens, and each hmAb is given the same
position in each of the three graphs. The names of the hmAbs are depicted
in 3c. Horizontal bars denote cutoff defined by negative control hmAb (NEG
CTR). (a) Nine of 19 hmAbs were reactive to CT-gliadin. (b) One of nine
hmAbs reactive to CT-gliadin was also reactive to BSA. (c) Five of eight
hmAbs reactive to CT-gliadin but not BSA were also reactive to
PLQPEQPFP.
NATURE COMMUNICATIONS | DOI: 10.1038/ncomms5041 ARTICLE
NATURE COMMUNICATIONS | 5:4041 | DOI: 10.1038/ncomms5041 | www.nature.com/naturecommunications 5
& 2014 Macmillan Publishers Limited. All rights reserved.
SHM within gliadin-specific IgAþ PCs. The mutation rates inthe hmAbs from PCs secreting IgA reactive with CT-gliadin(median 8.7, range 3–13, n¼ 8) as well as IgAþ PCs isolated withsynthetic gliadin peptides (median 7.5, range 0–23, n¼ 30) werelower than in the control PCs (median 15, range 0–37, n¼ 109)
(Fig. 8b). TG2-specific IgAþ PCs were scarcely mutated aspreviously described5 (median 4, range 0–15, n¼ 9).
Different VH genes are associated with various levels ofSHM21. The mutation rate in gliadin-specific IgA with VH3-23was significantly lower than the number of mutations observed in
38.9 60.2
0.350.490.36 0.50
42.1 57.2
0.08 0.09
22.3 77.5
0.04 0.01
23.9 76.0
Ctr-1 Ctr-2 UCD-1 UCD-2
PLQ
PE
QP
FP
IgA
a
3
0
1
2
3
0
1
2
3
0
1
2
PLQPEQPFP 33-mer Background SA
Ctr UCD Ctr UCDIg
A+ P
C (
%)
IgA
+ P
C (
%)
IgA
+ P
C (
%)
b
Rat
io o
f TG
2 ve
rsus
PLQ
PE
QP
FP
and
33-
mer
IgA+ PCIgM+ PC
1
2
4
8
16
1.09 0.05
86.3 12.6
1.34 0.02
94.2 4.42
IgM+ PC IgA+ PC
PLQ
PE
QP
FP
and
33-
mer
TG2
c d
Figure 4 | Staining of intestinal PCs with tetramers of synthetic gluten peptides or TG2 in flow cytometry. (a) Representative plots of PCs from
SCSs stained with APC-conjugated streptavidin in complex with biotinylated PLQPEQPFP peptide. The IgA-negative events are mainly IgMþ PCs. The four
plots represent two control patients (Ctr) and two subjects with UCD. (b) Frequency of IgAþ PCs stained positive with peptide in percentage of total
number of IgAþ PCs. The peptide used as antigen is given in headline. Each dot represents one subject, and mean values are indicated by horizontal bars.
‘Background SA’ represents cells stained with APC-streptavidin alone. (c) Representative plots of one subject with UCD of IgMþ PCs and IgAþ PCs from
SCSs stained with biotinylated peptides in complex with APC-conjugated strepavidin and biotinylated TG2 in complex with PE-conjugated streptavidin.
(d) Ratio of PCs stained positive with TG2 compared with synthetic gliadin peptides. IgMþ PCs and IgAþ PCs of the same sample are connected by lines.
ARTICLE NATURE COMMUNICATIONS | DOI: 10.1038/ncomms5041
6 NATURE COMMUNICATIONS | 5:4041 | DOI: 10.1038/ncomms5041 | www.nature.com/naturecommunications
& 2014 Macmillan Publishers Limited. All rights reserved.
VH3-23 from control population (Fig. 8c). We conclude that thelow mutation rate in gliadin-specific IgA is not a result of selectedVH usage.
DiscussionWe previously reported that IgA antibodies of TG2-specific PCsfound in coeliac lesions have limited SHM5. In the presentstudy, we have characterized gluten (gliadin)-reactive antibodiesexpression cloned from IgAþ PCs isolated from smallintestinal biopsies. We found that there is also a limitedmutation rate in these antibodies, demonstrating an unexpectedcommon feature of the IgA antibody responses to gluten andTG2 in CD.
The number of mutations in antibody genes relates to the typeof B-cell response elicited22. T-cell-independent B-cell responseshave no or little SHM with little restriction of VH usage as oftenseen in T cell-dependent responses23. T-cell-dependent B-cellresponses that develop in germinal centers typically result inhighly mutated antibodies24. GC reactions may also happenwithout the involvement of T cells, but then with low level of
SHM25. Low level of SHM is also seen in T-cell-dependentextrafollicular responses26 and in germinal center responses ofshort duration27.
For the TG2-specific IgA antibodies, the low mutation rate wassuggested to relate to enzymatic activity of B-cell receptor boundTG2 (ref. 5) or to the early termination of autoreactive B cells inGCs or self-antigen driving an extrafollicular response, similar towhat has been reported in other systems22,28,29. None of thesemechanisms should apply to IgA antibodies of gluten-specificPCs, and one could therefore expect that these PCs should havesimilar levels of SHM compared with control PCs. This is notwhat we observed. The mutation rate in IgA of gluten-specificPCs was low and similar to TG2-specific PCs. This suggests thatthe factor(s) causing the limited SHM in IgA of TG2-specific PCsis likely involved in both antibody responses.
The parallel fluctuation of antibodies to gluten and TG2 inresponse to dietary gluten10 suggests that the production of theseantibodies is regulated in a coordinated way. In keeping with thisnotion, it has been suggested that gluten-specific T cells couldprovide help to TG2-specific B cells by means of complexesgluten-TG2 acting as hapten-carrier complexes30,31. This model
10–12 10–10 10–8 10–6 10–4 10–20
1
2
3
4
5 UCD1002 1E01
Log
alph
aLIS
A s
igna
l (co
unts
)
Inhibiting peptide (M)
10–12 10–10 10–8 10–6 10–4 10–2
UCD1002 1E03
Log
alph
aLIS
A s
igna
l (co
unts
)
Inhibiting peptide (M)
0
1
2
3
4
5
PLQPQQPFP PLQPEQPFP
0
1
2
3
4
1: 1001:10,000 1
UCD1130 4B02
Log
alph
aLIS
A s
igna
l (co
unts
)
Inhibitor titration
Log
alph
aLIS
A s
igna
l (co
unts
)
0
1
2
4
3
1: 1001:10,000 1
UCD1143 1B02
Inhibitor titration
0
1
2
3
4
1: 1001:10,000 1
Log
alph
aLIS
A s
igna
l (co
unts
)
UCD1143 3B02
Inhibitor titration
CT-gliadin Cell lysate Mixture of TG2, LPS, CpG and Jo-1
a
b
Figure 5 | AlphaLISA characterization of gliadin-reactive hmAbs. (a) Antibody reactivity to constant concentration of biotinylated PLQPEQPFP in the
presence of competing antigens. The starting concentrations of competing antigens are CT-gliadin 10mgml� 1, cell lysate 1ml cellsml� 1, TG2 200 mgml� 1,
LPS 250mgml� 1, CpG 100 mgml� 1 and Jo-1 200mgml� 1. Only CT-gliadin blocked the signal, while cell lysate or a mixture of TG2, LPS, CpG and Jo-1 did
not. (b) Reactivity to deamidated gliadin versus native gliadin. Representative plots of two hmAbs binding to constant concentration of biotinylated
PLQPEQPFP in competition with various concentrations native PLQPQQPFP or the deamidated PLQPEQPFP was measured. The concentrations of
competitive peptide are depicted on x axis.
NATURE COMMUNICATIONS | DOI: 10.1038/ncomms5041 ARTICLE
NATURE COMMUNICATIONS | 5:4041 | DOI: 10.1038/ncomms5041 | www.nature.com/naturecommunications 7
& 2014 Macmillan Publishers Limited. All rights reserved.
would explain why the TG2 antibodies are produced upon glutenexposure, and it would also explain why only individuals whoexpress HLA-DQ2 or HLA-DQ8 make these antibodies16.Gluten-specific T cells obviously also could provide help to
gluten-specific B cells. As gluten-specific T cells preferentiallyrecognize deamidated gluten peptides32, B cells with surfaceimmunoglobulin that bind and internalize deamidated glutenpeptides would be better situated to receive T-cell help. Commonsequences of the two gliadin peptides used to isolate IgAþ PCs,are found in or adjacent to many T-cell epitopes in glutenproteins. The QPEXP (X¼Q, L) sequence is found in theDQ2.5-glia-a1a/b, DQ2.5-glia-a2, DQ2.5-glia-g2, DQ2.5-glia-g3,DQ2.5-glia-g4c/d, DQ2.5-glia-$1, DQ2.5-glia-$2, DQ2.5-hor-1, DQ2.5-hor-2, DQ2.5-sec-1, DQ2.5-sec-2 and DQ8-glia-g1a/b epitopes whereas the QPFP sequence is found in theDQ2.5-glia-g4c, DQ2.5-glia-g5, DQ2.5-glia-$2, DQ2.5-hor-2,DQ2.5-sec-2 and DQ8-glia-g1a epitopes32. The low mutationrate in TG2- and gluten-specific PCs compared with otherintestinal PCs, suggests that a common factor distinguishing theTG2- and gluten-specific PCs from most other gut PCs could beimplicated. Based on the model referred above, both gluten andgluten-reactive T cells could be such common factors.
Gluten is a protein antigen, which in contrast to most antigensof the gut has no bacterial or viral origin. Lack of strongconcomitant innate signals along with B-cell receptor triggeringcould result in extrafollicular response, in accordance with a studyof the B-cell response to a T cell-dependent antigen, whereimmunization without adjuvant was insufficient for GC forma-tion33. Analysis of mutation rate of antibodies to other dietaryproteins would shed light on this and should be examined in thefuture.
4
2
3
Log
alph
aLIS
A s
igna
l (co
unts
)
33-merPLQPEQPFP
4
2
3
Log
alph
aLIS
A s
igna
l (co
unts
)
33-merPLQPEQPFP
4
2
3
Log
alph
aLIS
A s
igna
l (co
unts
)
33-merPLQPEQPFP
a
FPQPQQPEQSFP GIIQPEQPAQL PEQP QQSF PEQ ERP LQQPLSQQPEETF
Inhibiting peptide (M)
UCD1002 1B064
2
3
Log
alph
aLIS
A s
igna
l (co
unts
)
10–210–6 10–410–210–6 10–4
Inhibiting peptide (M)
UCD1143 3B024
2
3
Log
alph
aLIS
A s
igna
l (co
unts
)
b
Figure 6 | Epitopes of gliadin-specific hmAbs. (a) Reactivity of hmAbs to PLQPEQPFP and 33-mer. Reactivity of each hmAb is connected by line.
Antibodies are grouped according to their reactivity pattern with reactivity to only one of the two peptides (left, right) or cross-reactive with both
peptides (middle). (b) Reactivity of two representative hmAbs to constant concentration of biotinylated PLQPEQPFP in competition with four different
competitive synthetic gliadin peptides. The amino-acid sequences of competitive peptides are shown and the concentrations of competitive peptides
are depicted on x axis. Amino-acid sequences shared with the PLQPEQPFP selecting peptide are underlined.
Alp
haLI
SA
sig
nal (
coun
ts)
150,000
100,000
50,000
0
UCD-8
UCD-7
UCD-6
UCD-5
UCD-4
UCD-3
UCD-2
UCD-1Ctr-
6Ctr-
5Ctr-
4Ctr-
3Ctr-
2Ctr-
1
Figure 7 | AlphaLISA anti-PLQPEQPFP immunoglobulin inhibition assay.
Reactivity of hmAbs UCD1114 1F03 and UCD1143 3B02 to constant
concentration of biotinylated PLQPEQPFP in the presence of sera from
either UCD or control subjects (Ctr). The signal was blocked by sera from
UCD patients but not from control subjects.
ARTICLE NATURE COMMUNICATIONS | DOI: 10.1038/ncomms5041
8 NATURE COMMUNICATIONS | 5:4041 | DOI: 10.1038/ncomms5041 | www.nature.com/naturecommunications
& 2014 Macmillan Publishers Limited. All rights reserved.
Extrafollicular responses typically give rise to short-lived PCsand rapid decline in serum antibodies after the immune responsein addition to low SHM34. TG2-specific PCs were rarely detectedin small intestine of CD subjects on a gluten-free diet5, and levelsof serum IgG and IgA antibodies to both gluten and TG2 typicallyfall below detection level months after the patient commence agluten-free diet10. These clinical observations, in addition to ourobservations of limited SHM in gluten-specific and TG2-specificIgAþ PCs, argue for an extrafollicular origin of gluten andTG2-specific antibodies in CD.
T cells influence extrafollicular development of B cells. It hasbeen reported that T cells located at the T-B border in lymphnodes, phenotypically different from GC T cells, are necessary forB-cell priming to form extrafollicular antibody responses35.Sustained CD40 signalling during B-cell and T-cell interactionhas been demonstrated to induce a plasma cell fate rather thanGC B-cell development36, and administration of a CD40 agonisticantibody was shown to ablate GC reaction and induced a patternof extrafollicular B-cell differentiation37.
Not only the quality, but also the degree of T-cell help could bea relevant factor. Excessive numbers of follicular helper T cells asseen in several mouse models, like the ‘san’ mutation in the RNAbinding protein Roquin38 and PD-1 deficiency39, drive survival ofGC B cells with a low degree of mutation and affinity and causeincreased autoreactivity possibly due to a lowered threshold forGC B-cell selection40. Interestingly, gluten-reactive T cells of CDpatients produce large amounts of interferon-g41 and in mice,excess of interferon-g has been demonstrated to promoteaccumulation of both follicular helper T cells and GC B cellsand to trigger autoimmunity42. It may thus be that TG2- andgluten-reactive B cells in such a setting may develop in GC andnot extrafollicularly.
Characterization of the specificity of antibodies produced byPCs reactive with gluten should give valuable insights into thepathogenesis in CD. We thus characterized the panel of hmAbsby AlphaLISA assays. First, we found that some antibodies arespecific to deamidated gliadin peptides and do not recognize non-deamidated counterparts. Inevitably, gliadin-specific B cells musthave encountered deamidated gliadin. Second, we found thatgliadin-specific antibodies frequently cross-react with differentgliadin peptides. Accordingly, gliadin-specific B cells may take up
and display several different T-cell epitopes. This may bebeneficial if a B cell receives help from several different T-cellclones, as recently described43.
In addition to the limited SHM, we observed a restrictedVH/VL usage in the panel of gluten-specific antibodies. LimitedVH usage is a sign of T-cell-dependent responses23. Notably,the same VH/VL pairings appear in different subjects. Thisphenomenon is similarly seen in TG2-specific antibodies whereVH restriction is observed in different patients5. The VH usage ofTG2-specific antibodies was recently demonstrated to correlatewith epitope specificity44. We observed a similar phenomenon forthe gliadin-specific hmAbs. Antibodies specific to deamidatedvariants of gluten peptides seemed to have different VH/VL usagethan antibodies with reactivity to both the deamidated and nativevariants. Such VH/VL restriction is by no means unique to CDand has been reported in antibodies specific for influenza45 andHIV46 antigens. For HIV antibodies, there has even been reportedan allelic preference for antibody usage46. A deeper analysis mayreveal similar allelic preferences of the antibody responses to TG2and gluten in CD. Restricted VH/VL usage and limited SHM inantibodies as observed in CD would favour influence of VHand/or VL polymorphisms in shaping the antibody response.This could speak for the involvement of VH and VL genes assusceptibility loci in CD, even though these genes have not beenindicated by recent genome-wide association studies inhumans47. Notably in mice, experiments with congenic strainsdemonstrated that the antibody response to gliadin is chieflycontrolled by the MHC and the immunoglobulin heavy chainloci48.
Interestingly, the hmAbs generated can be used to developdiagnostic assays detecting patient serum antibodies reactive withdisease-relevant gluten epitopes. Given that the antibodies arederived from PCs of the CD lesion, inhibition assays reflecting thespecificity of the hmAbs may potentially perform better thanassays used today. The hmAbs could potentially also be used fordetection of gluten contamination in gluten-free food.
In summary, our findings of restricted mutation rates in bothIgA antibody responses to gluten and TG2 in CD are surprising.We suggest that a common factor important for gluten-specificand TG2-specific B cells, possibly gluten antigen or gluten-specific T cells, is responsible for causing low mutation rates in
0
10
20
30
40
Gliadin-specificIgA
Control IgA
VH3-23
Num
ber
of m
utat
ions
per
VH
gen
e ***
0
10
20
30
40
Gliadin-specificIgA
Control IgA
All VH genes
Num
ber
of m
utat
ions
per
VH
gen
e ***VH3-23/VL4-69
VH3-15/VK4-1
VH3-23/VK3-11
VH3-23/VK3-20
VH4-04/VK4-1
VH3-7/VK3-15
VH3-72/VL2-11
VH3-74/VK4-1
VH3-23/VK1-27
VK3-21/VK2-28
VH3-73/VK4-1
VH3-21/VL2-14
a b c
Figure 8 | VH and VL usage and SHMs. (a) VH/VL usage of 38 gliadin-specific hmAbs from PCs either isolated by culture or by flow sorting.
(b) Frequencies of VH region somatic mutations (y axis) per sequence in the populations indicated on x axis. ‘Gliadin-specific IgA’ represents hmAbs
from PCs sequestered after in vitro culture (open circles) and IgAþ PCs isolated with synthetic gliadin peptides (black dots). ‘Control IgA’ represents
sequences derived from intestinal IgAþ PCs sorted as TG2-negative and PLQPEQPFP/33-mer-negative from two subjects with untreated CD
(UCD1130 and UCD1143). Each point represents a single IgA sequence. (c) Comparison of mutations in VH3-23 genes. Horizontal bars indicate
median values and P-values were obtained by Student’s t-test. NS40.05. ***Po0.001.
NATURE COMMUNICATIONS | DOI: 10.1038/ncomms5041 ARTICLE
NATURE COMMUNICATIONS | 5:4041 | DOI: 10.1038/ncomms5041 | www.nature.com/naturecommunications 9
& 2014 Macmillan Publishers Limited. All rights reserved.
the specific IgA antibodies. There is a restricted, but differentusage of VH and VL gene segments, for recognition of gluten andTG2 in CD. The restricted usage raises the possibility that theremight be genetic effects at the immunoglobulin loci for thedevelopment of this disease.
MethodsSubjects. Small intestinal biopsy specimens were obtained from subjects byesophagogastroduodenoscopy and forceps sampling from the duodenum. UCDpatients were referred to endoscopy based on clinical suspicion and positiveserologic test, and diagnosed according to the guidelines of the AmericanGastroenterological Association Institute49. These subjects were still on a gluten-containing diet at the time when biopsies were obtained, that is, when the diseasewas in its active chronic stage. Non-CD controls were appointed to endoscopy,where histopathology and serology negated CD diagnosis. The non-CD controlgroup consisted of seven HLA-DQ2.5þ subjects, three HLA-DQ8þ subjects andfour subjects who were not HLA-typed. All subjects have given written informedconsent. The study was approved by Regional Committees for Medical ResearchEthics South East Norway (S-97201).
Single-cell suspensions. Intestinal biopsies were collected and transported inRPMI 1640 in 50ml tubes on ice. For preparation of SCSs18, the biopsies weretransferred to 15ml tube and resuspended in 2mM EDTA in 2% fetal calf serum(FCS) in PBS. After 30-min rotation at 37 �C, the supernatant was discarded andthe biopsies resuspended in 1mgml� 1 blend collagenase (Sigma, C8051) and50mgml� 1 DNase (Sigma, DN25) in 2% FCS in Dulbecco’s PBS. The biopsies werethen incubated under constant rotation at 37 �C. After 30min, the biopsies weremechanically disrupted with a syringe equipped with a large steel needle. Afteranother 30min constant rotation, a smaller needle was used for the sameprocedure. After 1–2 h, the single-cell suspension was filtered through 40 mM filterinto 50ml tube and centrifuged at 470 g for 7min.
Human intestinal stromal cell line. Human fibroblast cell lines were derived fromsmall intestinal biopsies as previously described50. Biopsies were transferred toflat-bottomed six-well plates and gently disrupted with a scalpel for 15–30 s. Thebiopsies were cultured in 1% penicillin/streptomycin in 10% FCS in RPMI 1640(culture medium) at 37 �C in 5% CO2. Medium was changed every second week.After 5–10 weeks, a dense layer of cells attached to the bottom was detectable in thewells. These cells were detached with 0.05% trypsin-EDTA (Gibco, 25300–054) andtransferred to 25ml culture flasks. Culture medium was changed regularly. In theseflasks, the cell lines typically survived for 6–9 months. One of these cell lines, F1100from subject UCD1100, was used in most of the experiments.
In vitro co-culture of SCSs and fibroblasts. First, fibroblasts were detached from25ml culture flasks and transferred to plates with flat-bottomed wells. After 1 week,cells from SCSs were seeded on confluent layer of fibroblasts. Fibroblasts and SCSswere incubated in culture medium at 37 �C in 5% CO2. Different plate formatswere suited to different experimental settings; 24-well plates were used for BrdUassays and estimation of total IgA production and 384 well plates were used ofsingle PC cultures.
Extraction and preparation of gliadin proteins. Gliadin, the alcohol solublecomponent of gluten, was extracted from wheat flour. Wheat flour (Møllerens550001) 50 g was dissolved in 150ml butanol, vortex mixed and centrifuged at163 g for 5min. The butanol was decanted and the procedure repeated. The wheatflour pellet was dissolved in 350ml 70% ethanol and incubated at RT overnightunder constant stir mixing. Next day, the solution was centrifuged at 650 g for5min, and the supernatant was mixed with 1.5M NaCl in ratio 1:2 and incubatedat 4 �C for 4 h to precipitate the gliadin proteins. After centrifugation at 25,000 g for20min, the supernatant was decanted and the gliadin pellet dissolved in 40ml 8Murea in 0.01M ammonium bicarbonate. This solution was diluted 1:4 to give a finalurea concentration of 2M and incubated with 12–24mg chymotrypsin (CT)overnight at 37 �C under constant stir mixing. Next day, chymotrypsin was heatinactivated at 98 �C for 5min, and the solution was dialyzed (Spectra/PorMembrane MWCO 1,000) overnight and dried in speed vacuum concentrator. Thedigested gliadin was dissolved and incubated in acetic acid pH 1.8 at 95 �C for 1 hto introduce Q to E conversion (deamidation). The final product, heat/acid-treatedchymotrypsin-digested gliadin (CT-gliadin for short), was diluted in distilled H2Oand freeze dried before further usage.
ELISA supernatant IgA reactive with CT-gliadin. ELISA plates (96 well Nunc436014) were coated with 75 ml per well of CT-gliadin 40 mgml� 1 in carbonatebuffer 0.05M pH 9.6 overnight at 4 �C, washed and subsequently blocked with0.5% BSA in PBS and incubated with supernatant from single PC cultures. Anti-human IgA-alkaline phosphatase (Sigma, A9669) 1:3,000 was used as secondaryantibody. Anti-human IgG-alkaline phosphatase (Southern Biotech, 2040-04) at
concentration 1:4,000 was used when testing gliadin-reactive hmAbs. Plateswere developed for B15min with phosphatase substrate (Sigma-Aldrich) andabsorbance was measured at 405 nm.
Isolation of PCs after in vitro culture. Cells from culture wells were transferred toPCR plate and centrifuged at 3,750 g for 5min. Supernatant was decanted, andRNAse-inhibiting RT–PCR catch buffer17 was added, 10ml per well. PCR plate wassealed and stored at -70 �C until single-cell PCR preparation.
Staining antigen-specific PCs from SCSs. Two different biotinylatedsynthetic gliadin peptides were used to stain gliadin-specific PCs from SCSs.Biotin-GSGSGS-PLQPEQPFP and biotin-GSGSGS-LQLQPFPQPELPYPQPELPYPQPELPYPQPQPF were produced by GL Biochem (Shanghai). TG2 was expressedin Sf9 insect cells by Phadia and linked to biotin with Sulfo-NHS-LC-biotin(Pierce) as per the manufacturer’s protocol.
The synthetic peptides were incubated on ice with APC-labelled streptavidin(PhycoLink, PJ27S) and biotinylated TG2 incubated with PE-labelled streptavidin(Invitrogen, S866) at 4:1 molar ratio, in the dark for 1 h. The final tetramerconcentration for staining intestinal PCs was 40 nM in staining buffer containing2% FCS in PBS. PE CD138 1:40 (eBioscience, DL-101), PE-Cy7 CD27 1:50(eBioscience, LG.7F9), Pacific Blue CD19 1:100 (BioLegend, HIB19), PerCP CD31:40 (BD Biosciences, SK7), PerCP CD14 1:40 (BD Biosciences, MfP9), FITC goatanti-human IgA 1:800 (Southern Biotech, 2050-02) were used for staining of SCS.Propidium iodide for exclusion of dead cells was added just before analysis. Threedifferent flow cytometer instruments were used: Facs Aria, LSRII and Fortessa. Theplots in this manuscript (Figs 1 and 3, Supplementary Figs 1 and 2) are from LSRII.PCs appeared as one homogeneous population of large, CD4� and CD14� events,coexpressing CD138 and CD27, and were previously identified as antibodyproducing cells18. CD27 stained with higher intensity and gave a more definedpopulation than CD138. Thus, PCs were defined as large, viable,CD27þCD3�CD14� events.
Cloning and expression of hmAbs. The variable regions of the heavy and lightchain antibody genes of isolated PCs were amplified by RT–PCR and nested PCRusing the same primers as previously described17, cloned into expression vectorsand transfected into a human cell line as IgG1 according to previously establishedprotocol17.
AlphaLISA screening of hmAbs for reactivity to gluten peptides. AlphaLISAAcceptor beads (Perkin Elmer, 6772001) were coupled with polyclonal rabbit anti-human IgG (Dako A0423) and stored at a concentration of 2.5mgml� 1 accordingto the manufacturer’s instructions (as gliadin-specific hmAbs were produced inhuman IgG1 format). Anti-IgG AlphaLISA donor bead solution (1:400) and glia-din-specific hmAbs 1 mgml� 1 in AlphaLISA immunoassay buffer (Perkin Elmer,AL000C) were incubated for 1 h at 4 �C in the dark. After incubation, 15 ml weretransferred to each well in 384 well plates and mixed with 5 ml analyte. The plateswere incubated for 1 h at RT in the dark. AlphaScreen streptavidin donor beadsolution (Perkin Elmer, 6760002B) was diluted 1:200 in AlphaLISA Immunoassaybuffer, and 15ml were added per well before incubation at RT in the dark for30min. The different peptides used in the analyte were the following: biotin-GSGSGS-PLQPEQPFP, PLQPQQPFP, PLQPEQPFP, GIIQPEQPAQL,LQLQPFPQPQLPYPQPQLPYPQPQLPYPQPQPF, FPQPQQPEQSFP,PEQPQQSFPEQERP, LQLQPFPQPELPYPQPELPYPQPELPYPQPQPF,LQQPLSQQPEETF and biotin-GSGSGS-LQLQPFPQPELPYPQPELPYPQPELPYPQPQPF were purchased from GL Biochem, Research Genetics, Neosystems orobtained from Burkhard Fleckenstein.
AlphaLISA Acceptor beads were also coupled to equal amounts of the twogliadin-specific hmAbs UCD1114 1F03 and UCD1143 3B02 and stored atconcentration 2.5mgml� 1. These beads were used to detect biotin-GSGSGS-PLQPEQPFP in the presence of serum (Fig. 7). First, 5 ml biotin-GSGSGS-PLQPEQPFP was incubated with 10 ml serum at RT for 30min. Then, 30 ml ofmixture of AlphaLISA acceptor bead solution (1:600) and Alphascreen donor beadsolution (1:300) in AlphaLISA immunoassay buffer, was added per well. The platewas read after second incubation for 45min at RT in the dark. In pilot experiments,several gliadin-specific hmAbs were tested and gave similar results. The hmAbsUCD1114 1F03 and UCD1143 3B02 were chosen for the final experiments asthey were among the commonly used VH/VL pairs VH3-23/VL4-69 and VH3-15/VK4-1, respectively.
AlphaLISA screening of hmAbs for gliadin specificity. Anti-IgG AlphaLISAdonor bead solution (1:400) and gliadin-specific hmAbs 1 mgml� 1 in AlphaLISAimmunoassay buffer were incubated in 1.5ml tube for 1 h at RT in the dark before15 ml was transferred to each well in 384 well plate. Then 5 ml analyte was added perwell, and the plate subsequently incubated for 30min at RT in the dark. Theanalyte consisted of fixed concentration of 40 nM biotin-GSGSGS-PLQPEQPFPand titrations of either CT-gliadin, lysate of EBV-transfected B cells or a mixture ofLPS (Sigma L-4391), CpG, recombinant TG2 (Phadia) and recombinant Jo-1antigen (Phadia). After 45min incubation at RT in the dark, AlphaScreen
ARTICLE NATURE COMMUNICATIONS | DOI: 10.1038/ncomms5041
10 NATURE COMMUNICATIONS | 5:4041 | DOI: 10.1038/ncomms5041 | www.nature.com/naturecommunications
& 2014 Macmillan Publishers Limited. All rights reserved.
streptavidin donor bead solution was diluted 1:200 in AlphaLISA Immunoassaybuffer and 15 ml added per well. The plate was read after 30min incubation at RT inthe dark.
References1. Green, P. H. & Cellier, C. Celiac disease. New Engl. J. Med. 357, 1731–1743
(2007).2. Sollid, L. M. Coeliac disease: dissecting a complex inflammatory disorder. Nat.
Rev. Immunol. 2, 647–655 (2002).3. Lundin, K. E. et al. Gliadin-specific, HLA-DQ(a1*0501,b1*0201) restricted
T cells isolated from the small intestinal mucosa of celiac disease patients.J. Exp. Med. 178, 187–196 (1993).
4. Lycke, N., Kilander, A., Nilsson, L. A., Tarkowski, A. & Werner, N. Productionof antibodies to gliadin in intestinal mucosa of patients with coeliac disease: astudy at the single cell level. Gut 30, 72–77 (1989).
5. Di Niro, R. et al. High abundance of plasma cells secreting transglutaminase2-specific IgA autoantibodies with limited somatic hypermutation in celiacdisease intestinal lesions. Nat. Med. 18, 441–445 (2012).
6. Rubio-Tapia, A., Hill, I. D., Kelly, C. P., Calderwood, A. H. & Murray, J. A.ACG clinical guidelines: diagnosis and management of celiac disease. Am. J.Gastroenterol. 108, 656–676 (2013).
7. Husby, S. et al. European Society for Pediatric Gastroenterology, Hepatology,and Nutrition guidelines for the diagnosis of coeliac disease. J. Pediatr.Gastroenterol. Nutr. 54, 136–160 (2012).
8. Anderson, R. P. et al. A novel serogenetic approach determines the communityprevalence of celiac disease and informs improved diagnostic pathways. BMCMed. 11, 188 (2013).
9. Rostom, A. et al. The diagnostic accuracy of serologic tests for celiac disease: asystematic review. Gastroenterology 128, S38–S46 (2005).
10. Sulkanen, S. et al. Tissue transglutaminase autoantibody enzyme-linkedimmunosorbent assay in detecting celiac disease. Gastroenterology 115,1322–1328 (1998).
11. Scott, B. B., Goodall, A., Stephenson, P. & Jenkins, D. Small intestinal plasmacells in coeliac disease. Gut 25, 41–46 (1984).
12. Dorum, S. et al. The preferred substrates for transglutaminase 2 in a complexwheat gluten digest are peptide fragments harboring celiac disease T-cellepitopes. PLoS ONE 5, e14056 (2010).
13. Osman, A. A. et al. B cell epitopes of gliadin. Clin. Exp. Immunol. 121, 248–254(2000).
14. Ballew, J. T. et al. Antibody biomarker discovery through in vitro directedevolution of consensus recognition epitopes. Proc. Natl Acad. Sci. USA 110,19330–19335 (2013).
15. Aleanzi, M., Demonte, A. M., Esper, C., Garcilazo, S. & Waggener, M. Celiacdisease: antibody recognition against native and selectively deamidated gliadinpeptides. Clin. Chem. 47, 2023–2028 (2001).
16. Bjorck, S., Brundin, C., Lorinc, E., Lynch, K. F. & Agardh, D. Screening detectsa high proportion of celiac disease in young HLA-genotyped children.J. Pediatr. Gastroenterol. Nutr. 50, 49–53 (2010).
17. Smith, K. et al. Rapid generation of fully human monoclonal antibodies specificto a vaccinating antigen. Nat. Protoc. 4, 372–384 (2009).
18. Di Niro, R. et al. Rapid generation of rotavirus-specific human monoclonalantibodies from small-intestinal mucosa. J. Immunol. 185, 5377–5383 (2010).
19. Bateman, E. A. et al. IgA antibodies of coeliac disease patients recognise adominant T cell epitope of A-gliadin. Gut 53, 1274–1278 (2004).
20. Schwertz, E. et al. Serologic assay based on gliadin-related nonapeptides as ahighly sensitive and specific diagnostic aid in celiac disease. Clin. Chem. 50,2370–2375 (2004).
21. Wang, M., Rada, C. & Neuberger, M. S. Altering the spectrum ofimmunoglobulin V gene somatic hypermutation by modifying the active site ofAID. J. Exp. Med. 207, 141–153 (2010).
22. Goodnow, C. C., Vinuesa, C. G., Randall, K. L., Mackay, F. & Brink, R. Controlsystems and decision making for antibody production. Nat. Immunol. 11,681–688 (2010).
23. Maizels, N. & Bothwell, A. The T-cell-independent immune response to thehapten NP uses a large repertoire of heavy chain genes. Cell 43, 715–720 (1985).
24. MacLennan, I. C. Germinal centers. Annu. Rev. Immunol. 12, 117–139 (1994).25. Toellner, K. M. et al. Low-level hypermutation in T cell-independent germinal
centers compared with high mutation rates associated with T cell-dependentgerminal centers. J. Exp. Med. 195, 383–389 (2002).
26. MacLennan, I. C. et al. Extrafollicular antibody responses. Immunol. Rev. 194,8–18 (2003).
27. Takahashi, Y., Dutta, P. R., Cerasoli, D. M. & Kelsoe, G. In situ studies of theprimary immune response to (4-hydroxy-3-nitrophenyl)acetyl. V. Affinitymaturation develops in two stages of clonal selection. J. Exp. Med. 187, 885–895(1998).
28. Chan, T. D. et al. Elimination of germinal-center-derived self-reactive B cells isgoverned by the location and concentration of self-antigen. Immunity 37,893–904 (2012).
29. Herlands, R. A., William, J., Hershberg, U. & Shlomchik, M. J. Anti-chromatinantibodies drive in vivo antigen-specific activation and somatic hypermutationof rheumatoid factor B cells at extrafollicular sites. Eur. J. Immunol. 37,3339–3351 (2007).
30. Maki, M. in: Proceedings of the Sixth International Symposium Coeliac Disease(eds Feighery, C. & O’Farrelly, C.) 246–252 (Oak Tree Press, 1992).
31. Sollid, L. M., Molberg, O., McAdam, S. & Lundin, K. E. Autoantibodies in coeliacdisease: tissue transglutaminase - guilt by association? Gut 41, 851–852 (1997).
32. Sollid, L. M., Qiao, S. W., Anderson, R. P., Gianfrani, C. & Koning, F.Nomenclature and listing of celiac disease relevant gluten T-cell epitopesrestricted by HLA-DQ molecules. Immunogenetics 64, 455–460 (2012).
33. Chappell, C. P., Draves, K. E., Giltiay, N. V. & Clark, E. A. Extrafollicular B cellactivation by marginal zone dendritic cells drives T cell-dependent antibodyresponses. J. Exp. Med. 209, 1825–1840 (2012).
34. Ho, F., Lortan, J. E., MacLennan, I. C. & Khan, M. Distinct short-lived andlong-lived antibody-producing cell populations. Eur. J. Immunol. 16,1297–1301 (1986).
35. Lee, S. K. et al. B cell priming for extrafollicular antibody responses requiresBcl-6 expression by T cells. J. Exp. Med. 208, 1377–1388 (2011).
36. Kishi, Y., Aiba, Y., Higuchi, T., Furukawa, K., Tokuhisa, T., Takemori, T. &Tsubata, T. Augmented antibody response with premature germinal centerregression in CD40L transgenic mice. J Immunol 185, 211–219 (2010).
37. Erickson, L. D. et al. Short-circuiting long-lived humoral immunity by theheightened engagement of CD40. J. Clin. Invest. 109, 613–620 (2002).
38. Yu, D. et al. Roquin represses autoimmunity by limiting inducible T-cellco-stimulator messenger RNA. Nature 450, 299–303 (2007).
39. Kawamoto, S. et al. The inhibitory receptor PD-1 regulates IgA selection andbacterial composition in the gut. Science 336, 485–489 (2012).
40. Pratama, A. & Vinuesa, C. G. Control of TFH cell numbers: why and how?Immunol. Cell. Biol. 92, 40–48 (2014).
41. Nilsen, E. M. et al. Gluten specific, HLA-DQ restricted T cells from coeliacmucosa produce cytokines with Th1 or Th0 profile dominated by interferongamma. Gut 37, 766–776 (1995).
42. Lee, S. K. et al. Interferon-gamma excess leads to pathogenic accumulation offollicular helper T cells and germinal centers. Immunity 37, 880–892 (2012).
43. Shulman, Z. et al. T follicular helper cell dynamics in germinal centers. Science341, 673–677 (2013).
44. Iversen, R. et al. Transglutaminase 2-specific autoantibodies in celiac diseasetarget clustered, N-terminal epitopes not displayed on the surface of cells.J. Immunol. 190, 5981–5991 (2013).
45. Lingwood, D. et al. Structural and genetic basis for development of broadlyneutralizing influenza antibodies. Nature 489, 566–570 (2012).
46. Wu, X. et al. Focused evolution of HIV-1 neutralizing antibodies revealed bystructures and deep sequencing. Science 333, 1593–1602 (2011).
47. Trynka, G. et al. Dense genotyping identifies and localizes multiple common andrare variant association signals in celiac disease. Nat. Genet. 43, 1193–1201 (2011).
48. Kagnoff, M. F. Two genetic loci control the murine immune response toA-gliadin, a wheat protein that activates coeliac sprue. Nature 296, 158–160(1982).
49. Kagnoff, M. F. AGA Institute Medical Position Statement on the Diagnosis andManagement of Celiac Disease. Gastroenterology 131, 1977–1980 (2006).
50. Roncoroni, L. et al. Isolation and culture of fibroblasts from endoscopicduodenal biopsies of celiac patients. J. Transl. Med. 7, 40 (2009).
AcknowledgementsThis work is supported by the Research Council of Norway, the South-Eastern NorwayRegional Health Authority, the European Research Council (ERC-2010-Ad-268541),the United European Gastroenterology Research Prize (to L.M.S.) and by the NationalInstitutes of Health/National Institute of Allergy and Infectious Diseases (U19AI082724-01, R01 AI76585-03, and HHSN266200500026C) to (P.C.W.). We thankMarie K. Johannesen and Bjørg Simonsen for excellent technical assistance and staff atthe Flow Cytometry Core Facility and the Endocopy Unit at the Oslo UniversityHospital-Rikshospitalet for kind help. We thank Omri Snir and Mats Bemark for criticalreading of the manuscript.
Author contributionsL.M.S. conceived the project, L.M.S. and P.C.W. managed the project, Ø.S., C.J.H.D.,M.H., L.M. and M.S.-F. did the experiments, K.E.A.L. and J.J. provided biologicalmaterial, L.M.S. and Ø.S wrote the manuscript with input from co-authors.
Additional informationSupplementary Information accompanies this paper at http://www.nature.com/naturecommunications
Competing financial interests: Ø.S., L.M.S., C.J.H.D. and P.W. have submitted a patentapplication covering gliadin-specific monoclonal antibodies. The remaining authorsdeclare no competing financial interests.
NATURE COMMUNICATIONS | DOI: 10.1038/ncomms5041 ARTICLE
NATURE COMMUNICATIONS | 5:4041 | DOI: 10.1038/ncomms5041 | www.nature.com/naturecommunications 11
& 2014 Macmillan Publishers Limited. All rights reserved.
Reprints and permission information is available online at http://npg.nature.com/reprintsandpermissions/
How to cite this article: Steinsbø, Ø. et al. Restricted VH/VL usage and limitedmutations in gluten-specific IgA of coeliac disease lesion plasma cells. Nat. Commun.5:4041 doi: 10.1038/ncomms5041 (2014).
This work is licensed under a Creative Commons Attribution 3.0Unported License. The images or other third party material in this
article are included in the article’s Creative Commons license, unless indicated otherwisein the credit line; if the material is not included under the Creative Commons license,users will need to obtain permission from the license holder to reproduce the material.To view a copy of this license, visit http://creativecommons.org/licenses/by/3.0/
ARTICLE NATURE COMMUNICATIONS | DOI: 10.1038/ncomms5041
12 NATURE COMMUNICATIONS | 5:4041 | DOI: 10.1038/ncomms5041 | www.nature.com/naturecommunications
& 2014 Macmillan Publishers Limited. All rights reserved.


![The acidophilic nature of neuronal Golgi impregnation [Acta Histochem 1998].pdf](https://img.pdfslide.net/doc/110x75/6361b8ca2fd302ae64095d7c/the-acidophilic-nature-of-neuronal-golgi-impregnation-acta-histochem-1998pdf.jpg)
