Embed Size (px)
Citation preview
Inês Alexandra Ramalho Coutinho
Mestre em Conservação e Restauro
New insights into 17th and 18th century glass from Portugal: Study and
Preservation
Dissertação para obtenção do Grau de Doutor em Conservação e Restauro do Património
Especialidade em Ciências da Conservação
Orientador: Márcia Vilarigues, Professor Auxiliar, DCR, FCT/UNL
Co-orientadores: Márcia Ventura, Investigadora Post-Doc, DQ, FCT/UNL Teresa Medici, Investigadora, VICARTE, FCT/UNL
Júri:
Presidente: Prof. Doutora Maria Luísa Dias de Carvalho de Sousa Leonardo
Arguente(s): Prof. Doutor Ian Charles Freestone Prof. Doutora Susana Marta Lopes Almeida
Vogais: Prof. Doutor Carlos Alberto Louzeiro de Moura Prof. Doutora Maria de Fátima Duarte de Araújo Prof. Doutora Ana Maria Oliveira Carneiro
Março 2016

New insights into 17th and 18th century glass from Portugal: Study and Preservation
Copyright © Inês Coutinho, Faculdade de Ciências e Tecnologia, Universidade Nova de Lisboa. A Faculdade de Ciências e Tecnologia da Universidade Nova de Lisboa têm o direito, perpétuo e sem limites geográficos, de arquivar e publicar esta dissertação através de exemplares impressos reproduzidos em papel ou de forma digital, ou por qualquer outro meio conhecido ou que venha a ser inventado, e de a divulgar através de repositórios científicos e de admitir a sua cópia e distribuição com objectivos educacionais ou de investigação, não comerciais, desde que seja dado crédito ao autor e editor.

i
ACKNOWLEDGEMENTS
First of all I would like to thank to my supervisors Doctors Márcia Vilarigues, Márcia Ventura and
Teresa Medici. Their knowledge, guidance and friendship made this work easier, and to be developed
with great pleasure!
A very special thanks goes to Luís C. Alves, who was always available to help with the µ-PIXE
analysis. His good mood, and constant availability to help interpret results and to pass his knowledge
(even after the normal working hours!), made possible the task of analysing more than 200 glass
samples.
To Bernard Gratuze, I would like to thank for his kindness and availability to perform the LA-ICP-MS
analysis.
To Professor Jorge Parola I would like to thank for his advices during a fundamental part of my work,
the development of the optical sensor.
I would also like to thank to Professor João Lopes how gave precious help interpreting the statistical
analysis.
I am grateful to the archaeologists Lídia Fernandes and António Valongo, to Professor Helena
Catarino, and to the direction bodies from the archaeological company Crivarque, Mosteiro de Santa
Clara-a-Velha and Mosteiro de São João de Tarouca, who provided access to their glass assemblages,
giving opportunity for this work to be realised.
None of this work would have been possible without the constant support of the staff from VICARTE,
LAQV-REQUIMTE and the Department of Conservation and Restoration from the FCT/UNL, in
particular Cremilde and Ana Maria, who are always available to help with a smile in their faces.
To all my colleagues and friends a huge hug and a huge THANK YOU! In special to Joana Delgado,
Susana Coentro, Andreia Machado, Alexandra Rodrigues, Hélia Marçal, Francisca Pulido Valente,
Andreia Forte and Sandra Dias.
To my family, in special my daughter, my husband, my parents and grandparents, to Vasco and
Telma. Thank you for your constant support, love and friendship.
Thank you to everyone who helped me and made part of this work and was not named here.
This thesis benefited from the English revision from Helen Glanville and Francesca G. Wallis.

ii

iii
To my grandfather, who taught me to always seek knowledge;
To always try harder, never give up, and be better.

iv
v
RESUMO
O vidro encontrado na Península Ibérica e datado do início do período Moderno tem sido alvo de
pouco estudo até à data. O corrente projecto visa o estudo e a caracterização de objectos de vidro que
circularam em território português, combinando para isso análises químicas e estilísticas. Este projecto
tem como objectivo identificar a origem dos objectos de vidro, visando a identificação de vidro de
produção portuguesa.
Foi determinada a composição química de mais de 200 fragmentos de vidro através da técnica
analítica de µ-PIXE (determinado até às dezenas de µg/g). Os resultados obtidos permitiram
seleccionar alguns objectos para alargar a análise aos elementos traço e terras raras (REE) através da
técnica analítica de LA-ICP-MS (determinando até às ng/g). A cor no vidro foi estudada através da
espectroscopia de reflectância de UV-Vis e sempre que se justificou, os esmaltes encontrados foram
estudados através das técnicas de µ-EDXRF e microscopia de µ-Raman.
De todos os objectos analisados, concluiu-se que na sua grande maioria, o vidro datado até ao século
XVII é do tipo silicatado-sodo-cálcico, o que traduz uma tradição vidreira mediterrânica.
De entre as diversas formas estudadas, identificaram-se objectos de estilo veneziano ou façon-de-
Venise e para alguns deles foi confirmada a proveniência veneziana. Para outras formas identificadas
como façon-de-Venise, o estudo da sua composição revelou características que levaram ao
reconhecimento de novos centros de produção façon-de-Venise. Através do estudo do único conjunto
de vidros que contém fragmentos datados do período medieval, foi possível atestar a presença de vidro
veneziano no território Português desde pelo menos o século XIV.
Foram identificados mais objectos apresentando características particulares na sua composição, como
o alto e muito alto teor de alumina, por exemplo, que, tanto quanto se conhece, não encontra paralelo
em nenhum dos centros de produção de vidro conhecidos na Europa. Aliando o estudo das
características estilísticas com a determinação da composição química do vidro, permitiu levar à
identificação de alguns objectos de possível produção portuguesa.
Vários fragmentos de vidro pertencentes a garrafas de vinho foram retirados das escavações
arqueológicas realizadas em Lisboa e foram caracterizados quimicamente. A análise química aos
fragmentos revelou tratar-se de uma composição rica em cálcio e pobre em teores de óxidos alcalinos
(HLLA). Para alguns fragmentos, foi proposta uma proveniência inglesa. Para além da caracterização
química, foi proposta a sistematização da forma da garrafa, uma vez que a forma pode ser um factor
importante na determinação da sua datação.
vi
Uma pequena percentagem de fragmentos foi identificada como tendo composições químicas alcalinas
mistas, composições ricas em potássio, e composições ricas em chumbo. As duas últimas formulações
químicas foram encontradas entre os conjuntos arqueológicos de Lisboa e os objectos com estas
composições foram datados do século XVIII. Estas são evidências de que Portugal seguia as
tendências Europeias em relação ao vidro e a sua composição.
Neste trabalho apresenta-se a primeira caracterização química sistemática do vidro datado do início do
período moderno que circulava em Portugal, trazendo novos dados sobre as trocas comerciais entre
Portugal e os seus países aliados.
Como parte do estudo, e com o intuito de prolongar a sobrevivência destes conjuntos de vidro, foram
desenvolvidos sensores ópticos e de baixo custo para a detecção in situ do ácido fórmico. Este
poluente orgânico é emitido por materiais normalmente utilizados no armazenamento e exposição do
vidro. A detecção atempada da presença deste ácido pode desempenhar um papel importante na
preservação deste valioso património, o vidro.
Palavras-chave: Objectos de Vidro, Início do Período Moderno, Arqueometria, Estudos de
Proveniência, Estratégias de Conservação Preventiva
vii
ABSTRACT
Early Modern glass from the Iberian Peninsula has - so far - seldom been investigated. The project,
combining chemical analysis with a stylistic approach, and focusing on composition and technology,
aims to characterise glass objects circulating in the national territory, in an attempt to identify their
origins and to eventually bring to light a Portuguese centre of glass production.
The chemical composition of more than 200 glass fragments was determined by means of µ-PIXE
down to a level of tens of µg/g. The results obtained allowed one to select some objects to further
extend the analysis to the trace and rare earth elements (REE) down to the ng/g level, through the use
of LA-ICP-MS. Glass colours and natural hues were studied by means of UV-Vis reflectance
spectroscopy and, when necessary, enamels were studied by means of µ-EDXRF and µ- Raman
microscopy.
From all the objects analysed, it was possible to conclude that the great majority of the glass dating
upto the 17th century, is of a soda-lime-silica type, which indicates a Mediterranean tradition.
Venetian or façon-de-Venise shapes were identified, and for some of them a Venetian provenance was
confirmed. For other façon-de-Venise shapes, the composition presented differences that led to the
conclusion that new façon-de-Venise production centres could be recognised. From the only
assemblage containing glass fragments dated to the medieval period, it was possible to attest the
presence of Venetian glass in the Portuguese territory from at least the 14th century.
Additional objects showed particular compositional features, such as high and very high alumina
contents for instance, that, as far as it is known, do not match up with any of the known glass
production centres in Europe. Allying the stylistic characteristics with the glass chemical composition,
allowed one to identify some objects possibly belonging to a Portuguese production.
Several glass fragments belonging to wine bottles were retrieved from archaeological excavations in
Lisbon and were chemically characterised. The chemical analysis revealed an HLLA composition for
all of them. For some of these fragments it was possible to propose an English provenance. Besides
the chemical characterisation, a systematic analysis of the bottle shape was proposed since the shape
can be an important factor in determining its chronology.
A small percentage of the fragments were identified chemically as having mixed-alkali compositions,
potassium-rich glass, and lead glass compositions. The latter two chemical formulations were found
among the assemblages from Lisbon and the objects with these compositions were dated to the 18th
viii
century. These constitute evidence that Portugal followed European tendencies in their glass and its
compositions.
This is the first systematic chemical characterisation of Early Modern glass circulating in Portugal,
providing new insights into trade between Portugal and its trade allies.
As a part of the study, and to prolong the survival of these glass assemblages, simple and low cost
optical sensors were developed for the in situ detection of the organic pollutant formic acid, which is
emitted by materials usually used in storage and in the display of glass. The detection of the presence
of this acid can play an important role in the preservation of this valuable heritage; glass.
Keywords: Glass objects, Early modern period, Archaeometry, Provenance studies, Preventive
Conservation Strategies
Publications
COUTINHO, I., COENTRO, S., MEDICI, T., ALVES & Vilarigues, M. (n.d.) Analysis of medieval glasses from the
archaeological excavation in Beja (Alentejo, Southern Portugal). Journal of Medieval Iberian Studies, July,
2016.dx.doi.org/10.1080/17546559.2016.1205752.
COUTINHO, I., GRATUZE, B., ALVES, L. C., MEDICI T. & VILARIGUES, M. (n.d.) Wine bottles from Lisbon:
archaeometric studies of two archaeological sites dated from the 17th to the 19th century. Archaeometry, in press
COUTINHO, I., MEDICI, T., ALVES, L. C., FERNANDES, L., GRATUZE, B. & VILARIGUES, M. (n.d.) Glass findings
from the Teatro Romano Museum, Lisbon: Historical and chemical approach of an archaeological set from the
Modern period. Revista digitAR, submitted.
COUTINHO, I., MEDICI, T., ALVES, L. C., GRATUZE, B. & VILARIGUES, M. (2016) Provenance studies on façon-
de-Venise glass excavated in Portugal. Journal of Archaeological Science: Reports, 7, p. 437-448.
DOI: 10.1016/j.jasrep.2016.03.019
COUTINHO, I., MEDICI, T., SILVA, R. J. C., GRATUZE, B., CATARINO, H. & LIMA, A. (2016) Gilding on glass: new
evidence from a 17th century flask found in Portugal. Journal of Archaeological Science: Reports. 6. p. 293-301.
DOI: 10.1016/j.jasrep.2016.02.010

ix
COUTINHO, I., VILARIGUES, M., PAROLA, A. J. & VENTURA, M. G. (n.d.) A simple optical detection system for
formic acid based on the immobilization of colorimetric dyes in polymer thin films. Journal of Thin Solid Films,
submitted.
MEDICI, T., COUTINHO, I., ALVES, L.C., GRATUZE, B. & VILARIGUES, M. (n.d.) Looking through Late Medieval
and Early Modern glass in Portugal. Annales of the 20th Congress of the Association Internationale pour
l’Histoire du Verre, 7th-11th September 2015, Fribourg – Romont, Switzerland, in press.
PULIDO VALENTE, F.; COUTINHO, I.; MEDICI, T.; BRAIN, C. & VILARIGUES, M. (2016) A Group of Early English
Lead Crystal Glass Goblets found in Lisbon. Journal of Glass Studies, October.

x
xi
SYMBOLS AND NOTATIONS
µ-EDXRF – micro - Energy dispersive X-ray fluorescence spectroscopy
µ-PIXE – micro - Particle induced X-ray emission
CPU – courtyard from the Universidade de Coimbra
HLLA – High lime low alkali
LA-ICP-MS – Laser ablation inductively coupled plasma mass spectroscopy
LbL – Layer by Layer
LRA – Rua do Arsenal, Lisbon
LTR – Museu do Teatro Romano, Lisbon
n.d. – non-dated
p.c. – personal communication
PAA – poly(acrylic acid)
PEI – poly(ethylenimine)
PEMs – Polyelectrolyte multilayer
PMF – Praça Miguel Fernandes , Beja
REE – Rare earth elements
SCV – Santa Clara-a-Velha Monastery, Coimbra
SJT – São João de Tarouca Monastery
UV – Ultra Violet
Vis – Visible
VOCs – Volatile organic compounds

xii
xiii
CONTENTS INTRODUCTION 1
PART I – NEW INSIGHTS INTO 17TH AND 18TH CENTURY PORTUGUESE GLASS 11
CHAPTER 1 – INTRODUCTION 13
CHAPTER 2 – GLASS: PRODUCTION AND HISTORICAL CONTEXTS 17
2.1 Glass production in Europe during the 17th and 18th centuries 17
2.1.1 Chemical formulations of historical glass 17
2.1.2 A short journey through European glass history during the 17th and 18th centuries 21
2.2 Glass production in Portugal during the 17th and 18th centuries 43
2.2.1 Raw materials employed on Portuguese glass production 52
CHAPTER 3 – PORTUGUESE ARCHAEOLOGICAL GLASS ASSEMBLAGES: STUDYING AND COMPARING 55
3.1 Historical context and description of the archaeological assemblages considered in this work 55
3.1.1 Glass assemblage from Museu do Teatro Romano, Lisbon 55
3.1.2 Glass assemblage from Rua do Arsenal, Lisbon 57
3.1.3 Glass assemblage from Santa Clara-a-Velha Monastery, Coimbra 60
3.1.4 Glass assemblage from Pátio da Universidade de Coimbra 62
3.1.5 Glass assemblage from Praça Miguel Fernandes, Beja 63
3.1.6 Glass assemblage from São João de Tarouca Monastery 64
3.2 Research design and methodology 66
3.2.1 Analytical Methods 68
µ-PIXE 68
LA-ICP-MS 69
µ-EDXRF 71
UV-Vis Reflectance Spectroscopy 71
µ-Raman microscopy 72
3.2.2 Statistical treatment: Chemometrics approach 73
CHAPTER 4 – LOOKING THROUGH GLASS: UNCOVERING RELATIONS 75
4.1 Soda rich glass 76
4.1.1 A small set from the medieval period 82
4.1.2 Venetian and façon-de-Venise glass 87
4.1.3 The Gourds: a shape of Portuguese production? 97
4.1.4 Mould blown objects 101
4.1.5 Gilded objects 109
4.2 HLLA glass 113
4.3 Potassium rich glass 126
4.4 Mixed alkali glass 137
xiv
4.5 Lead glass 141
4.6 Glass colourants and opacifiers 145
4.6.1 Colourants in transparent glass 146
4.6.2 Colourants and opacifiers in enamels 153
4.7 Conclusions 159
PART II - PRESERVATION: SIGHT SENSING 163
CHAPTER 1 – INTRODUCTION TO PART II 165
CHAPTER 2 – SENSOR DEVELOPMENT 173
2.1 Methodology 173
2.1.1 Thin Films 173
2.1.1.1 Sol-Gel thin films 174
2.1.1.2 PEMs thin films assembled trough the LbL method 176
2.1.2 Chemo responsive dyes 178
Acid-base indicators and solvatochromic dyes 179
2.1.2.1 Dye pKa determination in the thin film 181
2.1.3 Sensor development 181
2.1.4 Analytical Methods 183
UV-Vis absorbance spectroscopy 183
SEM 183
2.2 Results and Discussion 184
2.2.1 Matrix selection 184
Sensibility to VOCs 186
Photosensitivity tests 187
2.2.2 Characterisation of PEI/PAA/MR system 188
Reversibility tests 194
Detection and Response time 195
2.3 Conclusions 197
FINAL REMARKS AND FUTURE WORK 199
REFERENCES 211
APPENDICES PART I 225
Appendix I: Tracers to track glass: raw materials employed in glass production. 227
Appendix II: Museu do Teatro Romano (Lisbon) set (LTR) – Objects information, chemical composition, objects catalogue and archaeological drawings catalogue (Catalogue I). 231
Appendix III: Rua do Arsenal (Lisbon) set (LRA) - Objects information, chemical composition, objects catalogue and archaeological drawings catalogue (Catalogue II). 255
Appendix IV: Santa Clara-a-Velha Monastery (Coimbra) set (SCV) - Objects information, chemical composition and objects catalogue (Catalogue III). 277
xv
Appendix V: Courtyard of the Universidade de Coimbra set (CPU) - Objects information, chemical composition and objects catalogue (Catalogue IV). 289
Appendix VI: Praça Miguel Fernandes (Beja) set (PMF) - Objects information, chemical composition and objects catalogue (Catalogue V). 297
Appendix VII: São João de Tarouca Monastery set (SJT) - Objects information, chemical composition and objects catalogue (Catalogue VI).
305
Appendix VIII: µ-PIXE and LA-ICP-MS values obtained for glass reference standards Corning A, Corning B, Corning C and Nist SRM 612. 315
Appendix IX: Classification tree for the soda-rich glass objects. 317
Appendix X Compositions from the literature. 319
Appendix XI: Bottle anatomy scheme. 325
Appendix XII: UV-Vis reflectance spectroscopy spectra for the glass fragments from the studied sets. 327
Appendix XIII: Tables with samples organised by the groups defined within each glass studied set. 351
Appendix XIV: µ-Raman wavenumbers’ assignments 357
APPENDICES PART II 359
Appendix I: Glass degradation mechanisms and its detailed description. 361

xvi
xvii
LIST OF FIGURES
INTRODUCTION
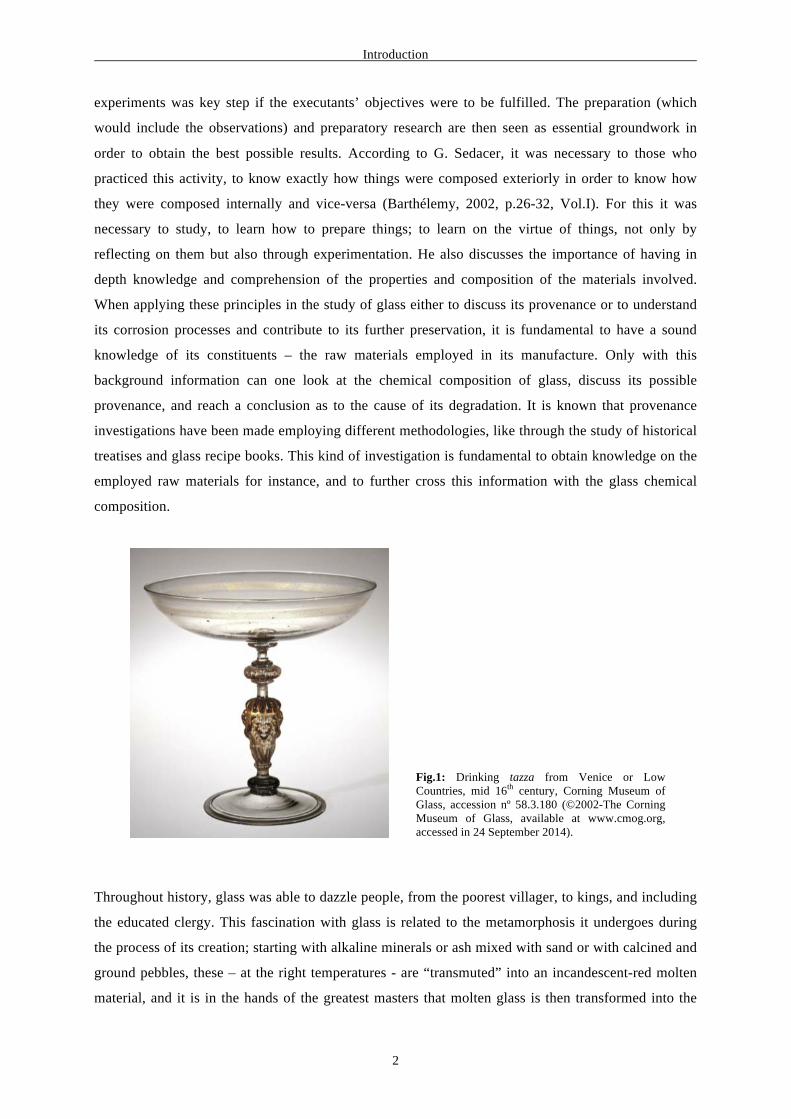
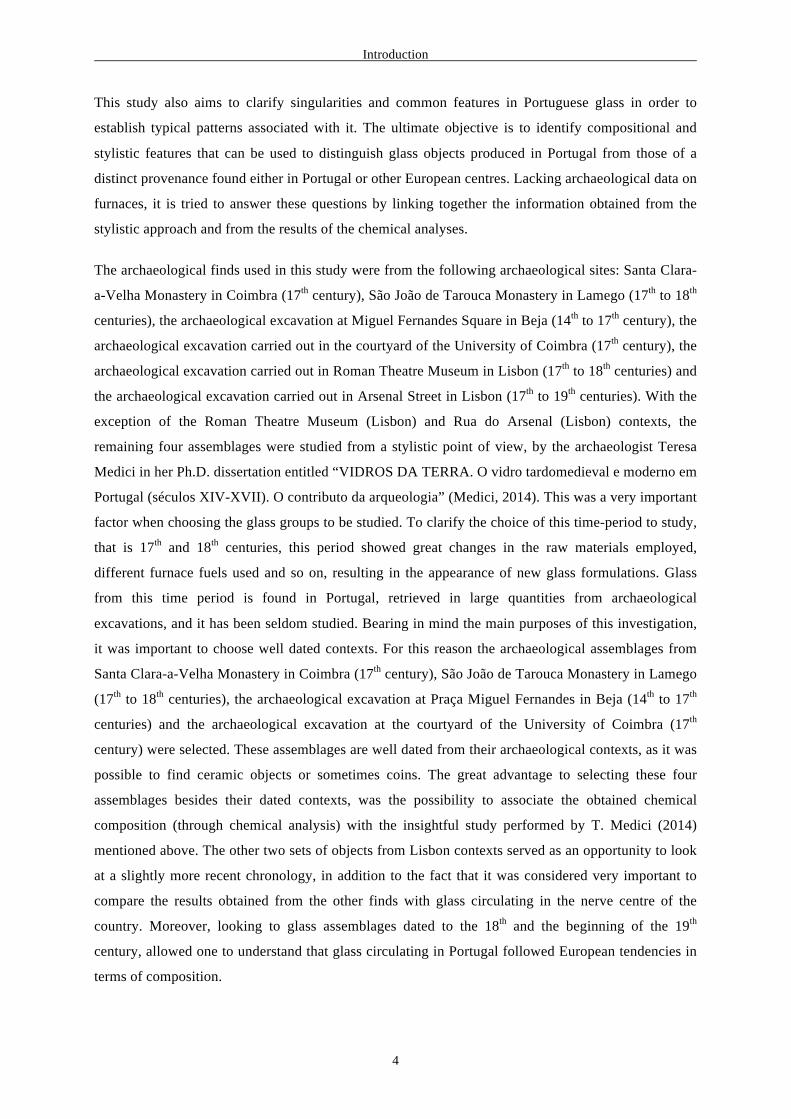
Fig.1: Drinking tazza from Venice or Low Countries, mid 16th century, Corning Museum of Glass, accession nº 58.3.180 (©2002-The Corning Museum of Glass, available at www.cmog.org, accessed in 24 September 2014).
2
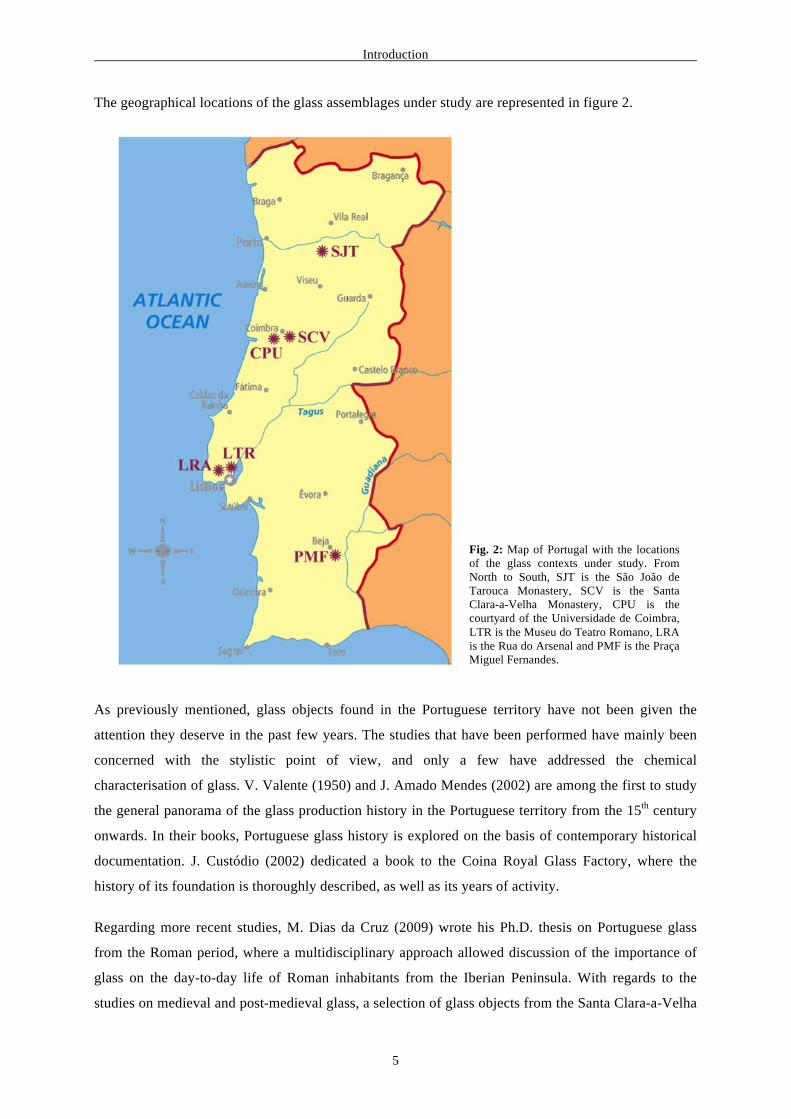
Fig. 2: Map of Portugal with the locations of the glass contexts under study. From North to South, SJT is the São João de Tarouca Monastery, SCV is the Santa Clara-a-Velha Monastery, CPU is the Paço da Universidade de Coimbra, LTR is the Museu do Teatro Romano, LRA is the Rua do Arsenal and PMF is the Praça Miguel Fernandes.
5
PART I – CHAPTER 2
Fig. 2.1: Goblet in cristallo glass, with enameled and gilded decoration. Dated between 1500 and 1525. The Corning Museum of Glass, accession nº 53.3.38 (©Collection of the Corning Museum of Glass, Corning, New York, available in www.cmog.org, accessed in 7 October 2014).
23
Fig. 2.2: Examples of some Venetian creations from the Corning Museum of Glass. (a) Chalcedony ewer, dated between 1500 and 1525. Accession nº 2001.3.56 (©Collection of the Corning Museum of Glass, Corning, New York, gift of Robert and Deborah Truitt); (b) Lattimo glass bowl with enamelled decoration, dated between 1500-1510. Accession nº 76.3.17 (©Collection of the Corning Museum of Glass, Corning, New York, purchased with funds from the Museum Endowment Fund); (c) Goblet with filigree decoration, dated to between 1575 and 1625. Accession nº 77.3.54 (©Collection of the Corning Museum of Glass, Corning, New York gift of Jerome Strauss). All images available in www.cmog.org, accessed in 7 October 2014.
24
Fig. 2.3: Flute with engraved decoration. From the Low Countries, dated about 1640. Accession nº 79.3.252 (©Collection of the Corning Museum of Glass, Corning, New York, bequest of Jerome Strauss). Available at www.cmog.org, accessed in 10 October 2014.
26
Fig. 2.4: Waffle beaker with enamel and gilded decoration. From the Low Countries, dated about 1575-1625. Accession nº 56.3.93. (©Collection of the Corning Museum of Glass, Corning, New York). Available at www.cmog.org, accessed in 10 October 2014.
27
Fig. 2.5: Heavy baluster stem lead glass goblet from English provenance. Dated between 1700 and 1710. Accession nº C.233-1912 (© Victoria and Albert Museum, London, available in http://collections.vam.ac.uk, accessed in 7 October 2014).
29
Fig. 2.6: English glass bottle, with a “shaft and globe” shape. Dated ca. 1650-1660. Accession nº 71.2.5. (©Collection of the Corning Museum of Glass, Corning, New York), available at www.cmog.org, accessed in 22 December 2014.
31
Fig. 2.7: (a) Goblet and lid with cutting and engraving decoration. From Bohemia, dated ca. 1725. Accession nº 27.185.192a, b (©The Metropolitan Museum of Art, available in http://www.metmuseum.org, accessed in 13 October 2014) and (b) Goblet with respective lid. Double glass with gold-sandwich (engraved gold) with cutting decoration. From Bohemian, dated ca. 1730-45. Accession nº355&A-1876 (© Victoria and Albert Museum, London, available at http://collections.vam.ac.uk, accessed in 13 October 2014).
34
Fig. 2.8: Maigelein with mould blown ribbed decoration. Probably from Germany, dated ca. 1500. Accession nº 69.3.14 (©Collection of the Corning Museum of Glass, Corning, New York), available at www.cmog.org, accessed in 14 October 2014.
35
Fig. 2.9: (a) Goblet with lid in ruby glass, with cutting decoration. From Germany, dated between 1725 and 1735. Accession nº 79.3.318 (©Collection of the Corning Museum of Glass, Corning, New York, bequest of Jerome Strauss); (b) Stangengläser with enamel and gilded decoration. From Germany, dated 1573. Accession nº 62.3.65 (©Collection of the Corning Museum of Glass, Corning, New York, gift of Edwin Beinecke). Both images available at www.cmog.org, accessed in 14 October 2014.
36
xviii
Fig. 2.10: Goblet with enamel decoration. French provenance, dated from mid-16th century. Accession nº XXVB96. (© The Wallace Collection, available in http://wallacelive.wallacecollection.org, accessed in 12 October 2014).
38
Fig. 2.11: Goblet with mould-blown decoration. Probably France, dated between 17th and 18th centuries. Accession nº 58.3.174. (©Collection of the Corning Museum of Glass, Corning, New York). Available at www.cmog.org, accessed in 12 October 2014.
38
Fig. 2.12: Goblet with lattimo threads. Spanish origin, probably Catalonia, 17th century. The Corning Museum of Glass, accession nº 66.3.58 (©Collection of the Corning Museum of Glass, Corning, New York, gift of Jerome Strauss). Available in www.cmog.org, accessed in 7 October 2014.
39
Fig. 2.13: Typical Spanish glass objects. (a) Almorratxa, Spanish provenance, Catalonia. Dated from 18th c. Accession nº 53.3.41 (©Collection of the Corning Museum of Glass, Corning, New York); (b) Porrones, Spanish provenance, probably Catalonia. Dated between 1650-1750. Accession nºs 79.3.481 and 79.3.910 (©Collection of the Corning Museum of Glass, Corning, New York, bequest of Jerome Strauss); (c) Càntir, Spanish provenance. Dated from 18th c. Accession nº 79.3.361 (©Collection of the Corning Museum of Glass, Corning, New York, gift of The Ruth Bryan Strauss Memorial Foundation). All images available in www.cmog.org, accessed in 7 October 2014.
40
Fig. 2.14: Map of Portugal with the locations of the reported glass workshops from the 15th to the 19th century (Amado Mendes, 2002).
43
Fig. 2.15: Example of some objects attributed to Portuguese production. (a) Sweet flask, attributed to Côvo manufactory, dated ca. 1650-1700. Accession nº153 Vid / MNAA; (b) Tray with engraved decoration, attributed to Marinha Grande Glass Factory, dated ca. 18th c. Accession nº 22 Vid CMP / MNSR; (c) Polyhedral flask with engraved decoration, attributed to Marinha Grande Glass Factory, dated ca. 1747-1767 (John Beare administration period). Accession nº 314 Vid CMP / MNSR; (d) Polyhedral flask with enamelled decoration, attributed to Coina Glass manufactory, dated ca. 1719-1747. Accession nº 342 Cer / MNSR; (e) Portuguese jug with wheel-engraved and cutting decoration, attributed to Coina or Marinha Grande Glass manufactories. Accession nº 273 Vid CMP / MNSR. (All images from ©IMC, available in http://www.matriznet.dgpc.pt, accessed in 15 October 2014.
46
Fig. 2.16: Engraving of the working area of the Marinha Grande Factory published in 1890 in the Ocidente Portuguese publication (ed. Saraiva, 1983, p.229).
50
PART I – CHAPTER 3
Fig. 3.1: 18th century engraving depicting Côrte-Real Palace before its destruction. Image taken from Biblioteca Digital Nacional oficial site (http://purl.pt/11578/1/).
59
Fig. 3.2: Santa Clara-a-Velha Monastery. Picture taken in 2012. 61
PART I – CHAPTER 4
Fig. 4.1: Charts representing (a) the percentage of different glass compositional types and (b) the percentage of decorative features found among all the glass assemblages studied.
76
Fig. 4.2: Oil lamps. Stained-glass panel from The Great East Window, York Minster, England. Photograph of God in Majesty (15th century), by the York Glaziers Trust (Brown, 2014, p. 78).
77
Fig. 4.3: Oil lamps. Portuguese Painting by Vasco Fernandes and Francisco Henriques, “Apresentação no Templo/ Políptico da Capela-mor da Sé de Viseu”, 1501-1506, Museu Grão Vasco (Grão Vasco Museum), inventory nº 2146 (© IMC available in www.matriznet.imc-ip.pt, accessed in 22 September 2014).
78
xix
Fig. 4.4: Contents of some Rare Earth elements and trace elements normalised to the upper Earth crust (Wedepohl, 1995) for the SCV fragments belonging to Group 2, in logarithmic scale.
80
Fig. 4.5: (a) Binary plot of alumina vs. iron oxide with the defined areas for low, medium, high and very high alumina contents according to Lima et al., 2012, and (b) plot of the weight ratios of Al2O3/SiO2 versus the weight ratio of TiO2/Al2O3.
84
Fig. 4.6: Binary plot of Na2O* vs. K2O*. Na2O* and K2O* values are obtained through the division of the respective oxide by every component introduced by the ash (Na2O, MgO, P2O5, K2O and CaO). The two correlation lines represent the purified ash (Na2O* + K2O* = 0.75) and the unpurified ash ((Na2O* + K2O* = 0.6). It is also possible to observe the Venetian cristallo boundaries, as well as the two vitrum blanchum known areas and the European Barilla area (Cagno et al., 2012b, Šmit et al., 2009).
86
Fig. 4.7: Some examples of façon-de-Venise fragments present in the sets being studied. 88
Fig. 4.8: Scores and loadings on the 1st and 2nd principal components, explaining circa 62% of the total variance, for the façon-de-Venise objects.
89
Fig. 4.9: (a) Al2O3 vs. Fe2O3 with marked zones for the low alumina (LA), medium alumina (MA), high alumina (HA) and very high alumina (VHA) contents according to Lima et al., 2012, and a grey area highlighting the area more concentrated with fragments. ** Millefiori values reported in Lima et al., 2012; (b) Al2O3 vs. TiO2 with boundaries for general Venetian glass and in particular cristallo glass, following published compositions in Verità, 2013, p. 528; (c) Fe2O3 vs. TiO2, all in weight percent of oxides and determined by µ-PIXE.
91
Fig. 4.10: Binary plot of Zr vs. Hf concentrations in µg/g, determined by means of LA-ICP-MS for the SCV façon-de-Venise objects. The grey area represents the general Antwerp façon-de-Venise region, and the dashed-line represents the area for the general Venetian region taken from the literature (De Raedt et al., 2001).
93
Fig. 4.11: Contents of some trace and Rare Earth elements normalised to the upper Earth crust (Wedepohl, 1995) for the Venetian or façon-de-Venise glass objects from the SCV set.
93
Fig. 4.12: Binary plot of Na2O* vs. K2O*. Na2O* and K2O* values are obtained through the division of the respective oxide by every component introduced by the ash (Na2O, MgO, P2O5, K2O and CaO). The two correlation lines represent the purified ash (Na2O* + K2O* = 0.75) and the un-purified ash ((Na2O* + K2O* = 0.6). It is also possible to observe the Venetian cristallo boundaries, as well as the two vitrum blanchum known areas and the European Barilla area (Cagno et al., 2012b, Šmit et al., 2009).
94
Fig. 4.13: Binary plot of CaO in weight percent of oxides vs. SrO in µg/g determined by means of µ-PIXE.
96
Fig. 4.14: Scheme summarising the main characteristics (stylistic and compositional) of the two groups of Venetian and façon-de-Venise objects.
96
Fig. 4.15: Examples of some necks of gourds from SCV and SJT sets. Gourds are organised by resemblance between shapes.
97
Fig. 4.16: Binary plots of (a) alumina vs. titanium oxide, in weight percent of oxides, divided by alumina contents following the division proposed by Lima et al. (2012), and b) alumina vs. iron oxide, both normalized to the silica content. Results measured by µ-PIXE.
98
Fig. 4.17: Contents of some trace and Rare Earth elements normalised to the upper Earth crust for the glass gourds from the SCV set.
99
Fig. 4.18: Binary plot of CaO vs. K2O in weight percent of oxides, measured by µ-PIXE. 101
Fig. 4.19: Four-petalled flower motif. Detail of a Portuguese painting by Gregório Lopes, “A Virgem, o menino e os anjos”, 1536-1539. Museu Nacional de Arte Antiga (National Museum of Ancient Art), inventory nº 30 Pint (© IMC available in www.matriznet.imc-ip.pt, accessed in 21 September 2014).
102

xx
Fig. 4.20: Scores and loadings on the 1st and 2nd principal components, explaining circa 61% of the total variance, for the mould-blown decorated objects.
103
Fig. 4.21: Binary plot of Al2O3 vs. Fe2O3, in weight percent of oxides and determined by means of µ-PIXE for the mould-blown decorated objects.
104
Fig. 4.22: Binary plot of K2O vs. CaO, in weight percent of oxides and determined by means of µ-PIXE for the mould blown decorated objects.
105
Fig. 4.23 Scheme summarising the main characteristics (stylistic and compositional) of the two groups of mould blown decorated objects.
108
Fig. 4.24: µ-EDXRF spectra from a gilded area in comparison with one from undecorated surface and other from bulk glass.
110
Fig. 4.25: Optical microscope observation of a gilded glass sample from the flask CPU0032 in cross-section. The image magnified 50x, was observed under polarized light in order to see the gold leaf/ glass interface.
111
Fig. 4.26: SEM (BSE) image of a cross-section of (a) a gilded area showing folds and wrinkles in the gold rich region and (b) its respective elemental mapping.
111
Fig. 4.27: Some examples of bottles found among the LTR and LRA sets. Fragments are chronologically organised.
113
Fig. 4.28: Scores on the 1st and 2nd principal component for both sets explaining ca. 55% of analysed data.
116
Fig. 4.29: Binary plots of a) K2O vs. P2O5, with a trend line representing the decrease in the use of fresh plant ashes in the glass batch, and b) Na2O vs. SrO with a trend line representing the increase in the use of kelp in the glass batch. Both plots have the concentrations in weight percent of oxides.
118
Fig. 4.30: Representation of samples from Group IHLLA divided by identified sub-groups. Charts represented in a), b) and c) are the major elements pattern from Group IHLLA normalised to the concentration of the continental earth’s crust (Wedepohl, 1995). The chart represented in d) is the trace elements and REE pattern of samples from Group IHLLA analysed by LA-ICP-MS.
120
Fig. 4.31: Chart represented in a) is the major elements pattern from Group IIHLLA normalised to concentration of the continental earth’s crust; and (b) trace elements and REE pattern for samples from Group IIHLLA analysed by LA-ICP-MS.
122
Fig. 4.32: Chart represented in a) is the major elements pattern from Group IIIHLLA normalised to concentrations of the continental earth’s crust; and (b) trace elements and REE pattern for samples from Group IIIHLLA analysed by LA-ICP-MS.
123
Fig. 4.33: Chart represented in a) is the major elements pattern from Group IVHLLA normalised to concentration of the continental earth’s crust; and (b) REE pattern for samples from Group IVHLLA analysed by LA-ICP-MS.
124
Fig. 4.34: Scheme summarising the main characteristics (stylistic and compositional) of the four groups of bottles.
125
Fig. 4.35: Some potassium-rich objects found among the assemblages studied. It is possible to observe mould blown, enamel and engraved decoration.
127
Fig. 4.36: Scores and loadings of the 1st and 2nd principal components, accounting for 50% of the total variance, for the potassium-rich glass objects.
129
Fig. 4.37: Binary plot of Al2O3 vs. Fe2O3, in weight percent of oxides and determined by means of µ-PIXE and LA-ICP-MS for the potassium-rich objects.
130
Fig. 4.38: Binary plot of As2O3/K2O vs. CaO/K2O for the potash-rich objects. 131
Fig. 4.39: Binary plot of CaO vs. SrO, in weight percent of oxides and µg/g and determined by means of µ-PIXE and LA-ICP-MS for the potassium rich objects.
131
xxi
Fig. 4.40: Binary plot of CaO vs. As2O3, in weight percent of oxides and determined by means of µ-PIXE and LA-ICP-MS for the potassium rich objects.
132
Fig. 4.41: Binary plot of variables calculated from the alkaline and alkaline earth oxides concentration for the potassium rich fragments (Kunicki-Goldfinger et al., 2005).
133
Fig. 4.42: Binary plot of K2O vs. CaO concentrations, in weight percent of oxides and determined by means of µ-PIXE and LA-ICP-MS for the potassium rich glass. It is possible to observe mean values (considering the standard deviation) collected from literature and present in Table 4.6 for potassium rich glass.
134
Fig. 4.43: Binary plot of ZrO2 vs. Y2O3 concentrations, in µg/g and determined by means of LA-ICP-MS for some fragments of the potassium rich glass.
134
Fig. 4.44: Contents of some trace elements and Rare Earth elements normalised to the upper Earth crust (Wedepohl, 1995), for the fragments with high arsenic oxide content from the potassium rich glass, in logarithmic scale.
135
Fig. 4.45: Contents of some trace elements and Rare Earth elements normalised to the upper Earth crust for some fragments from the potassium rich glass a) with higher PbO content and (b) two small vessel fragments, both in logarithmic scale.
136
Fig. 4.46: Scheme summarising the main characteristics (stylistic and compositional) of the group of potassium rich objects and also with the main characteristics of the ungrouped potassium rich objects.
137
Fig. 4.47: Binary plot of K2O vs. MgO, in weight percent of oxides, determined by means of µ-PIXE and LA-ICP-MS for the mixed alkali glass.
139
Fig. 4.48: Binary plot of Al2O3 vs. Fe2O3, in weight percent of oxides, determined by means of µ-PIXE and LA-ICP-MS for the mixed-alkali glass.
140
Fig. 4.49: Binary plot of Na2O vs. K2O concentrations, in weight percent of oxides and determined by means of µ-PIXE and LA-ICP-MS for the mixed alkali glass. It is possible to observe mean values (considering the standard deviation) collected from the literature and presented in Table 4.7 for mixed alkali glass.
141
Fig. 4.50: Binary plots of (a) SiO2 vs. PbO concentrations and (b) K2O vs. PbO concentrations, both in weight percent of oxides and determined by means of µ-PIXE and LA-ICP-MS for the lead glass objects.
143
Fig. 4.51: Binary plot of K2O vs. CaO concentrations, in weight percent of oxides and determined by means of µ-PIXE and LA-ICP-MS for the lead glass. Mean values (considering the standard deviation) collected from the literature and presented in Table 4.8 for lead glass are represented.
144
Fig. 4.52: Contents of some trace elements and Rare Earth elements normalised to the upper Earth crust (Wedepohl, 1995) for the two analysed lead glass fragments from the LRA assemblage, measured by LA-ICP-MS, in logarithmic scale.
145
Fig. 4.53: Binary plot of iron vs. manganese oxides. Three visual trend lines are marked on the chart.
146
Fig. 4.54: UV-Vis spectrum of fragment PMF0570 from PMF set, identified as a façon-de-Venise object, and presenting a natural bluish/ greyish hue.
147
Fig. 4.55: UV-Vis spectra of fragments SJT0128 and SJT0131 from the SJT set, presenting a green colouration.
148
Fig. 4.56: UV-Vis spectra of (a) fragment CPU0009 from CPU set presenting a yellow hue and (b) fragment LTR0011 from the LTR set presenting a dark amber colouration.
149
Fig. 4.57: UV-Vis spectrum of fragment SCV-V170 from the SCV set presenting a purple colouration.
150
xxii
Fig. 4.58: UV-Vis spectra of (a) fragment SCV-V210 from the SCV set, (b) fragment SCV-V335 from the SCV set both presenting a turquoise colouration, (c) fragment SCV-V115 from the SCV set and (d) fragment SCV-V14 from the SCV set, both presenting a blue colouration.
151
Fig. 4.59: UV-Vis reflectance spectra of (a) fragment LTR0024 from the LTR set and (b) fragment LRA0072 from the LRA set, both presenting an olive green colouration. UV-Vis reflectance spectra of (c) fragment LRA0091 from the LRA set and (d) fragment LRA0094 from the LRA set, both presenting a black-appearing colouration.
152
Fig. 4.60: Fragment LTR0014 from the LTR set, decorated with polychrome enamels. 153
Fig. 4.61: Fragment LTR0014 white enamel (a) µ-EDXRF spectrum and (b) µ-Raman spectrum. 154
Fig. 4.62: Fragment LTR0014 yellow enamel (a) µ-EDXRF spectrum and (b) µ-Raman spectra where were identified i) bindheimite (Naples Yellow) and ii) a mixture of haematite and magnetite.
155
Fig. 4.63: Fragment LTR0014 blue enamel spectrum by µ-EDXRF. 156
Fig. 4.64: LTR0014 green enamel (a) UV-Vis spectra of green, blue and yellow enamels; (b) µ-EDXRF spectra of green, blue and yellow enamels and (c) µ-Raman spectra where it was identified i) bindheimite (Naples Yellow) and ii) magnetite.
157
Fig. 4.65: LTR0014 red enamel (a) µ-EDXRF spectrum and (b) µ-Raman spectra where were identified i) haematite and ii) magnetite mixed with haematite.
158
Fig. 4.66: LTR0014 black enamel (a) µ-EDXRF spectrum and (b) µ-Raman spectrum where the presence of haematite (α-Fe2O3) was identified.
158
PART II – CHAPTER 2
Fig. 2.1: (a) Simplified scheme of the sol-gel preparation, deposition and heat treatment, followed by (b) the dye encapsulation by the sol-gel matrix.
174
Fig. 2.2: (a) Simplified scheme of the polyelectrolytes alternate deposition, followed by (b) the dye molecules attraction by the polyelectrolytes in the LbL matrix.
176
Fig. 2.3: Molecular structures of a) poly(ethylenimine), b) poly(acrylic acid), c) polystyrene sulfonate, and d) poly(4-vinylpyridine).
178
Fig. 2.4: Obtained sol-gel thin films for the tested dyes. Methyl violet, Methyl yellow and Erythrosine B were in a matrix of 0.5 MTMS + 0.5 TMOS. Congo red was in a matrix of 0.8 TMOS + 0.2 MTMS and Thymol blue was in a matrix of 0.8 + 0.2 PTMS. All dyes were in a concentration of 1%.
184
Fig. 2.5: Absorbance spectra of a) PEI/PAA/EB, b) PEI/PAA/CR when submitted to 1.5 min of exposition to saturated vapours of acetic acid, benzoic acid, citric acid, chloridric acid, formic acid, nitric acid, propionic acid and sulphuric acid and (c) PEI/PAA/MR when submitted to 1.5 min of exposition to saturated vapours of acetic acid, benzoic acid, citric acid, chloridric acid, formic acid, nitric acid, propionic acid, sulphuric acid, acetone, ethanol, commercial lye, methanol, toluene and commercial glass cleaner liquid.
186
Fig. 2.6: Absorbance spectra of a) PEI/PAA/EB, b) PEI/PAA/CR when submitted to 1.5 min of exposition to saturated vapours of acetic acid, benzoic acid, citric acid, chloridric acid, formic acid, nitric acid, propionic acid and sulphuric acid and (c) PEI/PAA/MR when submitted to 1.5 min of exposition to saturated vapours of acetic acid, benzoic acid, citric acid, chloridric acid, formic acid, nitric acid, propionic acid, sulphuric acid, acetone, ethanol, commercial lye, methanol, toluene and commercial glass cleaner liquid.
187
Fig. 2.7: Absorbance spectra of PEI/PAA/EB, PEI/PAA/CR and PEI/PAA/MR before and after 2, 4, 7 days and 5 months of indoor light exposure.
188
Fig. 2.8: Acid and basic form of MR dye. 189
xxiii
Fig. 2.9: Absorbance spectra of PEI/PAA/MR at 550 nm when the number of layers is increased from 2 to 20.
189
Fig. 2.10: Picture of the PEI/PAA/MR system with the respective cross-section SEM image from 2 to 20 layers.
190
Fig. 2.11: Absorbance spectra of the MR sensor (dye in PEMs (PEI/PAA)16 with MR system) compared with the MR dye in aqueous solution when submitted to pH2 and pH9 buffer solutions (normalized spectrum).
191
Fig. 2.12: Spectral evolution of MR sensor when submitted to buffer solutions with different pH values. Absorbance measured at 520nm.
192
Fig. 2.13: Spectral response of (PEI/PAA)16 system when submited to 3 cycles of immersion in buffer solutions with different pH values. Absorbance mesured at 525nm and 440nm.
193
Fig. 2.14: Absorbance spectra of the MR sensor (dye in PEMs PEI/PAA/MR system) when submitted to basic and acid buffer solutions.
194
Fig. 2.15: Reversible behaviour of MR sensor when submitted to a strong acid and a strong base alternatively. Absorbance measured at 427nm.
194
Fig. 2.16: Visual information (photographies) of the several sensors placed inside the desiccators before their exposure (a) and after its 43 days exposure (b). In a blue rectangle appear the sensors that changed its colours after 43 days exposure to the atmosphere created in desiccator 5.
196
Fig. 2.17: Absorbance spectra of a) sensors before the exposure to the desiccators’ atmospheres and b) sensors after the exposure to the desiccators’ atmospheres, where the sensors exposed to the atmosphere in desiccator 5 show a clear chance of colour. Each spectrum is the average of measurements in three different sensors, and all spectra were normalised.
196
CONCLUSIONS AND FUTURE WORK
Fig. 1: Map of Europe showing the presence, in Portuguese territory, of glass objects (full lines) and glass workers (dashed lines). Based in the literature (Amado Mendes, 2002; Custódio, 2002; Medici, 2015; Valente, 1950) and in the new insights from the current investigation.
207
APPENDICES PART I
Fig. I.1: Quartz pebbles from the Ticino River, Italy. 227
Fig. I.2: Flux raw materials. a) Salicornia europaea, as a source for soda-rich ashes, available in http://en.wikipedia.org (GNU Free Documentation License, accessed in 25 September 2014), b) detail of a branch from Salicornia europaea, available in http://ztopics.com (© Jenny Seawright, accessed in 25 September 2014) and c) Fern plants (nephrolepis family), as a source of potassium-rich ashes.
227
Fig. IX.1: Dendrogram of all the soda-rich glass from all assemblages under study. The dendrogram was achieved by the Ward’s method using Euclidian distances. Data was mean centred and normalised.
317
Fig. XI.1: The bottle anatomy. Image withdrawn from (Jones, 1986). 325

xxiv
xxv
LIST OF TABLES
PART I – CHAPTER 2
Table 2.1: Criteria used to distinguish among different types of glass (Cílovà & Woitsch, 2012; Dungworth et al., 2006; Mortimer, 1995; Schalm et al., 2007). 20
Table 2.2: Glassworkers in Portugal from 15th to 18th centuries (Amado Mendes, 2002; Sequeira, n.d.; Valente, 1950). 44
Table 2.3: Furnaces in Portugal from the 16th to the beginning of 20th century (Custódio, 2002, p.51). 45
Table 2.4: Origin and nature of the raw materials employed in the Portuguese glass factories (Custódio, 2002, p.108-112; Valente, 1950, p.30). 53
PART I – CHAPTER 3
Table 3.1: Some metallic ions responsible for glass colouration (Navarro, 2003, p.457; Vilarigues, 2008). 72
PART I – CHAPTER 4
Table 4.1: Division of objects from the sets under study into groups obtained through the classification tree. 79
Table 4.2: Group division by alumina content (Lima et al., 2012). 81 Table 4.3: Summary of the types of bottles, their typology, the glass colour and the number of
samples per archaeological set. 114
PART II – CHAPTER 1
Table 1.1: Formic acid vapours concentration measurements performed on museum environments. 170
PART II – CHAPTER 2
Table 2.1: Chemical formula and structure of the dyes used for this investigation (Sabnis, 2008). 180
Table 2.2: Solutions and respective created atmospheres inside 5 desiccators to test the sensors’ response. 183
Table 2.3: Measured (in acid – neutral range) and literature pKa values of the chosen dyes in aqueous solution and in LbL (PEI/PAA)16 matrix. 185
APPENDICES PART I
Table II.1: Description of analysed samples from Museu do Teatro Romano in Lisbon (LTR) with inventory number, object type, glass colouration, part of the object preserved and dating. 231
Table II. 2: Composition of samples from Museu do Teatro Romano in Lisbon (LTR) determined by µ-PIXE and LA-ICP-MS in weight percent of oxides. 235
Table II.3: REE and trace elements concentration in µg/g for the LTR samples, measured by LA-ICP-MS. 237
Table III.1: Description of analysed samples from Rua do Arsenal in Lisbon (LRA) with inventory number, object type, glass colouration, part of the object preserved and dating. 255
Table III.2: Composition of fragments from Rua do Arsenal in Lisbon (LRA) determined by LA-ICP-MS in weight percent of oxides. 259
xxvi
Table III. 3: REE and trace elements concentration in µg/g for the LRA samples, measured by LA-ICP-MS. 261
Table IV.1: Description of analysed samples from Santa Clara-a-Velha Monastery in Coimbra (SCV) with inventory number, object type, glass colouration, part of the object preserved and dating. 277
Table IV.2: Composition of samples from Santa Clara-a-Velha Monastery in Coimbra (SCV) determined by µ-PIXE, in weight percent of oxides. 281
Table IV.3: REE and trace elements concentration in µg/g for the SCV samples, measured by LA-ICP-MS. 282
Table V.1: Description of analysed samples from Pátio da Universidade in Coimbra (CPU) with inventory number, object type, glass colouration, part of the object preserved and dating 289
Table V.2: Composition of samples Pátio da Universidade in Coimbra (CPU) determined by µ-PIXE in weight percent of oxides. 291
Table VI.1: Description of analysed samples from Praça Miguel Fernandes in Beja (PMF) with inventory number, object type, glass colouration, part of the object preserved and dating. 297
Table VI.2: Composition of samples from Praça Miguel Fernaneds in Beja (PMF) determined by µ-PIXE in weight percent of oxides. 299
Table VII.1: Description of analysed samples from São João de Tarouca Monastery assemblage (SJT) with inventory number, object type, glass colouration, part of the object preserved and dating. 305
Table VII.2: Composition of fragments from São João de Tarouca Monastery (SJT) determined by µ-PIXE in weight percent of oxides. 309
Table VIII.1: µ-PIXE values obtained for the glass standards. Certified (Brill, 1999) and measured composition. 315
Table VIII.2: LA-ICP-MS values obtained for the glass standards. Certified (Wagner et al., 2012) and measured composition. 316
Table X.1: Chemical composition (in average) and standard deviations of Venetian and façon-de-Venise glasses dated to between the 16th and 17th centuries, in weight percent of oxides (Lima et al., 2012).
319
Table X.2: Chemical composition (in average) and standard deviations of HLLA glasses with known provenance and bottles dated between the 16th and 19th centuries, in weight percent of oxides. 320
Table X.3: Chemical composition (in average) and standard deviations of potassium rich glasses dated between the 14th and 18th centuries, in weight percent of oxides. 321
Table X.4: Chemical composition (in average) and standard deviations of mixed alkali glasses dated between the 14th and 18th centuries, in weight percent of oxides. 322
Table X.5: Chemical composition (in average) and standard deviations of lead glasses with known provenance dated between the 17th and 19th centuries, in weight percent of oxides. 323
Table XIII.1: Average of the composition of each façon-de-Venise group defined in the PCA analysis.
351
Table XIII.2: Composition of the gourd shaped vessels. 352
Table XIII.3: Average of the composition of each mould blown decorated group defined in the PCA analysis. 353
Table XIII.4: Average of the composition of each HLLA (wine glass bottles) group defined in the PCA analysis. 354
Table XIII.5: Average of the composition of the potassium rich group defined in the PCA analysis. 355
Table XIV.1: Wavenumbers (cm-1) and assignments of the compounds found in the analysed enamels from fragment LTR0014 (Coentro et al., 2012; Legodi & Waal, 2007). 361
Introduction
1
INTRODUCTION
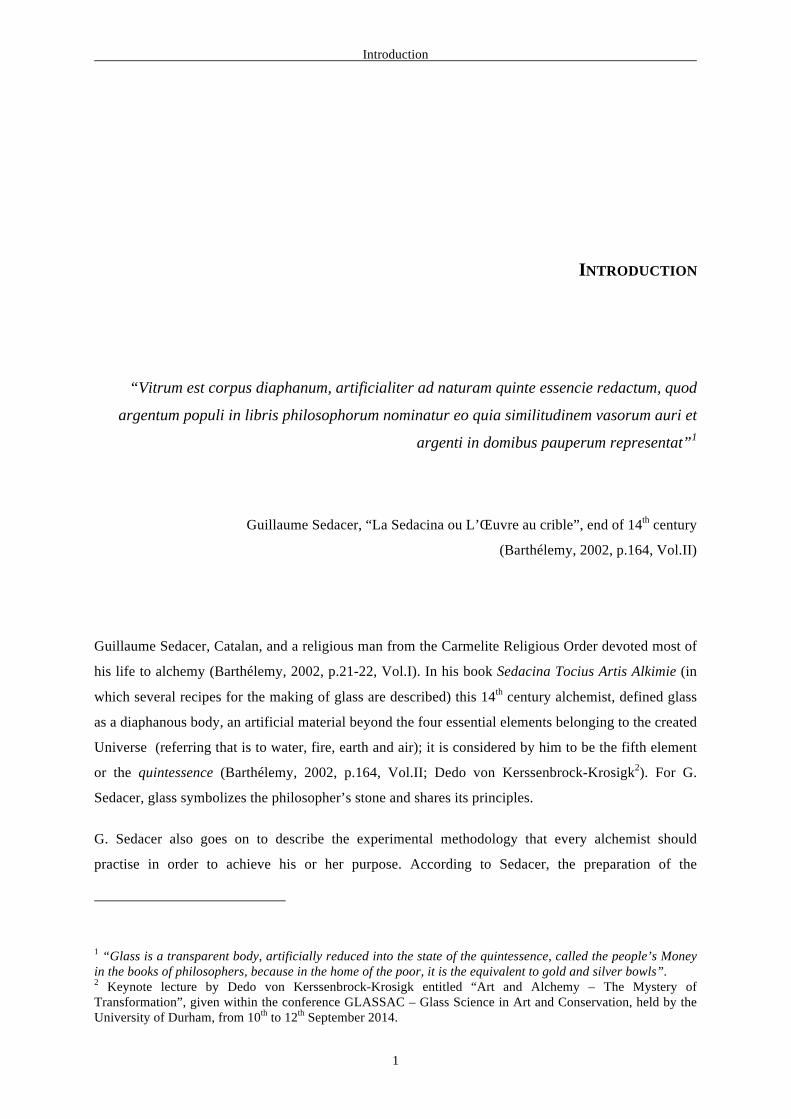
“Vitrum est corpus diaphanum, artificialiter ad naturam quinte essencie redactum, quod
argentum populi in libris philosophorum nominatur eo quia similitudinem vasorum auri et
argenti in domibus pauperum representat”1
Guillaume Sedacer, “La Sedacina ou L’Œuvre au crible”, end of 14th century
(Barthélemy, 2002, p.164, Vol.II)
Guillaume Sedacer, Catalan, and a religious man from the Carmelite Religious Order devoted most of
his life to alchemy (Barthélemy, 2002, p.21-22, Vol.I). In his book Sedacina Tocius Artis Alkimie (in
which several recipes for the making of glass are described) this 14th century alchemist, defined glass
as a diaphanous body, an artificial material beyond the four essential elements belonging to the created
Universe (referring that is to water, fire, earth and air); it is considered by him to be the fifth element
or the quintessence (Barthélemy, 2002, p.164, Vol.II; Dedo von Kerssenbrock-Krosigk2). For G.
Sedacer, glass symbolizes the philosopher’s stone and shares its principles.
G. Sedacer also goes on to describe the experimental methodology that every alchemist should
practise in order to achieve his or her purpose. According to Sedacer, the preparation of the
1 “Glass is a transparent body, artificially reduced into the state of the quintessence, called the people’s Money in the books of philosophers, because in the home of the poor, it is the equivalent to gold and silver bowls”. 2 Keynote lecture by Dedo von Kerssenbrock-Krosigk entitled “Art and Alchemy – The Mystery of Transformation”, given within the conference GLASSAC – Glass Science in Art and Conservation, held by the University of Durham, from 10th to 12th September 2014.
Introduction
2
experiments was key step if the executants’ objectives were to be fulfilled. The preparation (which
would include the observations) and preparatory research are then seen as essential groundwork in
order to obtain the best possible results. According to G. Sedacer, it was necessary to those who
practiced this activity, to know exactly how things were composed exteriorly in order to know how
they were composed internally and vice-versa (Barthélemy, 2002, p.26-32, Vol.I). For this it was
necessary to study, to learn how to prepare things; to learn on the virtue of things, not only by
reflecting on them but also through experimentation. He also discusses the importance of having in
depth knowledge and comprehension of the properties and composition of the materials involved.
When applying these principles in the study of glass either to discuss its provenance or to understand
its corrosion processes and contribute to its further preservation, it is fundamental to have a sound
knowledge of its constituents – the raw materials employed in its manufacture. Only with this
background information can one look at the chemical composition of glass, discuss its possible
provenance, and reach a conclusion as to the cause of its degradation. It is known that provenance
investigations have been made employing different methodologies, like through the study of historical
treatises and glass recipe books. This kind of investigation is fundamental to obtain knowledge on the
employed raw materials for instance, and to further cross this information with the glass chemical
composition.
Fig.1: Drinking tazza from Venice or Low Countries, mid 16th century, Corning Museum of Glass, accession nº 58.3.180 (©2002-The Corning Museum of Glass, available at www.cmog.org, accessed in 24 September 2014).
Throughout history, glass was able to dazzle people, from the poorest villager, to kings, and including
the educated clergy. This fascination with glass is related to the metamorphosis it undergoes during
the process of its creation; starting with alkaline minerals or ash mixed with sand or with calcined and
ground pebbles, these – at the right temperatures - are “transmuted” into an incandescent-red molten
material, and it is in the hands of the greatest masters that molten glass is then transformed into the
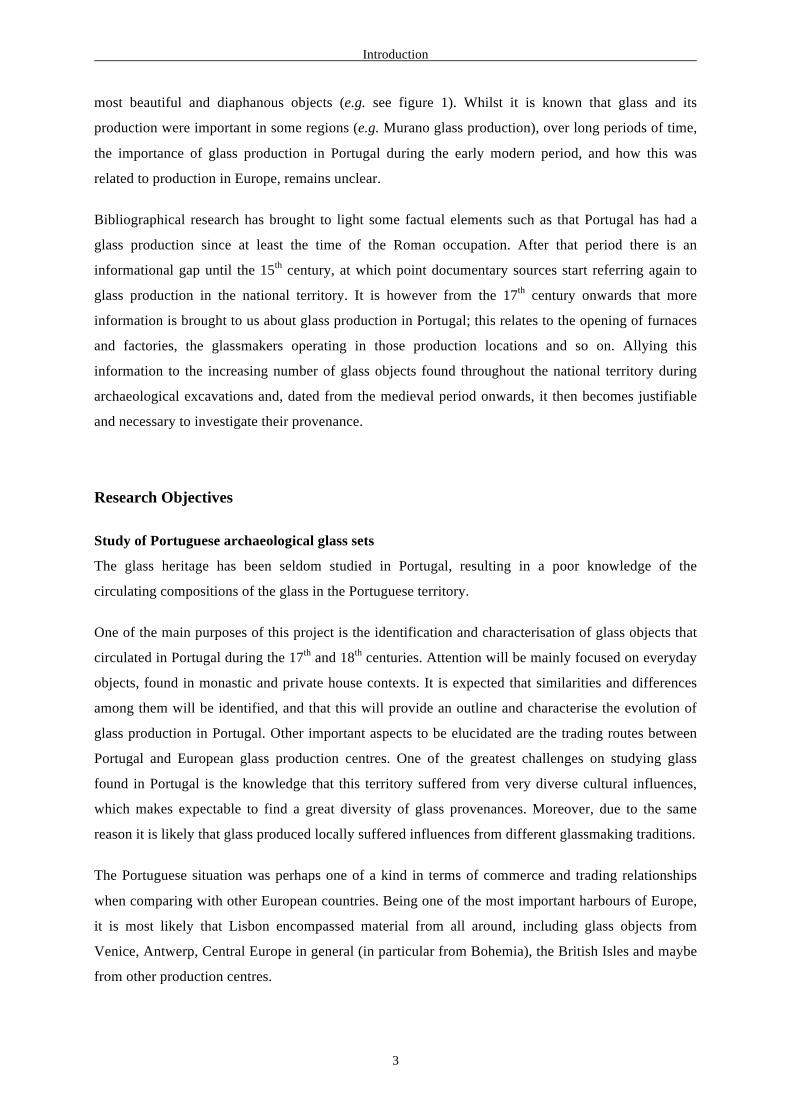
Introduction
3
most beautiful and diaphanous objects (e.g. see figure 1). Whilst it is known that glass and its
production were important in some regions (e.g. Murano glass production), over long periods of time,
the importance of glass production in Portugal during the early modern period, and how this was
related to production in Europe, remains unclear.
Bibliographical research has brought to light some factual elements such as that Portugal has had a
glass production since at least the time of the Roman occupation. After that period there is an
informational gap until the 15th century, at which point documentary sources start referring again to
glass production in the national territory. It is however from the 17th century onwards that more
information is brought to us about glass production in Portugal; this relates to the opening of furnaces
and factories, the glassmakers operating in those production locations and so on. Allying this
information to the increasing number of glass objects found throughout the national territory during
archaeological excavations and, dated from the medieval period onwards, it then becomes justifiable
and necessary to investigate their provenance.
Research Objectives
Study of Portuguese archaeological glass sets
The glass heritage has been seldom studied in Portugal, resulting in a poor knowledge of the
circulating compositions of the glass in the Portuguese territory.
One of the main purposes of this project is the identification and characterisation of glass objects that
circulated in Portugal during the 17th and 18th centuries. Attention will be mainly focused on everyday
objects, found in monastic and private house contexts. It is expected that similarities and differences
among them will be identified, and that this will provide an outline and characterise the evolution of
glass production in Portugal. Other important aspects to be elucidated are the trading routes between
Portugal and European glass production centres. One of the greatest challenges on studying glass
found in Portugal is the knowledge that this territory suffered from very diverse cultural influences,
which makes expectable to find a great diversity of glass provenances. Moreover, due to the same
reason it is likely that glass produced locally suffered influences from different glassmaking traditions.
The Portuguese situation was perhaps one of a kind in terms of commerce and trading relationships
when comparing with other European countries. Being one of the most important harbours of Europe,
it is most likely that Lisbon encompassed material from all around, including glass objects from
Venice, Antwerp, Central Europe in general (in particular from Bohemia), the British Isles and maybe
from other production centres.
Introduction
4
This study also aims to clarify singularities and common features in Portuguese glass in order to
establish typical patterns associated with it. The ultimate objective is to identify compositional and
stylistic features that can be used to distinguish glass objects produced in Portugal from those of a
distinct provenance found either in Portugal or other European centres. Lacking archaeological data on
furnaces, it is tried to answer these questions by linking together the information obtained from the
stylistic approach and from the results of the chemical analyses.
The archaeological finds used in this study were from the following archaeological sites: Santa Clara-
a-Velha Monastery in Coimbra (17th century), São João de Tarouca Monastery in Lamego (17th to 18th
centuries), the archaeological excavation at Miguel Fernandes Square in Beja (14th to 17th century), the
archaeological excavation carried out in the courtyard of the University of Coimbra (17th century), the
archaeological excavation carried out in Roman Theatre Museum in Lisbon (17th to 18th centuries) and
the archaeological excavation carried out in Arsenal Street in Lisbon (17th to 19th centuries). With the
exception of the Roman Theatre Museum (Lisbon) and Rua do Arsenal (Lisbon) contexts, the
remaining four assemblages were studied from a stylistic point of view, by the archaeologist Teresa
Medici in her Ph.D. dissertation entitled “VIDROS DA TERRA. O vidro tardomedieval e moderno em
Portugal (séculos XIV-XVII). O contributo da arqueologia” (Medici, 2014). This was a very important
factor when choosing the glass groups to be studied. To clarify the choice of this time-period to study,
that is 17th and 18th centuries, this period showed great changes in the raw materials employed,
different furnace fuels used and so on, resulting in the appearance of new glass formulations. Glass
from this time period is found in Portugal, retrieved in large quantities from archaeological
excavations, and it has been seldom studied. Bearing in mind the main purposes of this investigation,
it was important to choose well dated contexts. For this reason the archaeological assemblages from
Santa Clara-a-Velha Monastery in Coimbra (17th century), São João de Tarouca Monastery in Lamego
(17th to 18th centuries), the archaeological excavation at Praça Miguel Fernandes in Beja (14th to 17th
centuries) and the archaeological excavation at the courtyard of the University of Coimbra (17th
century) were selected. These assemblages are well dated from their archaeological contexts, as it was
possible to find ceramic objects or sometimes coins. The great advantage to selecting these four
assemblages besides their dated contexts, was the possibility to associate the obtained chemical
composition (through chemical analysis) with the insightful study performed by T. Medici (2014)
mentioned above. The other two sets of objects from Lisbon contexts served as an opportunity to look
at a slightly more recent chronology, in addition to the fact that it was considered very important to
compare the results obtained from the other finds with glass circulating in the nerve centre of the
country. Moreover, looking to glass assemblages dated to the 18th and the beginning of the 19th
century, allowed one to understand that glass circulating in Portugal followed European tendencies in
terms of composition.
Introduction
5
The geographical locations of the glass assemblages under study are represented in figure 2.
Fig. 2: Map of Portugal with the locations of the glass contexts under study. From North to South, SJT is the São João de Tarouca Monastery, SCV is the Santa Clara-a-Velha Monastery, CPU is the courtyard of the Universidade de Coimbra, LTR is the Museu do Teatro Romano, LRA is the Rua do Arsenal and PMF is the Praça Miguel Fernandes.
As previously mentioned, glass objects found in the Portuguese territory have not been given the
attention they deserve in the past few years. The studies that have been performed have mainly been
concerned with the stylistic point of view, and only a few have addressed the chemical
characterisation of glass. V. Valente (1950) and J. Amado Mendes (2002) are among the first to study
the general panorama of the glass production history in the Portuguese territory from the 15th century
onwards. In their books, Portuguese glass history is explored on the basis of contemporary historical
documentation. J. Custódio (2002) dedicated a book to the Coina Royal Glass Factory, where the
history of its foundation is thoroughly described, as well as its years of activity.
Regarding more recent studies, M. Dias da Cruz (2009) wrote his Ph.D. thesis on Portuguese glass
from the Roman period, where a multidisciplinary approach allowed discussion of the importance of
glass on the day-to-day life of Roman inhabitants from the Iberian Peninsula. With regards to the
studies on medieval and post-medieval glass, a selection of glass objects from the Santa Clara-a-Velha
Introduction
6
Monastery context was studied by M. Ferreira (2004) in terms of its shapes and decoration features.
This study has focused on the façon-de-Venise shapes, the filigree glass, the diamond engraving
decoration, and so on, outlining the myriad colours, shapes and decorative techniques that one can find
within this set of objects. Medici et al. (2009) studied a selection of glass bottles and jugs from the
same context in terms of shapes and decorative features, and the glass chemical composition was also
determined by means of micro-energy dispersive X-ray fluorescence spectrometry (µ-EDXRF). Also
within this group, a set of millefiori glass objects was studied not only from a stylistic point of view
but was also chemically characterised by X-ray electron probe microanalysis (EPMA), Raman
microscopy and UV-Visible absorption spectroscopy (Lima et al., 2012). From these approaches it
was possible to establish that some of the objects had a clear foreign influence (from Islamic and
Venetian glass for instance), but also that there were objects with uncommon shapes and decorative
features, as well as chemical compositions that did not relate to any of the coeval published
compositions from known European glass production centres.
Some papers were dedicated to the stylistic study of single glass assemblages where the historical
context was addressed. The set of glass objects from the Rua da Judiaria in Almada comprises glass
objects dating from the 12th to the 19th centuries and was studied by T. Medici (2005a). In this paper,
besides the description of the glass finds, the provenance of some objects based on their shapes and
decorative features is also discussed. The same author also studied an archaeological glass group dated
from Roman time to the 19th century of the present era. This group resulted from the archaeological
excavation in the Rua dos Correeiros, Lisbon (Medici, 2011). Once again the provenance of some
objects is discussed as well as the trading relations between Portugal and Venice during the medieval
and post-medieval period (Medici, 2011, p.313). M. Ferreira (2005a) studied the archaeological glass
found in different excavations carried out in the city of Tomar. The glass finds can be dated from the
Roman period to the 19th century. In this study the author was able to draw some conclusions about the
objects’ provenance through the analysis of their shapes (Ferreira, 2005a, p.407).
With the aim of analysing special decorative features, Ferreira & Medici (2010) compared mould
blown decoration patterns between assemblages from sites such as S. João de Tarouca Monastery,
Santa Clara-a-Velha Monastery, courtyard of the Universidade de Coimbra, and Praça Miguel
Fernandes in Beja, among others that are not considered in this present investigation. In this paper the
authors concluded the uniqueness of some decorative patterns that have no parallel throughout Europe
(Ferreira & Medici, 2010, p.408). Wheel engraved patterns dating to the 18th century were retrieved
from an archaeological excavation carried out on the Marquis of Marialva Palace, Lisbon. The
analysis of these fragments provided an understanding that in this period, sophisticated glass objects
were circulating in Portugal among the court and the wealthy population (Ferreira, 2005b, p.241).
Introduction
7
Finally, this brief review of the most up to date studies carried out on glass objects found in the
Portuguese territory will conclude with the only excavation and resultant archaeometric study
performed on a Portuguese production centre. The preliminary study on the production remains of the
Coina Royal glass factory showed that it produced at least four different types of glass compositions
(Lopes et al., 2009, p.592).
As it became clear from this brief review of the studies of glass found in Portugal, no systematic
approach was carried out on these several glass finds in order to ally the stylistic study to an
investigation of the chemical composition. This kind of approach is necessary to highlight differences
and similarities among glass groups found in Portugal and among other known European glass
production centres, as well as to outline and characterise the evolution of glass production in Portugal.
This line of investigation is mandatory because the general idea is that Portuguese glass production
was of poor quality and had no expression, a fact that was contradicted by these first preliminary
results.
In the study we performed, several analytical methods were selected in order to establish a framework
and characterisation methodology for the study of the glass objects. Among the several analytical
methods that can be applied for this purpose an attempt was made to mainly use non-destructive ones.
The conservation conditions of the glass objects and their preservation for future generations will also
be considered.
Sensor development
Like all existent materials without exception, glass suffers from degradation processes, which in an
extreme situation can lead to its full collapse and disappearance. In order to allow this material to be
passed on to future generations, preventive conservation measurements must be taken to ensure its
continuity through time.
In the context of preservation, attention will be paid to the monitoring of indoor pollutants that can
interfere with the integrity of the glass objects. It is known that pollutants such as for instance formic
acid and sulphuric acid from acid rain can affect the integrity of glass compromising its stability. The
objective is to design an optical sensor for the detection of the organic volatile compound formic acid.
In brief, formic acid will enhance and deepen alkali leaching from the glass matrix. This chemical
corrosion process will be explained further in Chapter 1, Part II. Although a new generation of
monitoring and analytical devices is currently available to study both indoor and outdoor atmospheric
Introduction
8
conservation, there are difficulties related to this subject which include limited access to sophisticated
measurement equipment, aggravated by the relative high number of places to be monitored and
measured (e.g. museum halls, interior showcases and storage boxes). Therefore simple and low-cost
devices for detecting the pollutants in situ, are still required for the preservation of cultural heritage
objects.
Some research has been carried out on this subject in which small sensors based on the encapsulation
of suitable organic dyes in sol-gel silica films were produced to monitor environmental parameters
such as light, humidity, temperature, and environmental pH (see for example Carmona et al., 2008;
Dickert et al., 2000; Goicoechea et al., 2008; Han et al., 2007; Janzen et al., 2006; Kowada et al.,
2005; among others).
Chemo-responsive dyes will be tested as sensors according to their sensitivity and selectivity towards
indoor formic acid vapours. The sensor response should ideally be specific and easily monitored by
means of a colour change, in minimum time, offering a suitable alternative to detecting the compound
referred to above, without the need for more sophisticated or non-practical instrumentation such as
electrodes, solutions, pH meters or batteries.
Introduction
9
This thesis is divided into two parts to facilitate its reading. Part I is dedicated to the archaeometric
study of the glass finds under investigation, and Part II focus on the sensor development. The general
Introduction focuses on the other hand, on the research objectives for the study of glass objects found
in Portuguese territory and for the sensor development, addressing the conservation issues and the
preservation of this heritage. In general, this thesis is structured in such a way so as to present first the
historical context and state of the art for the topics covered, followed by the presentation and
discussion of the results obtained and respective conclusions.
Part I is divided into four chapters. Chapter 1 is an introduction to archaeometry and archaeometric
studies on glass. In Chapter 2, the raw materials employed in glass production over certain periods of
time and for different European production centres are addressed. This is followed by a brief review of
the most up to date studies on glass in Europe covering the time period between 17th and 18th
centuries. Whenever necessary and for the sake of better understanding, a small contextualization of
the previous centuries is presented. In Chapter 3 a description of the archaeological context and the
historical background of the glass objects follows this for each context being study. This is followed
by the methodology used for the selection and sampling objects, the research design and methodology,
where the analytical methods and the respective analytical conditions used to perform the glass
analysis are described.
Finally, in Chapter 4 the study performed on the glass assemblages is presented. The results of this
investigation are presented, where the data obtained is divided into glass chemical type. This division
will allow the comparison between the obtained results of the contexts and published data on coeval
glass compositions from known European production centres.
In what regards Part II, in Chapter 1, the glass degradation mechanisms, its agents and what has been
done so far in terms of identifying and sensing them will be summarily described. Chapter Two
comprises the study and development of an optical sensor for the detection of indoor formic acid
vapours. In the same line of thought as in the previous chapters, first the methodology and
experimental design for the development of the sensor is explained, followed by the description of the
analytical techniques employed for the sensors characterisation. Last of all the matrices tested are
described, and the final sensor is presented.
Lastly, the final remarks for the previous chapters are presented, highlighting the main conclusions
and proposing future work.
Introduction
10
Glass as a material has always been a fascination to me. The way an incandescent molten mass is
transformed into beautiful objects and colourful stained-glass panels it is something that at a first sight
seems wrapped in magic. From the first time I saw glass being blown twenty-four years ago, I
developed a passion for this materials and all its potential.
During my master thesis I had the opportunity to work on some glass objects retrieved from
Portuguese archaeological excavations and dated from the post-medieval period. It was back then,
during my research on this matter, that I understood that glass retrieved from Portuguese
archaeological excavations and dated from the medieval period onwards was the subject of interest for
only a very limited number of scholars and that no systematic approach was done to study these
objects. From this lack of knowledge on medieval to early modern glass circulating in Portugal the
need to develop this project was obvious.
A very significant number of glass assemblages, in their majority from Portuguese archaeological
contexts, lay forgotten on storage. Archaeologist and other scholars chose most of the times not to
study this material due to their lack of knowledge on the subject and because no systematic approach
was done so far to demonstrate how the study of glass in Portugal can be important to reveal social
and economic aspects of our society. Related to the study of the material itself, other very important
aspect that captivated my attention was the conservation of glass objects. In order to keep this material
available to present and future generations, it is very important to investigate on further strategies
concerning the glass preservation and conservation, in order to minimise the action of the corrosion
agents.
I expect that this thesis, together with other fundamental works on this field, namely the PhD thesis
from Teresa Medici (2014), will change and improve the knowledge on glass circulating in Portugal,
helping also on stimulating the interest of others on this subject.
Chapter 1 –Introduction Part I
11
PART I
NEW INSIGHTS INTO 17TH AND 18TH CENTURY PORTUGUESE
GLASS

Chapter 1 –Introduction Part I
12
Chapter 1 –Introduction Part I
13
CHAPTER 1
INTRODUCTION
“Archaeometry is the application of scientific measurement to problems of the study of Man.
These “measurements”may be physical analysis, statistical studies, instrument techniques, or
even the inferences allowed by evaluation of quantified data.”
Philip C. Hammond, “Archaeometry and Time: A Review”, 1974
(Hammond, 1974, in Journal of Field Archaeology, Vol.1(3/4), p.329-335)
The citation above is one of many definitions for the term “archaeometry”, which has been the subject
of discussion even since it first appeared in the 1950s. The term is closely related to the scientific
journal Archaeometry founded in 1958 (Montero Ruiz et al., 2007). In a broader sense, archaeometry
can be understood as the set of measurements performed on material of archaeological origin. Its
definition has evolved with time, as well as the subjects it covers (Montero Ruiz et al., 2007).
Nowadays archaeometry, always strictly connect with archaeology, has become much more
interdisciplinary, the main purpose of which is the application of modern analytical methods to obtain
information from historical materials. The information obtained can be of a compositional or structural
nature, and can shed light on issues such as materials provenance, raw materials sources, dating,
commercial routes, and so on. Currently, the generally accepted areas encompassed by archaeometry
are: dating, physical and chemical analysis performed on materials (these include their technology,
origin and their applications) paleoenvironmental studies, geophysical survey and satellite remote
sensing and finally mathematical and statistical methods that allow one to interpret the data obtained
from different fields of investigation (Montero Ruiz et al., 2007).
Chapter 1 –Introduction Part I
14
In terms of the archaeometry of glass, its main focus is the study of the raw materials that compose the
glass. Raw materials are the group of basic components that are put together and submitted to a
transformation process in order to obtain a final product, in this case glass. According to Navarro
(2003, p.129-130), raw materials out of which glass is made can come directly from nature, can be
manufactured, or can result from previous recycling actions. In many cases the combination of the
three situations are observed when analysing glass compositions from the early modern period.
In order to correctly interpret the resulting data when analysing glass chemical compositions, a solid
knowledge of the raw materials is fundamental. It is very important to bear in mind the transformation
processes that each raw material can undergo, why it does so, the history of its usage, where it was
usually collected and so on. Another important aspect to consider when studying glass compositions is
the nature of the impurities that are characteristic for each raw material, since these can sometimes be
decisive when the provenance of the object is under discussion.
Along the history of glass making, the most frequently used raw materials to obtain silica – the main
component of glass – are quartz pebbles and sand. Apart from the silica, the sand used in the glass
batch always contains different type of impurities (Moretti & Hreglich, 2013). The minerals making
up these impurities are usually aluminium-rich kaolinite and feldspar, zirconium-rich zircon (ZrSiO4),
REE-rich monazite (REE phosphate), titanium-rich rutile (TiO2) and iron oxides (Moretti & Hreglich,
2013; Wedepohl et al., 2011a). These elements – alumina, iron and titanium oxides- are the main trace
elements and trackers for sand, allowing discussion about the provenance of raw materials and,
consequently, the provenance of the glass object (Velde, 2013).
The proximity of the raw materials to the production centre is important when studying the economic
aspects of early modern glass production (Navarro, 2003, p.130). It would be expected that the
glassworkers would use raw materials that could be found in the proximity of the kiln; however, it is
possible to find exceptional situations such as that of Venetian glass that will be further discussed in
Chapter 2, Part I.
Concerning the importance of archaeometry in Portuguese studies of glass dated to between the 17th
and 18th centuries, stylistic studies alone are not enough to obtain information on the glass
composition and can only be used to form suppositions on probable provenances of the objects. On
other hand the written sources with information about raw materials or used recipes are scarce and not
yet subject to a systematic and detailed study. Formal and stylistic studies on Portuguese
archaeological assemblages have been directed towards the identification of objects with formal
characteristics from known European centres, as for instance Venetian objects or those with façon-de-
Venise attributions (Ferreira, 2004). After this identification, determining the glass chemical
composition is mandatory. This will allow for comparisons with chemical compositions from the
Chapter 1 –Introduction Part I
15
literature, and confirm or not the supposed provenance. With the spread of glass recipes and
knowledge on the employment of raw materials and their treatment throughout Europe from the 16th
century onwards, the chemical compositions of most objects from several of the European production
centres are very similar, and sometimes impossible to distinguish from one another. Following the
example of façon-de-Venise glass, several scientific investigations dedicated their work on
differentiating façon-de-Venise production centres through the analysis of minor and trace elements
present in the glass (Cagno et al., 2008; 2010; De Raedt et al., 2001; Šmit et al., 2004; 2005; 2009). It
is fundamental to determine the minor and trace elements or Rare Earth Elements (REE) present in
glass objects as they are considered to be the glass fingerprints.
With this idea in mind, the objects from Portuguese archaeological excavations to be studied will be
analysed in order to determine their chemical composition in major, minor and whenever possible in
trace or REE components. To perform these analyses and obtain the glass chemical composition, a few
analytical methods can be used. In this current investigation, particle induced X-ray emission (PIXE)
was chosen to obtain data on the major and minor glass components, and laser ablation induced
coupled plasma mass spectrometry (LA-ICP-MS) was used to obtain information on the trace and rare
earth elements. One of the purposes of this investigation is to try and attribute a possible provenance
to the largest possible number of fragments. It is important to bear in mind that the process of
attributing a final provenance (in this case more specifically local or region production) to a glass
object (or objects in general) through its chemical composition it is not a straightforward task. It
implies the creation of a database from several productions centres in order to be able to make
comparisons between results. These databases should be composed by a minimum of 15 samples in
order to establish the variability within a single source (Tykot, 2004, p.417). For this reason, for every
glass compositional type and whenever possible, a database was created containing compositional
information from known European glass production centres, in order to compare these with the results
obtained.
Considering the studies carried out so far on Portuguese archaeological glass objects dated to between
the 14th and 15th centuries, it is concluded that the typologies of the objects can be inserted perfectly
within those of late-medieval Europe. The majority of the objects are utilitarian, for instance liquid
containers and tableware (Medici, 2014). Looking to glass objects dated from the 16th century, shapes
such as drinking glasses with feet, and bottles to serve at table were identified. With regard to the
drinking glasses, two different feet were identified in majority of cases: a foot with one spherical knop
on the stem, and a foot with two spherical knops on the stem. The first case is very common in
European glass production centres; on the other hand, the foot with two knops on the stem is rather
uncommon (Medici, 2014). Up to the 17th century, the objects found among archaeological
excavations are largely related to tableware. From this century onwards, a broader use of glass can be
Chapter 1 –Introduction Part I
16
observed, related to medical care, lighting and tableware. The presence of glass imports amongst finds
is also more in evidence. On the other hand, among known shapes, uncommon shapes without known
parallels are also identified as gourds, globular flasks and a mould blown four-petalled flower
embossed motif enclosed within a lozenge pattern decorating some glass objects such as beakers or
ink-pots (Medici, 2014). This discrepancy between retrieved objects before and after the 17th century,
could be a reflection of a behavioural change between the 16th century man and the 17th century man.
One can consider that in the 17th century a pre-consumer man begins to emerge, feeling the need to
possess more objects to fill his greater needs.
Finally, to summarise the main questions intended to be answered using archaeometric principles:
- What kind of glass, chemically speaking, was circulating in Portugal during the 17th and
18th centuries?
- Is it possible to identify particular features in terms of composition that can differentiate
objects found in the Portuguese territory? (Note that since no furnaces from this time
period have so far been excavated in Portugal, and that since no analysed glass coming
from this kind of environment has been characterised, one can expect to find specific
chemical features that do not have parallels in any of the published compositions from
known European production centres. To put it simply, with this information it would then
be possible to propose that these objects might be of Portuguese provenance.)
- If the answer to the previous question is positive, what kind of glassmaking tradition was
preferred in Portugal, the Mediterranean (soda-rich glass) or Northern Europe (potassium-
rich glass)?
- Allying the information gathered from the stylistic study with the chemical analysis, is it
possible to find particular typologies with unique compositions?
- Since the end of the 17th and 18th centuries were the time of invention and evolution in
terms of glass composition and formulation in Europe, is it possible to find some of those
novelties circulating in Portugal?
Chapter 2 – Glass: production and historical contexts Part I
17
CHAPTER 2
GLASS: PRODUCTION AND HISTORICAL CONTEXTS
2.1 Glass production in Europe during the 17th and 18th centuries
2.1.1 Chemical formulations of historical glass
It is important to understand how the glass production centres in Europe employed their knowledge of
glass compositions and formulated their own empirical glass compositions. Particular cases of various
raw materials and their use in different European glass production centres will be analysed.
Beginning with the Venetian glass that has been widely studied by Verità and co-workers (e.g. Verità
& Toninato, 1990; Verità & Zecchin, 2009a), it is possible to understand, through chemical analysis and
research in ancient treatises, that the raw materials employed in Venetian glass production were carefully
selected, and came from specific locations in order to produce a high quality glass with particular
characteristics, that made it one of the most desired luxury item throughout Europe. The most valued
characteristics in glass production were transparency, and an uncoloured and homogeneous matrix. To
this end, the selection of raw materials played a major role. During the 14th century, Venetian
glassmakers began to use quartz pebbles from the Ticino River as a source for silica, replacing the use
of impure sands (Verità & Zecchin, 2009a). Quartz pebbles are characterised by their pure composition,
with very low contents of unwanted impurities such as iron, that can give naturally occurring green, blue
or yellow hues to glass (see Appendix I, Part I). A general description of glass components, and the
importance of acquire knowledge about used raw materials is described and explored in Appendix I,
Part I.
It is important to emphasise that at this time the glassmakers’ knowledge was an empirical one.
Chapter 2 – Glass: production and historical contexts Part I
18
Venetian glassmaking history is strongly connected to the Islamic tradition. Venetian glassmakers were
influenced by the Islamic glassmakers in terms of production methodologies and the decoration
processes, as well as in their glassmaking recipes. With this knowledge, and since the 13th century,
Venetian glassmakers have employed Levantine ashes (rich in sodium), imported from Syria and Egypt,
as a source for the plant alkaline component (Verità & Zecchin, 2009a). During the 15th century, another
type of glass appeared in Murano, the famous cristallo that was made with the intent of resembling rock
crystal. This glass, known for its transparency and a perfectly accomplished decolouration, was obtained
as a result of the use of purified Levantine ashes in addition to the employment of the Ticino quartz
pebbles. This ashes’ purification step was the novelty. The ashes were ground, dissolved in water, and
then boiled. The resulting solution was filtered and left to dry. These steps led to the formation of a
white salt – sale da cristallo – that was mixed with the silica source in the right proportion, and calcined
in order to obtain the cristallo frit. This purification process resulted in the removal of iron compounds
as well as calcium and magnesium, the presence of these last two being essential to the chemical stability
of the glass (see Appendix I, Part I). During the second half of the 17th century, after the spread of façon-
de-Venise glass and the development of other glass formulations throughout Europe, the fashion for
Venetian glass went into decline. In addition, it was no longer possible to import Levantine ashes, and
an attempt to grow halophytic plants in the Venetian lagoon was made without success (Verità, 2013,
p.530). Until the decline, during the 18th century, Venetian glassmakers produced the most desired
luxury glass throughout Europe.
Aiming to match and surpass Venetian production, other glass production centres appeared in Europe
(e.g. in the Low Countries and the British Isles) and began making façon-de-Venise glass. This glass
was generally made by Venetian glassmakers who had escaped from Murano and from its restrictive
rules (De Raedt et al., 2002). In terms of raw materials, it was not possible to use the same ones that
were employed in Venice. However, it is worth noting that an effort was made to employ the purest raw
materials that were available locally. For this reason, the chemical composition of the façon-de-Venise
glass from the different production centres is similar to that of Venetian made glass. Nevertheless,
analysing the minor and trace elements from this façon-de-Venise glass allows one, most of the time, to
distinguish between production centres.
At the end of the 17th century, this desire to create new types of glass, led to the development of two
different compositions: a pure potassium glass matrix in Central Europe, and a pure lead glass matrix in
the British Isles.
The Central European potassium crystal glass was made using very pure sources of raw materials, such
as quartz pebbles to obtain silica and a selection of the potassium-rich plants from which ashes could be
obtained.
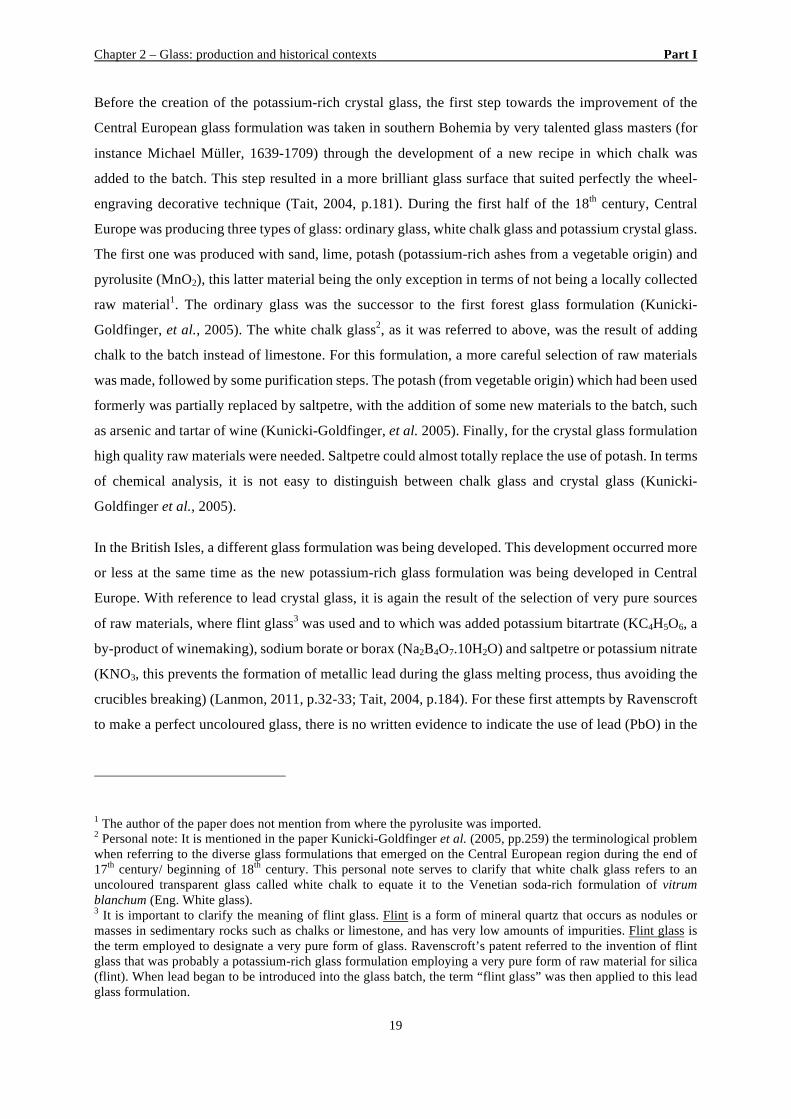
Chapter 2 – Glass: production and historical contexts Part I
19
Before the creation of the potassium-rich crystal glass, the first step towards the improvement of the
Central European glass formulation was taken in southern Bohemia by very talented glass masters (for
instance Michael Müller, 1639-1709) through the development of a new recipe in which chalk was
added to the batch. This step resulted in a more brilliant glass surface that suited perfectly the wheel-
engraving decorative technique (Tait, 2004, p.181). During the first half of the 18th century, Central
Europe was producing three types of glass: ordinary glass, white chalk glass and potassium crystal glass.
The first one was produced with sand, lime, potash (potassium-rich ashes from a vegetable origin) and
pyrolusite (MnO2), this latter material being the only exception in terms of not being a locally collected
raw material1. The ordinary glass was the successor to the first forest glass formulation (Kunicki-
Goldfinger, et al., 2005). The white chalk glass2, as it was referred to above, was the result of adding
chalk to the batch instead of limestone. For this formulation, a more careful selection of raw materials
was made, followed by some purification steps. The potash (from vegetable origin) which had been used
formerly was partially replaced by saltpetre, with the addition of some new materials to the batch, such
as arsenic and tartar of wine (Kunicki-Goldfinger, et al. 2005). Finally, for the crystal glass formulation
high quality raw materials were needed. Saltpetre could almost totally replace the use of potash. In terms
of chemical analysis, it is not easy to distinguish between chalk glass and crystal glass (Kunicki-
Goldfinger et al., 2005).
In the British Isles, a different glass formulation was being developed. This development occurred more
or less at the same time as the new potassium-rich glass formulation was being developed in Central
Europe. With reference to lead crystal glass, it is again the result of the selection of very pure sources
of raw materials, where flint glass3 was used and to which was added potassium bitartrate (KC4H5O6, a
by-product of winemaking), sodium borate or borax (Na2B4O7.10H2O) and saltpetre or potassium nitrate
(KNO3, this prevents the formation of metallic lead during the glass melting process, thus avoiding the
crucibles breaking) (Lanmon, 2011, p.32-33; Tait, 2004, p.184). For these first attempts by Ravenscroft
to make a perfect uncoloured glass, there is no written evidence to indicate the use of lead (PbO) in the
1 The author of the paper does not mention from where the pyrolusite was imported. 2 Personal note: It is mentioned in the paper Kunicki-Goldfinger et al. (2005, pp.259) the terminological problem when referring to the diverse glass formulations that emerged on the Central European region during the end of 17th century/ beginning of 18th century. This personal note serves to clarify that white chalk glass refers to an uncoloured transparent glass called white chalk to equate it to the Venetian soda-rich formulation of vitrum blanchum (Eng. White glass). 3 It is important to clarify the meaning of flint glass. Flint is a form of mineral quartz that occurs as nodules or masses in sedimentary rocks such as chalks or limestone, and has very low amounts of impurities. Flint glass is the term employed to designate a very pure form of glass. Ravenscroft’s patent referred to the invention of flint glass that was probably a potassium-rich glass formulation employing a very pure form of raw material for silica (flint). When lead began to be introduced into the glass batch, the term “flint glass” was then applied to this lead glass formulation.
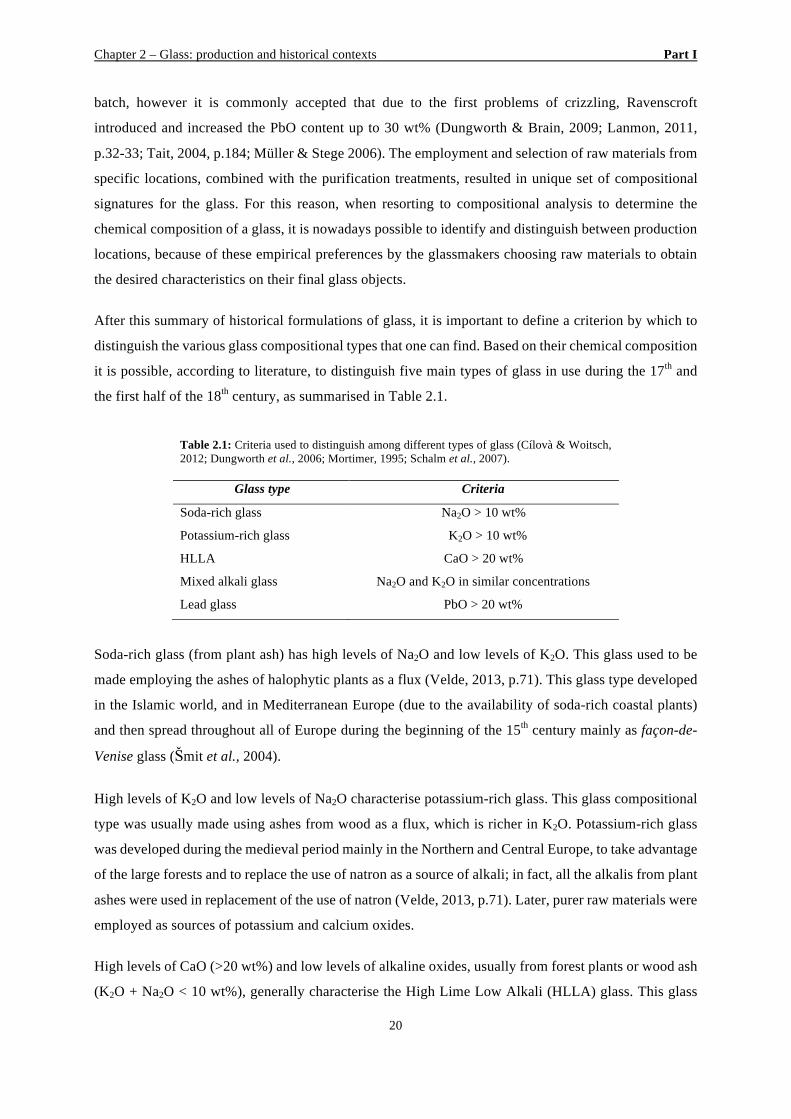
Chapter 2 – Glass: production and historical contexts Part I
20
batch, however it is commonly accepted that due to the first problems of crizzling, Ravenscroft
introduced and increased the PbO content up to 30 wt% (Dungworth & Brain, 2009; Lanmon, 2011,
p.32-33; Tait, 2004, p.184; Müller & Stege 2006). The employment and selection of raw materials from
specific locations, combined with the purification treatments, resulted in unique set of compositional
signatures for the glass. For this reason, when resorting to compositional analysis to determine the
chemical composition of a glass, it is nowadays possible to identify and distinguish between production
locations, because of these empirical preferences by the glassmakers choosing raw materials to obtain
the desired characteristics on their final glass objects.
After this summary of historical formulations of glass, it is important to define a criterion by which to
distinguish the various glass compositional types that one can find. Based on their chemical composition
it is possible, according to literature, to distinguish five main types of glass in use during the 17th and
the first half of the 18th century, as summarised in Table 2.1.
Table 2.1: Criteria used to distinguish among different types of glass (Cílovà & Woitsch, 2012; Dungworth et al., 2006; Mortimer, 1995; Schalm et al., 2007).
Glass type Criteria
Soda-rich glass Na2O > 10 wt%
Potassium-rich glass K2O > 10 wt%
HLLA CaO > 20 wt%
Mixed alkali glass Na2O and K2O in similar concentrations
Lead glass PbO > 20 wt%
Soda-rich glass (from plant ash) has high levels of Na2O and low levels of K2O. This glass used to be
made employing the ashes of halophytic plants as a flux (Velde, 2013, p.71). This glass type developed
in the Islamic world, and in Mediterranean Europe (due to the availability of soda-rich coastal plants)
and then spread throughout all of Europe during the beginning of the 15th century mainly as façon-de-
Venise glass (Šmit et al., 2004).
High levels of K2O and low levels of Na2O characterise potassium-rich glass. This glass compositional
type was usually made using ashes from wood as a flux, which is richer in K2O. Potassium-rich glass
was developed during the medieval period mainly in the Northern and Central Europe, to take advantage
of the large forests and to replace the use of natron as a source of alkali; in fact, all the alkalis from plant
ashes were used in replacement of the use of natron (Velde, 2013, p.71). Later, purer raw materials were
employed as sources of potassium and calcium oxides.
High levels of CaO (>20 wt%) and low levels of alkaline oxides, usually from forest plants or wood ash
(K2O + Na2O < 10 wt%), generally characterise the High Lime Low Alkali (HLLA) glass. This glass
Chapter 2 – Glass: production and historical contexts Part I
21
composition was widely used for the production of bottles, mainly in the British Isles. It is generally
accepted that HLLA glass was taken to the British Isles c. 1567 by immigrant French glassmakers, since
this composition was being made in France during the 16th century (Barrera & Velde, 1989; Dungworth
& Clark, 2004; Dungworth, 2010).
Mixed alkali glass is usually characterised by having a soda content too low to be a soda-rich glass, a
potassium content too low to be considered potassium-rich glass, and a lime content too low to be a
HLLA glass. They are therefore considered to be of an intermediate composition between the forest or
wood-ash glass and the soda-ash glass made from coastal plant ashes (Dungworth & Mortimer, 2005).
This glass compositional type results from a mixture of all these three components having the soda and
potassium contents almost in equal parts.
Lead crystal glass was developed and introduced in English glass production around 1674/1676
(Lanmon, 2011, p.24). Lead contents varied between 15 to 40 wt% and this glass was usually produced
with very pure raw materials such as white sand or flint (as source of silica), litharge and saltpetre
(Dungworth & Brain, 2009).
Throughout Chapter 4, five tables corresponding to the chemical composition of Venetian and façon-
de-Venise glass, high lime low alkali glass (HLLA), potassium-rich glass, mixed-alkali glass and lead
glass, are presented. In these tables, the values, presented in average with respective standard deviations,
were collected from literature and represent in their majority, glass production locations. The
compositions reported in these tables will serve as a base of comparison to help determining the
provenance of the glass objects that are the subject of this work.
2.1.2 A short journey through European glass history during the 17th and 18th centuries
In order to give a rough and preliminary idea of what was happening throughout Europe in terms of
Early Modern glass production, a short summary of the main production centres is presented below.
Venice
Venetian glass, produced on the famous island of Murano, was one of the most prized and desired luxury
items for more than 200 years. The history of Venetian glass is connected and inseparable from
glassmaking developments all over Europe. It was the driving force that impelled the other European
productions centres to develop new glass formulations, always with the intent of surpassing the
virtuosity and refinement of Venetian glass.
Chapter 2 – Glass: production and historical contexts Part I
22
This fascination with Venetian glass and its subsequent supremacy was due to the conjunction of several
characteristics such as the formulation of the glass and the selection of raw materials, the unique
decorative features, and the glassmakers’ mastery in creating and developing dazzling shapes (Verità &
Toninato, 1990; Whitehouse, 2004, pp.ii).
The evolution and development of glassmaking in Venice is connected and closely related to the history
of the Venetian Republic, which in turn had its political and economic growth linked to the Orient, more
specifically to the Levant (Verità, 2013, p.515). During the 12th century, Venice became an overseas
power and became the link between the East and the Western world (Gaba-Van Dongen, 2004, p.195).
Venetian glass evolved from two different traditions: during the Early Medieval period glass was being
produced both with natron (the flux used by Roman glassmakers), and with raw materials from the
Levant (Verità, 2013, p.533). Between the 7th and the 13th centuries, natron glass was gradually
substituted by a soda-lime-silica glass based on plant ashes. During the Middle Ages, Venetian glass
was exclusively produced using soda-rich vegetable ashes imported from the Levant and the glass
production was carried out in two steps: soda plant-ash and the silica source were mixed together in
almost equal parts and calcined for several hours which resulted in a frit. This frit was then mixed with
internal glass cullet4 and with other compounds (colouring or decolouring agents) to be melted in
crucibles (Verità, 2013, p.523).
Until the 15th century, Venice imported not only raw materials from the Levant but most probably also
Islamic glass recipes and the ideas for the shapes of the glass objects. From this period onwards, Venice
took control of innovation in glassmaking, creating its own shapes, decorative features and most
importantly, its own glass recipes with innovations in the composition (Verità, 2013, p.527). Venetian
glass can be divided into three groups on the bases of the different compositions: common glass, vitrum
blanchum and cristallo. The first two formulations were exclusive until the second half of the 15th
century. Common glass was a colourless transparent glass with natural hues of green, yellow or blue
that was mainly used to produce utilitarian items; and vitrum blanchum a well-discoloured glass that
still presented a slight greyish tint despite the attempt to overcome this problem by the replacement of
sand with quartz pebbles from the Ticino River (McCray, 1998; Verità, 2013, p.528). Cristallo is
mentioned for the first time in 1453 and 1457, in two documents found in Dubrovnik, Croatia and
Murano respectively. The word cristallo was used to designate a glass that could be compared to natural
4 Cullet is the term used to designate the waste of broken glass usually gathered for remelting. The expression “internal glass cullet” is here employed to clarify that Venetian glassmakers used only their own cullet; in other words, they only employed glass waste from their own production in order to control the quality of the glass.
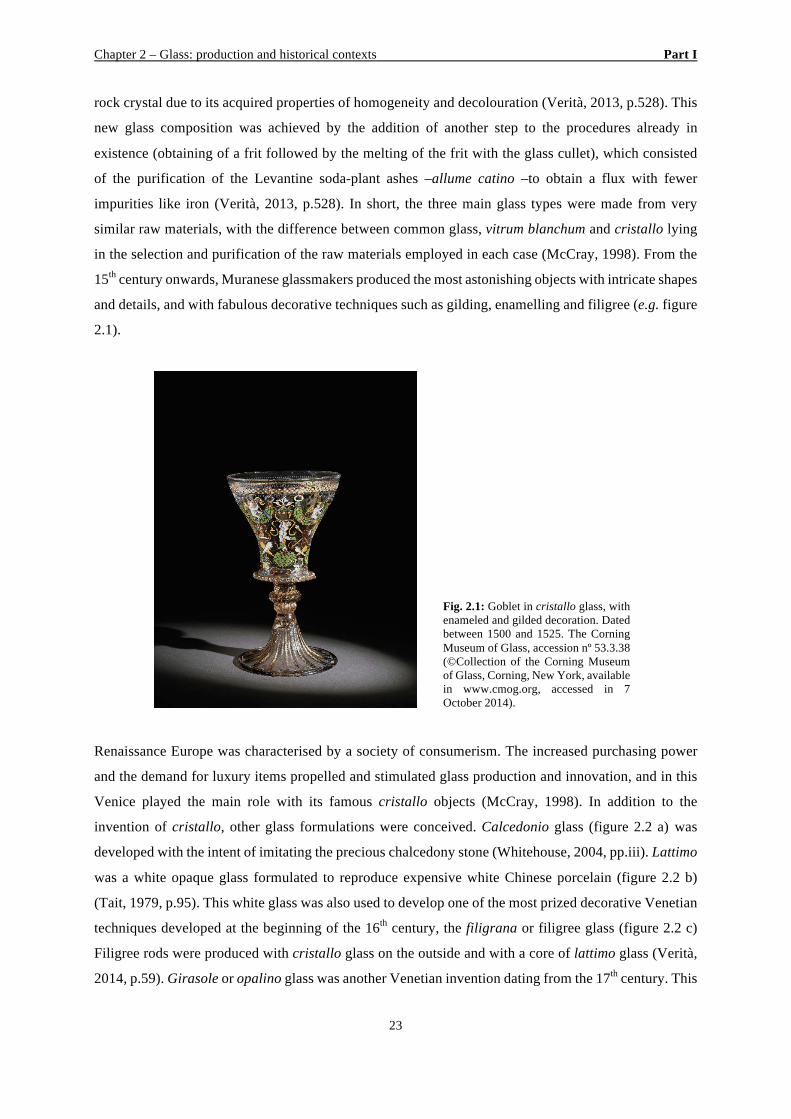
Chapter 2 – Glass: production and historical contexts Part I
23
rock crystal due to its acquired properties of homogeneity and decolouration (Verità, 2013, p.528). This
new glass composition was achieved by the addition of another step to the procedures already in
existence (obtaining of a frit followed by the melting of the frit with the glass cullet), which consisted
of the purification of the Levantine soda-plant ashes –allume catino –to obtain a flux with fewer
impurities like iron (Verità, 2013, p.528). In short, the three main glass types were made from very
similar raw materials, with the difference between common glass, vitrum blanchum and cristallo lying
in the selection and purification of the raw materials employed in each case (McCray, 1998). From the
15th century onwards, Muranese glassmakers produced the most astonishing objects with intricate shapes
and details, and with fabulous decorative techniques such as gilding, enamelling and filigree (e.g. figure
2.1).
Fig. 2.1: Goblet in cristallo glass, with enameled and gilded decoration. Dated between 1500 and 1525. The Corning Museum of Glass, accession nº 53.3.38 (©Collection of the Corning Museum of Glass, Corning, New York, available in www.cmog.org, accessed in 7 October 2014).
Renaissance Europe was characterised by a society of consumerism. The increased purchasing power
and the demand for luxury items propelled and stimulated glass production and innovation, and in this
Venice played the main role with its famous cristallo objects (McCray, 1998). In addition to the
invention of cristallo, other glass formulations were conceived. Calcedonio glass (figure 2.2 a) was
developed with the intent of imitating the precious chalcedony stone (Whitehouse, 2004, pp.iii). Lattimo
was a white opaque glass formulated to reproduce expensive white Chinese porcelain (figure 2.2 b)
(Tait, 1979, p.95). This white glass was also used to develop one of the most prized decorative Venetian
techniques developed at the beginning of the 16th century, the filigrana or filigree glass (figure 2.2 c)
Filigree rods were produced with cristallo glass on the outside and with a core of lattimo glass (Verità,
2014, p.59). Girasole or opalino glass was another Venetian invention dating from the 17th century. This
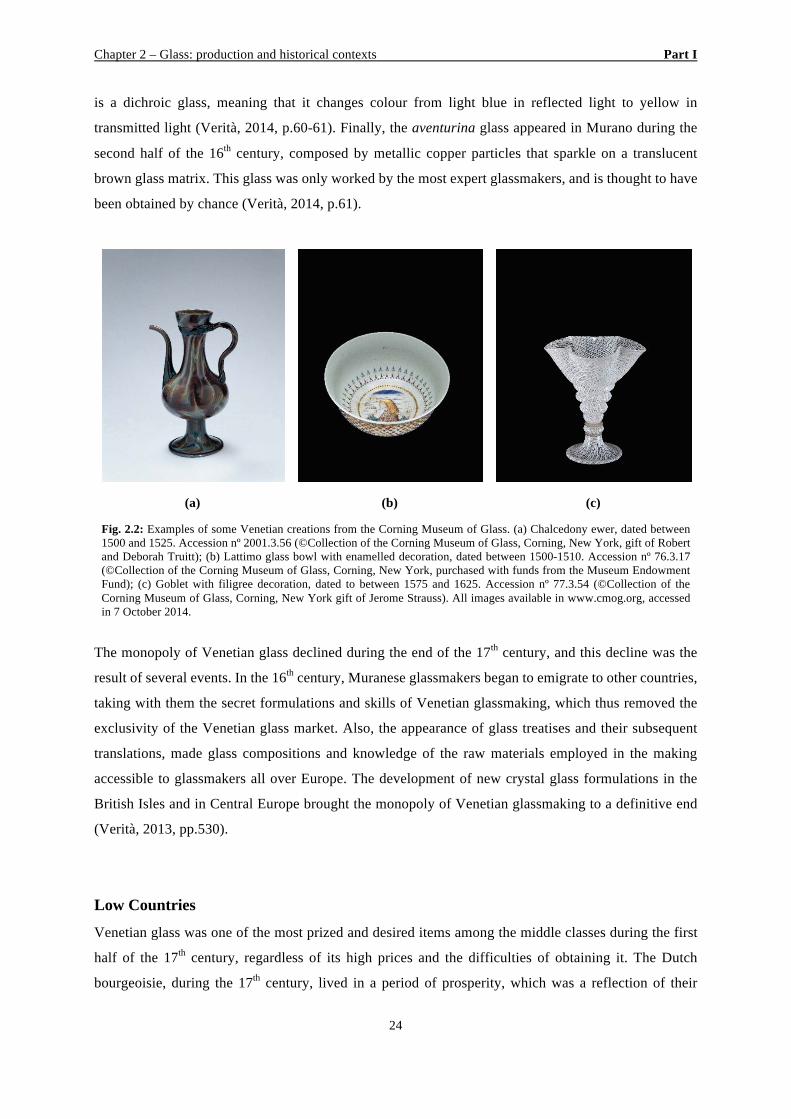
Chapter 2 – Glass: production and historical contexts Part I
24
is a dichroic glass, meaning that it changes colour from light blue in reflected light to yellow in
transmitted light (Verità, 2014, p.60-61). Finally, the aventurina glass appeared in Murano during the
second half of the 16th century, composed by metallic copper particles that sparkle on a translucent
brown glass matrix. This glass was only worked by the most expert glassmakers, and is thought to have
been obtained by chance (Verità, 2014, p.61).
(a) (b) (c)
Fig. 2.2: Examples of some Venetian creations from the Corning Museum of Glass. (a) Chalcedony ewer, dated between 1500 and 1525. Accession nº 2001.3.56 (©Collection of the Corning Museum of Glass, Corning, New York, gift of Robert and Deborah Truitt); (b) Lattimo glass bowl with enamelled decoration, dated between 1500-1510. Accession nº 76.3.17 (©Collection of the Corning Museum of Glass, Corning, New York, purchased with funds from the Museum Endowment Fund); (c) Goblet with filigree decoration, dated to between 1575 and 1625. Accession nº 77.3.54 (©Collection of the Corning Museum of Glass, Corning, New York gift of Jerome Strauss). All images available in www.cmog.org, accessed in 7 October 2014.
The monopoly of Venetian glass declined during the end of the 17th century, and this decline was the
result of several events. In the 16th century, Muranese glassmakers began to emigrate to other countries,
taking with them the secret formulations and skills of Venetian glassmaking, which thus removed the
exclusivity of the Venetian glass market. Also, the appearance of glass treatises and their subsequent
translations, made glass compositions and knowledge of the raw materials employed in the making
accessible to glassmakers all over Europe. The development of new crystal glass formulations in the
British Isles and in Central Europe brought the monopoly of Venetian glassmaking to a definitive end
(Verità, 2013, pp.530).
Low Countries
Venetian glass was one of the most prized and desired items among the middle classes during the first
half of the 17th century, regardless of its high prices and the difficulties of obtaining it. The Dutch
bourgeoisie, during the 17th century, lived in a period of prosperity, which was a reflection of their
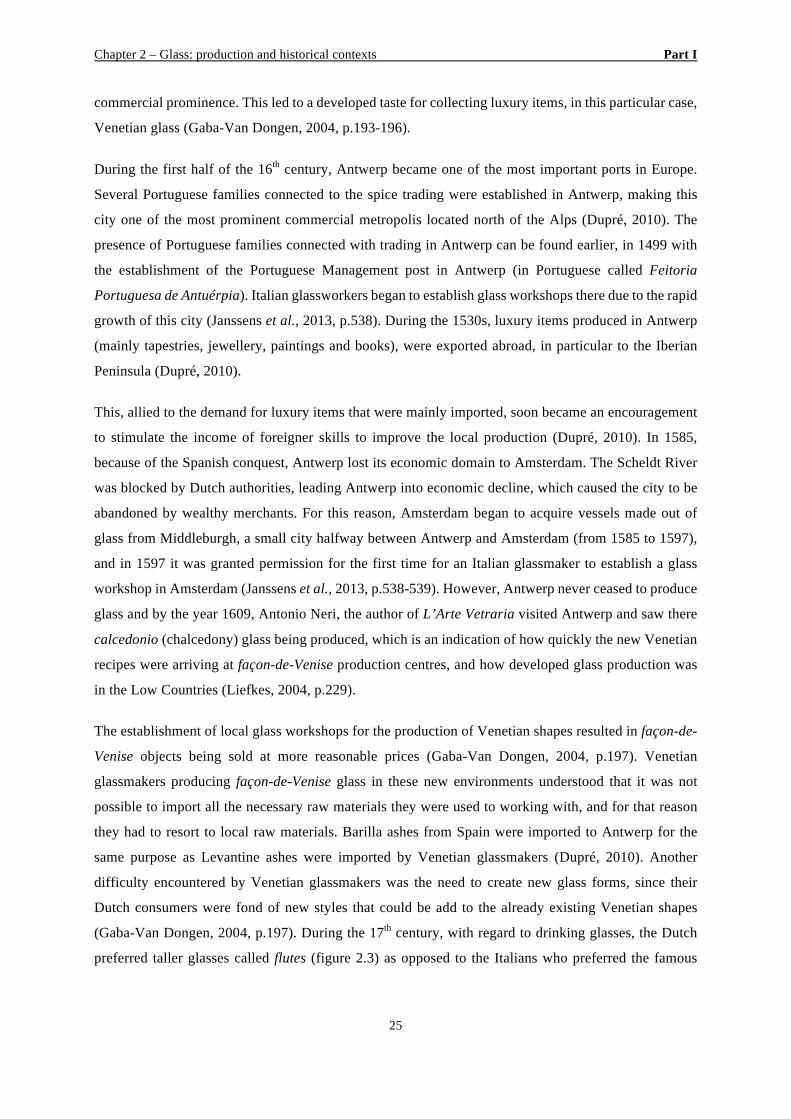
Chapter 2 – Glass: production and historical contexts Part I
25
commercial prominence. This led to a developed taste for collecting luxury items, in this particular case,
Venetian glass (Gaba-Van Dongen, 2004, p.193-196).
During the first half of the 16th century, Antwerp became one of the most important ports in Europe.
Several Portuguese families connected to the spice trading were established in Antwerp, making this
city one of the most prominent commercial metropolis located north of the Alps (Dupré, 2010). The
presence of Portuguese families connected with trading in Antwerp can be found earlier, in 1499 with
the establishment of the Portuguese Management post in Antwerp (in Portuguese called Feitoria
Portuguesa de Antuérpia). Italian glassworkers began to establish glass workshops there due to the rapid
growth of this city (Janssens et al., 2013, p.538). During the 1530s, luxury items produced in Antwerp
(mainly tapestries, jewellery, paintings and books), were exported abroad, in particular to the Iberian
Peninsula (Dupré, 2010).
This, allied to the demand for luxury items that were mainly imported, soon became an encouragement
to stimulate the income of foreigner skills to improve the local production (Dupré, 2010). In 1585,
because of the Spanish conquest, Antwerp lost its economic domain to Amsterdam. The Scheldt River
was blocked by Dutch authorities, leading Antwerp into economic decline, which caused the city to be
abandoned by wealthy merchants. For this reason, Amsterdam began to acquire vessels made out of
glass from Middleburgh, a small city halfway between Antwerp and Amsterdam (from 1585 to 1597),
and in 1597 it was granted permission for the first time for an Italian glassmaker to establish a glass
workshop in Amsterdam (Janssens et al., 2013, p.538-539). However, Antwerp never ceased to produce
glass and by the year 1609, Antonio Neri, the author of L’Arte Vetraria visited Antwerp and saw there
calcedonio (chalcedony) glass being produced, which is an indication of how quickly the new Venetian
recipes were arriving at façon-de-Venise production centres, and how developed glass production was
in the Low Countries (Liefkes, 2004, p.229).
The establishment of local glass workshops for the production of Venetian shapes resulted in façon-de-
Venise objects being sold at more reasonable prices (Gaba-Van Dongen, 2004, p.197). Venetian
glassmakers producing façon-de-Venise glass in these new environments understood that it was not
possible to import all the necessary raw materials they were used to working with, and for that reason
they had to resort to local raw materials. Barilla ashes from Spain were imported to Antwerp for the
same purpose as Levantine ashes were imported by Venetian glassmakers (Dupré, 2010). Another
difficulty encountered by Venetian glassmakers was the need to create new glass forms, since their
Dutch consumers were fond of new styles that could be add to the already existing Venetian shapes
(Gaba-Van Dongen, 2004, p.197). During the 17th century, with regard to drinking glasses, the Dutch
preferred taller glasses called flutes (figure 2.3) as opposed to the Italians who preferred the famous
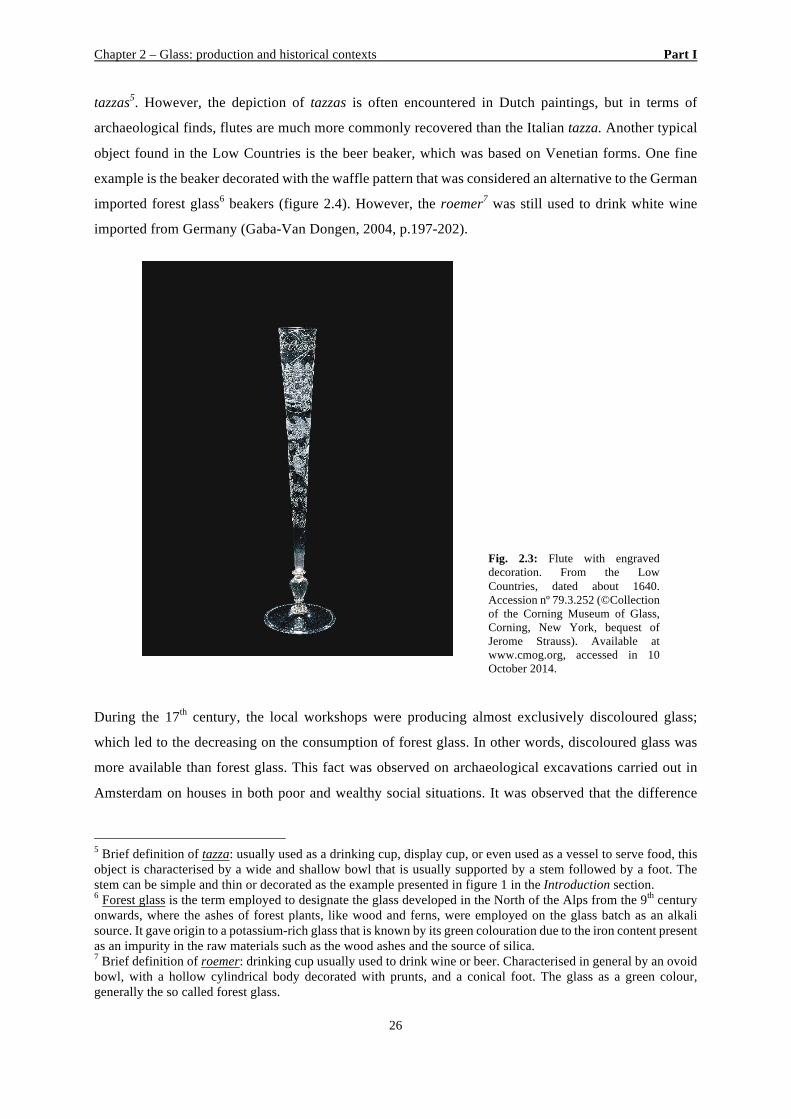
Chapter 2 – Glass: production and historical contexts Part I
26
tazzas5. However, the depiction of tazzas is often encountered in Dutch paintings, but in terms of
archaeological finds, flutes are much more commonly recovered than the Italian tazza. Another typical
object found in the Low Countries is the beer beaker, which was based on Venetian forms. One fine
example is the beaker decorated with the waffle pattern that was considered an alternative to the German
imported forest glass6 beakers (figure 2.4). However, the roemer7 was still used to drink white wine
imported from Germany (Gaba-Van Dongen, 2004, p.197-202).
Fig. 2.3: Flute with engraved decoration. From the Low Countries, dated about 1640. Accession nº 79.3.252 (©Collection of the Corning Museum of Glass, Corning, New York, bequest of Jerome Strauss). Available at www.cmog.org, accessed in 10 October 2014.
During the 17th century, the local workshops were producing almost exclusively discoloured glass;
which led to the decreasing on the consumption of forest glass. In other words, discoloured glass was
more available than forest glass. This fact was observed on archaeological excavations carried out in
Amsterdam on houses in both poor and wealthy social situations. It was observed that the difference
5 Brief definition of tazza: usually used as a drinking cup, display cup, or even used as a vessel to serve food, this object is characterised by a wide and shallow bowl that is usually supported by a stem followed by a foot. The stem can be simple and thin or decorated as the example presented in figure 1 in the Introduction section. 6 Forest glass is the term employed to designate the glass developed in the North of the Alps from the 9th century onwards, where the ashes of forest plants, like wood and ferns, were employed on the glass batch as an alkali source. It gave origin to a potassium-rich glass that is known by its green colouration due to the iron content present as an impurity in the raw materials such as the wood ashes and the source of silica. 7 Brief definition of roemer: drinking cup usually used to drink wine or beer. Characterised in general by an ovoid bowl, with a hollow cylindrical body decorated with prunts, and a conical foot. The glass as a green colour, generally the so called forest glass.
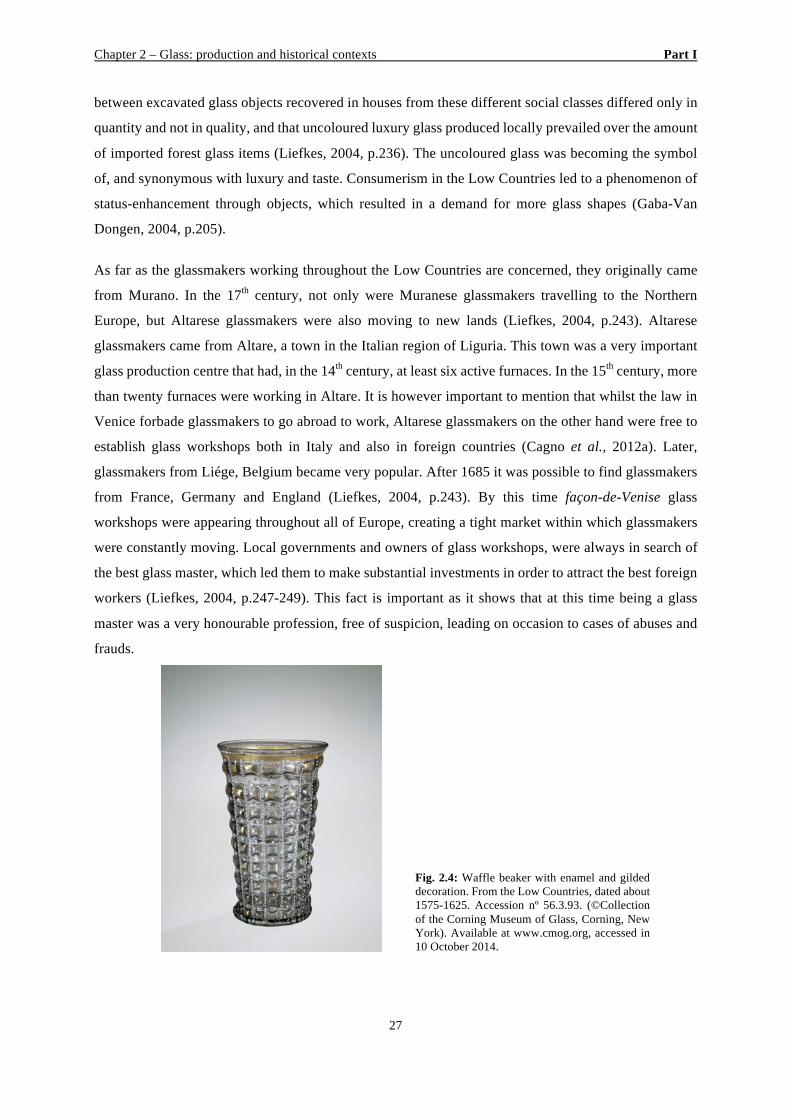
Chapter 2 – Glass: production and historical contexts Part I
27
between excavated glass objects recovered in houses from these different social classes differed only in
quantity and not in quality, and that uncoloured luxury glass produced locally prevailed over the amount
of imported forest glass items (Liefkes, 2004, p.236). The uncoloured glass was becoming the symbol
of, and synonymous with luxury and taste. Consumerism in the Low Countries led to a phenomenon of
status-enhancement through objects, which resulted in a demand for more glass shapes (Gaba-Van
Dongen, 2004, p.205).
As far as the glassmakers working throughout the Low Countries are concerned, they originally came
from Murano. In the 17th century, not only were Muranese glassmakers travelling to the Northern
Europe, but Altarese glassmakers were also moving to new lands (Liefkes, 2004, p.243). Altarese
glassmakers came from Altare, a town in the Italian region of Liguria. This town was a very important
glass production centre that had, in the 14th century, at least six active furnaces. In the 15th century, more
than twenty furnaces were working in Altare. It is however important to mention that whilst the law in
Venice forbade glassmakers to go abroad to work, Altarese glassmakers on the other hand were free to
establish glass workshops both in Italy and also in foreign countries (Cagno et al., 2012a). Later,
glassmakers from Liége, Belgium became very popular. After 1685 it was possible to find glassmakers
from France, Germany and England (Liefkes, 2004, p.243). By this time façon-de-Venise glass
workshops were appearing throughout all of Europe, creating a tight market within which glassmakers
were constantly moving. Local governments and owners of glass workshops, were always in search of
the best glass master, which led them to make substantial investments in order to attract the best foreign
workers (Liefkes, 2004, p.247-249). This fact is important as it shows that at this time being a glass
master was a very honourable profession, free of suspicion, leading on occasion to cases of abuses and
frauds.
Fig. 2.4: Waffle beaker with enamel and gilded decoration. From the Low Countries, dated about 1575-1625. Accession nº 56.3.93. (©Collection of the Corning Museum of Glass, Corning, New York). Available at www.cmog.org, accessed in 10 October 2014.
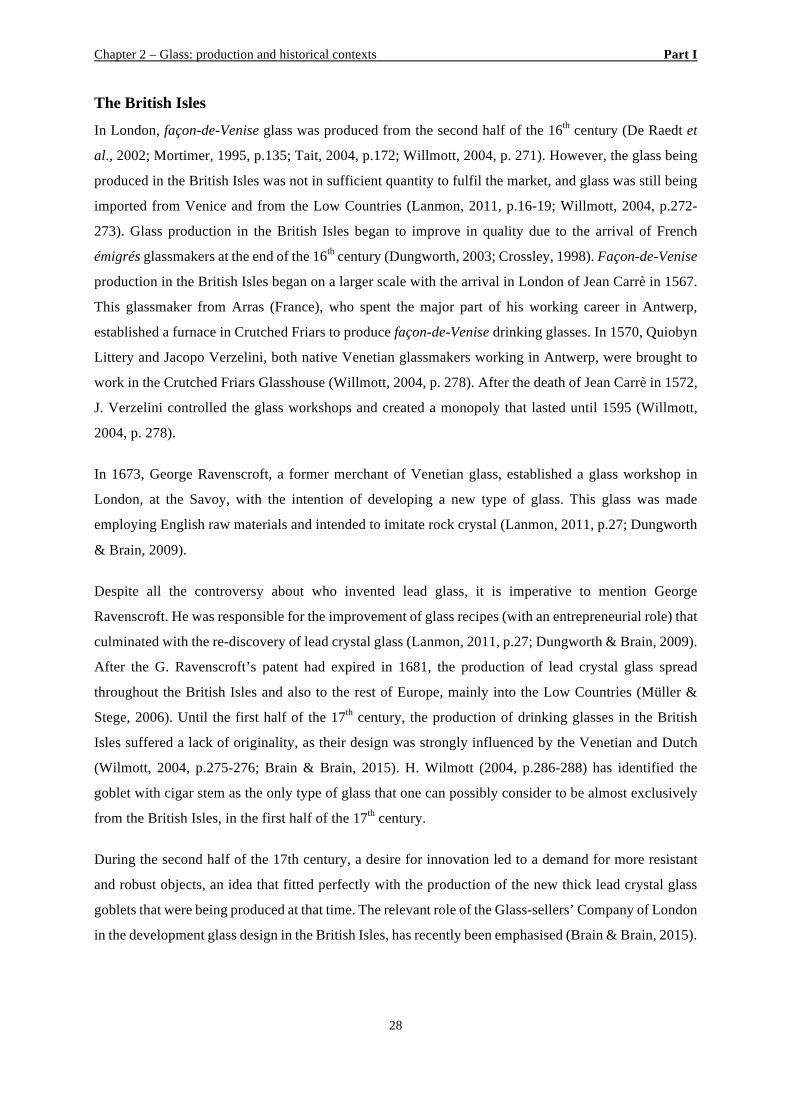
Chapter 2 – Glass: production and historical contexts Part I
28
The British Isles
In London, façon-de-Venise glass was produced from the second half of the 16th century (De Raedt et
al., 2002; Mortimer, 1995, p.135; Tait, 2004, p.172; Willmott, 2004, p. 271). However, the glass being
produced in the British Isles was not in sufficient quantity to fulfil the market, and glass was still being
imported from Venice and from the Low Countries (Lanmon, 2011, p.16-19; Willmott, 2004, p.272-
273). Glass production in the British Isles began to improve in quality due to the arrival of French
émigrés glassmakers at the end of the 16th century (Dungworth, 2003; Crossley, 1998). Façon-de-Venise
production in the British Isles began on a larger scale with the arrival in London of Jean Carrè in 1567.
This glassmaker from Arras (France), who spent the major part of his working career in Antwerp,
established a furnace in Crutched Friars to produce façon-de-Venise drinking glasses. In 1570, Quiobyn
Littery and Jacopo Verzelini, both native Venetian glassmakers working in Antwerp, were brought to
work in the Crutched Friars Glasshouse (Willmott, 2004, p. 278). After the death of Jean Carrè in 1572,
J. Verzelini controlled the glass workshops and created a monopoly that lasted until 1595 (Willmott,
2004, p. 278).
In 1673, George Ravenscroft, a former merchant of Venetian glass, established a glass workshop in
London, at the Savoy, with the intention of developing a new type of glass. This glass was made
employing English raw materials and intended to imitate rock crystal (Lanmon, 2011, p.27; Dungworth
& Brain, 2009).
Despite all the controversy about who invented lead glass, it is imperative to mention George
Ravenscroft. He was responsible for the improvement of glass recipes (with an entrepreneurial role) that
culminated with the re-discovery of lead crystal glass (Lanmon, 2011, p.27; Dungworth & Brain, 2009).
After the G. Ravenscroft’s patent had expired in 1681, the production of lead crystal glass spread
throughout the British Isles and also to the rest of Europe, mainly into the Low Countries (Müller &
Stege, 2006). Until the first half of the 17th century, the production of drinking glasses in the British
Isles suffered a lack of originality, as their design was strongly influenced by the Venetian and Dutch
(Wilmott, 2004, p.275-276; Brain & Brain, 2015). H. Wilmott (2004, p.286-288) has identified the
goblet with cigar stem as the only type of glass that one can possibly consider to be almost exclusively
from the British Isles, in the first half of the 17th century.
During the second half of the 17th century, a desire for innovation led to a demand for more resistant
and robust objects, an idea that fitted perfectly with the production of the new thick lead crystal glass
goblets that were being produced at that time. The relevant role of the Glass-sellers’ Company of London
in the development glass design in the British Isles, has recently been emphasised (Brain & Brain, 2015).
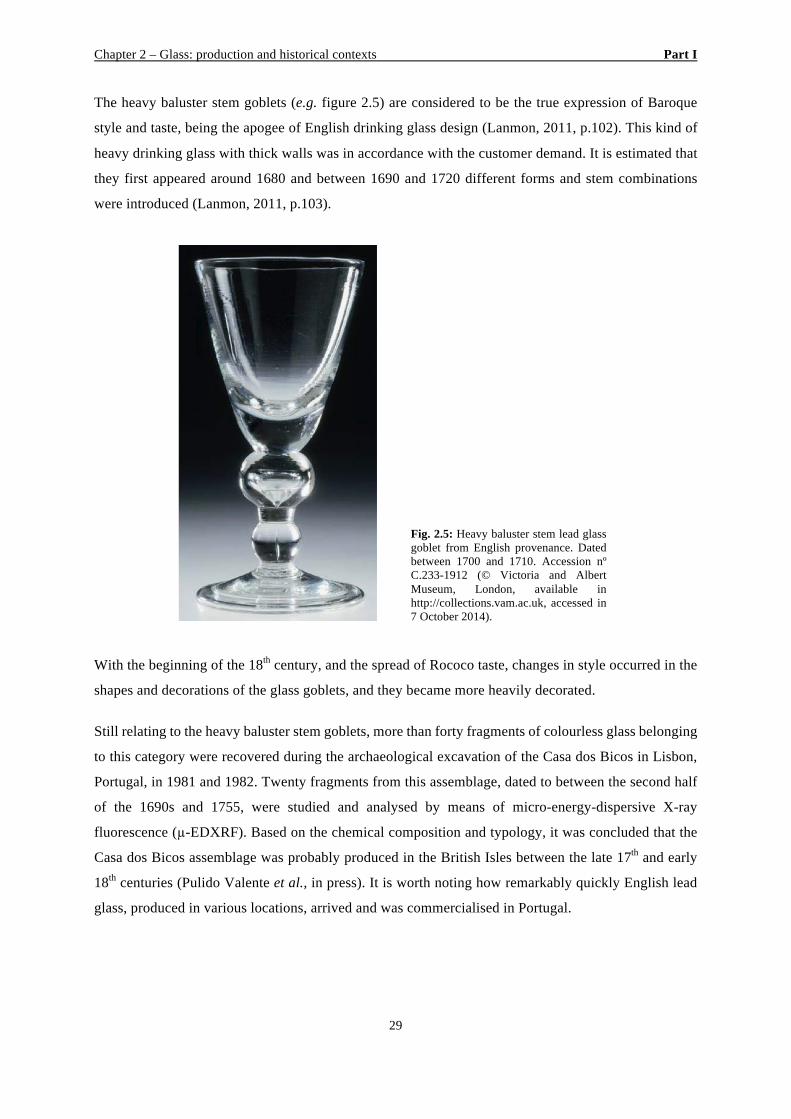
Chapter 2 – Glass: production and historical contexts Part I
29
The heavy baluster stem goblets (e.g. figure 2.5) are considered to be the true expression of Baroque
style and taste, being the apogee of English drinking glass design (Lanmon, 2011, p.102). This kind of
heavy drinking glass with thick walls was in accordance with the customer demand. It is estimated that
they first appeared around 1680 and between 1690 and 1720 different forms and stem combinations
were introduced (Lanmon, 2011, p.103).
Fig. 2.5: Heavy baluster stem lead glass goblet from English provenance. Dated between 1700 and 1710. Accession nº C.233-1912 (© Victoria and Albert Museum, London, available in http://collections.vam.ac.uk, accessed in 7 October 2014).
With the beginning of the 18th century, and the spread of Rococo taste, changes in style occurred in the
shapes and decorations of the glass goblets, and they became more heavily decorated.
Still relating to the heavy baluster stem goblets, more than forty fragments of colourless glass belonging
to this category were recovered during the archaeological excavation of the Casa dos Bicos in Lisbon,
Portugal, in 1981 and 1982. Twenty fragments from this assemblage, dated to between the second half
of the 1690s and 1755, were studied and analysed by means of micro-energy-dispersive X-ray
fluorescence (µ-EDXRF). Based on the chemical composition and typology, it was concluded that the
Casa dos Bicos assemblage was probably produced in the British Isles between the late 17th and early
18th centuries (Pulido Valente et al., in press). It is worth noting how remarkably quickly English lead
glass, produced in various locations, arrived and was commercialised in Portugal.
Chapter 2 – Glass: production and historical contexts Part I
30
Bottle development and evolution
It is not possible to discuss glass production in the British Isles without mentioning the bottle making,
and its consequent evolution. This was a progressive advance that began in the middle of the 17th century
with the need to develop better and more resistant containers to improve the transport of wine and other
beverages. A relevant innovation made by the industry of the British Isles was to produce bottles with
thicker walls: the increase of glass thickness made the bottles much more resistant mainly during their
transport (Lanmon, 2011, p.19, 287).
The interconnection with the wine trade is believed to also be at the origin of the evolution of the shape
of the bottle, which became more cylindrical over time. The cylindrical shape allowed for the transport
of more bottles in the same space; a cylindrical bottle could be transported horizontally, which helped
to maintain the sealing cork wet, and consequently the wine well sealed and preserved (Jones, 1986,
p.17; Lanmon, 2011, p. 309). Wills (1974, p.45) believes that Portuguese Port wine was one of the
propelling factors for the evolution of the shape of the bottle. In 1703, the British ambassador in Portugal
signed the Methuen treaty, in which it was stated that Portuguese wines would be bought preferentially
by the British Isles in place of the French wines. Port wine was the favourite, and it needed to be perfectly
sealed in order to maintain its characteristics, this being accomplished with the cylindrical bottle being
transported horizontally (Wills, 1974, p.45; Lanmon, 2011, p.54). Undoubtedly, the wine industry had
a large influence on the development of the bottle. Portuguese wines were largely exported to the British
Isles, and not only Port wine (red and white) but also wine from Madeira and from Lisbon. There are
registers dating from the 18th century referring to the large quantities of Port wine that wine merchants
kept in stock due to the time required for this beverage to become good and drinkable (Jones, 1986,
p.20). Wines like Port or Madeira were stored in bottles for them to mature. These wines could be
allowed to mature for as long as ten years (Jones, 1986, p.21). It is possible to interpret this information
and relate it with what Wills (1974) has stated about Portuguese Port wine being the propelling factor
that allowed the shape of the bottle to evolve into its cylindrical shape. Perhaps one can consider that
due to the length of time required for Portuguese wines to mature, it became necessary to re-think the
bottle shape and adapt it for long-time storage.
The colour of glass bottles also changed with time from olive green to a very dark green or brown that
appears black in the thickest areas of the glass. As far as the author know, no comprehensive study was
made so far to understand this black-appearing colour phenomena. In terms of chemical composition,
no distinction can be made between the olive green and black-appearing glass bottles.
According to the shapes of the bottles, it is possible to estimate an approximate chronology of
production, if one takes into consideration such factors as the shape of the body, the height of the neck,
the lips and any applied seal (Jones, 1986, p.29). The evolution in shape of the bottle occurred mainly
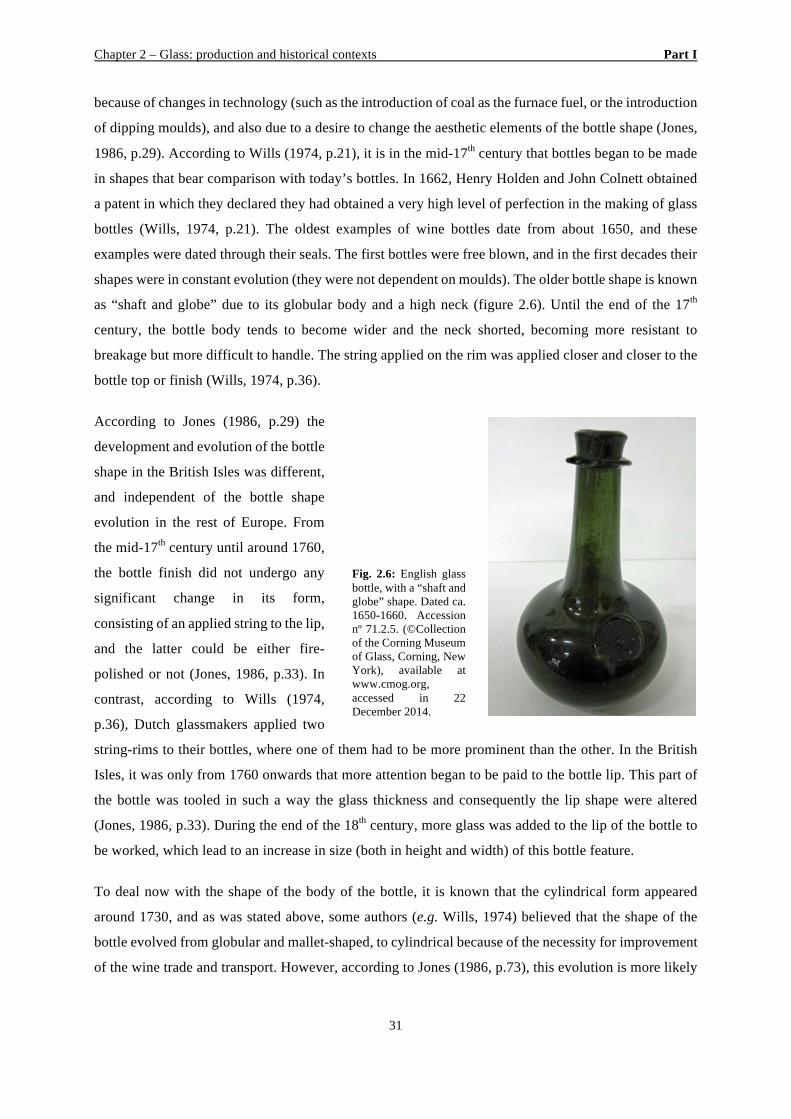
Chapter 2 – Glass: production and historical contexts Part I
31
because of changes in technology (such as the introduction of coal as the furnace fuel, or the introduction
of dipping moulds), and also due to a desire to change the aesthetic elements of the bottle shape (Jones,
1986, p.29). According to Wills (1974, p.21), it is in the mid-17th century that bottles began to be made
in shapes that bear comparison with today’s bottles. In 1662, Henry Holden and John Colnett obtained
a patent in which they declared they had obtained a very high level of perfection in the making of glass
bottles (Wills, 1974, p.21). The oldest examples of wine bottles date from about 1650, and these
examples were dated through their seals. The first bottles were free blown, and in the first decades their
shapes were in constant evolution (they were not dependent on moulds). The older bottle shape is known
as “shaft and globe” due to its globular body and a high neck (figure 2.6). Until the end of the 17th
century, the bottle body tends to become wider and the neck shorted, becoming more resistant to
breakage but more difficult to handle. The string applied on the rim was applied closer and closer to the
bottle top or finish (Wills, 1974, p.36).
According to Jones (1986, p.29) the
development and evolution of the bottle
shape in the British Isles was different,
and independent of the bottle shape
evolution in the rest of Europe. From
the mid-17th century until around 1760,
the bottle finish did not undergo any
significant change in its form,
consisting of an applied string to the lip,
and the latter could be either fire-
polished or not (Jones, 1986, p.33). In
contrast, according to Wills (1974,
p.36), Dutch glassmakers applied two
string-rims to their bottles, where one of them had to be more prominent than the other. In the British
Isles, it was only from 1760 onwards that more attention began to be paid to the bottle lip. This part of
the bottle was tooled in such a way the glass thickness and consequently the lip shape were altered
(Jones, 1986, p.33). During the end of the 18th century, more glass was added to the lip of the bottle to
be worked, which lead to an increase in size (both in height and width) of this bottle feature.
To deal now with the shape of the body of the bottle, it is known that the cylindrical form appeared
around 1730, and as was stated above, some authors (e.g. Wills, 1974) believed that the shape of the
bottle evolved from globular and mallet-shaped, to cylindrical because of the necessity for improvement
of the wine trade and transport. However, according to Jones (1986, p.73), this evolution is more likely
Fig. 2.6: English glass bottle, with a “shaft and globe” shape. Dated ca. 1650-1660. Accession nº 71.2.5. (©Collection of the Corning Museum of Glass, Corning, New York), available at www.cmog.org, accessed in 22 December 2014.
Chapter 2 – Glass: production and historical contexts Part I
32
result of the introduction of dipping moulds, since it is possible to form this shape in a dip mould, whilst
it was impossible to do this with the earlier shapes. It is also possible that this evolution is due to the
combination of both factors; in other words, due both to the necessity of improving transport conditions,
and in conjunction with the development of dipping moulds.
As far as the case of square bottles concerned, these are considered to have appeared during the 17th
century, and their regularity implies the use of a dip mould (Jones, 1986, p.84). These bottles were very
common among the Dutch, and were widely used to export gin. During the 18th century, these square
bottles, also known as case bottles, were still being produced and were also used in larger dimensions,
of up to two gallons (Wills, 1974, p.40).
To deal now with bottles push-ups, several shapes can be identified, and this feature tends to change
over the years. One of the most common is the dome-shaped one. From the late 18th century it is possible
to find conically shaped push-ups and in the 19th century, with the introduction of the Rickett’s mould,
this feature became an integrant part of the mould, and was formed inside it (Jones, 1986, p.86). This
mould was composed of three pieces that can be described as follows: a cylindrical one-piece mould
formed the bottle body, and two open-and-shut mould parts were responsible for forming the shoulder
and sometimes the bottleneck. Sometimes the mould included a fourth part which would form the bottle
base. Bottles made with this technique have characteristic lines encircling the body (at the shoulder
junction), and two vertical lines along the neck left by the mould (Jones, 1986, p.86).
High lime low alkali (HLLA) glass was usually used for the production of utilitarian glass (including
window glass), and by the beginning of the 18th century it was almost exclusively used for bottle
production. HLLA glass was widespread in the British Isles during the 17th and 18th centuries, and was
also mainly used in bottle production. This type of glass is also characterised by its strong green
colouration due to its high iron contents (Dungworth et al., 2006). It is believed that this compositional
type of glass was developed in Germany and France during the late medieval period, and that it was
probably made using the ashes of trees, particularly employing ashes of oak trees (Dungworth, 2009).
Central Europe
After the Roman occupation with its natron-based glass, it was during the 13th century that the Central
European region of Bohemia began to be colonised mainly by German people (to repopulate the territory
after the Mongol invasion of Europe in 1241), and that the knowledge of glassmaking techniques was
brought to this territory. Glass manufacture in this region was easier because of the presence of large
forests that not only supplied furnace fuel, but also potassium-rich ashes (Urešová, 1965 p.3-4). By the
middle of the 14th century, the exploitation of the silver mines (considered the richest in Europe) brought
Chapter 2 – Glass: production and historical contexts Part I
33
prosperity to the Bohemian territory. This success was evident in Central European glass production,
and by this time a high quality glass of potassium-lime-silica composition was being produced. It is
important to emphasise that in comparison to other potassium-lime-silica formulations produced in other
European regions during this period, the Central European composition was remarkably pure, and
allowed for the creation of thinly blown objects in an almost uncoloured glass. Central European
glassmakers, with their pure glass formulation, were able to create a range of more than twenty different
forms of fine tableware. From these creations one can draw attention to one of the finest and most elegant
of these: a tall and narrow flute measuring between 40 and 55 cm in height, generally decorated with a
dense arrangement of glass droplets much smaller than prunts (Tait, 2004, p.153). These glass creations
were exported to neighbouring countries, which propelled the glassmaking development into Central
European territory (Urešová, 1965 p.5).
The production of a potassium-rich formulation continued throughout the centuries, and by the end of
the 16th century, Central European glassmakers were employing new raw material purification methods,
more precisely, they had proceeded to the purification of ashes (Tait, 2004, p.179). The conjunction of
these improvements resulted in an almost uncoloured and much harder glass than the soda-lime-silica
formulation produced in Mediterranean Europe. This harder matrix allowed for the employment of
cutting decoration techniques (Tait, 2004, p.179). When referring to glass wheel-engraving techniques
from this region, it is imperative to mention the figure of Caspar Lehmann, who in 1588 arrived in
Prague as the “Imperial Gem-engraver”, and in 1608 became the “Imperial gem-engraver and glass-
engraver” (Tait, 2004, p.179). C. Lehmann was the initiator and the person responsible for the great
development and the supremacy of the Bohemian glass-engraving technique (Urešová, 1965 p.7).
During the first half of the 17th century a new potassium-lime based formulation was created in Bohemia
that was distinguished from others by its employment of only very pure raw materials (Kunicki-
Goldfinguer et al., 2005). This new glass composition allowed for the making of thick-walled vessels
that were very suitable for deep-engraving techniques. Central European crystal glass allowed for the
use of decorating techniques such as cutting and engraving, which had been perfected to such a degree
by the end of the 17th century, that this became the image of the Bohemian Baroque (Urešová, 1965,
p.7-8).
Considering the shapes of objects created with this new Central European crystal glass, some were
copied from Murano forms, but the most commonly found were inspired by the goblets and beakers
with lids and tall knoped stems from Nuremberg (see figure 2.7 a). In terms of engraving motifs, it is
possible to find floral stylised and naturalistic themes, small birds, small human figures, and later these
evolved into real engraved portraits, hunting scenes, biblical scenes, and so on (Urešová, 1965, p.7-8).
Other object types produced in Central Europe were those using double-walled glass with enclosed
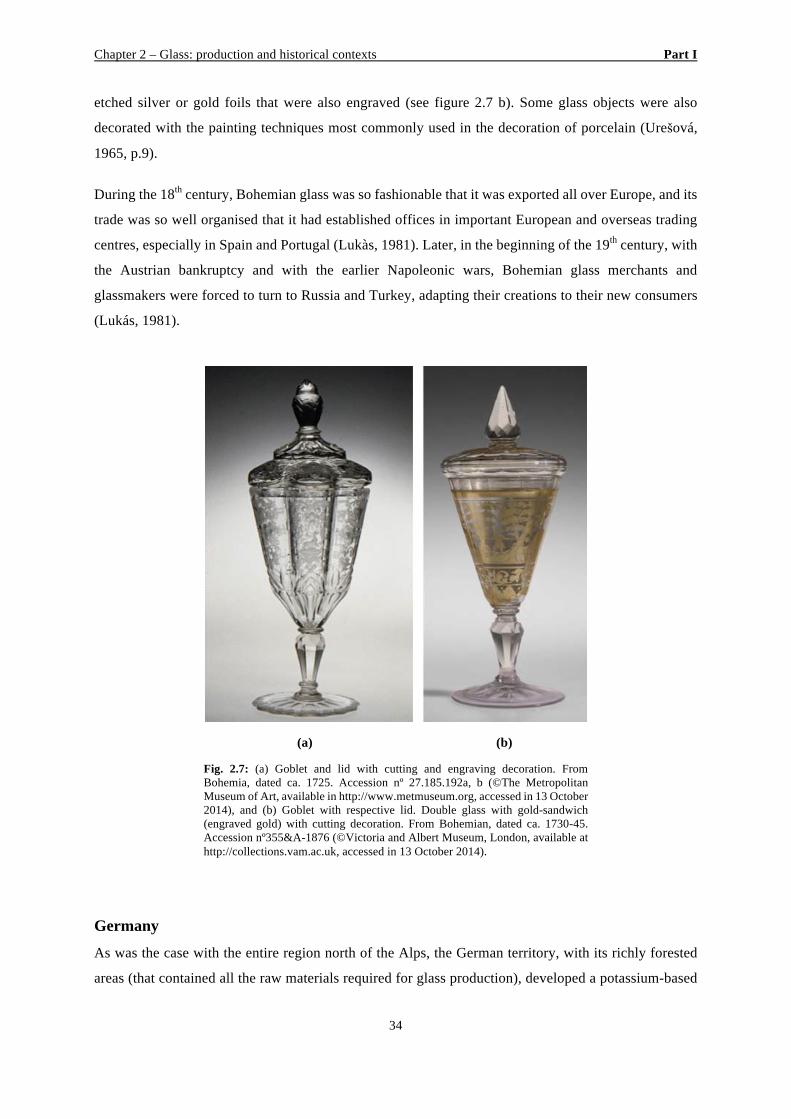
Chapter 2 – Glass: production and historical contexts Part I
34
etched silver or gold foils that were also engraved (see figure 2.7 b). Some glass objects were also
decorated with the painting techniques most commonly used in the decoration of porcelain (Urešová,
1965, p.9).
During the 18th century, Bohemian glass was so fashionable that it was exported all over Europe, and its
trade was so well organised that it had established offices in important European and overseas trading
centres, especially in Spain and Portugal (Lukàs, 1981). Later, in the beginning of the 19th century, with
the Austrian bankruptcy and with the earlier Napoleonic wars, Bohemian glass merchants and
glassmakers were forced to turn to Russia and Turkey, adapting their creations to their new consumers
(Lukás, 1981).
(a) (b)
Fig. 2.7: (a) Goblet and lid with cutting and engraving decoration. From Bohemia, dated ca. 1725. Accession nº 27.185.192a, b (©The Metropolitan Museum of Art, available in http://www.metmuseum.org, accessed in 13 October 2014), and (b) Goblet with respective lid. Double glass with gold-sandwich (engraved gold) with cutting decoration. From Bohemian, dated ca. 1730-45. Accession nº355&A-1876 (©Victoria and Albert Museum, London, available at http://collections.vam.ac.uk, accessed in 13 October 2014).
Germany
As was the case with the entire region north of the Alps, the German territory, with its richly forested
areas (that contained all the raw materials required for glass production), developed a potassium-based
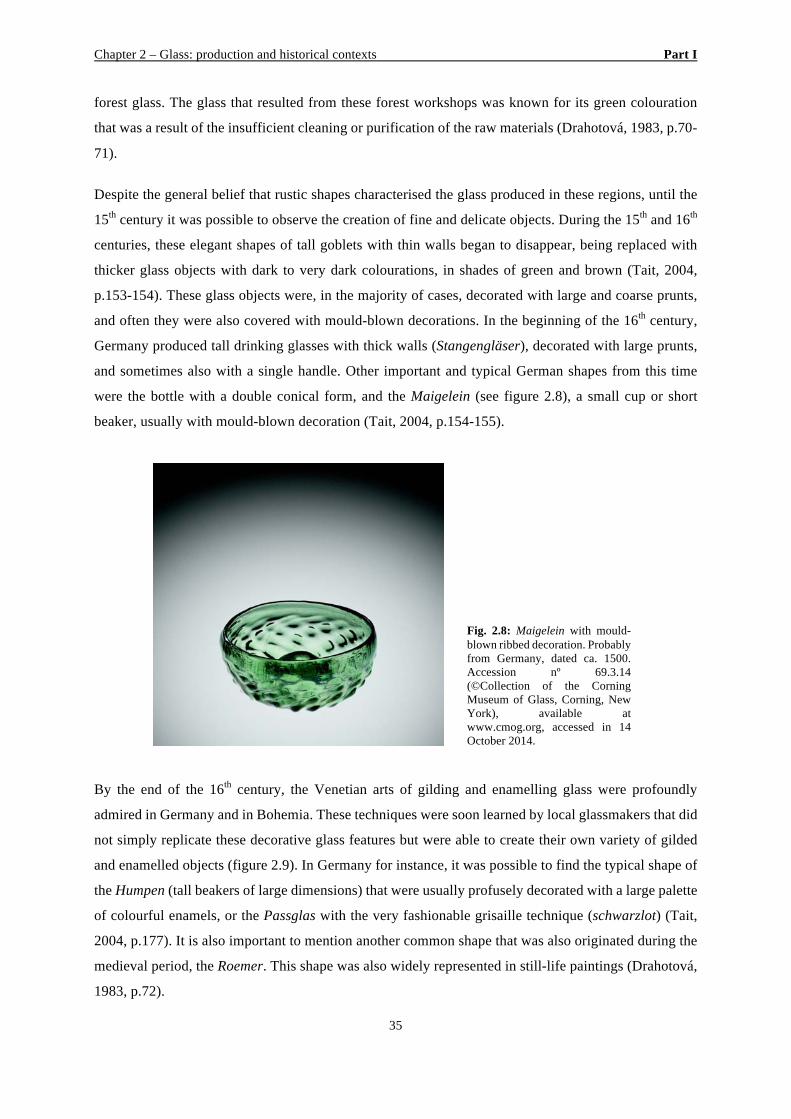
Chapter 2 – Glass: production and historical contexts Part I
35
forest glass. The glass that resulted from these forest workshops was known for its green colouration
that was a result of the insufficient cleaning or purification of the raw materials (Drahotová, 1983, p.70-
71).
Despite the general belief that rustic shapes characterised the glass produced in these regions, until the
15th century it was possible to observe the creation of fine and delicate objects. During the 15th and 16th
centuries, these elegant shapes of tall goblets with thin walls began to disappear, being replaced with
thicker glass objects with dark to very dark colourations, in shades of green and brown (Tait, 2004,
p.153-154). These glass objects were, in the majority of cases, decorated with large and coarse prunts,
and often they were also covered with mould-blown decorations. In the beginning of the 16th century,
Germany produced tall drinking glasses with thick walls (Stangengläser), decorated with large prunts,
and sometimes also with a single handle. Other important and typical German shapes from this time
were the bottle with a double conical form, and the Maigelein (see figure 2.8), a small cup or short
beaker, usually with mould-blown decoration (Tait, 2004, p.154-155).
Fig. 2.8: Maigelein with mould-blown ribbed decoration. Probably from Germany, dated ca. 1500. Accession nº 69.3.14 (©Collection of the Corning Museum of Glass, Corning, New York), available at www.cmog.org, accessed in 14 October 2014.
By the end of the 16th century, the Venetian arts of gilding and enamelling glass were profoundly
admired in Germany and in Bohemia. These techniques were soon learned by local glassmakers that did
not simply replicate these decorative glass features but were able to create their own variety of gilded
and enamelled objects (figure 2.9). In Germany for instance, it was possible to find the typical shape of
the Humpen (tall beakers of large dimensions) that were usually profusely decorated with a large palette
of colourful enamels, or the Passglas with the very fashionable grisaille technique (schwarzlot) (Tait,
2004, p.177). It is also important to mention another common shape that was also originated during the
medieval period, the Roemer. This shape was also widely represented in still-life paintings (Drahotová,
1983, p.72).
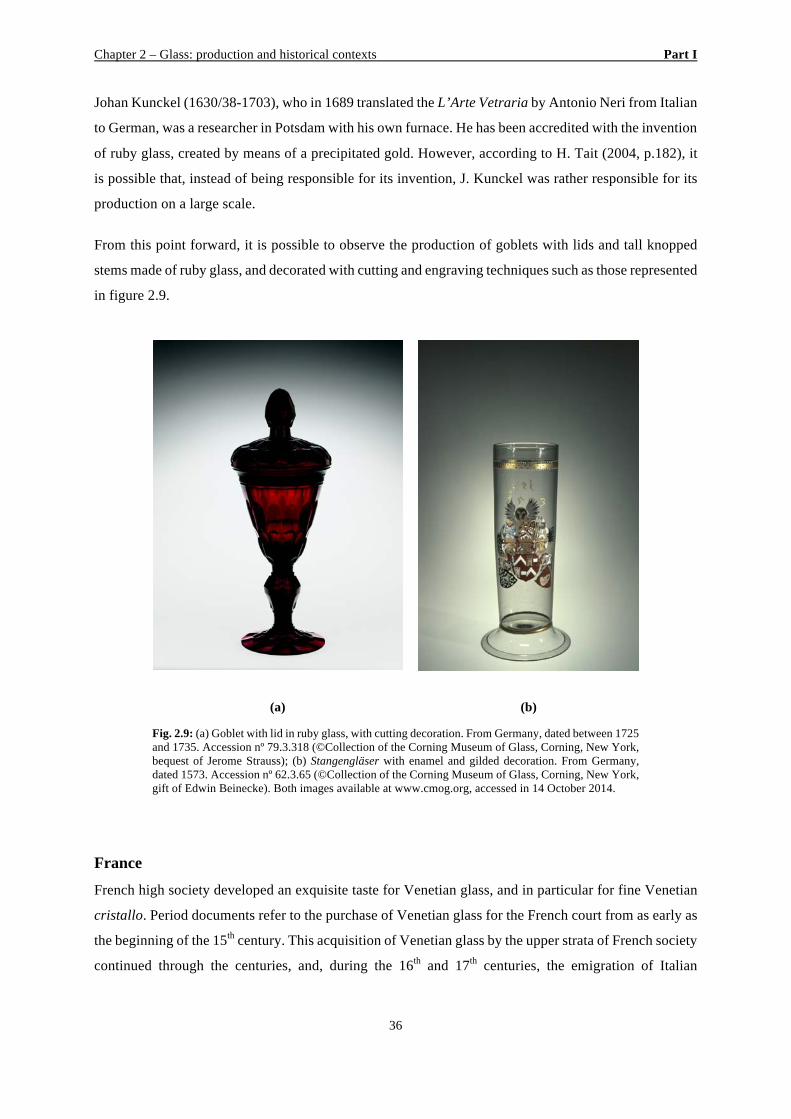
Chapter 2 – Glass: production and historical contexts Part I
36
Johan Kunckel (1630/38-1703), who in 1689 translated the L’Arte Vetraria by Antonio Neri from Italian
to German, was a researcher in Potsdam with his own furnace. He has been accredited with the invention
of ruby glass, created by means of a precipitated gold. However, according to H. Tait (2004, p.182), it
is possible that, instead of being responsible for its invention, J. Kunckel was rather responsible for its
production on a large scale.
From this point forward, it is possible to observe the production of goblets with lids and tall knopped
stems made of ruby glass, and decorated with cutting and engraving techniques such as those represented
in figure 2.9.
(a) (b)
Fig. 2.9: (a) Goblet with lid in ruby glass, with cutting decoration. From Germany, dated between 1725 and 1735. Accession nº 79.3.318 (©Collection of the Corning Museum of Glass, Corning, New York, bequest of Jerome Strauss); (b) Stangengläser with enamel and gilded decoration. From Germany, dated 1573. Accession nº 62.3.65 (©Collection of the Corning Museum of Glass, Corning, New York, gift of Edwin Beinecke). Both images available at www.cmog.org, accessed in 14 October 2014.
France
French high society developed an exquisite taste for Venetian glass, and in particular for fine Venetian
cristallo. Period documents refer to the purchase of Venetian glass for the French court from as early as
the beginning of the 15th century. This acquisition of Venetian glass by the upper strata of French society
continued through the centuries, and, during the 16th and 17th centuries, the emigration of Italian
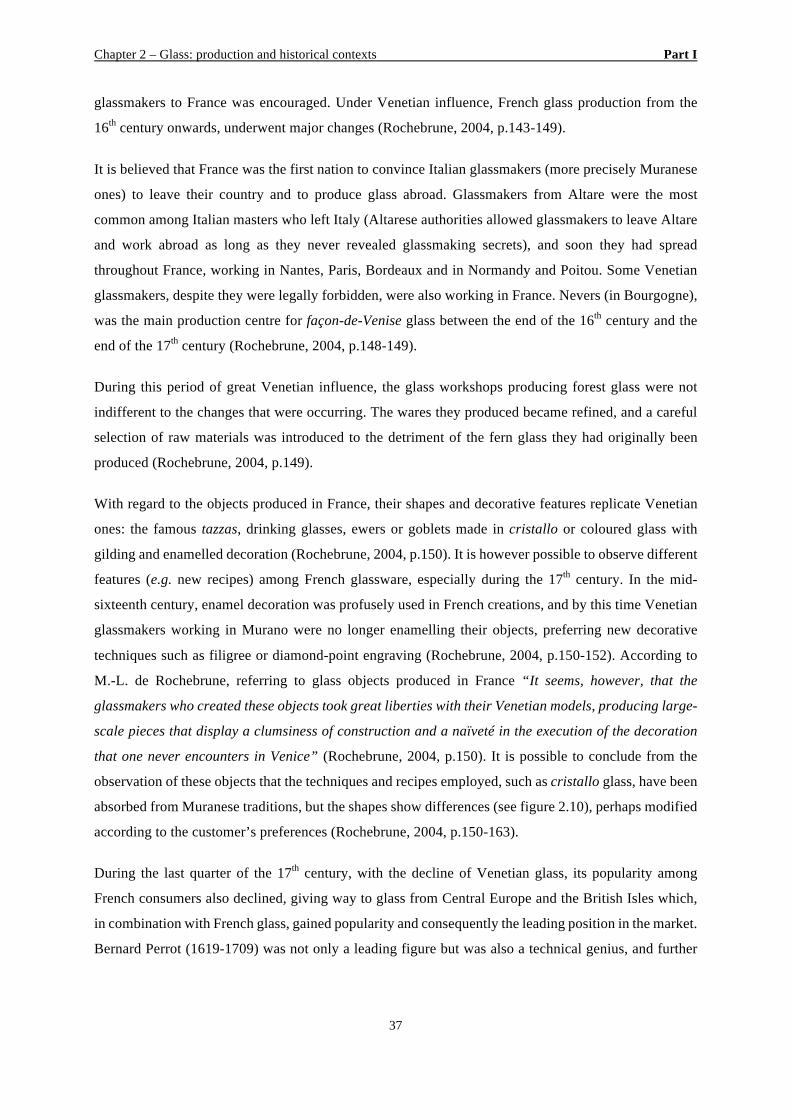
Chapter 2 – Glass: production and historical contexts Part I
37
glassmakers to France was encouraged. Under Venetian influence, French glass production from the
16th century onwards, underwent major changes (Rochebrune, 2004, p.143-149).
It is believed that France was the first nation to convince Italian glassmakers (more precisely Muranese
ones) to leave their country and to produce glass abroad. Glassmakers from Altare were the most
common among Italian masters who left Italy (Altarese authorities allowed glassmakers to leave Altare
and work abroad as long as they never revealed glassmaking secrets), and soon they had spread
throughout France, working in Nantes, Paris, Bordeaux and in Normandy and Poitou. Some Venetian
glassmakers, despite they were legally forbidden, were also working in France. Nevers (in Bourgogne),
was the main production centre for façon-de-Venise glass between the end of the 16th century and the
end of the 17th century (Rochebrune, 2004, p.148-149).
During this period of great Venetian influence, the glass workshops producing forest glass were not
indifferent to the changes that were occurring. The wares they produced became refined, and a careful
selection of raw materials was introduced to the detriment of the fern glass they had originally been
produced (Rochebrune, 2004, p.149).
With regard to the objects produced in France, their shapes and decorative features replicate Venetian
ones: the famous tazzas, drinking glasses, ewers or goblets made in cristallo or coloured glass with
gilding and enamelled decoration (Rochebrune, 2004, p.150). It is however possible to observe different
features (e.g. new recipes) among French glassware, especially during the 17th century. In the mid-
sixteenth century, enamel decoration was profusely used in French creations, and by this time Venetian
glassmakers working in Murano were no longer enamelling their objects, preferring new decorative
techniques such as filigree or diamond-point engraving (Rochebrune, 2004, p.150-152). According to
M.-L. de Rochebrune, referring to glass objects produced in France “It seems, however, that the
glassmakers who created these objects took great liberties with their Venetian models, producing large-
scale pieces that display a clumsiness of construction and a naïveté in the execution of the decoration
that one never encounters in Venice” (Rochebrune, 2004, p.150). It is possible to conclude from the
observation of these objects that the techniques and recipes employed, such as cristallo glass, have been
absorbed from Muranese traditions, but the shapes show differences (see figure 2.10), perhaps modified
according to the customer’s preferences (Rochebrune, 2004, p.150-163).
During the last quarter of the 17th century, with the decline of Venetian glass, its popularity among
French consumers also declined, giving way to glass from Central Europe and the British Isles which,
in combination with French glass, gained popularity and consequently the leading position in the market.
Bernard Perrot (1619-1709) was not only a leading figure but was also a technical genius, and further
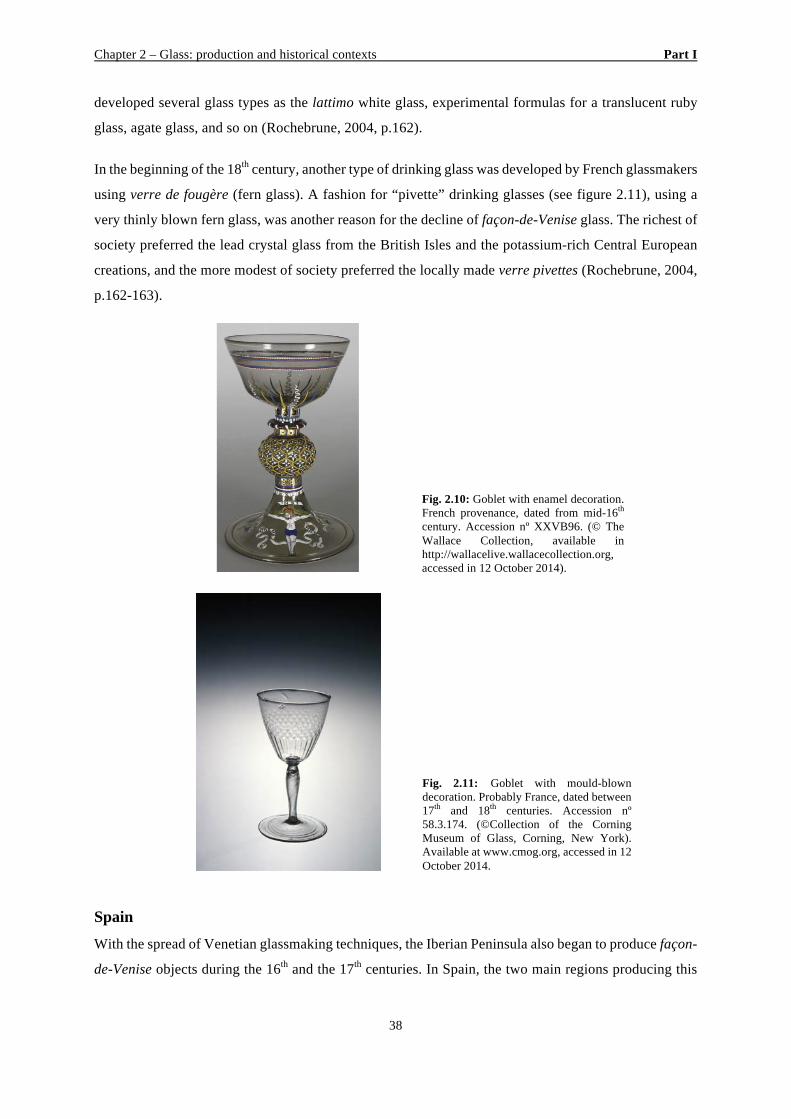
Chapter 2 – Glass: production and historical contexts Part I
38
developed several glass types as the lattimo white glass, experimental formulas for a translucent ruby
glass, agate glass, and so on (Rochebrune, 2004, p.162).
In the beginning of the 18th century, another type of drinking glass was developed by French glassmakers
using verre de fougère (fern glass). A fashion for “pivette” drinking glasses (see figure 2.11), using a
very thinly blown fern glass, was another reason for the decline of façon-de-Venise glass. The richest of
society preferred the lead crystal glass from the British Isles and the potassium-rich Central European
creations, and the more modest of society preferred the locally made verre pivettes (Rochebrune, 2004,
p.162-163).
Fig. 2.10: Goblet with enamel decoration. French provenance, dated from mid-16th century. Accession nº XXVB96. (© The Wallace Collection, available in http://wallacelive.wallacecollection.org, accessed in 12 October 2014).
Fig. 2.11: Goblet with mould-blown decoration. Probably France, dated between 17th and 18th centuries. Accession nº 58.3.174. (©Collection of the Corning Museum of Glass, Corning, New York). Available at www.cmog.org, accessed in 12 October 2014.
Spain
With the spread of Venetian glassmaking techniques, the Iberian Peninsula also began to produce façon-
de-Venise objects during the 16th and the 17th centuries. In Spain, the two main regions producing this
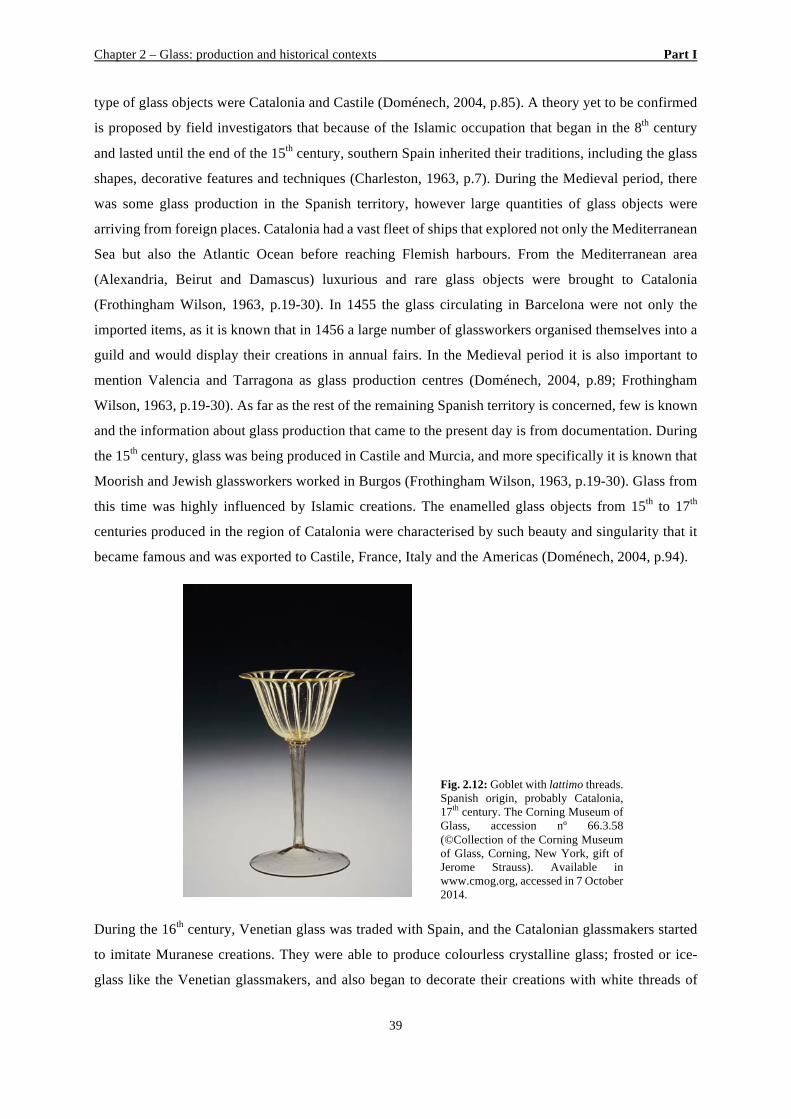
Chapter 2 – Glass: production and historical contexts Part I
39
type of glass objects were Catalonia and Castile (Doménech, 2004, p.85). A theory yet to be confirmed
is proposed by field investigators that because of the Islamic occupation that began in the 8th century
and lasted until the end of the 15th century, southern Spain inherited their traditions, including the glass
shapes, decorative features and techniques (Charleston, 1963, p.7). During the Medieval period, there
was some glass production in the Spanish territory, however large quantities of glass objects were
arriving from foreign places. Catalonia had a vast fleet of ships that explored not only the Mediterranean
Sea but also the Atlantic Ocean before reaching Flemish harbours. From the Mediterranean area
(Alexandria, Beirut and Damascus) luxurious and rare glass objects were brought to Catalonia
(Frothingham Wilson, 1963, p.19-30). In 1455 the glass circulating in Barcelona were not only the
imported items, as it is known that in 1456 a large number of glassworkers organised themselves into a
guild and would display their creations in annual fairs. In the Medieval period it is also important to
mention Valencia and Tarragona as glass production centres (Doménech, 2004, p.89; Frothingham
Wilson, 1963, p.19-30). As far as the rest of the remaining Spanish territory is concerned, few is known
and the information about glass production that came to the present day is from documentation. During
the 15th century, glass was being produced in Castile and Murcia, and more specifically it is known that
Moorish and Jewish glassworkers worked in Burgos (Frothingham Wilson, 1963, p.19-30). Glass from
this time was highly influenced by Islamic creations. The enamelled glass objects from 15th to 17th
centuries produced in the region of Catalonia were characterised by such beauty and singularity that it
became famous and was exported to Castile, France, Italy and the Americas (Doménech, 2004, p.94).
Fig. 2.12: Goblet with lattimo threads. Spanish origin, probably Catalonia, 17th century. The Corning Museum of Glass, accession nº 66.3.58 (©Collection of the Corning Museum of Glass, Corning, New York, gift of Jerome Strauss). Available in www.cmog.org, accessed in 7 October 2014.
During the 16th century, Venetian glass was traded with Spain, and the Catalonian glassmakers started
to imitate Muranese creations. They were able to produce colourless crystalline glass; frosted or ice-
glass like the Venetian glassmakers, and also began to decorate their creations with white threads of
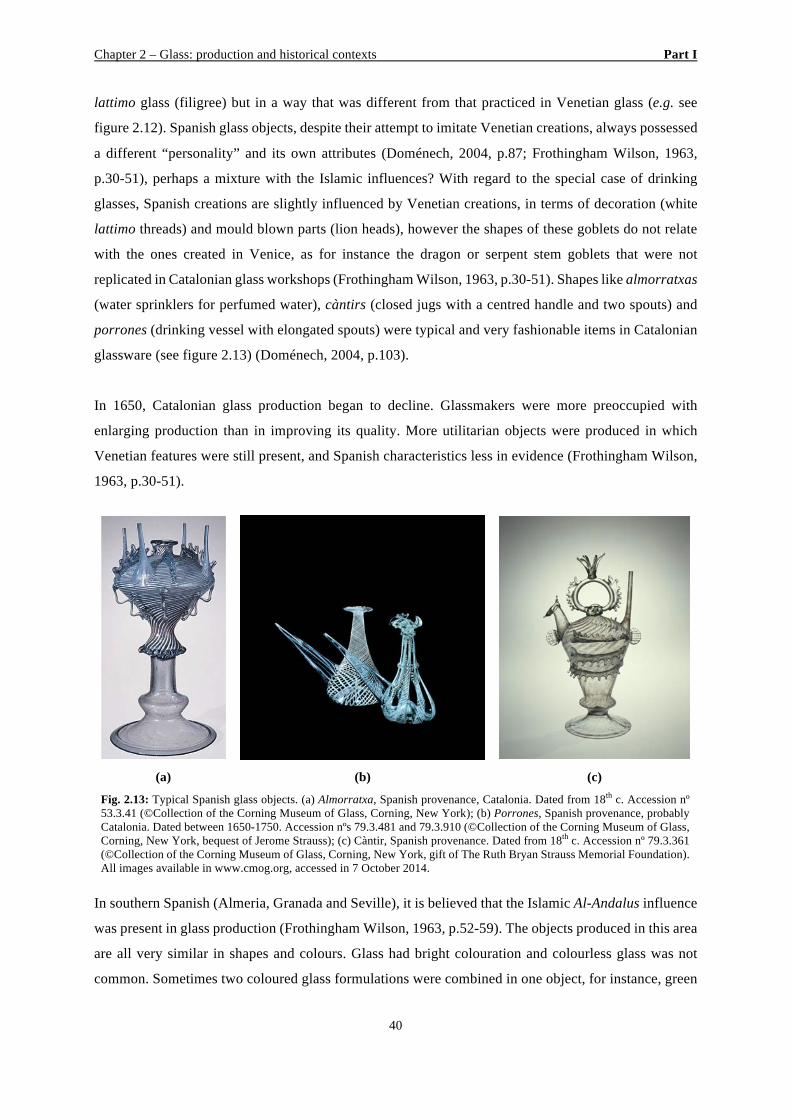
Chapter 2 – Glass: production and historical contexts Part I
40
lattimo glass (filigree) but in a way that was different from that practiced in Venetian glass (e.g. see
figure 2.12). Spanish glass objects, despite their attempt to imitate Venetian creations, always possessed
a different “personality” and its own attributes (Doménech, 2004, p.87; Frothingham Wilson, 1963,
p.30-51), perhaps a mixture with the Islamic influences? With regard to the special case of drinking
glasses, Spanish creations are slightly influenced by Venetian creations, in terms of decoration (white
lattimo threads) and mould blown parts (lion heads), however the shapes of these goblets do not relate
with the ones created in Venice, as for instance the dragon or serpent stem goblets that were not
replicated in Catalonian glass workshops (Frothingham Wilson, 1963, p.30-51). Shapes like almorratxas
(water sprinklers for perfumed water), càntirs (closed jugs with a centred handle and two spouts) and
porrones (drinking vessel with elongated spouts) were typical and very fashionable items in Catalonian
glassware (see figure 2.13) (Doménech, 2004, p.103).
In 1650, Catalonian glass production began to decline. Glassmakers were more preoccupied with
enlarging production than in improving its quality. More utilitarian objects were produced in which
Venetian features were still present, and Spanish characteristics less in evidence (Frothingham Wilson,
1963, p.30-51).
In southern Spanish (Almeria, Granada and Seville), it is believed that the Islamic Al-Andalus influence
was present in glass production (Frothingham Wilson, 1963, p.52-59). The objects produced in this area
are all very similar in shapes and colours. Glass had bright colouration and colourless glass was not
common. Sometimes two coloured glass formulations were combined in one object, for instance, green
(a) (b) (c)
Fig. 2.13: Typical Spanish glass objects. (a) Almorratxa, Spanish provenance, Catalonia. Dated from 18th c. Accession nº 53.3.41 (©Collection of the Corning Museum of Glass, Corning, New York); (b) Porrones, Spanish provenance, probably Catalonia. Dated between 1650-1750. Accession nºs 79.3.481 and 79.3.910 (©Collection of the Corning Museum of Glass, Corning, New York, bequest of Jerome Strauss); (c) Càntir, Spanish provenance. Dated from 18th c. Accession nº 79.3.361 (©Collection of the Corning Museum of Glass, Corning, New York, gift of The Ruth Bryan Strauss Memorial Foundation). All images available in www.cmog.org, accessed in 7 October 2014.
Chapter 2 – Glass: production and historical contexts Part I
41
and amber tonalities. The attempts to decolourise the batch resulted in colourless glass with shades of
smoky yellow or amber, as shown in figure 2.12 (Frothingham Wilson, 1963, p.52-59). This amber
tonality so typical of Catalonian glass is the result of the method used to remove colour. To the soda-
rich vegetable ashes, glassmakers added chalcedony or bloodstone (pedra sanguina) as decolourising
agents (Doménech, 2004, p.95). The author does not clearly indicate the source of this information, but
mentions that the manuscript written by the Jesuit priest Pere Gil entitled Historia natural de Cataluña,
provides information on various glass recipes (Doménech, 2004, p.88, 95). About the Catalonian glass,
it is however mentioned in his manuscript that a glass of superior quality was made with tartar (and not
with barilla) to which a small amount of bloodstone from Genoa was added (Doménech, 2004, p.88).
During the 17th century, many glassmakers from Italy and from Flanders moved to settle in Castile. In
the centres for glass production, attempts were made to produce colourless crystalline glass with local
raw materials; however the glass always appeared a little green or with yellowish/greyish shade. The
shapes resembled Flemish works as well as Venetian objects (Frothingham Wilson, 1963, p.60-71).
However, once again Spanish personality was imprinted in objects with unconventional proportions and
with no enamelling or engraved decoration so typical of Venetian glass (Doménech, 2004, p.104-105).
During the 17th century, the recipes and techniques from L’Arte Vetraria written by Antonio Neri were
available and circulating among glassmakers all over Europe. In El tratado de la fábrica de vidrio8, by
Juan Danís, a Spanish glassmaker, it is written that façon-de-Venise glass was being produced at San
Martín de Valdeiglesias (Doménech, 2004, p.104-105). The same source also tells us that the strongest
barilla9 was from Cieza near Cartagena, and the barilla from which the best colourless glass was
produced came- from the salty marshes around Murcia and Alicante (Frothingham Wilson, 1963, p.60-
71). Later, barilla from Alicante was exported to Venice to be employed in glass production there (Verità
& Zecchin, 2009a, p.603). In theory, glass produced across Spain had a soda-rich formulation.
Glassmakers collected their alkaline raw materials near sea salty shores where species such as Salsola
soda or Kali hispanica and Salicornia sp. grow.
In the beginning of the 18th century, the Real Fábrica de Cristales de La Granja10, in La Granja de San
Ildefonso (Segovia) was created. This manufactory started in 1727 with only one furnace run by the
Catalan glassworker Ventura Sit, and soon (approximately 1737), because of the interest taken by Queen
Isabel Farnese in the glass that was produced in that furnace, the manufactory was extended. With the
8 Treatise on the glass manufactory 9 Here it is not clear what the author means by “the strongest barilla”. 10 The Royal Manufactory of Crystals in La Granja.
Chapter 2 – Glass: production and historical contexts Part I
42
growth of the manufactory, more glassworkers were hired, not only from Spain but also from abroad,
for instance French and Swedish workers (Frothingham Wilson, 1963, p.72-87; Pastor Rey de Viñas,
1994, p.11). In 1775, the manufactory was producing the largest mirrors across Europe. This
manufactory produced not only mirrors, but also blown crystal glass11, and tableware, and the glass
objects were then decorated with cutting and engraving techniques (Frothingham Wilson, 1963, p.72-
87). In 1809, the manufactory suffered its first interruption in glass production. After this closure, the
responsibility for production was taken over by private administration, and the ruling monarch no longer
had absolute control over the manufactory. In 1820, the name of the manufactory was changed to Fábrica
Nacional de Cristales12 (Pastor Rey de Viñas, 1994, p.4).
An important comprehensive archaeometric study on Early Modern glass from Spain comes from a
recent archaeological excavation performed on the city of Palma, Mallorca (Capellà Galmés & Albero
Santacreu, 2015). The furnace is dated from the second-half of the 17th century, and from its excavation
several glass production remains were unearthed. The glass retrieved from this excavation presents
diverse colourations and hues of green, blue and purple (Capellà Galmés & Albero Santacreu, 2015).
Purple glass is considered rare and is usually related with luxury objects. Glass with this colour was
produced in Catalonia during the 16th and 17th centuries. A recipe to produce this glass was found in the
Balearic Library, in a Majorcan recipe book with recipes dated before 1841 (the document compiles
recipes used by several generations and the last one added dates from 1841) (Capellà Galmés & Albero
Santacreu, 2015). The recipe that is described refers to a glass made with manganese oxide, where for
each ounce of this component, one should add one pound of barilla. It is however worth noting here that
purple glass appeared in two archaeological contexts considered for this dissertation. In Santa Clara-a-
Velha Monastery this glass is quite abundant and generally appears associated with globular flasks and
gourds, two vessel shapes considered by T. Medici (2014) of possible Portuguese production, since no
examples in coeval European glass are known. Considering the employed silica sources, it is known that
a quartz sandstone was collected in Northern Mallorca (Banyalbufar, Serra de Tramuntana), from 1413
to 19th century. Considering the alkali source, the use of barilla is documented and it was harvested in
Mallorca, mainly from the south areas of the island (Capellà Galmés & Albero Santacreu, 2015). Barilla
from Alicante was also brought and used in Mallorca.
It is also important to keep in mind glass recycling. In this period it is possible to find registered great
amounts of broken glass, probably retrieved by itinerants selling glass that sometimes traded the new
11 The author does not clarify if the crystal glass from the La Granja de San Ildefonso manufactory was produced with lead. It is just mentioned that in terms of decoration and shape the glass objects resembled the glass produced in the British Isles. 12 National manufactory of Crystals.
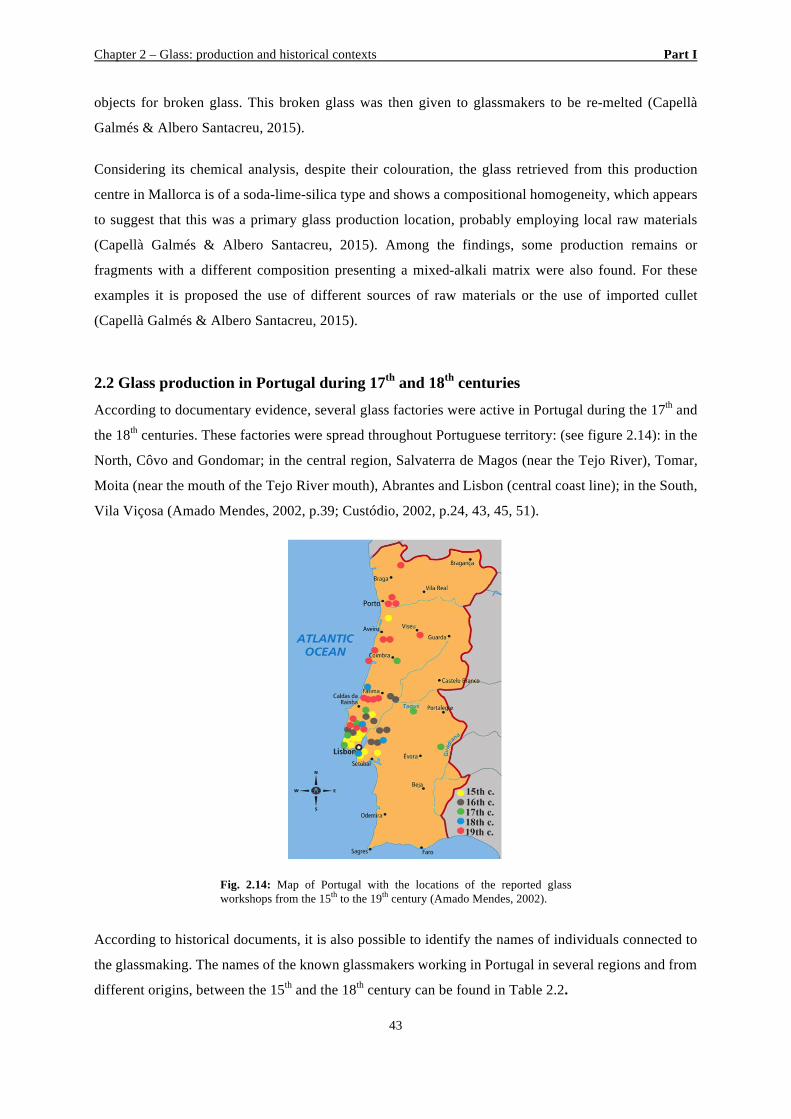
Chapter 2 – Glass: production and historical contexts Part I
43
objects for broken glass. This broken glass was then given to glassmakers to be re-melted (Capellà
Galmés & Albero Santacreu, 2015).
Considering its chemical analysis, despite their colouration, the glass retrieved from this production
centre in Mallorca is of a soda-lime-silica type and shows a compositional homogeneity, which appears
to suggest that this was a primary glass production location, probably employing local raw materials
(Capellà Galmés & Albero Santacreu, 2015). Among the findings, some production remains or
fragments with a different composition presenting a mixed-alkali matrix were also found. For these
examples it is proposed the use of different sources of raw materials or the use of imported cullet
(Capellà Galmés & Albero Santacreu, 2015).
2.2 Glass production in Portugal during 17th and 18th centuries
According to documentary evidence, several glass factories were active in Portugal during the 17th and
the 18th centuries. These factories were spread throughout Portuguese territory: (see figure 2.14): in the
North, Côvo and Gondomar; in the central region, Salvaterra de Magos (near the Tejo River), Tomar,
Moita (near the mouth of the Tejo River mouth), Abrantes and Lisbon (central coast line); in the South,
Vila Viçosa (Amado Mendes, 2002, p.39; Custódio, 2002, p.24, 43, 45, 51).
Fig. 2.14: Map of Portugal with the locations of the reported glass workshops from the 15th to the 19th century (Amado Mendes, 2002).
According to historical documents, it is also possible to identify the names of individuals connected to
the glassmaking. The names of the known glassmakers working in Portugal in several regions and from
different origins, between the 15th and the 18th century can be found in Table 2.2.
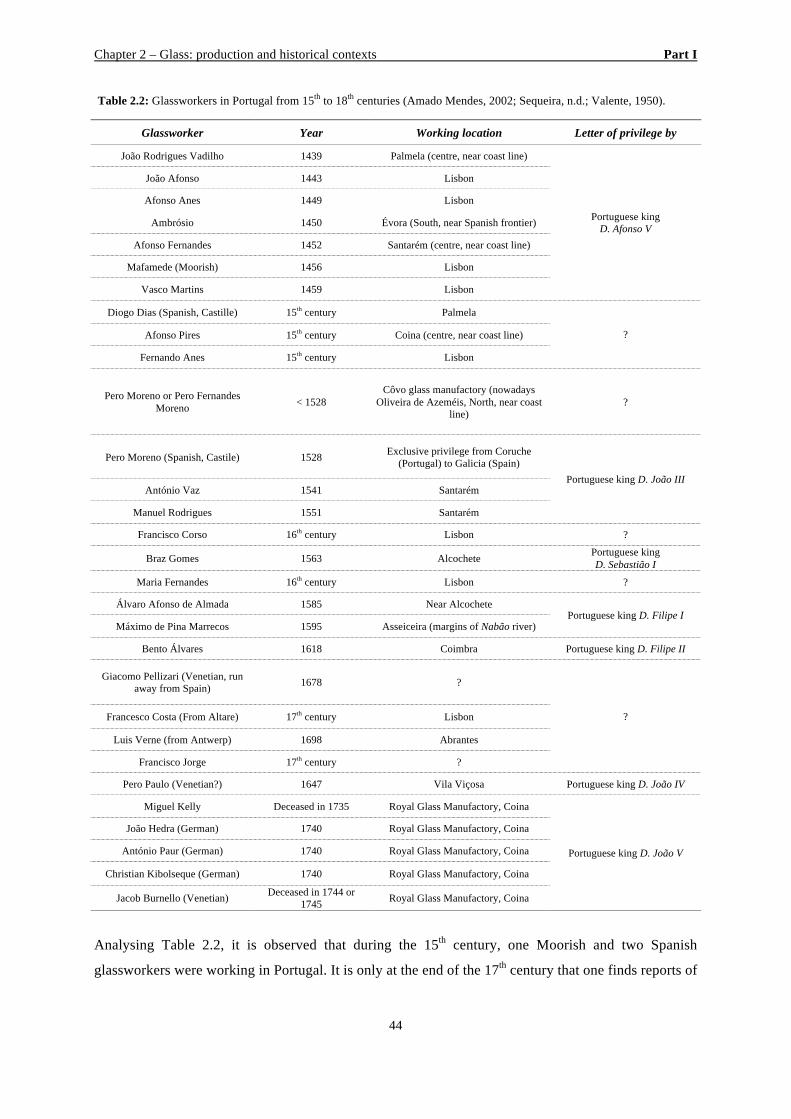
Chapter 2 – Glass: production and historical contexts Part I
44
Table 2.2: Glassworkers in Portugal from 15th to 18th centuries (Amado Mendes, 2002; Sequeira, n.d.; Valente, 1950).
Glassworker Year Working location Letter of privilege by
João Rodrigues Vadilho 1439 Palmela (centre, near coast line)
Portuguese king D. Afonso V
João Afonso 1443 Lisbon
Afonso Anes 1449 Lisbon
Ambrósio 1450 Évora (South, near Spanish frontier)
Afonso Fernandes 1452 Santarém (centre, near coast line)
Mafamede (Moorish) 1456 Lisbon
Vasco Martins 1459 Lisbon
Diogo Dias (Spanish, Castille) 15th century Palmela
? Afonso Pires 15th century Coina (centre, near coast line)
Fernando Anes 15th century Lisbon
Pero Moreno or Pero Fernandes Moreno < 1528
Côvo glass manufactory (nowadays Oliveira de Azeméis, North, near coast
line) ?
Pero Moreno (Spanish, Castile) 1528 Exclusive privilege from Coruche (Portugal) to Galicia (Spain)
Portuguese king D. João III António Vaz 1541 Santarém
Manuel Rodrigues 1551 Santarém
Francisco Corso 16th century Lisbon ?
Braz Gomes 1563 Alcochete Portuguese king D. Sebastião I
Maria Fernandes 16th century Lisbon ?
Álvaro Afonso de Almada 1585 Near Alcochete Portuguese king D. Filipe I
Máximo de Pina Marrecos 1595 Asseiceira (margins of Nabão river)
Bento Álvares 1618 Coimbra Portuguese king D. Filipe II
Giacomo Pellizari (Venetian, run away from Spain) 1678 ?
? Francesco Costa (From Altare) 17th century Lisbon
Luis Verne (from Antwerp) 1698 Abrantes
Francisco Jorge 17th century ?
Pero Paulo (Venetian?) 1647 Vila Viçosa Portuguese king D. João IV
Miguel Kelly Deceased in 1735 Royal Glass Manufactory, Coina
Portuguese king D. João V
João Hedra (German) 1740 Royal Glass Manufactory, Coina
António Paur (German) 1740 Royal Glass Manufactory, Coina
Christian Kibolseque (German) 1740 Royal Glass Manufactory, Coina
Jacob Burnello (Venetian) Deceased in 1744 or 1745 Royal Glass Manufactory, Coina
Analysing Table 2.2, it is observed that during the 15th century, one Moorish and two Spanish
glassworkers were working in Portugal. It is only at the end of the 17th century that one finds reports of
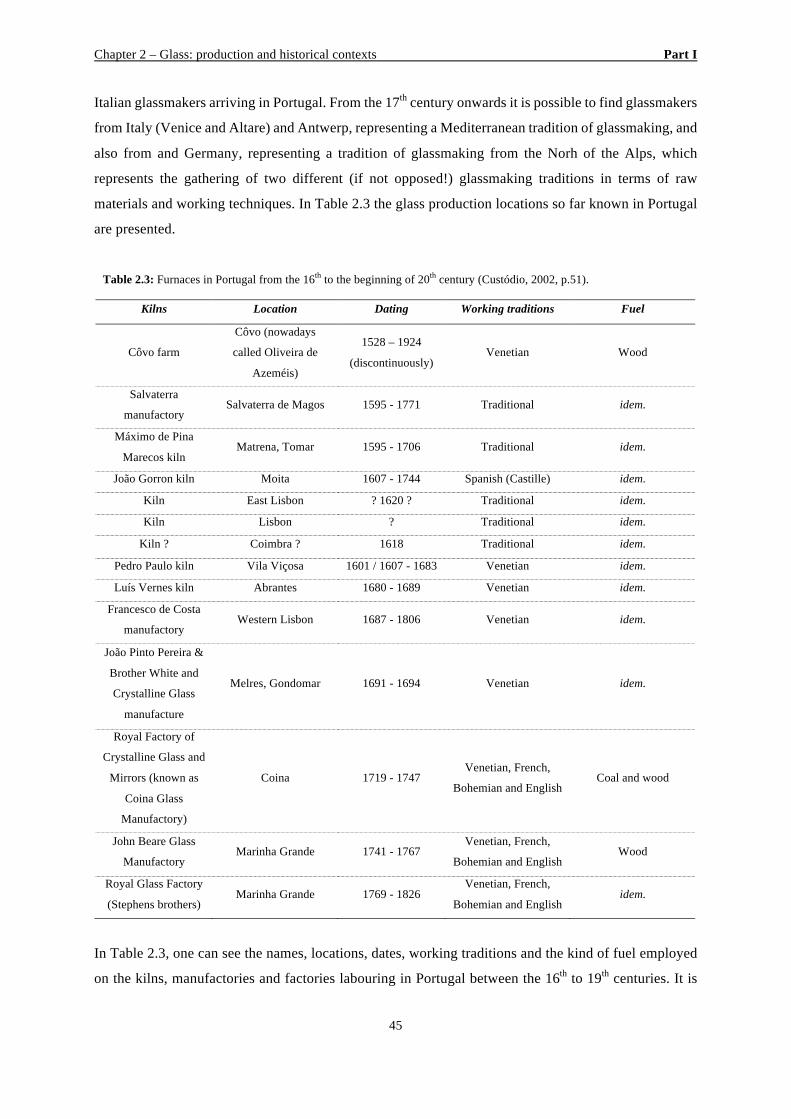
Chapter 2 – Glass: production and historical contexts Part I
45
Italian glassmakers arriving in Portugal. From the 17th century onwards it is possible to find glassmakers
from Italy (Venice and Altare) and Antwerp, representing a Mediterranean tradition of glassmaking, and
also from and Germany, representing a tradition of glassmaking from the Norh of the Alps, which
represents the gathering of two different (if not opposed!) glassmaking traditions in terms of raw
materials and working techniques. In Table 2.3 the glass production locations so far known in Portugal
are presented.
In Table 2.3, one can see the names, locations, dates, working traditions and the kind of fuel employed
on the kilns, manufactories and factories labouring in Portugal between the 16th to 19th centuries. It is
Table 2.3: Furnaces in Portugal from the 16th to the beginning of 20th century (Custódio, 2002, p.51).
Kilns Location Dating Working traditions Fuel
Côvo farm
Côvo (nowadays
called Oliveira de
Azeméis)
1528 – 1924
(discontinuously) Venetian Wood
Salvaterra
manufactory Salvaterra de Magos 1595 - 1771 Traditional idem.
Máximo de Pina
Marecos kiln Matrena, Tomar 1595 - 1706 Traditional idem.
João Gorron kiln Moita 1607 - 1744 Spanish (Castille) idem.
Kiln East Lisbon ? 1620 ? Traditional idem.
Kiln Lisbon ? Traditional idem.
Kiln ? Coimbra ? 1618 Traditional idem.
Pedro Paulo kiln Vila Viçosa 1601 / 1607 - 1683 Venetian idem.
Luís Vernes kiln Abrantes 1680 - 1689 Venetian idem.
Francesco de Costa
manufactory Western Lisbon 1687 - 1806 Venetian idem.
João Pinto Pereira &
Brother White and
Crystalline Glass
manufacture
Melres, Gondomar 1691 - 1694 Venetian idem.
Royal Factory of
Crystalline Glass and
Mirrors (known as
Coina Glass
Manufactory)
Coina 1719 - 1747 Venetian, French,
Bohemian and English Coal and wood
John Beare Glass
Manufactory Marinha Grande 1741 - 1767
Venetian, French,
Bohemian and English Wood
Royal Glass Factory
(Stephens brothers) Marinha Grande 1769 - 1826
Venetian, French,
Bohemian and English idem.
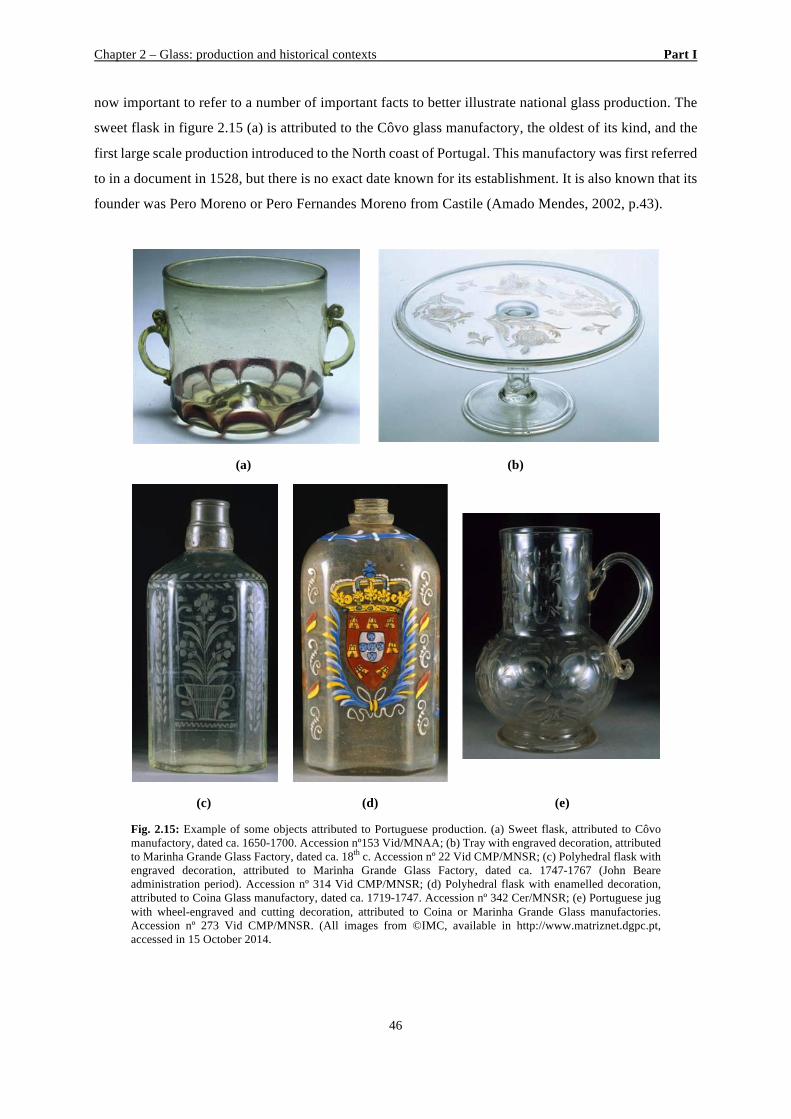
Chapter 2 – Glass: production and historical contexts Part I
46
now important to refer to a number of important facts to better illustrate national glass production. The
sweet flask in figure 2.15 (a) is attributed to the Côvo glass manufactory, the oldest of its kind, and the
first large scale production introduced to the North coast of Portugal. This manufactory was first referred
to in a document in 1528, but there is no exact date known for its establishment. It is also known that its
founder was Pero Moreno or Pero Fernandes Moreno from Castile (Amado Mendes, 2002, p.43).
(a) (b)
(c) (d) (e)
Fig. 2.15: Example of some objects attributed to Portuguese production. (a) Sweet flask, attributed to Côvo manufactory, dated ca. 1650-1700. Accession nº153 Vid/MNAA; (b) Tray with engraved decoration, attributed to Marinha Grande Glass Factory, dated ca. 18th c. Accession nº 22 Vid CMP/MNSR; (c) Polyhedral flask with engraved decoration, attributed to Marinha Grande Glass Factory, dated ca. 1747-1767 (John Beare administration period). Accession nº 314 Vid CMP/MNSR; (d) Polyhedral flask with enamelled decoration, attributed to Coina Glass manufactory, dated ca. 1719-1747. Accession nº 342 Cer/MNSR; (e) Portuguese jug with wheel-engraved and cutting decoration, attributed to Coina or Marinha Grande Glass manufactories. Accession nº 273 Vid CMP/MNSR. (All images from ©IMC, available in http://www.matriznet.dgpc.pt, accessed in 15 October 2014.
Chapter 2 – Glass: production and historical contexts Part I
47
According to Amado Mendes (2002, p.44-45), all the necessary conditions for glass production were
gathered together in the location chosen to establish this manufactory. It was close to clay deposits used
for the crucibles, it was surrounded by large areas of forest for furnace fuel, the quartz pebbles used as
the silica source were collect only a few kilometres away in Vermoim, and finally, it had an abundance
of water for the mills to use for the crushing of quartz pebbles (Amado Mendes, 2002, p.44-45). The
letter of privilege given to Pero Moreno gave him not only the right to manufacture glass in the Côvo
glass manufactory, but also the exclusivity for the selling and producing glass, from village of Coruche
up to the frontier with Galicia (Amado Mendes, 2002, p. 45). Information about the type of objects being
produced in the manufactory is scarce; however it is reported that during the 17th century its production
was dedicated to utilitarian objects (more precisely bottles, vessels with one wing and ewers), and that
more delicate glass objects came from abroad (Amado Mendes, 2002, p. 45). During the 18th century,
the Côvo glass manufactory produced mainly green glass, but by the end of the same century is was
producing glass panes, bottles, drinking glasses and crystal (Amado Mendes, 2002, p. 45). So far no
document has been found that might elucidate if this manufactory produced potassium-rich or soda-rich
glass, or even if it started producing lead crystal glass during the 18th century. Due to its proximity to
the coastline, and consequently to soda-rich plants (e.g. Salsola Kali), it would be expected that a soda-
rich composition was produced in the Côvo glass manufactory.
In 2009 an archaeological excavation promoted by the Municipality of Oliveira de Azeméis was carried
out in the location of the Côvo glass manufactory with the intent of identifying the location of the glass
furnaces (Almeida e Silva, 2012, p.2). During this investigation a large number of quartz pebbles were
found, already grinded in different grain sizes (Almeida e Silva, 2012, p.22-23; Garcia, 2009, p.47),
meaning that some of them were already being prepared to be introduced into the glass batch. Glass
fragments of different colours, as well as fragments of glass panes, were also recovered. It was not
possible to date these fragments (Garcia, 2009, p.47).
No catalogue has been ever found depicting the objects produced in the Côvo glass manufactory; so that
all the museum objects attributed to it are the result of pure speculation. It is also a known fact that the
Côvo muleteers distributed glass from this manufacture in the Minho region, Douro region and in
Estremadura (Custódio, 2002, p.54). In order to proceed to a proper attribution, one can only rely on
chemical analysis performed on the objects in order to compare compositions with production remains
of glass to be collected in a future major archaeological excavation in the location of the Côvo glass
manufactory.
On the south bank of the Tejo River, the kilns from Salvaterra de Magos and Moita were very important
glassmaking points, and their furnaces were precursors of the Coina glass manufactory. In an official
document, the Portuguese king D. Sebastião (ruled between 1557 and 1578) recognised the existence of
Chapter 2 – Glass: production and historical contexts Part I
48
several kilns producing glass in such quantities that the glass imports from foreign countries were
forbidden (Custódio, 2002, p.50). In 1625/26 the Côvo lords considered the glass production from
Salvaterra de Magos as one of the best in Portugal. In 1768, a contract was made between two German
entrepreneurs (João Galo and João Jorge) and this glass manufactory, with the intent of making its
production closer to that of the Bohemian tradition (Custódio, 2002, p.52, 54). During the 17th century,
the Moita manufactory was producing glass regularly, and its activity continued until the middle of the
18th century.
It is known that the kiln established in Matrena, Tomar was built near the Nabão River during the
Philippine dynasty (1581 – 1640) by a local nobleman (Máximo de Pina Marecos). This furnace was
prepared to work with hydraulic energy and used sand from Peralva (location near Tomar) as a silica
source (Custódio, 2002, p.50, 52).
As far as the kiln that was built in Vila Viçosa (South of Portugal) is concerned, it was directly related
to Portuguese royalty, since it was contiguous to the Palace of the Dukes of Bragança. A few references
to the glass produced in this kiln were found in private letters, which mention that it was of great quality,
and that the person responsible for its production was a Venetian glassmaker called Pero Paulo
(Custódio, 2002, p.44). This kiln was prepared to labour day and night, and it is known that it consumed
large amounts of wood as furnace fuel. It is also mentioned that in this production centre some of the
raw materials employed needed to be ground or crushed like the quartz pebbles that were employed as
silica source, and also that magnesium was employed. Historical documents report on the several
consignments of glass objects from this manufacture that were sold by muleteers, but no mention is
made as to the regions where this occurred (Custódio, 2002, p.45).
As no catalogue is known which refers to the kilns and manufactures reported above, and also lacking
any material from archaeological excavations to compare forms and chemical compositions, it can be
said that no glass objects are known from this source.
It was only in the 18th century, in a period after these small beginnings, during the reign of D. João V
(1698-1750), that the Portuguese glass industry enjoyed a great development. In 1719, this Portuguese
king, that had a passion for glass, ordered the installation of a Royal Glass Factory in Coina (located in
the centre/south-west of Portugal and only a few kilometres from the coast line) (Amado Mendes, 2002,
p.56; Custódio 2002, p.71). This manufactory employed glassmakers from Catalonia, England, Ireland,
Flanders, Italy, and Germany, and from 1731 to 1747 it was managed by foreign administrators, such as
the Englishmen Joam Butler (1731-1737) and Joam Poutz (1737-1741), and the Irishman John Beare
(1741-1747) (Custódio, 2002, p.101). Some of the workers’ names linked to the factory were discovered
in the parish records of Coina, however their roles inside the factory are unknown. Despite the lack of
Chapter 2 – Glass: production and historical contexts Part I
49
information on these people’s roles, it is important to point out that their different countries of origin
such as Spain, England, Ireland, Flanders, Germany, and Italy (Venice) were found in the records,
thereby recording the creation of a multicultural community (Custódio, 2002, p.135-137). It is not
unreasonable to think that some of these people would be the family members of some of the
glassworkers at the factory, thus providing an idea of the origins of the glass masters who worked there.
Their origins are linked to different traditions in glass production techniques.
With reference to the region of Coina, it was a very important village from the south bank of Tejo River.
It was the county seat, fluvial harbour and the connection point (by land) to the city of Setúbal (Custódio,
2002, p.79). In addition, this region was rich in sand, and in wood that provided the kilns in fuel. Its
proximity to the fluvial harbour was also fundamental for transactions and the commercialisation of the
glass produced in the factory. Production in the Coina Royal Glass factory included bottles, lead glass
and clear glass. The items produced followed the style and technology of the productions dominating
the market, and bottles were made in French and English style, and goblets and other vessels in Venetian
and Central European style (Custódio, 2002, p.176-181, 215).
According to J. Custódio (2002, p.213), the Coina glass factory produced bottles for both private
customers (green and clear glass bottles, with smaller sizes) and more industrially (larger bottles in green
or black glass). Between 1719 and 1747 there were essentially two major types of bottle shapes –
globular or onion bottles (free blown in terms of the production technique) and cylindrical bottles (free
blown or dip moulding techniques). The square bottles, commonly made all over Europe, were also
produced in this factory (Custódio, 2002, p.215).
In 1747, when John Beare administrated the manufactory, it was closed because of its large wood
consumption, and transferred to Marinha Grande, where more pinewood was available. The
manufactory continued its activity there with only a few interruptions until 1992 (see figure 2.16)
(Amado Mendes, 2002, p.59, 62; Custódio, 2002, p.229, 232).
Archaeological excavations were carried out both in the area where the Coina glass manufactory had
been established (Custódio, 2002, p.13), and in the Marinha Grande location. Some of the glass
fragments recovered and believed to belong both to the Coina and Marinha Grande manufactories,
spanning from the 18th to the 20th century, were analysed and only preliminary results were published
(Lopes et al., 2009; Schalm et al., 2005). Nevertheless, it has been possible to identify some
compositions that seem to be strictly related to local productions.
In terms of the shapes attributed to Portuguese provenance that are today spread throughout national
museums, they are mainly attributed to the Côvo manufactory, the Coina Royal Glass Factory, and, as
a result of comparisons with catalogues, to the Marinha Grande Royal Glass Factory. In figure 2.15, it
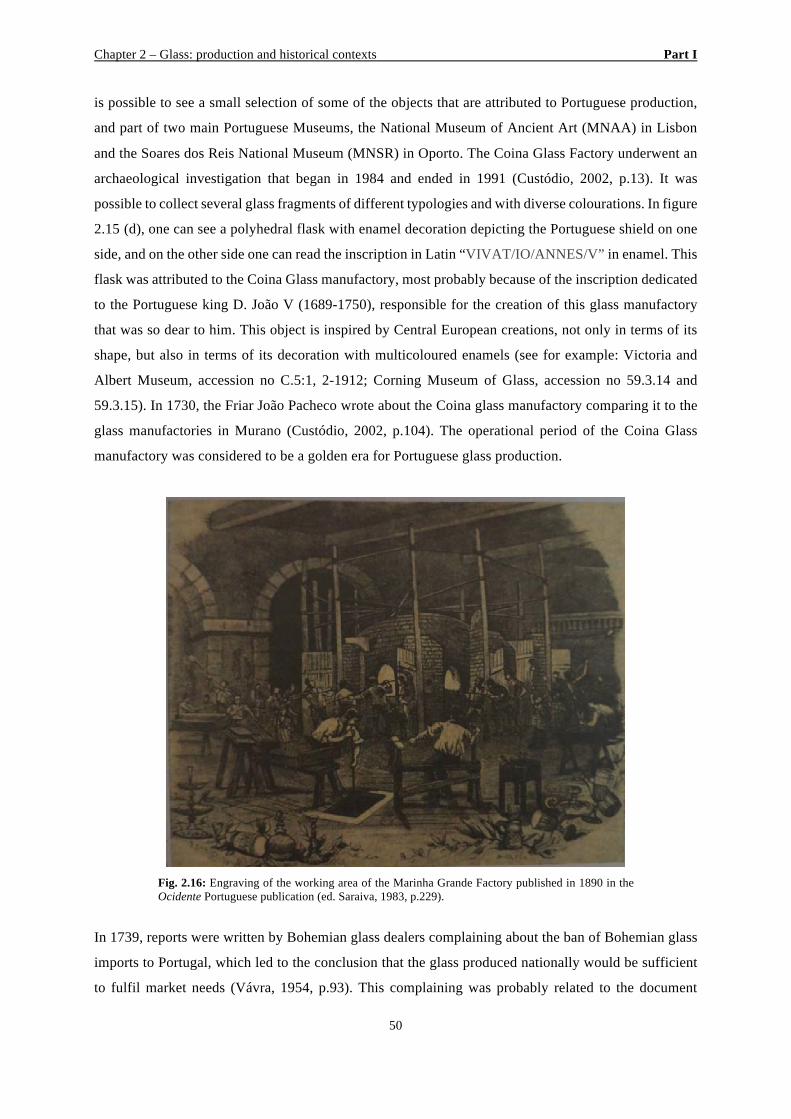
Chapter 2 – Glass: production and historical contexts Part I
50
is possible to see a small selection of some of the objects that are attributed to Portuguese production,
and part of two main Portuguese Museums, the National Museum of Ancient Art (MNAA) in Lisbon
and the Soares dos Reis National Museum (MNSR) in Oporto. The Coina Glass Factory underwent an
archaeological investigation that began in 1984 and ended in 1991 (Custódio, 2002, p.13). It was
possible to collect several glass fragments of different typologies and with diverse colourations. In figure
2.15 (d), one can see a polyhedral flask with enamel decoration depicting the Portuguese shield on one
side, and on the other side one can read the inscription in Latin “VIVAT/IO/ANNES/V” in enamel. This
flask was attributed to the Coina Glass manufactory, most probably because of the inscription dedicated
to the Portuguese king D. João V (1689-1750), responsible for the creation of this glass manufactory
that was so dear to him. This object is inspired by Central European creations, not only in terms of its
shape, but also in terms of its decoration with multicoloured enamels (see for example: Victoria and
Albert Museum, accession no C.5:1, 2-1912; Corning Museum of Glass, accession no 59.3.14 and
59.3.15). In 1730, the Friar João Pacheco wrote about the Coina glass manufactory comparing it to the
glass manufactories in Murano (Custódio, 2002, p.104). The operational period of the Coina Glass
manufactory was considered to be a golden era for Portuguese glass production.
Fig. 2.16: Engraving of the working area of the Marinha Grande Factory published in 1890 in the Ocidente Portuguese publication (ed. Saraiva, 1983, p.229).
In 1739, reports were written by Bohemian glass dealers complaining about the ban of Bohemian glass
imports to Portugal, which led to the conclusion that the glass produced nationally would be sufficient
to fulfil market needs (Vávra, 1954, p.93). This complaining was probably related to the document
Chapter 2 – Glass: production and historical contexts Part I
51
signed by D. João V on the 10th of May of 1734, in which the Portuguese king forbade the import of
foreign glass (Custódio, 2002, p.95). As has been mentioned above, during the 18th century, Portugal
and Spain were two of the main Bohemian glass trading centres (Lukàs, 1981, p.60), which implies that
these restrictions must have substantially affected Bohemian trade agreements and routes.
It is also known that glass was arriving in Portugal from Venice. The Portuguese king D. Manuel I, who
ruled between 1495 and 1521, had the commercial domination and exclusive privilege over Venetian
glass, not only in Portugal but also in its colonies. During this period, Venice can be considered one of
the main glass suppliers for the Portuguese territory (Medici, 2005b, p.133). However, even after this
period, glass was still being sent to Portugal from Venice. In a letter dated ca. 1592, sent to the Grand
Duke Ferdinando I de Medici the following is written:
“To Lisbon fine glass and several crystals by ducats 10.000.
Boiled13 crystals, large size, in lire 40 up to 50 hundred, in the shapes of lions, ships, baskets,
fountains, each piece lire 1,
1 1⁄2, lire 2, 2 1⁄2 and lire 3 each piece, and mirrors also provided.”14
This citation was firstly published by G. Corti (1971, p.653) and then referenced by T. Medici (2005b,
p.133) and by Barovier & Tonini (2014, p. 30). As mentioned by T. Medici (2005b, p.133), not only
was ordinary glass being brought from Venice to Portugal, but also fine cristallo glass objects.
It is important to look at the relations between Portugal and Antwerp. By 1611, there were seventy-two
Portuguese commercial-banker families living in Antwerp (Göttler & Moran, n.d.). From these, the
Ximenez family, particularly Emmanuel Ximenez, was the most famous. Besides Antwerp, he had
commercial offices in Lisbon and Seville (the two most important harbours in Europe during the 17th
century), Venice, Cadiz, Florence, Amsterdam, Hamburg, Goa, Bahía, Pernambuco, and many other
city harbours (Duprè, 2010; Göttler & Moran, n.d.). Moreover, the Ximenez family was directly
connected to the Medici family in Florence and to the Spanish Crown, this last through monetary
transactions (Duprè, 2010; Göttler & Moran, n.d.). Another very important and curious aspect is that
13 Here the term “boiled crystals” is associated with the process of purifying the plant ashes employed in the glass batch as a source of alkali. 14 Kindly translated by Teresa Medici from the Italian: “Per Lisbona vetraria fina e cristalli assai per duc. 10.000. Cristalli bolliti, grandi, di lire 40 fino a 50 cento, foggie di lione, nave, sporte, fontane, tal pezo lire 1, 1 1⁄2, lire 2, 2 1⁄2 e lire 3 il pezo, e spechiere fornite.”
Chapter 2 – Glass: production and historical contexts Part I
52
António Neri, the author of the famous recipe book L’Arte Vetraria was a close friend to the Ximenez
family. Neri stayed in the Ximenez house in Antwerp between 1604 and 1611 (Boer & Engle, 2010). It
was during his stay there that he observed the production of façon-de-Venise glass in the Gridolphi
factory, an experience that partially influenced him to write L’Arte Vetraria, published in 1612 (Duprè,
2010). From these facts, one can only wonder how soon the recipe book arrived in Portugal, which could
well have happened through the Ximenez family. As far as it is known, the treatise (L’Arte Vetraria)
was translated into Spanish in the 18th century, by Miguel Jerónimo Suárez Núñez, in an attempt to
rekindle the glass industry in Spain (Pérez-Pariente & Martín-Rojo, 2008). This is supposedly the first
translation of L’Arte Vetraria in the Iberian Peninsula, since, as far as it is known, no translation into
Portuguese is known. However, considering that several foreign glassmakers were active in Portugal,
the treatise might have reached Portugal in other languages.
Emmanuel Ximenez himself was a collector, and among other things, he collected glass. Along with
textile dyes, sugar and spices, paintings, books and precious stones, the Ximenez family traded
glassware, which was greatly appreciated especially in West African regions and Asia (Göttler & Moran,
n.d.). In the city of Antwerp this family was known for their luxurious life-style and ostentation,
demonstrated among others things, through their patronage of glassmakers (Göttler & Moran, n.d.).
2.2.1 Raw materials employed on Portuguese glass production
It is a known fact that the Portuguese coastline was very rich in plants like salsola kali and salicornia.
Nowadays, it is still possible to find these species in abundance along the Portuguese seashore. Knowing
that these plants existed in Portugal in large quantities, it is a priori expected to find a national glass
production that is of the soda-rich type, or in other words, which follows the Mediterranean tradition.
Vasco Martins, a 15th century Portuguese glassmaker from Lisbon, complained to the king, in documents
dated from 1459, that foreigners were stealing the Portuguese seashore plants, called in that time barilla,
from the national coasts (more specifically from the Algarve), and were taking them outside the country,
which was prejudicial to national glass production (Sequeira, n.d., pp.I; Valente, 1950, p.26, 107).
During the 15th century, the Portuguese king D. Afonso V forbade the Moresque and Andalusian people
to harvest and steal the barilla from the Algarve. This activity had become exclusive to the Portuguese
glassmakers (Sequeira, n.d., pp.I; Valente, 1950, p.107-108). Is it possible that some of the barilla being
consumed by the Venetian during the 17th was also from Portuguese origin.
Table 2.4 shows the origin of some of the raw materials employed in several Portuguese glass production
centres. In terms of the source of silica, during the centuries that are being studied here, it is reported
that it has always been collected in national territory. The various sands and quartz pebbles were
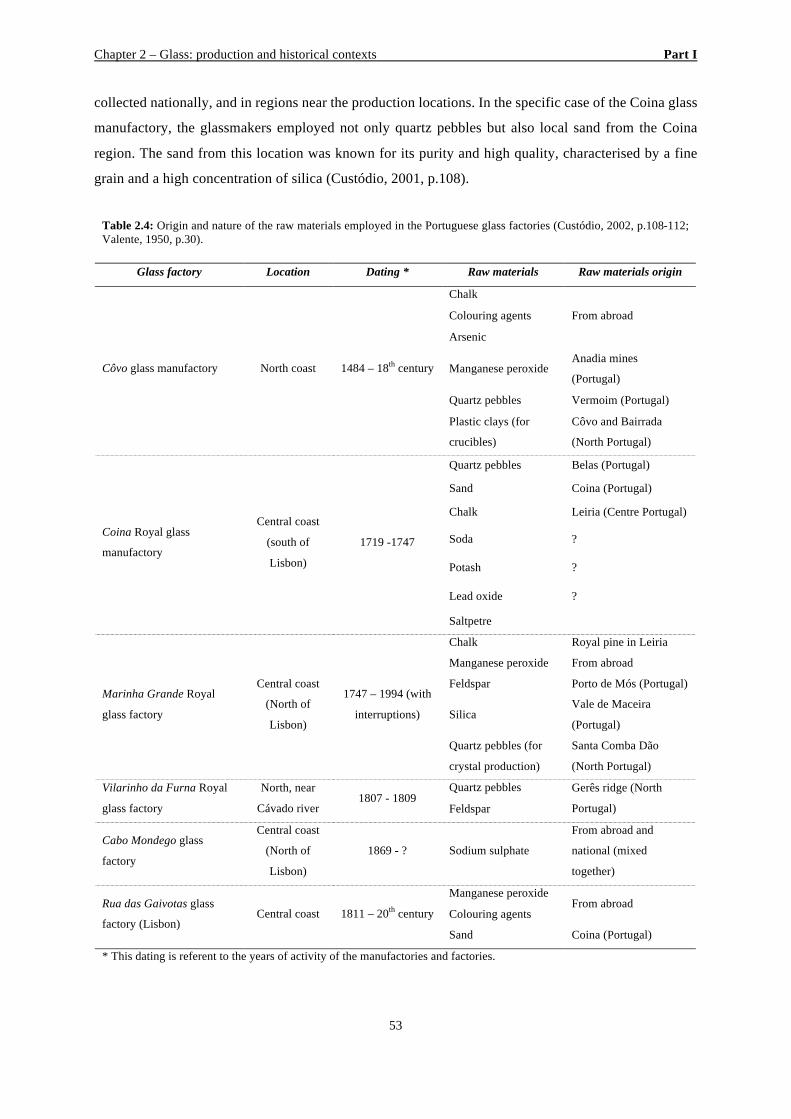
Chapter 2 – Glass: production and historical contexts Part I
53
collected nationally, and in regions near the production locations. In the specific case of the Coina glass
manufactory, the glassmakers employed not only quartz pebbles but also local sand from the Coina
region. The sand from this location was known for its purity and high quality, characterised by a fine
grain and a high concentration of silica (Custódio, 2001, p.108).
Table 2.4: Origin and nature of the raw materials employed in the Portuguese glass factories (Custódio, 2002, p.108-112; Valente, 1950, p.30).
Glass factory Location Dating * Raw materials Raw materials origin
Côvo glass manufactory North coast 1484 – 18th century
Chalk
From abroad Colouring agents
Arsenic
Manganese peroxide Anadia mines
(Portugal)
Quartz pebbles Vermoim (Portugal)
Plastic clays (for
crucibles)
Côvo and Bairrada
(North Portugal)
Coina Royal glass
manufactory
Central coast
(south of
Lisbon)
1719 -1747
Quartz pebbles Belas (Portugal)
Sand Coina (Portugal)
Chalk Leiria (Centre Portugal)
Soda ?
Potash ?
Lead oxide ?
Saltpetre
Marinha Grande Royal
glass factory
Central coast
(North of
Lisbon)
1747 – 1994 (with
interruptions)
Chalk Royal pine in Leiria
Manganese peroxide From abroad
Feldspar Porto de Mós (Portugal)
Silica Vale de Maceira
(Portugal)
Quartz pebbles (for
crystal production)
Santa Comba Dão
(North Portugal)
Vilarinho da Furna Royal
glass factory
North, near
Cávado river 1807 - 1809
Quartz pebbles Gerês ridge (North
Portugal) Feldspar
Cabo Mondego glass
factory
Central coast
(North of
Lisbon)
1869 - ? Sodium sulphate
From abroad and
national (mixed
together)
Rua das Gaivotas glass
factory (Lisbon) Central coast 1811 – 20th century
Manganese peroxide From abroad
Colouring agents
Sand Coina (Portugal)
* This dating is referent to the years of activity of the manufactories and factories.
Chapter 2 – Glass: production and historical contexts Part I
54
Regarding the source of alkalis, the preferences of Portuguese glassmakers for soda or potassium-rich
ashes are never mentioned, with the exception of the Coina glass manufactory that employed both (Table
2.4). Being a Mediterranean country well supplied in Salsola Kali, it is expected that the production
would be a soda-rich glass, however it is known that, for instance, in Coina glass manufactory,
glassmakers working there came from Germany and Bohemian, and it is for this reason that one would
expect them to have brought their glassmaking traditions with them, thus also producing potassium-rich
glass (Custódio, 2002, p.112; Valente, 1950, p.23).
In Table 2.4, the general origins of the raw materials employed in some of the most important
glassmaking centres from the post-medieval period onwards are reported. However, when one speaks
about larger manufactories like Coina glass manufactory or Marinha Grande glass factory that went
through different periods of administration, it is important to bear in mind that the suppliers of the raw
materials would have change from time to time. The dating presented in Table 2.4 refers to the years of
activity of the manufactories, and it was not possible to narrow down the use of certain raw materials.
However, as it was proposed above, it is highly probable that the origin of the raw materials changed
along the years. Moreover, it is important to mention that as these manufactories were more recent, it is
easier to find written documents describing the raw materials employed and their origins. With specific
reference to the Marinha Grande glass manufactory, between 1793 and 1795, it was importing coarse
barilla from Spain and refined barilla from America, saltpetre from India and red lead from the British
Isles. A few years later it was reported that the barilla employed on this manufactory was originated
from Alicante (Spain) and from Setúbal (Portugal) (Custódio, 2002, p.111). This makes clear that the
raw materials employed, with all their specific and unique trace elements according to their specific
provenance, were constantly changing, probably as a result of financial considerations.
Chapter 3 – Portuguese archaeological glass assemblages: studying and comparing Part I
55
CHAPTER 3
PORTUGUESE ARCHAEOLOGICAL GLASS ASSEMBLAGES: STUDYING AND
COMPARING
3.1 Historical context and description of the archaeological assemblages considered in
this work
3.1.1 Glass assemblage from Museu do Teatro Romano, Lisbon
The Roman Theatre was first discovered in 1798 during the reconstruction of the city of Lisbon after
the major earthquake in 1755. A major archaeological investigation into this area was initiated in 2001
and ended in 2011 (Fernandes & Fragoso de Almeida, 2012, p.111). This complex site yielded
archaeological records dating from the 1st century (date attributed to the edification of the Roman
Theatre) and from modern times, from the end of the 15th to the 18th centuries (Fernandes, 2007, p.28,
32-33; Dra. Lídia Fernandes p.c). Some of the elements of the building, such as its stones and its
foundations, were re-used in later constructions throughout the following centuries (Fernandes, 2007,
p.33). The most relevant structure excavated was the postscaenium. This huge wall belonged
originally to the Roman Theatre and served as a support to the theatre’s scenic façade; in this
particular case it served to contain the adjacent hill. Until the 1755 earthquake, this enormous structure
was used during the 17th and 18th centuries as the north wall of a house (Fernandes, 2007, p.33).
The glass finds under study here were excavated from the house remains and were almost certainly
abandoned and partially destroyed during the earthquake, and thus become part of the disposable
wreckage. The glass assemblage was found spread across several stratigraphic layers, all part of this
medium/large dimension house (Fernandes, 2007, p.35; Dra. Lídia Fernandes p.c.).
Chapter 3 – Portuguese archaeological glass assemblages: studying and comparing Part I
56
The first archaeological excavation carried out on these ruins dates from 1963 by the archaeologist D.
Fernando de Almeida. Since then, several archaeological excavations have been carried out at this
location, but it was only in 2001 that the museum was established in order to allow these ruins to be
visited, the excavation works to continue, and also to promote the preservation of this historical site
(Fernandes, 2007, p.30).
The main archaeological excavations undertaken on the Roman theatre in the past few years were in
2001, 2005, 2006, 2010 and 2011. These excavations were carried out by Serviço de Arqueologia do
Museu da Cidade de Lisboa – Divisão de Museus e Palácios (Câmara Municipal de Lisboa, Direcção
Municipal de Cultura, Departamento do Património Cultural) and focused on the south area of the
monument, and it enabled the discovery of the great structure of the theatre postcaenium (Dra. Lídia
Fernandes p.c.).
These archaeological campaigns allowed work to be carried out on a house structure (Pombaline
style1) from the post-earthquake period. Nine meters below this post-earthquake house, another house
structure was found dating from the 17th century. This house had 3 stories and it was built using the
postcaenium structure itself (Fernandes, 2007, p.33-35; Dra. Lídia Fernandes p.c.).
Some objects from the glass assemblage were associated with ash and mortar deposits that were the
result of the collapse of the upper walls and supporting beams. The house structure dated from the 17th
century was also filled with wreckage resulting from destruction caused by the earthquake. Posterior
constructions (in Pombaline style) were characterised by the use of different levels in order to
counteract the unevenness of the hill and also because it represented a solution to clear tons of
wreckage that covered the entire city. This is the explanation for the presence of wreckage material
that filled the pre-earthquake edifications (Dra. Lídia Fernandes p.c.).
Glass objects
Glass objects from the assemblage being studied were found in this archaeological context described
above, with the majority of pieces belonging to the 18th century. These objects were almost certainly
abandoned and partially destroyed during the earthquake, becoming in this manner part of the
disposable wreckage.
1 House structure of Pombaline style: this construction style was developed after the major earthquake that devastated Lisbon and its surroundings in 1755. It consisted on a flexible wooden structure, called cadge, that was imbedded on walls, roofs and floors and then covered with the remaining building materials. This system was done using pre-manufactured house pieces that were made outside the city and assembled on site (França, 1983, p. 163-166).

Chapter 3 – Portuguese archaeological glass assemblages: studying and comparing Part I
57
Other finds associated with these glass objects were also recovered including ceramics, tiles (dated
from the 18th century as the glass objects) and also some faience dating from the late 17th century to the
late 18th centuries (Dra. Lídia Fernandes p.c.).
The glass assemblage studied here comprises ninety-seven glass fragments. These fragments belong
for the most part to wine bottles (61 fragments) with different typologies (circular and square shapes)
and colours (that vary between olive green and black), and blue coloured glass flasks (8 fragments),
which can be considered utilitarian glass. Most of the shapes identified are mould-blown, and the
majority have a pontil mark. A group of sixty-three objects was selected to be part of this study.
With regards to the other objects from the set, it was possible to identify 3 fragments from drinking
glasses of transparent colourless, and transparent amber coloured glass, one glass cane (colour blue)
and 4 fragments (probably belonging to the same square flask) in transparent colourless glass
decorated with enamels of the following colours: red, blue, green, yellow, opaque white and black.
Another important find within this glass assemblage, was a seal from a mineral water bottle were it is
possible to decipher “Bad Pyrmonter Wasser”. This seal belongs to a German Spa located in Lower-
Saxony where thermal waters were fashionable since the 17th century2. The seal has the depiction of a
coat of arms with two rampant lions and two stars.
Another important aspect of this assemblage is that also includes the presence of one major
aggregation of molten glass fragments that probably resulted from the high temperatures of the great
number of fires that enveloped Lisbon after the earthquake.
The objects analysed are listed in Table II.1 in Appendix II with their dating and characteristics
described, and the quantification results are presented in Table II.2 in Appendix II. Objects catalogue3
and archaeological drawings are also present in Appendix II as Catalogue I.
3.1.2 Glass assemblage from Rua do Arsenal, Lisbon
Early in 2011, an archaeological excavation was begun on a building structure in Rua do Arsenal,
Lisbon, near the Tejo River. This excavation was undertaken by the archaeological company Alavanca
2 In http://www.badpyrmont.de/ accessed on 14th November 2012. 3 All the pictures and drawings presented in this thesis where no authorship is indicated were taken/ drawn by the author.
Chapter 3 – Portuguese archaeological glass assemblages: studying and comparing Part I
58
do Tempo, Arqueologia Antropologia Património and carried out in the foundations of the building, in
order to evaluate the archaeological potential of this location (Valongo, 2011, p.3).
According to some authors, the location of this building is consistent with the probable location of the
Côrte-Real Palace, dating from the 16th century and the second most important palace of Lisbon
(França, 1983, p.31). This location is also consistent with the Muralha Fernandina, a construction
dating from the 14th century (Valongo, 2011).
During the archaeological excavation, remains of both structures mentioned above were found. The
glass assemblage being studied came from the Côrte-Real Palace archaeological context, dating from
the 16th century up to the 19th century.
A member of the Côrte-Real family built the Côrte-Real Palace during the 16th century. After the
Portuguese Restoration of Independence that took place in 1640, the Palace was transferred to royalty
and was given to the Prince D. Pedro by his father, the king D. João IV. After a few years, the Prince
D. Pedro became king by the name D. Pedro II and made the above Palace his royal residence (ed.
Saraiva, 1983, p.24). The location of this Palace is what made this building so attractive to the royalty.
The Palace was located near the Tejo River, where the caravels loaded with foreign and attractive new
objects arrived. This was also a beautiful, four stories high, building, with four look-out towers (figure
3.1).
In 1668, peace was re-established in the Portuguese territories, and as a consequence, the properties
were given back to their original families. The Côrte-Real Palace was returned to the Castelo Rodrigo
Marquis, the former owner before 1640, who then rented the Palace to D. Pedro II, who never left it
(ed. Saraiva, 1983, p.24).
In 1751, the Palace was sold to the King D. Pedro III, who used it as a courthouse. According to some
authors, this was the year when a huge fire destroyed the Palace, and only the front façade with two
balconies over the Tejo River were left standing. This façade collapsed in 1755, during the earthquake
(Proença, 1983, p.210-211).
Other authors claim that this building was an active courthouse when the 1755 earthquake destroyed it
completely (ed. Saraiva, 1983, p.24).
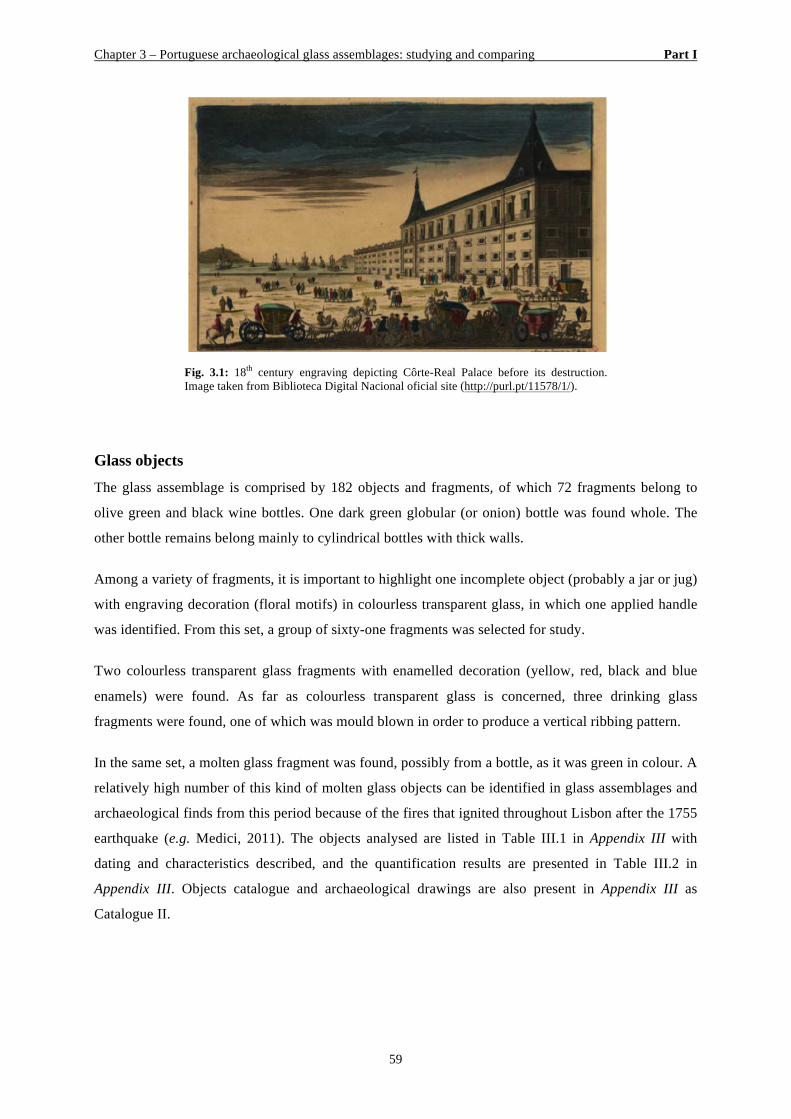
Chapter 3 – Portuguese archaeological glass assemblages: studying and comparing Part I
59
Fig. 3.1: 18th century engraving depicting Côrte-Real Palace before its destruction. Image taken from Biblioteca Digital Nacional oficial site (http://purl.pt/11578/1/).
Glass objects
The glass assemblage is comprised by 182 objects and fragments, of which 72 fragments belong to
olive green and black wine bottles. One dark green globular (or onion) bottle was found whole. The
other bottle remains belong mainly to cylindrical bottles with thick walls.
Among a variety of fragments, it is important to highlight one incomplete object (probably a jar or jug)
with engraving decoration (floral motifs) in colourless transparent glass, in which one applied handle
was identified. From this set, a group of sixty-one fragments was selected for study.
Two colourless transparent glass fragments with enamelled decoration (yellow, red, black and blue
enamels) were found. As far as colourless transparent glass is concerned, three drinking glass
fragments were found, one of which was mould blown in order to produce a vertical ribbing pattern.
In the same set, a molten glass fragment was found, possibly from a bottle, as it was green in colour. A
relatively high number of this kind of molten glass objects can be identified in glass assemblages and
archaeological finds from this period because of the fires that ignited throughout Lisbon after the 1755
earthquake (e.g. Medici, 2011). The objects analysed are listed in Table III.1 in Appendix III with
dating and characteristics described, and the quantification results are presented in Table III.2 in
Appendix III. Objects catalogue and archaeological drawings are also present in Appendix III as
Catalogue II.
Chapter 3 – Portuguese archaeological glass assemblages: studying and comparing Part I
60
3.1.3 Glass assemblage from Santa Clara-a-Velha Monastery, Coimbra
Between the years 1283 and 1286, D. Mor Dias (1st half 13th century - 1302), a Portuguese noble lady,
had the Santa Clara-a-Velha Monastery built in the city of Coimbra. This noble lady chose the location
of the monastery on the left bank of the Mondego River, because of its proximity to the already
existent Franciscan Monastery, in order to receive ecclesiastic assistance from the latter. This location
was also close to the Santa Ana Monastery, where D. Mor Dias’ sister, D. Teresa was a prioress
(Trindade & Gambini, 2009, p.19, 20). More than anything, this was a strategic location in order to
obtain protection and assistance from neighbouring monasteries.
Santa Clara-a-Velha Monastery belonged to the order of the Poor Clarissas. This religious order was
created in 1212 by Clara Offreduccio de Favarone inspired by the Franciscan ideals of total
renunciation to the possession of goods. This renunciation was seen as a vehicle to individual
purification and remission of the sins of society. According to these premises all goods should belong
to the community, and the religious sisters should live in absolute poverty (Trindade & Gambini,
2009, p.13, 14).
The Portuguese Queen D. Isabel de Aragão (1270-1336), known for her charitable character, moved to
Santa Clara-a-Velha Monastery after the death of her husband the Portuguese king D. Dinis (1261-
1325), and was buried there after her death. The presence of D. Isabel in the monastery brought it great
prominence and after her death, it became place of pilgrimage. During her life in the monastery, D.
Isabel enlarged the number of its buildings and lands, and was the person responsible for the building
of the gothic monastery still there today (figure 3.2) (Trindade & Gambini, 2009, p.24-27).
During the following centuries, the great majority of young women joining the order of Poor Clarissas
in Santa Clara-a-Velha Monastery were of high social status, probably belonging to noble families.
This fact is proven by their family names, and the high quality of the objects retrieved from the
archaeological excavation (Trindade & Gambini, 2009, p.26). In order to avoid leisure, the daily
religious life was filled with activities such as sewing and cooking, which was distributed among them
according to their position inside the monastery. It was also common for foreign people to provide
services to the monastery, for instance bricklaying and paving (Trindade & Gambini, 2009, p.44, 45).
Bearing this in mind it is reasonable to consider the possibility of services provided by glassmakers
working for the monastery and located in its proximities.
The location of the monastery and its proximity to the Mondego River resulted in a constant flooding,
which led to the decision to constructing a new monastery (Santa Clara-a-Nova Monastery) on a hill
located nearby, further away from the river bank. In 1649 the construction of the new monastery was
initiated, and some materials from the old building were employed. In 1672 some of the members of
the religious had already abandoned the old building, and finally in 1677 D. Isabel de Aragão’s grave
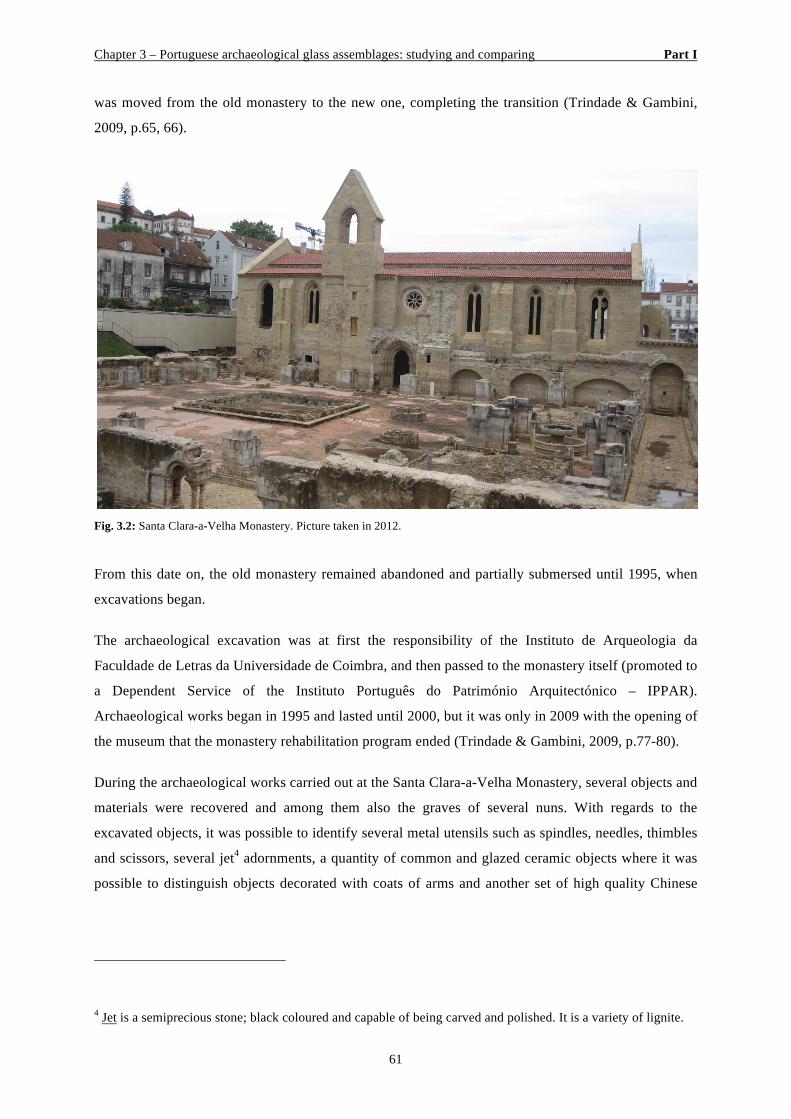
Chapter 3 – Portuguese archaeological glass assemblages: studying and comparing Part I
61
was moved from the old monastery to the new one, completing the transition (Trindade & Gambini,
2009, p.65, 66).
Fig. 3.2: Santa Clara-a-Velha Monastery. Picture taken in 2012.
From this date on, the old monastery remained abandoned and partially submersed until 1995, when
excavations began.
The archaeological excavation was at first the responsibility of the Instituto de Arqueologia da
Faculdade de Letras da Universidade de Coimbra, and then passed to the monastery itself (promoted to
a Dependent Service of the Instituto Português do Património Arquitectónico – IPPAR).
Archaeological works began in 1995 and lasted until 2000, but it was only in 2009 with the opening of
the museum that the monastery rehabilitation program ended (Trindade & Gambini, 2009, p.77-80).
During the archaeological works carried out at the Santa Clara-a-Velha Monastery, several objects and
materials were recovered and among them also the graves of several nuns. With regards to the
excavated objects, it was possible to identify several metal utensils such as spindles, needles, thimbles
and scissors, several jet4 adornments, a quantity of common and glazed ceramic objects where it was
possible to distinguish objects decorated with coats of arms and another set of high quality Chinese
4 Jet is a semiprecious stone; black coloured and capable of being carved and polished. It is a variety of lignite.
Chapter 3 – Portuguese archaeological glass assemblages: studying and comparing Part I
62
porcelain. Together with the remains of the nuns, several gold wires used to attach teeth together were
found, demonstrating once again the high social status of some of the women. It is also important to
mention that the entire monastery building was profusely decorated with Hispano-Moresque ceramic
tiles (Coentro et al., 2014) and limestone statues (Trindade & Gambini, 2009, p. 40-47).
Glass objects
With reference to the glass assemblage (Ferreira, 2004; Medici et al., 2009), thousands of objects and
fragments were retrieved. Glass objects of all colours were recovered, predominantly various shades
of green, blue, yellow, and purple. For this investigation thirty-seven glass objects were selected. The
colourless glass is worth noting, as it is possible to identify perfectly discoloured glass, and colourless
glass with natural hues (grey, blue, yellow, and green). As far as the glass decoration is concerned,
gilded glass, filigree, engraved glass, mould blown pattern decoration (Ferreira & Medici, 2010) and
millefiori (Lima et al., 2012) were identified. In terms of the typology of the objects, it is worth noting
that a variety of vessels such as gourds (so far a unique vessel typology only found in Portugal),
bottles, goblets and flasks of several sizes were found. The shapes are characterised by their
refinement, and among the objects it is possible to identify Venetian or façon-de-Venise forms and
decorations. The objects analysed are listed in Table IV.1 in Appendix IV with the dating and
characteristics described, and the quantification results are presented in Table IV.2 in Appendix IV.
The objects catalogue is also present in Appendix IV as Catalogue III. Archaeological drawings can be
consulted in Medici (2015).
3.1.4 Glass assemblage from the courtyard of Universidade de Coimbra
Between 2000 and 2003, archaeological excavations were undertaken in the courtyard of the
University of Coimbra (Coimbra, Portugal), as a part of a wider project concerning the architectural
and artistic evaluation of the entire complex. This archaeological excavation was promoted by the
University Rectory, and directed by Professor Helena Catarino (Catarino & Filipe, 2006).
This investigation enhanced the historical knowledge on this area of the town, which has been
inhabited since the Roman Aeminium (the Roman name of Coimbra) through to modern time. Of
special interest were the remains of the fortification (Alcácer) belonging to the Islamic town of
Madinat Qulumbriya. The building has a quadrangular plan, with towers leaning against the wall at
regular intervals. The gate, surrounded by two towers, turned to the East is today called Porta Férrea.
It has always been the main access to the complex despite the alterations that occurred after the
Christian Re-conquest of the town in 1064, when the building was first converted into the Royal
Palace, and then, in 1537, chosen by king D. João III to host the University.
Chapter 3 – Portuguese archaeological glass assemblages: studying and comparing Part I
63
During the archaeological survey at the North side of the gate, it was possible to partially excavate the
content of a small corridor, connecting one of the towers to the wall. The excavation yielded an
important archaeological record, including pottery and glass. The pottery assemblage comprises
objects belonging to typologies dating from the end of the 16th century to the beginning/first half of the
17th century. Therefore, the end of the use of the corridor, and its subsequent filling, can possibly be
correlated to the main renovation of the Porta Férrea, undertaken during the first half of the 17th
century by the chancellor D. Álvaro da Costa (1633 - 1637), when the obliteration of the towers was
ordered (Pimentel, 2005, p.125).
Glass objects
During the archaeological excavation it was possible to collect several glass fragments (c. 150). From
these finds thirty-two fragments were selected for this study. Uncoloured glass with natural green,
grey or yellow hues predominate. With regards to the decorative features it is possible to identify
mould-blown patterns, and glass with filigree. Among these fragments, a glass flask was retrieved
with gilded decoration (inventory no. CPU0032). The objects analysed are listed in Table V.1 in
Appendix V, dating and characteristics described and the quantification results are presented in Table
V.2 in Appendix V. Objects catalogue is also present in Appendix V as Catalogue IV. Archaeological
drawings can be consulted in Medici (2015).
3.1.5 Glass assemblage from Praça Miguel Fernandes, Beja
The glass fragments being studied here are part of an archaeological assemblage discovered in Beja
(South of Portugal). The excavations were carried out by the archaeological company Crivarque,
Estudos de Impacto e Trabalhos Geo-Arqueológicos, between 2003 and 2004, after the discovery of a
set of 137 silos during the construction of an underground car park in Avenida Miguel Fernandes. This
avenue is situated outside the walls of the city of Beja (Martins et al., 2007).
The silos were structures used during the 14th and 15th centuries as storage containers for food, mainly
cereals, usually with rounded forms. Once the silos were no longer used as a place of storage, this
meant that they could be used as a disposal site (rubbish pits) for the most diverse materials, including
rubble and household debris. The archaeological excavations took place near the city centre to allow
the construction of an underground parking lot. The archaeological excavation revealed a highly
diverse assemblage, including faunal remains, coins and other metal elements, military objects
(daggers), some bone objects, a large number of ceramic pieces in good condition and a number of
glass objects. The analysis of archaeological groups, including sherds of pottery and coins, allowed
one to situate this set chronologically between the 14th and 17th centuries (Martins et al., 2007).
Chapter 3 – Portuguese archaeological glass assemblages: studying and comparing Part I
64
Glass objects
With regards to the group of glass objects, this comprises mainly utilitarian objects dating from the
14th to the 17th centuries. The presence of more than three hundred objects was estimated, and from
this mass twenty-seven glass fragments were selected. From this selection, eleven fragments are dated
between 14th and 15th centuries, and the remaining sixteen glass fragments are dated to between 16th
and 17th centuries. From both chronologies, the majority of the glass fragments belong to beakers and
goblets. Also present in both chronologies are blown decorative motifs, and almost all the selected
objects have this kind of decoration.
The objects from the older chronology are characterised by a bright colouration in several shades of
green, yellow and blue, whilst in glass dated from 16th to 17th centuries, the colourless glass with
natural bluish and greyish hues predominates, which could indicate an attempt to discolour the batch.
The objects analysed are listed in Table VI.1 in Appendix VI, with dating and characteristics described,
and the quantification results are presented in Table VI.2 in Appendix VI. The objects catalogue is also
present in Appendix VI as Catalogue V. Archaeological drawings can be consulted in Medici (2015).
3.1.6 Glass assemblage from São João de Tarouca Monastery
São João de Tarouca Monastery was started to be built in Tarouca (located in the interior in the North
of Portugal) between the years of 1152 and 1154. This monastery is believed to be the first belonging
to the Cistercian religious order in Portugal. This monastery and the other coeval monastery located in
Lafões (also located in the interior in the North of Portugal) are both connected through the figure of
the abbot João Cirita, and doubts as to which one was built in first still remains today (Sampaio &
Sebastian, 2002a).
In the Cistercian order, the foundation of a new monastery had to be linked or affiliated to an older
monastery, as there existed a mother – daughter relationship between abbeys. São João de Tarouca
Monastery was linked to the Clairvaux Monastery in France and during the 12th and 13th centuries, the
Portuguese monastery had its prime period being responsible for the institution of the monasteries of
Santa Maria de Fiães, São Pedro das Águias and Santa Maria de Aguiar. Later, it was surpassed by the
Santa Maria de Alcobaça abbey (Sampaio & Sebastian 2002a, p.36).
The Clairvaux Monastery was founded in 1115 (only 40 years before São João de Tarouca Monastery)
by the 25-year-old monk Bernardo of Clairvaux. This monastery was responsible for the foundation of
60 other monasteries, with the implied definition of strict rules in order to maintain this spiritual
empire, whilst at the same time there was the notion that each monastery needed to have some
autonomy.
Chapter 3 – Portuguese archaeological glass assemblages: studying and comparing Part I
65
With regard to the architecture and the principles of construction of the São João de Tarouca
Monastery, it is important to note that it translates Cistercian guidelines admirably. The buildings are
free of decorations, marked by straight lines with no ostentation. Poverty and simplicity are the most
cherished principles, which lead to the absence of mural paintings, stained-glass panels or bell towers.
The monastery building was the way to formalize the monk’s exclusion and independence from the
outside world, and the São João de Tarouca Monastery was the perfect example with its simple
aesthetic. It was built in the perfect Cistercian geographical location, near two water-courses, with
fertile lands and in total isolation (Sampaio & Sebastian, 2002a).
During the 16th century, the São João de Tarouca Monastery reached its rising period in an economic
and social perspective, which lasted until 1834, where all the religious orders were abolished. Over
this period, the poverty, simplicity and absence of material goods was no longer manifest in the day-
to-day life of the Cistercian monks (Sampaio & Sebastian, 2002a; 2002b). This conclusion is linked to
the number and quality of the ceramic and glass archaeological finds retrieved from the monastery.
The archaeological excavations were performed by the Instituto Português do Património
Arquitectónico (IPPAR) and began in 1998 and lasted until 2001.
Glass objects
A large quantity of glass fragments was recovered during the archaeological excavations. These
objects were dated to between the 16th and 19th centuries. For this investigation only the glass objects
dated to between the 16th and 17th centuries were considered.
Thirty-four glass fragments were sampled and analysed. Among them it was possible to find glass
with filigree decoration, mould-blown decoration patterns, one gilded fragment also with engraved
decoration, and two objects with the application of strings.
With regards to the mould-blown decoration objects, some have already been studied by Ferreira &
Medici (2010), where fragments of bossed beakers, objects with the lozenge motifs enclosing smaller
lozenges, and also enclosing four-petalled flowers, were considered. This last motif that always
appears enclosed by the lozenge motif, is considered, as far as it is known, to be unique and only
found among glass assemblages retrieved from Portuguese territory. The objects analysed are listed in
Table VII.1 in Appendix VII, with dating and characteristics described, and the quantification results
are presented in Table VII.2 in Appendix VII. Objects catalogue is also present in Appendix VII under
Catalogue VI. Archaeological drawings can be consulted in Medici (2015).
Chapter 3 – Portuguese archaeological glass assemblages: studying and comparing Part I
66
3.2 Research design and methodology
The choice of the assemblages was based on their importance in terms of archaeological context,
which, as was stated in the Introduction, are all dated, and of which four had been well studied. The
geographical localisation and the objects of which the assemblages were constituted, were also
considered. With regard to the archaeological context, two of the selected sets originated in a religious
environment: two monasteries, one female, a convent (Santa Clara-a-Velha, Coimbra) and one male
(São João de Tarouca). These assemblages will highlight the importance of glass in the everyday life
of monasteries, as well as the kind of relation that existed between these institutions belonging to
different religious orders. It was noted by T. Medici (2015) that there was a great disparity between
the quality of the objects from these two monastic sets of objects and the other four assemblages.
Luxury objects compose the monastic sets, with façon-de-Venise shapes and decoration features
(Medici, 2015). Two of the other selected assemblages came from a noble context: one in Lisbon (Rua
do Arsenal) and one in Coimbra (University courtyard). Both contexts were royal houses and will
allow one to reach some conclusions on the glass used by the nobility. Finally, the last two
assemblages came from a civil context, one from a private middle class house in Lisbon (Teatro
Romano), and the other from several silos that served as garbage pits in Beja, a town in the South of
Portugal (Praça Miguel Fernandes, Beja). These groups will bring some insights on the glass
circulating through the different social classes: if it was mainly imported or on the other hand if it was
produced locally, and if the different social classes used different objects from different provenances.
The great challenge in studying glass objects from this period found in Portugal, is related to the fact
that this country was situated at the crossroads of various cultural influences, which might result in a
great diversity of provenances for the glass.
Representative glass objects from the archaeological contexts, mainly dated to between the 17th and
18th centuries, were selected. It is important to emphasise the importance of this 17th to 18th century
period for European glass production. It was a time of change in terms of glass chemical compositions
and also in terms of taste. In Portugal, it is from the 17th century onwards that more records on glass
production, glassmakers, the raw materials employed and so on has come to our knowledge. The
choice of objects was based on their formal and stylistic characteristics, considering also the available
historical and archaeological data. Particular attention was given to special features such as singular
decorative motifs or unique object shapes. On the case of the Praça Miguel Fernandes (Beja)
assemblage, a smaller group of older objects, dated to between 14th to the 15th century was also
selected for this study in order to have an overview of the evolution of glass production and circulation
in Portugal. For the same reason, in the instance of the Rua do Arsenal (Lisbon) assemblage, a number
of objects from the beginning of the 19th century were chosen for this investigation. According to the
number of objects available, an average of thirty to fifty objects were selected from each set.
Chapter 3 – Portuguese archaeological glass assemblages: studying and comparing Part I
67
The research methodology was designed on the basis of an interdisciplinary approach, relating
archaeometry, history and conservation science. These different but complementary approaches
allowed the characterisation of the chemical composition of the glass (with an emphasis on the
application of non-destructive techniques) in terms of major, minor and trace elements, which will
thus allow one to better define a possible provenance. This will also allow a discussion of the raw
materials employed for the different glass compositional types, and finally a study of the historical
materials and techniques used for the production of objects. Hypothesis on commercial routes of the
raw materials and objects will also be proposed.
In order to speculate on the provenance of the glass objects, based on their chemical compositions, the
analytical results will be compared with the available data from glass production centres active at the
time, such as Venice (Verità & Zecchin 2009a, 2009b), the Low Countries (De Raedt et al., 2002;
Šmit et al., 2004), the British Isles (Cable, 1987; Dungworth & Brain, 2009; Dungworth et al., 2006;
Farrelly et al., 2014; Mortimer, 1995), and Central Europe (Cílovà & Woitsch 2012; Kunicki-
Goldfinger et al. 2001, 2005; Smrcek, 1999). In terms of the Portuguese territory, it will be possible to
compare the results obtained with the preliminary data from analysis performed on glass attributed to
the Coina glass manufactory (Lopes et al., 2009) and with some coeval archaeological glass groups
(Lima et al., 2012).
Samples
The first phase of the work was to make an inventory of the archaeological assemblages (some sets
had already been inventoried, and for those, their institutional inventory number was kept) followed by
the selection of samples to be analysed. Fragments were chosen according to its typology, glass
colour, and the presence of some decorative features (such as the presence of enamels). Special
attention was given to glass bottles.
For the bottles, fragments were selected giving priority to bottoms and necks. The shape (square or
cylindrical bodies), the glass colour (black and green glass) and the thickness (some bottles presented
thinner walls than others), were the next characteristics considered.
In order to avoid erroneous results by analysing and quantifying corrosion layers rather than the
uncorroded bulk of the glass, it was decided to sample the objects selected. Small glass samples of 2-4
mm2 were dry cut from the selected objects with a diamond wire. These small glass samples were
embedded in cross-section in an epoxy resin and polished with SiC sandpapers down to 4000 mesh.
This sampling procedure was only performed in broken objects, and on fragments with no connection
to other fragments.
Chapter 3 – Portuguese archaeological glass assemblages: studying and comparing Part I
68
3.2.1 Analytical Methods
µ-PIXE
Ion-beam analytical techniques are being more and more employed in the study and characterisation of
cultural heritage. One of the great advantages of these techniques, and probably the one that makes
them so attractive for use with historical objects, is the almost negligible damage caused by irradiation
resulting from the ion beams bombardment (Šmit, 2013, p.155). The Particle Induced X-Ray Emission
(µ-PIXE) has been used in historical glass analysis because of its non-destructive nature and its
analytical capabilities (Calligaro, 2008).
The bases of ion-beam techniques is the detection of radiation that is induced by a particle beam
generated from electrostatic accelerators usually having an energy of around a few MeV (Šmit, 2013,
p.155). Looking now at the principles of µ-PIXE, this method is based on the excitation of the
characteristic X-rays of each element, which is analogous to XRF or EPMA techniques. The
advantage of PIXE over XRF is that the first is much more sensitive to the detection of light elements.
To improve the detection of light elements, which are undetectable in air (external beam setup), one
can use helium gas flow allowing the detection of elements down to sodium, or even in vacuum,
allowing measurements down to carbon (Šmit, 2013, p.157). Relating µ-PIXE with LA-ICP-MS, it is
clear that the second is much more sensitive (in orders of magnitude), however the LA-ICP-MS has
the disadvantage of leaving holes with ca. 100 µm in the analysed object. When combined with a
scanning nuclear microprobe, PIXE has the ability of producing elemental distribution maps with
micrometer spatial resolution over sample areas up to ~2.5×2.5 mm2. This allows the selection of
representative areas of analysis, and presents quantitative average values for larger areas (Calligaro,
2008).
This technique has been widely used in analysis of historical glass (Gueit et al., 2010, Šmit et al.,
2004) and for the investigation of the corrosion mechanisms of this material (Vilarigues et al., 2011).
Quantitative results were achieved with µ-PIXE ion beam analytical technique using an Oxford
Microbeams OM150 type scanning nuclear microprobe setup, either with the in-vacuum or with the
external beam configuration. The µ-PIXE equipment is located at the C2TN, Instituto Superior
Técnico, Universidade de Lisboa, by Luís Cerqueira Alves. To allow the efficient detection of low
energy X-rays such as the ones of Na, all the glass fragments were irradiated in vacuum with a focused
1 MeV proton beam and the X-rays produced collected by a 8 µm thick Be windowed Si(Li) detector.
In order to avoid or detect possible local glass heterogeneities, imaging (2D elemental distribution)
and X-ray spectra were obtained from an irradiated sample area of 750x750 µm2. For trace elements
quantification (typically elements with atomic number above the one of Fe), a higher proton beam was
required, and a 2 MeV one was used. In this case, the external beam setup was chosen in order to
Chapter 3 – Portuguese archaeological glass assemblages: studying and comparing Part I
69
prevent sample beam-charging, and consequently X-ray spectra degradation. X-rays were collected
with a SDD detector with 145 eV resolution from a sample area of 800x800 µm2. Whenever possible
the entire area of 800x800 µm2 was analysed and the reported composition is the result of the
integration of that area. For that reason, no average or standard deviation is reported. Operation and
basic data manipulation, this including elemental distribution mapping, was achieved through the
OMDAQ software code (Grime & Dawson, 1995), and quantitative analysis done with GUPIX
program (Campbell et al., 2010). The results, expressed in weight percent of oxides, were normalised
to 100%.
In order to validate the obtained concentration results, two glass reference standards were also
analysed, Corning B and Corning C. The obtained data from all the analysed samples is the result of
several days of µ-PIXE analysis, both in in-vacuum and external beam. In each day of analysis, the
glass standards were analysed at least one time. The average plus the standard deviation and the
relative standard deviation values for Corning B and Corning C are presented in Appendix VIII, Table
VIII.1.
LA-ICP-MS
The technique of laser ablation inductively coupled plasma mass spectrometry (LA-ICP-MS) has been
widely employed in the study of cultural heritage objects such as glass (Cagno et al., 2010, 2012a;
Wedepohl et al., 2011a) and metals (Sarah et al., 2007), and also in the study of the natural glass
obsidian (Gratuze, 1999; Chataigner & Gratuze 2014a, 2014b), because of its capability to analyse
solid samples.
LA-ICP-MS was developed after two other techniques, that is inductively coupled plasma optical or
atomic emission spectrometry (ICP-OES) and inductively coupled plasma mass spectrometry (ICP-
MS). ICP-MS was then combined with laser ablation during the nineties (Gratuze, 2013, p.201-202).
This technique was usually employed in geochemical studies, especially with the intent of determining
the rare earth elements (REE) patterns (Gratuze, 2013, p.201-202). The rare earth elements were
defined by IUPAC as the elements from the lanthanide series plus scandium and yttrium (eds.
Connelly et al., 2005, p.51).
This technique has the great advantage of its very high detection limits that can go to ng/g levels. This
is referent to a siliceous material and depends on the measured isotope, on the baseline background
level, and on the size of the laser spot (Gratuze, 2013, p.210). The disadvantage of LA-ICP-MS is the
hole that the laser ablation leaves behind, and the size of this crater can range between 20 and 200 µm.
The ablated material (ca. 80-90% of it) is then deposited around the craters and can be easily removed
(Gratuze, 2013, p.204). However, it is important to point out that the advantages of this method, that
Chapter 3 – Portuguese archaeological glass assemblages: studying and comparing Part I
70
allows one, in the specific case of glass analysis with the aim of studying provenances, to quantify not
only the major, minor but also trace and REE elements, overwhelm the disadvantage of its being a
destructive technique, in a micrometer scale.
When analysing the REE in glass, it is necessary to proceed to a normalisation of the obtained values
to the elements and REE present in the Continental Earth’s Crust. The huge differences in the
abundance of neighbouring elements due to even or odd proton numbers, will be annulled by this
process of normalisation (Wedepohl et al., 2011a). The reference values used on this process are
reported in Wedepohl (1995).
LA-ICP-MS (laser ablation-inductively coupled plasma-mass spectrometry) analysis was carried out
on the embedded glass cross-section. The ablation system used here is located at the National Centre
of Scientific Research (CNRS) in Orleans, France with Bernard Gratuze. It consists of a Nd:YAG
laser working at 266 nm (quadrupled frequency) and a Resonetics M50E excimer laser working at 193
nm coupled with the Thermo Fisher Scientific ELEMENT XR mass spectrometer. The Nd:YAG laser
operates at a maximum energy of 2 mJ and at a maximum pulse frequency of 15 Hz. The excimer laser
was operated at 3mJ with a repetition rate of 8 to 10 Hz. The beam diameter can be adjusted from 20
µm to 100 µm. A pre-ablation time of 20 s is set in order to eliminate the transient part of the signal
which is then acquired for 55 s corresponding to 20 mass scans from lithium to uranium (the signal in
count/second is measured in low resolution mode for 58 different isotopes). Calibration for glass was
carried out using NIST610 and Corning B, C and D glass reference material (Gratuze, 2013, 2014).
The detection limits range from 0.1 to 0.01 % for major elements, and from 20 to 500 ng/g for others.
For the gold leaf composition (present in fragment CPU0032), calibration was carried out using a gold
reference material SI RAuP7 from MBH containing trace elements in the range of 200 µg/g and a
ternary gold/silver/copper alloy containing 90.9 % Au, 6.3% Ag, 2.7 % Cu, 147 µg/g Pd and 2920
µg/g Pt as well as other trace elements. Accuracy ranges from 5 to 15 relative % depending on the
elements and their concentration.
The glass body analysis was carried out with the quadrupled Nd:YAG laser at 8 Hz with a beam
diameter of 80 µm. The composition is calculated from the average of two ablations carried out in
different areas of the sample. The analysis of the gold leaf area on fragment CPU0032 from the CPU
assemblage was carried out with the excimer laser with a diameter of approximately 40 µm to avoid
saturation of the detector when measuring the gold isotope. The analysis was carried out in 2 different
areas. The ablated mass of material contains glass, corroded glass layers (alkali depleted glass) and
resin. Only part of the spectrum (the one with the highest gold and silver signals) was used for
calculation.
Chapter 3 – Portuguese archaeological glass assemblages: studying and comparing Part I
71
In order to validate the obtained concentration results, glass reference standards Corning A and Nist
SRM 612 are regularly analysed as unknown samples throughout all of the analytical sequence. The
average values obtained during the analysis are presented in Appendix VIII, Table VIII.2.
µ-EDXRF
When inorganic materials are irradiated with X-rays it is commonly accepted that no harm is caused to
the matrix. Analytical techniques employing X-rays are recurrently used on cultural heritage, where
glass is included, both for structural and compositional analysis (Janssens, 2013, p.79).
With regard to the working principle of XRF analysis, this includes the measurement of the energy
and intensity of the characteristic photons emitted from a given sample, glass for instance, when this is
irradiated with a beam of primary X-rays. This will result in a spectrum with all the characteristic
emission lines stored. This information is necessary for identifying and quantifying the elements
present in the sample. All the other interaction processes that occur when the X-ray beam hits the
sample (elastic or Rayleigh and inelastic or Compton scattering), will result in the spectrum
background (Janssens, 2013, p.88).
In the specific case of this technique, the characteristic fluorescence radiation that is emitted is
measured by an energy-dispersive spectrometer. The photons are counted through a solid-state
detector that at the same time organises them according to their energy in a multichannel memory
resulting in a spectrum of X-ray energy versus intensity (Janssens, 2013, p.89).
Results were achieved by energy dispersive X-ray fluorescence (µ-EDXRF) using a portable µ-
XRF spectrometer ArtTAX 800, Bruker, located in the Department of Conservation and Restoration
(FCT NOVA), and was operated by the author. It operates with a molybdenum (Mo) X-ray
source, focusing polycapillary lens and electro-thermally cooled xFlash (Si drift) detector, with 170
eV resolution (Mn Kα). The accurate positioning system and polycapillary optics enabled a small area
of primary radiation (70 µm) at the sample. The excitation and detection paths can be purged with
helium to allow the detection of low-Z elements down to aluminium. Spectra were acquired under
the following conditions: voltage 40 kV, intensity 0.6 mA and live time of 360 s. Helium purging was
used to allow the determination of elements down to aluminium. Each glass was analysed in three
different areas.
Qualitative analysis was always accompanied by the glass reference standards Corning A (CMoG A),
Corning B (CMoG B), Corning C (CMoG C) and Corning D (CMoG D) analysis in order to ascertain
the glass type under study. This technique was mainly applied on enamels decorating glass fragments
that could not be sampled, and on fragments with gilded decoration to evaluate the decoration
technique.
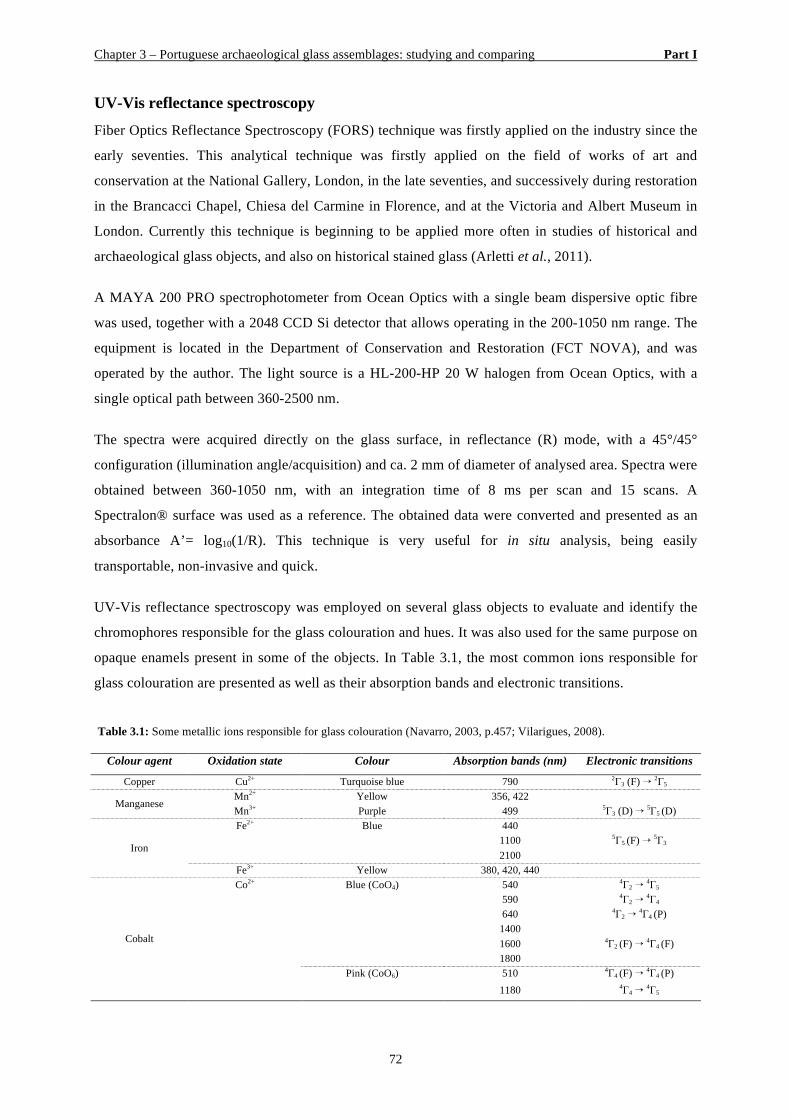
Chapter 3 – Portuguese archaeological glass assemblages: studying and comparing Part I
72
UV-Vis reflectance spectroscopy
Fiber Optics Reflectance Spectroscopy (FORS) technique was firstly applied on the industry since the
early seventies. This analytical technique was firstly applied on the field of works of art and
conservation at the National Gallery, London, in the late seventies, and successively during restoration
in the Brancacci Chapel, Chiesa del Carmine in Florence, and at the Victoria and Albert Museum in
London. Currently this technique is beginning to be applied more often in studies of historical and
archaeological glass objects, and also on historical stained glass (Arletti et al., 2011).
A MAYA 200 PRO spectrophotometer from Ocean Optics with a single beam dispersive optic fibre
was used, together with a 2048 CCD Si detector that allows operating in the 200-1050 nm range. The
equipment is located in the Department of Conservation and Restoration (FCT NOVA), and was
operated by the author. The light source is a HL-200-HP 20 W halogen from Ocean Optics, with a
single optical path between 360-2500 nm.
The spectra were acquired directly on the glass surface, in reflectance (R) mode, with a 45°/45°
configuration (illumination angle/acquisition) and ca. 2 mm of diameter of analysed area. Spectra were
obtained between 360-1050 nm, with an integration time of 8 ms per scan and 15 scans. A
Spectralon® surface was used as a reference. The obtained data were converted and presented as an
absorbance A’= log10(1/R). This technique is very useful for in situ analysis, being easily
transportable, non-invasive and quick.
UV-Vis reflectance spectroscopy was employed on several glass objects to evaluate and identify the
chromophores responsible for the glass colouration and hues. It was also used for the same purpose on
opaque enamels present in some of the objects. In Table 3.1, the most common ions responsible for
glass colouration are presented as well as their absorption bands and electronic transitions.
Table 3.1: Some metallic ions responsible for glass colouration (Navarro, 2003, p.457; Vilarigues, 2008).
Colour agent Oxidation state Colour Absorption bands (nm) Electronic transitions
Copper Cu2+ Turquoise blue 790 2Γ3 (F) → 2Γ5
Manganese Mn2+ Yellow 356, 422 Mn3+ Purple 499 5Γ3 (D) → 5Γ5 (D)
Iron
Fe2+ Blue 440 1100 5Γ5 (F) → 5Γ3
2100
Fe3+ Yellow 380, 420, 440
Cobalt
Co2+ Blue (CoO4) 540 4Γ2 → 4Γ5 590 4Γ2 → 4Γ4 640 4Γ2 → 4Γ4 (P)
1400 1600 4Γ2 (F) → 4Γ4 (F) 1800
Pink (CoO6) 510 4Γ4 (F) → 4Γ4 (P)
1180 4Γ4 → 4Γ5

Chapter 3 – Portuguese archaeological glass assemblages: studying and comparing Part I
73
µ-Raman microscopy
Raman analysis is a form of vibrational spectroscopy that measures the interaction between photons
(or neutrons) and the low energy levels of materials - the vibrational levels. The chemical composition
(atomic nature) and structure (the degree of crystallisation for instance) dictate these vibrational levels
that correspond to the collective vibrations of atoms and molecules (or atom groups) (Colomban,
2013, p.277).
This analytical technique was used to study the applied enamels on some of the glass fragments
whenever it was possible, given that in some cases, the state of conservation of some of the glass
objects did not permit them to be handled in such way that allowed this analysis to be carried out.
Raman microscopy was carried out to aid in the identification of the opacifying crystalline
compounds. The equipment is located in the Department of Conservation and Restoration (FCT
NOVA), and was operated by the Susana Coentro. Analyses were performed with a Labram 300 Jobin
Yvon spectrometer, equipped with a He-Ne laser of 17 mW power operating at 632.8 nm and a solid
state laser of 500 mW power operating at 532 nm. The laser beam was focused either with a 50x or
100x Olympus objective lens. The laser energy was filtered at 10% using a neutral density filter for all
analyses. Analyses were carried out on the surface of the enamels. Spectra were recorded as an
extended scan. The attribution of the Raman spectra was made using the RRUFF database project on
minerals (RRUFF).
3.2.2 Statistical treatment – Chemometrics approach
When a large quantity of data is generated, extraction of the highest amount of relevant information
contained within it is of paramount importance. After completion of the chemical analysis of the glass
fragments yielding their compositions, it is recommended to apply a suitable statistical treatment, in
this specific case a chemometric treatment, to bring to light the maximum amount of possible hidden
information.
Hierarchical clustering can be very useful as a first approach to analyse the relation between data
samples (Baxter, 2008, p.14). Here, the method of hierarchical cluster analysis through classification
trees (resourcing to the Ward’s method) will be applied first, and the sample grouping will be analysed
and discussed. Then, a PCA (Principal Component Analysis) will be applied to specifically analyse
variation within defined groups (like for instance the previously identified façon-de-Venise objects), in
order to better understand the relation between fragments, their typologies and composition.
Statistical analysis has been broadly used in archaeometric studies (Baxter, 2006, p.671). Methods
such as PCA and cluster analysis can be found applied to glass chemical compositions in studies
Chapter 3 – Portuguese archaeological glass assemblages: studying and comparing Part I
74
where raw materials and provenances are discussed. Cagno et al. (2010), Genga et al. (2008) and
Kunicki-Goldfinger et al. (2000) are only a few examples of the application of these multivariate
methods. These methods proved to be very useful for identifying groups of samples based on the glass
chemical composition.
Cluster analysis designates any statistical method applied to a data set with the objective of identifying
groups of samples. When applying a cluster analysis method, samples such as for instance the
chemical compositions of glass fragments, are grouped together based on their similarity, which
ultimately yields a representation of the difference between them (Baxter, 2008, p.2, 3).
The freeware R-statistica under the terms of Free Software Foundation's GNU General Public License
and Statistica from StatSoft (Dell software) was used to accomplish these analyses.
With regard to the adopted chemometric methodologies, either classification trees (cluster analysis) or
PCA modelling, it was found that some oxides from the glass chemical composition should not be
included. In other words, a variable (in this case the oxides) selection is necessary and fundamental
before applying these methods since some of them are known to be non-informative (Baxter &
Jackson, 2001). Minor oxides that tend to be approximately zero for most of the analysed samples but
appear with positive values for some samples, should not be used for the construction of the model
(Baxter, 2008, p.14). In addition, all data should be normalized prior to the application of these
methods. In this case, auto-scaling was the selected method. This method normalises the oxides (the
variables) by removing each oxide average and dividing by its standard deviation (Baxter, 2008). For
all chemometric methods, only the major or minor oxides with positive measurements were
considered. The minor oxides present only in some samples were discussed aside with their respective
influences taken into account. Since the REE were only measured for some samples, this information
was not considered for the PCA or the construction of the classification trees.
Because of the relatively limited number of samples (less than 10 samples), no statistical method was
applied on the study of mixed-alkali or lead glass.
Chapter 4 – Looking through glass: uncovering relations Part I
75
CHAPTER 4
LOOKING THROUGH GLASS: UNCOVERING RELATIONS
In order to evaluate the relation between glass sets and to identify possible common glass production
centres, the results of the chemical composition were divided into five glass compositional types: soda-
rich glass, potassium-rich glass, mixed alkali glass, HLLA glass and plumbic or lead glass. For this
classification, the criteria described in Table 2.1 (Chapter Two, Part I) were used. Results will be
presented below by order of the compositional type with a larger number of fragments identified.
We will be focusing on specific types of objects and to distinctive decorative features, for instance the
gilded objects.
T. Medici in her Ph.D. thesis (2014) classified glass objects according to their typologies, and the
nomenclature attributed to each type will be followed and employed in this thesis whenever necessary.
Within each glass compositional type, we tried to establish a possible relation between chemical
composition and shape with the aim of attributing a possible provenance, or the tradition that influenced
it.
Due to the colourful palette one can find among objects, the glass colourants will be discussed essentially
based on the UV-Vis reflectance spectroscopy analysis after considering the relation between fragments
and sets based on the chemical composition.
As has been mentioned before, in addition to the comparison between the compositions of the glass
objects, whenever possible the results obtained will be compared with published data on coeval glass
from other European production centres, and it is for this purpose that a representative survey of
compositions from the literature was made.
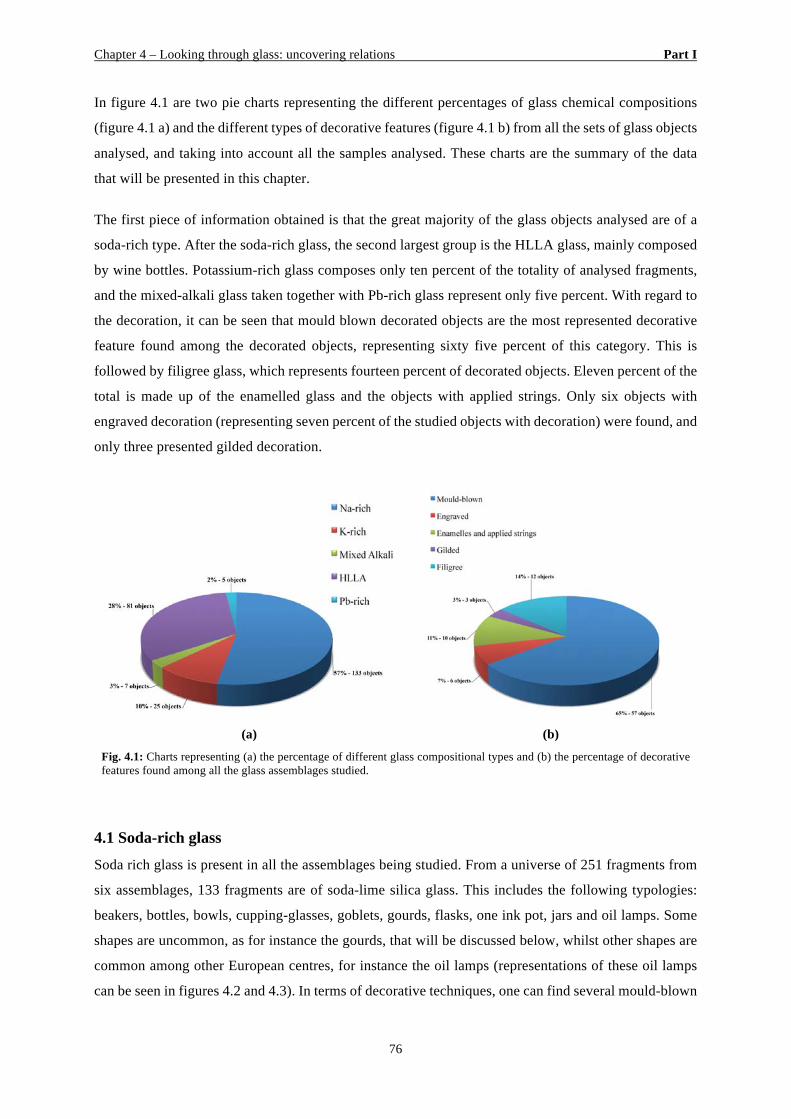
Chapter 4 – Looking through glass: uncovering relations Part I
76
In figure 4.1 are two pie charts representing the different percentages of glass chemical compositions
(figure 4.1 a) and the different types of decorative features (figure 4.1 b) from all the sets of glass objects
analysed, and taking into account all the samples analysed. These charts are the summary of the data
that will be presented in this chapter.
The first piece of information obtained is that the great majority of the glass objects analysed are of a
soda-rich type. After the soda-rich glass, the second largest group is the HLLA glass, mainly composed
by wine bottles. Potassium-rich glass composes only ten percent of the totality of analysed fragments,
and the mixed-alkali glass taken together with Pb-rich glass represent only five percent. With regard to
the decoration, it can be seen that mould blown decorated objects are the most represented decorative
feature found among the decorated objects, representing sixty five percent of this category. This is
followed by filigree glass, which represents fourteen percent of decorated objects. Eleven percent of the
total is made up of the enamelled glass and the objects with applied strings. Only six objects with
engraved decoration (representing seven percent of the studied objects with decoration) were found, and
only three presented gilded decoration.
(a) (b)
Fig. 4.1: Charts representing (a) the percentage of different glass compositional types and (b) the percentage of decorative features found among all the glass assemblages studied.
4.1 Soda-rich glass
Soda rich glass is present in all the assemblages being studied. From a universe of 251 fragments from
six assemblages, 133 fragments are of soda-lime silica glass. This includes the following typologies:
beakers, bottles, bowls, cupping-glasses, goblets, gourds, flasks, one ink pot, jars and oil lamps. Some
shapes are uncommon, as for instance the gourds, that will be discussed below, whilst other shapes are
common among other European centres, for instance the oil lamps (representations of these oil lamps
can be seen in figures 4.2 and 4.3). In terms of decorative techniques, one can find several mould-blown
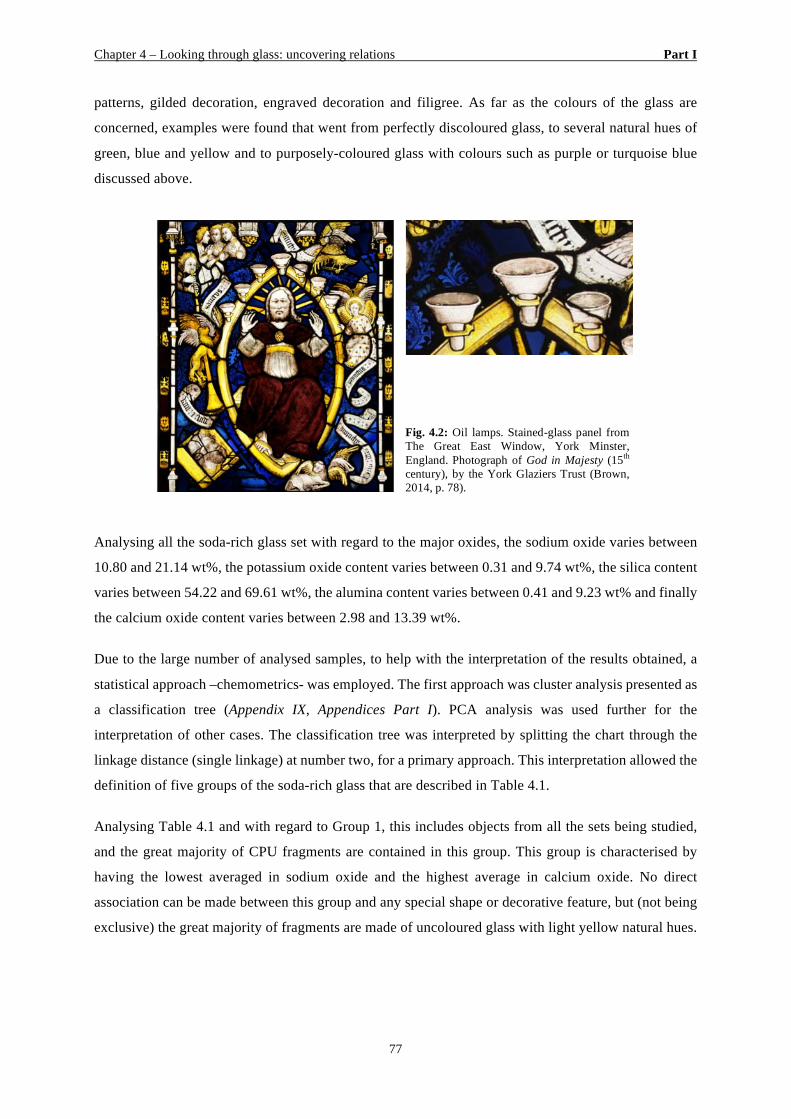
Chapter 4 – Looking through glass: uncovering relations Part I
77
patterns, gilded decoration, engraved decoration and filigree. As far as the colours of the glass are
concerned, examples were found that went from perfectly discoloured glass, to several natural hues of
green, blue and yellow and to purposely-coloured glass with colours such as purple or turquoise blue
discussed above.
Analysing all the soda-rich glass set with regard to the major oxides, the sodium oxide varies between
10.80 and 21.14 wt%, the potassium oxide content varies between 0.31 and 9.74 wt%, the silica content
varies between 54.22 and 69.61 wt%, the alumina content varies between 0.41 and 9.23 wt% and finally
the calcium oxide content varies between 2.98 and 13.39 wt%.
Due to the large number of analysed samples, to help with the interpretation of the results obtained, a
statistical approach –chemometrics- was employed. The first approach was cluster analysis presented as
a classification tree (Appendix IX, Appendices Part I). PCA analysis was used further for the
interpretation of other cases. The classification tree was interpreted by splitting the chart through the
linkage distance (single linkage) at number two, for a primary approach. This interpretation allowed the
definition of five groups of the soda-rich glass that are described in Table 4.1.
Analysing Table 4.1 and with regard to Group 1, this includes objects from all the sets being studied,
and the great majority of CPU fragments are contained in this group. This group is characterised by
having the lowest averaged in sodium oxide and the highest average in calcium oxide. No direct
association can be made between this group and any special shape or decorative feature, but (not being
exclusive) the great majority of fragments are made of uncoloured glass with light yellow natural hues.
Fig. 4.2: Oil lamps. Stained-glass panel from The Great East Window, York Minster, England. Photograph of God in Majesty (15th century), by the York Glaziers Trust (Brown, 2014, p. 78).
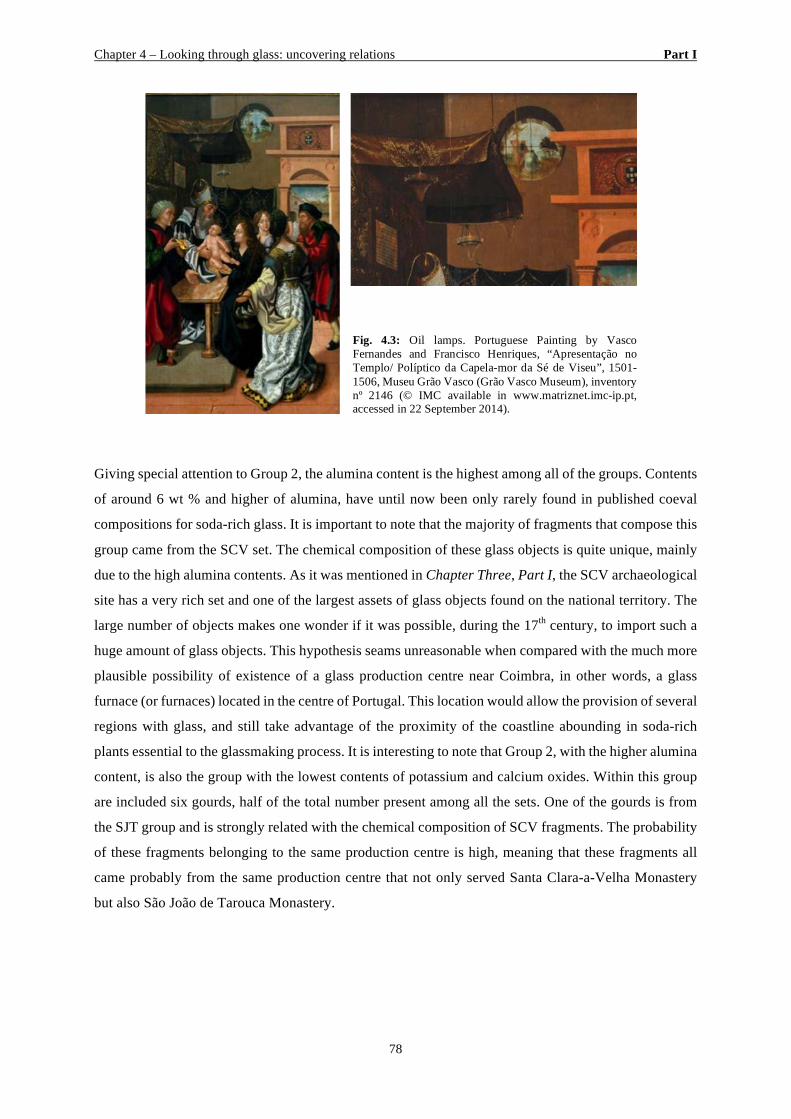
Chapter 4 – Looking through glass: uncovering relations Part I
78
Giving special attention to Group 2, the alumina content is the highest among all of the groups. Contents
of around 6 wt % and higher of alumina, have until now been only rarely found in published coeval
compositions for soda-rich glass. It is important to note that the majority of fragments that compose this
group came from the SCV set. The chemical composition of these glass objects is quite unique, mainly
due to the high alumina contents. As it was mentioned in Chapter Three, Part I, the SCV archaeological
site has a very rich set and one of the largest assets of glass objects found on the national territory. The
large number of objects makes one wonder if it was possible, during the 17th century, to import such a
huge amount of glass objects. This hypothesis seams unreasonable when compared with the much more
plausible possibility of existence of a glass production centre near Coimbra, in other words, a glass
furnace (or furnaces) located in the centre of Portugal. This location would allow the provision of several
regions with glass, and still take advantage of the proximity of the coastline abounding in soda-rich
plants essential to the glassmaking process. It is interesting to note that Group 2, with the higher alumina
content, is also the group with the lowest contents of potassium and calcium oxides. Within this group
are included six gourds, half of the total number present among all the sets. One of the gourds is from
the SJT group and is strongly related with the chemical composition of SCV fragments. The probability
of these fragments belonging to the same production centre is high, meaning that these fragments all
came probably from the same production centre that not only served Santa Clara-a-Velha Monastery
but also São João de Tarouca Monastery.
Fig. 4.3: Oil lamps. Portuguese Painting by Vasco Fernandes and Francisco Henriques, “Apresentação no Templo/ Políptico da Capela-mor da Sé de Viseu”, 1501-1506, Museu Grão Vasco (Grão Vasco Museum), inventory nº 2146 (© IMC available in www.matriznet.imc-ip.pt, accessed in 22 September 2014).
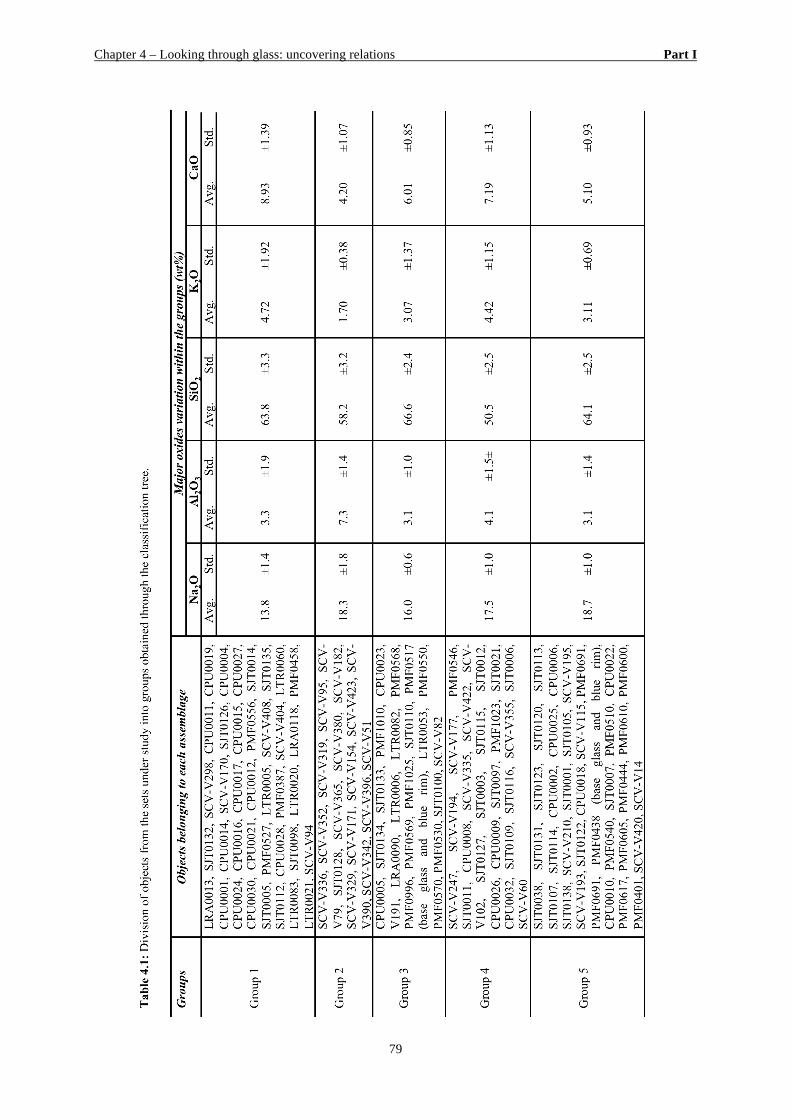
Chapter 4 – Looking through glass: uncovering relations Part I
79
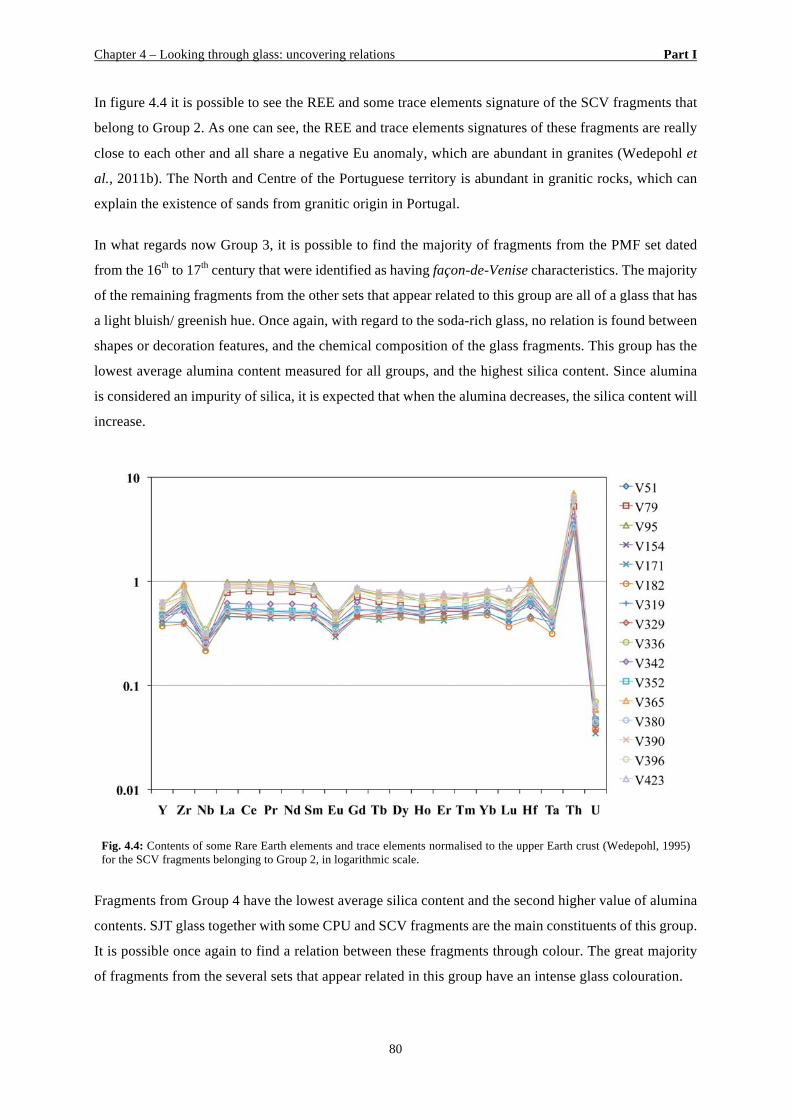
Chapter 4 – Looking through glass: uncovering relations Part I
80
In figure 4.4 it is possible to see the REE and some trace elements signature of the SCV fragments that
belong to Group 2. As one can see, the REE and trace elements signatures of these fragments are really
close to each other and all share a negative Eu anomaly, which are abundant in granites (Wedepohl et
al., 2011b). The North and Centre of the Portuguese territory is abundant in granitic rocks, which can
explain the existence of sands from granitic origin in Portugal.
In what regards now Group 3, it is possible to find the majority of fragments from the PMF set dated
from the 16th to 17th century that were identified as having façon-de-Venise characteristics. The majority
of the remaining fragments from the other sets that appear related to this group are all of a glass that has
a light bluish/ greenish hue. Once again, with regard to the soda-rich glass, no relation is found between
shapes or decoration features, and the chemical composition of the glass fragments. This group has the
lowest average alumina content measured for all groups, and the highest silica content. Since alumina
is considered an impurity of silica, it is expected that when the alumina decreases, the silica content will
increase.
Fig. 4.4: Contents of some Rare Earth elements and trace elements normalised to the upper Earth crust (Wedepohl, 1995) for the SCV fragments belonging to Group 2, in logarithmic scale.
Fragments from Group 4 have the lowest average silica content and the second higher value of alumina
contents. SJT glass together with some CPU and SCV fragments are the main constituents of this group.
It is possible once again to find a relation between these fragments through colour. The great majority
of fragments from the several sets that appear related in this group have an intense glass colouration.
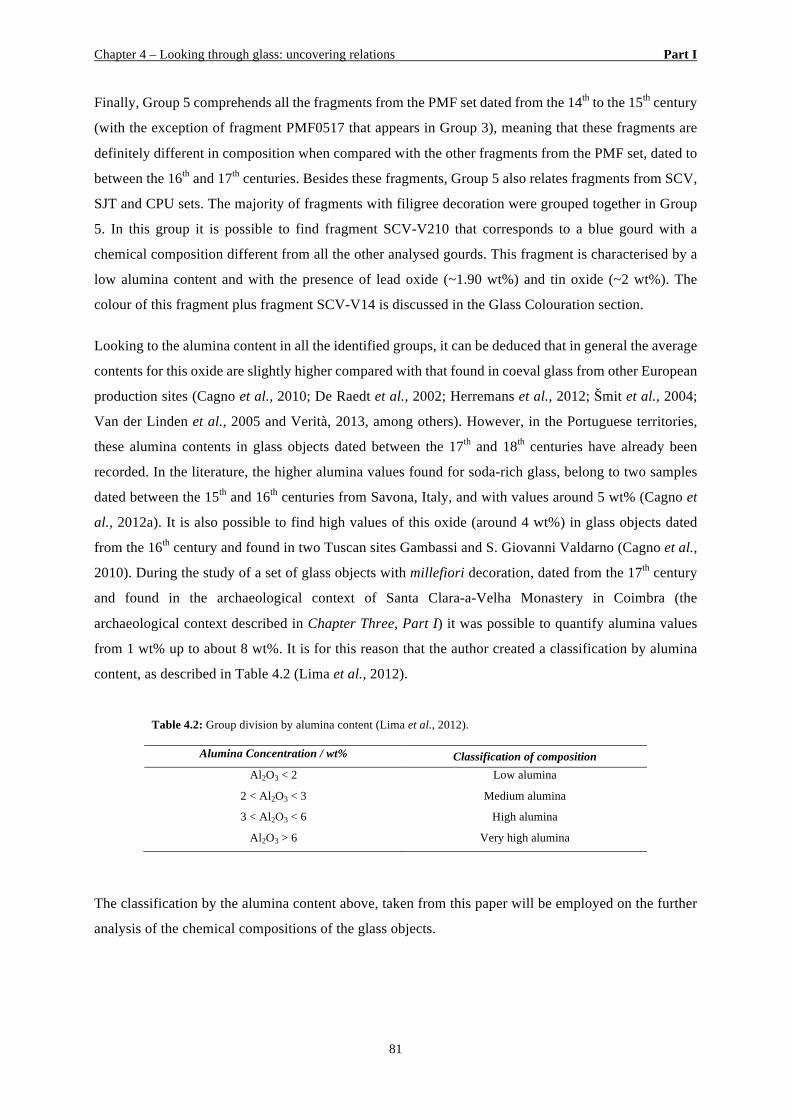
Chapter 4 – Looking through glass: uncovering relations Part I
81
Finally, Group 5 comprehends all the fragments from the PMF set dated from the 14th to the 15th century
(with the exception of fragment PMF0517 that appears in Group 3), meaning that these fragments are
definitely different in composition when compared with the other fragments from the PMF set, dated to
between the 16th and 17th centuries. Besides these fragments, Group 5 also relates fragments from SCV,
SJT and CPU sets. The majority of fragments with filigree decoration were grouped together in Group
5. In this group it is possible to find fragment SCV-V210 that corresponds to a blue gourd with a
chemical composition different from all the other analysed gourds. This fragment is characterised by a
low alumina content and with the presence of lead oxide (~1.90 wt%) and tin oxide (~2 wt%). The
colour of this fragment plus fragment SCV-V14 is discussed in the Glass Colouration section.
Looking to the alumina content in all the identified groups, it can be deduced that in general the average
contents for this oxide are slightly higher compared with that found in coeval glass from other European
production sites (Cagno et al., 2010; De Raedt et al., 2002; Herremans et al., 2012; Šmit et al., 2004;
Van der Linden et al., 2005 and Verità, 2013, among others). However, in the Portuguese territories,
these alumina contents in glass objects dated between the 17th and 18th centuries have already been
recorded. In the literature, the higher alumina values found for soda-rich glass, belong to two samples
dated between the 15th and 16th centuries from Savona, Italy, and with values around 5 wt% (Cagno et
al., 2012a). It is also possible to find high values of this oxide (around 4 wt%) in glass objects dated
from the 16th century and found in two Tuscan sites Gambassi and S. Giovanni Valdarno (Cagno et al.,
2010). During the study of a set of glass objects with millefiori decoration, dated from the 17th century
and found in the archaeological context of Santa Clara-a-Velha Monastery in Coimbra (the
archaeological context described in Chapter Three, Part I) it was possible to quantify alumina values
from 1 wt% up to about 8 wt%. It is for this reason that the author created a classification by alumina
content, as described in Table 4.2 (Lima et al., 2012).
Table 4.2: Group division by alumina content (Lima et al., 2012).
Alumina Concentration / wt% Classification of composition Al2O3 < 2 Low alumina
2 < Al2O3 < 3 Medium alumina
3 < Al2O3 < 6 High alumina
Al2O3 > 6 Very high alumina
The classification by the alumina content above, taken from this paper will be employed on the further
analysis of the chemical compositions of the glass objects.
Chapter 4 – Looking through glass: uncovering relations Part I
82
4.1.1 A small set from the medieval period 1
A group of eleven medieval glass fragments from the archaeological excavation in Avenida Miguel
Fernandes, Beja (PMF), was studied. These objects were at first investigated apart from the others,
because of their chronology. This small set provides the only information obtained for the medieval
period, and their study will allow to have an idea on the type (or types) of glass circulating in Portugal
and if a continuity is observed to the following centuries. Due to the small number of fragments, no
statistical treatment was applied to this data.
The glass finds from Beja dated between the 14th and the 15th centuries, can be considered a typical
group of glass objects from medieval tradition, with parallels in all European territory. Portuguese finds
can be compared with coeval objects from France, Spain, Italy, Germany and the British Isles, not only
in terms of the shapes of the objects, but also in the glass colour (greenish, yellowish and more scarcely,
colourless glass), and in decorative elements as the applied strings. It is yet interesting to point out that
the use of goblets in Portugal finds a parallelism with findings from French Mediterranean regions
(Coutinho et. al., 2016).
During the middle ages, glass was subjected to long-distance trading. As an example, during the 14th
and the 15th centuries, several archaeological evidences attest the glass importation from Germany, Italy
and France to the region of Flanders (Caluwé, 2005, p. 219-220). Numerous furnaces of small
dimensions were producing forest glass in Germany with the intent of distributing and exporting the
resultant objects through Frankfurt (Caluwé, 2006). Glass imports from Venice and Damascus arriving
in France and Cataluña are well documented (Doménech, 2004, p. 86; Frothingham Wilson, 1963, p.
22; Rochebrune, 2004). The most relevant and abundant information on glass production and trading
comes from Venice.
Since no medieval furnaces were so far discovered in Portugal, in order to provide comparable
production material, the employed methodology must combine both a stylistic and archaeometric
approach to discuss the provenance problem.
Considering the glass group from Beja under study here, some objects can be considered imported due
to their typological and decorative characteristics. The most evident example is the prunt fragment,
belonging to a beaker, the Krautskrunk, generally considered of a Central European tradition (Medici,
2014). The discoloured glass beakers decorated with applied coloured glass strings (spiralled) also
1 The content of this sub-chapter is published in the Journal of Medieval Iberian Studies under the title “First archaeometric study on medieval glass found in Beja (Southern Portugal)” (Coutinho et al., 2016).
Chapter 4 – Looking through glass: uncovering relations Part I
83
suggest a Central European tradition, as well as the discoloured beakers decorated with a blue rim
(Medici, 2014).
The remaining glass fragments from Beja, in terms of their stylistic features, seem to have come from
the same production centre. Simple shapes made in glass with green hues characterise this production.
The beaker with a string applied near the rim stands out, since no parallels were found outside
Portuguese contexts (Medici, 2014).
The composition of the analysed glass fragments was obtained by means of µ-PIXE and it is presented
in Table VI.2 in Appendix VI, Part I. All the analysed objects are composed by a soda-lime-silica glass
(Table VI.2 in Appendix VI, Part I). The contents of MgO (2.2-4.4 wt%), K2O (2.3-3.9 wt%), P2O5
(0.15-1.1 wt%) and the presence of chlorine (circa 1 wt%) are consistent with the use of coastal plant
ashes, thus showing a connection with the Mediterranean tradition.
The studied glasses do not differ significantly in terms of chemical composition, except in the cases
where the colour of the glass was changed intentionally (e.g. between colourless and blue glass). The
main compound of the glass, silica (SiO2), is present in a quantity that varies between 58 and 68 wt%.
The production of soda glass was predominant in the southern countries of medieval Europe, particularly
in Mediterranean countries, due to the abundance of marine plants (for instance salsola kali and barilla),
whose ashes contain high percentages of sodium and low percentages of potassium (Casellato et al.,
2003; Velde, 2013, p.71). The presence of chlorine in all the examined glasses is also indicative of the
use of these ashes as fluxes.
Silica
In addition to the silica, the sand used in the glass batch always contains different types of impurities
(Moretti & Hreglich, 2013). The minerals which make up these impurities are usually the aluminium-
rich kaolinite and feldspar, the zirconium-rich zircon (ZrSiO4), the REE-rich monazite (REE phosphate),
the titanium-rich rutile (TiO2) and iron oxides (Moretti & Hreglich, 2013; Wedepohl et al., 2011a).
These elements are the main trace elements and trackers for sand, allowing discussion about the
provenance of raw materials and, consequently, about the provenance of the glass (Velde, 2013). Further
information relating to the raw materials employed in the glassmaking process is presented in Appendix
I, Part I.
Following what was explained above, an overall look to the silica trace elements was performed and is
presented in figure 4.5. Starting with figure 4.5 a), through the division of the samples by their alumina
contents, one can identify a major group in the high alumina area, with contents between 3 and 6 wt%.
Studies on the chemical composition of 14th-15th century European glass have identified alumina
contents up to 4 wt % (see for instance Cagno et al., 2010; Duckworth et al., 2014; Verità & Zecchin,
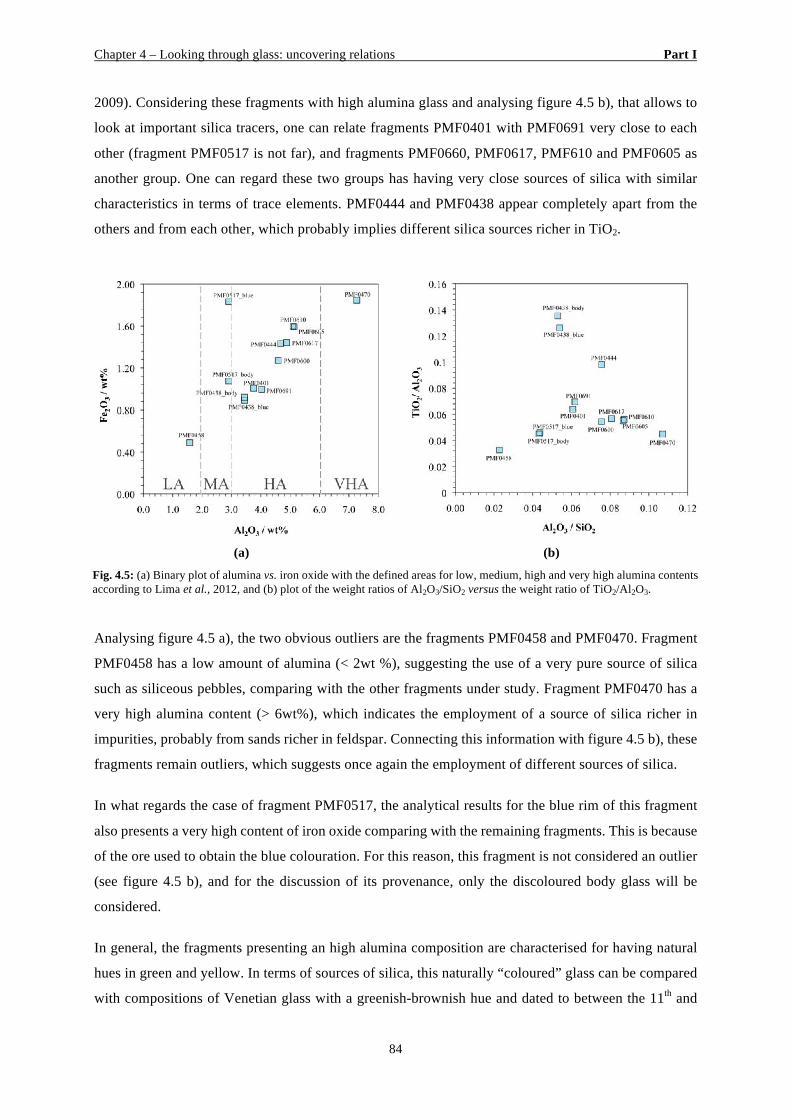
Chapter 4 – Looking through glass: uncovering relations Part I
84
2009). Considering these fragments with high alumina glass and analysing figure 4.5 b), that allows to
look at important silica tracers, one can relate fragments PMF0401 with PMF0691 very close to each
other (fragment PMF0517 is not far), and fragments PMF0660, PMF0617, PMF610 and PMF0605 as
another group. One can regard these two groups has having very close sources of silica with similar
characteristics in terms of trace elements. PMF0444 and PMF0438 appear completely apart from the
others and from each other, which probably implies different silica sources richer in TiO2.
Analysing figure 4.5 a), the two obvious outliers are the fragments PMF0458 and PMF0470. Fragment
PMF0458 has a low amount of alumina (< 2wt %), suggesting the use of a very pure source of silica
such as siliceous pebbles, comparing with the other fragments under study. Fragment PMF0470 has a
very high alumina content (> 6wt%), which indicates the employment of a source of silica richer in
impurities, probably from sands richer in feldspar. Connecting this information with figure 4.5 b), these
fragments remain outliers, which suggests once again the employment of different sources of silica.
In what regards the case of fragment PMF0517, the analytical results for the blue rim of this fragment
also presents a very high content of iron oxide comparing with the remaining fragments. This is because
of the ore used to obtain the blue colouration. For this reason, this fragment is not considered an outlier
(see figure 4.5 b), and for the discussion of its provenance, only the discoloured body glass will be
considered.
In general, the fragments presenting an high alumina composition are characterised for having natural
hues in green and yellow. In terms of sources of silica, this naturally “coloured” glass can be compared
with compositions of Venetian glass with a greenish-brownish hue and dated to between the 11th and
(a) (b)
Fig. 4.5: (a) Binary plot of alumina vs. iron oxide with the defined areas for low, medium, high and very high alumina contents according to Lima et al., 2012, and (b) plot of the weight ratios of Al2O3/SiO2 versus the weight ratio of TiO2/Al2O3.
Chapter 4 – Looking through glass: uncovering relations Part I
85
14th centuries (Verità et al., 2002; Veritá, 2013). Since the fragments under study here belong to
utilitarian glass, this does not necessarily mean that they were imported from Venice, but more likely
that similar recipes were being used around Mediterranean Europe. Furthermore, it is possible to find
glass from production sites in Tuscany with similar characteristics in terms of sources of silica glass
dated to between 13th and 14th centuries (Cagno et al., 2010).
It is from the 14th/15th century onwards, that a major care in terms of selecting raw materials to produce
glass is noticed, and starts to reflect on the glass chemical compositions. For this reason, it is possible
to find similarities among Mediterranean glass analysed from this time period.
As it was explained above, stylistically, the two beaker fragments with blue rims were very popular in
Venice and all around Europe. Fragments PMF0438 and PMF0517 are for this reason discussed in more
detail here, since are eligible to have been imported. The chemical composition of the fragments
PMF0438 and PMF0517 was first compared to published compositions of coeval Venetian glass (Verità
& Zecchin, 2009a; Verità, 2013). From this comparison, it was not possible to attribute these samples
to imports from Venice. From this period, the discoloured glasses had low contents of alumina (around
1 wt %), and lime contents around 8 wt% (Verità, 2013). Analysing the published compositions for glass
found in France from the considered period, soda-rich glass was so far only identified on the south of
the country, and it belongs to different typologies (found in flasks for instance). This French glass is
also characterised for having very low contents of alumina, suggesting the use of a pure silica source
(Barrera & Velde, 1989). Looking now to Spanish glass compositions, as far as the author knows, no
published glass compositions from this chronology are available. The closest compositions in terms of
chronology date to the 9th to the 12th century, and were obtained from glasses collected in the al-Andalus
region (Duckworth et al., 2014). It was decided to compare this data with the results obtained for the
PMF glasses, in order to evaluate a possible connection with the Islamic tradition. In terms of sources
of silica, the group defined by Duckworth et al. (2014) as low-lead can be compared with the two
PMF0438 and PMF0517 samples in terms of alumina, titanium and iron oxides. However, no lead was
found on the samples from PMF, Beja.
Fragment PMF0458 is also eligible to be a foreigner import, since this kind of prunted beakers
(Krautstrunk) were very fashioned in Central Europe. In Germany, this kind of beakers were
characterised for a potassium-rich composition (typical of Central European tradition), and dated to the
14th century. Similar prunted beakers of a potassium-rich composition were also found in Belgium
(Caluwé, 2005, p. 219, colour plate 58, d). These examples found in Belgium were considered an import
from Germany. As it was mentioned above, a Venetian origin for these beakers cannot be discarded.
Analysing the source of silica of the fragment PMF0458, one can conclude that it is consistent with
Venetian glass produced at this time. This fragment will be further discussed in more detail considering
its fluxing agents.
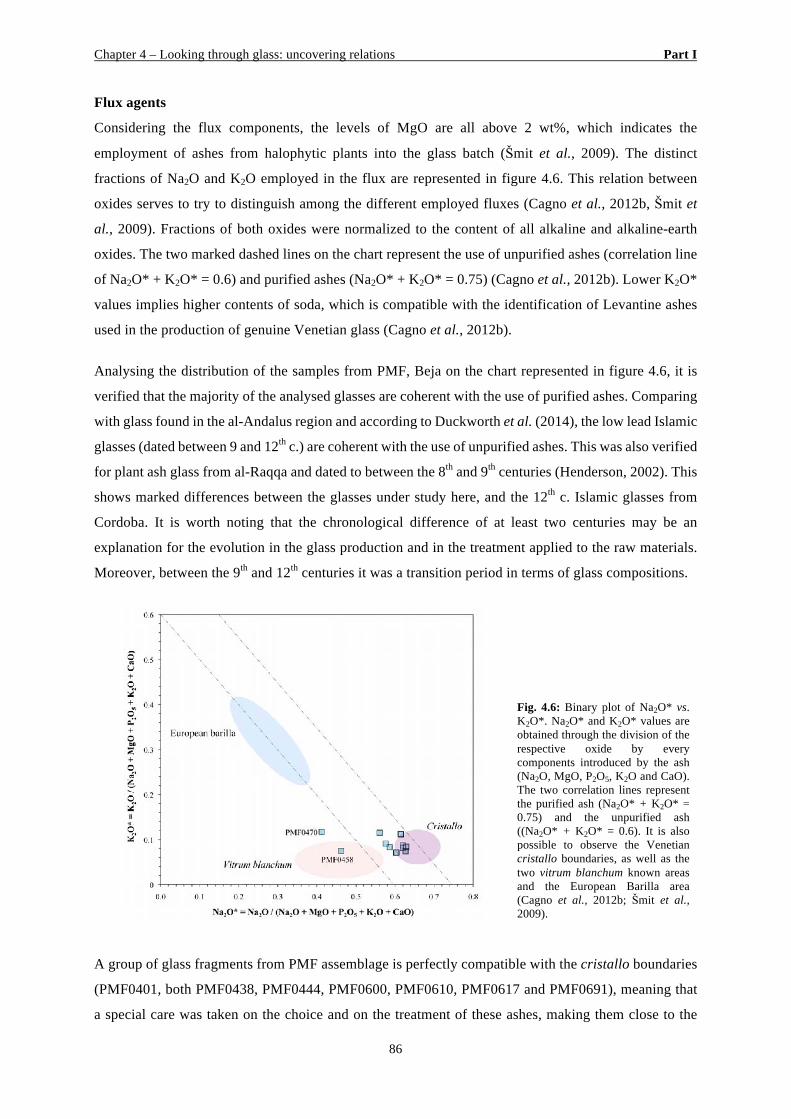
Chapter 4 – Looking through glass: uncovering relations Part I
86
Flux agents
Considering the flux components, the levels of MgO are all above 2 wt%, which indicates the
employment of ashes from halophytic plants into the glass batch (Šmit et al., 2009). The distinct
fractions of Na2O and K2O employed in the flux are represented in figure 4.6. This relation between
oxides serves to try to distinguish among the different employed fluxes (Cagno et al., 2012b, Šmit et
al., 2009). Fractions of both oxides were normalized to the content of all alkaline and alkaline-earth
oxides. The two marked dashed lines on the chart represent the use of unpurified ashes (correlation line
of Na2O* + K2O* = 0.6) and purified ashes (Na2O* + K2O* = 0.75) (Cagno et al., 2012b). Lower K2O*
values implies higher contents of soda, which is compatible with the identification of Levantine ashes
used in the production of genuine Venetian glass (Cagno et al., 2012b).
Analysing the distribution of the samples from PMF, Beja on the chart represented in figure 4.6, it is
verified that the majority of the analysed glasses are coherent with the use of purified ashes. Comparing
with glass found in the al-Andalus region and according to Duckworth et al. (2014), the low lead Islamic
glasses (dated between 9 and 12th c.) are coherent with the use of unpurified ashes. This was also verified
for plant ash glass from al-Raqqa and dated to between the 8th and 9th centuries (Henderson, 2002). This
shows marked differences between the glasses under study here, and the 12th c. Islamic glasses from
Cordoba. It is worth noting that the chronological difference of at least two centuries may be an
explanation for the evolution in the glass production and in the treatment applied to the raw materials.
Moreover, between the 9th and 12th centuries it was a transition period in terms of glass compositions.
A group of glass fragments from PMF assemblage is perfectly compatible with the cristallo boundaries
(PMF0401, both PMF0438, PMF0444, PMF0600, PMF0610, PMF0617 and PMF0691), meaning that
a special care was taken on the choice and on the treatment of these ashes, making them close to the
Fig. 4.6: Binary plot of Na2O* vs. K2O*. Na2O* and K2O* values are obtained through the division of the respective oxide by every components introduced by the ash (Na2O, MgO, P2O5, K2O and CaO). The two correlation lines represent the purified ash (Na2O* + K2O* = 0.75) and the unpurified ash ((Na2O* + K2O* = 0.6). It is also possible to observe the Venetian cristallo boundaries, as well as the two vitrum blanchum known areas and the European Barilla area (Cagno et al., 2012b; Šmit et al., 2009).
Chapter 4 – Looking through glass: uncovering relations Part I
87
characteristics of the Levantine ashes. More or less in between the two correlations lines, one can find
both PMF0517 and PMF0605 fragments. This can be the result of using less quantity of pure plant ashes.
Due to high levels of P2O5 in these samples a purification of the ashes is less probable, and the use of
pure sources for the plan ashes, like Syria for instance is proposed.
The fragments PMF0458 and PMF0470 are the two outliers identified in this relation of the flux
components, and they are both consistent with the use of less pure plant ashes. The fragment PMF0458
has a very close composition to Venetian glass dated to between 11th and 14th centuries, and according
to figure 4.6, it is consistent with vitrum blanchum glass (Verità, 1986; Verità & Zecchin, 2009a, p.
239). In Bohemian examples of prunted beakers with a soda-rich composition, were identified and
attributed to Venetian imports dated from the end of the 14th century and to the 15th century (Sedláčková,
2007, p. 202). A different type of prunted beakers was also found in the archaeological excavation of
Rocca di Asolo (Northern Italy), and was considered as a possible Venetian import (Gallo & Silvestri,
2012). Comparing the reported composition from Rocca di Asolo fragments with the one of fragment
PMF0458, it is possible to attest their similarity (Gallo & Silvestri, 2012).
Fragment PMF0470 was clearly made using unpure ashes. Relating this information with the one
obtained from analysis to the sources of silica, it is highly suggested that this fragment was made
employing raw materials (both the silica and the flux) from a different origin. Since the flux from
fragment PMF0470 was not treated, this also suggests that this object was made in a different production
centre comparing to the other fragments, and probably using a different recipe.
4.1.2 Venetian and Façon-de-Venise glass 2 Among all sets, some shapes were identified as Venetian or façon-de-Venise objects, not only because
of their shapes, but also due to their decorative features (examples in figure 4.7) (Medici, 2014).
From the 16th century onwards, façon-de-Venise glass was the manifestation of Venetian taste, spreading
in Europe throughout several production centres, mainly as a consequence of the emigration of Venetian
glassmakers. A number of papers devoted to the analysis of Venetian and façon-de Venise glass objects
discussed not only the raw materials employed in the manufacture of these items, but also their probable
production locations (De Raedt et al., 2001; 2002, Šmit et al., 2004; 2009; Verità & Zecchin, 2009a;
Moretti & Hreglich, 2013). Chemical analysis and research on ancient treatises (Verità & Zecchin,
2009a) led to the understanding that the raw materials employed in Venetian and façon-de Venise
2 The content of this sub-chapter is published in the Journal of Archeological Science: Reports under the title “Provenance studies on façon-de-Venise glass excavated in Portugal” (Coutinho et al., 2016b).
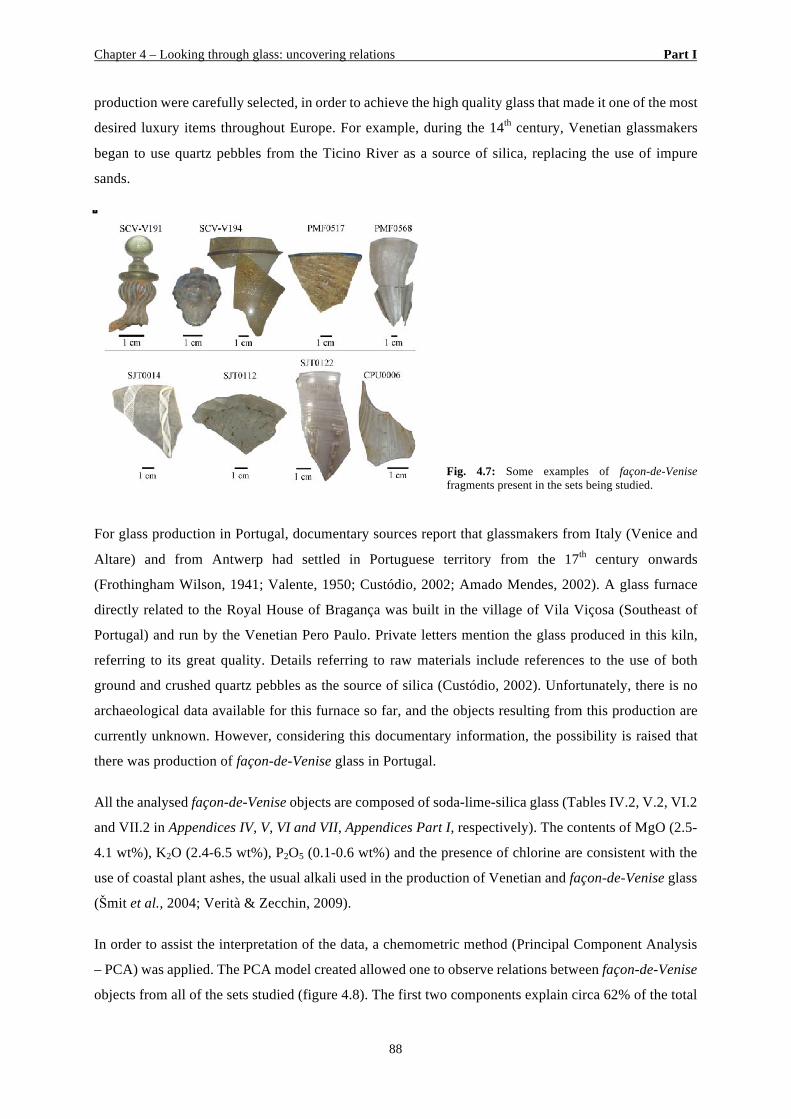
Chapter 4 – Looking through glass: uncovering relations Part I
88
production were carefully selected, in order to achieve the high quality glass that made it one of the most
desired luxury items throughout Europe. For example, during the 14th century, Venetian glassmakers
began to use quartz pebbles from the Ticino River as a source of silica, replacing the use of impure
sands.
Fig. 4.7: Some examples of façon-de-Venise fragments present in the sets being studied.
For glass production in Portugal, documentary sources report that glassmakers from Italy (Venice and
Altare) and from Antwerp had settled in Portuguese territory from the 17th century onwards
(Frothingham Wilson, 1941; Valente, 1950; Custódio, 2002; Amado Mendes, 2002). A glass furnace
directly related to the Royal House of Bragança was built in the village of Vila Viçosa (Southeast of
Portugal) and run by the Venetian Pero Paulo. Private letters mention the glass produced in this kiln,
referring to its great quality. Details referring to raw materials include references to the use of both
ground and crushed quartz pebbles as the source of silica (Custódio, 2002). Unfortunately, there is no
archaeological data available for this furnace so far, and the objects resulting from this production are
currently unknown. However, considering this documentary information, the possibility is raised that
there was production of façon-de-Venise glass in Portugal.
All the analysed façon-de-Venise objects are composed of soda-lime-silica glass (Tables IV.2, V.2, VI.2
and VII.2 in Appendices IV, V, VI and VII, Appendices Part I, respectively). The contents of MgO (2.5-
4.1 wt%), K2O (2.4-6.5 wt%), P2O5 (0.1-0.6 wt%) and the presence of chlorine are consistent with the
use of coastal plant ashes, the usual alkali used in the production of Venetian and façon-de-Venise glass
(Šmit et al., 2004; Verità & Zecchin, 2009).
In order to assist the interpretation of the data, a chemometric method (Principal Component Analysis
– PCA) was applied. The PCA model created allowed one to observe relations between façon-de-Venise
objects from all of the sets studied (figure 4.8). The first two components explain circa 62% of the total
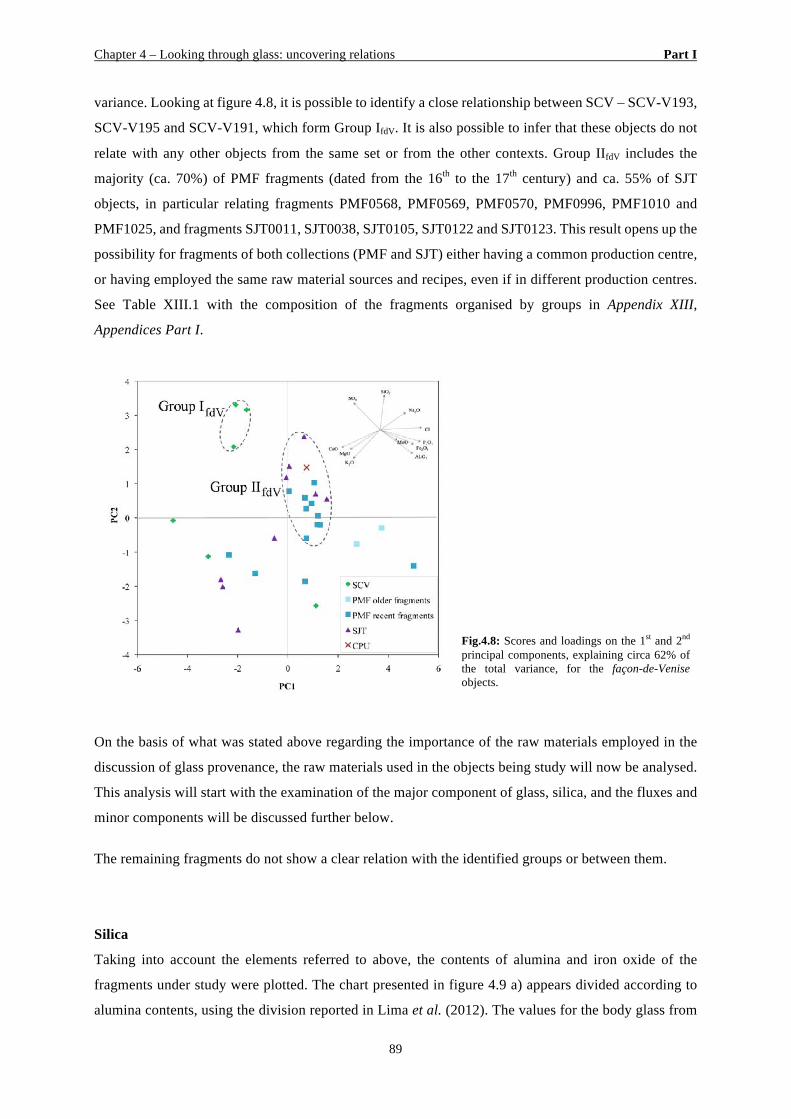
Chapter 4 – Looking through glass: uncovering relations Part I
89
variance. Looking at figure 4.8, it is possible to identify a close relationship between SCV – SCV-V193,
SCV-V195 and SCV-V191, which form Group IfdV. It is also possible to infer that these objects do not
relate with any other objects from the same set or from the other contexts. Group IIfdV includes the
majority (ca. 70%) of PMF fragments (dated from the 16th to the 17th century) and ca. 55% of SJT
objects, in particular relating fragments PMF0568, PMF0569, PMF0570, PMF0996, PMF1010 and
PMF1025, and fragments SJT0011, SJT0038, SJT0105, SJT0122 and SJT0123. This result opens up the
possibility for fragments of both collections (PMF and SJT) either having a common production centre,
or having employed the same raw material sources and recipes, even if in different production centres.
See Table XIII.1 with the composition of the fragments organised by groups in Appendix XIII,
Appendices Part I.
Fig.4.8: Scores and loadings on the 1st and 2nd principal components, explaining circa 62% of the total variance, for the façon-de-Venise objects.
On the basis of what was stated above regarding the importance of the raw materials employed in the
discussion of glass provenance, the raw materials used in the objects being study will now be analysed.
This analysis will start with the examination of the major component of glass, silica, and the fluxes and
minor components will be discussed further below.
The remaining fragments do not show a clear relation with the identified groups or between them.
Silica
Taking into account the elements referred to above, the contents of alumina and iron oxide of the
fragments under study were plotted. The chart presented in figure 4.9 a) appears divided according to
alumina contents, using the division reported in Lima et al. (2012). The values for the body glass from
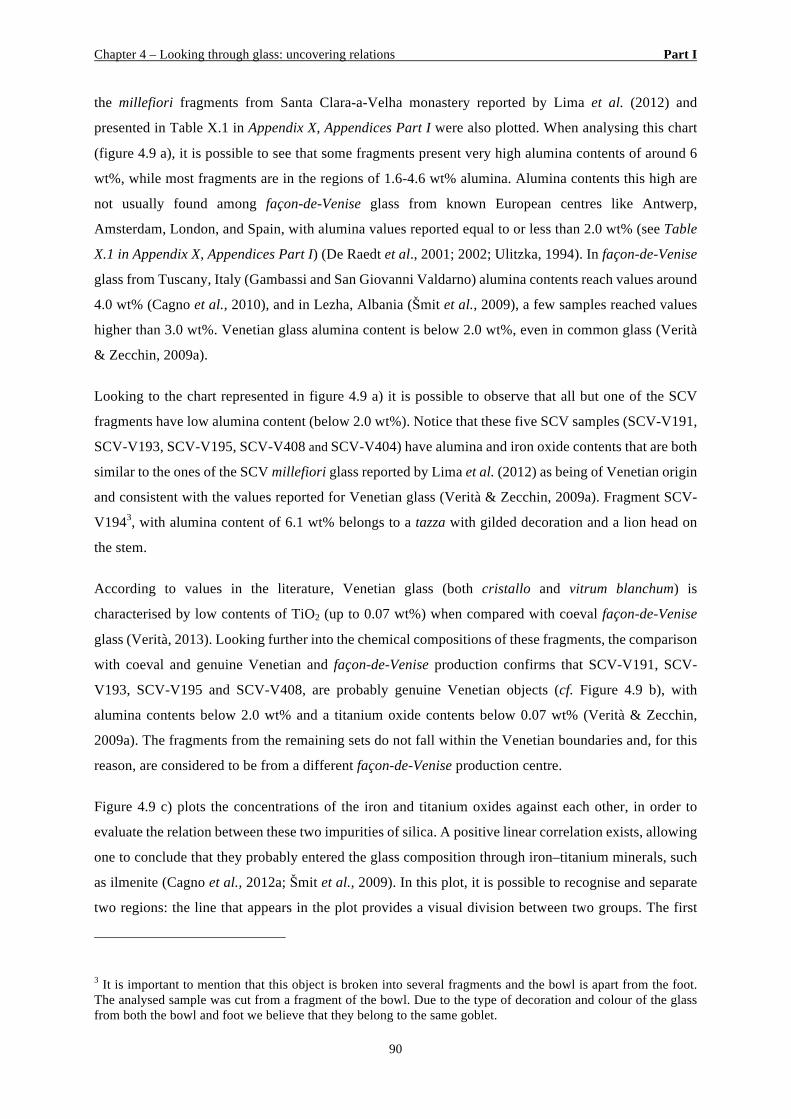
Chapter 4 – Looking through glass: uncovering relations Part I
90
the millefiori fragments from Santa Clara-a-Velha monastery reported by Lima et al. (2012) and
presented in Table X.1 in Appendix X, Appendices Part I were also plotted. When analysing this chart
(figure 4.9 a), it is possible to see that some fragments present very high alumina contents of around 6
wt%, while most fragments are in the regions of 1.6-4.6 wt% alumina. Alumina contents this high are
not usually found among façon-de-Venise glass from known European centres like Antwerp,
Amsterdam, London, and Spain, with alumina values reported equal to or less than 2.0 wt% (see Table
X.1 in Appendix X, Appendices Part I) (De Raedt et al., 2001; 2002; Ulitzka, 1994). In façon-de-Venise
glass from Tuscany, Italy (Gambassi and San Giovanni Valdarno) alumina contents reach values around
4.0 wt% (Cagno et al., 2010), and in Lezha, Albania (Šmit et al., 2009), a few samples reached values
higher than 3.0 wt%. Venetian glass alumina content is below 2.0 wt%, even in common glass (Verità
& Zecchin, 2009a).
Looking to the chart represented in figure 4.9 a) it is possible to observe that all but one of the SCV
fragments have low alumina content (below 2.0 wt%). Notice that these five SCV samples (SCV-V191,
SCV-V193, SCV-V195, SCV-V408 and SCV-V404) have alumina and iron oxide contents that are both
similar to the ones of the SCV millefiori glass reported by Lima et al. (2012) as being of Venetian origin
and consistent with the values reported for Venetian glass (Verità & Zecchin, 2009a). Fragment SCV-
V1943, with alumina content of 6.1 wt% belongs to a tazza with gilded decoration and a lion head on
the stem.
According to values in the literature, Venetian glass (both cristallo and vitrum blanchum) is
characterised by low contents of TiO2 (up to 0.07 wt%) when compared with coeval façon-de-Venise
glass (Verità, 2013). Looking further into the chemical compositions of these fragments, the comparison
with coeval and genuine Venetian and façon-de-Venise production confirms that SCV-V191, SCV-
V193, SCV-V195 and SCV-V408, are probably genuine Venetian objects (cf. Figure 4.9 b), with
alumina contents below 2.0 wt% and a titanium oxide contents below 0.07 wt% (Verità & Zecchin,
2009a). The fragments from the remaining sets do not fall within the Venetian boundaries and, for this
reason, are considered to be from a different façon-de-Venise production centre.
Figure 4.9 c) plots the concentrations of the iron and titanium oxides against each other, in order to
evaluate the relation between these two impurities of silica. A positive linear correlation exists, allowing
one to conclude that they probably entered the glass composition through iron–titanium minerals, such
as ilmenite (Cagno et al., 2012a; Šmit et al., 2009). In this plot, it is possible to recognise and separate
two regions: the line that appears in the plot provides a visual division between two groups. The first
3 It is important to mention that this object is broken into several fragments and the bowl is apart from the foot. The analysed sample was cut from a fragment of the bowl. Due to the type of decoration and colour of the glass from both the bowl and foot we believe that they belong to the same goblet.
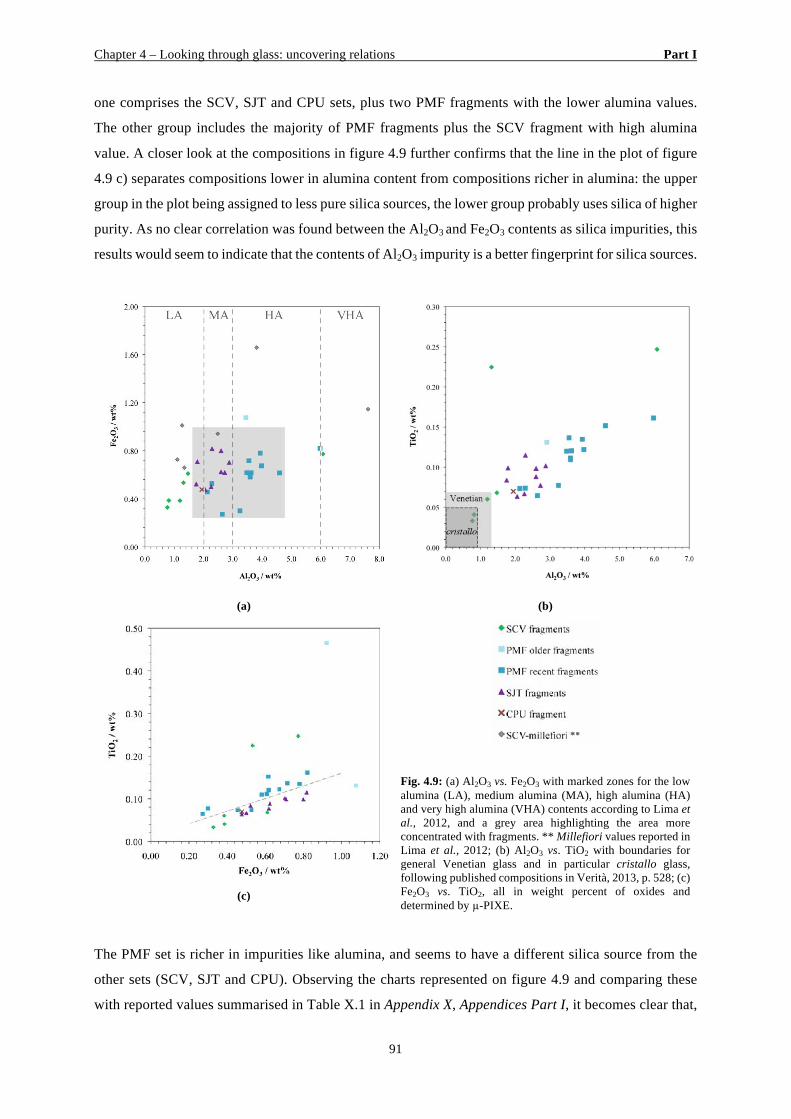
Chapter 4 – Looking through glass: uncovering relations Part I
91
one comprises the SCV, SJT and CPU sets, plus two PMF fragments with the lower alumina values.
The other group includes the majority of PMF fragments plus the SCV fragment with high alumina
value. A closer look at the compositions in figure 4.9 further confirms that the line in the plot of figure
4.9 c) separates compositions lower in alumina content from compositions richer in alumina: the upper
group in the plot being assigned to less pure silica sources, the lower group probably uses silica of higher
purity. As no clear correlation was found between the Al2O3 and Fe2O3 contents as silica impurities, this
results would seem to indicate that the contents of Al2O3 impurity is a better fingerprint for silica sources.
(a) (b)
Fig. 4.9: (a) Al2O3 vs. Fe2O3 with marked zones for the low alumina (LA), medium alumina (MA), high alumina (HA) and very high alumina (VHA) contents according to Lima et al., 2012, and a grey area highlighting the area more concentrated with fragments. ** Millefiori values reported in Lima et al., 2012; (b) Al2O3 vs. TiO2 with boundaries for general Venetian glass and in particular cristallo glass, following published compositions in Verità, 2013, p. 528; (c) Fe2O3 vs. TiO2, all in weight percent of oxides and determined by µ-PIXE.
(c)
The PMF set is richer in impurities like alumina, and seems to have a different silica source from the
other sets (SCV, SJT and CPU). Observing the charts represented on figure 4.9 and comparing these
with reported values summarised in Table X.1 in Appendix X, Appendices Part I, it becomes clear that,
Chapter 4 – Looking through glass: uncovering relations Part I
92
due to the elevated alumina contents for both represented chronologies, a Venetian provenance has to
be discarded, as already stated. The fragments PMF0527, PMF0556 and PMF1010, with an alumina
content below 3 wt%, can be compared with published results on façon-de-Venise production centres.
The remaining façon-de-Venise fragments from this set are related to each other not only in terms of
shapes and decorations (stem glass with mould blown ribs) and the hue of the glass (light blue), but also
in terms of major and minor elements and most of these PMF fragments were clustered together in the
PCA analysis (see figure 4.8). For this reason the existence of a façon-de-Venise production centre not
recognised yet is highly probable. Due to the absence of excavated glass furnaces of this period in
Portugal, and on the rest of the Iberian Peninsula as well, one can only speculate about the origin of
these objects.
The SJT fragments appear to have been made with the same or related silica sources. Due to the alumina
values (between 2 and 3 wt%), the fragments from this assemblage cannot be related with any of the
known façon-de-Venise production centres (see Table X.1 in Appendix X, Appendices Part I).
A more detailed analysis was performed on the SCV glass fragments attributed to Venetian origin by
means of LA-ICP-MS (Table VI.3 and VI.4 in Appendix VI, Appendices Part I). From this analysis it
was possible to quantify trace and REE contents in the glass.
According to De Raedt et al. (2001), it is possible to distinguish between Venetian and Antwerp façon-
de-Venise glass through the contents of Zr and Hf measured in the glass. Zirconium comes from the
zircon mineral, and Hf is an accessory element present in this mineral (Cagno et al., 2012a) The Zr
contents of Venetian glass is low, ranging between 20 and 40 µg/g; and the Hf content is less than 1
µg/g. Looking at the charts represented in figure 4.10, one can see that SCV-V191, SCV-V193, SCV-
V195, and SCV-V408 have Zr values of between 20 and 40 µg/g as well as an Hf content below 1 µg/g.
Relating this information to that obtained through major oxides analysis and with REE contents, it is
possible once again to confirm that these glass objects are of Venetian provenance.
Looking deeper at the glass composition, and considering trace elements and REE of SCV glasses (Table
VI.3 and VI.4 in Appendix VI, Appendices Part I) in a trace element Earth crust normalised plot (see
figure 4.11), it is possible to confirm that the fragments SCV-V191, SCV-V193, SCV-V195 and SCV-
V408 have a very similar trace element pattern, which in the case of SCV-V193 and SCV-V195 seems
to be identical. These four glasses have enrichment in Sr and depletion of the remaining crustal elements,
confirming the use of a pure silica source (Cagno et al., 2012a). Their resemblance in terms of trace and
REE elements concentration can be explained by the use of the same raw materials. In this case, the
fragment SCV-V408 could have been produced in a different Venetian production centre since its
chemical composition in major elements differs from SCV-V191, SCV-V193 and SCV-V195 fragments
(cf. Table IV.2 in Appendix IV, Appendices Part I). A different ratio of the employed raw materials can
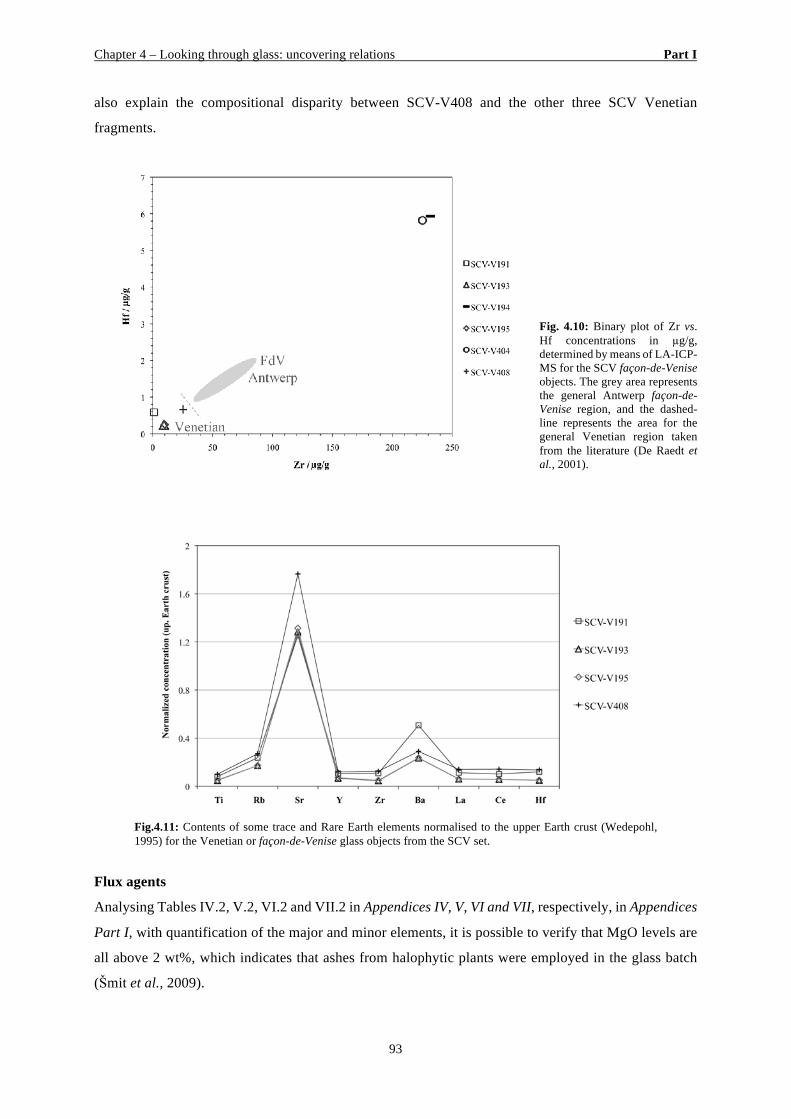
Chapter 4 – Looking through glass: uncovering relations Part I
93
also explain the compositional disparity between SCV-V408 and the other three SCV Venetian
fragments.
Fig.4.11: Contents of some trace and Rare Earth elements normalised to the upper Earth crust (Wedepohl, 1995) for the Venetian or façon-de-Venise glass objects from the SCV set.
Flux agents
Analysing Tables IV.2, V.2, VI.2 and VII.2 in Appendices IV, V, VI and VII, respectively, in Appendices
Part I, with quantification of the major and minor elements, it is possible to verify that MgO levels are
all above 2 wt%, which indicates that ashes from halophytic plants were employed in the glass batch
(Šmit et al., 2009).
Fig. 4.10: Binary plot of Zr vs. Hf concentrations in µg/g, determined by means of LA-ICP-MS for the SCV façon-de-Venise objects. The grey area represents the general Antwerp façon-de-Venise region, and the dashed-line represents the area for the general Venetian region taken from the literature (De Raedt et al., 2001).
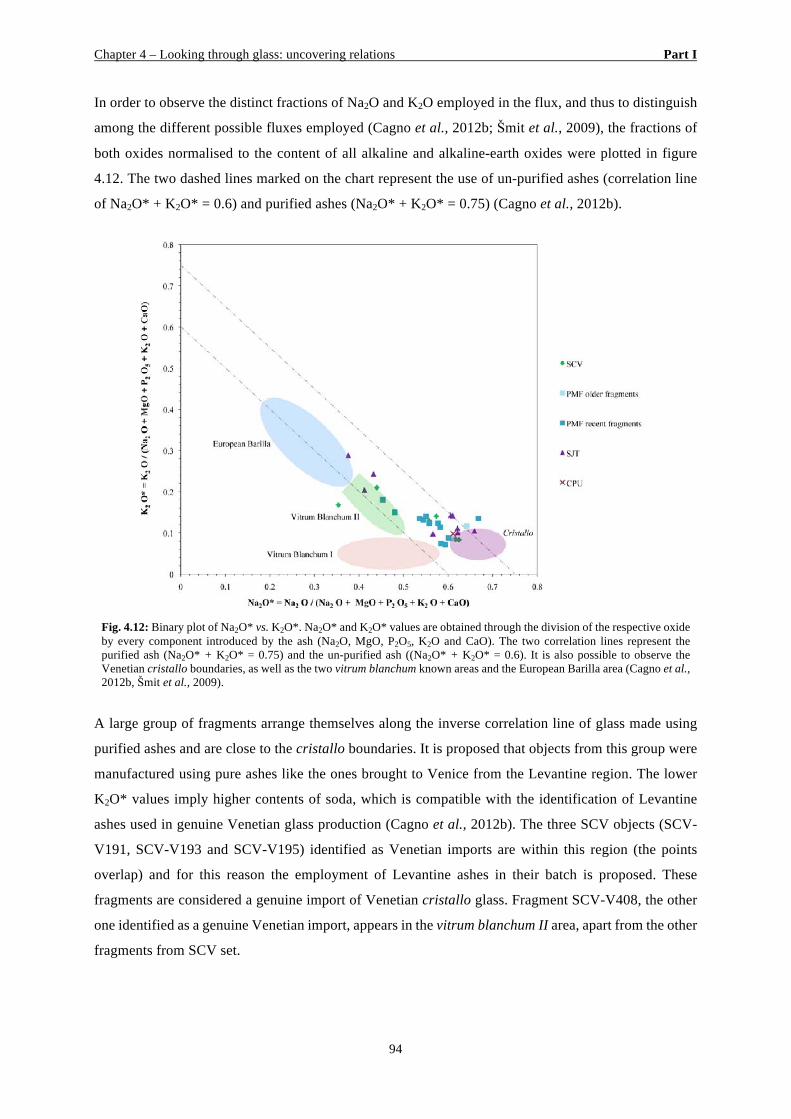
Chapter 4 – Looking through glass: uncovering relations Part I
94
In order to observe the distinct fractions of Na2O and K2O employed in the flux, and thus to distinguish
among the different possible fluxes employed (Cagno et al., 2012b; Šmit et al., 2009), the fractions of
both oxides normalised to the content of all alkaline and alkaline-earth oxides were plotted in figure
4.12. The two dashed lines marked on the chart represent the use of un-purified ashes (correlation line
of Na2O* + K2O* = 0.6) and purified ashes (Na2O* + K2O* = 0.75) (Cagno et al., 2012b).
Fig. 4.12: Binary plot of Na2O* vs. K2O*. Na2O* and K2O* values are obtained through the division of the respective oxide by every component introduced by the ash (Na2O, MgO, P2O5, K2O and CaO). The two correlation lines represent the purified ash (Na2O* + K2O* = 0.75) and the un-purified ash ((Na2O* + K2O* = 0.6). It is also possible to observe the Venetian cristallo boundaries, as well as the two vitrum blanchum known areas and the European Barilla area (Cagno et al., 2012b, Šmit et al., 2009).
A large group of fragments arrange themselves along the inverse correlation line of glass made using
purified ashes and are close to the cristallo boundaries. It is proposed that objects from this group were
manufactured using pure ashes like the ones brought to Venice from the Levantine region. The lower
K2O* values imply higher contents of soda, which is compatible with the identification of Levantine
ashes used in genuine Venetian glass production (Cagno et al., 2012b). The three SCV objects (SCV-
V191, SCV-V193 and SCV-V195) identified as Venetian imports are within this region (the points
overlap) and for this reason the employment of Levantine ashes in their batch is proposed. These
fragments are considered a genuine import of Venetian cristallo glass. Fragment SCV-V408, the other
one identified as a genuine Venetian import, appears in the vitrum blanchum II area, apart from the other
fragments from SCV set.
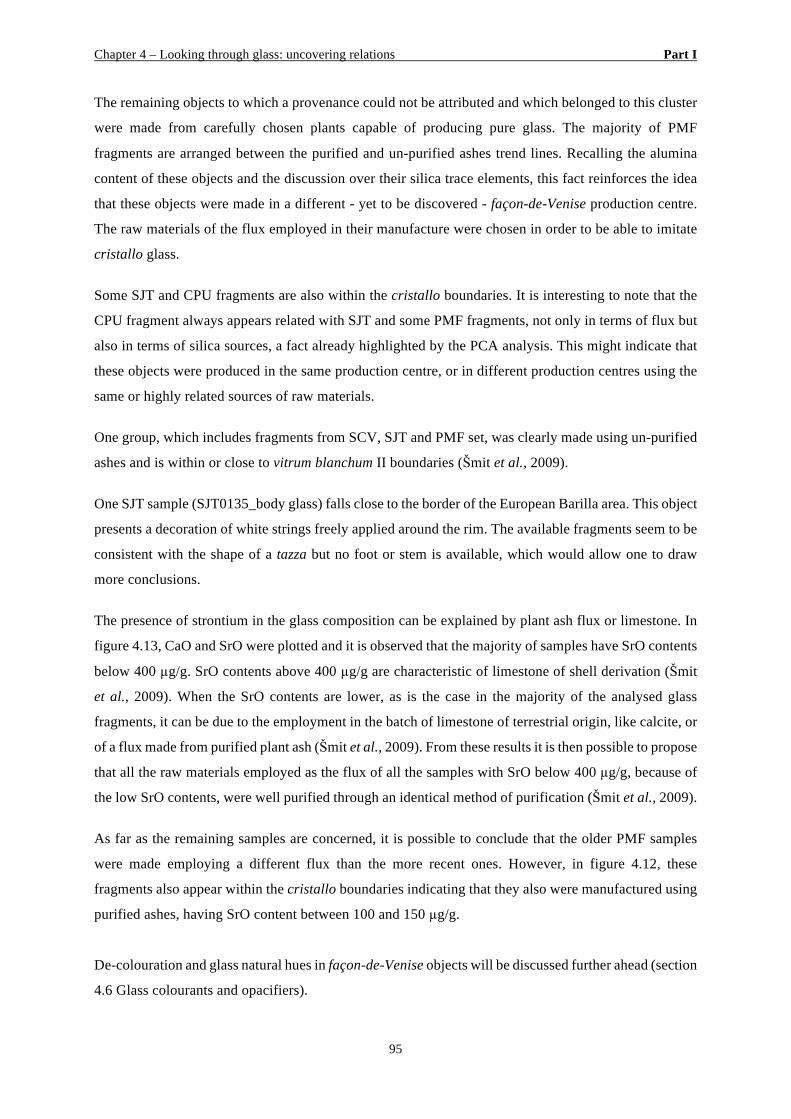
Chapter 4 – Looking through glass: uncovering relations Part I
95
The remaining objects to which a provenance could not be attributed and which belonged to this cluster
were made from carefully chosen plants capable of producing pure glass. The majority of PMF
fragments are arranged between the purified and un-purified ashes trend lines. Recalling the alumina
content of these objects and the discussion over their silica trace elements, this fact reinforces the idea
that these objects were made in a different - yet to be discovered - façon-de-Venise production centre.
The raw materials of the flux employed in their manufacture were chosen in order to be able to imitate
cristallo glass.
Some SJT and CPU fragments are also within the cristallo boundaries. It is interesting to note that the
CPU fragment always appears related with SJT and some PMF fragments, not only in terms of flux but
also in terms of silica sources, a fact already highlighted by the PCA analysis. This might indicate that
these objects were produced in the same production centre, or in different production centres using the
same or highly related sources of raw materials.
One group, which includes fragments from SCV, SJT and PMF set, was clearly made using un-purified
ashes and is within or close to vitrum blanchum II boundaries (Šmit et al., 2009).
One SJT sample (SJT0135_body glass) falls close to the border of the European Barilla area. This object
presents a decoration of white strings freely applied around the rim. The available fragments seem to be
consistent with the shape of a tazza but no foot or stem is available, which would allow one to draw
more conclusions.
The presence of strontium in the glass composition can be explained by plant ash flux or limestone. In
figure 4.13, CaO and SrO were plotted and it is observed that the majority of samples have SrO contents
below 400 µg/g. SrO contents above 400 µg/g are characteristic of limestone of shell derivation (Šmit
et al., 2009). When the SrO contents are lower, as is the case in the majority of the analysed glass
fragments, it can be due to the employment in the batch of limestone of terrestrial origin, like calcite, or
of a flux made from purified plant ash (Šmit et al., 2009). From these results it is then possible to propose
that all the raw materials employed as the flux of all the samples with SrO below 400 µg/g, because of
the low SrO contents, were well purified through an identical method of purification (Šmit et al., 2009).
As far as the remaining samples are concerned, it is possible to conclude that the older PMF samples
were made employing a different flux than the more recent ones. However, in figure 4.12, these
fragments also appear within the cristallo boundaries indicating that they also were manufactured using
purified ashes, having SrO content between 100 and 150 µg/g.
De-colouration and glass natural hues in façon-de-Venise objects will be discussed further ahead (section
4.6 Glass colourants and opacifiers).
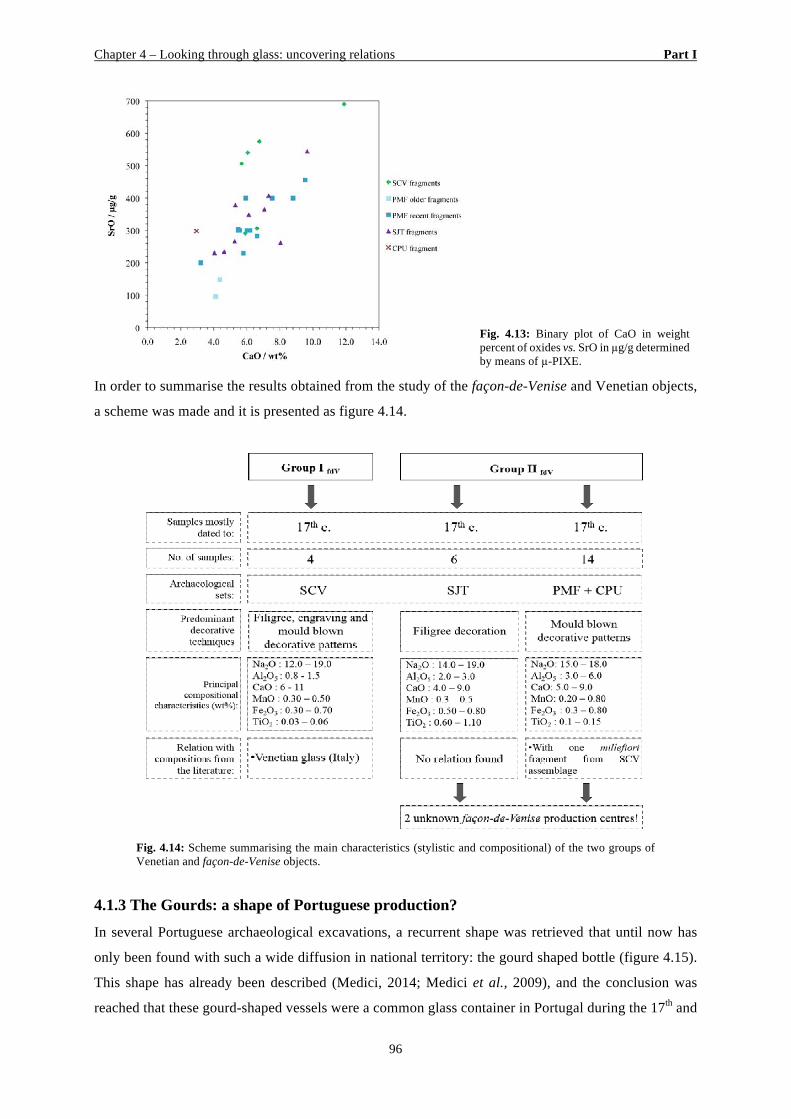
Chapter 4 – Looking through glass: uncovering relations Part I
96
In order to summarise the results obtained from the study of the façon-de-Venise and Venetian objects,
a scheme was made and it is presented as figure 4.14.
Fig. 4.14: Scheme summarising the main characteristics (stylistic and compositional) of the two groups of Venetian and façon-de-Venise objects.
4.1.3 The Gourds: a shape of Portuguese production?
In several Portuguese archaeological excavations, a recurrent shape was retrieved that until now has
only been found with such a wide diffusion in national territory: the gourd shaped bottle (figure 4.15).
This shape has already been described (Medici, 2014; Medici et al., 2009), and the conclusion was
reached that these gourd-shaped vessels were a common glass container in Portugal during the 17th and
Fig. 4.13: Binary plot of CaO in weight percent of oxides vs. SrO in µg/g determined by means of µ-PIXE.
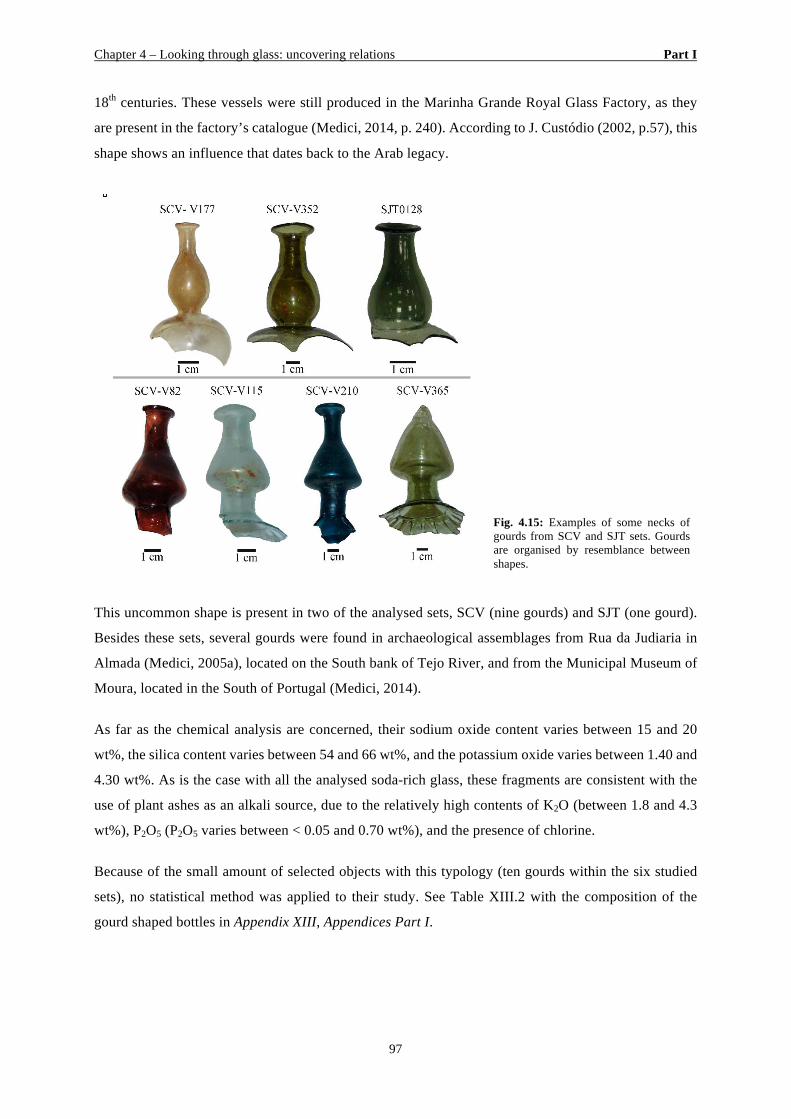
Chapter 4 – Looking through glass: uncovering relations Part I
97
18th centuries. These vessels were still produced in the Marinha Grande Royal Glass Factory, as they
are present in the factory’s catalogue (Medici, 2014, p. 240). According to J. Custódio (2002, p.57), this
shape shows an influence that dates back to the Arab legacy.
Fig. 4.15: Examples of some necks of gourds from SCV and SJT sets. Gourds are organised by resemblance between shapes.
This uncommon shape is present in two of the analysed sets, SCV (nine gourds) and SJT (one gourd).
Besides these sets, several gourds were found in archaeological assemblages from Rua da Judiaria in
Almada (Medici, 2005a), located on the South bank of Tejo River, and from the Municipal Museum of
Moura, located in the South of Portugal (Medici, 2014).
As far as the chemical analysis are concerned, their sodium oxide content varies between 15 and 20
wt%, the silica content varies between 54 and 66 wt%, and the potassium oxide varies between 1.40 and
4.30 wt%. As is the case with all the analysed soda-rich glass, these fragments are consistent with the
use of plant ashes as an alkali source, due to the relatively high contents of K2O (between 1.8 and 4.3
wt%), P2O5 (P2O5 varies between < 0.05 and 0.70 wt%), and the presence of chlorine.
Because of the small amount of selected objects with this typology (ten gourds within the six studied
sets), no statistical method was applied to their study. See Table XIII.2 with the composition of the
gourd shaped bottles in Appendix XIII, Appendices Part I.
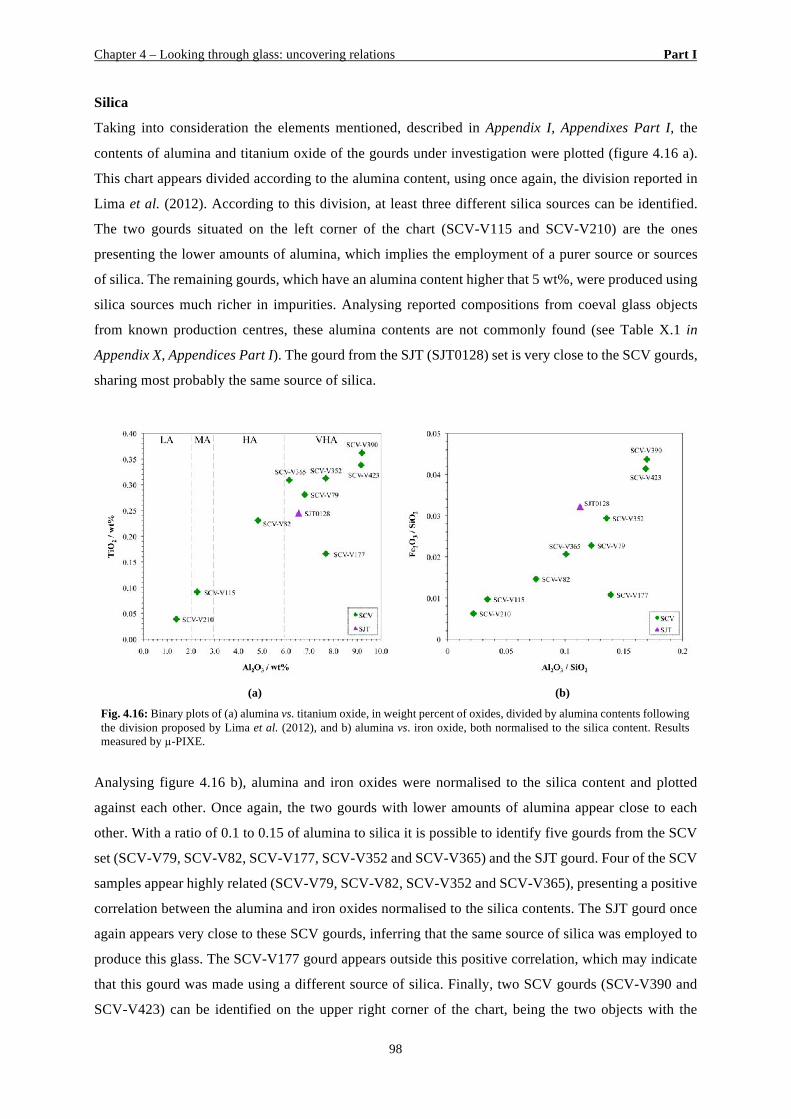
Chapter 4 – Looking through glass: uncovering relations Part I
98
Silica
Taking into consideration the elements mentioned, described in Appendix I, Appendixes Part I, the
contents of alumina and titanium oxide of the gourds under investigation were plotted (figure 4.16 a).
This chart appears divided according to the alumina content, using once again, the division reported in
Lima et al. (2012). According to this division, at least three different silica sources can be identified.
The two gourds situated on the left corner of the chart (SCV-V115 and SCV-V210) are the ones
presenting the lower amounts of alumina, which implies the employment of a purer source or sources
of silica. The remaining gourds, which have an alumina content higher that 5 wt%, were produced using
silica sources much richer in impurities. Analysing reported compositions from coeval glass objects
from known production centres, these alumina contents are not commonly found (see Table X.1 in
Appendix X, Appendices Part I). The gourd from the SJT (SJT0128) set is very close to the SCV gourds,
sharing most probably the same source of silica.
Analysing figure 4.16 b), alumina and iron oxides were normalised to the silica content and plotted
against each other. Once again, the two gourds with lower amounts of alumina appear close to each
other. With a ratio of 0.1 to 0.15 of alumina to silica it is possible to identify five gourds from the SCV
set (SCV-V79, SCV-V82, SCV-V177, SCV-V352 and SCV-V365) and the SJT gourd. Four of the SCV
samples appear highly related (SCV-V79, SCV-V82, SCV-V352 and SCV-V365), presenting a positive
correlation between the alumina and iron oxides normalised to the silica contents. The SJT gourd once
again appears very close to these SCV gourds, inferring that the same source of silica was employed to
produce this glass. The SCV-V177 gourd appears outside this positive correlation, which may indicate
that this gourd was made using a different source of silica. Finally, two SCV gourds (SCV-V390 and
SCV-V423) can be identified on the upper right corner of the chart, being the two objects with the
(a) (b)
Fig. 4.16: Binary plots of (a) alumina vs. titanium oxide, in weight percent of oxides, divided by alumina contents following the division proposed by Lima et al. (2012), and b) alumina vs. iron oxide, both normalised to the silica content. Results measured by µ-PIXE.
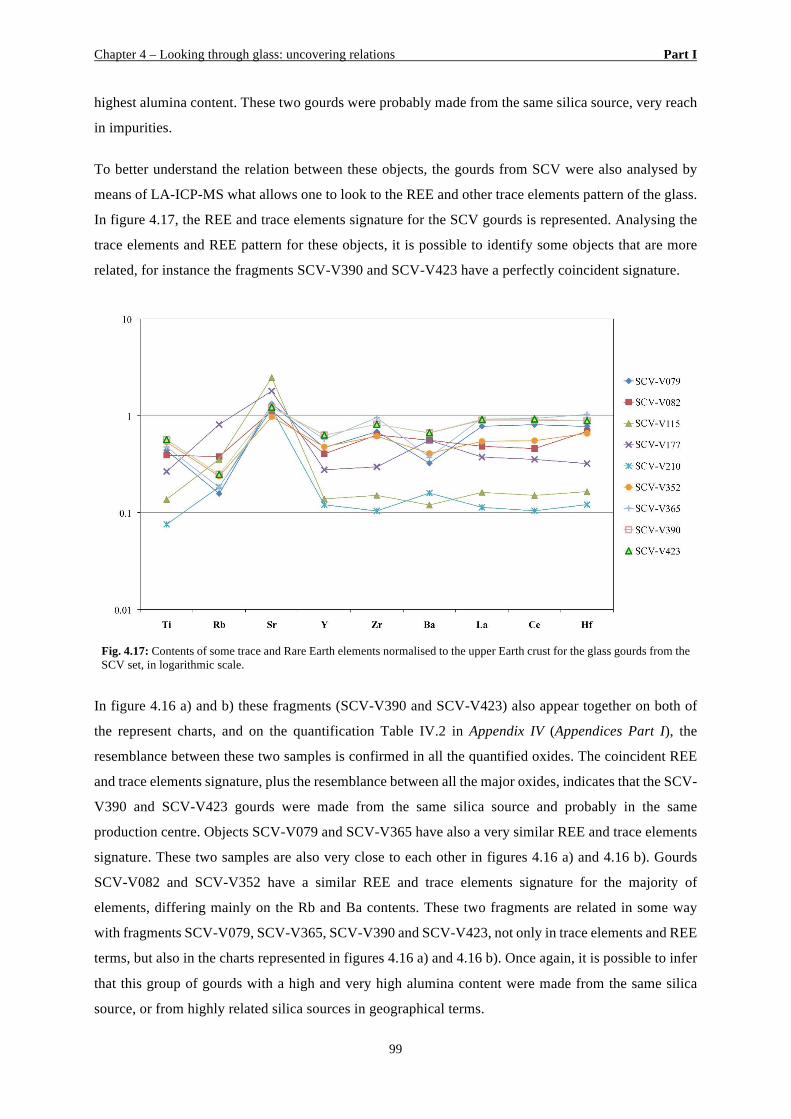
Chapter 4 – Looking through glass: uncovering relations Part I
99
highest alumina content. These two gourds were probably made from the same silica source, very reach
in impurities.
To better understand the relation between these objects, the gourds from SCV were also analysed by
means of LA-ICP-MS what allows one to look to the REE and other trace elements pattern of the glass.
In figure 4.17, the REE and trace elements signature for the SCV gourds is represented. Analysing the
trace elements and REE pattern for these objects, it is possible to identify some objects that are more
related, for instance the fragments SCV-V390 and SCV-V423 have a perfectly coincident signature.
Fig. 4.17: Contents of some trace and Rare Earth elements normalised to the upper Earth crust for the glass gourds from the SCV set, in logarithmic scale.
In figure 4.16 a) and b) these fragments (SCV-V390 and SCV-V423) also appear together on both of
the represent charts, and on the quantification Table IV.2 in Appendix IV (Appendices Part I), the
resemblance between these two samples is confirmed in all the quantified oxides. The coincident REE
and trace elements signature, plus the resemblance between all the major oxides, indicates that the SCV-
V390 and SCV-V423 gourds were made from the same silica source and probably in the same
production centre. Objects SCV-V079 and SCV-V365 have also a very similar REE and trace elements
signature. These two samples are also very close to each other in figures 4.16 a) and 4.16 b). Gourds
SCV-V082 and SCV-V352 have a similar REE and trace elements signature for the majority of
elements, differing mainly on the Rb and Ba contents. These two fragments are related in some way
with fragments SCV-V079, SCV-V365, SCV-V390 and SCV-V423, not only in trace elements and REE
terms, but also in the charts represented in figures 4.16 a) and 4.16 b). Once again, it is possible to infer
that this group of gourds with a high and very high alumina content were made from the same silica
source, or from highly related silica sources in geographical terms.
Chapter 4 – Looking through glass: uncovering relations Part I
100
With regard now to sample SCV-V115, it is the one with the higher Sr value and a depletion in the
remaining reported crust elements, which can be related to the use of a purer silica source containing
Sr-bearing aragonite from seashells (Cagno et al., 2012b). Sample SCV-V210 has a trace elements and
REE signature very close to SCV-V115, with depletion in most of the determined trace elements and
REE, which also indicates the use of a purer silica source, however it does not present such an elevated
Sr value. Both these gourds appear very close in the charts represented in figures 4.16 a) and 4.16 b)
and they present the lower alumina values. As it was mentioned above, fragment SCV-V210 has a
unique composition with the presence of lead and tin oxides. The composition can possibly be attributed
to recycled cullet, without any concern shown for the separating of the coloured from the uncoloured
glass. The object SCV-V177 has a REE and trace pattern that can be compared in terms of shape to the
REE pattern of SCV-V115 and SCV-V210 objects. Fragment SCV-V177 differs from these last two
gourds because of a higher Rb and Ba contents. In fact, fragment SCV-V177 presents the higher Rb
content of all the analysed gourds. The Sr content of this fragment is the second higher, almost
comparable with the Sr content of SCV-V115 object. This can indicate that silica from a different
location was used in the production of SCV-V177 gourd. This object is the one that in both figures 4.16
a) and 4.16 b) is always apart from the rest of the samples, which might indicate that this object has a
different provenance than the rest of the analysed gourds.
Flux agents and other glass components
Verifying the MgO levels, for most of the gourds the values are above 2 wt%, which once again indicates
that ashes from halophytic plants were employed in the glass batch (Šmit et al., 2009).
Analysing the relation between potassium and calcium oxides (figure 4.18), it is observed that, with the
exception of SCV-V177, the remaining objects are closely related, which might suggest that even the
glass with lower alumina contents can be related to the other objects. These two oxides come from the
plant ashes rich in alkalis employed on the batch. In the specific case of these analysed gourds, it seems
that the plant ashes used in their batches were collected from the same region, justifying the similarity
in CaO and K2O contents (figure 4.18).
The SJT gourd appears related with the SCV gourds with high and very high alumina content, suggesting
once again that these gourds share the same raw materials and possibly the same provenance.
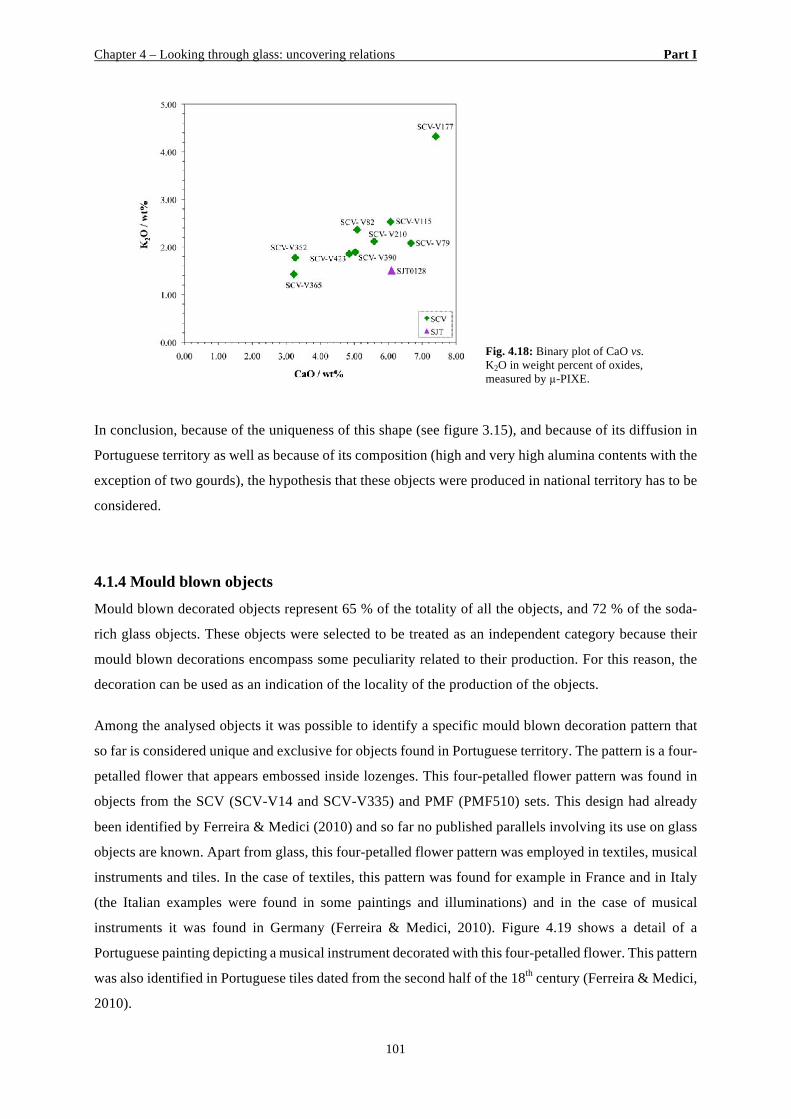
Chapter 4 – Looking through glass: uncovering relations Part I
101
Fig. 4.18: Binary plot of CaO vs. K2O in weight percent of oxides, measured by µ-PIXE.
In conclusion, because of the uniqueness of this shape (see figure 3.15), and because of its diffusion in
Portuguese territory as well as because of its composition (high and very high alumina contents with the
exception of two gourds), the hypothesis that these objects were produced in national territory has to be
considered.
4.1.4 Mould blown objects
Mould blown decorated objects represent 65 % of the totality of all the objects, and 72 % of the soda-
rich glass objects. These objects were selected to be treated as an independent category because their
mould blown decorations encompass some peculiarity related to their production. For this reason, the
decoration can be used as an indication of the locality of the production of the objects.
Among the analysed objects it was possible to identify a specific mould blown decoration pattern that
so far is considered unique and exclusive for objects found in Portuguese territory. The pattern is a four-
petalled flower that appears embossed inside lozenges. This four-petalled flower pattern was found in
objects from the SCV (SCV-V14 and SCV-V335) and PMF (PMF510) sets. This design had already
been identified by Ferreira & Medici (2010) and so far no published parallels involving its use on glass
objects are known. Apart from glass, this four-petalled flower pattern was employed in textiles, musical
instruments and tiles. In the case of textiles, this pattern was found for example in France and in Italy
(the Italian examples were found in some paintings and illuminations) and in the case of musical
instruments it was found in Germany (Ferreira & Medici, 2010). Figure 4.19 shows a detail of a
Portuguese painting depicting a musical instrument decorated with this four-petalled flower. This pattern
was also identified in Portuguese tiles dated from the second half of the 18th century (Ferreira & Medici,
2010).
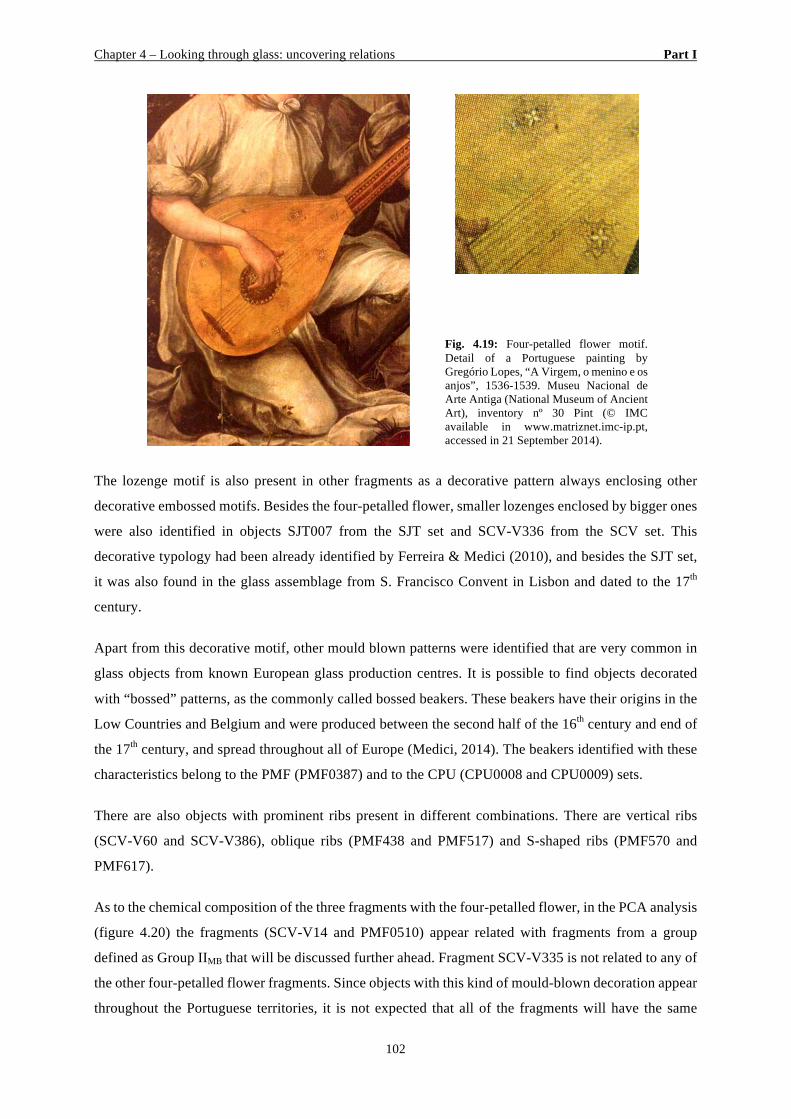
Chapter 4 – Looking through glass: uncovering relations Part I
102
Fig. 4.19: Four-petalled flower motif. Detail of a Portuguese painting by Gregório Lopes, “A Virgem, o menino e os anjos”, 1536-1539. Museu Nacional de Arte Antiga (National Museum of Ancient Art), inventory nº 30 Pint (© IMC available in www.matriznet.imc-ip.pt, accessed in 21 September 2014).
The lozenge motif is also present in other fragments as a decorative pattern always enclosing other
decorative embossed motifs. Besides the four-petalled flower, smaller lozenges enclosed by bigger ones
were also identified in objects SJT007 from the SJT set and SCV-V336 from the SCV set. This
decorative typology had been already identified by Ferreira & Medici (2010), and besides the SJT set,
it was also found in the glass assemblage from S. Francisco Convent in Lisbon and dated to the 17th
century.
Apart from this decorative motif, other mould blown patterns were identified that are very common in
glass objects from known European glass production centres. It is possible to find objects decorated
with “bossed” patterns, as the commonly called bossed beakers. These beakers have their origins in the
Low Countries and Belgium and were produced between the second half of the 16th century and end of
the 17th century, and spread throughout all of Europe (Medici, 2014). The beakers identified with these
characteristics belong to the PMF (PMF0387) and to the CPU (CPU0008 and CPU0009) sets.
There are also objects with prominent ribs present in different combinations. There are vertical ribs
(SCV-V60 and SCV-V386), oblique ribs (PMF438 and PMF517) and S-shaped ribs (PMF570 and
PMF617).
As to the chemical composition of the three fragments with the four-petalled flower, in the PCA analysis
(figure 4.20) the fragments (SCV-V14 and PMF0510) appear related with fragments from a group
defined as Group IIMB that will be discussed further ahead. Fragment SCV-V335 is not related to any of
the other four-petalled flower fragments. Since objects with this kind of mould-blown decoration appear
throughout the Portuguese territories, it is not expected that all of the fragments will have the same
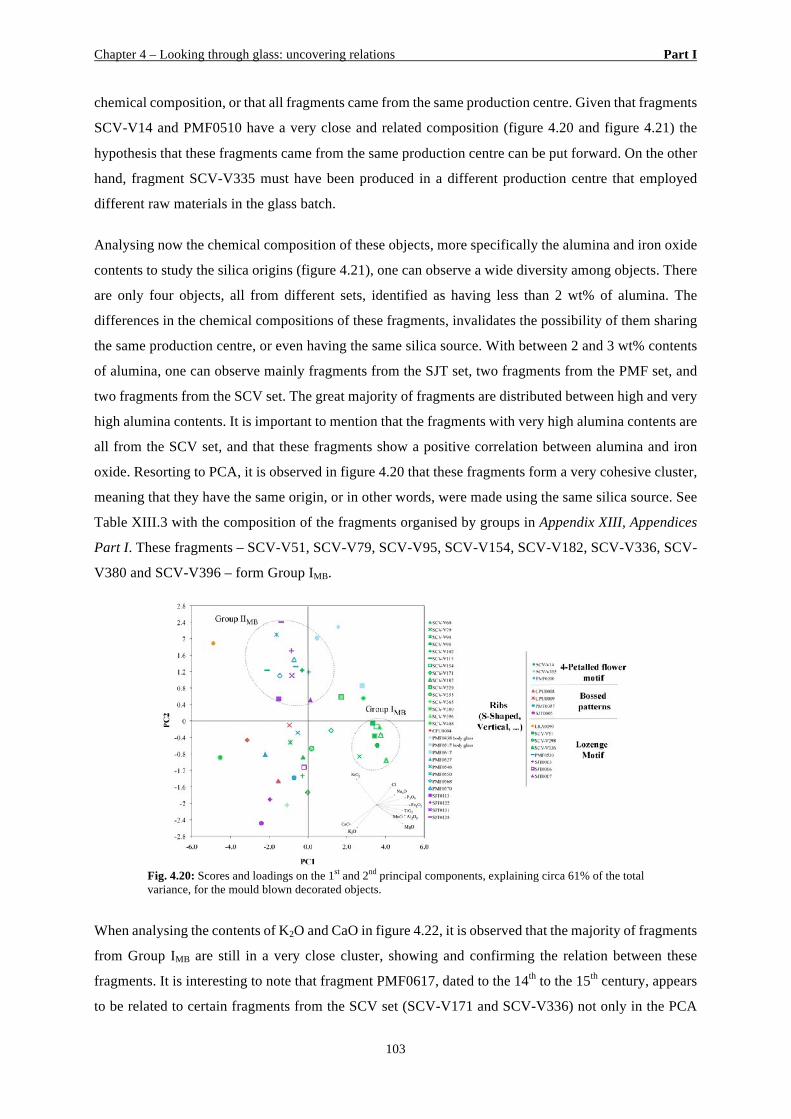
Chapter 4 – Looking through glass: uncovering relations Part I
103
chemical composition, or that all fragments came from the same production centre. Given that fragments
SCV-V14 and PMF0510 have a very close and related composition (figure 4.20 and figure 4.21) the
hypothesis that these fragments came from the same production centre can be put forward. On the other
hand, fragment SCV-V335 must have been produced in a different production centre that employed
different raw materials in the glass batch.
Analysing now the chemical composition of these objects, more specifically the alumina and iron oxide
contents to study the silica origins (figure 4.21), one can observe a wide diversity among objects. There
are only four objects, all from different sets, identified as having less than 2 wt% of alumina. The
differences in the chemical compositions of these fragments, invalidates the possibility of them sharing
the same production centre, or even having the same silica source. With between 2 and 3 wt% contents
of alumina, one can observe mainly fragments from the SJT set, two fragments from the PMF set, and
two fragments from the SCV set. The great majority of fragments are distributed between high and very
high alumina contents. It is important to mention that the fragments with very high alumina contents are
all from the SCV set, and that these fragments show a positive correlation between alumina and iron
oxide. Resorting to PCA, it is observed in figure 4.20 that these fragments form a very cohesive cluster,
meaning that they have the same origin, or in other words, were made using the same silica source. See
Table XIII.3 with the composition of the fragments organised by groups in Appendix XIII, Appendices
Part I. These fragments – SCV-V51, SCV-V79, SCV-V95, SCV-V154, SCV-V182, SCV-V336, SCV-
V380 and SCV-V396 – form Group IMB.
Fig. 4.20: Scores and loadings on the 1st and 2nd principal components, explaining circa 61% of the total variance, for the mould blown decorated objects.
When analysing the contents of K2O and CaO in figure 4.22, it is observed that the majority of fragments
from Group IMB are still in a very close cluster, showing and confirming the relation between these
fragments. It is interesting to note that fragment PMF0617, dated to the 14th to the 15th century, appears
to be related to certain fragments from the SCV set (SCV-V171 and SCV-V336) not only in the PCA
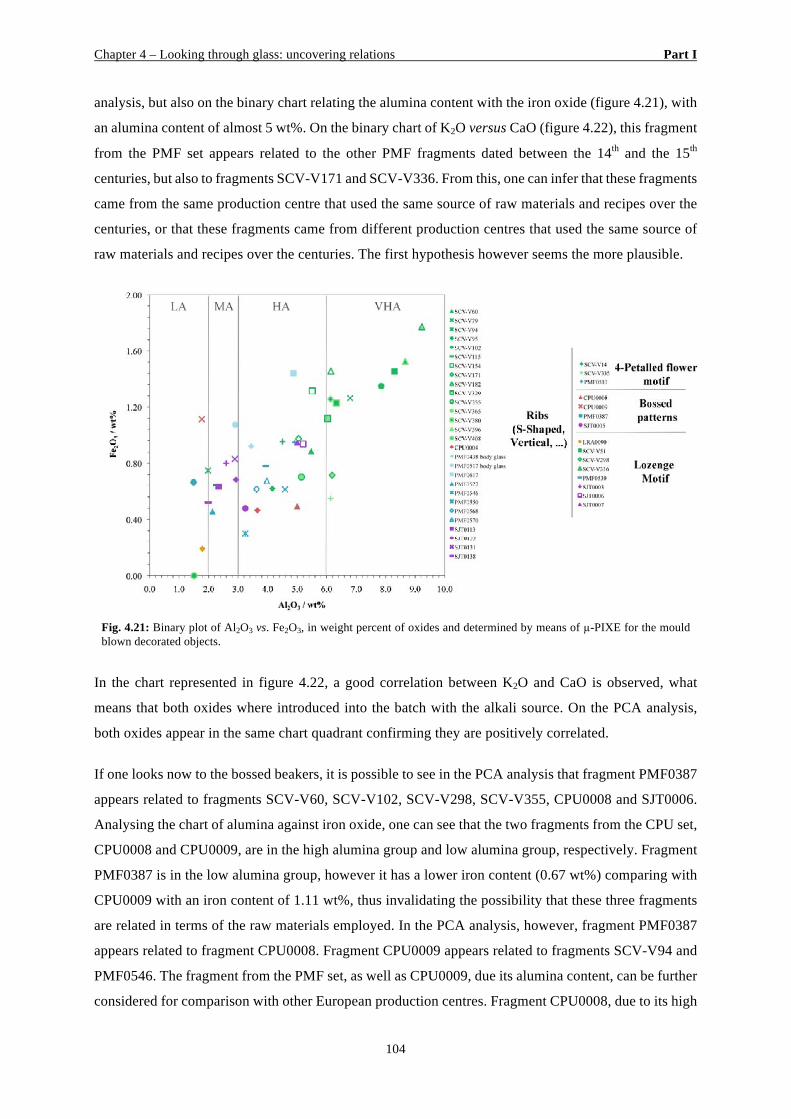
Chapter 4 – Looking through glass: uncovering relations Part I
104
analysis, but also on the binary chart relating the alumina content with the iron oxide (figure 4.21), with
an alumina content of almost 5 wt%. On the binary chart of K2O versus CaO (figure 4.22), this fragment
from the PMF set appears related to the other PMF fragments dated between the 14th and the 15th
centuries, but also to fragments SCV-V171 and SCV-V336. From this, one can infer that these fragments
came from the same production centre that used the same source of raw materials and recipes over the
centuries, or that these fragments came from different production centres that used the same source of
raw materials and recipes over the centuries. The first hypothesis however seems the more plausible.
Fig. 4.21: Binary plot of Al2O3 vs. Fe2O3, in weight percent of oxides and determined by means of µ-PIXE for the mould blown decorated objects.
In the chart represented in figure 4.22, a good correlation between K2O and CaO is observed, what
means that both oxides where introduced into the batch with the alkali source. On the PCA analysis,
both oxides appear in the same chart quadrant confirming they are positively correlated.
If one looks now to the bossed beakers, it is possible to see in the PCA analysis that fragment PMF0387
appears related to fragments SCV-V60, SCV-V102, SCV-V298, SCV-V355, CPU0008 and SJT0006.
Analysing the chart of alumina against iron oxide, one can see that the two fragments from the CPU set,
CPU0008 and CPU0009, are in the high alumina group and low alumina group, respectively. Fragment
PMF0387 is in the low alumina group, however it has a lower iron content (0.67 wt%) comparing with
CPU0009 with an iron content of 1.11 wt%, thus invalidating the possibility that these three fragments
are related in terms of the raw materials employed. In the PCA analysis, however, fragment PMF0387
appears related to fragment CPU0008. Fragment CPU0009 appears related to fragments SCV-V94 and
PMF0546. The fragment from the PMF set, as well as CPU0009, due its alumina content, can be further
considered for comparison with other European production centres. Fragment CPU0008, due to its high
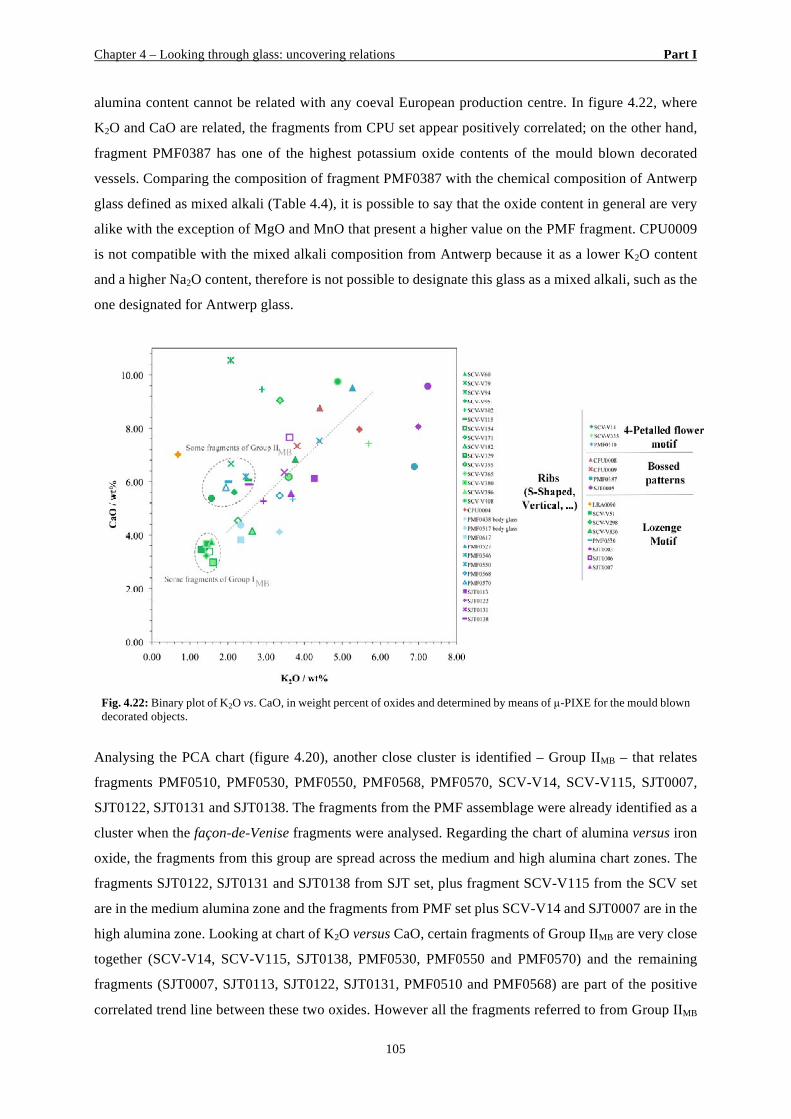
Chapter 4 – Looking through glass: uncovering relations Part I
105
alumina content cannot be related with any coeval European production centre. In figure 4.22, where
K2O and CaO are related, the fragments from CPU set appear positively correlated; on the other hand,
fragment PMF0387 has one of the highest potassium oxide contents of the mould blown decorated
vessels. Comparing the composition of fragment PMF0387 with the chemical composition of Antwerp
glass defined as mixed alkali (Table 4.4), it is possible to say that the oxide content in general are very
alike with the exception of MgO and MnO that present a higher value on the PMF fragment. CPU0009
is not compatible with the mixed alkali composition from Antwerp because it as a lower K2O content
and a higher Na2O content, therefore is not possible to designate this glass as a mixed alkali, such as the
one designated for Antwerp glass.
Fig. 4.22: Binary plot of K2O vs. CaO, in weight percent of oxides and determined by means of µ-PIXE for the mould blown decorated objects.
Analysing the PCA chart (figure 4.20), another close cluster is identified – Group IIMB – that relates
fragments PMF0510, PMF0530, PMF0550, PMF0568, PMF0570, SCV-V14, SCV-V115, SJT0007,
SJT0122, SJT0131 and SJT0138. The fragments from the PMF assemblage were already identified as a
cluster when the façon-de-Venise fragments were analysed. Regarding the chart of alumina versus iron
oxide, the fragments from this group are spread across the medium and high alumina chart zones. The
fragments SJT0122, SJT0131 and SJT0138 from SJT set, plus fragment SCV-V115 from the SCV set
are in the medium alumina zone and the fragments from PMF set plus SCV-V14 and SJT0007 are in the
high alumina zone. Looking at chart of K2O versus CaO, certain fragments of Group IIMB are very close
together (SCV-V14, SCV-V115, SJT0138, PMF0530, PMF0550 and PMF0570) and the remaining
fragments (SJT0007, SJT0113, SJT0122, SJT0131, PMF0510 and PMF0568) are part of the positive
correlated trend line between these two oxides. However all the fragments referred to from Group IIMB
Chapter 4 – Looking through glass: uncovering relations Part I
106
are very close to each other. It is important to point out again that the PMF fragments mentioned in this
section have already been dealt with, and their composition discussed in the façon-de-Venise section. It
was concluded back then, that these fragments could be of local provenance and from a new façon-de-
Venise production centre. The fact that other fragments with mould blown decorations from several
assemblages relate in terms of composition with these façon-de-Venise fragments, emphasises the
hypothesis of a new façon-de-Venise production centre, and raises the possibility that this centre did not
only produce façon-de-Venise objects, but also other varieties of glass objects such as mould blown
ones, differently coloured.
Analysing fragments PMF0438 and PMF0517 (both dated between 14th and 15th centuries), the PCA
chart shows them to be related. The chemical composition of these fragments was discussed in the façon
de Venise section; as it was stated in this chapter, due to the different dating of these fragments, is was
expected that their chemical composition would be different. However, in the case of fragment
PMF0617, also dated to between the 14th and 15th centuries, it does not relate to the other coeval
fragments in the PCA analysis, showing a closer relation with fragments SCV-V365 and SCV-V329
from the SCV set. Looking at the chemical composition of these three fragments, it is observed that all
the oxides, major and minor, have very close values, which means that these objects were made from
geographically related raw materials.
Continuing the analysis of the PCA chart, another small group is identified, in which the fragments
CPU0009, SCV-V94 and PMF0546 are related. Observing their chemical composition, in terms of
alumina and iron oxide contents (figure 4.21), only two fragments can be related, CPU0009 and SCV-
V94. Fragment PMF0546 is in the high alumina content zone. From this information one can conclude
that these fragments cannot be related in terms of their silica source, however, when the MgO, K2O,
CaO, P2O5 and chlorine contents are compared, it becomes clear that these fragments are closely related
in terms of the alkaline source employed to produce the glass. In other words, the plant ashes employed
in the batch of these three glass fragments are closely related in geographical terms.
Regarding fragment SCV-V408, this is another example that does not relate with any of the other
fragments. The chemical composition of this fragment has already been discussed in the façon-de-Venise
section.
Dealing now with fragment LRA0090, it does not relate to any of the other fragments from any of the
assemblages. This fragment dated from the 17th century, has a very low contents of manganese and
potassium oxides, which makes it difficult to relate them to the use of plant ashes as an alkali source.
Because of its dating, one cannot consider the possibility that this fragment was made using the Leblanc
process, which was only created at the end of the 18th century by Nicholas Leblanc. This process
consisted in the production of industrial soda using marine salt (Navarro, 2003, p.43). For this reason,
Chapter 4 – Looking through glass: uncovering relations Part I
107
the hypothesis is raised that this fragment was made using highly purified plant ashes, resulting in the
reduced amounts of manganese and potassium oxides. The other hypothesis that one has to consider is
that due to the complex archaeological stratigraphy of the site where this fragment was recovered, an
erroneous dating of the fragment was made, and in that case the Leblanc process can be proposed. In
terms of shape, due to the small size of the fragment it is not possible to draw other conclusions;
however, the lip of the neck of the flak suggests the kind used in wine bottles from the end of the 18th
century/ beginning of the 19th century. This lip seems a continuation of the neck but thicker, with no
string applied (see picture in Catalogue II, Appendix III, Appendices Part I).
The last group of fragments suggested in the PCA analysis, relates fragments from four of the
assemblages referred to above in the section of the mould blown decorated objects. In this group the
following fragments are associated: SCV-V60, SCV-V102, SCV-V298, SCV-V335 and SCV-V355
from the SCV set, SJT0003, SJT0005 and SJT0006 from the SJT set, PMF0387 from the PMF set and
CPU0008 from the CPU set. When analysing the binary charts, it does not seem that these fragments
are closely related among themselves. In terms of alumina versus iron oxide, if one excludes fragments
PMF0387 and CPU0008, both belonging to beakers with bossed decoration that have low alumina
content, the remaining fragments referred to above have high and very high alumina contents. These
bossed decorated beakers can be distinguished in the Al2O3 against Fe2O3 chart by their iron oxide
contents, since the fragment PMF0387 has a content of about 0.60 wt% of this oxide, and fragment
CPU0008 has a content of about 1.10 wt% of the same oxide. Observing the relation of these fragments
in the binary chart of K2O versus CaO, the two bossed beakers are not related, in that they have a
different ratio between these two oxides. PMF0387 has almost the same content of both oxides (around
6.50 wt%) and fragment CPU0008 has half the content of K2O (around 4 wt%) relative to the CaO
(around 8 wt%). The other fragments, in relation to the K2O versus CaO chart, show some positive
correlation. In the case of fragments SCV-V60, SCV-V335, SCV-V355, SJT0006 and CPU0008, these
are closer to the trend line marked in figure 4.21. In relation to the other fragments, one can say that
these are also part of the trend line with the apparent exception of fragments SJT0003, SJT0005 and
PMF0387 that are completely apart from this positive correlation. Finally, it was decided not to consider
these fragments a cohesive group since no consistent relation was found between their compositions.
In conclusion, in reference to the mould blown decorated objects, once again the glass objects with high
and very high alumina levels are the ones that can be considered to be locally made. In other words, the
glass objects that because of the composition of their raw materials do not find parallels in any other
production centre found in the literature could therefore considered to be of possible Portuguese
production. In terms of the types of motifs decorating the objects, it is possible to find some relations
between the objects with ribs. It was also evident that among all the objects with mould blown
decorations, the patterns with ribs (vertical ribs, S-shaped ribs, and so on) are by far the most common.
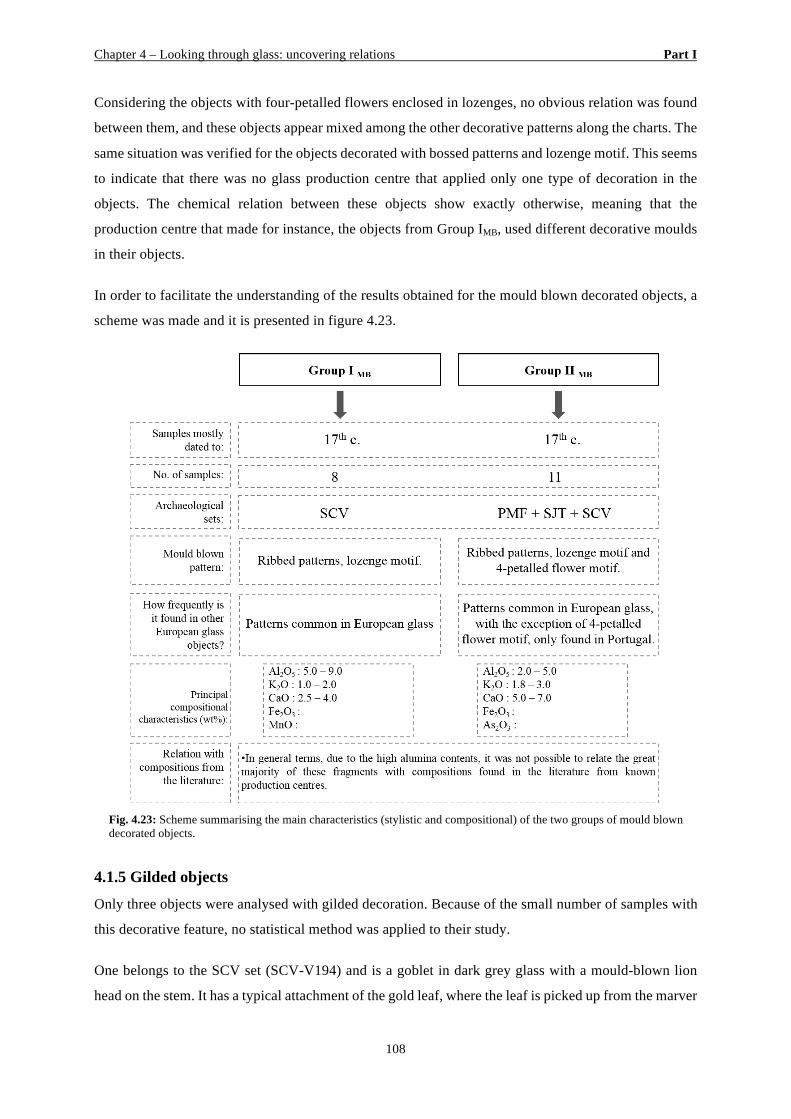
Chapter 4 – Looking through glass: uncovering relations Part I
108
Considering the objects with four-petalled flowers enclosed in lozenges, no obvious relation was found
between them, and these objects appear mixed among the other decorative patterns along the charts. The
same situation was verified for the objects decorated with bossed patterns and lozenge motif. This seems
to indicate that there was no glass production centre that applied only one type of decoration in the
objects. The chemical relation between these objects show exactly otherwise, meaning that the
production centre that made for instance, the objects from Group IMB, used different decorative moulds
in their objects.
In order to facilitate the understanding of the results obtained for the mould blown decorated objects, a
scheme was made and it is presented in figure 4.23.
Fig. 4.23: Scheme summarising the main characteristics (stylistic and compositional) of the two groups of mould blown decorated objects.
4.1.5 Gilded objects
Only three objects were analysed with gilded decoration. Because of the small number of samples with
this decorative feature, no statistical method was applied to their study.
One belongs to the SCV set (SCV-V194) and is a goblet in dark grey glass with a mould-blown lion
head on the stem. It has a typical attachment of the gold leaf, where the leaf is picked up from the marver
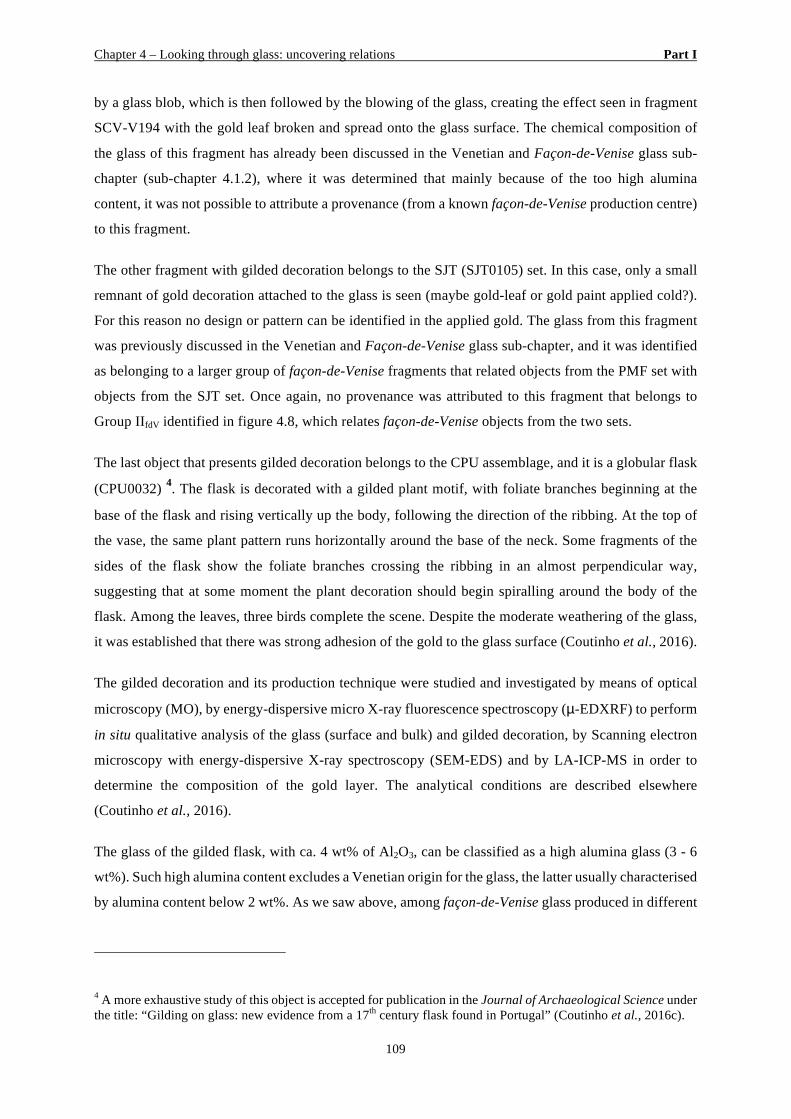
Chapter 4 – Looking through glass: uncovering relations Part I
109
by a glass blob, which is then followed by the blowing of the glass, creating the effect seen in fragment
SCV-V194 with the gold leaf broken and spread onto the glass surface. The chemical composition of
the glass of this fragment has already been discussed in the Venetian and Façon-de-Venise glass sub-
chapter (sub-chapter 4.1.2), where it was determined that mainly because of the too high alumina
content, it was not possible to attribute a provenance (from a known façon-de-Venise production centre)
to this fragment.
The other fragment with gilded decoration belongs to the SJT (SJT0105) set. In this case, only a small
remnant of gold decoration attached to the glass is seen (maybe gold-leaf or gold paint applied cold?).
For this reason no design or pattern can be identified in the applied gold. The glass from this fragment
was previously discussed in the Venetian and Façon-de-Venise glass sub-chapter, and it was identified
as belonging to a larger group of façon-de-Venise fragments that related objects from the PMF set with
objects from the SJT set. Once again, no provenance was attributed to this fragment that belongs to
Group IIfdV identified in figure 4.8, which relates façon-de-Venise objects from the two sets.
The last object that presents gilded decoration belongs to the CPU assemblage, and it is a globular flask
(CPU0032) 4. The flask is decorated with a gilded plant motif, with foliate branches beginning at the
base of the flask and rising vertically up the body, following the direction of the ribbing. At the top of
the vase, the same plant pattern runs horizontally around the base of the neck. Some fragments of the
sides of the flask show the foliate branches crossing the ribbing in an almost perpendicular way,
suggesting that at some moment the plant decoration should begin spiralling around the body of the
flask. Among the leaves, three birds complete the scene. Despite the moderate weathering of the glass,
it was established that there was strong adhesion of the gold to the glass surface (Coutinho et al., 2016).
The gilded decoration and its production technique were studied and investigated by means of optical
microscopy (MO), by energy-dispersive micro X-ray fluorescence spectroscopy (µ-EDXRF) to perform
in situ qualitative analysis of the glass (surface and bulk) and gilded decoration, by Scanning electron
microscopy with energy-dispersive X-ray spectroscopy (SEM-EDS) and by LA-ICP-MS in order to
determine the composition of the gold layer. The analytical conditions are described elsewhere
(Coutinho et al., 2016).
The glass of the gilded flask, with ca. 4 wt% of Al2O3, can be classified as a high alumina glass (3 - 6
wt%). Such high alumina content excludes a Venetian origin for the glass, the latter usually characterised
by alumina content below 2 wt%. As we saw above, among façon-de-Venise glass produced in different
4 A more exhaustive study of this object is accepted for publication in the Journal of Archaeological Science under the title: “Gilding on glass: new evidence from a 17th century flask found in Portugal” (Coutinho et al., 2016c).
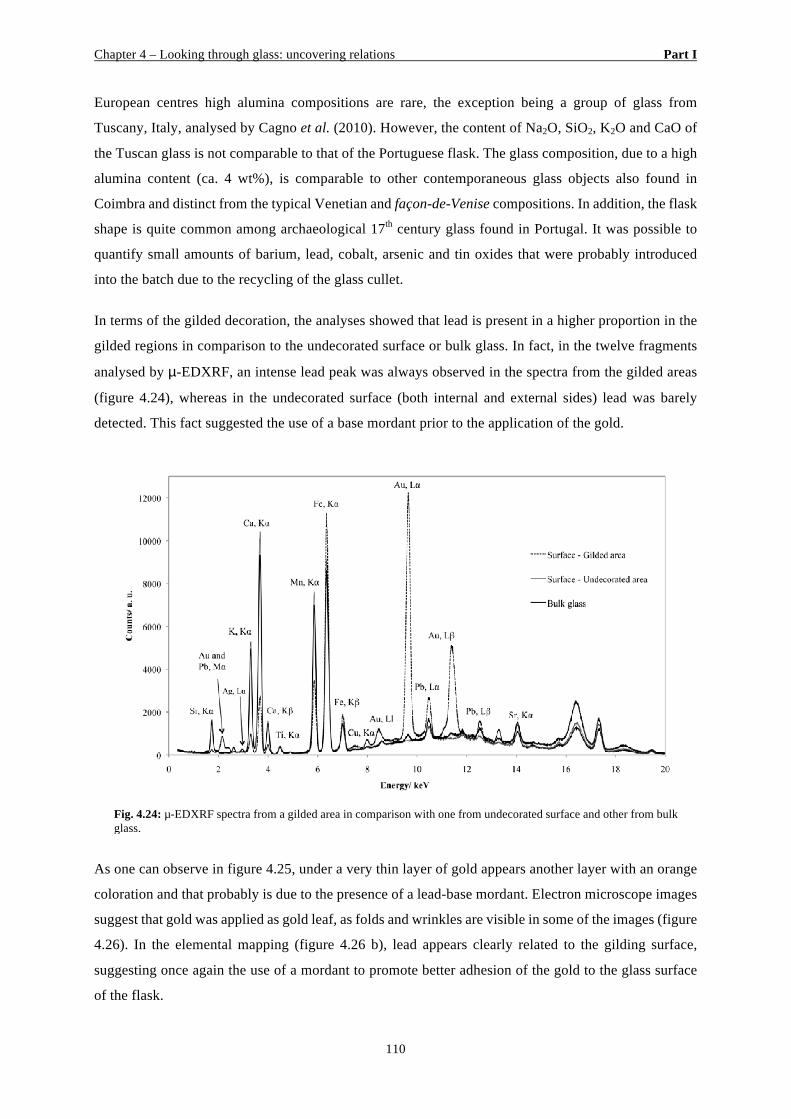
Chapter 4 – Looking through glass: uncovering relations Part I
110
European centres high alumina compositions are rare, the exception being a group of glass from
Tuscany, Italy, analysed by Cagno et al. (2010). However, the content of Na2O, SiO2, K2O and CaO of
the Tuscan glass is not comparable to that of the Portuguese flask. The glass composition, due to a high
alumina content (ca. 4 wt%), is comparable to other contemporaneous glass objects also found in
Coimbra and distinct from the typical Venetian and façon-de-Venise compositions. In addition, the flask
shape is quite common among archaeological 17th century glass found in Portugal. It was possible to
quantify small amounts of barium, lead, cobalt, arsenic and tin oxides that were probably introduced
into the batch due to the recycling of the glass cullet.
In terms of the gilded decoration, the analyses showed that lead is present in a higher proportion in the
gilded regions in comparison to the undecorated surface or bulk glass. In fact, in the twelve fragments
analysed by µ-EDXRF, an intense lead peak was always observed in the spectra from the gilded areas
(figure 4.24), whereas in the undecorated surface (both internal and external sides) lead was barely
detected. This fact suggested the use of a base mordant prior to the application of the gold.
Fig. 4.24: µ-EDXRF spectra from a gilded area in comparison with one from undecorated surface and other from bulk glass.
As one can observe in figure 4.25, under a very thin layer of gold appears another layer with an orange
coloration and that probably is due to the presence of a lead-base mordant. Electron microscope images
suggest that gold was applied as gold leaf, as folds and wrinkles are visible in some of the images (figure
4.26). In the elemental mapping (figure 4.26 b), lead appears clearly related to the gilding surface,
suggesting once again the use of a mordant to promote better adhesion of the gold to the glass surface
of the flask.
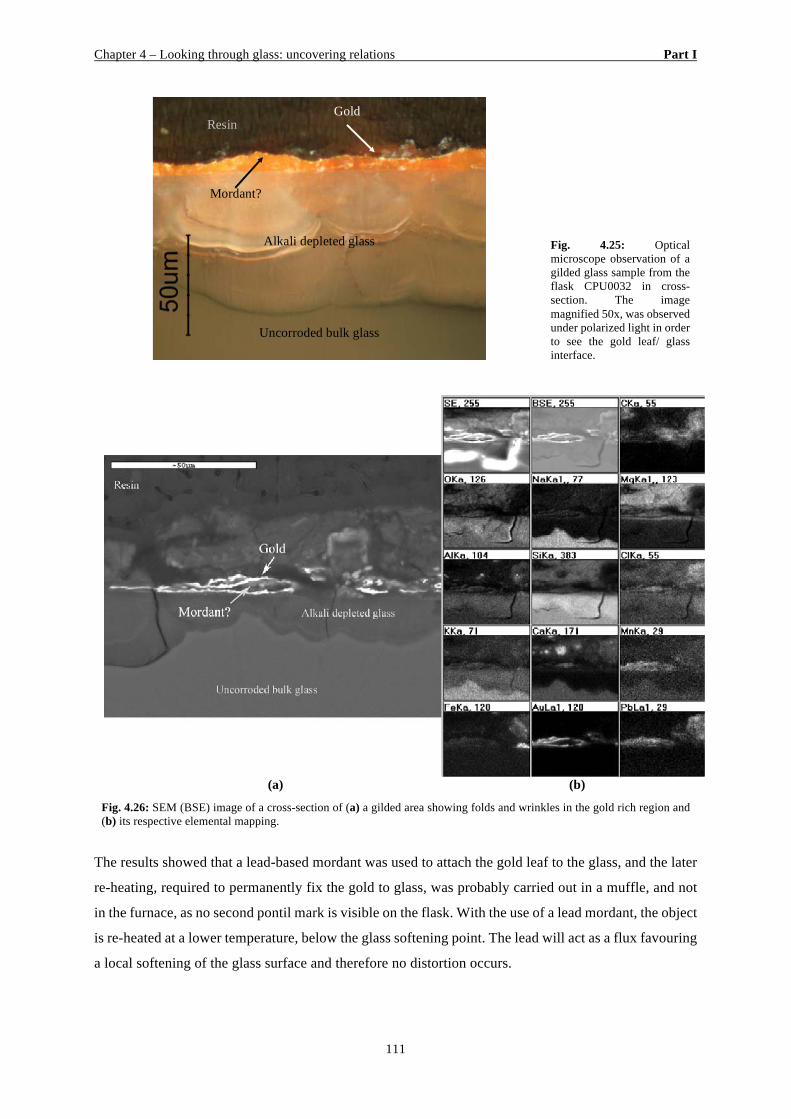
Chapter 4 – Looking through glass: uncovering relations Part I
111
Fig. 4.25: Optical microscope observation of a gilded glass sample from the flask CPU0032 in cross-section. The image magnified 50x, was observed under polarized light in order to see the gold leaf/ glass interface.
(a) (b)
Fig. 4.26: SEM (BSE) image of a cross-section of (a) a gilded area showing folds and wrinkles in the gold rich region and (b) its respective elemental mapping.
The results showed that a lead-based mordant was used to attach the gold leaf to the glass, and the later
re-heating, required to permanently fix the gold to glass, was probably carried out in a muffle, and not
in the furnace, as no second pontil mark is visible on the flask. With the use of a lead mordant, the object
is re-heated at a lower temperature, below the glass softening point. The lead will act as a flux favouring
a local softening of the glass surface and therefore no distortion occurs.
Resin Gold
Alkali depleted glass
Uncorroded bulk glass
Mordant?
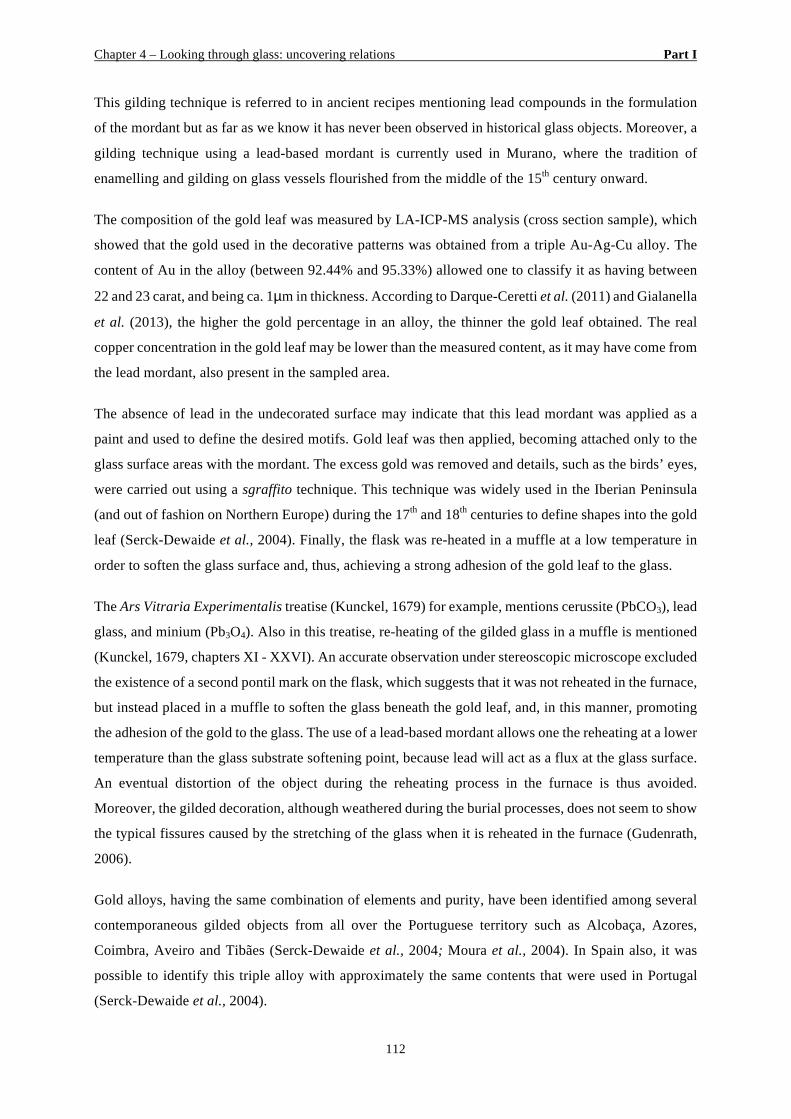
Chapter 4 – Looking through glass: uncovering relations Part I
112
This gilding technique is referred to in ancient recipes mentioning lead compounds in the formulation
of the mordant but as far as we know it has never been observed in historical glass objects. Moreover, a
gilding technique using a lead-based mordant is currently used in Murano, where the tradition of
enamelling and gilding on glass vessels flourished from the middle of the 15th century onward.
The composition of the gold leaf was measured by LA-ICP-MS analysis (cross section sample), which
showed that the gold used in the decorative patterns was obtained from a triple Au-Ag-Cu alloy. The
content of Au in the alloy (between 92.44% and 95.33%) allowed one to classify it as having between
22 and 23 carat, and being ca. 1µm in thickness. According to Darque-Ceretti et al. (2011) and Gialanella
et al. (2013), the higher the gold percentage in an alloy, the thinner the gold leaf obtained. The real
copper concentration in the gold leaf may be lower than the measured content, as it may have come from
the lead mordant, also present in the sampled area.
The absence of lead in the undecorated surface may indicate that this lead mordant was applied as a
paint and used to define the desired motifs. Gold leaf was then applied, becoming attached only to the
glass surface areas with the mordant. The excess gold was removed and details, such as the birds’ eyes,
were carried out using a sgraffito technique. This technique was widely used in the Iberian Peninsula
(and out of fashion on Northern Europe) during the 17th and 18th centuries to define shapes into the gold
leaf (Serck-Dewaide et al., 2004). Finally, the flask was re-heated in a muffle at a low temperature in
order to soften the glass surface and, thus, achieving a strong adhesion of the gold leaf to the glass.
The Ars Vitraria Experimentalis treatise (Kunckel, 1679) for example, mentions cerussite (PbCO3), lead
glass, and minium (Pb3O4). Also in this treatise, re-heating of the gilded glass in a muffle is mentioned
(Kunckel, 1679, chapters XI - XXVI). An accurate observation under stereoscopic microscope excluded
the existence of a second pontil mark on the flask, which suggests that it was not reheated in the furnace,
but instead placed in a muffle to soften the glass beneath the gold leaf, and, in this manner, promoting
the adhesion of the gold to the glass. The use of a lead-based mordant allows one the reheating at a lower
temperature than the glass substrate softening point, because lead will act as a flux at the glass surface.
An eventual distortion of the object during the reheating process in the furnace is thus avoided.
Moreover, the gilded decoration, although weathered during the burial processes, does not seem to show
the typical fissures caused by the stretching of the glass when it is reheated in the furnace (Gudenrath,
2006).
Gold alloys, having the same combination of elements and purity, have been identified among several
contemporaneous gilded objects from all over the Portuguese territory such as Alcobaça, Azores,
Coimbra, Aveiro and Tibães (Serck-Dewaide et al., 2004; Moura et al., 2004). In Spain also, it was
possible to identify this triple alloy with approximately the same contents that were used in Portugal
(Serck-Dewaide et al., 2004).
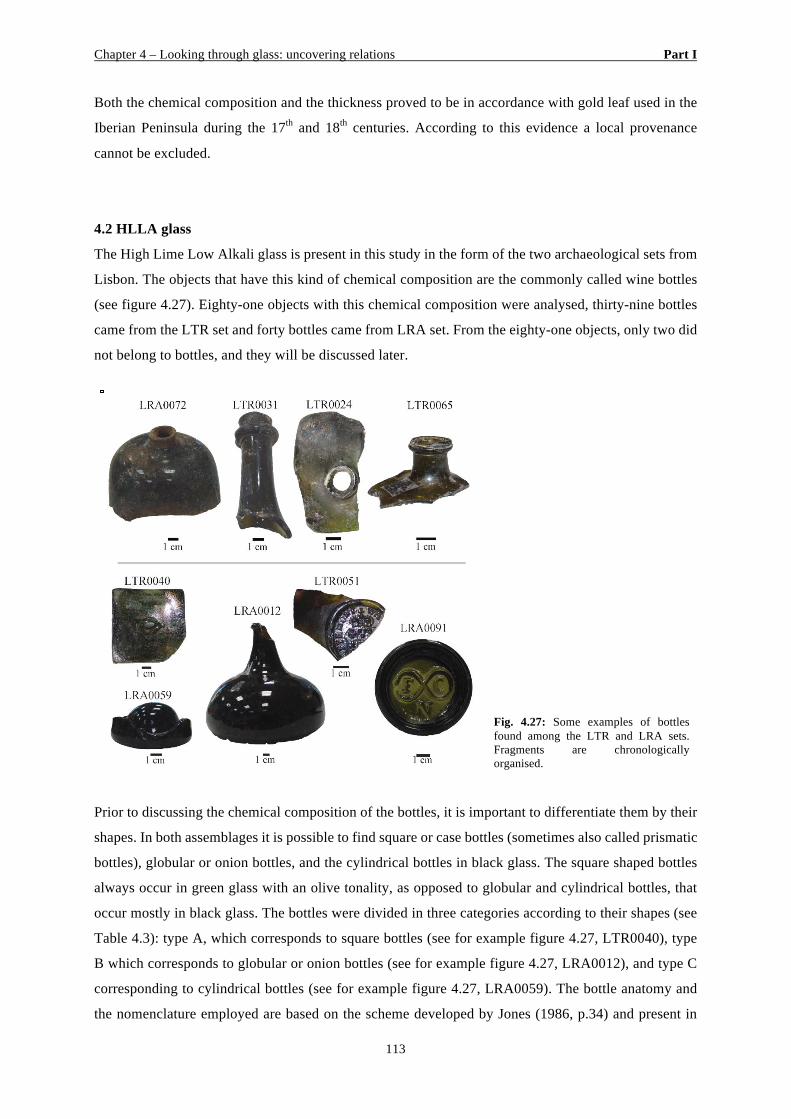
Chapter 4 – Looking through glass: uncovering relations Part I
113
Both the chemical composition and the thickness proved to be in accordance with gold leaf used in the
Iberian Peninsula during the 17th and 18th centuries. According to this evidence a local provenance
cannot be excluded.
4.2 HLLA glass
The High Lime Low Alkali glass is present in this study in the form of the two archaeological sets from
Lisbon. The objects that have this kind of chemical composition are the commonly called wine bottles
(see figure 4.27). Eighty-one objects with this chemical composition were analysed, thirty-nine bottles
came from the LTR set and forty bottles came from LRA set. From the eighty-one objects, only two did
not belong to bottles, and they will be discussed later.
Prior to discussing the chemical composition of the bottles, it is important to differentiate them by their
shapes. In both assemblages it is possible to find square or case bottles (sometimes also called prismatic
bottles), globular or onion bottles, and the cylindrical bottles in black glass. The square shaped bottles
always occur in green glass with an olive tonality, as opposed to globular and cylindrical bottles, that
occur mostly in black glass. The bottles were divided in three categories according to their shapes (see
Table 4.3): type A, which corresponds to square bottles (see for example figure 4.27, LTR0040), type
B which corresponds to globular or onion bottles (see for example figure 4.27, LRA0012), and type C
corresponding to cylindrical bottles (see for example figure 4.27, LRA0059). The bottle anatomy and
the nomenclature employed are based on the scheme developed by Jones (1986, p.34) and present in
Fig. 4.27: Some examples of bottles found among the LTR and LRA sets. Fragments are chronologically organised.
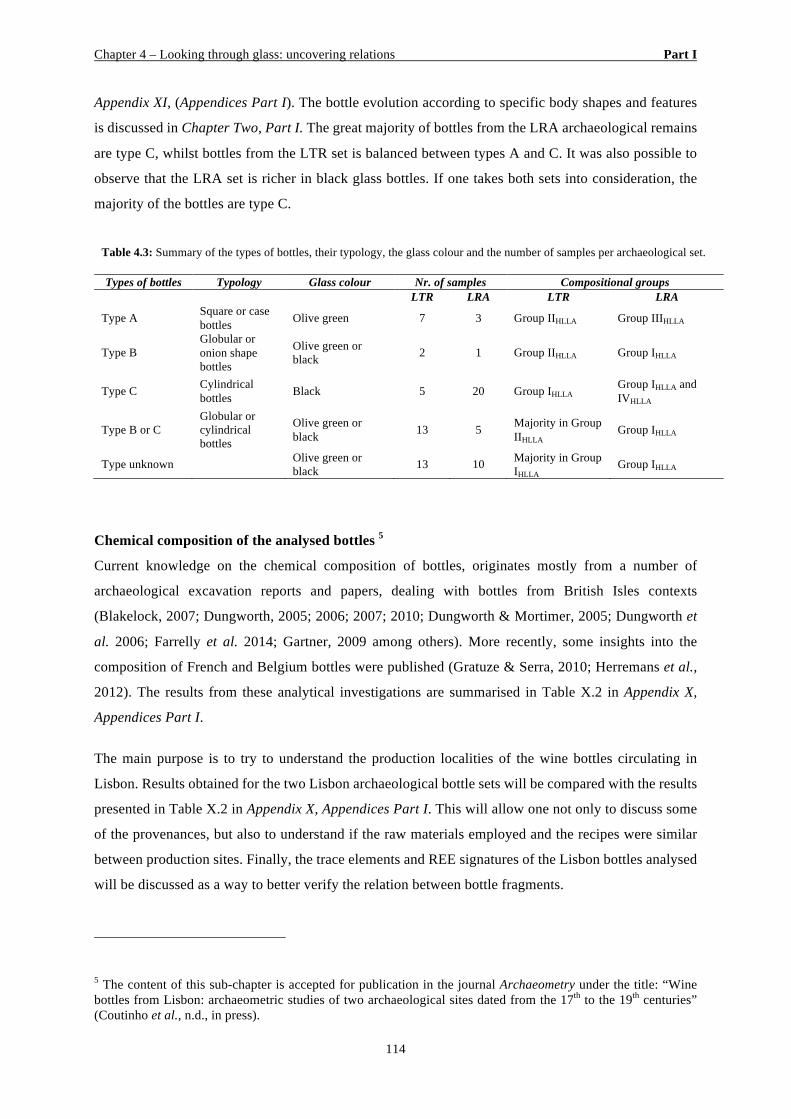
Chapter 4 – Looking through glass: uncovering relations Part I
114
Appendix XI, (Appendices Part I). The bottle evolution according to specific body shapes and features
is discussed in Chapter Two, Part I. The great majority of bottles from the LRA archaeological remains
are type C, whilst bottles from the LTR set is balanced between types A and C. It was also possible to
observe that the LRA set is richer in black glass bottles. If one takes both sets into consideration, the
majority of the bottles are type C.
Table 4.3: Summary of the types of bottles, their typology, the glass colour and the number of samples per archaeological set. Types of bottles Typology Glass colour Nr. of samples Compositional groups
LTR LRA LTR LRA
Type A Square or case bottles Olive green 7 3 Group IIHLLA Group IIIHLLA
Type B Globular or onion shape bottles
Olive green or black 2 1 Group IIHLLA Group IHLLA
Type C Cylindrical bottles Black 5 20 Group IHLLA Group IHLLA and
IVHLLA
Type B or C Globular or cylindrical bottles
Olive green or black 13 5 Majority in Group
IIHLLA Group IHLLA
Type unknown Olive green or black 13 10 Majority in Group
IHLLA Group IHLLA
Chemical composition of the analysed bottles 5
Current knowledge on the chemical composition of bottles, originates mostly from a number of
archaeological excavation reports and papers, dealing with bottles from British Isles contexts
(Blakelock, 2007; Dungworth, 2005; 2006; 2007; 2010; Dungworth & Mortimer, 2005; Dungworth et
al. 2006; Farrelly et al. 2014; Gartner, 2009 among others). More recently, some insights into the
composition of French and Belgium bottles were published (Gratuze & Serra, 2010; Herremans et al.,
2012). The results from these analytical investigations are summarised in Table X.2 in Appendix X,
Appendices Part I.
The main purpose is to try to understand the production localities of the wine bottles circulating in
Lisbon. Results obtained for the two Lisbon archaeological bottle sets will be compared with the results
presented in Table X.2 in Appendix X, Appendices Part I. This will allow one not only to discuss some
of the provenances, but also to understand if the raw materials employed and the recipes were similar
between production sites. Finally, the trace elements and REE signatures of the Lisbon bottles analysed
will be discussed as a way to better verify the relation between bottle fragments.
5 The content of this sub-chapter is accepted for publication in the journal Archaeometry under the title: “Wine bottles from Lisbon: archaeometric studies of two archaeological sites dated from the 17th to the 19th centuries” (Coutinho et al., n.d., in press).
Chapter 4 – Looking through glass: uncovering relations Part I
115
All the seventy-nine bottles analysed from both sets being studied, were revealed to be of a HLLA glass
type (Tables II.2 and III.2 in Appendices II and III, Appendices Part I). Analysing the composition of
the bottle fragments, their CaO contents varies between 19 and 28 wt%, their SiO2 content varies
between 55.5 and 70 wt%, the iron oxide between 0.8 and 4 wt%, MgO between 0.3 to 5 wt%, P2O5
between 0.2 and 3wt% and MnO varies between 0.1 and 1.8 wt%.
In general, high lime low alkali (HLLA) glass was used to produce utilitarian glass (including window
glass) and by the beginning of the 18th century it was almost exclusively used for bottle production.
Wine bottles of this type are characterised by their strong green coloration due to the high iron content
(Dungworth et al., 2006). This compositional type of glass was developed in Germany and France during
the late medieval period and it is believed that it was probably made using the ashes of trees, in particular
oak (Dungworth, 2009). HLLA glass was the typical composition used for bottles in the British Isles
and continental Europe since its introduction in the 16th century until the 19th century (Dungworth et al.,
2006). As far as Portugal is concerned, HLLA glass was identified by Lopes et. al. in the analytical
study of the glass fragments from the archaeological excavation of the Real Fábrica de Vidros de Coina
(Royal Glass Manufactory of Coina) (Lopes et al., 2009).
In the case of bottles, it is generally accepted that no particular care was taken in the choice of raw
materials to be employed in their production, and normally the cheapest ones were preferred
(Dungworth, 2012). In what regards the choice of alkalis for the HLLA glass during the 17th century,
ashes from wood or from forest plants are the raw materials that are assumed to have been employed,
mainly because of the contents of sodium, potassium and calcium oxides. From the 18th century onwards,
plant ashes were still used in the glassmaking process, however in lower proportions. The leached ashes,
rich in calcium, were employed in the batch in higher proportions (Dungworth, 2012). Moreover,
components coming from other industrial processes (waste material) were also used in glassmaking,
such as slags from iron furnaces (Dungworth, 2012). Kelp was another source of cheap alkali employed
in the glass batch of the wine bottles, which presence can be identified through an increased of the
strontium content in the glass (Dungworth, 2012). The majority of calcium oxide in these bottles was
most probably introduced into the batch through the plant ashes employed and also from the leached
ashes (Dungworth, 2012). Plant and wood ashes employed on bottle manufacture started to be washed
in order to obtain the charrées (the remains after wood ashes had been washed – insoluble residues
which are rich in calcium – mentioned in French glass recipe books from the 19th century, mentioning
specifically the bottle production6) (Gratuze & Serra, 2010).
6 See for instance: Jéhan, L.-F. 1851. Encyclopédie Théologique, ou séries de dictionnaires sur toutes les parties de la science religieuse. Tome 46 - Dictionnaire de chimie et de mineralogie. Paris, M. L’Abbé Migne, pp.1547-1548.
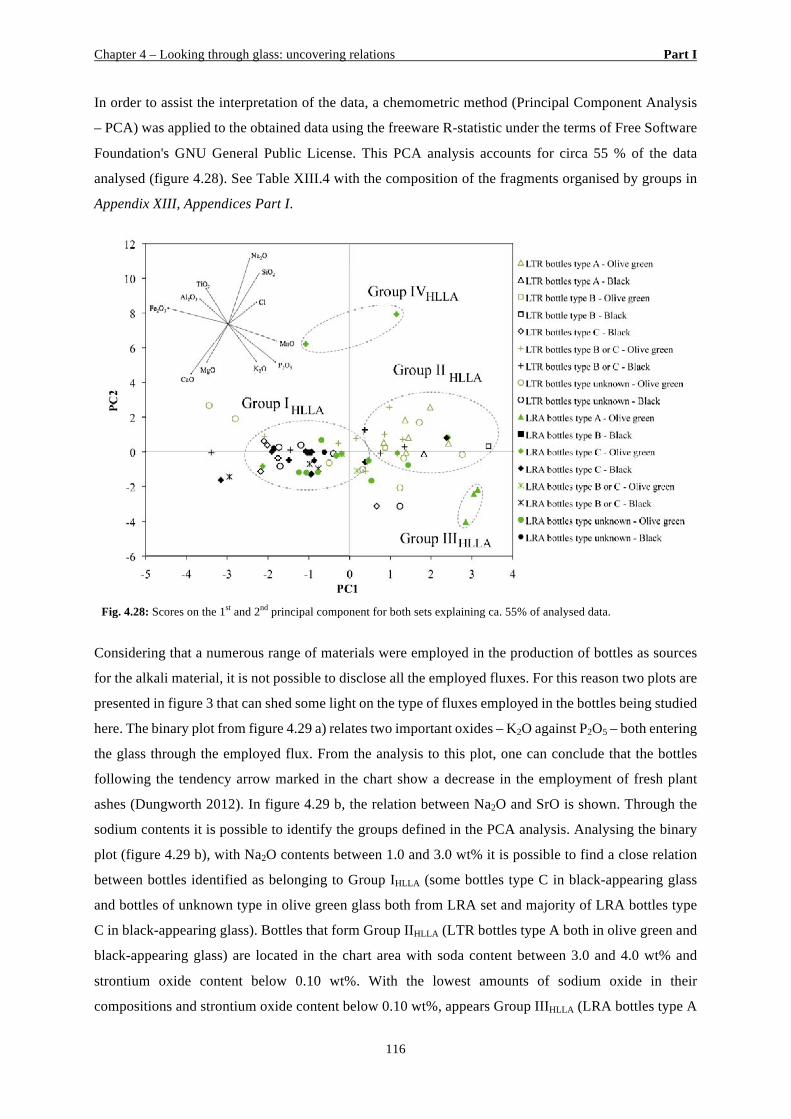
Chapter 4 – Looking through glass: uncovering relations Part I
116
In order to assist the interpretation of the data, a chemometric method (Principal Component Analysis
– PCA) was applied to the obtained data using the freeware R-statistic under the terms of Free Software
Foundation's GNU General Public License. This PCA analysis accounts for circa 55 % of the data
analysed (figure 4.28). See Table XIII.4 with the composition of the fragments organised by groups in
Appendix XIII, Appendices Part I.
Fig. 4.28: Scores on the 1st and 2nd principal component for both sets explaining ca. 55% of analysed data.
Considering that a numerous range of materials were employed in the production of bottles as sources
for the alkali material, it is not possible to disclose all the employed fluxes. For this reason two plots are
presented in figure 3 that can shed some light on the type of fluxes employed in the bottles being studied
here. The binary plot from figure 4.29 a) relates two important oxides – K2O against P2O5 – both entering
the glass through the employed flux. From the analysis to this plot, one can conclude that the bottles
following the tendency arrow marked in the chart show a decrease in the employment of fresh plant
ashes (Dungworth 2012). In figure 4.29 b, the relation between Na2O and SrO is shown. Through the
sodium contents it is possible to identify the groups defined in the PCA analysis. Analysing the binary
plot (figure 4.29 b), with Na2O contents between 1.0 and 3.0 wt% it is possible to find a close relation
between bottles identified as belonging to Group IHLLA (some bottles type C in black-appearing glass
and bottles of unknown type in olive green glass both from LRA set and majority of LRA bottles type
C in black-appearing glass). Bottles that form Group IIHLLA (LTR bottles type A both in olive green and
black-appearing glass) are located in the chart area with soda content between 3.0 and 4.0 wt% and
strontium oxide content below 0.10 wt%. With the lowest amounts of sodium oxide in their
compositions and strontium oxide content below 0.10 wt%, appears Group IIIHLLA (LRA bottles type A
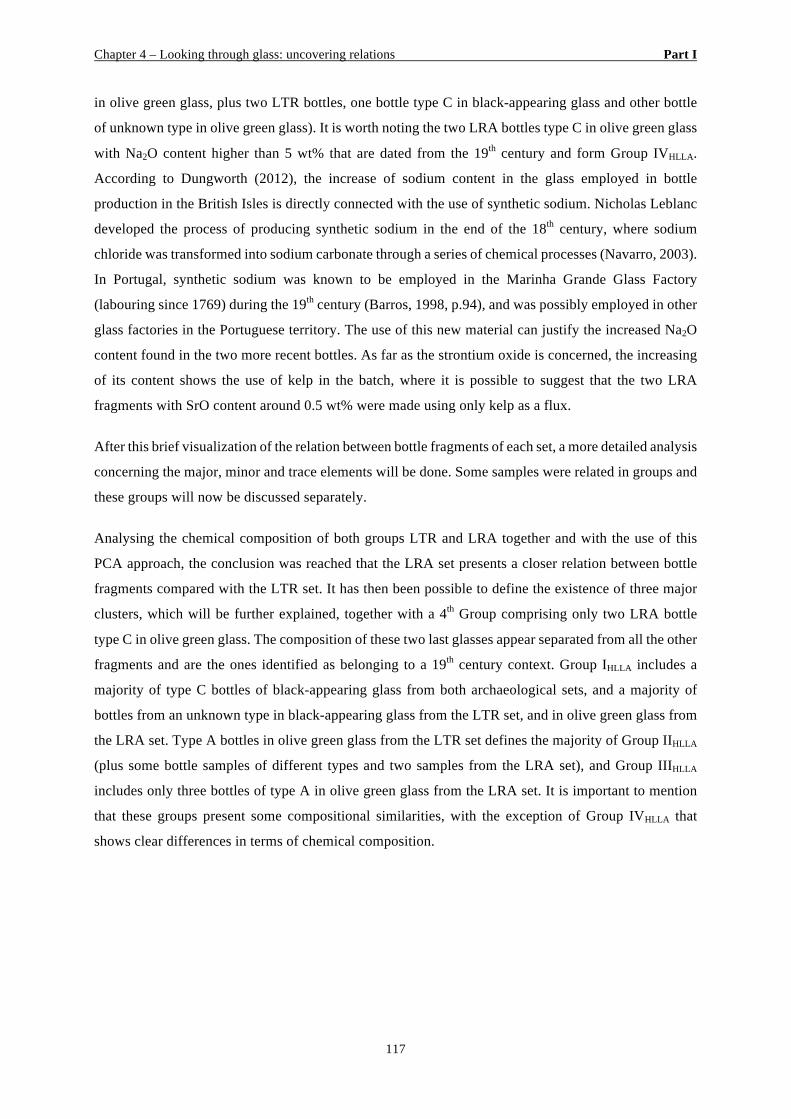
Chapter 4 – Looking through glass: uncovering relations Part I
117
in olive green glass, plus two LTR bottles, one bottle type C in black-appearing glass and other bottle
of unknown type in olive green glass). It is worth noting the two LRA bottles type C in olive green glass
with Na2O content higher than 5 wt% that are dated from the 19th century and form Group IVHLLA.
According to Dungworth (2012), the increase of sodium content in the glass employed in bottle
production in the British Isles is directly connected with the use of synthetic sodium. Nicholas Leblanc
developed the process of producing synthetic sodium in the end of the 18th century, where sodium
chloride was transformed into sodium carbonate through a series of chemical processes (Navarro, 2003).
In Portugal, synthetic sodium was known to be employed in the Marinha Grande Glass Factory
(labouring since 1769) during the 19th century (Barros, 1998, p.94), and was possibly employed in other
glass factories in the Portuguese territory. The use of this new material can justify the increased Na2O
content found in the two more recent bottles. As far as the strontium oxide is concerned, the increasing
of its content shows the use of kelp in the batch, where it is possible to suggest that the two LRA
fragments with SrO content around 0.5 wt% were made using only kelp as a flux.
After this brief visualization of the relation between bottle fragments of each set, a more detailed analysis
concerning the major, minor and trace elements will be done. Some samples were related in groups and
these groups will now be discussed separately.
Analysing the chemical composition of both groups LTR and LRA together and with the use of this
PCA approach, the conclusion was reached that the LRA set presents a closer relation between bottle
fragments compared with the LTR set. It has then been possible to define the existence of three major
clusters, which will be further explained, together with a 4th Group comprising only two LRA bottle
type C in olive green glass. The composition of these two last glasses appear separated from all the other
fragments and are the ones identified as belonging to a 19th century context. Group IHLLA includes a
majority of type C bottles of black-appearing glass from both archaeological sets, and a majority of
bottles from an unknown type in black-appearing glass from the LTR set, and in olive green glass from
the LRA set. Type A bottles in olive green glass from the LTR set defines the majority of Group IIHLLA
(plus some bottle samples of different types and two samples from the LRA set), and Group IIIHLLA
includes only three bottles of type A in olive green glass from the LRA set. It is important to mention
that these groups present some compositional similarities, with the exception of Group IVHLLA that
shows clear differences in terms of chemical composition.
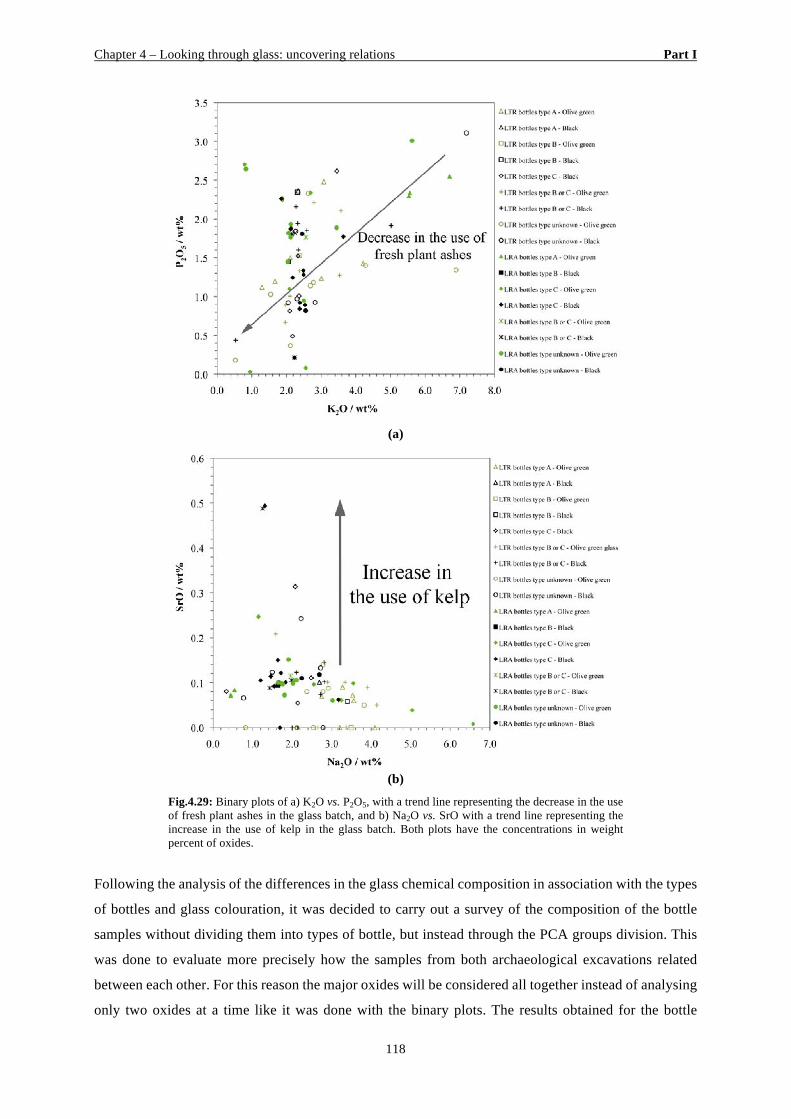
Chapter 4 – Looking through glass: uncovering relations Part I
118
(a)
(b)
Fig.4.29: Binary plots of a) K2O vs. P2O5, with a trend line representing the decrease in the use of fresh plant ashes in the glass batch, and b) Na2O vs. SrO with a trend line representing the increase in the use of kelp in the glass batch. Both plots have the concentrations in weight percent of oxides.
Following the analysis of the differences in the glass chemical composition in association with the types
of bottles and glass colouration, it was decided to carry out a survey of the composition of the bottle
samples without dividing them into types of bottle, but instead through the PCA groups division. This
was done to evaluate more precisely how the samples from both archaeological excavations related
between each other. For this reason the major oxides will be considered all together instead of analysing
only two oxides at a time like it was done with the binary plots. The results obtained for the bottle
Chapter 4 – Looking through glass: uncovering relations Part I
119
fragments will also be compared with data found in the literature that are summarised in Table X.2 in
Appendix X, Appendices Part I. Concerning the comparison with literature results, only the compositions
that are similar to the ones obtained for the bottles under study are presented.
Group IHLLA
In figure 4.30 three different charts with the majority of Group IHLLA samples is represented. These charts
have the contents of major elements that constitute the glass normalised to the concentration of the
continental earth’s crust (Wedepohl, 1995). In this way, the relation between eleven different elements
is compared, instead of comparing only two when analysing a binary chart. All the samples defined as
belonging to Group IHLLA have a very similar pattern, however three different sub-groups can be seen.
For each sub-group it was possible to find a relation with the literature that showed a close similarity in
terms of composition. In figure 4.30 a) the represented samples are similar to the glass produced in
Limekiln Lane (Bristol) in England. In figure b) the samples from Group IHLLA have a similar
composition to HLLA glass produced in the Silkstone glass factory (phase 4) in England. It is important
to note that the manganese content in the English factory is considerably higher than that in the samples
analysed from Lisbon. This is important because according to Farrelly et al. (2014) it is possible to
distinguish between HLLA production sites when relating the MnO and P2O5 contents from the glass
samples. The authors state that Irish HLLA glass dated to the late 16th and early 17th century was poorer
in MnO than the one produced in England. At this time, similar raw materials, glass recipes and furnace
conditions were being used both in Ireland and England, which resulted in similar glass compositions.
However, both the MnO and P2O5 contents are higher in English glass.
Plant ashes employed in glass manufacture were gathered locally and it is believed that these
compositional differences are due to the region’s geology where the plants have grown (Farrelly et al.,
2014). It is important to bear in mind that the production from Silkstone phase 4 is dated to the end of
the 17th century and 1700; and if one compares the contents of MnO and P2O5 with the ones obtained
for bottles produced in the British Isles during the 18th century (closer to the chronology of the bottles
being analysed here), the values for both these oxides are similar. One can also consider the hypothesis
that the bottles from both LTR and LRA archaeological sets that are comparable with Silkstone phase 4
were produced earlier and for this reason match the Silkstone composition from the end of the 17th
century.
Chapter 4 – Looking through glass: uncovering relations Part I
120
(a) (b)
(c)
(d)
Fig. 4.30: Representation of samples from Group IHLLA divided by identified sub-groups. Charts represented in a), b) and c) are the major elements pattern from Group IHLLA normalised to the concentration of the continental earth’s crust (Wedepohl, 1995), plus composition from the literature presented in Table X.2 in Appendix X, Appendices Part I. The composition from literature in a) is from Limekiln Lane in England, in b) from Silkstone, phase 4, England, and c) St. Thomas t., Bristol, England. The chart represented in d) is the trace elements and REE pattern of samples from Group IHLLA analysed by LA-ICP-MS and represented in logarithmic scale.
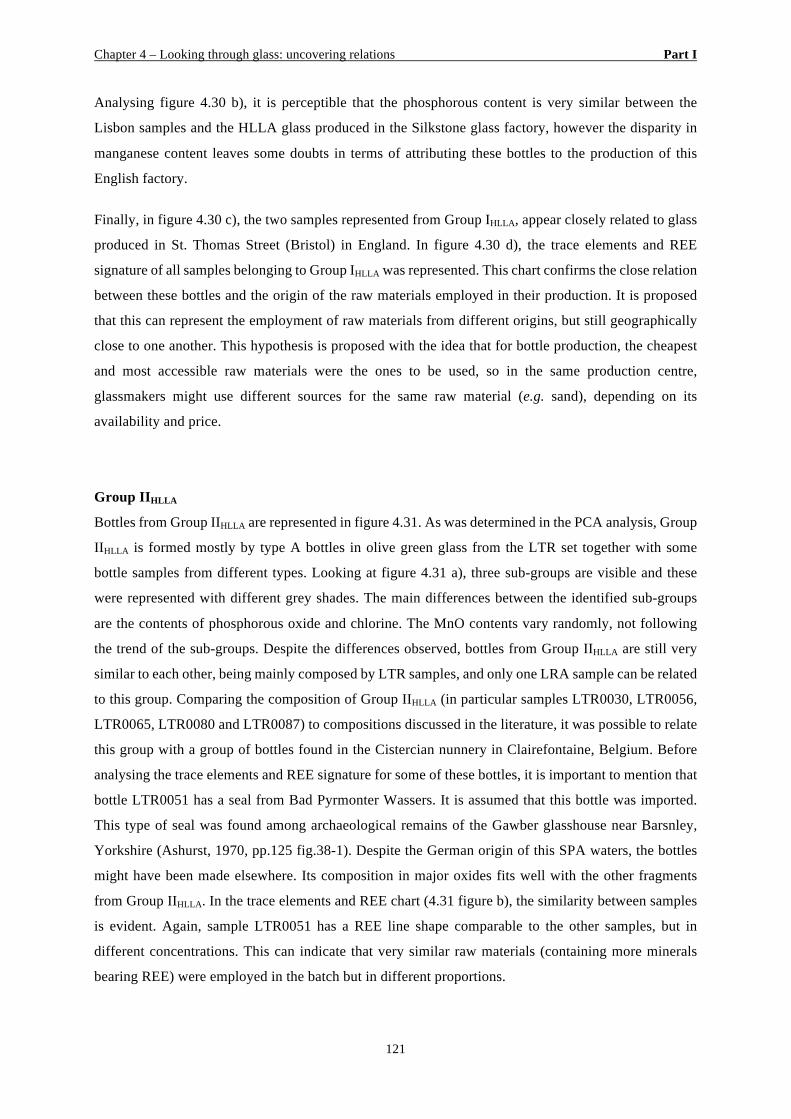
Chapter 4 – Looking through glass: uncovering relations Part I
121
Analysing figure 4.30 b), it is perceptible that the phosphorous content is very similar between the
Lisbon samples and the HLLA glass produced in the Silkstone glass factory, however the disparity in
manganese content leaves some doubts in terms of attributing these bottles to the production of this
English factory.
Finally, in figure 4.30 c), the two samples represented from Group IHLLA, appear closely related to glass
produced in St. Thomas Street (Bristol) in England. In figure 4.30 d), the trace elements and REE
signature of all samples belonging to Group IHLLA was represented. This chart confirms the close relation
between these bottles and the origin of the raw materials employed in their production. It is proposed
that this can represent the employment of raw materials from different origins, but still geographically
close to one another. This hypothesis is proposed with the idea that for bottle production, the cheapest
and most accessible raw materials were the ones to be used, so in the same production centre,
glassmakers might use different sources for the same raw material (e.g. sand), depending on its
availability and price.
Group IIHLLA
Bottles from Group IIHLLA are represented in figure 4.31. As was determined in the PCA analysis, Group
IIHLLA is formed mostly by type A bottles in olive green glass from the LTR set together with some
bottle samples from different types. Looking at figure 4.31 a), three sub-groups are visible and these
were represented with different grey shades. The main differences between the identified sub-groups
are the contents of phosphorous oxide and chlorine. The MnO contents vary randomly, not following
the trend of the sub-groups. Despite the differences observed, bottles from Group IIHLLA are still very
similar to each other, being mainly composed by LTR samples, and only one LRA sample can be related
to this group. Comparing the composition of Group IIHLLA (in particular samples LTR0030, LTR0056,
LTR0065, LTR0080 and LTR0087) to compositions discussed in the literature, it was possible to relate
this group with a group of bottles found in the Cistercian nunnery in Clairefontaine, Belgium. Before
analysing the trace elements and REE signature for some of these bottles, it is important to mention that
bottle LTR0051 has a seal from Bad Pyrmonter Wassers. It is assumed that this bottle was imported.
This type of seal was found among archaeological remains of the Gawber glasshouse near Barsnley,
Yorkshire (Ashurst, 1970, pp.125 fig.38-1). Despite the German origin of this SPA waters, the bottles
might have been made elsewhere. Its composition in major oxides fits well with the other fragments
from Group IIHLLA. In the trace elements and REE chart (4.31 figure b), the similarity between samples
is evident. Again, sample LTR0051 has a REE line shape comparable to the other samples, but in
different concentrations. This can indicate that very similar raw materials (containing more minerals
bearing REE) were employed in the batch but in different proportions.
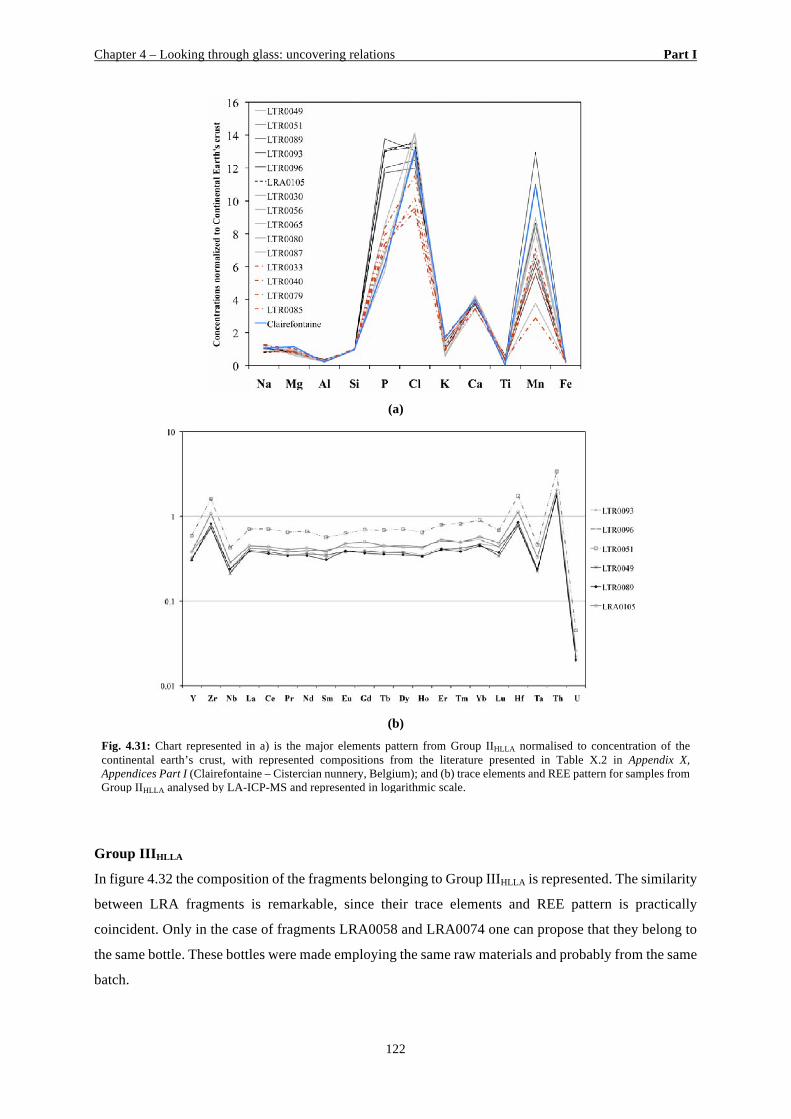
Chapter 4 – Looking through glass: uncovering relations Part I
122
(a)
(b)
Fig. 4.31: Chart represented in a) is the major elements pattern from Group IIHLLA normalised to concentration of the continental earth’s crust, with represented compositions from the literature presented in Table X.2 in Appendix X, Appendices Part I (Clairefontaine – Cistercian nunnery, Belgium); and (b) trace elements and REE pattern for samples from Group IIHLLA analysed by LA-ICP-MS and represented in logarithmic scale.
Group IIIHLLA
In figure 4.32 the composition of the fragments belonging to Group IIIHLLA is represented. The similarity
between LRA fragments is remarkable, since their trace elements and REE pattern is practically
coincident. Only in the case of fragments LRA0058 and LRA0074 one can propose that they belong to
the same bottle. These bottles were made employing the same raw materials and probably from the same
batch.
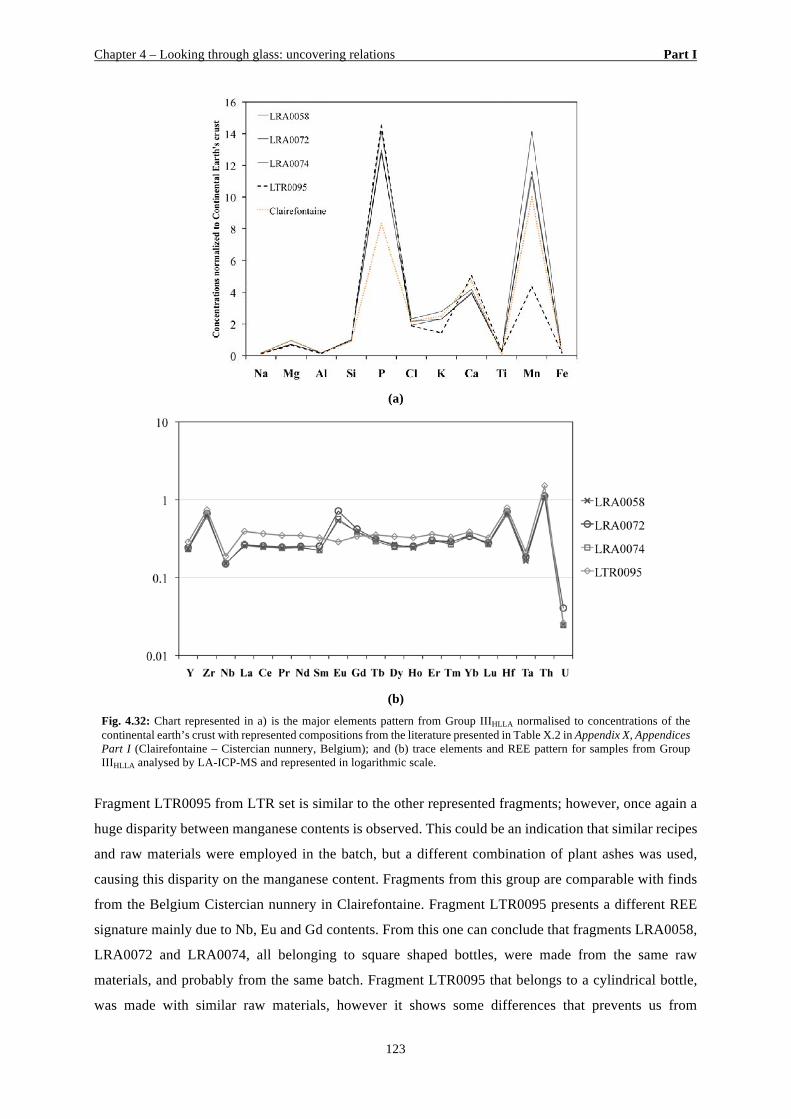
Chapter 4 – Looking through glass: uncovering relations Part I
123
(a)
(b)
Fig. 4.32: Chart represented in a) is the major elements pattern from Group IIIHLLA normalised to concentrations of the continental earth’s crust with represented compositions from the literature presented in Table X.2 in Appendix X, Appendices Part I (Clairefontaine – Cistercian nunnery, Belgium); and (b) trace elements and REE pattern for samples from Group IIIHLLA analysed by LA-ICP-MS and represented in logarithmic scale.
Fragment LTR0095 from LTR set is similar to the other represented fragments; however, once again a
huge disparity between manganese contents is observed. This could be an indication that similar recipes
and raw materials were employed in the batch, but a different combination of plant ashes was used,
causing this disparity on the manganese content. Fragments from this group are comparable with finds
from the Belgium Cistercian nunnery in Clairefontaine. Fragment LTR0095 presents a different REE
signature mainly due to Nb, Eu and Gd contents. From this one can conclude that fragments LRA0058,
LRA0072 and LRA0074, all belonging to square shaped bottles, were made from the same raw
materials, and probably from the same batch. Fragment LTR0095 that belongs to a cylindrical bottle,
was made with similar raw materials, however it shows some differences that prevents us from
Chapter 4 – Looking through glass: uncovering relations Part I
124
attributing this fragment to the same moment of production of the other three fragments. LTR0095 was
probably made in a different time than the other three fragments.
Group IVHLLA
Finally, in figure 4.33, the composition of Group IVHLLA is represented (only two 19th-century samples
from the LRA set).
(a)
(b)
Fig. 4.33: Chart represented in a) is the major elements pattern from Group IVHLLA normalised to concentration of the continental earth’s crust with represented compositions from the literature presented in Table X.2 in Appendix X, Appendices Part I (Les Arles and Bouches-du-Rhône, both in France); and (b) REE pattern for samples from Group IVHLLA analysed by LA-ICP-MS and represented in logarithmic scale.
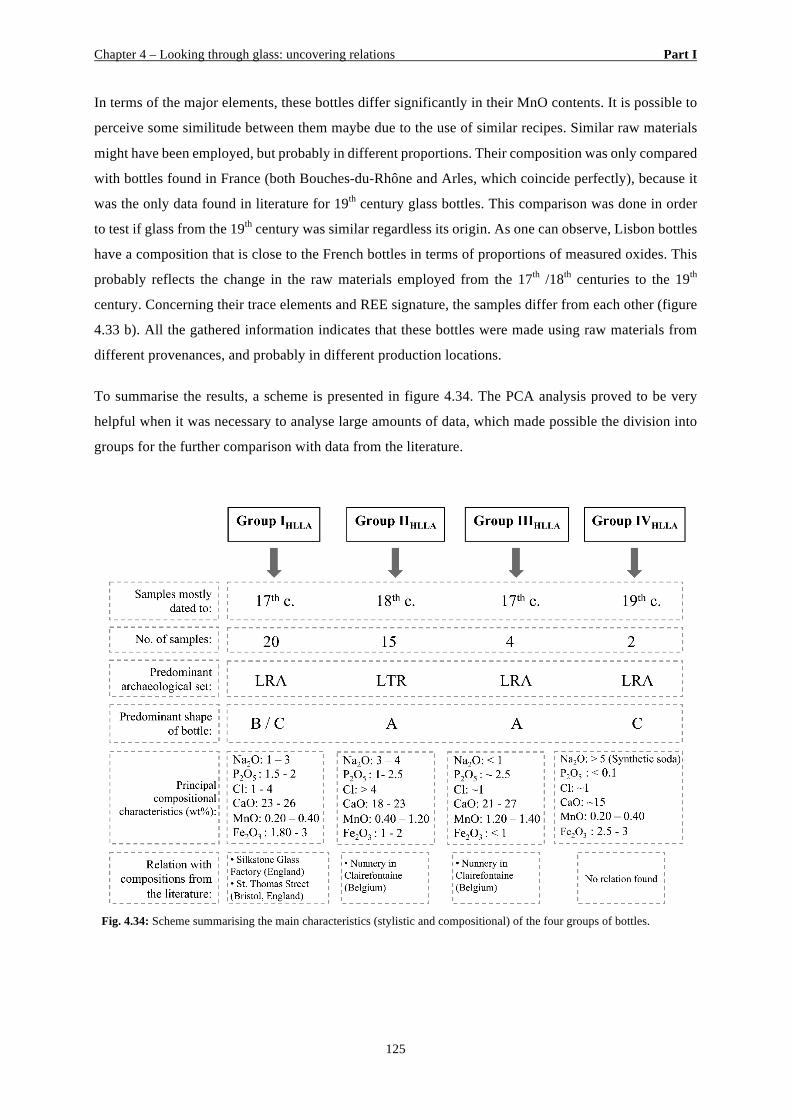
Chapter 4 – Looking through glass: uncovering relations Part I
125
In terms of the major elements, these bottles differ significantly in their MnO contents. It is possible to
perceive some similitude between them maybe due to the use of similar recipes. Similar raw materials
might have been employed, but probably in different proportions. Their composition was only compared
with bottles found in France (both Bouches-du-Rhône and Arles, which coincide perfectly), because it
was the only data found in literature for 19th century glass bottles. This comparison was done in order
to test if glass from the 19th century was similar regardless its origin. As one can observe, Lisbon bottles
have a composition that is close to the French bottles in terms of proportions of measured oxides. This
probably reflects the change in the raw materials employed from the 17th /18th centuries to the 19th
century. Concerning their trace elements and REE signature, the samples differ from each other (figure
4.33 b). All the gathered information indicates that these bottles were made using raw materials from
different provenances, and probably in different production locations.
To summarise the results, a scheme is presented in figure 4.34. The PCA analysis proved to be very
helpful when it was necessary to analyse large amounts of data, which made possible the division into
groups for the further comparison with data from the literature.
Fig. 4.34: Scheme summarising the main characteristics (stylistic and compositional) of the four groups of bottles.
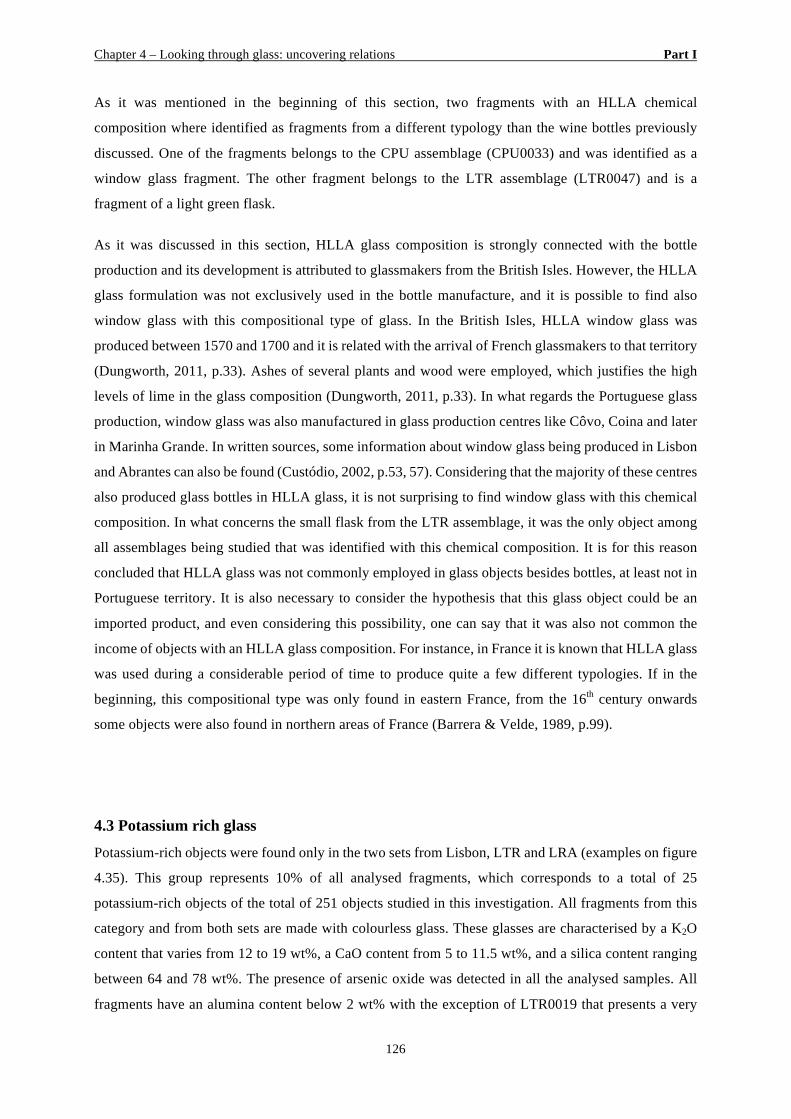
Chapter 4 – Looking through glass: uncovering relations Part I
126
As it was mentioned in the beginning of this section, two fragments with an HLLA chemical
composition where identified as fragments from a different typology than the wine bottles previously
discussed. One of the fragments belongs to the CPU assemblage (CPU0033) and was identified as a
window glass fragment. The other fragment belongs to the LTR assemblage (LTR0047) and is a
fragment of a light green flask.
As it was discussed in this section, HLLA glass composition is strongly connected with the bottle
production and its development is attributed to glassmakers from the British Isles. However, the HLLA
glass formulation was not exclusively used in the bottle manufacture, and it is possible to find also
window glass with this compositional type of glass. In the British Isles, HLLA window glass was
produced between 1570 and 1700 and it is related with the arrival of French glassmakers to that territory
(Dungworth, 2011, p.33). Ashes of several plants and wood were employed, which justifies the high
levels of lime in the glass composition (Dungworth, 2011, p.33). In what regards the Portuguese glass
production, window glass was also manufactured in glass production centres like Côvo, Coina and later
in Marinha Grande. In written sources, some information about window glass being produced in Lisbon
and Abrantes can also be found (Custódio, 2002, p.53, 57). Considering that the majority of these centres
also produced glass bottles in HLLA glass, it is not surprising to find window glass with this chemical
composition. In what concerns the small flask from the LTR assemblage, it was the only object among
all assemblages being studied that was identified with this chemical composition. It is for this reason
concluded that HLLA glass was not commonly employed in glass objects besides bottles, at least not in
Portuguese territory. It is also necessary to consider the hypothesis that this glass object could be an
imported product, and even considering this possibility, one can say that it was also not common the
income of objects with an HLLA glass composition. For instance, in France it is known that HLLA glass
was used during a considerable period of time to produce quite a few different typologies. If in the
beginning, this compositional type was only found in eastern France, from the 16th century onwards
some objects were also found in northern areas of France (Barrera & Velde, 1989, p.99).
4.3 Potassium rich glass
Potassium-rich objects were found only in the two sets from Lisbon, LTR and LRA (examples on figure
4.35). This group represents 10% of all analysed fragments, which corresponds to a total of 25
potassium-rich objects of the total of 251 objects studied in this investigation. All fragments from this
category and from both sets are made with colourless glass. These glasses are characterised by a K2O
content that varies from 12 to 19 wt%, a CaO content from 5 to 11.5 wt%, and a silica content ranging
between 64 and 78 wt%. The presence of arsenic oxide was detected in all the analysed samples. All
fragments have an alumina content below 2 wt% with the exception of LTR0019 that presents a very
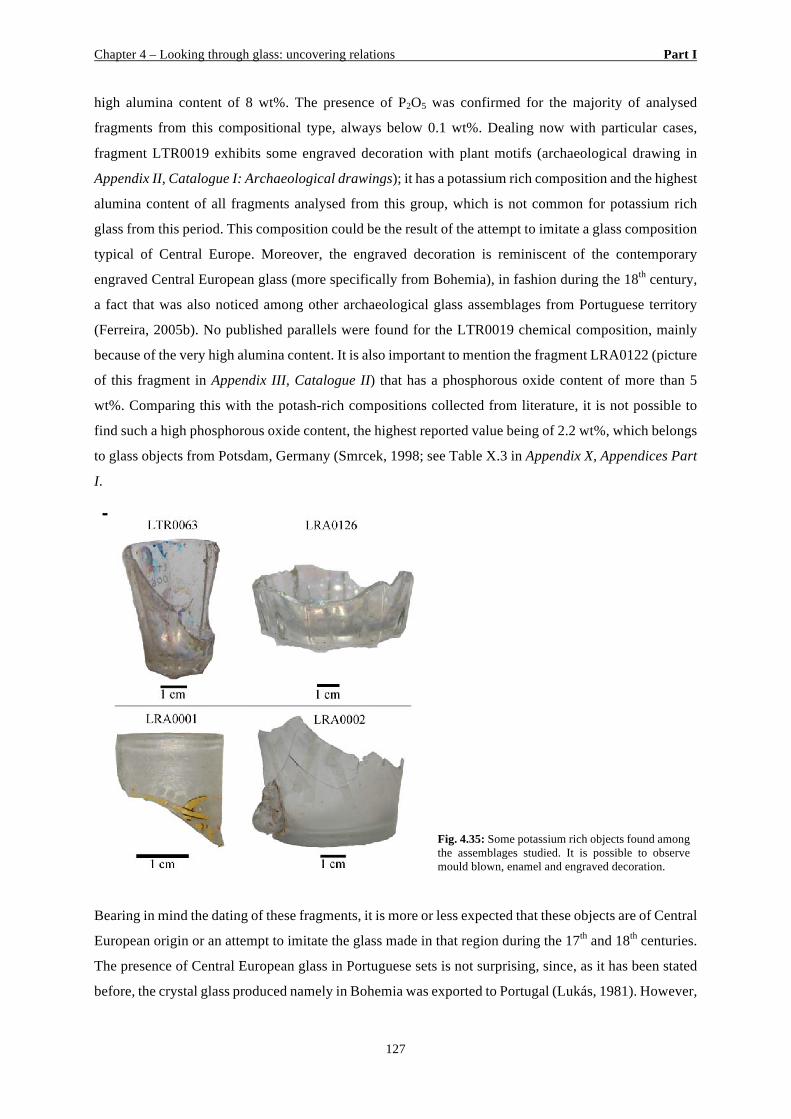
Chapter 4 – Looking through glass: uncovering relations Part I
127
high alumina content of 8 wt%. The presence of P2O5 was confirmed for the majority of analysed
fragments from this compositional type, always below 0.1 wt%. Dealing now with particular cases,
fragment LTR0019 exhibits some engraved decoration with plant motifs (archaeological drawing in
Appendix II, Catalogue I: Archaeological drawings); it has a potassium rich composition and the highest
alumina content of all fragments analysed from this group, which is not common for potassium rich
glass from this period. This composition could be the result of the attempt to imitate a glass composition
typical of Central Europe. Moreover, the engraved decoration is reminiscent of the contemporary
engraved Central European glass (more specifically from Bohemia), in fashion during the 18th century,
a fact that was also noticed among other archaeological glass assemblages from Portuguese territory
(Ferreira, 2005b). No published parallels were found for the LTR0019 chemical composition, mainly
because of the very high alumina content. It is also important to mention the fragment LRA0122 (picture
of this fragment in Appendix III, Catalogue II) that has a phosphorous oxide content of more than 5
wt%. Comparing this with the potash-rich compositions collected from literature, it is not possible to
find such a high phosphorous oxide content, the highest reported value being of 2.2 wt%, which belongs
to glass objects from Potsdam, Germany (Smrcek, 1998; see Table X.3 in Appendix X, Appendices Part
I.
Fig. 4.35: Some potassium rich objects found among the assemblages studied. It is possible to observe mould blown, enamel and engraved decoration.
Bearing in mind the dating of these fragments, it is more or less expected that these objects are of Central
European origin or an attempt to imitate the glass made in that region during the 17th and 18th centuries.
The presence of Central European glass in Portuguese sets is not surprising, since, as it has been stated
before, the crystal glass produced namely in Bohemia was exported to Portugal (Lukás, 1981). However,
Chapter 4 – Looking through glass: uncovering relations Part I
128
according to J. Custódio, glass à la façon de Bohème was being produced in the Coina Glass Factory
(Custódio, 2002, p.113). A fragment worth noting is the clear glass object LTR0014 (picture of this
fragments in Appendix II, Catalogue I), which belongs to an octagonal flask decorated with polychrome
enamels that was identified as being a typical feature of Central European glass from the 17th to 18th
century (see for example: Metropolitan Museum of Art, Accession Number 13.179.70a). Flasks with
the same shape and similar decorations were identified among the objects excavated from the Coina
Glass Factory. One of the flasks with this shape and exactly the same motif design as fragment
LTR0014, is present in the Soares dos Reis Museum, attributed to the Marinha Grande Glass Factory,
and is shown in figure 2.15 c), Chapter Two, Part 1. The difference between the two objects is that the
design on fragment LTR0014 is enamelled, and on the object from the Soares dos Reis Museum, the
motif was engraved (Custódio, 2002, p.244, 246).
Analysing the PCA charts (figure 4.36), a large cluster is observed – Group IK – composed of objects
from both sets, including fragments LTR0007, LTR0014, LTR0042, LTR0043, LTR0044, LRA0001,
LRA0002, LRA0003, LRA0005, LRA0006, LRA0007, LRA0076 and LRA0126. Within this large
cluster, it is noticeable that some fragments relate more with each other than others, and these relations
will be explored later. Fragment LTR0013 appears in the same quadrant as this cluster, but further away,
not being included in this group. One can also group fragments LTR0017, LTR0063 and LTR0064.
Finally, fragment LRA0112 appears related to LRA0122 and fragment LRA0123 relates with LRA0134.
Fragment LTR0019 was considered and identified as an outlier. The PCA model does not explain its
oxides relations. See Table XIII.5 with the composition of the fragments organised by groups in
Appendix XIII, Appendices Part I.
With regard to the fragments from Group IK, the objects from the LTR set belong to drinking glasses
(LTR0007) or flasks and jars (LTR0014, LTR0042, LTR0043 and LTR0044), whereas it was mentioned
previously, LTR0014 has a polychrome enamelled decoration. From the LRA set, all fragments are
made of colourless glass, some with enamelled decoration (LRA0001 and LRA0005), some with
engraved decoration (LRA0002, LRA0007, LRA0076), some have ribs of mould blown decoration
(LRA0126), and some are plain fragments of vessels (LRA0003 and LRA0006).
Object LRA0002 is worth noting. It is probably a jug with one handle, composed by five fragments, all
of them presenting floral and geometric engraved motifs. This type of engraving with motifs (floral and
geometric) very similar to the ones observed in fragment LRA0002, were also found in objects from an
archaeological excavation in Lisbon, and are very well described by Ferreira (2005b). It is concluded
by this author that several fragments with this type of decoration were found in at least in five
archaeological excavations in Portugal, and since Central European craftsmen were working here, a
national provenance could not be discarded (Ferreira, 2005b).
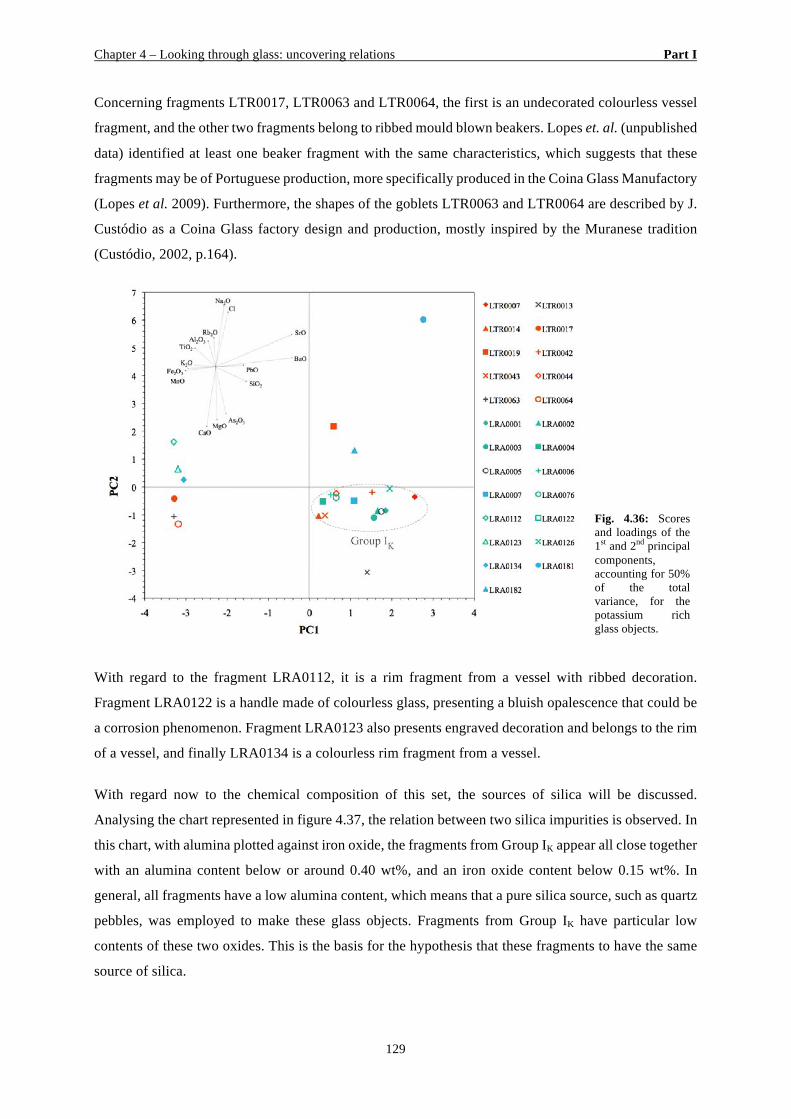
Chapter 4 – Looking through glass: uncovering relations Part I
129
Concerning fragments LTR0017, LTR0063 and LTR0064, the first is an undecorated colourless vessel
fragment, and the other two fragments belong to ribbed mould blown beakers. Lopes et. al. (unpublished
data) identified at least one beaker fragment with the same characteristics, which suggests that these
fragments may be of Portuguese production, more specifically produced in the Coina Glass Manufactory
(Lopes et al. 2009). Furthermore, the shapes of the goblets LTR0063 and LTR0064 are described by J.
Custódio as a Coina Glass factory design and production, mostly inspired by the Muranese tradition
(Custódio, 2002, p.164).
Fig. 4.36: Scores and loadings of the 1st and 2nd principal components, accounting for 50% of the total variance, for the potassium rich glass objects.
With regard to the fragment LRA0112, it is a rim fragment from a vessel with ribbed decoration.
Fragment LRA0122 is a handle made of colourless glass, presenting a bluish opalescence that could be
a corrosion phenomenon. Fragment LRA0123 also presents engraved decoration and belongs to the rim
of a vessel, and finally LRA0134 is a colourless rim fragment from a vessel.
With regard now to the chemical composition of this set, the sources of silica will be discussed.
Analysing the chart represented in figure 4.37, the relation between two silica impurities is observed. In
this chart, with alumina plotted against iron oxide, the fragments from Group IK appear all close together
with an alumina content below or around 0.40 wt%, and an iron oxide content below 0.15 wt%. In
general, all fragments have a low alumina content, which means that a pure silica source, such as quartz
pebbles, was employed to make these glass objects. Fragments from Group IK have particular low
contents of these two oxides. This is the basis for the hypothesis that these fragments to have the same
source of silica.
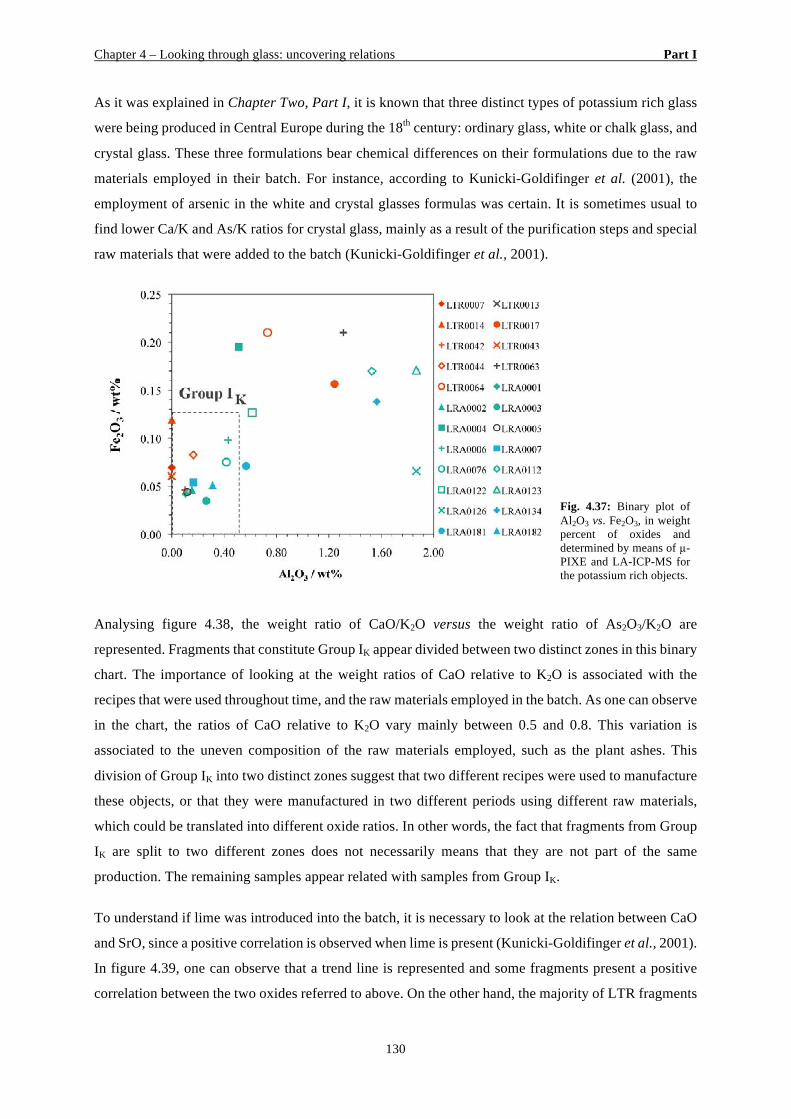
Chapter 4 – Looking through glass: uncovering relations Part I
130
As it was explained in Chapter Two, Part I, it is known that three distinct types of potassium rich glass
were being produced in Central Europe during the 18th century: ordinary glass, white or chalk glass, and
crystal glass. These three formulations bear chemical differences on their formulations due to the raw
materials employed in their batch. For instance, according to Kunicki-Goldifinger et al. (2001), the
employment of arsenic in the white and crystal glasses formulas was certain. It is sometimes usual to
find lower Ca/K and As/K ratios for crystal glass, mainly as a result of the purification steps and special
raw materials that were added to the batch (Kunicki-Goldifinger et al., 2001).
Fig. 4.37: Binary plot of Al2O3 vs. Fe2O3, in weight percent of oxides and determined by means of µ-PIXE and LA-ICP-MS for the potassium rich objects.
Analysing figure 4.38, the weight ratio of CaO/K2O versus the weight ratio of As2O3/K2O are
represented. Fragments that constitute Group IK appear divided between two distinct zones in this binary
chart. The importance of looking at the weight ratios of CaO relative to K2O is associated with the
recipes that were used throughout time, and the raw materials employed in the batch. As one can observe
in the chart, the ratios of CaO relative to K2O vary mainly between 0.5 and 0.8. This variation is
associated to the uneven composition of the raw materials employed, such as the plant ashes. This
division of Group IK into two distinct zones suggest that two different recipes were used to manufacture
these objects, or that they were manufactured in two different periods using different raw materials,
which could be translated into different oxide ratios. In other words, the fact that fragments from Group
IK are split to two different zones does not necessarily means that they are not part of the same
production. The remaining samples appear related with samples from Group IK.
To understand if lime was introduced into the batch, it is necessary to look at the relation between CaO
and SrO, since a positive correlation is observed when lime is present (Kunicki-Goldifinger et al., 2001).
In figure 4.39, one can observe that a trend line is represented and some fragments present a positive
correlation between the two oxides referred to above. On the other hand, the majority of LTR fragments
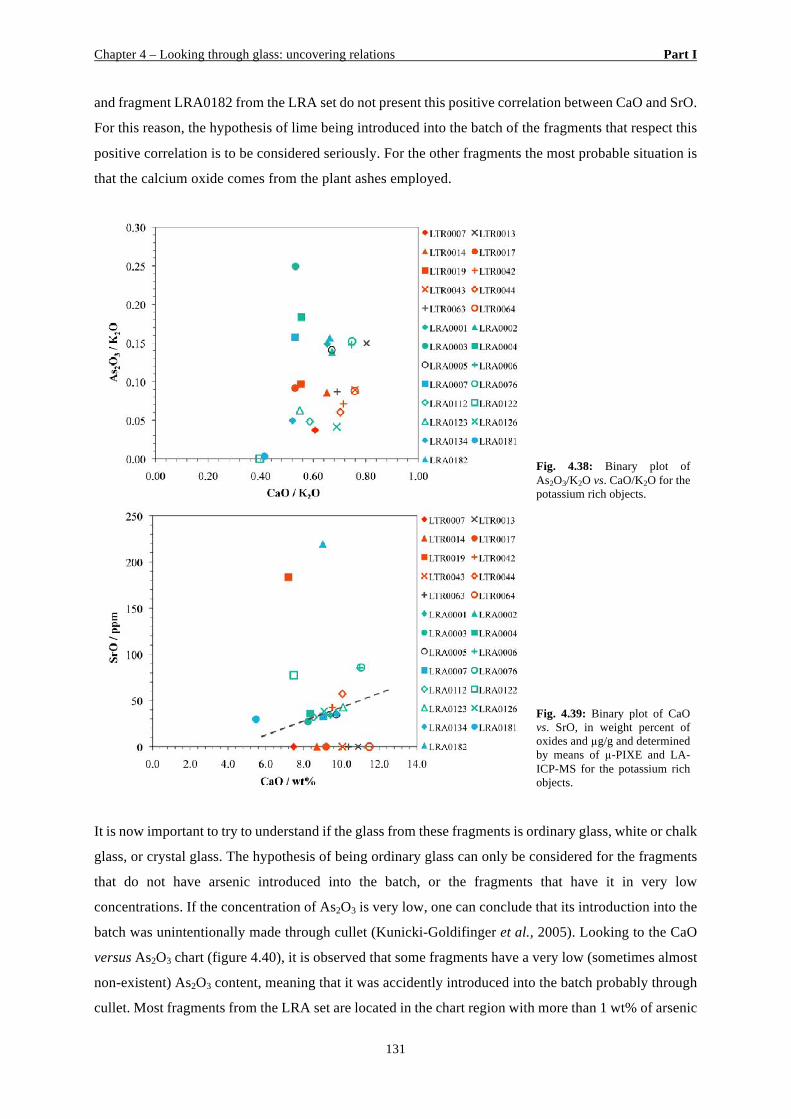
Chapter 4 – Looking through glass: uncovering relations Part I
131
and fragment LRA0182 from the LRA set do not present this positive correlation between CaO and SrO.
For this reason, the hypothesis of lime being introduced into the batch of the fragments that respect this
positive correlation is to be considered seriously. For the other fragments the most probable situation is
that the calcium oxide comes from the plant ashes employed.
Fig. 4.38: Binary plot of As2O3/K2O vs. CaO/K2O for the potassium rich objects.
Fig. 4.39: Binary plot of CaO vs. SrO, in weight percent of oxides and µg/g and determined by means of µ-PIXE and LA-ICP-MS for the potassium rich objects.
It is now important to try to understand if the glass from these fragments is ordinary glass, white or chalk
glass, or crystal glass. The hypothesis of being ordinary glass can only be considered for the fragments
that do not have arsenic introduced into the batch, or the fragments that have it in very low
concentrations. If the concentration of As2O3 is very low, one can conclude that its introduction into the
batch was unintentionally made through cullet (Kunicki-Goldifinger et al., 2005). Looking to the CaO
versus As2O3 chart (figure 4.40), it is observed that some fragments have a very low (sometimes almost
non-existent) As2O3 content, meaning that it was accidently introduced into the batch probably through
cullet. Most fragments from the LRA set are located in the chart region with more than 1 wt% of arsenic
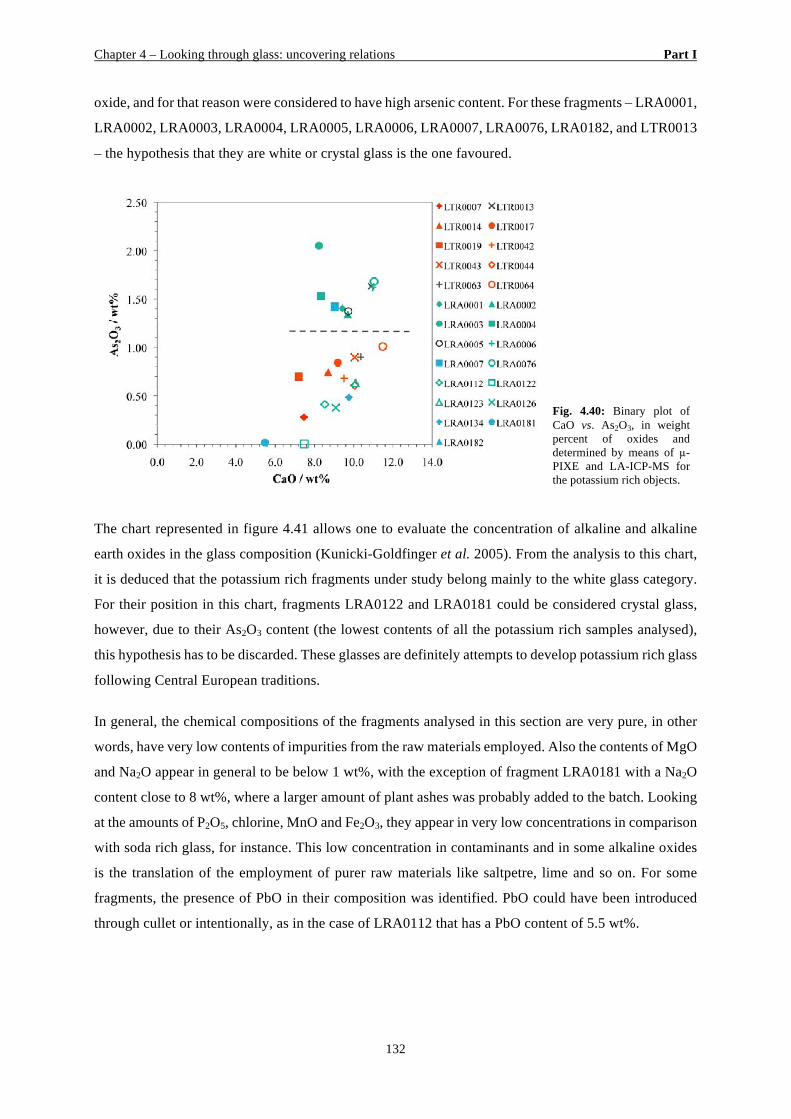
Chapter 4 – Looking through glass: uncovering relations Part I
132
oxide, and for that reason were considered to have high arsenic content. For these fragments – LRA0001,
LRA0002, LRA0003, LRA0004, LRA0005, LRA0006, LRA0007, LRA0076, LRA0182, and LTR0013
– the hypothesis that they are white or crystal glass is the one favoured.
Fig. 4.40: Binary plot of CaO vs. As2O3, in weight percent of oxides and determined by means of µ-PIXE and LA-ICP-MS for the potassium rich objects.
The chart represented in figure 4.41 allows one to evaluate the concentration of alkaline and alkaline
earth oxides in the glass composition (Kunicki-Goldfinger et al. 2005). From the analysis to this chart,
it is deduced that the potassium rich fragments under study belong mainly to the white glass category.
For their position in this chart, fragments LRA0122 and LRA0181 could be considered crystal glass,
however, due to their As2O3 content (the lowest contents of all the potassium rich samples analysed),
this hypothesis has to be discarded. These glasses are definitely attempts to develop potassium rich glass
following Central European traditions.
In general, the chemical compositions of the fragments analysed in this section are very pure, in other
words, have very low contents of impurities from the raw materials employed. Also the contents of MgO
and Na2O appear in general to be below 1 wt%, with the exception of fragment LRA0181 with a Na2O
content close to 8 wt%, where a larger amount of plant ashes was probably added to the batch. Looking
at the amounts of P2O5, chlorine, MnO and Fe2O3, they appear in very low concentrations in comparison
with soda rich glass, for instance. This low concentration in contaminants and in some alkaline oxides
is the translation of the employment of purer raw materials like saltpetre, lime and so on. For some
fragments, the presence of PbO in their composition was identified. PbO could have been introduced
through cullet or intentionally, as in the case of LRA0112 that has a PbO content of 5.5 wt%.
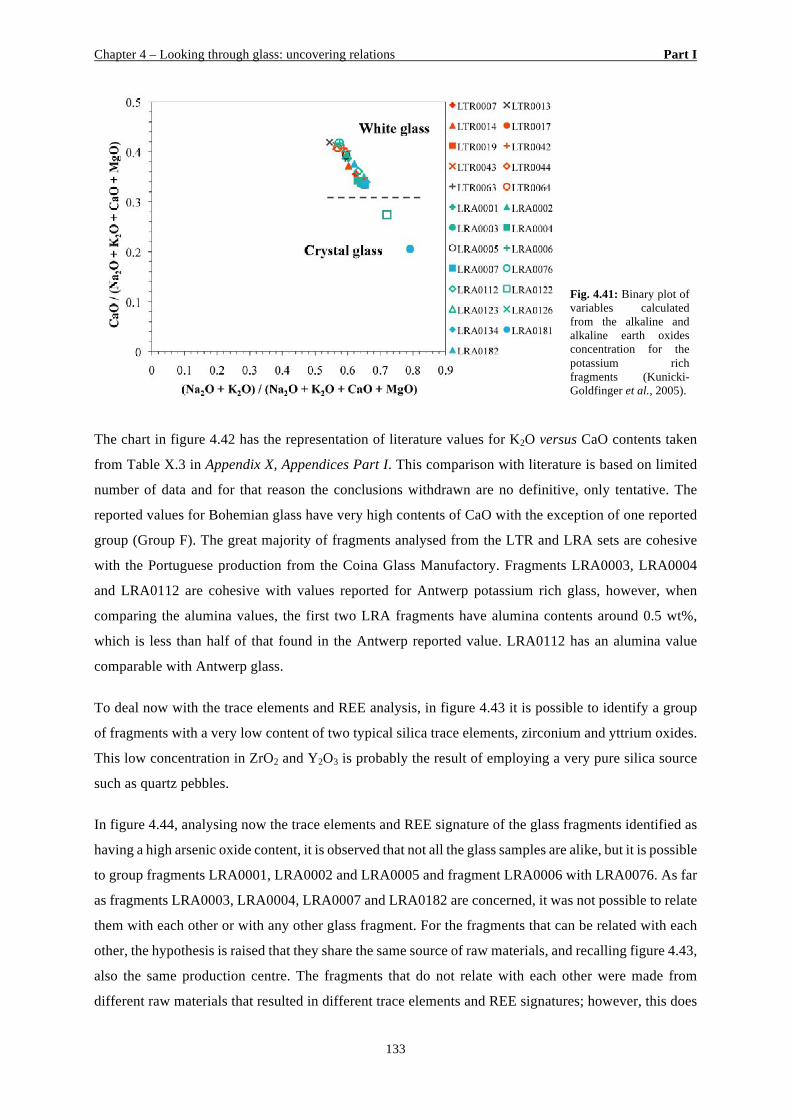
Chapter 4 – Looking through glass: uncovering relations Part I
133
The chart in figure 4.42 has the representation of literature values for K2O versus CaO contents taken
from Table X.3 in Appendix X, Appendices Part I. This comparison with literature is based on limited
number of data and for that reason the conclusions withdrawn are no definitive, only tentative. The
reported values for Bohemian glass have very high contents of CaO with the exception of one reported
group (Group F). The great majority of fragments analysed from the LTR and LRA sets are cohesive
with the Portuguese production from the Coina Glass Manufactory. Fragments LRA0003, LRA0004
and LRA0112 are cohesive with values reported for Antwerp potassium rich glass, however, when
comparing the alumina values, the first two LRA fragments have alumina contents around 0.5 wt%,
which is less than half of that found in the Antwerp reported value. LRA0112 has an alumina value
comparable with Antwerp glass.
To deal now with the trace elements and REE analysis, in figure 4.43 it is possible to identify a group
of fragments with a very low content of two typical silica trace elements, zirconium and yttrium oxides.
This low concentration in ZrO2 and Y2O3 is probably the result of employing a very pure silica source
such as quartz pebbles.
In figure 4.44, analysing now the trace elements and REE signature of the glass fragments identified as
having a high arsenic oxide content, it is observed that not all the glass samples are alike, but it is possible
to group fragments LRA0001, LRA0002 and LRA0005 and fragment LRA0006 with LRA0076. As far
as fragments LRA0003, LRA0004, LRA0007 and LRA0182 are concerned, it was not possible to relate
them with each other or with any other glass fragment. For the fragments that can be related with each
other, the hypothesis is raised that they share the same source of raw materials, and recalling figure 4.43,
also the same production centre. The fragments that do not relate with each other were made from
different raw materials that resulted in different trace elements and REE signatures; however, this does
Fig. 4.41: Binary plot of variables calculated from the alkaline and alkaline earth oxides concentration for the potassium rich fragments (Kunicki-Goldfinger et al., 2005).
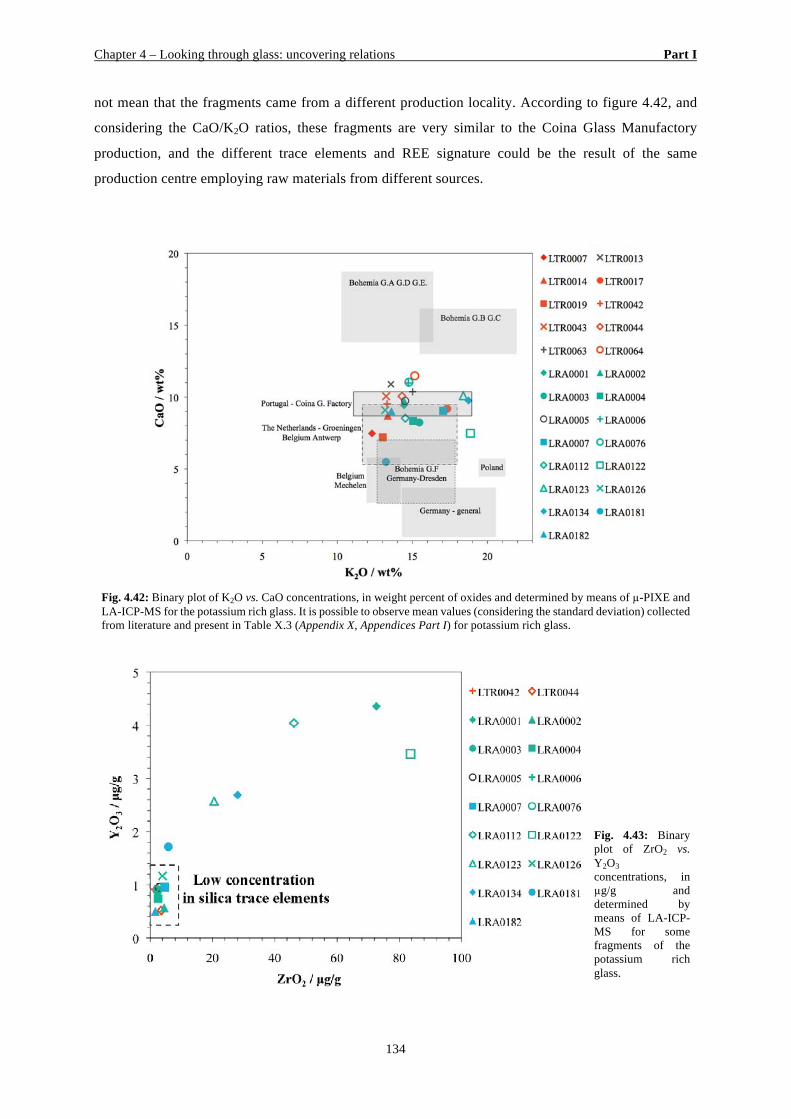
Chapter 4 – Looking through glass: uncovering relations Part I
134
not mean that the fragments came from a different production locality. According to figure 4.42, and
considering the CaO/K2O ratios, these fragments are very similar to the Coina Glass Manufactory
production, and the different trace elements and REE signature could be the result of the same
production centre employing raw materials from different sources.
Fig. 4.42: Binary plot of K2O vs. CaO concentrations, in weight percent of oxides and determined by means of µ-PIXE and LA-ICP-MS for the potassium rich glass. It is possible to observe mean values (considering the standard deviation) collected from literature and present in Table X.3 (Appendix X, Appendices Part I) for potassium rich glass.
Fig. 4.43: Binary plot of ZrO2 vs. Y2O3 concentrations, in µg/g and determined by means of LA-ICP-MS for some fragments of the potassium rich glass.
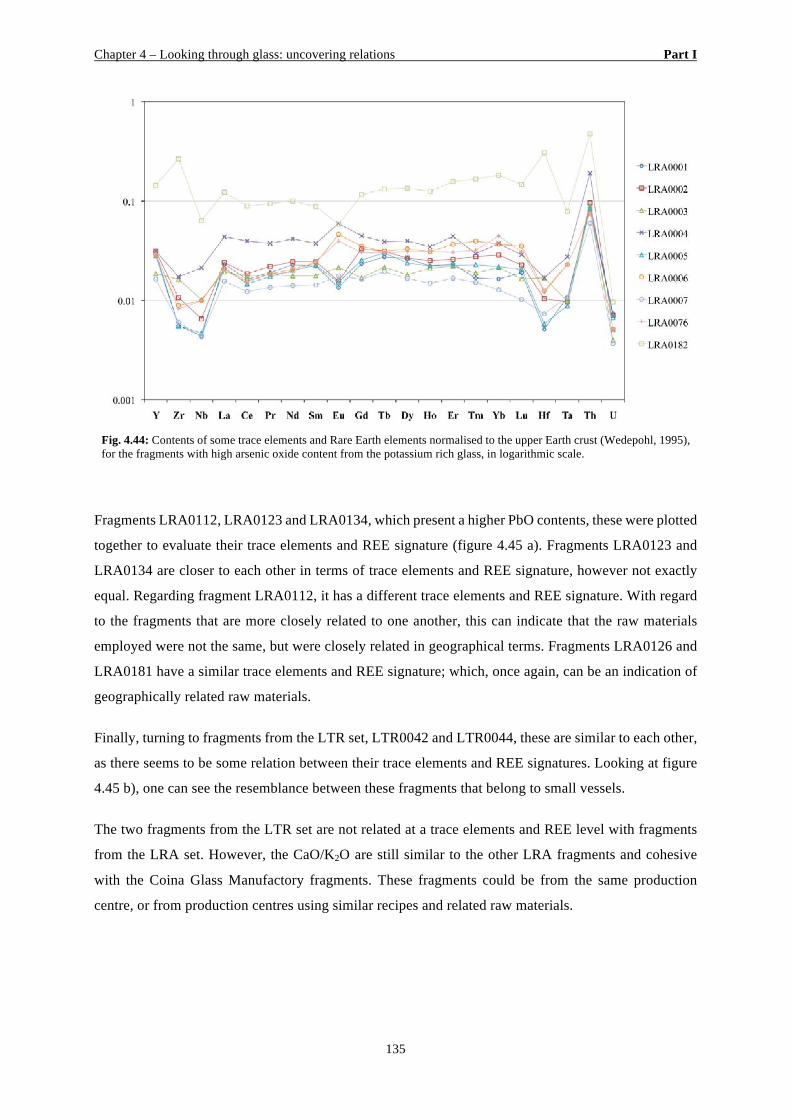
Chapter 4 – Looking through glass: uncovering relations Part I
135
Fig. 4.44: Contents of some trace elements and Rare Earth elements normalised to the upper Earth crust (Wedepohl, 1995), for the fragments with high arsenic oxide content from the potassium rich glass, in logarithmic scale.
Fragments LRA0112, LRA0123 and LRA0134, which present a higher PbO contents, these were plotted
together to evaluate their trace elements and REE signature (figure 4.45 a). Fragments LRA0123 and
LRA0134 are closer to each other in terms of trace elements and REE signature, however not exactly
equal. Regarding fragment LRA0112, it has a different trace elements and REE signature. With regard
to the fragments that are more closely related to one another, this can indicate that the raw materials
employed were not the same, but were closely related in geographical terms. Fragments LRA0126 and
LRA0181 have a similar trace elements and REE signature; which, once again, can be an indication of
geographically related raw materials.
Finally, turning to fragments from the LTR set, LTR0042 and LTR0044, these are similar to each other,
as there seems to be some relation between their trace elements and REE signatures. Looking at figure
4.45 b), one can see the resemblance between these fragments that belong to small vessels.
The two fragments from the LTR set are not related at a trace elements and REE level with fragments
from the LRA set. However, the CaO/K2O are still similar to the other LRA fragments and cohesive
with the Coina Glass Manufactory fragments. These fragments could be from the same production
centre, or from production centres using similar recipes and related raw materials.
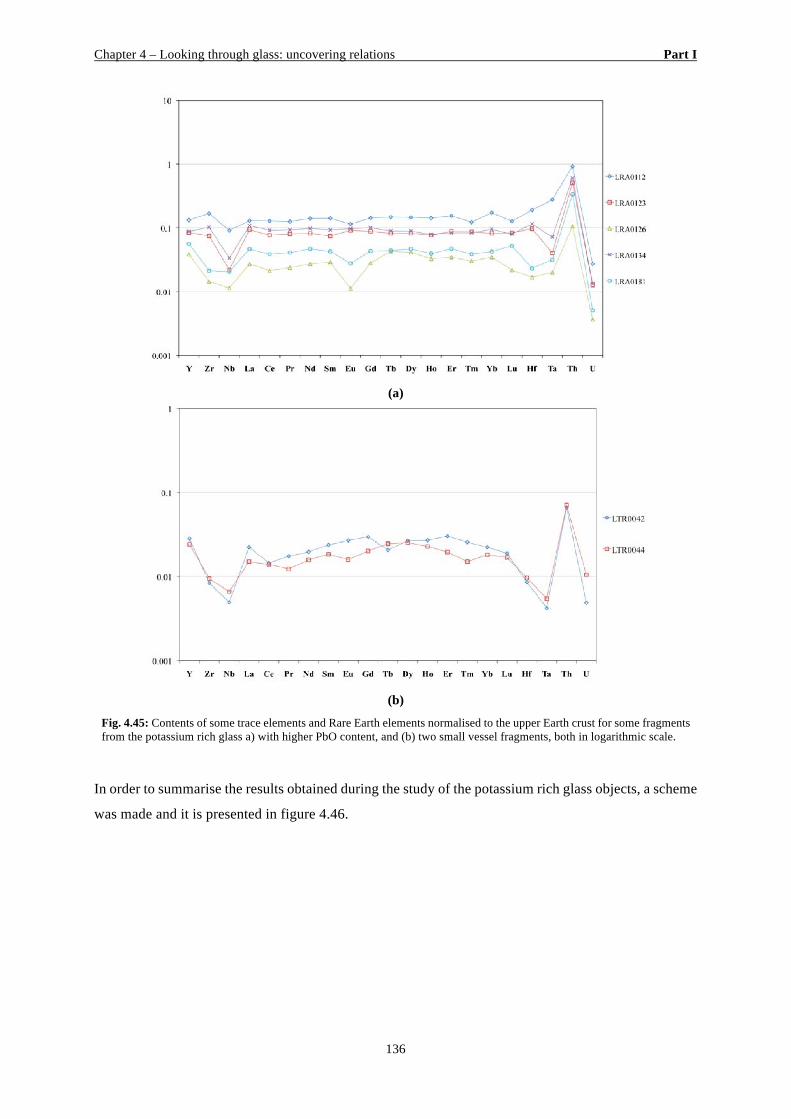
Chapter 4 – Looking through glass: uncovering relations Part I
136
(a)
(b)
Fig. 4.45: Contents of some trace elements and Rare Earth elements normalised to the upper Earth crust for some fragments from the potassium rich glass a) with higher PbO content, and (b) two small vessel fragments, both in logarithmic scale.
In order to summarise the results obtained during the study of the potassium rich glass objects, a scheme
was made and it is presented in figure 4.46.
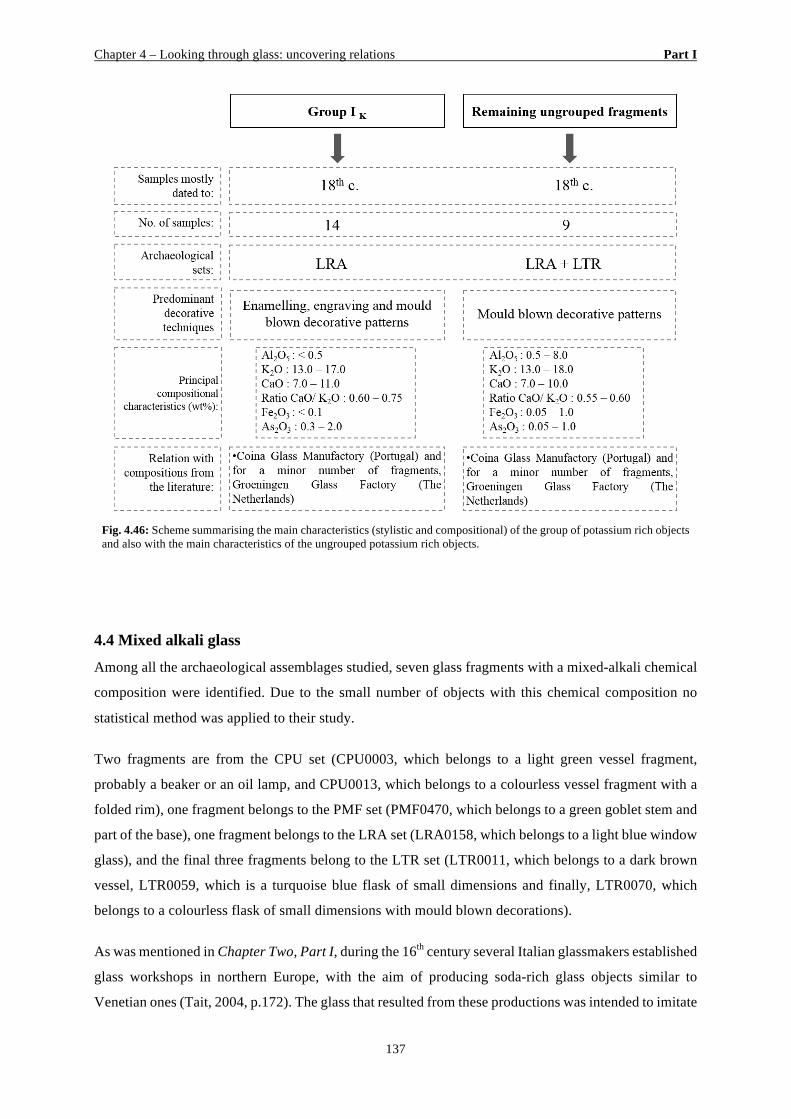
Chapter 4 – Looking through glass: uncovering relations Part I
137
Fig. 4.46: Scheme summarising the main characteristics (stylistic and compositional) of the group of potassium rich objects and also with the main characteristics of the ungrouped potassium rich objects.
4.4 Mixed alkali glass
Among all the archaeological assemblages studied, seven glass fragments with a mixed-alkali chemical
composition were identified. Due to the small number of objects with this chemical composition no
statistical method was applied to their study.
Two fragments are from the CPU set (CPU0003, which belongs to a light green vessel fragment,
probably a beaker or an oil lamp, and CPU0013, which belongs to a colourless vessel fragment with a
folded rim), one fragment belongs to the PMF set (PMF0470, which belongs to a green goblet stem and
part of the base), one fragment belongs to the LRA set (LRA0158, which belongs to a light blue window
glass), and the final three fragments belong to the LTR set (LTR0011, which belongs to a dark brown
vessel, LTR0059, which is a turquoise blue flask of small dimensions and finally, LTR0070, which
belongs to a colourless flask of small dimensions with mould blown decorations).
As was mentioned in Chapter Two, Part I, during the 16th century several Italian glassmakers established
glass workshops in northern Europe, with the aim of producing soda-rich glass objects similar to
Venetian ones (Tait, 2004, p.172). The glass that resulted from these productions was intended to imitate
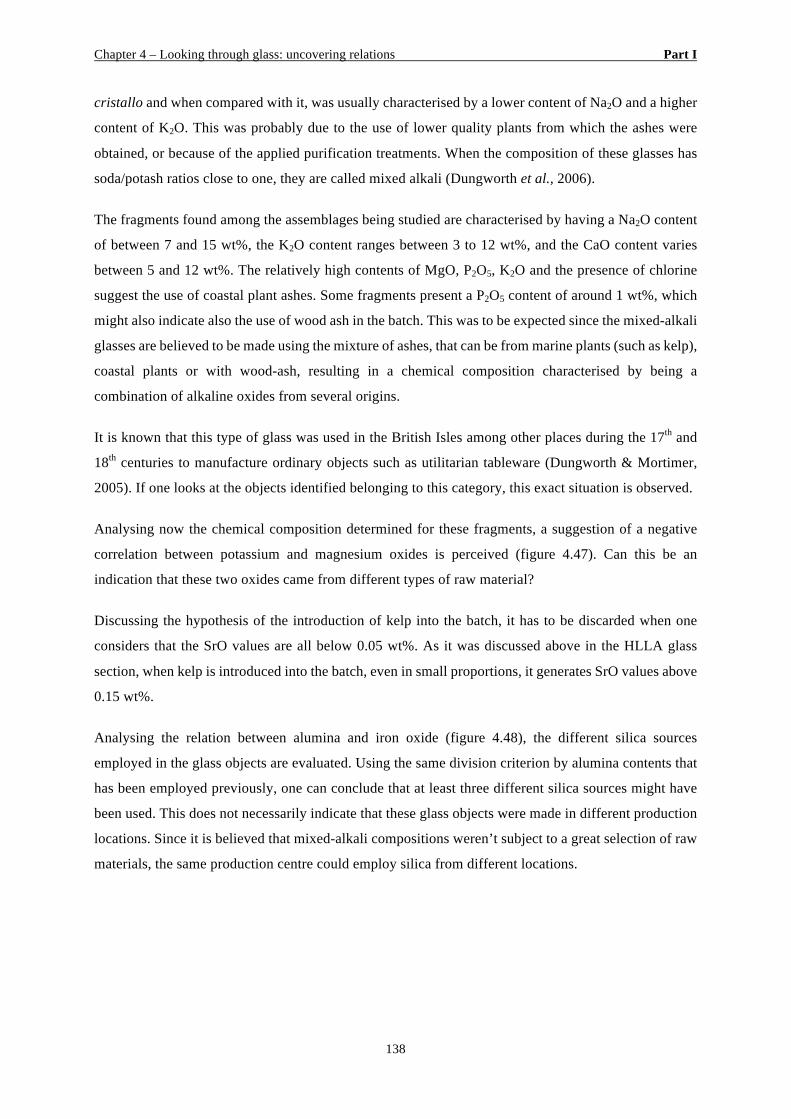
Chapter 4 – Looking through glass: uncovering relations Part I
138
cristallo and when compared with it, was usually characterised by a lower content of Na2O and a higher
content of K2O. This was probably due to the use of lower quality plants from which the ashes were
obtained, or because of the applied purification treatments. When the composition of these glasses has
soda/potash ratios close to one, they are called mixed alkali (Dungworth et al., 2006).
The fragments found among the assemblages being studied are characterised by having a Na2O content
of between 7 and 15 wt%, the K2O content ranges between 3 to 12 wt%, and the CaO content varies
between 5 and 12 wt%. The relatively high contents of MgO, P2O5, K2O and the presence of chlorine
suggest the use of coastal plant ashes. Some fragments present a P2O5 content of around 1 wt%, which
might also indicate also the use of wood ash in the batch. This was to be expected since the mixed-alkali
glasses are believed to be made using the mixture of ashes, that can be from marine plants (such as kelp),
coastal plants or with wood-ash, resulting in a chemical composition characterised by being a
combination of alkaline oxides from several origins.
It is known that this type of glass was used in the British Isles among other places during the 17th and
18th centuries to manufacture ordinary objects such as utilitarian tableware (Dungworth & Mortimer,
2005). If one looks at the objects identified belonging to this category, this exact situation is observed.
Analysing now the chemical composition determined for these fragments, a suggestion of a negative
correlation between potassium and magnesium oxides is perceived (figure 4.47). Can this be an
indication that these two oxides came from different types of raw material?
Discussing the hypothesis of the introduction of kelp into the batch, it has to be discarded when one
considers that the SrO values are all below 0.05 wt%. As it was discussed above in the HLLA glass
section, when kelp is introduced into the batch, even in small proportions, it generates SrO values above
0.15 wt%.
Analysing the relation between alumina and iron oxide (figure 4.48), the different silica sources
employed in the glass objects are evaluated. Using the same division criterion by alumina contents that
has been employed previously, one can conclude that at least three different silica sources might have
been used. This does not necessarily indicate that these glass objects were made in different production
locations. Since it is believed that mixed-alkali compositions weren’t subject to a great selection of raw
materials, the same production centre could employ silica from different locations.
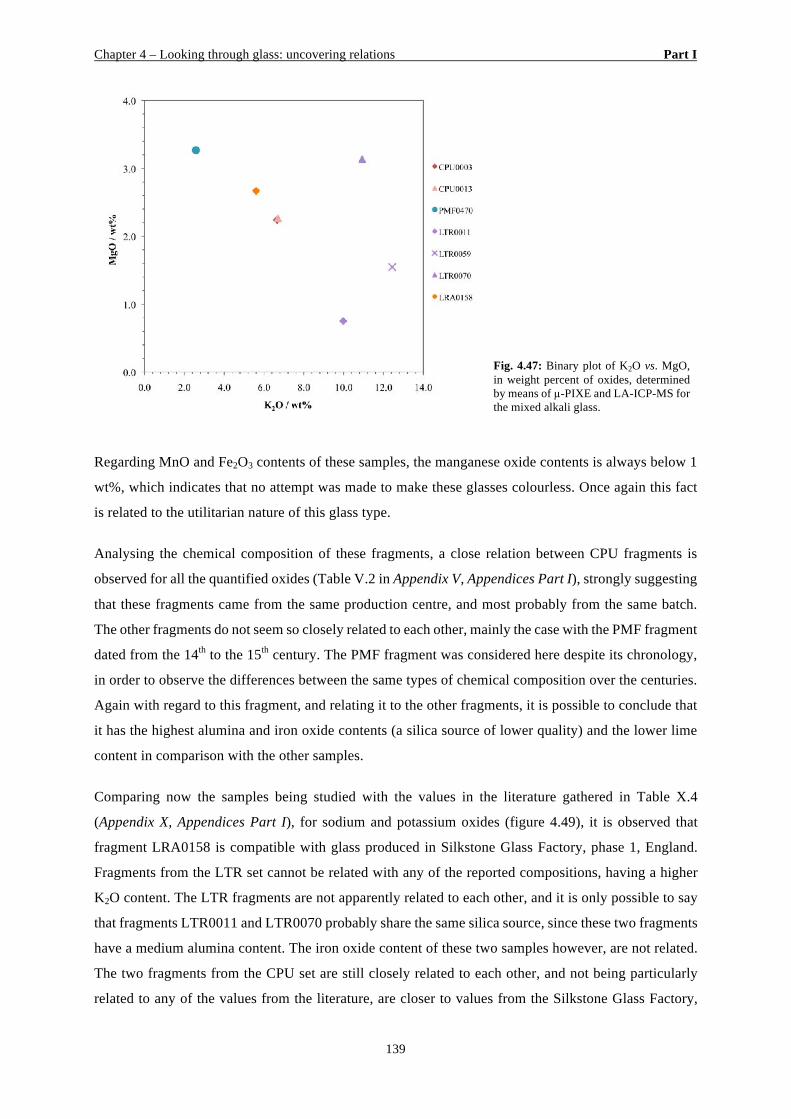
Chapter 4 – Looking through glass: uncovering relations Part I
139
Fig. 4.47: Binary plot of K2O vs. MgO, in weight percent of oxides, determined by means of µ-PIXE and LA-ICP-MS for the mixed alkali glass.
Regarding MnO and Fe2O3 contents of these samples, the manganese oxide contents is always below 1
wt%, which indicates that no attempt was made to make these glasses colourless. Once again this fact
is related to the utilitarian nature of this glass type.
Analysing the chemical composition of these fragments, a close relation between CPU fragments is
observed for all the quantified oxides (Table V.2 in Appendix V, Appendices Part I), strongly suggesting
that these fragments came from the same production centre, and most probably from the same batch.
The other fragments do not seem so closely related to each other, mainly the case with the PMF fragment
dated from the 14th to the 15th century. The PMF fragment was considered here despite its chronology,
in order to observe the differences between the same types of chemical composition over the centuries.
Again with regard to this fragment, and relating it to the other fragments, it is possible to conclude that
it has the highest alumina and iron oxide contents (a silica source of lower quality) and the lower lime
content in comparison with the other samples.
Comparing now the samples being studied with the values in the literature gathered in Table X.4
(Appendix X, Appendices Part I), for sodium and potassium oxides (figure 4.49), it is observed that
fragment LRA0158 is compatible with glass produced in Silkstone Glass Factory, phase 1, England.
Fragments from the LTR set cannot be related with any of the reported compositions, having a higher
K2O content. The LTR fragments are not apparently related to each other, and it is only possible to say
that fragments LTR0011 and LTR0070 probably share the same silica source, since these two fragments
have a medium alumina content. The iron oxide content of these two samples however, are not related.
The two fragments from the CPU set are still closely related to each other, and not being particularly
related to any of the values from the literature, are closer to values from the Silkstone Glass Factory,
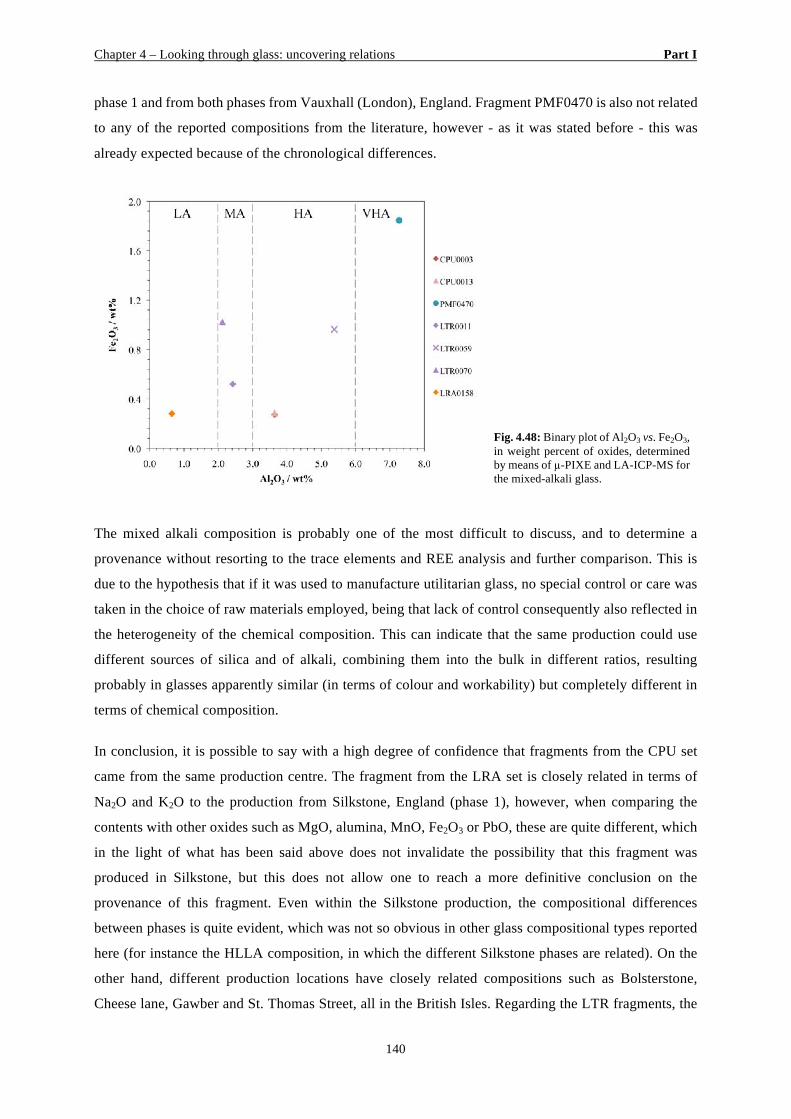
Chapter 4 – Looking through glass: uncovering relations Part I
140
phase 1 and from both phases from Vauxhall (London), England. Fragment PMF0470 is also not related
to any of the reported compositions from the literature, however - as it was stated before - this was
already expected because of the chronological differences.
Fig. 4.48: Binary plot of Al2O3 vs. Fe2O3, in weight percent of oxides, determined by means of µ-PIXE and LA-ICP-MS for the mixed-alkali glass.
The mixed alkali composition is probably one of the most difficult to discuss, and to determine a
provenance without resorting to the trace elements and REE analysis and further comparison. This is
due to the hypothesis that if it was used to manufacture utilitarian glass, no special control or care was
taken in the choice of raw materials employed, being that lack of control consequently also reflected in
the heterogeneity of the chemical composition. This can indicate that the same production could use
different sources of silica and of alkali, combining them into the bulk in different ratios, resulting
probably in glasses apparently similar (in terms of colour and workability) but completely different in
terms of chemical composition.
In conclusion, it is possible to say with a high degree of confidence that fragments from the CPU set
came from the same production centre. The fragment from the LRA set is closely related in terms of
Na2O and K2O to the production from Silkstone, England (phase 1), however, when comparing the
contents with other oxides such as MgO, alumina, MnO, Fe2O3 or PbO, these are quite different, which
in the light of what has been said above does not invalidate the possibility that this fragment was
produced in Silkstone, but this does not allow one to reach a more definitive conclusion on the
provenance of this fragment. Even within the Silkstone production, the compositional differences
between phases is quite evident, which was not so obvious in other glass compositional types reported
here (for instance the HLLA composition, in which the different Silkstone phases are related). On the
other hand, different production locations have closely related compositions such as Bolsterstone,
Cheese lane, Gawber and St. Thomas Street, all in the British Isles. Regarding the LTR fragments, the
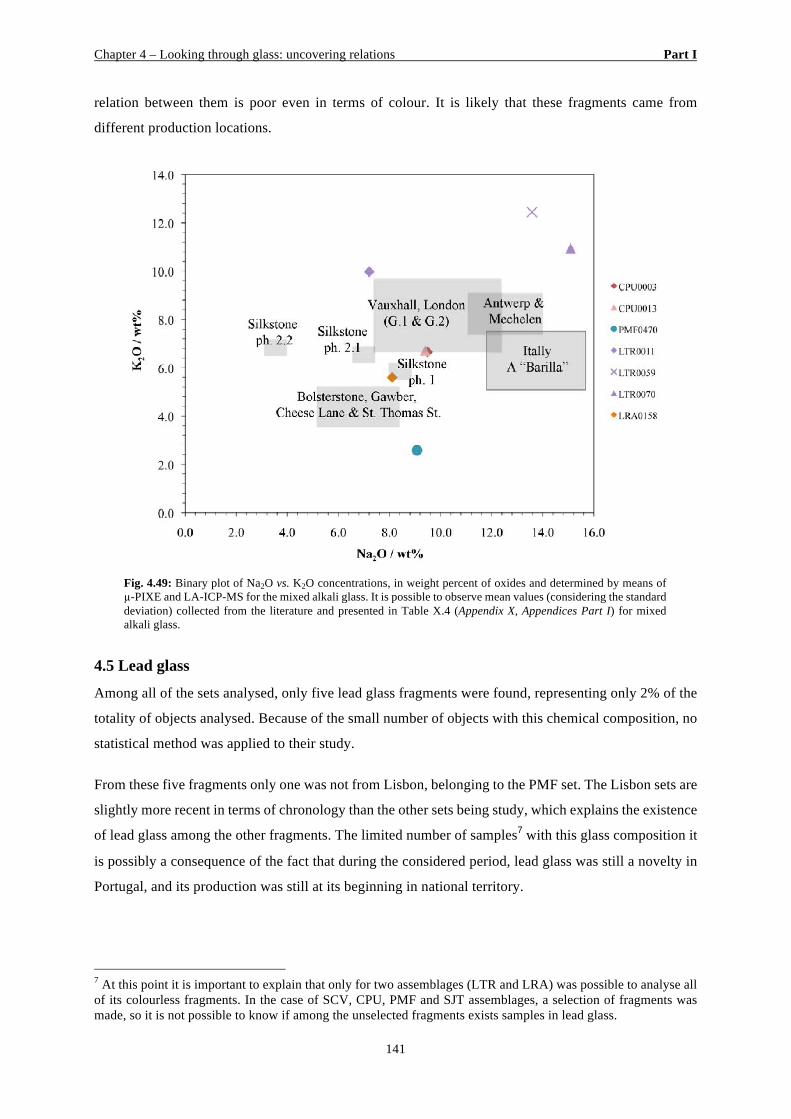
Chapter 4 – Looking through glass: uncovering relations Part I
141
relation between them is poor even in terms of colour. It is likely that these fragments came from
different production locations.
4.5 Lead glass
Among all of the sets analysed, only five lead glass fragments were found, representing only 2% of the
totality of objects analysed. Because of the small number of objects with this chemical composition, no
statistical method was applied to their study.
From these five fragments only one was not from Lisbon, belonging to the PMF set. The Lisbon sets are
slightly more recent in terms of chronology than the other sets being study, which explains the existence
of lead glass among the other fragments. The limited number of samples7 with this glass composition it
is possibly a consequence of the fact that during the considered period, lead glass was still a novelty in
Portugal, and its production was still at its beginning in national territory.
7 At this point it is important to explain that only for two assemblages (LTR and LRA) was possible to analyse all of its colourless fragments. In the case of SCV, CPU, PMF and SJT assemblages, a selection of fragments was made, so it is not possible to know if among the unselected fragments exists samples in lead glass.
Fig. 4.49: Binary plot of Na2O vs. K2O concentrations, in weight percent of oxides and determined by means of µ-PIXE and LA-ICP-MS for the mixed alkali glass. It is possible to observe mean values (considering the standard deviation) collected from the literature and presented in Table X.4 (Appendix X, Appendices Part I) for mixed alkali glass.
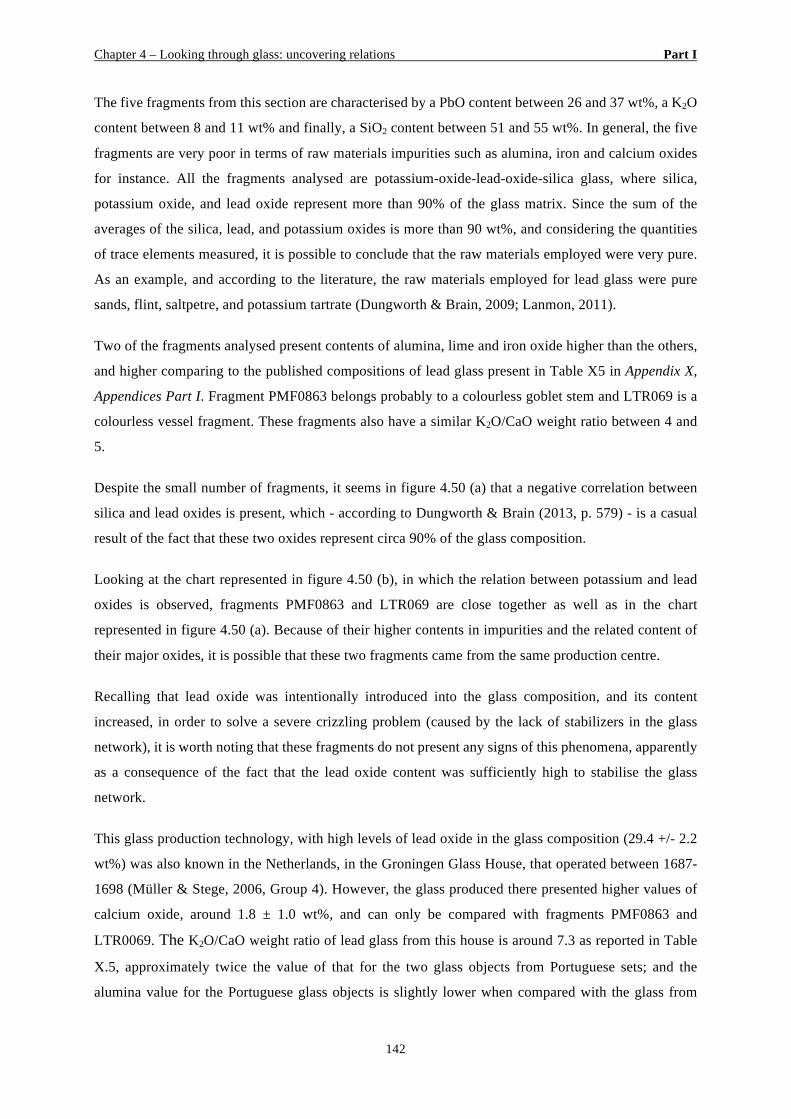
Chapter 4 – Looking through glass: uncovering relations Part I
142
The five fragments from this section are characterised by a PbO content between 26 and 37 wt%, a K2O
content between 8 and 11 wt% and finally, a SiO2 content between 51 and 55 wt%. In general, the five
fragments are very poor in terms of raw materials impurities such as alumina, iron and calcium oxides
for instance. All the fragments analysed are potassium-oxide-lead-oxide-silica glass, where silica,
potassium oxide, and lead oxide represent more than 90% of the glass matrix. Since the sum of the
averages of the silica, lead, and potassium oxides is more than 90 wt%, and considering the quantities
of trace elements measured, it is possible to conclude that the raw materials employed were very pure.
As an example, and according to the literature, the raw materials employed for lead glass were pure
sands, flint, saltpetre, and potassium tartrate (Dungworth & Brain, 2009; Lanmon, 2011).
Two of the fragments analysed present contents of alumina, lime and iron oxide higher than the others,
and higher comparing to the published compositions of lead glass present in Table X5 in Appendix X,
Appendices Part I. Fragment PMF0863 belongs probably to a colourless goblet stem and LTR069 is a
colourless vessel fragment. These fragments also have a similar K2O/CaO weight ratio between 4 and
5.
Despite the small number of fragments, it seems in figure 4.50 (a) that a negative correlation between
silica and lead oxides is present, which - according to Dungworth & Brain (2013, p. 579) - is a casual
result of the fact that these two oxides represent circa 90% of the glass composition.
Looking at the chart represented in figure 4.50 (b), in which the relation between potassium and lead
oxides is observed, fragments PMF0863 and LTR069 are close together as well as in the chart
represented in figure 4.50 (a). Because of their higher contents in impurities and the related content of
their major oxides, it is possible that these two fragments came from the same production centre.
Recalling that lead oxide was intentionally introduced into the glass composition, and its content
increased, in order to solve a severe crizzling problem (caused by the lack of stabilizers in the glass
network), it is worth noting that these fragments do not present any signs of this phenomena, apparently
as a consequence of the fact that the lead oxide content was sufficiently high to stabilise the glass
network.
This glass production technology, with high levels of lead oxide in the glass composition (29.4 +/- 2.2
wt%) was also known in the Netherlands, in the Groningen Glass House, that operated between 1687-
1698 (Müller & Stege, 2006, Group 4). However, the glass produced there presented higher values of
calcium oxide, around 1.8 ± 1.0 wt%, and can only be compared with fragments PMF0863 and
LTR0069. The K2O/CaO weight ratio of lead glass from this house is around 7.3 as reported in Table
X.5, approximately twice the value of that for the two glass objects from Portuguese sets; and the
alumina value for the Portuguese glass objects is slightly lower when compared with the glass from
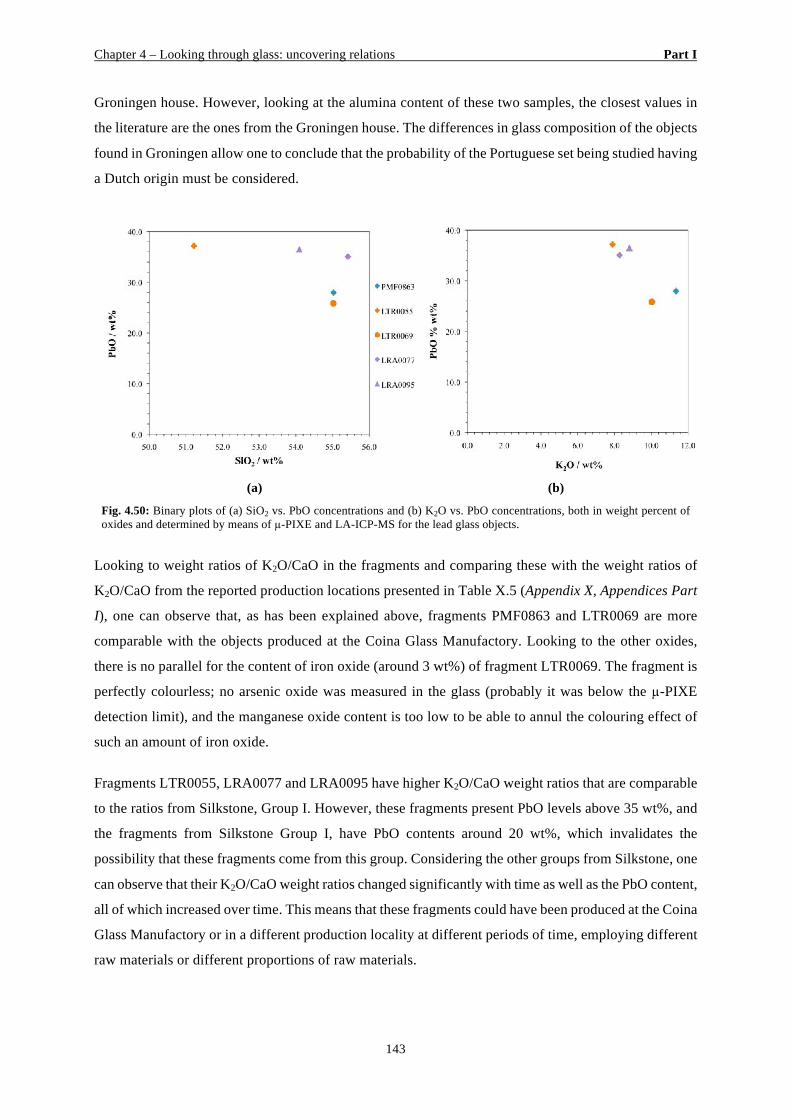
Chapter 4 – Looking through glass: uncovering relations Part I
143
Groningen house. However, looking at the alumina content of these two samples, the closest values in
the literature are the ones from the Groningen house. The differences in glass composition of the objects
found in Groningen allow one to conclude that the probability of the Portuguese set being studied having
a Dutch origin must be considered.
(a) (b)
Fig. 4.50: Binary plots of (a) SiO2 vs. PbO concentrations and (b) K2O vs. PbO concentrations, both in weight percent of oxides and determined by means of µ-PIXE and LA-ICP-MS for the lead glass objects.
Looking to weight ratios of K2O/CaO in the fragments and comparing these with the weight ratios of
K2O/CaO from the reported production locations presented in Table X.5 (Appendix X, Appendices Part
I), one can observe that, as has been explained above, fragments PMF0863 and LTR0069 are more
comparable with the objects produced at the Coina Glass Manufactory. Looking to the other oxides,
there is no parallel for the content of iron oxide (around 3 wt%) of fragment LTR0069. The fragment is
perfectly colourless; no arsenic oxide was measured in the glass (probably it was below the µ-PIXE
detection limit), and the manganese oxide content is too low to be able to annul the colouring effect of
such an amount of iron oxide.
Fragments LTR0055, LRA0077 and LRA0095 have higher K2O/CaO weight ratios that are comparable
to the ratios from Silkstone, Group I. However, these fragments present PbO levels above 35 wt%, and
the fragments from Silkstone Group I, have PbO contents around 20 wt%, which invalidates the
possibility that these fragments come from this group. Considering the other groups from Silkstone, one
can observe that their K2O/CaO weight ratios changed significantly with time as well as the PbO content,
all of which increased over time. This means that these fragments could have been produced at the Coina
Glass Manufactory or in a different production locality at different periods of time, employing different
raw materials or different proportions of raw materials.
Chapter 4 – Looking through glass: uncovering relations Part I
144
Analysing figure 4.51, in which the potassium oxide values were plotted against the lime values reported
in the literature presented in Table X.5 (Appendix X, Appendices Part I), and from the fragments being
studied here, it is observed that fragments PMF0863 and LTR0069 are close to the composition of lead
glass retrieved from the Groningen Glasshouse in The Netherlands. Nevertheless, as has been stated
before, the alumina content is lower for these fragments than that found in Groningen glass. The
compositional resemblance between Groningen glass and these two fragments cannot be ignored. These
fragments where retrieved from two different archaeological sites with different geographical locations.
Two hypotheses can be raised: these fragments were brought to Portugal from The Netherlands, or
glassworkers from The Netherlands were working in certain Portuguese furnaces, producing lead glass
with their recipes. It is known that from the 15th/16th centuries onwards, several glassworkers of different
nationalities began working in Portugal, and brought with them the glass recipes that they traditionally
used in their home countries, which makes this premise plausible. Looking to more recent production,
the Coina Glass Manufactory employed English glassmakers, and was under the English and Irish
administration (Custódio, 2002, p. 101).
Fig. 4.51: Binary plot of K2O vs. CaO concentrations, in weight percent of oxides and determined by means of µ-PIXE and LA-ICP-MS for the lead glass. Mean values (considering the standard deviation) collected from the literature and presented in Table X.5 (Appendix X, Appendices Part I) for lead glass are represented.
The remaining fragments LTR0055, LRA0077 and LRA0095 can only be related with glass from
Silkstone group II and IIa. These three fragments, however, present a higher lead oxide content than the
glass from these Silkstone groups. The same hypotheses considered for the previous situation has to be
considered here too.
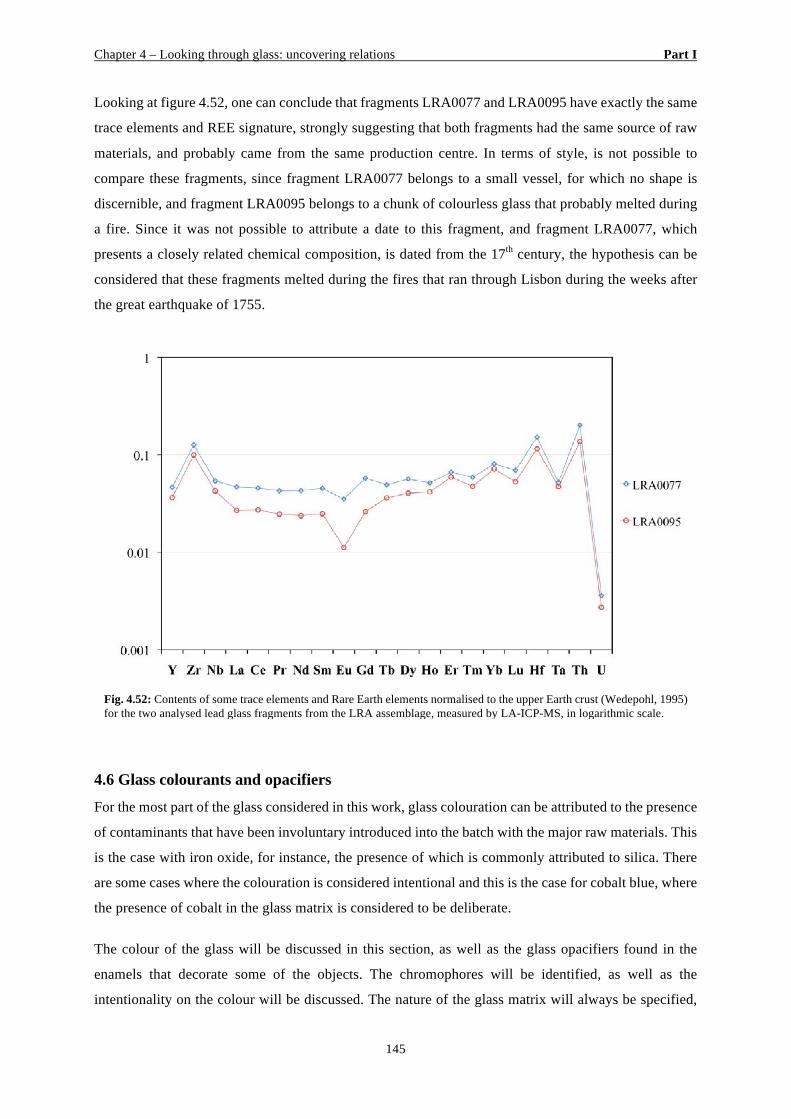
Chapter 4 – Looking through glass: uncovering relations Part I
145
Looking at figure 4.52, one can conclude that fragments LRA0077 and LRA0095 have exactly the same
trace elements and REE signature, strongly suggesting that both fragments had the same source of raw
materials, and probably came from the same production centre. In terms of style, is not possible to
compare these fragments, since fragment LRA0077 belongs to a small vessel, for which no shape is
discernible, and fragment LRA0095 belongs to a chunk of colourless glass that probably melted during
a fire. Since it was not possible to attribute a date to this fragment, and fragment LRA0077, which
presents a closely related chemical composition, is dated from the 17th century, the hypothesis can be
considered that these fragments melted during the fires that ran through Lisbon during the weeks after
the great earthquake of 1755.
Fig. 4.52: Contents of some trace elements and Rare Earth elements normalised to the upper Earth crust (Wedepohl, 1995) for the two analysed lead glass fragments from the LRA assemblage, measured by LA-ICP-MS, in logarithmic scale.
4.6 Glass colourants and opacifiers
For the most part of the glass considered in this work, glass colouration can be attributed to the presence
of contaminants that have been involuntary introduced into the batch with the major raw materials. This
is the case with iron oxide, for instance, the presence of which is commonly attributed to silica. There
are some cases where the colouration is considered intentional and this is the case for cobalt blue, where
the presence of cobalt in the glass matrix is considered to be deliberate.
The colour of the glass will be discussed in this section, as well as the glass opacifiers found in the
enamels that decorate some of the objects. The chromophores will be identified, as well as the
intentionality on the colour will be discussed. The nature of the glass matrix will always be specified,
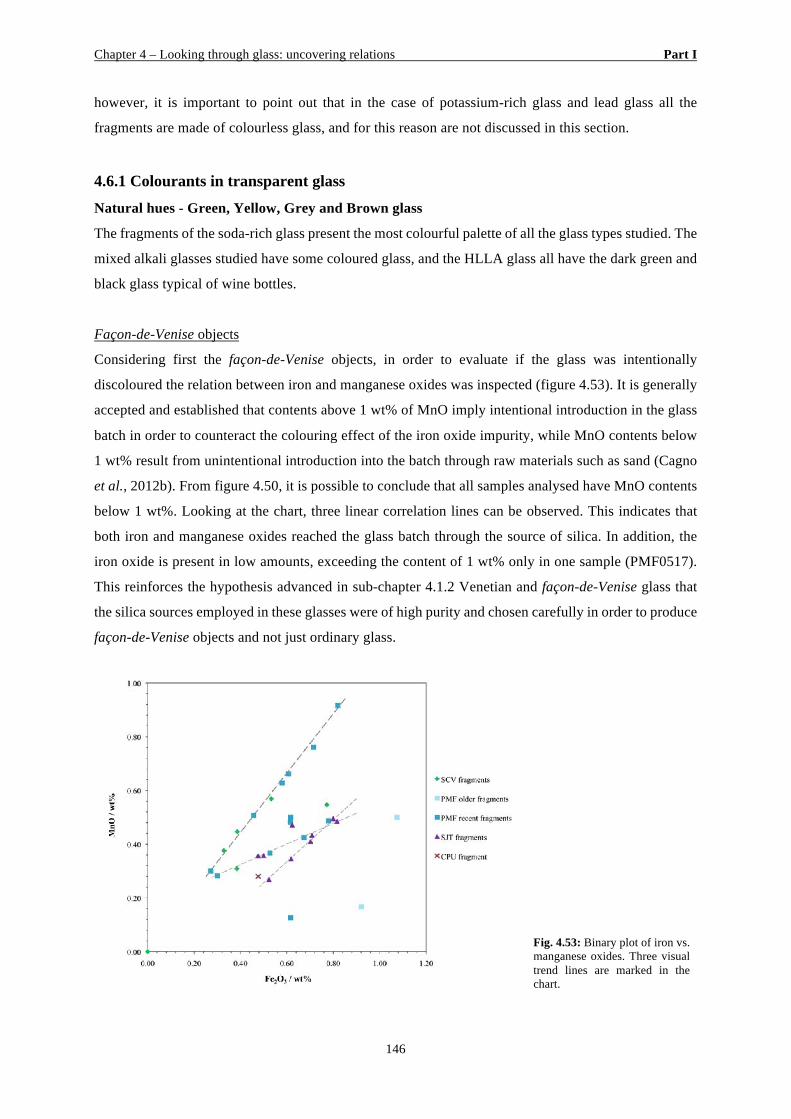
Chapter 4 – Looking through glass: uncovering relations Part I
146
however, it is important to point out that in the case of potassium-rich glass and lead glass all the
fragments are made of colourless glass, and for this reason are not discussed in this section.
4.6.1 Colourants in transparent glass
Natural hues - Green, Yellow, Grey and Brown glass
The fragments of the soda-rich glass present the most colourful palette of all the glass types studied. The
mixed alkali glasses studied have some coloured glass, and the HLLA glass all have the dark green and
black glass typical of wine bottles.
Façon-de-Venise objects
Considering first the façon-de-Venise objects, in order to evaluate if the glass was intentionally
discoloured the relation between iron and manganese oxides was inspected (figure 4.53). It is generally
accepted and established that contents above 1 wt% of MnO imply intentional introduction in the glass
batch in order to counteract the colouring effect of the iron oxide impurity, while MnO contents below
1 wt% result from unintentional introduction into the batch through raw materials such as sand (Cagno
et al., 2012b). From figure 4.50, it is possible to conclude that all samples analysed have MnO contents
below 1 wt%. Looking at the chart, three linear correlation lines can be observed. This indicates that
both iron and manganese oxides reached the glass batch through the source of silica. In addition, the
iron oxide is present in low amounts, exceeding the content of 1 wt% only in one sample (PMF0517).
This reinforces the hypothesis advanced in sub-chapter 4.1.2 Venetian and façon-de-Venise glass that
the silica sources employed in these glasses were of high purity and chosen carefully in order to produce
façon-de-Venise objects and not just ordinary glass.
Fig. 4.53: Binary plot of iron vs. manganese oxides. Three visual trend lines are marked in the chart.
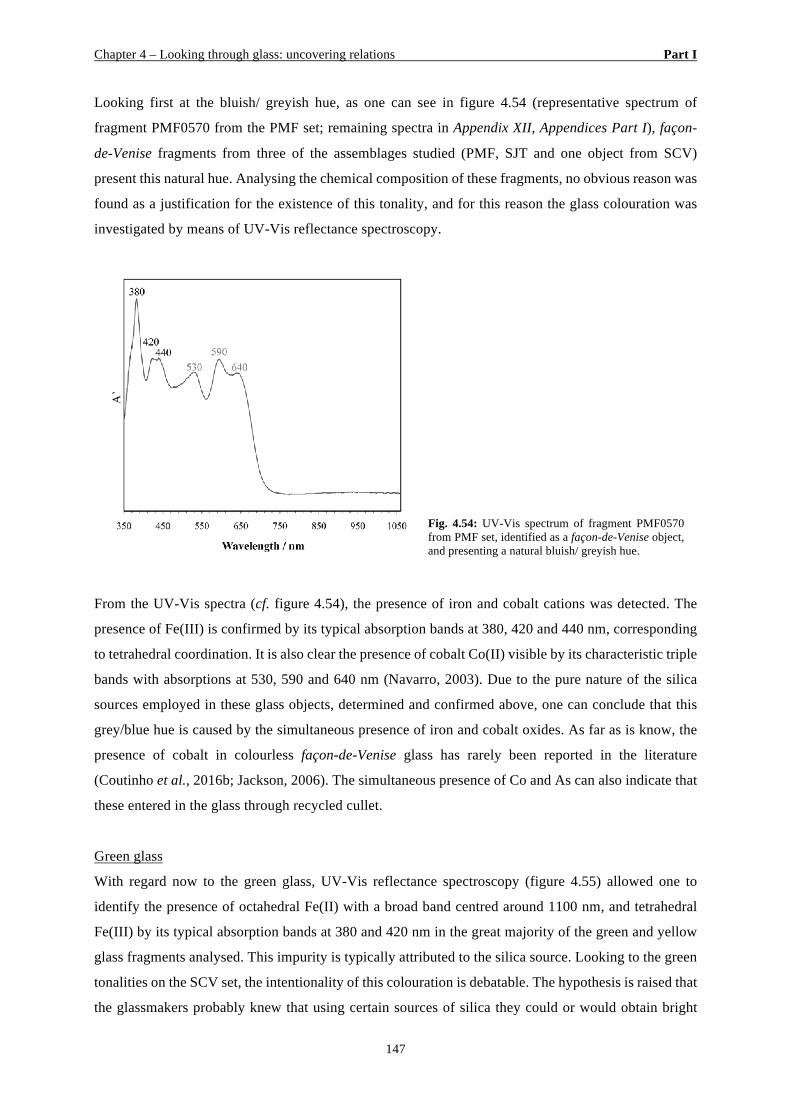
Chapter 4 – Looking through glass: uncovering relations Part I
147
Looking first at the bluish/ greyish hue, as one can see in figure 4.54 (representative spectrum of
fragment PMF0570 from the PMF set; remaining spectra in Appendix XII, Appendices Part I), façon-
de-Venise fragments from three of the assemblages studied (PMF, SJT and one object from SCV)
present this natural hue. Analysing the chemical composition of these fragments, no obvious reason was
found as a justification for the existence of this tonality, and for this reason the glass colouration was
investigated by means of UV-Vis reflectance spectroscopy.
Fig. 4.54: UV-Vis spectrum of fragment PMF0570 from PMF set, identified as a façon-de-Venise object, and presenting a natural bluish/ greyish hue.
From the UV-Vis spectra (cf. figure 4.54), the presence of iron and cobalt cations was detected. The
presence of Fe(III) is confirmed by its typical absorption bands at 380, 420 and 440 nm, corresponding
to tetrahedral coordination. It is also clear the presence of cobalt Co(II) visible by its characteristic triple
bands with absorptions at 530, 590 and 640 nm (Navarro, 2003). Due to the pure nature of the silica
sources employed in these glass objects, determined and confirmed above, one can conclude that this
grey/blue hue is caused by the simultaneous presence of iron and cobalt oxides. As far as is know, the
presence of cobalt in colourless façon-de-Venise glass has rarely been reported in the literature
(Coutinho et al., 2016b; Jackson, 2006). The simultaneous presence of Co and As can also indicate that
these entered in the glass through recycled cullet.
Green glass
With regard now to the green glass, UV-Vis reflectance spectroscopy (figure 4.55) allowed one to
identify the presence of octahedral Fe(II) with a broad band centred around 1100 nm, and tetrahedral
Fe(III) by its typical absorption bands at 380 and 420 nm in the great majority of the green and yellow
glass fragments analysed. This impurity is typically attributed to the silica source. Looking to the green
tonalities on the SCV set, the intentionality of this colouration is debatable. The hypothesis is raised that
the glassmakers probably knew that using certain sources of silica they could or would obtain bright
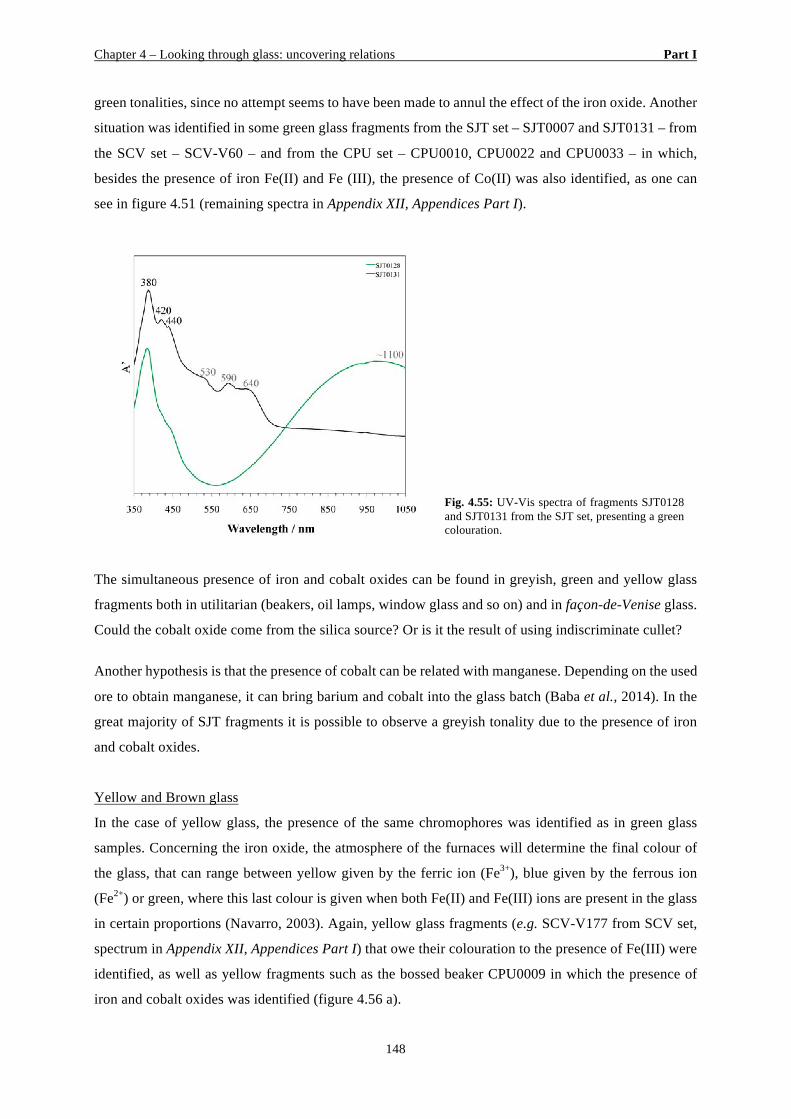
Chapter 4 – Looking through glass: uncovering relations Part I
148
green tonalities, since no attempt seems to have been made to annul the effect of the iron oxide. Another
situation was identified in some green glass fragments from the SJT set – SJT0007 and SJT0131 – from
the SCV set – SCV-V60 – and from the CPU set – CPU0010, CPU0022 and CPU0033 – in which,
besides the presence of iron Fe(II) and Fe (III), the presence of Co(II) was also identified, as one can
see in figure 4.51 (remaining spectra in Appendix XII, Appendices Part I).
Fig. 4.55: UV-Vis spectra of fragments SJT0128 and SJT0131 from the SJT set, presenting a green colouration.
The simultaneous presence of iron and cobalt oxides can be found in greyish, green and yellow glass
fragments both in utilitarian (beakers, oil lamps, window glass and so on) and in façon-de-Venise glass.
Could the cobalt oxide come from the silica source? Or is it the result of using indiscriminate cullet?
Another hypothesis is that the presence of cobalt can be related with manganese. Depending on the used
ore to obtain manganese, it can bring barium and cobalt into the glass batch (Baba et al., 2014). In the
great majority of SJT fragments it is possible to observe a greyish tonality due to the presence of iron
and cobalt oxides.
Yellow and Brown glass
In the case of yellow glass, the presence of the same chromophores was identified as in green glass
samples. Concerning the iron oxide, the atmosphere of the furnaces will determine the final colour of
the glass, that can range between yellow given by the ferric ion (Fe3+), blue given by the ferrous ion
(Fe2+) or green, where this last colour is given when both Fe(II) and Fe(III) ions are present in the glass
in certain proportions (Navarro, 2003). Again, yellow glass fragments (e.g. SCV-V177 from SCV set,
spectrum in Appendix XII, Appendices Part I) that owe their colouration to the presence of Fe(III) were
identified, as well as yellow fragments such as the bossed beaker CPU0009 in which the presence of
iron and cobalt oxides was identified (figure 4.56 a).
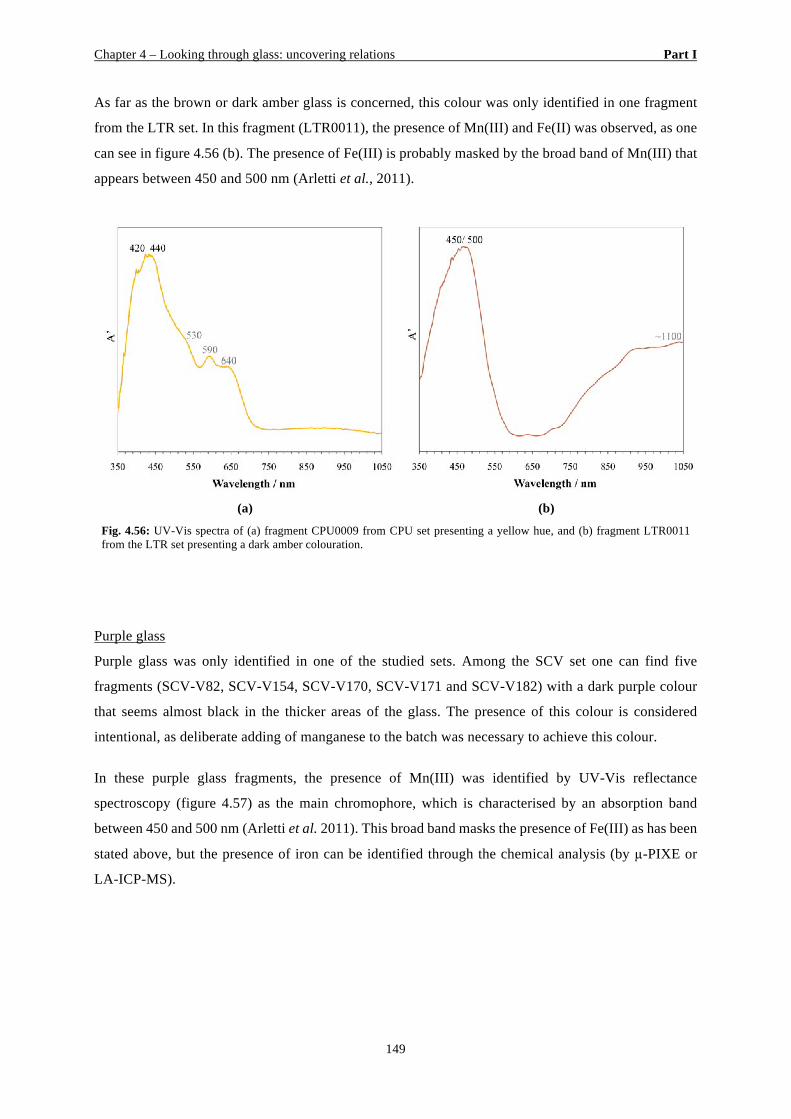
Chapter 4 – Looking through glass: uncovering relations Part I
149
As far as the brown or dark amber glass is concerned, this colour was only identified in one fragment
from the LTR set. In this fragment (LTR0011), the presence of Mn(III) and Fe(II) was observed, as one
can see in figure 4.56 (b). The presence of Fe(III) is probably masked by the broad band of Mn(III) that
appears between 450 and 500 nm (Arletti et al., 2011).
(a) (b)
Fig. 4.56: UV-Vis spectra of (a) fragment CPU0009 from CPU set presenting a yellow hue, and (b) fragment LTR0011 from the LTR set presenting a dark amber colouration.
Purple glass
Purple glass was only identified in one of the studied sets. Among the SCV set one can find five
fragments (SCV-V82, SCV-V154, SCV-V170, SCV-V171 and SCV-V182) with a dark purple colour
that seems almost black in the thicker areas of the glass. The presence of this colour is considered
intentional, as deliberate adding of manganese to the batch was necessary to achieve this colour.
In these purple glass fragments, the presence of Mn(III) was identified by UV-Vis reflectance
spectroscopy (figure 4.57) as the main chromophore, which is characterised by an absorption band
between 450 and 500 nm (Arletti et al. 2011). This broad band masks the presence of Fe(III) as has been
stated above, but the presence of iron can be identified through the chemical analysis (by µ-PIXE or
LA-ICP-MS).
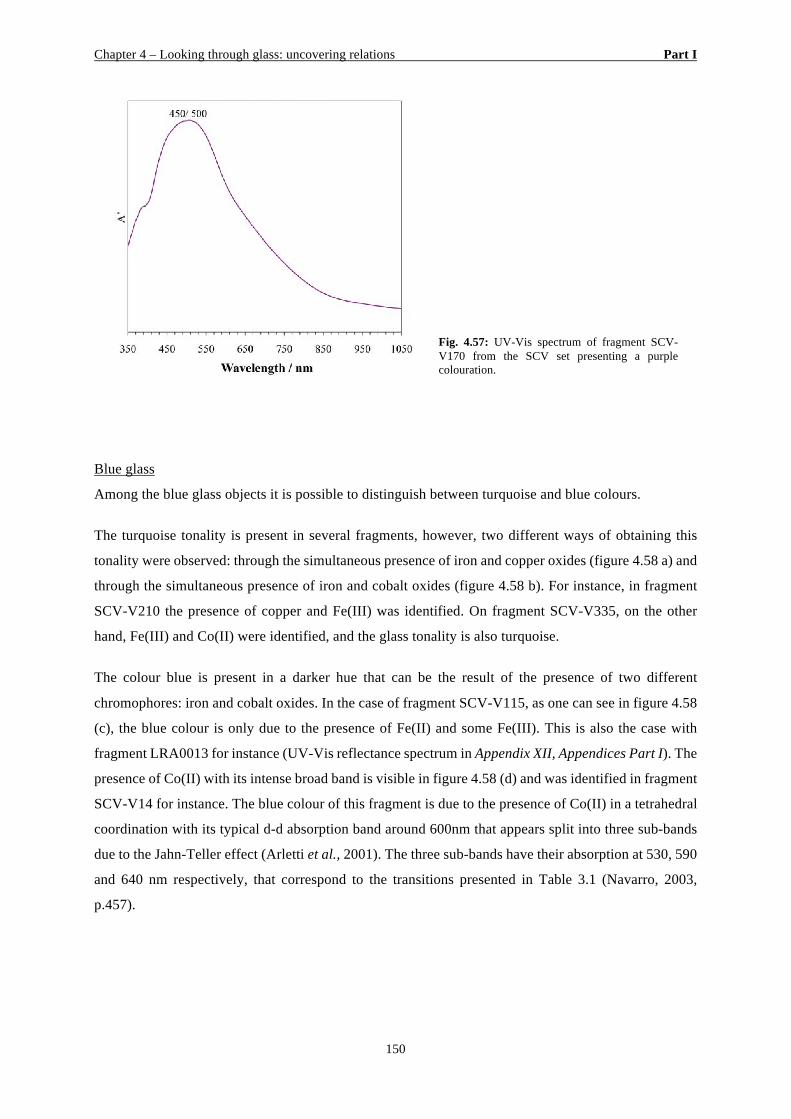
Chapter 4 – Looking through glass: uncovering relations Part I
150
Fig. 4.57: UV-Vis spectrum of fragment SCV-V170 from the SCV set presenting a purple colouration.
Blue glass
Among the blue glass objects it is possible to distinguish between turquoise and blue colours.
The turquoise tonality is present in several fragments, however, two different ways of obtaining this
tonality were observed: through the simultaneous presence of iron and copper oxides (figure 4.58 a) and
through the simultaneous presence of iron and cobalt oxides (figure 4.58 b). For instance, in fragment
SCV-V210 the presence of copper and Fe(III) was identified. On fragment SCV-V335, on the other
hand, Fe(III) and Co(II) were identified, and the glass tonality is also turquoise.
The colour blue is present in a darker hue that can be the result of the presence of two different
chromophores: iron and cobalt oxides. In the case of fragment SCV-V115, as one can see in figure 4.58
(c), the blue colour is only due to the presence of Fe(II) and some Fe(III). This is also the case with
fragment LRA0013 for instance (UV-Vis reflectance spectrum in Appendix XII, Appendices Part I). The
presence of Co(II) with its intense broad band is visible in figure 4.58 (d) and was identified in fragment
SCV-V14 for instance. The blue colour of this fragment is due to the presence of Co(II) in a tetrahedral
coordination with its typical d-d absorption band around 600nm that appears split into three sub-bands
due to the Jahn-Teller effect (Arletti et al., 2001). The three sub-bands have their absorption at 530, 590
and 640 nm respectively, that correspond to the transitions presented in Table 3.1 (Navarro, 2003,
p.457).
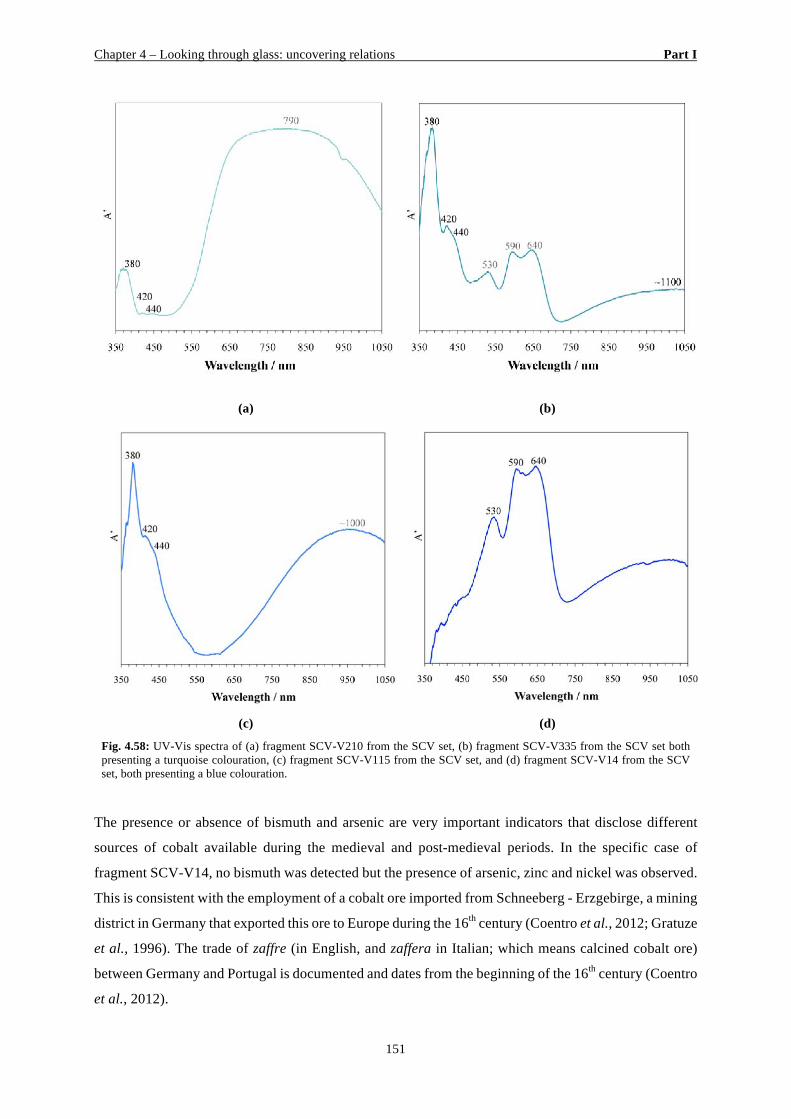
Chapter 4 – Looking through glass: uncovering relations Part I
151
(a) (b)
(c) (d)
Fig. 4.58: UV-Vis spectra of (a) fragment SCV-V210 from the SCV set, (b) fragment SCV-V335 from the SCV set both presenting a turquoise colouration, (c) fragment SCV-V115 from the SCV set, and (d) fragment SCV-V14 from the SCV set, both presenting a blue colouration.
The presence or absence of bismuth and arsenic are very important indicators that disclose different
sources of cobalt available during the medieval and post-medieval periods. In the specific case of
fragment SCV-V14, no bismuth was detected but the presence of arsenic, zinc and nickel was observed.
This is consistent with the employment of a cobalt ore imported from Schneeberg - Erzgebirge, a mining
district in Germany that exported this ore to Europe during the 16th century (Coentro et al., 2012; Gratuze
et al., 1996). The trade of zaffre (in English, and zaffera in Italian; which means calcined cobalt ore)
between Germany and Portugal is documented and dates from the beginning of the 16th century (Coentro
et al., 2012).
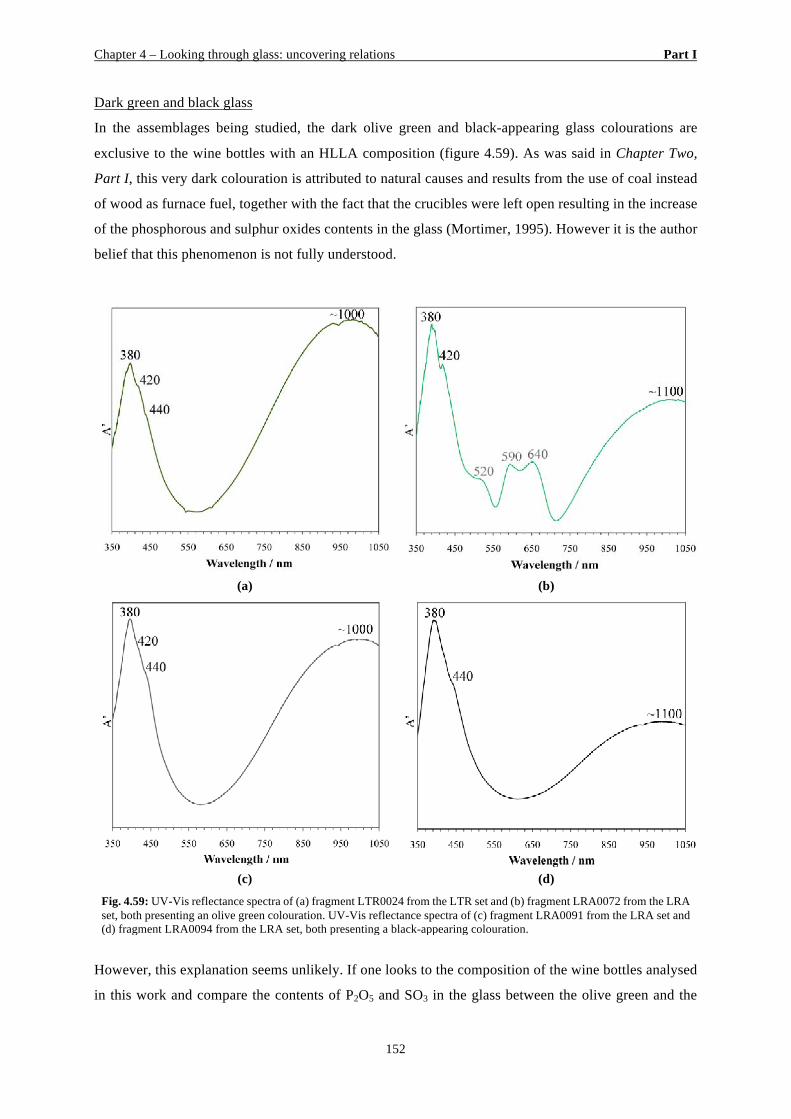
Chapter 4 – Looking through glass: uncovering relations Part I
152
Dark green and black glass
In the assemblages being studied, the dark olive green and black-appearing glass colourations are
exclusive to the wine bottles with an HLLA composition (figure 4.59). As was said in Chapter Two,
Part I, this very dark colouration is attributed to natural causes and results from the use of coal instead
of wood as furnace fuel, together with the fact that the crucibles were left open resulting in the increase
of the phosphorous and sulphur oxides contents in the glass (Mortimer, 1995). However it is the author
belief that this phenomenon is not fully understood.
(a) (b)
(c) (d)
Fig. 4.59: UV-Vis reflectance spectra of (a) fragment LTR0024 from the LTR set and (b) fragment LRA0072 from the LRA set, both presenting an olive green colouration. UV-Vis reflectance spectra of (c) fragment LRA0091 from the LRA set and (d) fragment LRA0094 from the LRA set, both presenting a black-appearing colouration.
However, this explanation seems unlikely. If one looks to the composition of the wine bottles analysed
in this work and compare the contents of P2O5 and SO3 in the glass between the olive green and the
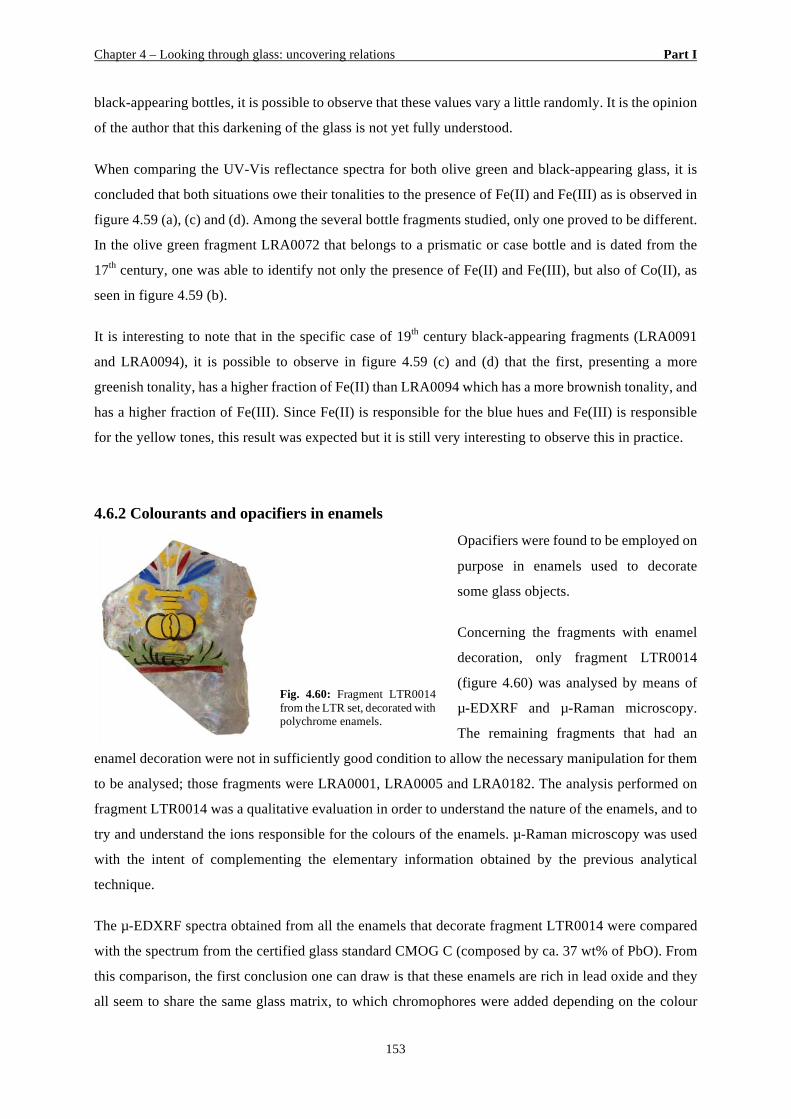
Chapter 4 – Looking through glass: uncovering relations Part I
153
black-appearing bottles, it is possible to observe that these values vary a little randomly. It is the opinion
of the author that this darkening of the glass is not yet fully understood.
When comparing the UV-Vis reflectance spectra for both olive green and black-appearing glass, it is
concluded that both situations owe their tonalities to the presence of Fe(II) and Fe(III) as is observed in
figure 4.59 (a), (c) and (d). Among the several bottle fragments studied, only one proved to be different.
In the olive green fragment LRA0072 that belongs to a prismatic or case bottle and is dated from the
17th century, one was able to identify not only the presence of Fe(II) and Fe(III), but also of Co(II), as
seen in figure 4.59 (b).
It is interesting to note that in the specific case of 19th century black-appearing fragments (LRA0091
and LRA0094), it is possible to observe in figure 4.59 (c) and (d) that the first, presenting a more
greenish tonality, has a higher fraction of Fe(II) than LRA0094 which has a more brownish tonality, and
has a higher fraction of Fe(III). Since Fe(II) is responsible for the blue hues and Fe(III) is responsible
for the yellow tones, this result was expected but it is still very interesting to observe this in practice.
4.6.2 Colourants and opacifiers in enamels
Opacifiers were found to be employed on
purpose in enamels used to decorate
some glass objects.
Concerning the fragments with enamel
decoration, only fragment LTR0014
(figure 4.60) was analysed by means of
µ-EDXRF and µ-Raman microscopy.
The remaining fragments that had an
enamel decoration were not in sufficiently good condition to allow the necessary manipulation for them
to be analysed; those fragments were LRA0001, LRA0005 and LRA0182. The analysis performed on
fragment LTR0014 was a qualitative evaluation in order to understand the nature of the enamels, and to
try and understand the ions responsible for the colours of the enamels. µ-Raman microscopy was used
with the intent of complementing the elementary information obtained by the previous analytical
technique.
The µ-EDXRF spectra obtained from all the enamels that decorate fragment LTR0014 were compared
with the spectrum from the certified glass standard CMOG C (composed by ca. 37 wt% of PbO). From
this comparison, the first conclusion one can draw is that these enamels are rich in lead oxide and they
all seem to share the same glass matrix, to which chromophores were added depending on the colour
Fig. 4.60: Fragment LTR0014 from the LTR set, decorated with polychrome enamels.
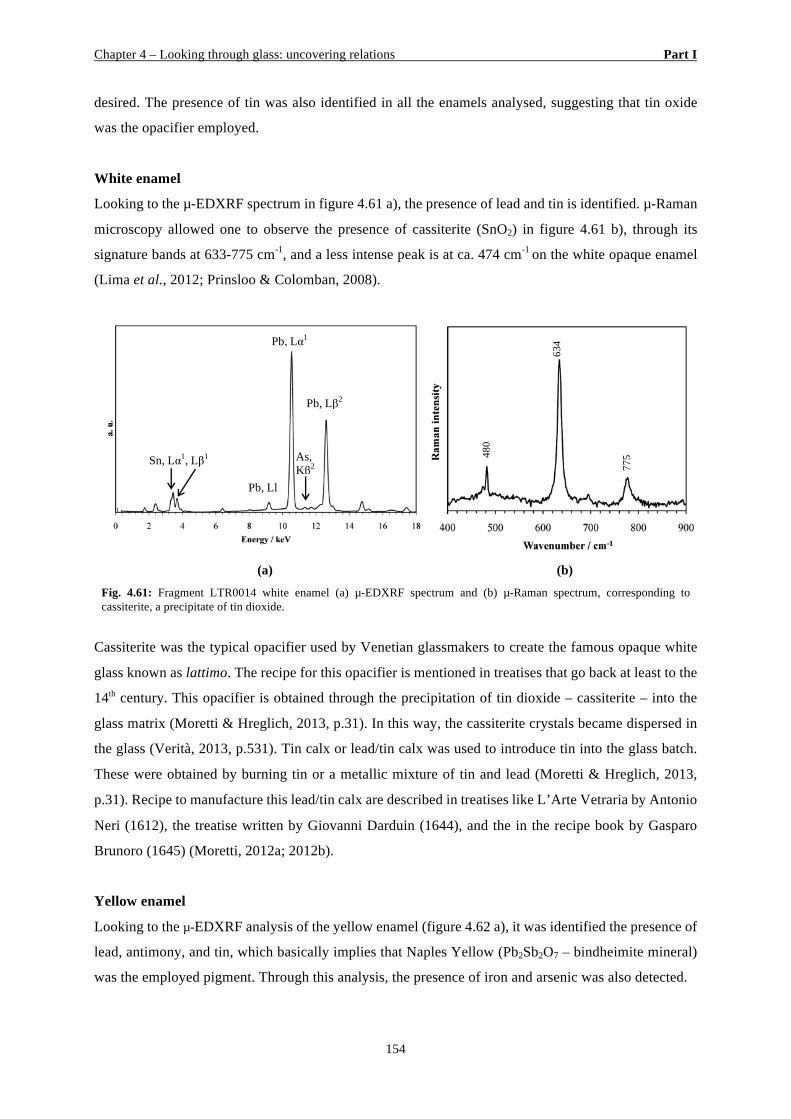
Chapter 4 – Looking through glass: uncovering relations Part I
154
desired. The presence of tin was also identified in all the enamels analysed, suggesting that tin oxide
was the opacifier employed.
White enamel
Looking to the µ-EDXRF spectrum in figure 4.61 a), the presence of lead and tin is identified. µ-Raman
microscopy allowed one to observe the presence of cassiterite (SnO2) in figure 4.61 b), through its
signature bands at 633-775 cm-1, and a less intense peak is at ca. 474 cm-1 on the white opaque enamel
(Lima et al., 2012; Prinsloo & Colomban, 2008).
(a) (b)
Fig. 4.61: Fragment LTR0014 white enamel (a) µ-EDXRF spectrum and (b) µ-Raman spectrum, corresponding to cassiterite, a precipitate of tin dioxide.
Cassiterite was the typical opacifier used by Venetian glassmakers to create the famous opaque white
glass known as lattimo. The recipe for this opacifier is mentioned in treatises that go back at least to the
14th century. This opacifier is obtained through the precipitation of tin dioxide – cassiterite – into the
glass matrix (Moretti & Hreglich, 2013, p.31). In this way, the cassiterite crystals became dispersed in
the glass (Verità, 2013, p.531). Tin calx or lead/tin calx was used to introduce tin into the glass batch.
These were obtained by burning tin or a metallic mixture of tin and lead (Moretti & Hreglich, 2013,
p.31). Recipe to manufacture this lead/tin calx are described in treatises like L’Arte Vetraria by Antonio
Neri (1612), the treatise written by Giovanni Darduin (1644), and the in the recipe book by Gasparo
Brunoro (1645) (Moretti, 2012a; 2012b).
Yellow enamel
Looking to the µ-EDXRF analysis of the yellow enamel (figure 4.62 a), it was identified the presence of
lead, antimony, and tin, which basically implies that Naples Yellow (Pb2Sb2O7 – bindheimite mineral)
was the employed pigment. Through this analysis, the presence of iron and arsenic was also detected.
Sn, Lα1, Lβ1 As, Kβ2
Pb, Ll
Pb, Lα1
Pb, Lβ2
480
634
775
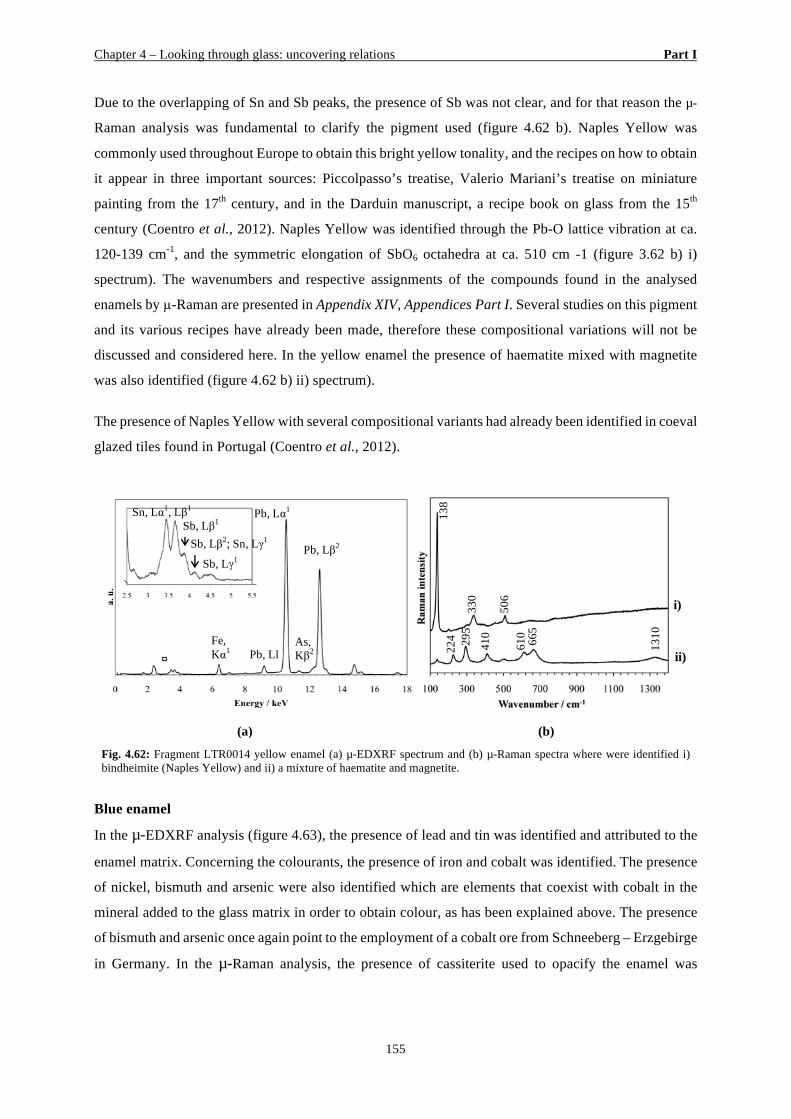
Chapter 4 – Looking through glass: uncovering relations Part I
155
Due to the overlapping of Sn and Sb peaks, the presence of Sb was not clear, and for that reason the µ-
Raman analysis was fundamental to clarify the pigment used (figure 4.62 b). Naples Yellow was
commonly used throughout Europe to obtain this bright yellow tonality, and the recipes on how to obtain
it appear in three important sources: Piccolpasso’s treatise, Valerio Mariani’s treatise on miniature
painting from the 17th century, and in the Darduin manuscript, a recipe book on glass from the 15th
century (Coentro et al., 2012). Naples Yellow was identified through the Pb-O lattice vibration at ca.
120-139 cm-1, and the symmetric elongation of SbO6 octahedra at ca. 510 cm -1 (figure 3.62 b) i)
spectrum). The wavenumbers and respective assignments of the compounds found in the analysed
enamels by µ-Raman are presented in Appendix XIV, Appendices Part I. Several studies on this pigment
and its various recipes have already been made, therefore these compositional variations will not be
discussed and considered here. In the yellow enamel the presence of haematite mixed with magnetite
was also identified (figure 4.62 b) ii) spectrum).
The presence of Naples Yellow with several compositional variants had already been identified in coeval
glazed tiles found in Portugal (Coentro et al., 2012).
(a) (b)
Fig. 4.62: Fragment LTR0014 yellow enamel (a) µ-EDXRF spectrum and (b) µ-Raman spectra where were identified i) bindheimite (Naples Yellow) and ii) a mixture of haematite and magnetite.
Blue enamel
In the µ-EDXRF analysis (figure 4.63), the presence of lead and tin was identified and attributed to the
enamel matrix. Concerning the colourants, the presence of iron and cobalt was identified. The presence
of nickel, bismuth and arsenic were also identified which are elements that coexist with cobalt in the
mineral added to the glass matrix in order to obtain colour, as has been explained above. The presence
of bismuth and arsenic once again point to the employment of a cobalt ore from Schneeberg – Erzgebirge
in Germany. In the µ-Raman analysis, the presence of cassiterite used to opacify the enamel was
Pb, Ll
Pb, Lα1
Pb, Lβ2
As, Kβ2
Fe, Kα1
Sn, Lα1, Lβ1 Sb, Lβ1
Sb, Lβ2; Sn, Lγ1 Sb, Lγ1
138
506
224 29
5
1310
665
330
410
610
i)
ii)
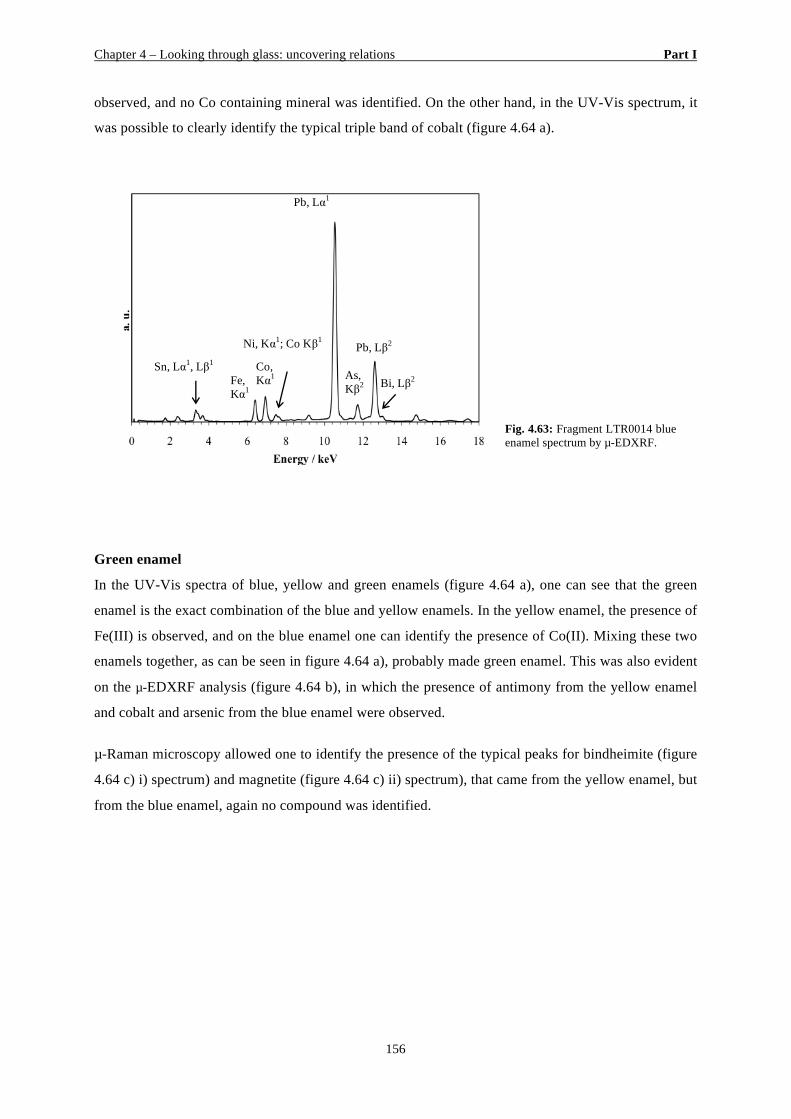
Chapter 4 – Looking through glass: uncovering relations Part I
156
observed, and no Co containing mineral was identified. On the other hand, in the UV-Vis spectrum, it
was possible to clearly identify the typical triple band of cobalt (figure 4.64 a).
Fig. 4.63: Fragment LTR0014 blue enamel spectrum by µ-EDXRF.
Green enamel
In the UV-Vis spectra of blue, yellow and green enamels (figure 4.64 a), one can see that the green
enamel is the exact combination of the blue and yellow enamels. In the yellow enamel, the presence of
Fe(III) is observed, and on the blue enamel one can identify the presence of Co(II). Mixing these two
enamels together, as can be seen in figure 4.64 a), probably made green enamel. This was also evident
on the µ-EDXRF analysis (figure 4.64 b), in which the presence of antimony from the yellow enamel
and cobalt and arsenic from the blue enamel were observed.
µ-Raman microscopy allowed one to identify the presence of the typical peaks for bindheimite (figure
4.64 c) i) spectrum) and magnetite (figure 4.64 c) ii) spectrum), that came from the yellow enamel, but
from the blue enamel, again no compound was identified.
Pb, Lα1
Pb, Lβ2
As, Kβ2
Fe, Kα1
Co, Kα1
Ni, Kα1; Co Kβ1
Sn, Lα1, Lβ1 Bi, Lβ2
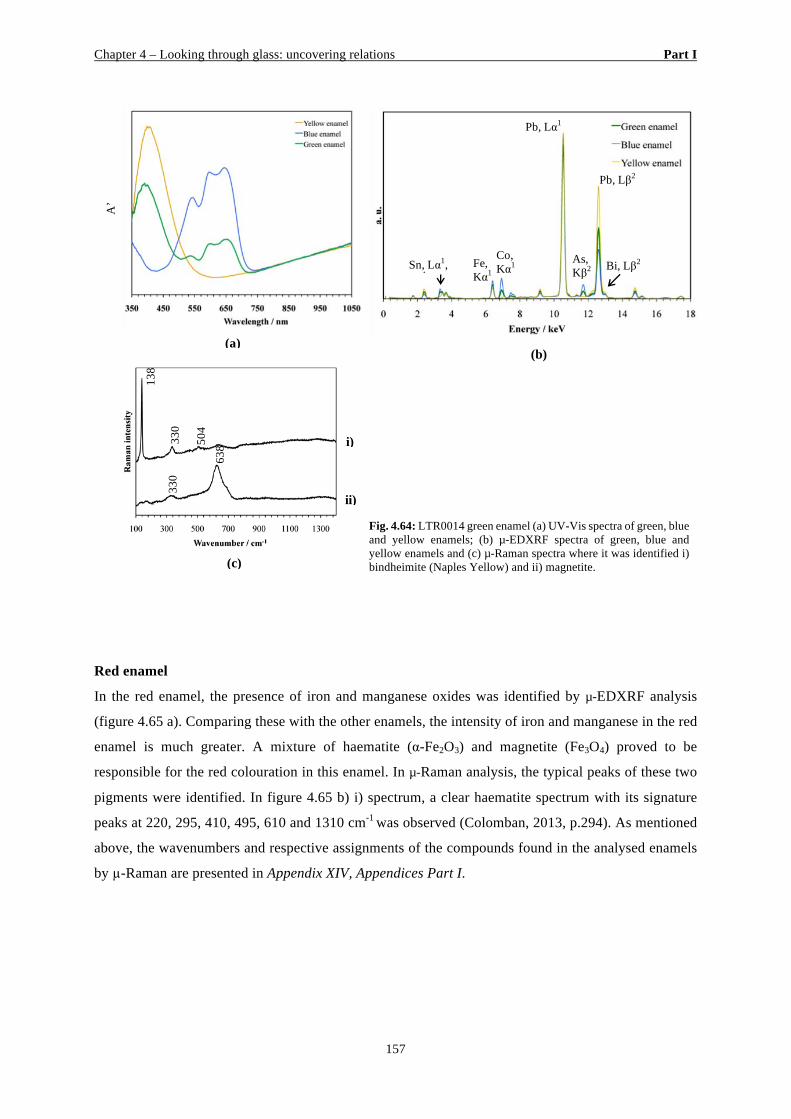
Chapter 4 – Looking through glass: uncovering relations Part I
157
Red enamel
In the red enamel, the presence of iron and manganese oxides was identified by µ-EDXRF analysis
(figure 4.65 a). Comparing these with the other enamels, the intensity of iron and manganese in the red
enamel is much greater. A mixture of haematite (α-Fe2O3) and magnetite (Fe3O4) proved to be
responsible for the red colouration in this enamel. In µ-Raman analysis, the typical peaks of these two
pigments were identified. In figure 4.65 b) i) spectrum, a clear haematite spectrum with its signature
peaks at 220, 295, 410, 495, 610 and 1310 cm-1 was observed (Colomban, 2013, p.294). As mentioned
above, the wavenumbers and respective assignments of the compounds found in the analysed enamels
by µ-Raman are presented in Appendix XIV, Appendices Part I.
Fig. 4.64: LTR0014 green enamel (a) UV-Vis spectra of green, blue and yellow enamels; (b) µ-EDXRF spectra of green, blue and yellow enamels and (c) µ-Raman spectra where it was identified i) bindheimite (Naples Yellow) and ii) magnetite.
(a)
(c)
638
330
504
330
138
i)
ii)
A’
(b)
Pb, Lα1
Pb, Lβ2
As, Kβ2
Sn, Lα1, Lβ1
Fe, Kα1
Co, Kα1 Bi, Lβ2
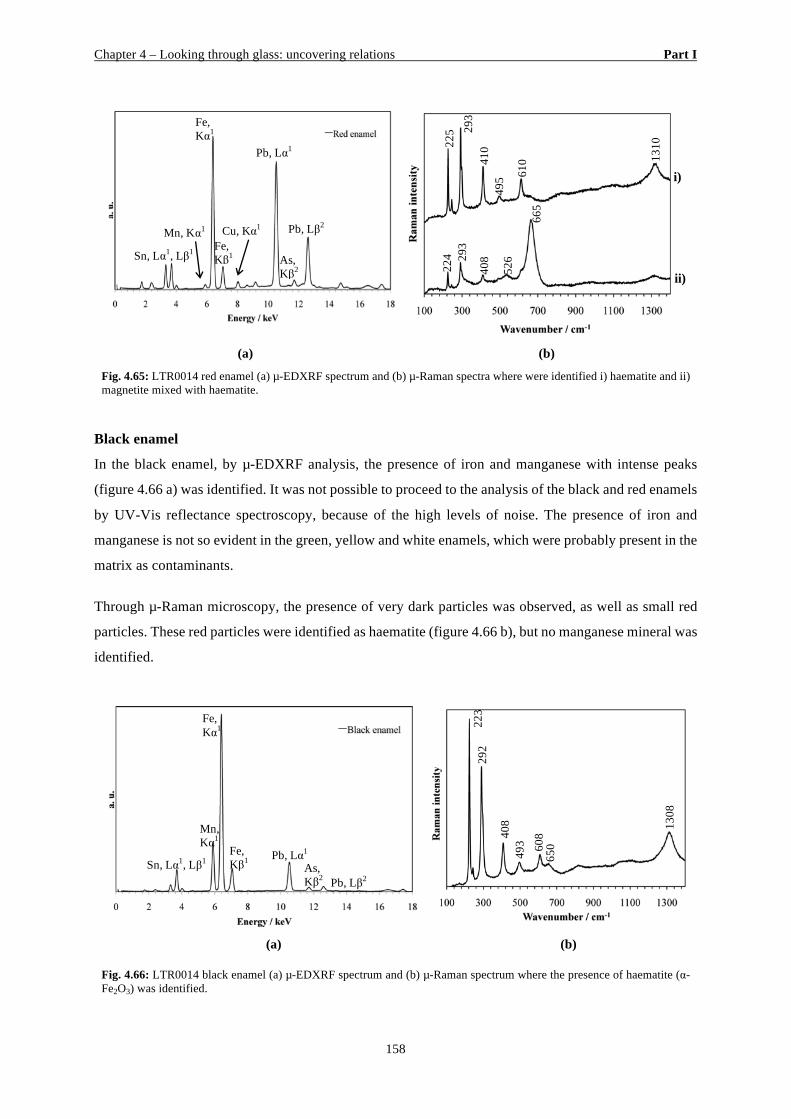
Chapter 4 – Looking through glass: uncovering relations Part I
158
(a) (b)
Fig. 4.65: LTR0014 red enamel (a) µ-EDXRF spectrum and (b) µ-Raman spectra where were identified i) haematite and ii) magnetite mixed with haematite.
Black enamel
In the black enamel, by µ-EDXRF analysis, the presence of iron and manganese with intense peaks
(figure 4.66 a) was identified. It was not possible to proceed to the analysis of the black and red enamels
by UV-Vis reflectance spectroscopy, because of the high levels of noise. The presence of iron and
manganese is not so evident in the green, yellow and white enamels, which were probably present in the
matrix as contaminants.
Through µ-Raman microscopy, the presence of very dark particles was observed, as well as small red
particles. These red particles were identified as haematite (figure 4.66 b), but no manganese mineral was
identified.
(a) (b)
Fig. 4.66: LTR0014 black enamel (a) µ-EDXRF spectrum and (b) µ-Raman spectrum where the presence of haematite (α-Fe2O3) was identified.
Pb, Lβ2
As, Kβ2
Fe, Kα1
Fe, Kβ1
Sn, Lα1, Lβ1
Cu, Kα1 Mn, Kα1
Pb, Lα1
i)
ii)
224
408 29
3
665
526
610 13
10
410
495
225 29
3
Pb, Lα1
Pb, Lβ2 As, Kβ2
Fe, Kα1
Mn, Kα1 Fe,
Kβ1
Sn, Lα1, Lβ1
292
223
493
408 13
08
650 60
8
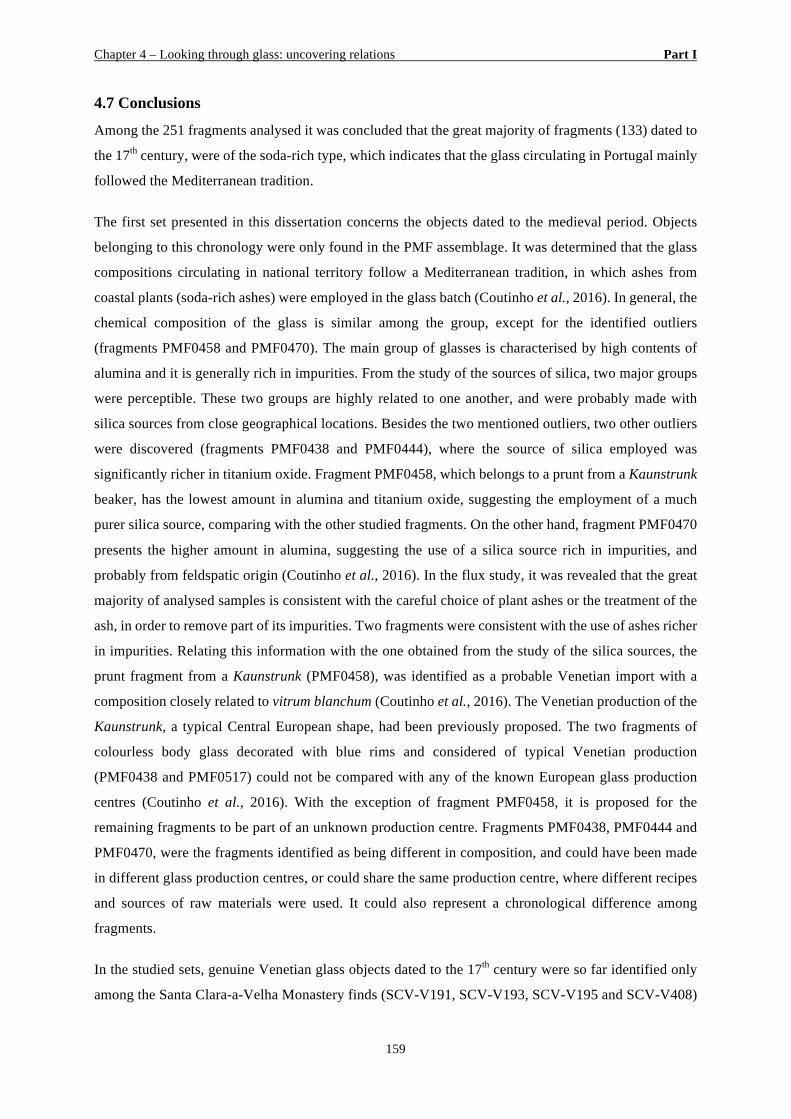
Chapter 4 – Looking through glass: uncovering relations Part I
159
4.7 Conclusions
Among the 251 fragments analysed it was concluded that the great majority of fragments (133) dated to
the 17th century, were of the soda-rich type, which indicates that the glass circulating in Portugal mainly
followed the Mediterranean tradition.
The first set presented in this dissertation concerns the objects dated to the medieval period. Objects
belonging to this chronology were only found in the PMF assemblage. It was determined that the glass
compositions circulating in national territory follow a Mediterranean tradition, in which ashes from
coastal plants (soda-rich ashes) were employed in the glass batch (Coutinho et al., 2016). In general, the
chemical composition of the glass is similar among the group, except for the identified outliers
(fragments PMF0458 and PMF0470). The main group of glasses is characterised by high contents of
alumina and it is generally rich in impurities. From the study of the sources of silica, two major groups
were perceptible. These two groups are highly related to one another, and were probably made with
silica sources from close geographical locations. Besides the two mentioned outliers, two other outliers
were discovered (fragments PMF0438 and PMF0444), where the source of silica employed was
significantly richer in titanium oxide. Fragment PMF0458, which belongs to a prunt from a Kaunstrunk
beaker, has the lowest amount in alumina and titanium oxide, suggesting the employment of a much
purer silica source, comparing with the other studied fragments. On the other hand, fragment PMF0470
presents the higher amount in alumina, suggesting the use of a silica source rich in impurities, and
probably from feldspatic origin (Coutinho et al., 2016). In the flux study, it was revealed that the great
majority of analysed samples is consistent with the careful choice of plant ashes or the treatment of the
ash, in order to remove part of its impurities. Two fragments were consistent with the use of ashes richer
in impurities. Relating this information with the one obtained from the study of the silica sources, the
prunt fragment from a Kaunstrunk (PMF0458), was identified as a probable Venetian import with a
composition closely related to vitrum blanchum (Coutinho et al., 2016). The Venetian production of the
Kaunstrunk, a typical Central European shape, had been previously proposed. The two fragments of
colourless body glass decorated with blue rims and considered of typical Venetian production
(PMF0438 and PMF0517) could not be compared with any of the known European glass production
centres (Coutinho et al., 2016). With the exception of fragment PMF0458, it is proposed for the
remaining fragments to be part of an unknown production centre. Fragments PMF0438, PMF0444 and
PMF0470, were the fragments identified as being different in composition, and could have been made
in different glass production centres, or could share the same production centre, where different recipes
and sources of raw materials were used. It could also represent a chronological difference among
fragments.
In the studied sets, genuine Venetian glass objects dated to the 17th century were so far identified only
among the Santa Clara-a-Velha Monastery finds (SCV-V191, SCV-V193, SCV-V195 and SCV-V408)
Chapter 4 – Looking through glass: uncovering relations Part I
160
(Coutinho et al., 2016b). As far as the remaining façon-de-Venise glass are concerned, the existence of
two groups of façon-de-Venise glass (mostly the Miguel Fernandes Square, Beja, samples and another
group with mostly the samples from the São João de Tarouca Monastery) the composition of which
demonstrate an attempt to employ pure raw materials, but present unique features (such as medium and
high alumina levels), allowing one to propose the existence of two yet unknown façon-de-Venise
production centres. These unique characteristics also invalidate the possibility that these objects have
been produced in some known façon-de-Venise production centre. Could these objects have been
produced in Portugal? It is a known fact that Italian glassmakers emigrated to Portugal from the 16th
century, which makes this a plausible possibility.
As far as the other soda-rich glass objects are concerned, namely the mould blown decorated ones, it
was possible to identify one unique decorative pattern (four-petalled flower enclosed by a lozenge motif)
that as far as is known has only been found in glass objects excavated in Portuguese territory. As far as
the composition of the fragments with the four-petalled flower motif is concerned, they all present high
and very high alumina contents, which makes the possibility of a Portuguese provenance plausible. In
terms of the chemical composition, it was also possible to find fragments that, mainly as a result of their
very high alumina contents (above 6 wt%), cannot be compared with known production centres. For
instance, a set of fragments from the SCV set presents a very similar chemical composition with high
alumina content, and for these fragments a national production is proposed, not only because of their
chemical composition but also to their uncommon shapes. This leads to the conclusions reached in the
section devoted to gourds, where this shape was discussed. The gourd can be considered an inherited
influence from the Arabic invasion. This shape can be found in archaeological excavations from
northern to southern territories, and again putting together its uncommon shape together with the
chemical composition a national production for these objects is proposed.
During the study of the soda-rich glass objects, some fragments with gilded decoration were also
identified. During the study and characterisation of these objects, one object caught one’s attention
(CPU0032), and was studied more exhaustively (Coutinho et al., 2016c). The results showed that a lead
based mordant was used to attach the gold leaf to the glass, and that afterwards the re-heating required
to permanently fix the gold the to glass was probably carried out in a muffle, and not in the furnace, as
no second pontil mark is visible on the flask. With the use of a lead mordant the object is re-heated at a
lower temperature, below the glass softening point. The lead will act as a flux favouring a local softening
of the glass surface and therefore no distortion occurs. Although this gilding technique is mentioned in
historical treatises, as far as it is known it has never been found before in historical glass objects. As far
as the chemical composition of the gold leaf is concerned, a possible Au-Ag alloy estimated between 22
and 23 carats with ca. 1µm in thickness was determined. Also the chemical composition of the gold (in
major elements) proved to be in accordance with gold leaf used in Portugal during the 17th and 18th
Chapter 4 – Looking through glass: uncovering relations Part I
161
century, in the regions of Coimbra and Aveiro. The gold trace elements allowed to determine that it
might have came from both West and Eastern African coasts, both exploited by the Portuguese until
mid-17th century (Coutinho et al., 2016c).
The second larger group identified, belongs to the HLLA glass, and this glass type appears for the most
part in the assemblages excavated in Lisbon. This glass type appears related only to one object: the wine
bottle. Between the two assemblages (LTR and LRA), different bottle shapes were identified and were
related to different chronologies. The bottles shapes were divided into three categories according to their
shapes: type A for square bottles, type B for globular or onion bottles and type C for cylindrical bottles.
It was concluded that among the eighty glass bottles the majority are of type C. This composition was
usually employed for bottle production and is in accordance with the data found in the literature. In the
bottles dated from 19th century, the composition analysed suggests the employment of synthetic soda in
their batch. PCA analysis allowed one to divide the data into four compositional groups (Coutinho et
al., n.d., in press). These groups presented cohesive characteristics throughout their compositional
analysis. The various compositional groups were compared with HLLA compositions drawn from the
literature. Despite the similarity found between the composition of the bottles from the literature and the
bottles excavated in Lisbon, the comparison between the major oxides is not enough to attest their
provenance. This comparison allows one to suggest provenances or similarities in the raw materials
employed, recipes, and also furnace conditions. It was possible to prove the relation between some
samples from both archaeological assemblages. No similarity was found with the few examples analysed
of bottles from the Coina Glass Manufactory. However other production centres were active in Portugal
during the chronological period studied, meaning that some of the studied bottles might come from there
(Coutinho et al., n.d., in press).
With regard to the potassium rich objects, this glass type was only found in the two glass assemblages
from the Lisbon excavations. These two assemblages are the ones that have a more recent chronology,
where the LRA set dates to the 18th century until the beginning of the 19th century. All the potassium-
rich samples are made of colourless glass, and most of them are engraved, enamelled or have mould
blown decorations. It was possible to verify that the majority of samples analysed can be classified as
white glass, and due to their decorative features it is possible to propose that these glass objects are
attempts to imitate the glass developed and produced in Bohemia. Comparing the results with published
data from known production centres in Central Europe, it was concluded that the majority of samples
can be related to the production of potassium rich glass from the Coina Glass Manufactory, and that no
genuine Central European glass could be identified.
The compositional type considered next is the mixed alkali that represents only a very small percentage
of the samples analysed. Considering the chemical composition of the seven fragments identified with
Chapter 4 – Looking through glass: uncovering relations Part I
162
this compositional type, it is possible to conclude that there is not an obvious relation between fragments
with the exception of both objects from the CPU set that have a closely related chemical composition.
Due to the very low number of samples from this category, the hypothesis is raised that these glass
objects were not produced with this composition on purpose.
Finally, considering the lead glass objects, these represent the smallest compositional group with only
five fragments. From these fragments only one was not retrieved from Lisbon and belongs to the PMF
set. From the point of view of chemical composition, it was possible to conclude that the raw materials
employed were very pure. By means of trace elements and REE analysis, it was possible to conclude
that both fragments from the LRA set have the same provenance or were manufactured employing the
same silica source. From the comparison with data from known production centres, it was possible to
conclude that three fragments were related with the production from the Silkstone Factory (England),
and the remaining two with the composition from the Groningen Glass House (The Netherlands). No
fragment presented any relation with the samples analysed from the Coina Glass Manufactory.

Chapter 1 – Introduction Part II
163
PART II
SIGHT SENSING

Chapter 1 – Introduction Part II
164
Chapter 1 – Introduction Part II
165
CHAPTER 1
INTRODUCTION
Alongside with the study of the glass collections, it is important to assure the preservation of their
constituting objects into the future generations. The study and characterisation of such glass
assemblages would become obsolete if their preservation was not a concern. In order to preserve and
elongate the objects existence it is important to guarantee that glass collections present in museums,
whether they are in display or in storage, are conditioned in the best environment and are kept safe
from pollutants that can compromise their better preservation.
First studies developed on this matter only paid attention to the effect of strong inorganic acids on
glass, like sulphuric and nitric acids. These experiments intended to reproduce and understand the role
of the external environment and its pollutants on glass corrosion (Cummings et al., 1998; Romich,
1999). Recent studies concluded that the combination of VOCs with relative humidity fluctuations and
unstable glass compositions is critical for the stability of museum glass objects (Fearn et al., 2004;
2006; Robinet et al., 2006; 2009). In recent studies on glass degradation mechanisms due to the
presence of VOCs, formic acid was considered the one which has more impact on the kinetic of these
mechanisms, being responsible for accelerating and deepening the alkali leaching from glass matrix
(Robinet et al., 2006; 2009).
Chapter 1 – Introduction Part II
166
Glass corrosion mechanisms
Processes of glass degradation due to the presence of water or high humidity values are well known as
well as the visual alteration and physical damage suffered by this material. In 1770 Lavoisier
established that water was the primary degradation agent of glass and in 1931, Laubengager
discovered that the glass surface deterioration develops faster in descent way than to its sides
(Davinson, 2003, p.174-175). Every time that glass reacts with water or with an aqueous solution,
chemical alterations will occur on the glass surface migrating then to its bulk (Clark et al., 1979, p.1).
According to literature there are two main responsible factors that can be determinant to glass
alteration: water and glass composition. Glass composition will determine its stability when in contact
with water, since the presence of different modifier cations in the silica matrix will result in a different
behaviour of this material (Robinet et al., 2009; Romich, 1999). Alkali ions are the most easily
leached from the glass silica matrix, since they are the least strongly coordinated to this matrix. The
bigger the alkaline ion is, the least strong will be its coordination inside the glass silica matrix. For this
reason, a soda-rich glass will be slightly more resistant to corrosion than a potash-rich glass (Robinet
et al., 2009; Romich, 1999).
The introduction of alkaline-earth ions in the glass silica matrix will contribute to the resistance of this
material to corrosion, since these double charged ions will coordinate with non-bridging oxygens
blocking the alkali migration (Robinet et al., 2009).
In presence of high humidity levels, a water film will be formed on the glass surface. Glass will start
to absorb this water and the number of glass layers absorbing water will increase with atmospheric
relative humidity. The highly modified glass compositions like cristallo are characterised by its high
contents on alkali and low contents on lime, this combination resulting on a glass with a very good
capability of absorbing water contents from the atmosphere (Fearn et al., 2004; 2006). It is also
important to notice that when glass absorbs water from atmosphere it also absorbs organic molecules
that might be present in it (Robinet et al., 2009).
After a water film is formed on the glass surface, the presence of this water will lead to two different
corrosion processes that will be controlled by the solution pH. When the solution pH is lower than 9,
the dominant corrosion process is selective leaching, changing to the silica matrix dissolution when
the solution pH increases above 9 (Clark et al., 1979, p.2-3; Robinet et al. 2009).
The first degradation phase developed at pH below 9, the leaching process, is itself complex and
composed by 3 different reactions that occur simultaneously and every reaction has direct influence on
all the others, being the final result the glass hydration (Robinet et al., 2009).
Chapter 1 – Introduction Part II
167
Chemical reactions occurring during the degradation process and its detailed description is presented
in Appendix I, Part II.
Glass corrosion in presence of VOCs
The kinetics from these degradation mechanisms is influenced by volatile organic compounds (VOCs)
present in the atmosphere. First studies developed on this matter only paid attention to the effect of
strong inorganic acids on glass, like sulphuric and nitric acids (Cummings et al., 1998, pp.858). More
recent and developed studies concluded that VOCs combined with relative humidity fluctuations and
unstable glass compositions are the ones responsible for glass degradation (Robinet et al., 2006).
The origin of these VOCs has been discussed. It is generally accepted and well known that VOCs
present in indoor museum environments are mainly emitted by wood from storage or display cabinets
(Robinet et al., 2004).
Wood or wooden composites are known for their characteristic of unleashing VOCs such as
formaldehyde, formic acid and acetic acid (Gibson et al., 1997a; Gibson & Watt 2010; Hyttinen et al.,
2010; Manninen et al., 2002; Ryhl-svendsen & Glastrup, 2002).
A study developed by Ohta et al. allowed to conclude that formic acid can be spontaneous generated
on natural silicate rocks (like granite, quartzdiorite or gneiss) in presence of CO2, light and water
(Ohta et al., 2000). With this in mind, Fearn and co-workers extrapolated this conclusion to glass,
explaining that the presence of formic acid could be attributed to its spontaneous generation when in
contact to CO2, light and water being catalysed by metallic ions like iron present in glass composition
(Fearn et al., 2006).
It is also known that formaldehyde can oxidise originating formic acid. This is a very low process
however; it could be accelerated in presence of metals or oxidising agents like ozone or peroxides
(Robinet et al., 2004).
Despite the origin of VOCs, it is well known that they can have an armful effect when in contact to
glass. Initially, formaldehyde was thought to be the one responsible for glass degradation (Robinet et
al., 2004). More recent investigation concluded that organic pollutants present in ambient air including
formaldehyde could have beneficial effects on glass preservation by stopping leaching, since they
neutralize the hydroxide solution responsible for dissolution of the glass silica matrix (Robinet et al.,
2009).
After a review of literature on glass degradation mechanisms due to the presence of VOCs, it was
possible to conclude that formic acid was the one responsible for accelerating and deepening the alkali
Chapter 1 – Introduction Part II
168
leaching from glass matrix leading to the formation of crystalline sodium formats (NaHCO2) on the
glass surface (Robinet et al., 2009).
Glass degradation mechanism in presence of formic acid will, once again, start with formation of a
water film on the glass surface. This thin water film will become saturated in the acid with the higher
dissociation constant (Ka), or the acid than can dissolve faster. Comparing the Ka values of formic acid
with acetic acid, formic acid is the one presenting a higher Ka value, meaning that this acid will
dissolve faster than the others and will saturate water. This explains why formic acid is the one
affecting glass instead of acetic acid or formaldehyde. The acid will be a H+ source, accelerating and
deepening this way the corrosion mechanisms (Robinet et al., 2009).
Comparing the Ka values of formic (Ka=1.77*10-4) and acetic acid (Ka=1.74*10-5), formic acid
presents a higher Ka value, meaning that this acid will dissolve faster than the acetic acid and will
saturate the water film.
This degradation mechanism is independent of formic acid concentrations present in indoor
environments since the lowest quantity of water will become saturated in this acid no matter how low
this quantity is. Robinet et al. proposes that there is no minimum value of formic acid bellow which
glass corrosion will not occur (Robinet et al., 2009).
In presence of formic acid, the corrosion product formed will be sodium or potassium formats
(Robinet et al., 2004; 2006). Potassium format is a highly hygroscopic compound being this way
always at liquid form at room temperature. The existence and formation of these deposits on the glass
surface implies a reaction from this material with the surrounding environment and consequently
changes in its structure (Robinet et al., 2004).
It is possible to identify two different types of sodium formats on the glass surface: sodium format
phase I and anhydrous sodium formate phase II. Robinet et al. (2009) concluded that sodium format
phase I is formed in presence of formaldehyde. This compound results from the reaction between
formaldehyde and NaOH present on the glass surface, neutralizing it and stopping glass corrosion. It is
recommended not to remove these crystals from the glass surface once they are acting like protective
agents (Robinet et al., 2009).
The presence of formic acid leads to the formation of sodium format phase II, being this, the main
identified phase from this compound among corrosion deposits (Robinet et al., 2004). These formats
are formed during the reaction between formic acid and glass itself, leading to an extremely
accelerated leaching of alkali ions (in average, leaching reactions are 10 times faster in presence of
VOCs in comparison with leaching reactions occurring in an unpolluted environment) (Robinet et al.,
2009).
Chapter 1 – Introduction Part II
169
This sodium formate phase II will create a deliquescent film on the glass surface, which will maintain
the environmental pH bellow 9 (Robinet et al., 2009). In presence of formic acid the second
degradation step of the silica matrix dissolution wont take place, being the selective alkali leaching the
only degradation process occurring (Robinet et al., 2009).
In conclusion, alkali ions leaching will lead to the disappearance of a non-polymerized structure (non-
bridging oxygen) coordinated with metallic ions. With this silica network polymerization, glass will be
transformed from a homogeneous diffusion barrier into a silica colloidal aggregate characterised by its
heterogeneity and porosity (Robinet et al., 2006). Formic acid, being a source of H+ ions, will
accelerate and enhance this ionic exchange, becoming the second factor (after water) to have in
attention when dealing with glass conservation (Robinet et al., 2007; 2009).
The circulating amount of formic acid in museum environments was measured for some museums.
Results are summarised in Table 1.1.
Regarding for instance, the values collected for the National Museum of Scotland Islamic cabinets
(Gibson et al., 1997a), it becomes obvious the necessity of identifying this VOC and remove any
objects susceptible to its action from these cabinets. It is also really important to refer the human
factor, since this pollutant can severely affect the human health. The OSHA standard for human
exposure is of 10000 µg m-3 and it is possible to find in literature values of 500 µg m-3 and >1000 µg
m-3 measured in museum cabinets. Despite the fact that the measured values are below the maximum
value recommended for human exposure, this still represents a risk for the conservator’s health.
In what concerns the amounts measured for specific types of wood, it was determined that red pine
unleashes the lowest amount of formic acid (18 µg/m-3), comparing for instance with yew (187 µg/m-3)
and mahogany (171 µg/m-3). These values were obtained after placing these types of wood inside
desiccators and measuring the atmosphere after 7 days (Gibson et al., 2010). For this reason, it is also
important to evaluate the type of wood when analysing a wooden storage or display cabinet to contain
historical glass objects.
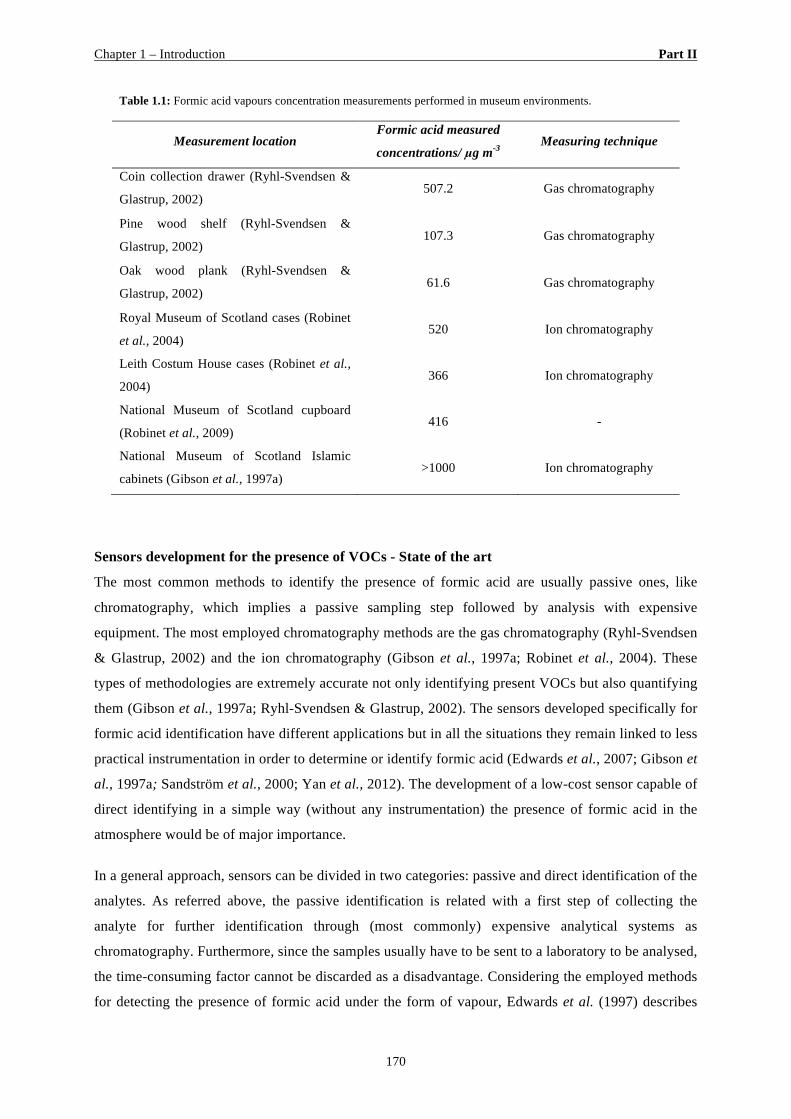
Chapter 1 – Introduction Part II
170
Table 1.1: Formic acid vapours concentration measurements performed in museum environments.
Measurement location Formic acid measured
concentrations/ µg m-3 Measuring technique
Coin collection drawer (Ryhl-Svendsen &
Glastrup, 2002) 507.2 Gas chromatography
Pine wood shelf (Ryhl-Svendsen &
Glastrup, 2002) 107.3 Gas chromatography
Oak wood plank (Ryhl-Svendsen &
Glastrup, 2002) 61.6 Gas chromatography
Royal Museum of Scotland cases (Robinet
et al., 2004) 520 Ion chromatography
Leith Costum House cases (Robinet et al.,
2004) 366 Ion chromatography
National Museum of Scotland cupboard
(Robinet et al., 2009) 416 -
National Museum of Scotland Islamic
cabinets (Gibson et al., 1997a) >1000 Ion chromatography
Sensors development for the presence of VOCs - State of the art
The most common methods to identify the presence of formic acid are usually passive ones, like
chromatography, which implies a passive sampling step followed by analysis with expensive
equipment. The most employed chromatography methods are the gas chromatography (Ryhl-Svendsen
& Glastrup, 2002) and the ion chromatography (Gibson et al., 1997a; Robinet et al., 2004). These
types of methodologies are extremely accurate not only identifying present VOCs but also quantifying
them (Gibson et al., 1997a; Ryhl-Svendsen & Glastrup, 2002). The sensors developed specifically for
formic acid identification have different applications but in all the situations they remain linked to less
practical instrumentation in order to determine or identify formic acid (Edwards et al., 2007; Gibson et
al., 1997a; Sandström et al., 2000; Yan et al., 2012). The development of a low-cost sensor capable of
direct identifying in a simple way (without any instrumentation) the presence of formic acid in the
atmosphere would be of major importance.
In a general approach, sensors can be divided in two categories: passive and direct identification of the
analytes. As referred above, the passive identification is related with a first step of collecting the
analyte for further identification through (most commonly) expensive analytical systems as
chromatography. Furthermore, since the samples usually have to be sent to a laboratory to be analysed,
the time-consuming factor cannot be discarded as a disadvantage. Considering the employed methods
for detecting the presence of formic acid under the form of vapour, Edwards et al. (1997) describes
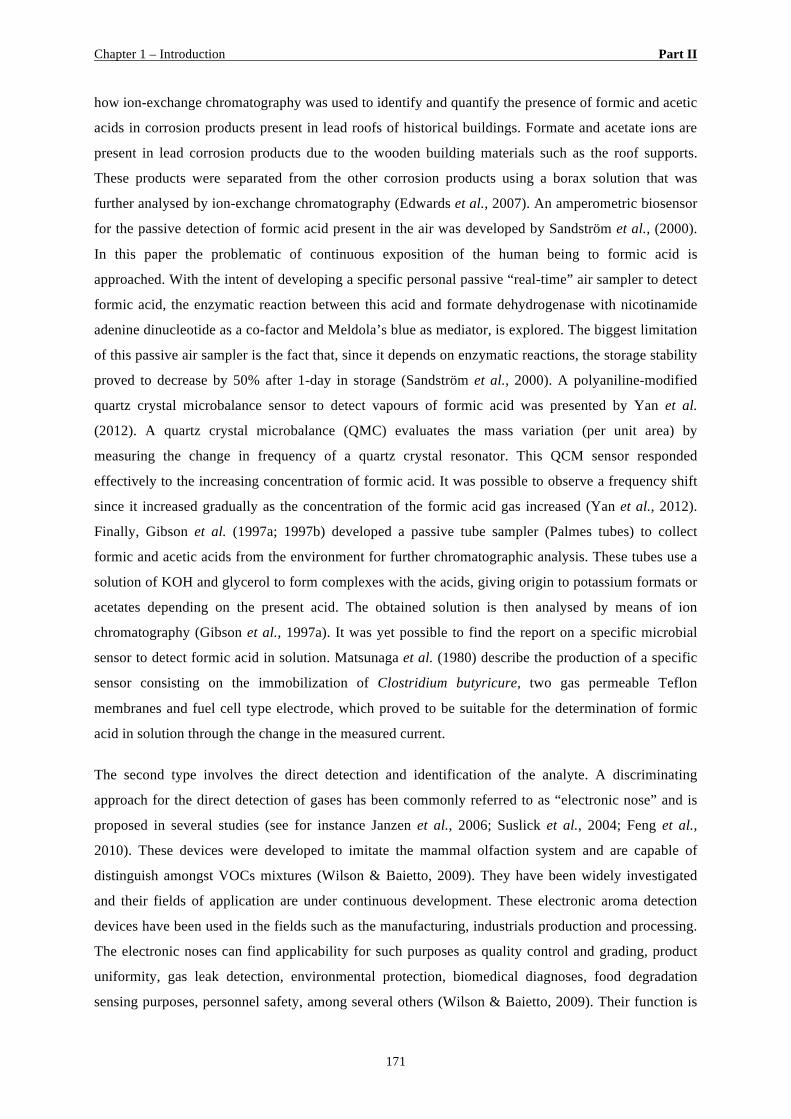
Chapter 1 – Introduction Part II
171
how ion-exchange chromatography was used to identify and quantify the presence of formic and acetic
acids in corrosion products present in lead roofs of historical buildings. Formate and acetate ions are
present in lead corrosion products due to the wooden building materials such as the roof supports.
These products were separated from the other corrosion products using a borax solution that was
further analysed by ion-exchange chromatography (Edwards et al., 2007). An amperometric biosensor
for the passive detection of formic acid present in the air was developed by Sandström et al., (2000).
In this paper the problematic of continuous exposition of the human being to formic acid is
approached. With the intent of developing a specific personal passive “real-time” air sampler to detect
formic acid, the enzymatic reaction between this acid and formate dehydrogenase with nicotinamide
adenine dinucleotide as a co-factor and Meldola’s blue as mediator, is explored. The biggest limitation
of this passive air sampler is the fact that, since it depends on enzymatic reactions, the storage stability
proved to decrease by 50% after 1-day in storage (Sandström et al., 2000). A polyaniline-modified
quartz crystal microbalance sensor to detect vapours of formic acid was presented by Yan et al.
(2012). A quartz crystal microbalance (QMC) evaluates the mass variation (per unit area) by
measuring the change in frequency of a quartz crystal resonator. This QCM sensor responded
effectively to the increasing concentration of formic acid. It was possible to observe a frequency shift
since it increased gradually as the concentration of the formic acid gas increased (Yan et al., 2012).
Finally, Gibson et al. (1997a; 1997b) developed a passive tube sampler (Palmes tubes) to collect
formic and acetic acids from the environment for further chromatographic analysis. These tubes use a
solution of KOH and glycerol to form complexes with the acids, giving origin to potassium formats or
acetates depending on the present acid. The obtained solution is then analysed by means of ion
chromatography (Gibson et al., 1997a). It was yet possible to find the report on a specific microbial
sensor to detect formic acid in solution. Matsunaga et al. (1980) describe the production of a specific
sensor consisting on the immobilization of Clostridium butyricure, two gas permeable Teflon
membranes and fuel cell type electrode, which proved to be suitable for the determination of formic
acid in solution through the change in the measured current.
The second type involves the direct detection and identification of the analyte. A discriminating
approach for the direct detection of gases has been commonly referred to as “electronic nose” and is
proposed in several studies (see for instance Janzen et al., 2006; Suslick et al., 2004; Feng et al.,
2010). These devices were developed to imitate the mammal olfaction system and are capable of
distinguish amongst VOCs mixtures (Wilson & Baietto, 2009). They have been widely investigated
and their fields of application are under continuous development. These electronic aroma detection
devices have been used in the fields such as the manufacturing, industrials production and processing.
The electronic noses can find applicability for such purposes as quality control and grading, product
uniformity, gas leak detection, environmental protection, biomedical diagnoses, food degradation
sensing purposes, personnel safety, among several others (Wilson & Baietto, 2009). Their function is
Chapter 1 – Introduction Part II
172
based on the response of an array of organic dyes, which implies that the response to a specific analyte
is given by a combination of determined dyes. Among the used dyes the acid-base indicators and
solvatochromic dyes present a better response to the presence of formic acid (Janzen et al., 2006).
Whereas on the first type of dye changes in the absorption/emission spectra are due to a change on the
electronic configuration trough coordination to the H+ from formic acid, on the second type
differences are due to changes on the polarity of the system.
It is also possible to find some in situ devices to analyse and semi-quantify the presence of VOCs,
without discriminating the acidic species (as for instance the Draeger tubes®, available information in
http://www.draeger.co.uk/, last consulted on May 13th 2013). This is the only direct identification
device available, as far as it is known, and has the limitation of not being specific for the detection of
formic acid if the measured atmosphere has the presence of other acids, situation that happens in most
cases, especially in museum wooden cabinets.
With these principles in mind it is proposed the development of an optical sensor capable of directly
identifying the presence of vapours of formic acid in presence of other VOCs.
Chapter 2 – Sensor Development Part II
173
CHAPTER 2
SENSOR DEVELOPMENT
2.1 Methodology
The methodology used to develop a simple and low-cost sensor for the detection of formic acid vapour
was based on the immobilization of chemo-responsive dyes (such as acid-base indicators,
solvatochromic dyes, among others) in a thin film matrix and consisted mainly in two steps. In a first
step, an adequate responsive dye, capable of selectively reacting when in presence of formic acid
under the form of vapour, was chosen. After the dye was chosen, the second step consisted in testing
its efficiency in the thin film matrixes. These dyes were then trapped in the matrixes and submitted to
several tests in order to choose the most viable dye/matrix combination.
It is important to mention that sometimes these steps did not occur independently. In other words, the
choice of matrix and acid-base dye are interconnected and one influences the other. With this in mind,
one can say that the obtained sensor will be a combination between the matrix and the dye
characteristics.
2.1.1 Thin Films
The manufacture and application of thin films is an ancestral technique. If one thinks in the physical
manufacture of gold leafs that were beaten until achieve 1 µm of thickness, its thinking in ancestral
thin films. Nowadays it is also possible to observe the development of chemical methods to produce
thin films (Ohring 2002, pp.xix), which can be deposited in various substrates such as silica glass,
metals, plastic and so on, having for this reason numerous applications in several fields (Walters &
Parkin, 2009).
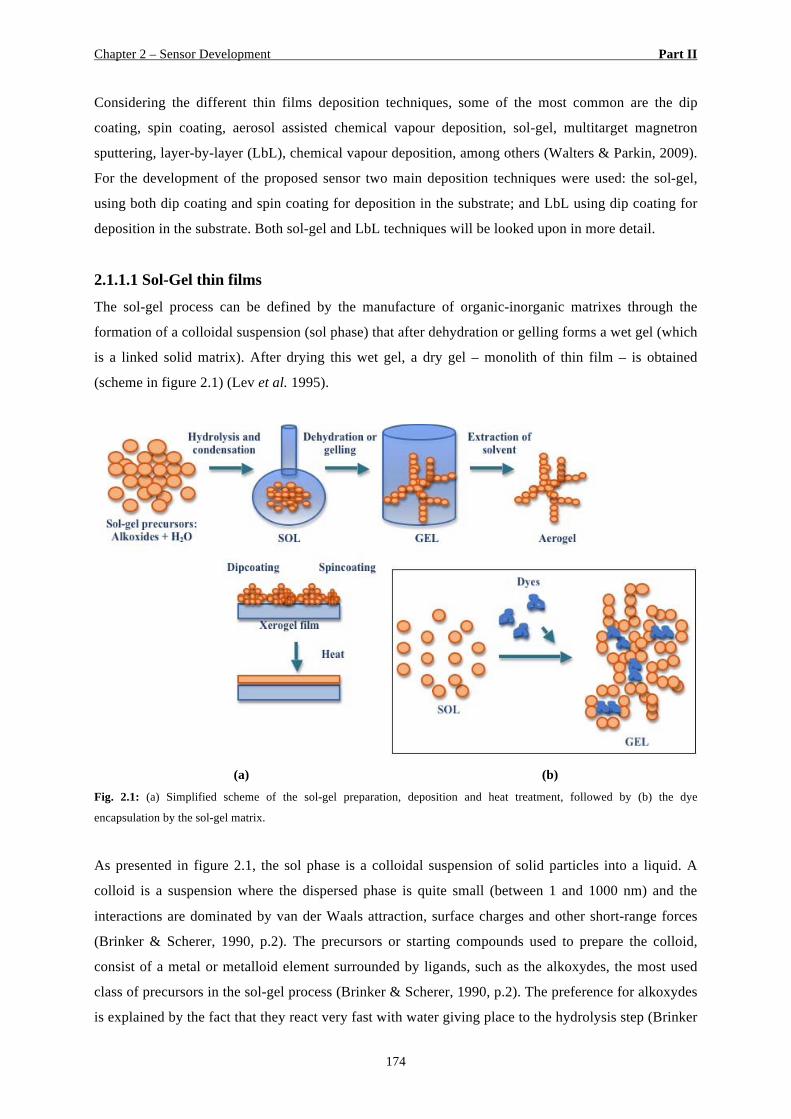
Chapter 2 – Sensor Development Part II
174
Considering the different thin films deposition techniques, some of the most common are the dip
coating, spin coating, aerosol assisted chemical vapour deposition, sol-gel, multitarget magnetron
sputtering, layer-by-layer (LbL), chemical vapour deposition, among others (Walters & Parkin, 2009).
For the development of the proposed sensor two main deposition techniques were used: the sol-gel,
using both dip coating and spin coating for deposition in the substrate; and LbL using dip coating for
deposition in the substrate. Both sol-gel and LbL techniques will be looked upon in more detail.
2.1.1.1 Sol-Gel thin films The sol-gel process can be defined by the manufacture of organic-inorganic matrixes through the
formation of a colloidal suspension (sol phase) that after dehydration or gelling forms a wet gel (which
is a linked solid matrix). After drying this wet gel, a dry gel – monolith of thin film – is obtained
(scheme in figure 2.1) (Lev et al. 1995).
(a) (b)
Fig. 2.1: (a) Simplified scheme of the sol-gel preparation, deposition and heat treatment, followed by (b) the dye
encapsulation by the sol-gel matrix.
As presented in figure 2.1, the sol phase is a colloidal suspension of solid particles into a liquid. A
colloid is a suspension where the dispersed phase is quite small (between 1 and 1000 nm) and the
interactions are dominated by van der Waals attraction, surface charges and other short-range forces
(Brinker & Scherer, 1990, p.2). The precursors or starting compounds used to prepare the colloid,
consist of a metal or metalloid element surrounded by ligands, such as the alkoxydes, the most used
class of precursors in the sol-gel process (Brinker & Scherer, 1990, p.2). The preference for alkoxydes
is explained by the fact that they react very fast with water giving place to the hydrolysis step (Brinker
Chapter 2 – Sensor Development Part II
175
& Scherer, 1990, p.3). When two molecules are hydrolyzed they can link together in a condensation
reaction that by definition, is a reaction where a small molecule (of water or alcohol) is released. This
condensation reaction will continue, giving origin to larger molecules in a process called
polymerization (Brinker & Scherer, 1990, p.4). The gel point occurs in a degree of the reaction where
the last bond is formed and the macromolecule is formed (Brinker & Scherer, 1990, p.8). The
reactions referred to here are assisted by a catalyst.
The sol-gel process can also be defined as a process that employs highly purified liquid raw materials
to obtain glass at room temperature. The highly pure raw materials will generate a pure matrix whose
homogeneity can be achieved by the constant agitation of the liquid mixture. In the end of the process,
a monolith or a thin film is obtained (Shelby, 2005, pp.269). This process is then an approach to
achieve inert inorganic or hybrid organic–inorganic matrices at room temperature that are stable at
thermally, chemically and photochemical levels. The sol-gel matrices can be transparent to the UV–
Vis radiation, allowing optical measurements, being this parameter sometimes fundamental to the
sensor development. These obtained matrixes can trap different organic or inorganic dopants
(chromophores) that become enclosed into their microporous structures. This can be done in such a
way that the optical properties of chromophores are preserved once trapped into the solid-state gel
matrix (Carmona et al., 2008).
Nowadays the sol-gel method can be considered one of the most popular methods to prepare thin films
with pH indicators (see for instance Kowada & Ozeki, 2005).
Experimental procedure used for sol gel films
Tetramethoxysilane (TMOS), methyltrimethoxysilane (MTMS) and Trimethoxy(propyl)silane
(PTMS) were used as raw materials and sol-gel initiators. The sol-gel initiators were mixed in a 1:2:5
ratio with water and ethanol, and then the selected dyes were added in a proportion of 0.1 mol% to the
previous mixture.
The three sol-gel initiators were used by mixing TMOS with the other two in a ratio of x TMOS + (1 -
x) MTMS or PTMS were x = 0 to 1. Once the solutions were ready and the dyes incorporated, it was
left for mixing for two hours at room temperature.
The chosen formulation is based on the work reported by Kowada et al. (2006) where no catalysts
such as the HCl so common in other sol-gel formulations, were used. Since acid-base dyes are being
incorporated in the formulation, the use of an acidic catalyst could interfere with the dyes’ pKa and it
would also cause their leaching from the sol-gel matrix (Kowada et al., 2006).
After the mixing step was completed, the thin films were prepared and applied on glass sheets by the
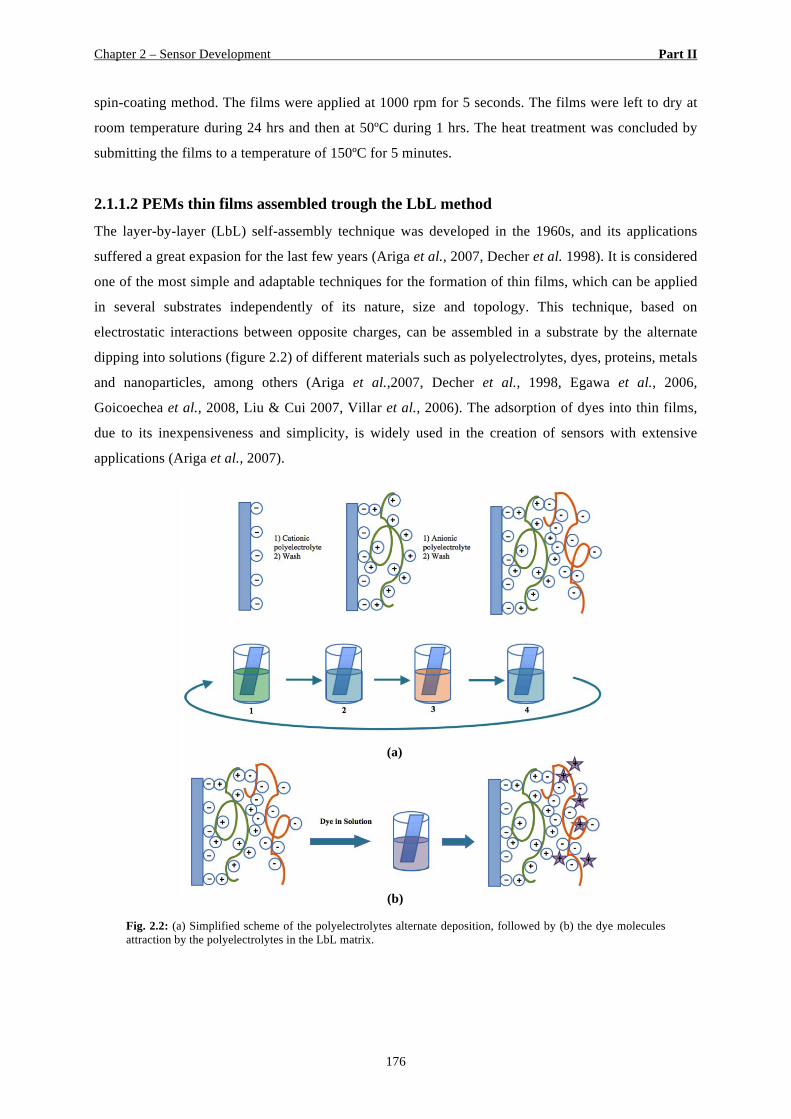
Chapter 2 – Sensor Development Part II
176
spin-coating method. The films were applied at 1000 rpm for 5 seconds. The films were left to dry at
room temperature during 24 hrs and then at 50ºC during 1 hrs. The heat treatment was concluded by
submitting the films to a temperature of 150ºC for 5 minutes.
2.1.1.2 PEMs thin films assembled trough the LbL method
The layer-by-layer (LbL) self-assembly technique was developed in the 1960s, and its applications
suffered a great expasion for the last few years (Ariga et al., 2007, Decher et al. 1998). It is considered
one of the most simple and adaptable techniques for the formation of thin films, which can be applied
in several substrates independently of its nature, size and topology. This technique, based on
electrostatic interactions between opposite charges, can be assembled in a substrate by the alternate
dipping into solutions (figure 2.2) of different materials such as polyelectrolytes, dyes, proteins, metals
and nanoparticles, among others (Ariga et al.,2007, Decher et al., 1998, Egawa et al., 2006,
Goicoechea et al., 2008, Liu & Cui 2007, Villar et al., 2006). The adsorption of dyes into thin films,
due to its inexpensiveness and simplicity, is widely used in the creation of sensors with extensive
applications (Ariga et al., 2007).
Fig. 2.2: (a) Simplified scheme of the polyelectrolytes alternate deposition, followed by (b) the dye molecules attraction by the polyelectrolytes in the LbL matrix.
(a)
(b)
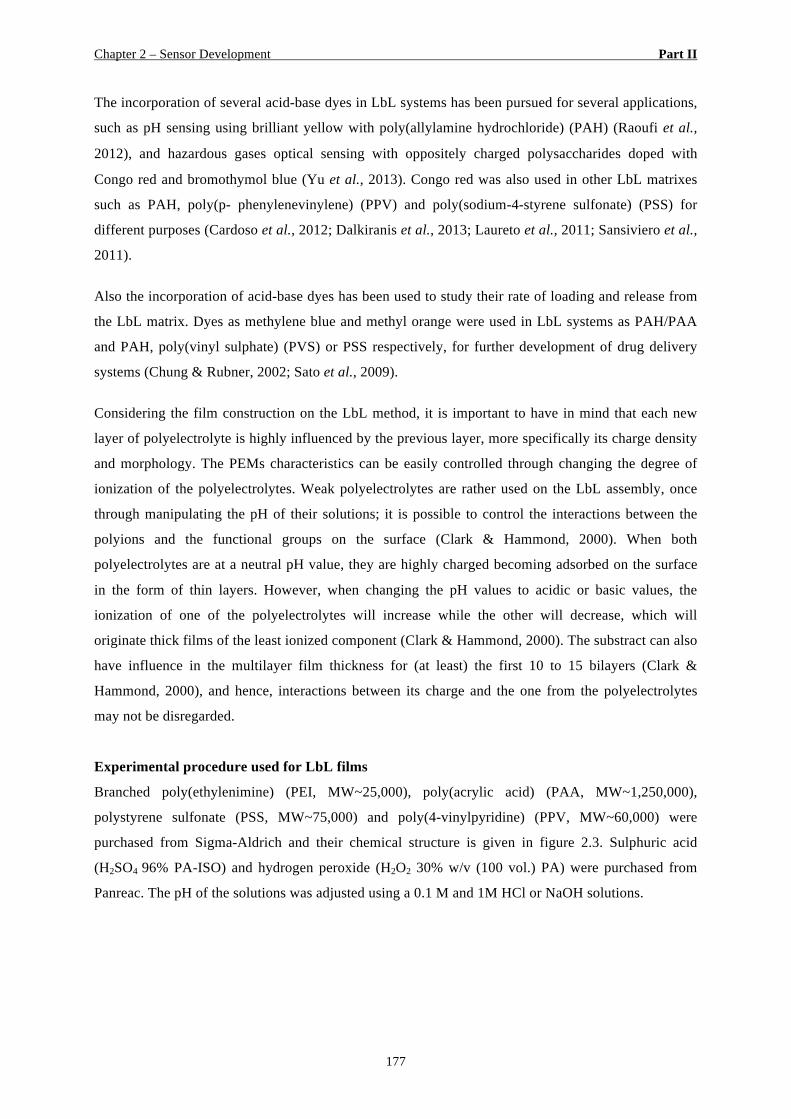
Chapter 2 – Sensor Development Part II
177
The incorporation of several acid-base dyes in LbL systems has been pursued for several applications,
such as pH sensing using brilliant yellow with poly(allylamine hydrochloride) (PAH) (Raoufi et al.,
2012), and hazardous gases optical sensing with oppositely charged polysaccharides doped with
Congo red and bromothymol blue (Yu et al., 2013). Congo red was also used in other LbL matrixes
such as PAH, poly(p- phenylenevinylene) (PPV) and poly(sodium-4-styrene sulfonate) (PSS) for
different purposes (Cardoso et al., 2012; Dalkiranis et al., 2013; Laureto et al., 2011; Sansiviero et al.,
2011).
Also the incorporation of acid-base dyes has been used to study their rate of loading and release from
the LbL matrix. Dyes as methylene blue and methyl orange were used in LbL systems as PAH/PAA
and PAH, poly(vinyl sulphate) (PVS) or PSS respectively, for further development of drug delivery
systems (Chung & Rubner, 2002; Sato et al., 2009).
Considering the film construction on the LbL method, it is important to have in mind that each new
layer of polyelectrolyte is highly influenced by the previous layer, more specifically its charge density
and morphology. The PEMs characteristics can be easily controlled through changing the degree of
ionization of the polyelectrolytes. Weak polyelectrolytes are rather used on the LbL assembly, once
through manipulating the pH of their solutions; it is possible to control the interactions between the
polyions and the functional groups on the surface (Clark & Hammond, 2000). When both
polyelectrolytes are at a neutral pH value, they are highly charged becoming adsorbed on the surface
in the form of thin layers. However, when changing the pH values to acidic or basic values, the
ionization of one of the polyelectrolytes will increase while the other will decrease, which will
originate thick films of the least ionized component (Clark & Hammond, 2000). The substract can also
have influence in the multilayer film thickness for (at least) the first 10 to 15 bilayers (Clark &
Hammond, 2000), and hence, interactions between its charge and the one from the polyelectrolytes
may not be disregarded.
Experimental procedure used for LbL films
Branched poly(ethylenimine) (PEI, MW~25,000), poly(acrylic acid) (PAA, MW~1,250,000),
polystyrene sulfonate (PSS, MW~75,000) and poly(4-vinylpyridine) (PPV, MW~60,000) were
purchased from Sigma-Aldrich and their chemical structure is given in figure 2.3. Sulphuric acid
(H2SO4 96% PA-ISO) and hydrogen peroxide (H2O2 30% w/v (100 vol.) PA) were purchased from
Panreac. The pH of the solutions was adjusted using a 0.1 M and 1M HCl or NaOH solutions.
Chapter 2 – Sensor Development Part II
178
Fig.2.3: Molecular structures of a) poly(ethylenimine), b) poly(acrylic acid), c) polystyrene sulfonate, and d) poly(4-vinylpyridine).
The polyelectrolytes were prepared in aqueous solution with a concentration of 1mg/ml. PEI solution
pH was adjusted to 7.5 and PAA solution pH was adjusted to 3.5. The PEI/PAA system was also
tested using both solutions with a pH value of 3.5. Two other systems were tested, the PEI/PSS system
whose pH values of solutions were corrected to 3.5 and 7.5 respectively and, the PPV/PAA system
with solutions at pH values of 7.5 and 3.5 respectively. PEMs films were deposited on float glass
sheets. The glass sheets were cleaned through immersion in piranha solution 1:1(v/v) of H2SO4 and
H2O2 during 30 min at 90oC and then rinsed with distilled water and dried with compressed air.
The PEMs films were assembled by dip-coating (Thermo Scientific Varistain 24-4) through
consecutive immersion of samples into the two oppositely charged polyelectrolites during 20 min,
until the desired number of bi-layers was formed. Each application layer was followed by three water-
rinsing steps (2 min, 1 min, 1min). The number of bi-layers chosen for the present work was 16. The
polyelectrolites system used in this work has the number of bilayers indicated, and whenever
necessary the pH of the solutions will also be displayed, as an example: (PEI/PAA)16.
The films were then immersed in the aqueous solution containing the dissolved dyes for a period of 35
min., which were prepared in a concentration of 2 mg/ml without pH adjustment. No rinsing was done
after the dyes adsorption on PEMs films. All films showed good stability and homogeneity.
2.1.2 Chemo responsive dyes
Chemo responsive dyes can be defined as dyes that change colour due to modifications in their
chemical environment. These colour changes can occur in both reflected and absorbed light. The dyes
that fit in these characteristics are within the classes of Lewis acid/base dyes, Brønsted acidic or basic
dyes (e.g., pH indicators), and dyes with large permanent dipoles (e.g., zwitterionic solvatochromic
dyes) (Janzen et al., 2006).
Chapter 2 – Sensor Development Part II
179
The principle of detection is strongly connected with the interaction between molecules and atoms,
both from the chemo responsive dye and the analyte. The reactions occurring between the chemical
compound one is trying to identify and the chemo responsive dyes can be enumerated as bond
formation and coordination, acid-base interactions, hydrogen-bonding, charge-transfer and π-π
molecular complexation, dipolar and multipolar interactions, and van der Waals interaction and
physical adsorption (Janzen et al., 2006).
When choosing a chemo responsive dye for the identification of a certain analyte it is important to
have in consideration certain requirements. First of all it is mandatory that the chosen dye (or dyes)
has a centre capable of strongly interact with the analyte (this interaction implies strong chemical
relations rather than a simple physical adsorption); secondly this interaction centre must be associated
to an intense chromophore (Janzen et al., 2006).
Acid-base indicators and solvatochromic dyes
For the sensor development several acid-base indicators plus one solvatochromic dye were used. The
choice of these dyes was connected to the fact that these are very well studied compounds and their
characteristics (chemical and physical properties) are well known. In their majority these dyes are also
non-toxic to the user. The chosen dyes were Congo red, Erythrosine B, Thymol Blue, Methyl Orange,
Methyl violet, Methyl yellow, Methyl red sodium salt and Reichardt’s dye. The chemical structure, λ
máx. of absorption, and literature pKa for each dye is reported in Table 2.1.
The Reichardt’s dye, 2,6-Diphenyl-4-(2,4,6-triphenyl-1-pyridinio)phenolate, or in a simplified way,
C41H29NO, was used as the solvatochromic dye.
All acid-base indicators plus the Reichardt’s dye were purchased from Sigma-Aldrich.
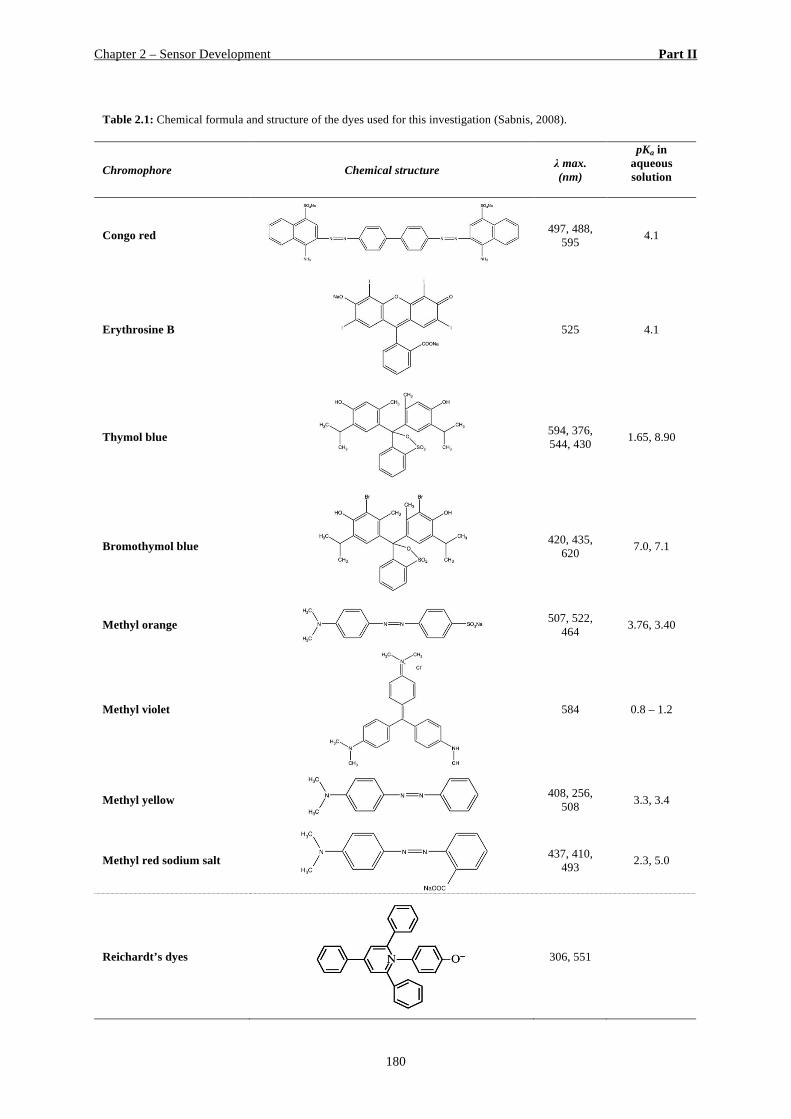
Chapter 2 – Sensor Development Part II
180
Table 2.1: Chemical formula and structure of the dyes used for this investigation (Sabnis, 2008).
Chromophore Chemical structure λ max. (nm)
pKa in aqueous solution
Congo red
497, 488, 595 4.1
Erythrosine B
525 4.1
Thymol blue
594, 376, 544, 430 1.65, 8.90
Bromothymol blue
420, 435, 620 7.0, 7.1
Methyl orange
507, 522, 464 3.76, 3.40
Methyl violet
584 0.8 – 1.2
Methyl yellow
408, 256, 508 3.3, 3.4
Methyl red sodium salt
437, 410, 493 2.3, 5.0
Reichardt’s dyes
306, 551
Chapter 2 – Sensor Development Part II
181
2.1.2.1 Dye pKa determination in the thin film
The first important step of this investigation was to determine the pKa value of the chosen acid-base
dyes (MV, CR, MR, EB and BTB) when inserted into this new medium – the thin film, in order to
understand if they were still reacting in the same pH range. This determination is fundamental since it
serves to verify if the acid-base indicator will still be able to detect the presence of the formic acid.
The determination of the pKa values of the chosen acid-base indicators in the polymeric matrix, was
made by dipping the samples with each dye into a range of buffer solutions from pH 0.3 until pH 13,
followed by the absorbance measurement. The used solutions were universal buffer solutions of
Theorell and Stenhagen (Kunster & Thiel, 1982). The immersion time was ~1.5 min and the optical
response was recorded. To obtain the pKa value the resulting data was treated and analysed through
least-squares fittings of the experimental data, using Solver from MS Excel.
The pKa values of the chosen dyes in aqueous solution were also determined and compared with the
respective literature values.
2.1.3 Sensor characterisation
It is very important to characterise the sensor under development in order to understand its potential
and its limitations. The sensor evaluated parameters were its specificity to identify formic acid, its
photosensibility, its response time in function of the amount of formic acid present in the atmosphere
and its reversibility. The reversibility is one of most important capabilities that it is necessary to assure
in its functioning. This is not only due to the need of reducing costs that museums are constantly
experiencing but also in environmental terms. Recycling and reutilizing are very important
characteristics on current materials and despite the interest here to produce a reutilizing product, it is
also important to assure that the materials (at least some of them) employed on the sensor are
recyclable. This is the case of the used substrate for both tested matrixes: glass.
The concentrations of formic acid measured in museum cabinets are in the order of a few hundred
µg/m3 so it is important for the developed sensor to be able to detect low atmospheric concentrations
of this acid.
The selectivity of the produced sensors was tested with organic compounds unleashed by wood, with
common solvents and dairy products used for cleaning purposes and with some inorganic acids. The
former group comprised acetic acid, benzoic acid, propionic acid; and the latter hydrochloric acid,
nitric acid, sulphuric acid. The common solvents tested were methanol, ethanol, acetone and toluene
and the tested cleaning dairy products were commercial lye and commercial glass cleaner liquid. Each
glass supporting LbL sensor was submitted to pure vapours of these substances for 1.5 min (in the case
Chapter 2 – Sensor Development Part II
182
of methyl red, a period of one hour was also tested) and, the optical responses recorded by measuring
its absorbance.
Further tests involved the determination of selectivity for the remaining three systems (with EB, CR
and MR dyes). This was done using formic acid and other organic acids, which are also unleashed
from wood such as acetic acid, benzoic acid and propionic acid (Robinet et al., 2006; 2009). The
spectral response of the produced systems to the referred acids plus hydrochloric acid, nitric acid and
sulphuric acid were recorded after 1.5 min of exposure.
Sensors were exposed to window and room light for a period of 150 days in order to study their
photosensitivity. Control samples were kept in the dark. Optical response of the sensors was measured
at different periods of time.
The systems containing CR, EB and MR were tested to observe their stability to light. In order to
study the behaviour of these systems when exposed to indoor daylight, one system containing each
dye was displayed inside laboratory installations, another set was placed in a window and a final set
was kept in the dark to serve as reference samples. The sensors spectral response was recorded at
every two days for a week and after 5 months exposure.
The reversibility test was performed exposing sensors alternately to the saturated atmosphere of a
strong base (ammonia) and a strong acid (hydrochloric acid) for eight cycles using different exposure
times. To perform this test, the sensor was placed inside a closed Petri dish with 450 µl of acid and
base, alternately and its absorbance was measured.
In order to establish the range of formic acid concentrations in the atmosphere that can be detected by
the developed sensor, as well as the required exposure times, a simulation of different atmospheres
was performed, in accordance with Gibson et al. (2010). Atmospheres of approximately 10, 30, and
100 mg/ m3 were initially simulated, but a simulation of a fourth atmosphere with a higher formic acid
concentration (> 100 mg/ m3) was further necessary. The (PEI/PAA/MR)16 sensors were placed inside
each of five 640 cm3 desiccators. Inside each desiccator five different solutions were placed with the
intent of creating the different atmospheres of formic acid. Their composition is presented in Table
2.2. The proposed methodology was to collect a set of two sensors from each desiccator as soon as the
first created atmosphere triggered the colour change in a sensor. Each set of two sensors collected
from the five desiccators were then analysed though UV-Vis absorbance spectroscopy, in order to
evaluate the colour change that has occurred.
The proposed methodology was to collect a set of two sensors from each desiccator as soon as the first
created atmosphere triggered the colour change in a sensor. Each set of two sensors collected from the
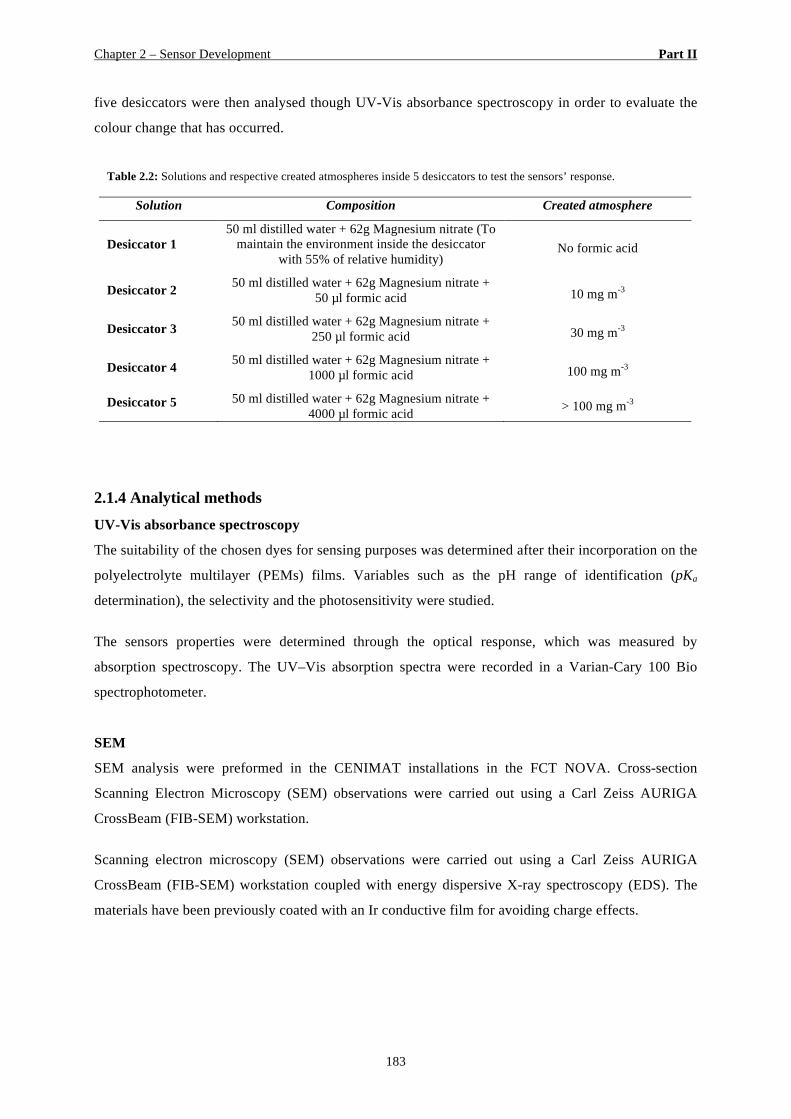
Chapter 2 – Sensor Development Part II
183
five desiccators were then analysed though UV-Vis absorbance spectroscopy in order to evaluate the
colour change that has occurred.
Table 2.2: Solutions and respective created atmospheres inside 5 desiccators to test the sensors’ response.
Solution Composition Created atmosphere
Desiccator 1 50 ml distilled water + 62g Magnesium nitrate (To
maintain the environment inside the desiccator with 55% of relative humidity)
No formic acid
Desiccator 2 50 ml distilled water + 62g Magnesium nitrate + 50 µl formic acid 10 mg m-3
Desiccator 3 50 ml distilled water + 62g Magnesium nitrate + 250 µl formic acid 30 mg m-3
Desiccator 4 50 ml distilled water + 62g Magnesium nitrate + 1000 µl formic acid 100 mg m-3
Desiccator 5 50 ml distilled water + 62g Magnesium nitrate + 4000 µl formic acid > 100 mg m-3
2.1.4 Analytical methods
UV-Vis absorbance spectroscopy
The suitability of the chosen dyes for sensing purposes was determined after their incorporation on the
polyelectrolyte multilayer (PEMs) films. Variables such as the pH range of identification (pKa
determination), the selectivity and the photosensitivity were studied.
The sensors properties were determined through the optical response, which was measured by
absorption spectroscopy. The UV–Vis absorption spectra were recorded in a Varian-Cary 100 Bio
spectrophotometer.
SEM
SEM analysis were preformed in the CENIMAT installations in the FCT NOVA. Cross-section
Scanning Electron Microscopy (SEM) observations were carried out using a Carl Zeiss AURIGA
CrossBeam (FIB-SEM) workstation.
Scanning electron microscopy (SEM) observations were carried out using a Carl Zeiss AURIGA
CrossBeam (FIB-SEM) workstation coupled with energy dispersive X-ray spectroscopy (EDS). The
materials have been previously coated with an Ir conductive film for avoiding charge effects.
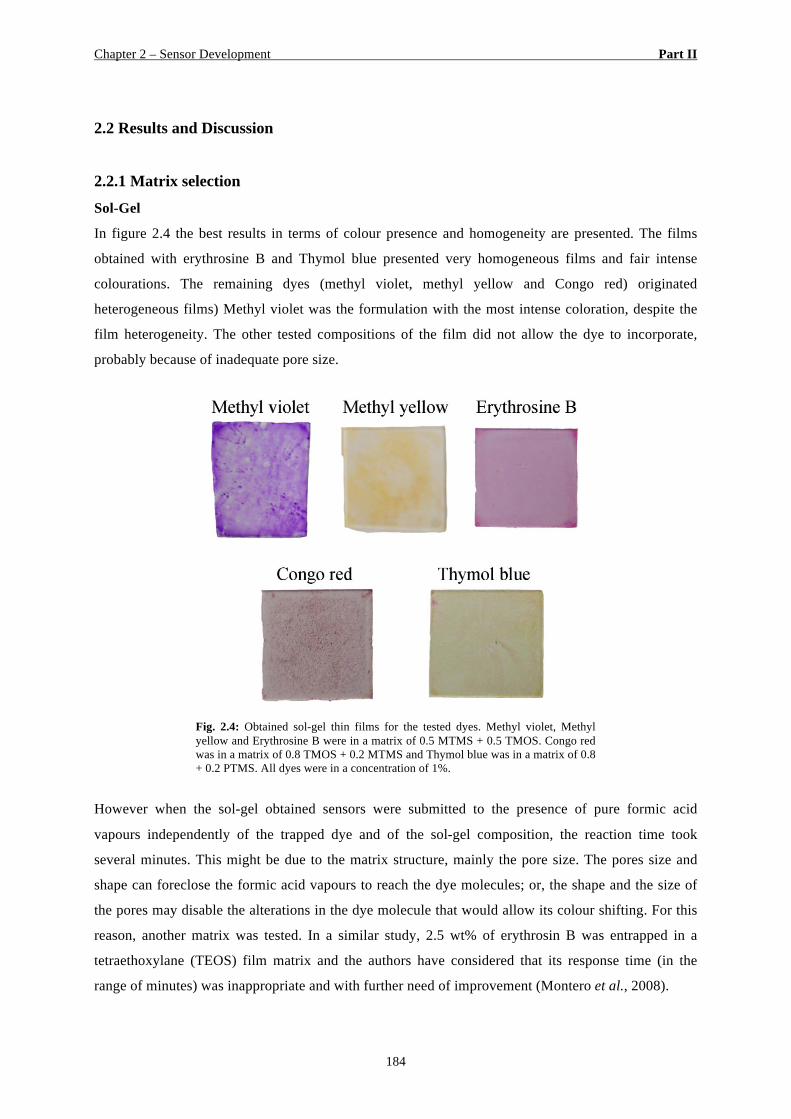
Chapter 2 – Sensor Development Part II
184
2.2 Results and Discussion
2.2.1 Matrix selection
Sol-Gel
In figure 2.4 the best results in terms of colour presence and homogeneity are presented. The films
obtained with erythrosine B and Thymol blue presented very homogeneous films and fair intense
colourations. The remaining dyes (methyl violet, methyl yellow and Congo red) originated
heterogeneous films) Methyl violet was the formulation with the most intense coloration, despite the
film heterogeneity. The other tested compositions of the film did not allow the dye to incorporate,
probably because of inadequate pore size.
Fig. 2.4: Obtained sol-gel thin films for the tested dyes. Methyl violet, Methyl yellow and Erythrosine B were in a matrix of 0.5 MTMS + 0.5 TMOS. Congo red was in a matrix of 0.8 TMOS + 0.2 MTMS and Thymol blue was in a matrix of 0.8 + 0.2 PTMS. All dyes were in a concentration of 1%.
However when the sol-gel obtained sensors were submitted to the presence of pure formic acid
vapours independently of the trapped dye and of the sol-gel composition, the reaction time took
several minutes. This might be due to the matrix structure, mainly the pore size. The pores size and
shape can foreclose the formic acid vapours to reach the dye molecules; or, the shape and the size of
the pores may disable the alterations in the dye molecule that would allow its colour shifting. For this
reason, another matrix was tested. In a similar study, 2.5 wt% of erythrosin B was entrapped in a
tetraethoxylane (TEOS) film matrix and the authors have considered that its response time (in the
range of minutes) was inappropriate and with further need of improvement (Montero et al., 2008).
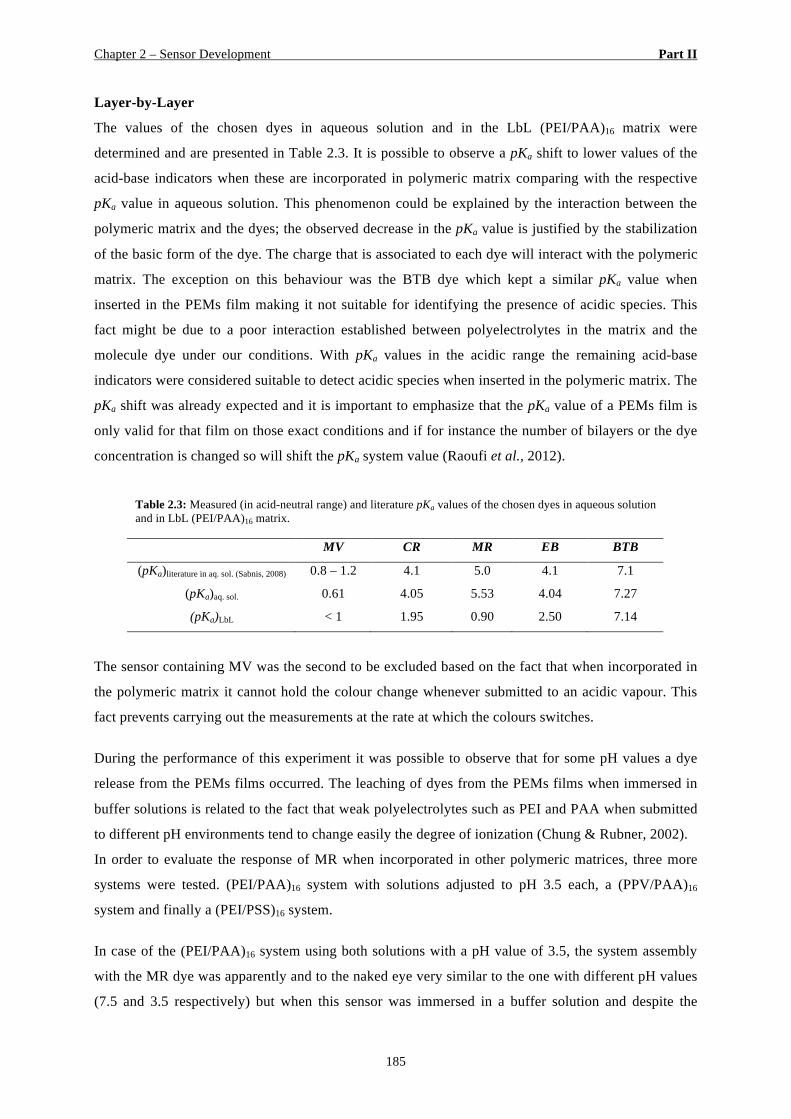
Chapter 2 – Sensor Development Part II
185
Layer-by-Layer
The values of the chosen dyes in aqueous solution and in the LbL (PEI/PAA)16 matrix were
determined and are presented in Table 2.3. It is possible to observe a pKa shift to lower values of the
acid-base indicators when these are incorporated in polymeric matrix comparing with the respective
pKa value in aqueous solution. This phenomenon could be explained by the interaction between the
polymeric matrix and the dyes; the observed decrease in the pKa value is justified by the stabilization
of the basic form of the dye. The charge that is associated to each dye will interact with the polymeric
matrix. The exception on this behaviour was the BTB dye which kept a similar pKa value when
inserted in the PEMs film making it not suitable for identifying the presence of acidic species. This
fact might be due to a poor interaction established between polyelectrolytes in the matrix and the
molecule dye under our conditions. With pKa values in the acidic range the remaining acid-base
indicators were considered suitable to detect acidic species when inserted in the polymeric matrix. The
pKa shift was already expected and it is important to emphasize that the pKa value of a PEMs film is
only valid for that film on those exact conditions and if for instance the number of bilayers or the dye
concentration is changed so will shift the pKa system value (Raoufi et al., 2012).
Table 2.3: Measured (in acid-neutral range) and literature pKa values of the chosen dyes in aqueous solution and in LbL (PEI/PAA)16 matrix.
MV CR MR EB BTB
(pKa)literature in aq. sol. (Sabnis, 2008) 0.8 – 1.2 4.1 5.0 4.1 7.1
(pKa)aq. sol. 0.61 4.05 5.53 4.04 7.27
(pKa)LbL < 1 1.95 0.90 2.50 7.14
The sensor containing MV was the second to be excluded based on the fact that when incorporated in
the polymeric matrix it cannot hold the colour change whenever submitted to an acidic vapour. This
fact prevents carrying out the measurements at the rate at which the colours switches.
During the performance of this experiment it was possible to observe that for some pH values a dye
release from the PEMs films occurred. The leaching of dyes from the PEMs films when immersed in
buffer solutions is related to the fact that weak polyelectrolytes such as PEI and PAA when submitted
to different pH environments tend to change easily the degree of ionization (Chung & Rubner, 2002).
In order to evaluate the response of MR when incorporated in other polymeric matrices, three more
systems were tested. (PEI/PAA)16 system with solutions adjusted to pH 3.5 each, a (PPV/PAA)16
system and finally a (PEI/PSS)16 system.
In case of the (PEI/PAA)16 system using both solutions with a pH value of 3.5, the system assembly
with the MR dye was apparently and to the naked eye very similar to the one with different pH values
(7.5 and 3.5 respectively) but when this sensor was immersed in a buffer solution and despite the
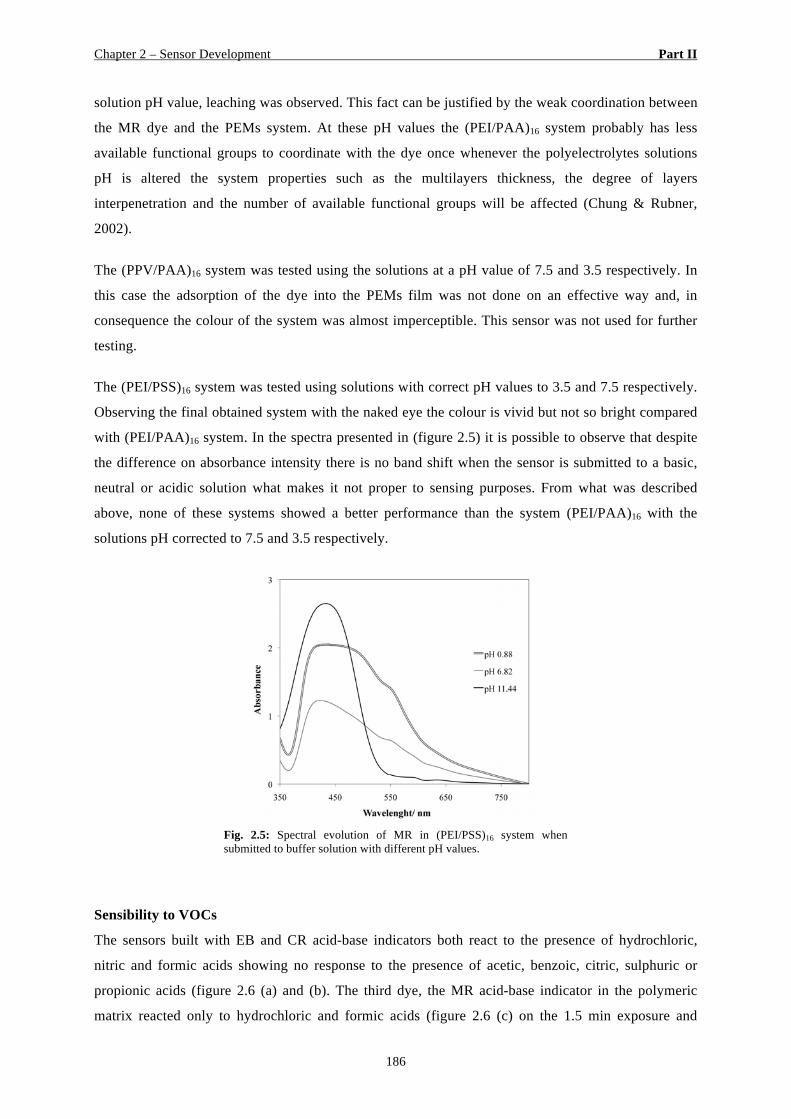
Chapter 2 – Sensor Development Part II
186
solution pH value, leaching was observed. This fact can be justified by the weak coordination between
the MR dye and the PEMs system. At these pH values the (PEI/PAA)16 system probably has less
available functional groups to coordinate with the dye once whenever the polyelectrolytes solutions
pH is altered the system properties such as the multilayers thickness, the degree of layers
interpenetration and the number of available functional groups will be affected (Chung & Rubner,
2002).
The (PPV/PAA)16 system was tested using the solutions at a pH value of 7.5 and 3.5 respectively. In
this case the adsorption of the dye into the PEMs film was not done on an effective way and, in
consequence the colour of the system was almost imperceptible. This sensor was not used for further
testing.
The (PEI/PSS)16 system was tested using solutions with correct pH values to 3.5 and 7.5 respectively.
Observing the final obtained system with the naked eye the colour is vivid but not so bright compared
with (PEI/PAA)16 system. In the spectra presented in (figure 2.5) it is possible to observe that despite
the difference on absorbance intensity there is no band shift when the sensor is submitted to a basic,
neutral or acidic solution what makes it not proper to sensing purposes. From what was described
above, none of these systems showed a better performance than the system (PEI/PAA)16 with the
solutions pH corrected to 7.5 and 3.5 respectively.
Fig. 2.5: Spectral evolution of MR in (PEI/PSS)16 system when submitted to buffer solution with different pH values.
Sensibility to VOCs
The sensors built with EB and CR acid-base indicators both react to the presence of hydrochloric,
nitric and formic acids showing no response to the presence of acetic, benzoic, citric, sulphuric or
propionic acids (figure 2.6 (a) and (b). The third dye, the MR acid-base indicator in the polymeric
matrix reacted only to hydrochloric and formic acids (figure 2.6 (c) on the 1.5 min exposure and
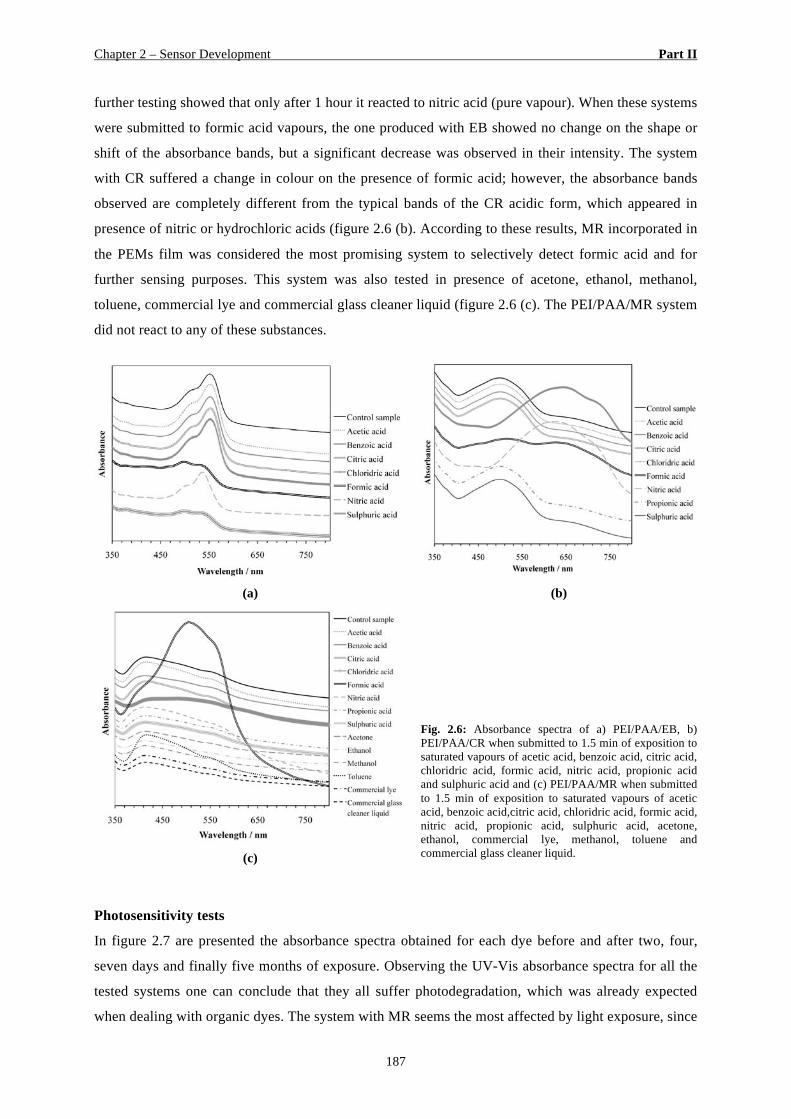
Chapter 2 – Sensor Development Part II
187
further testing showed that only after 1 hour it reacted to nitric acid (pure vapour). When these systems
were submitted to formic acid vapours, the one produced with EB showed no change on the shape or
shift of the absorbance bands, but a significant decrease was observed in their intensity. The system
with CR suffered a change in colour on the presence of formic acid; however, the absorbance bands
observed are completely different from the typical bands of the CR acidic form, which appeared in
presence of nitric or hydrochloric acids (figure 2.6 (b). According to these results, MR incorporated in
the PEMs film was considered the most promising system to selectively detect formic acid and for
further sensing purposes. This system was also tested in presence of acetone, ethanol, methanol,
toluene, commercial lye and commercial glass cleaner liquid (figure 2.6 (c). The PEI/PAA/MR system
did not react to any of these substances.
(a) (b)
(c)
Fig. 2.6: Absorbance spectra of a) PEI/PAA/EB, b) PEI/PAA/CR when submitted to 1.5 min of exposition to saturated vapours of acetic acid, benzoic acid, citric acid, chloridric acid, formic acid, nitric acid, propionic acid and sulphuric acid and (c) PEI/PAA/MR when submitted to 1.5 min of exposition to saturated vapours of acetic acid, benzoic acid,citric acid, chloridric acid, formic acid, nitric acid, propionic acid, sulphuric acid, acetone, ethanol, commercial lye, methanol, toluene and commercial glass cleaner liquid.
Photosensitivity tests
In figure 2.7 are presented the absorbance spectra obtained for each dye before and after two, four,
seven days and finally five months of exposure. Observing the UV-Vis absorbance spectra for all the
tested systems one can conclude that they all suffer photodegradation, which was already expected
when dealing with organic dyes. The system with MR seems the most affected by light exposure, since
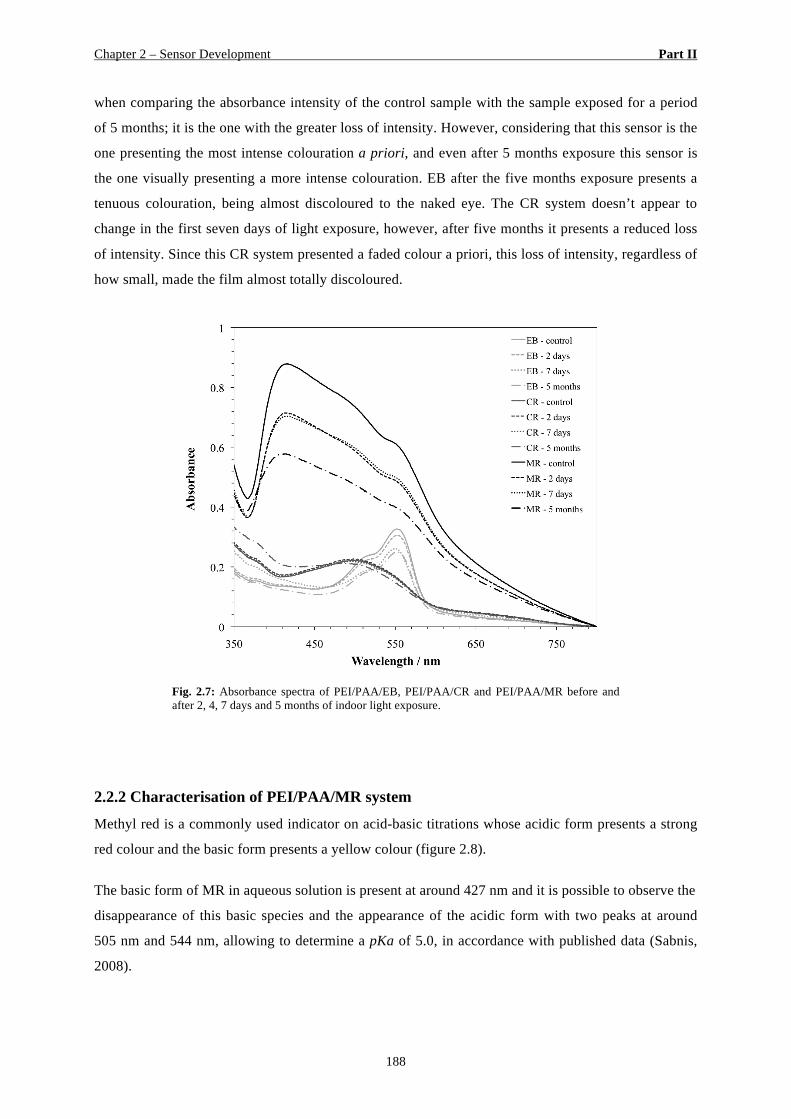
Chapter 2 – Sensor Development Part II
188
when comparing the absorbance intensity of the control sample with the sample exposed for a period
of 5 months; it is the one with the greater loss of intensity. However, considering that this sensor is the
one presenting the most intense colouration a priori, and even after 5 months exposure this sensor is
the one visually presenting a more intense colouration. EB after the five months exposure presents a
tenuous colouration, being almost discoloured to the naked eye. The CR system doesn’t appear to
change in the first seven days of light exposure, however, after five months it presents a reduced loss
of intensity. Since this CR system presented a faded colour a priori, this loss of intensity, regardless of
how small, made the film almost totally discoloured.
Fig. 2.7: Absorbance spectra of PEI/PAA/EB, PEI/PAA/CR and PEI/PAA/MR before and after 2, 4, 7 days and 5 months of indoor light exposure.
2.2.2 Characterisation of PEI/PAA/MR system
Methyl red is a commonly used indicator on acid-basic titrations whose acidic form presents a strong
red colour and the basic form presents a yellow colour (figure 2.8).
The basic form of MR in aqueous solution is present at around 427 nm and it is possible to observe the
disappearance of this basic species and the appearance of the acidic form with two peaks at around
505 nm and 544 nm, allowing to determine a pKa of 5.0, in accordance with published data (Sabnis,
2008).
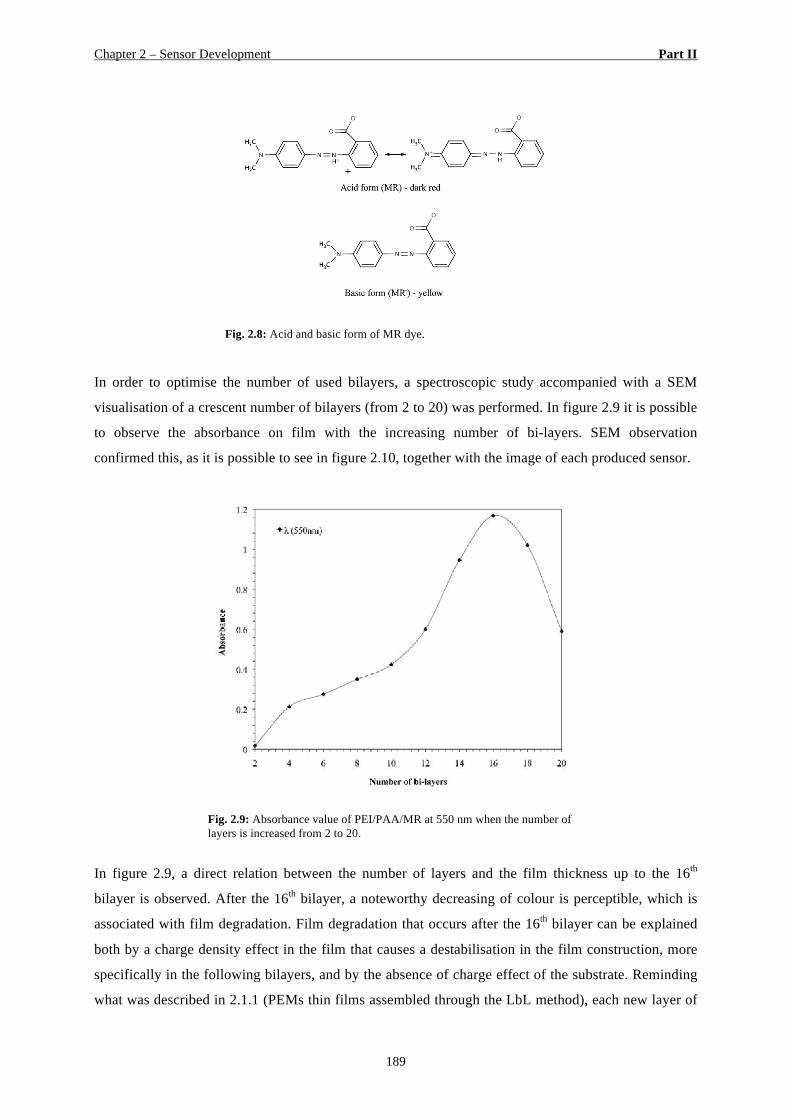
Chapter 2 – Sensor Development Part II
189
Fig. 2.8: Acid and basic form of MR dye.
In order to optimise the number of used bilayers, a spectroscopic study accompanied with a SEM
visualisation of a crescent number of bilayers (from 2 to 20) was performed. In figure 2.9 it is possible
to observe the absorbance on film with the increasing number of bi-layers. SEM observation
confirmed this, as it is possible to see in figure 2.10, together with the image of each produced sensor.
Fig. 2.9: Absorbance value of PEI/PAA/MR at 550 nm when the number of layers is increased from 2 to 20.
In figure 2.9, a direct relation between the number of layers and the film thickness up to the 16th
bilayer is observed. After the 16th bilayer, a noteworthy decreasing of colour is perceptible, which is
associated with film degradation. Film degradation that occurs after the 16th bilayer can be explained
both by a charge density effect in the film that causes a destabilisation in the film construction, more
specifically in the following bilayers, and by the absence of charge effect of the substrate. Reminding
what was described in 2.1.1 (PEMs thin films assembled through the LbL method), each new layer of
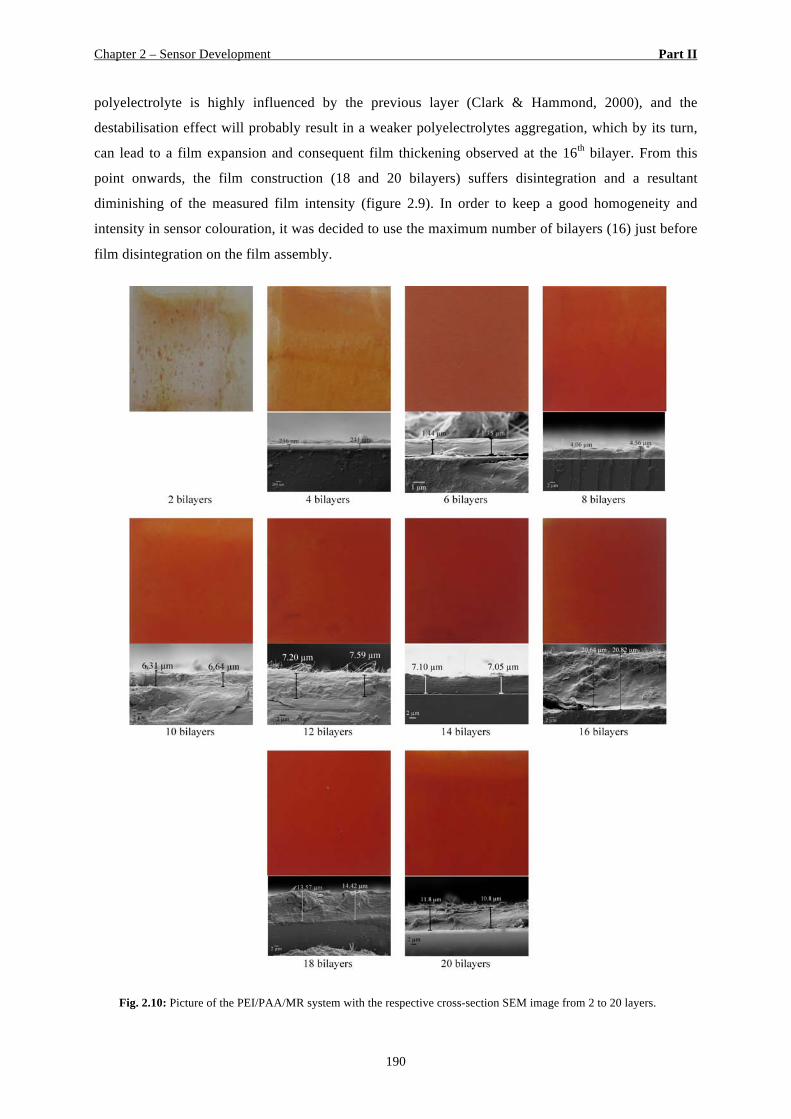
Chapter 2 – Sensor Development Part II
190
polyelectrolyte is highly influenced by the previous layer (Clark & Hammond, 2000), and the
destabilisation effect will probably result in a weaker polyelectrolytes aggregation, which by its turn,
can lead to a film expansion and consequent film thickening observed at the 16th bilayer. From this
point onwards, the film construction (18 and 20 bilayers) suffers disintegration and a resultant
diminishing of the measured film intensity (figure 2.9). In order to keep a good homogeneity and
intensity in sensor colouration, it was decided to use the maximum number of bilayers (16) just before
film disintegration on the film assembly.
Fig. 2.10: Picture of the PEI/PAA/MR system with the respective cross-section SEM image from 2 to 20 layers.
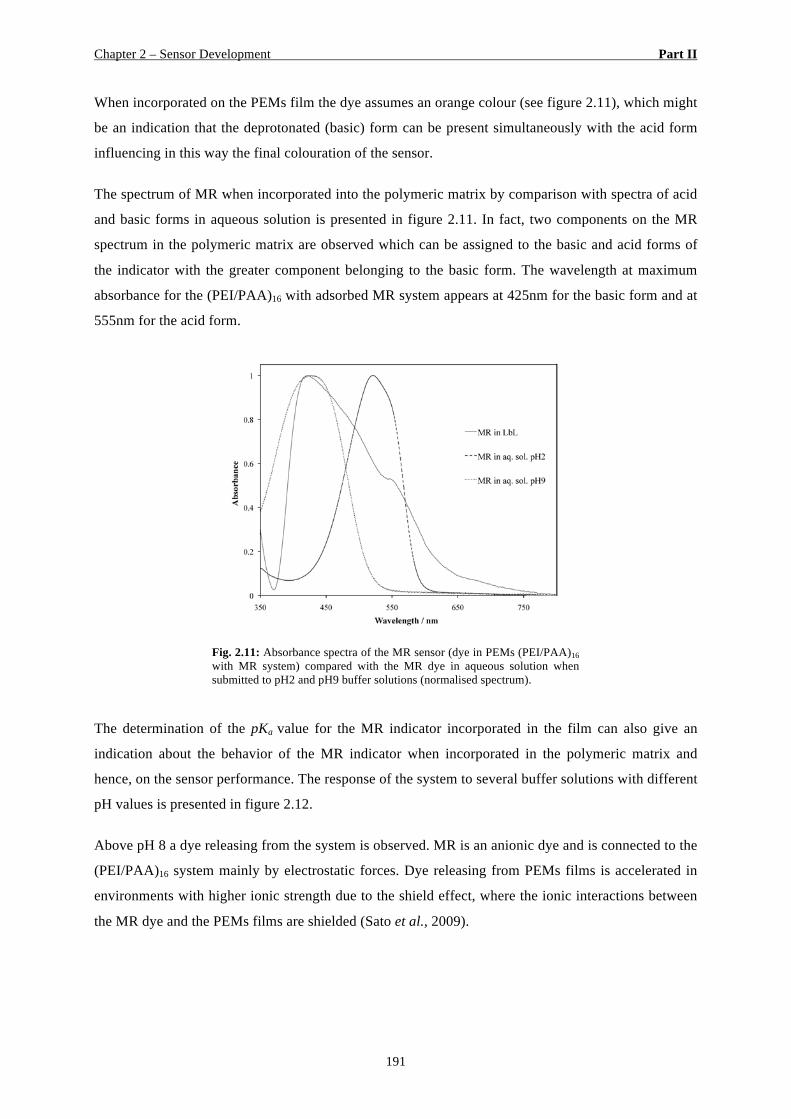
Chapter 2 – Sensor Development Part II
191
When incorporated on the PEMs film the dye assumes an orange colour (see figure 2.11), which might
be an indication that the deprotonated (basic) form can be present simultaneously with the acid form
influencing in this way the final colouration of the sensor.
The spectrum of MR when incorporated into the polymeric matrix by comparison with spectra of acid
and basic forms in aqueous solution is presented in figure 2.11. In fact, two components on the MR
spectrum in the polymeric matrix are observed which can be assigned to the basic and acid forms of
the indicator with the greater component belonging to the basic form. The wavelength at maximum
absorbance for the (PEI/PAA)16 with adsorbed MR system appears at 425nm for the basic form and at
555nm for the acid form.
Fig. 2.11: Absorbance spectra of the MR sensor (dye in PEMs (PEI/PAA)16 with MR system) compared with the MR dye in aqueous solution when submitted to pH2 and pH9 buffer solutions (normalised spectrum).
The determination of the pKa value for the MR indicator incorporated in the film can also give an
indication about the behavior of the MR indicator when incorporated in the polymeric matrix and
hence, on the sensor performance. The response of the system to several buffer solutions with different
pH values is presented in figure 2.12.
Above pH 8 a dye releasing from the system is observed. MR is an anionic dye and is connected to the
(PEI/PAA)16 system mainly by electrostatic forces. Dye releasing from PEMs films is accelerated in
environments with higher ionic strength due to the shield effect, where the ionic interactions between
the MR dye and the PEMs films are shielded (Sato et al., 2009).
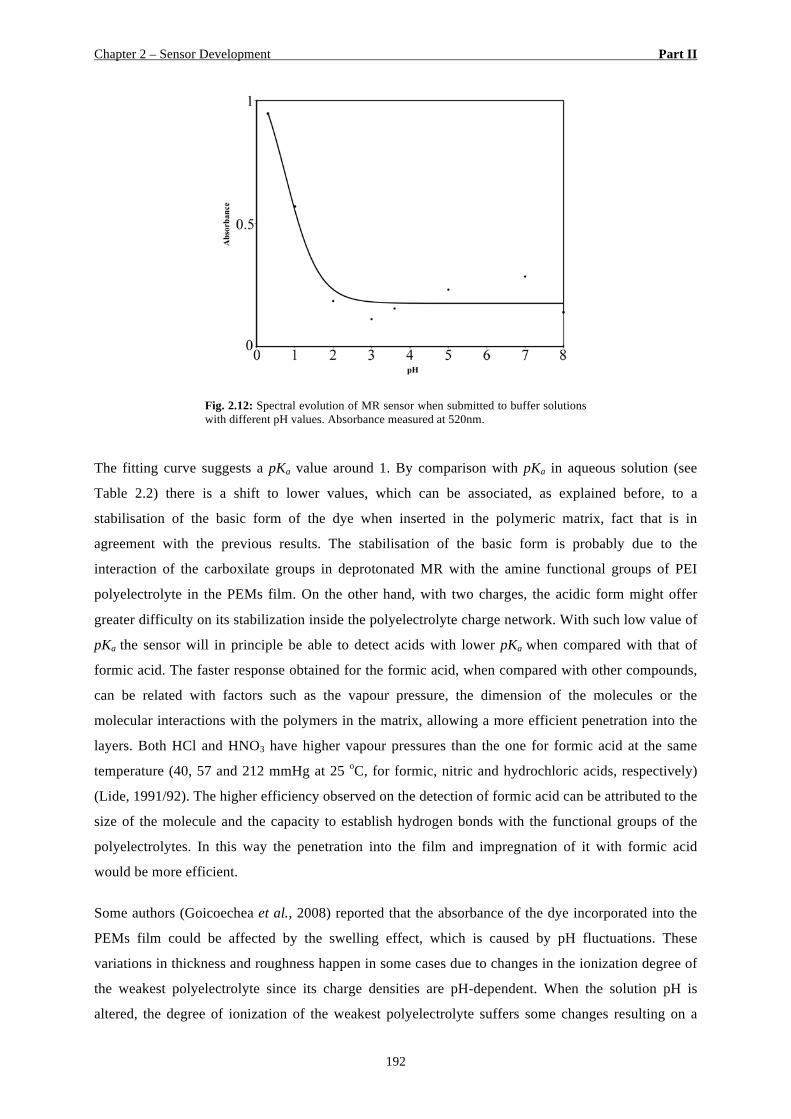
Chapter 2 – Sensor Development Part II
192
Fig. 2.12: Spectral evolution of MR sensor when submitted to buffer solutions with different pH values. Absorbance measured at 520nm.
The fitting curve suggests a pKa value around 1. By comparison with pKa in aqueous solution (see
Table 2.2) there is a shift to lower values, which can be associated, as explained before, to a
stabilisation of the basic form of the dye when inserted in the polymeric matrix, fact that is in
agreement with the previous results. The stabilisation of the basic form is probably due to the
interaction of the carboxilate groups in deprotonated MR with the amine functional groups of PEI
polyelectrolyte in the PEMs film. On the other hand, with two charges, the acidic form might offer
greater difficulty on its stabilization inside the polyelectrolyte charge network. With such low value of
pKa the sensor will in principle be able to detect acids with lower pKa when compared with that of
formic acid. The faster response obtained for the formic acid, when compared with other compounds,
can be related with factors such as the vapour pressure, the dimension of the molecules or the
molecular interactions with the polymers in the matrix, allowing a more efficient penetration into the
layers. Both HCl and HNO3 have higher vapour pressures than the one for formic acid at the same
temperature (40, 57 and 212 mmHg at 25 oC, for formic, nitric and hydrochloric acids, respectively)
(Lide, 1991/92). The higher efficiency observed on the detection of formic acid can be attributed to the
size of the molecule and the capacity to establish hydrogen bonds with the functional groups of the
polyelectrolytes. In this way the penetration into the film and impregnation of it with formic acid
would be more efficient.
Some authors (Goicoechea et al., 2008) reported that the absorbance of the dye incorporated into the
PEMs film could be affected by the swelling effect, which is caused by pH fluctuations. These
variations in thickness and roughness happen in some cases due to changes in the ionization degree of
the weakest polyelectrolyte since its charge densities are pH-dependent. When the solution pH is
altered, the degree of ionization of the weakest polyelectrolyte suffers some changes resulting on a
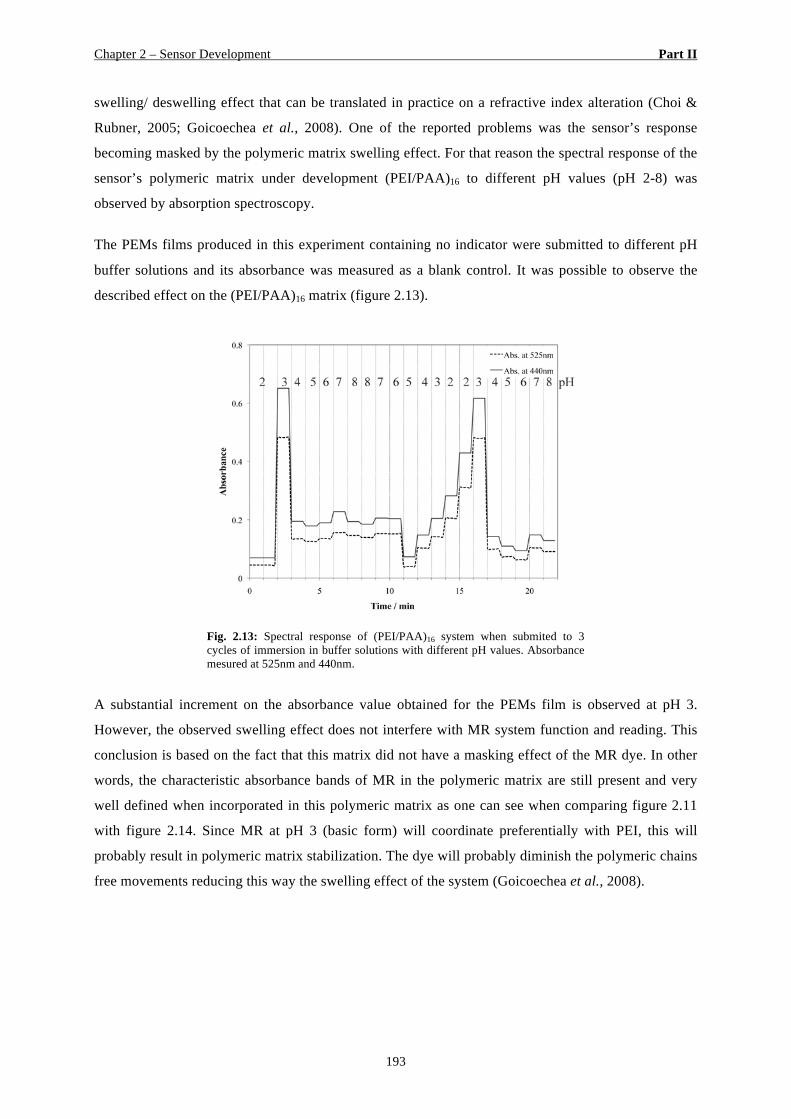
Chapter 2 – Sensor Development Part II
193
swelling/ deswelling effect that can be translated in practice on a refractive index alteration (Choi &
Rubner, 2005; Goicoechea et al., 2008). One of the reported problems was the sensor’s response
becoming masked by the polymeric matrix swelling effect. For that reason the spectral response of the
sensor’s polymeric matrix under development (PEI/PAA)16 to different pH values (pH 2-8) was
observed by absorption spectroscopy.
The PEMs films produced in this experiment containing no indicator were submitted to different pH
buffer solutions and its absorbance was measured as a blank control. It was possible to observe the
described effect on the (PEI/PAA)16 matrix (figure 2.13).
Fig. 2.13: Spectral response of (PEI/PAA)16 system when submited to 3 cycles of immersion in buffer solutions with different pH values. Absorbance mesured at 525nm and 440nm.
A substantial increment on the absorbance value obtained for the PEMs film is observed at pH 3.
However, the observed swelling effect does not interfere with MR system function and reading. This
conclusion is based on the fact that this matrix did not have a masking effect of the MR dye. In other
words, the characteristic absorbance bands of MR in the polymeric matrix are still present and very
well defined when incorporated in this polymeric matrix as one can see when comparing figure 2.11
with figure 2.14. Since MR at pH 3 (basic form) will coordinate preferentially with PEI, this will
probably result in polymeric matrix stabilization. The dye will probably diminish the polymeric chains
free movements reducing this way the swelling effect of the system (Goicoechea et al., 2008).
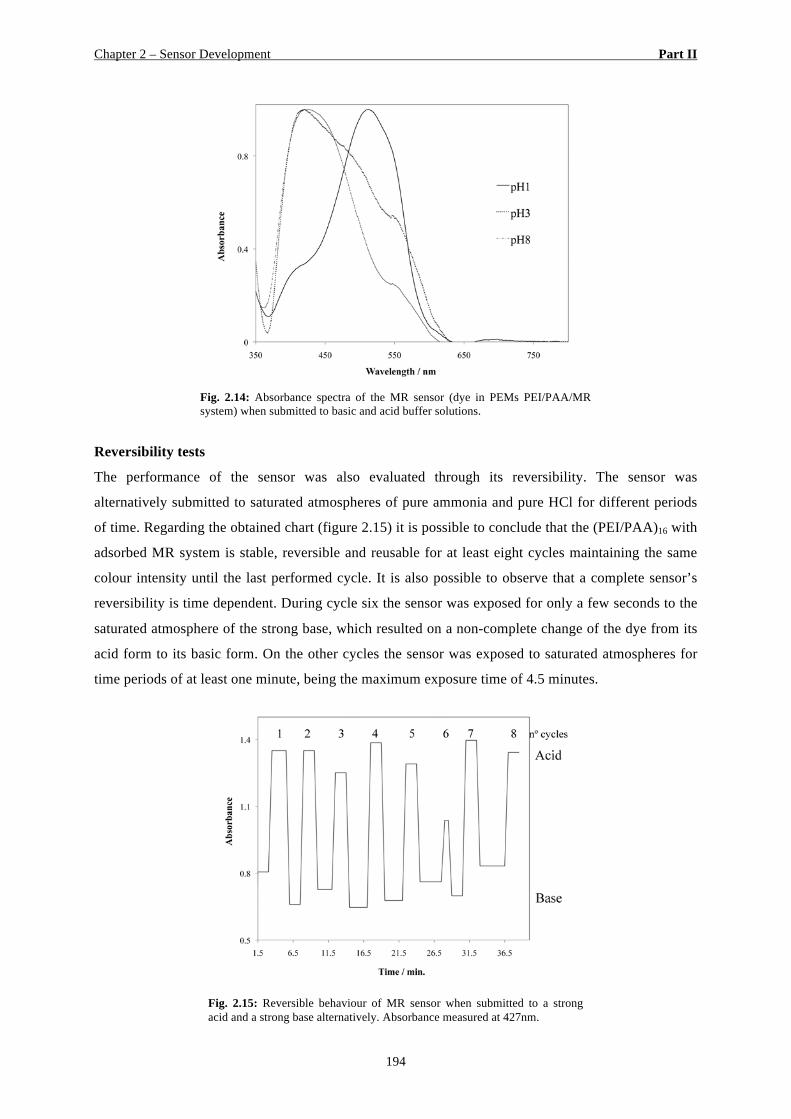
Chapter 2 – Sensor Development Part II
194
Fig. 2.14: Absorbance spectra of the MR sensor (dye in PEMs PEI/PAA/MR system) when submitted to basic and acid buffer solutions.
Reversibility tests
The performance of the sensor was also evaluated through its reversibility. The sensor was
alternatively submitted to saturated atmospheres of pure ammonia and pure HCl for different periods
of time. Regarding the obtained chart (figure 2.15) it is possible to conclude that the (PEI/PAA)16 with
adsorbed MR system is stable, reversible and reusable for at least eight cycles maintaining the same
colour intensity until the last performed cycle. It is also possible to observe that a complete sensor’s
reversibility is time dependent. During cycle six the sensor was exposed for only a few seconds to the
saturated atmosphere of the strong base, which resulted on a non-complete change of the dye from its
acid form to its basic form. On the other cycles the sensor was exposed to saturated atmospheres for
time periods of at least one minute, being the maximum exposure time of 4.5 minutes.
Fig. 2.15: Reversible behaviour of MR sensor when submitted to a strong acid and a strong base alternatively. Absorbance measured at 427nm.
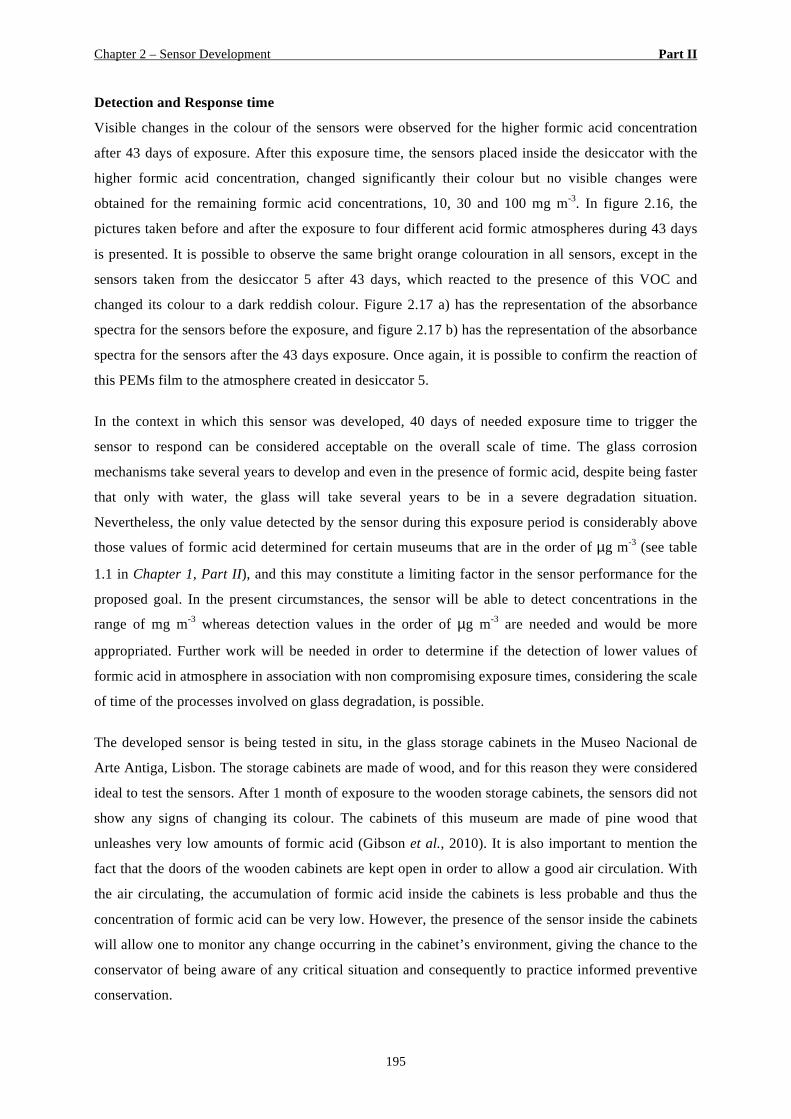
Chapter 2 – Sensor Development Part II
195
Detection and Response time
Visible changes in the colour of the sensors were observed for the higher formic acid concentration
after 43 days of exposure. After this exposure time, the sensors placed inside the desiccator with the
higher formic acid concentration, changed significantly their colour but no visible changes were
obtained for the remaining formic acid concentrations, 10, 30 and 100 mg m-3. In figure 2.16, the
pictures taken before and after the exposure to four different acid formic atmospheres during 43 days
is presented. It is possible to observe the same bright orange colouration in all sensors, except in the
sensors taken from the desiccator 5 after 43 days, which reacted to the presence of this VOC and
changed its colour to a dark reddish colour. Figure 2.17 a) has the representation of the absorbance
spectra for the sensors before the exposure, and figure 2.17 b) has the representation of the absorbance
spectra for the sensors after the 43 days exposure. Once again, it is possible to confirm the reaction of
this PEMs film to the atmosphere created in desiccator 5.
In the context in which this sensor was developed, 40 days of needed exposure time to trigger the
sensor to respond can be considered acceptable on the overall scale of time. The glass corrosion
mechanisms take several years to develop and even in the presence of formic acid, despite being faster
that only with water, the glass will take several years to be in a severe degradation situation.
Nevertheless, the only value detected by the sensor during this exposure period is considerably above
those values of formic acid determined for certain museums that are in the order of µg m-3 (see table
1.1 in Chapter 1, Part II), and this may constitute a limiting factor in the sensor performance for the
proposed goal. In the present circumstances, the sensor will be able to detect concentrations in the
range of mg m-3 whereas detection values in the order of µg m-3 are needed and would be more
appropriated. Further work will be needed in order to determine if the detection of lower values of
formic acid in atmosphere in association with non compromising exposure times, considering the scale
of time of the processes involved on glass degradation, is possible.
The developed sensor is being tested in situ, in the glass storage cabinets in the Museo Nacional de
Arte Antiga, Lisbon. The storage cabinets are made of wood, and for this reason they were considered
ideal to test the sensors. After 1 month of exposure to the wooden storage cabinets, the sensors did not
show any signs of changing its colour. The cabinets of this museum are made of pine wood that
unleashes very low amounts of formic acid (Gibson et al., 2010). It is also important to mention the
fact that the doors of the wooden cabinets are kept open in order to allow a good air circulation. With
the air circulating, the accumulation of formic acid inside the cabinets is less probable and thus the
concentration of formic acid can be very low. However, the presence of the sensor inside the cabinets
will allow one to monitor any change occurring in the cabinet’s environment, giving the chance to the
conservator of being aware of any critical situation and consequently to practice informed preventive
conservation.
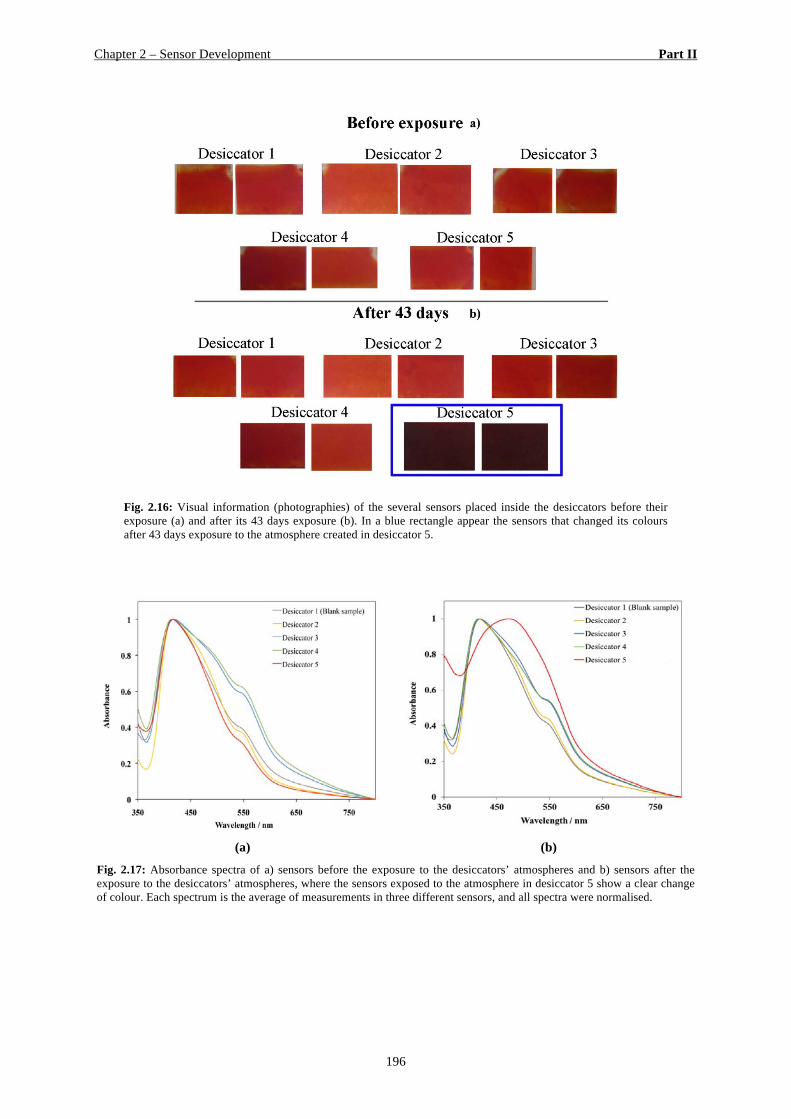
Chapter 2 – Sensor Development Part II
196
Fig. 2.16: Visual information (photographies) of the several sensors placed inside the desiccators before their exposure (a) and after its 43 days exposure (b). In a blue rectangle appear the sensors that changed its colours after 43 days exposure to the atmosphere created in desiccator 5.
(a) (b)
Fig. 2.17: Absorbance spectra of a) sensors before the exposure to the desiccators’ atmospheres and b) sensors after the exposure to the desiccators’ atmospheres, where the sensors exposed to the atmosphere in desiccator 5 show a clear change of colour. Each spectrum is the average of measurements in three different sensors, and all spectra were normalised.
Chapter 2 – Sensor Development Part II
197
2.3 Conclusions
Five acid-base indicators, BTB, MV, EB, CR and MR were successfully adsorbed in an LbL matrix of
PEI/PAA at pH values of 7.5 and 3.5 respectively. (PEI/PAA)16(pH 7.5/3.5) matrix showed good film
homogeneity with all the tested dyes and after 30min adsorption via dye diffusion process all the
systems had enough dye to be perceptible and vivid to the naked eye.
With the purpose of further develop an optical sensor for the detection of indoor formic acid vapours
all the dyes adsorbed in (PEI/PAA)16(pH 7.5/ 3.5) matrix were characterised and the first approach
was the determination of the pKa values for each dye in the LbL matrix. It was possible to conclude
that pKa value for all the dyes tended to drop with the exception of BTB that remains almost the same
when compared with its pKa in aqueous solution, being for this reason excluded from the following
tests. Also MV dye was excluded because once its adsorbed in (PEI/PAA)16 it cannot hold the colour
change whenever submitted to an acidic vapour, preventing the carrying out of measurements at the
rate at which the colours switches.
Following tests evaluated the sensibility of the remaining dyes (MR, EB, CR) adsorbed in
(PEI/PAA)16 to several acids (pure vapours), where it was possible to determine that (PEI/PAA)16 with
MR was the one reacting to less substances in the same exposure time (hydrochloric and formic acids)
and to nitric acid after 1 hour exposure.
The light stability of MR, CR and EB in (PEI/PAA)16 was evaluated being the MR dye the less
susceptible to photodegradation.
Being MR the most promissory dye it was tested in other LbL matrices ((PEI/PSS)16 assembled at pH
3.5/7.5, (PPV/PAA)16 assembled at pH 7.3/3.5, and (PEI/PAA)16 assembled at pH 3.5/3.5), however,
the best tested matrix was (PEI/PAA)16 assembled at pH 7.5/3.5.
Swelling effect of (PEI/PAA)16(pH 7.3/3.5) was evaluated in order to determine if it would mask the
MR reaction to acidic species which was not verified. The reversibility of this system with MR was
also verified for at least eight cycles.
(PEI/PAA)16 (pH 7.3/3.5) with adsorbed MR showed good and promising results for further
application as optical sensor for gaseous formic acid.
The developed sensor is able to detect formic acid concentration present in the atmosphere in the range
of mg m-3 during an exposure time that can be considered acceptable on the scale of time of the
processes involved on glass degradation. The simulated atmospheres are however considerably above
the ones typically present in museums, which have presented issues on glass preservation.

Chapter 2 – Sensor Development Part II
198
Future work will be needed to assess exposure times required to detect lower concentrations and thus
determine whether the sensor is suitable for use in the preventive conservation of glassware exposed in
museums.
Final remarks and future work
199
Final remarks and future work
The results presented in this thesis are the outcome of a multidisciplinary investigation that began with
the study of historical data about glass production from the 17th and 18th centuries. This study had in
mind the aesthetic taste and the influences it suffered through times, the importing and exporting
tendencies from certain production locations, and the raw materials employed in its manufacture. If in
some regions the production of glass is thoroughly studied (e.g. Murano glass production), the
knowledge on glass production in Portugal during the early modern period and how was it related with
the glass production in Europe, remains vague. The study on historical background allowed one to
conclude that the production of glass in Portugal existed, and during certain periods of time it was
considered of good quality and comparable (in terms of quality) to glass produced in other European
production centres. With this in mind, several representative glass objects were selected from available
archaeological assemblages excavated in the Portuguese territory, in order to be studied from the
formal and chemical points of view. The main purpose of this investigation was the study of the raw
materials employed in the glass manufacture, and finally, the attribution of a probable provenance to
the objects being studied. Since no furnaces were so far excavated in the Portuguese territory in order
to provide production remains to be analysed, to accomplish these goals, it was fundamental to
characterise the types of glass, chemically speaking, circulating in Portuguese territory. This
information allowed one to speculate about the most probable glass types being produced in Portugal,
and also to discuss on the most probable employed raw materials. This information allowed also one
to propose certain European regions from where Portugal imported glass. Another important aspect
proposed in this work, was the identification of unique compositional and stylistic features capable of
characterising the glass objects produced in Portugal, and distinguish it from glass objects produced in
other European centres.
In this archaeometric investigation, the chemical composition of more than 200 archaeological glass
fragments was obtained through analytical techniques such as µ-PIXE and LA-ICP-MS. The obtained
Final remarks and future work
200
results were treated employing statistical methods, which helped on the extraction of the maximum
information contained in these data. The archaeometric approach was applied with the final intent of
identifying the raw materials used in the glass production, and attributing a provenance to as many
objects as possible. As a consequence of this study, it was possible to propose some trading relations
between Portugal and other European regions. The aspect of the trading relations is considered of high
importance, in order to understand the society’s economical aspects and its social and political
operating systems (Tykot 2004, pp.407).
The research in the literature allowed one to take notice of several documents attesting the quantity
and quality of the glass production in Portugal, in such a way that led kings to forbid the income of
foreigner glass. On the other hand, it was also possible to become aware of other documents (mainly
from foreigner people visiting Portugal) that say otherwise. In these documents it is said that the glass
production in Portugal was almost inexistent and of poor quality. It is important to notice that the
countries of origin of these foreigners had commercial or trading interests with Portugal, making one
wonder if these statements were to be trusted or were mere played policies.
As far as the glass assemblages being studied are concerned, the first conclusion is that a considerably
high number of glass objects circulated in the Portuguese territory between the 17th and the 18th
centuries. A soda-rich glass type composes the great majority of these assemblages.
The glass assemblages being studied here came from different social origins (monasteries, palaces and
middle class houses), which allowed one to observe if the glass used among these ambiences was
related or if the social and financial status were translated in the objects owned by them.
Looking to the assemblages selected to be part of this study, the Santa Clara-a-Velha monastery set
was identified as the one being composed with the most prized objects. Within this assemblage,
several façon-de-Venise objects were identified, as well as several decorative techniques including the
gilding decoration. This assemblage is followed in richness by the São João de Tarouca monastery set,
the other assemblage belonging to a clergy environment. In this set, one can also find façon-de-Venise
objects, however more utilitarian glass is identified. The two monastic assemblages show how luxury
items surrounded the clergy, thereby contradicting all their ideals of renunciation to mundane goods. It
also shows that this social class was the one with a broader access to the goods entering in Portuguese
territory. These two monasteries, one female (Santa Clara-a-Velha monastery) and one male (São João
de Tarouca monastery), belong to two different religious orders; it was possible to find some glass
objects from both these assemblages which are related in chemical composition, meaning that these
two monasteries probably had a common glass production location from where objects were bought.
From Praça Miguel Fernandes assemblage, some façon-de-Venise objects were also identified,
however it is possible to understand that the objects have a more utilitarian nature. This glass set
Final remarks and future work
201
provided the unique opportunity of analysing glass objects from the medieval period, since this
excavation involved contexts dated from the 14th to the 17th centuries.
In what regards the assemblage from the Coimbra University courtyard, it is mainly composed by
utilitarian objects such as oil-lamps and small flasks; however a remarkable object was identified: a
globular flask with gilded decoration that was submitted to a broader investigation and discussed in
this thesis.
Finally, from the two excavations situated in Lisbon (Museu do Teatro Romano and Rua do Arsenal),
the unearthed material was mainly composed by wine bottles, which can be more recently dated.
These two glass assemblages are richer in utilitarian objects present in diverse compositional types.
As far as the chemical composition of the six sets being studied is concerned, one of the main
conclusions achieved in this investigation was that the glass type circulating in Portuguese territory
(either produced here or imported) and dated to between the 14th and 17th centuries, was of a soda-rich
composition, with Venetian forms present in the repertoire of shapes. Until the end of the 17th century,
Portugal followed a Mediterranean tradition concerning the production of glass. In the case of the
glass being imported, this means that the commercial trading in glass with the North and Central
European areas was low or inexistent. According to the literature, also Spain followed a Mediterranean
tradition concerning the glass production, this meaning that soda-rich compositions were generalised
through the Iberian Peninsula. Soda-rich glass was strongly present (so far exclusive!) in the four older
assemblages dated until the 17th century: Santa Clara-a-Velha monastery, São João de Tarouca
monastery, Praça Miguel Fernandes in Beja and the courtyard in Coimbra University.
The other compositional types here identified were: HLLA glass, potassium rich glass and lead glass.
These compositional types are present in majority (with the exception of only two fragments) in the
glass assemblages from Lisbon. This can be analysed from different angles: these two assemblages
from Lisbon have a more recent chronology, which can go up to the end of the 18th/ beginning of the
19th centuries what might justify the presence of these compositions that were more common from the
18th century onwards; and the other important factor is that Lisbon was the economical and trading
centre of the country, where ships loaded with goods from all around Europe arrived with new
products to be traded. This last statement means that all the novelties in terms of glass chemical
composition that were happening in production centres as Central Europe or the British Isles, were
arriving in Lisbon to be traded. These are the hypothesis assuming that the objects were imported.
Considering a Portuguese production, these objects were probably made in a production centre
employing foreigner glassmakers like Coina glass manufactory or the Salvaterra de Magos
manufactory (that had a contract with German entrepreneurs to produced glass in Bohemian style), and
would be probably sold and distributed first in the capital. Considering both possibilities, of importing
Final remarks and future work
202
or of national production, this shows that Portugal was updated in relation to what was being
developed in other parts of Europe. This fact had already been put to evidence in other published
works (Pulido Valente et al., 2016, in press; Coutinho et al., n.d., in press).
The first results presented concerned the older glass set dated to between the 14th and 15th centuries
that came from the excavation in Praça Miguel Fernandes, Beja. Eleven fragments from this
chronology were studied, and one fragment with Venetian origin was identified. In terms of shape, this
fragment can be related with the Central European production, since it’s a prunt from a prunted beaker
(known as Krautstrunk). However, beakers of this kind had already been identified elsewhere as a
Venetian production due to its chemical composition. Instead of being a Central European forest glass
composition (rich in potassium), this prunt from Praça Miguel Fernandes assemblage has a soda-rich
composition compatible with a Venetian production, both in terms of major and minor elements. The
study of this assemblage, allowed one to prove the existence of a commercial relationship between
Portugal and Venice, and to attest the presence of genuine Venetian glass in the Portuguese territory
from as early as the 14th century, fact already proposed during the study of an enamelled beaker (of the
Aldrevandin type) found in an archaeological excavation in Lisbon and dated to the 14th century
(Medici, 2008). From this assemblage, other fragments were stylistically identified as possible
Venetian productions, but their composition cannot be related with Venetian glass. The other analysed
fragments are, in terms of composition, related with the Mediterranean tradition, but cannot be
compared with any of the known coeval production centres. Also due to the utilitarian character of the
glass objects, a local provenance has to be considered.
In what regards the Venetian and façon-de-Venise glass amongst the studied sets, genuine Venetian
glass objects dated to the 17th century were so far identified only in the Santa Clara-a-Velha monastery
assemblage (SCV-V191, SCV-V193, SCV-V195 and SCV-V408). The façon-de-Venise fragments
from Praça Miguel Fernandes (Beja) were made either from the same silica source or from highly
related or geographically close silica sources. This assemblage seems to have a different silica source
in comparison with the façon-de-Venise fragments from the other sets, which is richer in impurities
such as alumina, and it is proposed that these fragments were produced in a façon-de-Venise
production centre yet to be discovered. Two façon-de-Venise fragments with more than 6 wt% of
alumina, were identified: one from the Santa Clara-a-Velha Monastery set (SCV-V194) and the other
from Praça Miguel Fernandes (Beja) set (PMF0540). The titanium oxide content in these two
fragments is very close, which remits for silica from the same source. These two fragments were
probably made in the same production centre. When inspecting some flux characteristics, it became
clear that the fragments subdivided between two different groups, distinguished by the purity of the
ashes employed in their manufacture. The majority of Praça Miguel Fernandes (Beja) façon-de-Venise
fragments were made with purified ashes and are very close to the cristallo boundaries. Highly related
Final remarks and future work
203
to the Praça Miguel Fernandes samples is also a previously analysed millefiori fragment from SCV
(Lima et al., 2012), indicating that these glasses might have been made using raw materials from the
same sources or have the same provenance.
Concerning the São João de Tarouca monastery group, all the analysed façon-de-Venise samples are
very similar in terms of composition, and were also made using purified ashes, however it was not
possible to relate them with any of the known façon-de-Venise production centres in Europe, mainly
because of the medium alumina contents, close to 3 wt%. Again, it is proposed that these samples
were also made in a façon-de-Venise production centre yet to be discovered. A general feature of all
the analysed façon-de-Venise glass, is that the MnO contents is below 1 wt%, which implies that no
attempt was made to discolour the batch. Iron and manganese oxides entered the glass composition
through the silica source. Their concentration and correlation supports the idea that the silica sources
used in these glasses were of high purity and chosen carefully to produce façon-de-Venise objects and
not just ordinary glass. Another important aspect was the identification of cobalt in façon-de-Venise
objects, which, as far as we know, has rarely been mentioned. Finally, the existence of two groups of
façon-de-Venise glass (most Praça Miguel Fernandes (Beja) samples and other group with most São
João de Tarouca monastery samples), whose composition demonstrates the attempt in employing pure
raw materials, but present unique features (as the medium and high alumina levels), allows one to
propose the identification of two new façon-de-Venise production centres.
Looking to unique shapes, the vessels in gourd shape were spread in the Portuguese territory, as far as
it is known this shape was not found in other European contexts. Their chemical composition has a
generalised presence of high alumina contents, which reinforces the hypothesis of these objects being
produced in national territory. The gourds in study here are from the Santa Clara-a-Velha monastery
and São João de Tarouca monastery assemblages. These vessels show a close relation in terms of
composition between fragments from both sets. The majority of the gourds share a type of chemical
composition highly related, mainly in terms of silica source. This typology is considered an heritage
from the Arab occupation and for the reasons described above and the lack of its presence in other
coeval European glass production centres known so far, the gourd is considered of probable
Portuguese production. In this case it was possible to relate a certain chemical composition to a
specific typology.
Looking to the mould blown decorated objects, this decorative feature was the one present in a higher
number of objects. Among the objects from this category, glass with very high alumina levels was
identified, being these mainly from the Santa Clara-a-Velha monastery assemblage. A local production
is proposed for those objects. A specific mould blown decoration pattern that is so far unique and
exclusive for the objects found in Portuguese territory, was identified. The pattern is a four-petalled
flower that appears embossed inside a lozenge motif. Since no parallel outside Portugal was so far
Final remarks and future work
204
identified for this kind of decoration, for the fragments presenting it, a national production was
proposed. To conclude about the mould blown decorated objects, once again the glass presenting high
and very high alumina levels are the ones considered as locally made. For the other mould-blown glass
objects, a national or local production is not however discarded. Common patterns like the bossed
beakers or the lozenge motif were identified in some vessels. For these objects it was not possible to
find parallels for its composition in published literature from coeval European production sites. Being
the majority of these objects utilitarian, a local production has to be considered.
Among the gilded decorated objects, one particular object and its gilding decorative technique was
subject of a more in depth study. Both the chemical composition and the thickness of the applied gold
foil were proved to be in accordance with the gold leaf used in the Iberian Peninsula during the 17th
and 18th centuries. The gilding technique was based in the use of a lead-based mordant that allowed
one to reheat the objects at a lower temperature than the softening point of the glass underneath, acting
as a flux on the glass surface, and attaching the gold leaf. This gilding technique is mentioned in
ancient recipes, which revealed lead compounds in the mordant’s formulation, but as far as it is
known, it has never been found in historical glass objects. However, this technique is currently in use
in Murano, where the tradition of enamelling and gilding on glass flourished from the middle of the
15th century onwards. Although in presence of a gilding technique of apparent Venetian tradition, the
glass composition, mainly because of its high alumina content (ca. 4 wt%), prevents us from placing
the origin of the flask in Venice or in any other of the known façon-de-Venise production centres. The
comparison with other contemporaneous glass objects also found in Coimbra pointed out a strong
similarity with items considered of possible Portuguese origin, not only in terms of chemical
composition but also concerning the object’s shape, quite common among archaeological glass dated
to the 17th century and found in Portugal. Concerning the chemical composition of the gold leaf, it was
possible to estimate an Au-Ag alloy with a composition between 22 and 23 carats, and with ca. 1µm in
thickness. Also the chemical composition of the gold (in major elements) proved to be in accordance
with the gold leaf used in Portugal (in the regions of Coimbra and Aveiro) during the 17th and 18th
centuries. The trace elements of the gold allowed one to propose that it might have come from both the
West and Eastern African coasts, which were exploited by the Portuguese until mid-17th century. Even
though the origin of the gilded flask cannot be indubitably attributed, according to these evidences a
local provenance cannot be excluded.
HLLA glass was the second larger type to be identified, which appears in the assemblages excavated
in Lisbon. This glass type appears related only to one object: the wine bottle. Between the two sets
(Teatro Romano museum and Rua do Arsenal, both in Lisbon), different bottle shapes were identified,
and these shapes were related to different chronologies. In terms of chemical composition, the Teatro
Romano museum assemblage presents a very heterogeneous one, which probably implies that the
Final remarks and future work
205
bottles from this set were produced in different production localities that used raw materials from
different origins. On the other hand, a large number of bottles from the Rua do Arsenal assemblage
appear related, suggesting that these bottles were manufacture in the same production centre or in
different centres using geographically related raw materials. Comparing with values from the
literature, Teatro Romano museum and Rua do Arsenal assemblages have no match with the bottles
analysed from the Coina glass manufactory; instead their chemical composition can be compared with
some English production sites. It is however important to mention that only a very small amount of
fragments from the Coina glass manufactory were studied and analysed, which is definitely not
enough to characterise an entire production; and also the bottle production in Portugal was for sure not
exclusively made in the Coina glass manufactory. This item was being produced in other national
glass production centres as the Côvo glass manufacture for instance.
Potassium-rich glass objects were only found in the two assemblages excavated in Lisbon. These two
sets are the ones that have a more recent chronology, where Rua do Arsenal assemblage has objects
dated up to the beginning of the 19th century. All the potassium-rich glass samples are made of
discoloured glass, and most of them present engraved, enamelled or mould blown decorations. It was
verified that the majority of analysed samples can be classified as white glass, and due to their
decoration features it is proposed that these glass objects were attempts on imitating the glass
developed and produced in the Central European regions. Comparing the obtained results with
published data from known production centres such as Bohemia, Germany and so on, it was concluded
that the majority of samples can be related with the production of potassium-rich glass from the Coina
glass manufactory, and no genuine Central European glass could be identified. For the majority of
these objects, a national production is considered; being also important to mention again that Central
European glassmakers worked in the Coina glass manufactory, as well as in the Salvaterra de Magos
furnace. These Portuguese production locations were probably using Central European recipes for
making glass.
Mixed alkali glass objects represent only a very small percentage of all the analysed samples. Only
seven fragments were identified with this composition, and no obvious relation between fragments
was found, with the exception of both objects belonging to the courtyard in Coimbra University
assemblage that have a highly related chemical composition. For the fragments from the courtyard in
Coimbra University, is it proposed that they share the same provenance, since their chemical
composition have an almost perfect match. Due to the very low amount of samples from this category
it is raised the hypothesis that these glass objects were not produced on purpose with this composition,
but were instead the result of employing different proportions of raw materials or using different
source of raw materials.
Final remarks and future work
206
On the topic of the lead glass fragments, only five examples were identified and only one does not
belong to the Lisbon assemblages. Three of these fragments can be related with each other and their
composition is similar to the composition used in Silkstone, England. For both fragments from Rua do
Arsenal assemblage, their trace elements and REE analysis showed that their signature is identical and
for this reason is highly suggested that both fragments had the same source of raw materials and
probably came from the same production centre. No fragment could be compared with the fragments
analysed from the Coina glass manufactory, however it is important to remind that only a few
fragments were analysed from this production centre, and more analysis are required in order to
characterise the production in Coina.
With an overall look to the glass assemblages and their chemical compositions, it is possible to
conclude that utilitarian fragments from Santa Clara-a-Velha monastery set are very chemically alike,
which allows one to propose a national provenance for these fragments, even perhaps a local
production. On the other assemblages it is possible to observe some diversity among compositions for
the utilitarian objects, which does not necessarily imply a different provenance. It can be the
translation of the lack of choice in the employed raw materials or in other words, the raw materials
were not carefully selected to the production of utilitarian glass. The same production centre could be
employing raw materials from more than one location over time and this could happen because of
financial reasons or the availability of raw materials. This would result in different chemical
compositions over time. In the Praça Miguel Fernandes assemblage analysis, fragments dated from the
14th to the 15th century were also analysed and it was possible to observe that in the statistical tree
clustering these older fragments were separated from the recent ones, however it is possible to observe
some similarities in the silica impurities. Again, the alumina and iron oxide contents of these older
glass objects can be related to some of the more recent ones and it is possible to propose that perhaps
these fragments are part of a local continuous production. The changing in recipes and sources of
some raw materials would justify the differences in some oxides from the composition, and the usage
of the same silica source (or different silica sources related geographically), would justify the
similarities found between different dated fragments.
Finally, it is important to reinforce that the novelties in terms of glass compositions were arriving in
Portugal in short periods after they were first formulated; genuine Venetian glass was found in the
Portuguese territory as soon as the 14th century (fig.1), potassium-rich glass formulated in Central
European regions in the end of the 17th/ beginning of the 18th centuries was found in assemblages
dated to the beginning of the 18th century, and finally, lead crystal glass formulated in the British Isles
in the first half of the 18th century was found in assemblages dated from the same period.
Gourds, four-petalled flowers in mould blown patterns and chemical compositions with high alumina
contents are considered the features that, so far, can be proposed for a national provenance, however
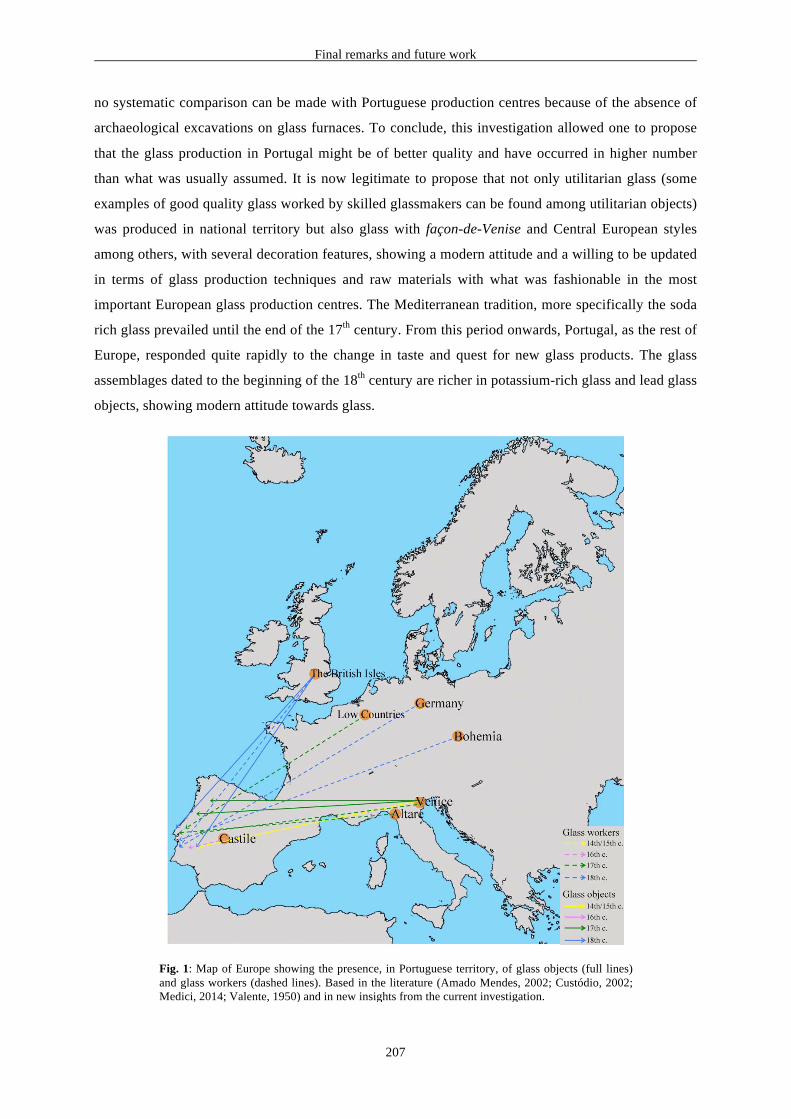
Final remarks and future work
207
no systematic comparison can be made with Portuguese production centres because of the absence of
archaeological excavations on glass furnaces. To conclude, this investigation allowed one to propose
that the glass production in Portugal might be of better quality and have occurred in higher number
than what was usually assumed. It is now legitimate to propose that not only utilitarian glass (some
examples of good quality glass worked by skilled glassmakers can be found among utilitarian objects)
was produced in national territory but also glass with façon-de-Venise and Central European styles
among others, with several decoration features, showing a modern attitude and a willing to be updated
in terms of glass production techniques and raw materials with what was fashionable in the most
important European glass production centres. The Mediterranean tradition, more specifically the soda
rich glass prevailed until the end of the 17th century. From this period onwards, Portugal, as the rest of
Europe, responded quite rapidly to the change in taste and quest for new glass products. The glass
assemblages dated to the beginning of the 18th century are richer in potassium-rich glass and lead glass
objects, showing modern attitude towards glass.
Fig. 1: Map of Europe showing the presence, in Portuguese territory, of glass objects (full lines) and glass workers (dashed lines). Based in the literature (Amado Mendes, 2002; Custódio, 2002; Medici, 2014; Valente, 1950) and in new insights from the current investigation.
Final remarks and future work
208
For the preservation of a legacy as important as glass, the preventive conservation of the glass
assemblages was also part of this project. It was proposed the design of an optical sensor for the
detection of the organic volatile compound formic acid.
In what concerns the sensor development, two different matrixes (sol-gel and polyelectrolytes by LbL
deposition) and several dyes (acid-base indicators and solvatochromic dyes), were tested in order to
define the better matrix / dye combination to be specific for the formic acid vapours identification.
The matrix showing a best performance was the one using the polyelectrolytes through the layer-by-
layer deposition method. Among the acid-base indicators and solvatochromic dye tested, Methyl red
(MR) exhibited the best performance after its incorporation in the polymeric matrix constituted by
both polyethylenimine and poly(acrylic acid).
The sensor produced in this way has demonstrated good selectivity detecting only HCl and HNO3 in
addition to the formic acid. The detection of these two acids was not considered problematic because
they are not expected to exist in the indoor environment of museums.
In general, the most prized characteristics in a sensor are its ability to identify only the desired analyte
(or analytes) in the least time possible and with the lowest limit of detection possible. However, in the
case of the sensor developed during this work, its purpose is to detect the presence of formic acids in
indoor museum environments. For this reason, it is not problematic that it reacts to the presence of
nitric and hydrochloric acids. The presence of these two mentioned acids are not expected in a
museum environment. Another important aspect is the response time. Again, considering the purpose
for which this sensor was developed, taking a few weeks to change his colour is not a problem.
Considering that the time that the sensor takes to change its colour is related with the amount of formic
acid: if the amounts of formic acid in a certain atmosphere are very high, the sensor will take less time
to change its colour. In this situation, it will be necessary to remove the glass exposed to this acid in a
very short time. The sensor has a cumulative effect, meaning that even if the amount of formic acid
present in the atmosphere is low, with time it will trigger the sensor to change its colour. Another
important aspect is that if anything changes in the environment where the sensor is exposed, and for
some reason a higher quantity of volatile formic acid becomes available in the atmosphere, the sensor
will also change his colour.
Future Work suggestions
In terms of future work it is essential to emphasise the needing of archaeological excavations in
locations known to have been places of glass production. It is crucial to find the remaining of glass
production from production locations such as the glass manufacture in Côvo. The remains from
furnaces located in the Portuguese territory need to be analysed and chemically characterised, in order
Final remarks and future work
209
to define compositions and probable used raw materials. This is the most assertive way for the creating
of database concerning the glass production in national territory, for the later comparison with analysis
of objects found all over the territory from non-production locations, such as the case of the
assemblages studied in this thesis and all the objects laying in national museums with probable and not
certain attributed production locations.
It would also be very important as complementary work and for the cases where an archaeological
excavation is not possible, to collect glassmaking raw materials, in this case sand and other silica
sources, because it is the material that suffered less compositional alterations in the last centuries (in
comparison for instance with plants used as an alkali source, and that have their composition
depending for instance from the season in they are harvested). The main idea would be to analyse
these silica sources (already transformed into glass) and compare them, mainly in terms of their
contents in alumina, iron and titanium oxides (plus REE), with the ones found in the analysed glass. If
the contents are similar and the signatures in trace and REE were similar and comparable, it would be
possible to discuss the glass provenances with a higher degree of certainty.
As a proposal of future work it would definitely be very important to study and characterise more
glass assemblages found in the Portuguese territory, starting for instance with the other glass
assemblages studied by T. Medici in her PhD thesis. This way the investigation would be based on a
very complete characterisation done previously. Another suggestion concerning assemblages to be
further analysed it would be very important also to make a deeper investigation and acquire more data
on the glass objects from the Santa Clara-a-Velha monastery. This is so far the assemblage with a
larger number of objects dated from the 17th century unearthed in the Portuguese territory; moreover it
is composed by utilitarian objects and luxury items, giving us the possibility to have a broader view on
the objects possibly produced in the national territory and the objects of probable importation.
Another important subject to consider for future work is the study of historical treatises. It would be
very important to try to identify the presence of recipes from historical treatises circulating in Europe
(as the Antonio Neri’s L’Arte Vetraria), reproduced in the glass through the study of its chemical
composition. Treatises such as Schedula diversarum atrium (Theophilus), L’Arte Vetraria (Antonio
Neri), or the La Sedacina ou l’Œuvre au crible (Guillaume Sedacer), would be very interesting to
study and to try reproducing the recipes they contain, in order to compare with the glass analysis from
historical objects.
In what regards the validation of the sensors, the next important step would be to test them in several
museum environments. This would allow one to observe and evaluate the sensor and its characteristics
in situ. At the same time, it is important to use other techniques to measure the formic acid
concentrations, validating this way the sensor. Moreover, it would be very interesting to observe the
Final remarks and future work
210
sensor’s reaction to different museum environments, with different temperatures and relative humidity
values and study the effect of these in the performance of the sensor.
Another important aspect would be the determination of the exact concentration that triggers the
sensor. From the performed tests it was possible to established that it is necessary an amount superior
to 100 mg m-3 of formic acid to set off the produced sensor, to be in accordance to the concentrations
measured in several wooden cabinets present in museums. Considering all the tests performed to the
sensor, it shows promising results to be an inexpensive and direct alternative to identify the presence
of formic acid. Moreover, during this investigation it was very difficult to currently find a company
available to perform measurements of formic acid in the form of vapours, which comes to emphasize
the necessity of developing in situ sensors without the need of a passive sampling.
211
References
ALMEIDA E SILVA, S. de (2012) Prospecção arqueológica: O Caso da Fábrica de Vidros do Côvo. A Thesis submitted in fulfilment of the Requirements of Universidade do Porto for the Degree of Master of Archaeology. Faculdade de Letras de Universidade do Porto. Porto: Porto University.
AMADO MENDES, J. (2002) A História do Vidro e do Cristal em Portugal. Lisboa: Edições Inapa. ARIGA, K., HILL, J.P. AND JI, Q. (2007) Layer-by-layer Assembly as a Versatile Bottom-up Nanofabrication
Technique for Exploratory Research and Realistic Application. Phys. Chem. Chem. Phys. 9(19). p. 2319–2340.
ARLETTI, R., CONTE, S., VANDINI, M., FIORI, C., BRACCI, S., BACCI, M. & PORCINAI, S. (2011) Florence
baptistery: chemical and mineralogical investigation of glass mosaic tesserae. Journal of Archaeological Science. 38. p. 79-88.
ASHURST, D. (1970) Excavations at Gawber glasshouse, near Barnsley, Yorkshire. Post-Medieval Archaeology.
4. p. 92–140. BABA, A.A., IBRAHIM, L. ADEKOLA, F.A., BALE, R.B., GHOSH, M.K., SHEIK, A.R., PRADHAN, S.R., AYANDA,
O.S. & FOLORUNSHO, I.O. (2014) Hydrometallurgical Processing of Manganese Ores: a Review. Journal of Minerals and Materials Characterization and Engineering. 2. pp.230-247.
BAROVIER, R. & TONINI, C. (2014) Tools to study glass: inventories, paintings and graphic works of the 16th
century. In: Barovier, R. & Tonini, C. (eds.). Study days on Venetian Glass: Approximately 1600’s. Tomo CLXXII, Vol.I. Venice, 27th February to 1st March 2013. Venice: ATTI dell’ Istituto Veneto di Scienze, Lettere ed Arti. pp. 3-34.
BARROS, C. (1998) Real Fábrica de Vidros da Marinha Grande: II centenário, 1769-1969. Leiria: Edições
Magno. BARTHÉLEMY, P. (2002) La Sedacina ou l’Œuvre au crible, L’alchimie de Guillaume Sedacer, carme catalan de
la fin du XIVe siècle. Vol I and II. Paris:S.É.H.A & Milan:Archè, BARRERA, J. & VELDE, B. (1989) A Study of French Medieval Glass Composition. Archéologie Médiévale.
XIX. p. 81–128. BAXTER, M.J. (2006) A review of supervised and unsupervised pattern recognition in archaeometry.
Archaeometry. 48 (4). p. 671-694. BAXTER, M.J. (2008) Cluster analysis. In: Liritzis, I. (ed.). New technologies in the Archaegnostic Sciences.
Athens: Gutenberg Press. (Consulted version in English, Not Published). BAXTER, M.J. & JACKSON, C.M. (2001) Variable selection in artefact compositional studies. Archaeometry. 43
(2). p. 253-268. BLAKELOCK, E. (2007) Bedminster Glue Factory, Bristol - Examination and analysis of glass and glassworking
debris. Research Department Report. Series English Heritage, no. 11/2007. ISSN 1749-8775.
212
BOER, P. & ENGLE, P. (2010) Antonio Neri: An Annotated Bibliography of Primary References. Journal of Glass Studies. 52. p. 51-67.
BRAIN, C. & BRAIN, S. (2015) Drinking glass design around 1670. European Journal of Glass Technology. 56
(4). p. 113-120. BREMS, D., DEGRYSE, P., HASENDONCKS, F., GIMENO, D., SILVESTRI, A., VASSILIEVA, E., LUYPAERS, S. &
HONINGS, J. (2012) Western Mediterranean sand deposits as a raw material for Roman glass production. Journal of Archaeological Science. 39. p. 2897-2907.
BRILL, R. H. (1999). Chemical Analyses of Early Glasses, v. 2, The Tables. Corning, New York: The Corning
Museum of Glass. BRINKER, C.J. & SCHERER, G.W. (1990) The Physics and Chemistry of Sol-Gel processing. San Diego:
Academic Press, Inc. BROWN, S. (2014) Apocalypse: The Great East Window of York Minster. London: Third Millennium Publishing
Limited. CABLE, M. (1987) Glass Technology at Bolsterstone (Appendix I of Excavations at the 17th-18th century
glasshouse at Bolsterstone and the 18th century Bolsterstone pothouse, Stocksbridge, Yorkshire). Post-Medieval Archaeology. 21. p. 147-226.
CAGNO, S., BRONDI BADANO, M., MATHIS, F., STRIVAY, D. & JANSSENS. K. (2012a) Study of medieval glass
fragments from Savona (Italy) and their relation with the glass produced in Altare. Journal of Archaeological Science. 39. p. 2191-2197.
CAGNO, S., FAVARETTO, L., MENDERA, M., IZMER, A., VANHAECKE, F. & JANSSENS. K. (2012b) Evidence of
Early Medieval Soda Ash Glass in the Archaeological Site of San Genesio (Tuscany). Journal of Archaeological Science. 39 (5). p. 1540–1552.
CAGNO, S., JANSSENS, K. & MENDERA, M. (2008) Compositional Analysis of Tuscan Glass Samples: In Search
of Raw Material Fingerprints. Anal Bioanal Chem. 391. p. 1389–1395. CAGNO, S., MENDERA, M., JEFFRIES, T. & JANSSENS, K. (2010) Raw Materials for Medieval to Post-Medieval
Tuscan Glassmaking: New Insight from LA-ICP-MS Analyses. Journal of Archaeological Science. 37. p. 3030–3036.
CALLIGARO, T. (2008) PIXE in the Study of Archaeological and Historical Glass. X-Ray Spectrometry. 37. p.
169–177. CALUWÉ, D. (2005) Archaeological vessel glass of the Late Medieval and Early Modern periods in the former
Duchy of Brabant: an interdisciplinary approach. In Annales du 16th Congrès de l’Association Internationale pour l’Histoire Du Verre (AIHV). London, 7th to 13th September 2003. Nottingham. pp. 219-222.
CALUWÉ, D. (2006) The use of drinking vessels in the context of dining and communal meals. Some preliminary
thoughts drawn on archaeological evidence from medieval and post-medieval periods in Flanders and the Duchy of Brabant (Belgium). Food and History. 4 (1). p. 279-304.
CAMPBELL, J.L., BOYD, N.I., GRASSI, N., BONNICK, P. & MAXWELL, J.A. (2010) The Guelph PIXE software
package IV. Nuclear Instruments and Methods B. 268. p. 3356-3363. CARDOSO, G., SILVA, R.J. DA, MACIEL, R.R.G., SOUZA, N.C. DE & SILVA, J.R. (2012) Roughness control of
layer-by-layer and alternative spray films from Congo red and PAH via laser light irradiation. Materials Sciences and Applications. 3. p. 552-556.
CARMONA, N., HERRERO-HERNANDEZ, E., LLOPIS, J. & VILLEGAS, M.A. (2008) Novel sol–gel reversible
thermochromic materials for environmental sensors. Journal Sol-Gel Technol. 47. p. 31-37.
213
CAPELLÀ GALMÉS, M.À. & ALBERO SANTACREU, D. (2015) El horno de vidrio del siglo XVII de Sa Gerreria (Palma, Mallorca): caontextualización histórica y análisis preliminar de los materiales. Boletin de la Sociedad Española de Cerámica y Vidrio. 54. p. 142-152.
CASELLATO, U.; FENZI, F.; GUERRIERO, P.; SITRAN, S.; VIGATO, P.A.; RUSSO, U.; GALGANI, M; MENDERA, M.
& MANASSE, A. (2003) Medieval and Renaissance Glass Technology inValdelsa (Florence). Part 1: Raw Materials, Sands and Non-Vitreous Finds. Journal of Cultural Heritage. 4. p. 337-353.
CATARINO, H. & FILIPE, S. (2006) Madinat Qulumbriya: arqueologia numa cidade de fronteira. In: Al-Ândalus
espaço de mudança: Balanço de 25 anos de história e arqueologia medievais. Seminário de Homenagem a Juan Zozaya Stabel – Hansen. Susana Gómez Martinez (coord.). Mértola, 16th to 18th May 2005. Mértola: Campo arqueológico de Mértola. pp. 73-85.
CHARLESTON, R.J. (1963) Forward. In: Frothingham, A. W. (author). Spanish Glass. London: Faber. CHATAIGNER, C. & GRATUZE, B. (2014a) New data on the exploitation of obsidian in the southern Caucasus
(Armenia, Georgia) and eastern Turkey, Part 1: source characterization. Archaeometry. 56 (1). p. 25-47. CHATAIGNER, C. & GRATUZE, B. (2014b) New data on the exploitation of obsidian in the southern Caucasus
(Armenia, Georgia) and eastern Turkey, Part 2: obsidian procurement from the upper Palaeolithic to the Late Bronze Age. Archaeometry. 56 (1). p. 48-69.
CHOI, J. & RUBNER, M.F. (2005) Influence of the Degree of Ionization on Weak Polyelectrolyte Multilayer
Assembly. Macromolecules. 38 (1). p. 116–124. CHUNG, A. J. & RUBNER, M.F. (2002). Methods of loading and releasing low molecular weight cationic
molecules in weak polyelectrolyte multilayer films. Langmuir. 18. p. 1176-1183. CÍLOVÁ, Z. & WOITSCH, J. (2012) Potash - a Key Raw Material of Glass Batch for Bohemian Glasses from 14th -
17th Centuries. Journal of Archaeological Science. 39. p. 371–380. CLARK, S. L. & HAMMOND, P. T. (2000) The Role of Secondary Interactions in Selective Electrostatic
Multilayer Deposition. Langmuir. 16. p. 10206-10214. CLARK, D.E.; PANTANO, C.G. & HENCH, L.L. (1979) Corrosion of Glass. New York: Books for Industry. COENTRO, S., MIMOSO, J.M., LIMA, A.M., SILVA, A.S., PAIS, A.N. & MURALHA, V.S.F. (2012) Multi-analytical
identification of pigments and pigment mixtures used in 17th century Portuguese azulejos. Journal of the European Ceramic Society. 32. p. 37-48.
COENTRO, S., TRINDADE, R.A.A., MIRÃO, J., CANDEIAS, A., ALVES, L.C., SILVA, R.M.C. & MURALHA, V.S.F.
(2014) Hispano-Mouresque tiles from the Monastery of Santa Clara-a-Velha (Coimbra, Portugal). Journal of Archaeological Science. 41. p. 21-28.
COLOMBAN, P. (2013) Non-destructive Raman analysis of Ancient glasses and glazes. In: Janssens, K. (ed)
Modern Methods for Analysing Archaeological and Historical Glass. Vol.I. Chichester: Wiley. CONNELLY, N.G.; DAMHUS, T.; HARTSBORN, R.M. & HUTTON, A.T. (eds.) (2005) Nomenclature of Inorganic
Chemistry – IUPAC Recommendations 2005. Cambridge: The Royal Society of Chemistry. COUTINHO, I., GRATUZE, B., ALVES, L.C., MEDICI, T., & VILARIGUES, M. (n.d.) Wine bottles from Lisbon:
archaeometric studies of two archaeological sites dated from the 17th to the 19th century. Archaeometry. In press.
COUTINHO, I., MEDICI, T., COENTRO, S., ALVES, L.C., VILARIGUES, M. (2016) Analysis of medieval glasses from
the archaeological excavation at Avenida Miguel Fernandes in Beja (Portugal). Journal of Medieval Iberian Studies, July, p.1-28.
COUTINHO, I., MEDICI, T., ALVES, L.C., GRATUZE, B. & VILARIGUES, M. (2016b) Provenance studies on façon-
de-Venise glass excavated in Portugal. Journal of Archaeological Science: Reports, 7, p. 437-448.
214
COUTINHO, I., MEDICI, T., SILVA, R.J.C., GRATUZE, B., CATARINO, H. & LIMA, A. (2016c) Gilding on glass: new evidence from a 17th century flask found in Portugal. Journal of Archaeological Science: Reports. 6. p. 293-301.
CROSSLEY, D. (1998) The English glass maker and his search for materials in the 16th and 17th centuries. In:
McCray, P (ed.). The Prehistory and History of Glassmaking Technology. Westerville, Ohio: American Ceramic Society.
CUMMINGS, K.; LANFORD, W.A. & FELDMANN, M. (1998) Weathering of Glass in moist and polluted air.
Nuclear Instruments and Methods in Physics Research B. 136. p. 858-862. CUSTÓDIO, J. (2002) A Real Fábrica de Vidros de Coina (1719-1747) e o vidro em Portugal nos séculos XVII e
XVIII. Lisboa: Instituto Português do Património Arquitectónico. DALKIRANIS, G.G., THERÉZIO, E.M., SILVA, M.A.T. DA, POÇAS, L.C., DUARTE, J.L., LAURETO, E., DIAS, I.F.L.,
TOZONI, J.R., SILVA, R.A. & MARLETTA, A. (2013) Annelingtemperature effects on the azodye photoisomerization processes of layer-by-layer self-assembled poly(p-phenylenevinylene)/Congo red thin films. Journal of Luminescence. 134. p. 842-846.
DARQUE-CERETTI, E., FELDER, E. & AUCOUTURIER, M., (2011) Foil and leaf gilding on cultural artefacts;
forming and adhesion. Revista Matéria. 16 (1). p. 540-559. DAVINSON, S. (2003) Conservation and Restoration of Glass. 2nd edition. Oxford: Butterworth-Heinemann. DE RAEDT, I., JANSSENS, K., & VEEKMAN, J. (2002) On the distinction between 16th and 17th century Venetian
and façon-de-Venise glass. In: Veeckman, J. (ed) Majolica and Glass: from Italy to Antwerp and Beyond. The Transfer of Technology in the 16th - early 17th Century. Antwerp: Stad Antwerpen. pp. 95-121.
DE RAEDT, I., JANSSENS, K., VEEKMAN, J., VINCZE, J., VEKEMANS, B. & JEFFRIES, T.E. (2001) Trace analysis
for distinguishing between Venetian and façon-de-Venise glass vessels of the 16th and 17th century. Journal of Analytical Atomic Spectroscopy. 16 (9). p. 1012-1017.
DIAS DA CRUZ, M. (2009) O Vidro Romano no Noroeste Peninsular. Um olhar a partir de Bracara Augusta. A
Thesis Submitted in fulfilment of the Requirements of Universidade do Minho for the Degree of Doctor of Archaeology. Instituto de Ciências Sociais da Universidade do Minho. Braga: Universidade do Minho.
DECHER, G., ECKLE, M., SCHMITT, J. & STRUTH, B. (1998) Layer-by-layer assembled multicomposite films.
Curr. Opin. Colloid Interface Sci. 3. p. 32-39. DICKERT, F., GEIGER, U., LIEBERZEIT, P. & REUTNER, U. (2000) Solvatochromic Betaine Dyes as Optochemical
Sensor Materials: Detection of Polar and Non-Polar Vapors. Sensors And Actuators B: Chemical. 70 (1-3). p. 263–269.
DRAHOTOVÁ, O. (1983) European glass: The development of hollow glassware through the ages. Prague: Artia. DOMÉNECH, I. (2004) Spanich Façon de Venise glass. In: Page, J-A (ed.). Beyond Venice: Glass in Venetian
Style, 1500-1750. Corning, New York: The Corning Museum of Glass. DUCKWORTH, C., RICARDO CÓRDOBA DE LA LLAVE, D.J. GOVANTES, E., & HENDERSON, J. (2014). Electron
Microprobe Analysis of 9th-12th Century Islamic Glass from Cordoba, Spain. Archaeometry. 57 (1). p. 27-50.
DUNGWORTH, D. (2003) Scientific Examination of Glass and Glassworking Materials from Silkstone, Yorkshire.
Centre for Archaeology Report. Series English Heritage, no. 90/2003. ISSN 1473-9224. DUNGWORTH, D. (2005) Investigation of 18th Century Glass and Glassworking Waste from Limekiln Lane,
Bristol. Centre for Archaeology Report. Series English Heritage, no. 7/2005. ISSN 1473-9224.
215
DUNGWORTH, D. (2006) Vauxhall, London: The Scientific Examination of Glass and Glassworking Materials from the Late Seventeenth Century Glasshouse. Research Department Report. Series English Heritage, 83/2006. ISSN 1749-8775.
DUNGWORTH, D. (2007) St. Thomas Street, Bristol - Examination and Analysis of Glass and Glassworking
Debris. Research Department Report. Series English Heritage, no. 27/2007. ISSN 1749-8775. DUNGWORTH, D. (2009) Innovations in the 17th Century Glass Industry: The Introdution of Kelp (seaweed) Ash
in Britain. In: Association Verre et Histoire (Eds.) Deuxième Colloque International De L’Association Verre Et Histoire. [Online]. Nancy, 26th to 28th March 2009. Available from: http://www.verre-histoire.org/colloques/innovations/pages/p301_01_dungworth.html [Accessed on 15/11/2013].
DUNGWORTH, D. (2010) Gunter’s Wood, Hambledon, Surrey examination of glassworking debris. Research
Department Report. Series English Heritage, no. 37-2010. ISSN 1749-8775. DUNGWORTH, D. (2011) The value of Historic Window glass. The Historic Environment. 2 (1). p. 21-48. DUNGWORTH, D. (2012) Three and a half centuries of bottle manufacture. Industrial Archaeology Review. 34
(1). p. 37-50. DUNGWORTH, D. & BRAIN, C. (2009) Late 17th century Crystal glass: an analytical investigation. Journal of
Glass Studies. 51. p. 111-137. DUNGWORTH, D. & BRAIN, C. (2013) Seventeenth- and Eighteenth-Century English Lead Glass. In: Janssens, K.
(ed) Modern Methods for Analysing Archaeological and Historical Glass. Vol.I. Chichester: Wiley. DUNGWORTH, D. & CLARK, C. (2004) SEM-ED analysis of Wealden Glass. Centre for Archaeology Report.
Series English Heritage. no. 54/2004. ISSN 1473-9224. DUNGWORTH, D., CROMWELL, T., ASHURST, D., CUMBERPATCH, C., HIGGINS, D. & WILLMOTT, H. (2006) Glass
and Pottery Manufacture at Silkstone, Yorkshire. Post-Medieval Archaeology. 40. p. 160–190. DUNGWORTH, D. & MORTIMER, C. (2005) Examination of Glassworking Materials from Cheese Lane, Bristol.
Centre for Archaeology Report. Series English Heritage, no. 6/2005. ISSN 1473-9224. DUPRÉ, S. (2010) Trading luxury glass, picturing collections and consuming objects of knowledge in early
seventeenth-century Antwerp. Intellectual History Review. 20(1). p. 53-78. EDWARDS, R., BORDASS, W. & FARRELL, D. (1997) Determination of Acetic and Formic Acid in Lead
Corrosion Products by Ion-exchange Chromatography. 122. p. 1527-1520. EGAWA, Y., HAYASHIDA, R. & ANZAI, J. (2006) Multilayered assemblies composed of Brilliant Yellow and
poly(allylamine) for an optical pH sensor. Anal. Sci. 22. p. 117-119. FARRELLY, J., O’BRIEN, C., PAYNTER, S., WILLMOTT, H., FENWICK, J., GOULD, M., MEENAN, R. & MCCANN.
W. (2014) Excavation of an Early 17th-Century Glassmaking Site at Glasshouse, Shinrone, Co. Offaly, Ireland. Post-Medieval Archaeology. 48 (1). p. 45–89.
FEARN, S.; MCPHAIL, D.S.; HAGENHOFF, B. & TALLAREK, E. (2006) TOF-SIMS analysis of corroding museum
glass. Applied Surface Science. 252 (19). p. 7136-7139. FEARN, S.; MCPHAIL, D.S. & OAKLEY, V. (2004) Room temperature corrosion of museum glass : an
Investigation using low-energy SIMS. Applied Surface Science. 232. p. 510-514. FENG, L., MUSTO, C.J.M., KEMLING, J.W., LIM, S.H. & SUSLICK, K.S. (2010) A Colorimetric sensor array for
Identification of toxic gases below permissible exposure limits. Chem. Commun. 46. p. 2037-2019. FERREIRA, M. (2004) Espólio Vítreo Proveniente da Estação Arqueológica do Mosteiro de Sta. Clara-a-Velha de
Coimbra: Resultados Preliminares. Revista Portuguesa De Arqueologia. 7. p. 541–583.
216
FERREIRA, M. (2005a) O Uso de Vidraria em Sellium e em Tomar: As Descobertas Arqueológicas Recentes em Relação com a História do Vidro. Revista Portuguesa de Arqueologia. 8 (1). p. 387–431.
FERREIRA, M. (2005b) Eighteenth-century Wheel-engraved Glassware from Lisbon. Post-Medieval
Archaeology. 39 (2) . p. 233-242. FERREIRA, M. & MEDICI, T. (2010) Mould-Blown decorative patterns on Medieval and post-Medieval glass
beakers found in Portugal (14th- 18th century). In: Actes des 23e Rencontres de l’Association française pour l’Archéologie du Verre. Series Scientia Artis, Vol. 5. Brussels and Namur, October 2008. Brussels: l’Institut royal du Patrimoine artistique. pp. 403-411.
FERNANDES, L. (2007) Teatro Romano de Lisboa – os caminhos da descoberta e os percursos da investigação
arqueológica. Revista Almadan. 15 (IIa series). p. 28–39. FERNANDES, L. & FRAGOSO DE ALMEIDA, R. (2012) Um Celeiro da Mitra no Teatro Romano de Lisboa: inércias
e mutações de um espaço do séc. XVI à actualidade. In: Congresso Internacional de Arqueologia: Velhos e Novos Mundos. ArqueoArte no. 1, Vol. I. Lisboa, 6th to 9th April 2011. Lisboa: CHAM (FCS-HUNL).
FRANÇA, J.-A. (1983) Lisboa Pombalina e o Iluminismo. Lisboa: Bertrand Editora. FROTHINGHAM WILSON, A. (1941) Hispanic Glass with examples in the collection of the Hispanic Society of
America. New York: U.S.A. Hispanic Society of America. FROTHINGHAM WILSON, A. (1963) Spanish Glass. London: Faber. GABA-VAN DONGEN, A. (2004) Longing for Luxury: Some social routes of Venetian-style glassware in the
Netherlands during the 17th century. In: Page, J-A (ed.). Beyond Venice: Glass in Venetian Style, 1500-1750. Corning, New York: The Corning Museum of Glass.
GALLO, F. & SILVESTRI, A. (2012). Medieval Glass From Rocca Di Asolo (Northern Italy): An Archaeometric
Study. Archaeometry. 54 (6). pp. 1023–1039. GARCIA, P. (2009) Prospecção na Quinta do Côvo. A Thesis submitted in fulfilment of the requirments of
Universidade de Aveiro for the degree of Master of Archaeology. Aveiro: Universidade de Aveiro. GARDNER, C. (2009) Hightown, Castleford, Yorkshire - An Assessment of Glass Waste. Research Department
Report. Series English Heritage, no. 25-2009. ISSN 1749-8775. GENGA, A., SICILIANO, M., TEPORE, A., MANGONE, A., TRAINI, A. & LAGANARA, C. (2008) An Archaeometric
Approach about the Study of Medieval Glass from Siponto (Foggia, Italy). Microchemical Journal. 90. p. 56–62.
GIALANELLA, S., POSSENTI, E., CHATEIGNER, D., LUTTEROTTI, L. & MARINO, F., (2013) Materials and
technological aspects of gilded buckles from a North Eastern Medieval Italian context. Applied Physics A. 113 (4). p. 1101-1108.
GIBSON, L.T.; COOKSEY, B.G. & LITTLEJOHN, D. (1997a) A diffusion tube sampler for the determination of
acetic acid and formic acid vapours in museum cabinets. Analytica chimica acta. 341. p. 11-19. GIBSON, L.T.; COOKSEY, B.G.; LITTLEJOHN, D. & TENNENT; N.H. (1997b). Determination of Experimental
Diffusion Coefficients of Acetic Acid and Formic Acid Vapours in Air Using a Passive Sampler. Analytica Chimica Acta .341. p. 1–10.
GIBSON, L.T. & WATT, C.M. (2010) Acetic and formic acids emitted from wood samples and their effect on
selected materials in museum environments. Corrosion Science. 52 (1). p. 172-178. GOICOECHEA, J., ZAMARREÑO, C.R., MATIAS, I.R., & ARREGUI, F.J. (2008) Optical Fiber pH Sensors Based on
Layer-by-layer Electrostatic Self-assembled Neutral Red. Sensors and Actuators B: Chemical. 132 (1). p. 305–311.
217
GÖTTLER, C. & MORAN, S.J. Reading the Inventory: The Possessions of the Portuguese Merchant-Bamker Emmanuel Ximenez (1564-1632) in Antwerp. [Online] Available from: http://ximenez.unibe.ch/historical/. [Accessed: 10th September 2015].
GRATUZE, B. (1999) Obsidian Characterization by Laser Ablation ICP-MS and its Application to Prehistoric
Trade in the Mediterranean and the Near East: Sources and Distribution of Obsidian within the Aegean and Anatolia. Journal of Archaeological Science. 26. p. 869–881.
GRATUZE, B. (2013) Glass characterization using Laser Ablation Inductively Coupled Plasma Mass
Spectrometry Methods. In: Janssens, K. (ed) Modern Methods for Analysing Archaeological and Historical Glass. Vol.I. Chichester: Wiley.
GRATUZE, B. (2014) Application de la spectrométrie de masse à plasma avec prélèvement par ablation laser
(LA-ICP-MS) à l’étude des recettes de fabrication et de la circulation des verres anciens. In: Dillmann, Ph. & Bellot-Gurlet, L. (eds.). Circulation des matériaux et des objets dans les sociétés anciennes. Collection Sciences Archéologiques. Paris: Éditons Archives Contemporaines. pp. 259-291.
GRATUZE, B. & SERRA, L. (2010) Résultats d’analyses réalisées sur des bouteilles retrouvées dans les épaves
marchandes et dans les vestiges de fabriques liées aux voies de diffusion provençales dans la première moitié du XIXe siècle. In: Bulletin de L’AFAV. Fréjus, 20th to 21st November 2009. pp. 164-169.
GRATUZE, B., SOULIER, I., BLET, M. & VALLAURI, L. (1996) De l’origine du cobalt: du verre à la céramique.
Reveu d’Archéométrie. 20. p. 77-94. GRIME, G.W. & DAWSON, M. (1995) Recent developments in data acquisition and processing on the Oxford
scanning proton microprobe. Nuclear Instruments and Methods B. 104. p. 107-113. GUDENRATH, W., (2006) Enameled Glass Vessels, 1425 B.C.E. - 1800: The Decorating Process. Journal of
Glass Studies. 48. p. 23-70. GUEIT, E., DARQUE-CERETTI, E. & AUCOUTURIER, M. (2010) Glass Gilding Process in Medieval Syria and
Egypt (13th–14th Century). Journal of Archaeological Science. 37 (7). p. 1742–1752. HAMMOND, P.C. (1974) Archaeometry and Time: A Review. Journal of Field Archaeology. Vol.1 (3/4). p. 329-
335. HAN, F., INOUE, T., KURAUCHI, Y. & OHGA, K. (2007) Reichardt’s dye as optochemical sensor materials
detected polar gas. Journal of Engineering and Applied Sciences. 2 (1). p. 9–15. HENDERSON, J. (2002). Tradition and Experiment in First Milennium A.D. Glass Production-The Emergence of
Early Islamic Glass Technology in Late Antiquity. Acc. Chem. Res. 35. p. 594-602. HERREMANS, D., CAGNO, S., VINCKE, A., DE CLERCQ, W. & JANSSENS, K. (2012) Composition and State of
Alteration of 18th Century Glass from the Cistercian Nunnery of Clairefontaine (Belgium). In: H. Thienpont, W. Meulebroeck, K. Nys, & D. Vanclooster (eds.). Proc. of SPIE: Integrated Approaches to the Study of Historical Glass. Vol. 8422. Brussels, 16th to 17th April 2012. Belingham: SPIE, the International Society for Optical Engineering.
HYTTINEN, M.; MASALIN-WEIJO, M.; KALLIOKOSKI, P. & PASANEN, P. (2010) Comparison of VOC emissions
between air-dried and heat-treated Norway spruce (Picea abies), Scots pine (Pinus sylvesteris) and European aspen (Populus tremula) wood. Atmospheric Environment. 44 (38). p. 5028-5033.
JACKSON, C.M. (2006). Compositional analysis of the Gnalić glass. In: Lazar, I., Willmott, H. (eds.), The glass
from the Gnalić wreck, Koper: Univerza na Primorskem, Znanstveno-raziskovalno središče: Inštitut za dediščino Sredozemlja: Založba Annales. pp. 87-95.
JANSSENS, K. (2013) X-ray based methods of analysis. In: Janssens, K. (ed) Modern Methods for Analysing
Archaeological and Historical Glass. Vol.I. Chichester: Wiley. pp. 79-128
218
JANSSENS, K, CAGNO, S., DE RAEDT, I & DEGRYSE, P. (2013) Transfer of glass manufacturing technology in the sixteenth and seventeenth centuries from Southern to Northern Europe. In: Janssens, K. (ed) Modern Methods for Analysing Archaeological and Historical Glass. Vol.I. Chichester: Wiley. pp. 538-562.
JANZEN, M.C., PONDER, J.B., BAILEY, D.P., INGISON, C.K. & SUSLICK, K.S. (2006) Colorimetric Sensor Arrays
for Volatile Organic Compounds. Journal of Analytical Chemistry. 78. p. 3591-3600. JONES, O., (1986) Cylindrical English Wine and Beer Bottles 1735-1850. Quebec: Environment Canada -Parks. KOWADA, Y., OZEKI, T. & MINAMI, T. (2005) Preparation of Silica-Gel Film with pH Indicators by the Sol-Gel
Method. Journal of Sol-Gel Science and Technology. 33. p. 175–185. KUNCKEL, J. (1679) Ars Vitraria Experimentalis. French translation: Art de la Verrerie de Neri, Merret et
Kunckel. Auquel on a ajouté́ le Sol sine veste d’Orschall ... traduits de l'Allemands par. M. D*** (Paul Henri Thiry, baron d’Holbach). Durand, Pissot, Paris, 1752.
KUNICKI-GOLDFINGER, J.J., KIERZEK, J., DZIERZANOWSKI, P. & KASPRZAK, A. (2005) Central European Crystal
Glass of the First Half of the 18th Century, In Annales du 16th Congrès de l’Association Internationale pour l’Histoire Du Verre (AIHV). London, 7th to 13th September 2003. Nottingham. pp. 258-262.
KUNICKI-GOLDFINGER, J.J., KIERZEK, J., KASPRZAK, A & MALOZEWSKA-BUCKO, B. (2000) A study of
eighteenth century glass vessels from central Europe by x-ray fluorescence analysis. X-Ray Spectrometry. 29. p. 310-316.
KUNICKI-GOLDFINGER, J.J., KIERZEK, J., KASPRZAK, A & MALOZEWSKA-BUCKO, B. (2001) Analyses of 18th-
century central European colourless glass vessels. In Annales du 15e Congrès de l’Association Internationale pour l’Histoire Du Verre (AIHV). Corning, 15th to 20th October 2001. Nottingham. pp. 224-229.
KUNSTER, F.W. & THIEL, A. (1982) Tabelle per le analisichimiche e chimico-fisiche, twelfth (ed.) Milano:
Hoepli. LANMON, D.P. (2011) The Golden age of English Glass. Woodbridge: Antique Collectors’ Club Ltd. LAURETO, E., SILVA, M.A.T. DA, FERNANDES, R.V., DUARTE, J.L., DIAS, I.F.L., SANTANA, H. DE & MARLETTA,
A. (2011) Laser irradiation effects on the optical properties of layer-by-layer PPV/Congo Red thin films. Synthetic Metals. 161. p. 87-91.
LEGODI, M.A. & WAAL, D. DE (2007) The preparation of magnetite, goethite, hematite and maghemite of
pigment quality from mill scale iron waste. Dyes and Pigments. 74. p. 161-168. LEV, O., TSIONSKY, M., RABINOVICH, L., GLEZER, V., SAMPATH, S., PANKRATOV, I, & CUN, J. (1995)
Organically modified Sol-Gel sensors. Anal. Chem. 67 (1). p. 22-30. LIDE, D.R. (ed.) (1991-92) CRC Handbook of Chemistry and Physics. 72nd Edition. LIEFKS, R. (2004) Façon-de-Venise glass in the Netherlands. In: Page, J-A (ed.). Beyond Venice: Glass in
Venetian Style, 1500-1750. Corning, New York: The Corning Museum of Glass. LIMA, A., MEDICI, T., PIRES DE MATOS, A. & VERITÀ, M. (2012) Chemical Analysis of 17th Century Millefiori
Glasses Excavated in the Monastery of Sta. Clara-a-Velha, Portugal: Comparison with Venetian and Façon-de-Venise Production. Journal of Archaeological Science. 39 (5). p. 1238–1248.
Liu, Y. & Cui, T. (2007) Ion-sensitive field-effect transistor based pH sensors using nano self-assembled
polyelectrolyte/nanoparticle multilayer films. Sensors Actuators B: Chemical. 123. p. 148–152.
219
LOPES, F.M., LIMA, A.M., VILARIGUES, M., COROADO, J., CARVALHO, C. & PIRES DE MATOS, A. (2009) Real Fábrica De Vidros De Coina - Chemical Analysis of Archaeological Glass Fragments. In: Janssens, K., Degryse, P., Cosyns, P., Caen, J. & Van’t dack, L. (eds.). Annales du 17e Congrès de l’Association Internationale pour l’Histoire Du Verre (AIHV). Antwerp, 4th to 8th September 2006. Antwerp: Aspeditions. pp. 590–593.
LUKÀS, V. (1981) The Exportation of Bohemian glass, a Historical review. Journal of Glass Studies. 23. p. 56-
63. MANNINEN, A.-marja; PASANEN, P. & HOLOPAINEN, J.K. (2002) Comparing the VOC emissions between air-
dried and heat-treated Scots pine wood. New Phytologist. 36. p. 1763-1768. MARTINS, A., NEVES, C. & ALDEIAS, V. (2007) Beja Medieval: Os silos da Avenida Miguel Fernandes.
Arqueologia e História. 2 (2ª Série). p. 600-609. MATSUNAGA, T., KARUBE, I. & SUZUKI, S. (1980) A Specific Microbial Sensor for Formic Acid. European J.
Appl. Microbiol. Biotechnol. 10. p. 235 – 243. MCCRAY, W.P. (1998) Glassmaking in Renaissance Italy: The Innovation of Venetian Cristallo. JOM. 50 (5). p.
14–19. MEDICI, T. (2005a) The Glass Finds from Rua Da Judiaria, Almada, Portugal (12th-19th Century). Revista
Portuguesa de Arqueologia. 8 (2). p. 535–569. MEDICI, T. (2005b). Produzione e consumo del vetro in Portogallo tra XIV e XVIII secolo: il ruolo della
tradizione italiana. Note preliminary. In: Atti delle XI Giornate Nazionali di Studio, Produzione e distribuzione del vetro nella storia: un fenomeno di globalizzazione, Bologna, 16th to 18th December 2005. Trieste: Editreg. pp. 133-139.
MEDICI, T. (2008). A Medieval Enamelled Beaker from Lisbon. Journal of Glass Studies. 50. p. 316-318. MEDICI, T. (2011) O Espólio Vítreo Do Núcleo Arqueológico Da Rua Dos Correeiros, Lisboa. Revista
Portuguesa de Arqueologia. 14. p. 313–353. MEDICI, T. (2014) Vidros da Terra. O vidro tardomedieval e moderno em Portugal� � (séculos XIV-XVII). O
contributo da arqueologia. A Thesis Submitted in fulfilment of the Requirements of Universidade de Coimbra for the Degree of Doctor of Archaeology. Faculdade de Letras da Universidade de Coimbra. Coimbra: Universidade de Coimbra.
MEDICI, T., LOPES, F.M., LIMA, A.M. LARSSON, M.A. & PIRES DE MATOS, A. (2009) Glass bottles and jugs
from the Monastery of Sta. Clara-a-Velha, Coimbra, Portugal. In: Janssens, K., Degryse, P., Cosyns, P., Caen, J. & Van’t dack, L. (eds.). Annales du 17e Congrès de l’Association Internationale pour l’Histoire Du Verre (AIHV). Antwerp, 4th to 8th September 2006. Antwerp: Aspeditions. pp. 391-400.
MONTERO, E., GARCIA, M.A., VILLEGAS, M.A. & LLOPIS, J. (2008) Spectral pH dependence of Erythrosin B in
sol-gel sílica coatings and buffered solutions. Bol. Soc. Esp.de Ceram. V. 47 (1). p. 1-6 MONTERO RUIZ, I., GARCÍA HERAS, M. & LÓPEZ-ROMETO, E. (2007) Arqueometría: Cambios y tendencias
actuales. Trabajos de Prehistoria. 64 (1). p. 23-40. MORETTI, C. & HREGLICH, S. (2013) Raw materials, recipes and procedures used for glass making. In: Janssens,
K. (ed) Modern Methods for Analysing Archaeological and Historical Glass. Vol.I. Chichester: Wiley. MORTIMER, C. (1995) Analysis of post-Medieval Glass from Old Broad Street, London, with Reference to Other
Contemporary Glasses from London and Italy. In: Hook. D. R. & Gaimster, D. R. M. (eds.). Trade and Discovery: The Scientific Study of Artefacts from Post-Medieval Europe and Beyond. London: British Museum Press, Dept. of Scientific Research. pp. 135-144
220
MOURA, C., BARREIRO, A. & RIBEIRO, I., (2004) Os Bustos-Relicário – Alguns casos notáveis da escultura seiscentista de barro em Alcobaça. In: Actas do Congresso Internacional A Policromia: a escultura policromada religiosa dos séculos XVII e XVIII: estudo comparativo das técnicas, alterações e conservação em Portugal, Espanha e Bélgica. Lisbon, 29th to 31st October 2002. Lisbon: Instituto Português de Conservação e Restauro. pp. 17-22.
MÜLLER, K. & STEGE, H. (2006) Material analysis of colourless lead glasses from a late 17th century glasshouse
site in Groningen (the Netherlands). In: Janssens, K., Degryse, P., Cosyns, P., Caen, J. & Van’t dack, L. (eds.). Annales du 17e Congrès de l’Association Internationale pour l’Histoire Du Verre (AIHV). Antwerp, 4th to 8th September 2006. Antwerp: Aspeditions. pp. 401-407.
NAVARRO, J.M.F. (2003) El Vidrio. Series Textos Universitários (Consejo Superior de Investigaciones
Científicas), 6. 3rd Edition. Madrid: Consejo Superior de Investigaciones Científicas, Sociedad Española de Cerámica y Vidrio.
OHRING, M. (2002) Materials Science of thin films. 2nd edition. San Diego: Academic Press. OHTA, K.; OGAWA, H. & MIZUNO, T. (2000) Abiological formation of formic acid on rocks in nature. Applied
Geochemistry. 15. p. 91-95. PASTOR REY DE VIÑAS, P. (1994) Historia de la Real Fábrica de Cristales de San Ildefonso durante la época de
la ilustración, 1727-1810. Madrid: Patrimonio Nacional. PÉREZ-PARIENTE, J. & MARTÍN-ROJO, A.B. (2008) Glass Technology in Spain in XVIIIth century according to
printed sources: the Spanish annotated translation of L’Arte Vetraria. Journal of Cultural Heritage. 9. p. 81-84.
PIMENTEL, A.F. (2005) O Paço Real de Coimbra, das origens ao estabelecimento da Universidade. In: A Morada
da Sabedoria. Vol. I. Coimbra: Almedina. PRINSLOO, L. & COLOMBAN, P. (2008) A Raman spectroscopic study of the Mapungubwe oblates: glass trade
beads excavated ata n Iron Age archaeological site in South África. Journal of Raman Spectroscopy. 39. p. 79-90.
PROENÇA, R. (1983) Guia de Portugal: Generalidades Lisboa e arredores. Vol. I. Lisbon: Fundação Caloust
Gulbenkian. PULIDO VALENTE, F., COUTINHO, I., MEDICI, T., BRAIN, C. & VILARIGUES, M. (n.d.) A Group of Early English
Lead Crystal Glass Goblets Found in Lisbon. Journal of Glass Studies. In press. RAOUFI, N., SURRE, F., SUN, T., RAJARAJAN, M. & GRATTAN, K.T.V. (2012) Wavelength dependent pH optical
sensor using the layer-by-layer technique. Sensors Actuators B: Chemical. 169. p. 374-381. ROBINET, L., COUPRY, C., EREMIN, K. & HALL, C. (2006) Raman Investigation of the Structural Changes
During Alteration of Historic Glasses by Organic Pollutants. Journal of Raman Spectroscopy. 37. p. 1278–1286.
ROBINET, L., EREMIN, K., COBO DEL ARCO, B. & GIBSON, L.T. (2004) A Raman spectroscopic study of
pollution-induced glass deterioration. Journal of Raman Spectroscopy. 35 (89). p. 662-670. ROBINET, L., EREMIN, K., COUPRY, C., HALL, C. & LACOME, N. (2007) Effect of Organic Acid Vapors on the
Alteration of Soda Silicate Glass. Journal of Non-Crystalline Solids. 353. p. 1546–1559. ROBINET, L., HALL, C., EREMIN, K., FEARN, S. & TATE, J. (2009) Alteration of soda silicate glasses by organic
pollutants in museums: Mechanisms and kinetics. Journal of Non-Crystalline Solids. 355. p. 1479-1488. ROCHEBRUNE, M.-L. de (2004) Venetian and Façon de Venise Glass in France in the 16th and 17th centuries. In:
Page, J-A (ed.). Beyond Venice: Glass in Venetian Style, 1500-1750. Corning, New York: The Corning Museum of Glass.
221
ROMICH, H. (1999) Historic glass and its interaction with the environment. In: Tennent, N. H. (ed.). The Conservation of Glass and Ceramics - Research, Practice and Training. London: James & James (Science Publishers) Ltd. pp. 5-14.
RYHL-SVENDSEN, M. & GLASTRUP, J. (2002) Acetic acid and formic acid concentrations in the museum
environment measured by SPME-GC / MS. Atmospheric Environment. 36. p. 3909-3916. SABNIS, R. W. 2008. Handbook of Acid-Base Indicators. CRC Press, San Francisco. SARAH, G., GRATUZE, B. & BARRANDON, J.-N. (2007) Application of Laser Ablation Inductively Coupled
Plasma Mass Spectrometry (LA-ICP-MS) for the Investigation of Ancient Silver Coins. Journal of Analytical Atomic Spectrometry. 22 (9). p. 1163-1167.
SAMPAIO, A. & SEBASTIAN, L. (2002a) Intervenção arqueológica no Mosteiro de São João de Tarouca: 1998 –
2001. Património: Estudos. 2. p. 33-42. SAMPAIO, A. & SEBASTIAN, L. (2002b) Mosteiro de São João de Tarouca: 700 anos de história da cerâmica.
Património: Estudos. 3. p. 165-177. SANDSTRÖM, K.J.M, NEWMAN, J., SUNESSON, A., LEVIN, J. & TURNER, A. (2000) Amperometric Biosensor for
Formic Acid in Air. Sens. Actuators B Chem. 70. p. 182–187. SANSIVIERO, M.T.C., SANTOS, D.S. DOS, JOB, A.E., & AROCA, R.F. (2011) Layer by layer TiO2 thin films and
photodegradation of Congo red. J. of Photochemistry and Photobiology A: Chemistry. 220. p. 20-24. SARAIVA, J.H. (ed.) (1983) História de Portugal. Volume III. Lisbon: Publicações Alfa. SATO, H., OKUDA, R., SUGIYAMA, A., HAMATSU, M. & ANZAI, J-I. (2009) Loading and release of methyl orange
in layer-by-layer assembled polyelectrolyte films. Materials Science and Engineering C. 29. p. 1057-1060.
SCHALM, O., JANSSENS, K., PEREIRA, J., CARVALHO, C. & PIRES DE MATOS, A. (2005) Chemical analysis of
archaeological glass: fragments excavated at the former Royal Glass Factory of Marinha Grande (Portugal). In: GLASSAC: Glass History - Glass Science and Conservation. Lisbon, 19th to 21st September 2005. Lisbon: ITN, UNL/ FCT.
SCHALM, O., JANSSENS, K., WOUTERS, H. & CALUWÉ, D. (2007) Composition of 12–18th Century Window
Glass in Belgium: Non-Figurative Windows in Secular Buildings and Stained-Glass Windows in Religious Buildings. Spectrochimica Acta Part B: Atomic Spectroscopy. 62 (6-7). p. 663–668.
SEDLÁČKOVÁ, H. (2007). From the Gothic Period to the Renaissance. Glass in Moravia 1450-Circa 1560. In:
Jaromir Žeglklitz (ed.), Studies in Post-Medieval Archaeology. Prague: Archaia Praha. pp.181-225. SEQUEIRA, G. de M. (n.d.) A Indústria Vidreira em Portugal: 1880 – 1962. Lisboa: Companhia Industrial
Portuguesa. SERCK-DEWAIDE, M., RABELO, E., SANYOVA, J., RIBEIRO, I., BARREIRO, A., ROMÃO, P., LE GAC, A., NARANJO,
M.C., LÓPEZ, M.J.G., GONZÁLEZ, M.G., LETONA, A.C.L. de, ARCAUTE, E.R. de, RAMOS, R.G., OLANO, M.B., SALVARREDI, I.B. & IBARRAN, E.M. (2004) Les techniques utilisées dans l’art baroque religieux des XVIIe et XVIIIe siècles au Portugal, en Espagne et en Belgique. In: Actas do Congresso Internacional A Policromia: a escultura policromada religiosa dos séculos XVII e XVIII: estudo comparativo das técnicas, alterações e conservação em Portugal, Espanha e Bélgica. Lisbon, 29th to 31st October 2002. Lisbon: Instituto Português de Conservação e Restauro. pp. 17-22.
SHELBY, J.E. (2005) Introduction to Glass Science and Technology. 2nd edition. Cambridge: The Royal Society
of Chemistry. SHORTLAND, A., SCHACHNER, L., FREESTONE, I. & TITE, M. (2006) Natron as a Flux in the Early Vitreous
Materials Industry: Sources, Beginnings and Reasons for Decline. Journal of Archaeological Science. 33. p. 521–530.
222
SMRCEK, A. (1999) Batch and Composition of Typical Bohemian Glasses from 14th to 19th Centuries. In: 5th ESG Conference. A3. Prague, 21st to 24th June 1999. Prague: Czech Glass Society.
ŠMIT, Ž. (2013) Ion-beam analysis methods. In: Janssens, K. (ed) Modern Methods for Analysing Archaeological
and Historical Glass. Vol.I. Chichester: Wiley. pp. 156-183. ŠMIT, Ž., JANSSENS, K., BULSKAD, E., WAGNERD, B., KOSE, M. & LAZAR, I. (2005) Trace element
fingerprinting of façon-de-Venise glass. Nucl Instrum Meth B. 239 (1-2). p. 94-99. ŠMIT, Ž., JANSSENS, K., SCHALM, O. & KOS, M., (2004) Spread of Façon-de-Venise Glassmaking through
Central and Western Europe. Nuclear Instruments and Methods in Physics Research B. 213. p. 717–722. ŠMIT, Ž., STAMATI, F., CIVIVI, N., VEVECKA-PRIFTAJ, A., KOS, M. & JEZERŠEK, D. (2009) Analysis of Venetian-
type glass fragments from the ancient city of Lezha (Albania). Nucl Instrum Meth B. 267. p. 1538-2544. SUSLICK, K.S., RAKOW, N.A. & SEN, A. (2004) Colorimetric sensor arrays for molecular recognition.
Tetrahedron. 49. p. 11133-11138. TAIT, H. (1979) The Golden Age of Venetian glass. London: British Museum Publications. TAIT, H. (2004) Europe from the Middle Ages to the Industrial Revolution. In: Tait, H. (ed). 5 Thousands Years
of Glass. Revised edition. Philadelphia: University of Pennsylvania Press. TITE, M.S., SHORTLAND, A., MANIATIS, Y., KAVOUSSANAKI, D. & HARRIS, S.A. (2006) The Composition of the
Soda-Rich and Mixed Alkali Plant Ashes Used in the Production of Glass. Journal of Archaeological Science. 33. p. 1284–1292.
TRINDADE, S.D. & GAMBINI, L.I. (2009) Mosteiro de Santa Clara-a-Velha - Do Convento à ruína, da ruína à
contemporaneidade. Côrte-Real, A. (Coord.). 2nd edition. Coimbra: Direcção Regional de Cultura do Centro.
TYKOT, R.H. (2004) Scientific methods and applications to archaeological provenance studies. In: Milazzo, M.
and Piacentini, M. (eds.). Proceedings of the International School of Physics “Enrico Fermi”. Course CLIV, Vol. 154. Amsterdam: IOS Press. pp.407-431.
ULITZKA, S. (1994) Analysen von historischen Gläsern – Licht im Dunkel der Geschichte?, In: Theuerkauff-
Liederwald, A. (ed.). Venezianisches Glas der Kunstsammlungen der Veste Coburg. Die Sammlung Herzog Alfreds von Sachsen – Coburg und Gotha (1844-1900). Venedig á la façon-de-Venise, Spanien, Mitteleuropa. Lingen: Luca verlag. pp.40-53.
UNITED STATES OF AMERICA, DEPARTMENT OF COMMERCE (2012). Certificate of Analysis Standard Reference
Material 612, Trace elements in glass. Gaithersburg: National Institute of Standards & Technology. UREŠOVÁ, L. (1965) Bohemian Glass. London, Victoria & Albert Museum: W. S. Cowell Ltd. VALENTE, V. (1950) O vidro em Portugal. Porto: Portucalense Editora. VALONGO, A.M. (2011) Archaeological excavation report: Projecto 58-11 Rua do Arsenal 148 Lisboa.
Unpublished. VAN DER LINDEN, V., BULTINCK, E., DE RUYTTER, J., SCHALM, O., JANSSENS, K., DEVOS, W. & TIRI, W. (2005)
Compositional Analysis of 17 – 18th Century Archaeological Glass Fragments, Excavated in Mechelen, Belgium: Comparison with Data from Neighboring Cities in the Low Countries. Nuclear Instruments and Methods in Physics Research B. 239. p. 100–106.
VÁVRA, J.R. (1954) 5000 Years of Glassmaking: the History of Glass. Praga: Artia. VELDE, B. (2013) Glass Compositions over Several Millennia in the Western World. In: Janssens, K. (ed)
Modern Methods for Analysing Archaeological and Historical Glass. Vol.I. Chichester: Wiley. pp. 67-78.
223
VERITÀ, M. (1986) Le Analisi Chimiche Dei Vetri E Cenni Sulla Tecnologia Vetraria Muranese Nel Xv E Xvi Secolo. In: Il Ritrovamento Di Torretta. Per Uno Studio Della Ceramica Padana. Venezia: Marsilio. pp. 221-23.
VERITÀ, M. (2013) Venetian soda glass. In: Janssens, K. (ed) Modern Methods for Analysing Archaeological and Historical Glass. Vol.I. Chichester: Wiley. pp. 515-536.
VERITÀ, M. (2014) Secrets and innovations of Venetian Glass between the 15th and the 17th centuries: raw
materials, glass melting and artefacts. In: Barovier, R. & Tonini, C. (eds.). Study days on Venetian Glass: Approximately 1600’s. Tomo CLXXII, Vol.I. Venice, 27th February to 1st March 2013. Venice: ATTI dell’ Istituto Veneto di Scienze, Lettere ed Arti. pp. 53-68.
VERITÀ, M. & TONINATO, T. (1990) A comparative analytical investigation on the origin of the Venetian
glassmaking. Rivista della Stazione Sperimentale del Vetro. 4. p. 169-175. VERITÀ, M. & ZECCHIN, S. (2009a) Thousand years of Venetian glass: the evolution of chemical composition
from the origins to the 18th century. In: Janssens, K., Degryse, P., Cosyns, P., Caen, J. & Van’t dack, L. (eds.). Annales du 17e Congrès de l’Association Internationale pour l’Histoire Du Verre (AIHV). Antwerp, 4th to 8th September 2006. Antwerp: Aspeditions. pp. 602–613.
VERITÀ, M. & ZECCHIN, S. (2009b) La tecnologia vetraria Veneziana del XV-XVI secolo attraverso le analisi di
reperti in vetro d’uso commune. Quaderni Friulani di Archeologia. XIX. p. 237-248. VILARIGUES, M. (2008). Estudo do efeito da adição de iões metálicos na corrosão de vidros potássicos. A Thesis
submitted in fulfilment of the requirements of Universidade Nova de Lisboa for the degree of Doctor in Conservation and Restoration. Faculdade de Ciências e Tecnologia da Universidade Nova de Lisboa. Lisboa: Universidade Nova de Lisboa.
VILARIGUES, M., REDOL, P., MACHADO, A., RODRIGUES, P.A. ALVES, L.C. & SILVA, R.C. da (2011) Corrosion
of 15th and Early 16th Century Stained Glass from the Monastery of Batalha Studied with External Ion Beam. Materials Characterization. 62 (2). p. 211–217.
VILLAR, I.D., MATIAS, I.R., ARREGUI, F.J. & CORRES, J.M. (2006) Fiber optic glucose biosensor. Optical
Engineering. 45. p. 104401–104406. WAGNER, B., NOWAK, A., BULSKA, E., HAMETNER, K. & GÜNTHER, D. (2012). Critical assessment of the
elemental composition of Corning archaeological reference glasses by LA-ICP-MS. Anal. Bioanal. Chem. 402. p. 1667-1677.
WALTERS, G. & PARKIN, I. (2009) The incorporation of noble metal nanoparticles into host matrix thin films:
synthesis, characterization and applications. J. Mater. Chem. 19. p. 574-590. WEDEPOHL, K.H. (1995). The composition of the continental crust. Geochimica et Cosmochimica Acta. 59 (7).
p. 1217-1232. WEDEPOHL, K.H., SIMON, K. & KRONZ, A. (2011a) Data on 61 Chemical Elements for the Characterization of
Three Major Glass Compositions in Late Antiquity and the Middle Ages. Archaeometry. 53 (1). p. 81–102.
WEDEPOHL, K.H., SIMON, K. & KRONZ, A. (2011b) The Chemical Composition Including the Rare Earth
Elements of the Three Major Glass Types of Europe and the Orient Used in Late Antiquity and the Middle Ages. Chemie Der Erde – Geochemistry. 71 (3). p. 289–296.
WILLMOTT, H., (2004) Venetian and Façon de Venise Glass in England. In: Page, J-A (ed.). Beyond Venice:
Glass in Venetian Style, 1500-1750. Corning, New York: The Corning Museum of Glass. WILLS, G., (1974) English Glass Bottles for the Collector. Edinburgh: John Bartholomew and Son Ltd. WILSON, A.D. & BAIETTO, M. (2009) Applications and Advances in Electronic-Nose Technologies. Sensors. 9
(7). p. 5099-5148
224
WHITEHOUSE, D. (2004) Forward. In: Page, J-A (ed.). Beyond Venice: Glass in Venetian Style, 1500-1750. Corning, New York: The Corning Museum of Glass.
YAN, Y., LU, D., ZHOU, H., HOU, H., ZANG, T., WU, L. & CAI, L. (2012) Polyaniline-Modified Quartz Crystal
Microbalance Sensor for Detection of Formic Acid Gas. Water Air Soil Pollut. 223 (3). p. 1275-1280. WEBSITES:
• [Online] Available from: http://www.badpyrmont.de/ [Accessed: 14th November 2012]. • Biblioteca Digital Nacional. [Online] Available from - http://purl.pt/11578/1/. [Accessed: 15th
November 2012]. • Museu da Cidade, Câmara Municipal de Lisboa. [Online] Available from -
http://www.museudacidade.pt/Lisboa/3D-lisboa1755/Paginas/default.aspx. [Accessed: 15th November 2012].
[Online] Available from - http://www.draeger.co.uk/sites/assets/PublishingImages/Products/cin_short-

! 225!
Appendices Part I

! 226!
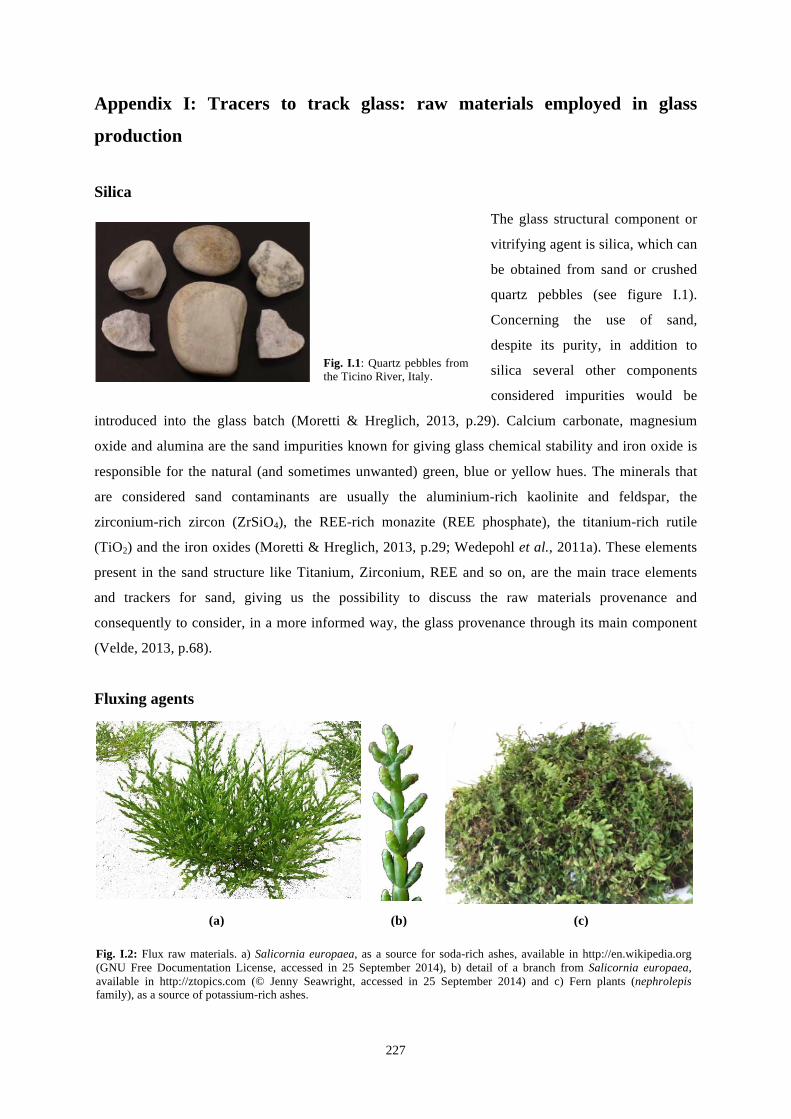
! 227!
Appendix I: Tracers to track glass: raw materials employed in glass
production
Silica
The glass structural component or
vitrifying agent is silica, which can
be obtained from sand or crushed
quartz pebbles (see figure I.1).
Concerning the use of sand,
despite its purity, in addition to
silica several other components
considered impurities would be
introduced into the glass batch (Moretti & Hreglich, 2013, p.29). Calcium carbonate, magnesium
oxide and alumina are the sand impurities known for giving glass chemical stability and iron oxide is
responsible for the natural (and sometimes unwanted) green, blue or yellow hues. The minerals that
are considered sand contaminants are usually the aluminium-rich kaolinite and feldspar, the
zirconium-rich zircon (ZrSiO4), the REE-rich monazite (REE phosphate), the titanium-rich rutile
(TiO2) and the iron oxides (Moretti & Hreglich, 2013, p.29; Wedepohl et al., 2011a). These elements
present in the sand structure like Titanium, Zirconium, REE and so on, are the main trace elements
and trackers for sand, giving us the possibility to discuss the raw materials provenance and
consequently to consider, in a more informed way, the glass provenance through its main component
(Velde, 2013, p.68).
Fluxing agents
Fig. I.2: Flux raw materials. a) Salicornia europaea, as a source for soda-rich ashes, available in http://en.wikipedia.org (GNU Free Documentation License, accessed in 25 September 2014), b) detail of a branch from Salicornia europaea, available in http://ztopics.com (© Jenny Seawright, accessed in 25 September 2014) and c) Fern plants (nephrolepis family), as a source of potassium-rich ashes.
(a) (b) (c)
Fig. I.1: Quartz pebbles from the Ticino River, Italy.
! 228!
Regarding now the other glass components, fluxing agents are responsible for lowering the glass
fusion temperature. This will reflect on the glass workable time and consequently on the time that
melted glass takes to solidify. These oxides can be denominated as network modifiers, since their
introduction will alter the glass network in such a way that, depending on its concentration modifiers,
can compromise the network stability (Moretti & Hreglich, 2013, p.29; Navarro, 2003, p.137).
The most common fluxing agents used in the past were natron, and soda-rich and potassium-rich ash,
being the last ones of vegetal origin. Natron was widely used as a flux in glass production since the
first millennium B.C. until the 9th century from the present era, when it was replaced by plant ash
(Velde, 2013, p.71; Shortland et al., 2006). This flux came from lakes located between Alexandria and
Cairo, and are mainly constituted by hydrated sodium carbonate (tronite or trona Na2CO3!2H2O).
Unlike plant ashes, it is very pure, not having in its composition the impurities that help in the glass
stabilization (Moretti & Hreglich, 2013, p.29). Due to its scarcity, from the 9th century onwards, natron
was no longer the main flux agent employed in glass production, being replaced by plant ash
(Shortland et al., 2006). In the Mediterranean area, the use of natron was replaced for ashes obtained
from plants located near coastlines like the Chenopodiaceae family (comprehending many genera like
Suaeda, Salsola and Salicornia, figure I.2), which were rich in soda (Tite et al., 2006; Velde, 2013,
p.71). On the North of the Alps region, natron was replaced with ashes from forest plants (for instance
fern, figure I.2) and wood that were richer in potassium oxide (potash-rich ashes) with the contents of
calcium and magnesium oxides also higher in comparison with soda-rich ashes (Velde, 2013, p.71).
The glass that was produced using potassium-rich ashes had a natural green hue and was commonly
called forest glass. This glass owes its colouration to the iron contents present in the plant-ashes
usually obtained from wood or ferns. During the 16th century this regional division started to blur due
to the emigration of Italian glassmakers to the North of the Alps bringing to this region the soda-rich
glass tradition (Velde, 2013, p.75). The 16th and 17th centuries were marked by a coexistence of both
soda-rich and wood-ash glasses, and progressively the wood-ash formulations ceased to be used
(Velde, 2013, p.75). The exception to this situation was the bottle production that continuing to be
produced using wood ashes in order to obtain the HLLA dark green or black glass (Velde, 2013, p.75).
Regarding this soda/wood-ash transition period, could it be the reason for the existence of a mixed
alkali glass composition? The mixture of soda-rich plants with potash-rich ones could be an
explanation for some mixed-alkali glass compositions, however another explanation has to be
considered. According to Tite et al. (2006), it is possible to obtain a mixed-alkali glass composition
from a Salsola kali plant if the ash obtained from this plant is first purified by dissolution followed by
evaporation (or suffers any other treatment) with the objective of reducing its lime-plus-magnesia
content. The ash employed in the batch would give origin to a mixed alkali glass (Tite et al., 2006).
! 229!
As it was mentioned above, Northern Europe ceased the production of wood-ash glass, however their
glass formulations were still rich in potassium oxide rather than in soda. At the end of the 17th century/
beginning of the 18th century, raw materials like saltpetre (potassium nitrate), chalk and limestone
were being introduced into the batch as sources of potassium and calcium (Kunicki-Goldfinger et al.,
2001). About the same time in England, lead was being introduced into the batch to lower the glass
melting temperature. In both situations the main purpose was to achieve a perfectly discoloured glass
formulation even when the glass walls had a higher thickness.
Stabilizers
In order for the glass to be stable and water resistant, its composition needs to contain stabilizers.
Alkaline-earth oxides and alumina are natural glass stabilizers that were introduced into the batch
together with silica and flux (e.g. sand and plant ashes) raw materials as their impurities (Moretti &
Hreglich, 2013, p.30). In the case of alumina, it was introduced into the batch through less pure sand
(rich in feldspars) and also, even though in less quantities, through non-purified vegetable ashes. The
ashes are also responsible for the introduction of calcium and magnesium oxides, once again through
its impurities (Moretti & Hreglich, 2013, p.30). At this point it is important to point out that it is
generally accepted that until the 19th century, stabilizers were added to the batch without the
glassmakers knowing their role on the glass matrix stability (Moretti & Hreglich, 2013, p.34). It is
however discussed by Brems et al. (2012) including several opinions on this matter where it is referred
to that skilled glassmakers might have realized that adding some lime to the batch in the form of shells
for instance (a fact mentioned by Pliny), improved the glass resistance when in contact with water.
Concerning lead oxide, it was primarily used as a glass stabilizer and it was commonly introduced into
the batch as litharge or minium, however it was later used as a flux agent. Depending on its
concentration, lead oxide can be a glass stabilizer, fluxing or vitrifying agent (Navarro, 2003, p.143;
Moretti & Hreglich 2013, p.30).
Fining agents
A fining agent is used to reduce or eliminate bubbles from the glass matrix. The first intentionally
used fining agents were arsenic and antimony oxides. These components were first mentioned in the
17th century treaty De Arte Vetraria written by Antonio Neri (Navarro, 2003, p.191-192, 200).
Magnesium oxide was employed with the purpose of decolourizing glass, however it also acts as a
fining agent (Moretti & Hreglich, 2013, p.31).
Opacifiers and colouring agents
Regarding the opacifiers used in the past, calcium antimonate was the first to be employed, dating
from the 15th century B.C (Moretti & Hreglich, 2013, p.31). Later in Venice, tin dioxide or cassiterite
! 230!
was the preferred opacifier for the glass production. Adding lead to the tin dioxide, Venetian
glassmakers were able to produce a white opaque glass called lattimo. The opacification using lead
arsenate was used for the production of another new Venetian formulation called girasole. This
designation was due to its milky appearance and optical properties, since this glass colour in reflected
light is of a pale blue tone and in transmitted light presents a reddish to orange-yellow colouration just
like the sunflower (Moretti & Hreglich, 2013, p. 31; Verità, 2013, p. 523).
Concerning now the colouring agents elements like manganese, iron, copper, cobalt and silver are
mentioned from the 14th century. Manganese oxide in quantities between 0.3 and 0.8 in weight
percentage of oxides, was used as a decolourizing agent, and when employed in a larger quantity is
used for the production of a purple coloured glass (Moretti & Hreglich, 2013, p.32). Iron oxide,
depending on its oxidation state can be responsible for a blue colouration (ferrous ion - Fe2+, obtained
in a reducing kiln atmosphere), for a yellow colouration (ferric ion - Fe3+ obtained in an oxidizing kiln
atmosphere) or for a green colouration when the mixture of both oxidation states is present (Navarro,
2003, p.449-450). Copper and its turquoise blue colouration in glass is the most ancient glass tonality
known and was widely used in the Egyptian period (Navarro, 2003, p.452). A red ruby colour can also
be obtained by the presence of copper nanoparticles (Kunicki-Goldfinger et al., 2014). Glass with
cobalt has an intense blue colouration, due to the high colouring capability of the Co2+ ion even when
present in low concentrations. Finally silver was employed in the preparation the chalcedony glass,
giving a brown to yellow colouration (Moretti & Hreglich, 2013, p.32).
Regarding now ruby glass, this colouration is attained by the presence of nanoparticles or gold
colloids inside the glass matrix. As was referred to before, copper nanoparticles can give origin to this
glass colour. It is also important to mention that gold nanoparticles can also give origin to ruby glass.
Both copper and gold were used since ancient times to obtain ruby glass and knew a great splendour
during the end of the Middle Ages in Venice. The use of gold to produce ruby glass only reappeared
on the 16th century by the hands of Kunckel in Potsdam, and until the end of the 19th century, its
mechanism was involved in mystery. The ruby colouration is a result of the colloid’s light absorption
and simultaneously of the light dispersion caused by the small colloidal gold particles (Navarro, 2003,
p.462-463).
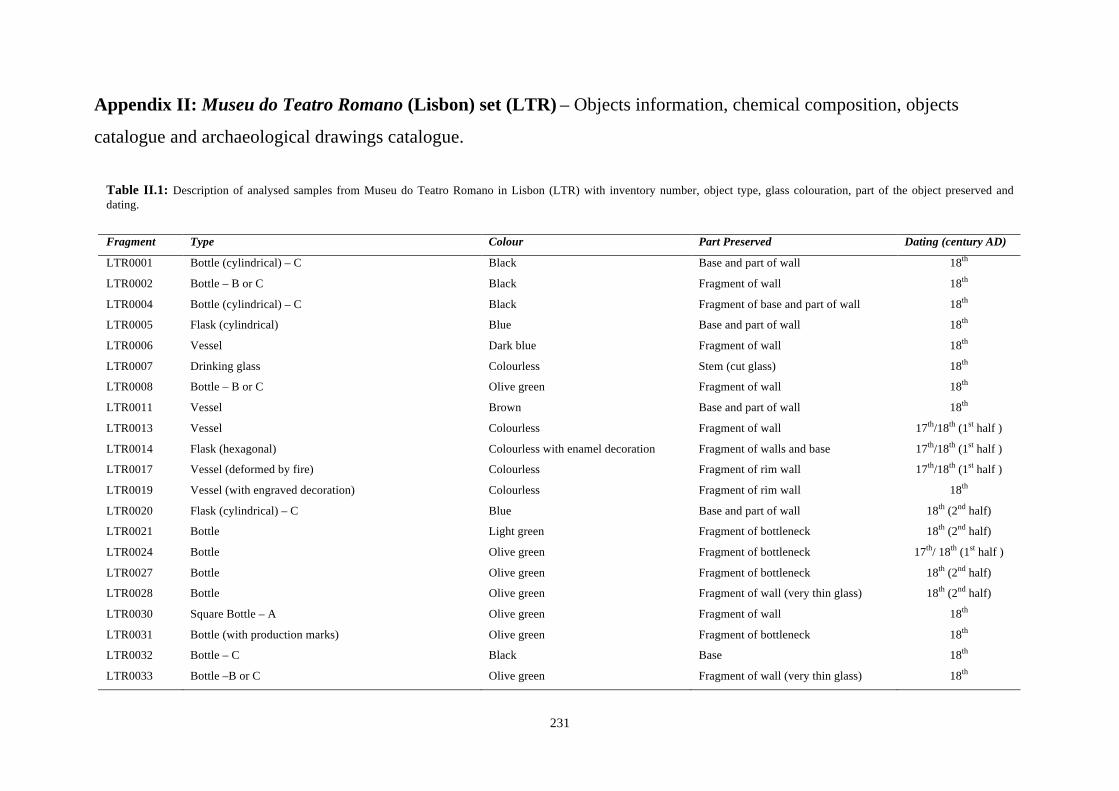
! 231!
Appendix II: Museu do Teatro Romano (Lisbon) set (LTR) – Objects information, chemical composition, objects
catalogue and archaeological drawings catalogue.
Table II.1: Description of analysed samples from Museu do Teatro Romano in Lisbon (LTR) with inventory number, object type, glass colouration, part of the object preserved and dating.
Fragment Type Colour Part Preserved Dating (century AD)
LTR0001 Bottle (cylindrical) – C Black Base and part of wall 18th
LTR0002 Bottle – B or C Black Fragment of wall 18th
LTR0004 Bottle (cylindrical) – C Black Fragment of base and part of wall 18th
LTR0005 Flask (cylindrical) Blue Base and part of wall 18th
LTR0006 Vessel Dark blue Fragment of wall 18th
LTR0007 Drinking glass Colourless Stem (cut glass) 18th
LTR0008 Bottle – B or C Olive green Fragment of wall 18th
LTR0011 Vessel Brown Base and part of wall 18th
LTR0013 Vessel Colourless Fragment of wall 17th/18th (1st half )
LTR0014 Flask (hexagonal) Colourless with enamel decoration Fragment of walls and base 17th/18th (1st half )
LTR0017 Vessel (deformed by fire) Colourless Fragment of rim wall 17th/18th (1st half )
LTR0019 Vessel (with engraved decoration) Colourless Fragment of rim wall 18th
LTR0020 Flask (cylindrical) – C Blue Base and part of wall 18th (2nd half)
LTR0021 Bottle Light green Fragment of bottleneck 18th (2nd half)
LTR0024 Bottle Olive green Fragment of bottleneck 17th/ 18th (1st half )
LTR0027 Bottle Olive green Fragment of bottleneck 18th (2nd half)
LTR0028 Bottle Olive green Fragment of wall (very thin glass) 18th (2nd half)
LTR0030 Square Bottle – A Olive green Fragment of wall 18th
LTR0031 Bottle (with production marks) Olive green Fragment of bottleneck 18th
LTR0032 Bottle – C Black Base 18th
LTR0033 Bottle –B or C Olive green Fragment of wall (very thin glass) 18th
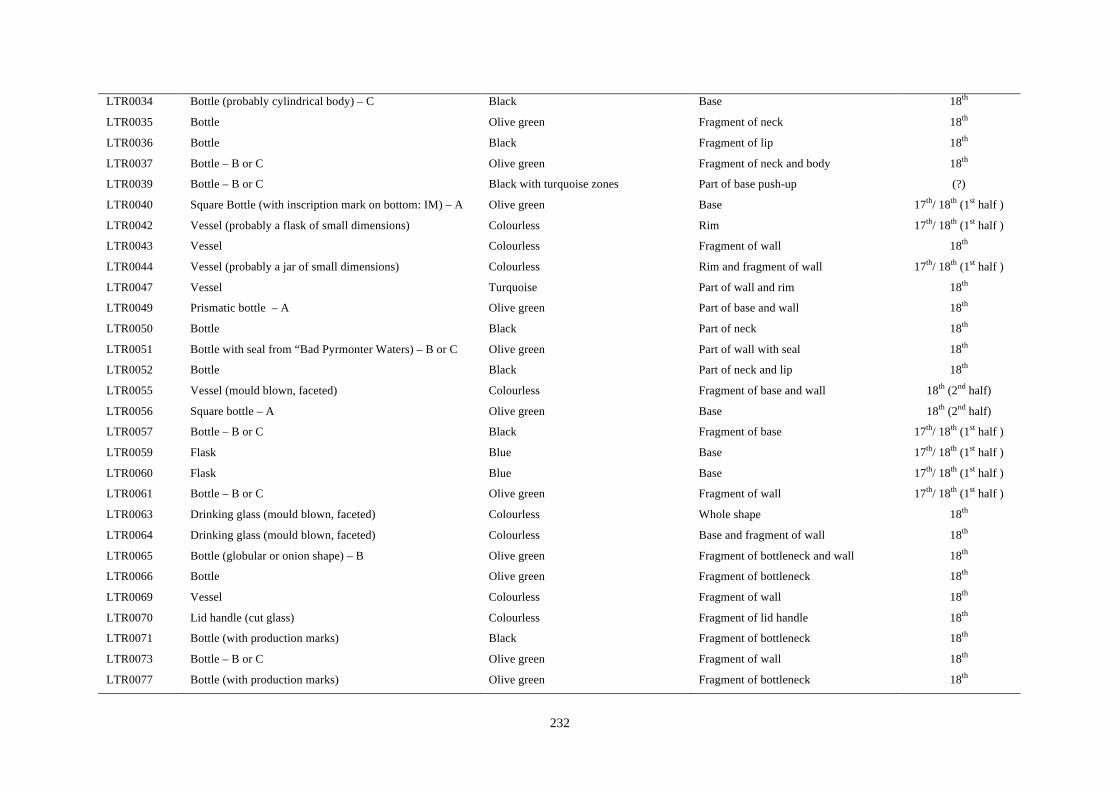
! 232!
LTR0034 Bottle (probably cylindrical body) – C Black Base 18th
LTR0035 Bottle Olive green Fragment of neck 18th
LTR0036 Bottle Black Fragment of lip 18th
LTR0037 Bottle – B or C Olive green Fragment of neck and body 18th
LTR0039 Bottle – B or C Black with turquoise zones Part of base push-up (?)
LTR0040 Square Bottle (with inscription mark on bottom: IM) – A Olive green Base 17th/ 18th (1st half )
LTR0042 Vessel (probably a flask of small dimensions) Colourless Rim 17th/ 18th (1st half )
LTR0043 Vessel Colourless Fragment of wall 18th
LTR0044 Vessel (probably a jar of small dimensions) Colourless Rim and fragment of wall 17th/ 18th (1st half )
LTR0047 Vessel Turquoise Part of wall and rim 18th
LTR0049 Prismatic bottle – A Olive green Part of base and wall 18th
LTR0050 Bottle Black Part of neck 18th
LTR0051 Bottle with seal from “Bad Pyrmonter Waters) – B or C Olive green Part of wall with seal 18th
LTR0052 Bottle Black Part of neck and lip 18th
LTR0055 Vessel (mould blown, faceted) Colourless Fragment of base and wall 18th (2nd half)
LTR0056 Square bottle – A Olive green Base 18th (2nd half)
LTR0057 Bottle – B or C Black Fragment of base 17th/ 18th (1st half )
LTR0059 Flask Blue Base 17th/ 18th (1st half )
LTR0060 Flask Blue Base 17th/ 18th (1st half )
LTR0061 Bottle – B or C Olive green Fragment of wall 17th/ 18th (1st half )
LTR0063 Drinking glass (mould blown, faceted) Colourless Whole shape 18th
LTR0064 Drinking glass (mould blown, faceted) Colourless Base and fragment of wall 18th
LTR0065 Bottle (globular or onion shape) – B Olive green Fragment of bottleneck and wall 18th
LTR0066 Bottle Olive green Fragment of bottleneck 18th
LTR0069 Vessel Colourless Fragment of wall 18th
LTR0070 Lid handle (cut glass) Colourless Fragment of lid handle 18th
LTR0071 Bottle (with production marks) Black Fragment of bottleneck 18th
LTR0073 Bottle – B or C Olive green Fragment of wall 18th
LTR0077 Bottle (with production marks) Olive green Fragment of bottleneck 18th
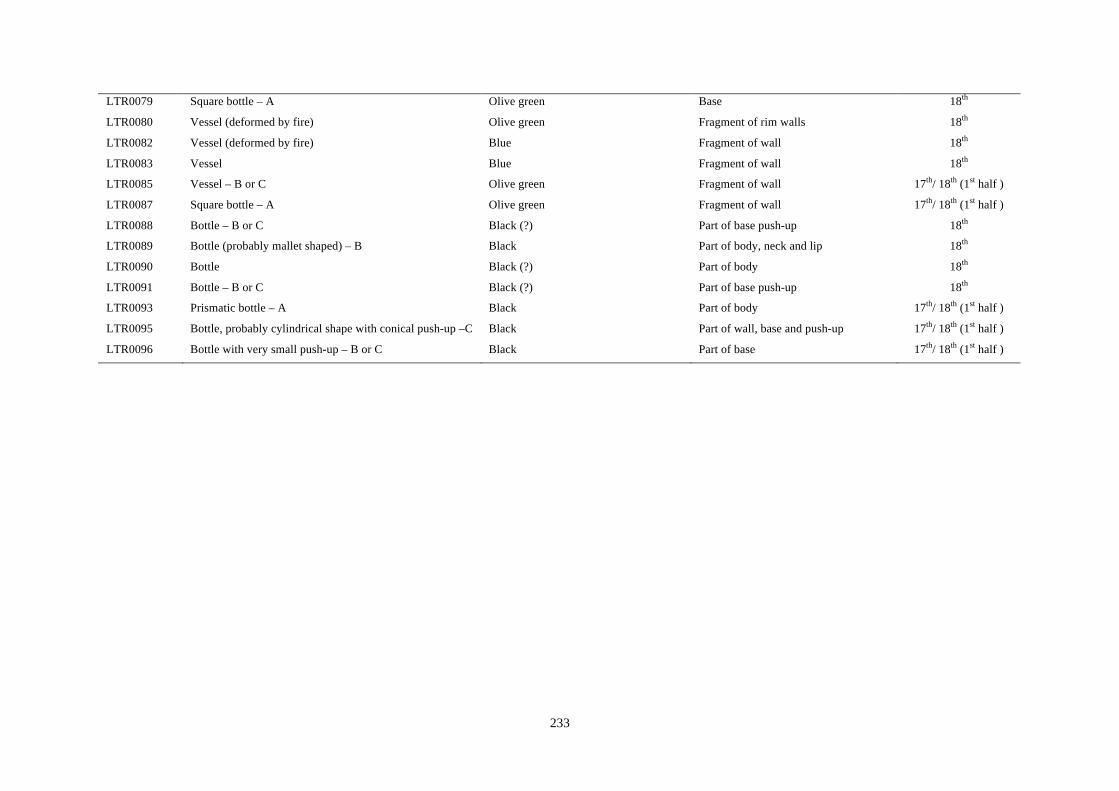
! 233!
LTR0079 Square bottle – A Olive green Base 18th
LTR0080 Vessel (deformed by fire) Olive green Fragment of rim walls 18th
LTR0082 Vessel (deformed by fire) Blue Fragment of wall 18th
LTR0083 Vessel Blue Fragment of wall 18th
LTR0085 Vessel – B or C Olive green Fragment of wall 17th/ 18th (1st half )
LTR0087 Square bottle – A Olive green Fragment of wall 17th/ 18th (1st half )
LTR0088 Bottle – B or C Black (?) Part of base push-up 18th
LTR0089 Bottle (probably mallet shaped) – B Black Part of body, neck and lip 18th
LTR0090 Bottle Black (?) Part of body 18th
LTR0091 Bottle – B or C Black (?) Part of base push-up 18th
LTR0093 Prismatic bottle – A Black Part of body 17th/ 18th (1st half )
LTR0095 Bottle, probably cylindrical shape with conical push-up –C Black Part of wall, base and push-up 17th/ 18th (1st half )
LTR0096 Bottle with very small push-up – B or C Black Part of base 17th/ 18th (1st half )
!!!!!!!!!!!!!!!

! 234!
!!!!
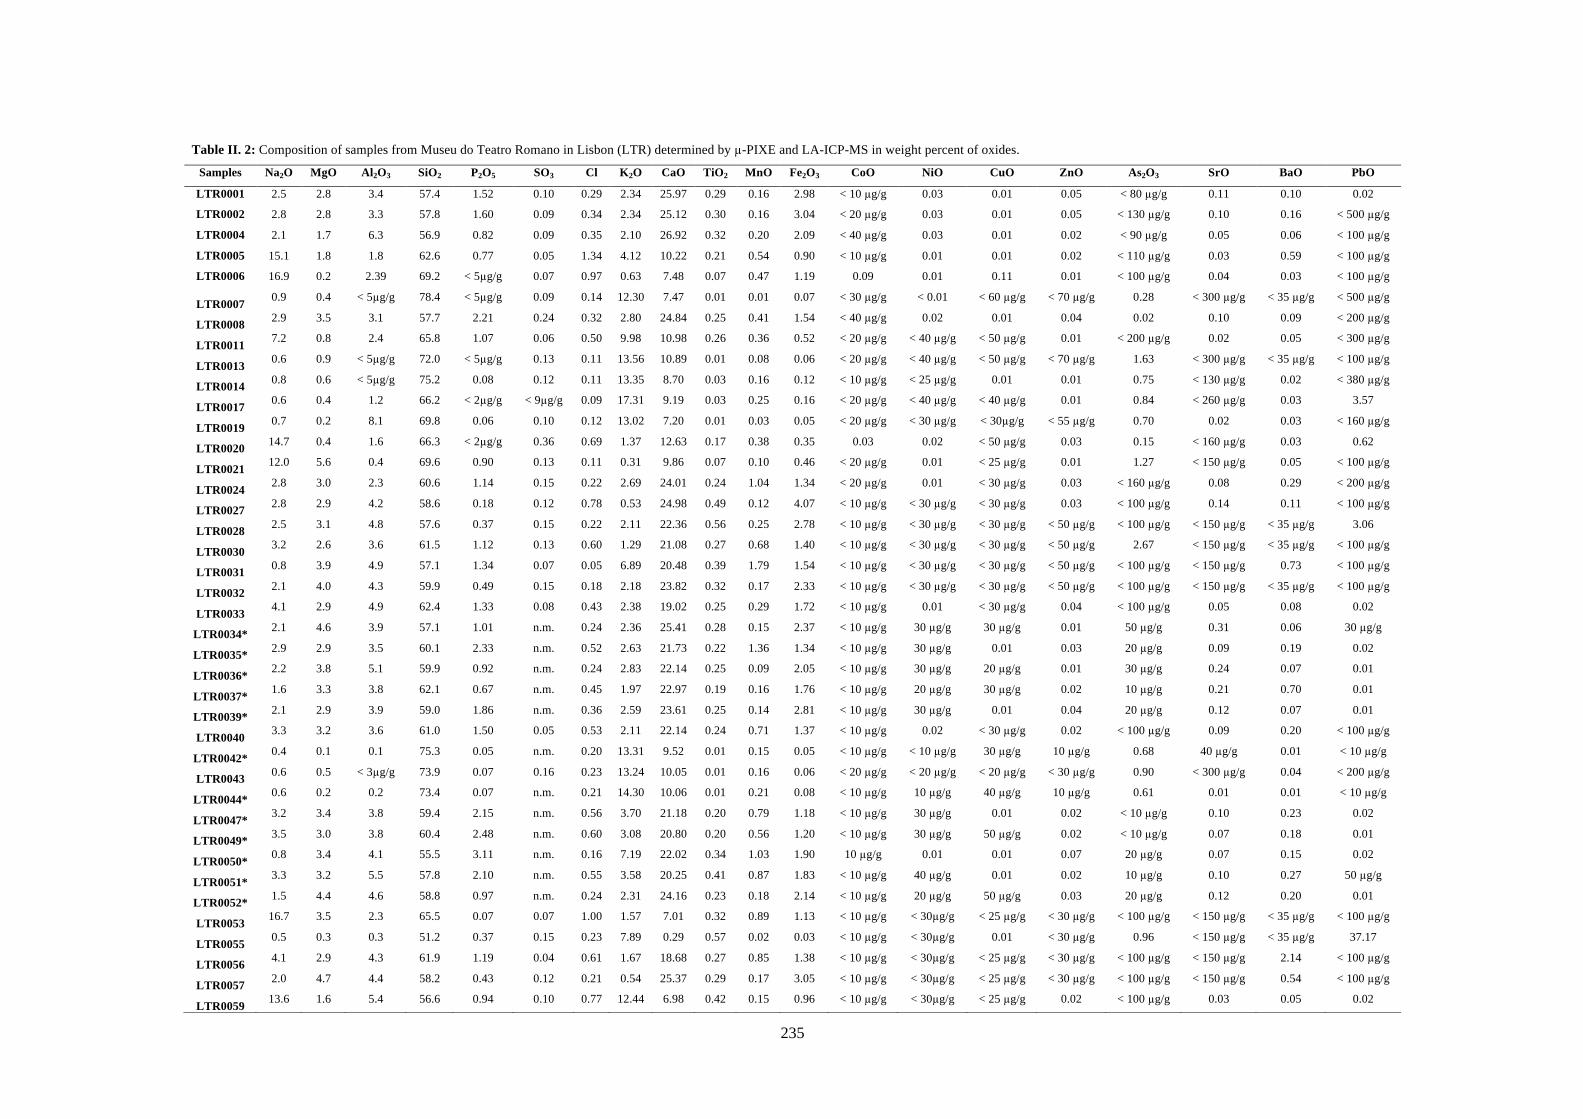
235
Table II. 2: Composition of samples from Museu do Teatro Romano in Lisbon (LTR) determined by µ-PIXE and LA-ICP-MS in weight percent of oxides.
Samples Na2O MgO Al2O3 SiO2 P2O5 SO3 Cl K2O CaO TiO2 MnO Fe2O3 CoO NiO CuO ZnO As2O3 SrO BaO PbO
LTR0001 2.5 2.8 3.4 57.4 1.52 0.10 0.29 2.34 25.97 0.29 0.16 2.98 < 10 µg/g 0.03 0.01 0.05 < 80 µg/g 0.11 0.10 0.02
LTR0002 2.8 2.8 3.3 57.8 1.60 0.09 0.34 2.34 25.12 0.30 0.16 3.04 < 20 µg/g 0.03 0.01 0.05 < 130 µg/g 0.10 0.16 < 500 µg/g
LTR0004 2.1 1.7 6.3 56.9 0.82 0.09 0.35 2.10 26.92 0.32 0.20 2.09 < 40 µg/g 0.03 0.01 0.02 < 90 µg/g 0.05 0.06 < 100 µg/g
LTR0005 15.1 1.8 1.8 62.6 0.77 0.05 1.34 4.12 10.22 0.21 0.54 0.90 < 10 µg/g 0.01 0.01 0.02 < 110 µg/g 0.03 0.59 < 100 µg/g
LTR0006 16.9 0.2 2.39 69.2 < 5µg/g 0.07 0.97 0.63 7.48 0.07 0.47 1.19 0.09 0.01 0.11 0.01 < 100 µg/g 0.04 0.03 < 100 µg/g
LTR0007 0.9 0.4 < 5µg/g 78.4 < 5µg/g 0.09 0.14 12.30 7.47 0.01 0.01 0.07 < 30 µg/g < 0.01 < 60 µg/g < 70 µg/g 0.28 < 300 µg/g < 35 µg/g < 500 µg/g
LTR0008 2.9 3.5 3.1 57.7 2.21 0.24 0.32 2.80 24.84 0.25 0.41 1.54 < 40 µg/g 0.02 0.01 0.04 0.02 0.10 0.09 < 200 µg/g
LTR0011 7.2 0.8 2.4 65.8 1.07 0.06 0.50 9.98 10.98 0.26 0.36 0.52 < 20 µg/g < 40 µg/g < 50 µg/g 0.01 < 200 µg/g 0.02 0.05 < 300 µg/g
LTR0013 0.6 0.9 < 5µg/g 72.0 < 5µg/g 0.13 0.11 13.56 10.89 0.01 0.08 0.06 < 20 µg/g < 40 µg/g < 50 µg/g < 70 µg/g 1.63 < 300 µg/g < 35 µg/g < 100 µg/g
LTR0014 0.8 0.6 < 5µg/g 75.2 0.08 0.12 0.11 13.35 8.70 0.03 0.16 0.12 < 10 µg/g < 25 µg/g 0.01 0.01 0.75 < 130 µg/g 0.02 < 380 µg/g
LTR0017 0.6 0.4 1.2 66.2 < 2µg/g < 9µg/g 0.09 17.31 9.19 0.03 0.25 0.16 < 20 µg/g < 40 µg/g < 40 µg/g 0.01 0.84 < 260 µg/g 0.03 3.57
LTR0019 0.7 0.2 8.1 69.8 0.06 0.10 0.12 13.02 7.20 0.01 0.03 0.05 < 20 µg/g < 30 µg/g < 30µg/g < 55 µg/g 0.70 0.02 0.03 < 160 µg/g
LTR0020 14.7 0.4 1.6 66.3 < 2µg/g 0.36 0.69 1.37 12.63 0.17 0.38 0.35 0.03 0.02 < 50 µg/g 0.03 0.15 < 160 µg/g 0.03 0.62
LTR0021 12.0 5.6 0.4 69.6 0.90 0.13 0.11 0.31 9.86 0.07 0.10 0.46 < 20 µg/g 0.01 < 25 µg/g 0.01 1.27 < 150 µg/g 0.05 < 100 µg/g
LTR0024 2.8 3.0 2.3 60.6 1.14 0.15 0.22 2.69 24.01 0.24 1.04 1.34 < 20 µg/g 0.01 < 30 µg/g 0.03 < 160 µg/g 0.08 0.29 < 200 µg/g
LTR0027 2.8 2.9 4.2 58.6 0.18 0.12 0.78 0.53 24.98 0.49 0.12 4.07 < 10 µg/g < 30 µg/g < 30 µg/g 0.03 < 100 µg/g 0.14 0.11 < 100 µg/g
LTR0028 2.5 3.1 4.8 57.6 0.37 0.15 0.22 2.11 22.36 0.56 0.25 2.78 < 10 µg/g < 30 µg/g < 30 µg/g < 50 µg/g < 100 µg/g < 150 µg/g < 35 µg/g 3.06
LTR0030 3.2 2.6 3.6 61.5 1.12 0.13 0.60 1.29 21.08 0.27 0.68 1.40 < 10 µg/g < 30 µg/g < 30 µg/g < 50 µg/g 2.67 < 150 µg/g < 35 µg/g < 100 µg/g
LTR0031 0.8 3.9 4.9 57.1 1.34 0.07 0.05 6.89 20.48 0.39 1.79 1.54 < 10 µg/g < 30 µg/g < 30 µg/g < 50 µg/g < 100 µg/g < 150 µg/g 0.73 < 100 µg/g
LTR0032 2.1 4.0 4.3 59.9 0.49 0.15 0.18 2.18 23.82 0.32 0.17 2.33 < 10 µg/g < 30 µg/g < 30 µg/g < 50 µg/g < 100 µg/g < 150 µg/g < 35 µg/g < 100 µg/g
LTR0033 4.1 2.9 4.9 62.4 1.33 0.08 0.43 2.38 19.02 0.25 0.29 1.72 < 10 µg/g 0.01 < 30 µg/g 0.04 < 100 µg/g 0.05 0.08 0.02
LTR0034* 2.1 4.6 3.9 57.1 1.01 n.m. 0.24 2.36 25.41 0.28 0.15 2.37 < 10 µg/g 30 µg/g 30 µg/g 0.01 50 µg/g 0.31 0.06 30 µg/g
LTR0035* 2.9 2.9 3.5 60.1 2.33 n.m. 0.52 2.63 21.73 0.22 1.36 1.34 < 10 µg/g 30 µg/g 0.01 0.03 20 µg/g 0.09 0.19 0.02
LTR0036* 2.2 3.8 5.1 59.9 0.92 n.m. 0.24 2.83 22.14 0.25 0.09 2.05 < 10 µg/g 30 µg/g 20 µg/g 0.01 30 µg/g 0.24 0.07 0.01
LTR0037* 1.6 3.3 3.8 62.1 0.67 n.m. 0.45 1.97 22.97 0.19 0.16 1.76 < 10 µg/g 20 µg/g 30 µg/g 0.02 10 µg/g 0.21 0.70 0.01
LTR0039* 2.1 2.9 3.9 59.0 1.86 n.m. 0.36 2.59 23.61 0.25 0.14 2.81 < 10 µg/g 30 µg/g 0.01 0.04 20 µg/g 0.12 0.07 0.01
LTR0040 3.3 3.2 3.6 61.0 1.50 0.05 0.53 2.11 22.14 0.24 0.71 1.37 < 10 µg/g 0.02 < 30 µg/g 0.02 < 100 µg/g 0.09 0.20 < 100 µg/g
LTR0042* 0.4 0.1 0.1 75.3 0.05 n.m. 0.20 13.31 9.52 0.01 0.15 0.05 < 10 µg/g < 10 µg/g 30 µg/g 10 µg/g 0.68 40 µg/g 0.01 < 10 µg/g
LTR0043 0.6 0.5 < 3µg/g 73.9 0.07 0.16 0.23 13.24 10.05 0.01 0.16 0.06 < 20 µg/g < 20 µg/g < 20 µg/g < 30 µg/g 0.90 < 300 µg/g 0.04 < 200 µg/g
LTR0044* 0.6 0.2 0.2 73.4 0.07 n.m. 0.21 14.30 10.06 0.01 0.21 0.08 < 10 µg/g 10 µg/g 40 µg/g 10 µg/g 0.61 0.01 0.01 < 10 µg/g
LTR0047* 3.2 3.4 3.8 59.4 2.15 n.m. 0.56 3.70 21.18 0.20 0.79 1.18 < 10 µg/g 30 µg/g 0.01 0.02 < 10 µg/g 0.10 0.23 0.02
LTR0049* 3.5 3.0 3.8 60.4 2.48 n.m. 0.60 3.08 20.80 0.20 0.56 1.20 < 10 µg/g 30 µg/g 50 µg/g 0.02 < 10 µg/g 0.07 0.18 0.01
LTR0050* 0.8 3.4 4.1 55.5 3.11 n.m. 0.16 7.19 22.02 0.34 1.03 1.90 10 µg/g 0.01 0.01 0.07 20 µg/g 0.07 0.15 0.02
LTR0051* 3.3 3.2 5.5 57.8 2.10 n.m. 0.55 3.58 20.25 0.41 0.87 1.83 < 10 µg/g 40 µg/g 0.01 0.02 10 µg/g 0.10 0.27 50 µg/g
LTR0052* 1.5 4.4 4.6 58.8 0.97 n.m. 0.24 2.31 24.16 0.23 0.18 2.14 < 10 µg/g 20 µg/g 50 µg/g 0.03 20 µg/g 0.12 0.20 0.01
LTR0053 16.7 3.5 2.3 65.5 0.07 0.07 1.00 1.57 7.01 0.32 0.89 1.13 < 10 µg/g < 30µg/g < 25 µg/g < 30 µg/g < 100 µg/g < 150 µg/g < 35 µg/g < 100 µg/g
LTR0055 0.5 0.3 0.3 51.2 0.37 0.15 0.23 7.89 0.29 0.57 0.02 0.03 < 10 µg/g < 30µg/g 0.01 < 30 µg/g 0.96 < 150 µg/g < 35 µg/g 37.17
LTR0056 4.1 2.9 4.3 61.9 1.19 0.04 0.61 1.67 18.68 0.27 0.85 1.38 < 10 µg/g < 30µg/g < 25 µg/g < 30 µg/g < 100 µg/g < 150 µg/g 2.14 < 100 µg/g
LTR0057 2.0 4.7 4.4 58.2 0.43 0.12 0.21 0.54 25.37 0.29 0.17 3.05 < 10 µg/g < 30µg/g < 25 µg/g < 30 µg/g < 100 µg/g < 150 µg/g 0.54 < 100 µg/g
LTR0059 13.6 1.6 5.4 56.6 0.94 0.10 0.77 12.44 6.98 0.42 0.15 0.96 < 10 µg/g < 30µg/g < 25 µg/g 0.02 < 100 µg/g 0.03 0.05 0.02
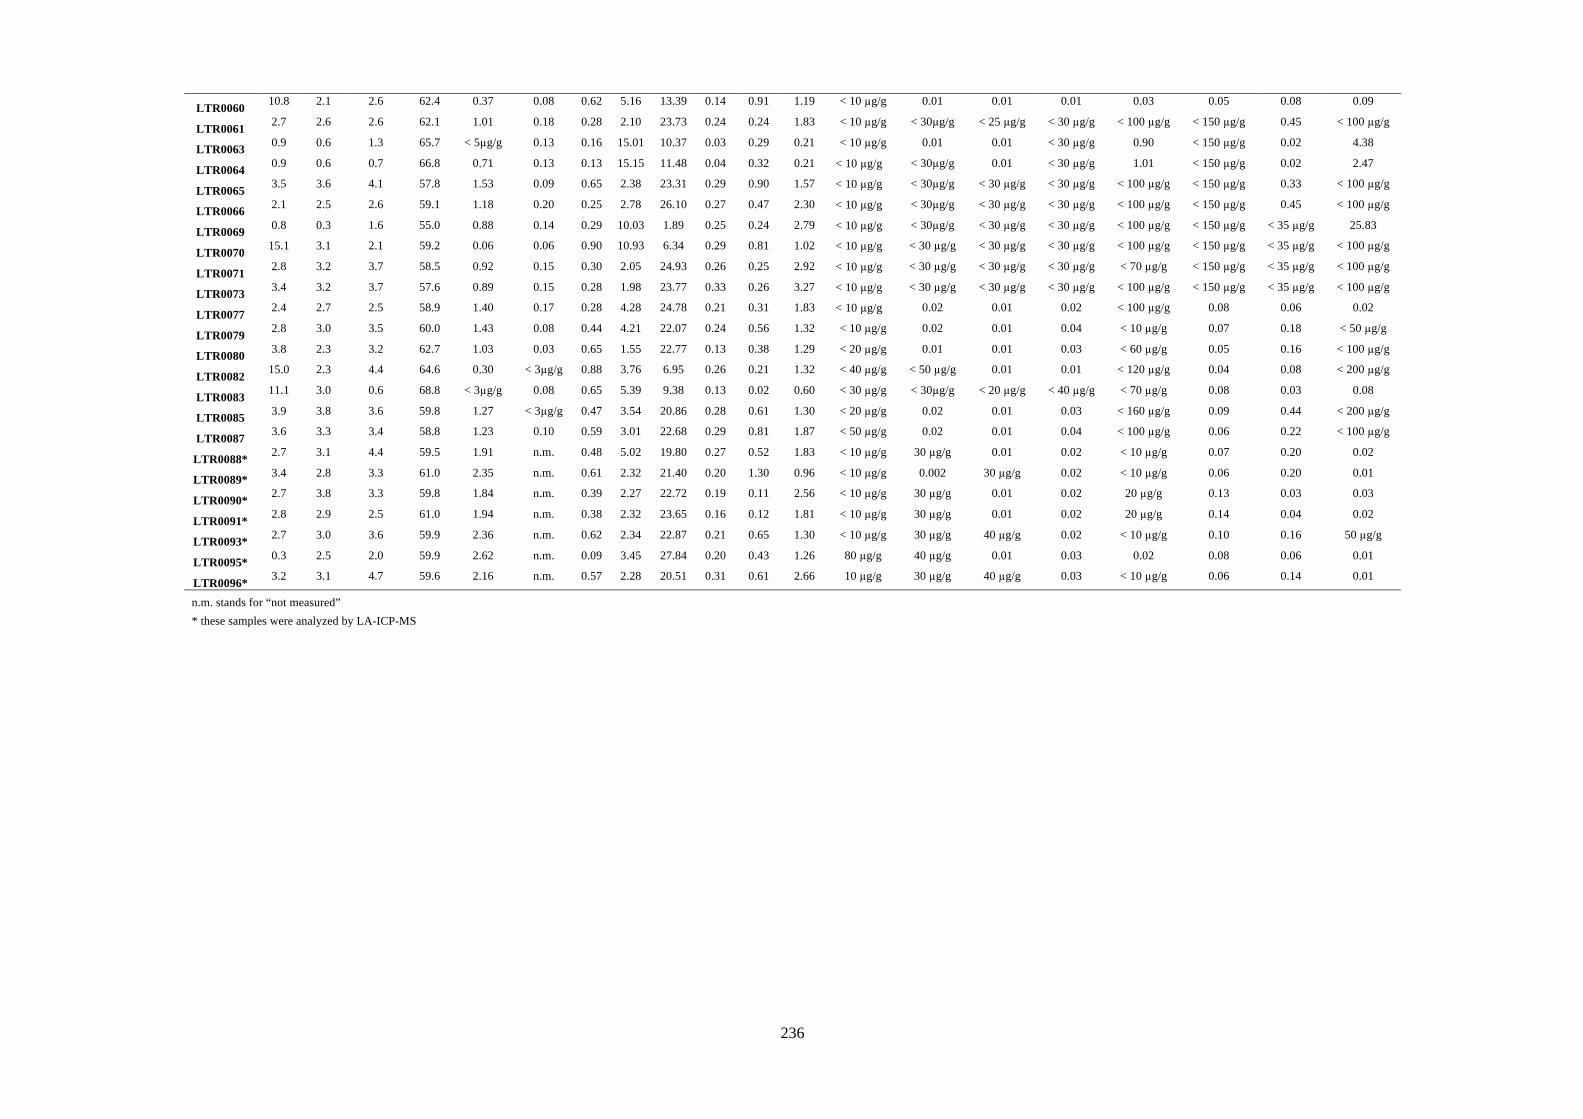
236
LTR0060 10.8 2.1 2.6 62.4 0.37 0.08 0.62 5.16 13.39 0.14 0.91 1.19 < 10 µg/g 0.01 0.01 0.01 0.03 0.05 0.08 0.09
LTR0061 2.7 2.6 2.6 62.1 1.01 0.18 0.28 2.10 23.73 0.24 0.24 1.83 < 10 µg/g < 30µg/g < 25 µg/g < 30 µg/g < 100 µg/g < 150 µg/g 0.45 < 100 µg/g
LTR0063 0.9 0.6 1.3 65.7 < 5µg/g 0.13 0.16 15.01 10.37 0.03 0.29 0.21 < 10 µg/g 0.01 0.01 < 30 µg/g 0.90 < 150 µg/g 0.02 4.38
LTR0064 0.9 0.6 0.7 66.8 0.71 0.13 0.13 15.15 11.48 0.04 0.32 0.21 < 10 µg/g < 30µg/g 0.01 < 30 µg/g 1.01 < 150 µg/g 0.02 2.47
LTR0065 3.5 3.6 4.1 57.8 1.53 0.09 0.65 2.38 23.31 0.29 0.90 1.57 < 10 µg/g < 30µg/g < 30 µg/g < 30 µg/g < 100 µg/g < 150 µg/g 0.33 < 100 µg/g
LTR0066 2.1 2.5 2.6 59.1 1.18 0.20 0.25 2.78 26.10 0.27 0.47 2.30 < 10 µg/g < 30µg/g < 30 µg/g < 30 µg/g < 100 µg/g < 150 µg/g 0.45 < 100 µg/g
LTR0069 0.8 0.3 1.6 55.0 0.88 0.14 0.29 10.03 1.89 0.25 0.24 2.79 < 10 µg/g < 30µg/g < 30 µg/g < 30 µg/g < 100 µg/g < 150 µg/g < 35 µg/g 25.83
LTR0070 15.1 3.1 2.1 59.2 0.06 0.06 0.90 10.93 6.34 0.29 0.81 1.02 < 10 µg/g < 30 µg/g < 30 µg/g < 30 µg/g < 100 µg/g < 150 µg/g < 35 µg/g < 100 µg/g
LTR0071 2.8 3.2 3.7 58.5 0.92 0.15 0.30 2.05 24.93 0.26 0.25 2.92 < 10 µg/g < 30 µg/g < 30 µg/g < 30 µg/g < 70 µg/g < 150 µg/g < 35 µg/g < 100 µg/g
LTR0073 3.4 3.2 3.7 57.6 0.89 0.15 0.28 1.98 23.77 0.33 0.26 3.27 < 10 µg/g < 30 µg/g < 30 µg/g < 30 µg/g < 100 µg/g < 150 µg/g < 35 µg/g < 100 µg/g
LTR0077 2.4 2.7 2.5 58.9 1.40 0.17 0.28 4.28 24.78 0.21 0.31 1.83 < 10 µg/g 0.02 0.01 0.02 < 100 µg/g 0.08 0.06 0.02
LTR0079 2.8 3.0 3.5 60.0 1.43 0.08 0.44 4.21 22.07 0.24 0.56 1.32 < 10 µg/g 0.02 0.01 0.04 < 10 µg/g 0.07 0.18 < 50 µg/g
LTR0080 3.8 2.3 3.2 62.7 1.03 0.03 0.65 1.55 22.77 0.13 0.38 1.29 < 20 µg/g 0.01 0.01 0.03 < 60 µg/g 0.05 0.16 < 100 µg/g
LTR0082 15.0 2.3 4.4 64.6 0.30 < 3µg/g 0.88 3.76 6.95 0.26 0.21 1.32 < 40 µg/g < 50 µg/g 0.01 0.01 < 120 µg/g 0.04 0.08 < 200 µg/g
LTR0083 11.1 3.0 0.6 68.8 < 3µg/g 0.08 0.65 5.39 9.38 0.13 0.02 0.60 < 30 µg/g < 30µg/g < 20 µg/g < 40 µg/g < 70 µg/g 0.08 0.03 0.08
LTR0085 3.9 3.8 3.6 59.8 1.27 < 3µg/g 0.47 3.54 20.86 0.28 0.61 1.30 < 20 µg/g 0.02 0.01 0.03 < 160 µg/g 0.09 0.44 < 200 µg/g
LTR0087 3.6 3.3 3.4 58.8 1.23 0.10 0.59 3.01 22.68 0.29 0.81 1.87 < 50 µg/g 0.02 0.01 0.04 < 100 µg/g 0.06 0.22 < 100 µg/g
LTR0088* 2.7 3.1 4.4 59.5 1.91 n.m. 0.48 5.02 19.80 0.27 0.52 1.83 < 10 µg/g 30 µg/g 0.01 0.02 < 10 µg/g 0.07 0.20 0.02
LTR0089* 3.4 2.8 3.3 61.0 2.35 n.m. 0.61 2.32 21.40 0.20 1.30 0.96 < 10 µg/g 0.002 30 µg/g 0.02 < 10 µg/g 0.06 0.20 0.01
LTR0090* 2.7 3.8 3.3 59.8 1.84 n.m. 0.39 2.27 22.72 0.19 0.11 2.56 < 10 µg/g 30 µg/g 0.01 0.02 20 µg/g 0.13 0.03 0.03
LTR0091* 2.8 2.9 2.5 61.0 1.94 n.m. 0.38 2.32 23.65 0.16 0.12 1.81 < 10 µg/g 30 µg/g 0.01 0.02 20 µg/g 0.14 0.04 0.02
LTR0093* 2.7 3.0 3.6 59.9 2.36 n.m. 0.62 2.34 22.87 0.21 0.65 1.30 < 10 µg/g 30 µg/g 40 µg/g 0.02 < 10 µg/g 0.10 0.16 50 µg/g
LTR0095* 0.3 2.5 2.0 59.9 2.62 n.m. 0.09 3.45 27.84 0.20 0.43 1.26 80 µg/g 40 µg/g 0.01 0.03 0.02 0.08 0.06 0.01
LTR0096* 3.2 3.1 4.7 59.6 2.16 n.m. 0.57 2.28 20.51 0.31 0.61 2.66 10 µg/g 30 µg/g 40 µg/g 0.03 < 10 µg/g 0.06 0.14 0.01
n.m. stands for “not measured”
* these samples were analyzed by LA-ICP-MS
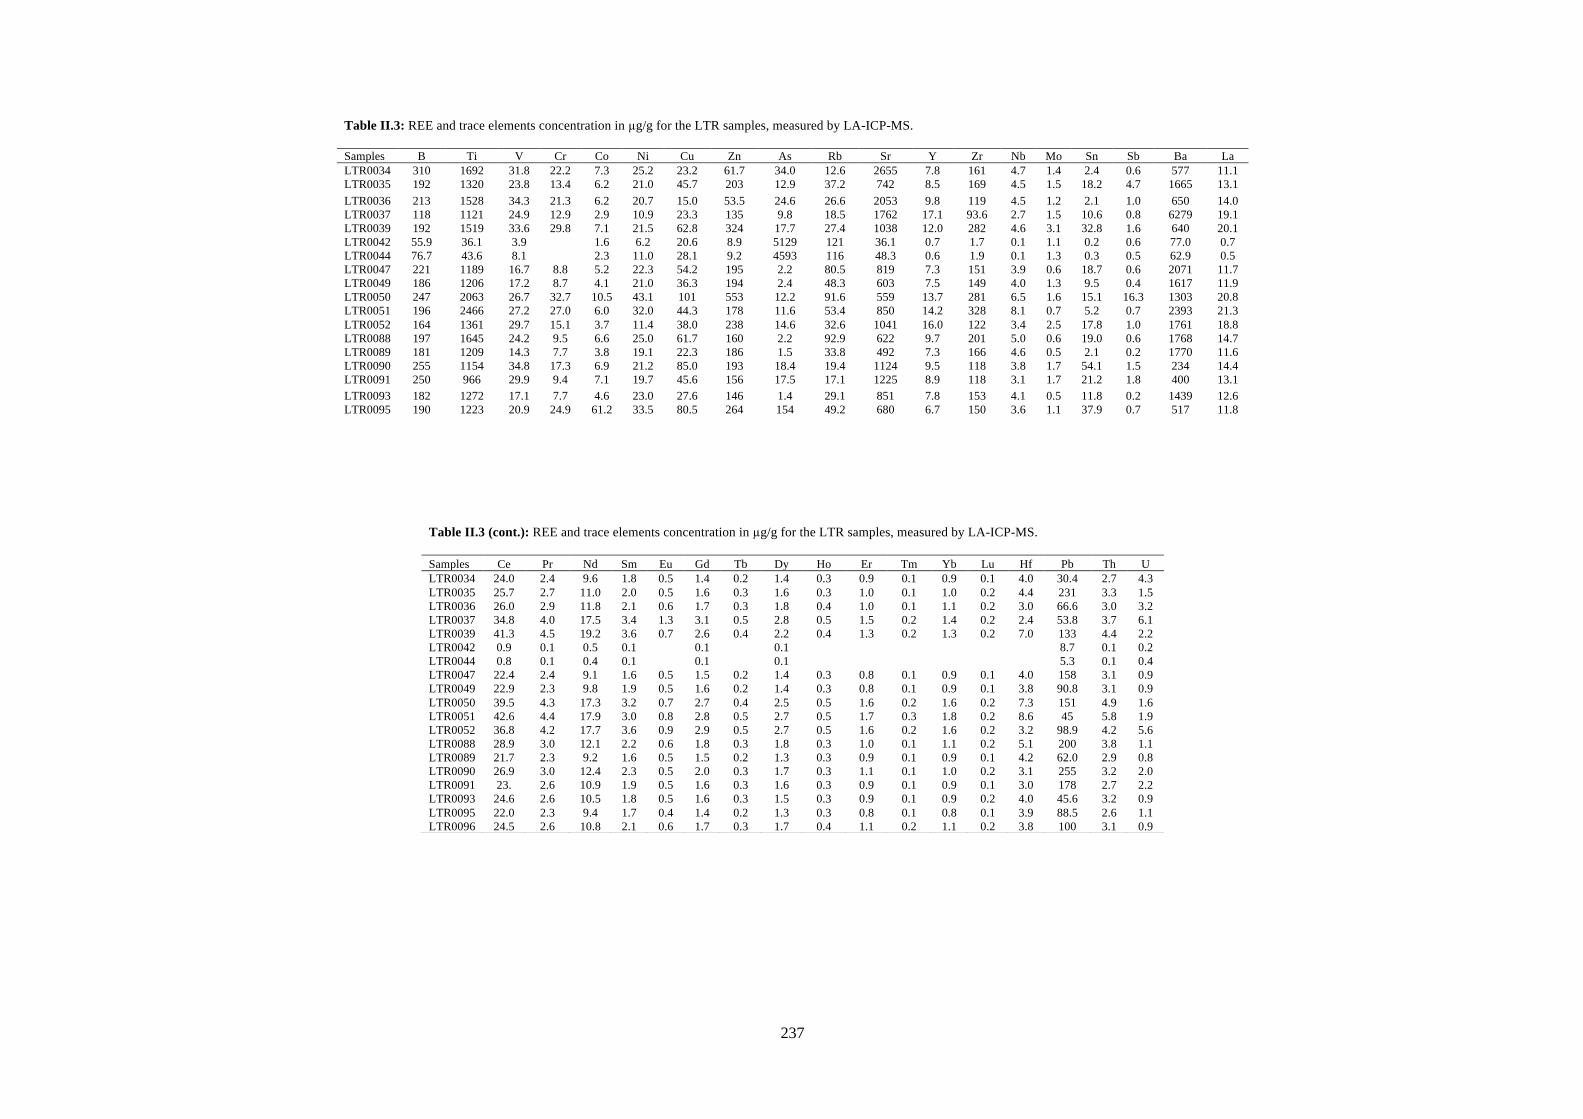
237
Table II.3: REE and trace elements concentration in µg/g for the LTR samples, measured by LA-ICP-MS. Samples B Ti V Cr Co Ni Cu Zn As Rb Sr Y Zr Nb Mo Sn Sb Ba La LTR0034 310 1692 31.8 22.2 7.3 25.2 23.2 61.7 34.0 12.6 2655 7.8 161 4.7 1.4 2.4 0.6 577 11.1 LTR0035 192 1320 23.8 13.4 6.2 21.0 45.7 203 12.9 37.2 742 8.5 169 4.5 1.5 18.2 4.7 1665 13.1 LTR0036 213 1528 34.3 21.3 6.2 20.7 15.0 53.5 24.6 26.6 2053 9.8 119 4.5 1.2 2.1 1.0 650 14.0 LTR0037 118 1121 24.9 12.9 2.9 10.9 23.3 135 9.8 18.5 1762 17.1 93.6 2.7 1.5 10.6 0.8 6279 19.1 LTR0039 192 1519 33.6 29.8 7.1 21.5 62.8 324 17.7 27.4 1038 12.0 282 4.6 3.1 32.8 1.6 640 20.1 LTR0042 55.9 36.1 3.9 1.6 6.2 20.6 8.9 5129 121 36.1 0.7 1.7 0.1 1.1 0.2 0.6 77.0 0.7 LTR0044 76.7 43.6 8.1 2.3 11.0 28.1 9.2 4593 116 48.3 0.6 1.9 0.1 1.3 0.3 0.5 62.9 0.5 LTR0047 221 1189 16.7 8.8 5.2 22.3 54.2 195 2.2 80.5 819 7.3 151 3.9 0.6 18.7 0.6 2071 11.7 LTR0049 186 1206 17.2 8.7 4.1 21.0 36.3 194 2.4 48.3 603 7.5 149 4.0 1.3 9.5 0.4 1617 11.9 LTR0050 247 2063 26.7 32.7 10.5 43.1 101 553 12.2 91.6 559 13.7 281 6.5 1.6 15.1 16.3 1303 20.8 LTR0051 196 2466 27.2 27.0 6.0 32.0 44.3 178 11.6 53.4 850 14.2 328 8.1 0.7 5.2 0.7 2393 21.3 LTR0052 164 1361 29.7 15.1 3.7 11.4 38.0 238 14.6 32.6 1041 16.0 122 3.4 2.5 17.8 1.0 1761 18.8 LTR0088 197 1645 24.2 9.5 6.6 25.0 61.7 160 2.2 92.9 622 9.7 201 5.0 0.6 19.0 0.6 1768 14.7 LTR0089 181 1209 14.3 7.7 3.8 19.1 22.3 186 1.5 33.8 492 7.3 166 4.6 0.5 2.1 0.2 1770 11.6 LTR0090 255 1154 34.8 17.3 6.9 21.2 85.0 193 18.4 19.4 1124 9.5 118 3.8 1.7 54.1 1.5 234 14.4 LTR0091 250 966 29.9 9.4 7.1 19.7 45.6 156 17.5 17.1 1225 8.9 118 3.1 1.7 21.2 1.8 400 13.1 LTR0093 182 1272 17.1 7.7 4.6 23.0 27.6 146 1.4 29.1 851 7.8 153 4.1 0.5 11.8 0.2 1439 12.6 LTR0095 190 1223 20.9 24.9 61.2 33.5 80.5 264 154 49.2 680 6.7 150 3.6 1.1 37.9 0.7 517 11.8
Table II.3 (cont.): REE and trace elements concentration in µg/g for the LTR samples, measured by LA-ICP-MS. Samples Ce Pr Nd Sm Eu Gd Tb Dy Ho Er Tm Yb Lu Hf Pb Th U LTR0034 24.0 2.4 9.6 1.8 0.5 1.4 0.2 1.4 0.3 0.9 0.1 0.9 0.1 4.0 30.4 2.7 4.3 LTR0035 25.7 2.7 11.0 2.0 0.5 1.6 0.3 1.6 0.3 1.0 0.1 1.0 0.2 4.4 231 3.3 1.5 LTR0036 26.0 2.9 11.8 2.1 0.6 1.7 0.3 1.8 0.4 1.0 0.1 1.1 0.2 3.0 66.6 3.0 3.2 LTR0037 34.8 4.0 17.5 3.4 1.3 3.1 0.5 2.8 0.5 1.5 0.2 1.4 0.2 2.4 53.8 3.7 6.1 LTR0039 41.3 4.5 19.2 3.6 0.7 2.6 0.4 2.2 0.4 1.3 0.2 1.3 0.2 7.0 133 4.4 2.2 LTR0042 0.9 0.1 0.5 0.1 0.1 0.1 8.7 0.1 0.2 LTR0044 0.8 0.1 0.4 0.1 0.1 0.1 5.3 0.1 0.4 LTR0047 22.4 2.4 9.1 1.6 0.5 1.5 0.2 1.4 0.3 0.8 0.1 0.9 0.1 4.0 158 3.1 0.9 LTR0049 22.9 2.3 9.8 1.9 0.5 1.6 0.2 1.4 0.3 0.8 0.1 0.9 0.1 3.8 90.8 3.1 0.9 LTR0050 39.5 4.3 17.3 3.2 0.7 2.7 0.4 2.5 0.5 1.6 0.2 1.6 0.2 7.3 151 4.9 1.6 LTR0051 42.6 4.4 17.9 3.0 0.8 2.8 0.5 2.7 0.5 1.7 0.3 1.8 0.2 8.6 45 5.8 1.9 LTR0052 36.8 4.2 17.7 3.6 0.9 2.9 0.5 2.7 0.5 1.6 0.2 1.6 0.2 3.2 98.9 4.2 5.6 LTR0088 28.9 3.0 12.1 2.2 0.6 1.8 0.3 1.8 0.3 1.0 0.1 1.1 0.2 5.1 200 3.8 1.1 LTR0089 21.7 2.3 9.2 1.6 0.5 1.5 0.2 1.3 0.3 0.9 0.1 0.9 0.1 4.2 62.0 2.9 0.8 LTR0090 26.9 3.0 12.4 2.3 0.5 2.0 0.3 1.7 0.3 1.1 0.1 1.0 0.2 3.1 255 3.2 2.0 LTR0091 23. 2.6 10.9 1.9 0.5 1.6 0.3 1.6 0.3 0.9 0.1 0.9 0.1 3.0 178 2.7 2.2 LTR0093 24.6 2.6 10.5 1.8 0.5 1.6 0.3 1.5 0.3 0.9 0.1 0.9 0.2 4.0 45.6 3.2 0.9 LTR0095 22.0 2.3 9.4 1.7 0.4 1.4 0.2 1.3 0.3 0.8 0.1 0.8 0.1 3.9 88.5 2.6 1.1 LTR0096 24.5 2.6 10.8 2.1 0.6 1.7 0.3 1.7 0.4 1.1 0.2 1.1 0.2 3.8 100 3.1 0.9

238
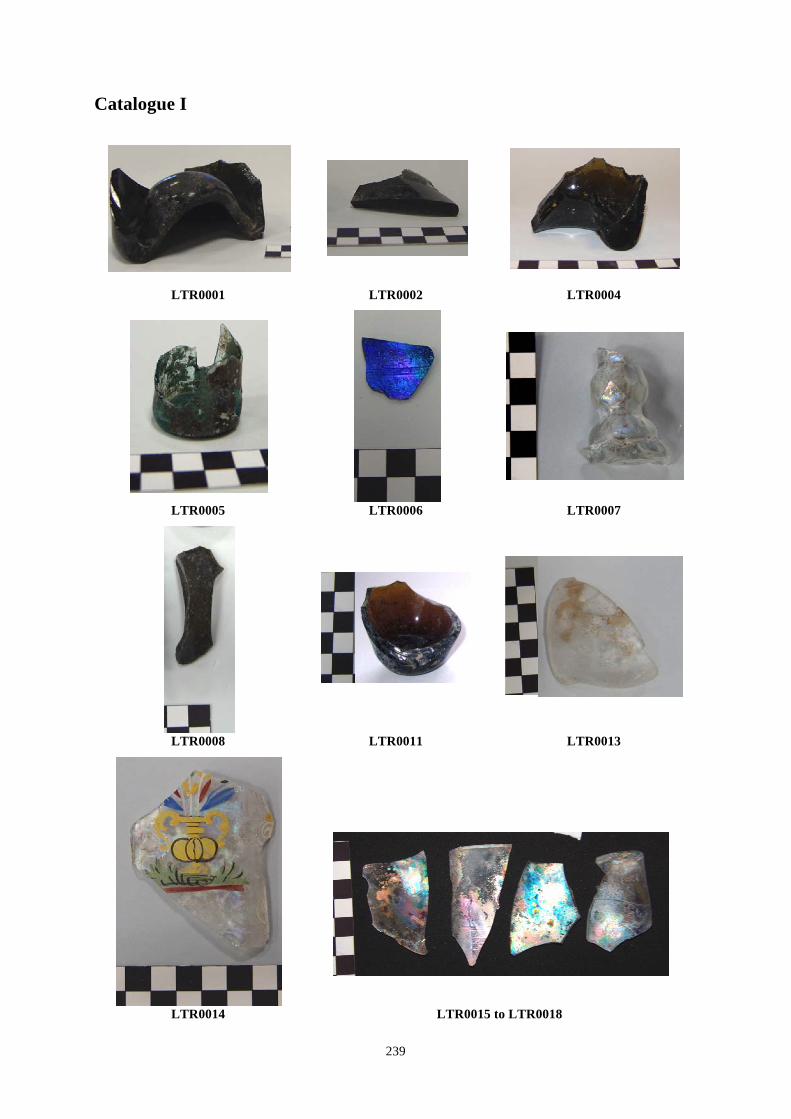
! 239!
Catalogue I
LTR0001 LTR0002 LTR0004
LTR0005 LTR0006 LTR0007
LTR0008 LTR0011 LTR0013
LTR0014 LTR0015 to LTR0018
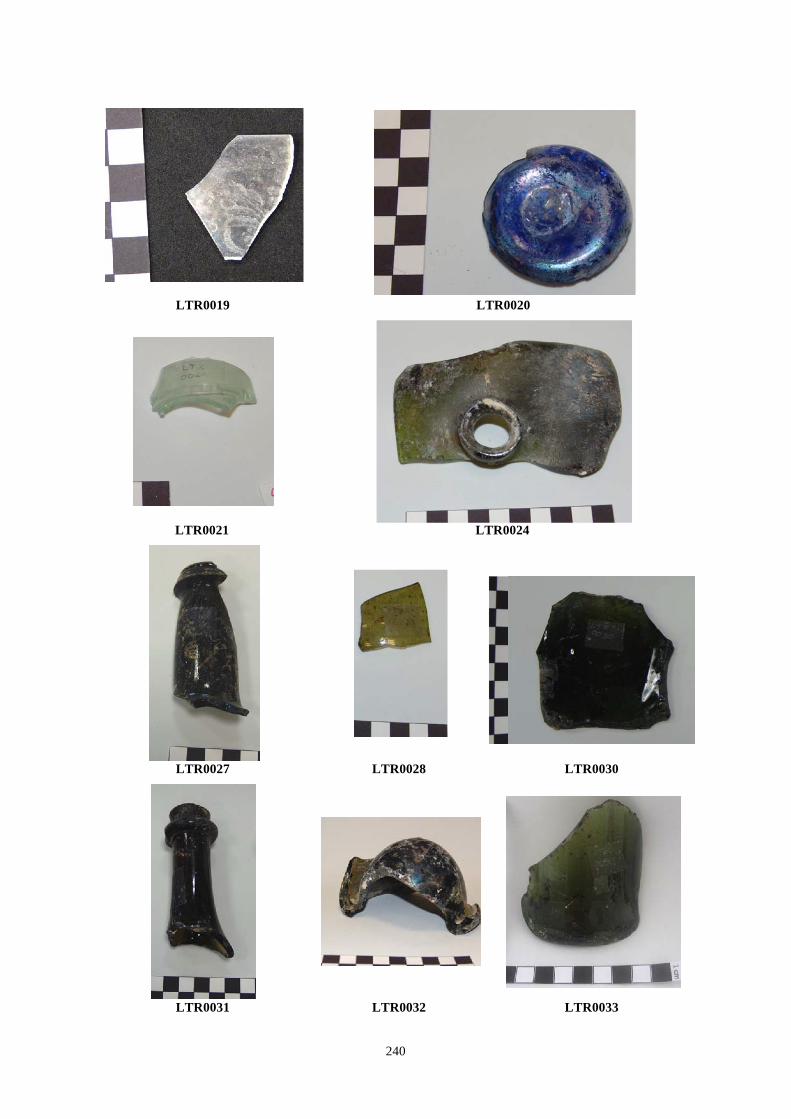
! 240!
LTR0019 LTR0020
LTR0021 LTR0024
LTR0027 LTR0028 LTR0030
LTR0031 LTR0032 LTR0033
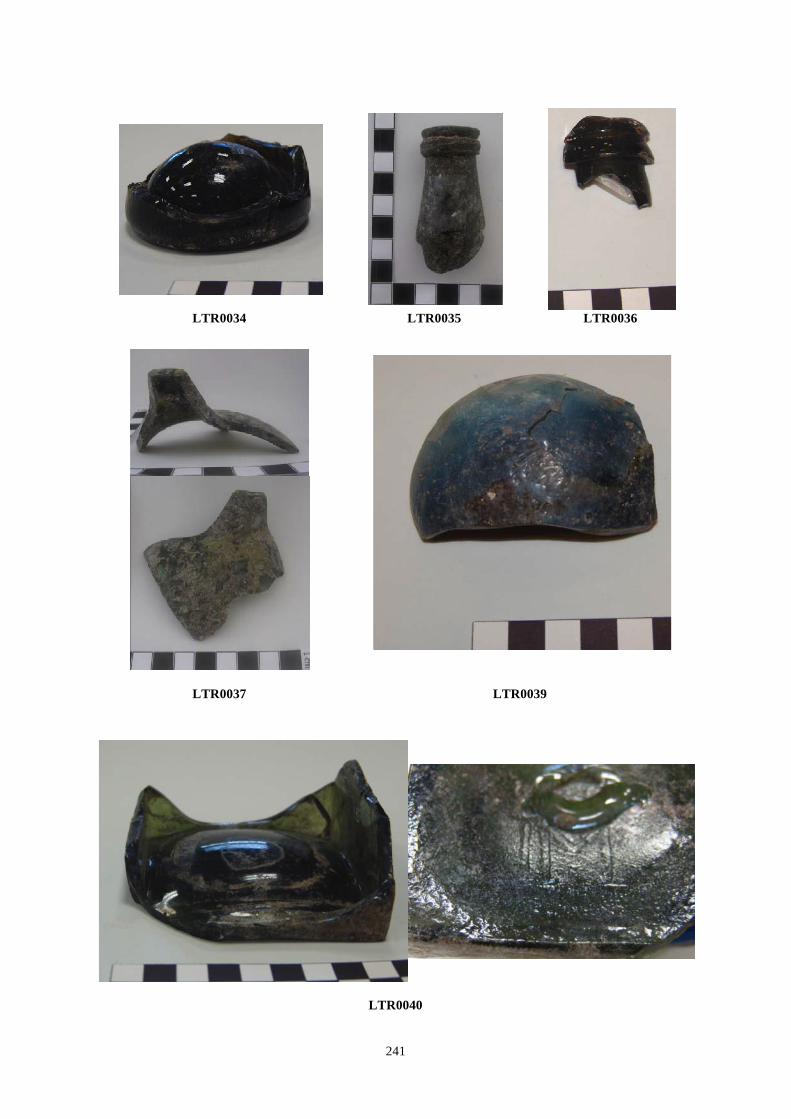
! 241!
LTR0034 LTR0035 LTR0036
LTR0037 LTR0039
LTR0040
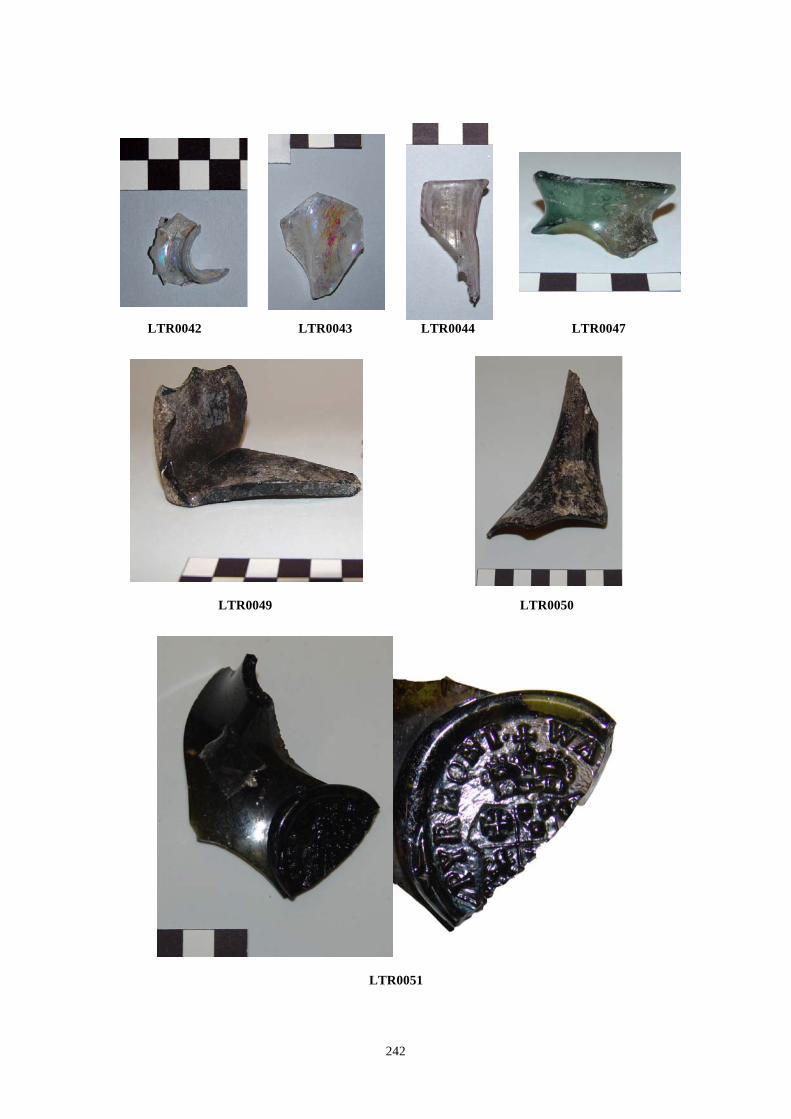
! 242!
LTR0042 LTR0043 LTR0044 LTR0047
LTR0049 LTR0050
LTR0051
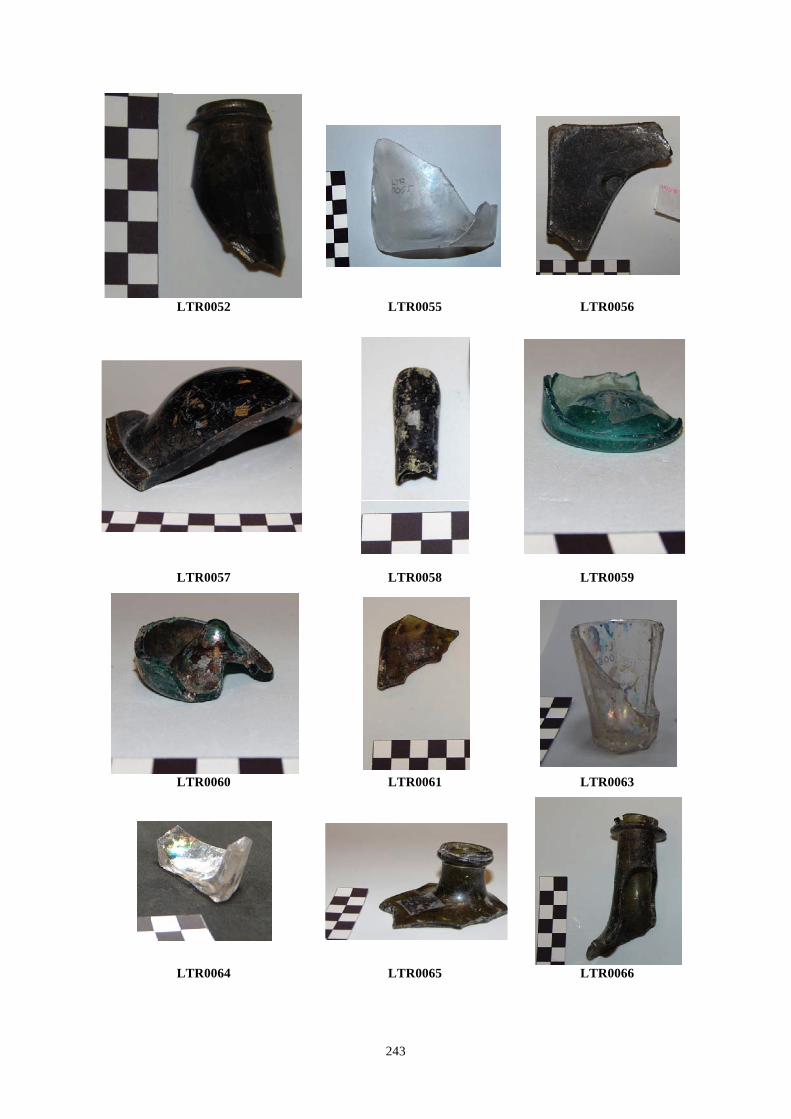
! 243!
LTR0052 LTR0055 LTR0056
LTR0057 LTR0058 LTR0059
LTR0060 LTR0061 LTR0063
LTR0064 LTR0065 LTR0066
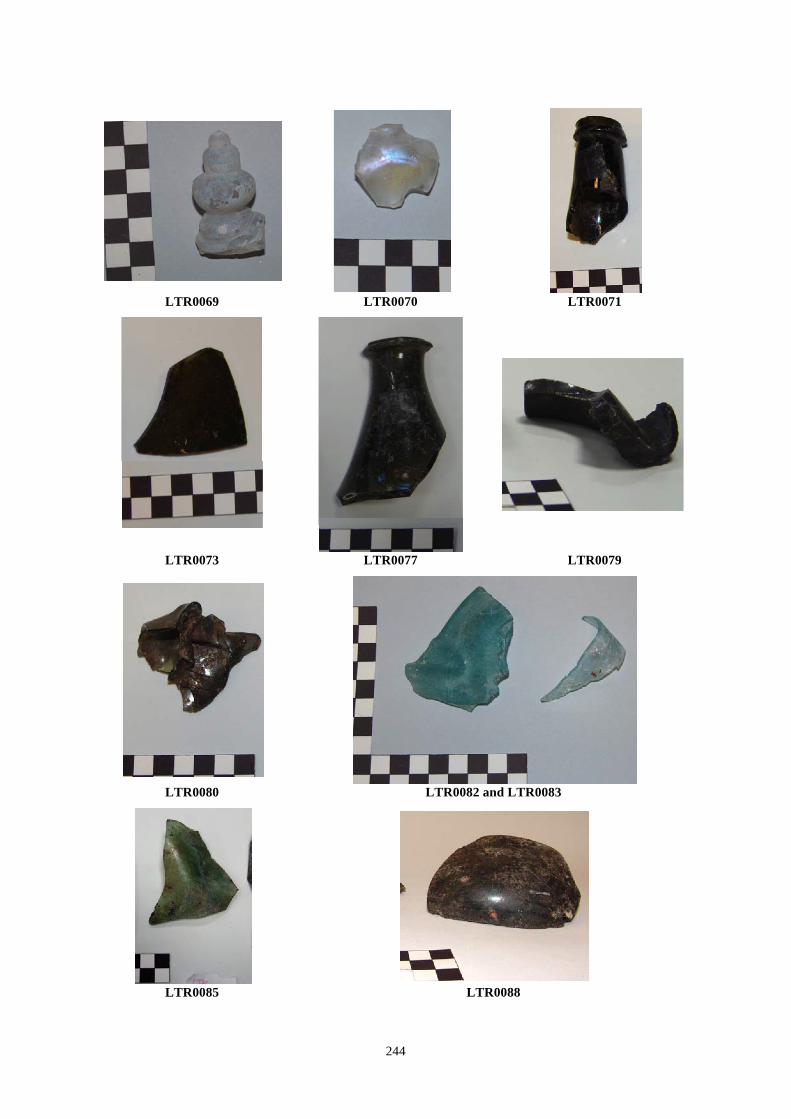
! 244!
LTR0069 LTR0070 LTR0071
LTR0073 LTR0077 LTR0079
LTR0080 LTR0082 and LTR0083
LTR0085 LTR0088
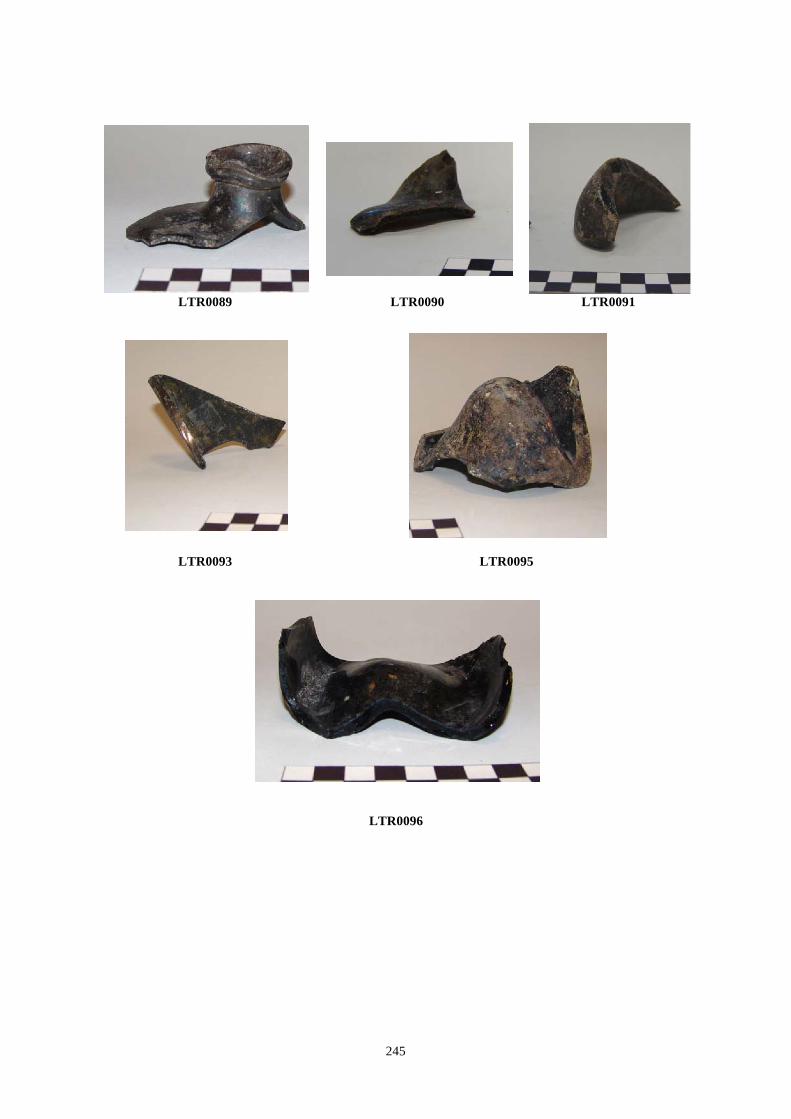
! 245!
LTR0089 LTR0090 LTR0091
LTR0093 LTR0095
LTR0096
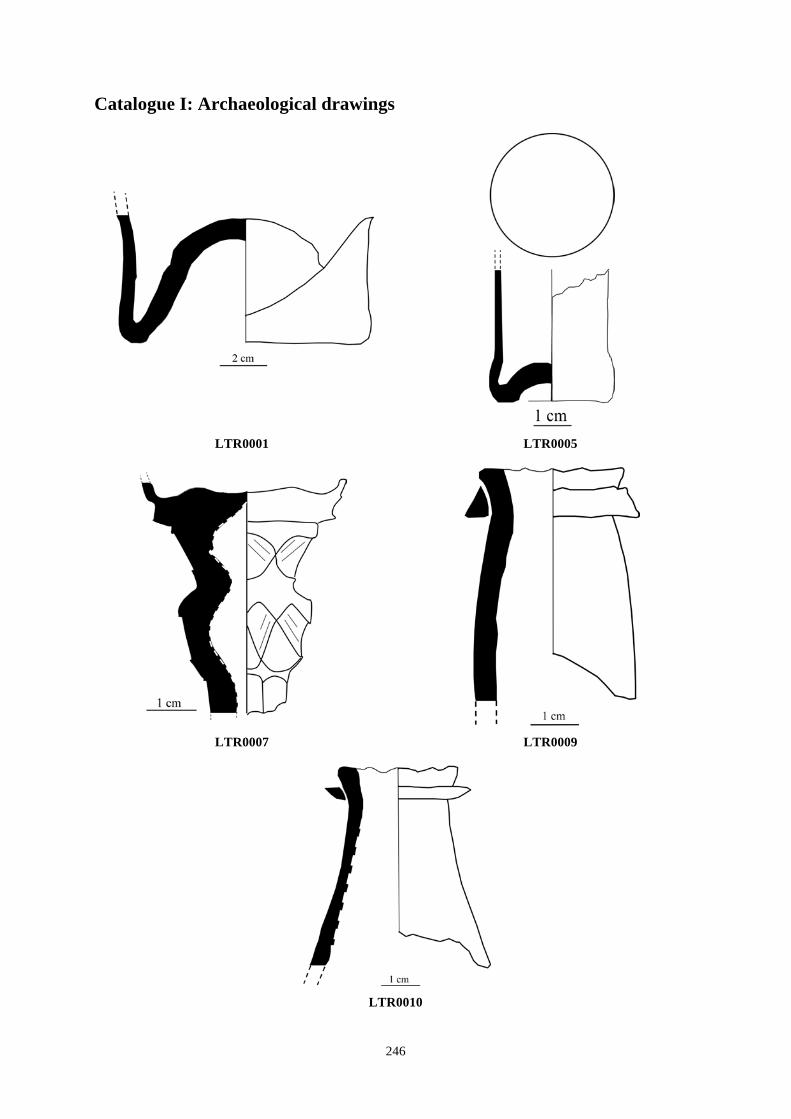
! 246!
Catalogue I: Archaeological drawings !
LTR0001 LTR0005
LTR0007 LTR0009
LTR0010
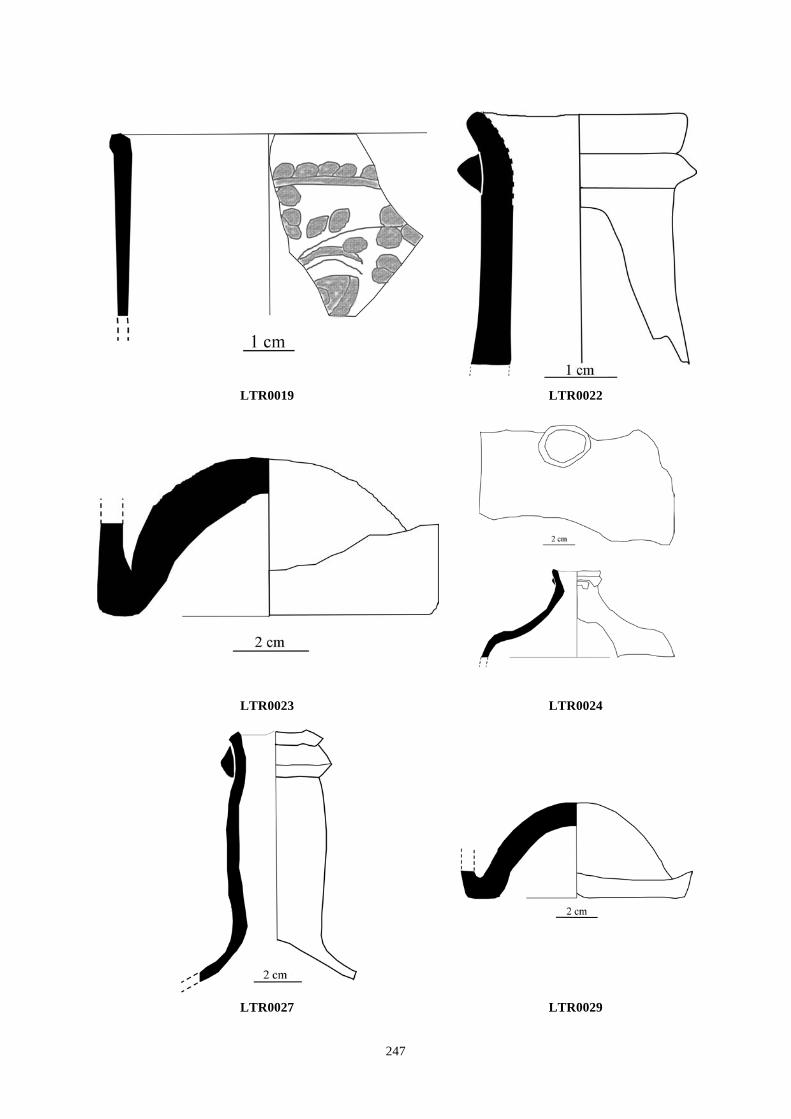
! 247!
!
LTR0019 LTR0022
LTR0023 LTR0024
LTR0027 LTR0029
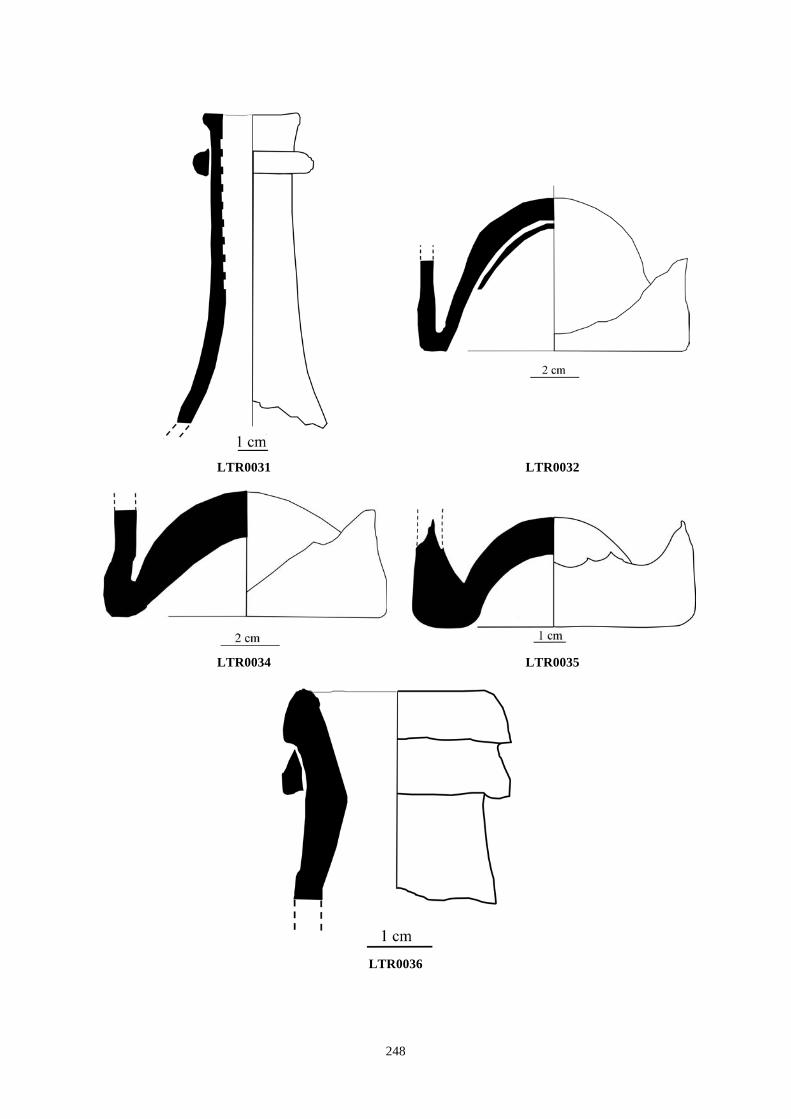
! 248!
!
LTR0031 LTR0032
LTR0034 LTR0035
LTR0036
!!
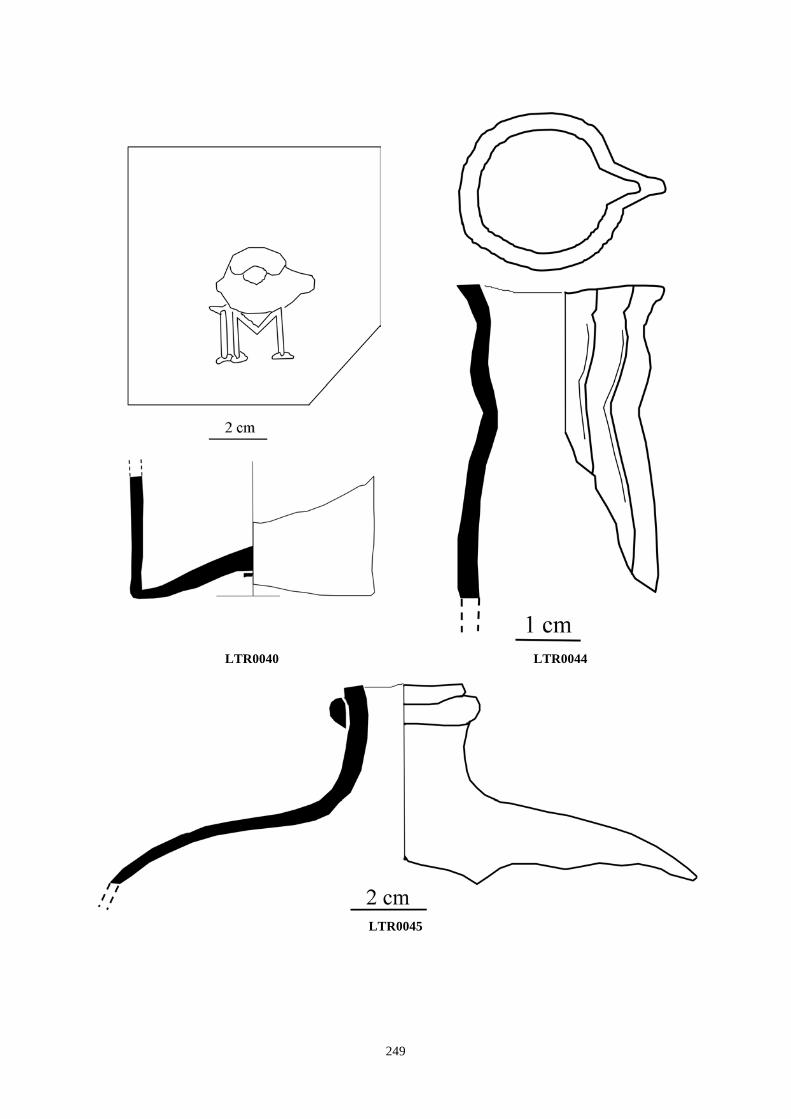
! 249!
!
LTR0040 LTR0044
LTR0045
!!!!
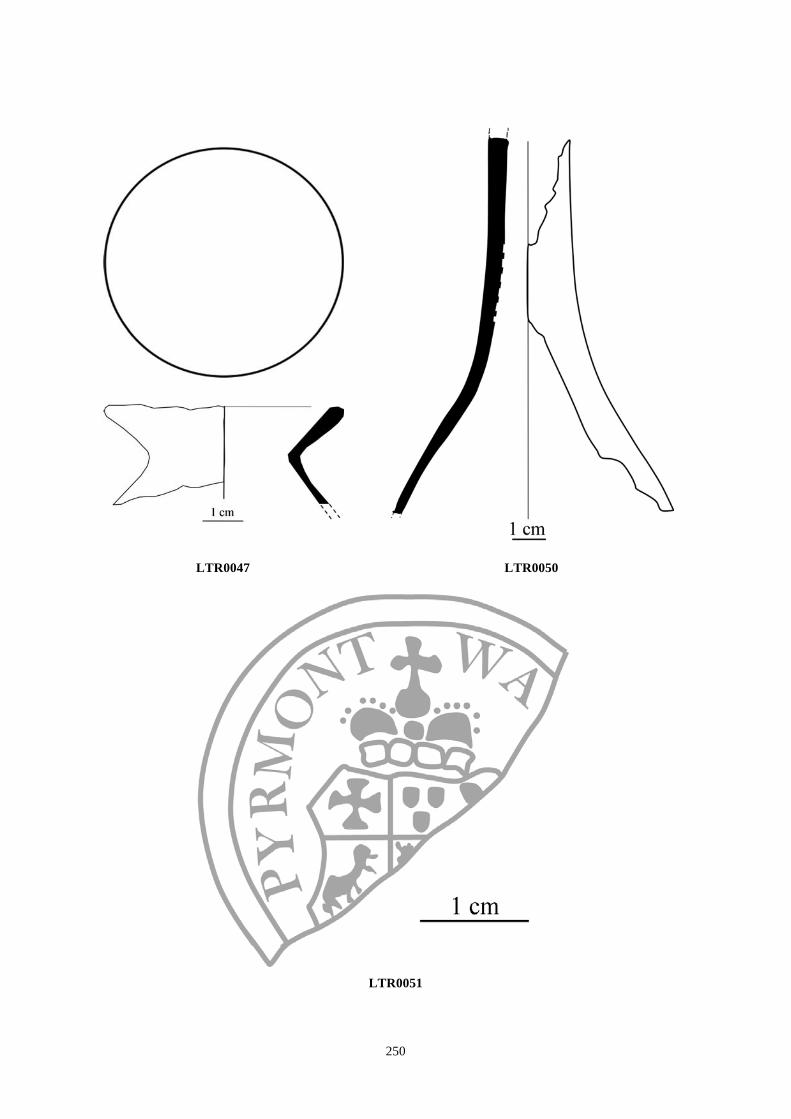
! 250!
!
!
LTR0047 LTR0050
LTR0051
!
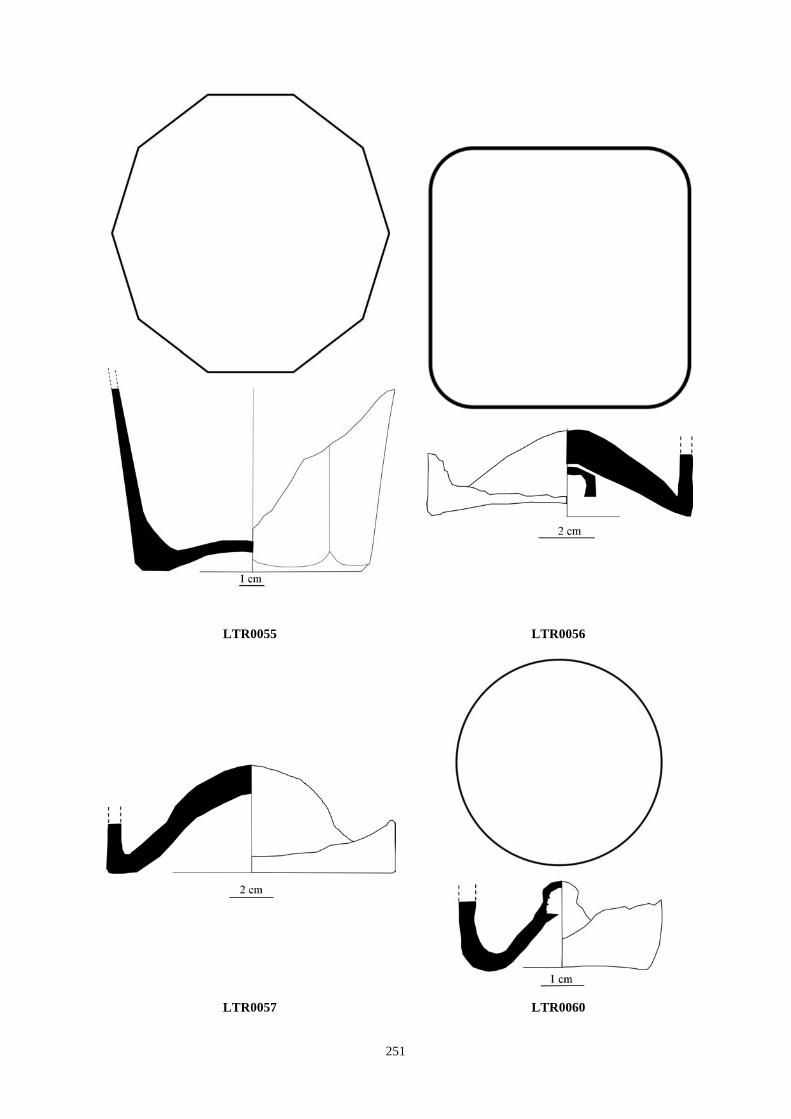
! 251!
LTR0055 LTR0056
LTR0057 LTR0060
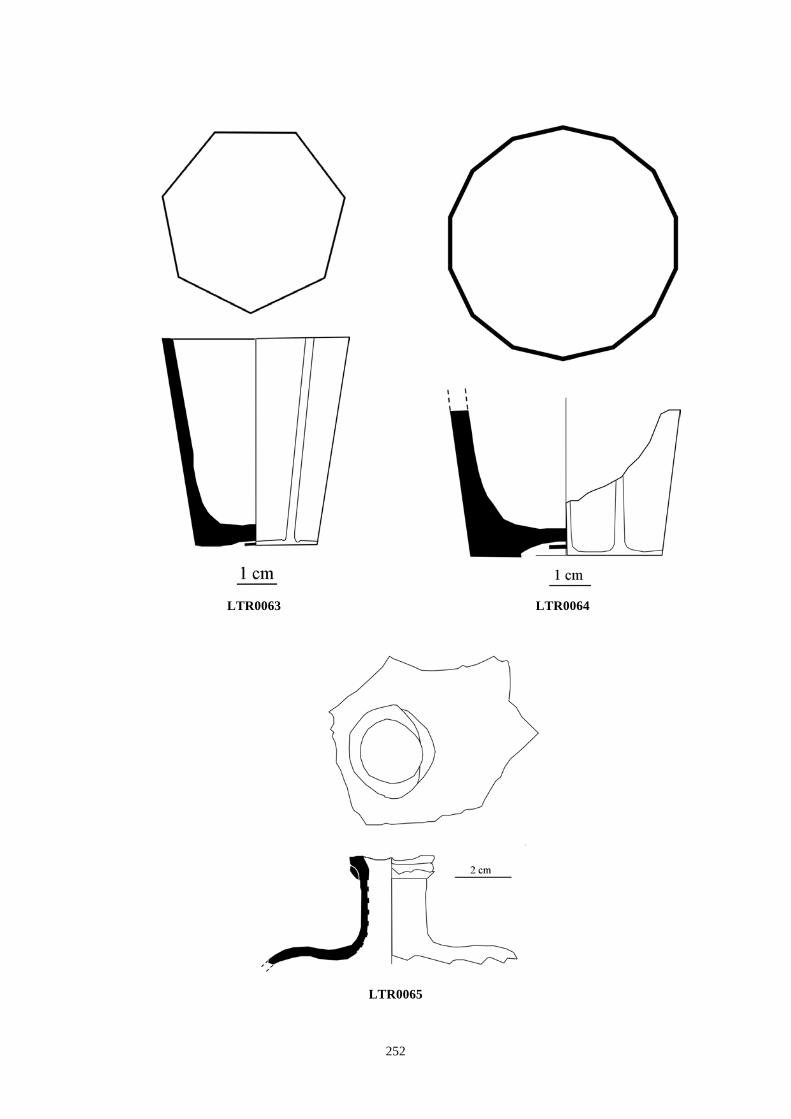
! 252!
!
LTR0063 LTR0064
LTR0065
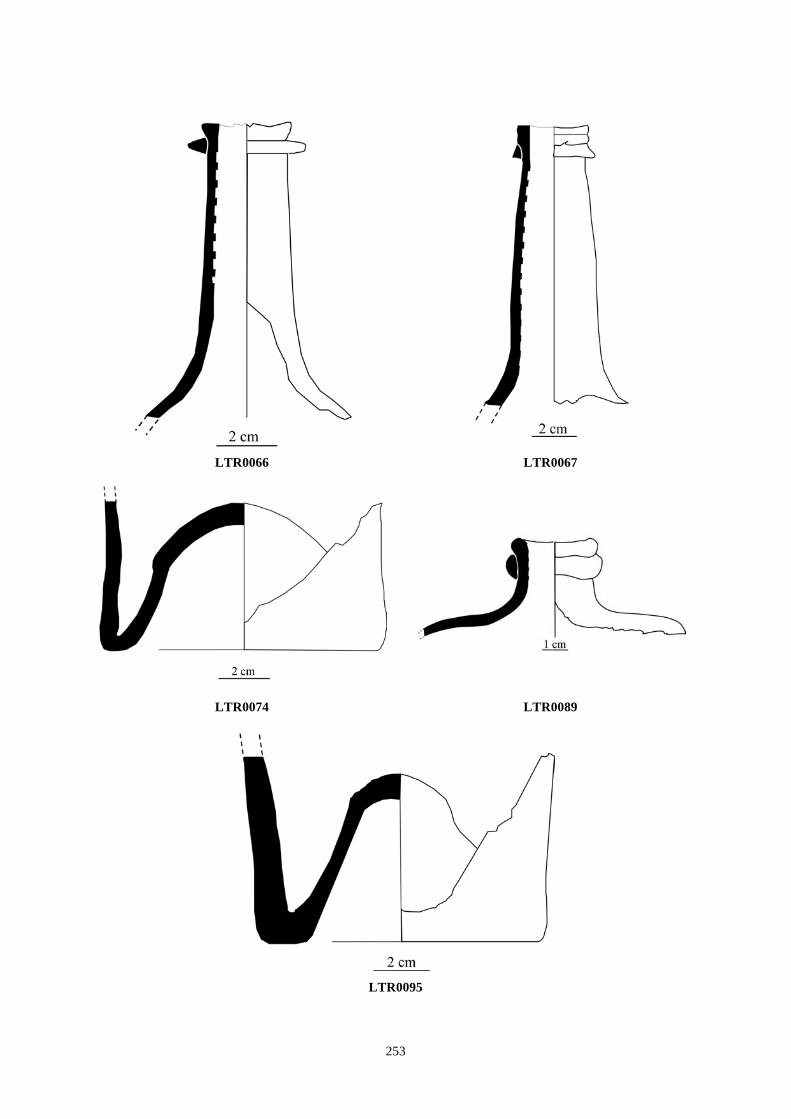
! 253!
!
LTR0066 LTR0067
LTR0074 LTR0089
LTR0095
!

! 254!
!
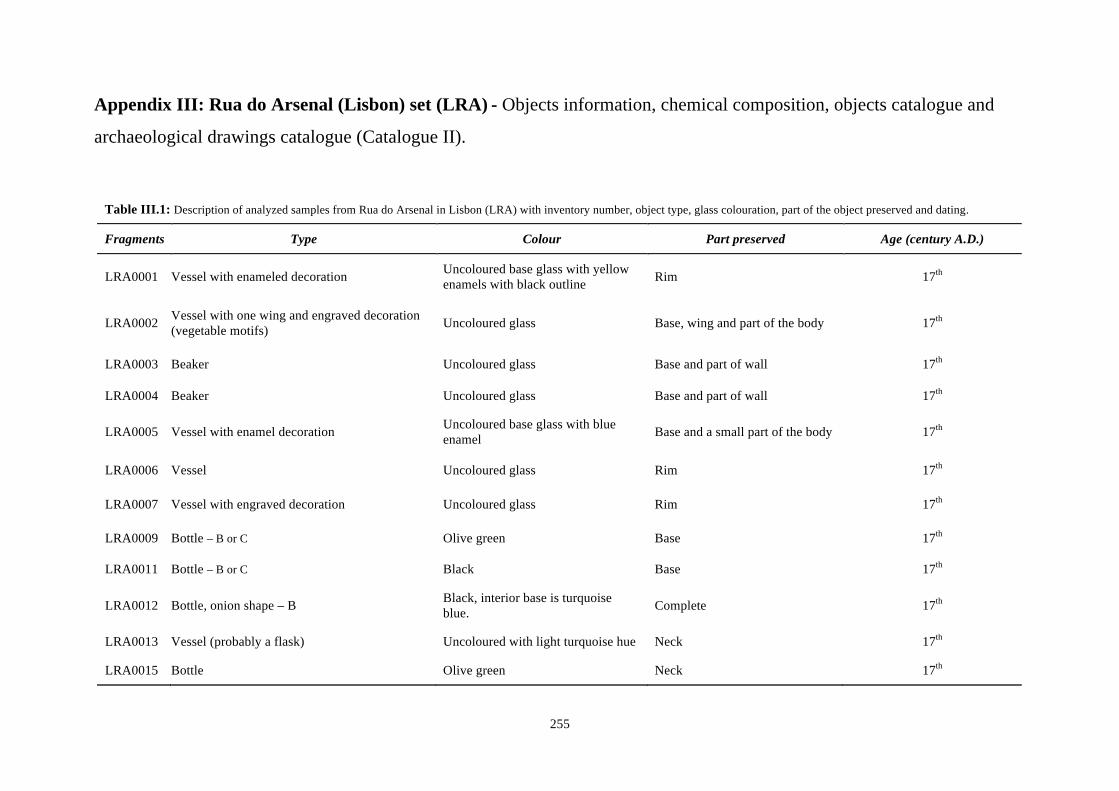
255
Appendix III: Rua do Arsenal (Lisbon) set (LRA) - Objects information, chemical composition, objects catalogue and
archaeological drawings catalogue (Catalogue II).
Table III.1: Description of analyzed samples from Rua do Arsenal in Lisbon (LRA) with inventory number, object type, glass colouration, part of the object preserved and dating.
Fragments Type Colour Part preserved Age (century A.D.)
LRA0001 Vessel with enameled decoration Uncoloured base glass with yellow enamels with black outline Rim 17th
LRA0002 Vessel with one wing and engraved decoration (vegetable motifs) Uncoloured glass Base, wing and part of the body 17th
LRA0003 Beaker Uncoloured glass Base and part of wall 17th
LRA0004 Beaker Uncoloured glass Base and part of wall 17th
LRA0005 Vessel with enamel decoration Uncoloured base glass with blue enamel Base and a small part of the body 17th
LRA0006 Vessel Uncoloured glass Rim 17th
LRA0007 Vessel with engraved decoration Uncoloured glass Rim 17th
LRA0009 Bottle – B or C Olive green Base 17th
LRA0011 Bottle – B or C Black Base 17th
LRA0012 Bottle, onion shape – B Black, interior base is turquoise blue. Complete 17th
LRA0013 Vessel (probably a flask) Uncoloured with light turquoise hue Neck 17th
LRA0015 Bottle Olive green Neck 17th
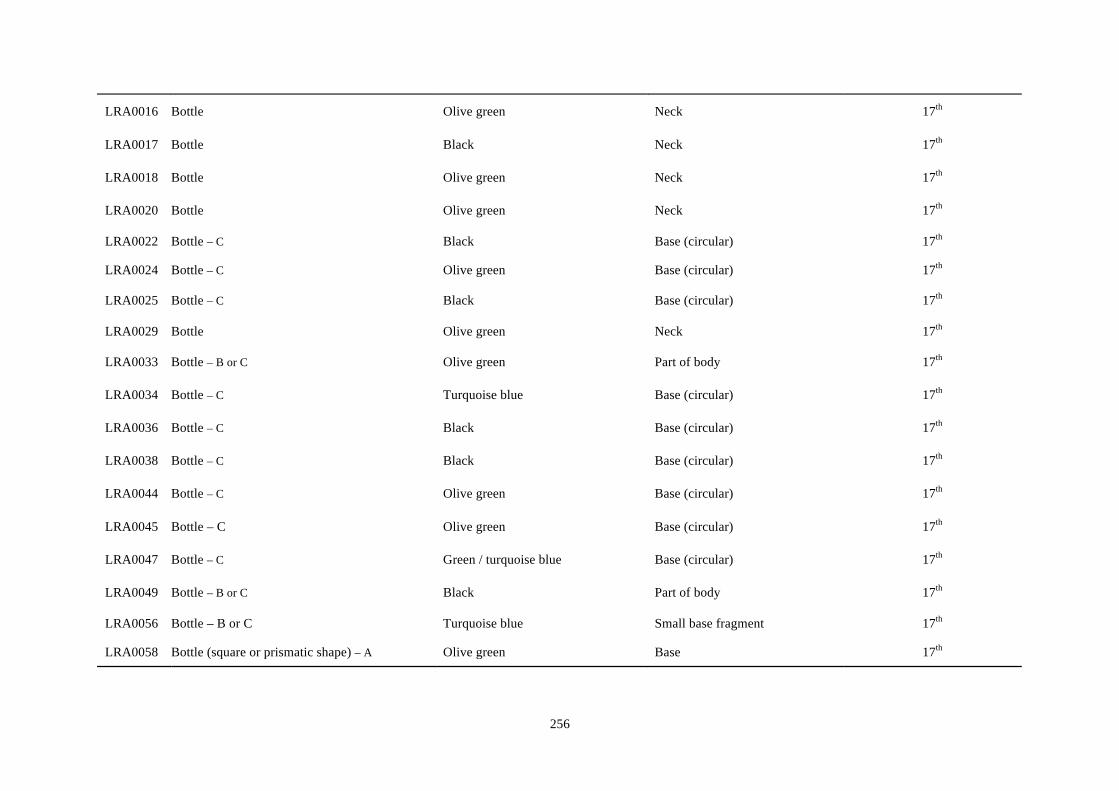
256
LRA0016 Bottle Olive green Neck 17th
LRA0017 Bottle Black Neck 17th
LRA0018 Bottle Olive green Neck 17th
LRA0020 Bottle Olive green Neck 17th
LRA0022 Bottle – C Black Base (circular) 17th
LRA0024 Bottle – C Olive green Base (circular) 17th
LRA0025 Bottle – C Black Base (circular) 17th
LRA0029 Bottle Olive green Neck 17th
LRA0033 Bottle – B or C Olive green Part of body 17th
LRA0034 Bottle – C Turquoise blue Base (circular) 17th
LRA0036 Bottle – C Black Base (circular) 17th
LRA0038 Bottle – C Black Base (circular) 17th
LRA0044 Bottle – C Olive green Base (circular) 17th
LRA0045 Bottle – C Olive green Base (circular) 17th
LRA0047 Bottle – C Green / turquoise blue Base (circular) 17th
LRA0049 Bottle – B or C Black Part of body 17th
LRA0056 Bottle – B or C Turquoise blue Small base fragment 17th
LRA0058 Bottle (square or prismatic shape) – A Olive green Base 17th
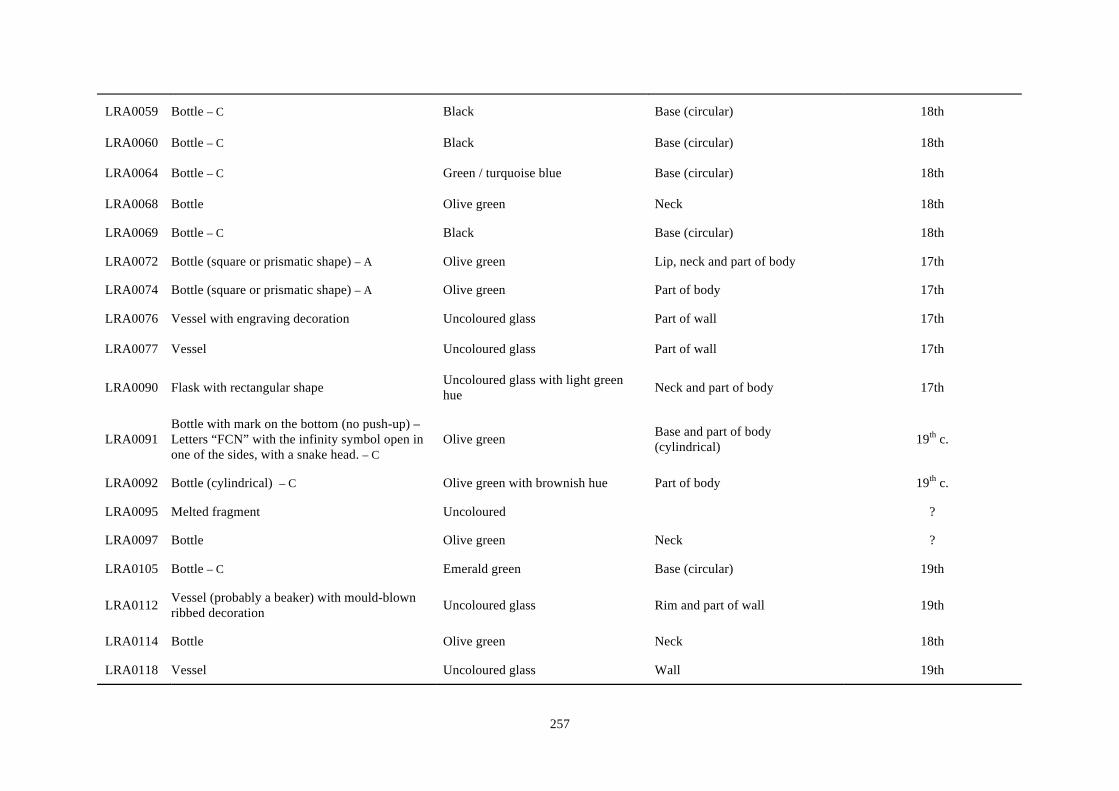
257
LRA0059 Bottle – C Black Base (circular) 18th
LRA0060 Bottle – C Black Base (circular) 18th
LRA0064 Bottle – C Green / turquoise blue Base (circular) 18th
LRA0068 Bottle Olive green Neck 18th
LRA0069 Bottle – C Black Base (circular) 18th
LRA0072 Bottle (square or prismatic shape) – A Olive green Lip, neck and part of body 17th
LRA0074 Bottle (square or prismatic shape) – A Olive green Part of body 17th
LRA0076 Vessel with engraving decoration Uncoloured glass Part of wall 17th
LRA0077 Vessel Uncoloured glass Part of wall 17th
LRA0090 Flask with rectangular shape Uncoloured glass with light green hue Neck and part of body 17th
LRA0091 Bottle with mark on the bottom (no push-up) – Letters “FCN” with the infinity symbol open in one of the sides, with a snake head. – C
Olive green Base and part of body (cylindrical) 19th c.
LRA0092 Bottle (cylindrical) – C Olive green with brownish hue Part of body 19th c.
LRA0095 Melted fragment Uncoloured ?
LRA0097 Bottle Olive green Neck ?
LRA0105 Bottle – C Emerald green Base (circular) 19th
LRA0112 Vessel (probably a beaker) with mould-blown ribbed decoration Uncoloured glass Rim and part of wall 19th
LRA0114 Bottle Olive green Neck 18th
LRA0118 Vessel Uncoloured glass Wall 19th
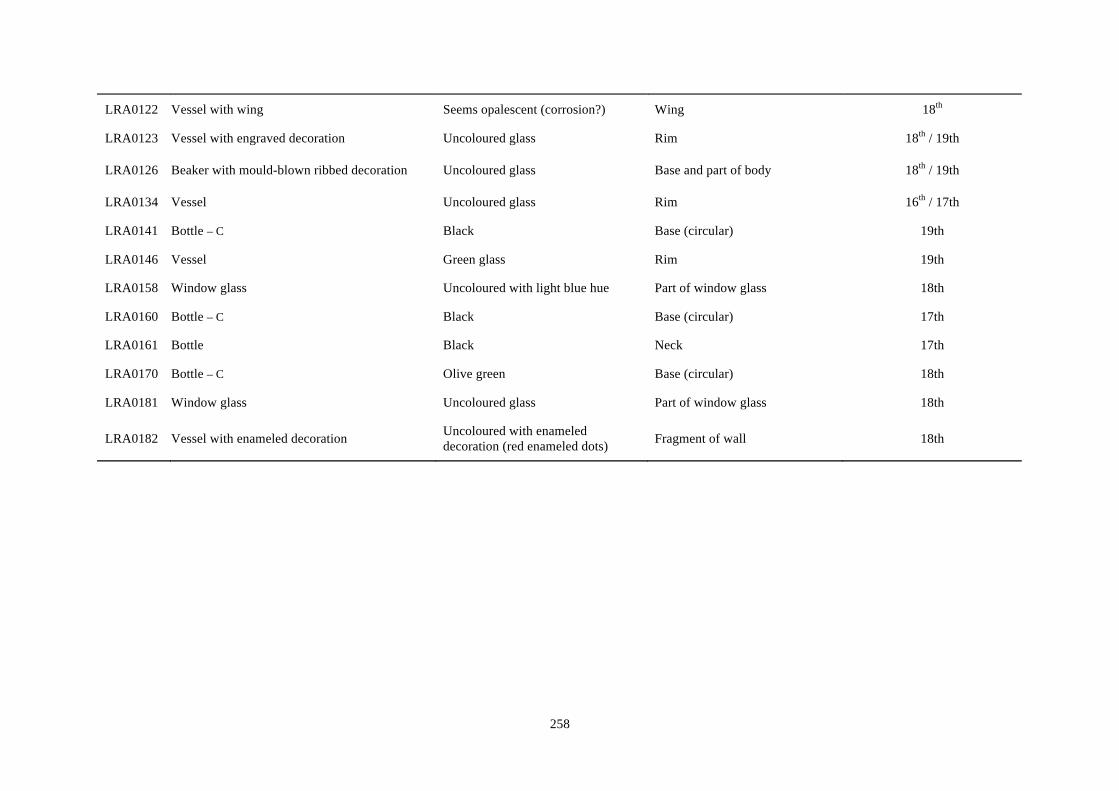
258
LRA0122 Vessel with wing Seems opalescent (corrosion?) Wing 18th
LRA0123 Vessel with engraved decoration Uncoloured glass Rim 18th / 19th
LRA0126 Beaker with mould-blown ribbed decoration Uncoloured glass Base and part of body 18th / 19th
LRA0134 Vessel Uncoloured glass Rim 16th / 17th
LRA0141 Bottle – C Black Base (circular) 19th
LRA0146 Vessel Green glass Rim 19th
LRA0158 Window glass Uncoloured with light blue hue Part of window glass 18th
LRA0160 Bottle – C Black Base (circular) 17th
LRA0161 Bottle Black Neck 17th
LRA0170 Bottle – C Olive green Base (circular) 18th
LRA0181 Window glass Uncoloured glass Part of window glass 18th
LRA0182 Vessel with enameled decoration Uncoloured with enameled decoration (red enameled dots) Fragment of wall 18th
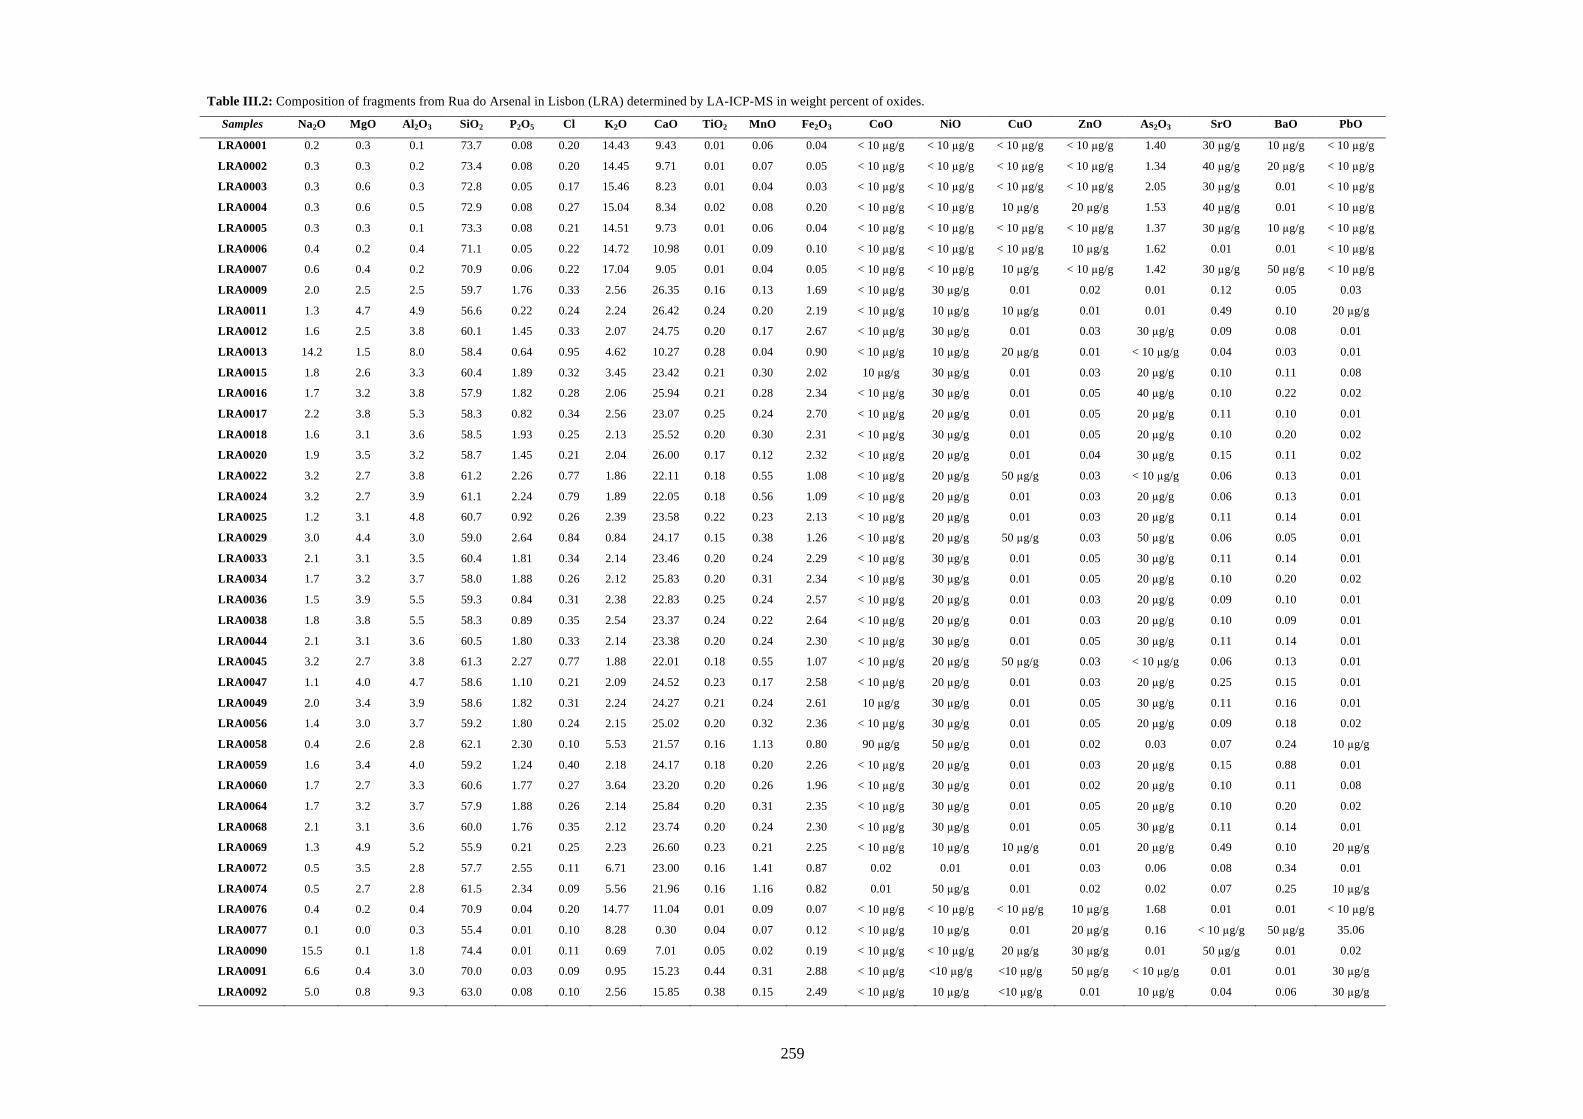
259
Table III.2: Composition of fragments from Rua do Arsenal in Lisbon (LRA) determined by LA-ICP-MS in weight percent of oxides.
Samples Na2O MgO Al2O3 SiO2 P2O5 Cl K2O CaO TiO2 MnO Fe2O3 CoO NiO CuO ZnO As2O3 SrO BaO PbO
LRA0001 0.2 0.3 0.1 73.7 0.08 0.20 14.43 9.43 0.01 0.06 0.04 < 10 µg/g < 10 µg/g < 10 µg/g < 10 µg/g 1.40 30 µg/g 10 µg/g < 10 µg/g
LRA0002 0.3 0.3 0.2 73.4 0.08 0.20 14.45 9.71 0.01 0.07 0.05 < 10 µg/g < 10 µg/g < 10 µg/g < 10 µg/g 1.34 40 µg/g 20 µg/g < 10 µg/g LRA0003 0.3 0.6 0.3 72.8 0.05 0.17 15.46 8.23 0.01 0.04 0.03 < 10 µg/g < 10 µg/g < 10 µg/g < 10 µg/g 2.05 30 µg/g 0.01 < 10 µg/g LRA0004 0.3 0.6 0.5 72.9 0.08 0.27 15.04 8.34 0.02 0.08 0.20 < 10 µg/g < 10 µg/g 10 µg/g 20 µg/g 1.53 40 µg/g 0.01 < 10 µg/g LRA0005 0.3 0.3 0.1 73.3 0.08 0.21 14.51 9.73 0.01 0.06 0.04 < 10 µg/g < 10 µg/g < 10 µg/g < 10 µg/g 1.37 30 µg/g 10 µg/g < 10 µg/g LRA0006 0.4 0.2 0.4 71.1 0.05 0.22 14.72 10.98 0.01 0.09 0.10 < 10 µg/g < 10 µg/g < 10 µg/g 10 µg/g 1.62 0.01 0.01 < 10 µg/g LRA0007 0.6 0.4 0.2 70.9 0.06 0.22 17.04 9.05 0.01 0.04 0.05 < 10 µg/g < 10 µg/g 10 µg/g < 10 µg/g 1.42 30 µg/g 50 µg/g < 10 µg/g LRA0009 2.0 2.5 2.5 59.7 1.76 0.33 2.56 26.35 0.16 0.13 1.69 < 10 µg/g 30 µg/g 0.01 0.02 0.01 0.12 0.05 0.03
LRA0011 1.3 4.7 4.9 56.6 0.22 0.24 2.24 26.42 0.24 0.20 2.19 < 10 µg/g 10 µg/g 10 µg/g 0.01 0.01 0.49 0.10 20 µg/g
LRA0012 1.6 2.5 3.8 60.1 1.45 0.33 2.07 24.75 0.20 0.17 2.67 < 10 µg/g 30 µg/g 0.01 0.03 30 µg/g 0.09 0.08 0.01
LRA0013 14.2 1.5 8.0 58.4 0.64 0.95 4.62 10.27 0.28 0.04 0.90 < 10 µg/g 10 µg/g 20 µg/g 0.01 < 10 µg/g 0.04 0.03 0.01
LRA0015 1.8 2.6 3.3 60.4 1.89 0.32 3.45 23.42 0.21 0.30 2.02 10 µg/g 30 µg/g 0.01 0.03 20 µg/g 0.10 0.11 0.08
LRA0016 1.7 3.2 3.8 57.9 1.82 0.28 2.06 25.94 0.21 0.28 2.34 < 10 µg/g 30 µg/g 0.01 0.05 40 µg/g 0.10 0.22 0.02
LRA0017 2.2 3.8 5.3 58.3 0.82 0.34 2.56 23.07 0.25 0.24 2.70 < 10 µg/g 20 µg/g 0.01 0.05 20 µg/g 0.11 0.10 0.01
LRA0018 1.6 3.1 3.6 58.5 1.93 0.25 2.13 25.52 0.20 0.30 2.31 < 10 µg/g 30 µg/g 0.01 0.05 20 µg/g 0.10 0.20 0.02
LRA0020 1.9 3.5 3.2 58.7 1.45 0.21 2.04 26.00 0.17 0.12 2.32 < 10 µg/g 20 µg/g 0.01 0.04 30 µg/g 0.15 0.11 0.02
LRA0022 3.2 2.7 3.8 61.2 2.26 0.77 1.86 22.11 0.18 0.55 1.08 < 10 µg/g 20 µg/g 50 µg/g 0.03 < 10 µg/g 0.06 0.13 0.01
LRA0024 3.2 2.7 3.9 61.1 2.24 0.79 1.89 22.05 0.18 0.56 1.09 < 10 µg/g 20 µg/g 0.01 0.03 20 µg/g 0.06 0.13 0.01
LRA0025 1.2 3.1 4.8 60.7 0.92 0.26 2.39 23.58 0.22 0.23 2.13 < 10 µg/g 20 µg/g 0.01 0.03 20 µg/g 0.11 0.14 0.01
LRA0029 3.0 4.4 3.0 59.0 2.64 0.84 0.84 24.17 0.15 0.38 1.26 < 10 µg/g 20 µg/g 50 µg/g 0.03 50 µg/g 0.06 0.05 0.01
LRA0033 2.1 3.1 3.5 60.4 1.81 0.34 2.14 23.46 0.20 0.24 2.29 < 10 µg/g 30 µg/g 0.01 0.05 30 µg/g 0.11 0.14 0.01
LRA0034 1.7 3.2 3.7 58.0 1.88 0.26 2.12 25.83 0.20 0.31 2.34 < 10 µg/g 30 µg/g 0.01 0.05 20 µg/g 0.10 0.20 0.02
LRA0036 1.5 3.9 5.5 59.3 0.84 0.31 2.38 22.83 0.25 0.24 2.57 < 10 µg/g 20 µg/g 0.01 0.03 20 µg/g 0.09 0.10 0.01
LRA0038 1.8 3.8 5.5 58.3 0.89 0.35 2.54 23.37 0.24 0.22 2.64 < 10 µg/g 20 µg/g 0.01 0.03 20 µg/g 0.10 0.09 0.01
LRA0044 2.1 3.1 3.6 60.5 1.80 0.33 2.14 23.38 0.20 0.24 2.30 < 10 µg/g 30 µg/g 0.01 0.05 30 µg/g 0.11 0.14 0.01
LRA0045 3.2 2.7 3.8 61.3 2.27 0.77 1.88 22.01 0.18 0.55 1.07 < 10 µg/g 20 µg/g 50 µg/g 0.03 < 10 µg/g 0.06 0.13 0.01
LRA0047 1.1 4.0 4.7 58.6 1.10 0.21 2.09 24.52 0.23 0.17 2.58 < 10 µg/g 20 µg/g 0.01 0.03 20 µg/g 0.25 0.15 0.01
LRA0049 2.0 3.4 3.9 58.6 1.82 0.31 2.24 24.27 0.21 0.24 2.61 10 µg/g 30 µg/g 0.01 0.05 30 µg/g 0.11 0.16 0.01
LRA0056 1.4 3.0 3.7 59.2 1.80 0.24 2.15 25.02 0.20 0.32 2.36 < 10 µg/g 30 µg/g 0.01 0.05 20 µg/g 0.09 0.18 0.02
LRA0058 0.4 2.6 2.8 62.1 2.30 0.10 5.53 21.57 0.16 1.13 0.80 90 µg/g 50 µg/g 0.01 0.02 0.03 0.07 0.24 10 µg/g
LRA0059 1.6 3.4 4.0 59.2 1.24 0.40 2.18 24.17 0.18 0.20 2.26 < 10 µg/g 20 µg/g 0.01 0.03 20 µg/g 0.15 0.88 0.01
LRA0060 1.7 2.7 3.3 60.6 1.77 0.27 3.64 23.20 0.20 0.26 1.96 < 10 µg/g 30 µg/g 0.01 0.02 20 µg/g 0.10 0.11 0.08
LRA0064 1.7 3.2 3.7 57.9 1.88 0.26 2.14 25.84 0.20 0.31 2.35 < 10 µg/g 30 µg/g 0.01 0.05 20 µg/g 0.10 0.20 0.02
LRA0068 2.1 3.1 3.6 60.0 1.76 0.35 2.12 23.74 0.20 0.24 2.30 < 10 µg/g 30 µg/g 0.01 0.05 30 µg/g 0.11 0.14 0.01
LRA0069 1.3 4.9 5.2 55.9 0.21 0.25 2.23 26.60 0.23 0.21 2.25 < 10 µg/g 10 µg/g 10 µg/g 0.01 20 µg/g 0.49 0.10 20 µg/g
LRA0072 0.5 3.5 2.8 57.7 2.55 0.11 6.71 23.00 0.16 1.41 0.87 0.02 0.01 0.01 0.03 0.06 0.08 0.34 0.01
LRA0074 0.5 2.7 2.8 61.5 2.34 0.09 5.56 21.96 0.16 1.16 0.82 0.01 50 µg/g 0.01 0.02 0.02 0.07 0.25 10 µg/g
LRA0076 0.4 0.2 0.4 70.9 0.04 0.20 14.77 11.04 0.01 0.09 0.07 < 10 µg/g < 10 µg/g < 10 µg/g 10 µg/g 1.68 0.01 0.01 < 10 µg/g
LRA0077 0.1 0.0 0.3 55.4 0.01 0.10 8.28 0.30 0.04 0.07 0.12 < 10 µg/g 10 µg/g 0.01 20 µg/g 0.16 < 10 µg/g 50 µg/g 35.06
LRA0090 15.5 0.1 1.8 74.4 0.01 0.11 0.69 7.01 0.05 0.02 0.19 < 10 µg/g < 10 µg/g 20 µg/g 30 µg/g 0.01 50 µg/g 0.01 0.02
LRA0091 6.6 0.4 3.0 70.0 0.03 0.09 0.95 15.23 0.44 0.31 2.88 < 10 µg/g <10 µg/g <10 µg/g 50 µg/g < 10 µg/g 0.01 0.01 30 µg/g
LRA0092 5.0 0.8 9.3 63.0 0.08 0.10 2.56 15.85 0.38 0.15 2.49 < 10 µg/g 10 µg/g <10 µg/g 0.01 10 µg/g 0.04 0.06 30 µg/g
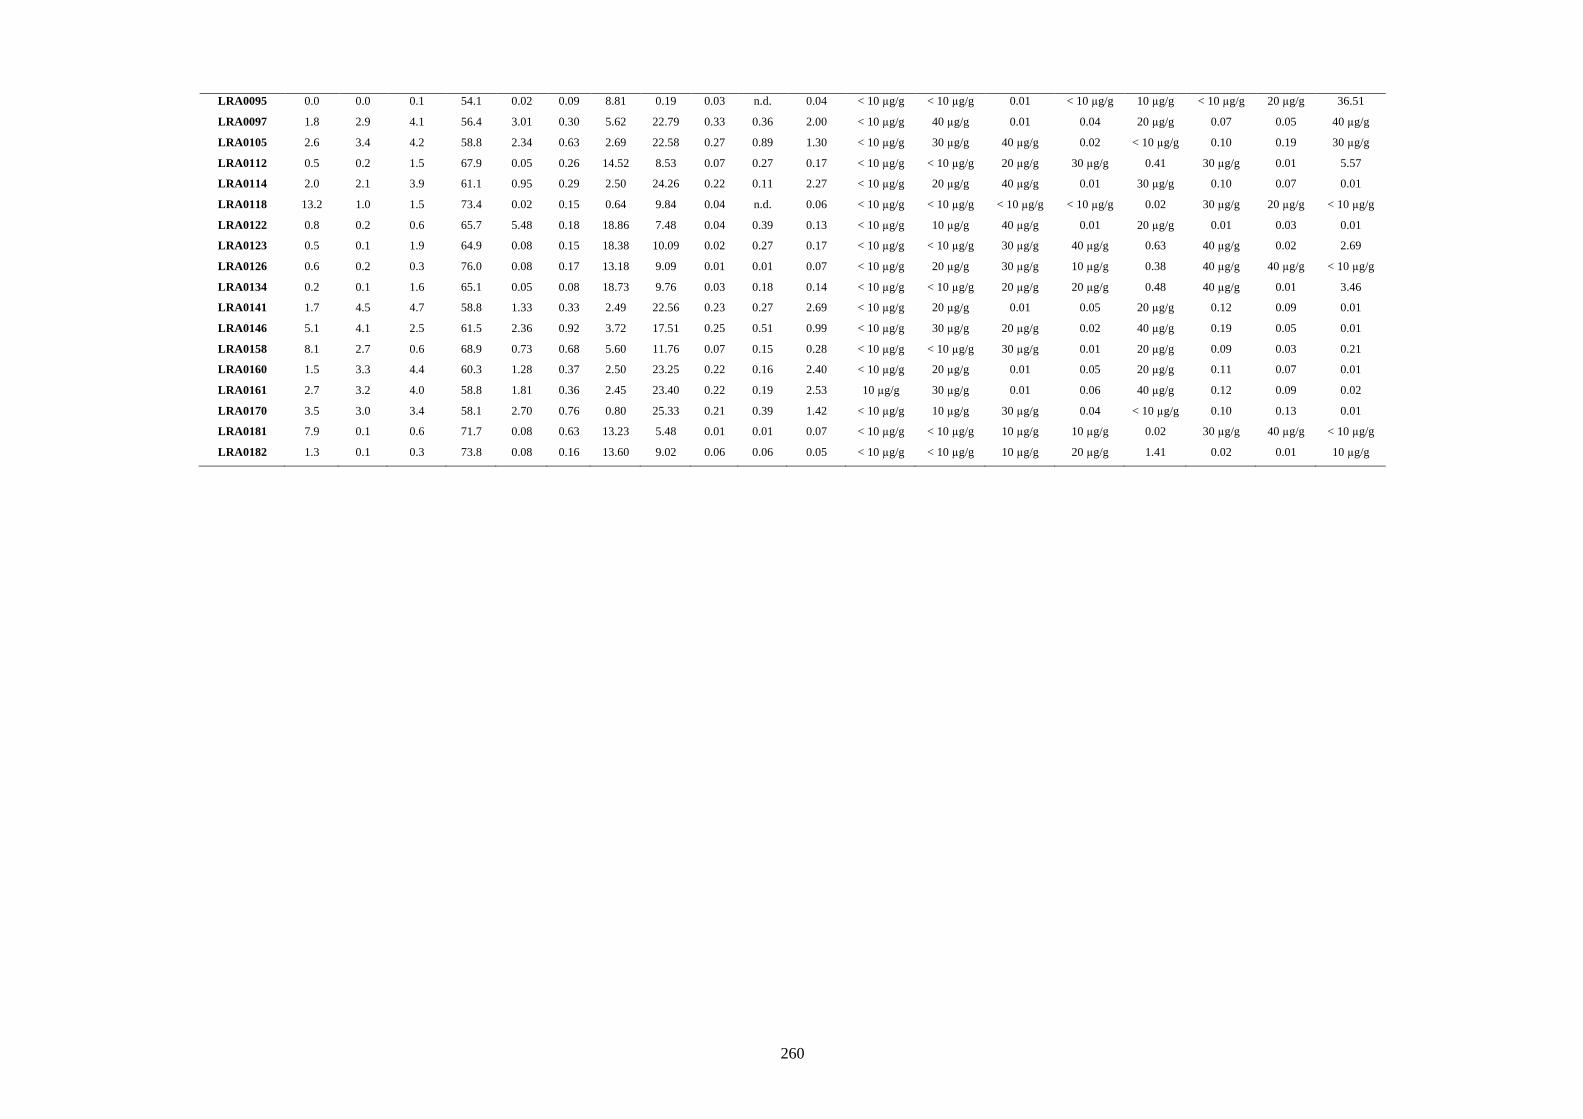
260
LRA0095 0.0 0.0 0.1 54.1 0.02 0.09 8.81 0.19 0.03 n.d. 0.04 < 10 µg/g < 10 µg/g 0.01 < 10 µg/g 10 µg/g < 10 µg/g 20 µg/g 36.51
LRA0097 1.8 2.9 4.1 56.4 3.01 0.30 5.62 22.79 0.33 0.36 2.00 < 10 µg/g 40 µg/g 0.01 0.04 20 µg/g 0.07 0.05 40 µg/g
LRA0105 2.6 3.4 4.2 58.8 2.34 0.63 2.69 22.58 0.27 0.89 1.30 < 10 µg/g 30 µg/g 40 µg/g 0.02 < 10 µg/g 0.10 0.19 30 µg/g
LRA0112 0.5 0.2 1.5 67.9 0.05 0.26 14.52 8.53 0.07 0.27 0.17 < 10 µg/g < 10 µg/g 20 µg/g 30 µg/g 0.41 30 µg/g 0.01 5.57
LRA0114 2.0 2.1 3.9 61.1 0.95 0.29 2.50 24.26 0.22 0.11 2.27 < 10 µg/g 20 µg/g 40 µg/g 0.01 30 µg/g 0.10 0.07 0.01
LRA0118 13.2 1.0 1.5 73.4 0.02 0.15 0.64 9.84 0.04 n.d. 0.06 < 10 µg/g < 10 µg/g < 10 µg/g < 10 µg/g 0.02 30 µg/g 20 µg/g < 10 µg/g
LRA0122 0.8 0.2 0.6 65.7 5.48 0.18 18.86 7.48 0.04 0.39 0.13 < 10 µg/g 10 µg/g 40 µg/g 0.01 20 µg/g 0.01 0.03 0.01
LRA0123 0.5 0.1 1.9 64.9 0.08 0.15 18.38 10.09 0.02 0.27 0.17 < 10 µg/g < 10 µg/g 30 µg/g 40 µg/g 0.63 40 µg/g 0.02 2.69
LRA0126 0.6 0.2 0.3 76.0 0.08 0.17 13.18 9.09 0.01 0.01 0.07 < 10 µg/g 20 µg/g 30 µg/g 10 µg/g 0.38 40 µg/g 40 µg/g < 10 µg/g
LRA0134 0.2 0.1 1.6 65.1 0.05 0.08 18.73 9.76 0.03 0.18 0.14 < 10 µg/g < 10 µg/g 20 µg/g 20 µg/g 0.48 40 µg/g 0.01 3.46
LRA0141 1.7 4.5 4.7 58.8 1.33 0.33 2.49 22.56 0.23 0.27 2.69 < 10 µg/g 20 µg/g 0.01 0.05 20 µg/g 0.12 0.09 0.01
LRA0146 5.1 4.1 2.5 61.5 2.36 0.92 3.72 17.51 0.25 0.51 0.99 < 10 µg/g 30 µg/g 20 µg/g 0.02 40 µg/g 0.19 0.05 0.01
LRA0158 8.1 2.7 0.6 68.9 0.73 0.68 5.60 11.76 0.07 0.15 0.28 < 10 µg/g < 10 µg/g 30 µg/g 0.01 20 µg/g 0.09 0.03 0.21
LRA0160 1.5 3.3 4.4 60.3 1.28 0.37 2.50 23.25 0.22 0.16 2.40 < 10 µg/g 20 µg/g 0.01 0.05 20 µg/g 0.11 0.07 0.01
LRA0161 2.7 3.2 4.0 58.8 1.81 0.36 2.45 23.40 0.22 0.19 2.53 10 µg/g 30 µg/g 0.01 0.06 40 µg/g 0.12 0.09 0.02
LRA0170 3.5 3.0 3.4 58.1 2.70 0.76 0.80 25.33 0.21 0.39 1.42 < 10 µg/g 10 µg/g 30 µg/g 0.04 < 10 µg/g 0.10 0.13 0.01
LRA0181 7.9 0.1 0.6 71.7 0.08 0.63 13.23 5.48 0.01 0.01 0.07 < 10 µg/g < 10 µg/g 10 µg/g 10 µg/g 0.02 30 µg/g 40 µg/g < 10 µg/g
LRA0182 1.3 0.1 0.3 73.8 0.08 0.16 13.60 9.02 0.06 0.06 0.05 < 10 µg/g < 10 µg/g 10 µg/g 20 µg/g 1.41 0.02 0.01 10 µg/g
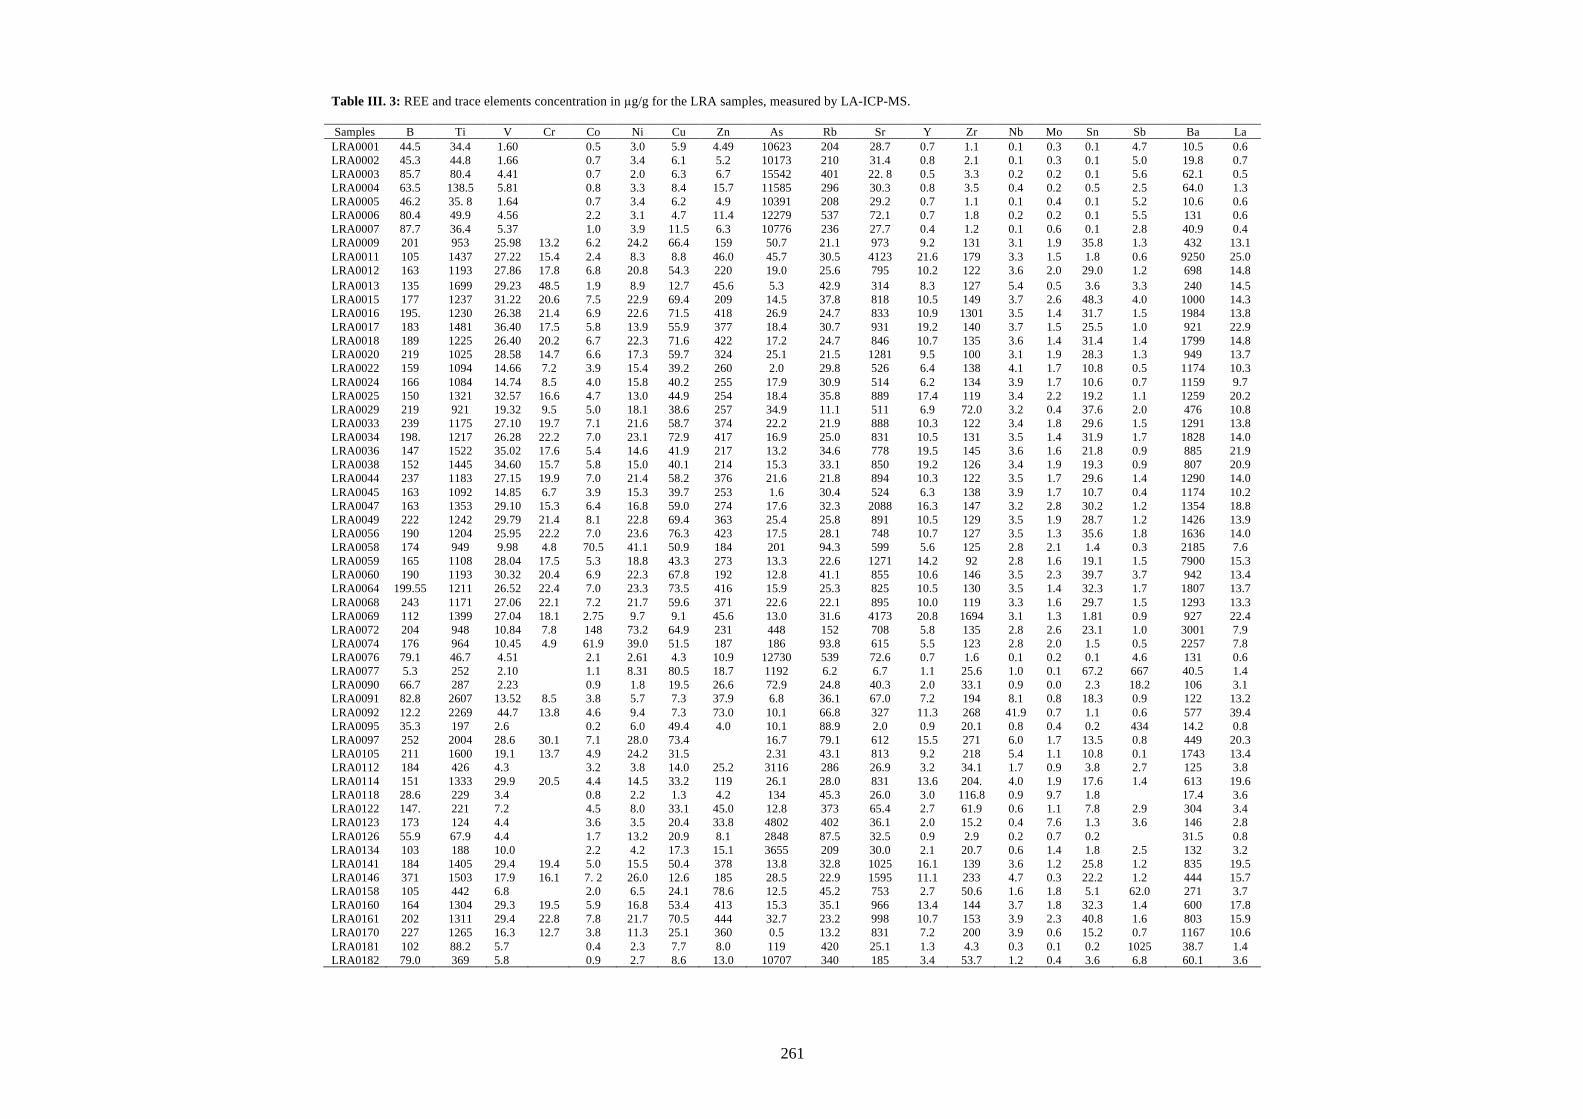
261
Table III. 3: REE and trace elements concentration in µg/g for the LRA samples, measured by LA-ICP-MS. Samples B Ti V Cr Co Ni Cu Zn As Rb Sr Y Zr Nb Mo Sn Sb Ba La LRA0001 44.5 34.4 1.60 0.5 3.0 5.9 4.49 10623 204 28.7 0.7 1.1 0.1 0.3 0.1 4.7 10.5 0.6 LRA0002 45.3 44.8 1.66 0.7 3.4 6.1 5.2 10173 210 31.4 0.8 2.1 0.1 0.3 0.1 5.0 19.8 0.7 LRA0003 85.7 80.4 4.41 0.7 2.0 6.3 6.7 15542 401 22. 8 0.5 3.3 0.2 0.2 0.1 5.6 62.1 0.5 LRA0004 63.5 138.5 5.81 0.8 3.3 8.4 15.7 11585 296 30.3 0.8 3.5 0.4 0.2 0.5 2.5 64.0 1.3 LRA0005 46.2 35. 8 1.64 0.7 3.4 6.2 4.9 10391 208 29.2 0.7 1.1 0.1 0.4 0.1 5.2 10.6 0.6 LRA0006 80.4 49.9 4.56 2.2 3.1 4.7 11.4 12279 537 72.1 0.7 1.8 0.2 0.2 0.1 5.5 131 0.6 LRA0007 87.7 36.4 5.37 1.0 3.9 11.5 6.3 10776 236 27.7 0.4 1.2 0.1 0.6 0.1 2.8 40.9 0.4 LRA0009 201 953 25.98 13.2 6.2 24.2 66.4 159 50.7 21.1 973 9.2 131 3.1 1.9 35.8 1.3 432 13.1 LRA0011 105 1437 27.22 15.4 2.4 8.3 8.8 46.0 45.7 30.5 4123 21.6 179 3.3 1.5 1.8 0.6 9250 25.0 LRA0012 163 1193 27.86 17.8 6.8 20.8 54.3 220 19.0 25.6 795 10.2 122 3.6 2.0 29.0 1.2 698 14.8 LRA0013 135 1699 29.23 48.5 1.9 8.9 12.7 45.6 5.3 42.9 314 8.3 127 5.4 0.5 3.6 3.3 240 14.5 LRA0015 177 1237 31.22 20.6 7.5 22.9 69.4 209 14.5 37.8 818 10.5 149 3.7 2.6 48.3 4.0 1000 14.3 LRA0016 195. 1230 26.38 21.4 6.9 22.6 71.5 418 26.9 24.7 833 10.9 1301 3.5 1.4 31.7 1.5 1984 13.8 LRA0017 183 1481 36.40 17.5 5.8 13.9 55.9 377 18.4 30.7 931 19.2 140 3.7 1.5 25.5 1.0 921 22.9 LRA0018 189 1225 26.40 20.2 6.7 22.3 71.6 422 17.2 24.7 846 10.7 135 3.6 1.4 31.4 1.4 1799 14.8 LRA0020 219 1025 28.58 14.7 6.6 17.3 59.7 324 25.1 21.5 1281 9.5 100 3.1 1.9 28.3 1.3 949 13.7 LRA0022 159 1094 14.66 7.2 3.9 15.4 39.2 260 2.0 29.8 526 6.4 138 4.1 1.7 10.8 0.5 1174 10.3 LRA0024 166 1084 14.74 8.5 4.0 15.8 40.2 255 17.9 30.9 514 6.2 134 3.9 1.7 10.6 0.7 1159 9.7 LRA0025 150 1321 32.57 16.6 4.7 13.0 44.9 254 18.4 35.8 889 17.4 119 3.4 2.2 19.2 1.1 1259 20.2 LRA0029 219 921 19.32 9.5 5.0 18.1 38.6 257 34.9 11.1 511 6.9 72.0 3.2 0.4 37.6 2.0 476 10.8 LRA0033 239 1175 27.10 19.7 7.1 21.6 58.7 374 22.2 21.9 888 10.3 122 3.4 1.8 29.6 1.5 1291 13.8 LRA0034 198. 1217 26.28 22.2 7.0 23.1 72.9 417 16.9 25.0 831 10.5 131 3.5 1.4 31.9 1.7 1828 14.0 LRA0036 147 1522 35.02 17.6 5.4 14.6 41.9 217 13.2 34.6 778 19.5 145 3.6 1.6 21.8 0.9 885 21.9 LRA0038 152 1445 34.60 15.7 5.8 15.0 40.1 214 15.3 33.1 850 19.2 126 3.4 1.9 19.3 0.9 807 20.9 LRA0044 237 1183 27.15 19.9 7.0 21.4 58.2 376 21.6 21.8 894 10.3 122 3.5 1.7 29.6 1.4 1290 14.0 LRA0045 163 1092 14.85 6.7 3.9 15.3 39.7 253 1.6 30.4 524 6.3 138 3.9 1.7 10.7 0.4 1174 10.2 LRA0047 163 1353 29.10 15.3 6.4 16.8 59.0 274 17.6 32.3 2088 16.3 147 3.2 2.8 30.2 1.2 1354 18.8 LRA0049 222 1242 29.79 21.4 8.1 22.8 69.4 363 25.4 25.8 891 10.5 129 3.5 1.9 28.7 1.2 1426 13.9 LRA0056 190 1204 25.95 22.2 7.0 23.6 76.3 423 17.5 28.1 748 10.7 127 3.5 1.3 35.6 1.8 1636 14.0 LRA0058 174 949 9.98 4.8 70.5 41.1 50.9 184 201 94.3 599 5.6 125 2.8 2.1 1.4 0.3 2185 7.6 LRA0059 165 1108 28.04 17.5 5.3 18.8 43.3 273 13.3 22.6 1271 14.2 92 2.8 1.6 19.1 1.5 7900 15.3 LRA0060 190 1193 30.32 20.4 6.9 22.3 67.8 192 12.8 41.1 855 10.6 146 3.5 2.3 39.7 3.7 942 13.4 LRA0064 199.55 1211 26.52 22.4 7.0 23.3 73.5 416 15.9 25.3 825 10.5 130 3.5 1.4 32.3 1.7 1807 13.7 LRA0068 243 1171 27.06 22.1 7.2 21.7 59.6 371 22.6 22.1 895 10.0 119 3.3 1.6 29.7 1.5 1293 13.3 LRA0069 112 1399 27.04 18.1 2.75 9.7 9.1 45.6 13.0 31.6 4173 20.8 1694 3.1 1.3 1.81 0.9 927 22.4 LRA0072 204 948 10.84 7.8 148 73.2 64.9 231 448 152 708 5.8 135 2.8 2.6 23.1 1.0 3001 7.9 LRA0074 176 964 10.45 4.9 61.9 39.0 51.5 187 186 93.8 615 5.5 123 2.8 2.0 1.5 0.5 2257 7.8 LRA0076 79.1 46.7 4.51 2.1 2.61 4.3 10.9 12730 539 72.6 0.7 1.6 0.1 0.2 0.1 4.6 131 0.6 LRA0077 5.3 252 2.10 1.1 8.31 80.5 18.7 1192 6.2 6.7 1.1 25.6 1.0 0.1 67.2 667 40.5 1.4 LRA0090 66.7 287 2.23 0.9 1.8 19.5 26.6 72.9 24.8 40.3 2.0 33.1 0.9 0.0 2.3 18.2 106 3.1 LRA0091 82.8 2607 13.52 8.5 3.8 5.7 7.3 37.9 6.8 36.1 67.0 7.2 194 8.1 0.8 18.3 0.9 122 13.2 LRA0092 12.2 2269 44.7 13.8 4.6 9.4 7.3 73.0 10.1 66.8 327 11.3 268 41.9 0.7 1.1 0.6 577 39.4 LRA0095 35.3 197 2.6 0.2 6.0 49.4 4.0 10.1 88.9 2.0 0.9 20.1 0.8 0.4 0.2 434 14.2 0.8 LRA0097 252 2004 28.6 30.1 7.1 28.0 73.4 16.7 79.1 612 15.5 271 6.0 1.7 13.5 0.8 449 20.3 LRA0105 211 1600 19.1 13.7 4.9 24.2 31.5 2.31 43.1 813 9.2 218 5.4 1.1 10.8 0.1 1743 13.4 LRA0112 184 426 4.3 3.2 3.8 14.0 25.2 3116 286 26.9 3.2 34.1 1.7 0.9 3.8 2.7 125 3.8 LRA0114 151 1333 29.9 20.5 4.4 14.5 33.2 119 26.1 28.0 831 13.6 204. 4.0 1.9 17.6 1.4 613 19.6 LRA0118 28.6 229 3.4 0.8 2.2 1.3 4.2 134 45.3 26.0 3.0 116.8 0.9 9.7 1.8 17.4 3.6 LRA0122 147. 221 7.2 4.5 8.0 33.1 45.0 12.8 373 65.4 2.7 61.9 0.6 1.1 7.8 2.9 304 3.4 LRA0123 173 124 4.4 3.6 3.5 20.4 33.8 4802 402 36.1 2.0 15.2 0.4 7.6 1.3 3.6 146 2.8 LRA0126 55.9 67.9 4.4 1.7 13.2 20.9 8.1 2848 87.5 32.5 0.9 2.9 0.2 0.7 0.2 31.5 0.8 LRA0134 103 188 10.0 2.2 4.2 17.3 15.1 3655 209 30.0 2.1 20.7 0.6 1.4 1.8 2.5 132 3.2 LRA0141 184 1405 29.4 19.4 5.0 15.5 50.4 378 13.8 32.8 1025 16.1 139 3.6 1.2 25.8 1.2 835 19.5 LRA0146 371 1503 17.9 16.1 7. 2 26.0 12.6 185 28.5 22.9 1595 11.1 233 4.7 0.3 22.2 1.2 444 15.7 LRA0158 105 442 6.8 2.0 6.5 24.1 78.6 12.5 45.2 753 2.7 50.6 1.6 1.8 5.1 62.0 271 3.7 LRA0160 164 1304 29.3 19.5 5.9 16.8 53.4 413 15.3 35.1 966 13.4 144 3.7 1.8 32.3 1.4 600 17.8 LRA0161 202 1311 29.4 22.8 7.8 21.7 70.5 444 32.7 23.2 998 10.7 153 3.9 2.3 40.8 1.6 803 15.9 LRA0170 227 1265 16.3 12.7 3.8 11.3 25.1 360 0.5 13.2 831 7.2 200 3.9 0.6 15.2 0.7 1167 10.6 LRA0181 102 88.2 5.7 0.4 2.3 7.7 8.0 119 420 25.1 1.3 4.3 0.3 0.1 0.2 1025 38.7 1.4 LRA0182 79.0 369 5.8 0.9 2.7 8.6 13.0 10707 340 185 3.4 53.7 1.2 0.4 3.6 6.8 60.1 3.6
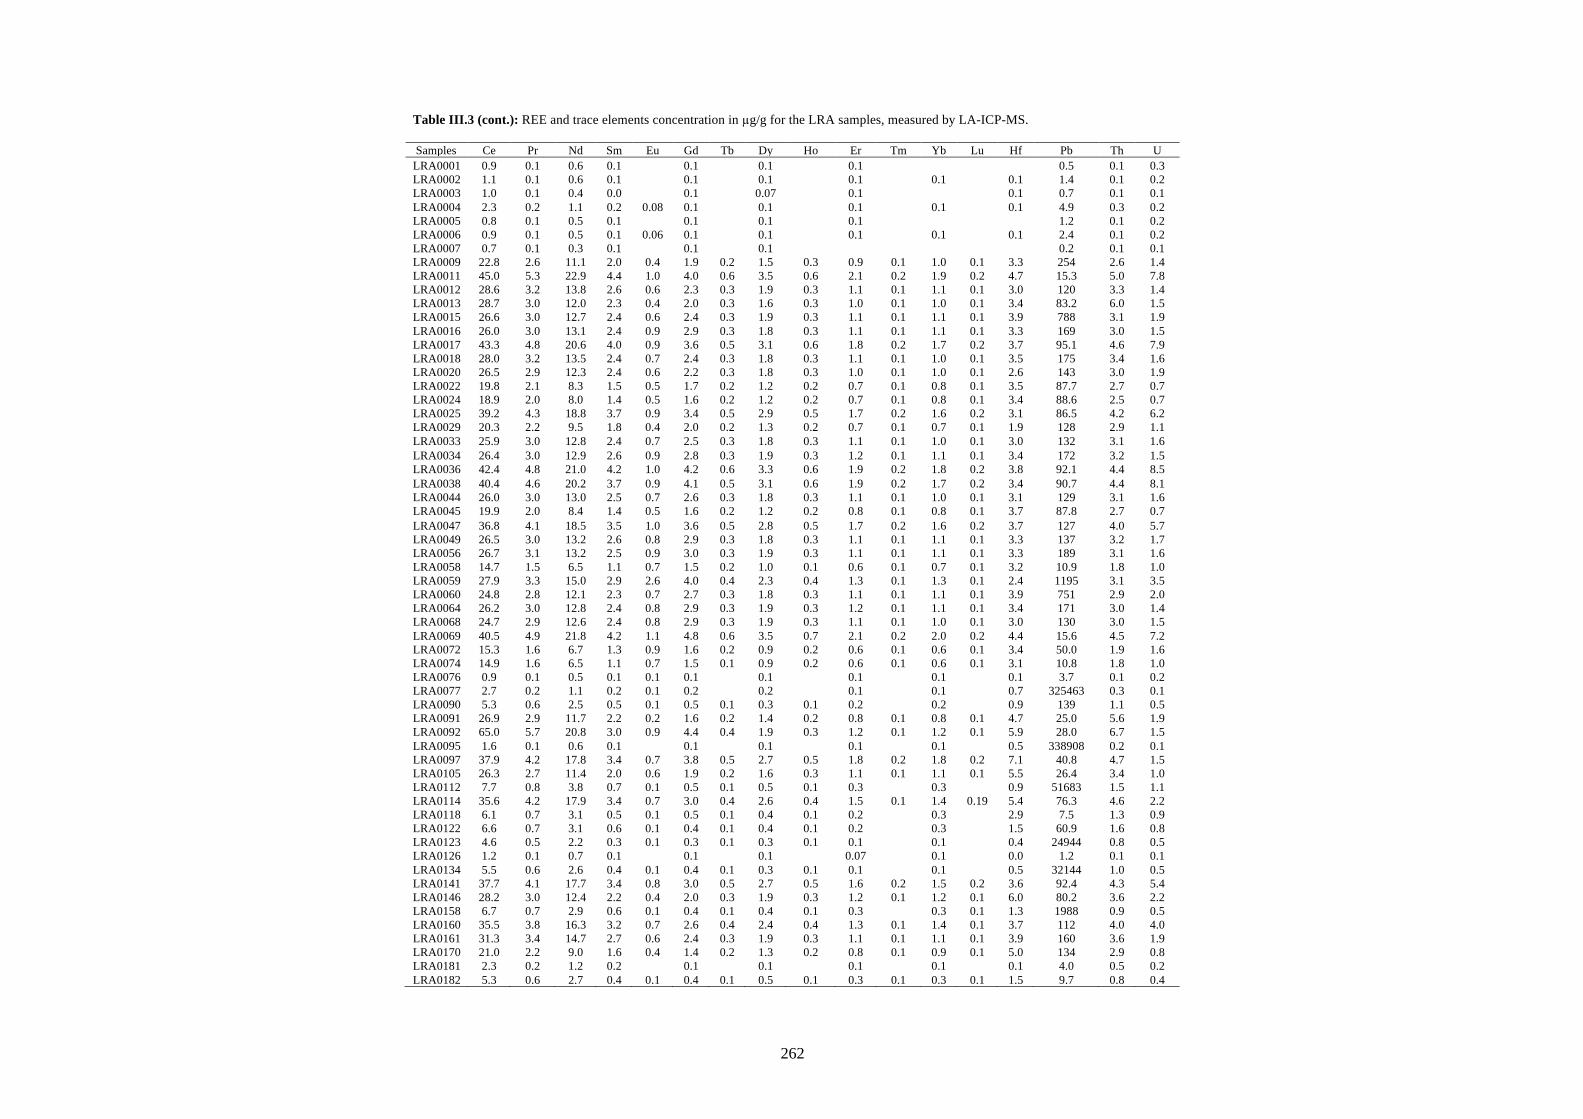
262
Table III.3 (cont.): REE and trace elements concentration in µg/g for the LRA samples, measured by LA-ICP-MS. Samples Ce Pr Nd Sm Eu Gd Tb Dy Ho Er Tm Yb Lu Hf Pb Th U LRA0001 0.9 0.1 0.6 0.1 0.1 0.1 0.1 0.5 0.1 0.3 LRA0002 1.1 0.1 0.6 0.1 0.1 0.1 0.1 0.1 0.1 1.4 0.1 0.2 LRA0003 1.0 0.1 0.4 0.0 0.1 0.07 0.1 0.1 0.7 0.1 0.1 LRA0004 2.3 0.2 1.1 0.2 0.08 0.1 0.1 0.1 0.1 0.1 4.9 0.3 0.2 LRA0005 0.8 0.1 0.5 0.1 0.1 0.1 0.1 1.2 0.1 0.2 LRA0006 0.9 0.1 0.5 0.1 0.06 0.1 0.1 0.1 0.1 0.1 2.4 0.1 0.2 LRA0007 0.7 0.1 0.3 0.1 0.1 0.1 0.2 0.1 0.1 LRA0009 22.8 2.6 11.1 2.0 0.4 1.9 0.2 1.5 0.3 0.9 0.1 1.0 0.1 3.3 254 2.6 1.4 LRA0011 45.0 5.3 22.9 4.4 1.0 4.0 0.6 3.5 0.6 2.1 0.2 1.9 0.2 4.7 15.3 5.0 7.8 LRA0012 28.6 3.2 13.8 2.6 0.6 2.3 0.3 1.9 0.3 1.1 0.1 1.1 0.1 3.0 120 3.3 1.4 LRA0013 28.7 3.0 12.0 2.3 0.4 2.0 0.3 1.6 0.3 1.0 0.1 1.0 0.1 3.4 83.2 6.0 1.5 LRA0015 26.6 3.0 12.7 2.4 0.6 2.4 0.3 1.9 0.3 1.1 0.1 1.1 0.1 3.9 788 3.1 1.9 LRA0016 26.0 3.0 13.1 2.4 0.9 2.9 0.3 1.8 0.3 1.1 0.1 1.1 0.1 3.3 169 3.0 1.5 LRA0017 43.3 4.8 20.6 4.0 0.9 3.6 0.5 3.1 0.6 1.8 0.2 1.7 0.2 3.7 95.1 4.6 7.9 LRA0018 28.0 3.2 13.5 2.4 0.7 2.4 0.3 1.8 0.3 1.1 0.1 1.0 0.1 3.5 175 3.4 1.6 LRA0020 26.5 2.9 12.3 2.4 0.6 2.2 0.3 1.8 0.3 1.0 0.1 1.0 0.1 2.6 143 3.0 1.9 LRA0022 19.8 2.1 8.3 1.5 0.5 1.7 0.2 1.2 0.2 0.7 0.1 0.8 0.1 3.5 87.7 2.7 0.7 LRA0024 18.9 2.0 8.0 1.4 0.5 1.6 0.2 1.2 0.2 0.7 0.1 0.8 0.1 3.4 88.6 2.5 0.7 LRA0025 39.2 4.3 18.8 3.7 0.9 3.4 0.5 2.9 0.5 1.7 0.2 1.6 0.2 3.1 86.5 4.2 6.2 LRA0029 20.3 2.2 9.5 1.8 0.4 2.0 0.2 1.3 0.2 0.7 0.1 0.7 0.1 1.9 128 2.9 1.1 LRA0033 25.9 3.0 12.8 2.4 0.7 2.5 0.3 1.8 0.3 1.1 0.1 1.0 0.1 3.0 132 3.1 1.6 LRA0034 26.4 3.0 12.9 2.6 0.9 2.8 0.3 1.9 0.3 1.2 0.1 1.1 0.1 3.4 172 3.2 1.5 LRA0036 42.4 4.8 21.0 4.2 1.0 4.2 0.6 3.3 0.6 1.9 0.2 1.8 0.2 3.8 92.1 4.4 8.5 LRA0038 40.4 4.6 20.2 3.7 0.9 4.1 0.5 3.1 0.6 1.9 0.2 1.7 0.2 3.4 90.7 4.4 8.1 LRA0044 26.0 3.0 13.0 2.5 0.7 2.6 0.3 1.8 0.3 1.1 0.1 1.0 0.1 3.1 129 3.1 1.6 LRA0045 19.9 2.0 8.4 1.4 0.5 1.6 0.2 1.2 0.2 0.8 0.1 0.8 0.1 3.7 87.8 2.7 0.7 LRA0047 36.8 4.1 18.5 3.5 1.0 3.6 0.5 2.8 0.5 1.7 0.2 1.6 0.2 3.7 127 4.0 5.7 LRA0049 26.5 3.0 13.2 2.6 0.8 2.9 0.3 1.8 0.3 1.1 0.1 1.1 0.1 3.3 137 3.2 1.7 LRA0056 26.7 3.1 13.2 2.5 0.9 3.0 0.3 1.9 0.3 1.1 0.1 1.1 0.1 3.3 189 3.1 1.6 LRA0058 14.7 1.5 6.5 1.1 0.7 1.5 0.2 1.0 0.1 0.6 0.1 0.7 0.1 3.2 10.9 1.8 1.0 LRA0059 27.9 3.3 15.0 2.9 2.6 4.0 0.4 2.3 0.4 1.3 0.1 1.3 0.1 2.4 1195 3.1 3.5 LRA0060 24.8 2.8 12.1 2.3 0.7 2.7 0.3 1.8 0.3 1.1 0.1 1.1 0.1 3.9 751 2.9 2.0 LRA0064 26.2 3.0 12.8 2.4 0.8 2.9 0.3 1.9 0.3 1.2 0.1 1.1 0.1 3.4 171 3.0 1.4 LRA0068 24.7 2.9 12.6 2.4 0.8 2.9 0.3 1.9 0.3 1.1 0.1 1.0 0.1 3.0 130 3.0 1.5 LRA0069 40.5 4.9 21.8 4.2 1.1 4.8 0.6 3.5 0.7 2.1 0.2 2.0 0.2 4.4 15.6 4.5 7.2 LRA0072 15.3 1.6 6.7 1.3 0.9 1.6 0.2 0.9 0.2 0.6 0.1 0.6 0.1 3.4 50.0 1.9 1.6 LRA0074 14.9 1.6 6.5 1.1 0.7 1.5 0.1 0.9 0.2 0.6 0.1 0.6 0.1 3.1 10.8 1.8 1.0 LRA0076 0.9 0.1 0.5 0.1 0.1 0.1 0.1 0.1 0.1 0.1 3.7 0.1 0.2 LRA0077 2.7 0.2 1.1 0.2 0.1 0.2 0.2 0.1 0.1 0.7 325463 0.3 0.1 LRA0090 5.3 0.6 2.5 0.5 0.1 0.5 0.1 0.3 0.1 0.2 0.2 0.9 139 1.1 0.5 LRA0091 26.9 2.9 11.7 2.2 0.2 1.6 0.2 1.4 0.2 0.8 0.1 0.8 0.1 4.7 25.0 5.6 1.9 LRA0092 65.0 5.7 20.8 3.0 0.9 4.4 0.4 1.9 0.3 1.2 0.1 1.2 0.1 5.9 28.0 6.7 1.5 LRA0095 1.6 0.1 0.6 0.1 0.1 0.1 0.1 0.1 0.5 338908 0.2 0.1 LRA0097 37.9 4.2 17.8 3.4 0.7 3.8 0.5 2.7 0.5 1.8 0.2 1.8 0.2 7.1 40.8 4.7 1.5 LRA0105 26.3 2.7 11.4 2.0 0.6 1.9 0.2 1.6 0.3 1.1 0.1 1.1 0.1 5.5 26.4 3.4 1.0 LRA0112 7.7 0.8 3.8 0.7 0.1 0.5 0.1 0.5 0.1 0.3 0.3 0.9 51683 1.5 1.1 LRA0114 35.6 4.2 17.9 3.4 0.7 3.0 0.4 2.6 0.4 1.5 0.1 1.4 0.19 5.4 76.3 4.6 2.2 LRA0118 6.1 0.7 3.1 0.5 0.1 0.5 0.1 0.4 0.1 0.2 0.3 2.9 7.5 1.3 0.9 LRA0122 6.6 0.7 3.1 0.6 0.1 0.4 0.1 0.4 0.1 0.2 0.3 1.5 60.9 1.6 0.8 LRA0123 4.6 0.5 2.2 0.3 0.1 0.3 0.1 0.3 0.1 0.1 0.1 0.4 24944 0.8 0.5 LRA0126 1.2 0.1 0.7 0.1 0.1 0.1 0.07 0.1 0.0 1.2 0.1 0.1 LRA0134 5.5 0.6 2.6 0.4 0.1 0.4 0.1 0.3 0.1 0.1 0.1 0.5 32144 1.0 0.5 LRA0141 37.7 4.1 17.7 3.4 0.8 3.0 0.5 2.7 0.5 1.6 0.2 1.5 0.2 3.6 92.4 4.3 5.4 LRA0146 28.2 3.0 12.4 2.2 0.4 2.0 0.3 1.9 0.3 1.2 0.1 1.2 0.1 6.0 80.2 3.6 2.2 LRA0158 6.7 0.7 2.9 0.6 0.1 0.4 0.1 0.4 0.1 0.3 0.3 0.1 1.3 1988 0.9 0.5 LRA0160 35.5 3.8 16.3 3.2 0.7 2.6 0.4 2.4 0.4 1.3 0.1 1.4 0.1 3.7 112 4.0 4.0 LRA0161 31.3 3.4 14.7 2.7 0.6 2.4 0.3 1.9 0.3 1.1 0.1 1.1 0.1 3.9 160 3.6 1.9 LRA0170 21.0 2.2 9.0 1.6 0.4 1.4 0.2 1.3 0.2 0.8 0.1 0.9 0.1 5.0 134 2.9 0.8 LRA0181 2.3 0.2 1.2 0.2 0.1 0.1 0.1 0.1 0.1 4.0 0.5 0.2 LRA0182 5.3 0.6 2.7 0.4 0.1 0.4 0.1 0.5 0.1 0.3 0.1 0.3 0.1 1.5 9.7 0.8 0.4
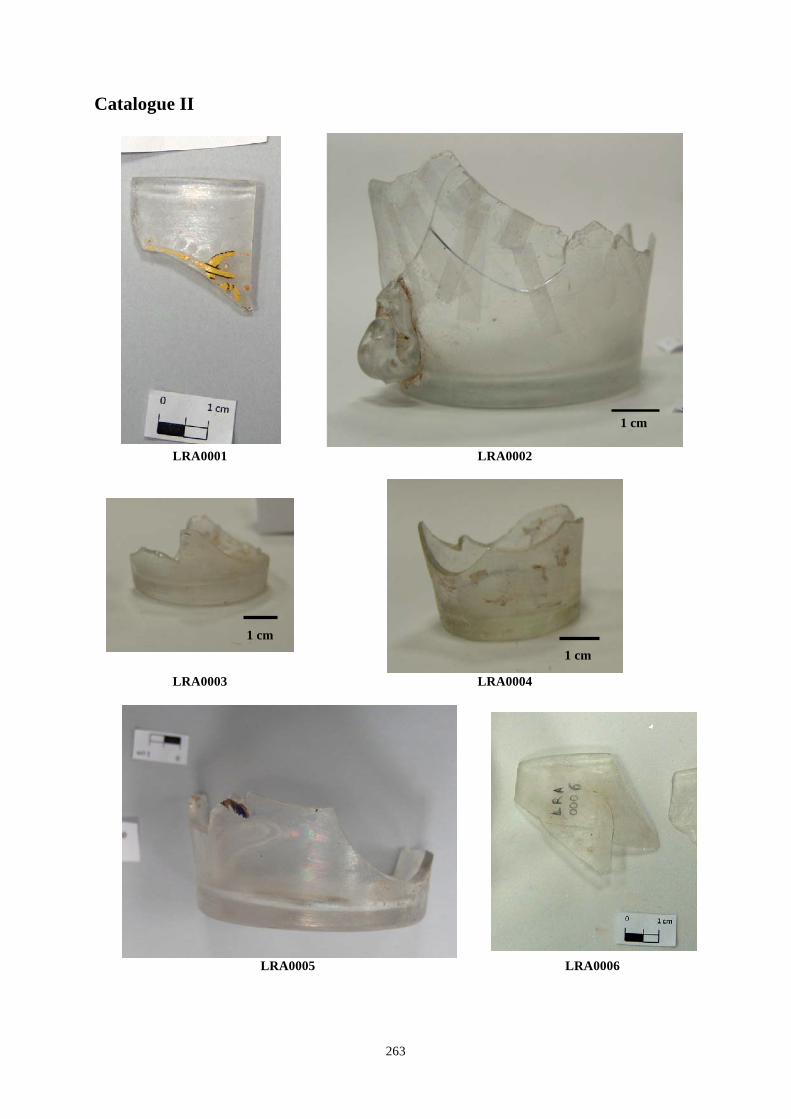
! 263!
Catalogue II !
! !LRA0001 LRA0002
!
LRA0003 LRA0004
! !LRA0005 LRA0006
!!
1 cm 1 cm
1 cm
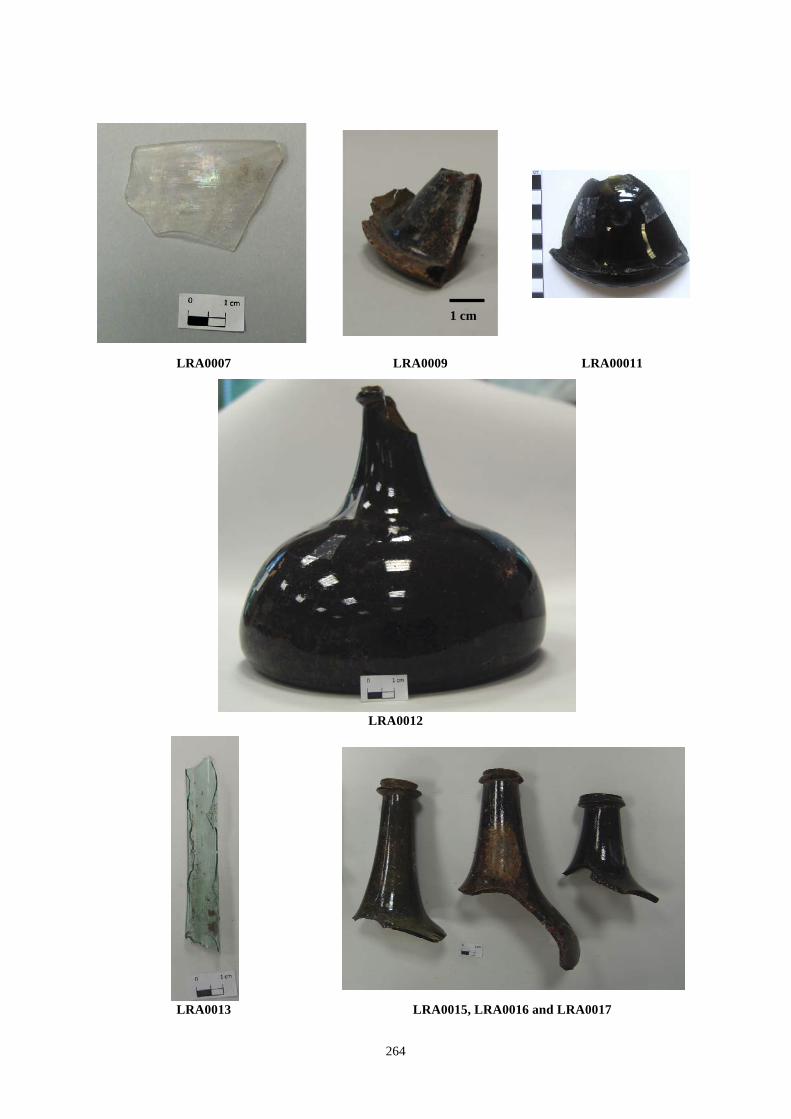
! 264!
!
!
!
!!
!
LRA0007 LRA0009 LRA00011
!LRA0012
! !LRA0013 LRA0015, LRA0016 and LRA0017
1 cm
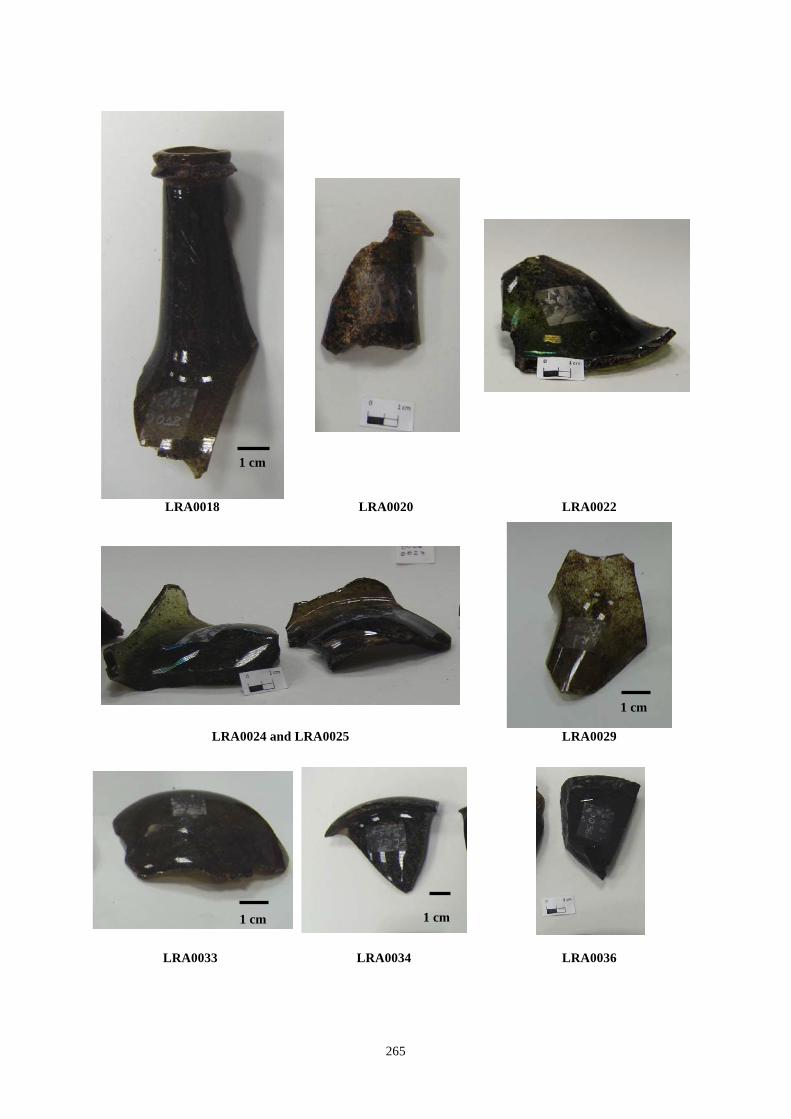
! 265!
!
LRA0018 LRA0020 LRA0022
LRA0024 and LRA0025 LRA0029
!
!
LRA0033 LRA0034 LRA0036 !!!
1 cm
1 cm
1 cm 1 cm
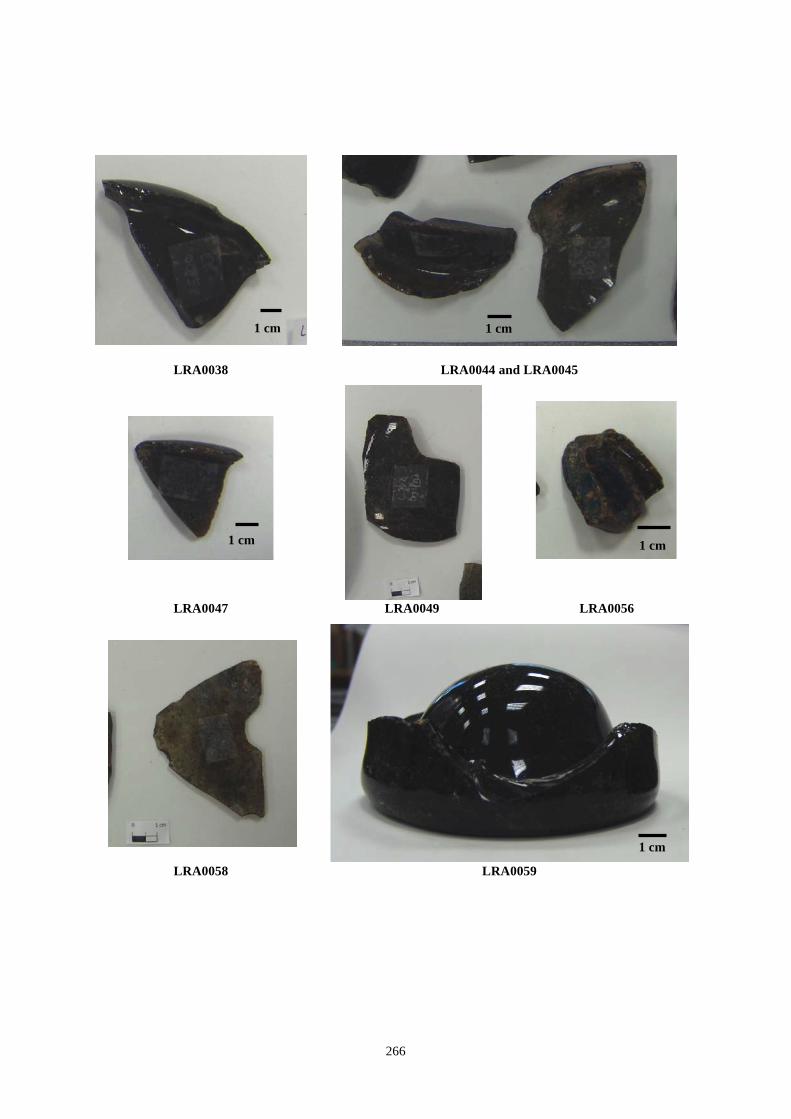
! 266!
!!!
!
!
LRA0038 LRA0044 and LRA0045
!
!
LRA0047 LRA0049 LRA0056
LRA0058 LRA0059 !!!!!!!!!
1 cm 1 cm
1 cm 1 cm
1 cm
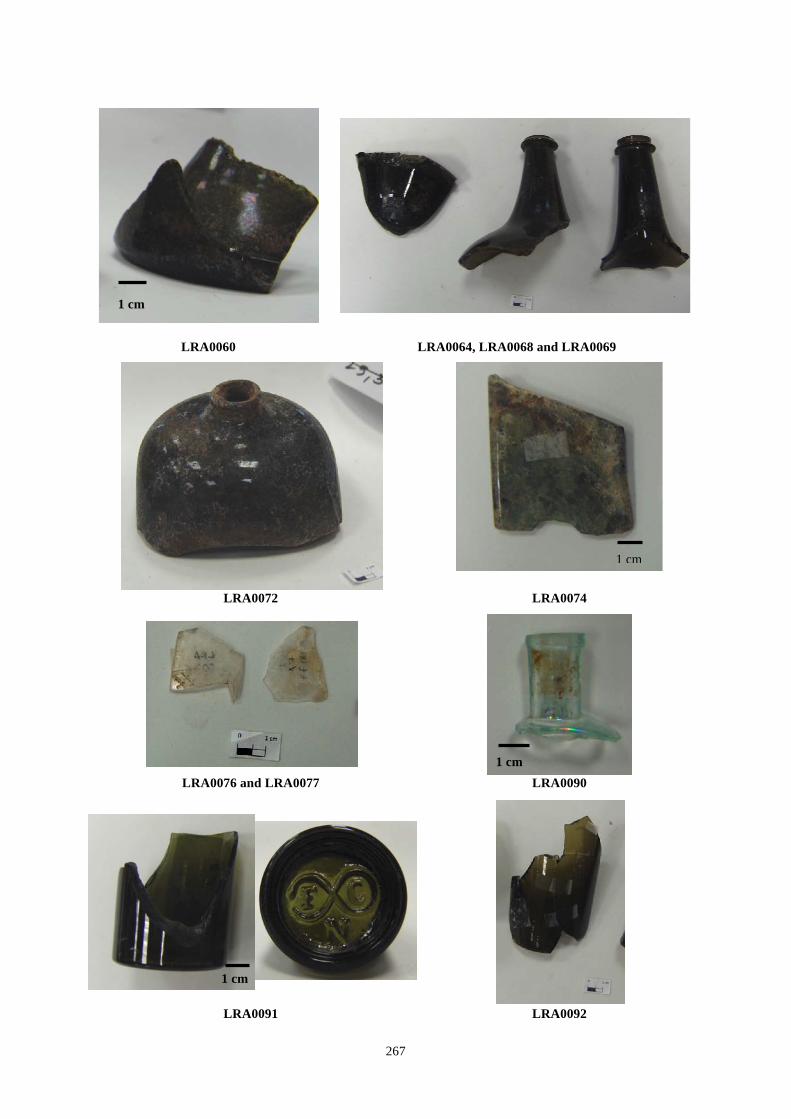
! 267!
LRA0060 LRA0064, LRA0068 and LRA0069
!
LRA0072 LRA0074
LRA0076 and LRA0077 LRA0090
LRA0091 LRA0092
1 cm
1 cm
1 cm
1 cm
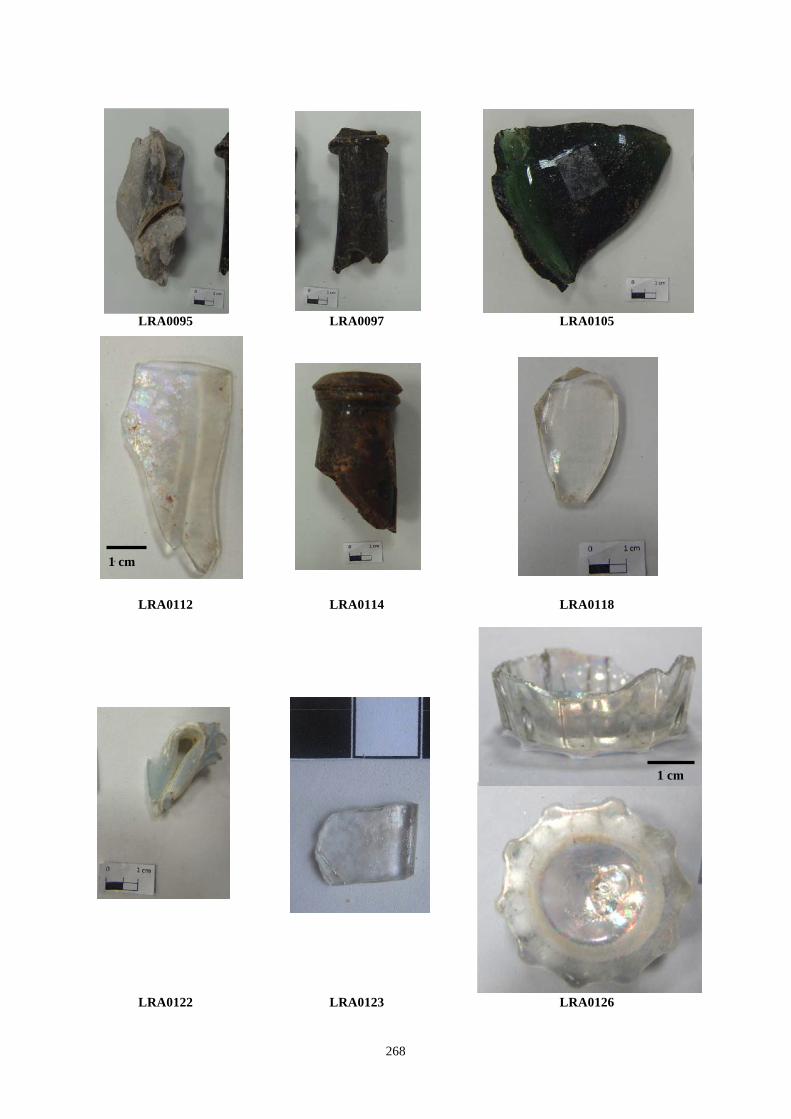
! 268!
!
LRA0095 LRA0097 LRA0105
LRA0112 LRA0114 LRA0118
LRA0122 LRA0123 LRA0126
1 cm
1 cm
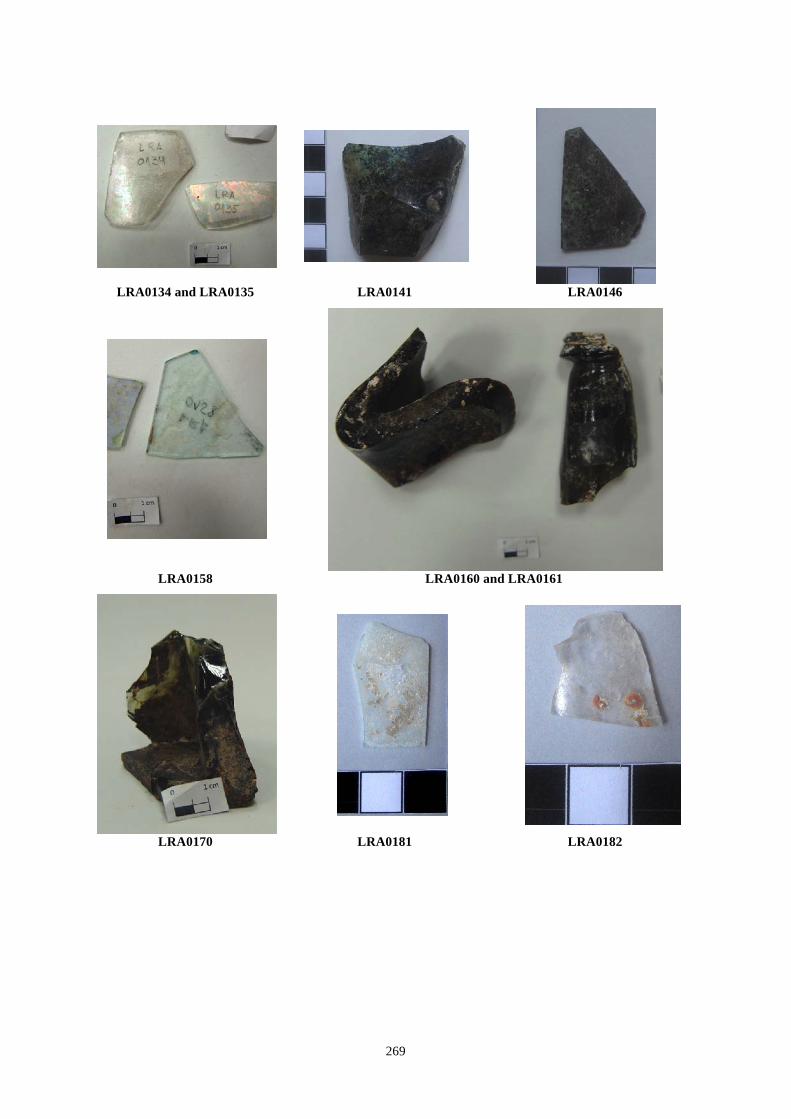
! 269!
!
LRA0134 and LRA0135 LRA0141 LRA0146
LRA0158 LRA0160 and LRA0161
LRA0170 LRA0181 LRA0182 !!!!!!!
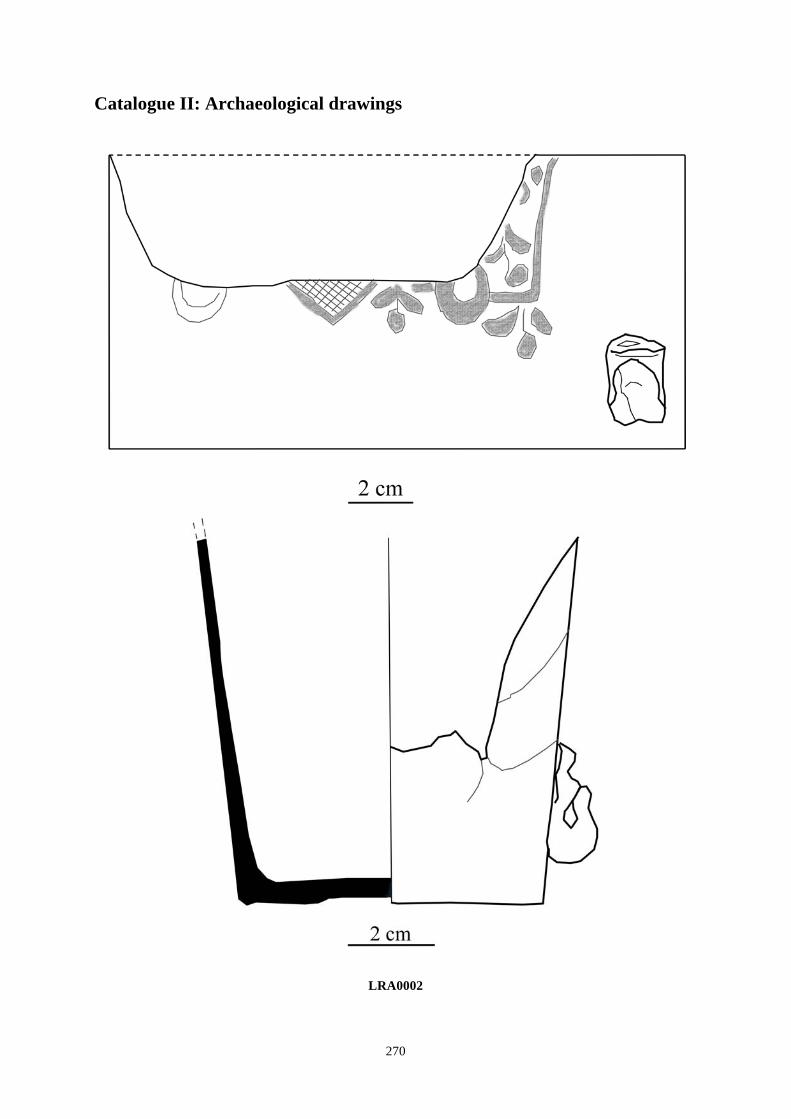
! 270!
Catalogue II: Archaeological drawings
LRA0002
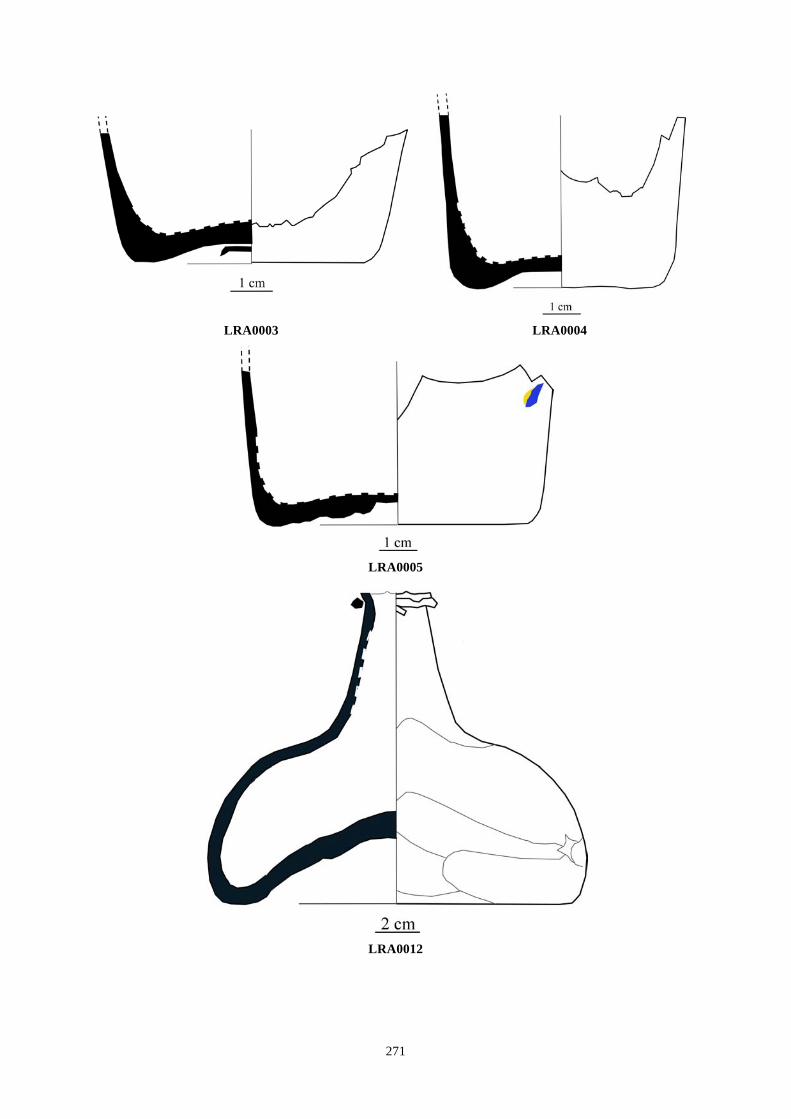
! 271!
LRA0003 LRA0004
LRA0005
LRA0012
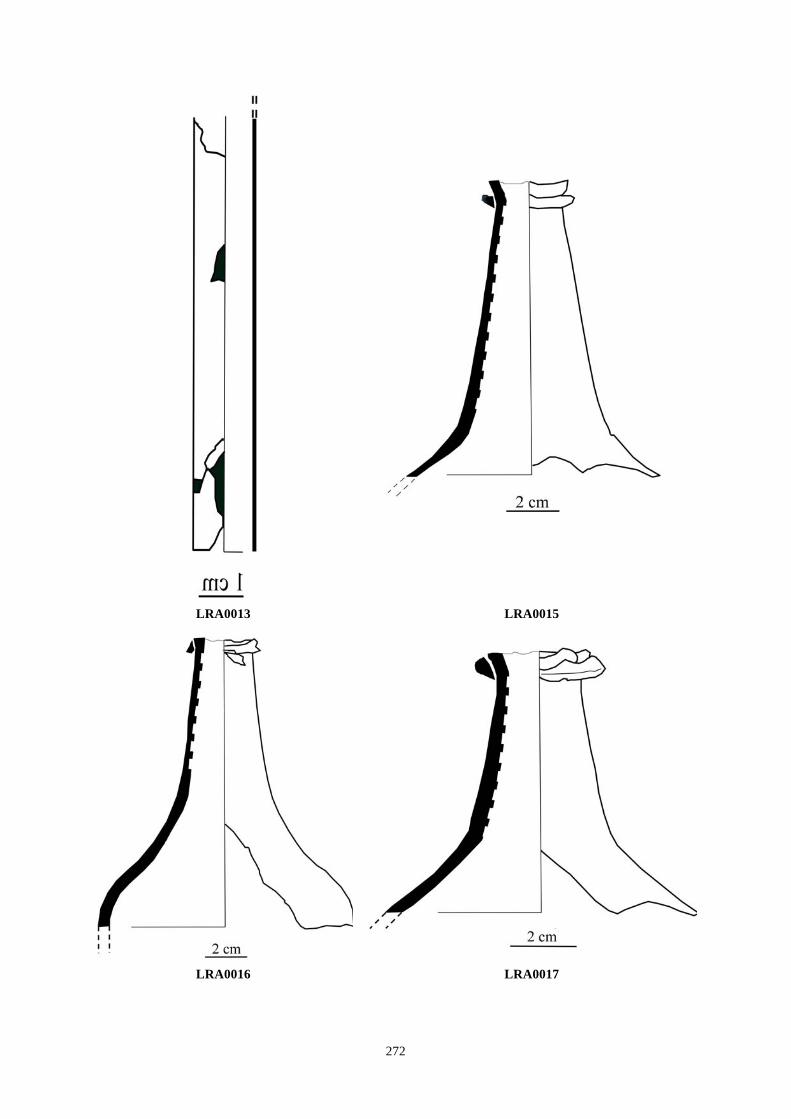
! 272!
LRA0013 LRA0015
LRA0016 LRA0017
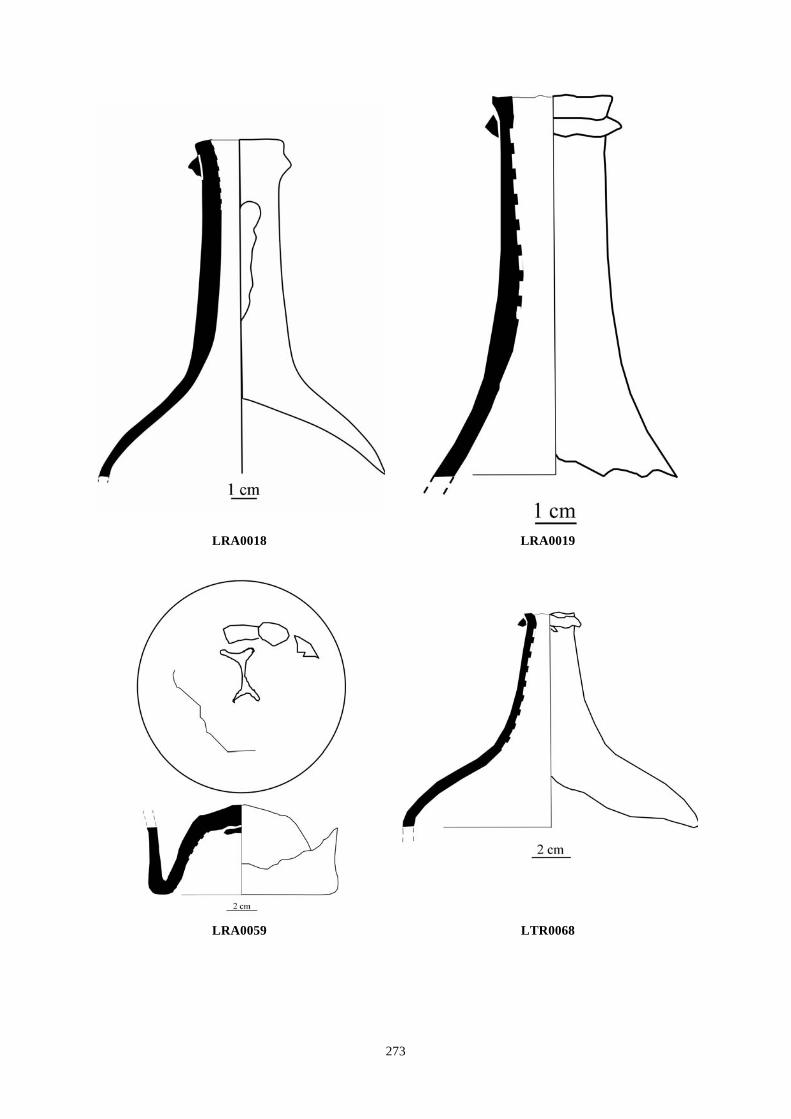
! 273!
LRA0018 LRA0019
LRA0059 LTR0068
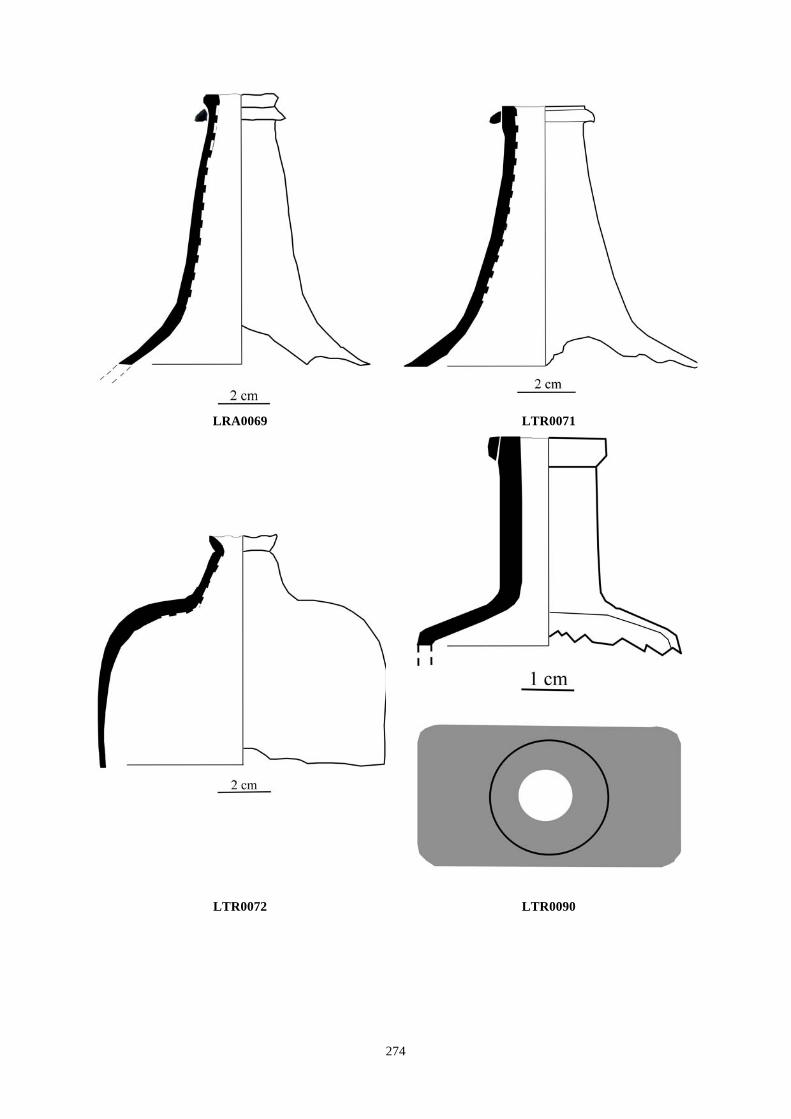
! 274!
LRA0069 LTR0071
LTR0072 LTR0090
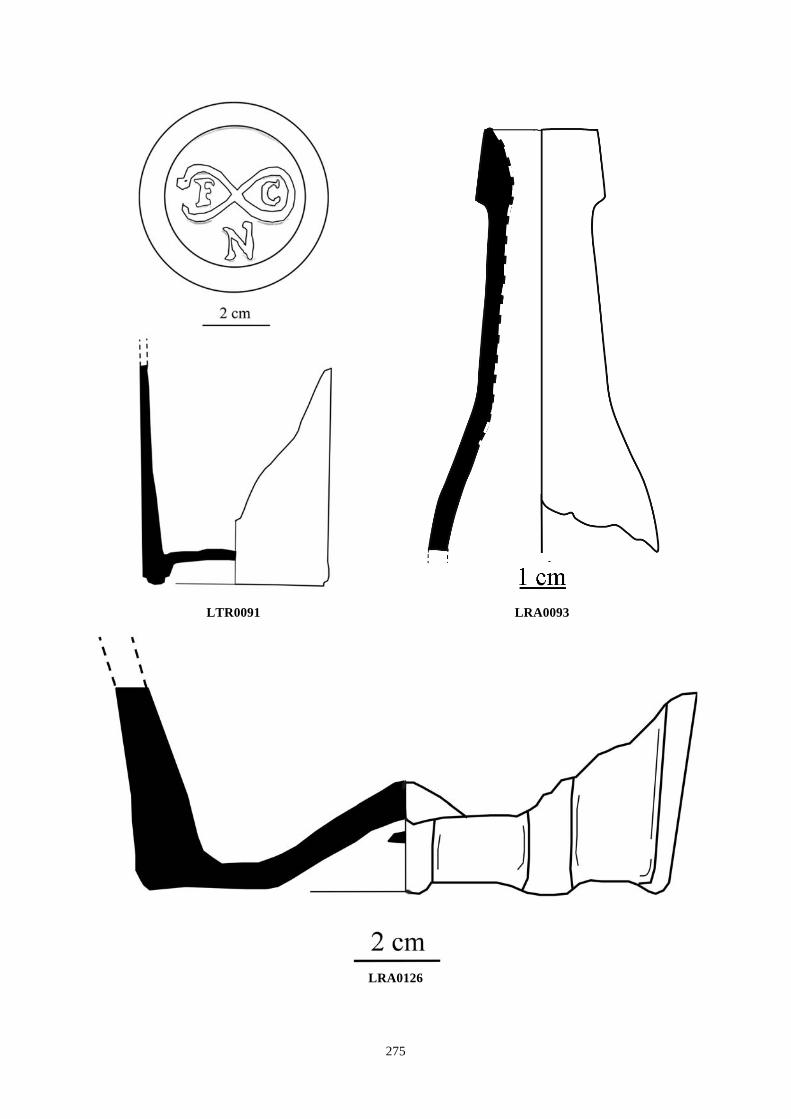
! 275!
LTR0091 LRA0093
LRA0126

! 276!
!
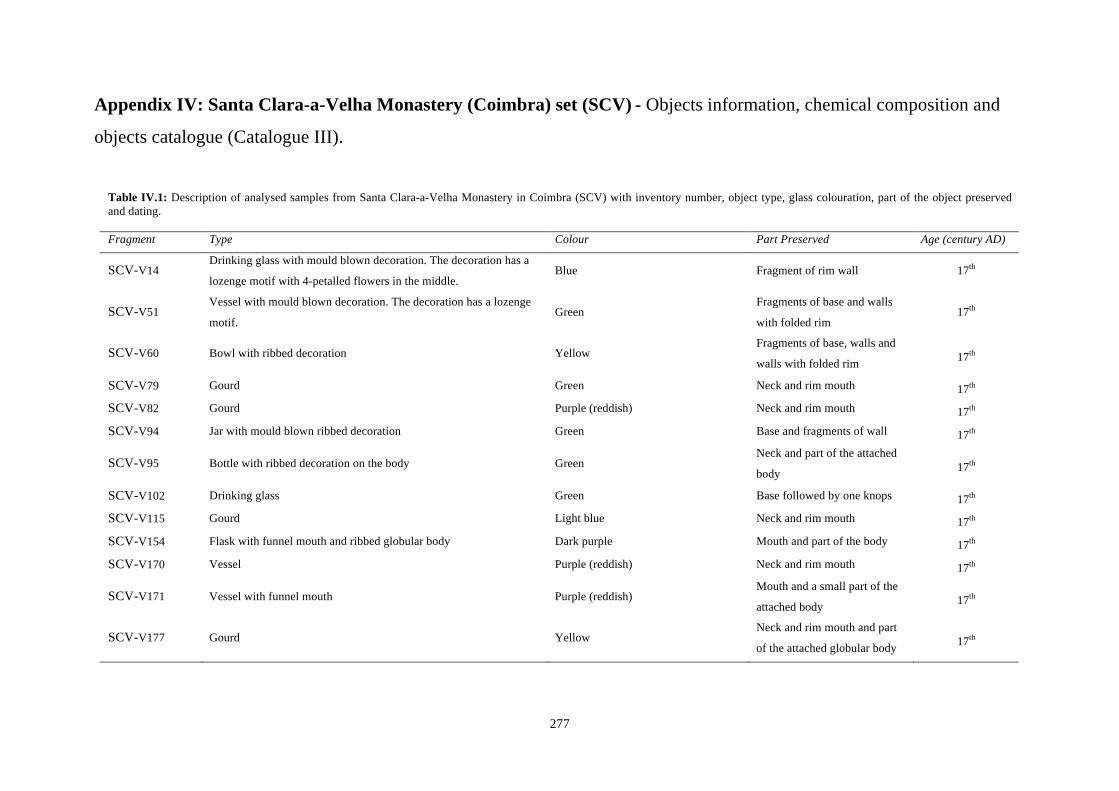
! 277!
Appendix IV: Santa Clara-a-Velha Monastery (Coimbra) set (SCV) - Objects information, chemical composition and
objects catalogue (Catalogue III).
Table IV.1: Description of analysed samples from Santa Clara-a-Velha Monastery in Coimbra (SCV) with inventory number, object type, glass colouration, part of the object preserved and dating. Fragment Type Colour Part Preserved Age (century AD)
SCV-V14 Drinking glass with mould blown decoration. The decoration has a
lozenge motif with 4-petalled flowers in the middle. Blue Fragment of rim wall 17th
SCV-V51 Vessel with mould blown decoration. The decoration has a lozenge
motif. Green
Fragments of base and walls
with folded rim 17th
SCV-V60 Bowl with ribbed decoration Yellow Fragments of base, walls and
walls with folded rim 17th!
SCV-V79 Gourd Green Neck and rim mouth 17th!SCV-V82 Gourd Purple (reddish) Neck and rim mouth 17th!SCV-V94 Jar with mould blown ribbed decoration Green Base and fragments of wall 17th!
SCV-V95 Bottle with ribbed decoration on the body Green Neck and part of the attached
body 17th!
SCV-V102 Drinking glass Green Base followed by one knops 17th!SCV-V115 Gourd Light blue Neck and rim mouth 17th!SCV-V154 Flask with funnel mouth and ribbed globular body Dark purple Mouth and part of the body 17th!SCV-V170 Vessel Purple (reddish) Neck and rim mouth 17th!
SCV-V171 Vessel with funnel mouth Purple (reddish) Mouth and a small part of the
attached body 17th!
SCV-V177 Gourd Yellow Neck and rim mouth and part
of the attached globular body 17th!
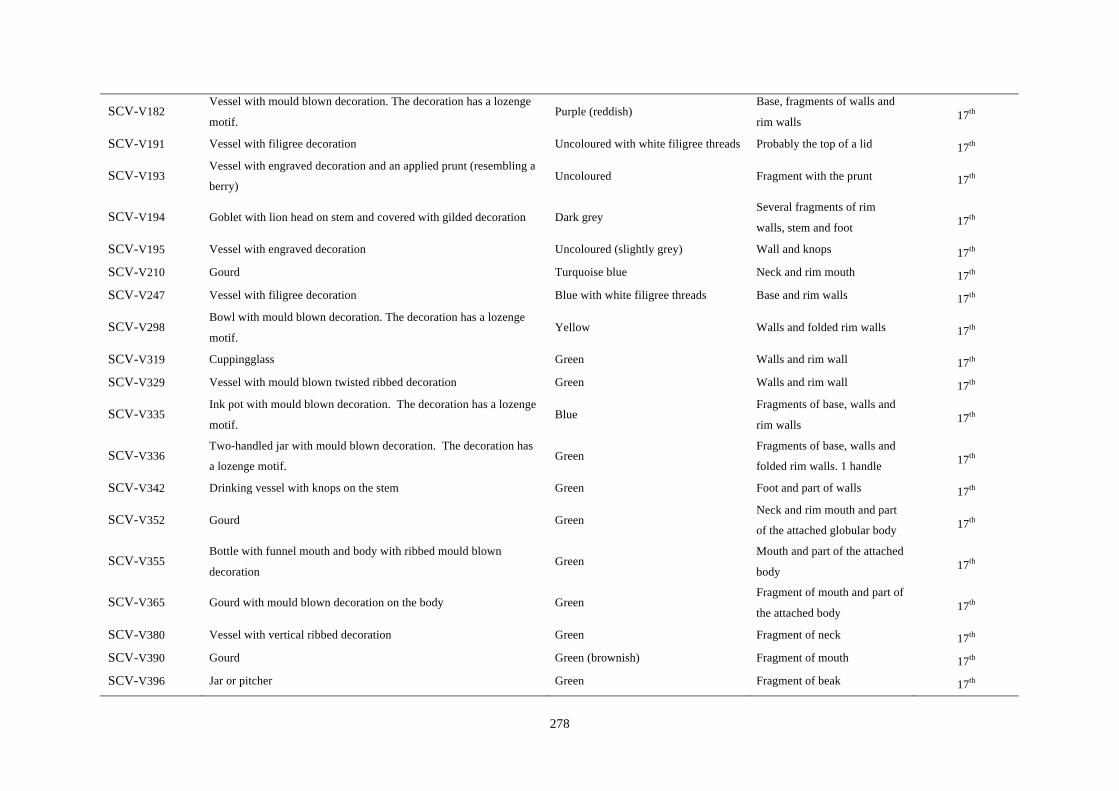
! 278!
SCV-V182 Vessel with mould blown decoration. The decoration has a lozenge
motif. Purple (reddish)
Base, fragments of walls and
rim walls 17th!
SCV-V191 Vessel with filigree decoration Uncoloured with white filigree threads Probably the top of a lid 17th!
SCV-V193 Vessel with engraved decoration and an applied prunt (resembling a
berry) Uncoloured Fragment with the prunt 17th!
SCV-V194 Goblet with lion head on stem and covered with gilded decoration Dark grey Several fragments of rim
walls, stem and foot 17th!
SCV-V195 Vessel with engraved decoration Uncoloured (slightly grey) Wall and knops 17th!SCV-V210 Gourd Turquoise blue Neck and rim mouth 17th!SCV-V247 Vessel with filigree decoration Blue with white filigree threads Base and rim walls 17th!
SCV-V298 Bowl with mould blown decoration. The decoration has a lozenge
motif. Yellow Walls and folded rim walls 17th!
SCV-V319 Cuppingglass Green Walls and rim wall 17th!SCV-V329 Vessel with mould blown twisted ribbed decoration Green Walls and rim wall 17th!
SCV-V335 Ink pot with mould blown decoration. The decoration has a lozenge
motif. Blue
Fragments of base, walls and
rim walls 17th!
SCV-V336 Two-handled jar with mould blown decoration. The decoration has
a lozenge motif. Green
Fragments of base, walls and
folded rim walls. 1 handle 17th!
SCV-V342 Drinking vessel with knops on the stem Green Foot and part of walls 17th!
SCV-V352 Gourd Green Neck and rim mouth and part
of the attached globular body 17th!
SCV-V355 Bottle with funnel mouth and body with ribbed mould blown
decoration Green
Mouth and part of the attached
body 17th!
SCV-V365 Gourd with mould blown decoration on the body Green Fragment of mouth and part of
the attached body 17th!
SCV-V380 Vessel with vertical ribbed decoration Green Fragment of neck 17th!SCV-V390 Gourd Green (brownish) Fragment of mouth 17th!SCV-V396 Jar or pitcher Green Fragment of beak 17th!
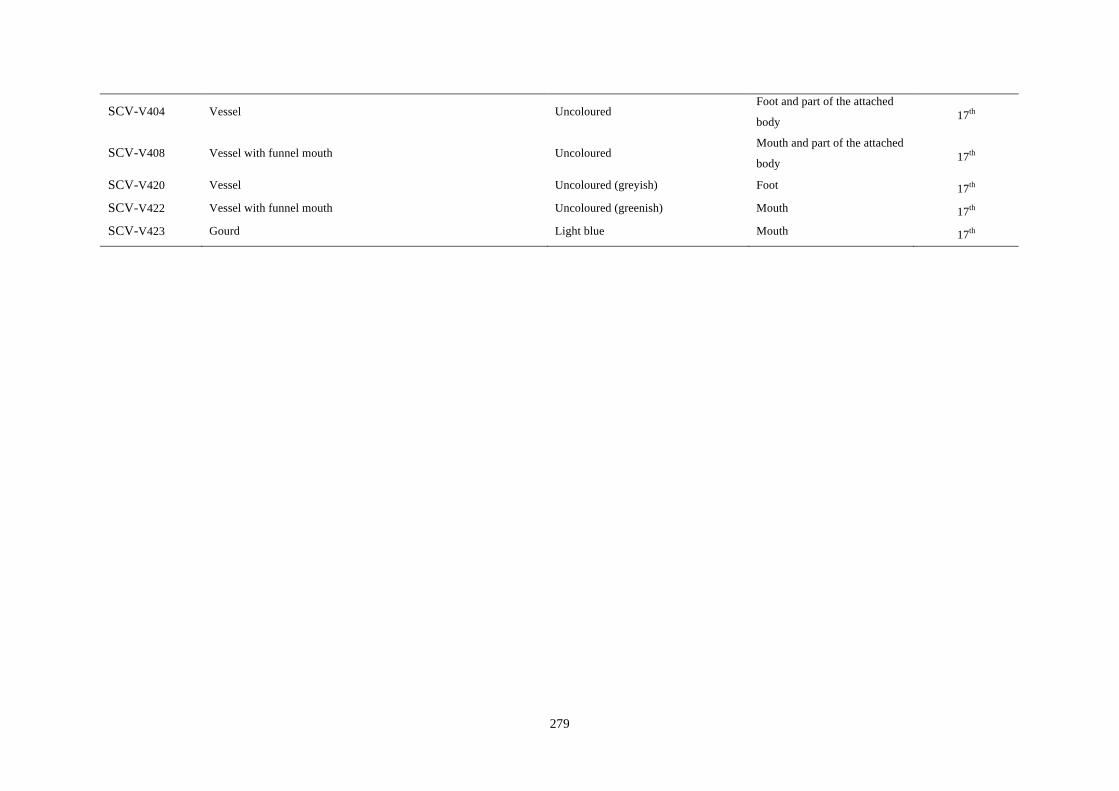
! 279!
SCV-V404 Vessel Uncoloured Foot and part of the attached
body 17th!
SCV-V408 Vessel with funnel mouth Uncoloured Mouth and part of the attached
body 17th!
SCV-V420 Vessel Uncoloured (greyish) Foot 17th!SCV-V422 Vessel with funnel mouth Uncoloured (greenish) Mouth 17th!SCV-V423 Gourd Light blue Mouth 17th!

! 280!
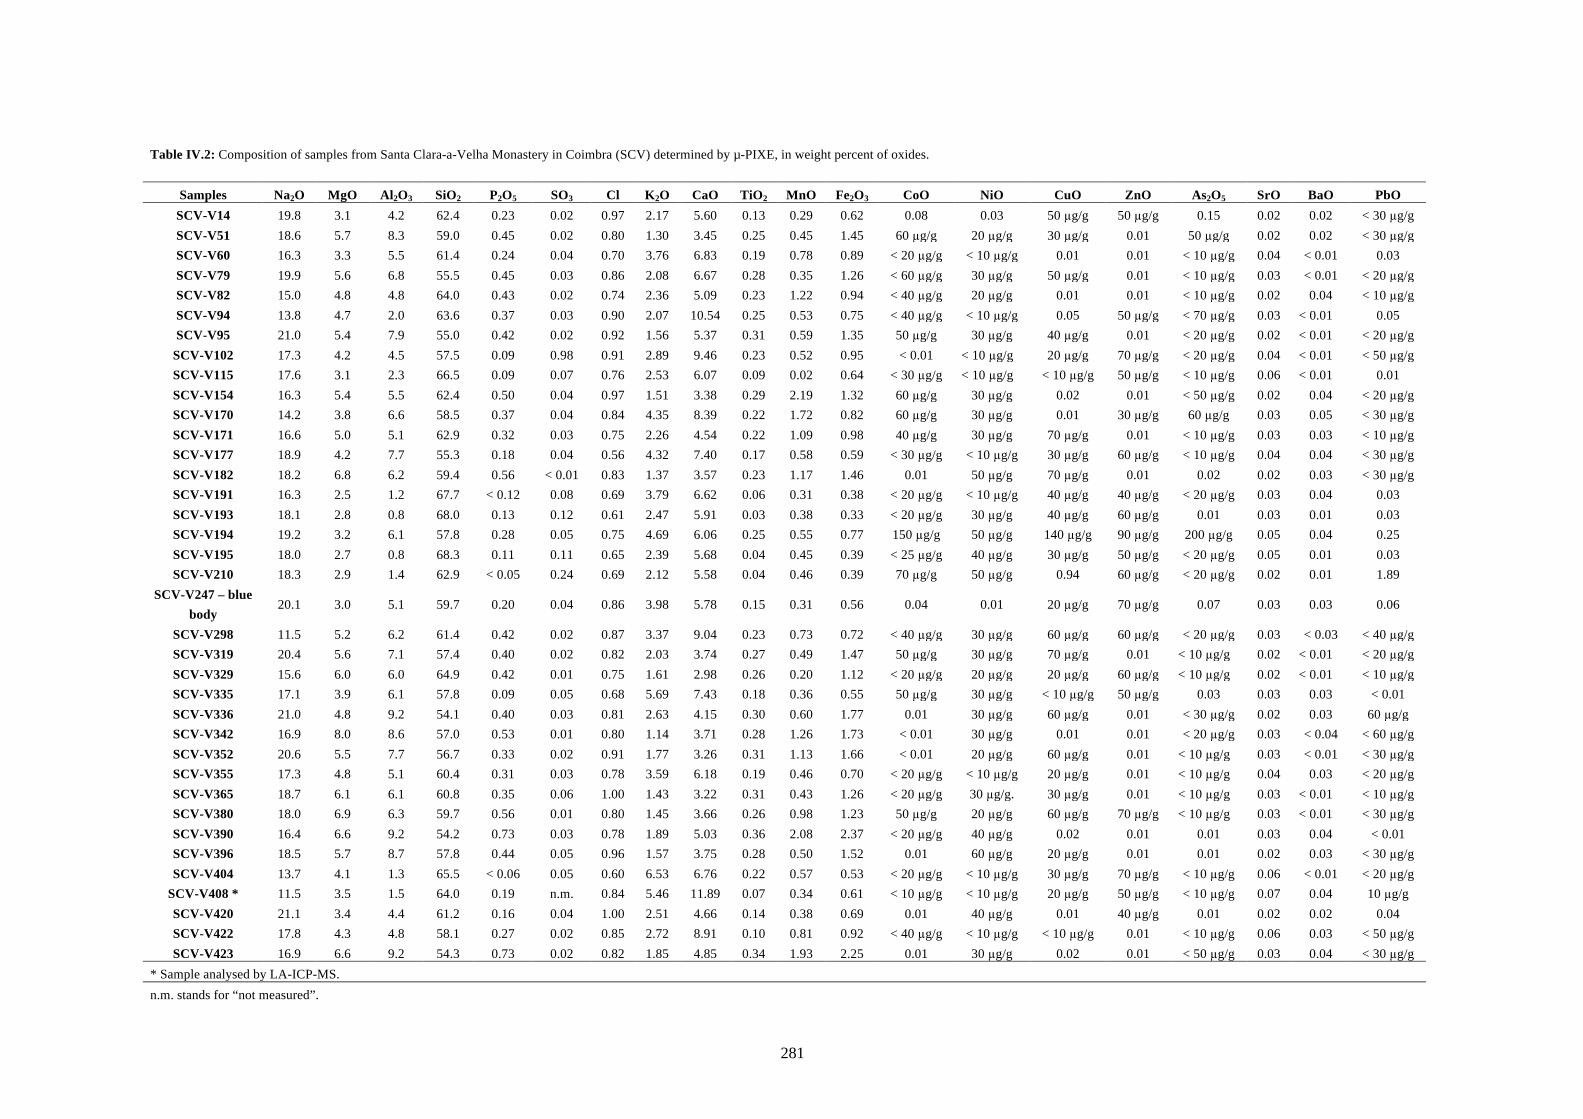
281
Table IV.2: Composition of samples from Santa Clara-a-Velha Monastery in Coimbra (SCV) determined by µ-PIXE, in weight percent of oxides.
Samples Na2O MgO Al2O3 SiO2 P2O5 SO3 Cl K2O CaO TiO2 MnO Fe2O3 CoO NiO CuO ZnO As2O5 SrO BaO PbO SCV-V14 19.8 3.1 4.2 62.4 0.23 0.02 0.97 2.17 5.60 0.13 0.29 0.62 0.08 0.03 50 µg/g 50 µg/g 0.15 0.02 0.02 < 30 µg/g SCV-V51 18.6 5.7 8.3 59.0 0.45 0.02 0.80 1.30 3.45 0.25 0.45 1.45 60 µg/g 20 µg/g 30 µg/g 0.01 50 µg/g 0.02 0.02 < 30 µg/g SCV-V60 16.3 3.3 5.5 61.4 0.24 0.04 0.70 3.76 6.83 0.19 0.78 0.89 < 20 µg/g < 10 µg/g 0.01 0.01 < 10 µg/g 0.04 < 0.01 0.03 SCV-V79 19.9 5.6 6.8 55.5 0.45 0.03 0.86 2.08 6.67 0.28 0.35 1.26 < 60 µg/g 30 µg/g 50 µg/g 0.01 < 10 µg/g 0.03 < 0.01 < 20 µg/g SCV-V82 15.0 4.8 4.8 64.0 0.43 0.02 0.74 2.36 5.09 0.23 1.22 0.94 < 40 µg/g 20 µg/g 0.01 0.01 < 10 µg/g 0.02 0.04 < 10 µg/g SCV-V94 13.8 4.7 2.0 63.6 0.37 0.03 0.90 2.07 10.54 0.25 0.53 0.75 < 40 µg/g < 10 µg/g 0.05 50 µg/g < 70 µg/g 0.03 < 0.01 0.05 SCV-V95 21.0 5.4 7.9 55.0 0.42 0.02 0.92 1.56 5.37 0.31 0.59 1.35 50 µg/g 30 µg/g 40 µg/g 0.01 < 20 µg/g 0.02 < 0.01 < 20 µg/g
SCV-V102 17.3 4.2 4.5 57.5 0.09 0.98 0.91 2.89 9.46 0.23 0.52 0.95 < 0.01 < 10 µg/g 20 µg/g 70 µg/g < 20 µg/g 0.04 < 0.01 < 50 µg/g SCV-V115 17.6 3.1 2.3 66.5 0.09 0.07 0.76 2.53 6.07 0.09 0.02 0.64 < 30 µg/g < 10 µg/g < 10 µg/g 50 µg/g < 10 µg/g 0.06 < 0.01 0.01 SCV-V154 16.3 5.4 5.5 62.4 0.50 0.04 0.97 1.51 3.38 0.29 2.19 1.32 60 µg/g 30 µg/g 0.02 0.01 < 50 µg/g 0.02 0.04 < 20 µg/g SCV-V170 14.2 3.8 6.6 58.5 0.37 0.04 0.84 4.35 8.39 0.22 1.72 0.82 60 µg/g 30 µg/g 0.01 30 µg/g 60 µg/g 0.03 0.05 < 30 µg/g SCV-V171 16.6 5.0 5.1 62.9 0.32 0.03 0.75 2.26 4.54 0.22 1.09 0.98 40 µg/g 30 µg/g 70 µg/g 0.01 < 10 µg/g 0.03 0.03 < 10 µg/g SCV-V177 18.9 4.2 7.7 55.3 0.18 0.04 0.56 4.32 7.40 0.17 0.58 0.59 < 30 µg/g < 10 µg/g 30 µg/g 60 µg/g < 10 µg/g 0.04 0.04 < 30 µg/g SCV-V182 18.2 6.8 6.2 59.4 0.56 < 0.01 0.83 1.37 3.57 0.23 1.17 1.46 0.01 50 µg/g 70 µg/g 0.01 0.02 0.02 0.03 < 30 µg/g SCV-V191 16.3 2.5 1.2 67.7 < 0.12 0.08 0.69 3.79 6.62 0.06 0.31 0.38 < 20 µg/g < 10 µg/g 40 µg/g 40 µg/g < 20 µg/g 0.03 0.04 0.03 SCV-V193 18.1 2.8 0.8 68.0 0.13 0.12 0.61 2.47 5.91 0.03 0.38 0.33 < 20 µg/g 30 µg/g 40 µg/g 60 µg/g 0.01 0.03 0.01 0.03 SCV-V194 19.2 3.2 6.1 57.8 0.28 0.05 0.75 4.69 6.06 0.25 0.55 0.77 150 µg/g 50 µg/g 140 µg/g 90 µg/g 200 µg/g 0.05 0.04 0.25 SCV-V195 18.0 2.7 0.8 68.3 0.11 0.11 0.65 2.39 5.68 0.04 0.45 0.39 < 25 µg/g 40 µg/g 30 µg/g 50 µg/g < 20 µg/g 0.05 0.01 0.03 SCV-V210 18.3 2.9 1.4 62.9 < 0.05 0.24 0.69 2.12 5.58 0.04 0.46 0.39 70 µg/g 50 µg/g 0.94 60 µg/g < 20 µg/g 0.02 0.01 1.89
SCV-V247 – blue body
20.1 3.0 5.1 59.7 0.20 0.04 0.86 3.98 5.78 0.15 0.31 0.56 0.04 0.01 20 µg/g 70 µg/g 0.07 0.03 0.03 0.06
SCV-V298 11.5 5.2 6.2 61.4 0.42 0.02 0.87 3.37 9.04 0.23 0.73 0.72 < 40 µg/g 30 µg/g 60 µg/g 60 µg/g < 20 µg/g 0.03 < 0.03 < 40 µg/g SCV-V319 20.4 5.6 7.1 57.4 0.40 0.02 0.82 2.03 3.74 0.27 0.49 1.47 50 µg/g 30 µg/g 70 µg/g 0.01 < 10 µg/g 0.02 < 0.01 < 20 µg/g SCV-V329 15.6 6.0 6.0 64.9 0.42 0.01 0.75 1.61 2.98 0.26 0.20 1.12 < 20 µg/g 20 µg/g 20 µg/g 60 µg/g < 10 µg/g 0.02 < 0.01 < 10 µg/g SCV-V335 17.1 3.9 6.1 57.8 0.09 0.05 0.68 5.69 7.43 0.18 0.36 0.55 50 µg/g 30 µg/g < 10 µg/g 50 µg/g 0.03 0.03 0.03 < 0.01 SCV-V336 21.0 4.8 9.2 54.1 0.40 0.03 0.81 2.63 4.15 0.30 0.60 1.77 0.01 30 µg/g 60 µg/g 0.01 < 30 µg/g 0.02 0.03 60 µg/g SCV-V342 16.9 8.0 8.6 57.0 0.53 0.01 0.80 1.14 3.71 0.28 1.26 1.73 < 0.01 30 µg/g 0.01 0.01 < 20 µg/g 0.03 < 0.04 < 60 µg/g SCV-V352 20.6 5.5 7.7 56.7 0.33 0.02 0.91 1.77 3.26 0.31 1.13 1.66 < 0.01 20 µg/g 60 µg/g 0.01 < 10 µg/g 0.03 < 0.01 < 30 µg/g SCV-V355 17.3 4.8 5.1 60.4 0.31 0.03 0.78 3.59 6.18 0.19 0.46 0.70 < 20 µg/g < 10 µg/g 20 µg/g 0.01 < 10 µg/g 0.04 0.03 < 20 µg/g SCV-V365 18.7 6.1 6.1 60.8 0.35 0.06 1.00 1.43 3.22 0.31 0.43 1.26 < 20 µg/g 30 µg/g. 30 µg/g 0.01 < 10 µg/g 0.03 < 0.01 < 10 µg/g SCV-V380 18.0 6.9 6.3 59.7 0.56 0.01 0.80 1.45 3.66 0.26 0.98 1.23 50 µg/g 20 µg/g 60 µg/g 70 µg/g < 10 µg/g 0.03 < 0.01 < 30 µg/g SCV-V390 16.4 6.6 9.2 54.2 0.73 0.03 0.78 1.89 5.03 0.36 2.08 2.37 < 20 µg/g 40 µg/g 0.02 0.01 0.01 0.03 0.04 < 0.01 SCV-V396 18.5 5.7 8.7 57.8 0.44 0.05 0.96 1.57 3.75 0.28 0.50 1.52 0.01 60 µg/g 20 µg/g 0.01 0.01 0.02 0.03 < 30 µg/g SCV-V404 13.7 4.1 1.3 65.5 < 0.06 0.05 0.60 6.53 6.76 0.22 0.57 0.53 < 20 µg/g < 10 µg/g 30 µg/g 70 µg/g < 10 µg/g 0.06 < 0.01 < 20 µg/g
SCV-V408 * 11.5 3.5 1.5 64.0 0.19 n.m. 0.84 5.46 11.89 0.07 0.34 0.61 < 10 µg/g < 10 µg/g 20 µg/g 50 µg/g < 10 µg/g 0.07 0.04 10 µg/g SCV-V420 21.1 3.4 4.4 61.2 0.16 0.04 1.00 2.51 4.66 0.14 0.38 0.69 0.01 40 µg/g 0.01 40 µg/g 0.01 0.02 0.02 0.04 SCV-V422 17.8 4.3 4.8 58.1 0.27 0.02 0.85 2.72 8.91 0.10 0.81 0.92 < 40 µg/g < 10 µg/g < 10 µg/g 0.01 < 10 µg/g 0.06 0.03 < 50 µg/g SCV-V423 16.9 6.6 9.2 54.3 0.73 0.02 0.82 1.85 4.85 0.34 1.93 2.25 0.01 30 µg/g 0.02 0.01 < 50 µg/g 0.03 0.04 < 30 µg/g
* Sample analysed by LA-ICP-MS.
n.m. stands for “not measured”.
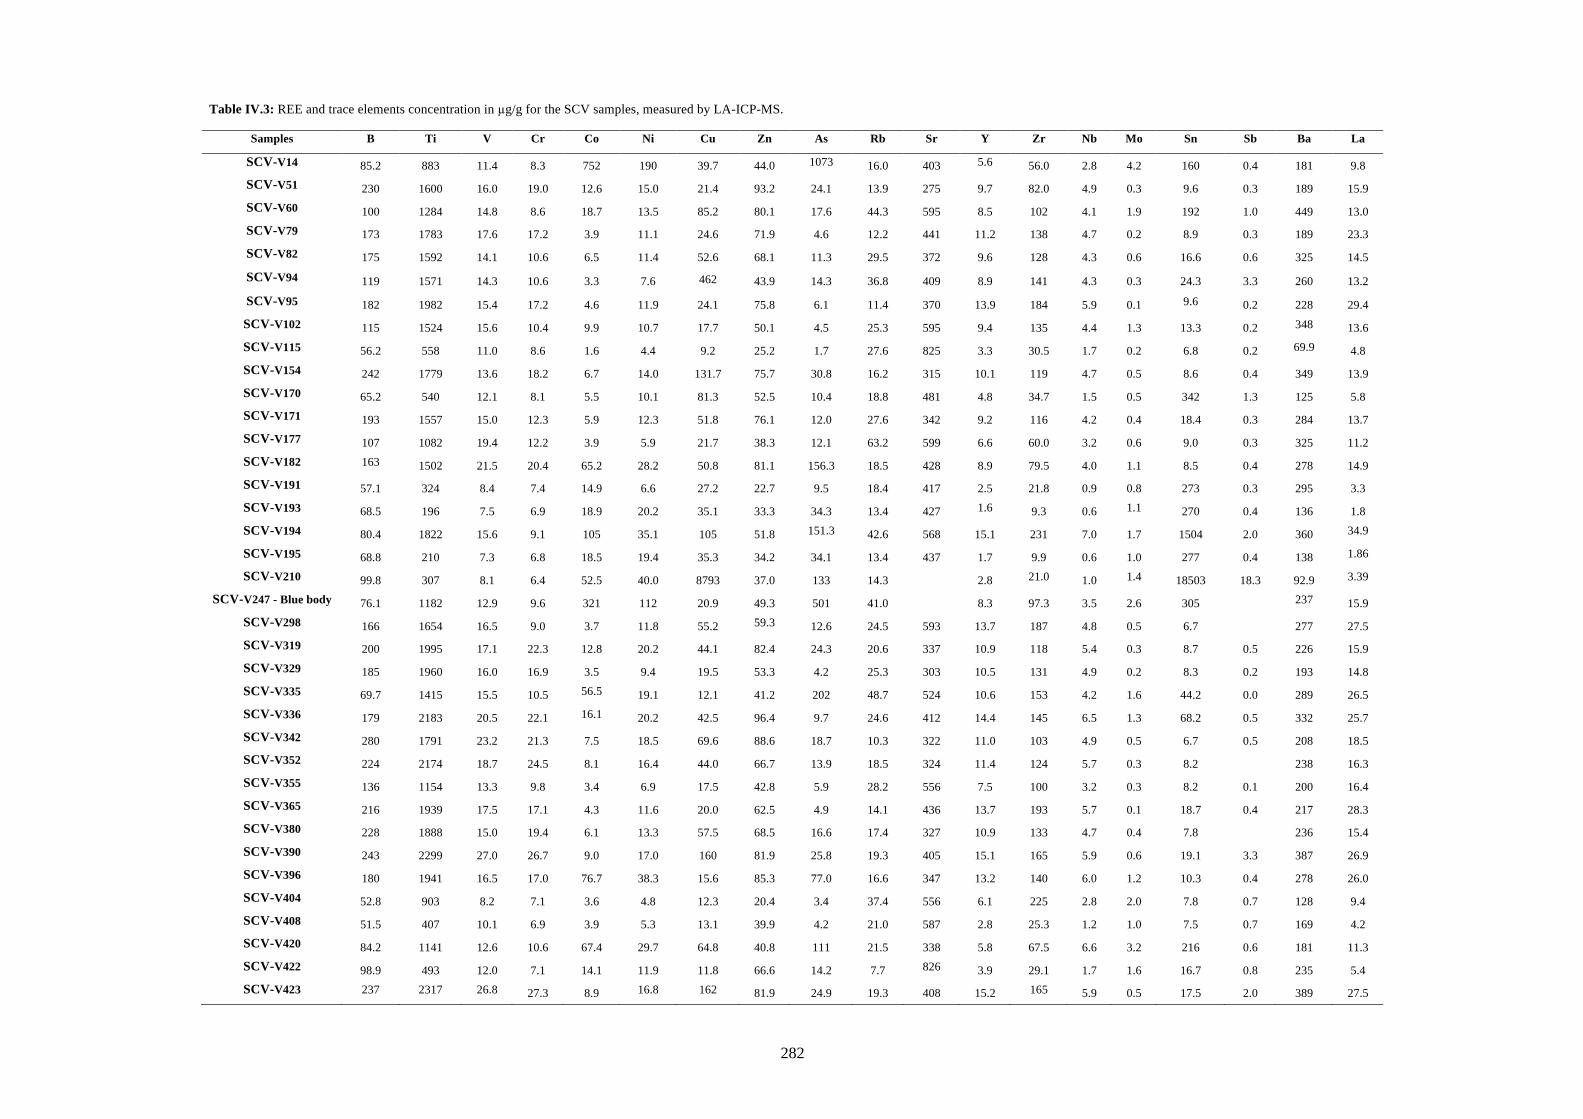
282
Table IV.3: REE and trace elements concentration in µg/g for the SCV samples, measured by LA-ICP-MS.
Samples B Ti V Cr Co Ni Cu Zn As Rb Sr Y Zr Nb Mo Sn Sb Ba La
SCV-V14 85.2 883 11.4 8.3 752 190 39.7 44.0 1073 16.0 403 5.6 56.0 2.8 4.2 160 0.4 181 9.8
SCV-V51 230 1600 16.0 19.0 12.6 15.0 21.4 93.2 24.1 13.9 275 9.7 82.0 4.9 0.3 9.6 0.3 189 15.9
SCV-V60 100 1284 14.8 8.6 18.7 13.5 85.2 80.1 17.6 44.3 595 8.5 102 4.1 1.9 192 1.0 449 13.0
SCV-V79 173 1783 17.6 17.2 3.9 11.1 24.6 71.9 4.6 12.2 441 11.2 138 4.7 0.2 8.9 0.3 189 23.3
SCV-V82 175 1592 14.1 10.6 6.5 11.4 52.6 68.1 11.3 29.5 372 9.6 128 4.3 0.6 16.6 0.6 325 14.5
SCV-V94 119 1571 14.3 10.6 3.3 7.6 462 43.9 14.3 36.8 409 8.9 141 4.3 0.3 24.3 3.3 260 13.2
SCV-V95 182 1982 15.4 17.2 4.6 11.9 24.1 75.8 6.1 11.4 370 13.9 184 5.9 0.1 9.6 0.2 228 29.4
SCV-V102 115 1524 15.6 10.4 9.9 10.7 17.7 50.1 4.5 25.3 595 9.4 135 4.4 1.3 13.3 0.2 348 13.6
SCV-V115 56.2 558 11.0 8.6 1.6 4.4 9.2 25.2 1.7 27.6 825 3.3 30.5 1.7 0.2 6.8 0.2 69.9 4.8
SCV-V154 242 1779 13.6 18.2 6.7 14.0 131.7 75.7 30.8 16.2 315 10.1 119 4.7 0.5 8.6 0.4 349 13.9
SCV-V170 65.2 540 12.1 8.1 5.5 10.1 81.3 52.5 10.4 18.8 481 4.8 34.7 1.5 0.5 342 1.3 125 5.8
SCV-V171 193 1557 15.0 12.3 5.9 12.3 51.8 76.1 12.0 27.6 342 9.2 116 4.2 0.4 18.4 0.3 284 13.7
SCV-V177 107 1082 19.4 12.2 3.9 5.9 21.7 38.3 12.1 63.2 599 6.6 60.0 3.2 0.6 9.0 0.3 325 11.2
SCV-V182 163 1502 21.5 20.4 65.2 28.2 50.8 81.1 156.3 18.5 428 8.9 79.5 4.0 1.1 8.5 0.4 278 14.9
SCV-V191 57.1 324 8.4 7.4 14.9 6.6 27.2 22.7 9.5 18.4 417 2.5 21.8 0.9 0.8 273 0.3 295 3.3
SCV-V193 68.5 196 7.5 6.9 18.9 20.2 35.1 33.3 34.3 13.4 427 1.6 9.3 0.6 1.1 270 0.4 136 1.8
SCV-V194 80.4 1822 15.6 9.1 105 35.1 105 51.8 151.3 42.6 568 15.1 231 7.0 1.7 1504 2.0 360 34.9
SCV-V195 68.8 210 7.3 6.8 18.5 19.4 35.3 34.2 34.1 13.4 437 1.7 9.9 0.6 1.0 277 0.4 138 1.86
SCV-V210 99.8 307 8.1 6.4 52.5 40.0 8793 37.0 133 14.3 2.8 21.0 1.0 1.4 18503 18.3 92.9 3.39
SCV-V247 - Blue body 76.1 1182 12.9 9.6 321 112 20.9 49.3 501 41.0 8.3 97.3 3.5 2.6 305 237 15.9
SCV-V298 166 1654 16.5 9.0 3.7 11.8 55.2 59.3 12.6 24.5 593 13.7 187 4.8 0.5 6.7 277 27.5
SCV-V319 200 1995 17.1 22.3 12.8 20.2 44.1 82.4 24.3 20.6 337 10.9 118 5.4 0.3 8.7 0.5 226 15.9
SCV-V329 185 1960 16.0 16.9 3.5 9.4 19.5 53.3 4.2 25.3 303 10.5 131 4.9 0.2 8.3 0.2 193 14.8
SCV-V335 69.7 1415 15.5 10.5 56.5 19.1 12.1 41.2 202 48.7 524 10.6 153 4.2 1.6 44.2 0.0 289 26.5
SCV-V336 179 2183 20.5 22.1 16.1 20.2 42.5 96.4 9.7 24.6 412 14.4 145 6.5 1.3 68.2 0.5 332 25.7
SCV-V342 280 1791 23.2 21.3 7.5 18.5 69.6 88.6 18.7 10.3 322 11.0 103 4.9 0.5 6.7 0.5 208 18.5
SCV-V352 224 2174 18.7 24.5 8.1 16.4 44.0 66.7 13.9 18.5 324 11.4 124 5.7 0.3 8.2 238 16.3
SCV-V355 136 1154 13.3 9.8 3.4 6.9 17.5 42.8 5.9 28.2 556 7.5 100 3.2 0.3 8.2 0.1 200 16.4
SCV-V365 216 1939 17.5 17.1 4.3 11.6 20.0 62.5 4.9 14.1 436 13.7 193 5.7 0.1 18.7 0.4 217 28.3
SCV-V380 228 1888 15.0 19.4 6.1 13.3 57.5 68.5 16.6 17.4 327 10.9 133 4.7 0.4 7.8 236 15.4
SCV-V390 243 2299 27.0 26.7 9.0 17.0 160 81.9 25.8 19.3 405 15.1 165 5.9 0.6 19.1 3.3 387 26.9
SCV-V396 180 1941 16.5 17.0 76.7 38.3 15.6 85.3 77.0 16.6 347 13.2 140 6.0 1.2 10.3 0.4 278 26.0
SCV-V404 52.8 903 8.2 7.1 3.6 4.8 12.3 20.4 3.4 37.4 556 6.1 225 2.8 2.0 7.8 0.7 128 9.4
SCV-V408 51.5 407 10.1 6.9 3.9 5.3 13.1 39.9 4.2 21.0 587 2.8 25.3 1.2 1.0 7.5 0.7 169 4.2
SCV-V420 84.2 1141 12.6 10.6 67.4 29.7 64.8 40.8 111 21.5 338 5.8 67.5 6.6 3.2 216 0.6 181 11.3
SCV-V422 98.9 493 12.0 7.1 14.1 11.9 11.8 66.6 14.2 7.7 826 3.9 29.1 1.7 1.6 16.7 0.8 235 5.4
SCV-V423 237 2317 26.8 27.3 8.9 16.8 162 81.9 24.9 19.3 408 15.2 165 5.9 0.5 17.5 2.0 389 27.5
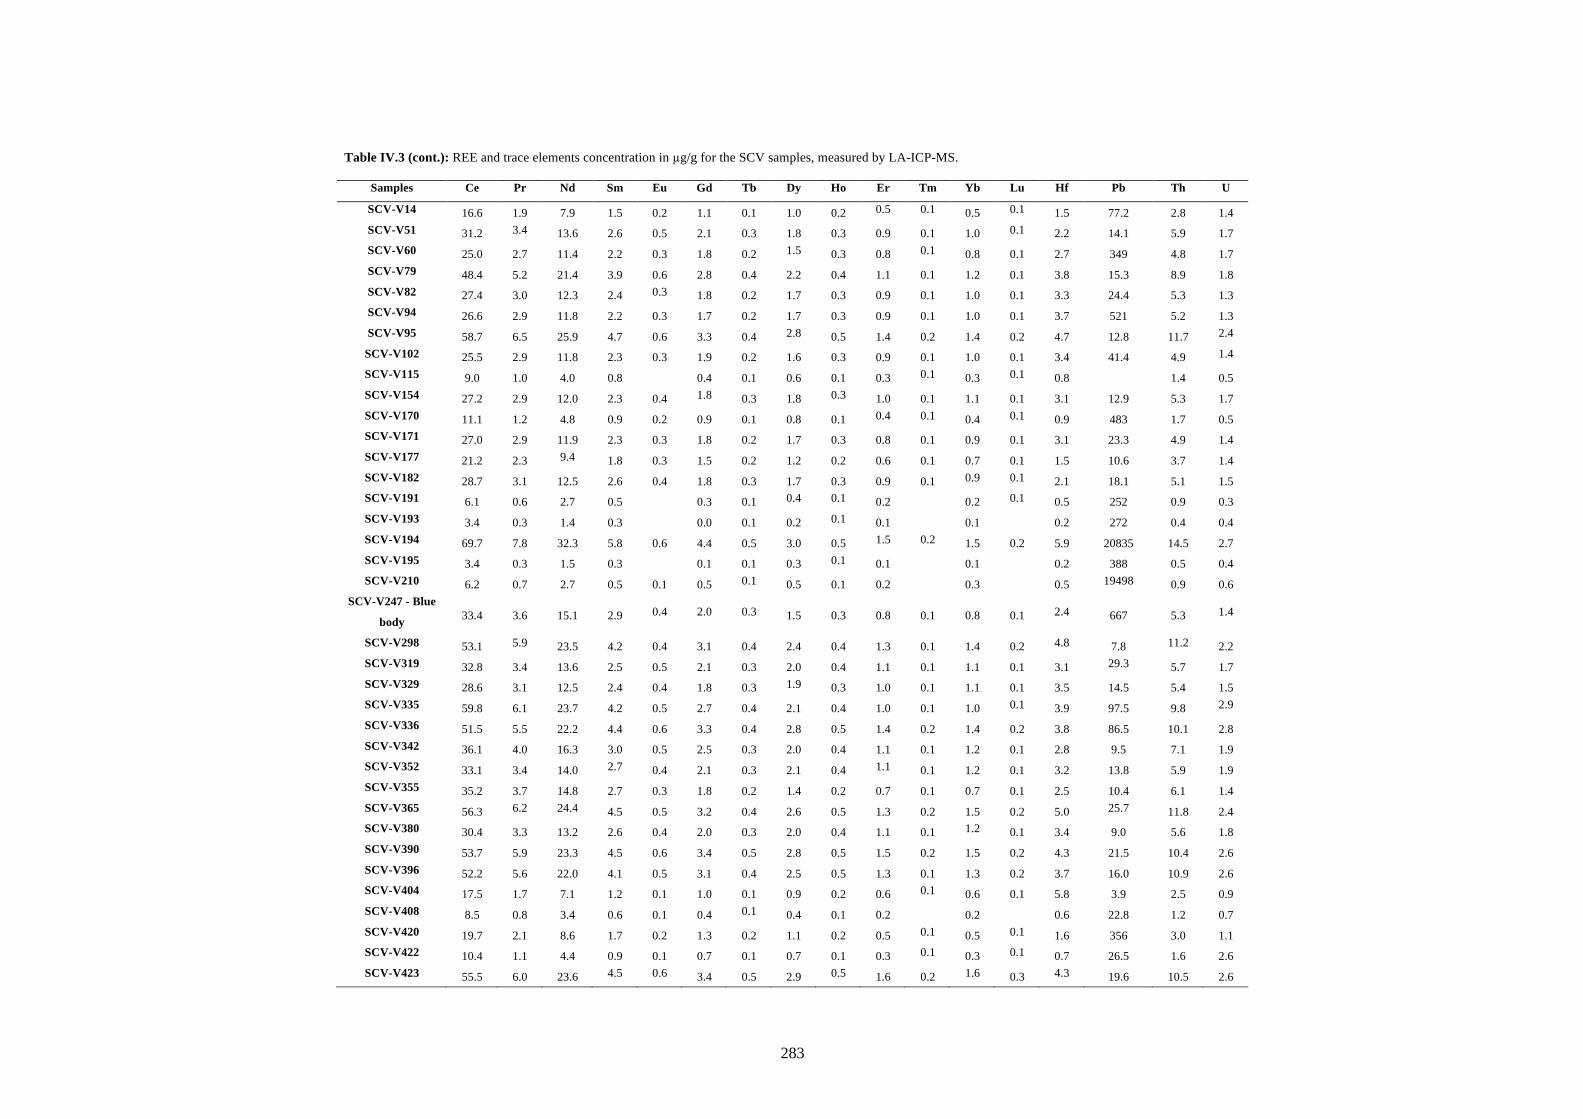
283
Table IV.3 (cont.): REE and trace elements concentration in µg/g for the SCV samples, measured by LA-ICP-MS.
Samples Ce Pr Nd Sm Eu Gd Tb Dy Ho Er Tm Yb Lu Hf Pb Th U
SCV-V14 16.6 1.9 7.9 1.5 0.2 1.1 0.1 1.0 0.2 0.5 0.1 0.5 0.1 1.5 77.2 2.8 1.4 SCV-V51 31.2 3.4 13.6 2.6 0.5 2.1 0.3 1.8 0.3 0.9 0.1 1.0 0.1 2.2 14.1 5.9 1.7 SCV-V60 25.0 2.7 11.4 2.2 0.3 1.8 0.2 1.5 0.3 0.8 0.1 0.8 0.1 2.7 349 4.8 1.7 SCV-V79 48.4 5.2 21.4 3.9 0.6 2.8 0.4 2.2 0.4 1.1 0.1 1.2 0.1 3.8 15.3 8.9 1.8 SCV-V82 27.4 3.0 12.3 2.4 0.3 1.8 0.2 1.7 0.3 0.9 0.1 1.0 0.1 3.3 24.4 5.3 1.3 SCV-V94 26.6 2.9 11.8 2.2 0.3 1.7 0.2 1.7 0.3 0.9 0.1 1.0 0.1 3.7 521 5.2 1.3 SCV-V95 58.7 6.5 25.9 4.7 0.6 3.3 0.4 2.8 0.5 1.4 0.2 1.4 0.2 4.7 12.8 11.7 2.4
SCV-V102 25.5 2.9 11.8 2.3 0.3 1.9 0.2 1.6 0.3 0.9 0.1 1.0 0.1 3.4 41.4 4.9 1.4
SCV-V115 9.0 1.0 4.0 0.8 0.4 0.1 0.6 0.1 0.3 0.1 0.3 0.1 0.8 1.4 0.5 SCV-V154 27.2 2.9 12.0 2.3 0.4 1.8 0.3 1.8 0.3 1.0 0.1 1.1 0.1 3.1 12.9 5.3 1.7 SCV-V170 11.1 1.2 4.8 0.9 0.2 0.9 0.1 0.8 0.1 0.4 0.1 0.4 0.1 0.9 483 1.7 0.5 SCV-V171 27.0 2.9 11.9 2.3 0.3 1.8 0.2 1.7 0.3 0.8 0.1 0.9 0.1 3.1 23.3 4.9 1.4 SCV-V177 21.2 2.3 9.4 1.8 0.3 1.5 0.2 1.2 0.2 0.6 0.1 0.7 0.1 1.5 10.6 3.7 1.4 SCV-V182 28.7 3.1 12.5 2.6 0.4 1.8 0.3 1.7 0.3 0.9 0.1 0.9 0.1 2.1 18.1 5.1 1.5 SCV-V191 6.1 0.6 2.7 0.5 0.3 0.1 0.4 0.1 0.2 0.2 0.1 0.5 252 0.9 0.3 SCV-V193 3.4 0.3 1.4 0.3 0.0 0.1 0.2 0.1 0.1 0.1 0.2 272 0.4 0.4 SCV-V194 69.7 7.8 32.3 5.8 0.6 4.4 0.5 3.0 0.5 1.5 0.2 1.5 0.2 5.9 20835 14.5 2.7 SCV-V195 3.4 0.3 1.5 0.3 0.1 0.1 0.3 0.1 0.1 0.1 0.2 388 0.5 0.4 SCV-V210 6.2 0.7 2.7 0.5 0.1 0.5 0.1 0.5 0.1 0.2 0.3 0.5 19498 0.9 0.6
SCV-V247 - Blue
body 33.4 3.6 15.1 2.9 0.4 2.0 0.3 1.5 0.3 0.8 0.1 0.8 0.1 2.4 667 5.3 1.4
SCV-V298 53.1 5.9 23.5 4.2 0.4 3.1 0.4 2.4 0.4 1.3 0.1 1.4 0.2 4.8 7.8 11.2 2.2 SCV-V319 32.8 3.4 13.6 2.5 0.5 2.1 0.3 2.0 0.4 1.1 0.1 1.1 0.1 3.1 29.3 5.7 1.7 SCV-V329 28.6 3.1 12.5 2.4 0.4 1.8 0.3 1.9 0.3 1.0 0.1 1.1 0.1 3.5 14.5 5.4 1.5 SCV-V335 59.8 6.1 23.7 4.2 0.5 2.7 0.4 2.1 0.4 1.0 0.1 1.0 0.1 3.9 97.5 9.8 2.9
SCV-V336 51.5 5.5 22.2 4.4 0.6 3.3 0.4 2.8 0.5 1.4 0.2 1.4 0.2 3.8 86.5 10.1 2.8 SCV-V342 36.1 4.0 16.3 3.0 0.5 2.5 0.3 2.0 0.4 1.1 0.1 1.2 0.1 2.8 9.5 7.1 1.9 SCV-V352 33.1 3.4 14.0 2.7 0.4 2.1 0.3 2.1 0.4 1.1 0.1 1.2 0.1 3.2 13.8 5.9 1.9 SCV-V355 35.2 3.7 14.8 2.7 0.3 1.8 0.2 1.4 0.2 0.7 0.1 0.7 0.1 2.5 10.4 6.1 1.4 SCV-V365 56.3 6.2 24.4 4.5 0.5 3.2 0.4 2.6 0.5 1.3 0.2 1.5 0.2 5.0 25.7 11.8 2.4 SCV-V380 30.4 3.3 13.2 2.6 0.4 2.0 0.3 2.0 0.4 1.1 0.1 1.2 0.1 3.4 9.0 5.6 1.8 SCV-V390 53.7 5.9 23.3 4.5 0.6 3.4 0.5 2.8 0.5 1.5 0.2 1.5 0.2 4.3 21.5 10.4 2.6 SCV-V396 52.2 5.6 22.0 4.1 0.5 3.1 0.4 2.5 0.5 1.3 0.1 1.3 0.2 3.7 16.0 10.9 2.6 SCV-V404 17.5 1.7 7.1 1.2 0.1 1.0 0.1 0.9 0.2 0.6 0.1 0.6 0.1 5.8 3.9 2.5 0.9 SCV-V408 8.5 0.8 3.4 0.6 0.1 0.4 0.1 0.4 0.1 0.2 0.2 0.6 22.8 1.2 0.7 SCV-V420 19.7 2.1 8.6 1.7 0.2 1.3 0.2 1.1 0.2 0.5 0.1 0.5 0.1 1.6 356 3.0 1.1 SCV-V422 10.4 1.1 4.4 0.9 0.1 0.7 0.1 0.7 0.1 0.3 0.1 0.3 0.1 0.7 26.5 1.6 2.6 SCV-V423 55.5 6.0 23.6 4.5 0.6 3.4 0.5 2.9 0.5 1.6 0.2 1.6 0.3 4.3 19.6 10.5 2.6

284
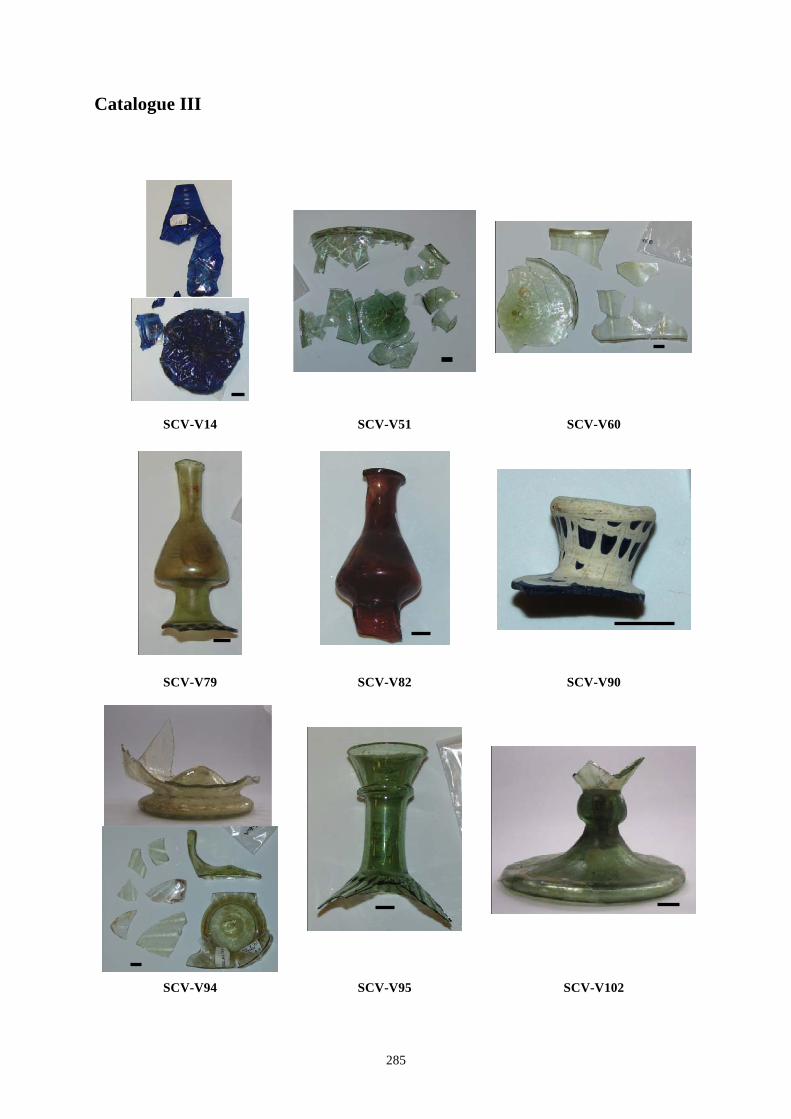
! 285!
Catalogue III !!
!
!
!!
!
!!
SCV-V14 SCV-V51 SCV-V60!!
!!
!
!
!!
!!
SCV-V79! SCV-V82! SCV-V90!
!
!!
!
!!!
!!
SCV-V94 SCV-V95 SCV-V102!
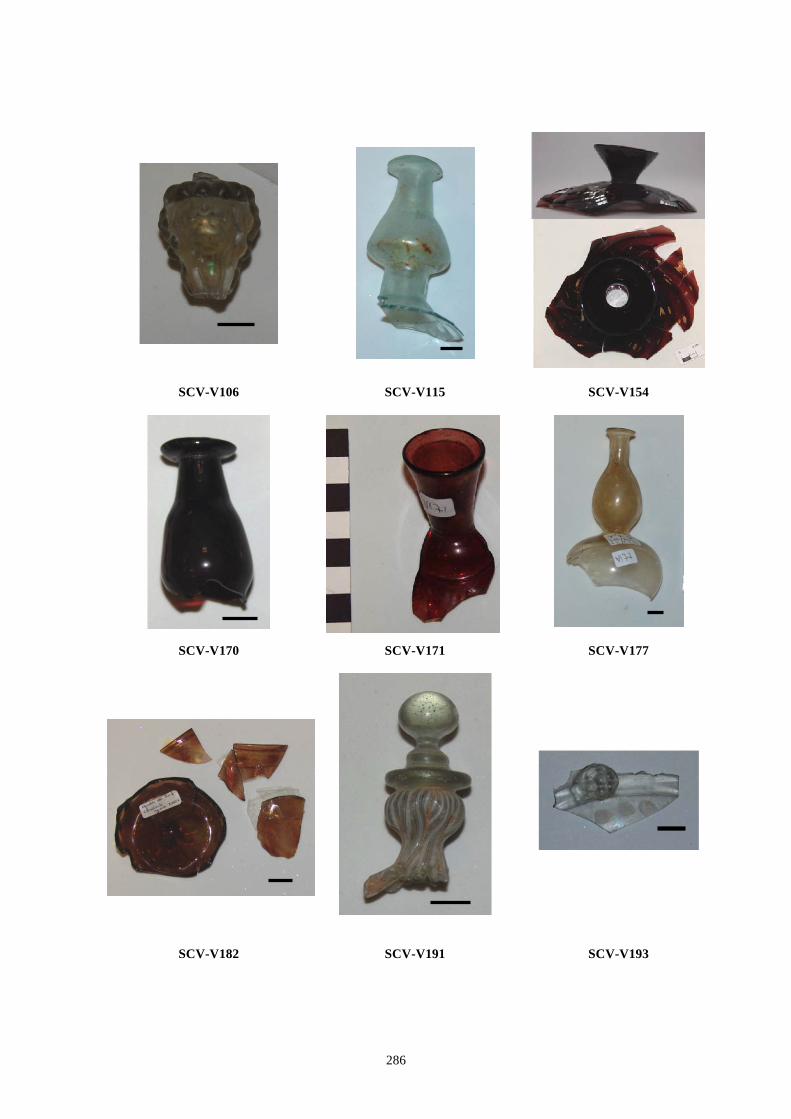
! 286!
SCV-V106 SCV-V115 SCV-V154
SCV-V170 SCV-V171 SCV-V177
SCV-V182 SCV-V191 SCV-V193
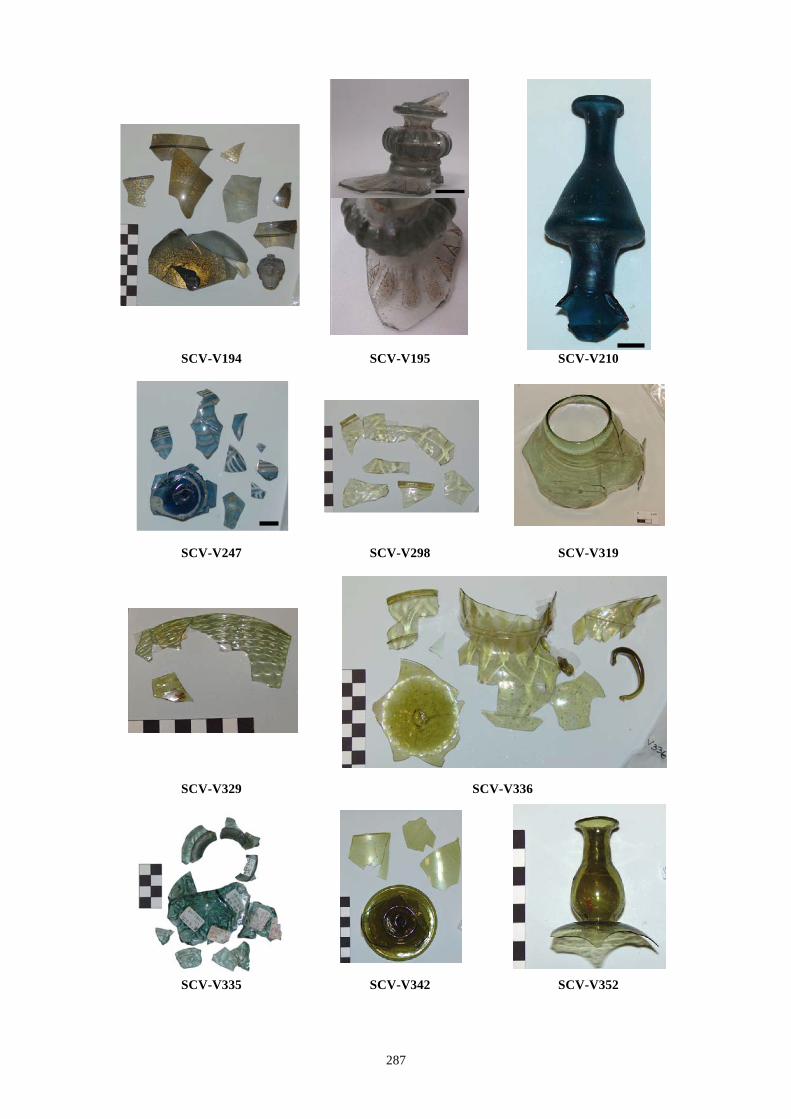
! 287!
SCV-V194 SCV-V195 SCV-V210
SCV-V247 SCV-V298 SCV-V319
SCV-V329 SCV-V336
SCV-V335 SCV-V342 SCV-V352
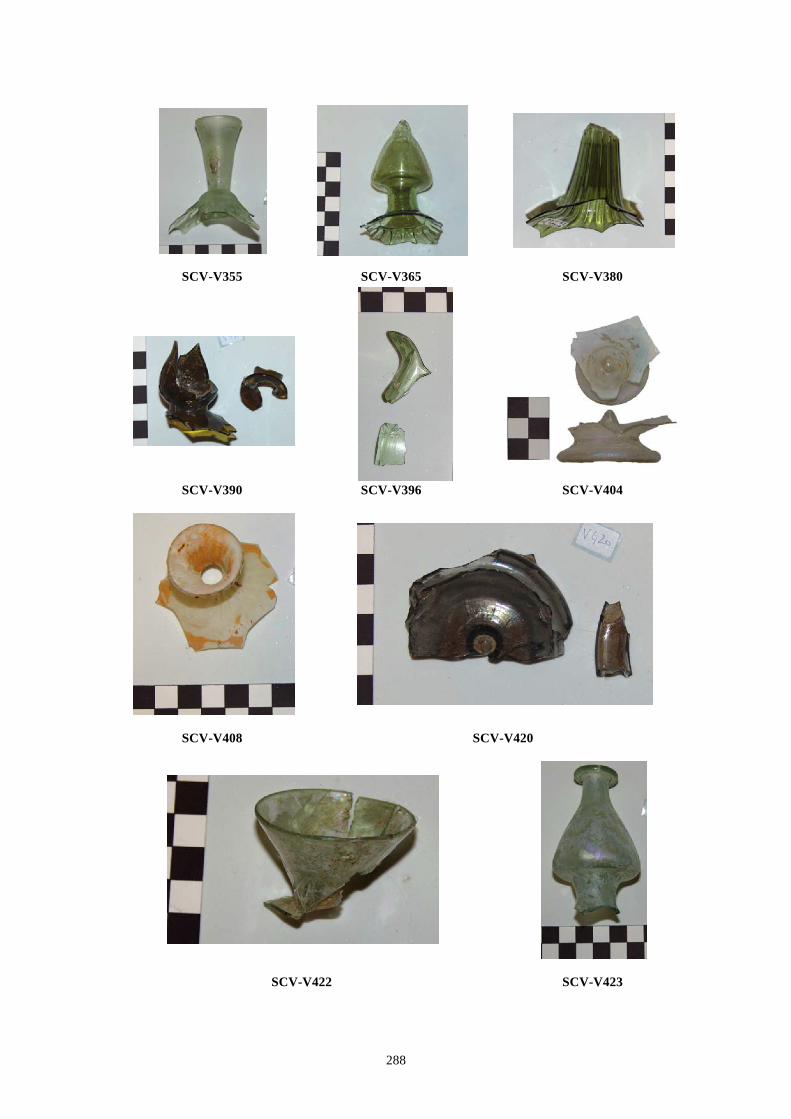
! 288!
SCV-V355 SCV-V365 SCV-V380
SCV-V390 SCV-V396 SCV-V404
SCV-V408 SCV-V420
SCV-V422 SCV-V423
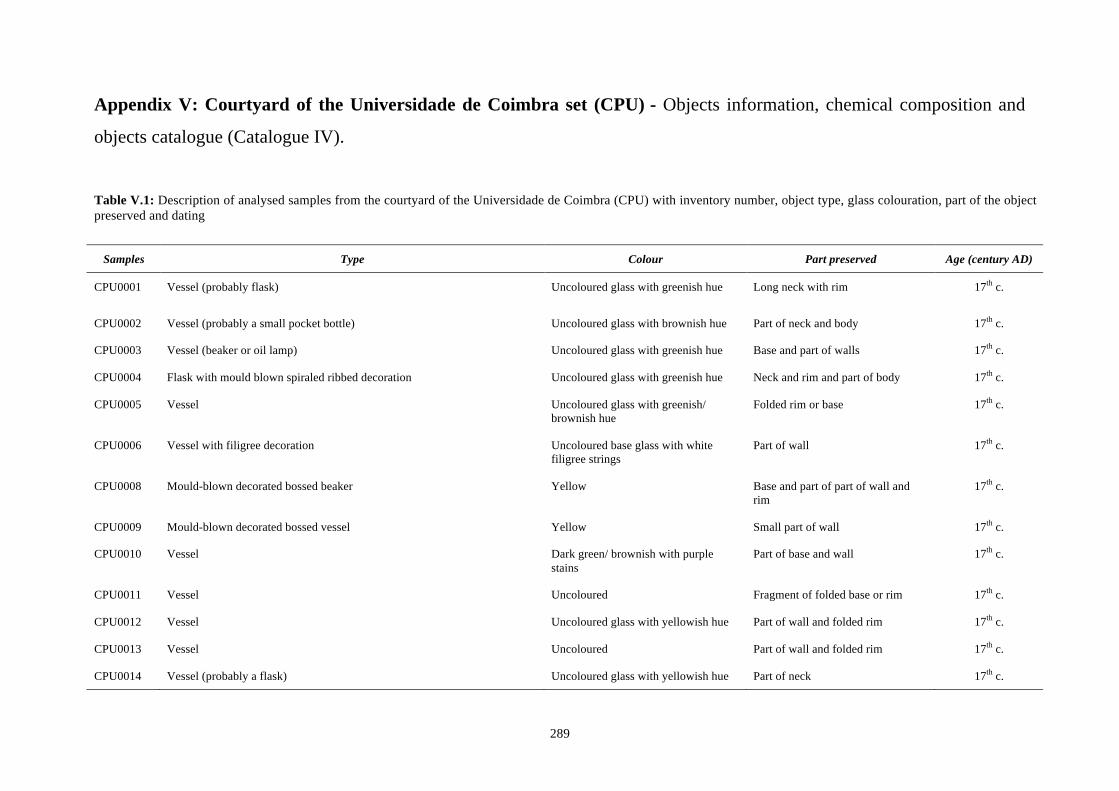
289
Appendix V: Courtyard of the Universidade de Coimbra set (CPU) - Objects information, chemical composition and
objects catalogue (Catalogue IV).
Table V.1: Description of analysed samples from the courtyard of the Universidade de Coimbra (CPU) with inventory number, object type, glass colouration, part of the object preserved and dating
Samples Type Colour Part preserved Age (century AD)
CPU0001 Vessel (probably flask) Uncoloured glass with greenish hue Long neck with rim 17th c.
CPU0002 Vessel (probably a small pocket bottle) Uncoloured glass with brownish hue Part of neck and body 17th c.
CPU0003 Vessel (beaker or oil lamp) Uncoloured glass with greenish hue Base and part of walls 17th c.
CPU0004 Flask with mould blown spiraled ribbed decoration Uncoloured glass with greenish hue Neck and rim and part of body 17th c.
CPU0005 Vessel Uncoloured glass with greenish/ brownish hue
Folded rim or base 17th c.
CPU0006 Vessel with filigree decoration Uncoloured base glass with white filigree strings
Part of wall 17th c.
CPU0008 Mould-blown decorated bossed beaker Yellow Base and part of part of wall and rim
17th c.
CPU0009 Mould-blown decorated bossed vessel Yellow Small part of wall 17th c.
CPU0010 Vessel Dark green/ brownish with purple stains
Part of base and wall 17th c.
CPU0011 Vessel Uncoloured Fragment of folded base or rim 17th c.
CPU0012 Vessel Uncoloured glass with yellowish hue Part of wall and folded rim 17th c.
CPU0013 Vessel Uncoloured Part of wall and folded rim 17th c.
CPU0014 Vessel (probably a flask) Uncoloured glass with yellowish hue Part of neck 17th c.
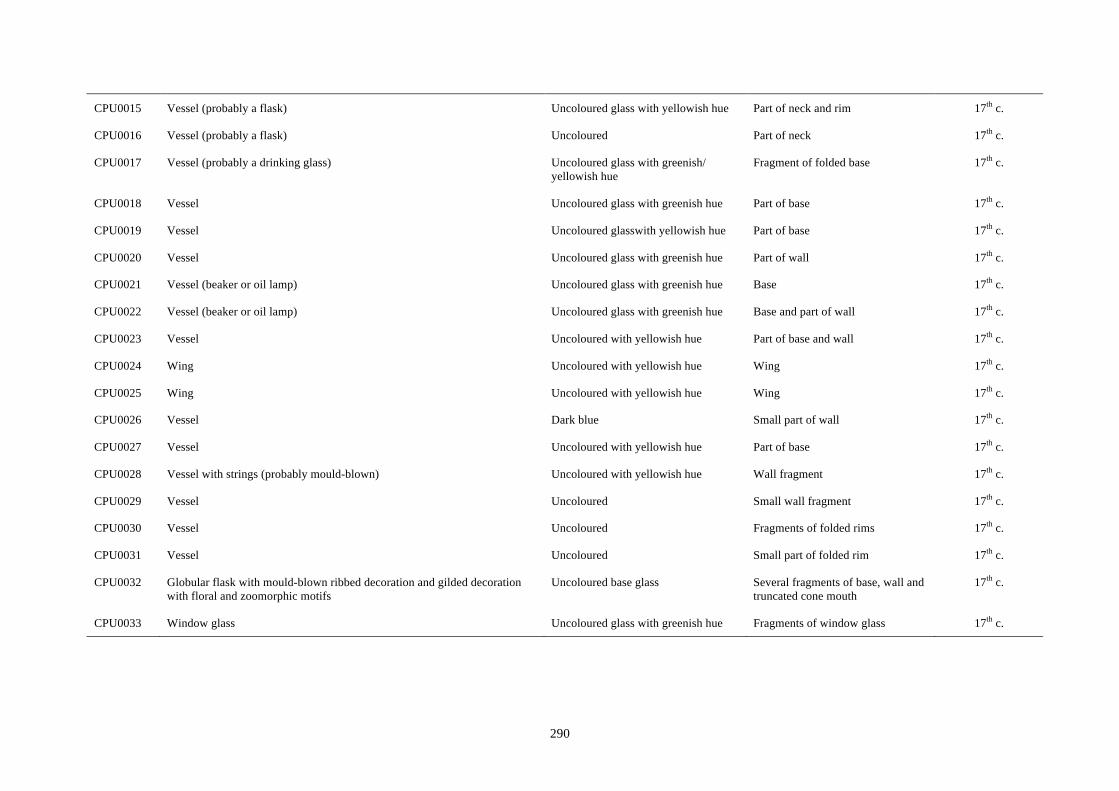
290
CPU0015 Vessel (probably a flask) Uncoloured glass with yellowish hue Part of neck and rim 17th c.
CPU0016 Vessel (probably a flask) Uncoloured Part of neck 17th c.
CPU0017 Vessel (probably a drinking glass) Uncoloured glass with greenish/ yellowish hue
Fragment of folded base 17th c.
CPU0018 Vessel Uncoloured glass with greenish hue Part of base 17th c.
CPU0019 Vessel Uncoloured glasswith yellowish hue Part of base 17th c.
CPU0020 Vessel Uncoloured glass with greenish hue Part of wall 17th c.
CPU0021 Vessel (beaker or oil lamp) Uncoloured glass with greenish hue Base 17th c.
CPU0022 Vessel (beaker or oil lamp) Uncoloured glass with greenish hue Base and part of wall 17th c.
CPU0023 Vessel Uncoloured with yellowish hue Part of base and wall 17th c.
CPU0024 Wing Uncoloured with yellowish hue Wing 17th c.
CPU0025 Wing Uncoloured with yellowish hue Wing 17th c.
CPU0026 Vessel Dark blue Small part of wall 17th c.
CPU0027 Vessel Uncoloured with yellowish hue Part of base 17th c.
CPU0028 Vessel with strings (probably mould-blown) Uncoloured with yellowish hue Wall fragment 17th c.
CPU0029 Vessel Uncoloured Small wall fragment 17th c.
CPU0030 Vessel Uncoloured Fragments of folded rims 17th c.
CPU0031 Vessel Uncoloured Small part of folded rim 17th c.
CPU0032 Globular flask with mould-blown ribbed decoration and gilded decoration with floral and zoomorphic motifs
Uncoloured base glass Several fragments of base, wall and truncated cone mouth
17th c.
CPU0033 Window glass Uncoloured glass with greenish hue Fragments of window glass 17th c.
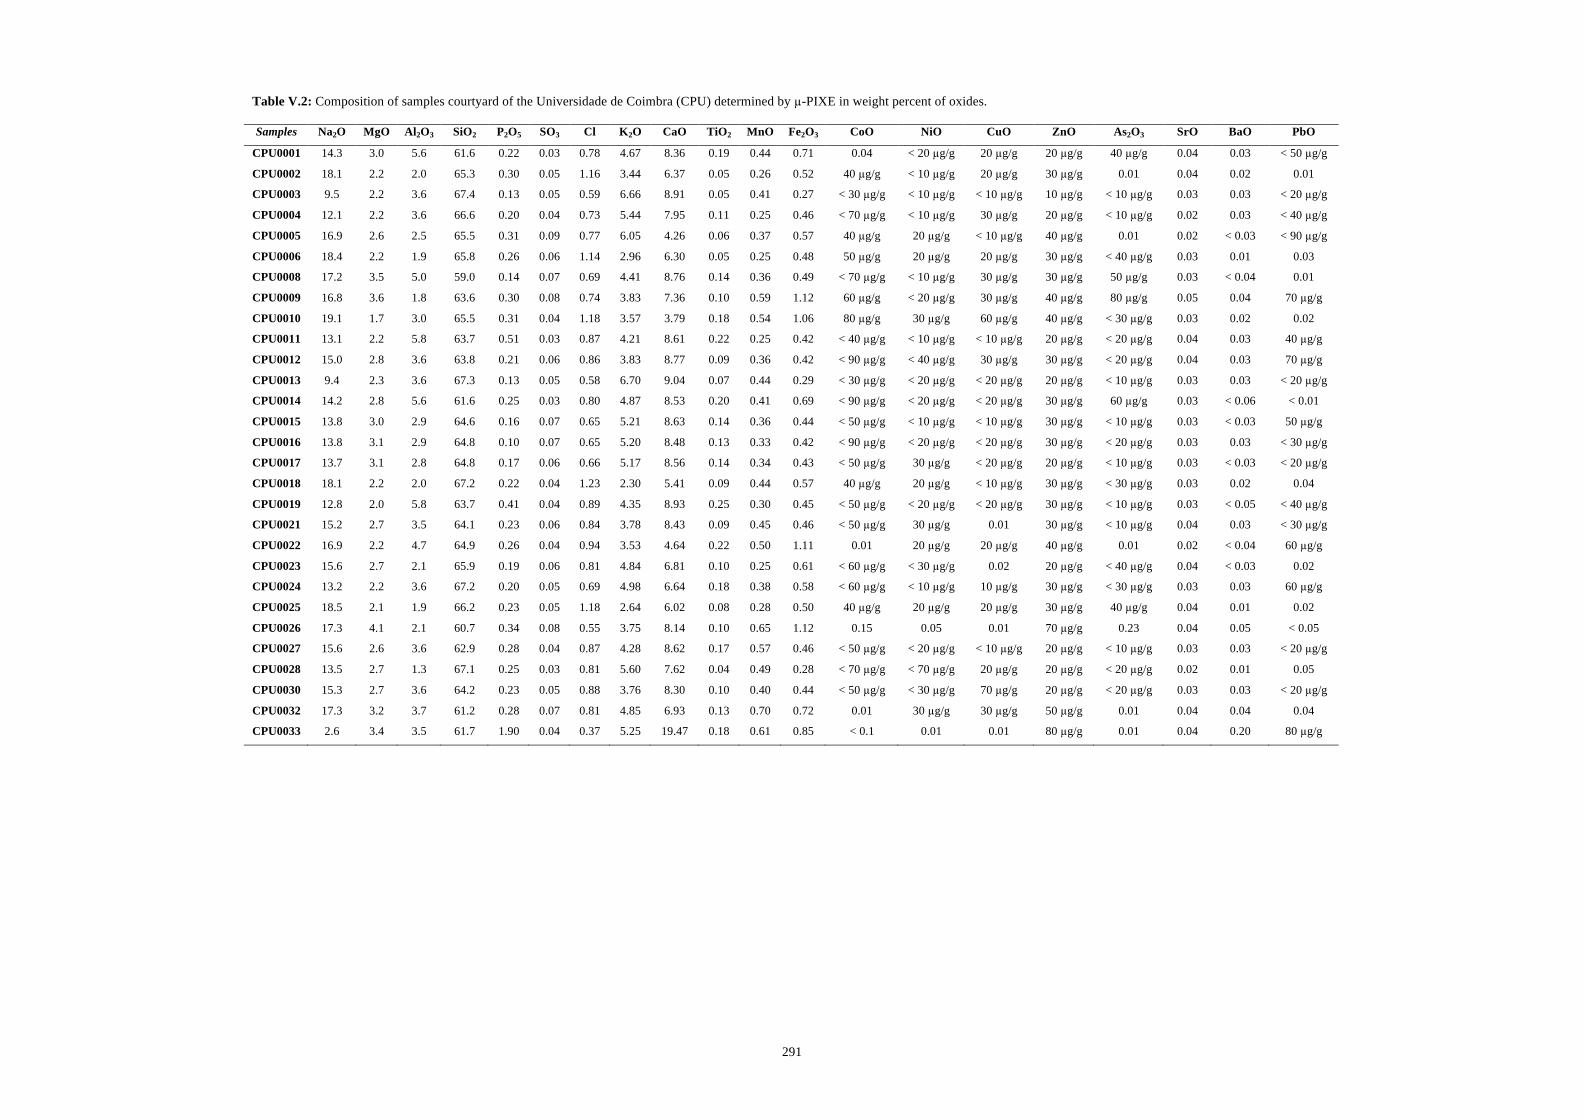
291
Table V.2: Composition of samples courtyard of the Universidade de Coimbra (CPU) determined by µ-PIXE in weight percent of oxides. Samples Na2O MgO Al2O3 SiO2 P2O5 SO3 Cl K2O CaO TiO2 MnO Fe2O3 CoO NiO CuO ZnO As2O3 SrO BaO PbO
CPU0001 14.3 3.0 5.6 61.6 0.22 0.03 0.78 4.67 8.36 0.19 0.44 0.71 0.04 < 20 µg/g 20 µg/g 20 µg/g 40 µg/g 0.04 0.03 < 50 µg/g CPU0002 18.1 2.2 2.0 65.3 0.30 0.05 1.16 3.44 6.37 0.05 0.26 0.52 40 µg/g < 10 µg/g 20 µg/g 30 µg/g 0.01 0.04 0.02 0.01 CPU0003 9.5 2.2 3.6 67.4 0.13 0.05 0.59 6.66 8.91 0.05 0.41 0.27 < 30 µg/g < 10 µg/g < 10 µg/g 10 µg/g < 10 µg/g 0.03 0.03 < 20 µg/g
CPU0004 12.1 2.2 3.6 66.6 0.20 0.04 0.73 5.44 7.95 0.11 0.25 0.46 < 70 µg/g < 10 µg/g 30 µg/g 20 µg/g < 10 µg/g 0.02 0.03 < 40 µg/g CPU0005 16.9 2.6 2.5 65.5 0.31 0.09 0.77 6.05 4.26 0.06 0.37 0.57 40 µg/g 20 µg/g < 10 µg/g 40 µg/g 0.01 0.02 < 0.03 < 90 µg/g CPU0006 18.4 2.2 1.9 65.8 0.26 0.06 1.14 2.96 6.30 0.05 0.25 0.48 50 µg/g 20 µg/g 20 µg/g 30 µg/g < 40 µg/g 0.03 0.01 0.03 CPU0008 17.2 3.5 5.0 59.0 0.14 0.07 0.69 4.41 8.76 0.14 0.36 0.49 < 70 µg/g < 10 µg/g 30 µg/g 30 µg/g 50 µg/g 0.03 < 0.04 0.01 CPU0009 16.8 3.6 1.8 63.6 0.30 0.08 0.74 3.83 7.36 0.10 0.59 1.12 60 µg/g < 20 µg/g 30 µg/g 40 µg/g 80 µg/g 0.05 0.04 70 µg/g CPU0010 19.1 1.7 3.0 65.5 0.31 0.04 1.18 3.57 3.79 0.18 0.54 1.06 80 µg/g 30 µg/g 60 µg/g 40 µg/g < 30 µg/g 0.03 0.02 0.02 CPU0011 13.1 2.2 5.8 63.7 0.51 0.03 0.87 4.21 8.61 0.22 0.25 0.42 < 40 µg/g < 10 µg/g < 10 µg/g 20 µg/g < 20 µg/g 0.04 0.03 40 µg/g CPU0012 15.0 2.8 3.6 63.8 0.21 0.06 0.86 3.83 8.77 0.09 0.36 0.42 < 90 µg/g < 40 µg/g 30 µg/g 30 µg/g < 20 µg/g 0.04 0.03 70 µg/g
CPU0013 9.4 2.3 3.6 67.3 0.13 0.05 0.58 6.70 9.04 0.07 0.44 0.29 < 30 µg/g < 20 µg/g < 20 µg/g 20 µg/g < 10 µg/g 0.03 0.03 < 20 µg/g CPU0014 14.2 2.8 5.6 61.6 0.25 0.03 0.80 4.87 8.53 0.20 0.41 0.69 < 90 µg/g < 20 µg/g < 20 µg/g 30 µg/g 60 µg/g 0.03 < 0.06 < 0.01 CPU0015 13.8 3.0 2.9 64.6 0.16 0.07 0.65 5.21 8.63 0.14 0.36 0.44 < 50 µg/g < 10 µg/g < 10 µg/g 30 µg/g < 10 µg/g 0.03 < 0.03 50 µg/g CPU0016 13.8 3.1 2.9 64.8 0.10 0.07 0.65 5.20 8.48 0.13 0.33 0.42 < 90 µg/g < 20 µg/g < 20 µg/g 30 µg/g < 20 µg/g 0.03 0.03 < 30 µg/g CPU0017 13.7 3.1 2.8 64.8 0.17 0.06 0.66 5.17 8.56 0.14 0.34 0.43 < 50 µg/g 30 µg/g < 20 µg/g 20 µg/g < 10 µg/g 0.03 < 0.03 < 20 µg/g CPU0018 18.1 2.2 2.0 67.2 0.22 0.04 1.23 2.30 5.41 0.09 0.44 0.57 40 µg/g 20 µg/g < 10 µg/g 30 µg/g < 30 µg/g 0.03 0.02 0.04
CPU0019 12.8 2.0 5.8 63.7 0.41 0.04 0.89 4.35 8.93 0.25 0.30 0.45 < 50 µg/g < 20 µg/g < 20 µg/g 30 µg/g < 10 µg/g 0.03 < 0.05 < 40 µg/g CPU0021 15.2 2.7 3.5 64.1 0.23 0.06 0.84 3.78 8.43 0.09 0.45 0.46 < 50 µg/g 30 µg/g 0.01 30 µg/g < 10 µg/g 0.04 0.03 < 30 µg/g CPU0022 16.9 2.2 4.7 64.9 0.26 0.04 0.94 3.53 4.64 0.22 0.50 1.11 0.01 20 µg/g 20 µg/g 40 µg/g 0.01 0.02 < 0.04 60 µg/g
CPU0023 15.6 2.7 2.1 65.9 0.19 0.06 0.81 4.84 6.81 0.10 0.25 0.61 < 60 µg/g < 30 µg/g 0.02 20 µg/g < 40 µg/g 0.04 < 0.03 0.02
CPU0024 13.2 2.2 3.6 67.2 0.20 0.05 0.69 4.98 6.64 0.18 0.38 0.58 < 60 µg/g < 10 µg/g 10 µg/g 30 µg/g < 30 µg/g 0.03 0.03 60 µg/g
CPU0025 18.5 2.1 1.9 66.2 0.23 0.05 1.18 2.64 6.02 0.08 0.28 0.50 40 µg/g 20 µg/g 20 µg/g 30 µg/g 40 µg/g 0.04 0.01 0.02
CPU0026 17.3 4.1 2.1 60.7 0.34 0.08 0.55 3.75 8.14 0.10 0.65 1.12 0.15 0.05 0.01 70 µg/g 0.23 0.04 0.05 < 0.05
CPU0027 15.6 2.6 3.6 62.9 0.28 0.04 0.87 4.28 8.62 0.17 0.57 0.46 < 50 µg/g < 20 µg/g < 10 µg/g 20 µg/g < 10 µg/g 0.03 0.03 < 20 µg/g CPU0028 13.5 2.7 1.3 67.1 0.25 0.03 0.81 5.60 7.62 0.04 0.49 0.28 < 70 µg/g < 70 µg/g 20 µg/g 20 µg/g < 20 µg/g 0.02 0.01 0.05 CPU0030 15.3 2.7 3.6 64.2 0.23 0.05 0.88 3.76 8.30 0.10 0.40 0.44 < 50 µg/g < 30 µg/g 70 µg/g 20 µg/g < 20 µg/g 0.03 0.03 < 20 µg/g CPU0032 17.3 3.2 3.7 61.2 0.28 0.07 0.81 4.85 6.93 0.13 0.70 0.72 0.01 30 µg/g 30 µg/g 50 µg/g 0.01 0.04 0.04 0.04 CPU0033 2.6 3.4 3.5 61.7 1.90 0.04 0.37 5.25 19.47 0.18 0.61 0.85 < 0.1 0.01 0.01 80 µg/g 0.01 0.04 0.20 80 µg/g

292
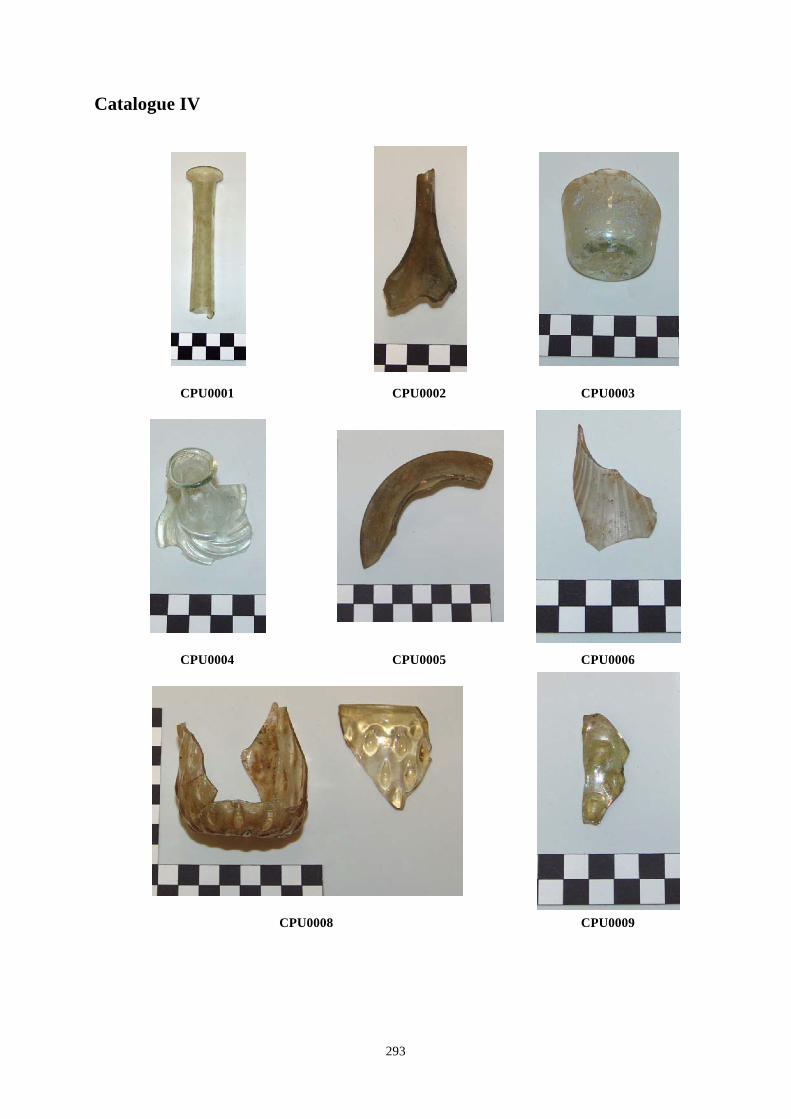
! 293!
Catalogue IV!!
!
!! ! !
CPU0001 CPU0002 CPU0003 !
!!
!!
CPU0004 CPU0005 CPU0006 !
!! !
CPU0008 CPU0009 !!!
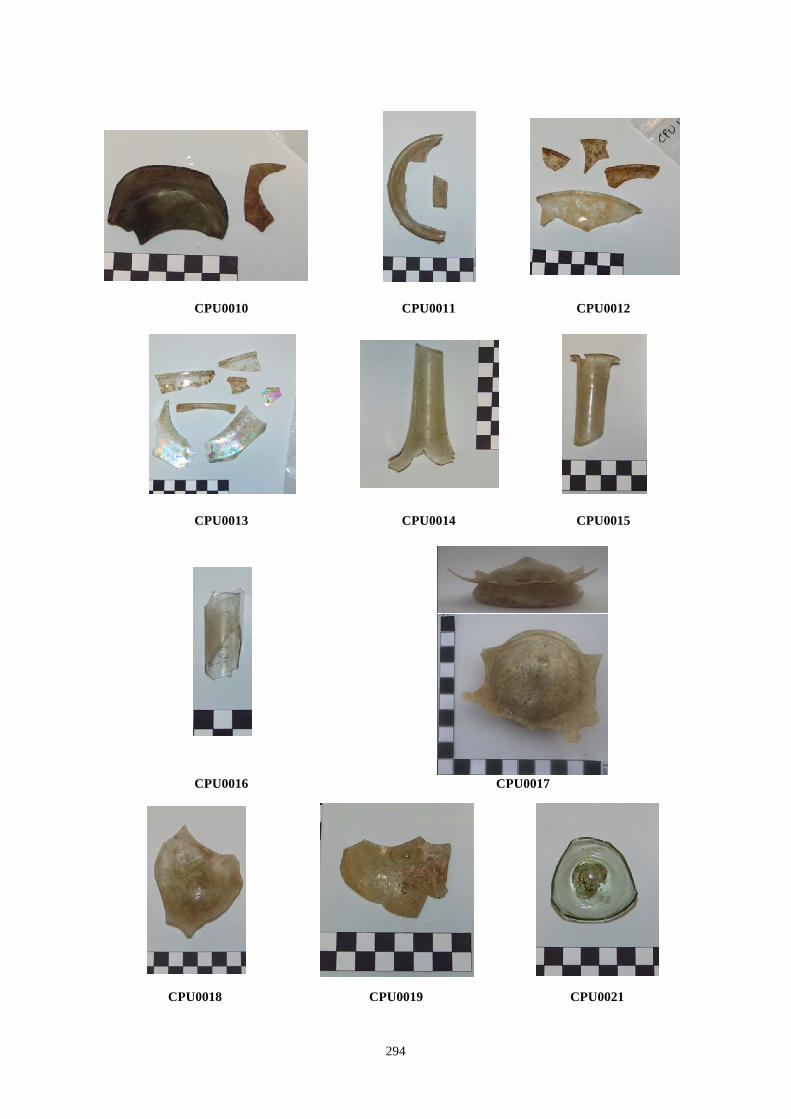
! 294!
!!
!!
!
!!
!
CPU0010 CPU0011 CPU0012 !
!!
! !CPU0013 CPU0014 CPU0015
!
!!
!
!CPU0016 CPU0017
CPU0018 CPU0019 CPU0021 !
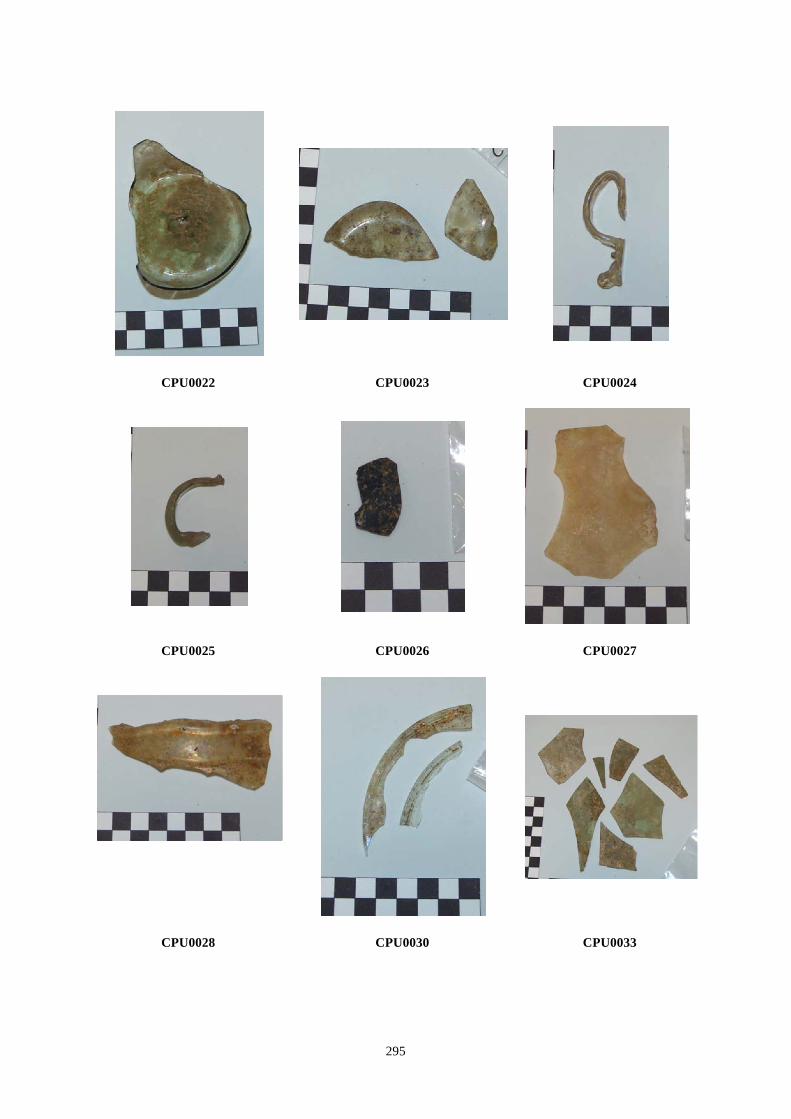
! 295!
!
!!
!!
CPU0022 CPU0023 CPU0024
! !
!
!!
CPU0025 CPU0026 CPU0027 !!
!!
!
!!
!
CPU0028 CPU0030 CPU0033 !!
!
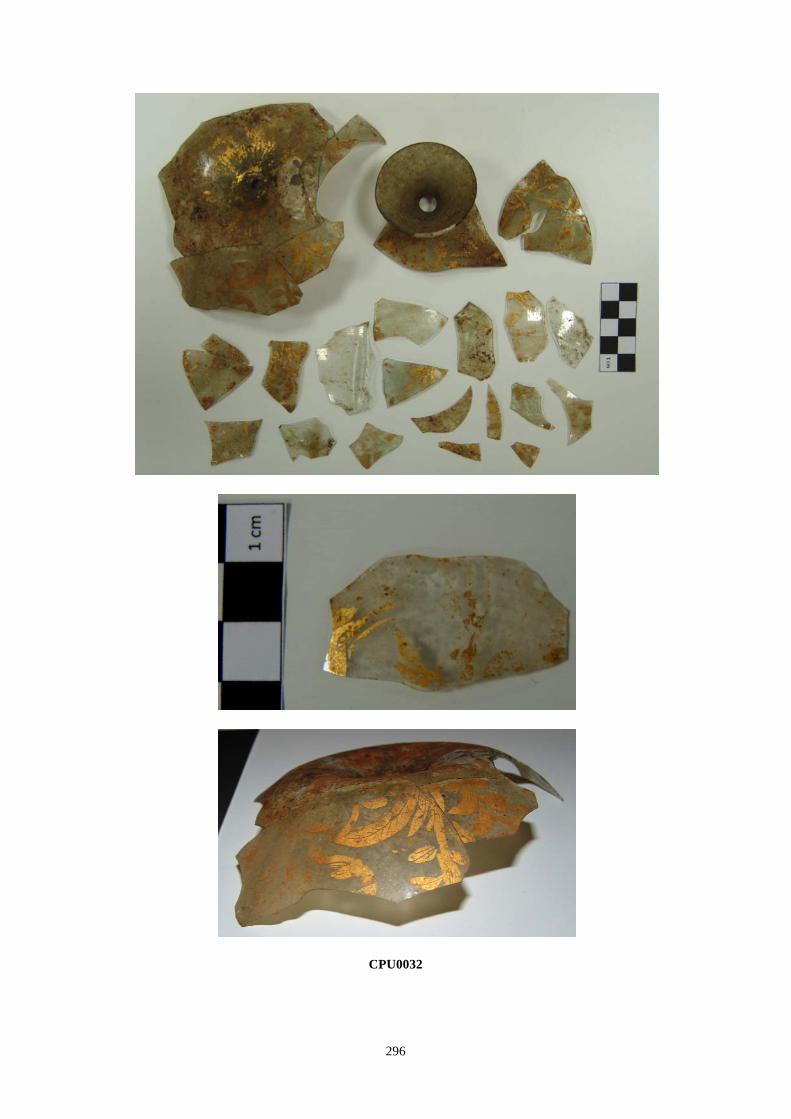
! 296!
!!
!!
!!
CPU0032 !
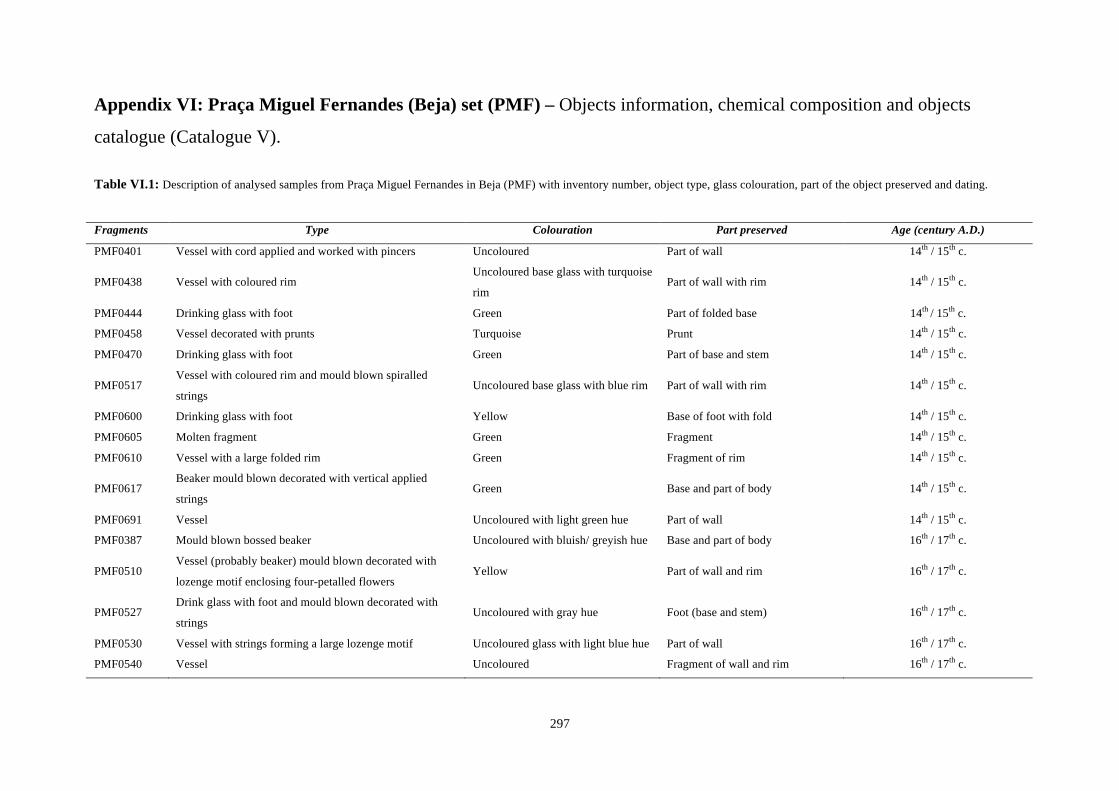
! 297!
Appendix VI: Praça Miguel Fernandes (Beja) set (PMF) – Objects information, chemical composition and objects
catalogue (Catalogue V).
Table VI.1: Description of analysed samples from Praça Miguel Fernandes in Beja (PMF) with inventory number, object type, glass colouration, part of the object preserved and dating.
Fragments Type Colouration Part preserved Age (century A.D.)
PMF0401 Vessel with cord applied and worked with pincers Uncoloured Part of wall 14th / 15th c.
PMF0438 Vessel with coloured rim Uncoloured base glass with turquoise
rim Part of wall with rim 14th / 15th c.!
PMF0444 Drinking glass with foot Green Part of folded base 14th / 15th c.!PMF0458 Vessel decorated with prunts Turquoise Prunt 14th / 15th c.!PMF0470 Drinking glass with foot Green Part of base and stem 14th / 15th c.!PMF0517
Vessel with coloured rim and mould blown spiralled
strings Uncoloured base glass with blue rim Part of wall with rim 14th / 15th c.!
PMF0600 Drinking glass with foot Yellow Base of foot with fold 14th / 15th c.!PMF0605 Molten fragment Green Fragment 14th / 15th c.!PMF0610 Vessel with a large folded rim Green Fragment of rim 14th / 15th c.!PMF0617
Beaker mould blown decorated with vertical applied
strings Green Base and part of body 14th / 15th c.!
PMF0691 Vessel Uncoloured with light green hue Part of wall 14th / 15th c.!PMF0387 Mould blown bossed beaker Uncoloured with bluish/ greyish hue Base and part of body 16th / 17th c.
PMF0510 Vessel (probably beaker) mould blown decorated with
lozenge motif enclosing four-petalled flowers Yellow Part of wall and rim 16th / 17th c.!
PMF0527 Drink glass with foot and mould blown decorated with
strings Uncoloured with gray hue Foot (base and stem) 16th / 17th c.!
PMF0530 Vessel with strings forming a large lozenge motif Uncoloured glass with light blue hue Part of wall 16th / 17th c.!PMF0540 Vessel Uncoloured Fragment of wall and rim 16th / 17th c.!
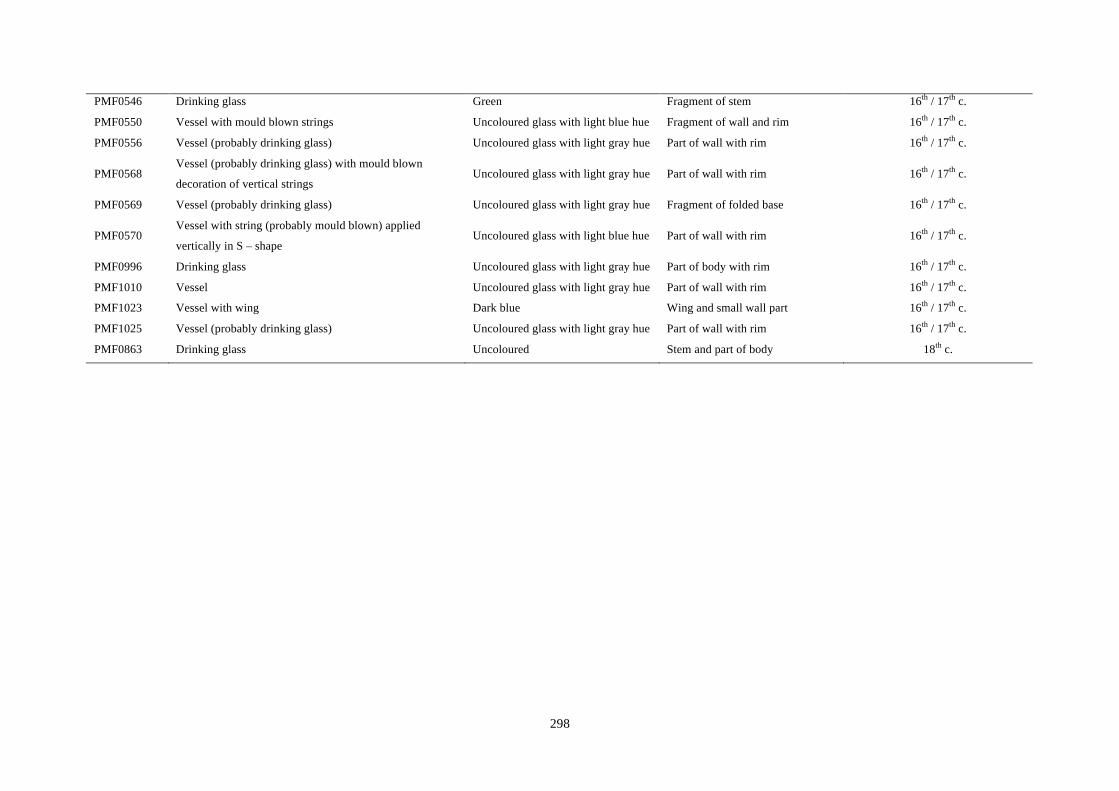
! 298!
PMF0546 Drinking glass Green Fragment of stem 16th / 17th c.!PMF0550 Vessel with mould blown strings Uncoloured glass with light blue hue Fragment of wall and rim 16th / 17th c.!PMF0556 Vessel (probably drinking glass) Uncoloured glass with light gray hue Part of wall with rim 16th / 17th c.!PMF0568
Vessel (probably drinking glass) with mould blown
decoration of vertical strings Uncoloured glass with light gray hue Part of wall with rim 16th / 17th c.!
PMF0569 Vessel (probably drinking glass) Uncoloured glass with light gray hue Fragment of folded base 16th / 17th c.!PMF0570
Vessel with string (probably mould blown) applied
vertically in S – shape Uncoloured glass with light blue hue Part of wall with rim 16th / 17th c.!
PMF0996 Drinking glass Uncoloured glass with light gray hue Part of body with rim 16th / 17th c.!PMF1010 Vessel Uncoloured glass with light gray hue Part of wall with rim 16th / 17th c.!PMF1023 Vessel with wing Dark blue Wing and small wall part 16th / 17th c.!PMF1025 Vessel (probably drinking glass) Uncoloured glass with light gray hue Part of wall with rim 16th / 17th c.!PMF0863 Drinking glass Uncoloured Stem and part of body 18th c.
!
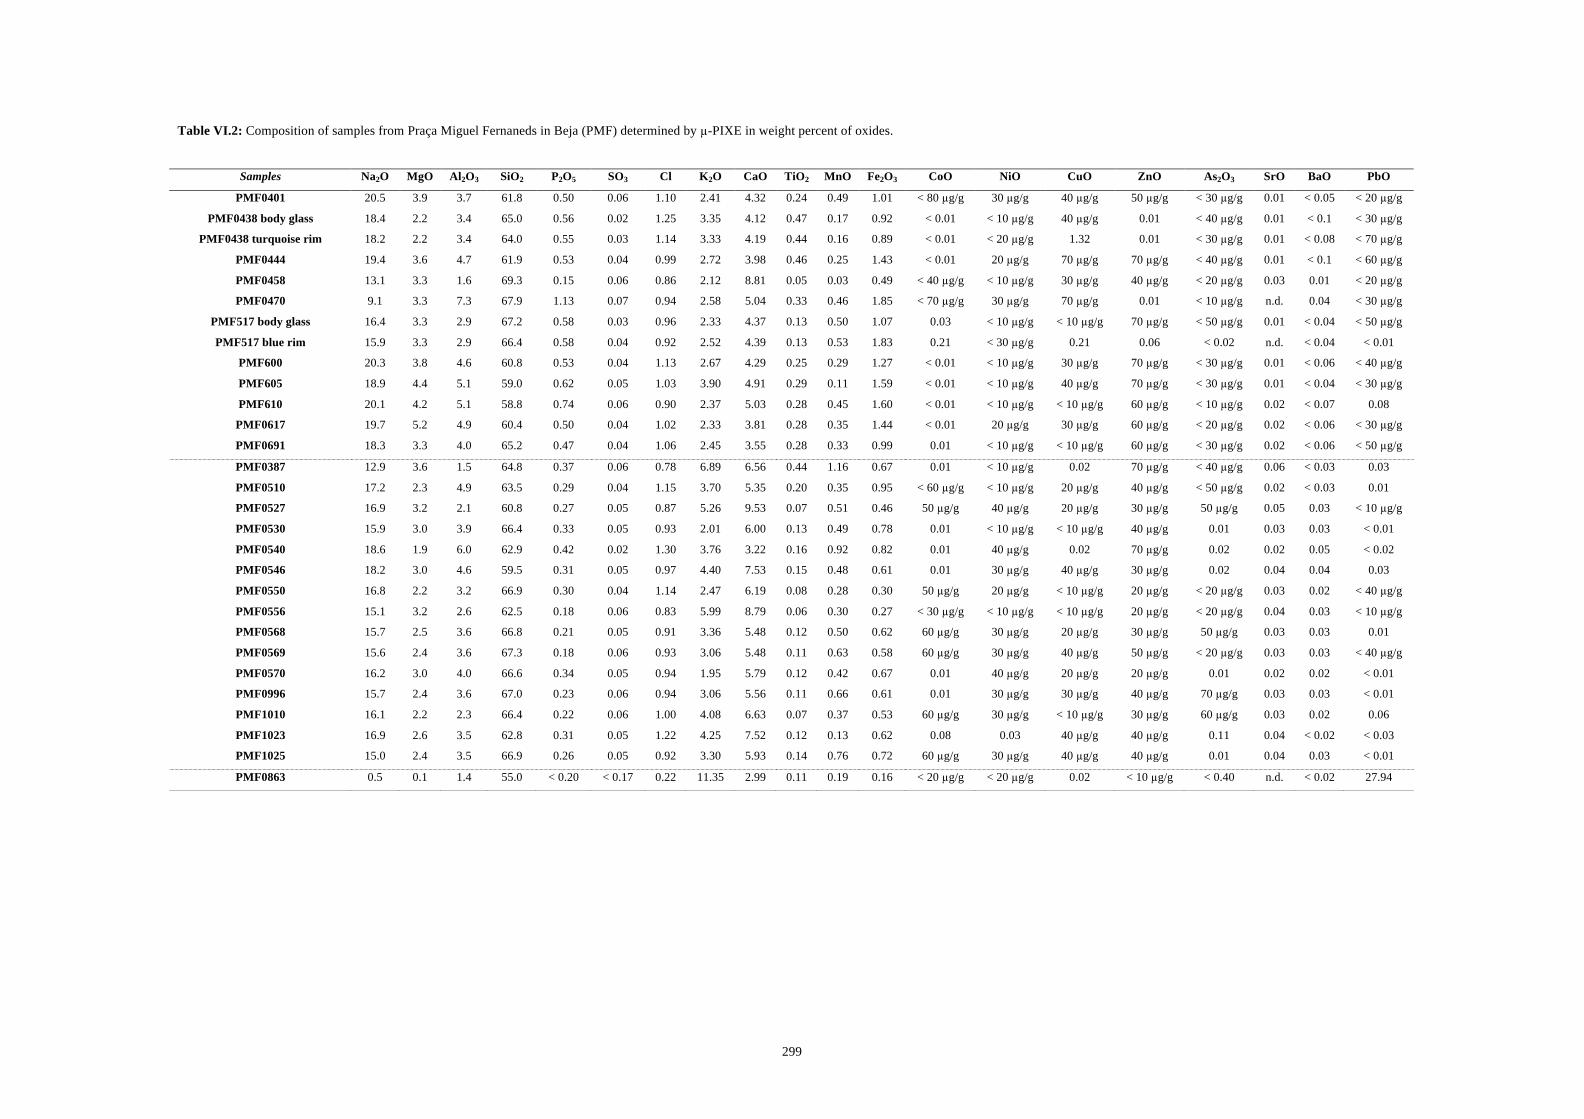
! 299!
!!!!!!!!!!!!!!!!!!!!!!!!!!!!!!!!!!!!!!!!!!!!!!!!!
Table VI.2: Composition of samples from Praça Miguel Fernaneds in Beja (PMF) determined by µ-PIXE in weight percent of oxides.
Samples Na2O MgO Al2O3 SiO2 P2O5 SO3 Cl K2O CaO TiO2 MnO Fe2O3 CoO NiO CuO ZnO As2O3 SrO BaO PbO
PMF0401 20.5 3.9 3.7 61.8 0.50 0.06 1.10 2.41 4.32 0.24 0.49 1.01 < 80 µg/g 30 µg/g 40 µg/g 50 µg/g < 30 µg/g 0.01 < 0.05 < 20 µg/g
PMF0438 body glass 18.4 2.2 3.4 65.0 0.56 0.02 1.25 3.35 4.12 0.47 0.17 0.92 < 0.01 < 10 µg/g 40 µg/g 0.01 < 40 µg/g 0.01 < 0.1 < 30 µg/g
PMF0438 turquoise rim 18.2 2.2 3.4 64.0 0.55 0.03 1.14 3.33 4.19 0.44 0.16 0.89 < 0.01 < 20 µg/g 1.32 0.01 < 30 µg/g 0.01 < 0.08 < 70 µg/g
PMF0444 19.4 3.6 4.7 61.9 0.53 0.04 0.99 2.72 3.98 0.46 0.25 1.43 < 0.01 20 µg/g 70 µg/g 70 µg/g < 40 µg/g 0.01 < 0.1 < 60 µg/g
PMF0458 13.1 3.3 1.6 69.3 0.15 0.06 0.86 2.12 8.81 0.05 0.03 0.49 < 40 µg/g < 10 µg/g 30 µg/g 40 µg/g < 20 µg/g 0.03 0.01 < 20 µg/g
PMF0470 9.1 3.3 7.3 67.9 1.13 0.07 0.94 2.58 5.04 0.33 0.46 1.85 < 70 µg/g 30 µg/g 70 µg/g 0.01 < 10 µg/g n.d. 0.04 < 30 µg/g
PMF517 body glass 16.4 3.3 2.9 67.2 0.58 0.03 0.96 2.33 4.37 0.13 0.50 1.07 0.03 < 10 µg/g < 10 µg/g 70 µg/g < 50 µg/g 0.01 < 0.04 < 50 µg/g
PMF517 blue rim 15.9 3.3 2.9 66.4 0.58 0.04 0.92 2.52 4.39 0.13 0.53 1.83 0.21 < 30 µg/g 0.21 0.06 < 0.02 n.d. < 0.04 < 0.01
PMF600 20.3 3.8 4.6 60.8 0.53 0.04 1.13 2.67 4.29 0.25 0.29 1.27 < 0.01 < 10 µg/g 30 µg/g 70 µg/g < 30 µg/g 0.01 < 0.06 < 40 µg/g
PMF605 18.9 4.4 5.1 59.0 0.62 0.05 1.03 3.90 4.91 0.29 0.11 1.59 < 0.01 < 10 µg/g 40 µg/g 70 µg/g < 30 µg/g 0.01 < 0.04 < 30 µg/g
PMF610 20.1 4.2 5.1 58.8 0.74 0.06 0.90 2.37 5.03 0.28 0.45 1.60 < 0.01 < 10 µg/g < 10 µg/g 60 µg/g < 10 µg/g 0.02 < 0.07 0.08
PMF0617 19.7 5.2 4.9 60.4 0.50 0.04 1.02 2.33 3.81 0.28 0.35 1.44 < 0.01 20 µg/g 30 µg/g 60 µg/g < 20 µg/g 0.02 < 0.06 < 30 µg/g
PMF0691 18.3 3.3 4.0 65.2 0.47 0.04 1.06 2.45 3.55 0.28 0.33 0.99 0.01 < 10 µg/g < 10 µg/g 60 µg/g < 30 µg/g 0.02 < 0.06 < 50 µg/g
PMF0387 12.9 3.6 1.5 64.8 0.37 0.06 0.78 6.89 6.56 0.44 1.16 0.67 0.01 < 10 µg/g 0.02 70 µg/g < 40 µg/g 0.06 < 0.03 0.03
PMF0510 17.2 2.3 4.9 63.5 0.29 0.04 1.15 3.70 5.35 0.20 0.35 0.95 < 60 µg/g < 10 µg/g 20 µg/g 40 µg/g < 50 µg/g 0.02 < 0.03 0.01
PMF0527 16.9 3.2 2.1 60.8 0.27 0.05 0.87 5.26 9.53 0.07 0.51 0.46 50 µg/g 40 µg/g 20 µg/g 30 µg/g 50 µg/g 0.05 0.03 < 10 µg/g
PMF0530 15.9 3.0 3.9 66.4 0.33 0.05 0.93 2.01 6.00 0.13 0.49 0.78 0.01 < 10 µg/g < 10 µg/g 40 µg/g 0.01 0.03 0.03 < 0.01
PMF0540 18.6 1.9 6.0 62.9 0.42 0.02 1.30 3.76 3.22 0.16 0.92 0.82 0.01 40 µg/g 0.02 70 µg/g 0.02 0.02 0.05 < 0.02
PMF0546 18.2 3.0 4.6 59.5 0.31 0.05 0.97 4.40 7.53 0.15 0.48 0.61 0.01 30 µg/g 40 µg/g 30 µg/g 0.02 0.04 0.04 0.03
PMF0550 16.8 2.2 3.2 66.9 0.30 0.04 1.14 2.47 6.19 0.08 0.28 0.30 50 µg/g 20 µg/g < 10 µg/g 20 µg/g < 20 µg/g 0.03 0.02 < 40 µg/g
PMF0556 15.1 3.2 2.6 62.5 0.18 0.06 0.83 5.99 8.79 0.06 0.30 0.27 < 30 µg/g < 10 µg/g < 10 µg/g 20 µg/g < 20 µg/g 0.04 0.03 < 10 µg/g
PMF0568 15.7 2.5 3.6 66.8 0.21 0.05 0.91 3.36 5.48 0.12 0.50 0.62 60 µg/g 30 µg/g 20 µg/g 30 µg/g 50 µg/g 0.03 0.03 0.01
PMF0569 15.6 2.4 3.6 67.3 0.18 0.06 0.93 3.06 5.48 0.11 0.63 0.58 60 µg/g 30 µg/g 40 µg/g 50 µg/g < 20 µg/g 0.03 0.03 < 40 µg/g
PMF0570 16.2 3.0 4.0 66.6 0.34 0.05 0.94 1.95 5.79 0.12 0.42 0.67 0.01 40 µg/g 20 µg/g 20 µg/g 0.01 0.02 0.02 < 0.01
PMF0996 15.7 2.4 3.6 67.0 0.23 0.06 0.94 3.06 5.56 0.11 0.66 0.61 0.01 30 µg/g 30 µg/g 40 µg/g 70 µg/g 0.03 0.03 < 0.01
PMF1010 16.1 2.2 2.3 66.4 0.22 0.06 1.00 4.08 6.63 0.07 0.37 0.53 60 µg/g 30 µg/g < 10 µg/g 30 µg/g 60 µg/g 0.03 0.02 0.06
PMF1023 16.9 2.6 3.5 62.8 0.31 0.05 1.22 4.25 7.52 0.12 0.13 0.62 0.08 0.03 40 µg/g 40 µg/g 0.11 0.04 < 0.02 < 0.03
PMF1025 15.0 2.4 3.5 66.9 0.26 0.05 0.92 3.30 5.93 0.14 0.76 0.72 60 µg/g 30 µg/g 40 µg/g 40 µg/g 0.01 0.04 0.03 < 0.01
PMF0863 0.5 0.1 1.4 55.0 < 0.20 < 0.17 0.22 11.35 2.99 0.11 0.19 0.16 < 20 µg/g < 20 µg/g 0.02 < 10 µg/g < 0.40 n.d. < 0.02 27.94

! 300!
!!!!!!!
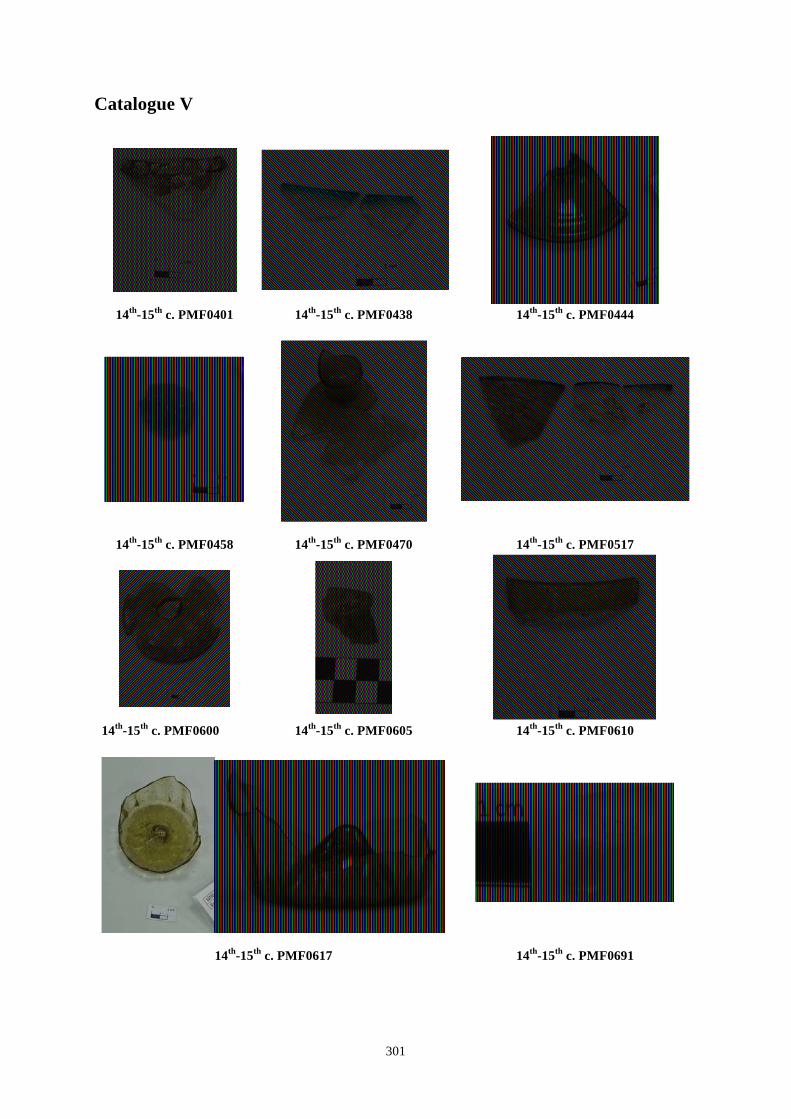
! 301
Catalogue V !
14th-15th c. PMF0401 14th-15th c. PMF0438 14th-15th c. PMF0444
!
!
14th-15th c. PMF0458 14th-15th c. PMF0470 14th-15th c. PMF0517 !
!
14th-15th c. PMF0600 14th-15th c. PMF0605 14th-15th c. PMF0610 !
!
14th-15th c. PMF0617 14th-15th c. PMF0691 !
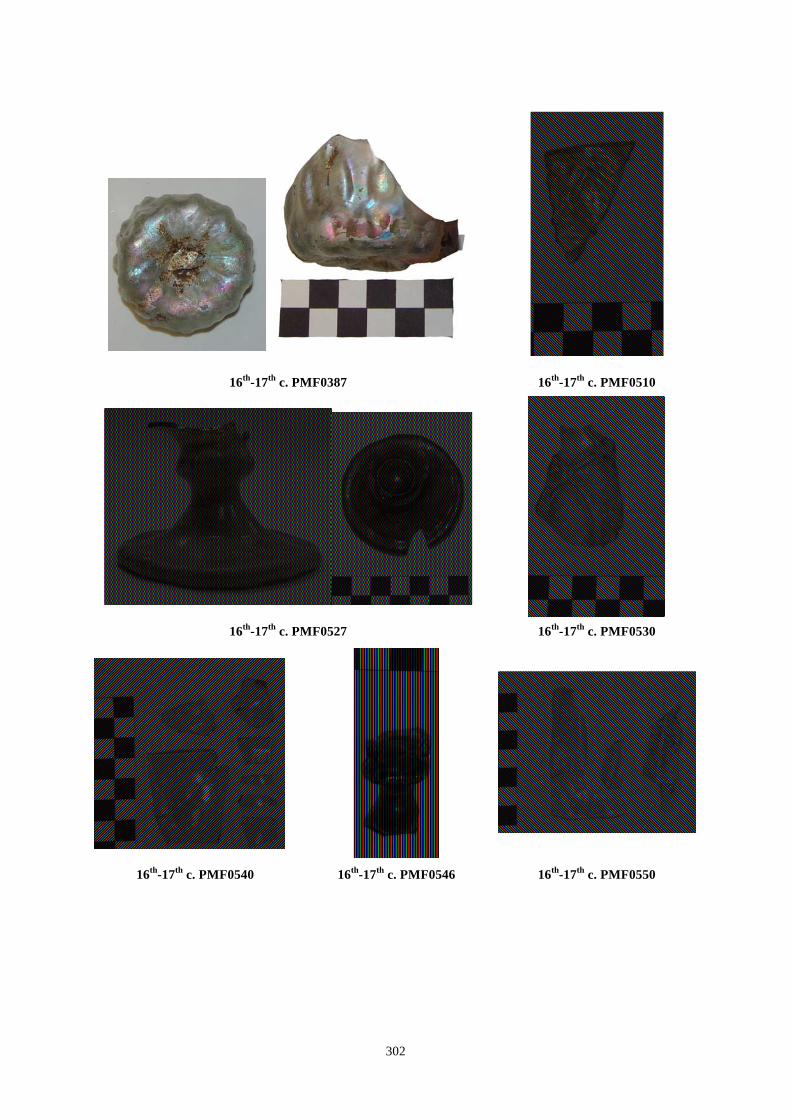
! 302
!
!
!!
16th-17th c. PMF0387! 16th-17th c. PMF0510!!
!! !
16th-17th c. PMF0527! 16th-17th c. PMF0530!!
!! !
!
16th-17th c. PMF0540! 16th-17th c. PMF0546! 16th-17th c. PMF0550!!!!!!!
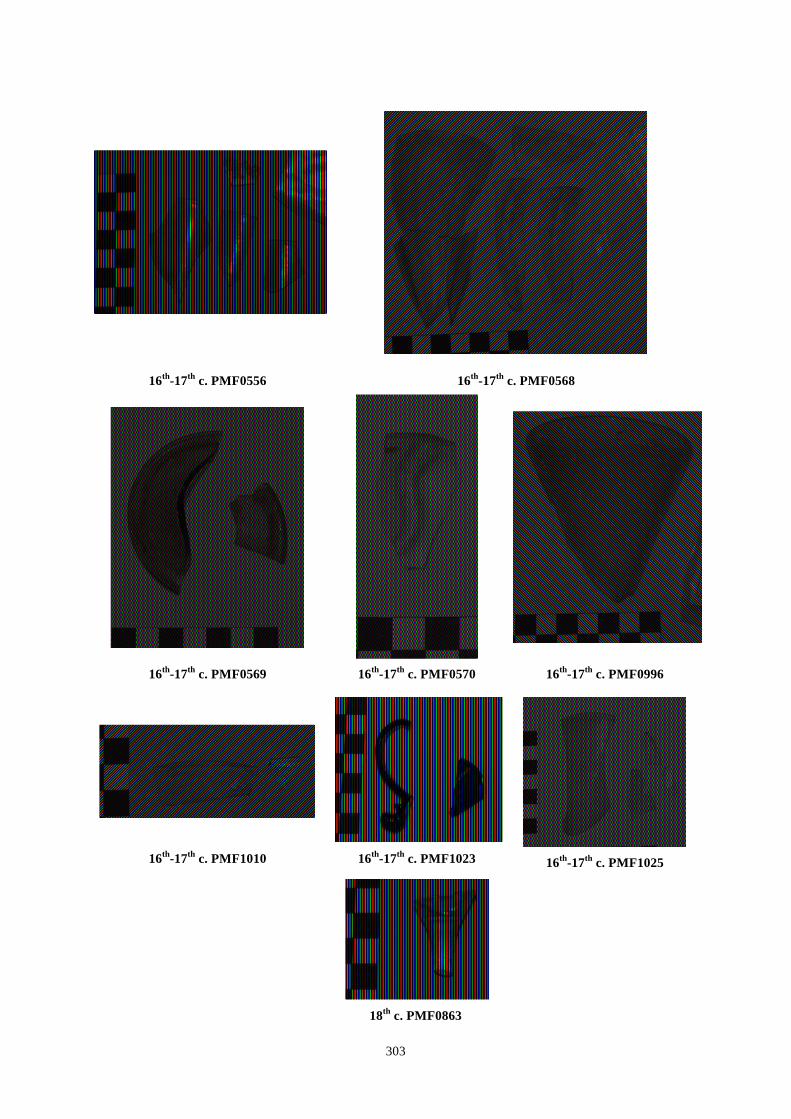
! 303
!
!
!!
16th-17th c. PMF0556! 16th-17th c. PMF0568!!
!! !
!
16th-17th c. PMF0569! 16th-17th c. PMF0570! 16th-17th c. PMF0996!
!! !
16th-17th c. PMF1010! 16th-17th c. PMF1023! 16th-17th c. PMF1025!
!!!!!!!!!!!! 18th c. PMF0863

! 304
!!!
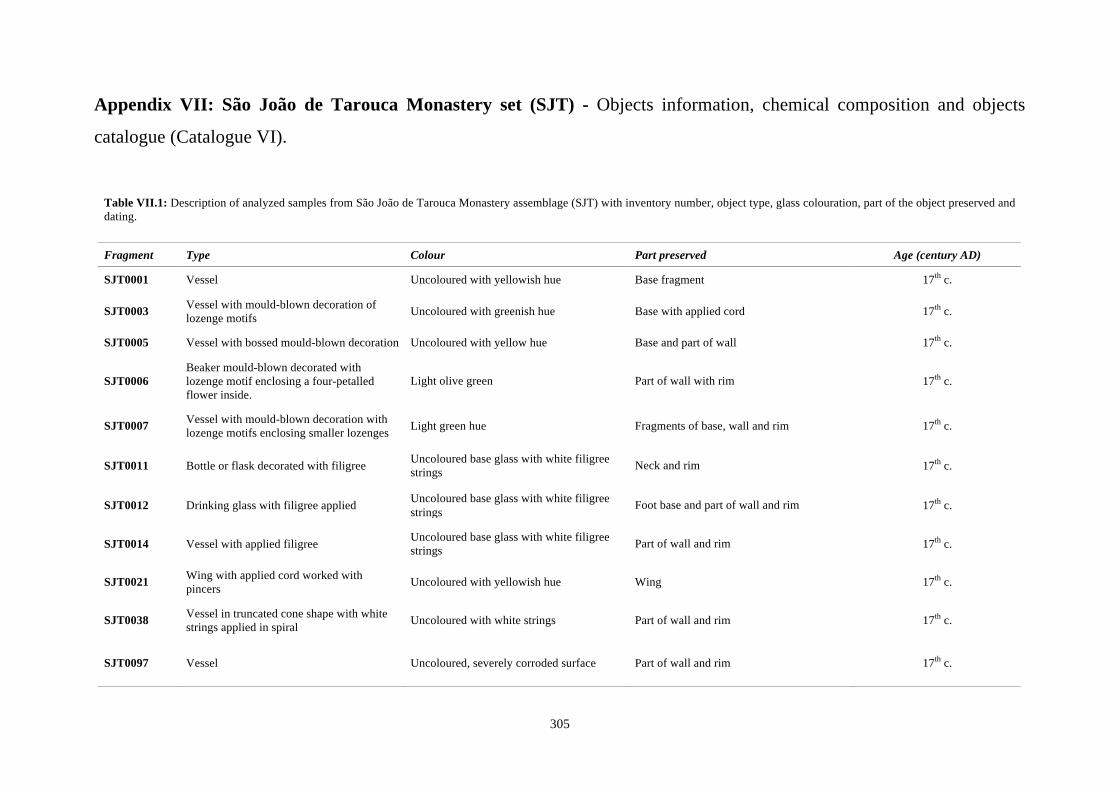
305
Appendix VII: São João de Tarouca Monastery set (SJT) - Objects information, chemical composition and objects
catalogue (Catalogue VI).
Table VII.1: Description of analyzed samples from São João de Tarouca Monastery assemblage (SJT) with inventory number, object type, glass colouration, part of the object preserved and dating.
Fragment Type Colour Part preserved Age (century AD)
SJT0001 Vessel Uncoloured with yellowish hue Base fragment 17th c.
SJT0003 Vessel with mould-blown decoration of lozenge motifs Uncoloured with greenish hue Base with applied cord 17th c.
SJT0005 Vessel with bossed mould-blown decoration Uncoloured with yellow hue Base and part of wall 17th c.
SJT0006 Beaker mould-blown decorated with lozenge motif enclosing a four-petalled flower inside.
Light olive green Part of wall with rim 17th c.
SJT0007 Vessel with mould-blown decoration with lozenge motifs enclosing smaller lozenges Light green hue Fragments of base, wall and rim 17th c.
SJT0011 Bottle or flask decorated with filigree Uncoloured base glass with white filigree strings Neck and rim 17th c.
SJT0012 Drinking glass with filigree applied Uncoloured base glass with white filigree strings Foot base and part of wall and rim 17th c.
SJT0014 Vessel with applied filigree Uncoloured base glass with white filigree strings Part of wall and rim 17th c.
SJT0021 Wing with applied cord worked with pincers Uncoloured with yellowish hue Wing 17th c.
SJT0038 Vessel in truncated cone shape with white strings applied in spiral Uncoloured with white strings Part of wall and rim 17th c.
SJT0097 Vessel Uncoloured, severely corroded surface Part of wall and rim 17th c.
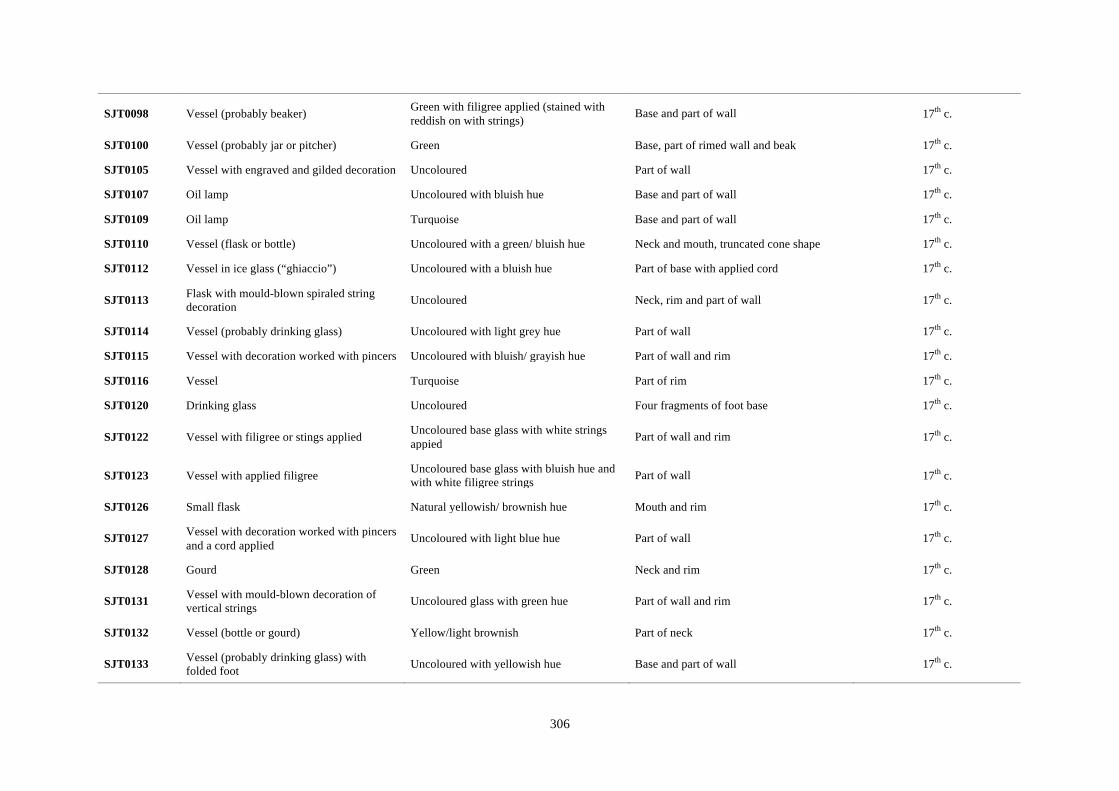
306
SJT0098 Vessel (probably beaker) Green with filigree applied (stained with reddish on with strings) Base and part of wall 17th c.
SJT0100 Vessel (probably jar or pitcher) Green Base, part of rimed wall and beak 17th c.
SJT0105 Vessel with engraved and gilded decoration Uncoloured Part of wall 17th c.
SJT0107 Oil lamp Uncoloured with bluish hue Base and part of wall 17th c.
SJT0109 Oil lamp Turquoise Base and part of wall 17th c.
SJT0110 Vessel (flask or bottle) Uncoloured with a green/ bluish hue Neck and mouth, truncated cone shape 17th c.
SJT0112 Vessel in ice glass (“ghiaccio”) Uncoloured with a bluish hue Part of base with applied cord 17th c.
SJT0113 Flask with mould-blown spiraled string decoration Uncoloured Neck, rim and part of wall 17th c.
SJT0114 Vessel (probably drinking glass) Uncoloured with light grey hue Part of wall 17th c.
SJT0115 Vessel with decoration worked with pincers Uncoloured with bluish/ grayish hue Part of wall and rim 17th c.
SJT0116 Vessel Turquoise Part of rim 17th c.
SJT0120 Drinking glass Uncoloured Four fragments of foot base 17th c.
SJT0122 Vessel with filigree or stings applied Uncoloured base glass with white strings appied Part of wall and rim 17th c.
SJT0123 Vessel with applied filigree Uncoloured base glass with bluish hue and with white filigree strings Part of wall 17th c.
SJT0126 Small flask Natural yellowish/ brownish hue Mouth and rim 17th c.
SJT0127 Vessel with decoration worked with pincers and a cord applied Uncoloured with light blue hue Part of wall 17th c.
SJT0128 Gourd Green Neck and rim 17th c.
SJT0131 Vessel with mould-blown decoration of vertical strings Uncoloured glass with green hue Part of wall and rim 17th c.
SJT0132 Vessel (bottle or gourd) Yellow/light brownish Part of neck 17th c.
SJT0133 Vessel (probably drinking glass) with folded foot Uncoloured with yellowish hue Base and part of wall 17th c.
307
SJT0134 Vessel (probably drinking glass) Turquoise Folded base 17th c.
SJT0135 Vessel with stings applied near the rim Uncoloured with white stings Part of wall and rim 17th c.
SJT0138 Drinking glass with folded foot and mould-blown decoration Uncoloured Base and part of wall. 17th c.

308
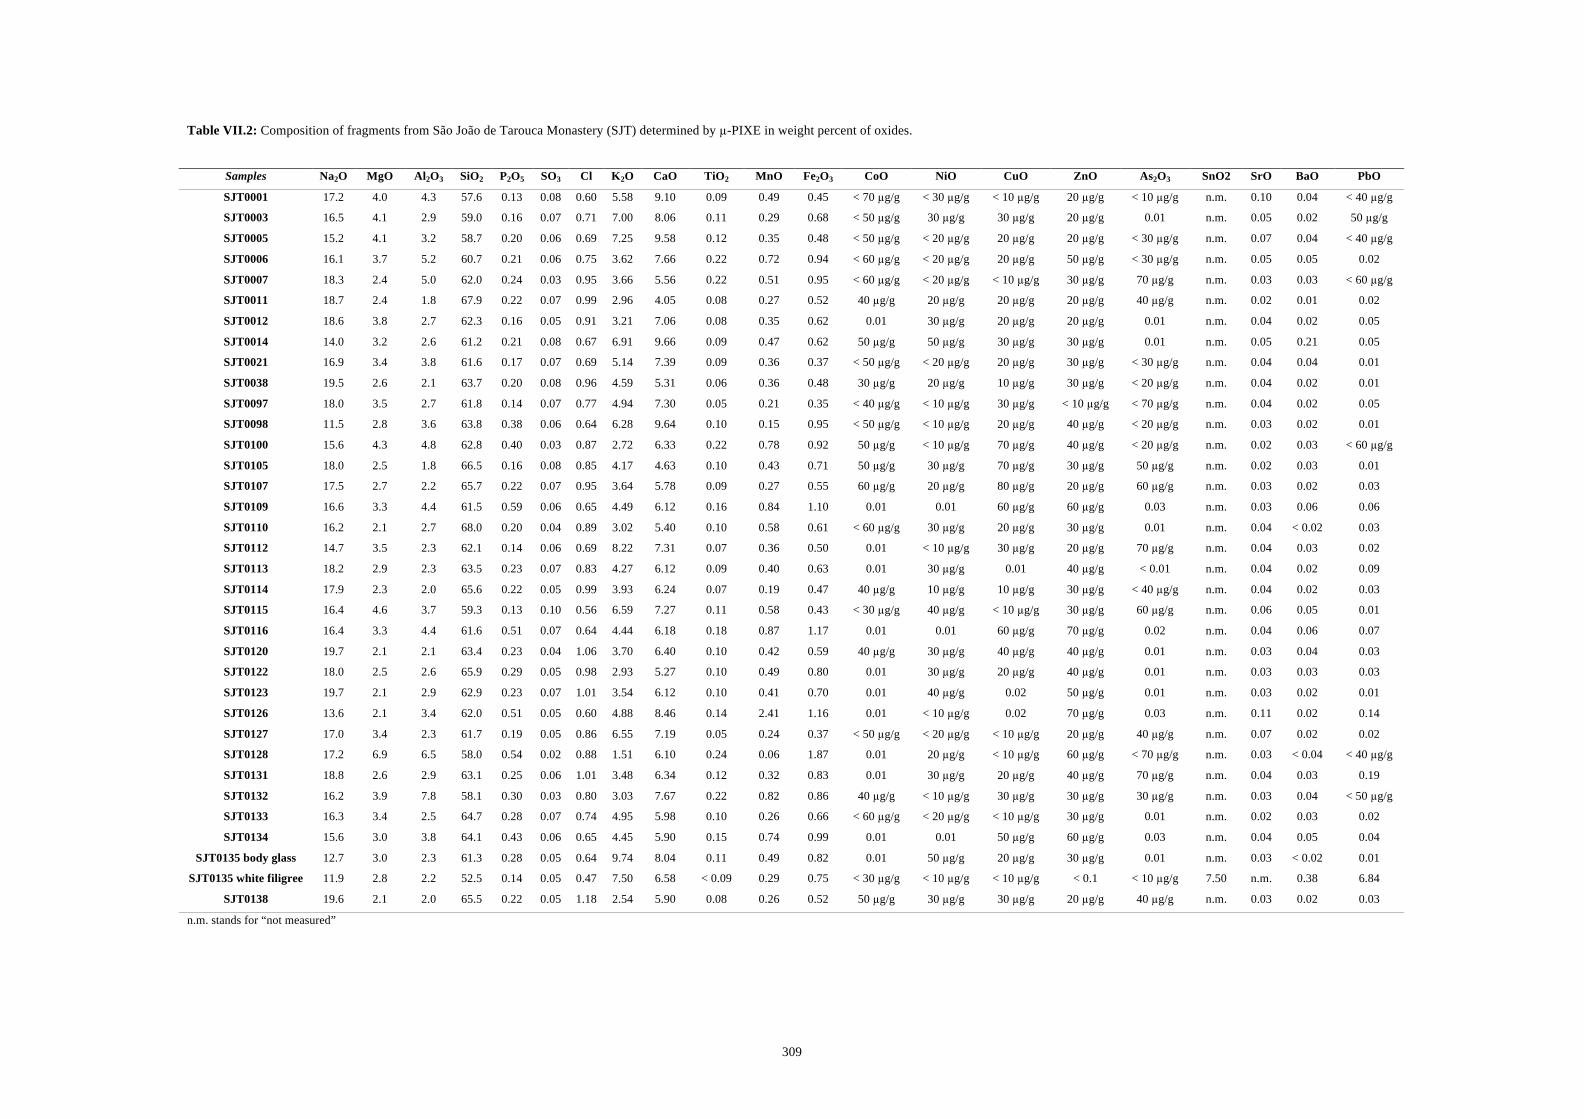
309
Table VII.2: Composition of fragments from São João de Tarouca Monastery (SJT) determined by µ-PIXE in weight percent of oxides.
Samples Na2O MgO Al2O3 SiO2 P2O5 SO3 Cl K2O CaO TiO2 MnO Fe2O3 CoO NiO CuO ZnO As2O3 SnO2 SrO BaO PbO
SJT0001 17.2 4.0 4.3 57.6 0.13 0.08 0.60 5.58 9.10 0.09 0.49 0.45 < 70 µg/g < 30 µg/g < 10 µg/g 20 µg/g < 10 µg/g n.m. 0.10 0.04 < 40 µg/g
SJT0003 16.5 4.1 2.9 59.0 0.16 0.07 0.71 7.00 8.06 0.11 0.29 0.68 < 50 µg/g 30 µg/g 30 µg/g 20 µg/g 0.01 n.m. 0.05 0.02 50 µg/g
SJT0005 15.2 4.1 3.2 58.7 0.20 0.06 0.69 7.25 9.58 0.12 0.35 0.48 < 50 µg/g < 20 µg/g 20 µg/g 20 µg/g < 30 µg/g n.m. 0.07 0.04 < 40 µg/g
SJT0006 16.1 3.7 5.2 60.7 0.21 0.06 0.75 3.62 7.66 0.22 0.72 0.94 < 60 µg/g < 20 µg/g 20 µg/g 50 µg/g < 30 µg/g n.m. 0.05 0.05 0.02
SJT0007 18.3 2.4 5.0 62.0 0.24 0.03 0.95 3.66 5.56 0.22 0.51 0.95 < 60 µg/g < 20 µg/g < 10 µg/g 30 µg/g 70 µg/g n.m. 0.03 0.03 < 60 µg/g
SJT0011 18.7 2.4 1.8 67.9 0.22 0.07 0.99 2.96 4.05 0.08 0.27 0.52 40 µg/g 20 µg/g 20 µg/g 20 µg/g 40 µg/g n.m. 0.02 0.01 0.02
SJT0012 18.6 3.8 2.7 62.3 0.16 0.05 0.91 3.21 7.06 0.08 0.35 0.62 0.01 30 µg/g 20 µg/g 20 µg/g 0.01 n.m. 0.04 0.02 0.05
SJT0014 14.0 3.2 2.6 61.2 0.21 0.08 0.67 6.91 9.66 0.09 0.47 0.62 50 µg/g 50 µg/g 30 µg/g 30 µg/g 0.01 n.m. 0.05 0.21 0.05
SJT0021 16.9 3.4 3.8 61.6 0.17 0.07 0.69 5.14 7.39 0.09 0.36 0.37 < 50 µg/g < 20 µg/g 20 µg/g 30 µg/g < 30 µg/g n.m. 0.04 0.04 0.01
SJT0038 19.5 2.6 2.1 63.7 0.20 0.08 0.96 4.59 5.31 0.06 0.36 0.48 30 µg/g 20 µg/g 10 µg/g 30 µg/g < 20 µg/g n.m. 0.04 0.02 0.01
SJT0097 18.0 3.5 2.7 61.8 0.14 0.07 0.77 4.94 7.30 0.05 0.21 0.35 < 40 µg/g < 10 µg/g 30 µg/g < 10 µg/g < 70 µg/g n.m. 0.04 0.02 0.05
SJT0098 11.5 2.8 3.6 63.8 0.38 0.06 0.64 6.28 9.64 0.10 0.15 0.95 < 50 µg/g < 10 µg/g 20 µg/g 40 µg/g < 20 µg/g n.m. 0.03 0.02 0.01
SJT0100 15.6 4.3 4.8 62.8 0.40 0.03 0.87 2.72 6.33 0.22 0.78 0.92 50 µg/g < 10 µg/g 70 µg/g 40 µg/g < 20 µg/g n.m. 0.02 0.03 < 60 µg/g
SJT0105 18.0 2.5 1.8 66.5 0.16 0.08 0.85 4.17 4.63 0.10 0.43 0.71 50 µg/g 30 µg/g 70 µg/g 30 µg/g 50 µg/g n.m. 0.02 0.03 0.01
SJT0107 17.5 2.7 2.2 65.7 0.22 0.07 0.95 3.64 5.78 0.09 0.27 0.55 60 µg/g 20 µg/g 80 µg/g 20 µg/g 60 µg/g n.m. 0.03 0.02 0.03
SJT0109 16.6 3.3 4.4 61.5 0.59 0.06 0.65 4.49 6.12 0.16 0.84 1.10 0.01 0.01 60 µg/g 60 µg/g 0.03 n.m. 0.03 0.06 0.06
SJT0110 16.2 2.1 2.7 68.0 0.20 0.04 0.89 3.02 5.40 0.10 0.58 0.61 < 60 µg/g 30 µg/g 20 µg/g 30 µg/g 0.01 n.m. 0.04 < 0.02 0.03
SJT0112 14.7 3.5 2.3 62.1 0.14 0.06 0.69 8.22 7.31 0.07 0.36 0.50 0.01 < 10 µg/g 30 µg/g 20 µg/g 70 µg/g n.m. 0.04 0.03 0.02
SJT0113 18.2 2.9 2.3 63.5 0.23 0.07 0.83 4.27 6.12 0.09 0.40 0.63 0.01 30 µg/g 0.01 40 µg/g < 0.01 n.m. 0.04 0.02 0.09
SJT0114 17.9 2.3 2.0 65.6 0.22 0.05 0.99 3.93 6.24 0.07 0.19 0.47 40 µg/g 10 µg/g 10 µg/g 30 µg/g < 40 µg/g n.m. 0.04 0.02 0.03
SJT0115 16.4 4.6 3.7 59.3 0.13 0.10 0.56 6.59 7.27 0.11 0.58 0.43 < 30 µg/g 40 µg/g < 10 µg/g 30 µg/g 60 µg/g n.m. 0.06 0.05 0.01
SJT0116 16.4 3.3 4.4 61.6 0.51 0.07 0.64 4.44 6.18 0.18 0.87 1.17 0.01 0.01 60 µg/g 70 µg/g 0.02 n.m. 0.04 0.06 0.07
SJT0120 19.7 2.1 2.1 63.4 0.23 0.04 1.06 3.70 6.40 0.10 0.42 0.59 40 µg/g 30 µg/g 40 µg/g 40 µg/g 0.01 n.m. 0.03 0.04 0.03
SJT0122 18.0 2.5 2.6 65.9 0.29 0.05 0.98 2.93 5.27 0.10 0.49 0.80 0.01 30 µg/g 20 µg/g 40 µg/g 0.01 n.m. 0.03 0.03 0.03
SJT0123 19.7 2.1 2.9 62.9 0.23 0.07 1.01 3.54 6.12 0.10 0.41 0.70 0.01 40 µg/g 0.02 50 µg/g 0.01 n.m. 0.03 0.02 0.01
SJT0126 13.6 2.1 3.4 62.0 0.51 0.05 0.60 4.88 8.46 0.14 2.41 1.16 0.01 < 10 µg/g 0.02 70 µg/g 0.03 n.m. 0.11 0.02 0.14
SJT0127 17.0 3.4 2.3 61.7 0.19 0.05 0.86 6.55 7.19 0.05 0.24 0.37 < 50 µg/g < 20 µg/g < 10 µg/g 20 µg/g 40 µg/g n.m. 0.07 0.02 0.02
SJT0128 17.2 6.9 6.5 58.0 0.54 0.02 0.88 1.51 6.10 0.24 0.06 1.87 0.01 20 µg/g < 10 µg/g 60 µg/g < 70 µg/g n.m. 0.03 < 0.04 < 40 µg/g
SJT0131 18.8 2.6 2.9 63.1 0.25 0.06 1.01 3.48 6.34 0.12 0.32 0.83 0.01 30 µg/g 20 µg/g 40 µg/g 70 µg/g n.m. 0.04 0.03 0.19
SJT0132 16.2 3.9 7.8 58.1 0.30 0.03 0.80 3.03 7.67 0.22 0.82 0.86 40 µg/g < 10 µg/g 30 µg/g 30 µg/g 30 µg/g n.m. 0.03 0.04 < 50 µg/g
SJT0133 16.3 3.4 2.5 64.7 0.28 0.07 0.74 4.95 5.98 0.10 0.26 0.66 < 60 µg/g < 20 µg/g < 10 µg/g 30 µg/g 0.01 n.m. 0.02 0.03 0.02
SJT0134 15.6 3.0 3.8 64.1 0.43 0.06 0.65 4.45 5.90 0.15 0.74 0.99 0.01 0.01 50 µg/g 60 µg/g 0.03 n.m. 0.04 0.05 0.04
SJT0135 body glass 12.7 3.0 2.3 61.3 0.28 0.05 0.64 9.74 8.04 0.11 0.49 0.82 0.01 50 µg/g 20 µg/g 30 µg/g 0.01 n.m. 0.03 < 0.02 0.01
SJT0135 white filigree 11.9 2.8 2.2 52.5 0.14 0.05 0.47 7.50 6.58 < 0.09 0.29 0.75 < 30 µg/g < 10 µg/g < 10 µg/g < 0.1 < 10 µg/g 7.50 n.m. 0.38 6.84
SJT0138 19.6 2.1 2.0 65.5 0.22 0.05 1.18 2.54 5.90 0.08 0.26 0.52 50 µg/g 30 µg/g 30 µg/g 20 µg/g 40 µg/g n.m. 0.03 0.02 0.03
n.m. stands for “not measured”

310
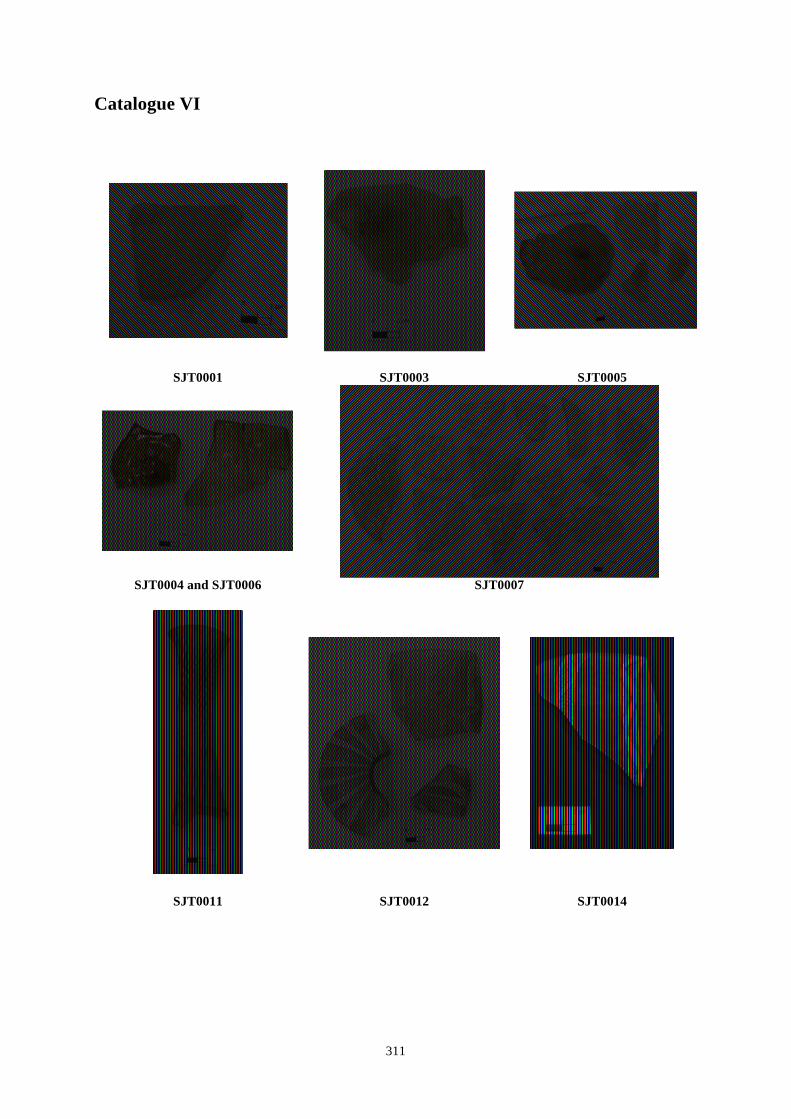
! 311
Catalogue VI !!
!
!!
!
!!
!
SJT0001 SJT0003 SJT0005
!
!! !
SJT0004 and SJT0006 SJT0007 !
!!
! !
SJT0011 SJT0012 SJT0014 !!!
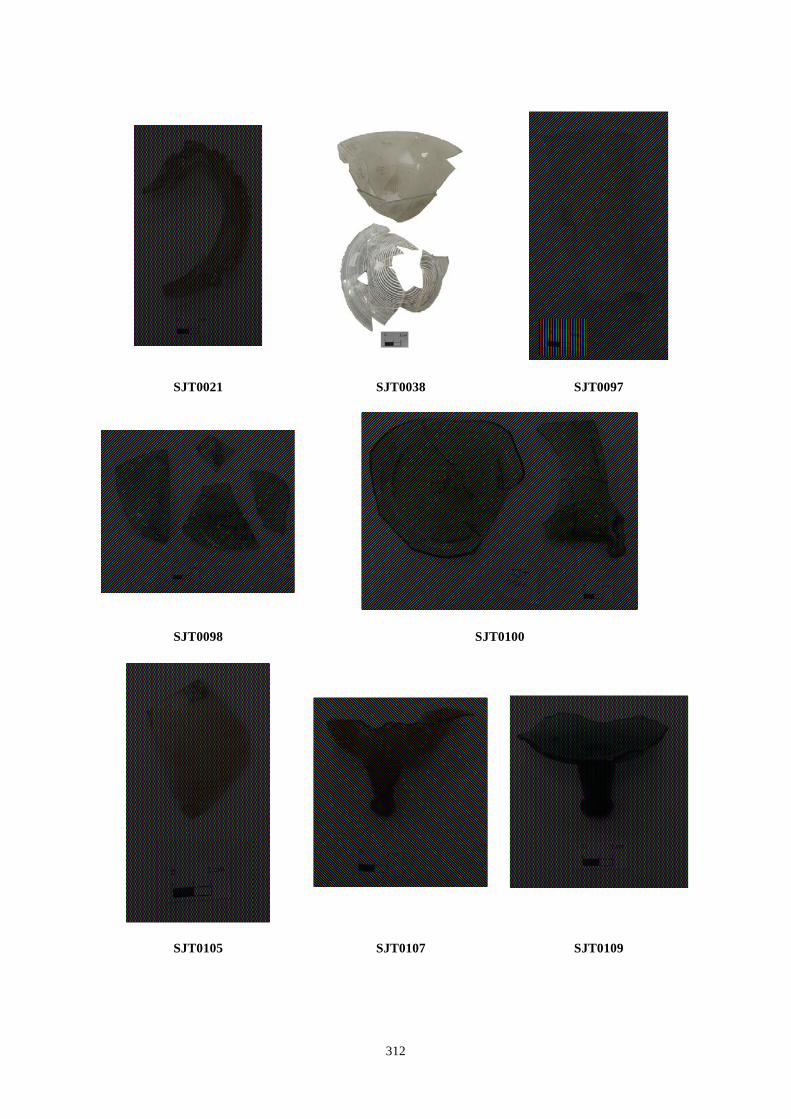
! 312
!
!! !
!
!!
SJT0021 SJT0038 SJT0097
!
!!
!
!!
SJT0098 SJT0100 !
!!
! !
SJT0105 SJT0107 SJT0109 !!!
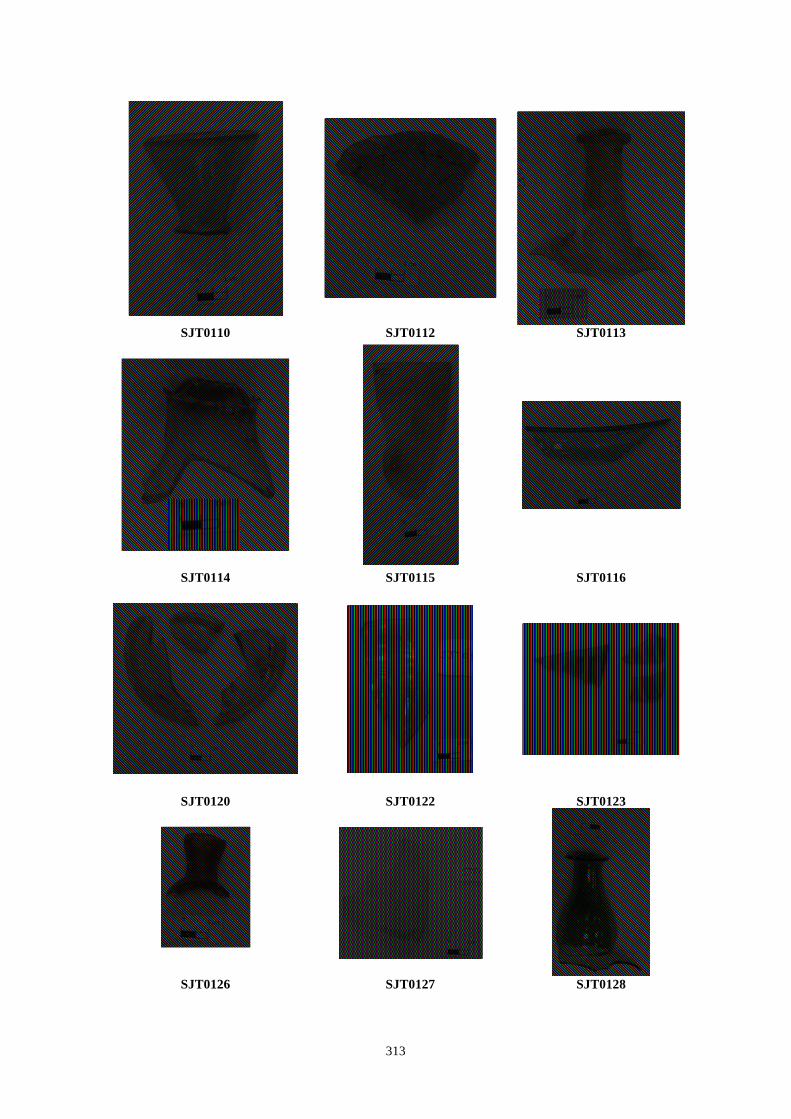
! 313
!!
!
!SJT0110 SJT0112 SJT0113
!
!! !
!
SJT0114 SJT0115 SJT0116 !
!!
!!
SJT0120 SJT0122 SJT0123 !
!
SJT0126 SJT0127 SJT0128
!
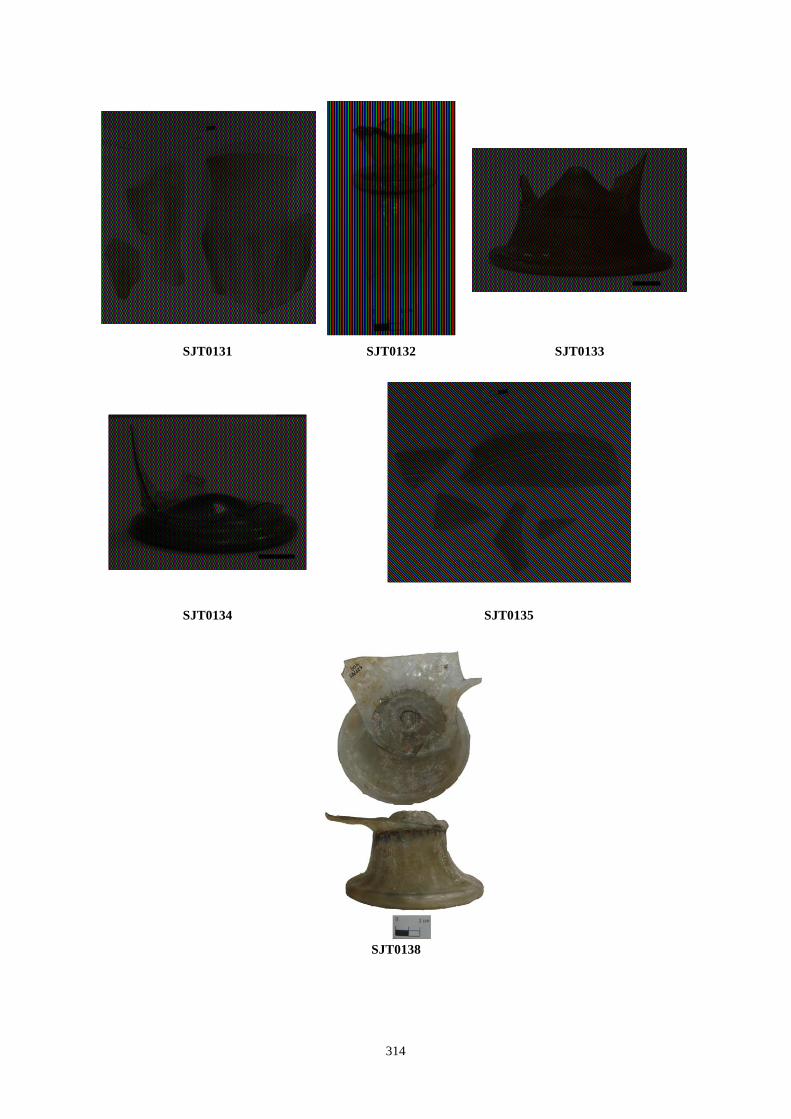
! 314
!
!! !
!!!
!!!
SJT0131 SJT0132 SJT0133 !!!
!!
!
!
!!
SJT0134 SJT0135
!SJT0138
!
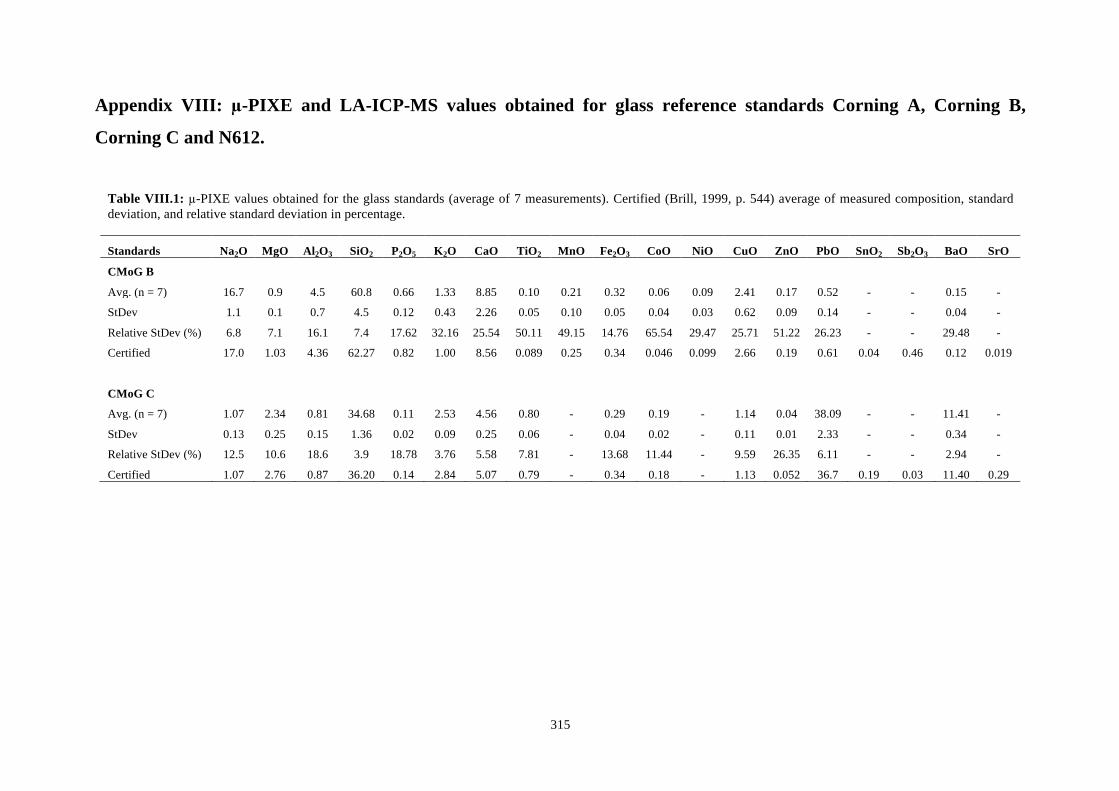
315
Appendix VIII: µ-PIXE and LA-ICP-MS values obtained for glass reference standards Corning A, Corning B,
Corning C and N612.
Table VIII.1: µ-PIXE values obtained for the glass standards (average of 7 measurements). Certified (Brill, 1999, p. 544) average of measured composition, standard deviation, and relative standard deviation in percentage.
Standards Na2O MgO Al2O3 SiO2 P2O5 K2O CaO TiO2 MnO Fe2O3 CoO NiO CuO ZnO PbO SnO2 Sb2O3 BaO SrO
CMoG B Avg. (n = 7) 16.7 0.9 4.5 60.8 0.66 1.33 8.85 0.10 0.21 0.32 0.06 0.09 2.41 0.17 0.52 - - 0.15 -
StDev 1.1 0.1 0.7 4.5 0.12 0.43 2.26 0.05 0.10 0.05 0.04 0.03 0.62 0.09 0.14 - - 0.04 -
Relative StDev (%) 6.8 7.1 16.1 7.4 17.62 32.16 25.54 50.11 49.15 14.76 65.54 29.47 25.71 51.22 26.23 - - 29.48 -
Certified 17.0 1.03 4.36 62.27 0.82 1.00 8.56 0.089 0.25 0.34 0.046 0.099 2.66 0.19 0.61 0.04 0.46 0.12 0.019
CMoG C Avg. (n = 7) 1.07 2.34 0.81 34.68 0.11 2.53 4.56 0.80 - 0.29 0.19 - 1.14 0.04 38.09 - - 11.41 -
StDev 0.13 0.25 0.15 1.36 0.02 0.09 0.25 0.06 - 0.04 0.02 - 0.11 0.01 2.33 - - 0.34 -
Relative StDev (%) 12.5 10.6 18.6 3.9 18.78 3.76 5.58 7.81 - 13.68 11.44 - 9.59 26.35 6.11 - - 2.94 -
Certified 1.07 2.76 0.87 36.20 0.14 2.84 5.07 0.79 - 0.34 0.18 - 1.13 0.052 36.7 0.19 0.03 11.40 0.29
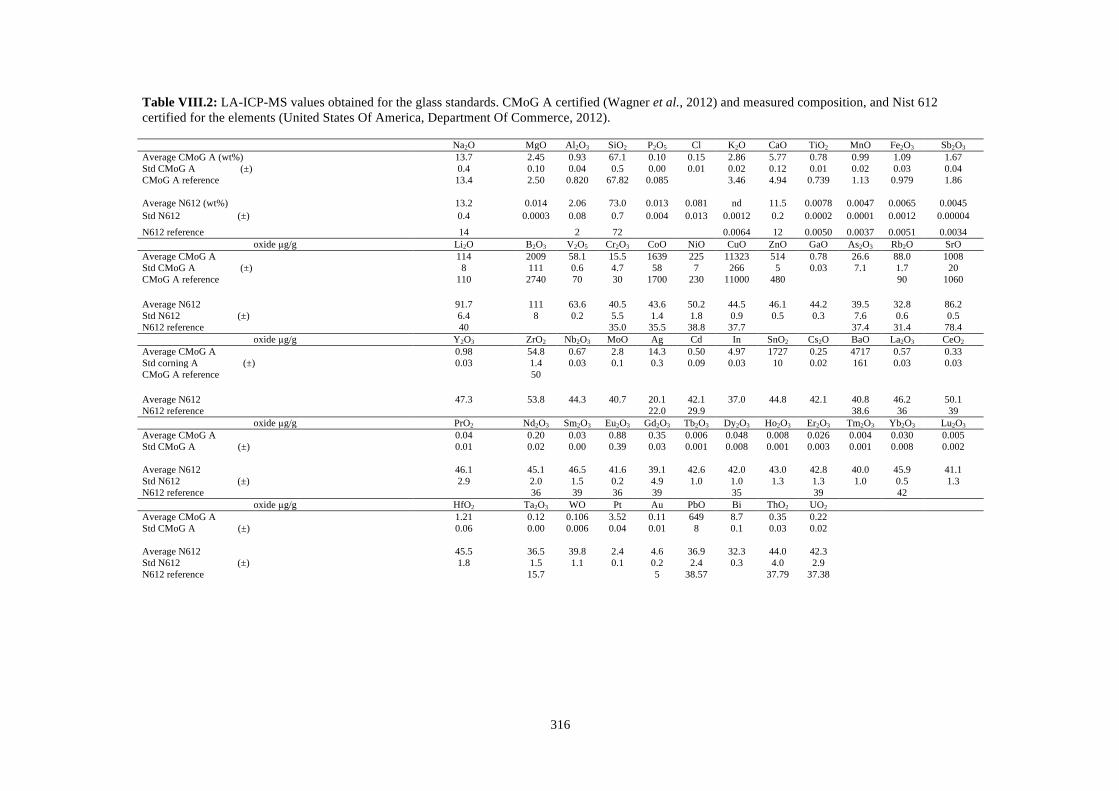
316
Table VIII.2: LA-ICP-MS values obtained for the glass standards. CMoG A certified (Wagner et al., 2012) and measured composition, and Nist 612 certified for the elements (United States Of America, Department Of Commerce, 2012).
Na2O MgO Al2O3 SiO2 P2O5 Cl K2O CaO TiO2 MnO Fe2O3 Sb2O3 Average CMoG A (wt%) 13.7 2.45 0.93 67.1 0.10 0.15 2.86 5.77 0.78 0.99 1.09 1.67 Std CMoG A (±) 0.4 0.10 0.04 0.5 0.00 0.01 0.02 0.12 0.01 0.02 0.03 0.04 CMoG A reference 13.4 2.50 0.820 67.82 0.085 3.46 4.94 0.739 1.13 0.979 1.86 Average N612 (wt%) 13.2 0.014 2.06 73.0 0.013 0.081 nd 11.5 0.0078 0.0047 0.0065 0.0045 Std N612 (±) 0.4 0.0003 0.08 0.7 0.004 0.013 0.0012 0.2 0.0002 0.0001 0.0012 0.00004
N612 reference 14 2 72 0.0064 12 0.0050 0.0037 0.0051 0.0034 oxide µg/g Li2O B2O3 V2O5 Cr2O3 CoO NiO CuO ZnO GaO As2O3 Rb2O SrO
Average CMoG A 114 2009 58.1 15.5 1639 225 11323 514 0.78 26.6 88.0 1008 Std CMoG A (±) 8 111 0.6 4.7 58 7 266 5 0.03 7.1 1.7 20 CMoG A reference 110 2740 70 30 1700 230 11000 480 90 1060 Average N612 91.7 111 63.6 40.5 43.6 50.2 44.5 46.1 44.2 39.5 32.8 86.2 Std N612 (±) 6.4 8 0.2 5.5 1.4 1.8 0.9 0.5 0.3 7.6 0.6 0.5 N612 reference 40 35.0 35.5 38.8 37.7 37.4 31.4 78.4
oxide µg/g Y2O3 ZrO2 Nb2O3 MoO Ag Cd In SnO2 Cs2O BaO La2O3 CeO2 Average CMoG A 0.98 54.8 0.67 2.8 14.3 0.50 4.97 1727 0.25 4717 0.57 0.33 Std corning A (±) 0.03 1.4 0.03 0.1 0.3 0.09 0.03 10 0.02 161 0.03 0.03 CMoG A reference 50 Average N612 47.3 53.8 44.3 40.7 20.1 42.1 37.0 44.8 42.1 40.8 46.2 50.1 N612 reference 22.0 29.9 38.6 36 39
oxide µg/g PrO2 Nd2O3 Sm2O3 Eu2O3 Gd2O3 Tb2O3 Dy2O3 Ho2O3 Er2O3 Tm2O3 Yb2O3 Lu2O3 Average CMoG A 0.04 0.20 0.03 0.88 0.35 0.006 0.048 0.008 0.026 0.004 0.030 0.005 Std CMoG A (±) 0.01 0.02 0.00 0.39 0.03 0.001 0.008 0.001 0.003 0.001 0.008 0.002 Average N612 46.1 45.1 46.5 41.6 39.1 42.6 42.0 43.0 42.8 40.0 45.9 41.1 Std N612 (±) 2.9 2.0 1.5 0.2 4.9 1.0 1.0 1.3 1.3 1.0 0.5 1.3 N612 reference 36 39 36 39 35 39 42
oxide µg/g HfO2 Ta2O3 WO Pt Au PbO Bi ThO2 UO2 Average CMoG A 1.21 0.12 0.106 3.52 0.11 649 8.7 0.35 0.22 Std CMoG A (±) 0.06 0.00 0.006 0.04 0.01 8 0.1 0.03 0.02 Average N612 45.5 36.5 39.8 2.4 4.6 36.9 32.3 44.0 42.3 Std N612 (±) 1.8 1.5 1.1 0.1 0.2 2.4 0.3 4.0 2.9 N612 reference 15.7 5 38.57 37.79 37.38
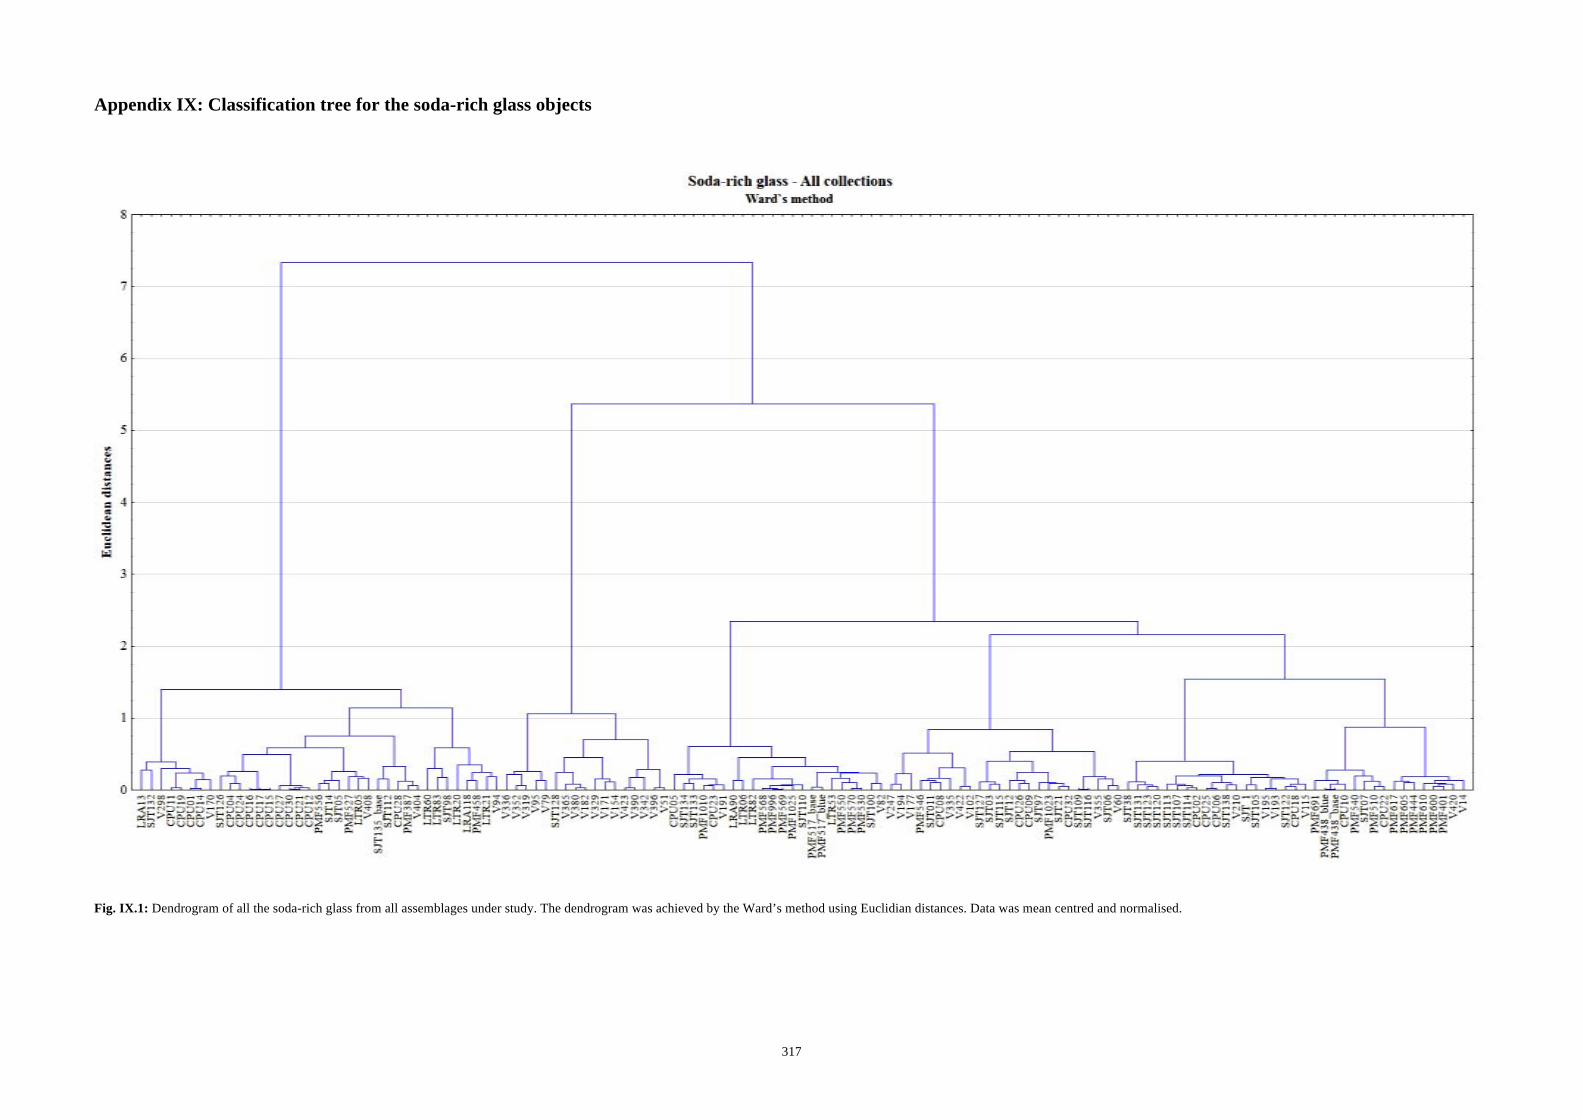
! 317!
Appendix IX: Classification tree for the soda-rich glass objects
Fig. IX.1: Dendrogram of all the soda-rich glass from all assemblages under study. The dendrogram was achieved by the Ward’s method using Euclidian distances. Data was mean centred and normalised. !!

! 318!
!
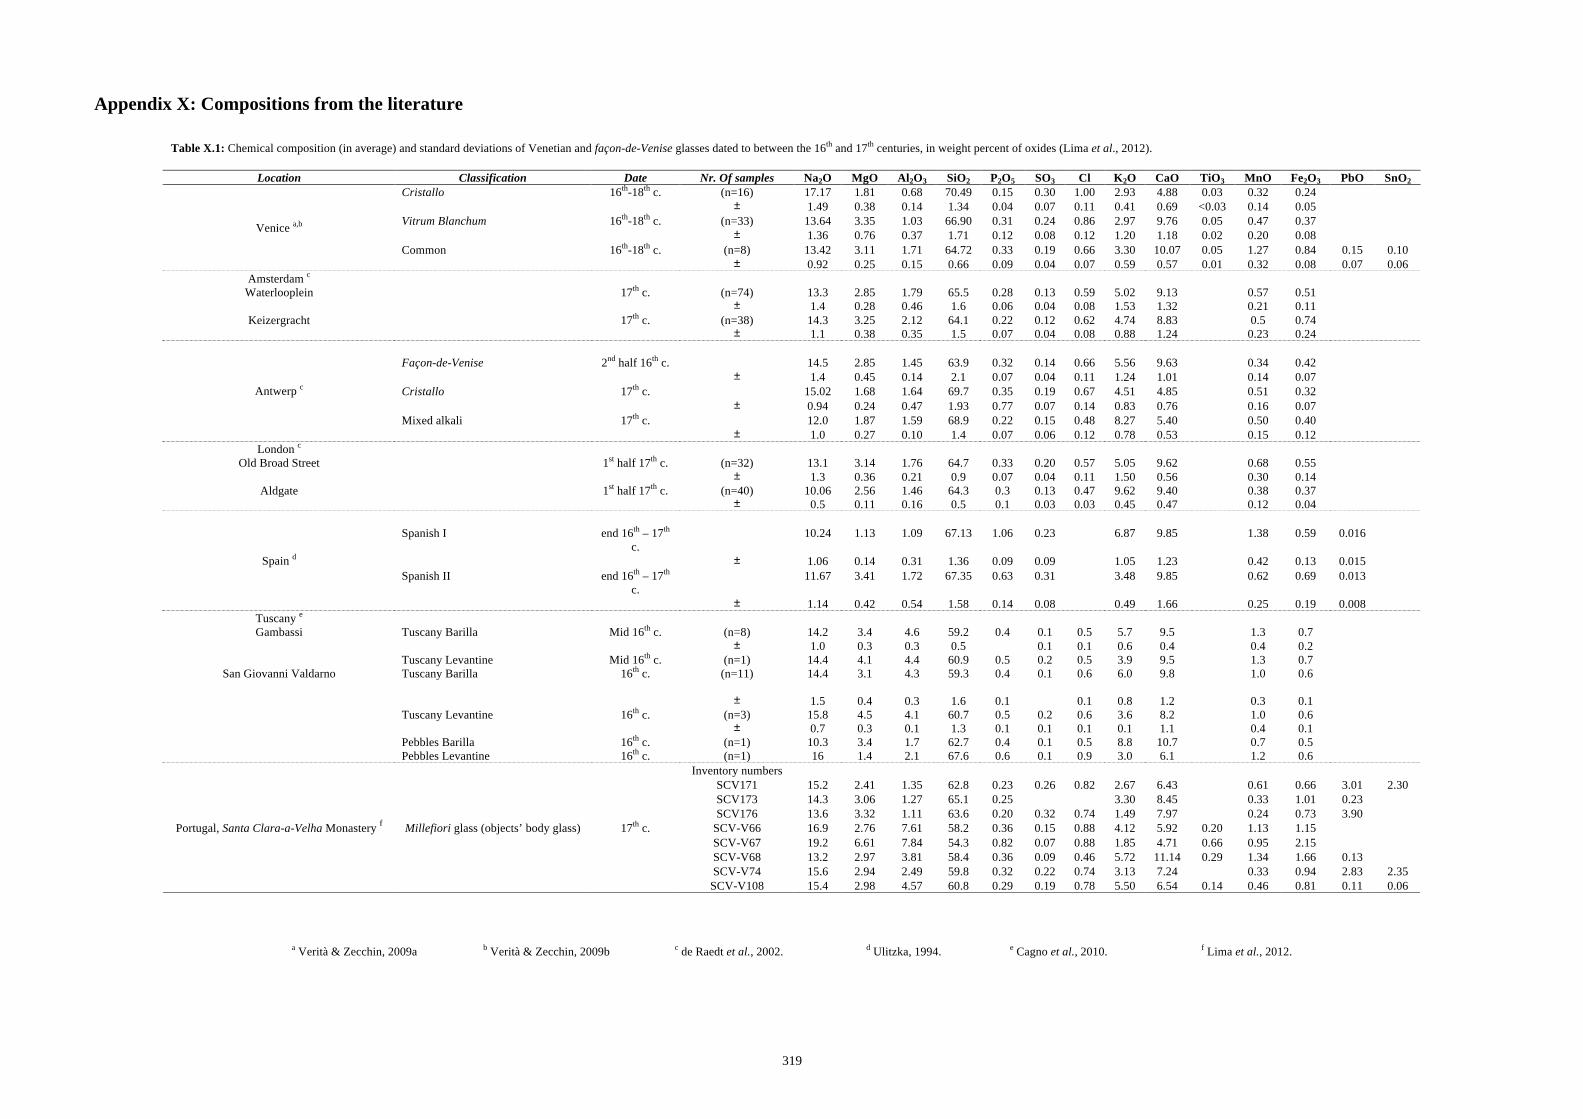
319
Appendix X: Compositions from the literature
a Verità & Zecchin, 2009a b Verità & Zecchin, 2009b c de Raedt et al., 2002. d Ulitzka, 1994. e Cagno et al., 2010. f Lima et al., 2012.
Table X.1: Chemical composition (in average) and standard deviations of Venetian and façon-de-Venise glasses dated to between the 16th and 17th centuries, in weight percent of oxides (Lima et al., 2012).
Location Classification Date Nr. Of samples Na2O MgO Al2O3 SiO2 P2O5 SO3 Cl K2O CaO TiO3 MnO Fe2O3 PbO SnO2 Cristallo 16th-18th c. (n=16) 17.17 1.81 0.68 70.49 0.15 0.30 1.00 2.93 4.88 0.03 0.32 0.24 ± 1.49 0.38 0.14 1.34 0.04 0.07 0.11 0.41 0.69 <0.03 0.14 0.05 Vitrum Blanchum 16th-18th c. (n=33) 13.64 3.35 1.03 66.90 0.31 0.24 0.86 2.97 9.76 0.05 0.47 0.37 ± 1.36 0.76 0.37 1.71 0.12 0.08 0.12 1.20 1.18 0.02 0.20 0.08 Common 16th-18th c. (n=8) 13.42 3.11 1.71 64.72 0.33 0.19 0.66 3.30 10.07 0.05 1.27 0.84 0.15 0.10
Venice a,b
± 0.92 0.25 0.15 0.66 0.09 0.04 0.07 0.59 0.57 0.01 0.32 0.08 0.07 0.06 Amsterdam c
Waterlooplein 17th c. (n=74) 13.3 2.85 1.79 65.5 0.28 0.13 0.59 5.02 9.13 0.57 0.51 ± 1.4 0.28 0.46 1.6 0.06 0.04 0.08 1.53 1.32 0.21 0.11
Keizergracht 17th c. (n=38) 14.3 3.25 2.12 64.1 0.22 0.12 0.62 4.74 8.83 0.5 0.74 ± 1.1 0.38 0.35 1.5 0.07 0.04 0.08 0.88 1.24 0.23 0.24
Façon-de-Venise 2nd half 16th c. 14.5 2.85 1.45 63.9 0.32 0.14 0.66 5.56 9.63 0.34 0.42 ± 1.4 0.45 0.14 2.1 0.07 0.04 0.11 1.24 1.01 0.14 0.07 Cristallo 17th c. 15.02 1.68 1.64 69.7 0.35 0.19 0.67 4.51 4.85 0.51 0.32 ± 0.94 0.24 0.47 1.93 0.77 0.07 0.14 0.83 0.76 0.16 0.07 Mixed alkali 17th c. 12.0 1.87 1.59 68.9 0.22 0.15 0.48 8.27 5.40 0.50 0.40
Antwerp c
± 1.0 0.27 0.10 1.4 0.07 0.06 0.12 0.78 0.53 0.15 0.12 London c
Old Broad Street 1st half 17th c. (n=32) 13.1 3.14 1.76 64.7 0.33 0.20 0.57 5.05 9.62 0.68 0.55 ± 1.3 0.36 0.21 0.9 0.07 0.04 0.11 1.50 0.56 0.30 0.14
Aldgate 1st half 17th c. (n=40) 10.06 2.56 1.46 64.3 0.3 0.13 0.47 9.62 9.40 0.38 0.37 ± 0.5 0.11 0.16 0.5 0.1 0.03 0.03 0.45 0.47 0.12 0.04
Spanish I end 16th – 17th
c. 10.24 1.13 1.09 67.13 1.06 0.23 6.87 9.85 1.38 0.59 0.016
± 1.06 0.14 0.31 1.36 0.09 0.09 1.05 1.23 0.42 0.13 0.015 Spanish II end 16th – 17th
c. 11.67 3.41 1.72 67.35 0.63 0.31 3.48 9.85 0.62 0.69 0.013
Spain d
± 1.14 0.42 0.54 1.58 0.14 0.08 0.49 1.66 0.25 0.19 0.008 Tuscany e Gambassi Tuscany Barilla Mid 16th c. (n=8) 14.2 3.4 4.6 59.2 0.4 0.1 0.5 5.7 9.5 1.3 0.7
± 1.0 0.3 0.3 0.5 0.1 0.1 0.6 0.4 0.4 0.2 Tuscany Levantine Mid 16th c. (n=1) 14.4 4.1 4.4 60.9 0.5 0.2 0.5 3.9 9.5 1.3 0.7
San Giovanni Valdarno Tuscany Barilla 16th c.
(n=11) 14.4 3.1 4.3 59.3 0.4 0.1 0.6 6.0 9.8 1.0 0.6
± 1.5 0.4 0.3 1.6 0.1 0.1 0.8 1.2 0.3 0.1 Tuscany Levantine 16th c. (n=3) 15.8 4.5 4.1 60.7 0.5 0.2 0.6 3.6 8.2 1.0 0.6 ± 0.7 0.3 0.1 1.3 0.1 0.1 0.1 0.1 1.1 0.4 0.1 Pebbles Barilla 16th c. (n=1) 10.3 3.4 1.7 62.7 0.4 0.1 0.5 8.8 10.7 0.7 0.5 Pebbles Levantine 16th c. (n=1) 16 1.4 2.1 67.6 0.6 0.1 0.9 3.0 6.1 1.2 0.6
Inventory numbers SCV171 15.2 2.41 1.35 62.8 0.23 0.26 0.82 2.67 6.43 0.61 0.66 3.01 2.30 SCV173 14.3 3.06 1.27 65.1 0.25 3.30 8.45 0.33 1.01 0.23 SCV176 13.6 3.32 1.11 63.6 0.20 0.32 0.74 1.49 7.97 0.24 0.73 3.90
SCV-V66 16.9 2.76 7.61 58.2 0.36 0.15 0.88 4.12 5.92 0.20 1.13 1.15 SCV-V67 19.2 6.61 7.84 54.3 0.82 0.07 0.88 1.85 4.71 0.66 0.95 2.15 SCV-V68 13.2 2.97 3.81 58.4 0.36 0.09 0.46 5.72 11.14 0.29 1.34 1.66 0.13 SCV-V74 15.6 2.94 2.49 59.8 0.32 0.22 0.74 3.13 7.24 0.33 0.94 2.83 2.35
Portugal, Santa Clara-a-Velha Monastery f Millefiori glass (objects’ body glass) 17th c.
SCV-V108 15.4 2.98 4.57 60.8 0.29 0.19 0.78 5.50 6.54 0.14 0.46 0.81 0.11 0.06
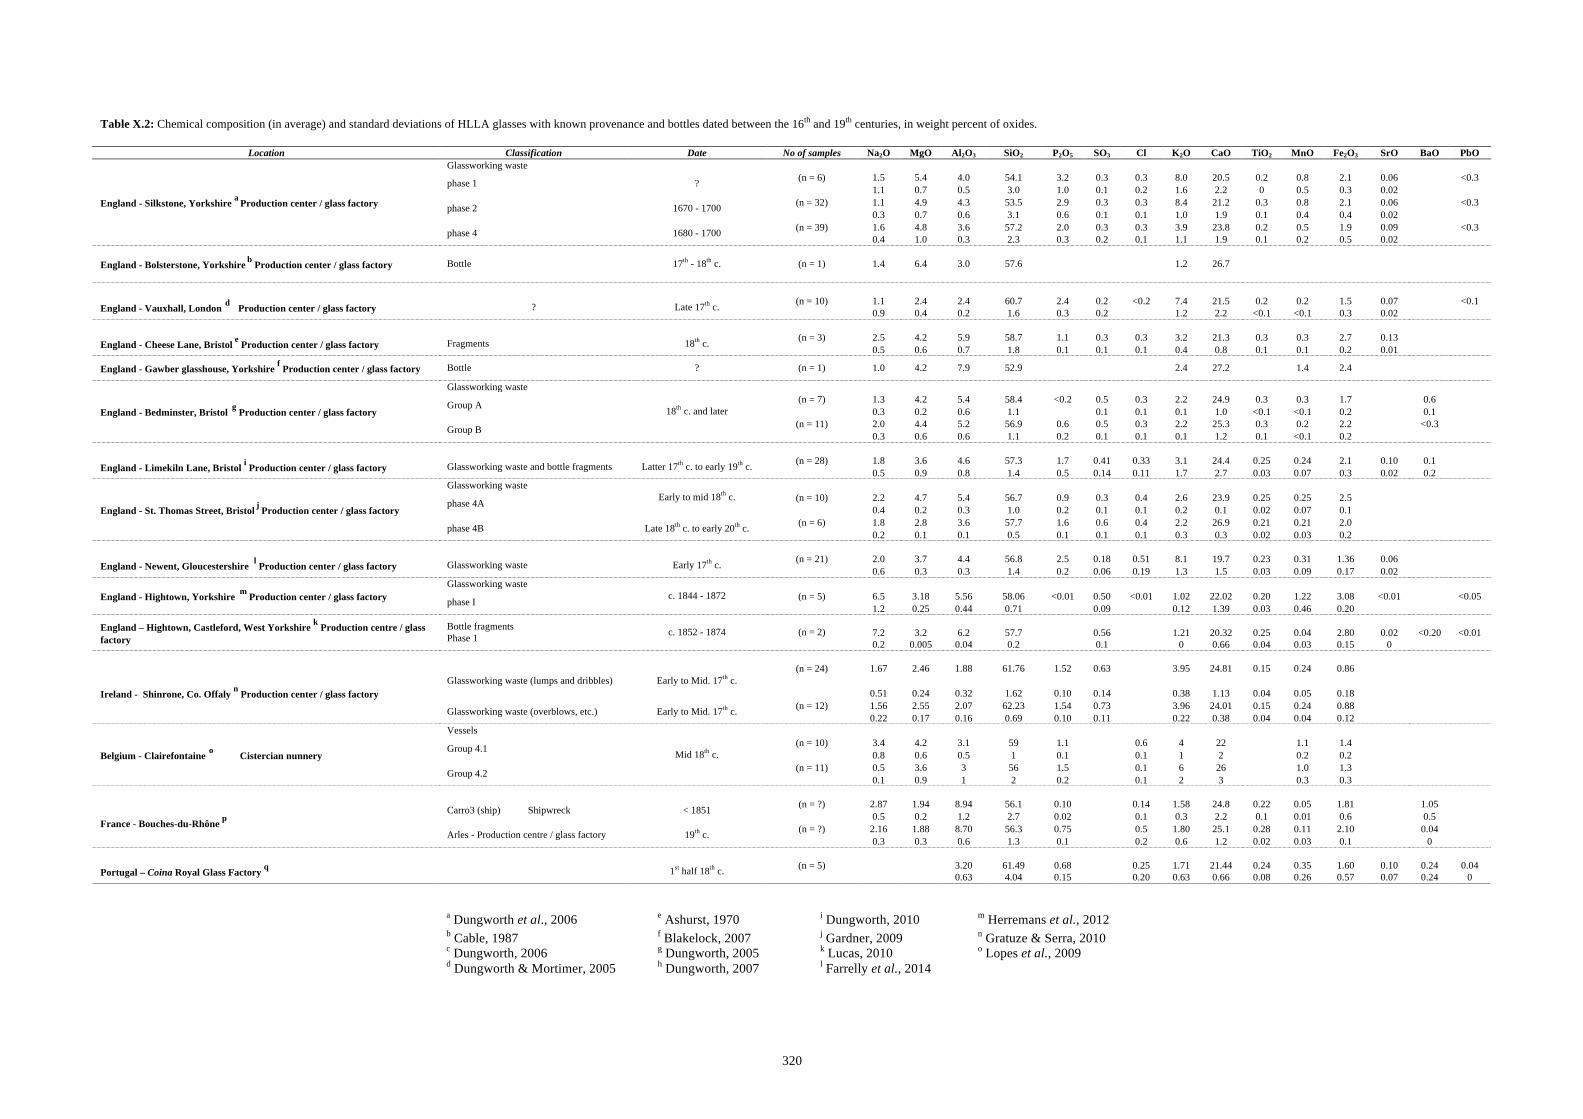
320
Table X.2: Chemical composition (in average) and standard deviations of HLLA glasses with known provenance and bottles dated between the 16th and 19th centuries, in weight percent of oxides.
Location Classification Date No of samples Na2O MgO Al2O3 SiO2 P2O5 SO3 Cl K2O CaO TiO2 MnO Fe2O3 SrO BaO PbO Glassworking waste
(n = 6) 1.5 5.4 4.0 54.1 3.2 0.3 0.3 8.0 20.5 0.2 0.8 2.1 0.06 <0.3 phase 1 ? 1.1 0.7 0.5 3.0 1.0 0.1 0.2 1.6 2.2 0 0.5 0.3 0.02
(n = 32) 1.1 4.9 4.3 53.5 2.9 0.3 0.3 8.4 21.2 0.3 0.8 2.1 0.06 <0.3 phase 2 1670 - 1700 0.3 0.7 0.6 3.1 0.6 0.1 0.1 1.0 1.9 0.1 0.4 0.4 0.02
(n = 39) 1.6 4.8 3.6 57.2 2.0 0.3 0.3 3.9 23.8 0.2 0.5 1.9 0.09 <0.3
England - Silkstone, Yorkshire a Production center / glass factory
phase 4 1680 - 1700 0.4 1.0 0.3 2.3 0.3 0.2 0.1 1.1 1.9 0.1 0.2 0.5 0.02
England - Bolsterstone, Yorkshire b Production center / glass factory Bottle 17th - 18th c. (n = 1) 1.4 6.4 3.0 57.6
1.2 26.7
(n = 10) 1.1 2.4 2.4 60.7 2.4 0.2 <0.2 7.4 21.5 0.2 0.2 1.5 0.07 <0.1
England - Vauxhall, London d Production center / glass factory ? Late 17th c. 0.9 0.4 0.2 1.6 0.3 0.2 1.2 2.2 <0.1 <0.1 0.3 0.02
(n = 3) 2.5 4.2 5.9 58.7 1.1 0.3 0.3 3.2 21.3 0.3 0.3 2.7 0.13 England - Cheese Lane, Bristol e Production center / glass factory Fragments 18th c.
0.5 0.6 0.7 1.8 0.1 0.1 0.1 0.4 0.8 0.1 0.1 0.2 0.01
England - Gawber glasshouse, Yorkshire f Production center / glass factory Bottle ? (n = 1) 1.0 4.2 7.9 52.9
2.4 27.2
1.4 2.4
Glassworking waste (n = 7) 1.3 4.2 5.4 58.4 <0.2 0.5 0.3 2.2 24.9 0.3 0.3 1.7 0.6 Group A
0.3 0.2 0.6 1.1 0.1 0.1 0.1 1.0 <0.1 <0.1 0.2 0.1 (n = 11) 2.0 4.4 5.2 56.9 0.6 0.5 0.3 2.2 25.3 0.3 0.2 2.2 <0.3
England - Bedminster, Bristol g Production center / glass factory
Group B
18th c. and later
0.3 0.6 0.6 1.1 0.2 0.1 0.1 0.1 1.2 0.1 <0.1 0.2
(n = 28) 1.8 3.6 4.6 57.3 1.7 0.41 0.33 3.1 24.4 0.25 0.24 2.1 0.10 0.1 England - Limekiln Lane, Bristol i Production center / glass factory Glassworking waste and bottle fragments Latter 17th c. to early 19th c.
0.5 0.9 0.8 1.4 0.5 0.14 0.11 1.7 2.7 0.03 0.07 0.3 0.02 0.2 Glassworking waste
(n = 10) 2.2 4.7 5.4 56.7 0.9 0.3 0.4 2.6 23.9 0.25 0.25 2.5 phase 4A Early to mid 18th c.
0.4 0.2 0.3 1.0 0.2 0.1 0.1 0.2 0.1 0.02 0.07 0.1 (n = 6) 1.8 2.8 3.6 57.7 1.6 0.6 0.4 2.2 26.9 0.21 0.21 2.0
England - St. Thomas Street, Bristol j Production center / glass factory
phase 4B Late 18th c. to early 20th c. 0.2 0.1 0.1 0.5 0.1 0.1 0.1 0.3 0.3 0.02 0.03 0.2
(n = 21) 2.0 3.7 4.4 56.8 2.5 0.18 0.51 8.1 19.7 0.23 0.31 1.36 0.06
England - Newent, Gloucestershire l Production center / glass factory Glassworking waste Early 17th c. 0.6 0.3 0.3 1.4 0.2 0.06 0.19 1.3 1.5 0.03 0.09 0.17 0.02
Glassworking waste (n = 5) 6.5 3.18 5.56 58.06 <0.01 0.50 <0.01 1.02 22.02 0.20 1.22 3.08 <0.01 <0.05 England - Hightown, Yorkshire m Production center / glass factory phase I
c. 1844 - 1872 1.2 0.25 0.44 0.71 0.09 0.12 1.39 0.03 0.46 0.20
7.2 3.2 6.2 57.7 0.56 1.21 20.32 0.25 0.04 2.80 0.02 <0.20 <0.01 England – Hightown, Castleford, West Yorkshire k Production centre / glass
factory Bottle fragments Phase 1 c. 1852 - 1874 (n = 2)
0.2 0.005 0.04 0.2 0.1 0 0.66 0.04 0.03 0.15 0
(n = 24) 1.67 2.46 1.88 61.76 1.52 0.63 3.95 24.81 0.15 0.24 0.86 Glassworking waste (lumps and dribbles) Early to Mid. 17th c. 0.51 0.24 0.32 1.62 0.10 0.14 0.38 1.13 0.04 0.05 0.18
(n = 12) 1.56 2.55 2.07 62.23 1.54 0.73 3.96 24.01 0.15 0.24 0.88 Ireland - Shinrone, Co. Offaly n Production center / glass factory
Glassworking waste (overblows, etc.) Early to Mid. 17th c. 0.22 0.17 0.16 0.69 0.10 0.11 0.22 0.38 0.04 0.04 0.12
Vessels (n = 10) 3.4 4.2 3.1 59 1.1 0.6 4 22 1.1 1.4 Group 4.1
0.8 0.6 0.5 1 0.1 0.1 1 2 0.2 0.2 (n = 11) 0.5 3.6 3 56 1.5 0.1 6 26 1.0 1.3
Belgium - Clairefontaine o Cistercian nunnery
Group 4.2
Mid 18th c.
0.1 0.9 1 2 0.2 0.1 2 3 0.3 0.3
(n = ?) 2.87 1.94 8.94 56.1 0.10 0.14 1.58 24.8 0.22 0.05 1.81 1.05 Carro3 (ship) Shipwreck < 1851 0.5 0.2 1.2 2.7 0.02 0.1 0.3 2.2 0.1 0.01 0.6 0.5
(n = ?) 2.16 1.88 8.70 56.3 0.75 0.5 1.80 25.1 0.28 0.11 2.10 0.04 France - Bouches-du-Rhône p Arles - Production centre / glass factory 19th c.
0.3 0.3 0.6 1.3 0.1 0.2 0.6 1.2 0.02 0.03 0.1 0
(n = 5) 3.20 61.49 0.68 0.25 1.71 21.44 0.24 0.35 1.60 0.10 0.24 0.04 Portugal – Coina Royal Glass Factory q 1st half 18th c. 0.63 4.04 0.15 0.20 0.63 0.66 0.08 0.26 0.57 0.07 0.24 0
a Dungworth et al., 2006 e Ashurst, 1970 i Dungworth, 2010 m Herremans et al., 2012 b Cable, 1987 f Blakelock, 2007 j Gardner, 2009 n Gratuze & Serra, 2010 c Dungworth, 2006 g Dungworth, 2005 k Lucas, 2010 o Lopes et al., 2009 d Dungworth & Mortimer, 2005 h Dungworth, 2007 l Farrelly et al., 2014
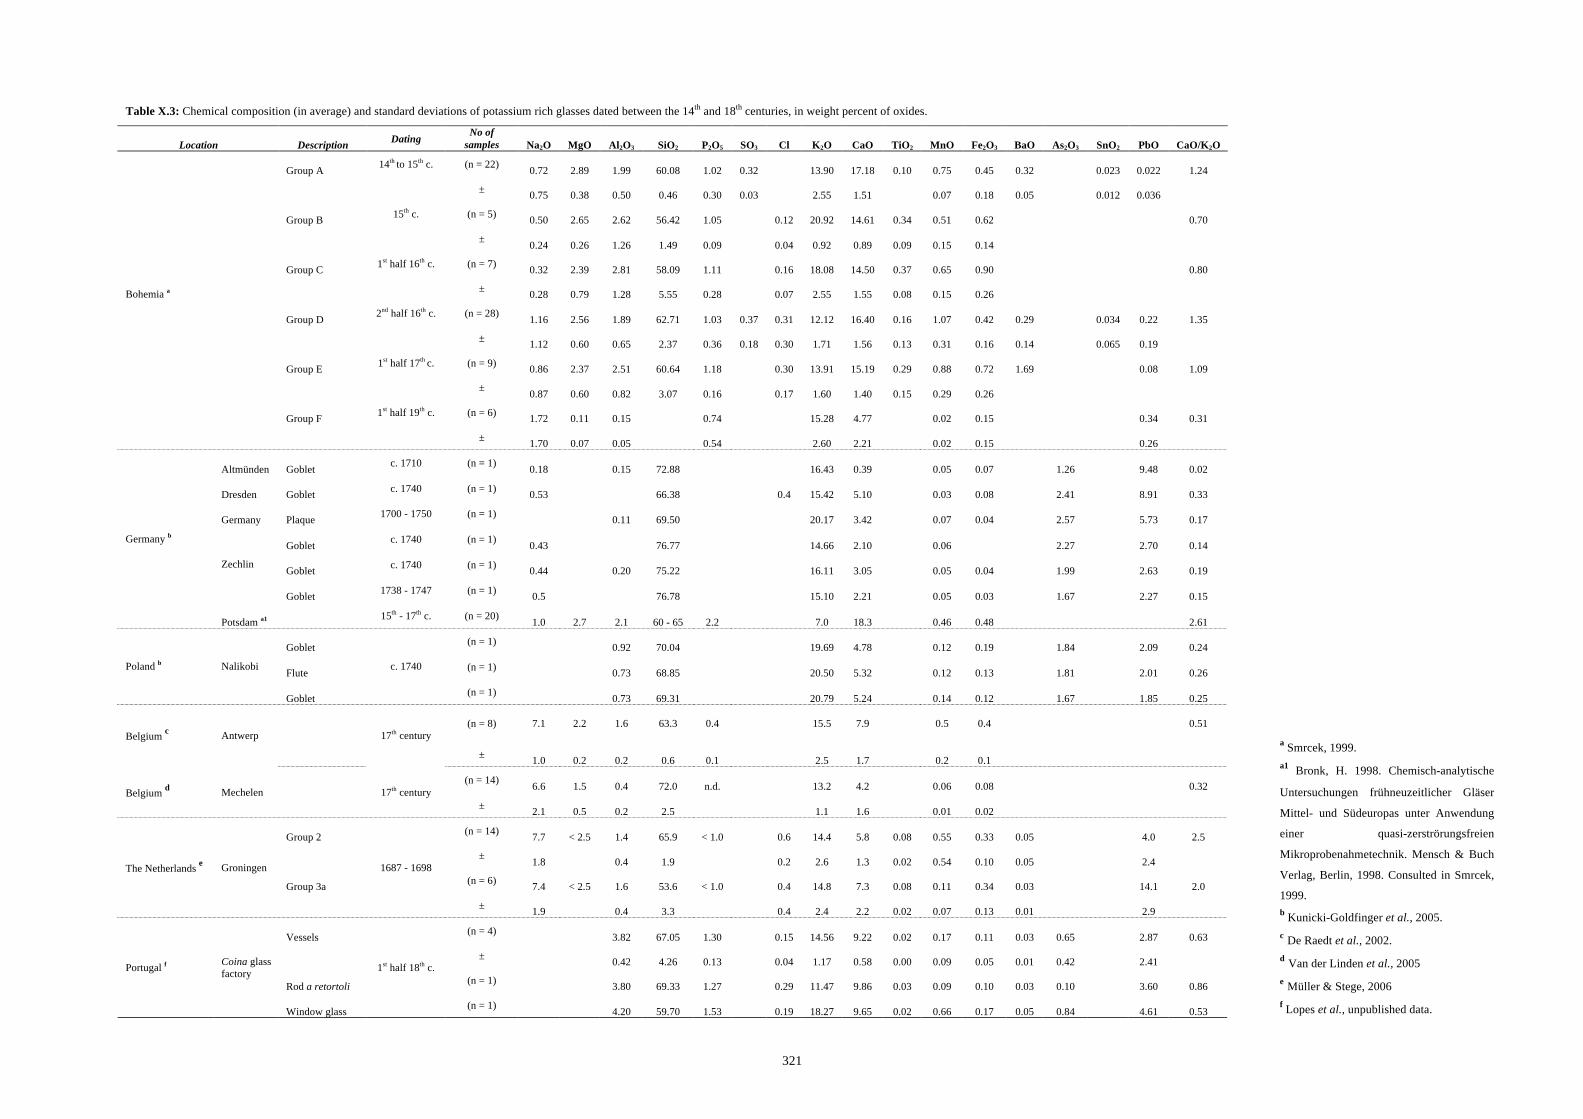
321
Table X.3: Chemical composition (in average) and standard deviations of potassium rich glasses dated between the 14th and 18th centuries, in weight percent of oxides.
Location Description Dating No of samples Na2O MgO Al2O3 SiO2 P2O5 SO3 Cl K2O CaO TiO2 MnO Fe2O3 BaO As2O3 SnO2 PbO CaO/K2O
Group A 14th to 15th c. (n = 22) 0.72 2.89 1.99 60.08 1.02 0.32 13.90 17.18 0.10 0.75 0.45 0.32 0.023 0.022 1.24
± 0.75 0.38 0.50 0.46 0.30 0.03 2.55 1.51 0.07 0.18 0.05 0.012 0.036
Group B 15th c. (n = 5) 0.50 2.65 2.62 56.42 1.05 0.12 20.92 14.61 0.34 0.51 0.62 0.70
± 0.24 0.26 1.26 1.49 0.09 0.04 0.92 0.89 0.09 0.15 0.14
Group C 1st half 16th c. (n = 7) 0.32 2.39 2.81 58.09 1.11 0.16 18.08 14.50 0.37 0.65 0.90 0.80
± 0.28 0.79 1.28 5.55 0.28 0.07 2.55 1.55 0.08 0.15 0.26
Group D 2nd half 16th c. (n = 28) 1.16 2.56 1.89 62.71 1.03 0.37 0.31 12.12 16.40 0.16 1.07 0.42 0.29 0.034 0.22 1.35
± 1.12 0.60 0.65 2.37 0.36 0.18 0.30 1.71 1.56 0.13 0.31 0.16 0.14 0.065 0.19
Group E 1st half 17th c. (n = 9) 0.86 2.37 2.51 60.64 1.18 0.30 13.91 15.19 0.29 0.88 0.72 1.69 0.08 1.09
± 0.87 0.60 0.82 3.07 0.16 0.17 1.60 1.40 0.15 0.29 0.26
Group F 1st half 19th c. (n = 6) 1.72 0.11 0.15 0.74 15.28 4.77 0.02 0.15 0.34 0.31
Bohemia a
± 1.70 0.07 0.05 0.54 2.60 2.21 0.02 0.15 0.26
Altmünden Goblet c. 1710 (n = 1) 0.18 0.15 72.88 16.43 0.39 0.05 0.07 1.26 9.48 0.02
Dresden Goblet c. 1740 (n = 1) 0.53 66.38 0.4 15.42 5.10 0.03 0.08 2.41 8.91 0.33
Germany Plaque 1700 - 1750 (n = 1) 0.11 69.50 20.17 3.42 0.07 0.04 2.57 5.73 0.17
Goblet c. 1740 (n = 1) 0.43 76.77 14.66 2.10 0.06 2.27 2.70 0.14
Goblet c. 1740 (n = 1) 0.44 0.20 75.22 16.11 3.05 0.05 0.04 1.99 2.63 0.19 Zechlin
Goblet 1738 - 1747 (n = 1) 0.5 76.78 15.10 2.21 0.05 0.03 1.67 2.27 0.15
Germany b
Potsdam a1 15th - 17th c. (n = 20) 1.0 2.7 2.1 60 - 65 2.2 7.0 18.3 0.46 0.48 2.61
Goblet (n = 1) 0.92 70.04 19.69 4.78 0.12 0.19 1.84 2.09 0.24
Flute (n = 1) 0.73 68.85 20.50 5.32 0.12 0.13 1.81 2.01 0.26 Poland b Nalikobi
Goblet
c. 1740
(n = 1) 0.73 69.31 20.79 5.24 0.14 0.12 1.67 1.85 0.25
(n = 8) 7.1 2.2 1.6 63.3 0.4 15.5 7.9 0.5 0.4 0.51
Belgium c Antwerp
17th century
± 1.0 0.2 0.2 0.6 0.1 2.5 1.7 0.2 0.1
(n = 14) 6.6 1.5 0.4 72.0 n.d. 13.2 4.2 0.06 0.08 0.32 Belgium d Mechelen
17th century ± 2.1 0.5 0.2 2.5 1.1 1.6 0.01 0.02
Group 2 (n = 14) 7.7 < 2.5 1.4 65.9 < 1.0 0.6 14.4 5.8 0.08 0.55 0.33 0.05 4.0 2.5
± 1.8 0.4 1.9 0.2 2.6 1.3 0.02 0.54 0.10 0.05 2.4
Group 3a (n = 6) 7.4 < 2.5 1.6 53.6 < 1.0 0.4 14.8 7.3 0.08 0.11 0.34 0.03 14.1 2.0
The Netherlands e Groningen
1687 - 1698
± 1.9 0.4 3.3 0.4 2.4 2.2 0.02 0.07 0.13 0.01 2.9
Vessels (n = 4) 3.82 67.05 1.30 0.15 14.56 9.22 0.02 0.17 0.11 0.03 0.65 2.87 0.63
± 0.42 4.26 0.13 0.04 1.17 0.58 0.00 0.09 0.05 0.01 0.42 2.41
Rod a retortoli (n = 1) 3.80 69.33 1.27 0.29 11.47 9.86 0.03 0.09 0.10 0.03 0.10 3.60 0.86
Portugal f Coina glass factory
Window glass
1st half 18th c.
(n = 1) 4.20 59.70 1.53 0.19 18.27 9.65 0.02 0.66 0.17 0.05 0.84 4.61 0.53
a Smrcek, 1999. a1 Bronk, H. 1998. Chemisch-analytische
Untersuchungen frühneuzeitlicher Gläser
Mittel- und Südeuropas unter Anwendung
einer quasi-zerströrungsfreien
Mikroprobenahmetechnik. Mensch & Buch
Verlag, Berlin, 1998. Consulted in Smrcek,
1999. b Kunicki-Goldfinger et al., 2005. c De Raedt et al., 2002. d Van der Linden et al., 2005 e Müller & Stege, 2006 f Lopes et al., unpublished data.
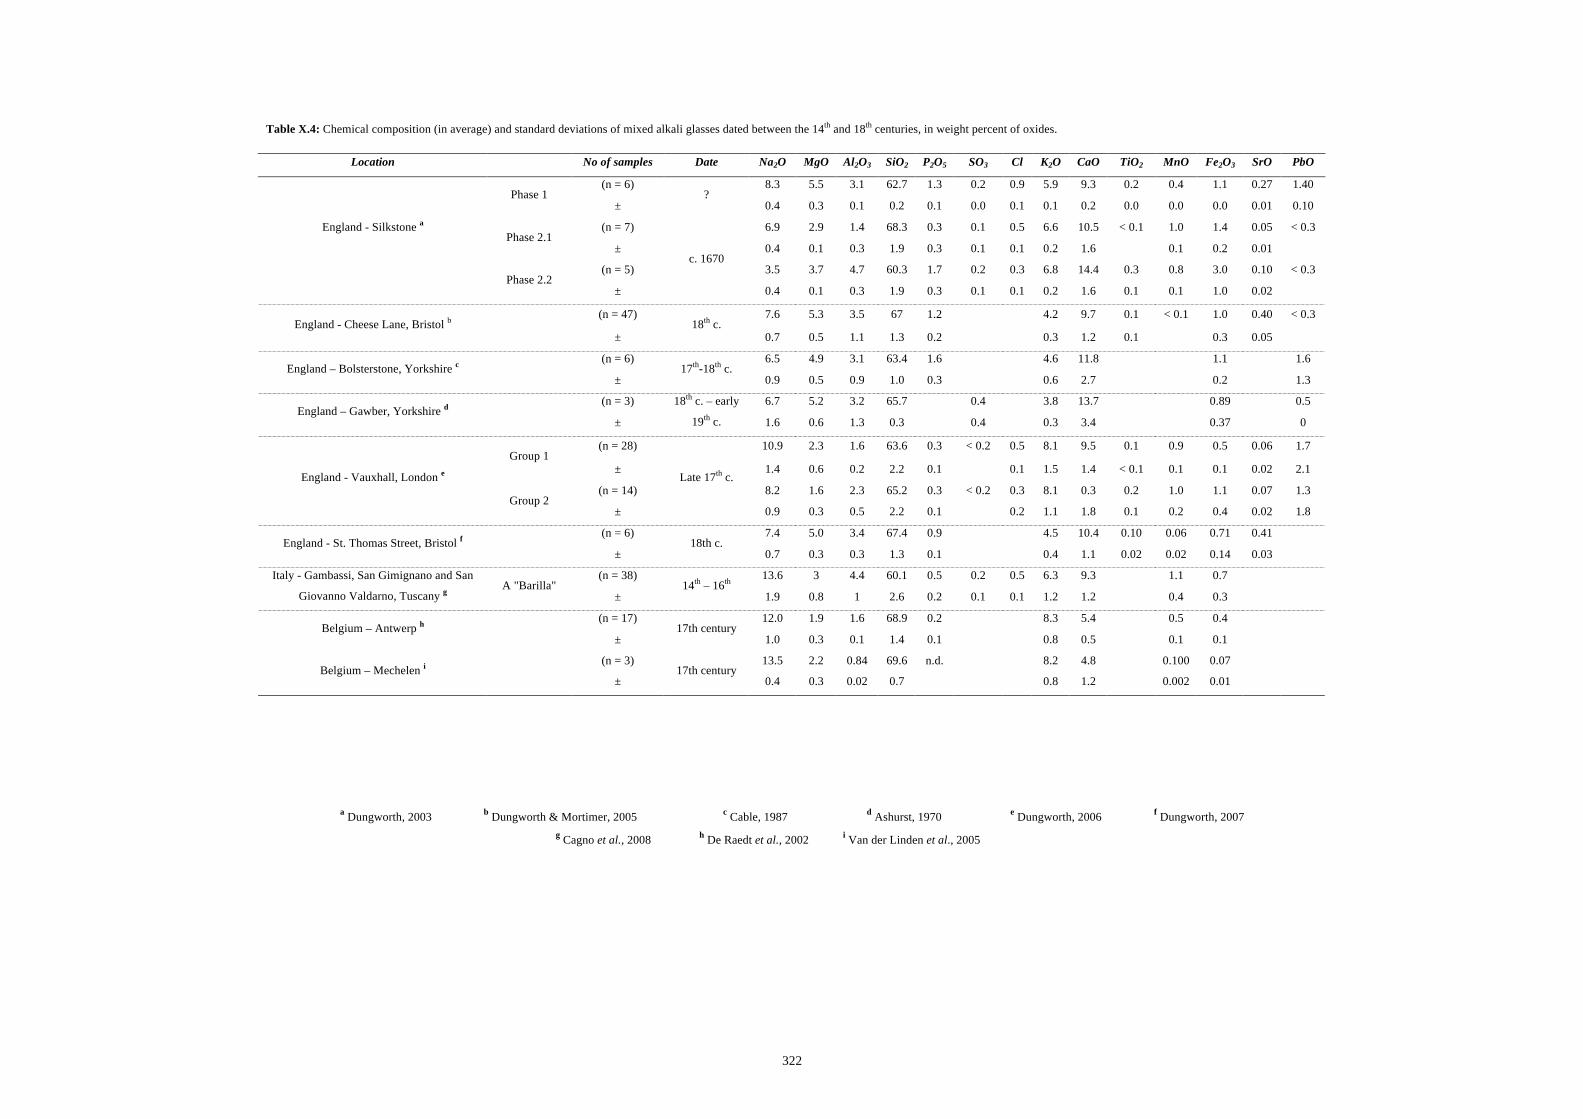
322
a Dungworth, 2003 b Dungworth & Mortimer, 2005 c Cable, 1987 d Ashurst, 1970 e Dungworth, 2006 f Dungworth, 2007 g Cagno et al., 2008 h De Raedt et al., 2002 i Van der Linden et al., 2005
Table X.4: Chemical composition (in average) and standard deviations of mixed alkali glasses dated between the 14th and 18th centuries, in weight percent of oxides.
Location No of samples Date Na2O MgO Al2O3 SiO2 P2O5 SO3 Cl K2O CaO TiO2 MnO Fe2O3 SrO PbO
(n = 6) 8.3 5.5 3.1 62.7 1.3 0.2 0.9 5.9 9.3 0.2 0.4 1.1 0.27 1.40 Phase 1
± ?
0.4 0.3 0.1 0.2 0.1 0.0 0.1 0.1 0.2 0.0 0.0 0.0 0.01 0.10
(n = 7) 6.9 2.9 1.4 68.3 0.3 0.1 0.5 6.6 10.5 < 0.1 1.0 1.4 0.05 < 0.3 Phase 2.1
± 0.4 0.1 0.3 1.9 0.3 0.1 0.1 0.2 1.6 0.1 0.2 0.01
(n = 5) 3.5 3.7 4.7 60.3 1.7 0.2 0.3 6.8 14.4 0.3 0.8 3.0 0.10 < 0.3
England - Silkstone a
Phase 2.2 ±
c. 1670
0.4 0.1 0.3 1.9 0.3 0.1 0.1 0.2 1.6 0.1 0.1 1.0 0.02
(n = 47) 7.6 5.3 3.5 67 1.2 4.2 9.7 0.1 < 0.1 1.0 0.40 < 0.3 England - Cheese Lane, Bristol b
± 18th c.
0.7 0.5 1.1 1.3 0.2 0.3 1.2 0.1 0.3 0.05
(n = 6) 6.5 4.9 3.1 63.4 1.6 4.6 11.8 1.1 1.6 England – Bolsterstone, Yorkshire c
± 17th-18th c.
0.9 0.5 0.9 1.0 0.3 0.6 2.7 0.2 1.3
(n = 3) 6.7 5.2 3.2 65.7 0.4 3.8 13.7 0.89 0.5 England – Gawber, Yorkshire d
±
18th c. – early
19th c. 1.6 0.6 1.3 0.3 0.4 0.3 3.4 0.37 0
(n = 28) 10.9 2.3 1.6 63.6 0.3 < 0.2 0.5 8.1 9.5 0.1 0.9 0.5 0.06 1.7 Group 1
± 1.4 0.6 0.2 2.2 0.1 0.1 1.5 1.4 < 0.1 0.1 0.1 0.02 2.1
(n = 14) 8.2 1.6 2.3 65.2 0.3 < 0.2 0.3 8.1 0.3 0.2 1.0 1.1 0.07 1.3 England - Vauxhall, London e
Group 2 ±
Late 17th c.
0.9 0.3 0.5 2.2 0.1 0.2 1.1 1.8 0.1 0.2 0.4 0.02 1.8
(n = 6) 7.4 5.0 3.4 67.4 0.9 4.5 10.4 0.10 0.06 0.71 0.41 England - St. Thomas Street, Bristol f
± 18th c.
0.7 0.3 0.3 1.3 0.1 0.4 1.1 0.02 0.02 0.14 0.03
(n = 38) 13.6 3 4.4 60.1 0.5 0.2 0.5 6.3 9.3 1.1 0.7 Italy - Gambassi, San Gimignano and San
Giovanno Valdarno, Tuscany g A "Barilla"
± 14th – 16th
1.9 0.8 1 2.6 0.2 0.1 0.1 1.2 1.2 0.4 0.3
(n = 17) 12.0 1.9 1.6 68.9 0.2 8.3 5.4 0.5 0.4 Belgium – Antwerp h
± 17th century
1.0 0.3 0.1 1.4 0.1 0.8 0.5 0.1 0.1
(n = 3) 13.5 2.2 0.84 69.6 n.d. 8.2 4.8 0.100 0.07 Belgium – Mechelen i
± 17th century
0.4 0.3 0.02 0.7 0.8 1.2 0.002 0.01
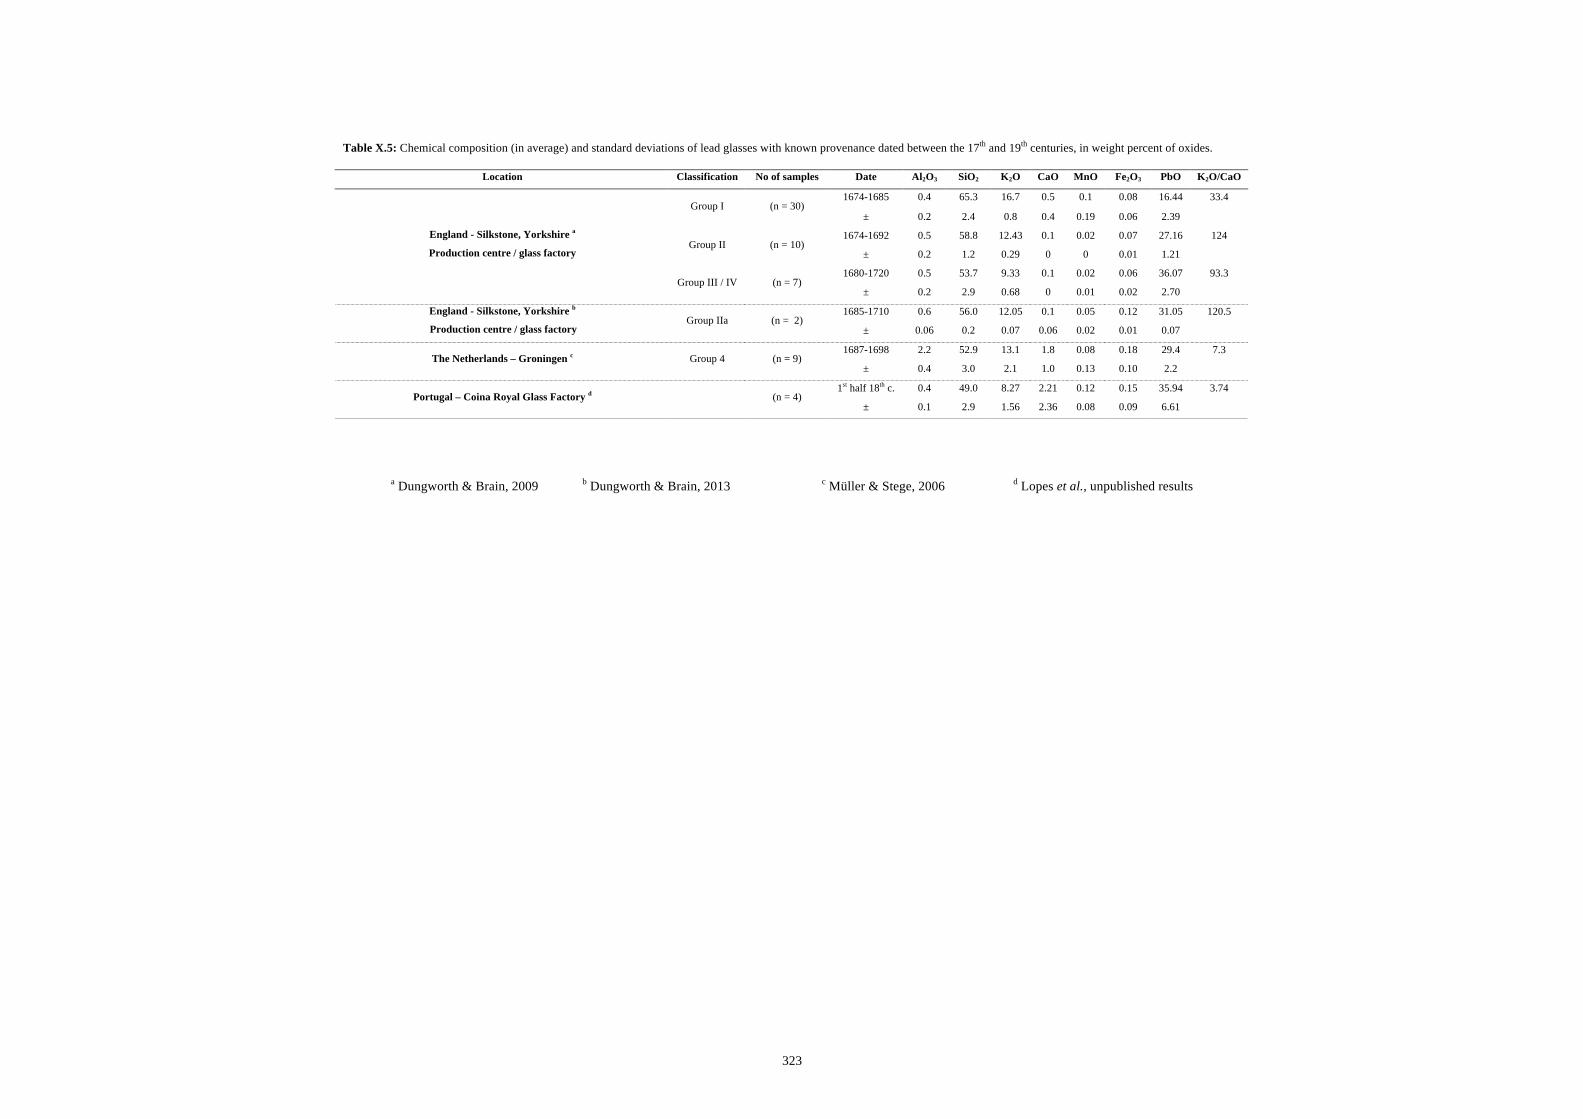
323
a Dungworth & Brain, 2009 b Dungworth & Brain, 2013 c Müller & Stege, 2006 d Lopes et al., unpublished results
Table X.5: Chemical composition (in average) and standard deviations of lead glasses with known provenance dated between the 17th and 19th centuries, in weight percent of oxides.
Location Classification No of samples Date Al2O3 SiO2 K2O CaO MnO Fe2O3 PbO K2O/CaO
1674-1685 0.4 65.3 16.7 0.5 0.1 0.08 16.44 33.4 Group I (n = 30)
± 0.2 2.4 0.8 0.4 0.19 0.06 2.39
1674-1692 0.5 58.8 12.43 0.1 0.02 0.07 27.16 124 Group II (n = 10)
± 0.2 1.2 0.29 0 0 0.01 1.21
1680-1720 0.5 53.7 9.33 0.1 0.02 0.06 36.07 93.3
England - Silkstone, Yorkshire a
Production centre / glass factory
Group III / IV (n = 7) ± 0.2 2.9 0.68 0 0.01 0.02 2.70
1685-1710 0.6 56.0 12.05 0.1 0.05 0.12 31.05 120.5 England - Silkstone, Yorkshire b
Production centre / glass factory Group IIa (n = 2)
± 0.06 0.2 0.07 0.06 0.02 0.01 0.07
1687-1698 2.2 52.9 13.1 1.8 0.08 0.18 29.4 7.3 The Netherlands – Groningen c Group 4 (n = 9)
± 0.4 3.0 2.1 1.0 0.13 0.10 2.2
1st half 18th c. 0.4 49.0 8.27 2.21 0.12 0.15 35.94 3.74 Portugal – Coina Royal Glass Factory d
(n = 4)
± 0.1 2.9 1.56 2.36 0.08 0.09 6.61

324
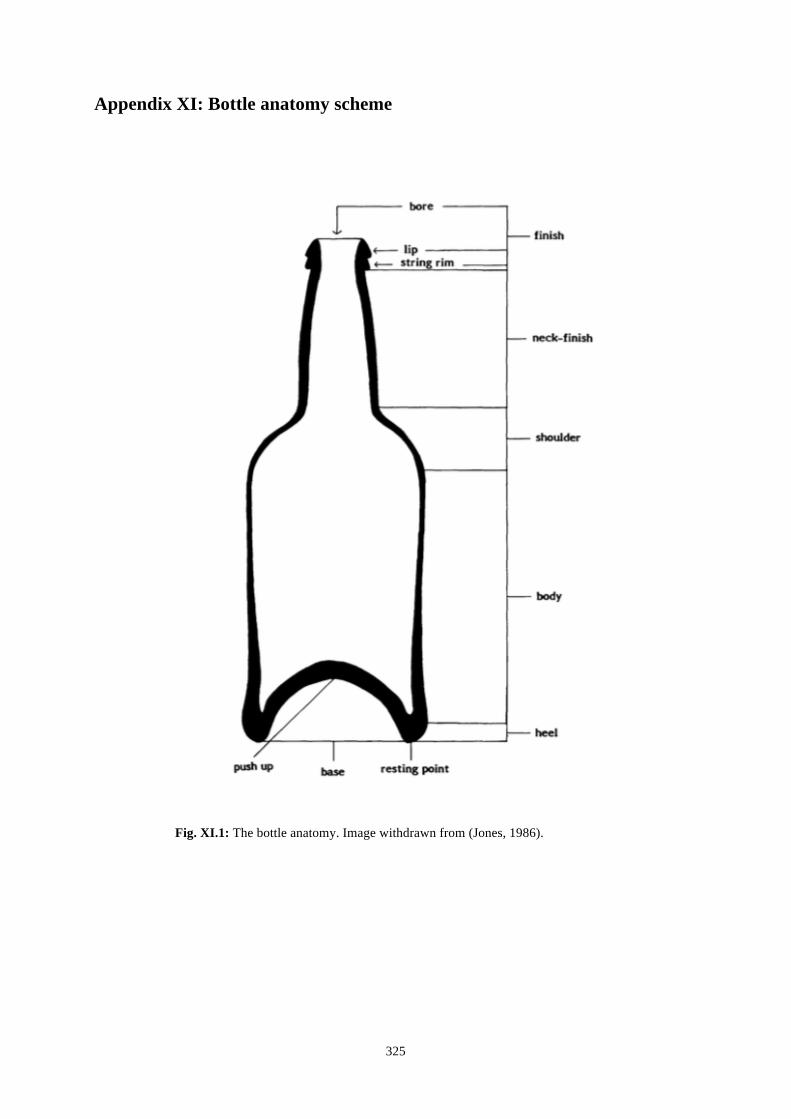
! 325!
Appendix XI: Bottle anatomy scheme !!!!
!!!
Fig. XI.1: The bottle anatomy. Image withdrawn from (Jones, 1986). !!!!!!!!!

! 326!
!
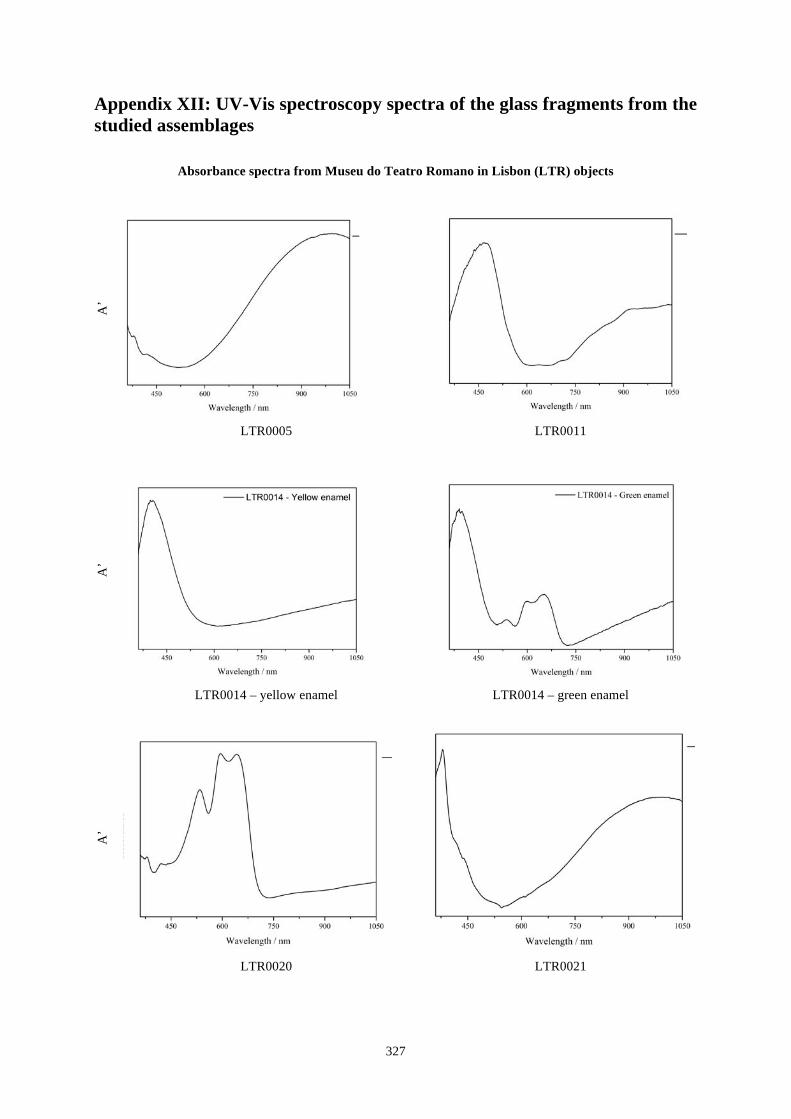
! 327!
Appendix XII: UV-Vis spectroscopy spectra of the glass fragments from the studied assemblages
Absorbance spectra from Museu do Teatro Romano in Lisbon (LTR) objects
A’
LTR0005 LTR0011
A’
LTR0014 – yellow enamel LTR0014 – green enamel
A’
LTR0020 LTR0021
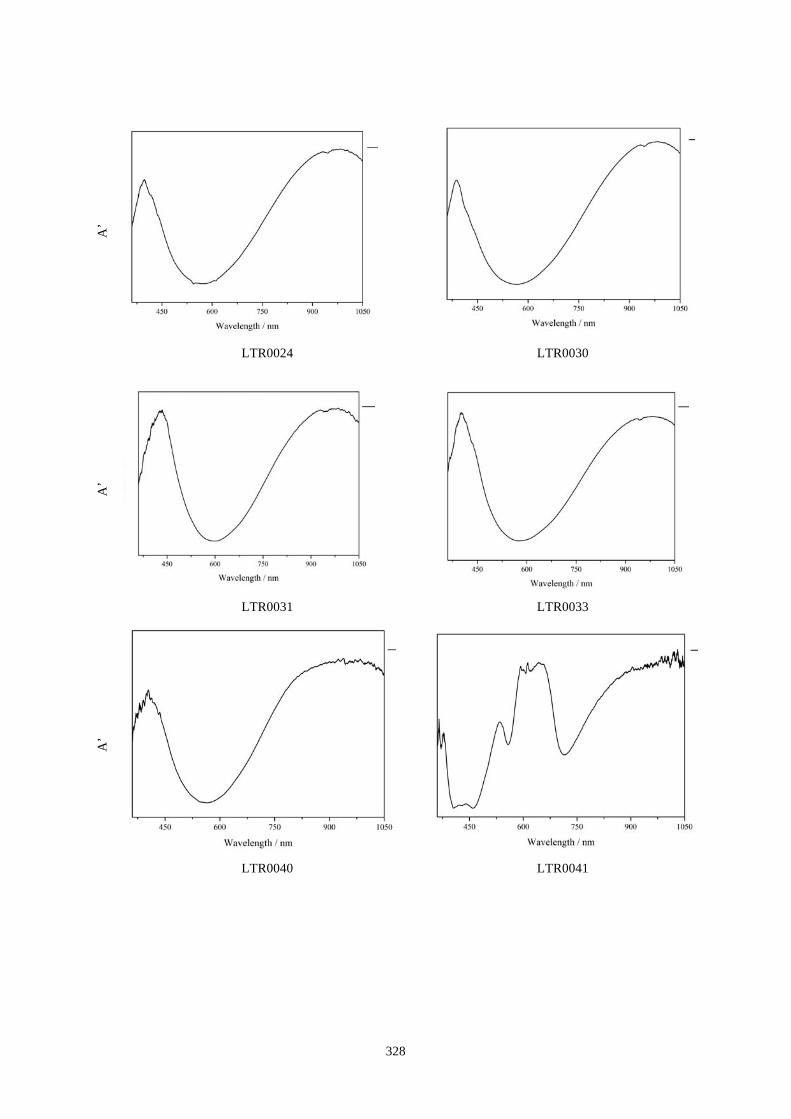
! 328!
A
’
LTR0024 LTR0030
A’
LTR0031 LTR0033
A’
LTR0040 LTR0041
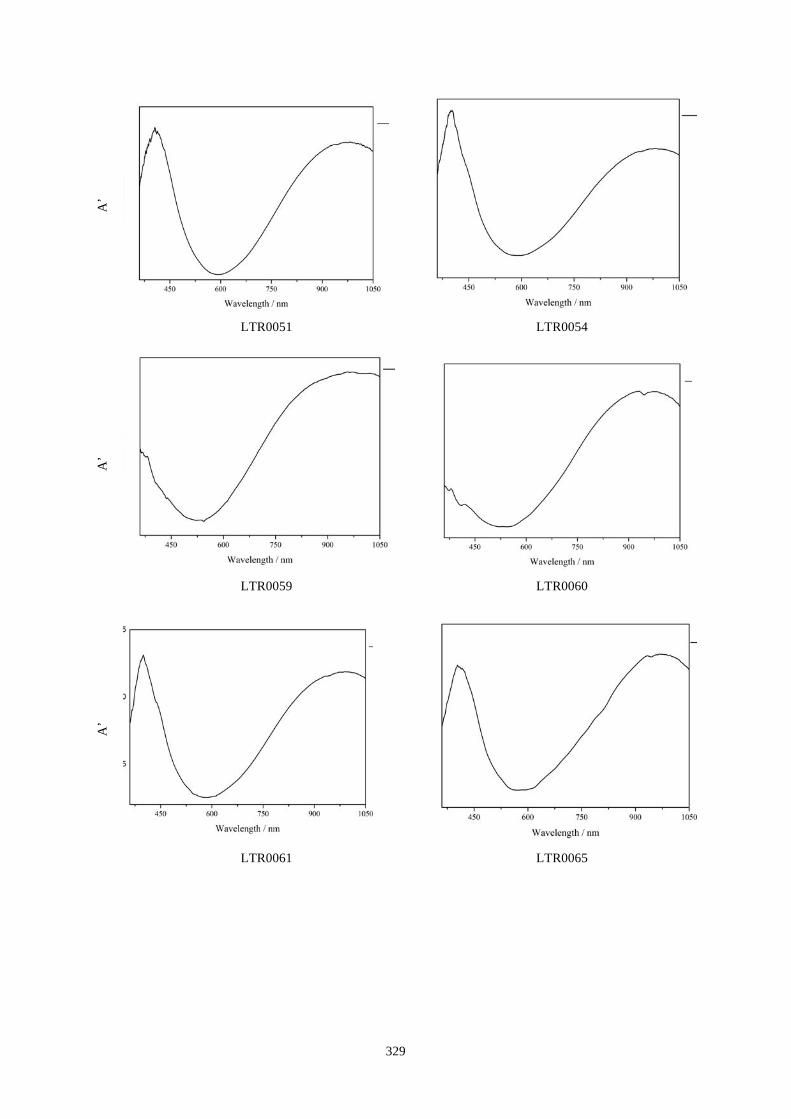
! 329!
A’
LTR0051 LTR0054
A’
LTR0059 LTR0060
A’
LTR0061 LTR0065
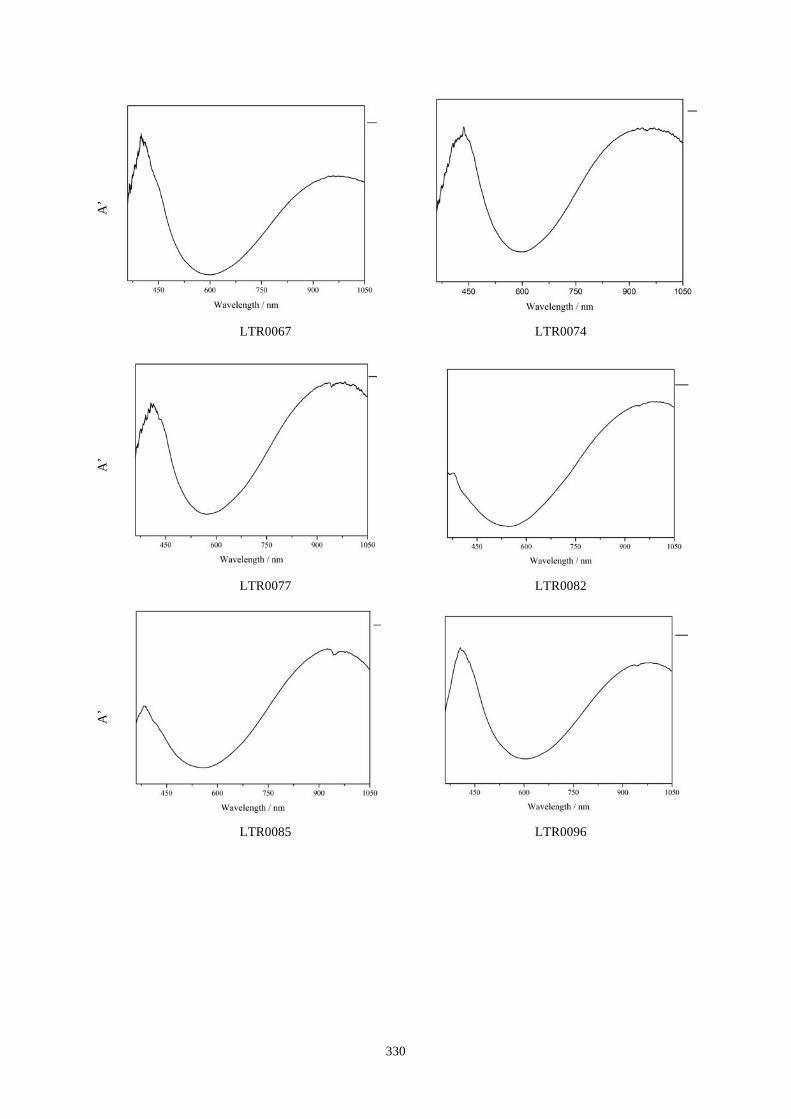
! 330!
A’
LTR0067 LTR0074
A’
LTR0077 LTR0082
A’
LTR0085 LTR0096
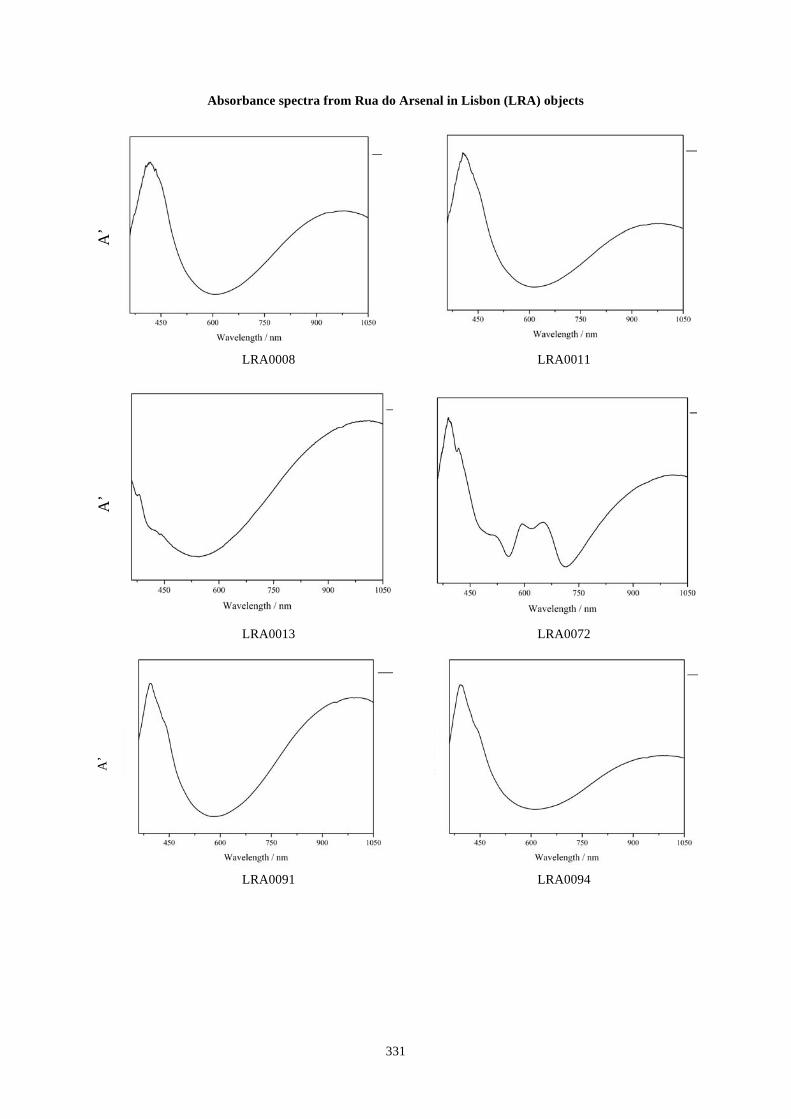
! 331!
Absorbance spectra from Rua do Arsenal in Lisbon (LRA) objects A
’
LRA0008 LRA0011
A’
LRA0013 LRA0072
A’
LRA0091 LRA0094
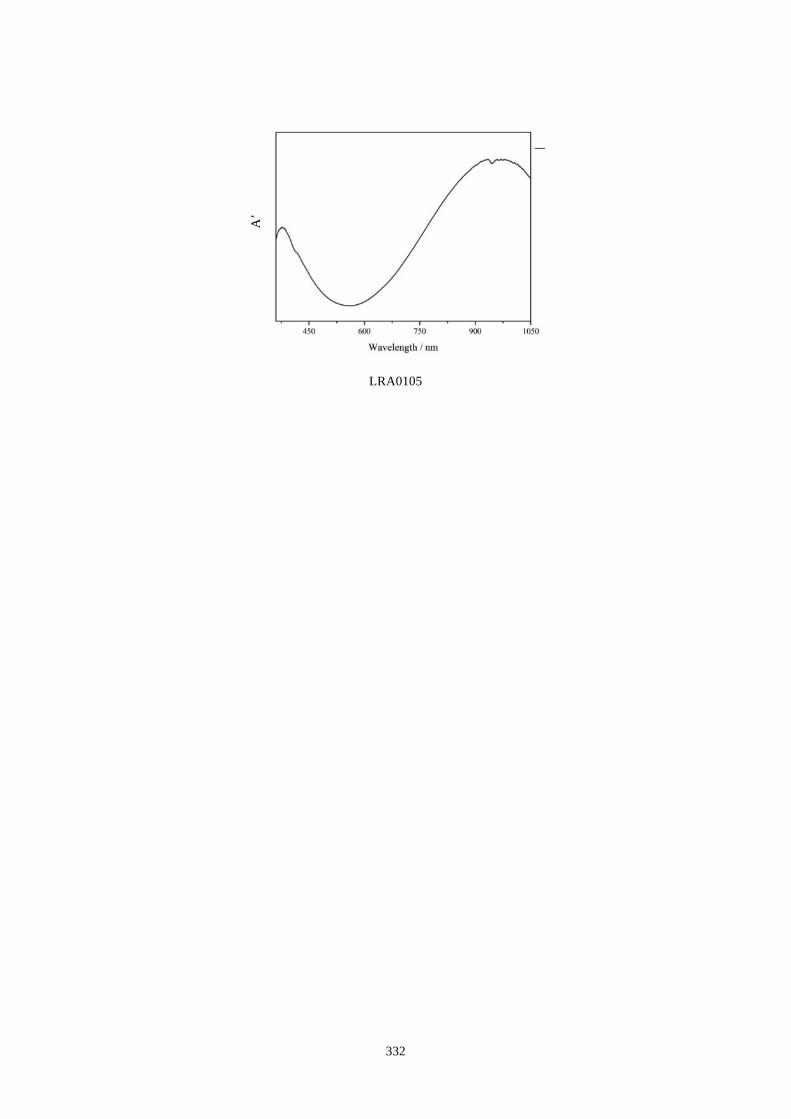
! 332!
LRA0105
A’
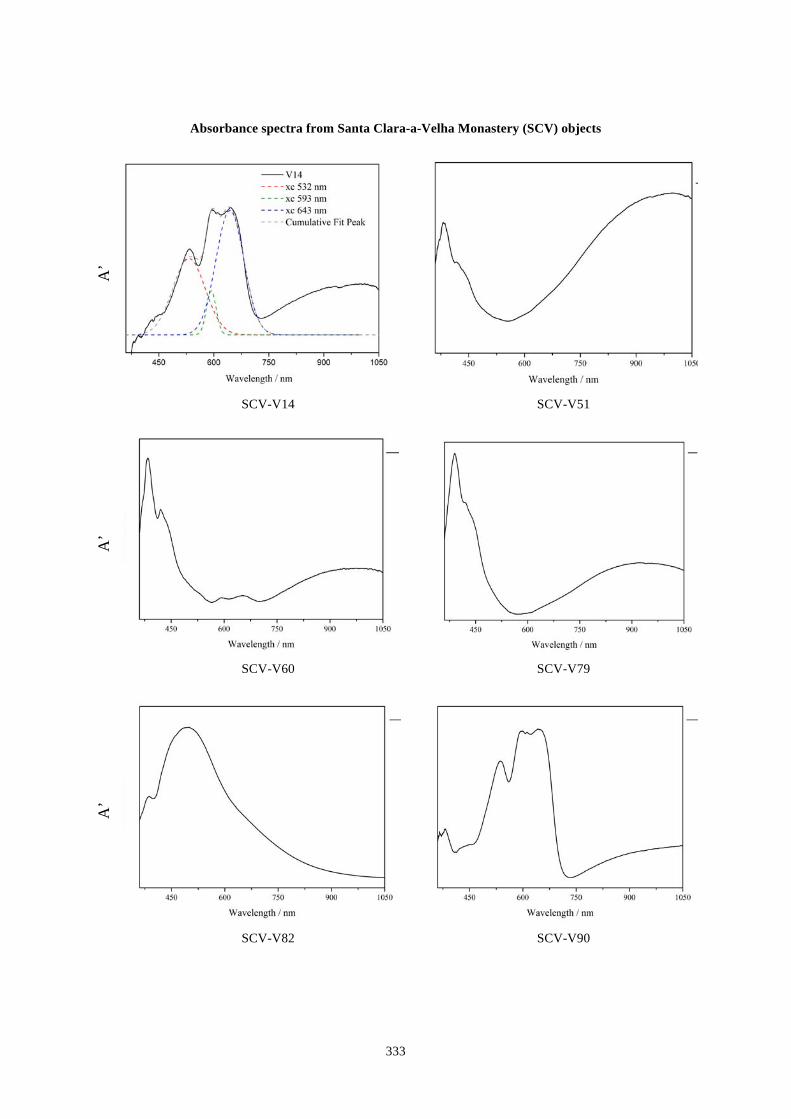
! 333!
Absorbance spectra from Santa Clara-a-Velha Monastery (SCV) objects
A’
SCV-V14 SCV-V51
A’
SCV-V60 SCV-V79
A’
SCV-V82 SCV-V90
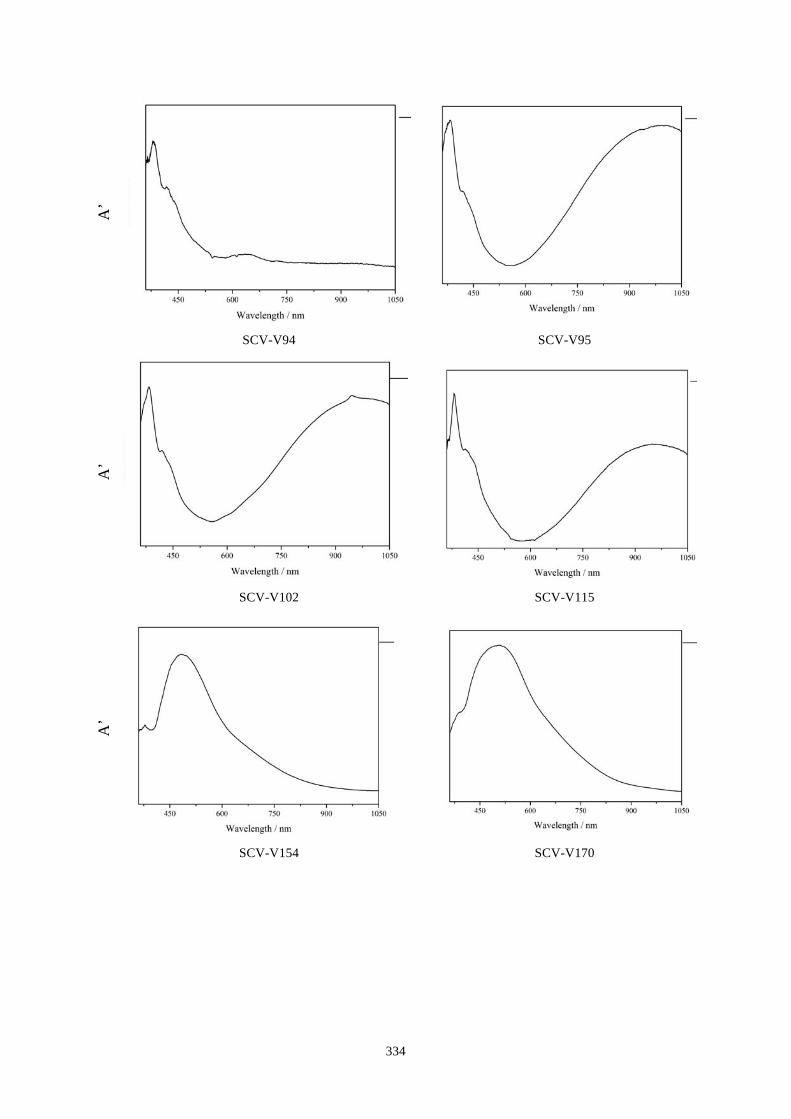
! 334!
A’
SCV-V94 SCV-V95
A’
SCV-V102 SCV-V115
A’
SCV-V154 SCV-V170
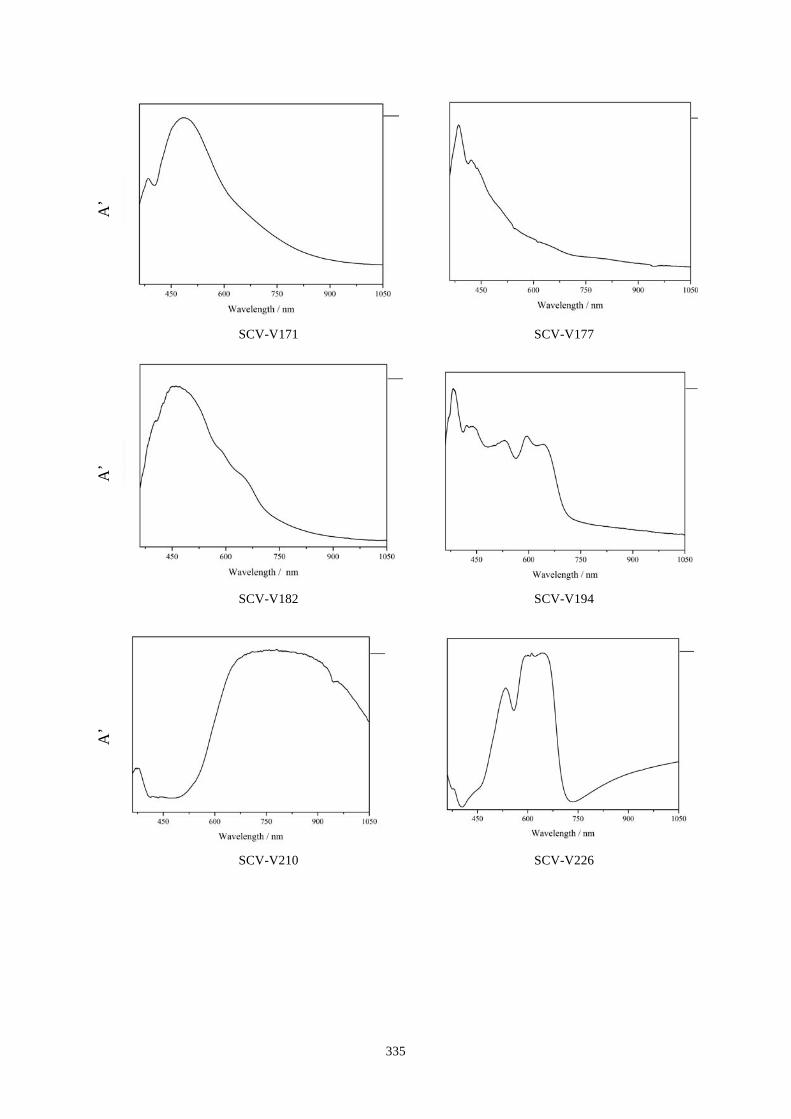
! 335!
A’
SCV-V171 SCV-V177
A’
SCV-V182 SCV-V194
A’
SCV-V210 SCV-V226
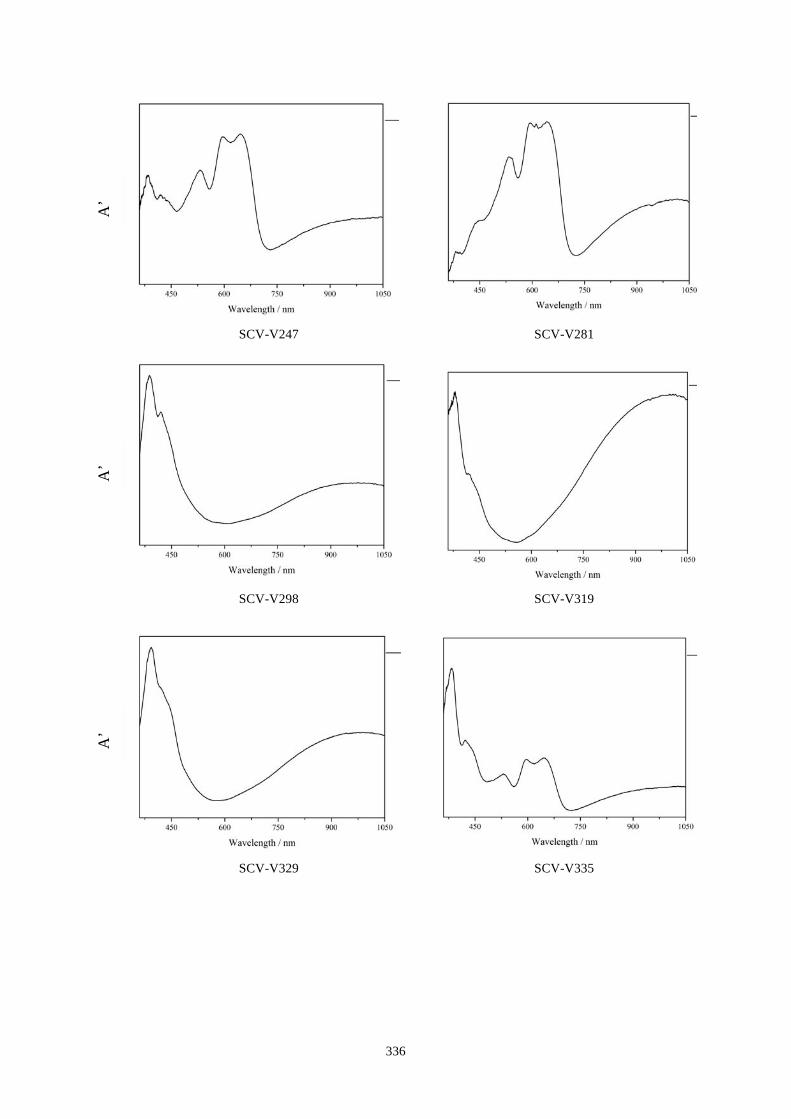
! 336!
A’
SCV-V247 SCV-V281
A’
SCV-V298 SCV-V319
A’
SCV-V329 SCV-V335
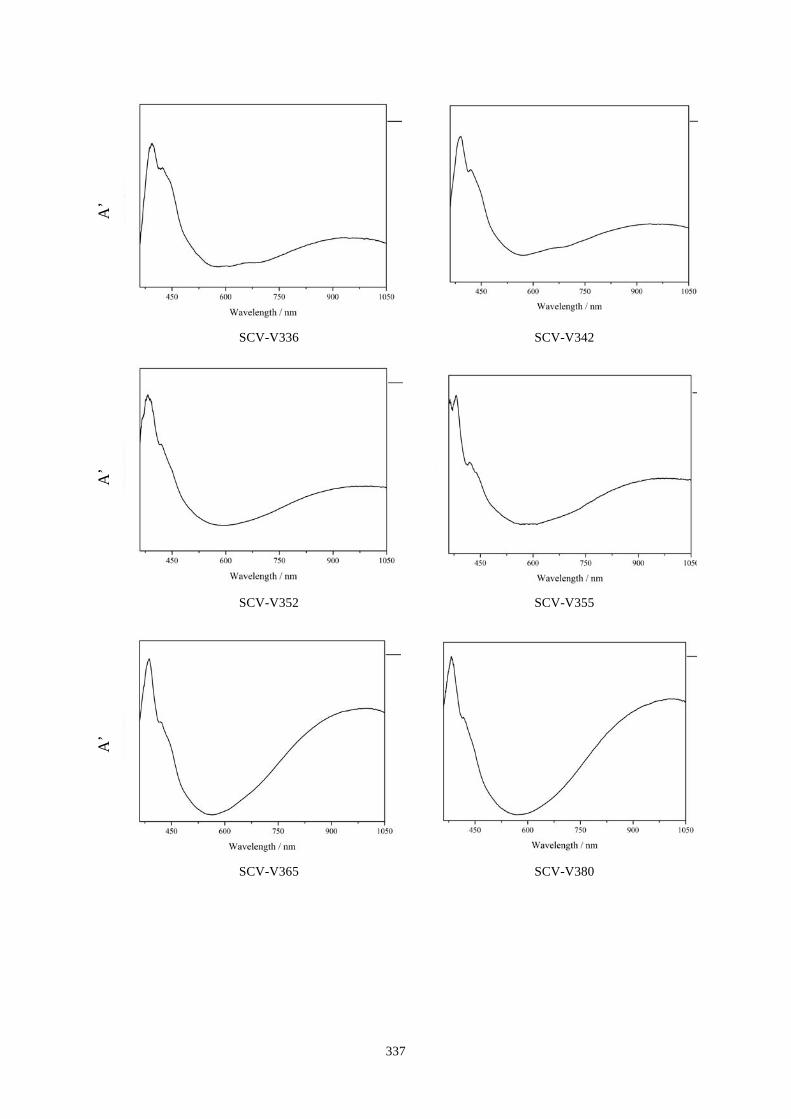
! 337!
A’
SCV-V336 SCV-V342
A’
SCV-V352 SCV-V355
A’
SCV-V365 SCV-V380
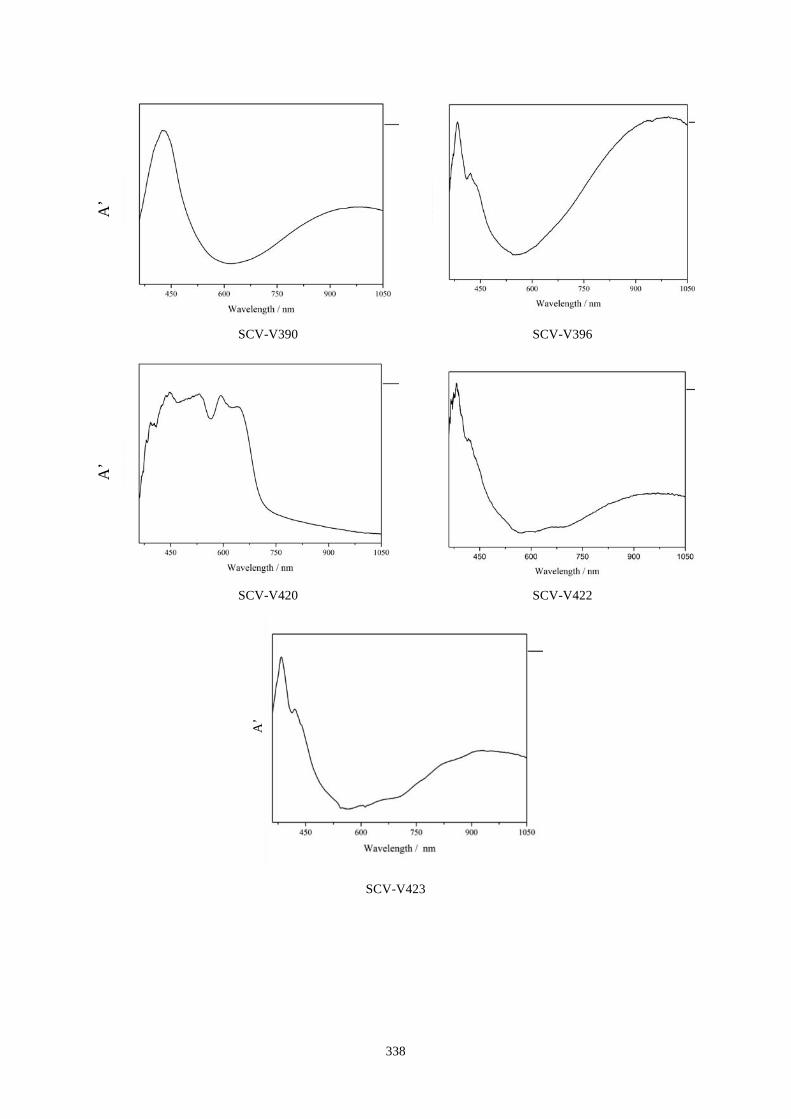
! 338!
A’
SCV-V390 SCV-V396
A’
SCV-V420 SCV-V422
SCV-V423
A’
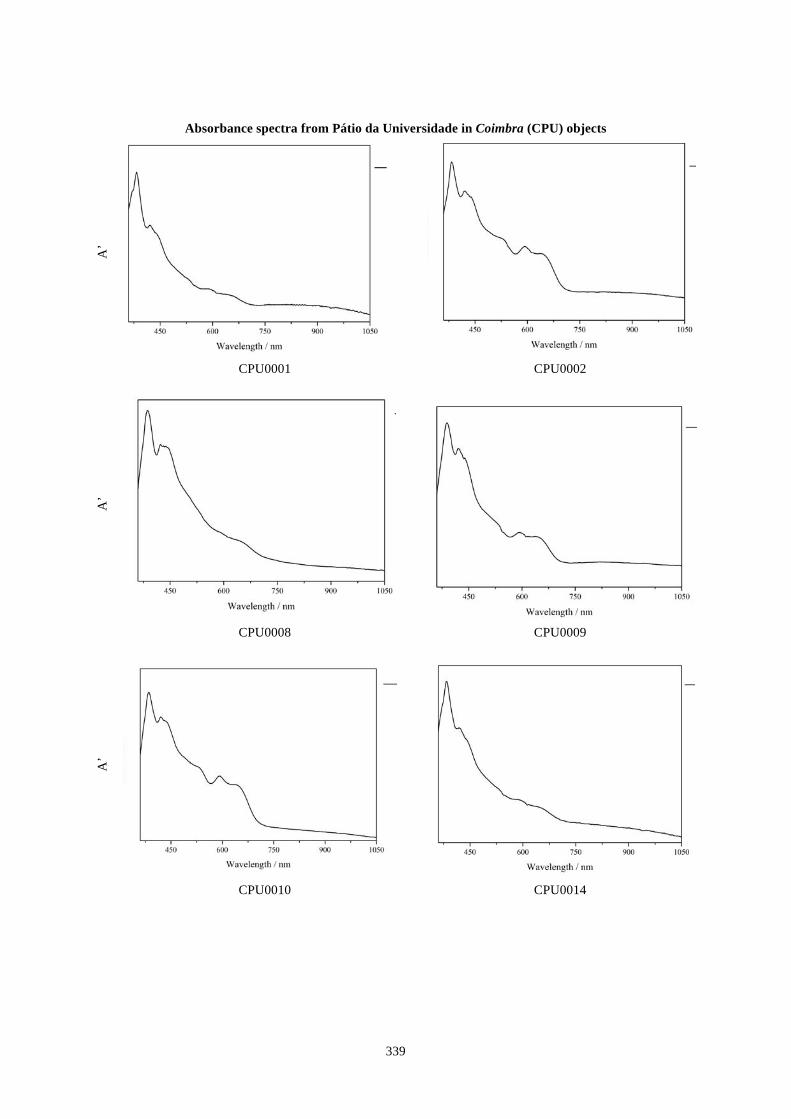
! 339!
Absorbance spectra from Pátio da Universidade in Coimbra (CPU) objects
A’
CPU0001 CPU0002
A’
CPU0008 CPU0009
A’
CPU0010 CPU0014
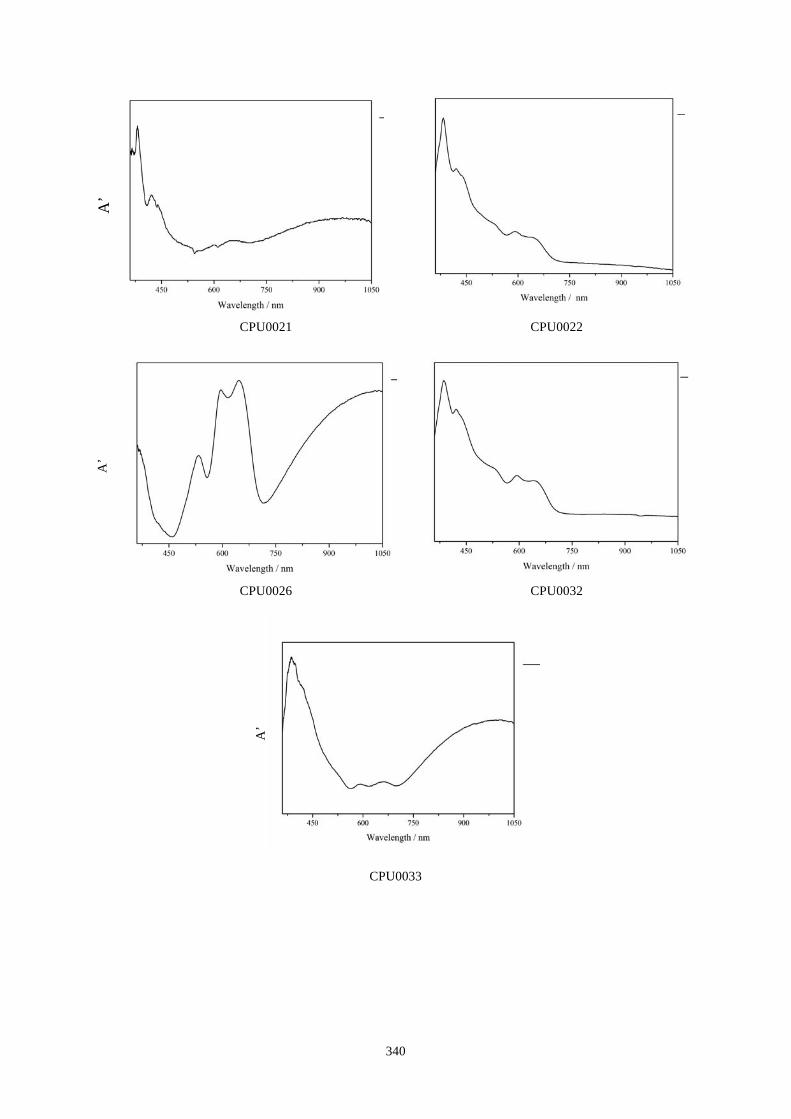
! 340!
A’
CPU0021 CPU0022
A’
CPU0026 CPU0032
CPU0033
A’
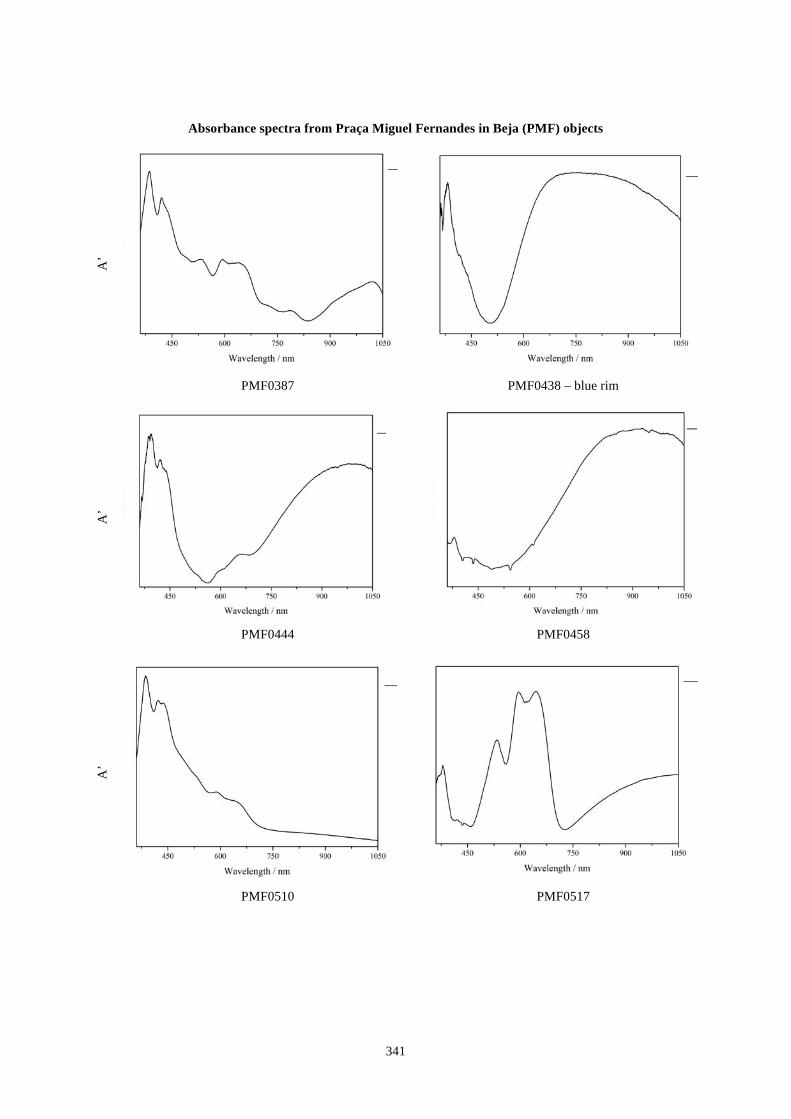
! 341!
Absorbance spectra from Praça Miguel Fernandes in Beja (PMF) objects
A’
PMF0387 PMF0438 – blue rim
A’
PMF0444 PMF0458
A’
PMF0510 PMF0517
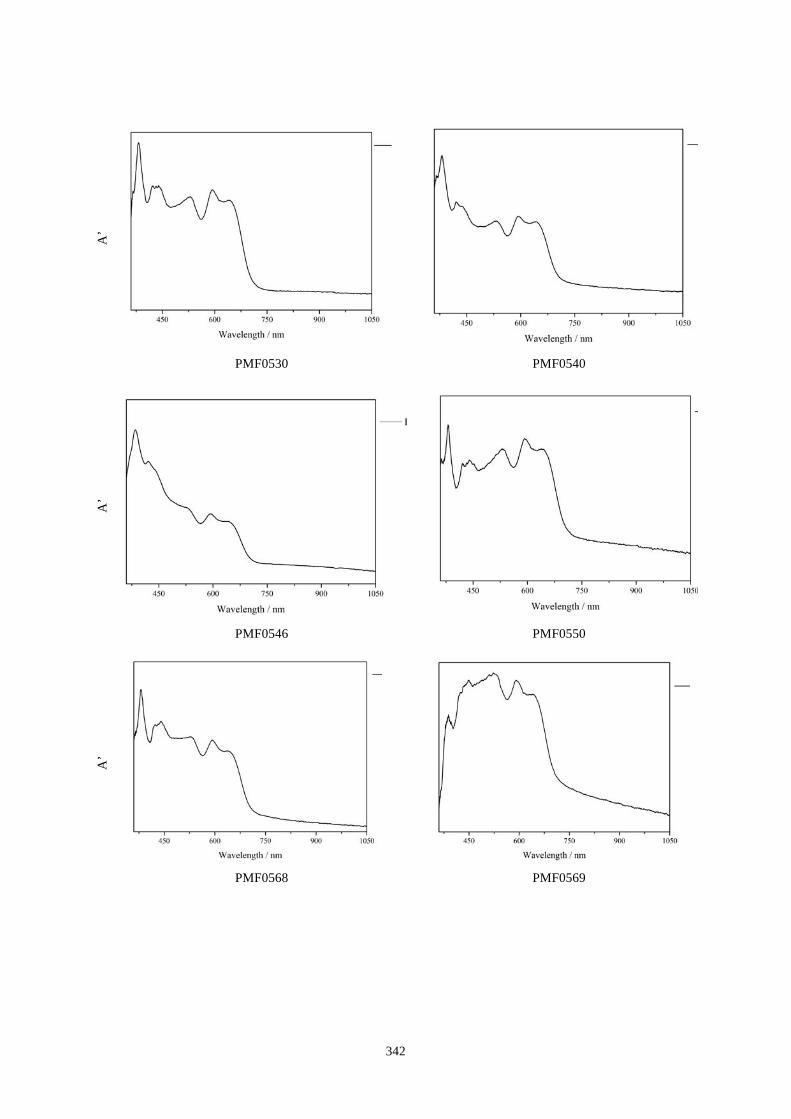
! 342!
A
’
PMF0530 PMF0540
A’
PMF0546 PMF0550
A’
PMF0568 PMF0569
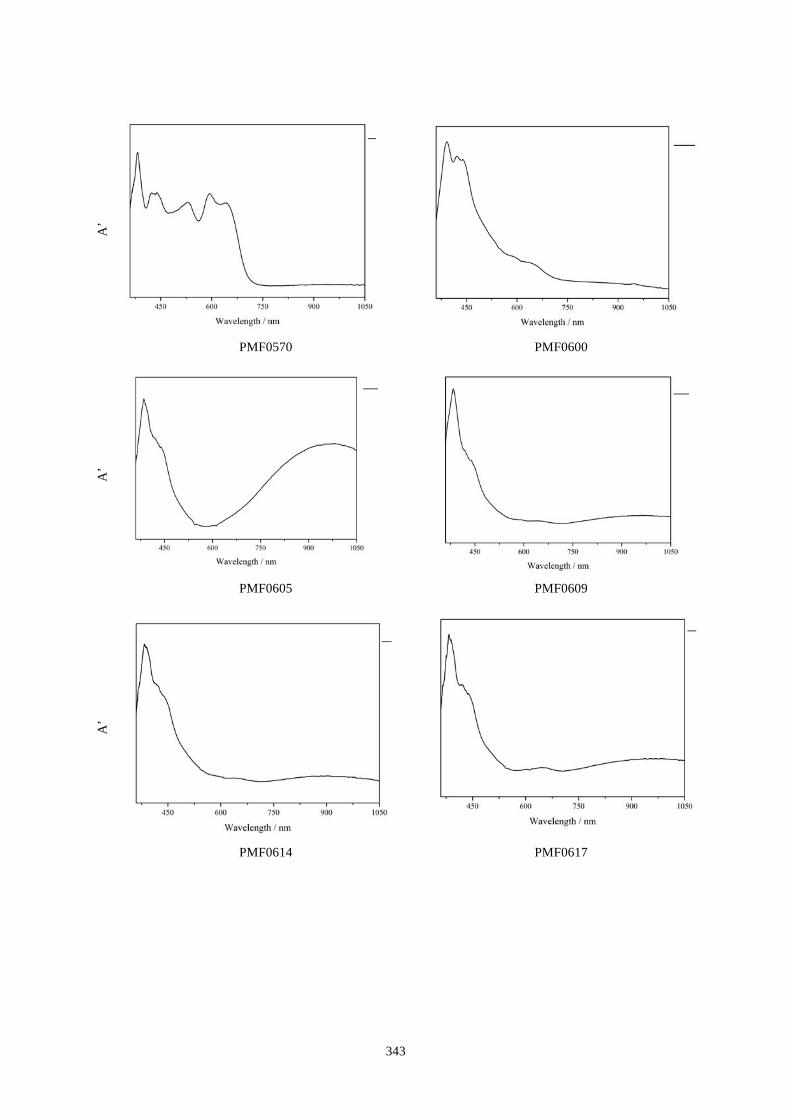
! 343!
A
’
PMF0570 PMF0600
A’
PMF0605 PMF0609
A’
PMF0614 PMF0617
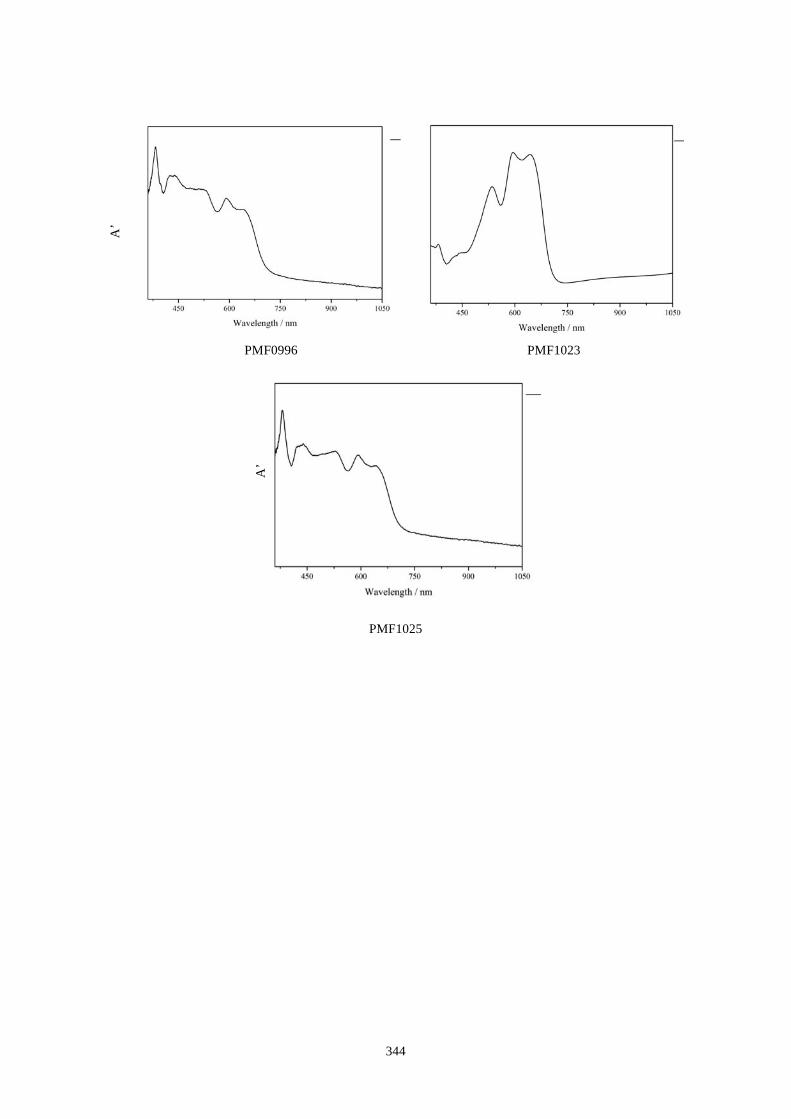
! 344!
A
’
PMF0996 PMF1023
PMF1025
A’
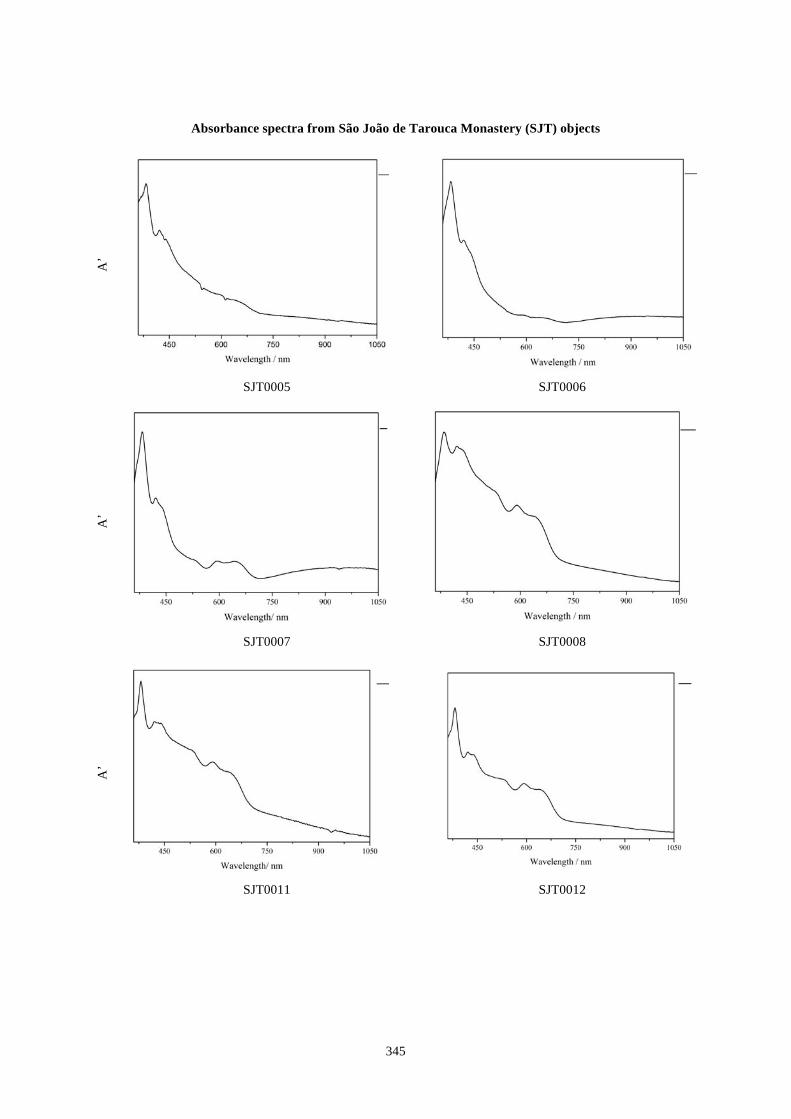
! 345!
Absorbance spectra from São João de Tarouca Monastery (SJT) objects
A’
SJT0005 SJT0006
A’
SJT0007 SJT0008
A’
SJT0011 SJT0012
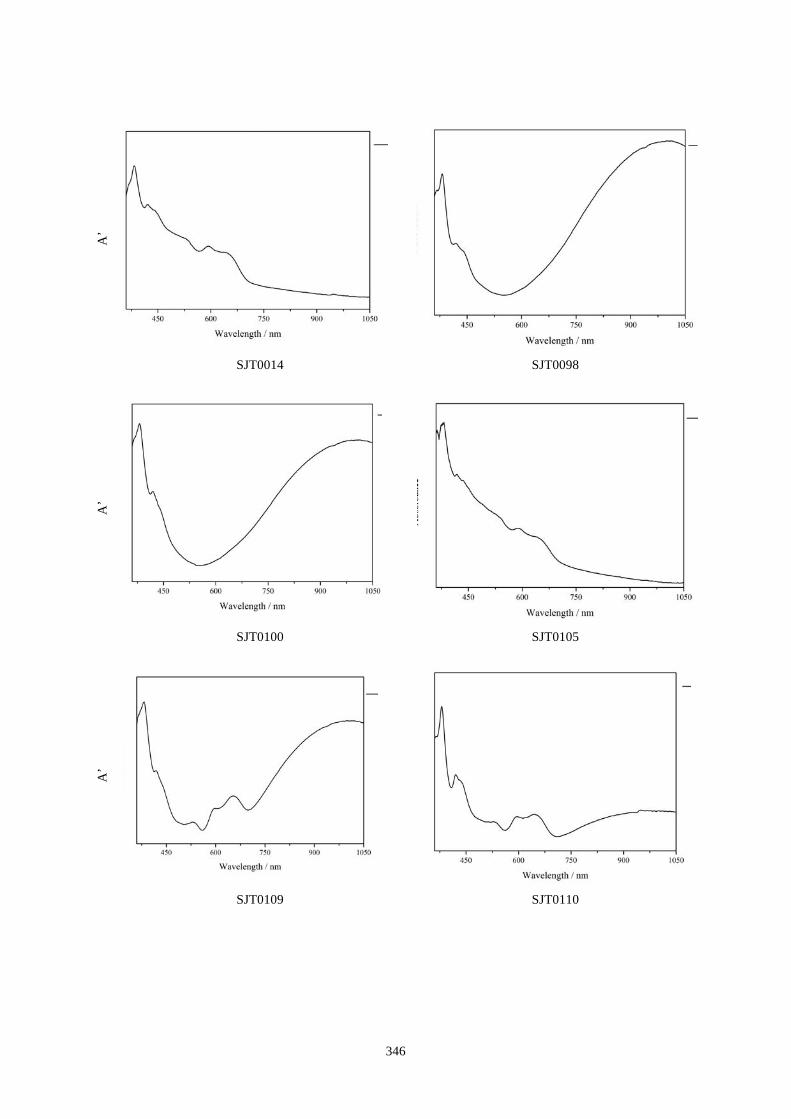
! 346!
A
’
SJT0014 SJT0098
A’
SJT0100 SJT0105
A’
SJT0109 SJT0110
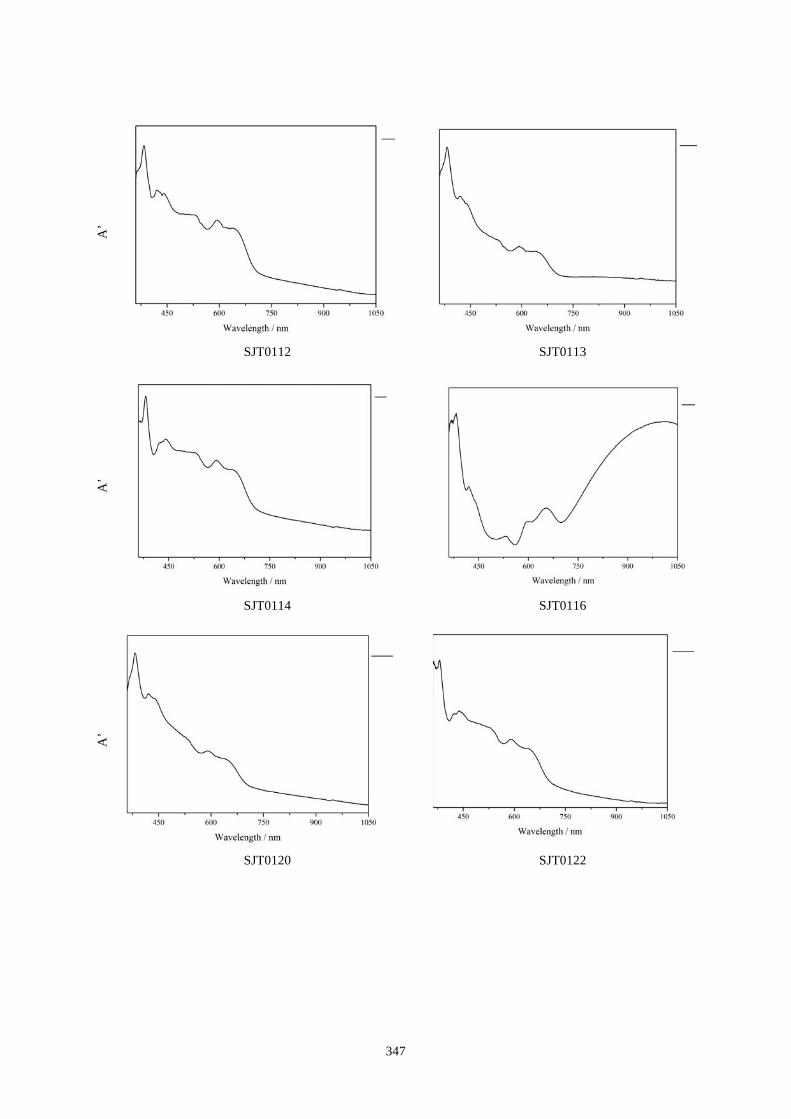
! 347!
A
’
SJT0112 SJT0113
A’
SJT0114 SJT0116
A’
SJT0120 SJT0122
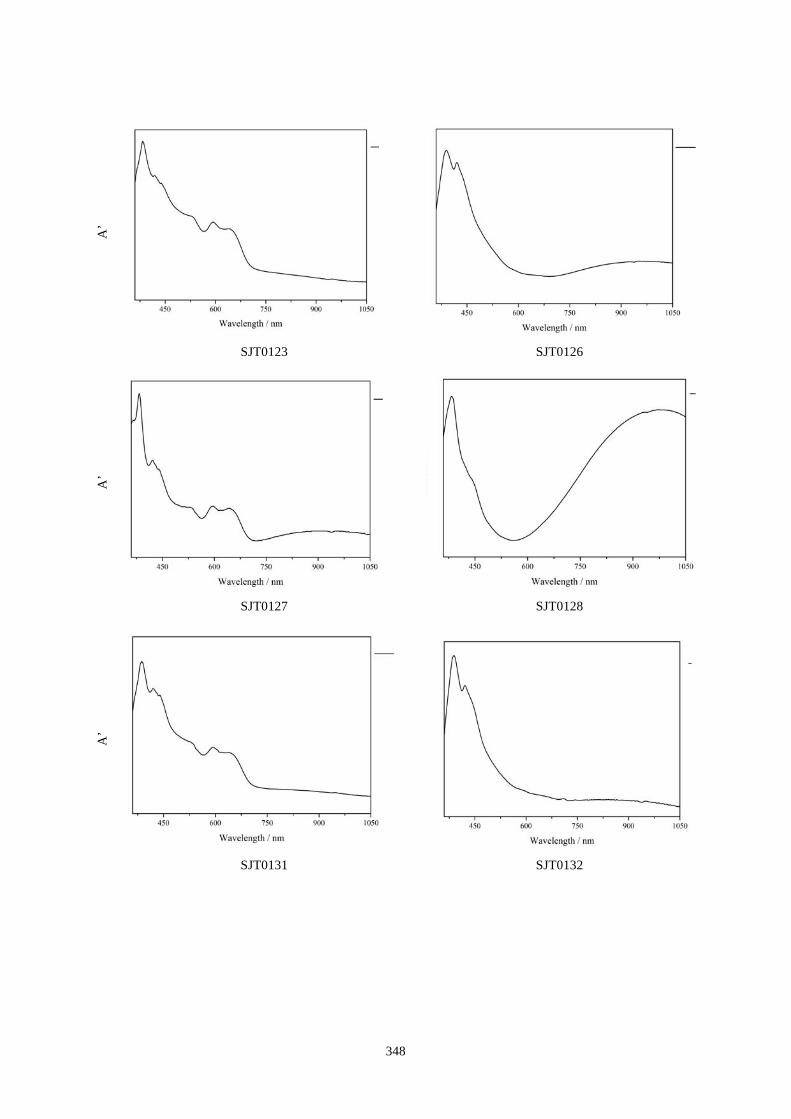
! 348!
A
’
SJT0123 SJT0126
A’
SJT0127 SJT0128
A’
SJT0131 SJT0132
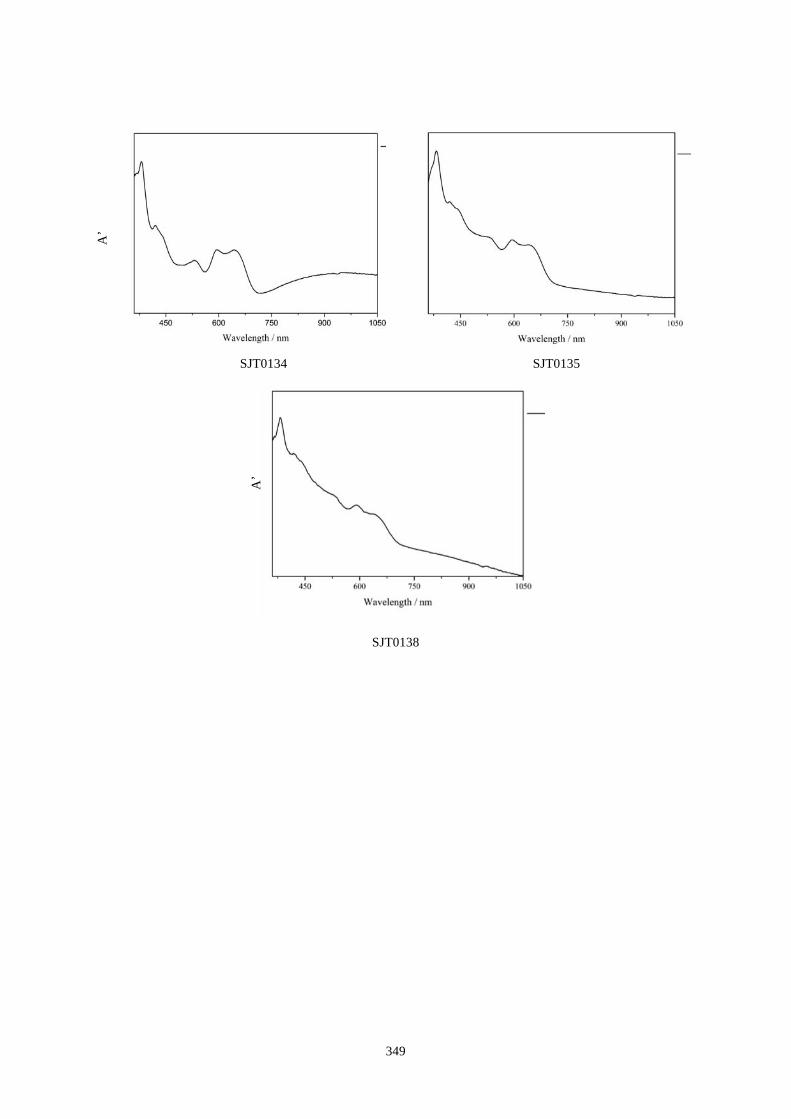
! 349!
A
’
SJT0134 SJT0135
SJT0138
A’

! 350!
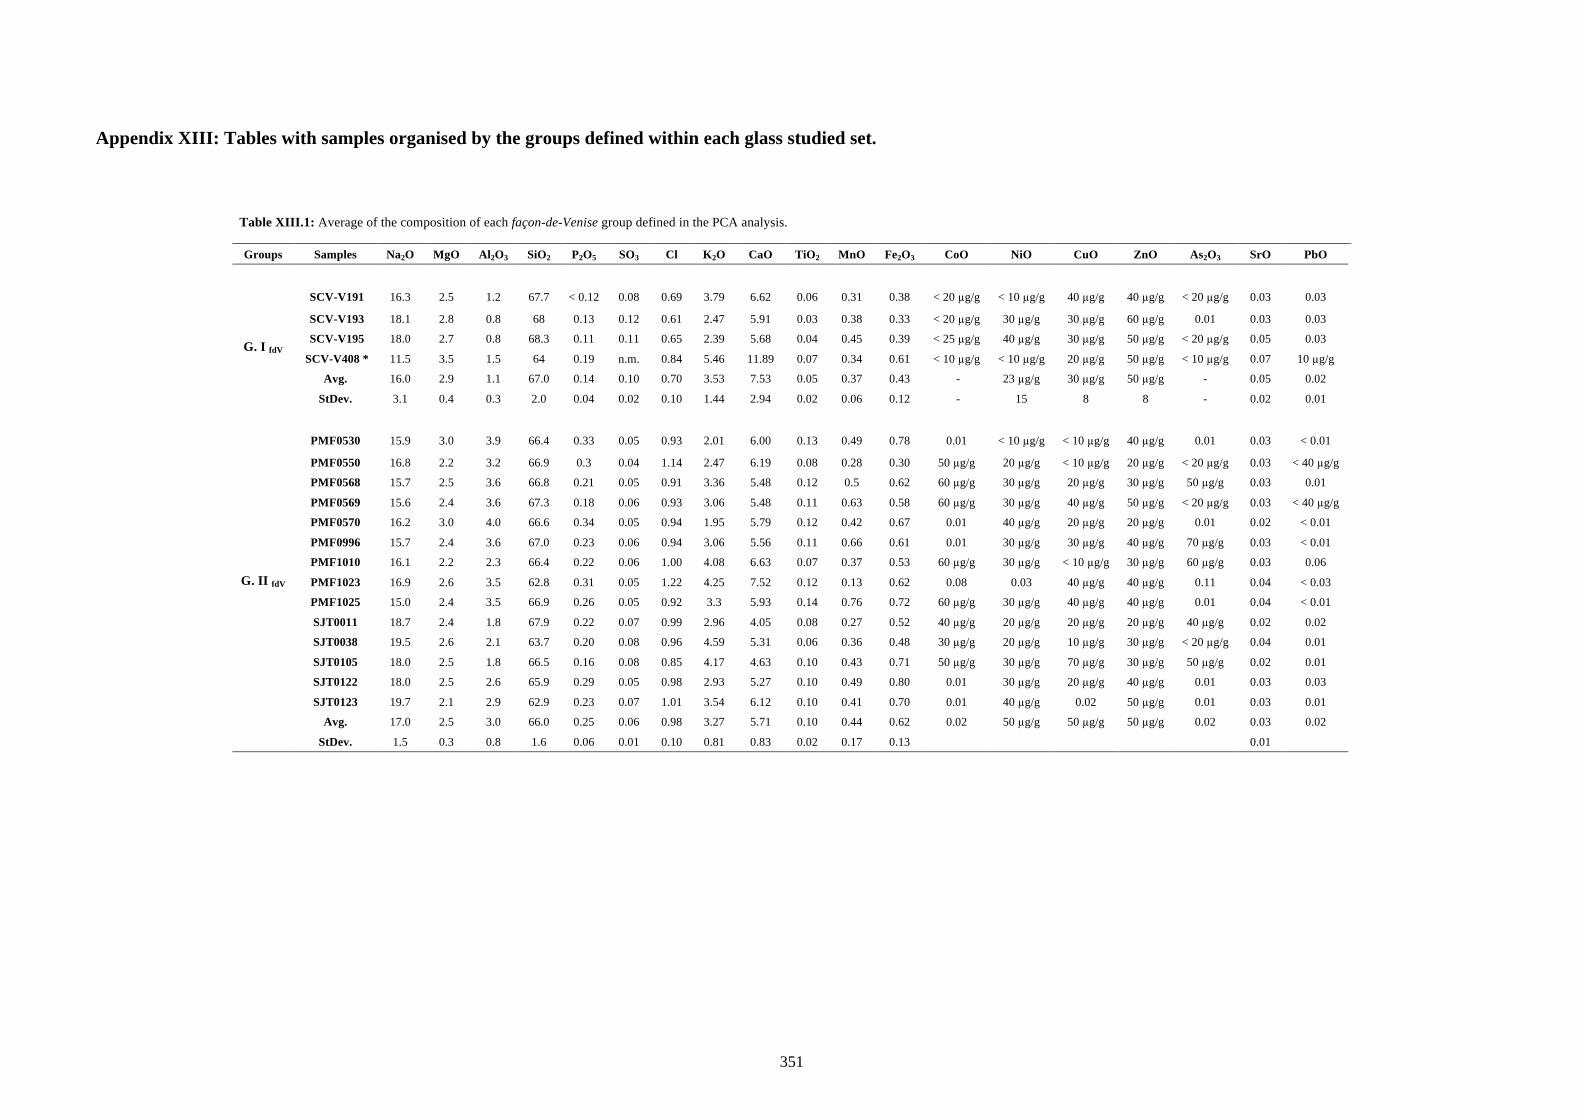
351
Appendix XIII: Tables with samples organised by the groups defined within each glass studied set.
Table XIII.1: Average of the composition of each façon-de-Venise group defined in the PCA analysis. Groups Samples Na2O MgO Al2O3 SiO2 P2O5 SO3 Cl K2O CaO TiO2 MnO Fe2O3 CoO NiO CuO ZnO As2O3 SrO PbO
G. I fdV
SCV-V191 16.3 2.5 1.2 67.7 < 0.12 0.08 0.69 3.79 6.62 0.06 0.31 0.38 < 20 µg/g < 10 µg/g 40 µg/g 40 µg/g < 20 µg/g 0.03 0.03
SCV-V193 18.1 2.8 0.8 68 0.13 0.12 0.61 2.47 5.91 0.03 0.38 0.33 < 20 µg/g 30 µg/g 30 µg/g 60 µg/g 0.01 0.03 0.03
SCV-V195 18.0 2.7 0.8 68.3 0.11 0.11 0.65 2.39 5.68 0.04 0.45 0.39 < 25 µg/g 40 µg/g 30 µg/g 50 µg/g < 20 µg/g 0.05 0.03
SCV-V408 * 11.5 3.5 1.5 64 0.19 n.m. 0.84 5.46 11.89 0.07 0.34 0.61 < 10 µg/g < 10 µg/g 20 µg/g 50 µg/g < 10 µg/g 0.07 10 µg/g
Avg. 16.0 2.9 1.1 67.0 0.14 0.10 0.70 3.53 7.53 0.05 0.37 0.43 - 23 µg/g 30 µg/g 50 µg/g - 0.05 0.02
StDev. 3.1 0.4 0.3 2.0 0.04 0.02 0.10 1.44 2.94 0.02 0.06 0.12 - 15 8 8 - 0.02 0.01
G. II fdV
PMF0530 15.9 3.0 3.9 66.4 0.33 0.05 0.93 2.01 6.00 0.13 0.49 0.78 0.01 < 10 µg/g < 10 µg/g 40 µg/g 0.01 0.03 < 0.01
PMF0550 16.8 2.2 3.2 66.9 0.3 0.04 1.14 2.47 6.19 0.08 0.28 0.30 50 µg/g 20 µg/g < 10 µg/g 20 µg/g < 20 µg/g 0.03 < 40 µg/g
PMF0568 15.7 2.5 3.6 66.8 0.21 0.05 0.91 3.36 5.48 0.12 0.5 0.62 60 µg/g 30 µg/g 20 µg/g 30 µg/g 50 µg/g 0.03 0.01
PMF0569 15.6 2.4 3.6 67.3 0.18 0.06 0.93 3.06 5.48 0.11 0.63 0.58 60 µg/g 30 µg/g 40 µg/g 50 µg/g < 20 µg/g 0.03 < 40 µg/g
PMF0570 16.2 3.0 4.0 66.6 0.34 0.05 0.94 1.95 5.79 0.12 0.42 0.67 0.01 40 µg/g 20 µg/g 20 µg/g 0.01 0.02 < 0.01
PMF0996 15.7 2.4 3.6 67.0 0.23 0.06 0.94 3.06 5.56 0.11 0.66 0.61 0.01 30 µg/g 30 µg/g 40 µg/g 70 µg/g 0.03 < 0.01
PMF1010 16.1 2.2 2.3 66.4 0.22 0.06 1.00 4.08 6.63 0.07 0.37 0.53 60 µg/g 30 µg/g < 10 µg/g 30 µg/g 60 µg/g 0.03 0.06
PMF1023 16.9 2.6 3.5 62.8 0.31 0.05 1.22 4.25 7.52 0.12 0.13 0.62 0.08 0.03 40 µg/g 40 µg/g 0.11 0.04 < 0.03
PMF1025 15.0 2.4 3.5 66.9 0.26 0.05 0.92 3.3 5.93 0.14 0.76 0.72 60 µg/g 30 µg/g 40 µg/g 40 µg/g 0.01 0.04 < 0.01
SJT0011 18.7 2.4 1.8 67.9 0.22 0.07 0.99 2.96 4.05 0.08 0.27 0.52 40 µg/g 20 µg/g 20 µg/g 20 µg/g 40 µg/g 0.02 0.02
SJT0038 19.5 2.6 2.1 63.7 0.20 0.08 0.96 4.59 5.31 0.06 0.36 0.48 30 µg/g 20 µg/g 10 µg/g 30 µg/g < 20 µg/g 0.04 0.01
SJT0105 18.0 2.5 1.8 66.5 0.16 0.08 0.85 4.17 4.63 0.10 0.43 0.71 50 µg/g 30 µg/g 70 µg/g 30 µg/g 50 µg/g 0.02 0.01
SJT0122 18.0 2.5 2.6 65.9 0.29 0.05 0.98 2.93 5.27 0.10 0.49 0.80 0.01 30 µg/g 20 µg/g 40 µg/g 0.01 0.03 0.03
SJT0123 19.7 2.1 2.9 62.9 0.23 0.07 1.01 3.54 6.12 0.10 0.41 0.70 0.01 40 µg/g 0.02 50 µg/g 0.01 0.03 0.01
Avg. 17.0 2.5 3.0 66.0 0.25 0.06 0.98 3.27 5.71 0.10 0.44 0.62 0.02 50 µg/g 50 µg/g 50 µg/g 0.02 0.03 0.02
StDev. 1.5 0.3 0.8 1.6 0.06 0.01 0.10 0.81 0.83 0.02 0.17 0.13 0.01
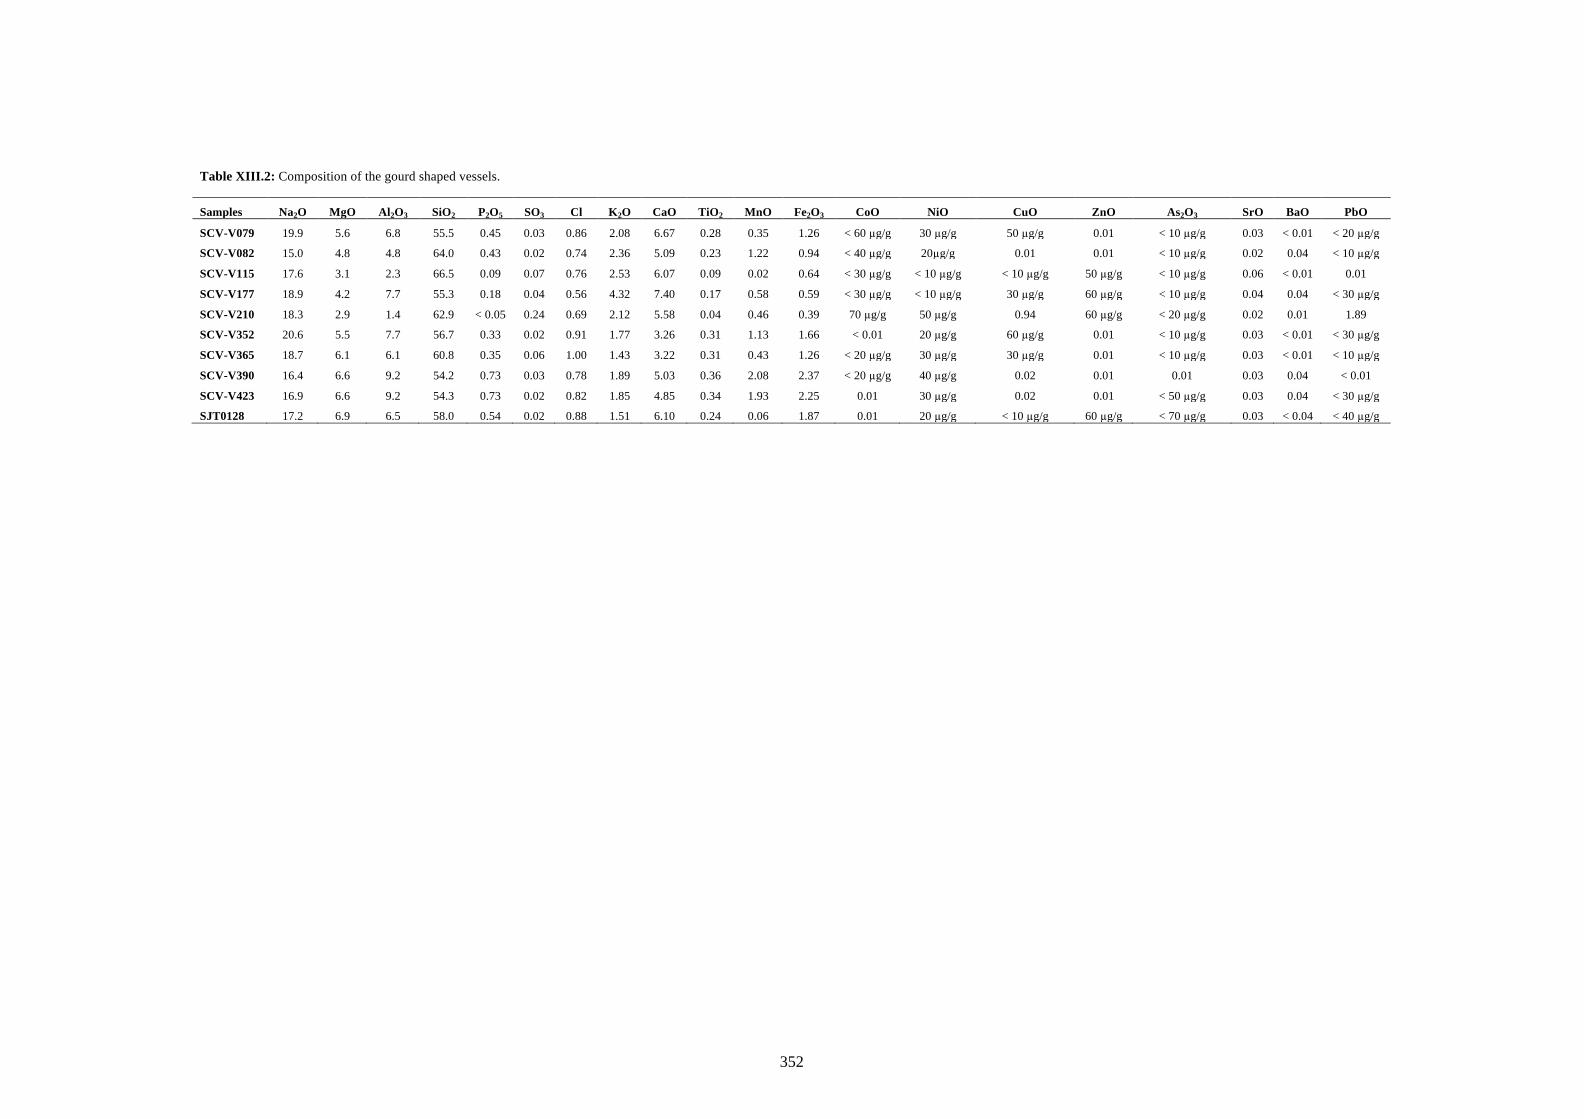
352
Table XIII.2: Composition of the gourd shaped vessels.
Samples Na2O MgO Al2O3 SiO2 P2O5 SO3 Cl K2O CaO TiO2 MnO Fe2O3 CoO NiO CuO ZnO As2O3 SrO BaO PbO
SCV-V079 19.9 5.6 6.8 55.5 0.45 0.03 0.86 2.08 6.67 0.28 0.35 1.26 < 60 µg/g 30 µg/g 50 µg/g 0.01 < 10 µg/g 0.03 < 0.01 < 20 µg/g
SCV-V082 15.0 4.8 4.8 64.0 0.43 0.02 0.74 2.36 5.09 0.23 1.22 0.94 < 40 µg/g 20µg/g 0.01 0.01 < 10 µg/g 0.02 0.04 < 10 µg/g
SCV-V115 17.6 3.1 2.3 66.5 0.09 0.07 0.76 2.53 6.07 0.09 0.02 0.64 < 30 µg/g < 10 µg/g < 10 µg/g 50 µg/g < 10 µg/g 0.06 < 0.01 0.01
SCV-V177 18.9 4.2 7.7 55.3 0.18 0.04 0.56 4.32 7.40 0.17 0.58 0.59 < 30 µg/g < 10 µg/g 30 µg/g 60 µg/g < 10 µg/g 0.04 0.04 < 30 µg/g
SCV-V210 18.3 2.9 1.4 62.9 < 0.05 0.24 0.69 2.12 5.58 0.04 0.46 0.39 70 µg/g 50 µg/g 0.94 60 µg/g < 20 µg/g 0.02 0.01 1.89
SCV-V352 20.6 5.5 7.7 56.7 0.33 0.02 0.91 1.77 3.26 0.31 1.13 1.66 < 0.01 20 µg/g 60 µg/g 0.01 < 10 µg/g 0.03 < 0.01 < 30 µg/g
SCV-V365 18.7 6.1 6.1 60.8 0.35 0.06 1.00 1.43 3.22 0.31 0.43 1.26 < 20 µg/g 30 µg/g 30 µg/g 0.01 < 10 µg/g 0.03 < 0.01 < 10 µg/g
SCV-V390 16.4 6.6 9.2 54.2 0.73 0.03 0.78 1.89 5.03 0.36 2.08 2.37 < 20 µg/g 40 µg/g 0.02 0.01 0.01 0.03 0.04 < 0.01
SCV-V423 16.9 6.6 9.2 54.3 0.73 0.02 0.82 1.85 4.85 0.34 1.93 2.25 0.01 30 µg/g 0.02 0.01 < 50 µg/g 0.03 0.04 < 30 µg/g
SJT0128 17.2 6.9 6.5 58.0 0.54 0.02 0.88 1.51 6.10 0.24 0.06 1.87 0.01 20 µg/g < 10 µg/g 60 µg/g < 70 µg/g 0.03 < 0.04 < 40 µg/g
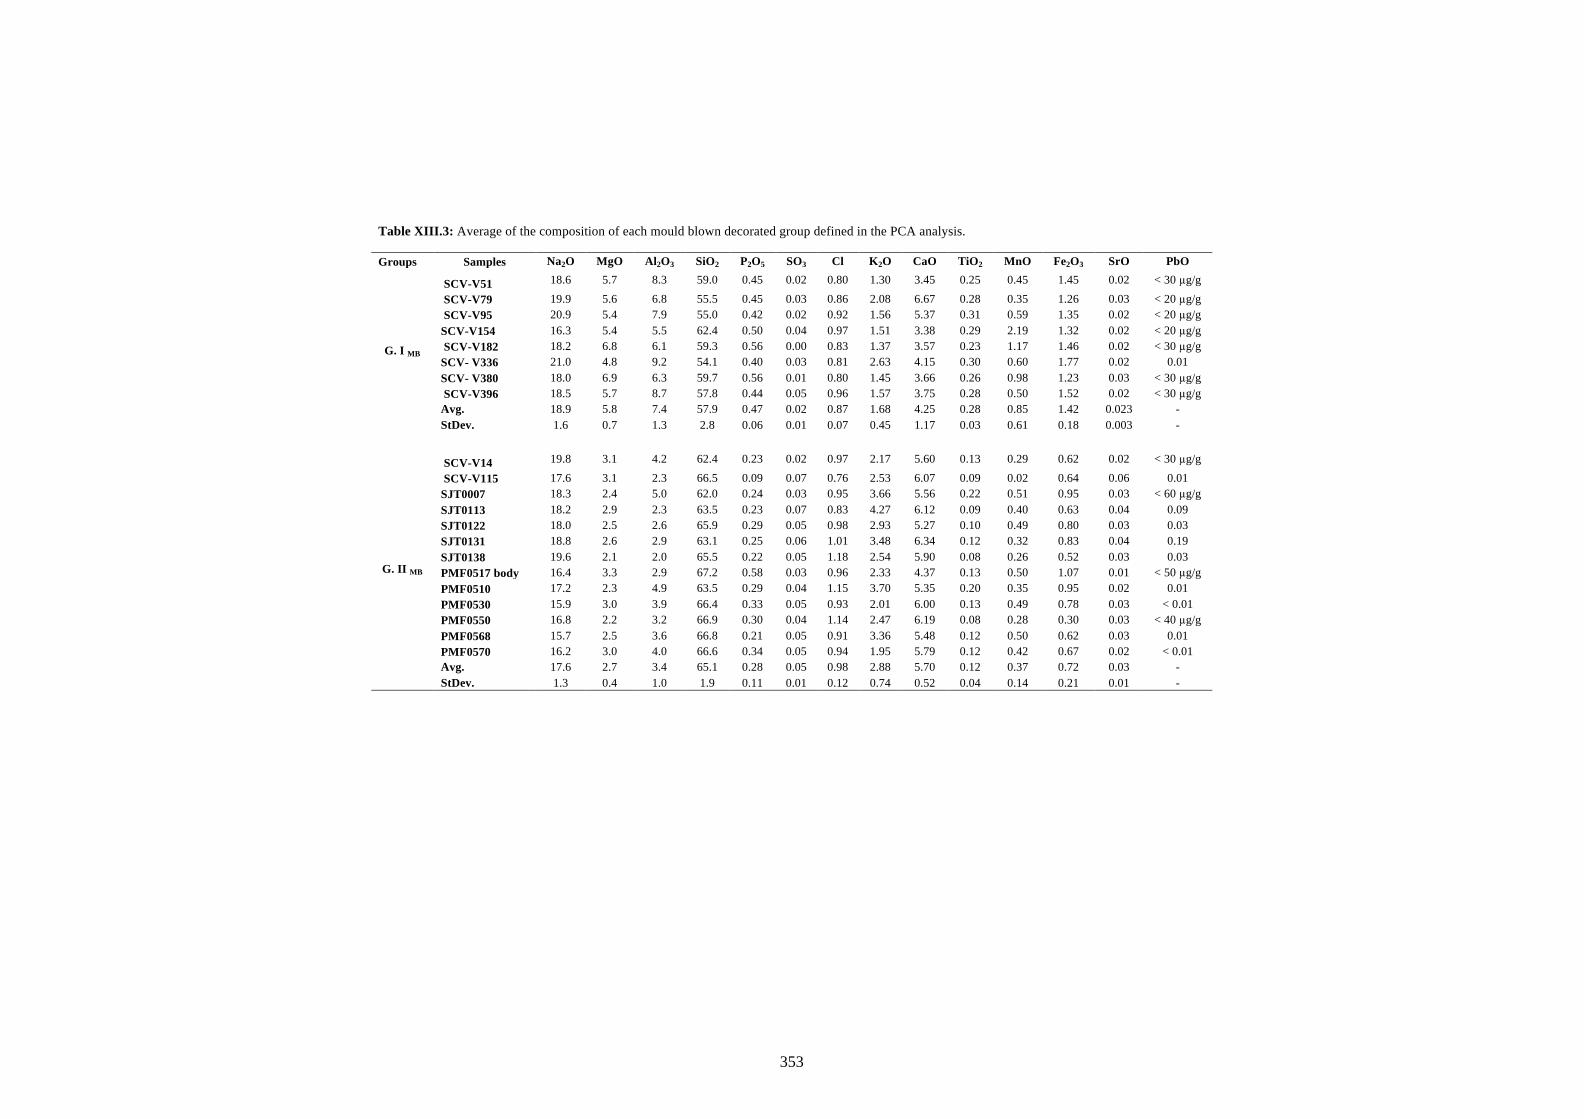
353
Table XIII.3: Average of the composition of each mould blown decorated group defined in the PCA analysis. Groups Samples Na2O MgO Al2O3 SiO2 P2O5 SO3 Cl K2O CaO TiO2 MnO Fe2O3 SrO PbO
G. I MB
SCV-V51 18.6 5.7 8.3 59.0 0.45 0.02 0.80 1.30 3.45 0.25 0.45 1.45 0.02 < 30 µg/g
SCV-V79 19.9 5.6 6.8 55.5 0.45 0.03 0.86 2.08 6.67 0.28 0.35 1.26 0.03 < 20 µg/g SCV-V95 20.9 5.4 7.9 55.0 0.42 0.02 0.92 1.56 5.37 0.31 0.59 1.35 0.02 < 20 µg/g SCV-V154 16.3 5.4 5.5 62.4 0.50 0.04 0.97 1.51 3.38 0.29 2.19 1.32 0.02 < 20 µg/g SCV-V182 18.2 6.8 6.1 59.3 0.56 0.00 0.83 1.37 3.57 0.23 1.17 1.46 0.02 < 30 µg/g SCV- V336 21.0 4.8 9.2 54.1 0.40 0.03 0.81 2.63 4.15 0.30 0.60 1.77 0.02 0.01 SCV- V380 18.0 6.9 6.3 59.7 0.56 0.01 0.80 1.45 3.66 0.26 0.98 1.23 0.03 < 30 µg/g SCV-V396 18.5 5.7 8.7 57.8 0.44 0.05 0.96 1.57 3.75 0.28 0.50 1.52 0.02 < 30 µg/g Avg. 18.9 5.8 7.4 57.9 0.47 0.02 0.87 1.68 4.25 0.28 0.85 1.42 0.023 - StDev. 1.6 0.7 1.3 2.8 0.06 0.01 0.07 0.45 1.17 0.03 0.61 0.18 0.003 -
G. II MB
SCV-V14 19.8 3.1 4.2 62.4 0.23 0.02 0.97 2.17 5.60 0.13 0.29 0.62 0.02 < 30 µg/g
SCV-V115 17.6 3.1 2.3 66.5 0.09 0.07 0.76 2.53 6.07 0.09 0.02 0.64 0.06 0.01 SJT0007 18.3 2.4 5.0 62.0 0.24 0.03 0.95 3.66 5.56 0.22 0.51 0.95 0.03 < 60 µg/g SJT0113 18.2 2.9 2.3 63.5 0.23 0.07 0.83 4.27 6.12 0.09 0.40 0.63 0.04 0.09 SJT0122 18.0 2.5 2.6 65.9 0.29 0.05 0.98 2.93 5.27 0.10 0.49 0.80 0.03 0.03 SJT0131 18.8 2.6 2.9 63.1 0.25 0.06 1.01 3.48 6.34 0.12 0.32 0.83 0.04 0.19 SJT0138 19.6 2.1 2.0 65.5 0.22 0.05 1.18 2.54 5.90 0.08 0.26 0.52 0.03 0.03 PMF0517 body 16.4 3.3 2.9 67.2 0.58 0.03 0.96 2.33 4.37 0.13 0.50 1.07 0.01 < 50 µg/g PMF0510 17.2 2.3 4.9 63.5 0.29 0.04 1.15 3.70 5.35 0.20 0.35 0.95 0.02 0.01 PMF0530 15.9 3.0 3.9 66.4 0.33 0.05 0.93 2.01 6.00 0.13 0.49 0.78 0.03 < 0.01 PMF0550 16.8 2.2 3.2 66.9 0.30 0.04 1.14 2.47 6.19 0.08 0.28 0.30 0.03 < 40 µg/g PMF0568 15.7 2.5 3.6 66.8 0.21 0.05 0.91 3.36 5.48 0.12 0.50 0.62 0.03 0.01 PMF0570 16.2 3.0 4.0 66.6 0.34 0.05 0.94 1.95 5.79 0.12 0.42 0.67 0.02 < 0.01 Avg. 17.6 2.7 3.4 65.1 0.28 0.05 0.98 2.88 5.70 0.12 0.37 0.72 0.03 - StDev. 1.3 0.4 1.0 1.9 0.11 0.01 0.12 0.74 0.52 0.04 0.14 0.21 0.01 -
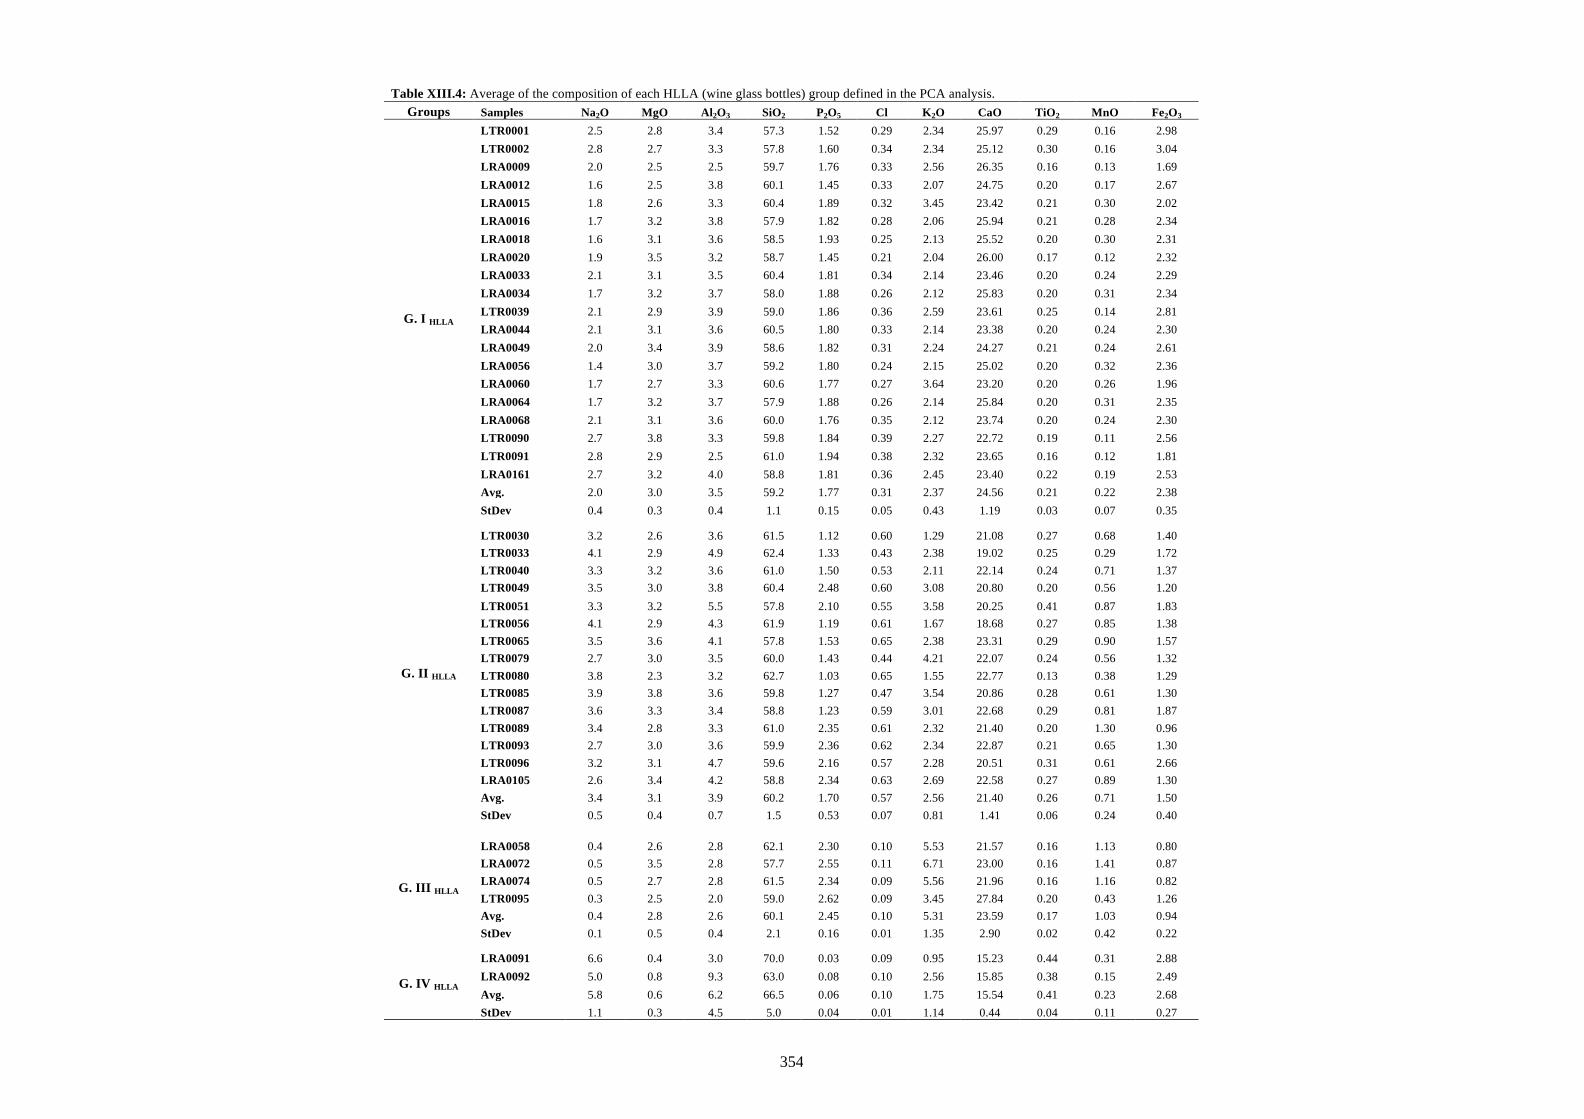
354
Table XIII.4: Average of the composition of each HLLA (wine glass bottles) group defined in the PCA analysis. Groups Samples Na2O MgO Al2O3 SiO2 P2O5 Cl K2O CaO TiO2 MnO Fe2O3
G. I HLLA
LTR0001 2.5 2.8 3.4 57.3 1.52 0.29 2.34 25.97 0.29 0.16 2.98 LTR0002 2.8 2.7 3.3 57.8 1.60 0.34 2.34 25.12 0.30 0.16 3.04 LRA0009 2.0 2.5 2.5 59.7 1.76 0.33 2.56 26.35 0.16 0.13 1.69 LRA0012 1.6 2.5 3.8 60.1 1.45 0.33 2.07 24.75 0.20 0.17 2.67 LRA0015 1.8 2.6 3.3 60.4 1.89 0.32 3.45 23.42 0.21 0.30 2.02 LRA0016 1.7 3.2 3.8 57.9 1.82 0.28 2.06 25.94 0.21 0.28 2.34 LRA0018 1.6 3.1 3.6 58.5 1.93 0.25 2.13 25.52 0.20 0.30 2.31 LRA0020 1.9 3.5 3.2 58.7 1.45 0.21 2.04 26.00 0.17 0.12 2.32 LRA0033 2.1 3.1 3.5 60.4 1.81 0.34 2.14 23.46 0.20 0.24 2.29 LRA0034 1.7 3.2 3.7 58.0 1.88 0.26 2.12 25.83 0.20 0.31 2.34 LTR0039 2.1 2.9 3.9 59.0 1.86 0.36 2.59 23.61 0.25 0.14 2.81 LRA0044 2.1 3.1 3.6 60.5 1.80 0.33 2.14 23.38 0.20 0.24 2.30 LRA0049 2.0 3.4 3.9 58.6 1.82 0.31 2.24 24.27 0.21 0.24 2.61 LRA0056 1.4 3.0 3.7 59.2 1.80 0.24 2.15 25.02 0.20 0.32 2.36 LRA0060 1.7 2.7 3.3 60.6 1.77 0.27 3.64 23.20 0.20 0.26 1.96 LRA0064 1.7 3.2 3.7 57.9 1.88 0.26 2.14 25.84 0.20 0.31 2.35 LRA0068 2.1 3.1 3.6 60.0 1.76 0.35 2.12 23.74 0.20 0.24 2.30 LTR0090 2.7 3.8 3.3 59.8 1.84 0.39 2.27 22.72 0.19 0.11 2.56 LTR0091 2.8 2.9 2.5 61.0 1.94 0.38 2.32 23.65 0.16 0.12 1.81 LRA0161 2.7 3.2 4.0 58.8 1.81 0.36 2.45 23.40 0.22 0.19 2.53 Avg. 2.0 3.0 3.5 59.2 1.77 0.31 2.37 24.56 0.21 0.22 2.38 StDev 0.4 0.3 0.4 1.1 0.15 0.05 0.43 1.19 0.03 0.07 0.35
G. II HLLA
LTR0030 3.2 2.6 3.6 61.5 1.12 0.60 1.29 21.08 0.27 0.68 1.40 LTR0033 4.1 2.9 4.9 62.4 1.33 0.43 2.38 19.02 0.25 0.29 1.72 LTR0040 3.3 3.2 3.6 61.0 1.50 0.53 2.11 22.14 0.24 0.71 1.37 LTR0049 3.5 3.0 3.8 60.4 2.48 0.60 3.08 20.80 0.20 0.56 1.20
LTR0051 3.3 3.2 5.5 57.8 2.10 0.55 3.58 20.25 0.41 0.87 1.83 LTR0056 4.1 2.9 4.3 61.9 1.19 0.61 1.67 18.68 0.27 0.85 1.38 LTR0065 3.5 3.6 4.1 57.8 1.53 0.65 2.38 23.31 0.29 0.90 1.57 LTR0079 2.7 3.0 3.5 60.0 1.43 0.44 4.21 22.07 0.24 0.56 1.32 LTR0080 3.8 2.3 3.2 62.7 1.03 0.65 1.55 22.77 0.13 0.38 1.29 LTR0085 3.9 3.8 3.6 59.8 1.27 0.47 3.54 20.86 0.28 0.61 1.30 LTR0087 3.6 3.3 3.4 58.8 1.23 0.59 3.01 22.68 0.29 0.81 1.87 LTR0089 3.4 2.8 3.3 61.0 2.35 0.61 2.32 21.40 0.20 1.30 0.96 LTR0093 2.7 3.0 3.6 59.9 2.36 0.62 2.34 22.87 0.21 0.65 1.30 LTR0096 3.2 3.1 4.7 59.6 2.16 0.57 2.28 20.51 0.31 0.61 2.66 LRA0105 2.6 3.4 4.2 58.8 2.34 0.63 2.69 22.58 0.27 0.89 1.30 Avg. 3.4 3.1 3.9 60.2 1.70 0.57 2.56 21.40 0.26 0.71 1.50 StDev 0.5 0.4 0.7 1.5 0.53 0.07 0.81 1.41 0.06 0.24 0.40
G. III HLLA
LRA0058 0.4 2.6 2.8 62.1 2.30 0.10 5.53 21.57 0.16 1.13 0.80 LRA0072 0.5 3.5 2.8 57.7 2.55 0.11 6.71 23.00 0.16 1.41 0.87 LRA0074 0.5 2.7 2.8 61.5 2.34 0.09 5.56 21.96 0.16 1.16 0.82 LTR0095 0.3 2.5 2.0 59.0 2.62 0.09 3.45 27.84 0.20 0.43 1.26 Avg. 0.4 2.8 2.6 60.1 2.45 0.10 5.31 23.59 0.17 1.03 0.94 StDev 0.1 0.5 0.4 2.1 0.16 0.01 1.35 2.90 0.02 0.42 0.22
G. IV HLLA
LRA0091 6.6 0.4 3.0 70.0 0.03 0.09 0.95 15.23 0.44 0.31 2.88 LRA0092 5.0 0.8 9.3 63.0 0.08 0.10 2.56 15.85 0.38 0.15 2.49 Avg. 5.8 0.6 6.2 66.5 0.06 0.10 1.75 15.54 0.41 0.23 2.68 StDev 1.1 0.3 4.5 5.0 0.04 0.01 1.14 0.44 0.04 0.11 0.27
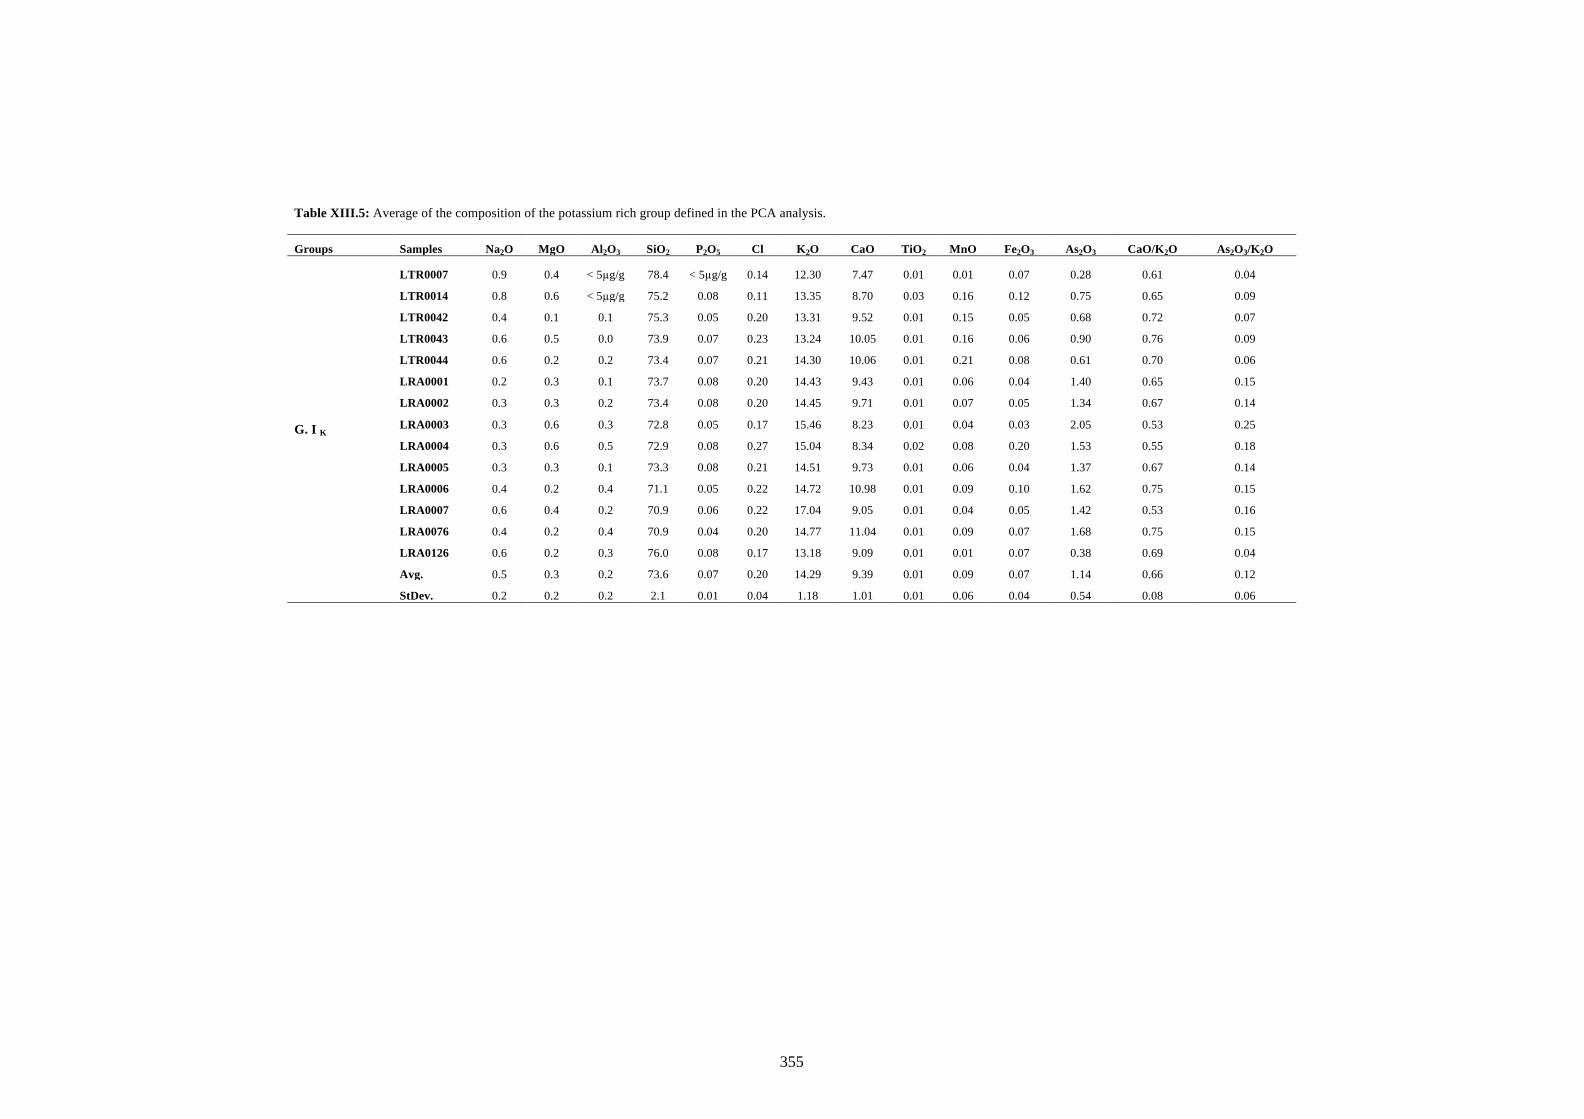
355
Table XIII.5: Average of the composition of the potassium rich group defined in the PCA analysis.
Groups Samples Na2O MgO Al2O3 SiO2 P2O5 Cl K2O CaO TiO2 MnO Fe2O3 As2O3 CaO/K2O As2O3/K2O
G. I K
LTR0007 0.9 0.4 < 5µg/g 78.4 < 5µg/g 0.14 12.30 7.47 0.01 0.01 0.07 0.28 0.61 0.04
LTR0014 0.8 0.6 < 5µg/g 75.2 0.08 0.11 13.35 8.70 0.03 0.16 0.12 0.75 0.65 0.09
LTR0042 0.4 0.1 0.1 75.3 0.05 0.20 13.31 9.52 0.01 0.15 0.05 0.68 0.72 0.07
LTR0043 0.6 0.5 0.0 73.9 0.07 0.23 13.24 10.05 0.01 0.16 0.06 0.90 0.76 0.09
LTR0044 0.6 0.2 0.2 73.4 0.07 0.21 14.30 10.06 0.01 0.21 0.08 0.61 0.70 0.06
LRA0001 0.2 0.3 0.1 73.7 0.08 0.20 14.43 9.43 0.01 0.06 0.04 1.40 0.65 0.15
LRA0002 0.3 0.3 0.2 73.4 0.08 0.20 14.45 9.71 0.01 0.07 0.05 1.34 0.67 0.14
LRA0003 0.3 0.6 0.3 72.8 0.05 0.17 15.46 8.23 0.01 0.04 0.03 2.05 0.53 0.25
LRA0004 0.3 0.6 0.5 72.9 0.08 0.27 15.04 8.34 0.02 0.08 0.20 1.53 0.55 0.18
LRA0005 0.3 0.3 0.1 73.3 0.08 0.21 14.51 9.73 0.01 0.06 0.04 1.37 0.67 0.14
LRA0006 0.4 0.2 0.4 71.1 0.05 0.22 14.72 10.98 0.01 0.09 0.10 1.62 0.75 0.15
LRA0007 0.6 0.4 0.2 70.9 0.06 0.22 17.04 9.05 0.01 0.04 0.05 1.42 0.53 0.16
LRA0076 0.4 0.2 0.4 70.9 0.04 0.20 14.77 11.04 0.01 0.09 0.07 1.68 0.75 0.15
LRA0126 0.6 0.2 0.3 76.0 0.08 0.17 13.18 9.09 0.01 0.01 0.07 0.38 0.69 0.04
Avg. 0.5 0.3 0.2 73.6 0.07 0.20 14.29 9.39 0.01 0.09 0.07 1.14 0.66 0.12
StDev. 0.2 0.2 0.2 2.1 0.01 0.04 1.18 1.01 0.01 0.06 0.04 0.54 0.08 0.06

356
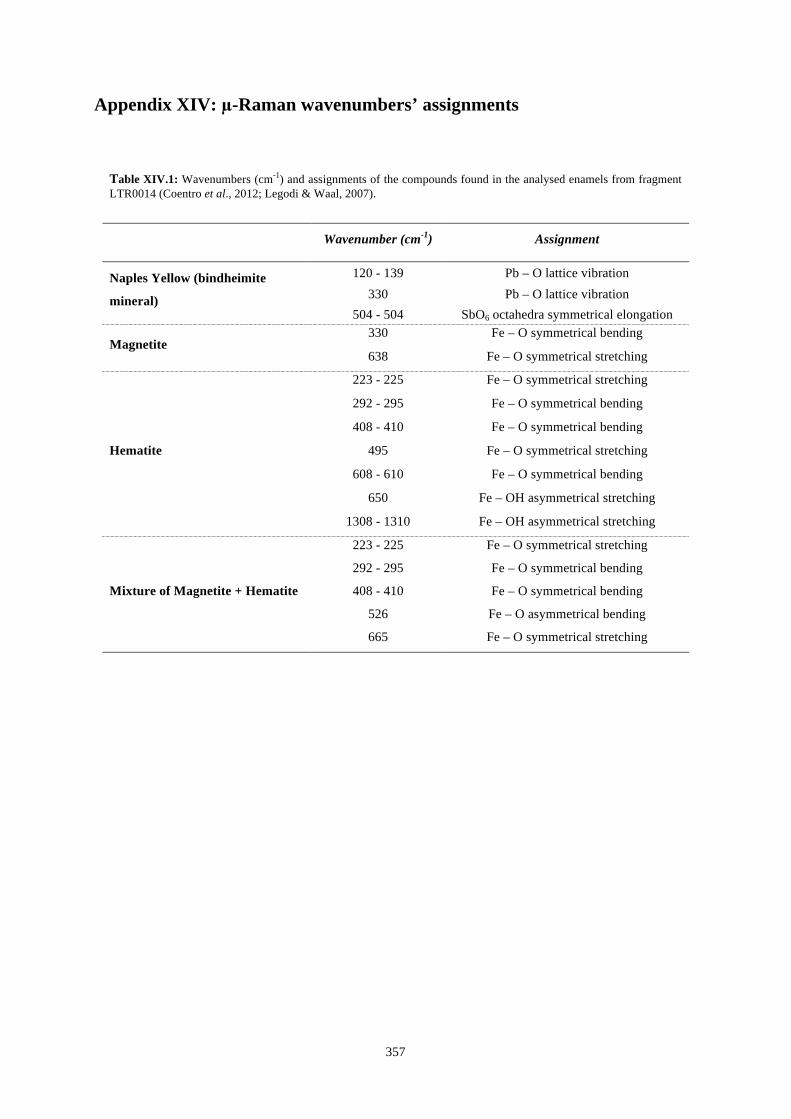
357
Appendix XIV: µ-Raman wavenumbers’ assignments
Table XIV.1: Wavenumbers (cm-1) and assignments of the compounds found in the analysed enamels from fragment LTR0014 (Coentro et al., 2012; Legodi & Waal, 2007).
Wavenumber (cm-1) Assignment
Naples Yellow (bindheimite
mineral)
120 - 139 Pb – O lattice vibration
330 Pb – O lattice vibration 504 - 504 SbO6 octahedra symmetrical elongation
Magnetite 330 Fe – O symmetrical bending
638 Fe – O symmetrical stretching
Hematite
223 - 225 Fe – O symmetrical stretching
292 - 295 Fe – O symmetrical bending
408 - 410 Fe – O symmetrical bending
495 Fe – O symmetrical stretching
608 - 610 Fe – O symmetrical bending
650 Fe – OH asymmetrical stretching
1308 - 1310 Fe – OH asymmetrical stretching
Mixture of Magnetite + Hematite
223 - 225 Fe – O symmetrical stretching
292 - 295 Fe – O symmetrical bending
408 - 410 Fe – O symmetrical bending
526 Fe – O asymmetrical bending
665 Fe – O symmetrical stretching

358

359
Appendices Part II

360
361
Appendix I: Glass degradation mechanisms and its detailed description. The first reaction to occur is the ionic exchange, where alkaline ions negatively charged are extracted
from the glass matrix forming a sodium or potassium hydroxide solution. In order to maintain the
matrix neutrality, these leached ions are replaced by H3O+ ions (Davinson, 2003; Robinet et al., 2009).
1) Ionic exchange:
ΞSi — O-Na+ + H+ → ΞSi — OH + Na+
ΞSi — O-Na+ + H3O+ → ΞSi — OH +H2O + Na+
2) Hydration: when water enters glass like a solvent
ΞSi — O-Na+ + H2O → ΞSi — OH + Na+ + OH-
3) Hydrolysis: when water is able to break Si-O-Si bounds in order to form silanes (reversible)
ΞSi —O—SiΞ + H2O → ΞSi — OH + OH — SiΞ → ΞSi —O—SiΞ + H2O
If the glass being attacked is a soda glass, a more unstable composition, cracks will be formed on glass
surface, allowing water to penetrate deeper on glass bulk and continuing the alkali leaching corrosion
process (Robinet et al., 2009).
This process of ionic exchange between water and glass will result in a superficial layer of glass very
rich in silica and also hydrated. Water, due to ionic exchange will be overloaded in H+ ions increasing
this way its alkalinity and its potential to attack glass (Davinson, 2003; Robinet et al., 2009).
The silica network dissolution corresponds to the breakdown of siloxane bonds existent on the glass/
solution interface (Robinet et al., 2009).
1) Dissolution:
ΞSi —O—SiΞ + OH- → ΞSi — O-+ HO—SiΞ
ΞSi — O-+ H2O → ΞSi — OH + OH-
2) Network rearrangement:
ΞSi — OH + HO—SiΞ → ΞSi —O—SiΞ + H2O
This dissolution process is followed by the formation of a gel layer composed by hydrated silica
species, which will condensate forming a new amorphous, hydrated and porous material. Corroded
glass will be composed by a leached layer between a gel layer and bulk glass (Robinet et al., 2009).

362


![Colonization of India [17th - 19th c.] . 2](https://img.pdfslide.net/doc/110x75/632190a58a1d893baa0d2254/colonization-of-india-17th-19th-c-2.jpg)

