Embed Size (px)
Citation preview
This article appeared in a journal published by Elsevier. The attachedcopy is furnished to the author for internal non-commercial researchand education use, including for instruction at the authors institution
and sharing with colleagues.
Other uses, including reproduction and distribution, or selling orlicensing copies, or posting to personal, institutional or third party
websites are prohibited.
In most cases authors are permitted to post their version of thearticle (e.g. in Word or Tex form) to their personal website orinstitutional repository. Authors requiring further information
regarding Elsevier’s archiving and manuscript policies areencouraged to visit:
http://www.elsevier.com/authorsrights

Author's personal copy
Original article
New model for adenine-induced chronic renal failure in mice, and the effect of gumacacia treatment thereon: Comparison with rats
Badreldin H. Ali a,⁎, Suhail Al-Salam b, Mohammed Al Za'abi a, Mostafa I. Waly c, Aishwarya Ramkumar a,Sumyia Beegam a, Intisar Al-Lawati a, Sirin A. Adham d, Abderrahim Nemmar e
a Department of Pharmacology and Clinical Pharmacy, College of Medicine and Health Sciences, Sultan Qaboos University, Omanb Department of Pathology, United Arab Emirates University, Al-Ain, United Arab Emiratesc Department of Food Science and Nutrition, College of Agricultural and Marine Sciences, Sultan Qaboos University, Omand Department of Biology, College of Science, Sultan Qaboos University, Omane Department of Physiology, United Arab Emirates University, Al-Ain, United Arab Emirates
a b s t r a c ta r t i c l e i n f o
Article history:Received 6 March 2013Accepted 1 May 2013
Keywords:AdenineAnimal modelChronic renal failureMiceRats
Introduction: This study aimed at comparing the effects of feeding mice and rats with adenine to inducea state of chronic renal failure (CRF), and to assess the effect of treatment with gum acacia (GA) thereon.Methods: We compared the outcome, in mice, of feeding adenine at three different doses (0.75%, 0.3%, and0.2%, w/w). Biochemical and histopathological studies were conducted in plasma, urine and renal homoge-nates from both species. Results: When mice and rats were fed adenine (0.75%, w/w), all treated rats sur-vived the treatment, but all treated mice died within 1–2 days. The dosage in mice was reduced to 0.3%,w/w, for 4 weeks, but again all treated mice died within 3–4 days. A further reduction in the dosage inmice to 0.2%, w/w, for 4 weeks resulted in no mortality, and produced alterations similar to those observedin rats fed adenine at a dose of 0.75%,w/w, for 4 weeks. Plasma creatinine, urea and urinary protein weresignificantly increased (P b 0.001) in adenine-treated mice and rats, and this action was incompletely, butsignificantly (P b 0.05), reversed by GA. Adenine significantly (P b 0.001) reduced superoxide dismutase(SOD) activity and reduced glutathione (GSH) concentration in renal homogenates from both species, andthese reductions were significantly (P b 0.05) ameliorated by GA. Discussion: Our data suggest that miceare more sensitive to adenine than rats, and that a dose of adenine of 0.2%, w/w, for 4 weeks in mice is sug-gested as a model for CRF. In both models, GA (15%, w/v, in the drinking water for 4 weeks) given concom-itantly with adenine ameliorated the severity of CRF to a similar extent.
© 2013 Elsevier Inc. All rights reserved.
1. Introduction
The prevalence and incidence of the common disorder chronic kid-ney disease, CKD [also termed in its later stage chronic renal failure(CRF)], are on the increase, both in developed and developing countries,imposing a very expensive and rising demandon health-care systems al-ready burdened by paucity of resources (James, Hemmelgarn, & Tonelli,2010;Nugent, Fathima, Feigl, & Chyung, 2011). The disease is progressivein nature, requires involved and frequently expensive management,causes serious complications such as diabetes, stroke, cardiovascular dis-eases and other diseases, and has no satisfactory treatment (Baumgarten& Gehr, 2011; Smart & Titus, 2011). Therefore, there is a need for studiesinto the pathophysiology andmechanisms of CKD, and also for the devel-opment of new effective therapeutic strategies, and for the search of
appropriate and valid animal models of the disease. The model shouldsimulate, as much as possible, the human renal disease in its naturalcourse, aswell as its histological features, which could predict renal func-tional outcome, and responsiveness to clinically-used drugs (Ichihara etal., 2009; Mak et al., 2006).
The most commonly used rat model for progressive renal failure isthe “remnant kidney” model (also called 5/6 nephrectomy) in whichthere are reduced renal mass and nephron number, and is induced byeither infarction or surgical excision of both poles, with removal ofthe contralateral kidney (Fogo, 2003; Kujal & Vernerová, 2008). Sev-eral experimental and novel therapies have been suggested usingthis classic model (Ali, Alqarawi, & Ahmed, 2004; Deng et al., 2010).The other valid, yet less widely used model, is the adenine-inducedCRF in rats (Ormrod & Miller, 1980; Yokozawa, Zheng, Oura, &Koizumi, 1986), in which adenine is given mixed with the feed at aconcentration of 0.75%, w/w, for 4 weeks. Orally-administered ade-nine is metabolized to 2,8-dihydroxyadenine, which precipitatesand forms tubular crystals that injure the renal tissue (Shuvy et al.,2011).
Journal of Pharmacological and Toxicological Methods 68 (2013) 384–393
⁎ Corresponding author at: Department of Pharmacology andClinical Pharmacy, College ofMedicine and Health Sciences, Sultan Qaboos University, P.O. Box 35, 123-Al Khod, Oman.Tel.: +00968 95909294.
E-mail address: [email protected] (B.H. Ali).
1056-8719/$ – see front matter © 2013 Elsevier Inc. All rights reserved.http://dx.doi.org/10.1016/j.vascn.2013.05.001
Contents lists available at ScienceDirect
Journal of Pharmacological and Toxicological Methods
j ourna l homepage: www.e lsev ie r .com/ locate / jpha rmtox

Author's personal copy
Relatively fewer novel and experimental therapies have beenreported using the adenine model in rats (Ali, Ziada, Al-Husseni,Beegam, Al-Ruqaishi, et al., 2011; Ali, Ziada, Al-Husseni, Beegam, &Nemmar, 2011; Ali et al., 2013; Tong, Han, Guo, & Liu, 2010). As faras we are aware, mice treated with adenine, were not used as amodel for CRF, except for a recent paper that has been reportedwhen this work was being written (Santana et al., 2013). Previouslyit has been reported that mice treated with adenine (at variousdoses and for various periods) can be used as models for acute kidneyinjury (Minami et al., 1994; Morishita, Ohnishi, Watanabe, Ishibashi,& Kusano, 2011) and crystal-induced nephritis (Oyama et al., 2010).The use of the mouse in the CRF model offers an additional (andmore economical) alternative to the currently used rat model andcan also be used in knock-out mice with CRF (Neven & D'Haese,2011).
In this work, the effects of adenine on several renal parameters inboth mice and rats, as well as the effects thereon of treatment withgum acacia (GA) were compared. We have previously shown thatGA was effective in ameliorating the effects of adenine-induced CRFin rats (Ali et al., 2010). The aim is to find out if the mouse can beused as an adenine-induced model for CRF, and if the ensuing CRFcan be mitigated by GA treatment.
2. Methods
This project was reviewed and approved by the Institutional ReviewBoard of the Animal Research Ethics Committee of the Sultan QaboosUniversity (SQU), and procedures involving animals and their carewere conducted in conformity with international laws and policies(EEC Council directives 86/609, OJL 358, 1 December, 12, 1987; NIHGuide for the Care and Use of Laboratory Animals, NIH PublicationsNo. 85-23, 1985).
2.1. Animals
A total of 24maleWistar rats (Taconic Farms, Germantown, NY, USA)and 48 mice (C57 BL-6), weighing initially 200–240 g, and 25–30 g,respectively, were obtained from the SQU Small Animal House. Theyhad free access to water and a feed composed of standard powder dietcontaining 0.85% phosphorus, 1.12% calcium, 0.35% magnesium, 25.3%crude protein and 2.5 IU/g vitamin D3 (Oman Flour Mills, Muscat,Oman).
2.2. Chemicals
GA usedwas SUPERGUMTMEM 10, Lot 101008, 1.1.11 (Sanwa-Cho,Toyonaka, Osaka, Japan); aqueous solutions were prepared freshlyevery day. The chemical properties of GA have been fully reviewedbefore (Ali, Ziada, & Blunden, 2009; Vielhauer, Stavrakis, & Mayadas,2005). The SUPERGUMTM EM 10 used was characterized by size frac-tionation followed bymultiple angle laser light scattering (GPC-MALLS)to give its molecular profile. The average molecular weight was 3.43 ×10⁶, and the content of arabino galactan protein (AGP) 26.4%. Adeninewas obtained from Sigma (St. Louis,MO, USA). Creatinine, urea and pro-tein kits were bought from Human GmbH (Mannheim, Germany) andsuperoxide dismutase (SOD) kits were bought from Randox (Antrim,UK). Immunohistochemical detection kits for caspase 3, caspase-3 pri-mary monoclonal rabbit antibody and cold lysis buffer were purchasedfrom Cell Signaling Technology (Boston, MA, USA). Inhibitor cocktail forwestern blot was bought from Sigma Aldrich (St. Louis,MO, USA). PVDFmembrane for electrophoresis was obtained from Merck Millipore(Overijse, Belgium). BM chemiluminescence Western blotting kit(mouse/rabbit) and X-ray film were bought from Roche (Branford,USA). All other chemicals were of analytical reagent grade.
2.3. Experimental design
After an acclimatization period of seven days, mice and rats wereeach randomly divided into four equal groups. The first groups ofthe two species continued to receive the same diet without treatmentuntil the end of the study (control group). The second groups wereswitched to a powder diet containing adenine (0.2%, w/w–0.75%, w/w,in feed for four weeks in mice; 0.75%, w/w, in feed for four weeks inrats). The third groups of the two species were given normal food andGA in drinking water at a concentration of 15%, w/v, for four weeks.The fourth groups of both species were given adenine as in group two,plus GA in drinkingwater at a concentration of 15%, w/v, for fourweeks.
During the treatment periods, animals were weighed weekly andplaced individually in metabolic cages to collect the urine voidedin 24 h. Twenty-four hours after the end of the treatment the animalswere anesthetized with an intra-peritoneal injection of ketamine(75 mg/kg) and xylazine (5 mg/kg), and blood (1 mL from eachmouse, and 5 mL from each rat) was collected from the anterior venacava into heparinized tubes. The blood collected from two mice waspooled to enable us to carry out several biochemical analyses on the
A) Mice B) Rats
C GA (15%) C GA (15%)
Ade(0.2%) Ade + GA Ade (0.75%) Ade + GA
Fig. 1. Gross morphology of the kidneys of a mouse and a rat that have received adenine (Ade) in feed at a concentration of 0.2%, w/w, and 0.75%, w/w, respectively and with GA(15%, w/w, in drinking water), compared with their respective controls (C) treated with normal saline and GA alone.
385B.H. Ali et al. / Journal of Pharmacological and Toxicological Methods 68 (2013) 384–393

Author's personal copy
plasmaobtained following centrifugation. The blood and urine collectedwere centrifuged at 900 g at 4 °C for 15 min. These were stored frozenat −80 °C pending analysis. The two kidneys were excised, blotted onfilter paper, and weighed. A small piece of the right kidney was placedin 10% formalin for subsequent histological processing. The rest of thekidneyswere kept frozen at−80 °C to await biochemical analysiswith-in a week. The left kidney was homogenized in ice-cold Tris buffer(pH 7.4) to give a 10%, w/v homogenate. The latter was centrifuged at1500 g at 4 °C for 15 min, and the supernatant obtained was used tomeasure superoxide dismutase (SOD) activity and reduced glutathione(GSH) concentration.
2.4. Biochemical and physiological measurements
Creatinine, urea and protein concentrations in plasma and/orurine were measured spectrophotometrically using commercial kits.In renal cortex homogenates, reduced glutathione (GSH) concentra-tion was measured using a spectrophotometric method (Katayama
et al., 2011), and SOD activity was measured spectrophotometricallyusing a commercial kit.
2.5. Histopathology
The kidneys were fixed in 10% neutral-buffered formalin, dehydratedin increasing concentrations of ethanol, cleared with xylene and embed-ded in paraffin. Five micrometer sections were prepared from kidneyparaffin blocks and stained with hematoxylin and eosin (H & E). Themicroscopic scoring of the kidney sections was carried out in a blindedfashion by a pathologist who was unaware of the treatment groups,and assigned a score, as described before (Suzuki et al., 1995), whichrepresents the approximate extent of the necrotic area in the corticalproximal tubules on a scale of 0–4 (0, no necrosis; 1, a few focal necroticspots; 2, necrotic area was about one half; 3, necrotic spots formedabout two thirds percentage; 4, nearly the entire area was necrotic).The size of the necrosis was also estimated, and values were presentedas means ± SEM.
A (i) Mice B (i) Rat
-20
-10
0
10
20
p<0.001
p<0.05
p<0.001
p<0.001
BW
T c
hang
e %
-40
-20
0
20
40p<0.01
p<0.001
p<0.001
p<0.001
BW
T c
hang
e %
A (ii) Mice B (ii) Rat
0.0
0.5
1.0
1.5
2.0 p<0.01
p<0.05
Kid
ney
wei
ght (
% b
ody
wt)
0.00
0.01
0.02
0.03 p<0.001
p<0.001p<0.001
Kid
ney
wei
ght (
% b
ody
wt)
Fig. 2. Effect of treatment of mice and rats with saline (control), GA, adenine, and adenine + GA for four weeks on body weight change (final weight − initial weight × 100) [A(i) &B(i)], and kidney relative weight (kidney weight / final body weight × 100) [A(ii) & B(ii)]. GA (15%, w/w) was given in the drinking water, and adenine in the feed at a concentration of0.2% in mice and 0.75%, w/w, in rats, respectively. Each column and vertical bar are mean ± SEM (n = 12) for mice and (n = 6) for rats.
386 B.H. Ali et al. / Journal of Pharmacological and Toxicological Methods 68 (2013) 384–393

Author's personal copy
Staining for apoptosis was performed with a signal stain-cleavedcaspase-3 immunohistochemical detection kit. This was used to detectthe activation of caspase using the avidin–biotin immunoperoxidasemethod to detect intracellular caspase-3 protein. Stainingwas performedon 5 μm paraffin sections from the left kidney by a standard techniqueusing rabbit anti-cleaved caspase 3 (clone Asp175, 1:50) (Suzuki et al.,1995). Known positive control sections for apoptosis were used. Fornegative control, primary antibody was replaced with normal rabbitserum. The apoptotic indexwas calculated bydividing the number of pos-itive tubular epithelial cells for anti-casapase-3 per 100 tubular epithelialcells. The calculationwas repeated in at least 10 randomhighpowerfieldsand the total was divided by 10 to get the apoptotic index.
2.6. Western blot analysis for caspase-3 and its cleaved fragment
Kidneys from both mice and rats (total of 40 kidneys, 5 from eachtreatment group) were homogenized by crushing a few μg using amicrosize mortar and piston in cold lysis buffer containing proteaseinhibitor cocktail. Aliquots (100 μg) of total protein from each sample
were loaded onto a 15% SDS-PAGE gel. Protein was transferred to aPVDF membrane.
The membranes were blocked with 5% nonfat milk in TBST(10 mM Tris, pH 7.5, 150 mM NaCl, 0.05% Tween 20) and probedwith a 1:1000 dilution of caspase-3 primary monoclonal rabbit anti-body in 5% nonfat milk/TBST. Immunoblots were then processedwith horseradish-peroxidase-conjugated anti-rabbit immunoglobulinG (IgG) using the enhanced BM chemiluminescence Western blottingkit (mouse/rabbit). The blots were exposed to X-ray film at roomtemperature. Membranes were stripped and re-probed with β-actinprimary antibody to prove an equal loading of the samples.
2.7. Statistical analysis
Values reported are means ± SEM (number of observations). Differ-ences between groups were analyzed by a one-way analysis of variance(ANOVA) followed by Tukey's multiple comparison tests (GraphpadPrism version 4.03, San Diego, CA, USA). P ≤ 0.05 was considered statis-tically significant.
A (i) Mice B (i) Rat
0
5
10
15
20
25p<0.01
p<0.001
p<0.01
Wat
er in
take
(m
l)
0
20
40
60
80 p<0.001
p<0.001
p<0.001p<0.001
Wat
er in
take
(m
l)
A (ii) Mice B (ii) Rat
0
5
10
15 p<0.001
p<0.001p<0.001
Urin
e vo
lum
e (m
l/day
)
0
20
40
60p<0.001
p<0.001
p<0.001
p<0.001
p<0.001
Urin
e vo
lum
e (m
l/day
)
Fig. 3. Effect of treatment of mice and rats with saline (control), GA, adenine, and adenine + GA for four weeks on water intake (mL) [A(i) & B(i)] and 24-h urine output [A(ii) & B(ii)] inthe last day of treatment (mL). GA (15%,w/w)was given in the drinkingwater, and adenine in the feed at a concentration of 0.2% inmice and 0.75%,w/w, in rats, respectively. Each columnand vertical bar are mean ± SEM (n = 12) for mice and (n = 6) for rats.
387B.H. Ali et al. / Journal of Pharmacological and Toxicological Methods 68 (2013) 384–393

Author's personal copy
3. Results
3.1. Mortality in adenine-treated animals
When mice and rats were fed adenine (0.75%, w/w), all treated ratssurvived the treatment, but all treated mice died within 1–2 days. Thedosage in mice was reduced to 0.3%, w/w, for 4 weeks, but again all
treated mice died within 3–4 days. A further reduction in the dosagein mice to 0.2%, w/w, for 4 weeks resulted in no mortality.
3.2. Body and kidney weights and morphology
Typical representatives of the morphological appearances of thekidneys of the mice and rat groups are shown in Fig. 1. The kidneys
A (i) Mice B (i) Rat
0
10
20
30
40
50
p<0.001
p<0.001
p<0.001
Pla
sma
urea
(µm
ol/l)
0
50
100
150
200
p<0.001
p<0.001
p<0.001
Pla
sma
urea
(µm
ol/l)
A (ii) Mice B (ii) Rat
0
20
40
60
80p<0.05
p<0.01
p<0.01
Pla
sma
crea
tinin
e (µ
mol
/l)
0
50
100
150
200
250
p<0.001
p<0.001
p<0.001
Pla
sma
crea
tinin
e (µ
mol
/l)
A (iii) Mice B (iii) Rat
0
50
100
150
p<0.05
p<0.05
p<0.05
Pro
tein
in u
rine
(g/l)
0
50
100
150
p<0.05
p<0.05
p<0.05
Pro
tein
in u
rine
(g/l)
Fig. 4. Effect of treatment of mice and rats with saline (control), GA, adenine and adenine + GA for four weeks on concentrations of plasma urea [A(i) & B(i)], plasma creatinine[4A(ii) & B(ii)] and urinary protein [A(iii) & B(iii)]. GA (15%, w/w) was given in the drinking water, and adenine in the feed at a concentration of 0.2% in mice and 0.75%, w/w, in rats,respectively. Each column and vertical bar are mean ± SEM (n = 12) for mice and (n = 6) for rats.
388 B.H. Ali et al. / Journal of Pharmacological and Toxicological Methods 68 (2013) 384–393
Author's personal copy
from the control and GA-treated mice and rats appeared normal.However, the kidneys of adenine-treated animals were pale, and afew adenine crystals were seen, mainly in the cortex area. Thekidneys of the animals of both species that had been treated with ad-enine plus GA appeared improved compared with those of the kid-neys of mice and rats treated with adenine alone.
Fig. 2A(i) and B(i) shows that the mice and rats grew to approxi-mately the same extent during the experimental period. Adenine(0.2%, w/w, 4 weeks) reduced the final body weights of mice about19% while adenine (0.75%, w/w, 4 weeks) reduced it in rats byabout 30%. GA (15%, w/v) increased the final body weight in bothmice and rats by about 3%, while the increase in control mice andrats was about 15% and 18%, respectively. Concomitant administra-tion of GA (15%, w/v) with adenine at the two doses in mice andrats did not significantly affect the reduction in body weight causedby adenine alone. The weight of the kidneys relative to that of thebody was significantly increased by adenine in rats, but not in mice.Concomitant administration of GA (15%, w/v) with adenine in ratssignificantly reduced the elevation in the relative kidney weight inadenine-treated rats (P b 0.001) (Fig. 2A(ii) and B(ii)).
The effect of adenine on water intake and urine output at the twodoses in mice and rats is shown in Fig. 3A(i) and B(i). Adenine signifi-cantly (P b 0.001) increased thewater intake of the two species to a sim-ilar extent, and GA mitigated that action to a similar extent.
3.3. Biochemical findings
Fig. 4 depicts the concentrations of plasma [A(i) & B(i)] urea and cre-atinine [A(ii) & B(ii)] in the four groups of the two species. Significant(P b 0.001) increase in urea and creatinine was found in adenine-treatedmice and rats, an action thatwas significantly reversed byGA (P b 0.001).Urine protein concentrations in mice and rats [A(iii) & B(iii)] were signif-icantly increased by adenine, and this actionwas incompletely, but signif-icantly, reversed by GA (P b 0.05) in both species.
The effects of adenine and GA treatments on SOD activity and GSHconcentration in mouse and rat renal tissue are shown in Table 1. GA inthe two species produced a slight, but statistically insignificant, increasein the SOD activity and GSH concentration, while adenine producedmarked reductions in both analytes (P b 0.001). These reductions wereincompletely, but significantly, reversed by GA (P b 0.05) in bothspecies.
3.4. Histopathological findings
The control and the GA-treated groups ofmice and rats showed nor-mal kidney histology (Fig. 5a and c; upper(A) and lower (B) panels) anda score of zero (Table 2). The stain for apoptosis in these groups showedno evidence of apoptotic cells in the examined sections (Fig. 6a and c;upper (A) and lower (B) panels). The adenine-treated groups of miceand rats showed diffuse acute tubular necrosis in 73.5 ± 3.5% and69.5 ± 2.7% of the examined tissue areas, respectively (score 4), andexhibited tubular distention with necrotic material involving loss ofbrush border of proximal tubules, dilatation of large number of tubules,mixed inflammatory cells infiltration of the interstitium, focal tubularatrophy (Fig. 5b; upper (A) and lower (B) panels), and many apoptoticcells (Fig. 6b; upper (A) and lower (B) panels).
The mice and rats given adenine plus GA concomitantly showedimprovement in the histological appearance when compared withthe adenine-treated groups. There were focal areas of acute tubularnecrosis involving 30.4 ± 2.8% and 37.5 ± 7.7% of examined areas,respectively (Table 2). There were also less dilatation of the tubules,less interstitial inflammatory cell infiltration, less tubular atrophy(Fig. 5d; upper (A) and lower (B) panels) and less apoptotic cells(Fig. 6b; upper (A) and lower (B) panels). Quantification of apoptosisshowed that the apoptotic indices in mice and rats treated with ade-nine alone were 12.3% and 10.6%, respectively; and in mice and rats
treated with adenine and GA were 8.2% and 7.7%, respectively. Inmice and rats treated with saline or GA the apoptotic indices werezero.
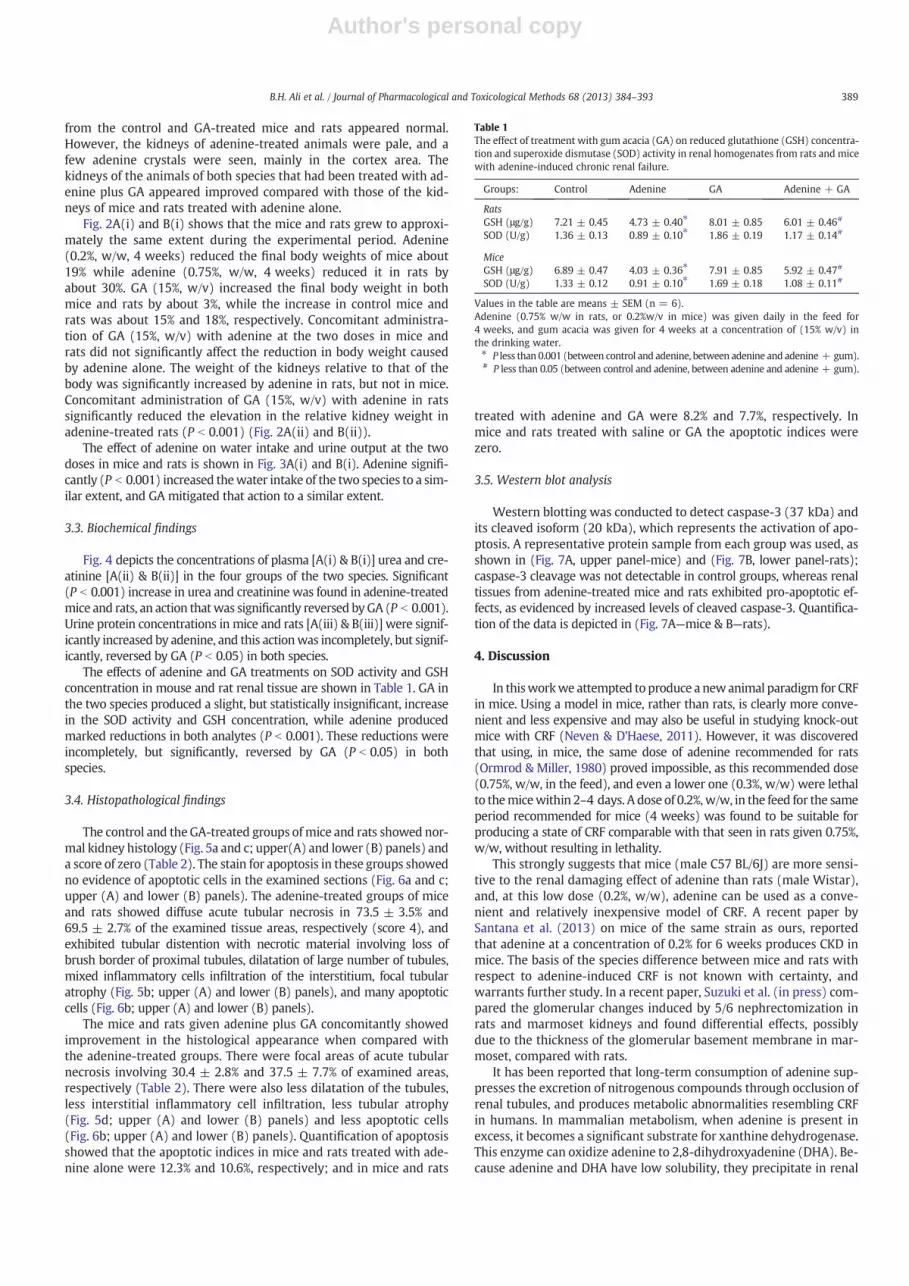
3.5. Western blot analysis
Western blotting was conducted to detect caspase-3 (37 kDa) andits cleaved isoform (20 kDa), which represents the activation of apo-ptosis. A representative protein sample from each group was used, asshown in (Fig. 7A, upper panel-mice) and (Fig. 7B, lower panel-rats);caspase-3 cleavage was not detectable in control groups, whereas renaltissues from adenine-treated mice and rats exhibited pro-apoptotic ef-fects, as evidenced by increased levels of cleaved caspase-3. Quantifica-tion of the data is depicted in (Fig. 7A—mice & B—rats).
4. Discussion
In thisworkwe attempted to produce a newanimal paradigm for CRFin mice. Using a model in mice, rather than rats, is clearly more conve-nient and less expensive and may also be useful in studying knock-outmice with CRF (Neven & D'Haese, 2011). However, it was discoveredthat using, in mice, the same dose of adenine recommended for rats(Ormrod & Miller, 1980) proved impossible, as this recommended dose(0.75%, w/w, in the feed), and even a lower one (0.3%, w/w) were lethalto themicewithin 2–4 days. A dose of 0.2%,w/w, in the feed for the sameperiod recommended for mice (4 weeks) was found to be suitable forproducing a state of CRF comparable with that seen in rats given 0.75%,w/w, without resulting in lethality.
This strongly suggests that mice (male C57 BL/6J) are more sensi-tive to the renal damaging effect of adenine than rats (male Wistar),and, at this low dose (0.2%, w/w), adenine can be used as a conve-nient and relatively inexpensive model of CRF. A recent paper bySantana et al. (2013) on mice of the same strain as ours, reportedthat adenine at a concentration of 0.2% for 6 weeks produces CKD inmice. The basis of the species difference between mice and rats withrespect to adenine-induced CRF is not known with certainty, andwarrants further study. In a recent paper, Suzuki et al. (in press) com-pared the glomerular changes induced by 5/6 nephrectomization inrats and marmoset kidneys and found differential effects, possiblydue to the thickness of the glomerular basement membrane in mar-moset, compared with rats.
It has been reported that long-term consumption of adenine sup-presses the excretion of nitrogenous compounds through occlusion ofrenal tubules, and produces metabolic abnormalities resembling CRFin humans. In mammalian metabolism, when adenine is present inexcess, it becomes a significant substrate for xanthine dehydrogenase.This enzyme can oxidize adenine to 2,8-dihydroxyadenine (DHA). Be-cause adenine and DHA have low solubility, they precipitate in renal
Table 1The effect of treatment with gum acacia (GA) on reduced glutathione (GSH) concentra-tion and superoxide dismutase (SOD) activity in renal homogenates from rats and micewith adenine-induced chronic renal failure.
Groups: Control Adenine GA Adenine + GA
RatsGSH (μg/g) 7.21 ± 0.45 4.73 ± 0.40⁎ 8.01 ± 0.85 6.01 ± 0.46#
SOD (U/g) 1.36 ± 0.13 0.89 ± 0.10⁎ 1.86 ± 0.19 1.17 ± 0.14#
MiceGSH (μg/g) 6.89 ± 0.47 4.03 ± 0.36⁎ 7.91 ± 0.85 5.92 ± 0.47#
SOD (U/g) 1.33 ± 0.12 0.91 ± 0.10⁎ 1.69 ± 0.18 1.08 ± 0.11#
Values in the table are means ± SEM (n = 6).Adenine (0.75% w/w in rats, or 0.2%w/v in mice) was given daily in the feed for4 weeks, and gum acacia was given for 4 weeks at a concentration of (15% w/v) inthe drinking water.⁎ P less than 0.001 (between control and adenine, between adenine and adenine + gum).# P less than 0.05 (between control and adenine, between adenine and adenine + gum).
389B.H. Ali et al. / Journal of Pharmacological and Toxicological Methods 68 (2013) 384–393

Author's personal copy
tubules (Ormrod & Miller, 1980; Shuvy et al., 2011; Yokozawa et al.,1986). It is not known whether mice transform adenine to a renaldamaging metabolite more efficiently than rats, or whether thereare other genetic, biochemical, or histological explanations for thisspecies difference.
Unlike what we have found in the present work, mice have beenshown to be more resistant to the acute renal actions of cisplatin(CP) (Katayama et al., 2011), and gentamicin (Suzuki et al., 1995).Gentamicin concentration in the cytosol of rat renal tissue wasabout 3.4-fold higher than that in mouse kidney after administrationof the antibiotic at a dose of 80 mg/kg. In light microscopic analysis,gentamicin, at this dose, produced necrosis in the greater part of therat kidney proximal tubuli with no pathological findings in mousekidney. Thus, the reason for the resistance of mice to gentamicin
nephrotoxicity has been suggested to be due to differences in thestructure of the mouse nephron.
Micewere also more resistant than rats to the acute nephrotoxic ac-tion of CP, based on clinico-pathological changes; the nephrotoxic dosewas determined to be 45 mg/m2 for mice, compared with 22.5 mg/m2
for rats (Katayama et al., 2011). The species difference here was as-cribed to a difference in the cysteine-S-conjugate β-lyase that is in-volved in the metabolism of cisplatin to a nephrotoxic metabolite.
There are only few papers on the use of adenine in mice. One ofthose was on genetically engineered mice which were used specificallyas amodel for human adenine phosphoribosyl transferase deficiency, inwhich the deficiency of this enzyme, adenine phosphoribosyl transfer-ase (APRT, EC 2.4.2.7), can result in nephrolithiasis, interstitial nephritis,and CRF (Stockelman, Lorenz, Smith, Biovin, & Stambrook, 1998). More
A: Mice (upper panel)
B: Rats (lower panel)
Fig. 5. Representative photographs of sections of renal tissue under light microscope of mice (A) and rats (B) that have been treated with (a) saline, (b) adenine, (c) GA, and(d) adenine + GA after hematoxylin and eosin staining (H & E, 100×). (a) Control group, showing normal kidney architecture and histology. (b) Adenine-treated group, showingacute tubular necrosis in about 70% of the examined tissue areas (thick arrows) with tubular distention with necrotic material (big thick arrows), and many apoptotic cells andmixed inflammatory cells (big thin arrows), and atrophic tubules (arrow head). (c) GA 15% treated group, showing normal kidney architecture and histology. (d) Adenine + GA15% treated group, showing histological improvement in the histologic appearance with focal areas of acute tubular necrosis (thick arrows) involving about 38% of examined areas,with less dilated tubules, less interstitial inflammation (thin arrow) and less atrophic tubules (arrow head).
390 B.H. Ali et al. / Journal of Pharmacological and Toxicological Methods 68 (2013) 384–393

Author's personal copy
recently, a study was published on the use of adenine (0.75%, w/w, inthe feed) in C57BL/6J male mice, as a model of acute renal injury(ARI) within 1–5 days of adenine ingestion (Morishita et al., 2011). Inour hands, this dose was lethal to mice within 1–2 days, possiblysuggesting that at a concentration of 0.75%, w/w, adenine is not suitableto use if the aim is to produce ARI or CRF models in mice. While thepresent work was being written, a paper on adenine-induced CKD inmice appeared in which adenine (0.2%, w/w) was given to C57/BL-6micemixedwith feed for 6 weeks (Santana et al., 2013). Our current re-sults in the same strain of mice using adenine (0.2% for 4 weeks) are inagreement with that report.
Biochemical indicators of cell death include caspase-3, which is acrucial mediator of programmed cell death (apoptosis). Caspase-3 ac-tivation by cleavage has been considered as an apoptotic index, andthis is essential for the formation of apoptotic bodies and commit-ment to loss of cell viability. In this work, adenine-treated mice andrats showed detectable caspase-3 cleavage, which may be considered
Table 2Semiquantitative analysis of histology of kidneys from rats and mice treated with sa-line, adenine, gum Arabic (GA) or adenine + GA.
Group % of necrosis Score of necrosis
Control group 0 (rats) 0 (rats)0 (mice) 0 (mice)
Adenine-treated group 73.5 ± 3.5 (rats) 4(rats)69.5 ± 2.7 (mice) 4 (mice)
GA-treated group 0 (rats) 0 (rats)0 (mice) 0 (mice)
Adenine + GA-treated group 30.4 ± 2.8 (rats) 2 (rats)37.5 ± 3.1 (mice) 2 (mice)
Values are means ± SEM (n = 6).Rats and mice were treated with adenine (0.75% and 0.2% w/w, respectively) in thefeed for 4 consecutive weeks, GA (15 w/v in the drinking water) for 4 consecutiveweeks, or both given together for the same duration, and were killed 24 h after thelast day of treatment. Kidney sections were processed and analyzed by a pathologistunaware of the treatments given.
Aa b
c d
a b
c d
B
Fig. 6. Representative photograph of sections of renal tissue of mice (A) and rats (B) that have been treated with (a) saline, (b) adenine, (c) GA and (d) adenine + GA, and analyzedimmunohistochemically (anticaspase-3, streptavidin–biotin immunohistochemicalmethod). Saline andGA-treated groups (a and c, respectively) showednormal kidney architecture andno apoptotic cells. (b) Adenine-treated group showed acute tubular necrosis with tubular distention and necrotic material andmany apoptotic cell depicting brown cytoplasmic staining(thick arrows). Mice given (d) adenine + GA showed improvement in the histologic appearance with few focal areas of acute tubular necrosis and few apoptotic cells depicting browncytoplasmic staining (thick arrows).
391B.H. Ali et al. / Journal of Pharmacological and Toxicological Methods 68 (2013) 384–393
Author's personal copy
a possible mechanism involved in the adenine-induced kidney dam-age. The induced apoptosis was almost totally suppressed by GA inrat kidney tissue, and to a lesser extent in the mice renal tissue.
The specific mechanism of the effect of GA in apoptosis is, however,not clear. However, the results do suggest that there is a functional pro-tective effect of GA in adenine CRF in mice and rats, the mechanism ofwhich might involve combating apoptosis induced by adenine.
Further in vivo studies arewarranted to shedmore light on the effectof GA on adenine-mediated apoptosis. CRF is known to be associatedwith generation of damaging free radicals, and also with inflammatoryactions (Himmelfarb, 2004).Wehave previously shown, in rats, that GApossesses both anti-oxidant and anti-inflammatory properties (Ali etal., 2010), and this might be the basis of its beneficial effect in theadenine-induced CRF. The possible mechanism by which GA amelio-rates adenine-induced CRF has been discussed before (Ali et al., 2013).Here, we have confirmed the salutary action of GA in adenine CRF inboth mice and rats. The modest increase (3%) in the body weights ofGA-treated mice and rats compared with their respective controls(which is increased by 15%–18%) may be potentially a salutary action.Recently, a study has been conducted on healthy women and has con-cluded that GA ingestion causes significant reduction in body massindex and body fat percentage among healthy adult females. This actionof GA could be utilized in the treatment of obesity (Babiker et al., 2012).
We have reported recently that adenine-induced CRF in rats resultedin several consequences that included some behavioral (Ali, Ziada,Al-Husseni, Beegam, Al-Ruqaishi, et al., 2011) and vascular changes inblood pressure and heart rate (Ali, Ziada, Al-Husseni, Beegam, &Nemmar,2011). Comparing these consequences (and others, such as its effect onreproductive function (Adachi & Nakada, 1999)) in the currently pro-posed model in mice, is warranted.
To what extent any animal model of CRF can resemble CKD inhumans (considering that the situations of patients suffering from
CKD cannot be easily and completely reproduced) is not certain(Hentschel & Bonventre, 2005). However, the fact that more thanone clinical report from Sudan (Ali, Ali, Fadlalla, & Khalid, 2008) andother countries (Al-Mosawi, 2007, 2009) has confirmed that the salu-tary effect of giving GA to CKD patients lends strong support to therelevance and validity of the model used here.
In conclusion, this work has shown that adenine can be used as amodel for CRF in mice when given in the feed at a concentration of0.2%, w/w, for four weeks, causing a similar degree of renal damageto that induced in rats by feeding adenine at a concentration of0.75%, w/w, for four weeks. GA was found to be equally ameliorativein both models.
Author contributions
Conceived and designed the experiments: BHA. Performed theexperiments: AN; AR; IA; SB; MIW; and SAA. Analyzed the data: BHA;MZ; and IA. Contributed reagents/tools: BHA; AN; MZ; MIW; and SAA.Wrote the paper: BHA; AN; MZ, and MIW.
Acknowledgments
This work was supported by a grant from the Research Council ofOman (RC/Med/Pharm/10/01) and SQU. Thanks are due to the staff ofthe SQU Small Animal House for looking after the animals. GA was akind gift from Sanwa-Cho, Toyonaka, Osaka, Japan.
References
Adachi, Y., & Nakada, T. (1999). Effect of experimentally induced renal failure on testiculartestosterone synthesis in rats. Archives of Andrology, 43, 37–45.
A) Mice
B) Rats
Fig. 7. Representative photograph and quantification of apoptosis and caspase 3 cleavage in kidney tissues of mice (A-top panel) and rats (B-bottom panel). Lysates were prepared fromkidney tissues of animals treated with saline (control), adenine (Ad), Ad + GA or GA. Western blotting is depicted for caspase-3, cleaved caspase-3 and β-Actin loading protein.
392 B.H. Ali et al. / Journal of Pharmacological and Toxicological Methods 68 (2013) 384–393

Author's personal copy
Ali, B. H., Al-Husseni, I., Beegam, S., Al-Shukaili, A., Nemmar, A., Schierling, S., et al.(2013). Effect of gum Arabic on oxidative stress and inflammation in adenine in-duced chronic renal failure in rats. PloS One, 8, e55242.
Ali, A. A., Ali, K. E., Fadlalla, A. E., & Khalid, K. E. (2008). The effects of gum arabic oraltreatment on the metabolic profile of chronic renal failure patients under regularhaemodialysis in Central Sudan. Natural Product Research, 22, 12–21.
Ali, B. H., Alqarawi, A. A., & Ahmed, I. H. (2004). Does treatment with gum Arabic affectexperimental chronic renal failure in rats? Fundamental and Clinical Pharmacology,18, 327–329.
Ali, B. H., Al-Salam, S., Al-Husseni, I., Kayed, R. R., Al-Masroori, N., Al-Harthi, T., et al.(2010). Effects of gum Arabic in rats with adenine-induced chronic renal failure.Experimental Biology and Medicine (Maywood), 235, 373–382.
Ali, B. H., Ziada, A., Al-Husseni, I., Beegam, S., Al-Ruqaishi, B., & Nemmar, A. (2011).Effect of acacia gum on blood pressure in rats with adenine-induced chronicrenal failure. Phytomedicine, 18, 1176–1180.
Ali, B. H., Ziada, A., Al-Husseni, I., Beegam, S., & Nemmar, A. (2011). Motor and behavioralchanges in rats with adenine-induced chronic renal failure: Influence of acacia gumtreatment. Experimental Biology and Medicine (Maywood), 236, 107–112.
Ali, B. H., Ziada, A., & Blunden, G. (2009). Biological effects of gum Arabic: A review ofsome recent research. Food and Chemical Toxicology, 47, 1–8.
Al-Mosawi, A. J. (2007). The use of acacia gum in end stage renal failure. Journal of TropicalPediatrics, 53, 362–365.
Al-Mosawi, A. J. (2009). Six-year dialysis freedom in end-stage renal disease. Clinicaland Experimental Nephrology, 13, 494–500.
Babiker, R., Merghani, T. H., Elmusharaf, K., Badi, R. M., Lang, F., & Saeed, A. M. (2012).Effects of gum Arabic ingestion on body mass index and body fat percentage inhealthy adult females: Two-arm randomized, placebo controlled, double-blindtrial. Nutrition Journal, 11, 111.
Baumgarten, M., & Gehr, T. (2011). Chronic kidney disease: Detection and evaluation.American Family Physician, 84, 1138–1148.
Deng, A., Arndt, M. A., Satriano, J., Singh, P., Rieg, T., Thomson, S., et al. (2010). Renalprotection in chronic kidney disease: Hypoxia-inducible factor activation vs.angiotensin II blockade. American Journal of Physiology. Renal Physiology, 299,F1365–F1373.
Fogo, A. B. (2003). Animal models of FSGS: Lessons for pathogenesis and treatment.Seminars in Nephrology, 23, 161–171.
Hentschel, D. M., & Bonventre, J. V. (2005). Novel non-rodent models of kidney disease.Current Molecular Medicine, 5, 537–546.
Himmelfarb, J. (2004). Linking oxidative stress and inflammation in kidney disease:Which is the chicken and which is the egg? Seminars in Dialysis, 17, 449–454.
Ichihara, A., Sakoda, M., Kurauchi-Mito, A., Narita, T., Kinouchi, K., & Itoh, H. (2009).Drug discovery for overcoming chronic kidney disease (CKD): New therapy forCKD by a (pro) renin receptor-blocking decoy peptide. Journal of PharmacologicalSciences, 109, 20–23.
James, M. T., Hemmelgarn, B. R., & Tonelli, M. (2010). Early recognition and preventionof chronic kidney disease. Lancet, 375, 1296–1309.
Katayama, R., Nagata, S., Iida, H., Yamagishi, N., Yamashita, T., & Furuhama, K. (2011).Possible role of cysteine-S-conjugate β-lyase in species differences in cisplatinnephrotoxicity. Food and Chemical Toxicology, 49, 2053–2059.
Kujal, P., & Vernerová, Z. (2008). Nephrectomy as an experimental model of chronicrenal failure and adaptation to reduced nephron number. Ceskoslvenska Fysiologie,57, 104–109.
Mak, R. H., Kuo, H. J., & Cheung, W. W. (2006). Animal models of obesity-associatedchronic kidney disease. Advances in Chronic Kidney Disease, 13, 374–385.
Minami, T., Nakagawa, H., Nabeshima, M., Kadota, E., Namikawa, K., Kawaki, H., et al.(1994). Nephrotoxicity induced by adenine and its analogs: Relationship betweenstructure and renal injury. Biological and Pharmaceutical Bulletin, 17, 1032–1037.
Morishita, Y., Ohnishi, A., Watanabe, M., Ishibashi, K., & Kusano, E. (2011). Establish-ment of acute kidney injury mouse model by 0.75% adenine ingestion. RenalFailure, 33, 1013–1018.
Neven, E., & D'Haese, P. C. (2011). Vascular calcification in chronic renal failure: Whathave we learned from animal studies? Circulation Research, 108, 249–264.
Nugent, R. A., Fathima, S. F., Feigl, A. B., & Chyung, D. (2011). The burden of chronic kid-ney disease on developing nations: A 21st century challenge in global health.Nephron. Clinical Practice, 118, 269–277.
Ormrod, D., & Miller, T. (1980). Experimental uremia. Description of a model producingvarying degrees of stable uremia. Nephron, 26, 249–254.
Oyama, Y., Hashiguchi, T., Taniguchi, N., Tancharoen, S., Uchimura, T., Biswas, K. K., et al.(2010). High-mobility group box-1 protein promotes granulomatous nephritis inadenine-induced nephropathy. Laboratory Investigation, 90, 853–866.
Santana, A. C., Degaspari, S., Catanozi, S., Dellê, H., de Sá Lima, L., Silva, C., et al. (2013).Thalidomide suppresses inflammation in adenine-induced CKD with uraemia inmice. Nephrology, Dialysis, Transplantation, 28, 1140–1149.
Shuvy, M., Nyska, A., Beeri, R., Abedat, S., Gal-Moscovici, A., Rajamannan, N. M., et al.(2011). Histopathology and apoptosis in an animal model of reversible renal inju-ry. Experimental Toxicology and Pathology, 63, 303–306.
Smart, N. A., & Titus, T. T. (2011). Outcomes of early versus late nephrology referral inchronic kidney disease: A systematic review. American Journal of Medicine, 124,1073–1080.
Stockelman, M. G., Lorenz, J. N., Smith, F. N., Biovin, G. P., & Stambrook, P. J. (1998).Chronic renal failure in a mouse model of human adenine phosphoribosyl transfer-ase deficiency. American Journal of Physiology, 275, 154–163.
Suzuki, S., Takamura, S., Yoshida, J., Shinzawa, Y., Niwa, O., & Tamatani, R. (1995). Com-parison of gentamicin nephrotoxicity between rats and mice. Comparative Bio-chemistry and Physiology. Part C Pharmacology, Toxicology and Endocrinology, 112,15–28.
Suzuki, Y., Yamaguchi, I., Onoda, N., Saito, T., Myojo, K., Imaizumi, M., et al. (2013). Dif-ferential renal glomerular changes induced by 5/6 nephrectomization betweencommon marmoset monkeys (Callithrix jacchus) and rats. Experimental Toxicologyand Pathology (in press).
Tong, Y., Han, B., Guo, H., & Liu, Y. (2010). Protection of Chinese herbs againstadenine-induced chronic renal failure in rats. African Journal of Traditional Comple-mentary and Alternative Medicine, 7, 331–338.
Vielhauer, V., Stavrakis, G., & Mayadas, T. N. (2005). Renal cell-expressed TNF receptor2, not receptor 1, is essential for the development of glomerulonephritis. Journal ofClinical Investigation, 115, 1199–1209.
Yokozawa, T., Zheng, P. D., Oura, H., & Koizumi, F. (1986). Animal model of adenine-induced chronic renal failure in rats. Nephron, 44, 230–234.
393B.H. Ali et al. / Journal of Pharmacological and Toxicological Methods 68 (2013) 384–393


