Embed Size (px)
Citation preview

arX
iv:1
002.
1028
v1 [
astr
o-ph
.GA
] 4
Feb
201
0
New results from DAMA/LIBRA
R.Bernabei a,b, P. Belli b, F. Cappella c,d, R.Cerulli e, C.J.Dai f ,
A. d’Angelo c,d, H.L.He f , A. Incicchitti d, H.H.Kuang f ,
X.H.Ma f , F.Montecchia a,b, F.Nozzoli a,b,
D. Prosperi c,d, X.D. Sheng f , R.G.Wang f , Z.P.Ye f,g
aDip. di Fisica, Universita di Roma “Tor Vergata”, I-00133 Rome, ItalybINFN, sez. Roma “Tor Vergata”, I-00133 Rome, Italy
cDip. di Fisica, Universita di Roma “La Sapienza”, I-00185 Rome, ItalydINFN, sez. Roma, I-00185 Rome, Italy
eLaboratori Nazionali del Gran Sasso, I.N.F.N., Assergi, Italyf IHEP, Chinese Academy, P.O. Box 918/3, Beijing 100039, China
gUniversity of Jing Gangshan, Jiangxi, China
Abstract
DAMA/LIBRA is running at the Gran Sasso National Laboratory of theI.N.F.N.. Here the results obtained with a further exposure of 0.34 ton × yr arepresented. They refer to two further annual cycles collected one before and one af-ter the first DAMA/LIBRA upgrade occurred on September/October 2008. Thecumulative exposure with those previously released by the former DAMA/NaIand by DAMA/LIBRA is now 1.17 ton × yr, corresponding to 13 annual cycles.The data further confirm the model independent evidence of the presence ofDark Matter (DM) particles in the galactic halo on the basis of the DM annualmodulation signature (8.9 σ C.L. for the cumulative exposure). In particular,with the cumulative exposure the modulation amplitude of the single-hit eventsin the (2 – 6) keV energy interval measured in NaI(Tl) target is (0.0116±0.0013)cpd/kg/keV; the measured phase is (146 ± 7) days and the measured period is(0.999 ± 0.002) yr, values well in agreement with those expected for the DMparticles.
Keywords: Scintillation detectors, elementary particle processes, Dark Matter
PACS numbers: 29.40.Mc - Scintillation detectors; 95.30.Cq - Elementary particleprocesses; 95.35.+d - Dark matter (stellar, interstellar, galactic, and cosmological).
1 Introduction
The former DAMA/NaI [1, 2, 3, 4, 5, 6, 7, 8, 9, 10, 11, 12, 13, 14] and the presentDAMA/LIBRA [15, 16, 17] experiments at the Gran Sasso National Laboratory havethe main aim to investigate the presence of Dark Matter particles in the galactichalo by exploiting the model independent Dark Matter annual modulation signature
1

originally suggested in the mid 80’s in ref. [18]. In fact, as a consequence of its annualrevolution around the Sun, which is moving in the Galaxy travelling with respect tothe Local Standard of Rest towards the star Vega near the constellation of Hercules,the Earth should be crossed by a larger flux of Dark Matter particles around ∼ 2June (when the Earth orbital velocity is summed to the one of the solar system withrespect to the Galaxy) and by a smaller one around ∼ 2 December (when the twovelocities are subtracted). Thus, this signature has a different origin and peculiaritiesthan the seasons on the Earth and than effects correlated with seasons (consider theexpected value of the phase as well as the other requirements listed below). Thisannual modulation signature is very distinctive since the effect induced by DM particlesmust simultaneously satisfy all the following requirements: the rate must contain acomponent modulated according to a cosine function (1) with one year period (2) anda phase that peaks roughly around ≃ 2nd June (3); this modulation must only befound in a well-defined low energy range, where DM particle induced events can bepresent (4); it must apply only to those events in which just one detector of manyactually “fires” (single-hit events), since the DM particle multi-interaction probabilityis negligible (5); the modulation amplitude in the region of maximal sensitivity mustbe <∼7% for usually adopted halo distributions (6), but it can be larger in case ofsome possible scenarios such as e.g. those in refs. [19, 20]. This offers an efficientDM model independent signature, able to test a large interval of cross sections and ofhalo densities; moreover, the use of highly radiopure NaI(Tl) scintillators as target-detectors assures sensitivity to wide ranges of DM candidates, of interaction types andof astrophysical scenarios.
It is worth noting that only systematic effects or side reactions able to simultane-ously fulfil all the 6 requirements given above (and no one has ever been suggested)and to account for the whole observed modulation amplitude might mimic this DMsignature.
The DAMA/LIBRA set-up, whose description, radiopurity and main features arediscussed in details in ref. [16] has firstly been upgraded in September/October 2008:i) one detector has been recovered by replacing a broken PMT (see ref. [15]); ii) a newoptimization of some PMTs and HVs has been performed; iii) all the transient digitizersrecording the shape of the pulse have been replaced with new ones, the U1063A Acqiris8-bit 1GS/s DC270 High-Speed cPCI Digitizers; iv) a new DAQ with optical read-outhas been installed. Also during this upgrade the operations involving the handling ofthe sensitive part of the setup and the shield have been performed in HP Nitrogenatmosphere. The upgrade has allowed to enlarge the sensitive mass and to improvegeneral features. Here we just remind that the sensitive part of this set-up is made of25 highly radiopure NaI(Tl) crystal scintillators (5-rows by 5-columns matrix) having9.70 kg mass each one. In each detector two 10 cm long special quartz light guidesact also as optical windows on the two end faces of the crystal and are coupled to twolow background photomultipliers working in coincidence at single photoelectron level.The detectors are housed in a sealed low-radioactive copper box installed in the centerof a low-radioactive Cu/Pb/Cd-foils/polyethylene/paraffin shield; moreover, about 1m concrete (made from the Gran Sasso rock material) almost fully surrounds (mostlyoutside the barrack) this passive shield, acting as a further neutron moderator. A
2

threefold-levels sealing system excludes the detectors from the environmental air ofthe underground laboratory [16]. A hardware/software system to monitor the runningconditions is operative and self-controlled computer processes automatically controlseveral parameters and manage alarms. Moreover: i) the light response ranges from5.5 to 7.5 photoelectrons/keV, depending on the detector; ii) the hardware thresholdof each PMT is at single photoelectron (each detector is equipped with two low back-ground photomultipliers working in coincidence); iii) energy calibration with X-rays/γsources are regularly carried out down to few keV; iv) the software energy thresholdof the experiment is 2 keV; v) both single-hit events (where just one of the detectorsfires) and multiple-hit events (where more than one detector fires) are acquired; v) thedata are collected up to the MeV region despite the optimization is performed for thelower one. For the radiopurity, the procedures and further details see ref. [15, 16].
The data of the former DAMA/NaI (0.29 ton × yr) and those of the first 4 annualcycles of DAMA/LIBRA (total exposure 0.53 ton×yr) have already given positivemodel independent evidence for the presence of DM particles in the galactic halo withhigh confidence level on the basis of the DM annual modulation signature [15].
In this paper the model independent results with other two annual cyclesDAMA/LIBRA-5,6 are presented. As mentioned, the data of the first cycle havebeen collected in the same conditions as DAMA/LIBRA-1,2,3,4 [15, 16], while thedata of DAMA/LIBRA-6 have been taken after the above mentioned 2008 upgrade.
2 The results
The updated exposures of the DAMA/LIBRA annual cycles and the cumulative onewith the former DAMA/NaI are given in Table 1.
Table 1: Exposures of the DAMA/LIBRA-5,6 annual cycles. Here α = 〈cos2ω(t− t0)〉is the mean value of the squared cosine and β = 〈cosω(t− t0)〉 is the mean value of thecosine (the averages are taken over the live time of the data taking and t0 = 152.5 day,i.e. June 2nd); thus, (α−β2) indicates the variance of the cosine (i.e. it is 0.5 for a fullyear of data taking). The information on the previously published DAMA/LIBRA-1,2,3,4, are recalled as well as the cumulative exposure, when including the formerDAMA/NaI.
Period mass Exposure (α − β2)(kg) (kg×day)
DAMA/LIBRA-1,2,3,4 Sept. 9, 2003 - July 17, 2007 232.8 192824 0.537
DAMA/LIBRA-5 July 17, 2007 - Aug. 29, 2008 232.8 66105 0.468
DAMA/LIBRA-6 Nov. 12,2008 - Sept. 1, 2009 242.5 58768 0.519
DAMA/LIBRA-1 to -6 Sept. 9, 2003 - Sept. 1, 2009 317697≃ 0.87 ton×yr 0.519DAMA/NaI + DAMA/LIBRA-1 to 6: 1.17 ton×yr
The only data treatment, which is performed on the raw data, is to remove noise
3

pulses (mainly PMT noise, Cherenkov light in the light guides and in the PMT win-dows, and afterglows) near the energy threshold in the single-hit events; for a descrip-tion of the used procedure and details see ref. [16].
In the DAMA/LIBRA-1,2,3,4,5,6 annual cycles about 7.2 × 10⁷ events have alsobeen collected for energy calibrations and about 3× 10⁶ events/keV for the evaluationof the acceptance windows efficiency for noise rejection near energy threshold. Theperiodical calibrations and, in particular, those related with the acceptance windowsefficiency mainly affect the duty cycle of the experiment. From Table 1 one can observea significant improvement in the duty cycle of the sixth annual cycles with respect tothe previous ones; this is mainly due to the new transient Digitizers and DAQ installedat fall 2008.
Several analyses on the model-independent investigation of the DM annual modu-lation signature have been performed as previously done in ref. [15] and refs. therein.In particular, Fig. 1 shows the time behaviour of the experimental residual rates forsingle-hit events in the (2–4), (2–5) and (2–6) keV energy intervals. These residualrates are calculated from the measured rate of the single-hit events (already correctedfor the overall efficiency and for the acquisition dead time) after subtracting the con-stant part: < rijk − flatjk >jk. Here rijk is the rate in the considered i-th timeinterval for the j-th detector in the k-th energy bin, while flatjk is the rate of thej-th detector in the k-th energy bin averaged over the cycles. The average is madeon all the detectors (j index) and on all the energy bins (k index) which constitutethe considered energy interval. The weighted mean of the residuals must obviously bezero over one cycle.
For clarity in Fig. 1 only the DAMA/LIBRA data collected over six annual cycles(0.87 ton × yr) are shown; the DAMA/NaI data (0.29 ton × yr) and comparison withDAMA/LIBRA are available in ref. [15].
The hypothesis of absence of modulation in the data can be discarded (see Table2).
Table 2: Test of absence of modulation in the data of the DAMA/LIBRA-1,2,3,4,5,6and without/with also the data of the former DAMA/NaI. As it can be seen, a nullmodulation amplitude is discarded by the data.
Energy interval DAMA/LIBRA DAMA/NaI & DAMA/LIBRA(keV) (6 annual cycles) (7+6 annual cycles)2-4 χ2/d.o.f. = 90.0/43 χ2/d.o.f. = 147.4/80
→ P = 3.6 × 10⁻⁵ → P = 6.8 × 10⁻⁶
2-5 χ2/d.o.f. = 82.1/43 χ2/d.o.f. = 135.2/80→ P = 3.1 ×10⁻⁴ → P = 1.1 × 10⁻⁴
2-6 χ2/d.o.f. = 68.9/43 χ2/d.o.f. = 139.5/80→ P = 7.4 × 10⁻³ → P = 4.3 × 10⁻⁵
The single-hit residual rate of DAMA/LIBRA-1,2,3,4,5,6 of Fig. 1 can be fittedwith the formula: A cosω(t − t0) considering a period T = 2π
ω= 1 yr and a phase
t0 = 152.5 day (June 2nd), as expected by the DM annual modulation signature; this
4

2-4 keV
Time (day)
Res
idua
ls (
cpd/
kg/k
eV)
DAMA/LIBRA ≈ 250 kg (0.87 ton×yr)
2-5 keV
Time (day)
Res
idua
ls (
cpd/
kg/k
eV)
DAMA/LIBRA ≈ 250 kg (0.87 ton×yr)
2-6 keV
Time (day)
Res
idua
ls (
cpd/
kg/k
eV)
DAMA/LIBRA ≈ 250 kg (0.87 ton×yr)
Figure 1: Experimental model-independent residual rate of the single-hit scintillationevents, measured by DAMA/LIBRA,1,2,3,4,5,6 in the (2 – 4), (2 – 5) and (2 – 6)keV energy intervals as a function of the time. The zero of the time scale is January1st of the first year of data taking of the former DAMA/NaI experiment [15]. Theexperimental points present the errors as vertical bars and the associated time binwidth as horizontal bars. The superimposed curves are the cosinusoidal functionsbehaviors A cosω(t − t0) with a period T = 2π
ω= 1 yr, with a phase t0 = 152.5 day
(June 2nd) and with modulation amplitudes, A, equal to the central values obtainedby best fit over the whole data including also the exposure previously collected bythe former DAMA/NaI experiment: cumulative exposure is 1.17 ton × yr (see alsoref. [15] and refs. therein). The dashed vertical lines correspond to the maximumexpected for the DM signal (June 2nd), while the dotted vertical lines correspond tothe minimum. See text.
5

can be repeated for the total available exposure 1.17 ton × yr including the formerDAMA/NaI data (see [15] and refs. therein). The results are shown in Table 3.
Table 3: Modulation amplitude, A, obtained by fitting the single-hit residual rate of thesix DAMA/LIBRA annual cycles (Fig. 1), and including also the former DAMA/NaIdata given elsewhere (see [15] and refs. therein) for a total cumulative exposure of 1.17ton × yr. It has been obtained by fitting the data with the formula: A cosω(t − t0)with T = 2π
ω= 1 yr and t0 = 152.5 day (June 2nd), as expected for a signal by the
DM annual modulation signature. The corresponding χ2 value for each fit and theconfidence level are also reported
Energy interval DAMA/LIBRA DAMA/NaI & DAMA/LIBRA(keV) (cpd/kg/keV) (cpd/kg/keV)2-4 A=(0.0170±0.0024) A=(0.0183±0.0022)
χ2/d.o.f. = 41.0/42 χ2/d.o.f. = 75.7/79→ 8.3 σ C.L.
2-5 A=(0.0129±0.0018) A=(0.0144±0.0016)χ2/d.o.f. = 30.7/42 χ2/d.o.f. = 56.6/79
→ 9.0 σ C.L.2-6 A=(0.0097±0.0015) A=(0.0114±0.0013)
χ2/d.o.f. = 24.1/42 χ2/d.o.f. = 64.7/79→ 8.8 σ C.L.
The compatibility among the 13 annual cycles has been investigated. In particular,the modulation amplitudes measured in each annual cycle of the whole 1.17 ton × yrexposure have been analysed as in ref. [15]. Indeed these modulation amplitudes arenormally distributed around their best fit value as pointed out by the χ2 test (χ2 = 9.3,12.2 and 10.1 over 12 d.o.f. for the three energy intervals, respectively) and the runtest (lower tail probabilities of 57%, 47% and 35% for the three energy intervals, re-spectively). Moreover, the DAMA/LIBRA-5 and DAMA/LIBRA-6 (2–6) keV modu-lation amplitudes are (0.0086±0.0032) cpd/kg/keV and (0.0101±0.0031) cpd/kg/keV,respectively, in agreement with that of DAMA/LIBRA-1,2,3,4: (0.0110 ± 0.0019)cpd/kg/keV; we also recall that the statistical compatibility between the DAMA/NaIand DAMA/LIBRA-1,2,3,4 modulation amplitudes has been verified [15]. Thus,also when adding DAMA/LIBRA-5,6, the cumulative result from DAMA/NaI andDAMA/LIBRA can be adopted.
Table 4 shows the results obtained for the cumulative 1.17 ton × yr exposure whenthe period and phase parameters are kept free in the fitting procedure described above.
The DAMA/LIBRA single-hit residuals of Fig.1 and those of DAMA/NaI (seee.g. [15]) have also been investigated by a Fourier analysis, obtaining a clear peakcorresponding to a period of 1 year (see Fig. 2); the same analysis in other energyregion shows instead only aliasing peaks.
The measured energy distribution has been investigated in other energy regionsnot of interest for Dark Matter, also verifying the absence of any significant back-
6

Table 4: Modulation amplitude (A), period (T = 2πω) and phase (t0), obtained by
fitting, with the formula: A cosω(t− t0), the single-hit residual rate of the cumulative1.17 ton × yr exposure. The results are well compatible with expectations for a signalin the DM annual modulation signature.
Energy interval A (cpd/kg/keV) T = 2πω
(yr) t0 (days) C. L.2-4 (0.0194±0.0022) (0.996±0.002) 136±7 8.8σ2-5 (0.0149±0.0016) (0.997±0.002) 142±7 9.3σ2-6 (0.0116±0.0013) (0.999±0.002) 146±7 8.9σ
Frequency (d-1)
Nor
mal
ized
Pow
er
0
5
10
15
0 0.002 0.004 0.006 0.008
Frequency (d-1)
Nor
mal
ized
Pow
er
0
5
10
15
20
0 0.002 0.004 0.006 0.008
Figure 2: Power spectrum of the measured single-hit residuals in the (2–6) keV (solidlines) and (6–14) keV (dotted lines) energy intervals calculated according to ref. [21],including also the treatment of the experimental errors and of the time binning. Thedata refer to: a) DAMA/LIBRA-1,2,3,4,5,6 (exposure of 0.87 ton × yr); b) the cumu-lative 1.17 ton × yr exposure (DAMA/NaI and DAMA/LIBRA-1,2,3,4,5,6). As it canbe seen, the principal mode present in the (2–6) keV energy interval corresponds toa frequency of 2.697× 10⁻³ d−1 and 2.735× 10⁻³ d−1 (vertical lines), respectively inthe a) and b) case. They correspond to a period of ≃ 1 year. A similar peak is notpresent in the (6–14) keV energy interval just above.
ground modulation 1. Following the procedures described in ref. [15] and ref. therein,the measured rate integrated above 90 keV, R90, as a function of the time has beenanalysed. In particular, also for these two latter annual cycles the distribution of thepercentage variations of R90 with respect to the mean values for all the detectors hasbeen considered; it shows a cumulative gaussian behaviour with σ ≃ 1%, well ac-
1, In fact, the background in the lowest energy region is essentially due to “Compton” electrons,X-rays and/or Auger electrons, muon induced events, etc., which are strictly correlated with theevents in the higher energy part of the spectrum. Thus, if a modulation detected in the lowest energyregion would be due to a modulation of the background (rather than to a signal), an equal or largermodulation in the higher energy regions should be present.
7
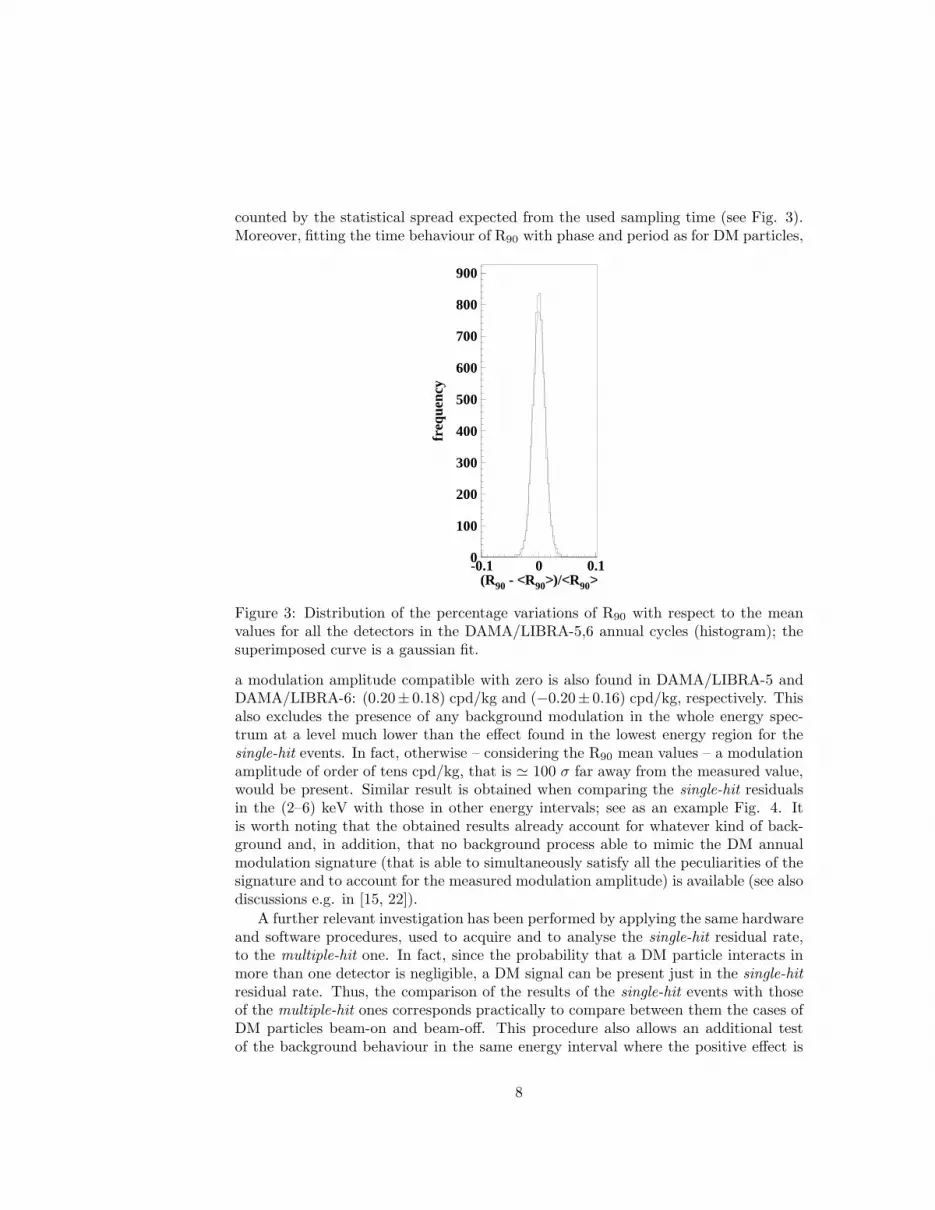
counted by the statistical spread expected from the used sampling time (see Fig. 3).Moreover, fitting the time behaviour of R90 with phase and period as for DM particles,
(R90 - <R90>)/<R90>
freq
uenc
y
0
100
200
300
400
500
600
700
800
900
-0.1 0 0.1
Figure 3: Distribution of the percentage variations of R90 with respect to the meanvalues for all the detectors in the DAMA/LIBRA-5,6 annual cycles (histogram); thesuperimposed curve is a gaussian fit.
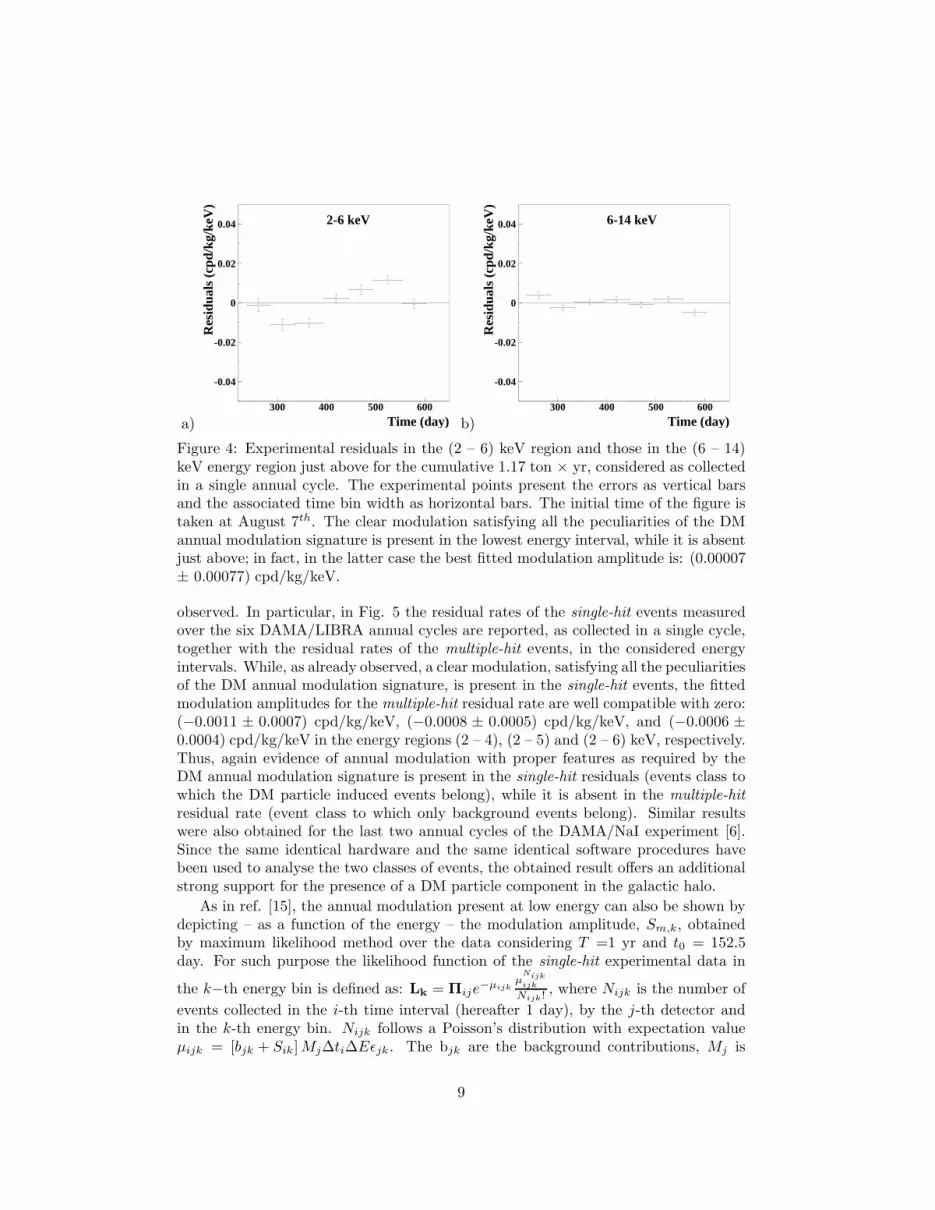
a modulation amplitude compatible with zero is also found in DAMA/LIBRA-5 andDAMA/LIBRA-6: (0.20± 0.18) cpd/kg and (−0.20± 0.16) cpd/kg, respectively. Thisalso excludes the presence of any background modulation in the whole energy spec-trum at a level much lower than the effect found in the lowest energy region for thesingle-hit events. In fact, otherwise – considering the R90 mean values – a modulationamplitude of order of tens cpd/kg, that is ≃ 100 σ far away from the measured value,would be present. Similar result is obtained when comparing the single-hit residualsin the (2–6) keV with those in other energy intervals; see as an example Fig. 4. Itis worth noting that the obtained results already account for whatever kind of back-ground and, in addition, that no background process able to mimic the DM annualmodulation signature (that is able to simultaneously satisfy all the peculiarities of thesignature and to account for the measured modulation amplitude) is available (see alsodiscussions e.g. in [15, 22]).
A further relevant investigation has been performed by applying the same hardwareand software procedures, used to acquire and to analyse the single-hit residual rate,to the multiple-hit one. In fact, since the probability that a DM particle interacts inmore than one detector is negligible, a DM signal can be present just in the single-hitresidual rate. Thus, the comparison of the results of the single-hit events with thoseof the multiple-hit ones corresponds practically to compare between them the cases ofDM particles beam-on and beam-off. This procedure also allows an additional testof the background behaviour in the same energy interval where the positive effect is
8
a) Time (day)
Res
idua
ls (
cpd/
kg/k
eV)
2-6 keV
-0.04
-0.02
0
0.02
0.04
300 400 500 600
b) Time (day)
Res
idua
ls (
cpd/
kg/k
eV)
6-14 keV
-0.04
-0.02
0
0.02
0.04
300 400 500 600
Figure 4: Experimental residuals in the (2 – 6) keV region and those in the (6 – 14)keV energy region just above for the cumulative 1.17 ton × yr, considered as collectedin a single annual cycle. The experimental points present the errors as vertical barsand the associated time bin width as horizontal bars. The initial time of the figure istaken at August 7th. The clear modulation satisfying all the peculiarities of the DMannual modulation signature is present in the lowest energy interval, while it is absentjust above; in fact, in the latter case the best fitted modulation amplitude is: (0.00007± 0.00077) cpd/kg/keV.
observed. In particular, in Fig. 5 the residual rates of the single-hit events measuredover the six DAMA/LIBRA annual cycles are reported, as collected in a single cycle,together with the residual rates of the multiple-hit events, in the considered energyintervals. While, as already observed, a clear modulation, satisfying all the peculiaritiesof the DM annual modulation signature, is present in the single-hit events, the fittedmodulation amplitudes for the multiple-hit residual rate are well compatible with zero:(−0.0011 ± 0.0007) cpd/kg/keV, (−0.0008 ± 0.0005) cpd/kg/keV, and (−0.0006 ±0.0004) cpd/kg/keV in the energy regions (2 – 4), (2 – 5) and (2 – 6) keV, respectively.Thus, again evidence of annual modulation with proper features as required by theDM annual modulation signature is present in the single-hit residuals (events class towhich the DM particle induced events belong), while it is absent in the multiple-hitresidual rate (event class to which only background events belong). Similar resultswere also obtained for the last two annual cycles of the DAMA/NaI experiment [6].Since the same identical hardware and the same identical software procedures havebeen used to analyse the two classes of events, the obtained result offers an additionalstrong support for the presence of a DM particle component in the galactic halo.
As in ref. [15], the annual modulation present at low energy can also be shown bydepicting – as a function of the energy – the modulation amplitude, Sm,k, obtainedby maximum likelihood method over the data considering T =1 yr and t0 = 152.5day. For such purpose the likelihood function of the single-hit experimental data in
the k−th energy bin is defined as: Lk = Πije−µijk
µNijk
ijk
Nijk!, where Nijk is the number of
events collected in the i-th time interval (hereafter 1 day), by the j-th detector andin the k-th energy bin. Nijk follows a Poisson’s distribution with expectation valueµijk = [bjk + Sik]Mj∆ti∆Eǫjk. The bjk are the background contributions, Mj is
9

2-4 keV
Time (day)
Res
idua
ls (
cpd/
kg/k
eV)
2-5 keV
Time (day)
Res
idua
ls (
cpd/
kg/k
eV)
2-6 keV
Time (day)
Res
idua
ls (
cpd/
kg/k
eV)
Figure 5: Experimental residual rates over the six DAMA/LIBRA annual cycles forsingle-hit events (open circles) (class of events to which DM events belong) and formultiple-hit events (filled triangles) (class of events to which DM events do not belong).They have been obtained by considering for each class of events the data as collectedin a single annual cycle and by using in both cases the same identical hardware and thesame identical software procedures. The initial time of the figure is taken on August7th. The experimental points present the errors as vertical bars and the associatedtime bin width as horizontal bars. See text and ref. [15]. Analogous results wereobtained for the DAMA/NaI data [6].
the mass of the j−th detector, ∆ti is the detector running time during the i-th timeinterval, ∆E is the chosen energy bin, ǫjk is the overall efficiency. Moreover, the signalcan be written as Sik = S0,k + Sm,k · cosω(ti − t0), where S0,k is the constant part ofthe signal and Sm,k is the modulation amplitude. The usual procedure is to minimizethe function yk = −2ln(Lk)− const for each energy bin; the free parameters of the fit
10

are the (bjk + S0,k) contributions and the Sm,k parameter. Hereafter, the index k isomitted when unnecessary.
Energy (keV)
S m (
cpd/
kg/k
eV)
-0.05
-0.025
0
0.025
0.05
0 2 4 6 8 10 12 14 16 18 20
Figure 6: Energy distribution of the Sm variable for the total cumulative exposure1.17 ton×yr. The energy bin is 0.5 keV. A clear modulation is present in the lowestenergy region, while Sm values compatible with zero are present just above. In fact,the Sm values in the (6–20) keV energy interval have random fluctuations around zerowith χ2 equal to 27.5 for 28 degrees of freedom.
In Fig. 6 the obtained Sm are shown in each considered energy bin (there ∆E = 0.5keV). It can be inferred that positive signal is present in the (2–6) keV energy interval,while Sm values compatible with zero are present just above. In fact, the Sm valuesin the (6–20) keV energy interval have random fluctuations around zero with χ2 equalto 27.5 for 28 degrees of freedom. All this confirms the previous analyses.
The method also allows the extraction of the the Sm values for each detector, foreach annual cycle and for each energy bin. Thus, following the procedure describedin ref. [15], we have also verified that the Sm are statistically well distributed in allthe six DAMA/LIBRA annual cycles and in all the sixteen energy bins (∆E = 0.25keV in the 2–6 keV energy interval) for each detector. Moreover, that procedure alsoallows the definition of a χ2 for each detector; the associated degree of freedom are16 for the detector restored after the upgrade in 2008 and 96 for the others. Thevalues of the χ2/d.o.f. range between 0.7 and 1.22 for twenty-four detectors, and theobserved annual modulation effect is well distributed in all these detectors at 95%C.L.. A particular mention is deserved to the remaining detector whose value is 1.28exceeding the value corresponding to that C.L.; this also is statistically consistent,considering that the expected number of detector exceeding this value over twenty-five is 1.25. Moreover, the mean value of the 25 χ2/d.o.f. is 1.066, slightly largerthan expected. Although this can be still ascribed to statistical fluctuations (seebefore), let us ascribe it to a possible systematics. In this case, one would have anadditional error of ≤ 4 × 10⁻⁴ cpd/kg/keV, if quadratically combined, or ≤ 5× 10⁻⁵
cpd/kg/keV, if linearly combined, to the modulation amplitude measured in the (2 –6) keV energy interval. This possible additional error: ≤ 4% or ≤ 0.5%, respectively,of the DAMA/LIBRA modulation amplitude is an upper limit of possible systematic
11
effects.Among further additional tests, the analysis of the modulation amplitudes as a
function of the energy separately for the nine inner detectors and the remaining exter-nal ones has been carried out including the DAMA/LIBRA-5,6 data to those alreadyanalysed in ref. [15]. The obtained values are fully in agreement; in fact, the hypoth-esis that the two sets of modulation amplitudes as a function of the energy belong tosame distribution has been verified by χ2 test, obtaining: χ2/d.o.f. = 3.1/4 and 7.1/8for the energy intervals (2–4) and (2–6) keV, respectively (∆E = 0.5 keV). This showsthat the effect is also well shared between inner and external detectors.
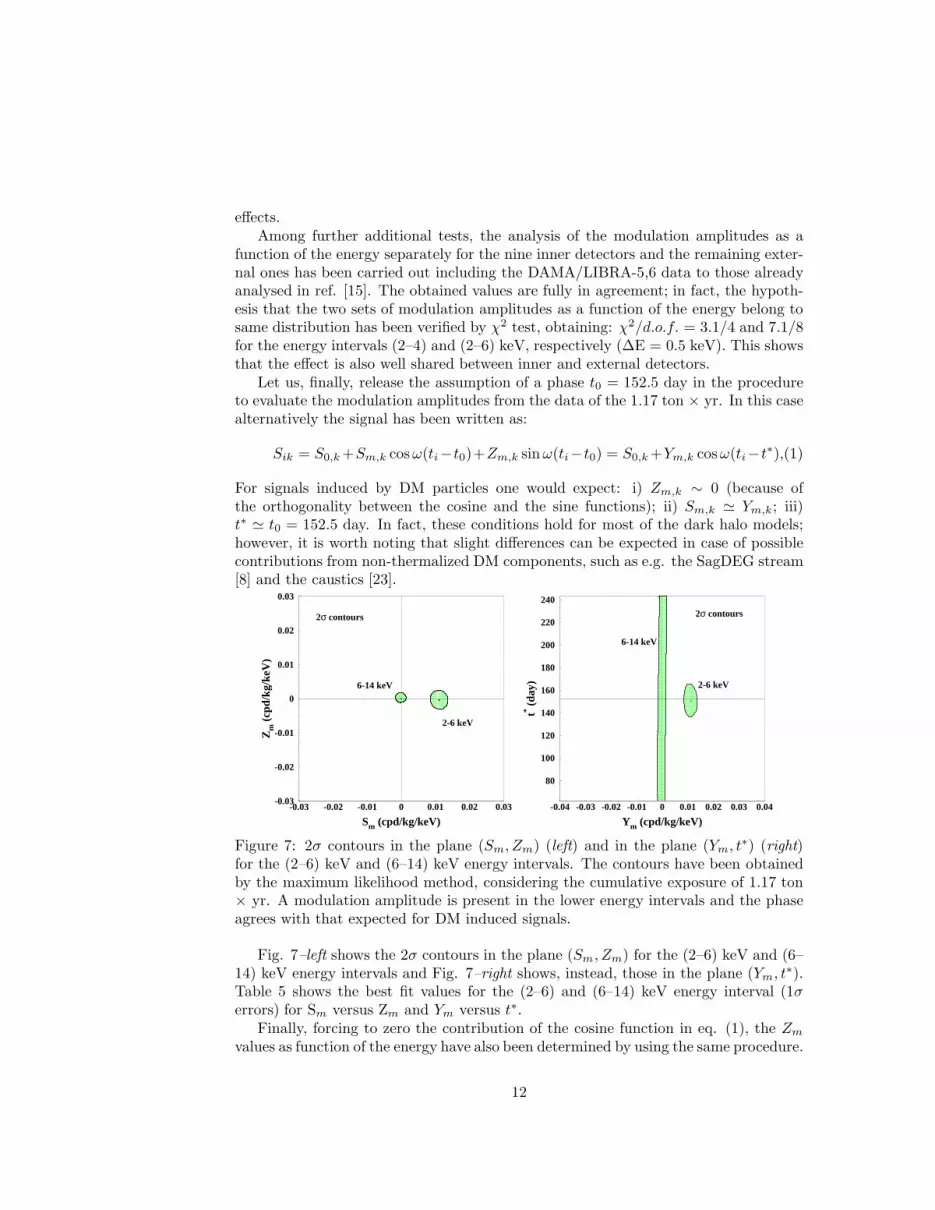
Let us, finally, release the assumption of a phase t0 = 152.5 day in the procedureto evaluate the modulation amplitudes from the data of the 1.17 ton × yr. In this casealternatively the signal has been written as:
Sik = S0,k+Sm,k cosω(ti−t0)+Zm,k sinω(ti−t0) = S0,k+Ym,k cosω(ti−t∗),(1)
For signals induced by DM particles one would expect: i) Zm,k ∼ 0 (because ofthe orthogonality between the cosine and the sine functions); ii) Sm,k ≃ Ym,k; iii)t∗ ≃ t0 = 152.5 day. In fact, these conditions hold for most of the dark halo models;however, it is worth noting that slight differences can be expected in case of possiblecontributions from non-thermalized DM components, such as e.g. the SagDEG stream[8] and the caustics [23].
Sm (cpd/kg/keV)
Zm
(cp
d/kg
/keV
)
2-6 keV
6-14 keV
2σ contours
-0.03
-0.02
-0.01
0
0.01
0.02
0.03
-0.03 -0.02 -0.01 0 0.01 0.02 0.03
Ym (cpd/kg/keV)
t* (da
y) 2-6 keV
6-14 keV
2σ contours
80
100
120
140
160
180
200
220
240
-0.04 -0.03 -0.02 -0.01 0 0.01 0.02 0.03 0.04
Figure 7: 2σ contours in the plane (Sm, Zm) (left) and in the plane (Ym, t∗) (right)for the (2–6) keV and (6–14) keV energy intervals. The contours have been obtainedby the maximum likelihood method, considering the cumulative exposure of 1.17 ton× yr. A modulation amplitude is present in the lower energy intervals and the phaseagrees with that expected for DM induced signals.
Fig. 7–left shows the 2σ contours in the plane (Sm, Zm) for the (2–6) keV and (6–14) keV energy intervals and Fig. 7–right shows, instead, those in the plane (Ym, t∗).Table 5 shows the best fit values for the (2–6) and (6–14) keV energy interval (1σerrors) for Sm versus Zm and Ym versus t∗.
Finally, forcing to zero the contribution of the cosine function in eq. (1), the Zm
values as function of the energy have also been determined by using the same procedure.
12

Table 5: Best fit values for the (2–6) and (6–14) keV energy interval (1σ errors) forSm versus Zm and Ym versus t∗, considering the cumulative exposure of 1.17 ton ×yr. See also Fig. 7.
E Sm Zm Ym t∗
(keV) (cpd/kg/keV) (cpd/kg/keV) (cpd/kg/keV) (day)2–6 (0.0111 ± 0.0013) -(0.0004 ± 0.0014) (0.0111 ± 0.0013) (150.5 ± 7.0)6–14 -(0.0001 ± 0.0008) (0.0002 ± 0.0005) -(0.0001 ± 0.0008) undefined
The values of Zm as a function of the energy is reported in Fig. 8. Obviously, suchvalues are expected to be zero in case of presence of a DM signal with t∗ ≃ t0 = 152.5day. By the fact, the χ2 test applied to the data supports the hypothesis that the Zm
values are simply fluctuating around zero; in fact, for example in the (2–14) keV and(2–20) keV energy region the χ2/d.o.f. are equal to 21.6/24 and 47.1/36 (probabilityof 60% and 10%), respectively.
Energy (keV)
Zm
(cp
d/kg
/keV
)
-0.05
-0.025
0
0.025
0.05
0 2 4 6 8 10 12 14 16 18 20
Figure 8: Energy distribution of the Zm variable for the total exposure (1.17 ton ×yr, DAMA/NaI&DAMA/LIBRA), once forced to zero the contribution of the cosinefunction in eq. (1). The energy bin is 0.5 keV. The Zm values are expected to be zeroin case of presence of a DM particles’ signal with t∗ ≃ t0 = 152.5 day. By the fact,the χ2 test applied to the data supports the hypothesis that the Zm values are simplyfluctuating around zero; see text.
The behaviours of the Ym and of the phase t∗ variables as function of energy areshown in Fig. 9 for the total exposure (1.17 ton × yr, DAMA/NaI&DAMA/LIBRA).The Ym are superimposed with the Sm values with 1 keV energy bin (unlike Fig. 6where the energy bin is 0.5 keV). As in the previous analyses, an annual modulationeffect is present in the lower energy intervals and the phase agrees with that expectedfor DM induced signals.
These results confirm those achieved by other kinds of analyses.Sometimes naive statements were put forwards as the fact that in nature several
phenomena may show some kind of periodicity. It is worth noting that the point iswhether they might mimic the annual modulation signature in DAMA/LIBRA (andformer DAMA/NaI), i.e. whether they might be not only quantitatively able to accountfor the observed modulation amplitude but also able to contemporaneously satisfy allthe requirements of the DM annual modulation signature. The same is also for side
13

Energy (keV)
Ym
, Sm
(cp
d/kg
/keV
)
-0.05
-0.025
0
0.025
0.05
0 2 4 6 8 10 12 14 16 18 20
Energy (keV)
t* (da
y)
0
100
200
300
2 3 4 5 6 7 8
Figure 9: Top: Energy distributions of the Ym variable (light data points; red colouronline) and of the Sm variable (solid data points) for the total exposure (1.17 ton ×yr, DAMA/NaI&DAMA/LIBRA). Here, unlike the data of Fig. 6, the energy bin is1 keV. Bottom: Energy distribution of the phase t∗ for the total exposure; here theerrors are at 2σ. An annual modulation effect is present in the lower energy intervalsup to 6 keV and the phase agrees with that expected for DM induced signals. Nomodulation is present above 6 keV and the phase is undetermined.
reactions. This has already been deeply investigated in ref. [15, 16] and referencestherein; the arguments and the quantitative conclusions, presented there, also applyto the DAMA/LIBRA-5,6 data. Some additional arguments have also been recentlyaddressed in [22, 24].
3 Comments
The obtained model independent evidence – at 8.9 σ C.L. over 13 annual cycles – iscompatible with a wide set of scenarios regarding the nature of the DM candidate andrelated astrophysical, nuclear and particle Physics (see e.g. ref. [5, 6, 7, 9, 10, 11, 12],Appendix A of ref. [15] and in literature, for example see [19, 25, 26]); and many otherpossibilities are open. Further future works are foreseen.
It is worth recalling that no other experiment exists, whose result can be directlycompared in a model-independent way with those by DAMA/NaI and DAMA/LIBRA,
14

and that – more in general – results obtained with different target materials and/ordifferent approaches cannot be directly compared among them in a model-independentway. This is in particular due to the existing experimental and theoretical uncertain-ties, not last e.g. how many kinds of dark matter particles can exist in the Universe2,the nature, the interaction types, the different nuclear and/or atomic correlated as-pects, the unknown right halo model, the right DM density, etc. as well as the uncer-tainties on the values of each one of the many involved experimental and theoreticalparameter/assumption/approximation used in the calculations. Moreover, some ex-perimental aspects of some techniques used in the field have also to be addressed[5, 27, 24]. Another relevant argument is the methodological robustness [28]. In par-ticular, the general considerations on comparisons reported in Appendix A of ref. [15]still hold. Hence, claims for contradiction have no scientific basis. On the other hand,whatever possible “positive” result has to be interpreted and a large room of compat-ibility with DAMA annual modulation evidence is present.
Similar considerations can also be done for the indirect detection searches, sinceit does not exist a biunivocal correspondence between the observables in the directand indirect experiments. However, if possible excesses in the positron to electron fluxratio and in the γ rays flux with respect to a modeling of the background contribution,which is expected from the considered sources, might be interpreted – under someassumptions – in terms of Dark Matter, this would also be not in conflict with the effectobserved by DAMA experiments. It is worth noting that different possibilities eitherconsidering different background modeling or accounting for other kinds of sources canalso explain the indirect observations [29].
Finally, as regards the accelerator searches for new particles beyond the StandardModel of particle Physics, it is worth noting that they can demonstrate the existenceof some of the possible DM candidates, but cannot credit that a certain particle is theDM solution or the ”single” DM solution. Moreover, DM candidates and scenariosexist (even e.g. for the neutralino candidate) on which accelerators cannot give anyinformation. It is also worth noting that for every candidate (including the neutralino)there exist various different possibilities for the theoretical aspects. Nevertheless, theresults from accelerators will give outstanding and crucial complementary informationin the field.
A new upgrade of DAMA/LIBRA is foreseen in 2010 with the replacement of allthe low background PMTs with new ones having higher quantum efficiency; the mainaim is to lower the software energy threshold and, thus, to increase the experimentalsensitivity and to disentangle – in the corollary investigation on the candidate parti-cle(s) – at least some of the many possible astrophysical, nuclear and particle Physicsscenarios and related experimental and theoretical uncertainties.
2In fact, it is worth noting that, considering the richness in particles of the visible matter which isless than 1% of the Universe density, one could also expect that the particle part of the Dark Matterin the Universe may also be multicomponent.
15

4 Conclusions
The new annual cycles DAMA/LIBRA-5,6 have further confirmed a peculiar annualmodulation of the single-hit events in the (2–6) keV energy region satisfying themany requests of the DM annual modulation signature; the total exposure by for-mer DAMA/NaI and present DAMA/LIBRA is 1.17 ton × yr.
In fact, as required by the DM annual modulation signature: 1) the single-hit eventsshow a clear cosine-like modulation as expected for the DM signal; 2) the measuredperiod is equal to (0.999± 0.002) yr well compatible with the 1 yr period as expectedfor the DM signal; 3) the measured phase (146± 7) days is well compatible with theroughly ≃ 152.5 days expected for the DM signal; 4) the modulation is present onlyin the low energy (2–6) keV energy interval and not in other higher energy regions,consistently with expectation for the DM signal; 5) the modulation is present only inthe single-hit events, while it is absent in the multiple-hit ones as expected for the DMsignal; 6) the measured modulation amplitude in NaI(Tl) of the single-hit events in the(2–6) keV energy interval is: (0.0116± 0.0013) cpd/kg/keV (8.9 σ C.L.). No system-atic or side processes able to simultaneously satisfy all the many peculiarities of thesignature and to account for the whole measured modulation amplitude is available.Further work is in progress.
References
[1] P. Belli, R. Bernabei, C. Bacci, A. Incicchitti, R. Marcovaldi, D. Prosperi, DAMAproposal to INFN Scientific Committee II, April 24th 1990.
[2] R. Bernabei et al., Phys. Lett. B 389 (1996) 757; R. Bernabei et al., Phys. Lett.B 424 (1998) 195; R. Bernabei et al., Phys. Lett. B 450 (1999) 448; P. Belli et al.,Phys. Rev. D 61 (2000) 023512; R. Bernabei et al., Phys. Lett. B 480 (2000) 23;R. Bernabei et al., Phys. Lett. B 509 (2001) 197; R. Bernabei et al., Eur. Phys.J. C 23 (2002) 61; P. Belli et al., Phys. Rev. D 66 (2002) 043503.
[3] R. Bernabei et al., Il Nuovo Cim. A 112 (1999) 545.
[4] R. Bernabei et al., Eur. Phys. J. C 18 (2000) 283.
[5] R. Bernabei el al., La Rivista del Nuovo Cimento 26 n.1 (2003) 1-73.
[6] R. Bernabei et al., Int. J. Mod. Phys. D 13 (2004) 2127.
[7] R. Bernabei et al., Int. J. Mod. Phys. A 21 (2006) 1445.
[8] R. Bernabei et al., Eur. Phys. J. C 47 (2006) 263.
[9] R. Bernabei et al., Int. J. Mod. Phys. A 22 (2007) 3155.
[10] R. Bernabei et al., Eur. Phys. J. C 53 (2008) 205.
[11] R. Bernabei et al., Phys. Rev. D 77 (2008) 023506.
16

[12] R. Bernabei et al., Mod. Phys. Lett. A 23 (2008) 2125.
[13] R. Bernabei et al., Phys. Lett. B408 (1997) 439; P. Belli et al., Phys. Lett. B460(1999) 236; R. Bernabei et al., Phys. Rev. Lett. 83 (1999) 4918; P. Belli et al.,Phys. Rev. C60 (1999) 065501; R. Bernabei et al., Il Nuovo Cimento A112 (1999)1541; R. Bernabei et al., Phys. Lett. B 515 (2001) 6; F. Cappella et al., Eur.Phys. J.-direct C14 (2002) 1; R. Bernabei et al., Eur. Phys. J. A 23 (2005) 7; R.Bernabei et al., Eur. Phys. J. A 24 (2005) 51; R. Bernabei et al., Astrop. Phys. 4(1995) 45.
[14] R. Bernabei, in the volume The Identification of Dark Matter, World Sc. Pub.(1997) 574.
[15] R. Bernabei et al., Eur. Phys. J. C 56 (2008) 333.
[16] R. Bernabei et al., Nucl. Instr. & Meth. A 592 (2008) 297.
[17] R. Bernabei et al., Eur. Phys. J. C 62 (2009) 327.
[18] K.A. Drukier et al., Phys. Rev. D 33 (1986) 3495; K. Freese et al., Phys. Rev. D37 (1988) 3388.
[19] D. Smith and N. Weiner, Phys. Rev. D 64 (2001) 043502; D. Tucker-Smith andN. Weiner, Phys. Rev. D 72 (2005) 063509; D. P. Finkbeiner et al, Phys. Rev. D80 (2009) 115008.
[20] K.Freese et al. astro-ph/0309279; Phys. Rev. Lett. 92 (2004) 11301.
[21] W.H. Press and G. B. Rybicki, Astrophys. J. 338 (1989) 277; J.D. Scargle, Astro-phys. J. 263 (1982) 835.
[22] R. Bernabei et al., arXiv:0912.0660[astro-ph.GA], to appear in the Proceed. ofScineghe09, October 2009, Assisi (It).
[23] F.S. Ling, P. Sikivie and S. Wick, Phys. Rev. D 70 (2004) 123503.
[24] R. Bernabei et. al, arXiv:0912.4200 to appear in the Proceedings of TAUP09(2009); http://taup2009.lngs.infn.it/slides/jul3/nozzoli.pdf, talk given by F. Noz-zoli.
[25] A. Bottino, N. Fornengo, and S. Scopel, Phys. Rev. D 67 (2003) 063519; A.Bottino, F. Donato, N. Fornengo, and S. Scopel, Phys. Rev. D 69 (2003) 037302;Phys. Rev. D 78 (2008) 083520; A. Bottino, F. Donato, N. Fornengo, S. Scopel,arXiv:0912.4025.
[26] R. Foot, Phys. Rev. D 78 (2008) 043529.
[27] R. Bernabei et al., ISBN 978-88-95688-12-1, pages 1-53 (2009) Exorma Ed.(arXiv:0806.0011v2).
[28] R. Hudson, Found. Phys. 39 (2009) 174.
17

[29] F. Donato et al., Phys. rev. Lett. 102 (2009) 071301; T. Delahaye et al., Astron.Astrophys. 501 (2009) 821; S. Profumo, arXiv:0812.4457; P. Blasi, Phys. Rev.Lett. 103 (2009) 051104; M. Ahlers et al., arXiv:0909.4060.
18


