Embed Size (px)
Citation preview

303I S S U E
2 0 1 4
NEW ZEALANDSURVEYORJ O U R N A L O F T H EN E W Z E A L A N DINSTITUTE OF SURVEYORS
Boundary Makers: Land Surveying in Nineteenth-Century New Zealand
Survey of the Height of Mount Taranaki or Mount Egmont
A Very High Resolution DEM of Kilimanjaro via Photogrammetry of Geoeye-1 Images (Kilisosdem2012)
Airborne Gravity Trial for an improved National Geoid
Photogrammetry, Remote Sensing and the Surveying Discipline
Making Urban Intensification Work: A Tauranga Case Study

NEW ZEALANDSURVEYORNEW ZEALAND SURVEYOR #303 • 2014
CONTENTSEDITORIAL Future PastBruce McFadgen 2
REFEREED PAPERSBoundary Makers: Land Surveying in Nineteenth-Century New ZealandGiselle Byrnes 5
Survey of the Height of Mount Taranaki or Mount EgmontA A Radcliffe 11
A Very High Resolution DEM of Kilimanjaro via Photogrammetry of Geoeye-1 Images (Kilisosdem2012)Pascal Sirguey and Nicolas J. Cullen 19
Airborne Gravity Trial for an improved National GeoidR. Winefield, M. Amos & F. Caratori Tontini 26
Photogrammetry, Remote Sensing and the Surveying DisciplinePascal Sirguey 32
Making Urban Intensification Work: A Tauranga Case Study Hamish Crawford & Caroline Miller 39
New Zealand SurveyorA Journal of the New Zealand Institute of Surveyors Inc.Issue No. 303 2014ISSN 0048-0150www.surveyors.org.nz
EditorBruce McFadgen
Phone: (04) 471 1774Fax: (04) 471 1907Email: [email protected]
All rights are reserved. Abstracts and brief quotations may be made providing reference is credited to New Zealand Surveyor. Complete papers or large extracts of text may not be printed or reproduced without the permission of the editor.
Correspondence relating to literary items in New Zealand Surveyor may be addressed to the editor. Papers, articles and letters to the editor, suitable for publication, are welcome.
All correspondence relating to business aspects, including subscriptions and advertising, should be addressed to:
New Zealand Institute of Surveyors Inc.PO Box 831WellingtonNEW ZEALAND
Phone: (04) 471 1774Fax: (04) 471 1907Email: [email protected] free to all members of the Institute.Subscription rates available from the Chief Executive.Published annually by the New Zealand Institute of Surveyors – 126th year of publication.
Design and print management byKPMDesignPO Box 1562Paraparaumu Beach 5252Phone: (04) 902 5703Email: [email protected]
2 New Zealand Surveyor #303 • 2014
EDITORIALI
Future PastBRUCE MCFADGENThe 2013 conference, Celebrating the Past – Redefining the Future, marked the 50th anniversary of the Otago University Survey School. It was a celebration of achieve-ment, and a view of where the profession might go in the future, but also – for those of us whose connections with the school date from its beginnings – a sobering reminder of the years that have passed and of those who are no longer with us.
Just how much the profession has changed since the Survey School began can be simply illustrated. Consider survey calculations. Seven figure log tables were still in use; but how many students at Survey School today have even seen them, let alone used them? Electronic distance measure-ment was not very old and, compared with today’s technol-ogy, undertaken using a large unwieldy box, the tellurom-eter, mounted on a tripod and powered by a heavy 12 volt truck battery. Today, the same task, much more quickly accomplished, and with a greater range and precision, uses far more compact equipment that is now incorporated within many theodolites. Furthermore, positions can now be measured, with a precision that matches, indeed sur-passes that of the past, by employing GPS, which uses sig-nals emitted by satellites circling the Earth. And there have been dramatic improvements in topographic mapping as a result of new technology. Pascal Sirguey discusses some of them in this issue of the NZ Surveyor.
An intriguing example of the change in technology since European settlement of New Zealand is given in this issue by Alan Radcliffe. He reviews the various measurements of the height of Mt Taranaki, from the first attempt in 1839 by Dieffenbach, who used a thermometer to measure the temperature of boiling water at the top, to Radcliffe’s own attempt in 2012 using GPS. What is very encouraging about Radcliffe’s paper, apart from its useful outcome, is that he describes an exercise carried out in the best scien-tific tradition – simply to satisfy his curiosity, and for the pleasure of finding out!
Technology is evolving quickly, and in some fields, is now developing at an exponential rate. Land Surveyors can expect changes in the next 50 years to be far greater than they have experienced in the last 50 years. As technology
has changed, so it has led to the need for changes and improvements to reference systems and databases; see the paper by Winefield et al in this issue. Control networks, for example, are now related to a semi-dynamic datum that incorporates the deformation of the earth’s crust that results from plate tectonic movements. These movements, which are manifest principally as slow earthquakes, are more or less continuous and measured with GPS. In addi-tion to the obvious technological changes seen in the tools of trade, there has also been a major change to how data is presented.
The primary purpose of the profession, certainly of the Cadastral Surveyor – that of defining land – is still much as it was in the past: how to indicate to a land owner the position of the boundaries of the land owned, recognis-ing they have as much responsibility to adjoining owners as to their client. In this respect, perhaps one of the most public changes, evident not only to Land Surveyors, but also to whoever has occasion to use them, is to survey plans, which are a record of land boundaries. Gone are the coloured plans, often works of art, drawn by hand on heavy mounted paper. They have been replaced by black and white computer-generated plans that are much more efficiently produced, and can be accessed very efficiently over the Internet.
Giselle Byrne, in her address to the conference, and in her paper published in this issue, noted that surveyors of the colonial era played an important role in the development of the young New Zealand colony. Their records – in dia-ries, field books, and plans – contain a wealth of valuable information, not normally gathered today. Their evidence of what the landscape was like includes information of a topographical, botanical, and ethnographic nature.
The historic value of the information embodied in survey records is considerable, and of widespread interest beyond its value to surveyors defining modern land boundaries. When the records are referred to, they can be of immense value to researchers. The LINZ web site claims that the records are not often referred to, but the LINZ database is now only one source of early survey plans. There are many other sources; QuickMap for one is very widely
New Zealand Surveyor #303 • 2014 3
used, including by surveyors, planners, valuers and archaeologists. Ethnographic data, including locations of gardens, whare, kainga, pa, and urupa, and the names of people listed as landowners, are of considerable inter-est to Maori, as well as being of wider historical interest. Archaeologists are increasingly consulting survey plans for evidence of what people were doing in the landscape before 1900 AD, which is the cut-off point for the legal definition of an archaeological site. Topographic changes to the landscape over time are recorded on survey plans, and some may prove to be important for understanding and adapting to the effects of global climate change, such as the coastline changes resulting from erosion and accre-tion that are recorded on some survey plans. Some of this information has been drawn upon and used, for example, in a study of erosion and accretion along coastlines that was carried out some 35 years ago. Other plans record the effects of earthquake uplift and subsidence, and give an indication of what effects can reasonably be expected from future earthquakes. There is even more supplemen-tary information tucked away in old field books, and par-adoxically the older field books are often the more useful. Trigonometrical observations back to 1867 recorded in old field books, for example, allowed strain models to be developed in the 1970s for geophysical analysis. For the most part, however, the historic information recorded in old field books is largely untapped, very likely due to the difficulty of accessing them.
It is unfortunate, then, that in the electronic database of survey plans that replaced the old system whereby a sur-veyor consulted an original copy, some old plans are vir-tually unreadable. This is not because the originals are unreadable, but because they were digitised from micro-fiche or photocopies. The plans were presumably con-sidered of limited value to surveyors, but many of those plans also record useful historic information. Most of the survey plans in this category are old pre-1900 AD plans, but there are some from after 1900 AD. There is no for-mal programme to rescan these plans, although they are rescanned, at no cost, whenever a request is made, and a copy is sent to the requester and also added to Landonline. None, however, have been added as part of an ongoing update service to the databases leased by third parties such as QuickMap. Some original copies of plans have been lodged with National Archives, which means that they will be well cared for; this is just as well because even a good digital copy doesn’t always provide an adequate record, and there are times when the original plan must be viewed to interpret features shown on the plan. National Archives do an excellent job preserving past records, but they do not as yet seem to fully understand the original, and very efficient, land-based indexing system developed by LINZ
and their predecessors. LINZ has a task here to ensure that National Archives are kept fully conversant with the system.
Old field books present another problem. All field books for the North Island and Chatham Islands are now housed in Hamilton, and for the South Island, in Christchurch. They were first removed from the smaller land district offices and sent to the parent regional offices when the smaller offices were closed, and were later sent to Hamilton and Christchurch. Surveyors, however, were strongly of the opinion that the field books should not be moved. They form part of the legal record; a document of what the sur-veyor did at the time in the field, and they are therefore of high evidential standing. They may contain much more data than appears on the face of a plan, and they also need to be readily available to consult. Again, older field books can be more important than younger ones; such as for rural areas where the most recent surveys defining boundaries might be older than 1900 AD. Or an older plan might be so worn or damaged that important data is missing, data which can only be retrieved from a field book.
Single copies of field books are at risk from a disaster. Previous experience is not encouraging in this respect: in the past, plans, field books, and other records have been damaged or destroyed by natural events: floods in Blenheim and Wellington; fire in Auckland; and earth-quake and fire in Hawkes Bay. Housing field books in only two locations increases the likelihood of major loss should one or other of the two locations be struck by a major disaster. Fortunately the field books held in Christchurch were not affected by the recent earthquakes. Some 800 field books have been scanned, but these represent only a small part of the total. Creating digital copies will be a huge undertaking, but it is an essential undertaking, if only to protect the asset, because field books are the pri-mary record from which final plans were drawn, and from which, when necessary, survey plans can be reproduced. There is a pressing need to ensure the remainder are cop-ied and made available online, if only as a precaution against damage and destruction from earthquake, flood, or fire in the future.
The importance of the survey system, and how it under-pins property rights, is fundamental to a modern econ-omy, and land surveyors occupy a key position in main-taining that system. Without well-trained surveyors, there is no guaranteed land title system, nor the consequent land ownership rights that underpin modern property law. Without modern property law, economic development is compromised by constraints that inhibit the conversion of land assets into useable capital. In their subdivision and development of land as part of this process, surveyors are
4 New Zealand Surveyor #303 • 2014
helping to define the future, and insofar as they research the past from the documents of former surveys in order to carry out this task, they too are historians, and the search for old marks is, in essence, archaeology. But for these tasks to be undertaken successfully, the availability of accurate records of the past, properly indexed is essential. LINZ and their predecessors were the custodians of plans, field books, and a wealth of other information relating to land in this country for more than one and a half centuries. The records that survive as a result of the care that they exer-cised are important to help us interpret and understand the past. There is no doubt that LINZ and its predecessors did a very good job of looking after the records, and for this, researchers of our history must be grateful.
How the past is viewed and interpreted in the future, how-ever, will depend on how well the original existing records are maintained and presented. Under the Cadastral Survey Act 2002, this is clearly the responsibility of LINZ. There is no doubt that being able to consult old plans from an electronic database is extremely convenient, but the job does need to be completed, both for old plans, and for field books, as well as the registers, record sheets, indexes, and other data that are part of the evidence. In view of the issues mentioned above, the decisions made today will determine how the people of the future will view and interpret the past. Will the surveyors and historical researchers of the future regret these decisions, or will they applaud them?
AcknowledgementI am grateful for the discussion with, and assistance received from, members of the New Zealand Institute of Surveyors, from LINZ, and from other persons, in the preparation of this, my last editorial. Being editor of the NZ Surveyor has been a very rewarding experience, and I would like to express my thanks to those readers and others who have assisted me over the last seven years. In particular, I would like to thank Julian Bateson of Bateson Publishing, who guided me through the initial learning process; then and subsequently, he was always a pleasure to work with. To the new editor, I give my best wishes, and I hope you enjoy the task as much as I have.
Ngā mihi rā mō ngā rā kei mua i te aroaro.Bruce McFadgen.
New Zealand Surveyor #303 • 2014 5
Boundary Makers: Land Surveying in Nineteenth-Century New Zealand1
GISELLE BYRNESCharles Darwin University, Darwin, Australia
IntroductionIn February 1840 the Treaty of Waitangi was signed between the British Crown and Maori tribes whereby, and despite serious ambiguities between the intent and mean-ing of the Maori and English language versions, the British assumed sovereignty over the country and declared New Zealand a Crown colony. A period of intensive British and European immigration immediately ensued and within a decade war over land and issues of sovereignty broke out. For much of the remainder of the nineteenth century, New Zealand was effectively a war-zone with British colonial forces embroiled in a bitter contest with indigenous Maori for control of large parts of the country. Eventually, the British declared themselves victorious and as punishment, much of the remaining land occupied by Maori tribes was confiscated, following punitive models that had been applied by the British in subduing the ‘rebel’ Irish clans in the seventeenth century. Successive New Zealand colonial governments then worked to redefine, control and ulti-mately transform the meaning as well as the ownership of land through a series of complex legislative instruments. In this way, almost all of the Maori land estate had passed out of Maori hands by the early years of the twentieth century. Today, just a small fraction of the original Maori estate remains in Maori ownership.2
The colonial land surveyors were critical to this history of land alienation. Located among the vanguard of European settlers to New Zealand, the early land surveyors were charged with creating new outposts of empire that would replicate the values, attitudes, and aspirations of the Old World. Moreover, when considered in retrospect, the work of the colonial land surveyors reflects much that is cen-tral to the European history of New Zealand; particularly the transformation, domestication and ‘taming’ of the natural environment. The land surveyors thus occupied a central role in implementing colonisation on the ground. They were, therefore, both boundary markers as well as boundary makers. Moreover, the land surveyors in nine-teenth-century colonial New Zealand were located, quite literally, at the ‘cutting edge’ of the great imperial project
to claim and tame new territories. They were among the advance guard of European settlers to walk the land and assess its potential for future development. Indeed, the landscape of modern New Zealand testifies to the work of the colonial land surveyors, as the place-names they assigned are still visible on the modern map. This article briefly considers the colonising efforts of the early colonial land surveyors in New Zealand during the second half of the nineteenth-century following the assertion of British sovereignty 1840 and their negotiation of both cultural and physical boundaries. It does so by placing them in the context of their times, as agents of the nineteenth-century colonising process that shaped so much of the subsequent history of New Zealand.
Survey Methods and PracticeThe task of the colonial land surveyor was a significant one. Charged with reining in the wilderness and creating order and sense in apparently ‘uncharted’ territory, the land sur-veyors occupied a peculiar position in the practical imple-mentation of colonial policy. The lines inscribed by the land surveyors—in maps, drawings and plans as well as on the land itself—were symbols of power and portents of the political, social and economic change that was to follow in their wake. In this way, land surveying was fundamental to the British acquisition of new territory, and represented, in a very graphic and visible way, the aggressive thrust of the broader colonial project.
Land surveying in colonial New Zealand had its genesis, of course, in much older traditions. In the eighteenth and nineteenth centuries, the expansion of empires, along with the consequent need to delineate national boundaries and construct maps of territorial possession, demanded increasingly accurate methods of land demarcation and measurement. In addition, the process of enclosure and the increasing value of private property in rapidly devel-oping urban centres brought surveying and surveyors into the economic as well as the political arena. By the middle of the nineteenth century in Europe at least, land survey methods comprised a combination of perspectives
6 New Zealand Surveyor #303 • 2014
and competing practices. While the influence of military techniques (inherited from the Roman architects of land surveying) remained strong, this was accompanied in the latter half of the nineteenth century by a new emphasis on scientific engineering as a direct consequence of massive British industrialisation and technological innovation.
Types of SurveysBroadly speaking, the practice of land surveying in the late eighteenth and early nineteenth centuries fell into two distinct categories. The first involved confirming an already existing cadastre and aimed to provide something of a retrospective vision of land already settled; this was the case where the settlement patterns had long been shaped by history and tradition, such as in most parts of Europe and particularly in England. The second type of land survey (which has more relevance to ‘newer’ colonial contexts) was concerned with the future rather than the past; it was focussed on providing a framework for future resettlement. This latter approach, what might be termed the ‘survey of the future’, was enthusiastically adopted in New Zealand, where the land surveyor’s chief task was to layer a new spatial order on the existing landscape. Within this ‘future’ survey, there were two further forms: those where the free selection of land parcels had commenced prior to actual settlement on the land, and those where set-tlement was consciously planned in advance. The former, the ‘free selection survey’, was the most popular type of survey in colonial New Zealand, at least in the early years of organised settlement. This allowed individuals to effec-tively determine the boundaries of their own allotment and frequently led to irregular and odd-shaped parcels of land (along with the consequent administrative confu-sion). On the other hand, surveyors who determined the shape of sections in advance of formal occupation usually laid out a planned settlement for clients such as individual landowners, a company or the government. This method of survey can still be seen in the design of many rural sec-tions, while the New Zealand Company settlements (New Plymouth and Nelson, for example) are perhaps the best examples of the planned settlement surveys. In their work, New Zealand surveyors also employed instruments which were common to surveying practice elsewhere, including the theodolite, the circumferentor or surveyors’ compass, and the prismatic compass.3
The Colonial Land SurveyorsIn the early decades of organised British resettlement in New Zealand, from the 1840s to the 1860s, the land sur-veyors had two key objectives: first, surveying was an exer-cise in possessing the land and in transferring ownership from Maori to Crown (and often then private) tenure, and second, their efforts collectively translated the meaning
and purpose of land from one cultural framework into another. In other words, in addition to the alienation of land from Maori ownership, surveying changed and chal-lenged the understandings of what land meant, at both an everyday and on a philosophical level. Land became more than a marker of identity and belonging, and came to be seen as an asset to be traded or sold, forfeited, divided and permanently lost. The surveyors were therefore intimately involved in the processes of alienating land from custom-ary Maori ownership and facilitating its transfer out of Maori hands.
During the 1840s land surveyors worked in private capac-ities as well as for the colonial government and for the New Zealand Land Company. Following the signing of the Treaty and the assumption of British sovereignty, increas-ing numbers of British settlers arrived in New Zealand. With expectations about the superior quality and poten-tial of the land, boosted by the publicity marketed by land speculators such as the New Zealand Company, the pres-sure for land intensified and the demand for surveyors consequently grew. Surveyors were in demand for their role in delineating land parcels and boundaries, essential to confirming the legal sale and purchase of land. During the 1840s tension between the nascent colonial govern-ment and the New Zealand Company over disparate land policies, together with the demands of Company settlers, who felt cheated of their purchases, stretched the existing resources of both Company and Crown survey services. Sons of missionaries and traders, many of whom were educated in mission schools and were fluent in Maori, were readily recruited as surveyors. It is worth noting that their intimate knowledge of Maori culture and language proved invaluable not only in negotiating the survey but also facilitating the purchase of much of the Maori land estate. With the further influx of settlers during the 1850s and 1860s, the colonial government looked to the local immigrant population for additional survey staff.
From 1854 surveyors were included on the staff of the Land Purchase Department (incorporated into the Native Department in 1885), initially established to manage the acquisition of Maori land. Indeed, until 1862 it was possi-ble to obtain work as a land surveyor in the colony with-out registration, although surveyors under contract to the Crown to survey Crown lands (and so-called ‘waste lands’) were required to satisfy the standards set by the provincial chief surveyors. In the absence of a standardised system of registration, any person with a minimum knowledge of surveying could practice with minimal experience or qual-ifications. Consequently, many young men turned to sur-veying as a relatively easy source of income and adventure.
Most but by no means all of the early surveyors were born in England and made New Zealand their adoptive home.
New Zealand Surveyor #303 • 2014 7
Some came from Scotland and Ireland, while others came from further afield, particularly central Europe. A large number of colonial land surveyors had spent time in the Australian colonies before arriving in New Zealand; indeed, most of the early surveyors who have left records had trav-elled extensively before arriving in the colony. Some had left established careers to immigrate and brought experi-ence with them, while others were young men who chose to ‘cut their teeth’ in developing a surveying career in New Zealand. Robert Park and John Rochfort, for instance, were trained in engineering; Charles Heaphy initially trained as a draughtsman; and Theophilus Heale, later chief surveyor and inspector of surveys, was educated as a classical scholar, mathematician and navigator. Some—Charles Heaphy, Samuel Brees and John Buchanan, for instance—were highly accomplished artists, while others had trained as draughtsmen and drew on these technical skills in the course of their surveying fieldwork. Others became active in political roles, at both the provincial and national level. Frederick Carrington, for example, was a provincial superintendent and a Member of Parliament. Land surveying was often a natural choice of occupation for those young male settlers who could make use of their skills in a particularly practical fashion. In addition, sur-veyors were often men of learning and intellectual ability, with interests in poetry, ethnology, philology and geology. It would be fair to say that land surveying, due to its physi-cal rigors, typically attracted young men with a keen sense of adventure and an abundance of energy. For many, a sur-veying career also promised the challenge of working on the colonial frontier.4
So who were the colonial land surveyors and how might we understand them? Two descriptions vividly depict their appearance and countenance of the early colonial land surveyors. The first is the young Edward Jerningham Wakefield’s colourful impression of meeting a group of survey cadets in 1845 and is worth citing at some length. ‘I met two or three of these [cadets] on the Porirua road’, Wakefield recalled, ‘with labourers and theodolites and other baggage, starting for the Manawatu. I remember laughing at their dandified appearance and wondering what new arrivals had thus suddenly taken to the bush’. Wakefield was amused (and possibly irritated) by what he saw as their youthful exuberance and highly affected appearance. ‘Everything about them was so obviously new; their guns just out of their cases fastened across tight-fit-ting shooting jackets by patent leather belts; their forage caps of superfine cloth; and their white collars relieved by new black silk neckerchiefs. … Some positively walked with gloves and dandy-cut trousers,’ he continued, ‘and, to Crown all, their faces shone with soap. There had been a little rain the night before and, having only got about two miles from the town, they were still picking their way
and stepping carefully over the muddy places.’ Wakefield, with first-hand experience of the hardships of colonial life, knew these efforts at cleanliness and respectability would be short-lived. ‘I sat down on the stump of a tree’, he con-cluded with just a touch of self-confidence, ‘and vastly enjoyed the cockney procession; wondering how long their neat appearance and fastidious steps would last.’5
In contrast, John Turnbull Thomson’s slightly later descrip-tion of the seasoned colonial surveyor provided a picture that instead emphasised the egalitarian nature of life on a survey team. ‘The Colonial Surveyor’, Thomson wrote, ‘ ... is clothed in fustian trousers and blue shirt, Panama hat, and stout hob-nailed shoes. He is not known from his chainman. If he smokes, it is … through a “cutty” pipe, and he puffs at that energetically.’ Thomson’s surveyor was not only resourceful, but a jack-of-all-trades: ‘He has a hundred things about him; knives, needles, telescopes, matches, paper, ink, thread and buttons; these are stowed away in all corners of his dress; and then his “swag” contains his tent, blankets, and [a] change of clothes.’ Thomson’s sur-veyor was also a man of the land. ‘These [items] with his theodolite he carries on his back,’ Thomson went on to say, ‘and walks away through bogs, “creeks”, and scrubs, at the rate of 3 miles an hour. He cleans his shoes once a month with mutton drippings, and he lives on “damper”, salt junk and oceans of tea. His bed is on the ground, and he con-siders himself lucky if he gets into a bush where he can luxuriate in the warmth of a blazing fire.’ Thomson’s was also a man with certain qualities and precious skills. ‘In this land of equality he shares bed and board with his men,’ he observes, ‘but they are not of the common sort, for “the service” is popular among the enterprising colonists, and he has to pick. They are men that know their place and their duty ... I prefer the homely enjoyments of colonial life.’6
The everyday reality for the colonial land surveyor was clearly challenging and probably sat somewhere between these two highly romanticised images, each of which are stereotypes in their own way. Nonetheless, the constant rain, ‘the bog’ and the mud, and the inclement weather elicited frequent comments and complaints from the surveyors. Generally, however, the climatic challenges, while inconvenient, were seen as a test of strength and fortitude. ‘The [New Zealand] Company’s surveyors whose life is almost wholly spent in the bush,’ Charles Heaphy remarked in 1842, ‘and who often pursue their vocation in all weathers, are amongst the healthiest and most robust men in the colony.’7 They had to be able-bodied and strong, as living arrangements were often makeshift, temporary and haphazard, and often fraught with risk.
8 New Zealand Surveyor #303 • 2014
Negotiating Cultural BoundariesDespite the uncompromising pace of the British colonisa-tion of New Zealand post-1840, most of the early colonial land surveyors were keenly aware that they were not ‘first-time’ explorers, but were traversing landscapes that were already known, named and mapped by indigenous Maori. Surveyors were in constant contact with Maori communi-ties, especially in the North Island where they were instru-mental in implementing the policy of raupatu, or confisca-tion, on the ground. Indeed, for many Maori communities, the surveyor was the ‘face’ of the new colonial order. From the 1860s, and especially with the operation of the Native Land Court from 1865, the work of land surveyors took on a more formidable and potent role as Maori land was transferred from collective customary tenure to individual Crown-derived titles and, in many cases, was permanently alienated.
Fortunately (for historians), many of the early land sur-veyors recorded their contact with Maori in great detail, often acknowledging their dependence on their Maori assistants, cooks and chainmen. The early surveyors also noted that Maori survey hands—accurately referred to by surveyors as ‘the compass’—were especially valued for their navigational skills. Indeed, Maori often proved more able than European assistants. John Rochfort, who surveyed in the Nelson and Canterbury provinces in the 1850s, chose to employ only Maori survey hands. While surveying the boundaries of the Canterbury and Otago Provinces in 1858, Edward Jollie wrote how he ‘took an old Maori with me named “Governor Grey”, who had lived for some time in the Wanaka District’ and the ways in which he relied upon this particular guide. Women, too, worked in this capacity. In January 1844, when Jollie travelled from the Manawatu River back to Wellington, he and his party ‘secured a canoe to take us the first 12 miles of our journey, the crew consisting of two Maori girls’.8 It is clear that Maori quickly responded to the increased demand for their services from surveyors by adapting and expanding their existing economic networks. Arthur Dobson wrote that on the West Coast of the South Island, ‘as time went on able-bodied young men that I had working for me sent word to the various pas [villages] down the coast that I was coming, and that I would pay for help for canoeing on the rivers’.9 When Dobson arrived to commence his survey, the local tribe Ngai Tahu was ready and waiting.
Maori employed as guides for surveyors therefore played a contradictory role in the surveying and exploration of New Zealand. These contradictions were particularly acute when European explorer-surveyors paid Maori guides, who were already familiar with the area, to assist them in their ‘discovery’. In the Australian context, Henry
Reynolds has considered how European explorers used Aboriginal guidance to ‘open up’ much of the Australian continent to European settlement. Paul Carter has also observed how in Australia the European explorer was more often led than leader. Apart from complicating what we mean by the term ‘exploration’ in the early colonial period, this engagement clearly posits Maori and other Indigenous actors as active, rather than passive players in the larger colonial project.10
The negotiation of boundary making eventually cut both ways and Maori opposition to surveying was not uncom-mon as lines were drawn, often arbitrarily and at random, through cultivations and across tribal boundaries. Indeed, from the 1860s onwards, for many Maori communities the presence of the land surveyor became a metaphor for loss and a portent of impending land alienation. According to surveyors who worked in Taranaki, Maori frequently demonstrated their opposition to the conduct of surveys. While laying out the settlement of New Plymouth in the early months of 1841, Frederick Carrington was con-fronted by ‘natives from the interior who said we that we should not cut any more. They flourished their tomahawks, and danced and yelled, and I thought we should all be massacred.’11 In Taranaki, this reaction was not surprising, given that many of the purchases were highly contested, both at the time, and later, in the form of submissions to successive government commissions of inquiry. Tensions between Ngati Toa and New Zealand Company surveyors working at Wairau, near Nelson, reached a climax in June 1843, when 22 settlers and six Maori were killed. The inci-dent followed an attempt by officials of the New Zealand Company in Nelson to seize by force land from the great rangatira (chief) Te Rauparaha, who denied having sold the land.
For Maori, the surveyor’s theodolite—commonly referred to as the ‘taipo’ or ‘tipo’—was also a symbol of uncertainty and possible conflict. From the 1840s, the erection of sur-vey poles, like the traditional pou whenua marker-poles of Maori society, signified an explicit and aggressive act of possession. Maori leaders therefore often regarded the intrusion of the surveyors and their boundary markers as overt challenges to their mana. While surveying Ngai Tahu land reserves in September 1848, Walter Mantell noted how ‘[t]wo or three old men not understanding the erec-tion of a pole at their huts at Waitueri threw it away with the others which the man carried. I went down [and] lectured them [and] explained the use of the pole and remained there.’12 There is much evidence to suggest that Maori well understood the erection of the survey poles, and their removal was a deliberate act of protest at Mantell’s mark-ing out of the reserves. The surveyor Edwin Brookes cited
New Zealand Surveyor #303 • 2014 9
the suspicion Taranaki Maori held towards the theodolite in the 1870s: ‘The invariable expression that would come over them after a long drawn breath was “taipo”, meaning evil spirit: by my interpretation was—a mystery, or some-thing mysterious. In order to show them a friendly spirit, I would allow many of these natives to look through the telescope, when they would withdraw from it much per-plexed.’13 While impressed by the technology, Maori no doubt appreciated the powerful role of the theodolite in the survey and alienation of their lands.
The initial phase of breaking in the land, establishing European settlements and striving for political dominance led to increasing tension between Maori and surveyors. According to the records created by the surveyors them-selves, resistance from Maori towards the progress of sur-veys continued well into the latter half of the nineteenth century. Under the instructions of Wi Kingi Te Rangitake, for instance, women pulled up the survey pegs at Waitara in February 1860 to demonstrate their opposition to the survey of a highly disputed ‘purchase’. In other parts of Taranaki there were frequent incidents of antagonism between Maori and surveyors. While laying out military settlements in north Taranaki during 1865-66, Stephenson Percy Smith worked under the protection of armed cover-ing military parties. Given that Smith’s surveying work was part of implementing the punitive policy of land confisca-tion (the raupatu), it seems hardly surprising that Maori directed their frustration at surveyors, the most visible agents of this pernicious policy.14
These examples of conflict serve both to illustrate the pre-carious position occupied by the early land surveyors in the field and to highlight how a Maori system of naming and mapping pre-dated and indeed co-existed with the new order imposed by the land surveyors. For Maori, bounda-ries on the land formed the basis of an indigenous system of mapping. As the basis of tribal economy and commu-nity life, land was identified through a complex system of rights and privileges that relied on physical as well as cultural boundary markers. While whakapapa (genealog-ical) connections, waiata (song), and ‘mental maps’ were used in navigating the land, boundaries were indicated by geographical features such as hills, rock formations and rivers. Stones, wooden posts and holes in the ground also functioned as markers between tribal areas, and individual cultivation plots were often the most enduring divisional marks. Maori also diverted streams and constructed estu-arine canals to assist with fishing and to act as boundary markers. Prior to organised British settlement, guardian-ship over the land was signified both by cultural and physi-cal boundaries. From that point forward, however, physical and tangible boundaries on the land became the prevailing
and indeed dominant symbols of identity, ‘ownership’ and esteem; established and legitimized in public and official discourse and given popular currency by government leg-islation. Western capitalist ideas of land tenure and indi-vidual property ownership dominated. The land wars, and their issue—the Native Land Courts and the raupatu—also played a role in this fundamental shift in thinking. While Maori perceptions of land use and ownership continued, European (and especially British) ideals about land usage and administration soon became the norm rather than the exception.
ConclusionWhile much of the modern map of New Zealand is tes-timony to the work of the early colonial land surveyors, they have been largely overlooked as a founding group of colonists, save for a handful of historical works.15 Notwithstanding a few recent publications that have attempted to remedy this oversight, it is something of a paradox that while the dominant story of New Zealand has effectively written the surveyors out of history, the sur-veyors themselves have been actively engaged in writing themselves into our past. Their legacy lives on in place-names that survive as historical artefacts from another era. Indeed, in almost every corner of modern New Zealand, surveyors’ names and descriptors can be found in geo-graphical features, suburbs, districts and even streets. Finally, the diaries and field books of colonial land survey-ors offer valuable evidence to the interested reader. As well as containing technical details regarding the conduct of early land surveying, these records reveal rich and detailed botanical and ethnological information as well as personal reflections on the processes of land transformation and settlement.16
Land surveying was fundamental to the British coloniz-ing vision and the acquisition of new territories, such as New Zealand, for resettlement. The work of the colonial land surveyors also reflects much that is central to the his-tory of New Zealand, particularly the transformation and domestication of the natural environment. Their work deserves, therefore, to be remembered, though it needs to also be understood in context. While it would be tempt-ing to oversimplify the contribution of the land surveyors to New Zealand’s past, and (depending on your point of view) to either valorize or demonize their work as colonial entrepreneurs, it is worth remembering that the surveyors were agents of their time who were also capable of criti-quing both the rationale and immediate impact of their work. We need to remember them as complex historical actors whose work has shaped the contours of our histor-ical trajectory and fashioned our modern society in ways more powerful than we fully realize.
10 New Zealand Surveyor #303 • 2014
Notes1 This article is an updated version of a keynote conference address to Celebrating the Past - Redefining the Future, New Zealand Institute of Surveyors Conference, University of Otago, Dunedin, New Zealand, 27-30 August 2013, and subsequently published as ‘Boundary Makers: Land Surveying in nine-teenth-century New Zealand’, in Mick Strack, ed., Celebrating the Past: Redefining the Future, School of Surveying, University of Otago and the New Zealand Institute of Surveyors, Dunedin, 2013, pp. 7-15, and ‘Boundary Markers: Land Surveying in Nineteenth Century New Zealand’, Journal of the International Federation of Surveyors, October 2013, http://www.fig.net/pub/monthly_articles/november_2013/giselle_byrnes.html. Much of the content of this article is drawn from Giselle Byrnes, Boundary Markers: Land Surveying and the Colonisation of New Zealand, Bridget Williams Books, Wellington, 2001; see also G. Byrnes, ‘Surveying—Maori and the Land: An Essay in Historical Representation’, New Zealand Journal of History, vol. 31, no. 1 (1997), pp. 85-98. The author wishes to thank Dr Stephen Hamilton and an anonymous reviewer for helpful comments on an earlier draft.
2 Land alienation, in addition to a range of other issues, is the subject of the vast majority of claims by modern Maori to the Waitangi Tribunal, a commission of inquiry established in 1975 to inquire into the allegations by Maori tribes that the Crown has consistently failed to honor its responsibilities under the 1840 Treaty of Waitangi. See further, Claudia Orange, The Treaty of Waitangi, Allen and Unwin, Wellington, 1987; Alan Ward, An Unsettled History: Treaty Claims in New Zealand Today, Bridget Williams Books, Wellington, 1998; Giselle Byrnes, The Waitangi Tribunal and New Zealand History, Oxford University Press, Melbourne, 2004.
3 Surveying in North America embraced both types of survey, while in the Australian colonies, planned rectilinear (or equal square) land division was the most common practice. Chain surveying was also a common practice, where the Gunter’s chain, 66-foot long and divided into equal links, was used for calculating distance.
4 John Rochfort, The Adventures of a Surveyor in New Zealand and the Australian Gold Diggings, London, 1853.
5 Edward Jerningham Wakefield, Adventure in New Zealand, first edition John Murray (ed.), London, 1845, revised edition Joan Stevens (ed.), Auckland, 1975, pp. 233-34.
6 John Turnbull Thomson, ‘Extracts from a journal kept during the reconnaissance survey of the southern districts of the province of Otago’, in Nancy Taylor (ed.), Early Travellers in New Zealand, London, 1959, p. 347. See also John Turnbull Thomson, MS-Papers-0176, Alexander Turnbull Library, Wellington, and John Turnbull Thomson, Rambles with a Philosopher, Dunedin, 1867.
7 Charles Heaphy, Narrative of a Residence in Various Parts of New Zealand, London, 1842, p. 23.
8 Rochfort, The Adventures of a Surveyor; Jollie wrote ‘this old Maori was named after Sir George Grey the Governor—twice—of New Zealand, by I believe, Mr Walter Mantel [sic], with whom he had been for some time travelling about the Waitaki River.’ Edward Jollie, Reminiscences 1825-94, MS-Papers-4207, Alexander Turnbull Library, Wellington, p. 27. Similarly, the wives of Kehu and Pikewate joined them in guiding Thomas Brunner down the West Coast of the South Island on his ‘Great Journey’ of discovery in 1846-48.
9 Cited in Arthur Dudley Dobson, Reminiscences of Arthur Dudley Dobson, Engineer, 1840-1930, Christchurch, 1930.
10 Henry Reynolds, ‘The land, the explorers and the Aborigines’, Historical Studies, vol. 19, no. 5 (1980), pp. 213-26; Paul Carter, The Road to Botany Bay: an essay in spatial history, London, 1987, p. 340.
11 F. A. Carrington, cited in William H. J. Seffern, Chronicles of the Garden of New Zealand Known as Taranaki, New Plymouth, 1896, p. 47.
12 Walter Mantell, ‘Journal Kaiapoi to Otago, 1848-49’, MS-Papers-1543, Alexander Turnbull Library, Wellington.
13 Edwin Brookes, Frontier Life: Taranaki, New Zealand, Auckland, 1892, pp. 38-39.
14 The confiscation of Maori land, or raupatu, was ushered in under the rather euphemistically titled ‘The New Zealand Settlements Act 1863’.
15 See for example Nola Easdale, Kairuri, the measurer of land: the life of the nineteenth century surveyor pictured in his art and his writings, Highgate/Price Milburn, Petone, 1988; Giselle Byrnes, Boundary Markers: Land Surveying and the Colonisation of New Zealand, Bridget Williams Books, Wellington, 2001.
16 As Nola Easdale has shown in New Zealand and Stephen Martin for Australia, surveyors’ diaries and field books are par-ticularly rich historical sources. See further Easdale, Kairuri, the measurer of land: the life of the nineteenth century surveyor pictured in his art and his writings; and also Stephen Martin, A New Land: European perceptions of Australia, 1788-1850, Allen & Unwin, St Leonards, New South Wales, 1993.
Professor Giselle Byrnes is Pro Vice-Chancellor of the Faculty of Law, Education, Business and Arts at Charles Darwin University, based in Darwin, Australia where she has been since 2011. Prior to her cur-rent role, Giselle was Professor of History and Pro Vice-Chancellor (Postgraduate) at the University of Waikato. Giselle’s research has cen-tred on settler-indigenous histories in colonial and postcolonial con-texts. In 2006 she was Fulbright Visiting Professor in New Zealand Studies at Georgetown University, Washington DC, and she has served a term as National President of the New Zealand Historical Association.
New Zealand Surveyor #303 • 2014 11
Survey of the Height of Mount Taranaki or Mount EgmontA A RADCLIFFEAorangi Surveys, Gisborne, NZ Email: [email protected]
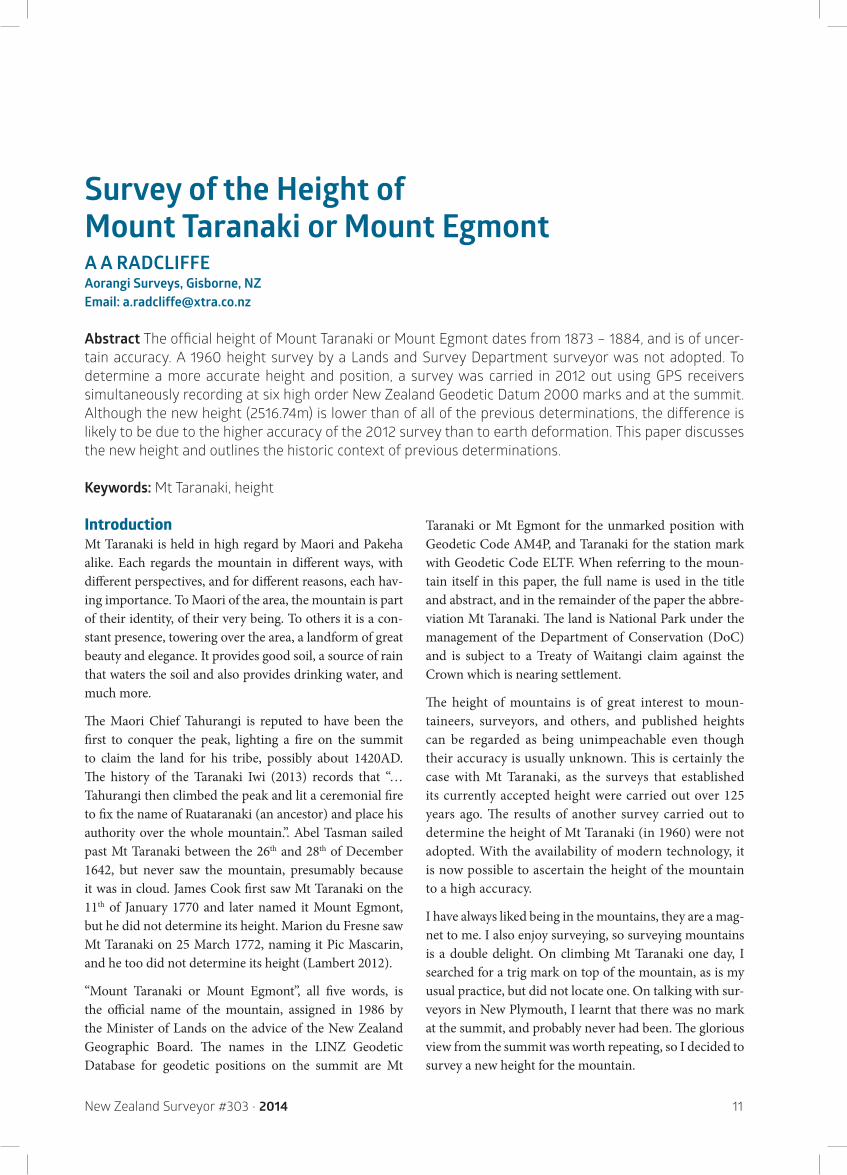
Abstract The official height of Mount Taranaki or Mount Egmont dates from 1873 – 1884, and is of uncer-tain accuracy. A 1960 height survey by a Lands and Survey Department surveyor was not adopted. To determine a more accurate height and position, a survey was carried in 2012 out using GPS receivers simultaneously recording at six high order New Zealand Geodetic Datum 2000 marks and at the summit. Although the new height (2516.74m) is lower than of all of the previous determinations, the difference is likely to be due to the higher accuracy of the 2012 survey than to earth deformation. This paper discusses the new height and outlines the historic context of previous determinations.
Keywords: Mt Taranaki, height
IntroductionMt Taranaki is held in high regard by Maori and Pakeha alike. Each regards the mountain in different ways, with different perspectives, and for different reasons, each hav-ing importance. To Maori of the area, the mountain is part of their identity, of their very being. To others it is a con-stant presence, towering over the area, a landform of great beauty and elegance. It provides good soil, a source of rain that waters the soil and also provides drinking water, and much more.
The Maori Chief Tahurangi is reputed to have been the first to conquer the peak, lighting a fire on the summit to claim the land for his tribe, possibly about 1420AD. The history of the Taranaki Iwi (2013) records that “… Tahurangi then climbed the peak and lit a ceremonial fire to fix the name of Ruataranaki (an ancestor) and place his authority over the whole mountain.”. Abel Tasman sailed past Mt Taranaki between the 26th and 28th of December 1642, but never saw the mountain, presumably because it was in cloud. James Cook first saw Mt Taranaki on the 11th of January 1770 and later named it Mount Egmont, but he did not determine its height. Marion du Fresne saw Mt Taranaki on 25 March 1772, naming it Pic Mascarin, and he too did not determine its height (Lambert 2012).
“Mount Taranaki or Mount Egmont”, all five words, is the official name of the mountain, assigned in 1986 by the Minister of Lands on the advice of the New Zealand Geographic Board. The names in the LINZ Geodetic Database for geodetic positions on the summit are Mt
Taranaki or Mt Egmont for the unmarked position with Geodetic Code AM4P, and Taranaki for the station mark with Geodetic Code ELTF. When referring to the moun-tain itself in this paper, the full name is used in the title and abstract, and in the remainder of the paper the abbre-viation Mt Taranaki. The land is National Park under the management of the Department of Conservation (DoC) and is subject to a Treaty of Waitangi claim against the Crown which is nearing settlement.
The height of mountains is of great interest to moun-taineers, surveyors, and others, and published heights can be regarded as being unimpeachable even though their accuracy is usually unknown. This is certainly the case with Mt Taranaki, as the surveys that established its currently accepted height were carried out over 125 years ago. The results of another survey carried out to determine the height of Mt Taranaki (in 1960) were not adopted. With the availability of modern technology, it is now possible to ascertain the height of the mountain to a high accuracy.
I have always liked being in the mountains, they are a mag-net to me. I also enjoy surveying, so surveying mountains is a double delight. On climbing Mt Taranaki one day, I searched for a trig mark on top of the mountain, as is my usual practice, but did not locate one. On talking with sur-veyors in New Plymouth, I learnt that there was no mark at the summit, and probably never had been. The glorious view from the summit was worth repeating, so I decided to survey a new height for the mountain.
12 New Zealand Surveyor #303 • 2014
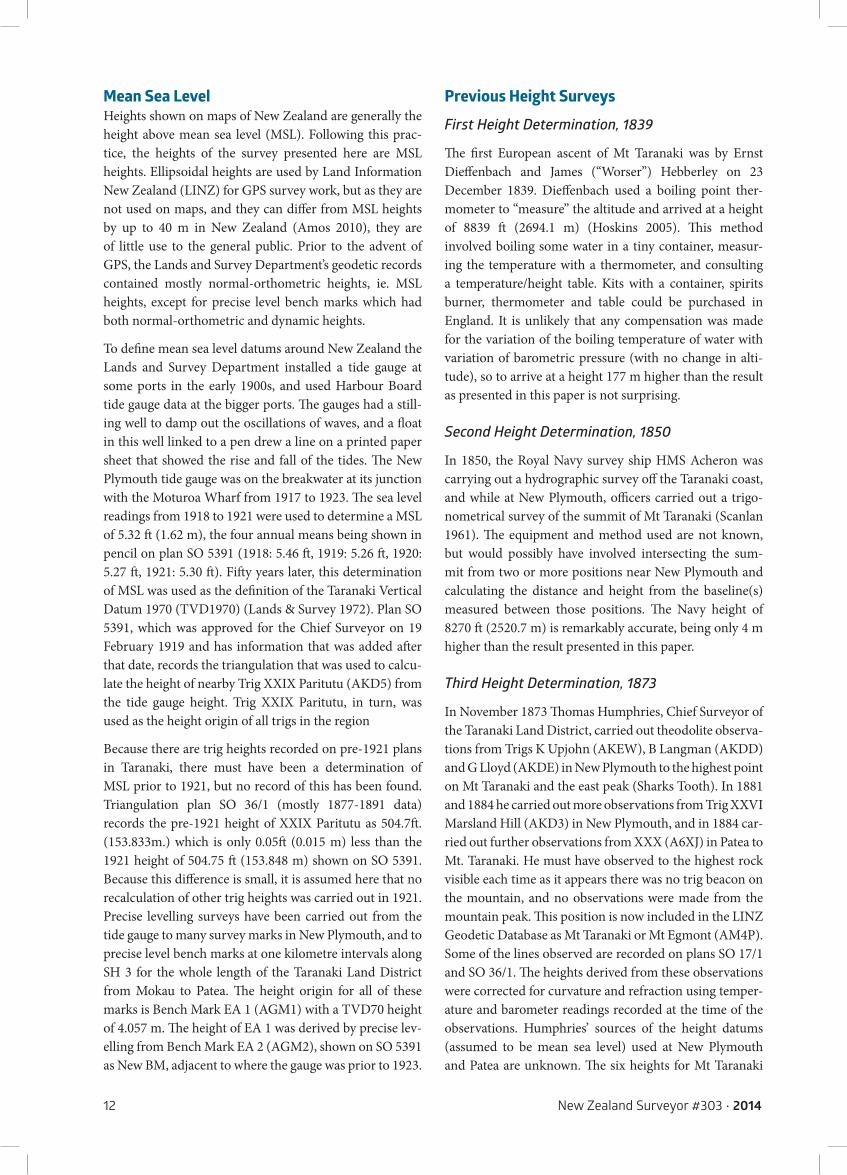
Mean Sea LevelHeights shown on maps of New Zealand are generally the height above mean sea level (MSL). Following this prac-tice, the heights of the survey presented here are MSL heights. Ellipsoidal heights are used by Land Information New Zealand (LINZ) for GPS survey work, but as they are not used on maps, and they can differ from MSL heights by up to 40 m in New Zealand (Amos 2010), they are of little use to the general public. Prior to the advent of GPS, the Lands and Survey Department’s geodetic records contained mostly normal-orthometric heights, ie. MSL heights, except for precise level bench marks which had both normal-orthometric and dynamic heights.
To define mean sea level datums around New Zealand the Lands and Survey Department installed a tide gauge at some ports in the early 1900s, and used Harbour Board tide gauge data at the bigger ports. The gauges had a still-ing well to damp out the oscillations of waves, and a float in this well linked to a pen drew a line on a printed paper sheet that showed the rise and fall of the tides. The New Plymouth tide gauge was on the breakwater at its junction with the Moturoa Wharf from 1917 to 1923. The sea level readings from 1918 to 1921 were used to determine a MSL of 5.32 ft (1.62 m), the four annual means being shown in pencil on plan SO 5391 (1918: 5.46 ft, 1919: 5.26 ft, 1920: 5.27 ft, 1921: 5.30 ft). Fifty years later, this determination of MSL was used as the definition of the Taranaki Vertical Datum 1970 (TVD1970) (Lands & Survey 1972). Plan SO 5391, which was approved for the Chief Surveyor on 19 February 1919 and has information that was added after that date, records the triangulation that was used to calcu-late the height of nearby Trig XXIX Paritutu (AKD5) from the tide gauge height. Trig XXIX Paritutu, in turn, was used as the height origin of all trigs in the region
Because there are trig heights recorded on pre-1921 plans in Taranaki, there must have been a determination of MSL prior to 1921, but no record of this has been found. Triangulation plan SO 36/1 (mostly 1877-1891 data) records the pre-1921 height of XXIX Paritutu as 504.7ft. (153.833m.) which is only 0.05ft (0.015 m) less than the 1921 height of 504.75 ft (153.848 m) shown on SO 5391. Because this difference is small, it is assumed here that no recalculation of other trig heights was carried out in 1921. Precise levelling surveys have been carried out from the tide gauge to many survey marks in New Plymouth, and to precise level bench marks at one kilometre intervals along SH 3 for the whole length of the Taranaki Land District from Mokau to Patea. The height origin for all of these marks is Bench Mark EA 1 (AGM1) with a TVD70 height of 4.057 m. The height of EA 1 was derived by precise lev-elling from Bench Mark EA 2 (AGM2), shown on SO 5391 as New BM, adjacent to where the gauge was prior to 1923.
Previous Height SurveysFirst Height Determination, 1839
The first European ascent of Mt Taranaki was by Ernst Dieffenbach and James (“Worser”) Hebberley on 23 December 1839. Dieffenbach used a boiling point ther-mometer to “measure” the altitude and arrived at a height of 8839 ft (2694.1 m) (Hoskins 2005). This method involved boiling some water in a tiny container, measur-ing the temperature with a thermometer, and consulting a temperature/height table. Kits with a container, spirits burner, thermometer and table could be purchased in England. It is unlikely that any compensation was made for the variation of the boiling temperature of water with variation of barometric pressure (with no change in alti-tude), so to arrive at a height 177 m higher than the result as presented in this paper is not surprising.
Second Height Determination, 1850
In 1850, the Royal Navy survey ship HMS Acheron was carrying out a hydrographic survey off the Taranaki coast, and while at New Plymouth, officers carried out a trigo-nometrical survey of the summit of Mt Taranaki (Scanlan 1961). The equipment and method used are not known, but would possibly have involved intersecting the sum-mit from two or more positions near New Plymouth and calculating the distance and height from the baseline(s) measured between those positions. The Navy height of 8270 ft (2520.7 m) is remarkably accurate, being only 4 m higher than the result presented in this paper.
Third Height Determination, 1873
In November 1873 Thomas Humphries, Chief Surveyor of the Taranaki Land District, carried out theodolite observa-tions from Trigs K Upjohn (AKEW), B Langman (AKDD) and G Lloyd (AKDE) in New Plymouth to the highest point on Mt Taranaki and the east peak (Sharks Tooth). In 1881 and 1884 he carried out more observations from Trig XXVI Marsland Hill (AKD3) in New Plymouth, and in 1884 car-ried out further observations from XXX (A6XJ) in Patea to Mt. Taranaki. He must have observed to the highest rock visible each time as it appears there was no trig beacon on the mountain, and no observations were made from the mountain peak. This position is now included in the LINZ Geodetic Database as Mt Taranaki or Mt Egmont (AM4P). Some of the lines observed are recorded on plans SO 17/1 and SO 36/1. The heights derived from these observations were corrected for curvature and refraction using temper-ature and barometer readings recorded at the time of the observations. Humphries’ sources of the height datums (assumed to be mean sea level) used at New Plymouth and Patea are unknown. The six heights for Mt Taranaki
New Zealand Surveyor #303 • 2014 13
ranged from 8258.2 to 8263.5 ft (2517.10 to 2518.71 m), with a mean of 8260.9 ft (2517.92 m). The height of 8260 ft was adopted as the official height and it remains so to this day in the LINZ Geodetic Database, where Mt Taranaki or Mt Egmont is shown (rounded to one decimal place) as 2517.6 m, despite later surveys in 1960 and 2012 pro-ducing different heights. Humphries’ work was remarka-bly accurate, considering the long lines observed and the equipment he used.
Fourth Height Determination, 1900
While there are many records of people climbing Mt Taranaki in the 1800s, it appears that no survey mark was established on the mountain top, and no survey work was carried out at the top to determine the position or height. In 1885, J W Davis and F Carrington carried out a topographic survey of the peaks and ice fields at the top (SO 4632); in 1901, Harry May Skeet completed a com-prehensive topographic survey of the National Park; and in 1928-29, A V Adams carried out a topographic survey (SO 9987), possibly an extension of Skeet’s work, which included the top of Mt Taranaki and the Pouakai Range to the north. But while these surveyors must have established many survey marks, none are shown on their plans. About 1900, Skeet and staff erected a large steel trig beacon on the top of the mountain (Scanlan 1961), but apparently it was for observing to from distant survey marks, and no the-odolite observations are known to have been made at this beacon. Some remains of the steel beacon were still there in the 1970s. Skeet appears to have calculated a height for the mountain of 8260 ft. (2517.65 m), the same as that determined by Humphries.
Fifth Height Determination, 1960
In 1960, Trevor Thomas Bright, a Staff Surveyor of the New Plymouth office of the Lands and Survey Department, was instructed by the Chief Surveyor J M Grant to carry out a triangulation survey to more accurately determine the height of Mt Taranaki. Bright lead a party of six staff, plus the Taranaki Herald Editor A B Scanlan as a guide, to the top and back on Tuesday 1 March 1960. It appears he observed only vertical angles with Wild T3 theodolite (serial no. 84) to Trigs Raven (A7DC), C Pouakai (A7DB) and A German Hill (B1BF, not B9KQ or NPLY). He had intended to observe vertical angles to Trig A Huirangi (1259), but it was hidden by cloud all day. He had also intended to observe horizontal angles to all four trigs, but only one was visible at a time. They left a guyed mast at the instrument position, which is assumed to be the same position as Mt Taranaki. No survey mark was placed at the summit, but the base of the mast was set in a groove in the rock, which can still be identified with reasonable certainty.
Bright later made observations back to the mast, measur-ing both horizontal and vertical angles, from Raven, A German Hill, Trig B Brown (A7E1) and A Huirangi. On the 1st and 2nd of March 1960, the Taranaki Herald pub-lished “before and after” articles about the survey, which gave a good description of the work. The geometric figure of the surveyed lines is quite weak, with no fully measured triangle and only two lines with reciprocal vertical angles. This figure would not produce an accurate height of Mt Taranaki.
The results of the survey calculated by Bright (1960) gave a height of 8258 ft (2517.04 m) for the summit. This height was not adopted as official, as R P Gough (1960) the Assistant Surveyor-General said the height difference of 2 ft (0.61 m) from the old height is within the error of the method used, and that the old height of 8260 ft (2517.65 m) “will stand”. No survey mark was established on the summit and no Survey Office (SO) plan was drawn of the survey, which is unusual practice.
I wrote to Bright about his survey, and spoke to him twice; he said he was disappointed that his new height had not been adopted, and that after all of the work and expense to carry out the survey, it was a pity that the results were unable to be used (due to the weaknesses in the network noted above). He sent me copies of departmental corre-spondence of the time, and of some photographs of his and other survey parties on Mt Taranaki (Bright 2012). It was good to talk to a surveyor who, like me, had later been a Chief Surveyor for the Lands and Survey Department. I was saddened to hear that he died in November 2012.
Height Determination #6, 2012Stage One (2010)
The first stage of this survey was carried out in December 2010, when I established Iron Tube IT1 Camellia (ELTG) in Bell Block, and measured a network of vectors between it, two CGPS marks (German Hill No. 2 (NLPY) and Wanganui GPS (WANG)), and four precise level bench marks (EA 19 (AHHJ), EA 22 (AHHM), EA 24 (B4LR) and EB 25 No. 2 (BAX8)). Only two Epoch 10 GPS receiv-ers were available at the time, one of which was set up on IT1 to run continuously for a few days with a car battery as the power source. The other receiver was set up on each of the other marks in turn, for periods of 1.6 to 2.4 hours. Using data from IT1 and German Hill No. 2, two vectors to each bench mark were produced. A network adjustment gave high accuracy three dimensional coordinates for IT1, and also revealed a two dimensional coordinate error of 0.40 m for EA 19 and a 0.19 m difference (possible error) in the normal-orthometric height of German Hill No. 2.
14 New Zealand Surveyor #303 • 2014
The intention had been to use the normal-orthometric heights of IT1, German Hill No. 2, and perhaps two other trigs on the west side of the mountain as fixed heights for a GPS network to calculate the height of Mt Taranaki, but with the normal-orthometric height of German Hill No. 2 being unusable, additional fixed stations were needed. As well as German Hill No. 2 and Wanganui GPS, Trig 1 Pukeiti (A7EJ) on the north west side of the mountain, Trig Clement (A7DU) on the south west side, and Bench Mark EB 16 (B4AP) at Stratford on the east side were selected.
An application was made to DoC for a permit to carry out the work, and after some discussion with the DoC Taranaki office and the Taranaki Iwi CEO (Ms. Liana Poutu), it was agreed that a survey mark could be estab-lished on the top as long as no damage was done and the mark was small and inconspicuous. The consultation with Taranaki Iwi was a careful and enjoyable process and I am appreciative of their agreement. Later, a complaint from a member of the public was publicised about the mark being established, but Ms. Poutu and others agreed that there was no basis for the complaint.
Stage Two (March 2012)
By March 2012, another three Spectra Precision Epoch 10 GPS receivers had been purchased, and on 4th March 2012 Epoch 10s were set up on marks IT1 Camellia, 1 Pukeiti, Clement and EB 16. These had batteries and data storage sufficient for 4 days continuous recording at 5 second epochs. There is quite a distance between these marks, but the receivers were able to be set up during a single after-noon and evening.
Observations from the mountain top were made on the 5th March. I walked in with survey equipment and storm gear from the North Egmont road end (952 m), starting at 7:30 am. A storm had finished the day before and there was a good coating of snow on the mountain, with patches as far down as Tahurangi Hut (1180 m). Above 1800 m the snow was continuous. The Surrey Road entrance to the crater was icy, but with care was okay, and by noon I was on the rocky summit. All of the summit rocks were thickly encrusted with ice, which had to be chipped away from
the highest part to establish the planned station mark. The rock was much softer than anticipated, and the bit of the electric masonry drill went down through it as if in soft new concrete. The rock powder produced from the drill-ing stuck in a stiff paste in the hole rather than being the normal free flowing rock powder that blows away in the breeze. The rock appeared to be porous, with water in the pores, and the moisture bound the powder into a paste. The proposed 20 mm long pin would have been unstable, as epoxy glue would not have stuck to the paste in the hole, and frost heave could have lifted it out of the hole. A deeper hole was therefore drilled, very easily as the rock was soft, and the steel drill bit, 100 mm long 6 mm diameter, was then used as the station mark. The mark is grey, the top is almost flush with the top of the grey rock, and it is very hard to see the mark even when it is known where to look.
A small light tripod with a GPS receiver was set up over the mark, and the tripod feet were tied to rocks to stop it blowing over during the 26 hour set up. Establishing the mark and setting up the GPS was not easy and it was 1:30 pm before the GPS was recording satellite signals. A Garmin Oregon handheld GPS and 50 m tape were used to make a field book diagram of the top. I stayed near the GPS until all others on the mountain top had departed for the day, before leaving at 3 pm. Even so, when I arrived on the top again on Tuesday 6th March shortly after 11am, I found that the GPS had restarted itself just 10 minutes earlier, and a man had steadied himself by touching it just before I had arrived, fortunately not disturbing the antenna. A further 4.4 hours of data was recorded, making 26.3 hours data in total, and I departed at 4.10pm for the trip back down the mountain. The other four Epoch 10 receivers were recovered on 7th and 8th March.
Stage Three (April 2012)
GPS vectors were measured in the Port Taranaki area to strengthen the height origin for the survey, and to deter-mine the height of Paritutu No. 2. The height of Paritutu No. 2 was re-measured to find out if the 2012 height dif-fered from Bright’s 1960 height of 505.2 ft. Any difference could indicate that the 1960 height of Mt Taranaki required
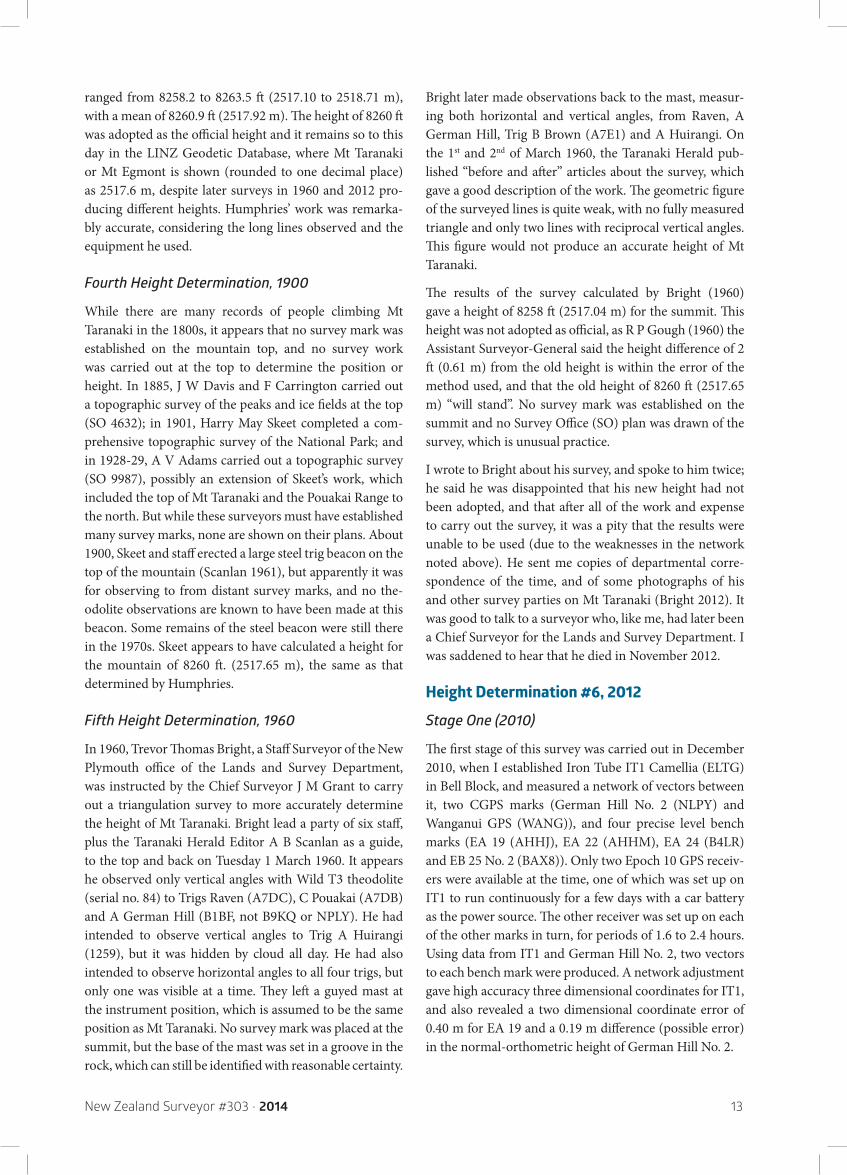
Figure 1 Mt. Taranaki 4 March 2012 Figure 2 Mt. Taranaki 5 March 2012 Figure 3 Summit 5 March 2012
New Zealand Surveyor #303 • 2014 15
Point ID Northing (m)
North Err. (m)
Easting (m)
East Err. (m)
Orth. Hgt. TVD70 (m)
Orth. Hgt. Err. (m)
Horiz/vert Orders
Clement (A7DU) 770297.065 Fixed 376615.768 Fixed 235.385 0.020 3/3V
Paritutu No2 (A7DX) 808414.528 0.002 382317.433 0.002 153.855 0.005
Pukeiti (A7EJ) 793505.266 0.002 379182.348 0.003 489.256 0.019
New Plymouth Fund (AGMH) 808658.082 0.002 382923.847 0.002 4.906 Fixed 6/1V
EA19 (AHHJ) 810901.838 0.016 392164.425 0.013 30.475 0.037
EA22 (AHHM) 810597.870 0.015 393068.506 0.015 37.862 0.036
EB16 (B4AP) 778889.187 Fixed 404381.774 Fixed 319.706 Fixed 2/1V
EA24 (B4LR) 811868.764 0.011 394950.502 0.010 35.012 0.057
EB25-2 (BAX8) 810364.896 0.014 391167.462 0.011 35.372 0.069
RM14 SO12436 (D1JX) 808633.884 Fixed 382938.366 Fixed 5.564 0.005 2/1V
Taranaki (ELTF) 782166.229 0.003 385857.321 0.004 2516.741 0.020
IT1 Camellia (ELTG) 812243.841 0.003 392884.399 0.004 19.075 0.019
German Hill No. 2 (NPLY) 794776.205 Fixed 390529.871 Fixed 394.759 0.017 0/3V
Wanganui GPS (WANG) 727518.459 Fixed 450853.129 Fixed 274.494 0.039 0/-
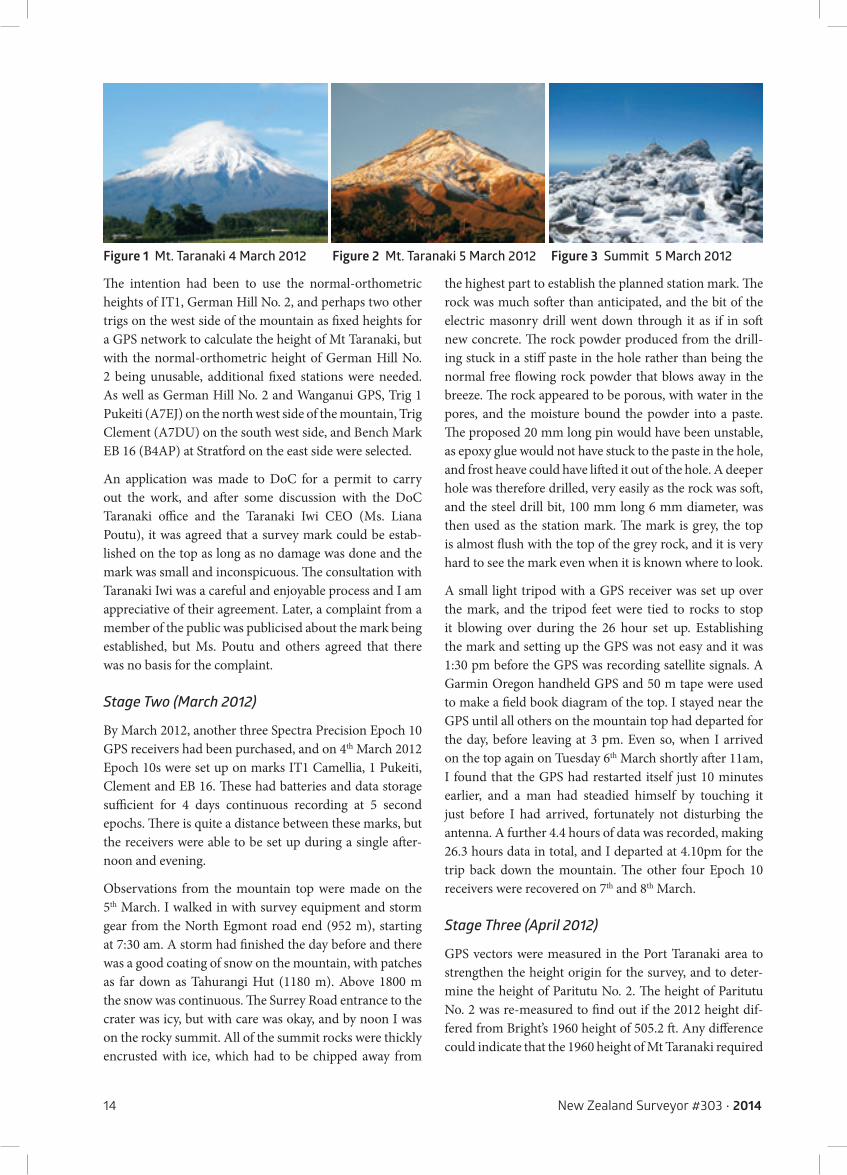
Table 1 Final Coordinates and Heights from TBC network adjustment.
a correction by the amount of the difference. Accordingly, GPS measurements were carried out at Reference Mark RM14 SO 12436 (D1JX), Bench Mark New Plymouth Fundamental (AGMH) and Paritutu No. 2.
Network Adjustment
The adjustment of the network was carried out using the Trimble Business Centre program (TBC) separately for each stage of the survey, then combining all three stages. Trials were run holding fixed various combinations of existing marks and ellipsoidal or normal-orthometric (MSL) heights. The results of the final adjustment are shown in Table 1.
In Table 1, the horizontal coordinates of five stations, and the heights of two stations of the 13 existing stations in the network were held fixed in the adjustment. The reason is that the Geodetic Database coordinates and/or heights of the marks are not mutually consistent as they are of differ-ent orders, they were not all surveyed in one network, and they contain small and large differences. Even including marks with small differences can unnecessarily “bend” the adjustment and cause the Standard Error of Unit Weight (SEUW) to greatly increase. The coordinates held fixed are of very high order, either zero or one, except for Clement. The latter was held as a fixed mark as one was needed in that part of the net. Without this, a large part of the net would have been “hanging” unconstrained. New Plymouth Fundamental in the Port Taranaki area, and EB 16 at Stratford, are of the highest vertical order (1V) and are the height origins (normal-orthometric) for the whole survey.
Table 2 shows a comparison of the height of Paritutu No. 2 derived in this paper, and Bright’s 1960 height of 505.2ft, after making allowance for the lowering of the trig pipe in
1992. The TBC network adjustment produced a height for Paritutu No. 2 of 153.86 m, which should be more accu-rate than the 1960 height due to the greater accuracy of the method used.
The difference between the 1960 and the 2012 heights of Paritutu No. 2 is -0.10 m, after allowing for the lowering of the trig pipe by 0.03 m on 10 July 1992. This differ-ence suggests that the 1960 height of Mt Taranaki (8258 ft = 2517.04 m) should be corrected by -0.10 m. However, there are several possible reasons for the difference, none of which can be proven correct. Accordingly, the -0.10 m difference is viewed as insufficiently justified, and is not accepted here.
The field and office data was sent to LINZ National Geodetic Office where it was adjusted again, this time using the SNAP network adjustment program. The points IT1 Camellia (ELTG) in Bell Block, and Taranaki (ELTF) were accepted as 5th order marks and added to the Geodetic Database. Only ellipsoidal heights are held fixed in LINZ network adjustments, and if normal-orthometric heights are required they are calculated at a later stage from the
Station Height 1960 (m)
Paritutu No.2 (2012) (see Table 1) 153.86
Trig pipe lowered 10 July 1992 (LINZ Geodetic Database) +0.03
Recalculated height of Paritutu No. 2 pre-10 July 1992 153.89
Paritutu No.2 (Bright 1960) 505.2 ft (=153.99 m) 153.99
Difference between Bright (1960) and recalculated pre-1992 height -0.10
Table 2 Height of Paritutu No.2 determined by Bright (1960), compared with the 2012 height after making allowance for the lowering of the trig pipe in 1992.
16 New Zealand Surveyor #303 • 2014
ellipsoidal heights using the conversion utility available on the LINZ website. One reason for using normal-orthomet-ric heights for the height origins in this paper was to avoid using this conversion, which may be a mean of many com-parisons, and hence introduce a small error.
Sixth Height Determination, 2012
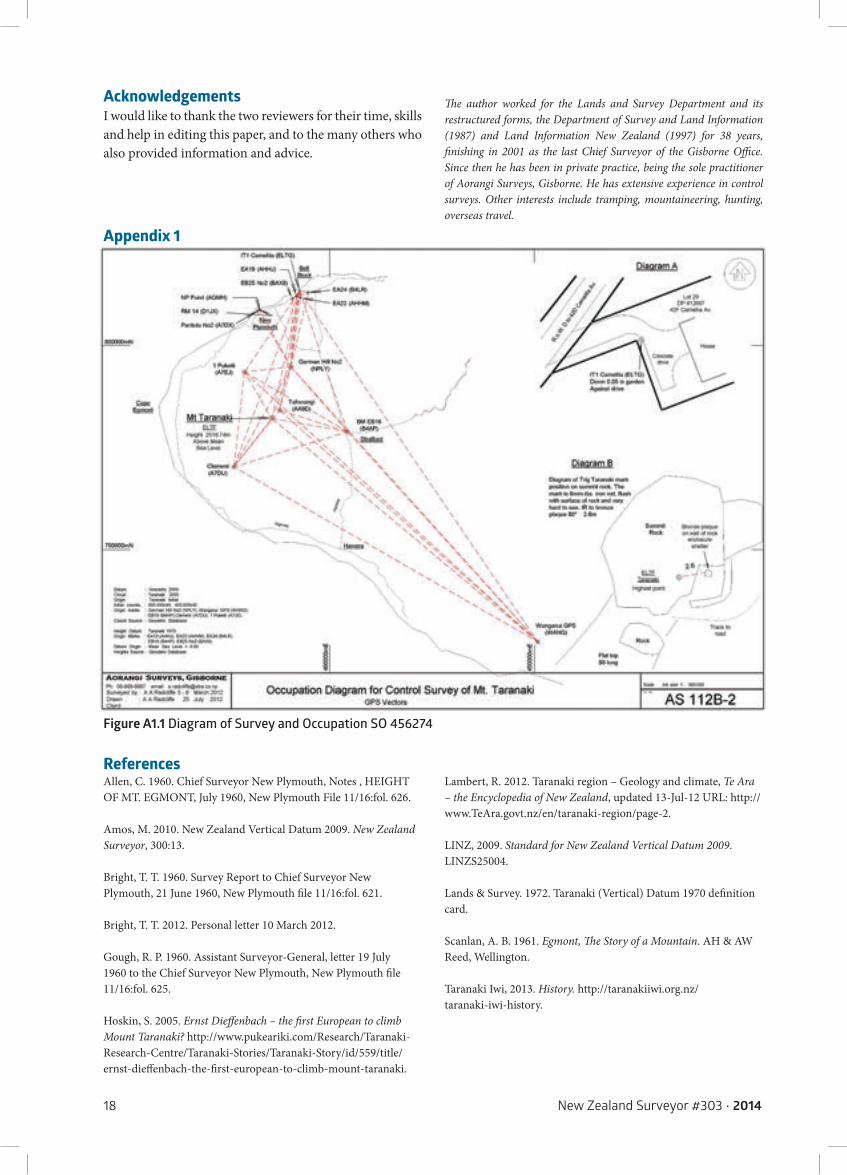
The main objective of carrying out the survey described in this paper was to determine the height of Mt. Taranaki. From Table 1, the height of Taranaki (ELTF) above mean sea level is 2516.74 m. The survey is recorded on SO 456274 (Appendix 1).
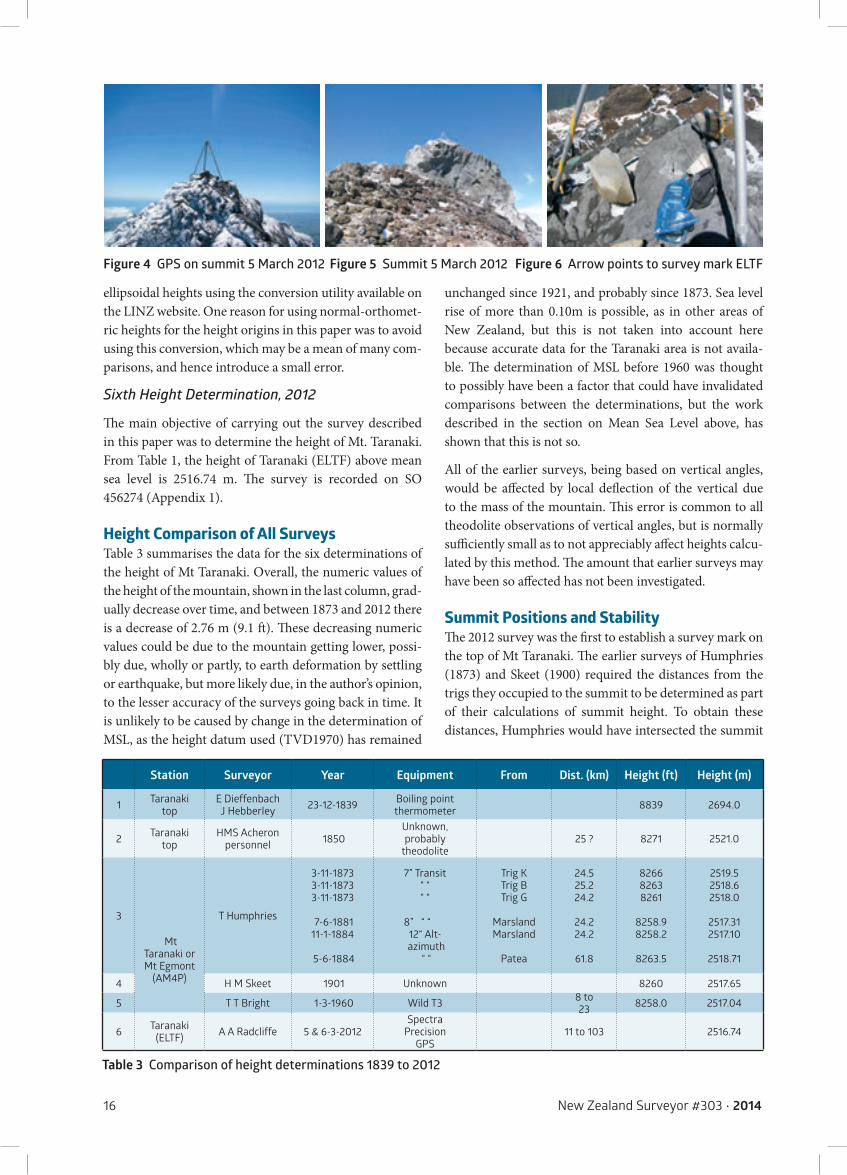
Height Comparison of All Surveys Table 3 summarises the data for the six determinations of the height of Mt Taranaki. Overall, the numeric values of the height of the mountain, shown in the last column, grad-ually decrease over time, and between 1873 and 2012 there is a decrease of 2.76 m (9.1 ft). These decreasing numeric values could be due to the mountain getting lower, possi-bly due, wholly or partly, to earth deformation by settling or earthquake, but more likely due, in the author’s opinion, to the lesser accuracy of the surveys going back in time. It is unlikely to be caused by change in the determination of MSL, as the height datum used (TVD1970) has remained
unchanged since 1921, and probably since 1873. Sea level rise of more than 0.10m is possible, as in other areas of New Zealand, but this is not taken into account here because accurate data for the Taranaki area is not availa-ble. The determination of MSL before 1960 was thought to possibly have been a factor that could have invalidated comparisons between the determinations, but the work described in the section on Mean Sea Level above, has shown that this is not so.
All of the earlier surveys, being based on vertical angles, would be affected by local deflection of the vertical due to the mass of the mountain. This error is common to all theodolite observations of vertical angles, but is normally sufficiently small as to not appreciably affect heights calcu-lated by this method. The amount that earlier surveys may have been so affected has not been investigated.
Summit Positions and StabilityThe 2012 survey was the first to establish a survey mark on the top of Mt Taranaki. The earlier surveys of Humphries (1873) and Skeet (1900) required the distances from the trigs they occupied to the summit to be determined as part of their calculations of summit height. To obtain these distances, Humphries would have intersected the summit
Station Surveyor Year Equipment From Dist. (km) Height (ft) Height (m)
1 Taranakitop
E DieffenbachJ Hebberley 23-12-1839 Boiling point
thermometer 8839 2694.0
2 Taranakitop
HMS Acheronpersonnel 1850
Unknown,probably
theodolite25 ? 8271 2521.0
3
Mt Taranaki or Mt Egmont
(AM4P)
T Humphries
3-11-18733-11-18733-11-1873
7-6-188111-1-1884
5-6-1884
7” Transit“ ““ “
8” “ “12“ Alt-
azimuth “ “
Trig KTrig BTrig G
MarslandMarsland
Patea
24.525.224.2
24.224.2
61.8
826682638261
8258.98258.2
8263.5
2519.52518.62518.0
2517.312517.10
2518.71
4 H M Skeet 1901 Unknown 8260 2517.65
5 T T Bright 1-3-1960 Wild T3 8 to23 8258.0 2517.04
6 Taranaki(ELTF) A A Radcliffe 5 & 6-3-2012
SpectraPrecision
GPS11 to 103 2516.74
Table 3 Comparison of height determinations 1839 to 2012
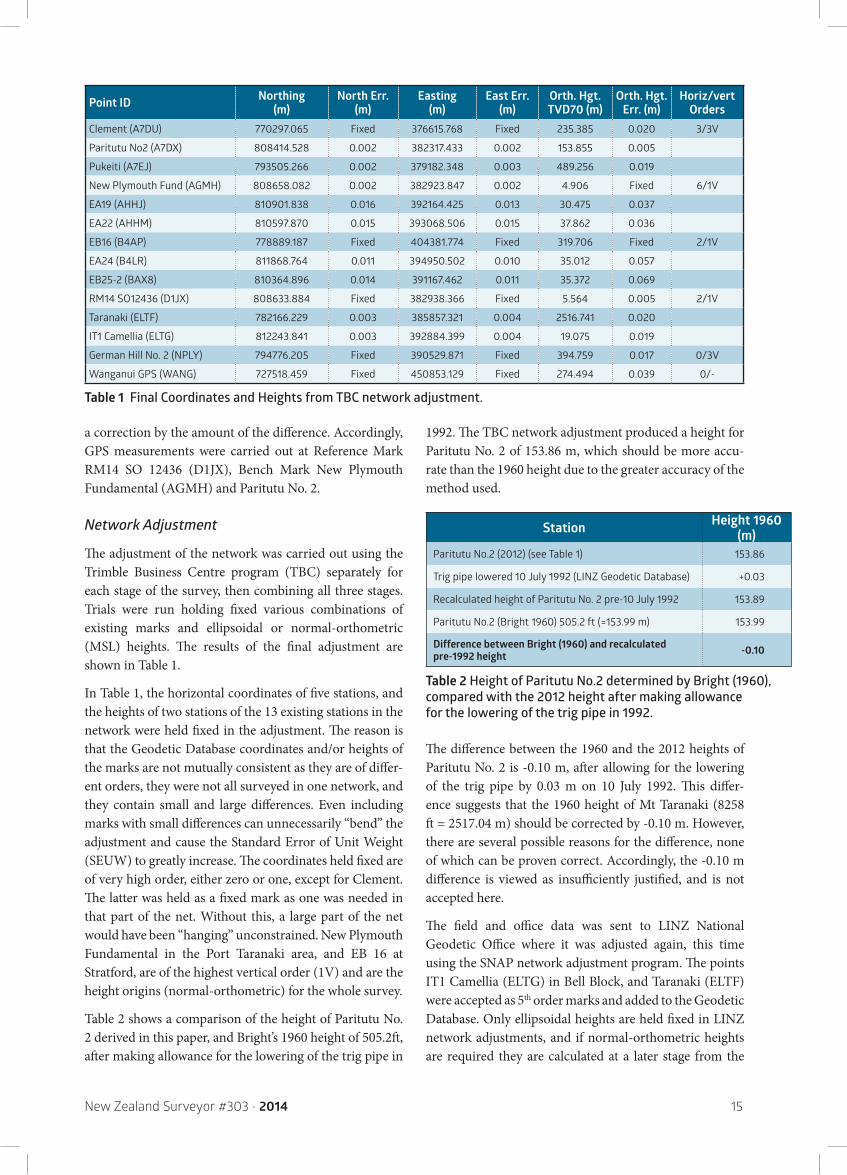
Figure 4 GPS on summit 5 March 2012 Figure 5 Summit 5 March 2012 Figure 6 Arrow points to survey mark ELTF
New Zealand Surveyor #303 • 2014 17
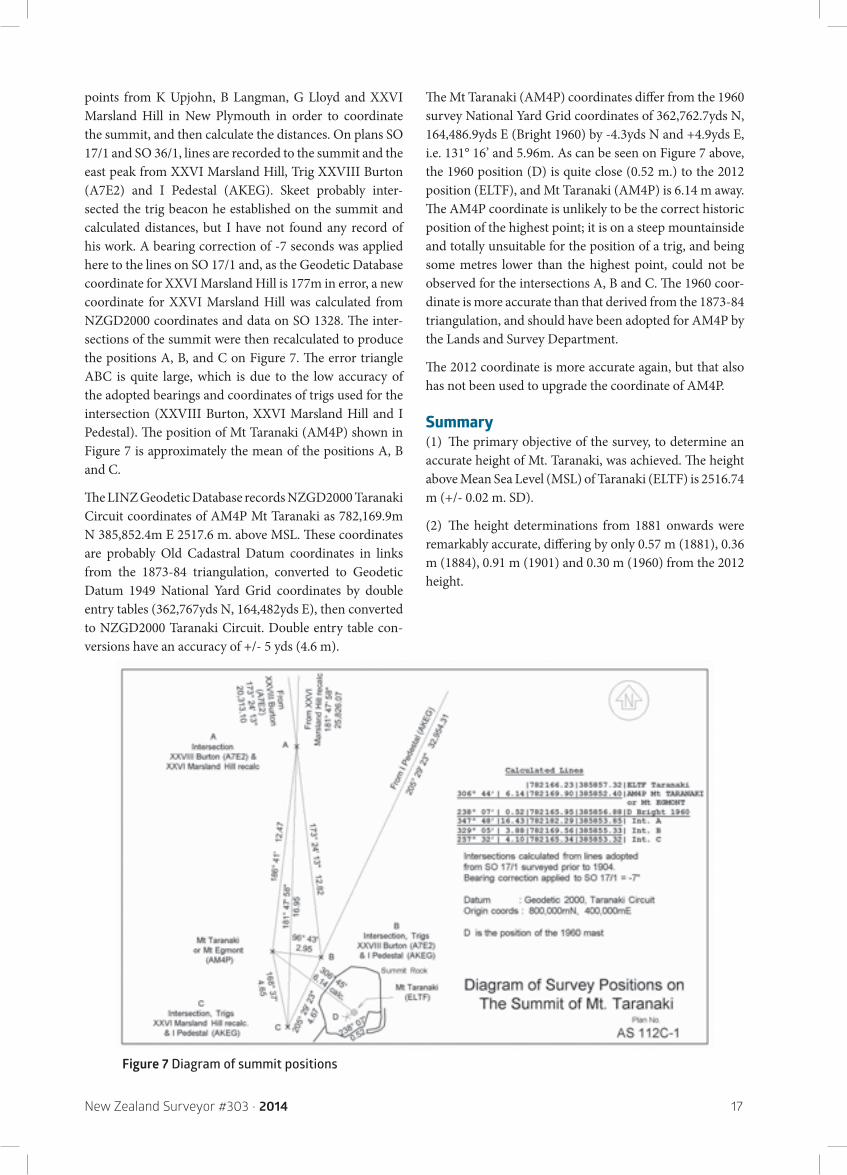
points from K Upjohn, B Langman, G Lloyd and XXVI Marsland Hill in New Plymouth in order to coordinate the summit, and then calculate the distances. On plans SO 17/1 and SO 36/1, lines are recorded to the summit and the east peak from XXVI Marsland Hill, Trig XXVIII Burton (A7E2) and I Pedestal (AKEG). Skeet probably inter-sected the trig beacon he established on the summit and calculated distances, but I have not found any record of his work. A bearing correction of -7 seconds was applied here to the lines on SO 17/1 and, as the Geodetic Database coordinate for XXVI Marsland Hill is 177m in error, a new coordinate for XXVI Marsland Hill was calculated from NZGD2000 coordinates and data on SO 1328. The inter-sections of the summit were then recalculated to produce the positions A, B, and C on Figure 7. The error triangle ABC is quite large, which is due to the low accuracy of the adopted bearings and coordinates of trigs used for the intersection (XXVIII Burton, XXVI Marsland Hill and I Pedestal). The position of Mt Taranaki (AM4P) shown in Figure 7 is approximately the mean of the positions A, B and C.
The LINZ Geodetic Database records NZGD2000 Taranaki Circuit coordinates of AM4P Mt Taranaki as 782,169.9m N 385,852.4m E 2517.6 m. above MSL. These coordinates are probably Old Cadastral Datum coordinates in links from the 1873-84 triangulation, converted to Geodetic Datum 1949 National Yard Grid coordinates by double entry tables (362,767yds N, 164,482yds E), then converted to NZGD2000 Taranaki Circuit. Double entry table con-versions have an accuracy of +/- 5 yds (4.6 m).
The Mt Taranaki (AM4P) coordinates differ from the 1960 survey National Yard Grid coordinates of 362,762.7yds N, 164,486.9yds E (Bright 1960) by -4.3yds N and +4.9yds E, i.e. 131° 16’ and 5.96m. As can be seen on Figure 7 above, the 1960 position (D) is quite close (0.52 m.) to the 2012 position (ELTF), and Mt Taranaki (AM4P) is 6.14 m away. The AM4P coordinate is unlikely to be the correct historic position of the highest point; it is on a steep mountainside and totally unsuitable for the position of a trig, and being some metres lower than the highest point, could not be observed for the intersections A, B and C. The 1960 coor-dinate is more accurate than that derived from the 1873-84 triangulation, and should have been adopted for AM4P by the Lands and Survey Department.
The 2012 coordinate is more accurate again, but that also has not been used to upgrade the coordinate of AM4P.
Summary(1) The primary objective of the survey, to determine an accurate height of Mt. Taranaki, was achieved. The height above Mean Sea Level (MSL) of Taranaki (ELTF) is 2516.74 m (+/- 0.02 m. SD).
(2) The height determinations from 1881 onwards were remarkably accurate, differing by only 0.57 m (1881), 0.36 m (1884), 0.91 m (1901) and 0.30 m (1960) from the 2012 height.
Figure 7 Diagram of summit positions
18 New Zealand Surveyor #303 • 2014
AcknowledgementsI would like to thank the two reviewers for their time, skills and help in editing this paper, and to the many others who also provided information and advice.
Appendix 1
Figure A1.1 Diagram of Survey and Occupation SO 456274
The author worked for the Lands and Survey Department and its restructured forms, the Department of Survey and Land Information (1987) and Land Information New Zealand (1997) for 38 years, finishing in 2001 as the last Chief Surveyor of the Gisborne Office. Since then he has been in private practice, being the sole practitioner of Aorangi Surveys, Gisborne. He has extensive experience in control surveys. Other interests include tramping, mountaineering, hunting, overseas travel.
ReferencesAllen, C. 1960. Chief Surveyor New Plymouth, Notes , HEIGHT OF MT. EGMONT, July 1960, New Plymouth File 11/16:fol. 626.
Amos, M. 2010. New Zealand Vertical Datum 2009. New Zealand Surveyor, 300:13.
Bright, T. T. 1960. Survey Report to Chief Surveyor New Plymouth, 21 June 1960, New Plymouth file 11/16:fol. 621.
Bright, T. T. 2012. Personal letter 10 March 2012.
Gough, R. P. 1960. Assistant Surveyor-General, letter 19 July 1960 to the Chief Surveyor New Plymouth, New Plymouth file 11/16:fol. 625.
Hoskin, S. 2005. Ernst Dieffenbach – the first European to climb Mount Taranaki? http://www.pukeariki.com/Research/Taranaki-Research-Centre/Taranaki-Stories/Taranaki-Story/id/559/title/ernst-dieffenbach-the-first-european-to-climb-mount-taranaki.
Lambert, R. 2012. Taranaki region – Geology and climate, Te Ara – the Encyclopedia of New Zealand, updated 13-Jul-12 URL: http://www.TeAra.govt.nz/en/taranaki-region/page-2.
LINZ, 2009. Standard for New Zealand Vertical Datum 2009. LINZS25004.
Lands & Survey. 1972. Taranaki (Vertical) Datum 1970 definition card.
Scanlan, A. B. 1961. Egmont, The Story of a Mountain. AH & AW Reed, Wellington.
Taranaki Iwi, 2013. History. http://taranakiiwi.org.nz/taranaki-iwi-history.
New Zealand Surveyor #303 • 2014 19
A Very High Resolution DEM of Kilimanjaro via Photogrammetry of Geoeye-1 Images (Kilisosdem2012)PASCAL SIRGUEY1 AND NICOLAS J. CULLEN2
1National School of Surveying, University of Otago, New Zealand2Department of Geography, University of Otago, New Zealand
Abstract In 1912, German explorers Eduard Oehler and glaciologist Fritz Klute surveyed Kilimanjaro armed with a photogrammetric camera. This led to a 1:50,000 scale map being produced, the quality of which should be praised given the complexity of the terrain and the technical limitations of the emerging survey-ing technique at the time. The mapping of Kilimanjaro at a scale of 1:50,000 was not repeated for another 50 years, when a photogrammetric survey was conducted from aerial images captured in 1962. The rap-idly changing topography associated with the glacier retreat, and the popularity of the slopes of Kibo, which attract about 40,000 climbers each year, justifies the need to develop a new topographic survey of this outstanding landmark. In this context, the application of the photogrammetric principles to the latest generation of very high resolution space-borne optical sensors (VHRS) offers new surveying opportunities, by enabling the topographic mapping of remote and hardly accessible areas at large scale with unprece-dented spatial resolution, at a small pecuniary and logistical cost. Thus, 100 years after Klute and Oehler completed the first ground based photogrammetric survey of Kibo, and 50 years after the most recent aerial photogrammetric survey, this paper illustrates the potential of a space-borne photogrammetric survey technique by reporting on the latest effort to map the topography of Kibo from GeoEye-1 stereo imagery. This has led to the creation of a new 50cm resolution Digital Elevation Model (DEM), namely KILISoSDEM2012, and this paper shows that the new DEM exhibits a 35% and 25% improvement in plani-metric and elevation accuracy respectively, compared to the specifications of GeoEye-1 Precision products.
IntroductionIn 1867, the “German father of photometrographie” Albrecht Meydenbauer (1834-1921) met the geographer and explorer Otto Kersten (1839-1900) who, five years earlier, had attempted the first climb of Kibo, the highest of three peaks of Kilimanjaro. Meydenbauer presented to him the technique he designed that allowed measure-ments to be made from photographs, as he foresaw that it could be a useful surveying application during expe-ditions (Grimm 2007). Fascinated, Kersten proposed to rename the technique Photogrammetry (Albertz 2007), thus sealing an intimate link between this science and the highest mountain of Africa and tallest freestanding moun-tain in the world, where a glacier named after Kersten still remains. Forty years later, in 1906–07, German explorers Fritz Jaeger and Eduard Oehler conducted further map-ping of Kibo from photographs, but could not apply the photogrammetric principles due to the lack of a suitable camera (Jaeger 1909: 194-196). Armed with a photogram-metric camera, Oehler returned to Kilimanjaro in 1912
with geographer and glaciologist Fritz Klute (Klute 1920). This led to a 1:50,000 scale map being produced (Figure 1), the quality of which should be praised given the com-plexity of the terrain and the technical limitations of the emerging surveying technique at the time.
The mapping of Kilimanjaro at a scale of 1:50,000 was not repeated for another 50 years. A photogrammetric survey was conducted from aerial images captured in January 1962 for the main mountain, following a survey in March 1958 for its surroundings (Directorate of Overseas Surveys 1964; Young & Hastenrath 1987; Shirima, S. pers. com., September 25, 2013). Although more recent research pro-jects have used some limited survey data in selected areas of the volcano, such as to characterise the demise of gla-ciers on Kibo (Cullen et al. 2013), the massive volcano has not benefited from an updated and more detailed survey in 50 years. The rapidly changing topography associated with the glacier retreat, and the fact that the slopes of Kibo attract about 40,000 climbers each year (UIAA, 2013), justify the need to develop a new topographic survey of
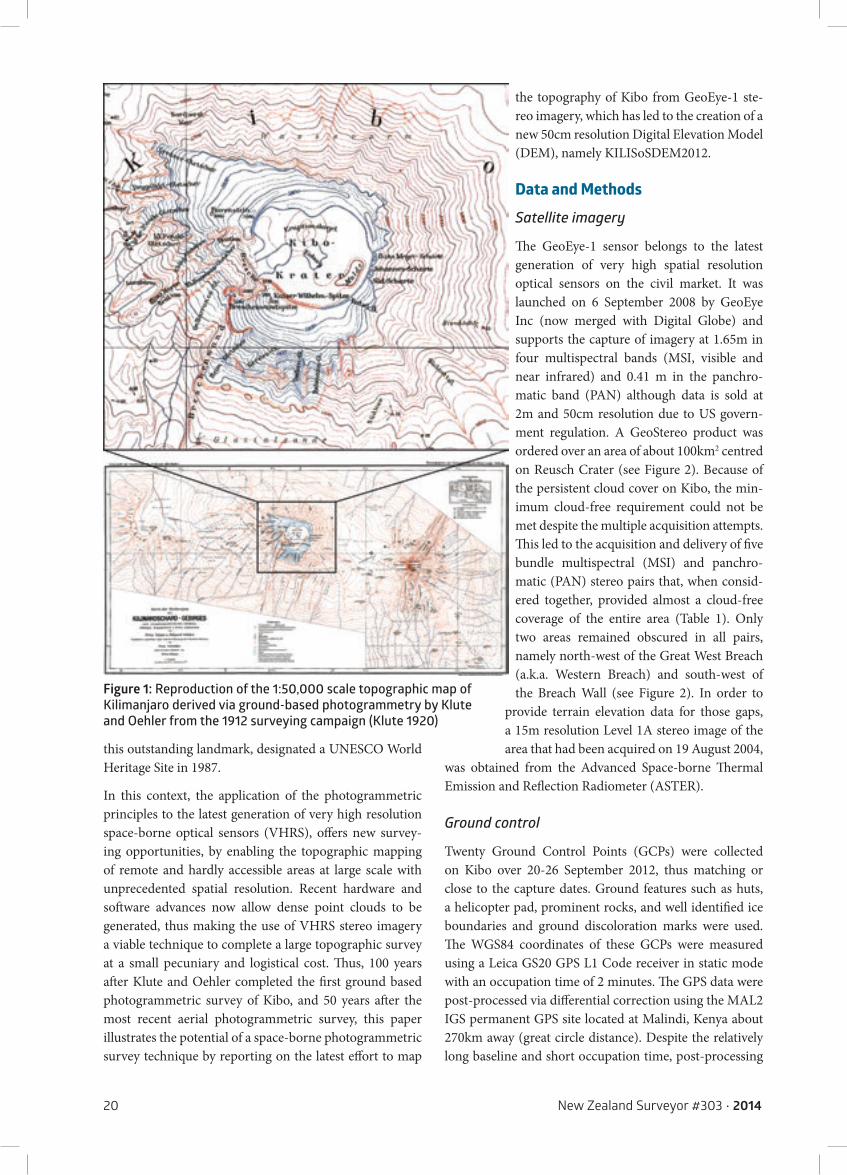
20 New Zealand Surveyor #303 • 2014
this outstanding landmark, designated a UNESCO World Heritage Site in 1987.
In this context, the application of the photogrammetric principles to the latest generation of very high resolution space-borne optical sensors (VHRS), offers new survey-ing opportunities, by enabling the topographic mapping of remote and hardly accessible areas at large scale with unprecedented spatial resolution. Recent hardware and software advances now allow dense point clouds to be generated, thus making the use of VHRS stereo imagery a viable technique to complete a large topographic survey at a small pecuniary and logistical cost. Thus, 100 years after Klute and Oehler completed the first ground based photogrammetric survey of Kibo, and 50 years after the most recent aerial photogrammetric survey, this paper illustrates the potential of a space-borne photogrammetric survey technique by reporting on the latest effort to map
the topography of Kibo from GeoEye-1 ste-reo imagery, which has led to the creation of a new 50cm resolution Digital Elevation Model (DEM), namely KILISoSDEM2012.
Data and MethodsSatellite imagery
The GeoEye-1 sensor belongs to the latest generation of very high spatial resolution optical sensors on the civil market. It was launched on 6 September 2008 by GeoEye Inc (now merged with Digital Globe) and supports the capture of imagery at 1.65m in four multispectral bands (MSI, visible and near infrared) and 0.41 m in the panchro-matic band (PAN) although data is sold at 2m and 50cm resolution due to US govern-ment regulation. A GeoStereo product was ordered over an area of about 100km2 centred on Reusch Crater (see Figure 2). Because of the persistent cloud cover on Kibo, the min-imum cloud-free requirement could not be met despite the multiple acquisition attempts. This led to the acquisition and delivery of five bundle multispectral (MSI) and panchro-matic (PAN) stereo pairs that, when consid-ered together, provided almost a cloud-free coverage of the entire area (Table 1). Only two areas remained obscured in all pairs, namely north-west of the Great West Breach (a.k.a. Western Breach) and south-west of the Breach Wall (see Figure 2). In order to
provide terrain elevation data for those gaps, a 15m resolution Level 1A stereo image of the area that had been acquired on 19 August 2004,
was obtained from the Advanced Space-borne Thermal Emission and Reflection Radiometer (ASTER).
Ground control
Twenty Ground Control Points (GCPs) were collected on Kibo over 20-26 September 2012, thus matching or close to the capture dates. Ground features such as huts, a helicopter pad, prominent rocks, and well identified ice boundaries and ground discoloration marks were used. The WGS84 coordinates of these GCPs were measured using a Leica GS20 GPS L1 Code receiver in static mode with an occupation time of 2 minutes. The GPS data were post-processed via differential correction using the MAL2 IGS permanent GPS site located at Malindi, Kenya about 270km away (great circle distance). Despite the relatively long baseline and short occupation time, post-processing
Figure 1: Reproduction of the 1:50,000 scale topographic map of Kilimanjaro derived via ground-based photogrammetry by Klute and Oehler from the 1912 surveying campaign (Klute 1920)
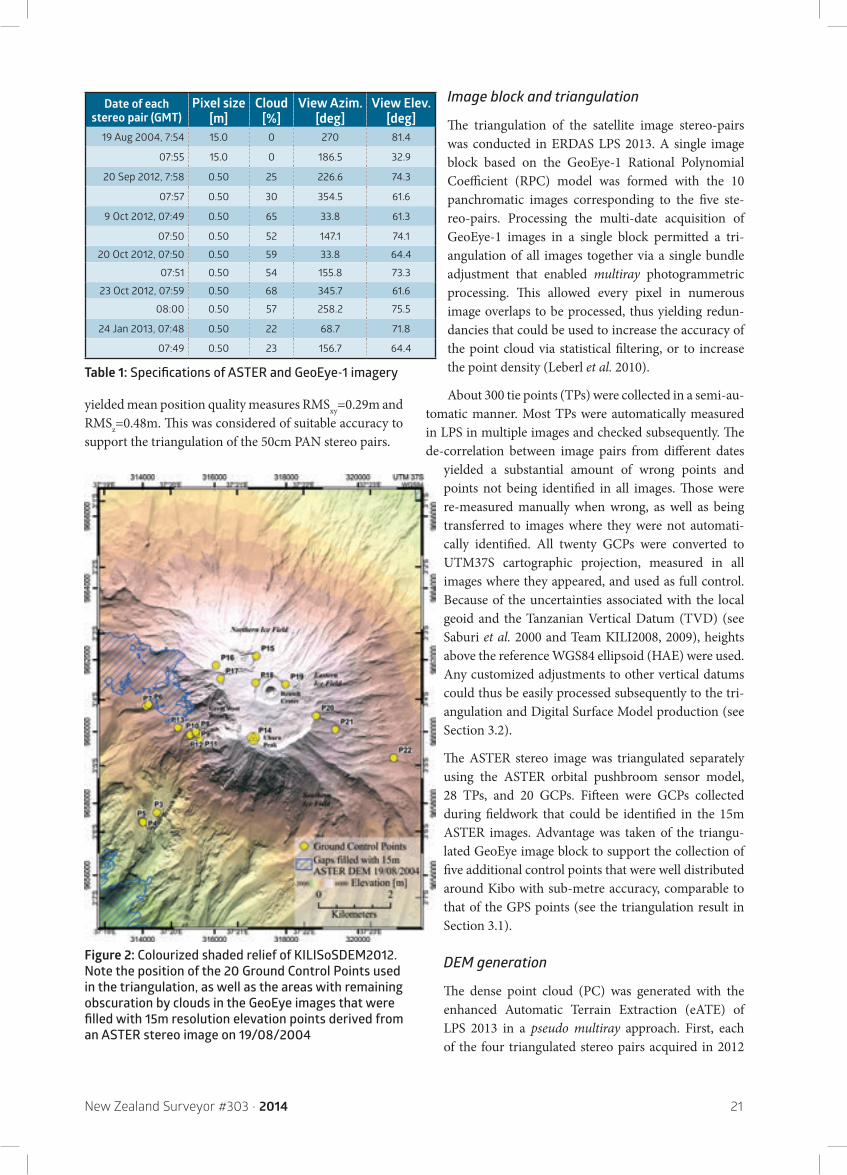
New Zealand Surveyor #303 • 2014 21
yielded mean position quality measures RMSxy=0.29m and RMSz=0.48m. This was considered of suitable accuracy to support the triangulation of the 50cm PAN stereo pairs.
Image block and triangulation
The triangulation of the satellite image stereo-pairs was conducted in ERDAS LPS 2013. A single image block based on the GeoEye-1 Rational Polynomial Coefficient (RPC) model was formed with the 10 panchromatic images corresponding to the five ste-reo-pairs. Processing the multi-date acquisition of GeoEye-1 images in a single block permitted a tri-angulation of all images together via a single bundle adjustment that enabled multiray photogrammetric processing. This allowed every pixel in numerous image overlaps to be processed, thus yielding redun-dancies that could be used to increase the accuracy of the point cloud via statistical filtering, or to increase the point density (Leberl et al. 2010).
About 300 tie points (TPs) were collected in a semi-au-tomatic manner. Most TPs were automatically measured in LPS in multiple images and checked subsequently. The de-correlation between image pairs from different dates
yielded a substantial amount of wrong points and points not being identified in all images. Those were re-measured manually when wrong, as well as being transferred to images where they were not automati-cally identified. All twenty GCPs were converted to UTM37S cartographic projection, measured in all images where they appeared, and used as full control. Because of the uncertainties associated with the local geoid and the Tanzanian Vertical Datum (TVD) (see Saburi et al. 2000 and Team KILI2008, 2009), heights above the reference WGS84 ellipsoid (HAE) were used. Any customized adjustments to other vertical datums could thus be easily processed subsequently to the tri-angulation and Digital Surface Model production (see Section 3.2).
The ASTER stereo image was triangulated separately using the ASTER orbital pushbroom sensor model, 28 TPs, and 20 GCPs. Fifteen were GCPs collected during fieldwork that could be identified in the 15m ASTER images. Advantage was taken of the triangu-lated GeoEye image block to support the collection of five additional control points that were well distributed around Kibo with sub-metre accuracy, comparable to that of the GPS points (see the triangulation result in Section 3.1).
DEM generation
The dense point cloud (PC) was generated with the enhanced Automatic Terrain Extraction (eATE) of LPS 2013 in a pseudo multiray approach. First, each of the four triangulated stereo pairs acquired in 2012
Figure 2: Colourized shaded relief of KILISoSDEM2012. Note the position of the 20 Ground Control Points used in the triangulation, as well as the areas with remaining obscuration by clouds in the GeoEye images that were filled with 15m resolution elevation points derived from an ASTER stereo image on 19/08/2004
Date of each stereo pair (GMT)
Pixel size [m]
Cloud [%]
View Azim. [deg]
View Elev. [deg]
19 Aug 2004, 7:54 15.0 0 270 81.4
07:55 15.0 0 186.5 32.9
20 Sep 2012, 7:58 0.50 25 226.6 74.3
07:57 0.50 30 354.5 61.6
9 Oct 2012, 07:49 0.50 65 33.8 61.3
07:50 0.50 52 147.1 74.1
20 Oct 2012, 07:50 0.50 59 33.8 64.4
07:51 0.50 54 155.8 73.3
23 Oct 2012, 07:59 0.50 68 345.7 61.6
08:00 0.50 57 258.2 75.5
24 Jan 2013, 07:48 0.50 22 68.7 71.8
07:49 0.50 23 156.7 64.4
Table 1: Specifications of ASTER and GeoEye-1 imagery
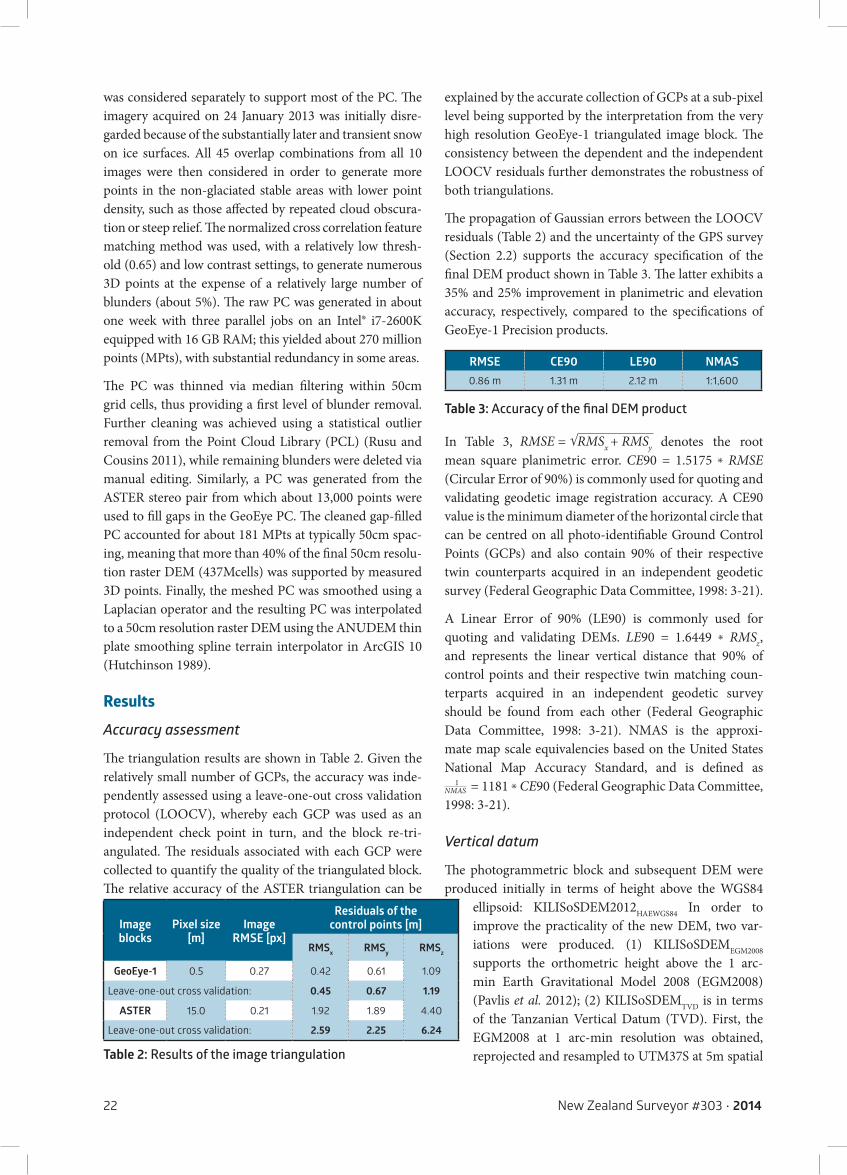
22 New Zealand Surveyor #303 • 2014
was considered separately to support most of the PC. The imagery acquired on 24 January 2013 was initially disre-garded because of the substantially later and transient snow on ice surfaces. All 45 overlap combinations from all 10 images were then considered in order to generate more points in the non-glaciated stable areas with lower point density, such as those affected by repeated cloud obscura-tion or steep relief. The normalized cross correlation feature matching method was used, with a relatively low thresh-old (0.65) and low contrast settings, to generate numerous 3D points at the expense of a relatively large number of blunders (about 5%). The raw PC was generated in about one week with three parallel jobs on an Intel® i7-2600K equipped with 16 GB RAM; this yielded about 270 million points (MPts), with substantial redundancy in some areas.
The PC was thinned via median filtering within 50cm grid cells, thus providing a first level of blunder removal. Further cleaning was achieved using a statistical outlier removal from the Point Cloud Library (PCL) (Rusu and Cousins 2011), while remaining blunders were deleted via manual editing. Similarly, a PC was generated from the ASTER stereo pair from which about 13,000 points were used to fill gaps in the GeoEye PC. The cleaned gap-filled PC accounted for about 181 MPts at typically 50cm spac-ing, meaning that more than 40% of the final 50cm resolu-tion raster DEM (437Mcells) was supported by measured 3D points. Finally, the meshed PC was smoothed using a Laplacian operator and the resulting PC was interpolated to a 50cm resolution raster DEM using the ANUDEM thin plate smoothing spline terrain interpolator in ArcGIS 10 (Hutchinson 1989).
ResultsAccuracy assessment
The triangulation results are shown in Table 2. Given the relatively small number of GCPs, the accuracy was inde-pendently assessed using a leave-one-out cross validation protocol (LOOCV), whereby each GCP was used as an independent check point in turn, and the block re-tri-angulated. The residuals associated with each GCP were collected to quantify the quality of the triangulated block. The relative accuracy of the ASTER triangulation can be
explained by the accurate collection of GCPs at a sub-pixel level being supported by the interpretation from the very high resolution GeoEye-1 triangulated image block. The consistency between the dependent and the independent LOOCV residuals further demonstrates the robustness of both triangulations.
The propagation of Gaussian errors between the LOOCV residuals (Table 2) and the uncertainty of the GPS survey (Section 2.2) supports the accuracy specification of the final DEM product shown in Table 3. The latter exhibits a 35% and 25% improvement in planimetric and elevation accuracy, respectively, compared to the specifications of GeoEye-1 Precision products.
In Table 3, denotes the root mean square planimetric error. CE90 = 1.5175 ✳ RMSE (Circular Error of 90%) is commonly used for quoting and validating geodetic image registration accuracy. A CE90 value is the minimum diameter of the horizontal circle that can be centred on all photo-identifiable Ground Control Points (GCPs) and also contain 90% of their respective twin counterparts acquired in an independent geodetic survey (Federal Geographic Data Committee, 1998: 3-21).
A Linear Error of 90% (LE90) is commonly used for quoting and validating DEMs. LE90 = 1.6449 ✳ RMSz, and represents the linear vertical distance that 90% of control points and their respective twin matching coun-terparts acquired in an independent geodetic survey should be found from each other (Federal Geographic Data Committee, 1998: 3-21). NMAS is the approxi-mate map scale equivalencies based on the United States National Map Accuracy Standard, and is defined as NMAS
1 = 1181 ✳ CE90 (Federal Geographic Data Committee,
1998: 3-21).
Vertical datum
The photogrammetric block and subsequent DEM were produced initially in terms of height above the WGS84
ellipsoid: KILISoSDEM2012HAEWGS84 In order to improve the practicality of the new DEM, two var-iations were produced. (1) KILISoSDEMEGM2008 supports the orthometric height above the 1 arc-min Earth Gravitational Model 2008 (EGM2008) (Pavlis et al. 2012); (2) KILISoSDEMTVD is in terms of the Tanzanian Vertical Datum (TVD). First, the EGM2008 at 1 arc-min resolution was obtained, reprojected and resampled to UTM37S at 5m spatial
RMSE CE90 LE90 NMAS0.86 m 1.31 m 2.12 m 1:1,600
Table 3: Accuracy of the final DEM product
Image blocks
Pixel size[m]
Image RMSE [px]
Residuals of the control points [m]
RMSx RMSy RMSz
GeoEye-1 0.5 0.27 0.42 0.61 1.09
Leave-one-out cross validation: 0.45 0.67 1.19
ASTER 15.0 0.21 1.92 1.89 4.40
Leave-one-out cross validation: 2.59 2.25 6.24
Table 2: Results of the image triangulation
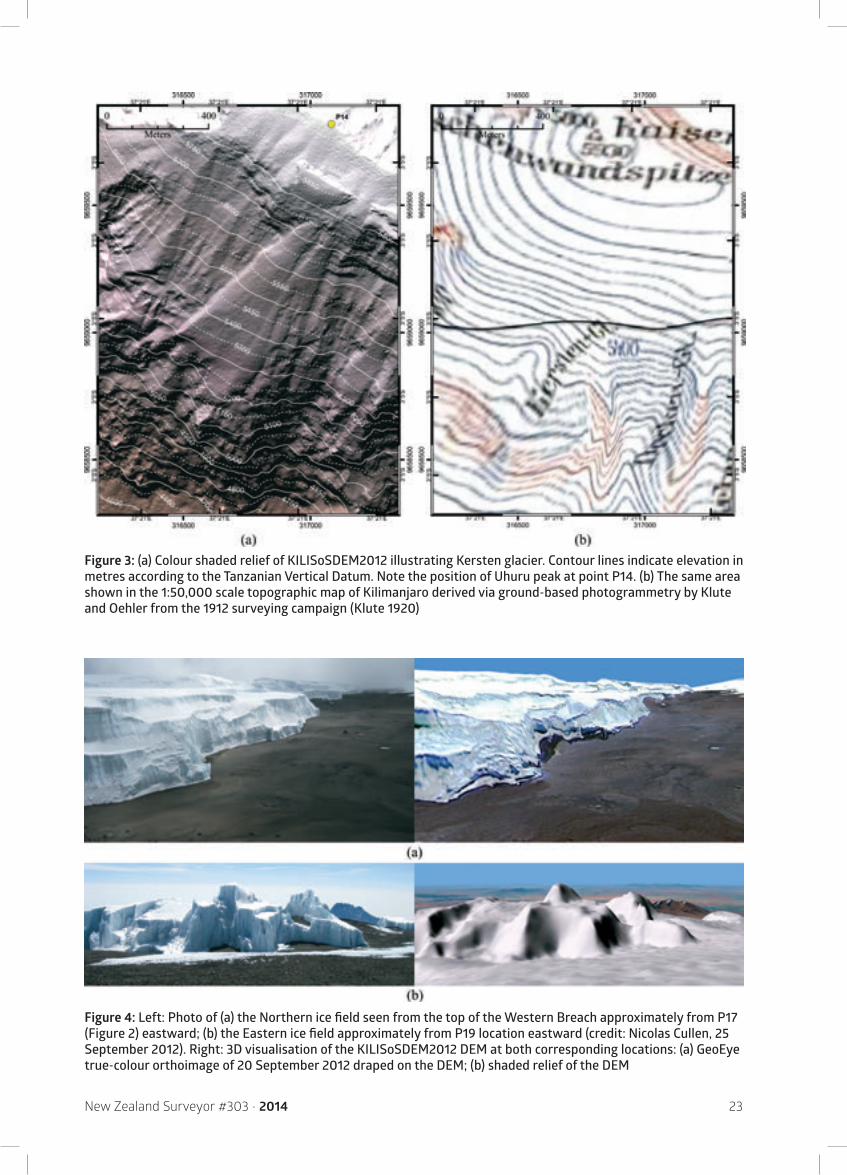
New Zealand Surveyor #303 • 2014 23
Figure 4: Left: Photo of (a) the Northern ice field seen from the top of the Western Breach approximately from P17 (Figure 2) eastward; (b) the Eastern ice field approximately from P19 location eastward (credit: Nicolas Cullen, 25 September 2012). Right: 3D visualisation of the KILISoSDEM2012 DEM at both corresponding locations: (a) GeoEye true-colour orthoimage of 20 September 2012 draped on the DEM; (b) shaded relief of the DEM
Figure 3: (a) Colour shaded relief of KILISoSDEM2012 illustrating Kersten glacier. Contour lines indicate elevation in metres according to the Tanzanian Vertical Datum. Note the position of Uhuru peak at point P14. (b) The same area shown in the 1:50,000 scale topographic map of Kilimanjaro derived via ground-based photogrammetry by Klute and Oehler from the 1912 surveying campaign (Klute 1920)
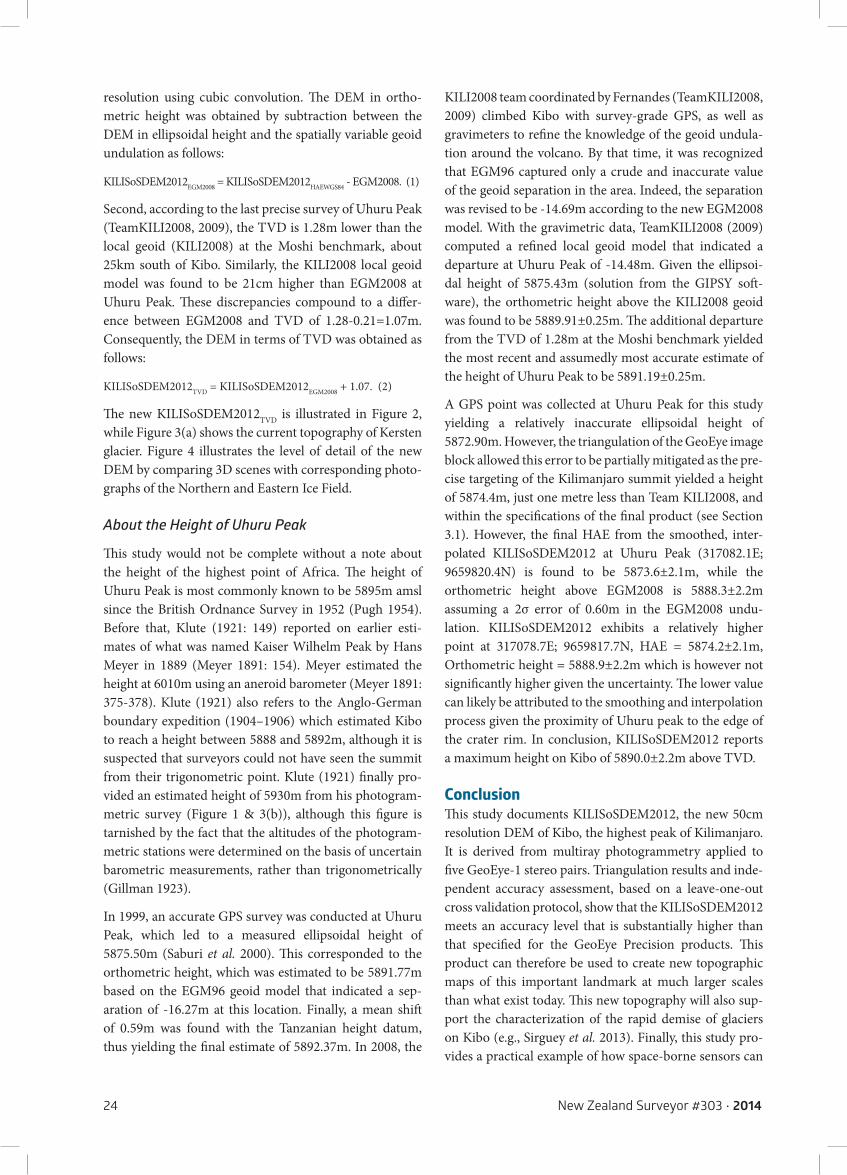
24 New Zealand Surveyor #303 • 2014
resolution using cubic convolution. The DEM in ortho-metric height was obtained by subtraction between the DEM in ellipsoidal height and the spatially variable geoid undulation as follows:
KILISoSDEM2012EGM2008 = KILISoSDEM2012HAEWGS84 - EGM2008. (1)
Second, according to the last precise survey of Uhuru Peak (TeamKILI2008, 2009), the TVD is 1.28m lower than the local geoid (KILI2008) at the Moshi benchmark, about 25km south of Kibo. Similarly, the KILI2008 local geoid model was found to be 21cm higher than EGM2008 at Uhuru Peak. These discrepancies compound to a differ-ence between EGM2008 and TVD of 1.28-0.21=1.07m. Consequently, the DEM in terms of TVD was obtained as follows:
KILISoSDEM2012TVD = KILISoSDEM2012EGM2008 + 1.07. (2)
The new KILISoSDEM2012TVD is illustrated in Figure 2, while Figure 3(a) shows the current topography of Kersten glacier. Figure 4 illustrates the level of detail of the new DEM by comparing 3D scenes with corresponding photo-graphs of the Northern and Eastern Ice Field.
About the Height of Uhuru Peak
This study would not be complete without a note about the height of the highest point of Africa. The height of Uhuru Peak is most commonly known to be 5895m amsl since the British Ordnance Survey in 1952 (Pugh 1954). Before that, Klute (1921: 149) reported on earlier esti-mates of what was named Kaiser Wilhelm Peak by Hans Meyer in 1889 (Meyer 1891: 154). Meyer estimated the height at 6010m using an aneroid barometer (Meyer 1891: 375-378). Klute (1921) also refers to the Anglo-German boundary expedition (1904–1906) which estimated Kibo to reach a height between 5888 and 5892m, although it is suspected that surveyors could not have seen the summit from their trigonometric point. Klute (1921) finally pro-vided an estimated height of 5930m from his photogram-metric survey (Figure 1 & 3(b)), although this figure is tarnished by the fact that the altitudes of the photogram-metric stations were determined on the basis of uncertain barometric measurements, rather than trigonometrically (Gillman 1923).
In 1999, an accurate GPS survey was conducted at Uhuru Peak, which led to a measured ellipsoidal height of 5875.50m (Saburi et al. 2000). This corresponded to the orthometric height, which was estimated to be 5891.77m based on the EGM96 geoid model that indicated a sep-aration of -16.27m at this location. Finally, a mean shift of 0.59m was found with the Tanzanian height datum, thus yielding the final estimate of 5892.37m. In 2008, the
KILI2008 team coordinated by Fernandes (TeamKILI2008, 2009) climbed Kibo with survey-grade GPS, as well as gravimeters to refine the knowledge of the geoid undula-tion around the volcano. By that time, it was recognized that EGM96 captured only a crude and inaccurate value of the geoid separation in the area. Indeed, the separation was revised to be -14.69m according to the new EGM2008 model. With the gravimetric data, TeamKILI2008 (2009) computed a refined local geoid model that indicated a departure at Uhuru Peak of -14.48m. Given the ellipsoi-dal height of 5875.43m (solution from the GIPSY soft-ware), the orthometric height above the KILI2008 geoid was found to be 5889.91±0.25m. The additional departure from the TVD of 1.28m at the Moshi benchmark yielded the most recent and assumedly most accurate estimate of the height of Uhuru Peak to be 5891.19±0.25m.
A GPS point was collected at Uhuru Peak for this study yielding a relatively inaccurate ellipsoidal height of 5872.90m. However, the triangulation of the GeoEye image block allowed this error to be partially mitigated as the pre-cise targeting of the Kilimanjaro summit yielded a height of 5874.4m, just one metre less than Team KILI2008, and within the specifications of the final product (see Section 3.1). However, the final HAE from the smoothed, inter-polated KILISoSDEM2012 at Uhuru Peak (317082.1E; 9659820.4N) is found to be 5873.6±2.1m, while the orthometric height above EGM2008 is 5888.3±2.2m assuming a 2σ error of 0.60m in the EGM2008 undu-lation. KILISoSDEM2012 exhibits a relatively higher point at 317078.7E; 9659817.7N, HAE = 5874.2±2.1m, Orthometric height = 5888.9±2.2m which is however not significantly higher given the uncertainty. The lower value can likely be attributed to the smoothing and interpolation process given the proximity of Uhuru peak to the edge of the crater rim. In conclusion, KILISoSDEM2012 reports a maximum height on Kibo of 5890.0±2.2m above TVD.
ConclusionThis study documents KILISoSDEM2012, the new 50cm resolution DEM of Kibo, the highest peak of Kilimanjaro. It is derived from multiray photogrammetry applied to five GeoEye-1 stereo pairs. Triangulation results and inde-pendent accuracy assessment, based on a leave-one-out cross validation protocol, show that the KILISoSDEM2012 meets an accuracy level that is substantially higher than that specified for the GeoEye Precision products. This product can therefore be used to create new topographic maps of this important landmark at much larger scales than what exist today. This new topography will also sup-port the characterization of the rapid demise of glaciers on Kibo (e.g., Sirguey et al. 2013). Finally, this study pro-vides a practical example of how space-borne sensors can

New Zealand Surveyor #303 • 2014 25
be used to support surveying applications with relatively strict accuracy requirements.
AcknowledgmentsThis research was funded by the National School of Surveying and the Department of Geography, University of Otago, New Zealand. ASTER images were obtained with support from the Global Land Ice Measurement from Space (GLIMS). The authors thank Stephen Shirima,
principal land surveyor and assistant director of the map-ping division at the Ministry of Lands, Housing and Human Settlements Development, Dar es Salaam, Tanzania, and Jorge Filipe Dos Santos from TeamKILI2008 for their use-ful insight. The two anonymous reviewers are also thanked for their constructive comments on the manuscript. This research would not have been possible without the support from the following Tanzanian authorities: COSTECH, KINAPA, TANAPA, TAWIRI.
ReferencesAlbertz, J. 2007. A Look Back – 140 Years of “Photogrammetry”, some remarks on the history of photogrammetry. Photogrammetric Engineering and Remote Sensing, 73(5): 504-506.
Cullen, N. J., Sirguey, P., Mölg, T., Kaser, G., Winkler, M. & Fitzsimons, S. J. 2013. A Century of Ice Retreat on Kilimanjaro: the Mapping Reloaded, The Cryosphere, 7(2): 419-431, doi:10.5194/tc-7-419-2013.
Directorate of Overseas Surveys. 1964. Kilimanjaro, East Africa (Tanganyika) Series Y742, Sheet 56/2, D.O.S. 422 1964, Edition 1, Scale 1:50,000.
Federal Geographic Data Committee. 1998. Part 3: National Standard for Spatial Data Accuracy Geospatial, Positioning Accuracy Standards, Federal Geographic Data Committee, (FGDC-STD-007.3-1998), 28pp.
Gillman, C. 1923. Dr. Klute’s Map of Kilimanjaro. The Geographical Journal, The Royal Geographical Society (with the Institute of British Geographers): 61(1): 70.
Grimm, A. 2007. The Origin of the Term Photogrammetry. In: Fritsch, D. (ed.), 51st Photogrammetric Week. Pp 53-60.
Hutchinson, M. F. 1989. A new procedure for gridding elevation and stream line data with automatic removal of spurious pits. Journal of Hydrology, 106: 211-232.
UIAA – International Mountaineering and Climbing Federation, 2013. Safety and Success on Kilimanjaro. Retrieved from http://www.theuiaa.org/kilimanjaro.html on September 27, 2013.
Jaeger, F. 1909. Forschungen in den Hochregionen des Kilimandscharo, Mitt. Deutsch. Schutzgebiet, 22: 113-197.
Klute, F. 1920. Ergebnisse der Forschungen am Kilimandscharo 1912. Reimer–Vohsen, Berlin, 1920.Klute, F. 1921. Die ste-reophotogrammetrishe Aufnahme der Hochregionen des Kilimandscharo. Zeitschrift der Gesselschaft Erdkunde zu Berlin, 56: 144-151.
Leberl, F., Irschara, A., Pock, T., Melxner, P., Gruber, M., Scholz, S. and Wlechert, A. 2010. Point Clouds: Lidar versus 3D Vision. Photogrammetric Engineering & Remote Sensing, 10: 1123-1134.
Meyer, H. 1891. Across East African glaciers: an account of the first ascent of Kilimanjaro. George Philip and Son, London. Translated from the German by E. H. S. Calder.
Pavlis, N. K., Holmes, S. A., Kenyon, S. C. and Factor, J. K. 2012. The development and evaluation of the Earth Gravitational Model 2008 (EGM2008). Journal of Geophysical Research, 117(B4): B04406.
Pugh, K. T. 1954. Height determination of Kilimanjaro. Empire Survey Review, 12(91): 194-206.
Rusu, R. B. and Cousins, S. 2011. 3D is here: Point Cloud Library (PCL). IEEE International Conference on Robotics and Automation (ICRA), May 9-13, Shanghai, China: pp 1-4.
Saburi, J., Angelakis, N., Jaeger, R., Illner, M., Jackson, P. and Pugh, K. 2000. Height measurement of Kilimanjaro. Survey Review, 35(278): 552-562.
Sirguey, P. J., Cullen, N. J., Mölg, T. and Kaser, G. 2013. Ice volume assessment of the Northern Ice Field of Kilimanjaro: the photogrammetry strikes back. In: Proceedings of the American Geophysical Union (AGU) fall meeting, San Francisco, USA, 7-13 December 2013, C42A-05.
Team KILI2008 2009. Precise Determination of the Orthometric Height of Mt. Kilimanjaro, FIG Working Week 2009, Eilat, Israel, 3-8 May 2009, 11pp.
Young, J. A. T. and Hastenrath, S. 1987. Glaciers of the Middle East and Africa – Glaciers of Africa. In: Williams, R. G. and Ferrigno, J. G. (eds), Satellite image atlas of glaciers of the World. USGS Professional paper 1386-G-3, U.S. Geological Survey, G49-G70 (1987)
26 New Zealand Surveyor #303 • 2014
Airborne Gravity Trial for an Improved National GeoidR. WINEFIELD1, M. AMOS1, F. CARATORI TONTINI2
1Land Information New Zealand, Wellington, NEW ZEALAND E-mail: [email protected] 2GNS Science, Lower Hutt, NEW ZEALAND
Abstract Land Information New Zealand (LINZ) has recently commenced a project to improve the accu-racy of the New Zealand Vertical Datum 2009 (NZVD2009), which will primarily be achieved through the incorporation of airborne gravity data into the quasigeoid that defines NZVD2009. This paper describes a trial airborne gravity survey carried out over Canterbury in early 2012 by LINZ, in conjunction with GNS Science. The purpose of this trial was to provide a proof of concept for the capture of a national airborne gravity dataset in the New Zealand environment.
Keywords: airborne gravity, terrestrial gravity, New Zealand, geoid modelling, vertical datum
IntroductionThe release of the New Zealand Vertical Datum 2009 (NZVD2009) provided a single, nationally consistent ver-tical reference system across New Zealand for the first time (Amos 2010a). The introduction of NZVD2009 is a signif-icant improvement on the situation prior, as normal-orth-ometric heights can now be accessed using GNSS (Global Navigation Satellite System) technologies anywhere in New Zealand. However, limitations in the accuracy of the New Zealand Quasigeoid 2009 (NZGeoid2009) that defines the datum were quickly identified as a barrier to its adoption. Potential users of the datum indicated that datum accu-racy better than 3cm was desirable to make the best use of developing positioning technologies (LINZ 2011).
This study utilises a trial airborne gravity survey to verify the suitability of the technique used and to optimise flying parameters for a national campaign. The test results are assessed in order to evaluate the potential for improving the New Zealand vertical datum through the inclusion of a national airborne gravity dataset.
New Zealand Vertical Datum 2009NZVD2009 is the official vertical datum for New Zealand. It is used to provide normal-orthometric heights to mainland New Zealand and its offshore islands, and is defined in relation to the New Zealand Quasigeoid 2009 (NZGeoid2009), which extends over the New Zealand continental shelf. The nominal national accuracy of NZVD2009 is 8cm, with regional accuracies varying between 2cm and 25cm (LINZ 2009).
Prior to the introduction of NZVD2009, heights in New Zealand were referenced to thirteen separate local verti-cal datums (LVD) based on normal-orthometric corrected precise levelling. Many of the LVDs cover large spatial extents, but due to the nature of precise levelling, obser-vations were often limited to main roads, resulting in large gaps in the network coverage particularly in mountainous areas (Amos 2010b).
Each LVD is based on mean sea level from one of twelve tide gauges, which are often located in harbours or rivers. Generally, these tide gauges are not well suited for verti-cal datum definition, as their locations are susceptible to local hydrographic effects (such as the shape and depth of the waterbed), whereas ideal locations are off shore or on the open coast (Amos 2010a). In addition, mean-sea level at each gauge has been determined over a range of time intervals, usually a period greater than three years, but typ-ically less than the eighteen years required to observe a full metonic cycle (Amos and Featherstone 2009).
Much of the levelling network has not been re-surveyed since it was established; in many cases published heights are more than 40 years old, and have been subject to sig-nificant vertical deformation during this time (Amos and Featherstone 2009). Precise levelling is an expensive undertaking, and it is not economically feasible for all bench marks in the country to be re-observed and main-tained on a regular basis (Amos 2010b). The more cost effective means of determining heights today is to use GNSS technology (Amos 2007).
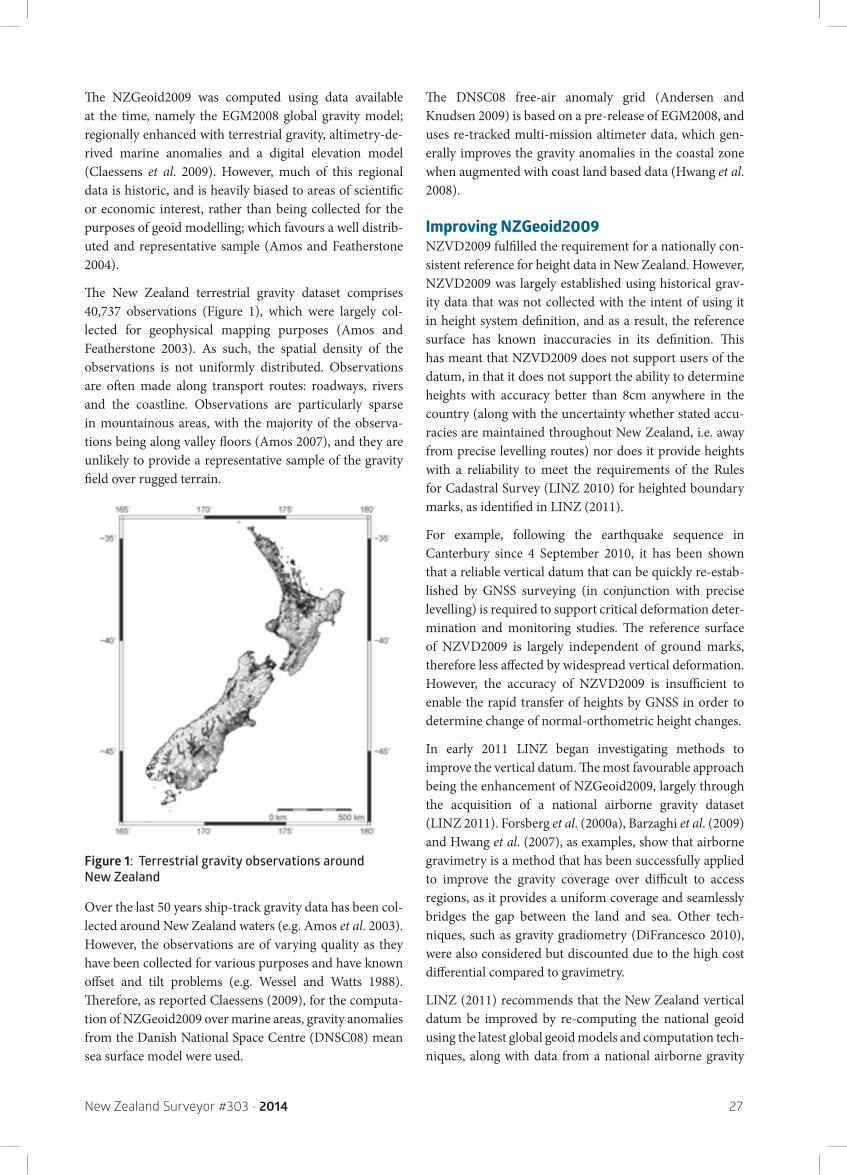
New Zealand Surveyor #303 • 2014 27
The NZGeoid2009 was computed using data available at the time, namely the EGM2008 global gravity model; regionally enhanced with terrestrial gravity, altimetry-de-rived marine anomalies and a digital elevation model (Claessens et al. 2009). However, much of this regional data is historic, and is heavily biased to areas of scientific or economic interest, rather than being collected for the purposes of geoid modelling; which favours a well distrib-uted and representative sample (Amos and Featherstone 2004).
The New Zealand terrestrial gravity dataset comprises 40,737 observations (Figure 1), which were largely col-lected for geophysical mapping purposes (Amos and Featherstone 2003). As such, the spatial density of the observations is not uniformly distributed. Observations are often made along transport routes: roadways, rivers and the coastline. Observations are particularly sparse in mountainous areas, with the majority of the observa-tions being along valley floors (Amos 2007), and they are unlikely to provide a representative sample of the gravity field over rugged terrain.
Figure 1: Terrestrial gravity observations around New Zealand
Over the last 50 years ship-track gravity data has been col-lected around New Zealand waters (e.g. Amos et al. 2003). However, the observations are of varying quality as they have been collected for various purposes and have known offset and tilt problems (e.g. Wessel and Watts 1988). Therefore, as reported Claessens (2009), for the computa-tion of NZGeoid2009 over marine areas, gravity anomalies from the Danish National Space Centre (DNSC08) mean sea surface model were used.
The DNSC08 free-air anomaly grid (Andersen and Knudsen 2009) is based on a pre-release of EGM2008, and uses re-tracked multi-mission altimeter data, which gen-erally improves the gravity anomalies in the coastal zone when augmented with coast land based data (Hwang et al. 2008).
Improving NZGeoid2009NZVD2009 fulfilled the requirement for a nationally con-sistent reference for height data in New Zealand. However, NZVD2009 was largely established using historical grav-ity data that was not collected with the intent of using it in height system definition, and as a result, the reference surface has known inaccuracies in its definition. This has meant that NZVD2009 does not support users of the datum, in that it does not support the ability to determine heights with accuracy better than 8cm anywhere in the country (along with the uncertainty whether stated accu-racies are maintained throughout New Zealand, i.e. away from precise levelling routes) nor does it provide heights with a reliability to meet the requirements of the Rules for Cadastral Survey (LINZ 2010) for heighted boundary marks, as identified in LINZ (2011).
For example, following the earthquake sequence in Canterbury since 4 September 2010, it has been shown that a reliable vertical datum that can be quickly re-estab-lished by GNSS surveying (in conjunction with precise levelling) is required to support critical deformation deter-mination and monitoring studies. The reference surface of NZVD2009 is largely independent of ground marks, therefore less affected by widespread vertical deformation. However, the accuracy of NZVD2009 is insufficient to enable the rapid transfer of heights by GNSS in order to determine change of normal-orthometric height changes.
In early 2011 LINZ began investigating methods to improve the vertical datum. The most favourable approach being the enhancement of NZGeoid2009, largely through the acquisition of a national airborne gravity dataset (LINZ 2011). Forsberg et al. (2000a), Barzaghi et al. (2009) and Hwang et al. (2007), as examples, show that airborne gravimetry is a method that has been successfully applied to improve the gravity coverage over difficult to access regions, as it provides a uniform coverage and seamlessly bridges the gap between the land and sea. Other tech-niques, such as gravity gradiometry (DiFrancesco 2010), were also considered but discounted due to the high cost differential compared to gravimetry.
LINZ (2011) recommends that the New Zealand vertical datum be improved by re-computing the national geoid using the latest global geoid models and computation tech-niques, along with data from a national airborne gravity
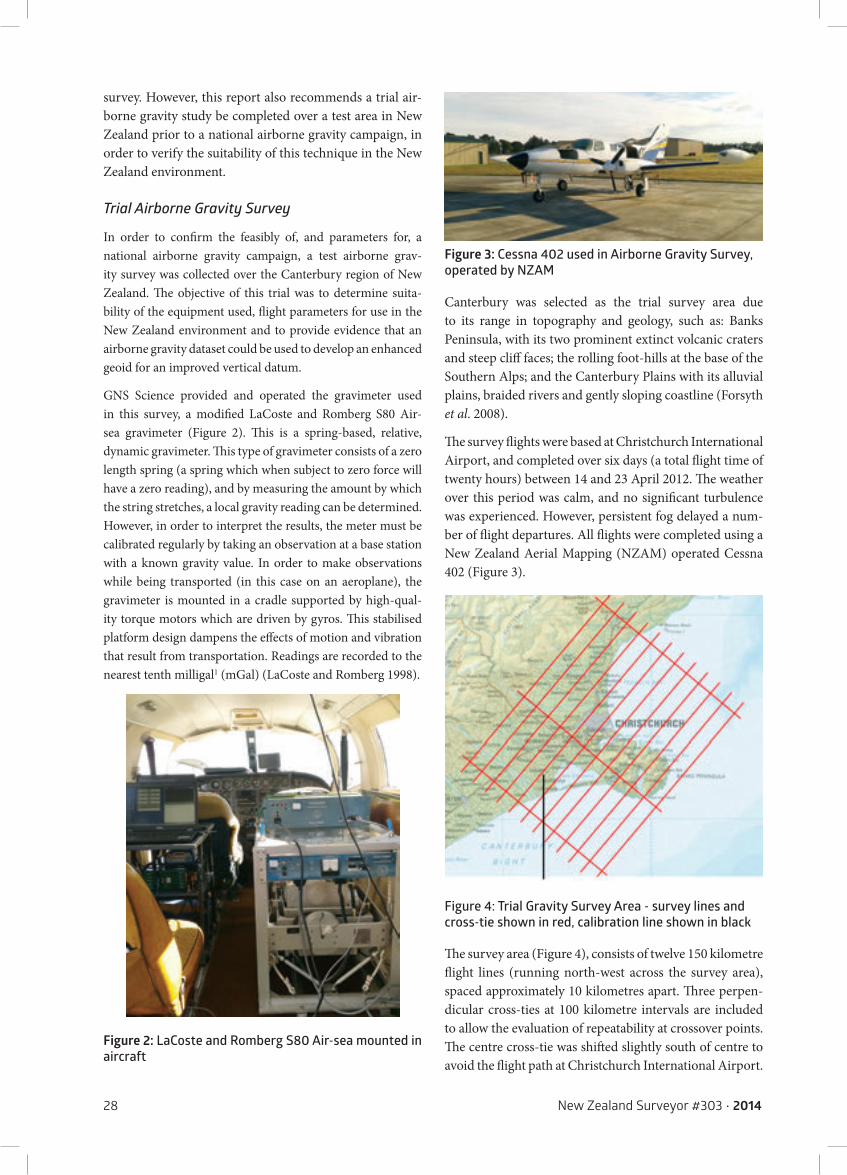
28 New Zealand Surveyor #303 • 2014
survey. However, this report also recommends a trial air-borne gravity study be completed over a test area in New Zealand prior to a national airborne gravity campaign, in order to verify the suitability of this technique in the New Zealand environment.
Trial Airborne Gravity Survey
In order to confirm the feasibly of, and parameters for, a national airborne gravity campaign, a test airborne grav-ity survey was collected over the Canterbury region of New Zealand. The objective of this trial was to determine suita-bility of the equipment used, flight parameters for use in the New Zealand environment and to provide evidence that an airborne gravity dataset could be used to develop an enhanced geoid for an improved vertical datum.
GNS Science provided and operated the gravimeter used in this survey, a modified LaCoste and Romberg S80 Air-sea gravimeter (Figure 2). This is a spring-based, relative, dynamic gravimeter. This type of gravimeter consists of a zero length spring (a spring which when subject to zero force will have a zero reading), and by measuring the amount by which the string stretches, a local gravity reading can be determined. However, in order to interpret the results, the meter must be calibrated regularly by taking an observation at a base station with a known gravity value. In order to make observations while being transported (in this case on an aeroplane), the gravimeter is mounted in a cradle supported by high-qual-ity torque motors which are driven by gyros. This stabilised platform design dampens the effects of motion and vibration that result from transportation. Readings are recorded to the nearest tenth milligal1 (mGal) (LaCoste and Romberg 1998).
Figure 2: LaCoste and Romberg S80 Air-sea mounted in aircraft
Figure 3: Cessna 402 used in Airborne Gravity Survey, operated by NZAM
Canterbury was selected as the trial survey area due to its range in topography and geology, such as: Banks Peninsula, with its two prominent extinct volcanic craters and steep cliff faces; the rolling foot-hills at the base of the Southern Alps; and the Canterbury Plains with its alluvial plains, braided rivers and gently sloping coastline (Forsyth et al. 2008).
The survey flights were based at Christchurch International Airport, and completed over six days (a total flight time of twenty hours) between 14 and 23 April 2012. The weather over this period was calm, and no significant turbulence was experienced. However, persistent fog delayed a num-ber of flight departures. All flights were completed using a New Zealand Aerial Mapping (NZAM) operated Cessna 402 (Figure 3).
Figure 4: Trial Gravity Survey Area - survey lines and cross-tie shown in red, calibration line shown in black
The survey area (Figure 4), consists of twelve 150 kilometre flight lines (running north-west across the survey area), spaced approximately 10 kilometres apart. Three perpen-dicular cross-ties at 100 kilometre intervals are included to allow the evaluation of repeatability at crossover points. The centre cross-tie was shifted slightly south of centre to avoid the flight path at Christchurch International Airport.
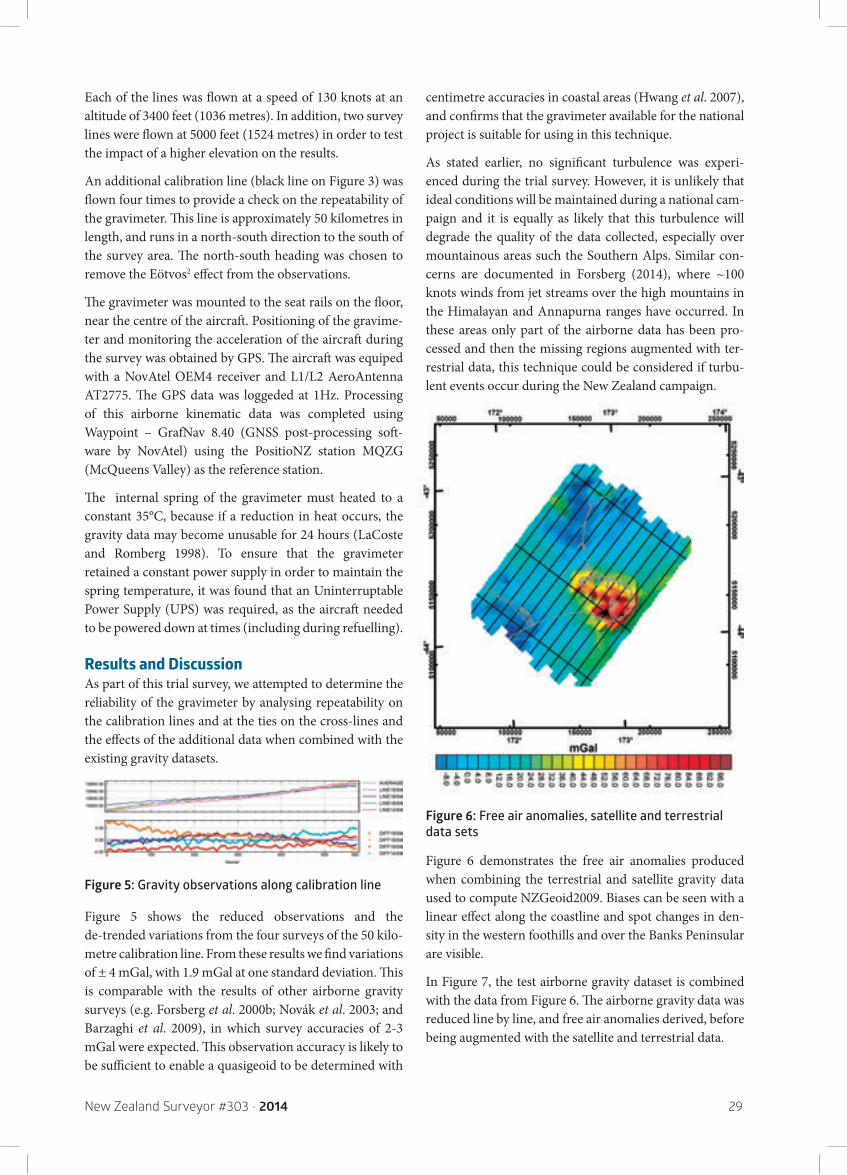
New Zealand Surveyor #303 • 2014 29
Each of the lines was flown at a speed of 130 knots at an altitude of 3400 feet (1036 metres). In addition, two survey lines were flown at 5000 feet (1524 metres) in order to test the impact of a higher elevation on the results.
An additional calibration line (black line on Figure 3) was flown four times to provide a check on the repeatability of the gravimeter. This line is approximately 50 kilometres in length, and runs in a north-south direction to the south of the survey area. The north-south heading was chosen to remove the Eötvos2 effect from the observations.
The gravimeter was mounted to the seat rails on the floor, near the centre of the aircraft. Positioning of the gravime-ter and monitoring the acceleration of the aircraft during the survey was obtained by GPS. The aircraft was equiped with a NovAtel OEM4 receiver and L1/L2 AeroAntenna AT2775. The GPS data was loggeded at 1Hz. Processing of this airborne kinematic data was completed using Waypoint – GrafNav 8.40 (GNSS post-processing soft-ware by NovAtel) using the PositioNZ station MQZG (McQueens Valley) as the reference station.
The internal spring of the gravimeter must heated to a constant 35°C, because if a reduction in heat occurs, the gravity data may become unusable for 24 hours (LaCoste and Romberg 1998). To ensure that the gravimeter retained a constant power supply in order to maintain the spring temperature, it was found that an Uninterruptable Power Supply (UPS) was required, as the aircraft needed to be powered down at times (including during refuelling).
Results and DiscussionAs part of this trial survey, we attempted to determine the reliability of the gravimeter by analysing repeatability on the calibration lines and at the ties on the cross-lines and the effects of the additional data when combined with the existing gravity datasets.
Figure 5: Gravity observations along calibration line
Figure 5 shows the reduced observations and the de-trended variations from the four surveys of the 50 kilo-metre calibration line. From these results we find variations of ± 4 mGal, with 1.9 mGal at one standard deviation. This is comparable with the results of other airborne gravity surveys (e.g. Forsberg et al. 2000b; Novák et al. 2003; and Barzaghi et al. 2009), in which survey accuracies of 2-3 mGal were expected. This observation accuracy is likely to be sufficient to enable a quasigeoid to be determined with
centimetre accuracies in coastal areas (Hwang et al. 2007), and confirms that the gravimeter available for the national project is suitable for using in this technique.
As stated earlier, no significant turbulence was experi-enced during the trial survey. However, it is unlikely that ideal conditions will be maintained during a national cam-paign and it is equally as likely that this turbulence will degrade the quality of the data collected, especially over mountainous areas such the Southern Alps. Similar con-cerns are documented in Forsberg (2014), where ~100 knots winds from jet streams over the high mountains in the Himalayan and Annapurna ranges have occurred. In these areas only part of the airborne data has been pro-cessed and then the missing regions augmented with ter-restrial data, this technique could be considered if turbu-lent events occur during the New Zealand campaign.
Figure 6: Free air anomalies, satellite and terrestrial data sets
Figure 6 demonstrates the free air anomalies produced when combining the terrestrial and satellite gravity data used to compute NZGeoid2009. Biases can be seen with a linear effect along the coastline and spot changes in den-sity in the western foothills and over the Banks Peninsular are visible.
In Figure 7, the test airborne gravity dataset is combined with the data from Figure 6. The airborne gravity data was reduced line by line, and free air anomalies derived, before being augmented with the satellite and terrestrial data.
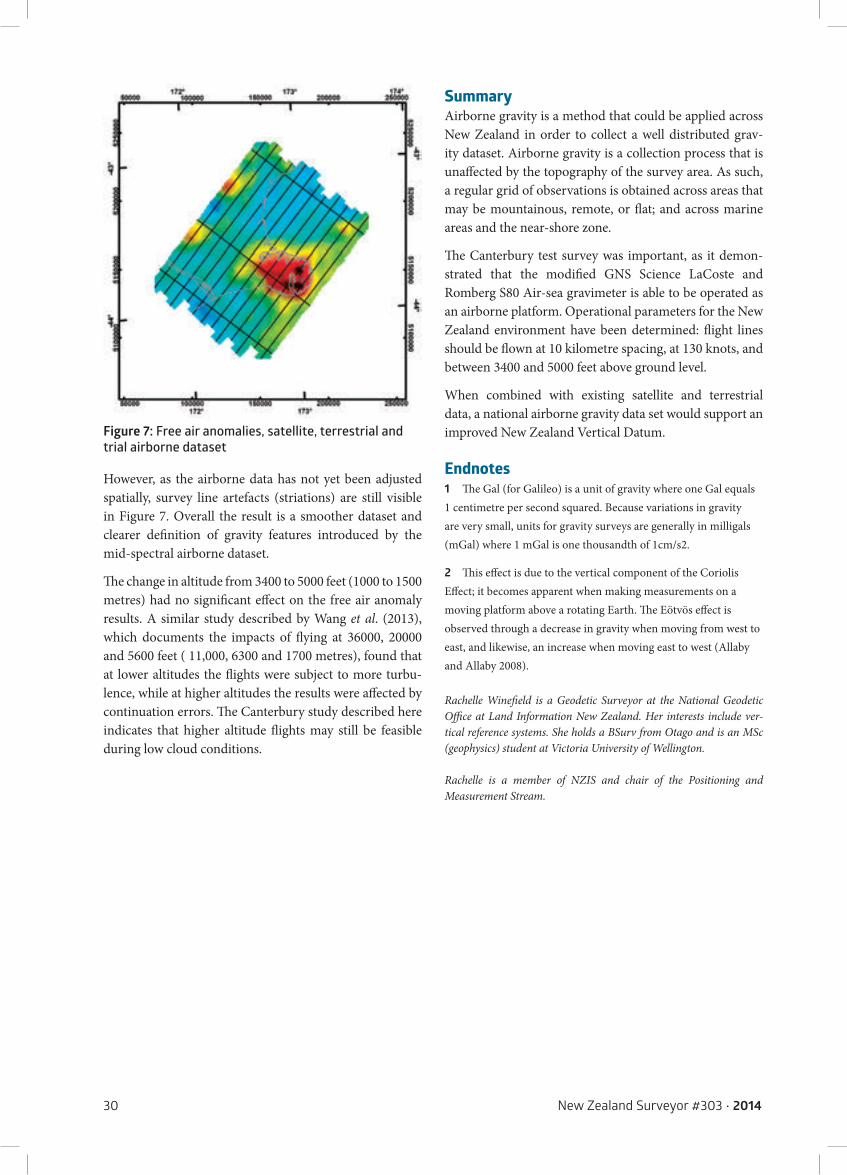
30 New Zealand Surveyor #303 • 2014
Figure 7: Free air anomalies, satellite, terrestrial and trial airborne dataset
However, as the airborne data has not yet been adjusted spatially, survey line artefacts (striations) are still visible in Figure 7. Overall the result is a smoother dataset and clearer definition of gravity features introduced by the mid-spectral airborne dataset.
The change in altitude from 3400 to 5000 feet (1000 to 1500 metres) had no significant effect on the free air anomaly results. A similar study described by Wang et al. (2013), which documents the impacts of flying at 36000, 20000 and 5600 feet ( 11,000, 6300 and 1700 metres), found that at lower altitudes the flights were subject to more turbu-lence, while at higher altitudes the results were affected by continuation errors. The Canterbury study described here indicates that higher altitude flights may still be feasible during low cloud conditions.
Rachelle Winefield is a Geodetic Surveyor at the National Geodetic Office at Land Information New Zealand. Her interests include ver-tical reference systems. She holds a BSurv from Otago and is an MSc (geophysics) student at Victoria University of Wellington.
Rachelle is a member of NZIS and chair of the Positioning and Measurement Stream.
Endnotes1 The Gal (for Galileo) is a unit of gravity where one Gal equals 1 centimetre per second squared. Because variations in gravity are very small, units for gravity surveys are generally in milligals (mGal) where 1 mGal is one thousandth of 1cm/s2.
2 This effect is due to the vertical component of the Coriolis Effect; it becomes apparent when making measurements on a moving platform above a rotating Earth. The Eötvös effect is observed through a decrease in gravity when moving from west to east, and likewise, an increase when moving east to west (Allaby and Allaby 2008).
SummaryAirborne gravity is a method that could be applied across New Zealand in order to collect a well distributed grav-ity dataset. Airborne gravity is a collection process that is unaffected by the topography of the survey area. As such, a regular grid of observations is obtained across areas that may be mountainous, remote, or flat; and across marine areas and the near-shore zone.
The Canterbury test survey was important, as it demon-strated that the modified GNS Science LaCoste and Romberg S80 Air-sea gravimeter is able to be operated as an airborne platform. Operational parameters for the New Zealand environment have been determined: flight lines should be flown at 10 kilometre spacing, at 130 knots, and between 3400 and 5000 feet above ground level.
When combined with existing satellite and terrestrial data, a national airborne gravity data set would support an improved New Zealand Vertical Datum.

New Zealand Surveyor #303 • 2014 31
ReferencesAllaby, A. and Allaby, M. (eds). 2008. A Dictionary of Earth Sciences. 3rd ed. Oxford: Oxford University Press.
Amos, M. 2007. Quasigeoid modelling in New Zealand to modify multiple local vertical datums, PhD Thesis, Curtin University of Technology, Perth, 238pp.
Amos, M. 2010a. New Zealand Vertical Datum 2009. New Zealand Surveyor, 300: 5-16.
Amos, M. 2010b. A geoid based height system for the unification of disparate local vertical datums, FIG Congress Syndey, Australia, 11-16 April 2010.
Amos, M. and Featherstone, W. 2003. Preparations for a new gravimetric geoid model of New Zealand, and some preliminary results. New Zealand Surveyor, 293: 3-14.
Amos, M., Featherstone, W. and Brett, J. 2003. Crossover adjust-ment of New Zealand marine gravity data, and comparisons with satellite altimetry and global geopotential models. Gravity, geoid and space missions, IAG Symposia Series, Jekeli et al. (eds), Oporto, pp266-271.
Amos, M. and Featherstone, W. 2004. A comparison of grid-ding techniques for terrestrial gravity observations in New Zealand. Gravity, Geoid and Space Missions 2004 proceedings CD, Porto, Portugal.
Amos, M. and Featherstone, W. 2009. Unification of New Zealand’s local vertical datums: iterative gravimetric quasigeoid computations. Journal of geodesy, 83(1): 57-68, doi: 10.1007/s00190-008-0232-y.
Andersen, O. B. and Knudsen, P. 2009. DNSC08 mean sea surface and mean dynamic topography models. Journal of Geophysical Research: Oceans (1978–2012), 114(C11).
Barzaghi, R., Borghi, A., Keller, K., Forsberg, R., Giori, I., Loretti, I., Olesen, Olesen., and Stenseng, L. 2009. Airborne gravity tests in the Italian area to improve the geoid model of Italy. Geophysical Prospecting, 57(4): 625-632.
Claessens, S., Hirt, H., Featherstone, W. and Kirby, J. 2009. Computation of a new gravimetric quasigeoid model for New Zealand, Contract report for LINZ, Curtin University of Technology, Perth, 39pp.
DiFrancesco D., 2010. The Gravity Quest. In: Lane, R. (ed), Airborne Gravity 2010 – Abstracts from the ASEG-PESA Airborne Gravity 2010 Workshop, Geoscience Australia & Geological Survey of New South Wales, Geoscience Australia Record 2010/23 & GSNSW File GS2010/0457, pp44-48.
Forsberg, R., Olesen, A., Bastos, L., Gidskehaug, A., Meyer, U. and Timmen, L. 2000a. Airborne geoid determination. Earth Planets and Space, 52(10): 863-866.
Forsberg, R., Olesen, A. V., & Keller, K. 2000b. Airborne gravity survey of the North Greenland continental shelf. Gravity, Geoid and Geodynamics: 235-240. Vol. 54 Issue 4.
Forsberg, R., Olesen, A. V., Einarsson, I., Manandhar, N. and Shreshta, K. 2014. Geoid of Nepal from airborne gravity survey. Earth on the Edge: Science for a Sustainable Planet. Melbourne, Australia: Springer. (International Association of Geodesy Symposia: 139: 521-527).
Forsyth, P., Barrell, D. and Jongens, R. (compilers). 2008. Geology of the Christchurch area. Institute of Geological & Nuclear Science 1:250 000 geological map 16. 1 sheet + 67p. Lower Hutt, New Zealand. GNS Science.
Hwang, C., Hsiao, Y. S., Shih, H. C., Yang, M., Chen, K. H., Forsberg, R. and Olesen, A. V. 2007. Geodetic and geophysical results from a Taiwan airborne gravity survey: Data reduction and accuracy assessment. Journal of Geophysical Research: Solid Earth (1978–2012), 112 (B4 B004220).
LaCoste and Romberg 1998. Lacoste and Romberg Model «S» air-sea dynamic gravity meter with «AIRSEA 3.0» digital control. Instruction Manual. LaCoste and Romberg, LLC.
LINZ 2009. Standard for the New Zealand Vertical Datum. LINZS25004.
LINZ 2010. Rules for Cadastral Survey 2010. LINZS65003.
LINZ 2011. Airborne gravity for an improved vertical datum: options for the development of New Zealand’s vertical datum. Available from: www.linz.govt.nz/geodetic/standards-publications/technical-reports.
Novák, P., Kern, M., Schwarz, K. P., Sideris, M. G., Heck, B., Ferguson, S, ... and Wei, M. 2003. On geoid determination from airborne gravity. Journal of Geodesy, 76(9-10): 510-522.
Olesen, A. and Forsberg R. 2007. Airborne scalar gravime-try for regional gravity field mapping and geoid determina-tion. Proceedings, Gravity Field of the Earth–1st Meeting of the International Gravity Field Service. Vol. 73, No. 18: 277-282.
Wang, Y. M., Preaux, S., Diehl, T., Childers, V., Roman, D. and Smith, D. 2013. Accuracy assessment of test flights using the Turnkey Airborne Gravity System over Alabama in 2008. Journal of Geodetic Science, 3(2): 136-142.
Wessel, P. and Watts, A. B. 1988. On the accuracy of marine gravity measurements. Journal of Geophysical Research: Solid Earth (1978–2012).93(B1): 393-413.
32 New Zealand Surveyor #303 • 2014
Photogrammetry, Remote Sensing and the Surveying DisciplinePASCAL SIRGUEYNational School of Surveying/ Te Kura Kairūri, University of Otago, PO Box 56, Dunedin, New Zealand. [email protected]
Abstract For over a century, photogrammetry has been at the very heart of the surveying discipline and map-making process. In New Zealand, aerial surveys have been used to create topographic maps since the late 1920s. As imaging capabilities have dramatically improved through the development of new sen-sor technologies (e.g., digital sensors), and satellite platforms now enable observations to be made from space with unprecedented resolution, the means to obtain topographic information over large areas have evolved. New techniques, such as LiDAR, have gained a large momentum over the last decade. However, the principles of photogrammetry, which remain relevant, have also evolved. The Multiray photogram-metric technique now allows dense and accurate point clouds to be derived from multiple image overlaps and is competitive with LiDAR products. New platforms such as Unmanned Aerial Vehicles (UAV) offer new opportunities for surveyors, as many can now engage in aerial mapping without the logistical bur-den of aeroplane operations. Furthermore, imaging of the earth’s surface from space via optical or radar technologies, offers spatial resolutions that now approach the requirements of some surveying tasks. In this context, the photogrammetric method has greatly evolved, becoming part of the wider discipline of remote sensing, placing it at the centre of the surveying profession. This paper offers a brief overview on how the discipline of remote sensing has gone hand in hand with land surveying, and what it can offer in the future to this profession.
Keywords Photogrammetry, remote sensing, aerial surveys, aerial mapping, spatial imagery.
“Non Tanquam Pictor, Sed Tanquam Mathematicus” Not as an Artist but as a Mathematician
INTRODUCTIONWhile on a trip down the Danube Sir Henry Wotton (1568-1639) met Johannes Kepler (1571-1630) in Linz in 1620 (Wotton 1672: 298-302). Kepler was a mathematics teacher in what is today the capital of Upper Austria. As Wotton was impressed by a realistic drawing of a landscape found in Kepler’s study, Kepler explained how he completed the drawing himself “non tanquam pictor, sed tanquam math-ematicus” (not as an artist but as a mathematician). In a subsequent letter to Lord Francis Bacon (1561-1626), Wotton then provided one of the earliest descriptions of Kepler’s camera obscura (Kepler 1604: 297), a clever design of a portable camera (Figure 1) which allowed the natural appearance of landscapes to be reproduced faithfully and
objectively (Wotton 1672: 300). In his description, Wotton stressed immediately the opportunities offered by this technique to Chorography.1
“This2 I have described to your Lordship, because I think there might be good use made of it for Chorography: for otherwise, to make
Landskips by it were illiberal, though surely no Painter can do them so precisely.”
(Wotton 1672: 300).
In doing so, Wotton may have been among the first to perceive the potential of remote sensing techniques in the surveying sciences.
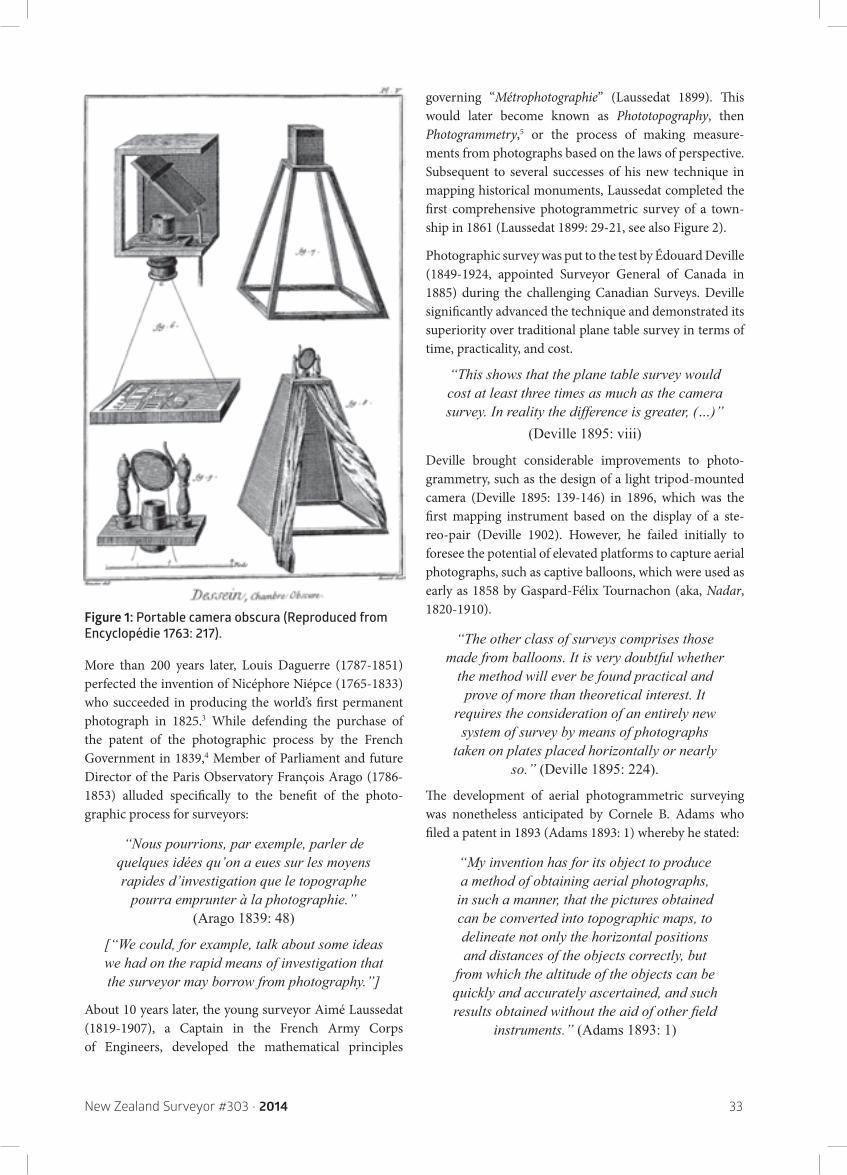
New Zealand Surveyor #303 • 2014 33
Figure 1: Portable camera obscura (Reproduced from Encyclopédie 1763: 217).
More than 200 years later, Louis Daguerre (1787-1851) perfected the invention of Nicéphore Niépce (1765-1833) who succeeded in producing the world’s first permanent photograph in 1825.3 While defending the purchase of the patent of the photographic process by the French Government in 1839,4 Member of Parliament and future Director of the Paris Observatory François Arago (1786-1853) alluded specifically to the benefit of the photo-graphic process for surveyors:
“Nous pourrions, par exemple, parler de quelques idées qu’on a eues sur les moyens rapides d’investigation que le topographe
pourra emprunter à la photographie.” (Arago 1839: 48)
[“We could, for example, talk about some ideas we had on the rapid means of investigation that the surveyor may borrow from photography.”]
About 10 years later, the young surveyor Aimé Laussedat (1819-1907), a Captain in the French Army Corps of Engineers, developed the mathematical principles
governing “Métrophotographie” (Laussedat 1899). This would later become known as Phototopography, then Photogrammetry,5 or the process of making measure-ments from photographs based on the laws of perspective. Subsequent to several successes of his new technique in mapping historical monuments, Laussedat completed the first comprehensive photogrammetric survey of a town-ship in 1861 (Laussedat 1899: 29-21, see also Figure 2).
Photographic survey was put to the test by Édouard Deville (1849-1924, appointed Surveyor General of Canada in 1885) during the challenging Canadian Surveys. Deville significantly advanced the technique and demonstrated its superiority over traditional plane table survey in terms of time, practicality, and cost.
“This shows that the plane table survey would cost at least three times as much as the camera survey. In reality the difference is greater, (…)”
(Deville 1895: viii)
Deville brought considerable improvements to photo-grammetry, such as the design of a light tripod-mounted camera (Deville 1895: 139-146) in 1896, which was the first mapping instrument based on the display of a ste-reo-pair (Deville 1902). However, he failed initially to foresee the potential of elevated platforms to capture aerial photographs, such as captive balloons, which were used as early as 1858 by Gaspard-Félix Tournachon (aka, Nadar, 1820-1910).
“The other class of surveys comprises those made from balloons. It is very doubtful whether
the method will ever be found practical and prove of more than theoretical interest. It
requires the consideration of an entirely new system of survey by means of photographs
taken on plates placed horizontally or nearly so.” (Deville 1895: 224).
The development of aerial photogrammetric surveying was nonetheless anticipated by Cornele B. Adams who filed a patent in 1893 (Adams 1893: 1) whereby he stated:
“My invention has for its object to produce a method of obtaining aerial photographs,
in such a manner, that the pictures obtained can be converted into topographic maps, to delineate not only the horizontal positions and distances of the objects correctly, but
from which the altitude of the objects can be quickly and accurately ascertained, and such results obtained without the aid of other field
instruments.” (Adams 1893: 1)
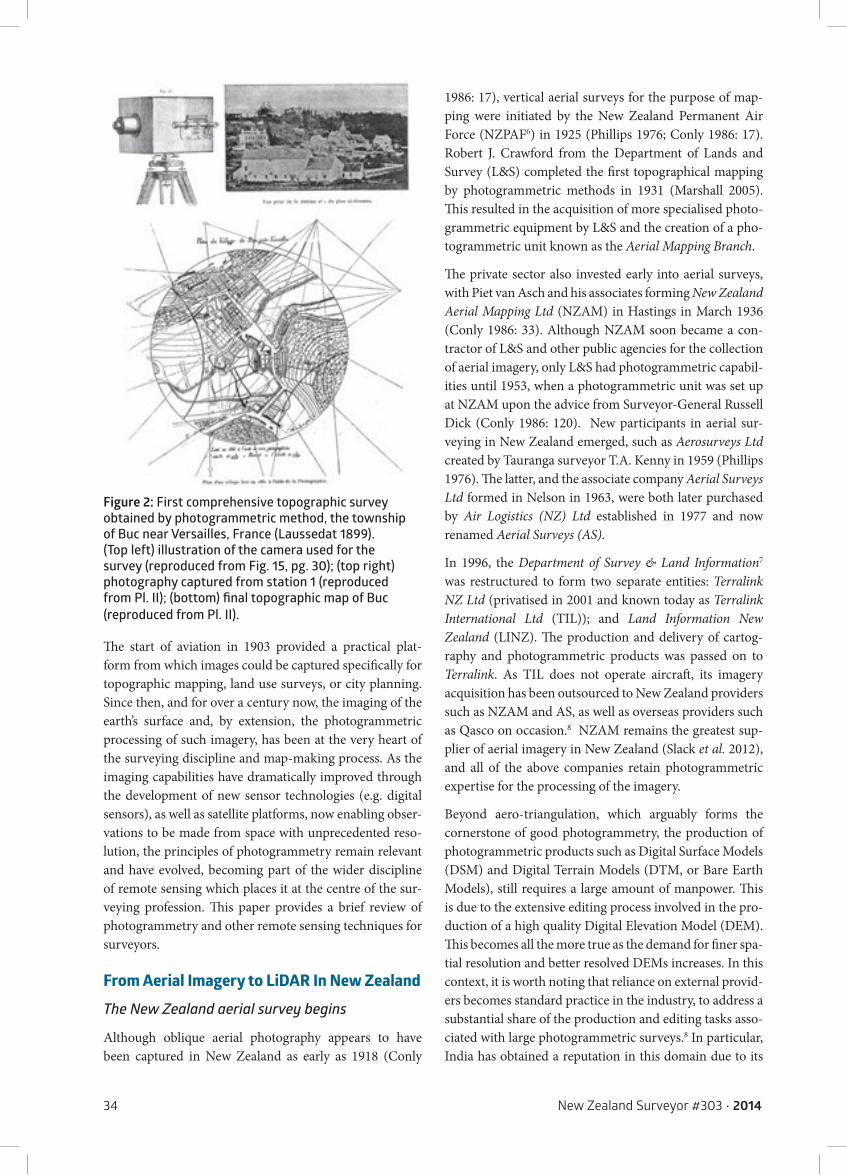
34 New Zealand Surveyor #303 • 2014
Figure 2: First comprehensive topographic survey obtained by photogrammetric method, the township of Buc near Versailles, France (Laussedat 1899). (Top left) illustration of the camera used for the survey (reproduced from Fig. 15, pg. 30); (top right) photography captured from station 1 (reproduced from Pl. II); (bottom) final topographic map of Buc (reproduced from Pl. II).
The start of aviation in 1903 provided a practical plat-form from which images could be captured specifically for topographic mapping, land use surveys, or city planning. Since then, and for over a century now, the imaging of the earth’s surface and, by extension, the photogrammetric processing of such imagery, has been at the very heart of the surveying discipline and map-making process. As the imaging capabilities have dramatically improved through the development of new sensor technologies (e.g. digital sensors), as well as satellite platforms, now enabling obser-vations to be made from space with unprecedented reso-lution, the principles of photogrammetry remain relevant and have evolved, becoming part of the wider discipline of remote sensing which places it at the centre of the sur-veying profession. This paper provides a brief review of photogrammetry and other remote sensing techniques for surveyors.
From Aerial Imagery to LiDAR In New ZealandThe New Zealand aerial survey begins
Although oblique aerial photography appears to have been captured in New Zealand as early as 1918 (Conly
1986: 17), vertical aerial surveys for the purpose of map-ping were initiated by the New Zealand Permanent Air Force (NZPAF6) in 1925 (Phillips 1976; Conly 1986: 17). Robert J. Crawford from the Department of Lands and Survey (L&S) completed the first topographical mapping by photogrammetric methods in 1931 (Marshall 2005). This resulted in the acquisition of more specialised photo-grammetric equipment by L&S and the creation of a pho-togrammetric unit known as the Aerial Mapping Branch.
The private sector also invested early into aerial surveys, with Piet van Asch and his associates forming New Zealand Aerial Mapping Ltd (NZAM) in Hastings in March 1936 (Conly 1986: 33). Although NZAM soon became a con-tractor of L&S and other public agencies for the collection of aerial imagery, only L&S had photogrammetric capabil-ities until 1953, when a photogrammetric unit was set up at NZAM upon the advice from Surveyor-General Russell Dick (Conly 1986: 120). New participants in aerial sur-veying in New Zealand emerged, such as Aerosurveys Ltd created by Tauranga surveyor T.A. Kenny in 1959 (Phillips 1976). The latter, and the associate company Aerial Surveys Ltd formed in Nelson in 1963, were both later purchased by Air Logistics (NZ) Ltd established in 1977 and now renamed Aerial Surveys (AS).
In 1996, the Department of Survey & Land Information7 was restructured to form two separate entities: Terralink NZ Ltd (privatised in 2001 and known today as Terralink International Ltd (TIL)); and Land Information New Zealand (LINZ). The production and delivery of cartog-raphy and photogrammetric products was passed on to Terralink. As TIL does not operate aircraft, its imagery acquisition has been outsourced to New Zealand providers such as NZAM and AS, as well as overseas providers such as Qasco on occasion.8 NZAM remains the greatest sup-plier of aerial imagery in New Zealand (Slack et al. 2012), and all of the above companies retain photogrammetric expertise for the processing of the imagery.
Beyond aero-triangulation, which arguably forms the cornerstone of good photogrammetry, the production of photogrammetric products such as Digital Surface Models (DSM) and Digital Terrain Models (DTM, or Bare Earth Models), still requires a large amount of manpower. This is due to the extensive editing process involved in the pro-duction of a high quality Digital Elevation Model (DEM). This becomes all the more true as the demand for finer spa-tial resolution and better resolved DEMs increases. In this context, it is worth noting that reliance on external provid-ers becomes standard practice in the industry, to address a substantial share of the production and editing tasks asso-ciated with large photogrammetric surveys.8 In particular, India has obtained a reputation in this domain due to its
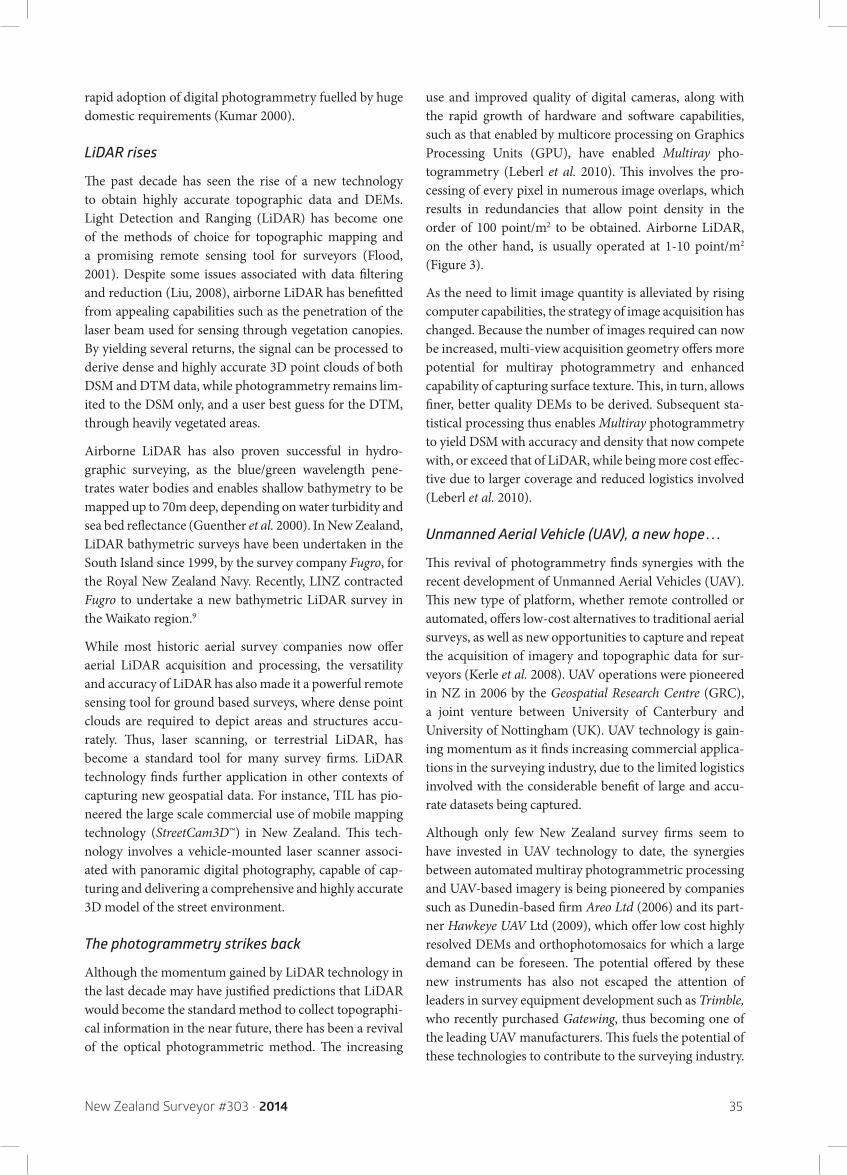
New Zealand Surveyor #303 • 2014 35
rapid adoption of digital photogrammetry fuelled by huge domestic requirements (Kumar 2000).
LiDAR rises
The past decade has seen the rise of a new technology to obtain highly accurate topographic data and DEMs. Light Detection and Ranging (LiDAR) has become one of the methods of choice for topographic mapping and a promising remote sensing tool for surveyors (Flood, 2001). Despite some issues associated with data filtering and reduction (Liu, 2008), airborne LiDAR has benefitted from appealing capabilities such as the penetration of the laser beam used for sensing through vegetation canopies. By yielding several returns, the signal can be processed to derive dense and highly accurate 3D point clouds of both DSM and DTM data, while photogrammetry remains lim-ited to the DSM only, and a user best guess for the DTM, through heavily vegetated areas.
Airborne LiDAR has also proven successful in hydro-graphic surveying, as the blue/green wavelength pene-trates water bodies and enables shallow bathymetry to be mapped up to 70m deep, depending on water turbidity and sea bed reflectance (Guenther et al. 2000). In New Zealand, LiDAR bathymetric surveys have been undertaken in the South Island since 1999, by the survey company Fugro, for the Royal New Zealand Navy. Recently, LINZ contracted Fugro to undertake a new bathymetric LiDAR survey in the Waikato region.9
While most historic aerial survey companies now offer aerial LiDAR acquisition and processing, the versatility and accuracy of LiDAR has also made it a powerful remote sensing tool for ground based surveys, where dense point clouds are required to depict areas and structures accu-rately. Thus, laser scanning, or terrestrial LiDAR, has become a standard tool for many survey firms. LiDAR technology finds further application in other contexts of capturing new geospatial data. For instance, TIL has pio-neered the large scale commercial use of mobile mapping technology (StreetCam3D™) in New Zealand. This tech-nology involves a vehicle-mounted laser scanner associ-ated with panoramic digital photography, capable of cap-turing and delivering a comprehensive and highly accurate 3D model of the street environment.
The photogrammetry strikes back
Although the momentum gained by LiDAR technology in the last decade may have justified predictions that LiDAR would become the standard method to collect topographi-cal information in the near future, there has been a revival of the optical photogrammetric method. The increasing
use and improved quality of digital cameras, along with the rapid growth of hardware and software capabilities, such as that enabled by multicore processing on Graphics Processing Units (GPU), have enabled Multiray pho-togrammetry (Leberl et al. 2010). This involves the pro-cessing of every pixel in numerous image overlaps, which results in redundancies that allow point density in the order of 100 point/m2 to be obtained. Airborne LiDAR, on the other hand, is usually operated at 1-10 point/m2 (Figure 3).
As the need to limit image quantity is alleviated by rising computer capabilities, the strategy of image acquisition has changed. Because the number of images required can now be increased, multi-view acquisition geometry offers more potential for multiray photogrammetry and enhanced capability of capturing surface texture. This, in turn, allows finer, better quality DEMs to be derived. Subsequent sta-tistical processing thus enables Multiray photogrammetry to yield DSM with accuracy and density that now compete with, or exceed that of LiDAR, while being more cost effec-tive due to larger coverage and reduced logistics involved (Leberl et al. 2010).
Unmanned Aerial Vehicle (UAV), a new hope . . .
This revival of photogrammetry finds synergies with the recent development of Unmanned Aerial Vehicles (UAV). This new type of platform, whether remote controlled or automated, offers low-cost alternatives to traditional aerial surveys, as well as new opportunities to capture and repeat the acquisition of imagery and topographic data for sur-veyors (Kerle et al. 2008). UAV operations were pioneered in NZ in 2006 by the Geospatial Research Centre (GRC), a joint venture between University of Canterbury and University of Nottingham (UK). UAV technology is gain-ing momentum as it finds increasing commercial applica-tions in the surveying industry, due to the limited logistics involved with the considerable benefit of large and accu-rate datasets being captured.
Although only few New Zealand survey firms seem to have invested in UAV technology to date, the synergies between automated multiray photogrammetric processing and UAV-based imagery is being pioneered by companies such as Dunedin-based firm Areo Ltd (2006) and its part-ner Hawkeye UAV Ltd (2009), which offer low cost highly resolved DEMs and orthophotomosaics for which a large demand can be foreseen. The potential offered by these new instruments has also not escaped the attention of leaders in survey equipment development such as Trimble, who recently purchased Gatewing, thus becoming one of the leading UAV manufacturers. This fuels the potential of these technologies to contribute to the surveying industry.
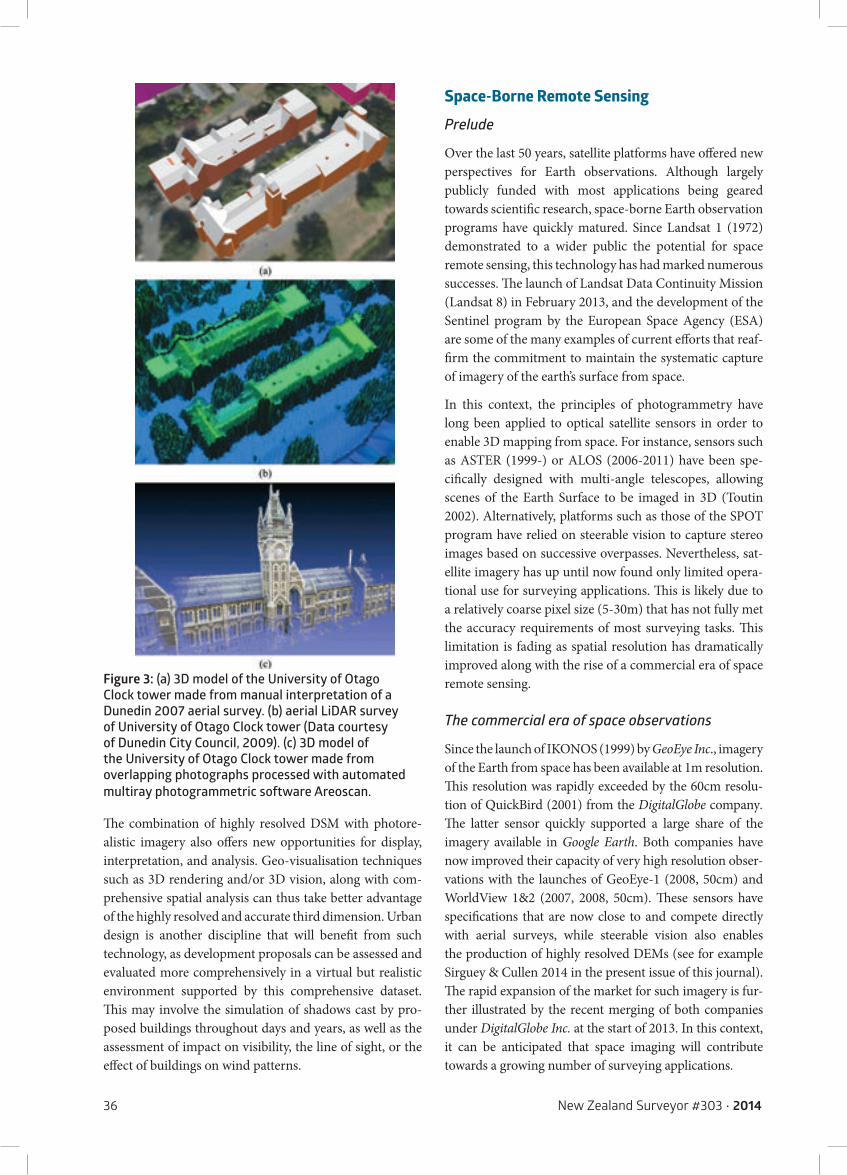
36 New Zealand Surveyor #303 • 2014
Figure 3: (a) 3D model of the University of Otago Clock tower made from manual interpretation of a Dunedin 2007 aerial survey. (b) aerial LiDAR survey of University of Otago Clock tower (Data courtesy of Dunedin City Council, 2009). (c) 3D model of the University of Otago Clock tower made from overlapping photographs processed with automated multiray photogrammetric software Areoscan.
The combination of highly resolved DSM with photore-alistic imagery also offers new opportunities for display, interpretation, and analysis. Geo-visualisation techniques such as 3D rendering and/or 3D vision, along with com-prehensive spatial analysis can thus take better advantage of the highly resolved and accurate third dimension. Urban design is another discipline that will benefit from such technology, as development proposals can be assessed and evaluated more comprehensively in a virtual but realistic environment supported by this comprehensive dataset. This may involve the simulation of shadows cast by pro-posed buildings throughout days and years, as well as the assessment of impact on visibility, the line of sight, or the effect of buildings on wind patterns.
Space-Borne Remote SensingPrelude
Over the last 50 years, satellite platforms have offered new perspectives for Earth observations. Although largely publicly funded with most applications being geared towards scientific research, space-borne Earth observation programs have quickly matured. Since Landsat 1 (1972) demonstrated to a wider public the potential for space remote sensing, this technology has had marked numerous successes. The launch of Landsat Data Continuity Mission (Landsat 8) in February 2013, and the development of the Sentinel program by the European Space Agency (ESA) are some of the many examples of current efforts that reaf-firm the commitment to maintain the systematic capture of imagery of the earth’s surface from space.
In this context, the principles of photogrammetry have long been applied to optical satellite sensors in order to enable 3D mapping from space. For instance, sensors such as ASTER (1999-) or ALOS (2006-2011) have been spe-cifically designed with multi-angle telescopes, allowing scenes of the Earth Surface to be imaged in 3D (Toutin 2002). Alternatively, platforms such as those of the SPOT program have relied on steerable vision to capture stereo images based on successive overpasses. Nevertheless, sat-ellite imagery has up until now found only limited opera-tional use for surveying applications. This is likely due to a relatively coarse pixel size (5-30m) that has not fully met the accuracy requirements of most surveying tasks. This limitation is fading as spatial resolution has dramatically improved along with the rise of a commercial era of space remote sensing.
The commercial era of space observations
Since the launch of IKONOS (1999) by GeoEye Inc., imagery of the Earth from space has been available at 1m resolution. This resolution was rapidly exceeded by the 60cm resolu-tion of QuickBird (2001) from the DigitalGlobe company. The latter sensor quickly supported a large share of the imagery available in Google Earth. Both companies have now improved their capacity of very high resolution obser-vations with the launches of GeoEye-1 (2008, 50cm) and WorldView 1&2 (2007, 2008, 50cm). These sensors have specifications that are now close to and compete directly with aerial surveys, while steerable vision also enables the production of highly resolved DEMs (see for example Sirguey & Cullen 2014 in the present issue of this journal). The rapid expansion of the market for such imagery is fur-ther illustrated by the recent merging of both companies under DigitalGlobe Inc. at the start of 2013. In this context, it can be anticipated that space imaging will contribute towards a growing number of surveying applications.
New Zealand Surveyor #303 • 2014 37
More sensors dedicated to very high resolution with metre to sub-metre resolution are also available, such as the KompSAT (2006, 1m). More recently, the Pleiades I&II (2011 & 2012, 70cm) developed by the French space agency CNES have been designed specifically to support stereo imaging of large areas, thus opening a new era for updating large scale maps without reliance on aerial sur-veys (Cantou et al. 2006).
Alternative remote sensing techniques for surveyors
The principles of photogrammetry have been general-ised to other forms of space imagery, including that from active systems such as side looking RAdio Detection and Ranging (RADAR). Stereo imaging from Synthetic Aperture Radar (SAR) has thus been implemented suc-cessfully on-board the Space Shuttle in 2000 to yield the global and widely used SRTM DEM at 30-90m resolution (Farr et al. 2007). This process is known as radargrammetry and enables a new revolution for topographic mapping to be foreseen. This is evidenced by the dual satellites mission TerraSAR-X/TanDEM-X from the German Aerospace Center (DLR), which will deliver a global DEM at about 10m spatial resolution and less than 5m relative vertical accuracy (Wessel et al. 2013).
Radar remote sensing has also permitted the detec-tion and mapping of ground and structure motion via Interferometric SAR (InSAR) techniques. For example, centimetre magnitude coseismic displacements of the 2010 Darfield earthquake could be mapped in 3D (Hu et al. 2012). Given the magnitude of displacements capable of being measured from space, it is again foreseeable that an increasing number of surveying firms will find commer-cial opportunities in this technology. Furthermore, recent advances in image processing have generalized the con-cept of image interference to optical imagery, so that very small ground displacements, even at sub-pixel level, can now be measured from high resolution sensors (Leprince et al. 2007; Beavan et al. 2012).
Finally, the wider field of geodesy is also being addressed by space observation. For example, the GRACE (2002) and GOCE (2009) missions have allowed unprecedented observations of the Earth’s gravity field. This has yielded a much improved representation of the Earth’s Geoid, and in turn a better accuracy for elevation measurements made by surveyors in the field.
Coordination of imagery in New Zealand
With the growing use and need of imagery, a number of initiatives have been taken in New Zealand to coordinate
the capture, repository, and delivery of imagery products, including LiDAR datasets. While both historical actors TIL and NZAM maintain and distribute their own library of aerial photos, several governmental initiatives deserve to be mentioned. First, the Ministry for the Environment has negotiated coverage of New Zealand with SPOT5 imagery in the context of the Land Use and Carbon Analysis System (LUCAS) to measure and monitor the carbon stocks of New Zealand’s forests and soils. Second, the club-funded KiwImage project initiated in 2007 by the NZ Fire Service is providing a low-cost near complete coverage of very high resolution satellite data (QuickBird) for New Zealand. The imagery acquired on an All of Government license is now managed and distributed by LINZ. Finally, the New Zealand Geospatial Office at LINZ is seeking to inventory all LiDAR data acquired in New Zealand. All these efforts have been consolidated into the National Imagery Coordination Programme developed by LINZ and promoting full open licensing of imagery. As the total expenditure on imagery acquisition over the past two years is close to NZ$6M, these initiatives further demon-strate the growing commitment of New Zealand into geo-spatial data and technologies (Slack et al. 2012).
ConclusionRemote sensing techniques have been central to the sur-veying disciplines for over a century. Today, traditional aerial photogrammetry is only one of the multiple means for surveyors to acquire topographical data. LiDAR and radargrammetry, from terrestrial to space-borne systems have provided new alternatives for high quality data cap-ture. Nevertheless, the photogrammetric method is still relevant and current as low cost alternatives to aerial mapping become available with the rise of UAVs. While a number of survey firms have invested in laser scan-ner equipment, it can be anticipated that UAV will also become a tool of choice for surveyors. Finally, one can foresee an increasing reliance on space imagery as resolu-tion and accuracy approaches the needs of more surveying tasks. This will require some degree of adaptation given the highly specific set of skills and resources required to process these data.
AcknowledgmentsThe author wishes to thank John Kotrotsos from Terralink International Ltd., and Hugh Parker from Fugro LADS Corporation Pty, Ltd. for their useful insights. Mick Strack, Tony Moore, and Bruce McFadgen are also thanked for editing this paper. Surveyor General Don Grant and an anonymous referee are thanked for their review of the manuscript and their constructive comments.

38 New Zealand Surveyor #303 • 2014
Notes1 Chorography: the systematic description and mapping of particular regions (Oxford Dictionaries). In the 17th Century, Chorography is associated with topography, cartography, and map-making.2 This refers to the description of the portable camera obscura.3 Nicéphore Niépce invented the Heliographic process, a precur-sor to the photographic process.4 The invention would then be declared a “Gift free to the World” (Arago 1839: 52).5 The name was supposedly coined by geographical explorer Dr. Otto Kersten in 1867 from discussions with Albrecht Meydenbauer, the German “father” of photogrammetry (Albertz 2007).6 NZPAF became Royal New Zealand Air Force (RNZAF) in 1934.
ReferencesAdams, C. B. 1893. Method of Photogrammetry. Patent No. 510,758, December 12, 1893, 6pp. Albertz, J. 2007. A Look Back: 140 Years of “Photogrammetry”. Some remarks on the history of photogrammetry. Photogrammetric Engineering and Remote Sensing. 73(5):504-506.Arago, F. 1839. Rapport de M. Arago sur le daguerréotype, lu à la séance de la Chambre des députés, le 3 juillet 1839, et à l’Académie des sciences, séance du 19 août. Bachelier, Paris. Scanned version available from http://catalogue.bnf.fr/ark:/12148/cb300243833.Beavan, J., Lee, J., Levick, S. and Jones, K. 2012. Ground dis-placements and dilatational strains caused by the 2010-2011 Canterbury earthquakes. GNS Science Consultancy Report 2012/67, 59pp.Cantou, J.-P., Maillet, G., Flamanc, D. and Buissart, H. 2006. Preparing the use of PLEIADES images for mapping pur-poses: preliminary assessments at IGN-France. Internat. Archives of Photogrammetry and Remote Sensing, Ankara, Turkey, 36.Conly, G. 1986. Piet’s Eye in the Sky: the Story of NZ Aerial Mapping Ltd. Grantham House Publishing, Wellington, New Zealand, 188pp.Deville, E. 1895. Photographic Surveying, Including the Elements of Descriptive Geometry and Perspective. Government Printing Office, Ottawa, 232pp.Deville, E. 1902. On the use of Wheatstone Stereoscope in Photographing Surveying, in Proceedings and Transactions of the Royal Society of Canada. Serie 2, Vol. 8, Section III: 63-69.Encyclopédie 1763. Recueil de planches. In: Diderot, D. and d’Alembert, J.-B. (Eds), Encyclopédie, ou dictionnaire raisonné des sciences, des arts et des métiers (Encyclopaedia or a Systematic Dictionary of the Sciences, Arts and Crafts). Vol. 2B, Briasson, David, Le Breton and Durand (Publishers), Paris.Farr, T. G. and 17 others. 2007. The Shuttle Radar Topography Mission. Review of Geophysics, AGU, 45(2):RG2004-.Flood, M. 2001. Laser altimetry: From science to commercial LiDAR mapping. Photogrammetric Engineering and Remote Sensing, 67(11):1209-1217.Guenther, G. C., Brooks, M. W. and La Rocque, P. E. 2000. New Capabilities of the “SHOALS” Airborne Lidar Bathymeter. Remote Sensing of Environment, 73(2):247-255.Hu, J., Li, Z. W., Ding, X. L., Zhu, J. J., Zhang, L. and Sun, Q. 2012. 3D coseismic displacement of 2010 Darfield, New Zealand earthquake estimated from multi-aperture InSAR and D-InSAR measurements. Journal of Geodesy, 86(11): 1029-1041.Kepler, J. 1604. Ad Vitellionem Paralipomena, Quibus Astronomiæ Pars Optica Traditvr. Francofvrti, 449pp. Scanned version available from the Bavarian State Library at http://daten.digitale-sammlun-gen.de/~db/bsb00007828/images/.
Kerle, N., Heuel, S. and Pfeifer, N. 2008. Real-time data collection and information generation using airborne sensors. In: Zlatanova S and Li, J (Eds), Geospatial information Technology for Emergency Response. Taylor & Francis, London, UK, pp43-74.Kumar, G. S. 2000. Geo Information: the emerging scenario in India. International Archives of Photogrammetry and Remote Sensing, Vol. XXXIII, Part B6: 188-194.Leprince, S., Barbot, S., Ayoub, F. and Avouac, J.-P. 2007. Automatic and precise orthorectification, coregistration, and sub-pixel correlation of satellite images, application to ground defor-mation measurements. IEEE Trans. on Geoscience and Remote Sensing, 45(6):1529-1558.Laussedat, A. 1899. La métrophotographie. Bibliothèque Photographique, Gauthier-Villars, Paris. 52pp.Leberl, F., Irschara, A., Pock, T., Melxner, P., Gruber, M., Scholz, S. & Wlechert, A. 2010. Point Clouds: Lidar versus 3D Vision. Photogrammetric Engineering & Remote Sensing, 10:1123-1134.Liu, X. 2008. Airborne LiDAR for DEM generation: some critical issues. Progress in Physical Geography, 32(1):31-49, doi:10.1177/0309133308089496.Marshall, B. 2005. From Sextants to Satellites: A Cartographic Time Line for New Zealand. New Zealand Map Society Journal, 18: 1-136.Phillips, T. D. 1976. A History of Aerial Survey Photography in New Zealand. Journal of the Aviation Historical Society of New Zealand, 19(2):89-95.Slack, A., Dustow, K., Nana, G., Heaslewood, N., Lythe, M., Ladd, M. and Harding, A. 2012. I-SEC: All-of-Government Imagery Stock-take, Economic Analysis, and Coordination Models, Business and Economic Research Limited (BERL). Report prepared for LINZ, 81pp.Sirguey, P. and Cullen, N. J. 2014. A very high resolution DEM of Kilimanjaro via photogrammetry of GeoEye-1 images (KILISoSDEM2012). NZ Surveyor, 303, In Press. Toutin, T. 2002. Three-Dimensional topographic mapping with ASTER stereo data in rugged topography. IEEE Transactions on Geoscience and Remote Sensing, 40(10):2241-2247.Wotton, H. 1672. Reliquiæ Wottonianæ, or, a collection of lives, letters, poems. 3rd edition, London, 589pp.Wessel, B. and 12 others. 2011. TanDEM-X Ground Segment DEM products specification document, Deutsches Zentrum für Luft- und Raumfahrt (DLR), Doc No TD-GS-PS-0021, 25pp.
7 Formed out of a restructure of L&S in 1987.8 Personal communication from John Kotrotsos, Imagery Manager, Terralink International Ltd.9 Personal communication from Hugh Parker, Hydrographic Surveyor, Fugro LADS Corporation Pty, Ltd.
Pascal Sirguey is a Senior Lecturer at the National School of Surveying, University of Otago from which he graduated with a PhD in 2010. He also holds a MSc in Mechanical Engineering from the Ecole Centrale de Lyon in France. He worked as an chief project engineer until joining the School in 2006 for his doctoral research that characterized the con-tribution of snowmelt in the upper Waitaki catchment using remote sensing. He now teaches and conducts research on remote sensing and photogrammetry, with a specific focus on applications to cryospheric environments.
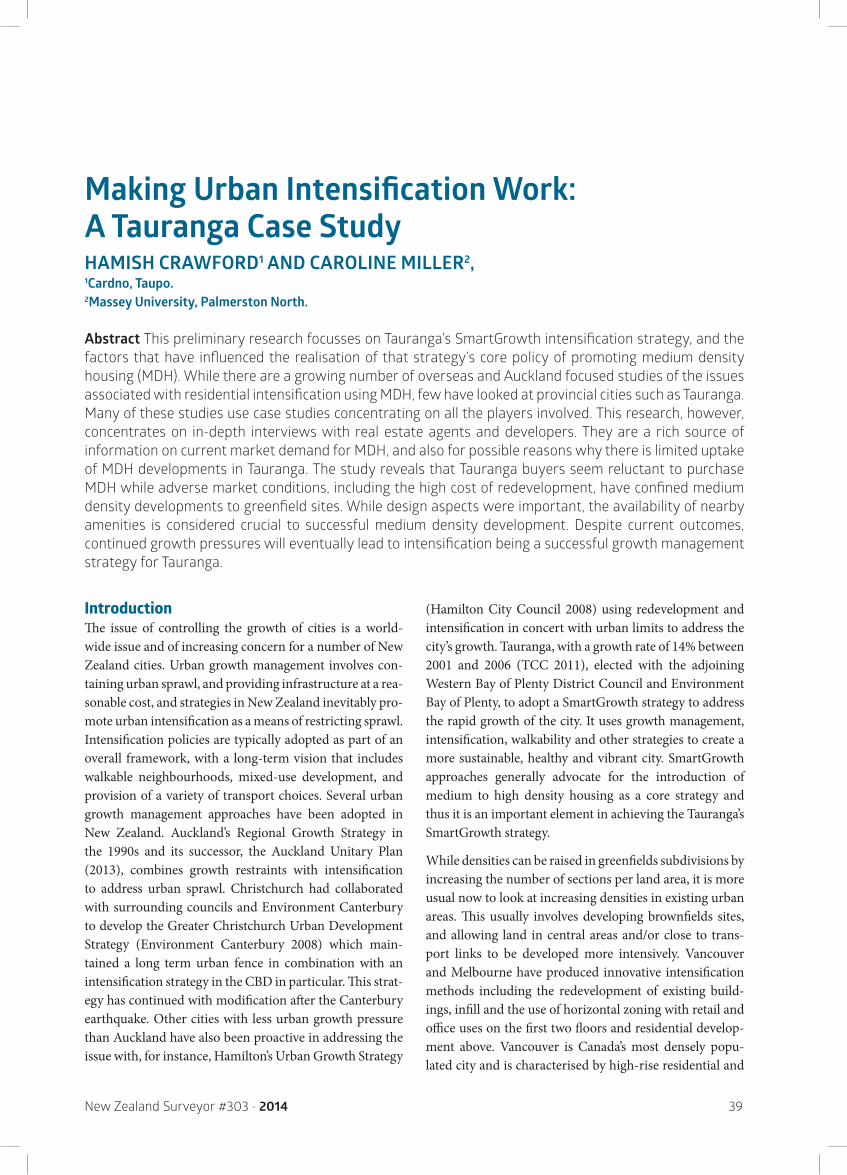
New Zealand Surveyor #303 • 2014 39
Making Urban Intensification Work: A Tauranga Case Study HAMISH CRAWFORD1 AND CAROLINE MILLER2, 1Cardno, Taupo. 2Massey University, Palmerston North.
Abstract This preliminary research focusses on Tauranga’s SmartGrowth intensification strategy, and the factors that have influenced the realisation of that strategy’s core policy of promoting medium density housing (MDH). While there are a growing number of overseas and Auckland focused studies of the issues associated with residential intensification using MDH, few have looked at provincial cities such as Tauranga. Many of these studies use case studies concentrating on all the players involved. This research, however, concentrates on in-depth interviews with real estate agents and developers. They are a rich source of information on current market demand for MDH, and also for possible reasons why there is limited uptake of MDH developments in Tauranga. The study reveals that Tauranga buyers seem reluctant to purchase MDH while adverse market conditions, including the high cost of redevelopment, have confined medium density developments to greenfield sites. While design aspects were important, the availability of nearby amenities is considered crucial to successful medium density development. Despite current outcomes, continued growth pressures will eventually lead to intensification being a successful growth management strategy for Tauranga.
IntroductionThe issue of controlling the growth of cities is a world-wide issue and of increasing concern for a number of New Zealand cities. Urban growth management involves con-taining urban sprawl, and providing infrastructure at a rea-sonable cost, and strategies in New Zealand inevitably pro-mote urban intensification as a means of restricting sprawl. Intensification policies are typically adopted as part of an overall framework, with a long-term vision that includes walkable neighbourhoods, mixed-use development, and provision of a variety of transport choices. Several urban growth management approaches have been adopted in New Zealand. Auckland’s Regional Growth Strategy in the 1990s and its successor, the Auckland Unitary Plan (2013), combines growth restraints with intensification to address urban sprawl. Christchurch had collaborated with surrounding councils and Environment Canterbury to develop the Greater Christchurch Urban Development Strategy (Environment Canterbury 2008) which main-tained a long term urban fence in combination with an intensification strategy in the CBD in particular. This strat-egy has continued with modification after the Canterbury earthquake. Other cities with less urban growth pressure than Auckland have also been proactive in addressing the issue with, for instance, Hamilton’s Urban Growth Strategy
(Hamilton City Council 2008) using redevelopment and intensification in concert with urban limits to address the city’s growth. Tauranga, with a growth rate of 14% between 2001 and 2006 (TCC 2011), elected with the adjoining Western Bay of Plenty District Council and Environment Bay of Plenty, to adopt a SmartGrowth strategy to address the rapid growth of the city. It uses growth management, intensification, walkability and other strategies to create a more sustainable, healthy and vibrant city. SmartGrowth approaches generally advocate for the introduction of medium to high density housing as a core strategy and thus it is an important element in achieving the Tauranga’s SmartGrowth strategy.
While densities can be raised in greenfields subdivisions by increasing the number of sections per land area, it is more usual now to look at increasing densities in existing urban areas. This usually involves developing brownfields sites, and allowing land in central areas and/or close to trans-port links to be developed more intensively. Vancouver and Melbourne have produced innovative intensification methods including the redevelopment of existing build-ings, infill and the use of horizontal zoning with retail and office uses on the first two floors and residential develop-ment above. Vancouver is Canada’s most densely popu-lated city and is characterised by high-rise residential and
40 New Zealand Surveyor #303 • 2014
mixed-use development (Bogdanowicz 2006). It has shown intensification can be successfully undertaken on a smaller scale, and without the need to demolish buildings to rede-velop the city at a higher density (Isthmus 2013). This move to intensification was facilitated by developing, with signif-icant public involvement, a CityPlan in 1995, which pro-vided broad guidance on how this intensification would be achieved while still preserving the character of the city. As a result, ‘growth would be concentrated in neighbourhood centres through the intensification of land use and activ-ity, allowing surrounding low-density residential areas to remain largely unchanged’ (Davison 2011:108). To achieve these policies, Vancouver has adopted three strategies for residential intensification. The first strategy created sep-arate, liveable areas in existing apartments or houses, by dividing an apartment into two separate rentable areas, or by building basement suites beneath the dwelling. This type of intensification is considered to be largely invisible from the street. The second strategy involved constructing new cottages behind an existing dwelling, often accessible via a lane. Such lanes are common in Canada, providing narrow vehicular access through the middle of blocks to the rear of properties. Although lanes are uncommon in New Zealand cities, Isthmus (2013) suggests a compa-rable technique would be to construct small cottages of a complimentary character and style in an unobtrusive position around larger existing dwellings; what we con-sider in New Zealand to be in-fill intensification. The third strategy involved adding extra floors above retail outlets, derived from German and other European models, con-verting warehouses to residential or constructing smaller multi-level townhouses, perhaps with underground park-ing to encourage mixed-use developments in good trans-port locations. Each of these three strategies has signifi-cantly increased the density of Vancouver’s metropolitan area, which now has twice Auckland’s population den-sity (Isthmus 2013). Despite this move to intensification, Vancouver was voted the world’s most liveable city every year from 2002 to 2010 by the Economist Intelligence Unit (Holden & Scerri 2013), demonstrating that increased density does not need to be at the expense of liveability.
The approach used by Vancouver was intended to reduce the potential for intensification to be rejected as being out of character with resident’s perceptions and desires for their city. This seems to be a consistent issue with all intensifi-cation strategies, as is demonstrated by Melbourne’s expe-rience. Melbourne is an example of attempts by a number of Australian cities to address accelerating urban expan-sion, and to create compact cities. As Woodcock notes, this requires compact city policies ‘to accommodate res-idents’ aspirations alongside those of planning and design professionals’ (Woodcock 2011:344). The result of these
concerns was the production, in 2002, of the Melbourne 2030 policy, which concentrated higher density develop-ment in commercial activity centres along public trans-port routes, while constraining outward expansion with an Urban Growth Boundary (Woodcock 2011:344). As in Vancouver, Melbourne 2030 was intended to protect neighbourhood character when residential intensifica-tion was instituted. As such, it was a similar approach to that adopted by the Auckland Regional Growth Forum, which developed a metropolitan urban limit and tried to encourage higher density development in inner suburbs, and at public transport routes. Melbourne 2030 was crit-icised for not providing sufficient guidance on how these policies would be achieved. The growth of Melbourne also continued at an accelerating rate, leading to the review of Melbourne 2030 in 2008.
The intensification in Vancouver and Melbourne serve to highlight both the move to intensification as a central aspect of urban containment policies, and the potential for resident opposition to emerge in response to that inten-sification. Opposition to intensification is common, and tends to focus on how it changes the character of an area, something both strategies say they are trying to avoid, or at least consider in the planning of higher density devel-opments. Other perceived problems relate to the quality of the living environment; the concern that it may turn into a future slum, and the reduced ability of communities to ensure their views are heard and acted upon. Woodcock et al.’s (2011) study of intensification in the Melbourne sub-urb of Brunswick revealed a degree of NIMBYism among residents, and also a poorly functioning planning system, which encouraged ‘gaming’ by developers to achieve the outcomes they wanted. Woodcock et al. (2011:360) con-clude that ‘the current planning system encourages ambit claims, contestation, cynicism and speculation as it thwarts negotiations between residents, Councils and developers over the achievement of a more compact city’. Davison’s (2011) study of the intensification of Collingwood in Vancouver revealed many of the same concerns as found in Brunswick. Existing residents were unfamiliar with the concepts being promoted, and found the process unpre-dictable. In the case of Collingwood, a long period of active public engagement, and an appreciation that the higher density proposal was necessary to raise sufficient funds to provide the desired levels of social infrastructure, allowed the development of higher density developments that were acceptable to the Collingwood neighbourhood.
The process of promoting and achieving urban contain-ment, at least partly through intensification, involves a wide range of players including councils, planners, sur-veyors, developers, and existing and new residents. Each party has a different view of the process and their place in
New Zealand Surveyor #303 • 2014 41
it. Vancouver and Melbourne’s experiences highlight the role of community and individual’s concerns as a central issue in achieving higher density residential developments. Ultimately, the New Zealand public have to be encouraged to accept high density living if urban growth is to be suc-cessfully contained. They will only be encouraged to do so: if they like the medium density housing (MDH) available; if existing communities begin to accept that intensification is a positive contribution to their community; and if devel-opers are willing to provide it.
Developers are an essential part of any intensification strat-egy that seeks to promote MDH. They respond to both the potential that plans provide to undertake such develop-ments, and what they believe people will buy, and have to be astute at producing what the market wants, given the other substantial uncertainties that surround land devel-opment. Real estate agents are useful proxies for home buyers, as they are in regular contact with clients, have a good understanding of what buyers are seeking, and con-versely what developments buyers do not like. In most studies, developers are represented as part of the devel-opment process, rather than as individuals (see Searle & Filion 2011, Isthmus 2013, Beacon Pathways 2011), or as players in a case study (see Davison 2011,Woodcock et al.2011). Thus this study focuses on the role of developers in creating MDH, which they must be motivated to pro-duce, and the role of real estate agents who facilitate the sale and resale of MDH, if urban containment strategies such as SmartGrowth are to work.
The monitoring of the Tauranga’s SmartGrowth Strategy (see Gray 2009, Mead et al. 2012), which has included the views of developers’ and real estate agents’, has revealed issues in residential intensification. The Strategy assumed 19% of the sub-regional growth would be accommodated through intensification by 2015. Residential intensification has, from 1996-2012, accommodated about ‘5-6% of the sub-regions growth’ leading to concerns about the ability of intensification to contain Tauranga’s growth (Mead et al. 2012:107). This suggests that there is an issue with intensi-fication, which both Tauranga’s monitoring and the litera-ture suggest, will involve developers.
This article therefore looks at the intensification policies adopted as part of the SmartGrowth strategy in Tauranga, and what needs to be done to encourage developers to produce MDH developments that buyers are willing to purchase. The SmartGrowth strategies and provisions in the Tauranga District Plan are therefore analysed first, to establish the structure through which intensification is intended to be achieved. We then draw on a series of interviews with developers and real estate agents to deter-mine the present demand for MDH, and what these key
players believe needs to be done to ensure developers undertake intensification developments as envisaged by the SmartGrowth strategy. The research was undertaken as part of the requirements for a Master of Resource and Environmental Planning degree at Massey University by the lead author.
Research StrategyIn considering the initial question of demand, it was con-cluded that interviews with real estate agents would pro-vide a valuable source of information on buyers’ expec-tations and demands. Whilst comprehensive surveys of house-hunters or the general public are the obvious method, this was not possible at a scale that would pro-duce useful results. Real estate agents regularly talk with house-hunters, and can therefore be expected to under-stand what housing types are sought, what house-hunt-ers seek in a house/section, and whether they support the concept of intensification. The main criteria when select-ing real estate agents was to choose experienced agents from different companies, and from a range of geographic locations, to avoid skewing results. The experience factor is relevant as it suggests an ability to discuss trends over time. The real estate agents were identified through the Tauranga Property Press and local papers as being involved in selling MDH. Real estate agents who agreed to partici-pate were asked 6 structured questions that were intended to elicit their opinion of the strategy, their experience of selling, and perceptions of demand for MDH in Tauranga.
The developers were identified from the resource consent files held by the Tauranga City Council (TCC) as being developers of MDH. Their interviews were based on a struc-tured 5 question interview about their attitude to MDH developments and intensification policies. Developers were also questioned on the likelihood of success for both greenfield and urban redevelopment MDH. As well as interviews, three higher density Tauranga developments were visited to gain some insights as to the outcomes when intensification was implemented. The research was under-taken in mid-2013, using 40-60 minute interviews with 5 experienced real estate agents and 5 land developers, pro-ducing 10 interviews in total. At the end of each interview, a summary of key points was read back to ensure agree-ment on content, and all participants signed informed and voluntary consent forms. The research was subject to an ethical review, and was given a Low Risk Ethics approval by the Massey University Human Ethics Committee. To comply with that approval, participants could withdraw at any time, and their identities were protected.
This research was undertaken as a small scale project to fulfil the requirements of a 30 credit research project. This was a constraint in terms of time and resourcing, which
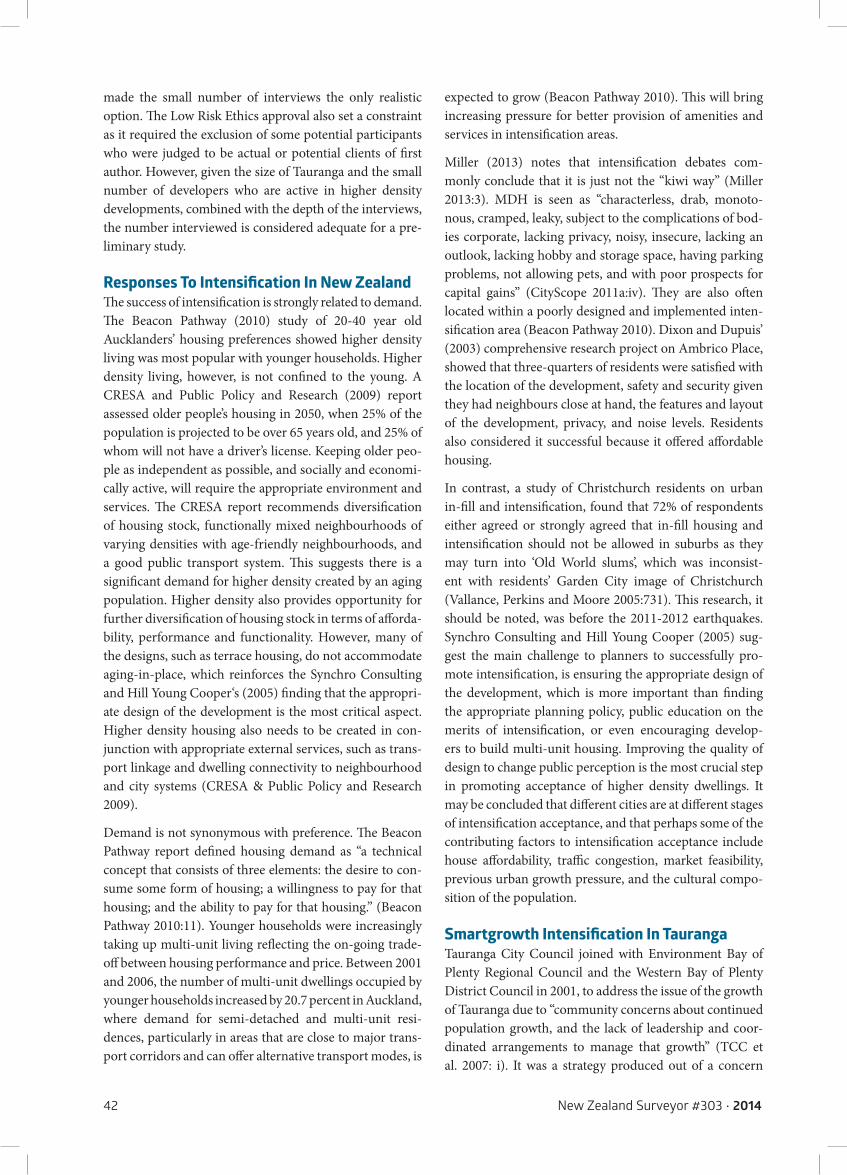
42 New Zealand Surveyor #303 • 2014
made the small number of interviews the only realistic option. The Low Risk Ethics approval also set a constraint as it required the exclusion of some potential participants who were judged to be actual or potential clients of first author. However, given the size of Tauranga and the small number of developers who are active in higher density developments, combined with the depth of the interviews, the number interviewed is considered adequate for a pre-liminary study.
Responses To Intensification In New ZealandThe success of intensification is strongly related to demand. The Beacon Pathway (2010) study of 20-40 year old Aucklanders’ housing preferences showed higher density living was most popular with younger households. Higher density living, however, is not confined to the young. A CRESA and Public Policy and Research (2009) report assessed older people’s housing in 2050, when 25% of the population is projected to be over 65 years old, and 25% of whom will not have a driver’s license. Keeping older peo-ple as independent as possible, and socially and economi-cally active, will require the appropriate environment and services. The CRESA report recommends diversification of housing stock, functionally mixed neighbourhoods of varying densities with age-friendly neighbourhoods, and a good public transport system. This suggests there is a significant demand for higher density created by an aging population. Higher density also provides opportunity for further diversification of housing stock in terms of afforda-bility, performance and functionality. However, many of the designs, such as terrace housing, do not accommodate aging-in-place, which reinforces the Synchro Consulting and Hill Young Cooper‘s (2005) finding that the appropri-ate design of the development is the most critical aspect. Higher density housing also needs to be created in con-junction with appropriate external services, such as trans-port linkage and dwelling connectivity to neighbourhood and city systems (CRESA & Public Policy and Research 2009).
Demand is not synonymous with preference. The Beacon Pathway report defined housing demand as “a technical concept that consists of three elements: the desire to con-sume some form of housing; a willingness to pay for that housing; and the ability to pay for that housing.” (Beacon Pathway 2010:11). Younger households were increasingly taking up multi-unit living reflecting the on-going trade-off between housing performance and price. Between 2001 and 2006, the number of multi-unit dwellings occupied by younger households increased by 20.7 percent in Auckland, where demand for semi-detached and multi-unit resi-dences, particularly in areas that are close to major trans-port corridors and can offer alternative transport modes, is
expected to grow (Beacon Pathway 2010). This will bring increasing pressure for better provision of amenities and services in intensification areas.
Miller (2013) notes that intensification debates com-monly conclude that it is just not the “kiwi way” (Miller 2013:3). MDH is seen as “characterless, drab, monoto-nous, cramped, leaky, subject to the complications of bod-ies corporate, lacking privacy, noisy, insecure, lacking an outlook, lacking hobby and storage space, having parking problems, not allowing pets, and with poor prospects for capital gains” (CityScope 2011a:iv). They are also often located within a poorly designed and implemented inten-sification area (Beacon Pathway 2010). Dixon and Dupuis’ (2003) comprehensive research project on Ambrico Place, showed that three-quarters of residents were satisfied with the location of the development, safety and security given they had neighbours close at hand, the features and layout of the development, privacy, and noise levels. Residents also considered it successful because it offered affordable housing.
In contrast, a study of Christchurch residents on urban in-fill and intensification, found that 72% of respondents either agreed or strongly agreed that in-fill housing and intensification should not be allowed in suburbs as they may turn into ‘Old World slums’, which was inconsist-ent with residents’ Garden City image of Christchurch (Vallance, Perkins and Moore 2005:731). This research, it should be noted, was before the 2011-2012 earthquakes. Synchro Consulting and Hill Young Cooper (2005) sug-gest the main challenge to planners to successfully pro-mote intensification, is ensuring the appropriate design of the development, which is more important than finding the appropriate planning policy, public education on the merits of intensification, or even encouraging develop-ers to build multi-unit housing. Improving the quality of design to change public perception is the most crucial step in promoting acceptance of higher density dwellings. It may be concluded that different cities are at different stages of intensification acceptance, and that perhaps some of the contributing factors to intensification acceptance include house affordability, traffic congestion, market feasibility, previous urban growth pressure, and the cultural compo-sition of the population.
Smartgrowth Intensification In TaurangaTauranga City Council joined with Environment Bay of Plenty Regional Council and the Western Bay of Plenty District Council in 2001, to address the issue of the growth of Tauranga due to “community concerns about continued population growth, and the lack of leadership and coor-dinated arrangements to manage that growth” (TCC et al. 2007: i). It was a strategy produced out of a concern
New Zealand Surveyor #303 • 2014 43
for the environmental, social and infrastructural costs of Tauranga’s urban growth. The SmartGrowth strategy was adopted by all three Councils in 2004, and updated in 2007. A core philosophy of SmartGrowth is that intensification of urban growth provides better social and environmental outcomes that contain urban sprawl. The 50-Year Strategy and Implementation Plan (TCC et al. 2007) identifies pri-mary intensification areas, secondary intensification areas and general intensification policies to be implemented, in that priority order. These objectives, policies, methods, rules, and standards, are detailed in both the Operative and Proposed Tauranga City District Plan.
The primary intensification areas fall within two broad ‘Intensification Management Areas’ (TCC 2011:7), located on the Mount Maunganui peninsula and the Tauranga central isthmus, with nine primary intensification areas developed by 2051 (TCC 2011). The Tauranga City Centre Strategy (TCC 2012) provided further detail on the Intensification Management Areas, including increased building heights and scale. It noted some community con-cern to this in terms of supply and demand issues, over-shadowing, the overwhelming nature of tall buildings, loss of views, and traffic congestion. However, the Strategy also discussed support for taller buildings (typically 4 – 5 sto-reys) including appropriate demarcation of the city centre as a prestigious and prosperous city, providing opportuni-ties for investment and development that may otherwise be directed to less appropriate areas. The Strategy includes view shafts kept building-free, and the protection of pedes-trian amenities.
Eight secondary residential intensification areas were planned (TCC 2011) around established suburban com-mercial centre nodes, to promote the integration of mixed uses and densities with transportation and urban design (TCC 2012). Intensification was a key part of that inte-gration. The third and lowest intensification priority was general intensification, using in-fill policies to increase density and provide a variety of housing options in general residential areas. The policies are intended to recognise the existing attributes of the areas, such as amenity and char-acter. The SmartGrowth Strategy included two greenfield intensification areas, which contrasts with the approach used both overseas and elsewhere in New Zealand, where intensification is focused on developed areas, particularly in the CBD, and at transport nodes (TCC 2011).
The primary and secondary intensification areas were intended to provide the highest density areas, at an antic-ipated average density of one residential unit per 100-250m2, with a minimum residential unit density of 1 per 325m2 (TCC 2011). Greenfields’ developments must achieve an average density of 15 dwellings per hectare, an
increase on the previous requirements for 10 dwellings per hectare. Table 1 indicates where the population increase will be accommodated, with 33% being in existing urban areas.
Growth Type Population Occupied Dwellings
Intensification Areas (Primary & Secondary) 19,893 22% 10,095 24%
General (infill) Intensification 8,458 9% 3,813 9%
Greenfield 64,244 69% 28,216 67%
Total 92,595 100% 42,124 100%
Table 1 Growth Management Allocation by Growth Type (Source: TCC 2011)
In 2012, TCC produced a report card on the SmartGrowth Strategy, which showed that the promotion and develop-ment of intensification around the suburban commercial centres had been unsuccessful, and target dates had not been met (TCC et al. 2012). It identified as the main rea-sons, the global economic downturn and subsequent slow-ing of growth and concerns over development viability, with subsidiary reasons being (TCC et al. 2012):
• lack of severe traffic congestion, as in Auckland, to generate demand for more central living;
• leaky homes crisis, which has tarnished the image of MDH;
•recent falls in the valuation of apartments;• the collapse of most finance companies;•risk averse lending criteria by banks;• increase in the cost of land and construction;• lack of suitable redevelopment sites.
The report concluded that primary and secondary inten-sification is unlikely to achieve the predicted growth in dwellings by 2051, and the most likely urban intensifica-tion would include: small/medium sized redevelopment opportunities in the existing urban area; medium to large scale development in specified parts of the existing urban area; and medium to high density development in central greenfield areas, such as the racecourse. The report card was followed by a comprehensive review report, released in mid-2013, which recommended the strategy be re-con-sidered in terms of the projected growth areas. TCC is now amending its intensification targets to assist it in planning for the associated infrastructure upgrades. The three options are: to keep the status quo and not amend the strategy; to amend the intensification growth projec-tions to align with a more realistic scenario; or wait to amend the intensification growth projections until after the release of the 2013 Census population projections (Mead et al. 2012). It is against this background that MDH was introduced to Tauranga.
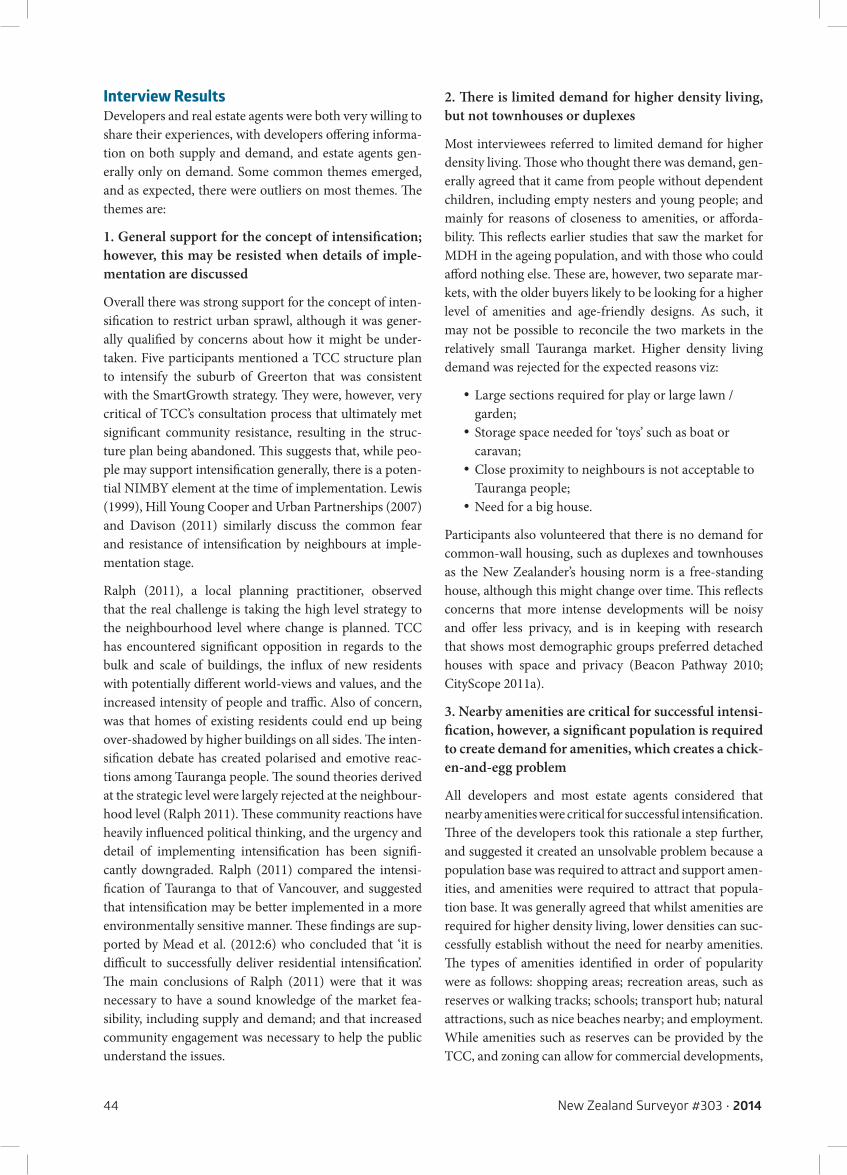
44 New Zealand Surveyor #303 • 2014
Interview ResultsDevelopers and real estate agents were both very willing to share their experiences, with developers offering informa-tion on both supply and demand, and estate agents gen-erally only on demand. Some common themes emerged, and as expected, there were outliers on most themes. The themes are:
1. General support for the concept of intensification; however, this may be resisted when details of imple-mentation are discussed
Overall there was strong support for the concept of inten-sification to restrict urban sprawl, although it was gener-ally qualified by concerns about how it might be under-taken. Five participants mentioned a TCC structure plan to intensify the suburb of Greerton that was consistent with the SmartGrowth strategy. They were, however, very critical of TCC’s consultation process that ultimately met significant community resistance, resulting in the struc-ture plan being abandoned. This suggests that, while peo-ple may support intensification generally, there is a poten-tial NIMBY element at the time of implementation. Lewis (1999), Hill Young Cooper and Urban Partnerships (2007) and Davison (2011) similarly discuss the common fear and resistance of intensification by neighbours at imple-mentation stage.
Ralph (2011), a local planning practitioner, observed that the real challenge is taking the high level strategy to the neighbourhood level where change is planned. TCC has encountered significant opposition in regards to the bulk and scale of buildings, the influx of new residents with potentially different world-views and values, and the increased intensity of people and traffic. Also of concern, was that homes of existing residents could end up being over-shadowed by higher buildings on all sides. The inten-sification debate has created polarised and emotive reac-tions among Tauranga people. The sound theories derived at the strategic level were largely rejected at the neighbour-hood level (Ralph 2011). These community reactions have heavily influenced political thinking, and the urgency and detail of implementing intensification has been signifi-cantly downgraded. Ralph (2011) compared the intensi-fication of Tauranga to that of Vancouver, and suggested that intensification may be better implemented in a more environmentally sensitive manner. These findings are sup-ported by Mead et al. (2012:6) who concluded that ‘it is difficult to successfully deliver residential intensification’. The main conclusions of Ralph (2011) were that it was necessary to have a sound knowledge of the market fea-sibility, including supply and demand; and that increased community engagement was necessary to help the public understand the issues.
2. There is limited demand for higher density living, but not townhouses or duplexes
Most interviewees referred to limited demand for higher density living. Those who thought there was demand, gen-erally agreed that it came from people without dependent children, including empty nesters and young people; and mainly for reasons of closeness to amenities, or afforda-bility. This reflects earlier studies that saw the market for MDH in the ageing population, and with those who could afford nothing else. These are, however, two separate mar-kets, with the older buyers likely to be looking for a higher level of amenities and age-friendly designs. As such, it may not be possible to reconcile the two markets in the relatively small Tauranga market. Higher density living demand was rejected for the expected reasons viz:
•Large sections required for play or large lawn / garden;
•Storage space needed for ‘toys’ such as boat or caravan;
•Close proximity to neighbours is not acceptable to Tauranga people;
•Need for a big house.
Participants also volunteered that there is no demand for common-wall housing, such as duplexes and townhouses as the New Zealander’s housing norm is a free-standing house, although this might change over time. This reflects concerns that more intense developments will be noisy and offer less privacy, and is in keeping with research that shows most demographic groups preferred detached houses with space and privacy (Beacon Pathway 2010; CityScope 2011a).
3. Nearby amenities are critical for successful intensi-fication, however, a significant population is required to create demand for amenities, which creates a chick-en-and-egg problem
All developers and most estate agents considered that nearby amenities were critical for successful intensification. Three of the developers took this rationale a step further, and suggested it created an unsolvable problem because a population base was required to attract and support amen-ities, and amenities were required to attract that popula-tion base. It was generally agreed that whilst amenities are required for higher density living, lower densities can suc-cessfully establish without the need for nearby amenities. The types of amenities identified in order of popularity were as follows: shopping areas; recreation areas, such as reserves or walking tracks; schools; transport hub; natural attractions, such as nice beaches nearby; and employment. While amenities such as reserves can be provided by the TCC, and zoning can allow for commercial developments,
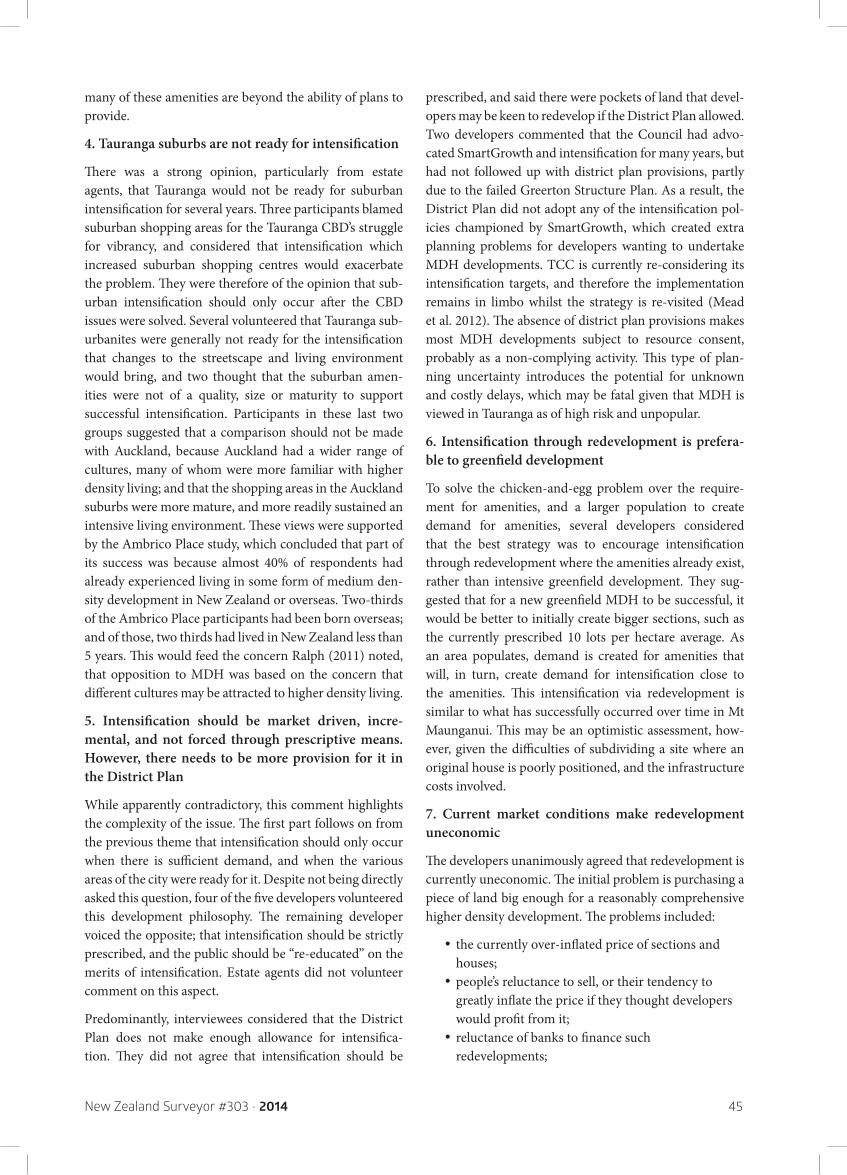
New Zealand Surveyor #303 • 2014 45
many of these amenities are beyond the ability of plans to provide.
4. Tauranga suburbs are not ready for intensification
There was a strong opinion, particularly from estate agents, that Tauranga would not be ready for suburban intensification for several years. Three participants blamed suburban shopping areas for the Tauranga CBD’s struggle for vibrancy, and considered that intensification which increased suburban shopping centres would exacerbate the problem. They were therefore of the opinion that sub-urban intensification should only occur after the CBD issues were solved. Several volunteered that Tauranga sub-urbanites were generally not ready for the intensification that changes to the streetscape and living environment would bring, and two thought that the suburban amen-ities were not of a quality, size or maturity to support successful intensification. Participants in these last two groups suggested that a comparison should not be made with Auckland, because Auckland had a wider range of cultures, many of whom were more familiar with higher density living; and that the shopping areas in the Auckland suburbs were more mature, and more readily sustained an intensive living environment. These views were supported by the Ambrico Place study, which concluded that part of its success was because almost 40% of respondents had already experienced living in some form of medium den-sity development in New Zealand or overseas. Two-thirds of the Ambrico Place participants had been born overseas; and of those, two thirds had lived in New Zealand less than 5 years. This would feed the concern Ralph (2011) noted, that opposition to MDH was based on the concern that different cultures may be attracted to higher density living.
5. Intensification should be market driven, incre-mental, and not forced through prescriptive means. However, there needs to be more provision for it in the District Plan
While apparently contradictory, this comment highlights the complexity of the issue. The first part follows on from the previous theme that intensification should only occur when there is sufficient demand, and when the various areas of the city were ready for it. Despite not being directly asked this question, four of the five developers volunteered this development philosophy. The remaining developer voiced the opposite; that intensification should be strictly prescribed, and the public should be “re-educated” on the merits of intensification. Estate agents did not volunteer comment on this aspect.
Predominantly, interviewees considered that the District Plan does not make enough allowance for intensifica-tion. They did not agree that intensification should be
prescribed, and said there were pockets of land that devel-opers may be keen to redevelop if the District Plan allowed. Two developers commented that the Council had advo-cated SmartGrowth and intensification for many years, but had not followed up with district plan provisions, partly due to the failed Greerton Structure Plan. As a result, the District Plan did not adopt any of the intensification pol-icies championed by SmartGrowth, which created extra planning problems for developers wanting to undertake MDH developments. TCC is currently re-considering its intensification targets, and therefore the implementation remains in limbo whilst the strategy is re-visited (Mead et al. 2012). The absence of district plan provisions makes most MDH developments subject to resource consent, probably as a non-complying activity. This type of plan-ning uncertainty introduces the potential for unknown and costly delays, which may be fatal given that MDH is viewed in Tauranga as of high risk and unpopular.
6. Intensification through redevelopment is prefera-ble to greenfield development
To solve the chicken-and-egg problem over the require-ment for amenities, and a larger population to create demand for amenities, several developers considered that the best strategy was to encourage intensification through redevelopment where the amenities already exist, rather than intensive greenfield development. They sug-gested that for a new greenfield MDH to be successful, it would be better to initially create bigger sections, such as the currently prescribed 10 lots per hectare average. As an area populates, demand is created for amenities that will, in turn, create demand for intensification close to the amenities. This intensification via redevelopment is similar to what has successfully occurred over time in Mt Maunganui. This may be an optimistic assessment, how-ever, given the difficulties of subdividing a site where an original house is poorly positioned, and the infrastructure costs involved.
7. Current market conditions make redevelopment uneconomic
The developers unanimously agreed that redevelopment is currently uneconomic. The initial problem is purchasing a piece of land big enough for a reasonably comprehensive higher density development. The problems included:
• the currently over-inflated price of sections and houses;
•people’s reluctance to sell, or their tendency to greatly inflate the price if they thought developers would profit from it;
•reluctance of banks to finance such redevelopments;
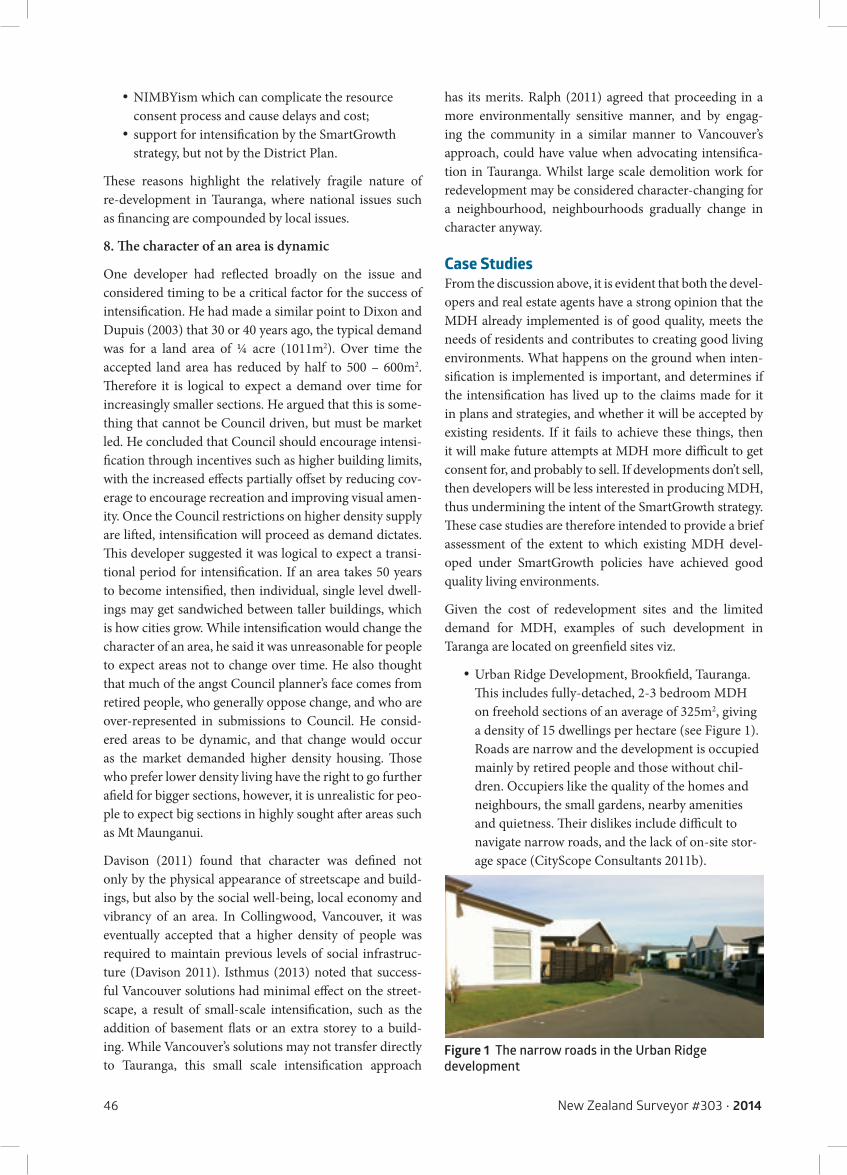
46 New Zealand Surveyor #303 • 2014
•NIMBYism which can complicate the resource consent process and cause delays and cost;
•support for intensification by the SmartGrowth strategy, but not by the District Plan.
These reasons highlight the relatively fragile nature of re-development in Tauranga, where national issues such as financing are compounded by local issues.
8. The character of an area is dynamic
One developer had reflected broadly on the issue and considered timing to be a critical factor for the success of intensification. He had made a similar point to Dixon and Dupuis (2003) that 30 or 40 years ago, the typical demand was for a land area of ¼ acre (1011m2). Over time the accepted land area has reduced by half to 500 – 600m2. Therefore it is logical to expect a demand over time for increasingly smaller sections. He argued that this is some-thing that cannot be Council driven, but must be market led. He concluded that Council should encourage intensi-fication through incentives such as higher building limits, with the increased effects partially offset by reducing cov-erage to encourage recreation and improving visual amen-ity. Once the Council restrictions on higher density supply are lifted, intensification will proceed as demand dictates. This developer suggested it was logical to expect a transi-tional period for intensification. If an area takes 50 years to become intensified, then individual, single level dwell-ings may get sandwiched between taller buildings, which is how cities grow. While intensification would change the character of an area, he said it was unreasonable for people to expect areas not to change over time. He also thought that much of the angst Council planner’s face comes from retired people, who generally oppose change, and who are over-represented in submissions to Council. He consid-ered areas to be dynamic, and that change would occur as the market demanded higher density housing. Those who prefer lower density living have the right to go further afield for bigger sections, however, it is unrealistic for peo-ple to expect big sections in highly sought after areas such as Mt Maunganui.
Davison (2011) found that character was defined not only by the physical appearance of streetscape and build-ings, but also by the social well-being, local economy and vibrancy of an area. In Collingwood, Vancouver, it was eventually accepted that a higher density of people was required to maintain previous levels of social infrastruc-ture (Davison 2011). Isthmus (2013) noted that success-ful Vancouver solutions had minimal effect on the street-scape, a result of small-scale intensification, such as the addition of basement flats or an extra storey to a build-ing. While Vancouver’s solutions may not transfer directly to Tauranga, this small scale intensification approach
has its merits. Ralph (2011) agreed that proceeding in a more environmentally sensitive manner, and by engag-ing the community in a similar manner to Vancouver’s approach, could have value when advocating intensifica-tion in Tauranga. Whilst large scale demolition work for redevelopment may be considered character-changing for a neighbourhood, neighbourhoods gradually change in character anyway.
Case StudiesFrom the discussion above, it is evident that both the devel-opers and real estate agents have a strong opinion that the MDH already implemented is of good quality, meets the needs of residents and contributes to creating good living environments. What happens on the ground when inten-sification is implemented is important, and determines if the intensification has lived up to the claims made for it in plans and strategies, and whether it will be accepted by existing residents. If it fails to achieve these things, then it will make future attempts at MDH more difficult to get consent for, and probably to sell. If developments don’t sell, then developers will be less interested in producing MDH, thus undermining the intent of the SmartGrowth strategy. These case studies are therefore intended to provide a brief assessment of the extent to which existing MDH devel-oped under SmartGrowth policies have achieved good quality living environments.
Given the cost of redevelopment sites and the limited demand for MDH, examples of such development in Taranga are located on greenfield sites viz.
•Urban Ridge Development, Brookfield, Tauranga. This includes fully-detached, 2-3 bedroom MDH on freehold sections of an average of 325m2, giving a density of 15 dwellings per hectare (see Figure 1). Roads are narrow and the development is occupied mainly by retired people and those without chil-dren. Occupiers like the quality of the homes and neighbours, the small gardens, nearby amenities and quietness. Their dislikes include difficult to navigate narrow roads, and the lack of on-site stor-age space (CityScope Consultants 2011b).
Figure 1 The narrow roads in the Urban Ridge development
New Zealand Surveyor #303 • 2014 47
•Excelsa Village, Wairakei Development, Papamoa East. Located 18kms east of the city in part of the new suburb of Papamoa (Figure 2), it has adhered to the SmartGrowth principles, including a den-sity of 15 lots per hectare (McPherson 2011) with mixed section sizes. Some interviewees took issue with its distance from the Tauranga and Mount Maunganui CBDs, insufficient amenities, and the uniformity of houses. The SmartGrowth design elements, however, are likely to eventually create a strong community.
•The Lakes, at Tauriko, is 10km south of the Tauranga CBD (Figure 3) and includes 2000 mixed sized sections, of which 500 have been developed (Skellern 2012). There is no shopping or commer-cial component as yet within or near to the devel-opment, however, one is due to be constructed now that there is a population base to support it. This development was criticised by several interview-ees, who thought there were insufficient building controls, a lack of commercial amenity, and that the sections were too small. While facilities are presently lacking, and the development feels rather isolated, this will change when the commercial centre develops, and a major recreational facility is developed in its lake.
That these greenfield MDH developments exist, indicates that there is some demand for this type of housing. It sug-gests that those who inhabit such developments, and those who sell them, have high expectations about the quality of design and amenities. In the case of the Lakes develop-ment, however, the designs illustrated in Figure 3 are very similar to the Stonefields development in Auckland. Given
that buyers in Tauranga have differing housing and amen-ity expectations, and being outside Auckland the cost pres-sures are smaller, this suggests that the Lakes development may not work for Tauranga.
ConclusionIntensification, as a major aspect of the SmartGrowth management strategy for Tauranga, is unlikely to succeed in the short term due to neighbourhood level rejection, and the lack of financial viability in undertaking redevel-opment. These results are consistent with those of overseas studies; they highlight the importance of potential resi-dents and existing neighbourhoods accepting intensifica-tion in order to get intensification projects implemented. The neighbourhood level rejection suggests that Tauranga suburbanites are not yet ready for intensification, and the pressures to intensify are not sufficiently great to com-pel it. Buyers are perceived to want good local amenities, which the developers see as being provided by councils. For developers the costs of aggregating a suitably sized site, development costs, the lack of suitable redevelopment sites, and financing difficulties all make MDH projects risky and speculative.
Small scale in-fill intensification and greenfields intensi-fication will continue at a small scale, but as a minor part of the market, and not featuring high density residential development such as multi-level apartment blocks. This confirms Mead et al.’s (2012) conclusions on the failure of primary and secondary intensification to date, and the likelihood of the SmartGrowth targets not being met, despite demographic projections predicting an aging pop-ulation and more single or couple-only families, to whom MDH most appeals.
This research shows that MDH as a key aspect of SmartGrowth is not currently successful in Tauranga. The likely factors that will make intensification success-ful are gradually building, and in time, a tipping point will be reached when the pressures are such that intensi-fication will be a successful growth management strategy for Tauranga. As conditions for intensification develop, buyer expectations will change, and lending institutions will undoubtedly be more willing to provide financial resources. This study, however, highlights the complex fac-tors, most of which are outside the control of those creating intensification plans, which will largely determine if, how, and where residential intensification will be achievable.
Acknowledgements Hamish Crawford would like to acknowledge the New Zealand Institute of Surveyors Scholarship which made this study possible.
Figure 2 The Excelsa development, Papamoa
Figure 3 The Lakes

48 New Zealand Surveyor #303 • 2014
ReferencesBeacon Pathway. 2010. The determinants of tenure and location choices of 20-40 year old households in the Auckland region. Wellington, New Zealand: Centre for Housing Research Aotearoa New Zealand.Bogdanowicz. 2006. Vancouverism. Toronto, Canada: Canadian Architect. Retrieved from http://www.canadianarchitect.com/news/vancouverism/1000205807/?issue=08012006. CityScope Consultants Ltd. 2011a. Improving the design, quality and affordability of residential intensification in New Zealand. Wellington, New Zealand: Centre for Housing Research Aotearoa New Zealand.CityScope Consultants Ltd. 2011b. Urban Ridge Case Study. Wellington, New Zealand: Centre for Housing Research Aotearoa New Zealand.CRESA and Public Policy and Research. 2009. Older people’s housing futures in 2050: three scenarios for an ageing society. Wellington, New Zealand: Centre for Housing Research Aotearoa New Zealand.Davison, G. 2011. An unlikely urban symbiosis: urban intensifi-cation and neighbourhood character in Collingwood, Vancouver. Urban Policy and Research, 29(2): 105-124.Dixon, J., and Dupuis A. 2003. Urban intensification in Auckland, New Zealand: a challenge for new urbanism. Housing Studies, 18(3): 353-368.Environment Canterbury. 2008. Greater Christchurch Urban Development Strategy. Retrieved from http://ecan.govt.nz/publica-tions/Pages/greater-urban-development-strategy.aspx.Gray, N. 2009. Smart Growth Management Implementation Issues Report. Tauranga, New Zealand: Tauranga City Council and the Smart Growth Management Group.Hamilton City Council. 2008. Hamilton Urban Growth Strategy. Retrieved from http://www.hamilton.govt.nz/our-city/city-strate-gies/hamiltonurbangrowth/Pages/default.aspx.Hill Young Cooper and Urban Partnerships. 2007. Regional inten-sification: intensive housing demand and supply issues. Auckland, New Zealand: Auckland Regional Council.Holden, M., and Scerri, A. 2013. More than this: liveable Melbourne meets liveable Vancouver. Cities, 31: 444-453.Isthmus Research. 2013. Learning from Vancouver: Gentle Density. Auckland, New ZealandLewis, M. 1999. Suburban backlash: The battle for the world’s most liveable city. Victoria, Australia: Bloomings Books.McPherson, M. 2011. All go for new Papamoa suburb, Bay of Plenty Times. March 27. Retrieved from http://www.nzherald.co.nz/bay-of-plenty times/business/news/article.cfm?c_id=1503347&objectid=11023406. Mead, A., Ralph, A., Smith, F., Greenway, A., Marjoribanks, K., Ullrich, L., and Davies, L. 2012. Prospects for Residential Infill and Intensification in Tauranga City, SmartGrowth/Tauranga City Council. Retrieved from http://www.SmartGrowthbop.org.nz/research/integrated-planning-and-the-settlement-pattern/residen-tial-land.aspx.
Miller, C.L. 2013. Planning and health – Opportunities for partnership. Paper presented to the Future Built Environments Conference, Auckland, New Zealand.Ralph, A. 2011. The challenges of implementing residential inten-sification. In: Witten, K., Abrahamse, W., and Stuart, K. (eds.). From growth misconduct, avoiding sprawl and improving urban intensification in New Zealand. Wellington, New Zealand: New Zealand Centre for Sustainable Cities centred at University of Otago, (pp. 97-107)Searle, G., and Filion, P. 2011. Planning context and urban inten-sification outcomes: Sydney versus Toronto. Urban Studies, 48(7): 1419-1438.Skellern, G. 2012. Millionaire steps in to save The Lakes, Bay of Plenty Times. April 28. Retrieved from http://www.nzherald.co.nz/bay-of-plenty-times/news/article.cfm?c_id=1503343&objectid=11061447. Synchro Consulting and Hill Young Cooper. 2005. Social impli-cations of housing intensification in the Auckland region: analysis and review of media reports, surveys and literature. Auckland, New Zealand: Auckland Sustainable Cities Programme.Tauranga City Council. 2011. Tauranga City Population and Household Forecast Review 2011. New Zealand: Author. Retrieved from http://www.tauranga.govt.nz/council-documents-reports/councils-strategies-plans-reports/reports/tauranga-city-popula-tion-and-housing-reviews/tauranga-city-forecast-review-2011.aspx Tauranga City Council. 2012. City Centre Strategy 2012. New Zealand. Retrieved from http://www.tauranga.govt.nz/coun-cil-documents-reports/councils-strategies-plans-reports/strate-gies/city-centre-.aspx. Tauranga City Council, Western Bay of Plenty District Council and Environment Bay of Plenty Regional Council. 2007. 50-year strategy and implementation plan. New Zealand. Retrieved from http://econtent.tauranga.govt.nz/data/documents/joint_strategies_plans/SmartGrowth/smart_growth_strategy_without_maps.pdf. Tauranga City Council, Western Bay of Plenty District Council and Environment Bay of Plenty Regional Council. 2012. Report card June 2012. New Zealand. Retrieved from http://www.SmartGrowthbop.org.nz/media/67822/SmartGrowth_report_card_final.pdf.Vallance, S, Perkins, H.C., and Moore, K. 2005. The results of making a city more compact: neighbours interpretation of urban in-fill. Environment and Planning B: Planning and Design, 32: 715-733.Woodcock, I., Dovey, K., Wollan, S., and Robertson, I. 2011. Speculation and resistance: Constraints on compact city policy implementation in Melbourne. Urban Policy and Research, 29(4): 343-362.
Hamish Crawford is the Manager, Senior Surveyor and Planning Manager at the Taupo Office of Cardno. This work is based on his research project for his recently completed MRP degree.
Associate Professor Caroline Miller is a former planning practitioner, now in the Resource and Environmental Planning Programme at Massey University. Her research focuses on critical studies of the RMA and the history of planning in New Zealand. She is a Board member of the New Zealand Planning Institute.

INSTRUCTIONS FOR AUTHORSThe New Zealand Surveyor is the journal of the New Zealand Institute of Surveyors. It publishes original research papers and in-depth papers on topics of professional interest related to land surveying, which have been written by researchers or professional surveyors working anywhere in the world. Review articles, book reviews, and letters to the Editor are also published. The New Zealand Surveyor is published annually.
Papers previously published or under consideration elsewhere will not be accepted.
LENGTH OF PAPERSPapers of 4000 and 6000 words (excluding figures and tables) are preferred. Longer papers will be considered providing the author justifies the increased length.
Unless by agreement with the Editor, book reviews should be no shorter than1000 words and no longer than 2000 words.
PRE-SUBMISSION REVIEWPlease ensure that your paper has been reviewed by colleagues before submission. Ask your reviewers to address not only its content but also to provide you with feedback on presentation, references, illustrations, and quality of the written English.
Papers submitted will usually be sent to specialist referees for confidential assessment.
SUBMISSION OF PAPERSPapers are to be submitted by email as a formatted text file prepared using Microsoft Word, or in a format readable by Microsoft Word. Send to: [email protected] by 1 August. Figures may be included with the text when the paper is first submitted.
When accepted, an electronic copy of the paper must be provided with text, tables, and captions as one file, in a format readable by Microsoft Word. Figures are to be provided as separate files.
FiguresFigures are to be supplied as separate electronic images in jpeg, tif or png format. The images need to be a suitable size for a publication using normal print technology which is far more demanding than a computer screen. Photographs as jpegs should be at least 400kb in size, tif photographs need to be approximately ten times this size or a minimum of 4Mb and be capable of publication as grey scale images. Diagrams vary in the file size required so they need to be made and saved at a decent size and not reduced for emailing. If in doubt send samples to the Editor for assessment.
Figures should be numbered in order, using Arabic numerals (Figure 1, 2, 3…), and placed in the text as close as possible to their first mention. The positions of figures in the text are to be marked by the figure number and caption.
Captions should adequately explain the symbols presented in the figures. Keys, scales and north points should be provided where appropriate.
TablesTables are to be included as part of the text, unless they are larger than 0.75 pages, when they should be placed separately on separate pages after the References. Tables should be numbered in order, using Arabic numerals (Table 1, 2, 3…), and placed in the text close to their first mention. For tables placed after the References, their positions in the text should be marked by the table number and caption. Abbreviations should be adequately explained in the caption or in table footnotes. Units of measurement should be placed in column heads.
Word processing The following conventions should be adhered to for text files:
1. Use Times New Roman font for all text. Size 14 for the title of the paper, size 12 for all other text including sub-headings, captions, table titles, figure titles, and end notes.
2. Insert a one-line space between headings and the following text.
3. Insert a one-line space between paragraphs, and start the first line of the new paragraph full out, not indented.
4. Headings should be styled in capitals, and centred on the page.
5. Subheadings should be styled in bold italic, left justified, with only the initial letter capitalised.
6. Do not underline. Use italics sparingly for emphasis.
7. Turn off track changes, and remove all field codes produced by programs such as bibliographic citation software (e.g. EndNote).
8. For Tables, use Word for Windows Table Tool. Do not use Excel or other table programs.
9. Footnotes are not acceptable, and end notes should be kept to a minimum.
AbstractAll submitted papers should be accompanied by an abstract of 150 words or less. The abstract should be presented so that, with the paper title, it is informative and intelligible and gives the main results of the paper. Do not use abbreviations, or cite references.
KeywordsThree to five keywords should be provided, obtained from the whole paper, not just the title and abstract.
ReferencesAuthors are responsible for the accuracy of their references. References should be cited using the Harvard (Name date) system. In the text they are to be by author name and year of publication, and at the end of the text, listed in alphabetical order of authors’ surnames. Publications by the same author published in the same year are to be distinguished by letters after the date. List references in full, do not abbreviate journal titles.
Please be wisely conservative in the use of references. They are important, but if used excessively they can make reading the paper virtually impossible.
For reference formats, see examples in recent issues of the New Zealand Surveyor.
Biographical detailsBrief biographical details for each author, including their institutional affiliation and email address, should be supplied with the first submission.