Embed Size (px)
Citation preview

NFSEN Exercise - 4
1 Your router should be sending flows to one PC in your group, and one PC in your neighbor group. Confirm this!
2 Ensure NfSen is running by browsing on the page and ensuring you can see the graphs with no errors indicated
3 We will now see what type of traffic is passing through the two routers
What we will do
On the PC receiving flows, open the NFSEN page and click on ‘live’ on the top right of the page and select “New Profile …” – You may need to select several times as NfSen is picky.
Enter the name ‘HTTP_TRAFFIC’ for the profile name and additionally create a new group called “groupX” where X is your group number
Select individual channels and shadow profile. - Individual channel – can create channels with own filters - Shadow profile – save hard disk space by not creating
new data but instead analyses already collected data See next page for an example image…
Create a Stat to graph specific traffic
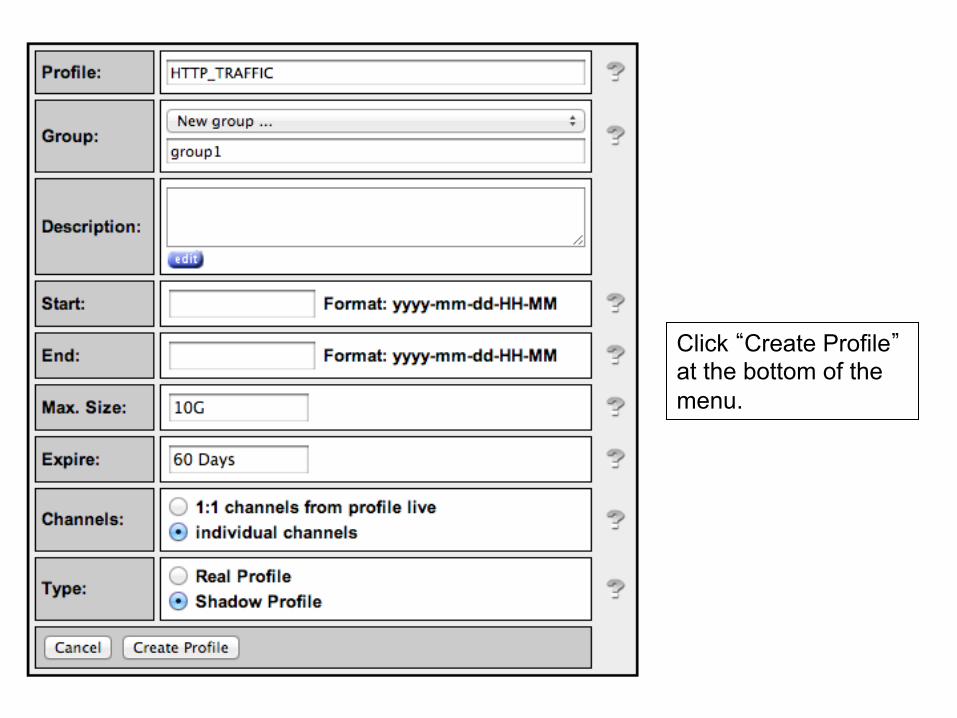
Click “Create Profile” at the bottom of the menu.
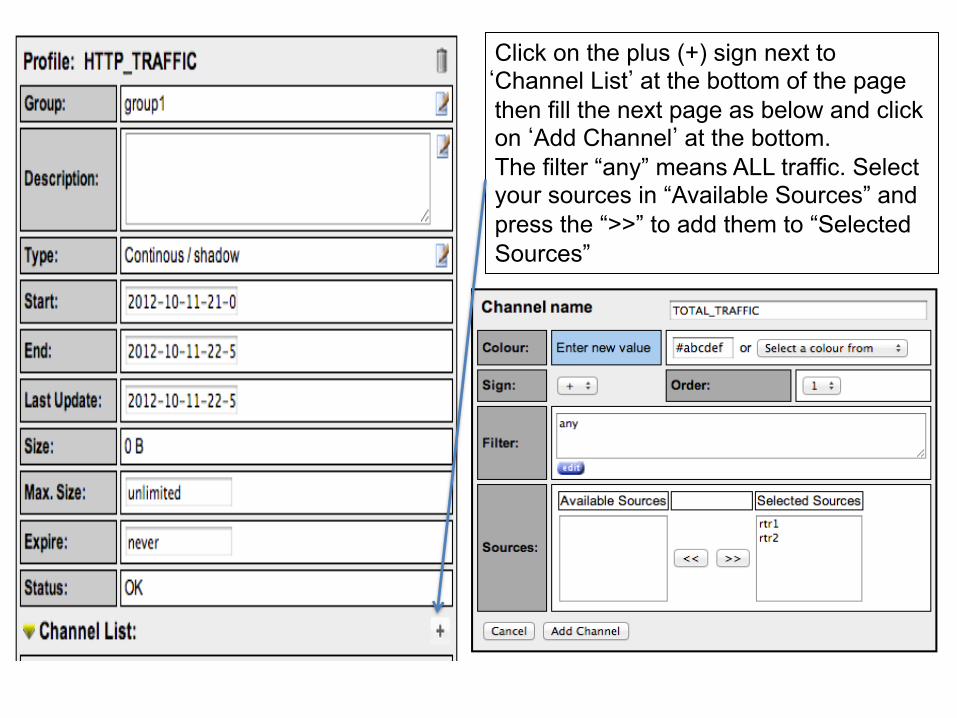
Click on the plus (+) sign next to ‘Channel List’ at the bottom of the page then fill the next page as below and click on ‘Add Channel’ at the bottom. The filter “any” means ALL traffic. Select your sources in “Available Sources” and press the “>>” to add them to “Selected Sources”
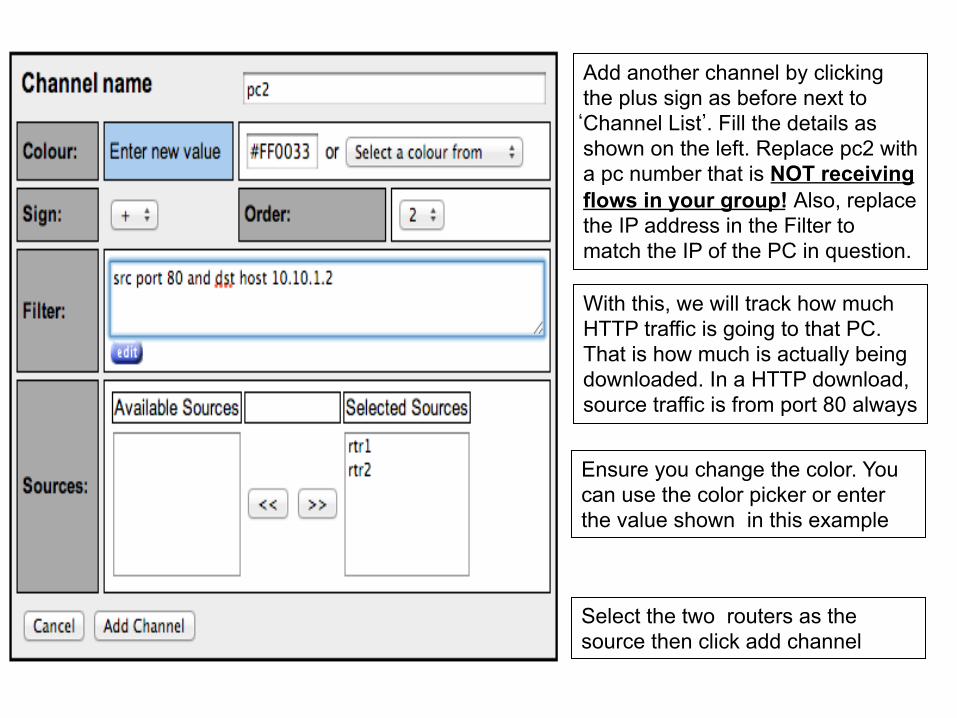
Add another channel by clicking the plus sign as before next to ‘Channel List’. Fill the details as shown on the left. Replace pc2 with a pc number that is NOT receiving flows in your group! Also, replace the IP address in the Filter to match the IP of the PC in question.
Ensure you change the color. You can use the color picker or enter the value shown in this example
Select the two routers as the source then click add channel
With this, we will track how much HTTP traffic is going to that PC. That is how much is actually being downloaded. In a HTTP download, source traffic is from port 80 always
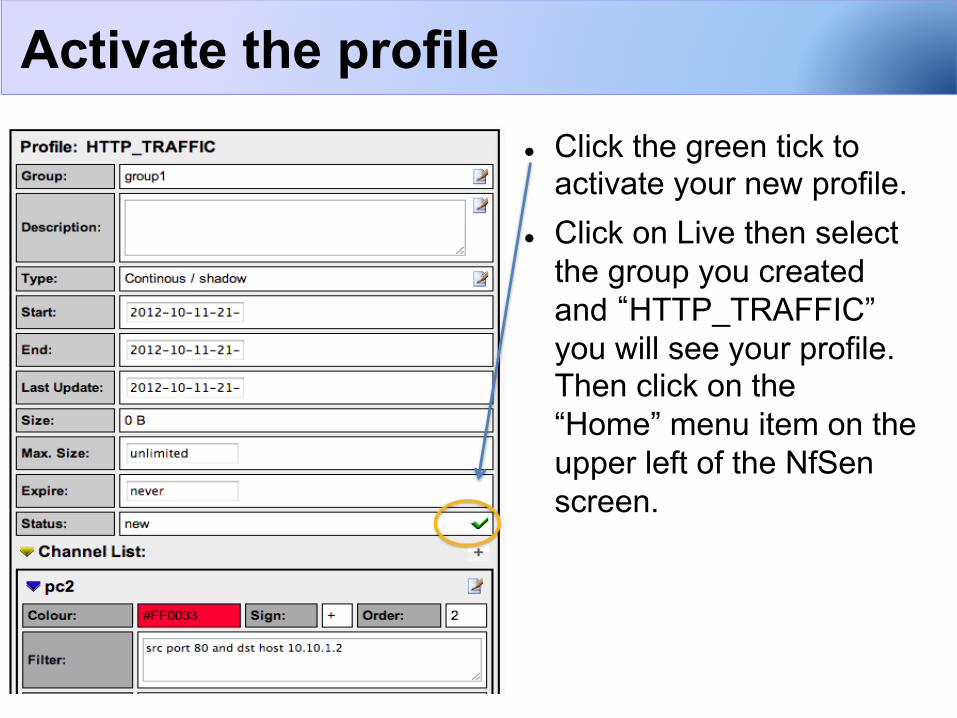
Click the green tick to activate your new profile.
Click on Live then select the group you created and “HTTP_TRAFFIC” you will see your profile. Then click on the “Home” menu item on the upper left of the NfSen screen.
Activate the profile
Download HTTP data to pcY
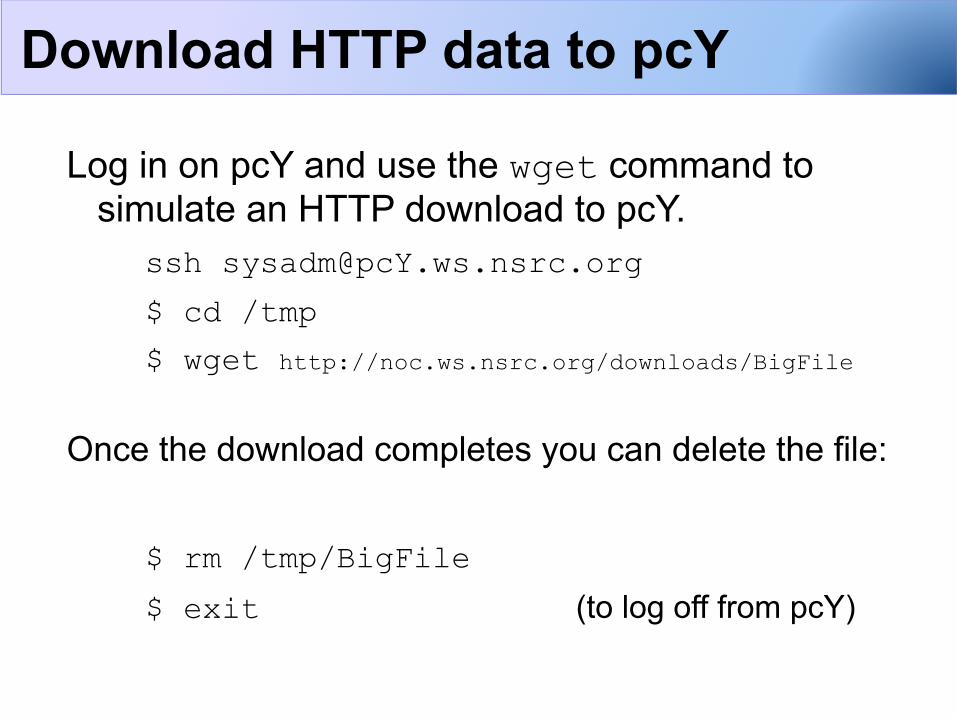
Log in on pcY and use the wget command to simulate an HTTP download to pcY.
$ cd /tmp
$ wget http://noc.ws.nsrc.org/downloads/BigFile
Once the download completes you can delete the file: $ rm /tmp/BigFile $ exit (to log off from pcY)
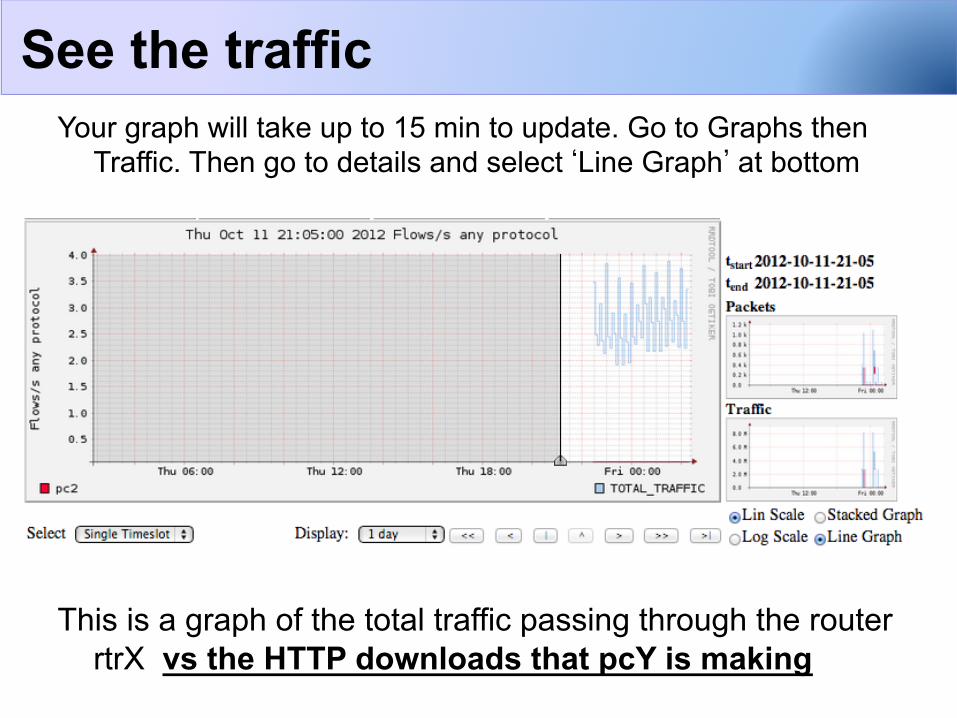
Your graph will take up to 15 min to update. Go to Graphs then Traffic. Then go to details and select ‘Line Graph’ at bottom
This is a graph of the total traffic passing through the router rtrX vs the HTTP downloads that pcY is making
See the traffic
NOC BOX
rtrX
NFSEN Server pcY
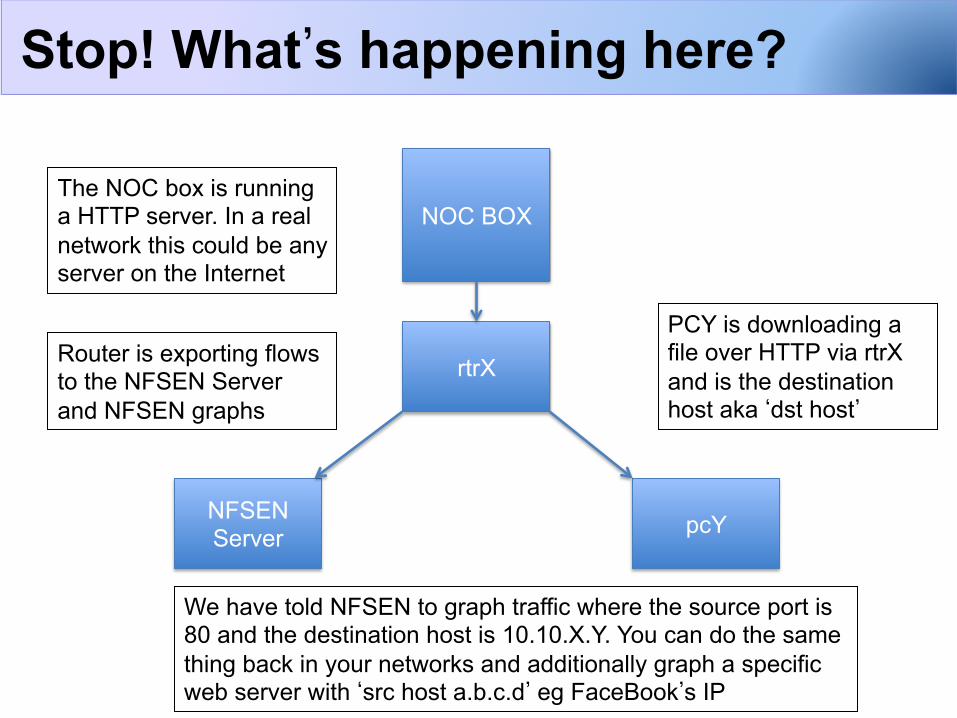
Router is exporting flows to the NFSEN Server and NFSEN graphs
PCY is downloading a file over HTTP via rtrX and is the destination host aka ‘dst host’
The NOC box is running a HTTP server. In a real network this could be any server on the Internet
We have told NFSEN to graph traffic where the source port is 80 and the destination host is 10.10.X.Y. You can do the same thing back in your networks and additionally graph a specific web server with ‘src host a.b.c.d’ eg FaceBook’s IP
Stop! What’s happening here?
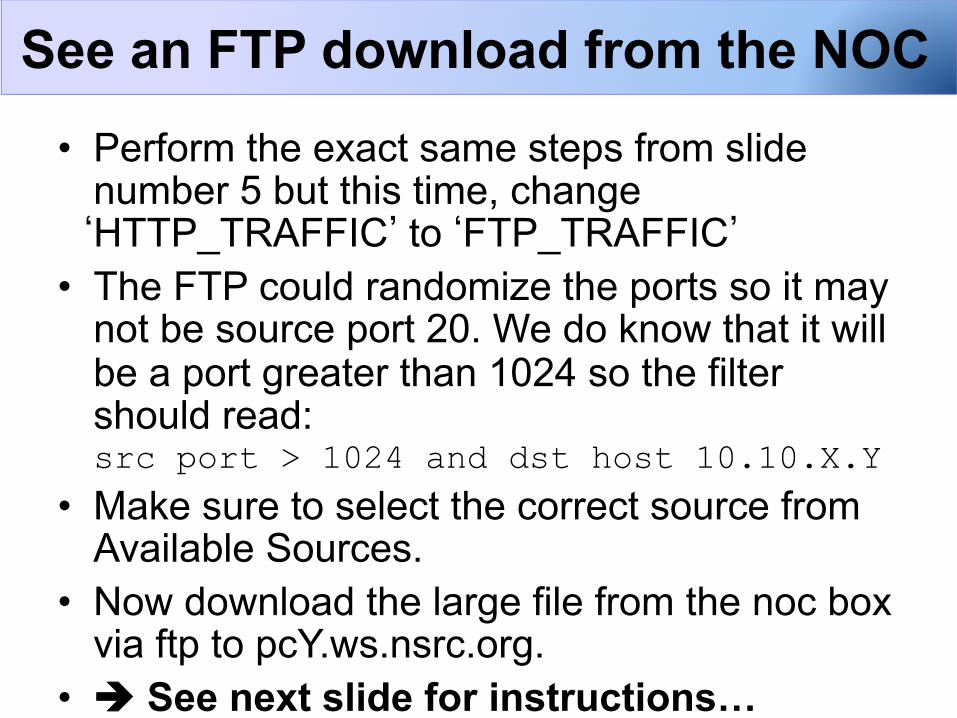
• Perform the exact same steps from slide number 5 but this time, change ‘HTTP_TRAFFIC’ to ‘FTP_TRAFFIC’
• The FTP could randomize the ports so it may not be source port 20. We do know that it will be a port greater than 1024 so the filter should read: src port > 1024 and dst host 10.10.X.Y
• Make sure to select the correct source from Available Sources.
• Now download the large file from the noc box via ftp to pcY.ws.nsrc.org.
• See next slide for instructions…
See an FTP download from the NOC
Download FTP data to pcY
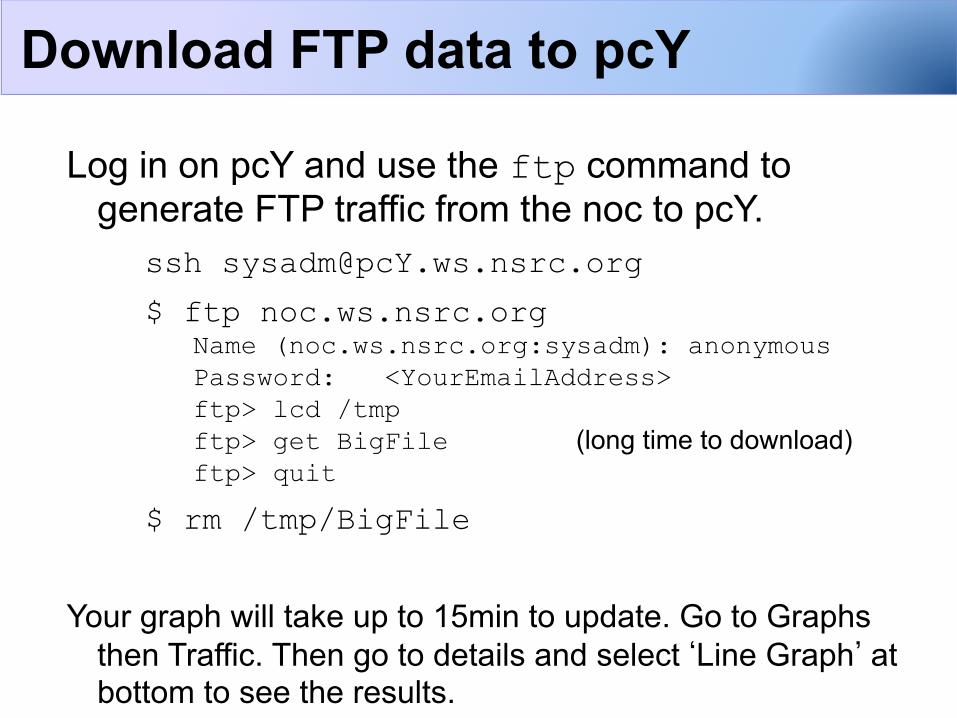
Log in on pcY and use the ftp command to generate FTP traffic from the noc to pcY.
$ ftp noc.ws.nsrc.org Name (noc.ws.nsrc.org:sysadm): anonymous Password: <YourEmailAddress> ftp> lcd /tmp ftp> get BigFile (long time to download) ftp> quit
$ rm /tmp/BigFile
Your graph will take up to 15min to update. Go to Graphs then Traffic. Then go to details and select ‘Line Graph’ at bottom to see the results.

Part 2
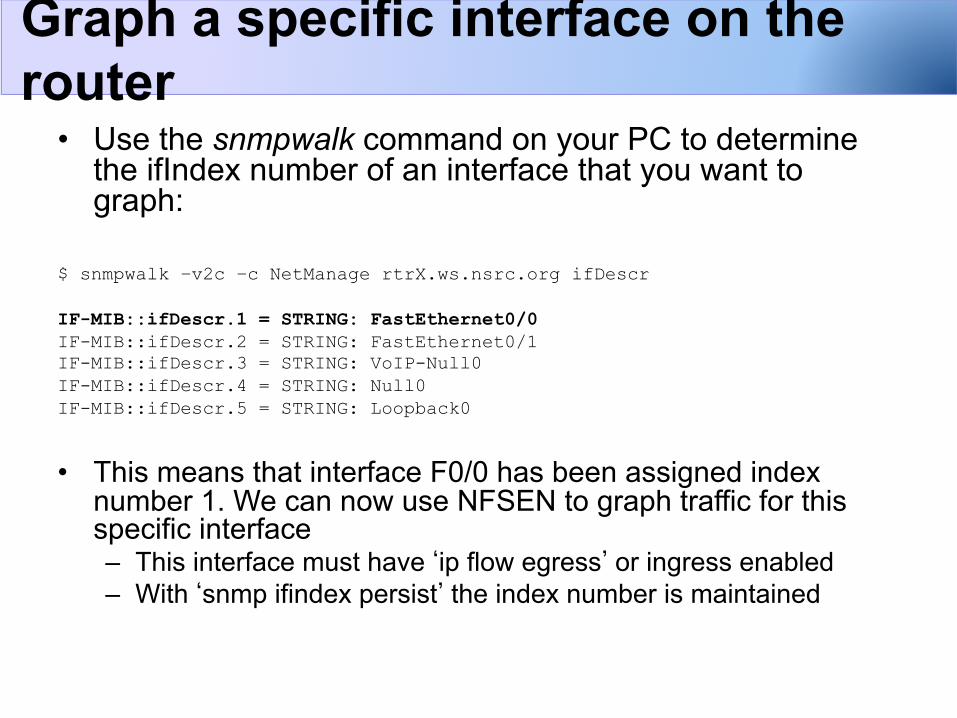
• Use the snmpwalk command on your PC to determine the ifIndex number of an interface that you want to graph:
$ snmpwalk –v2c –c NetManage rtrX.ws.nsrc.org ifDescr IF-MIB::ifDescr.1 = STRING: FastEthernet0/0 IF-MIB::ifDescr.2 = STRING: FastEthernet0/1 IF-MIB::ifDescr.3 = STRING: VoIP-Null0 IF-MIB::ifDescr.4 = STRING: Null0 IF-MIB::ifDescr.5 = STRING: Loopback0
• This means that interface F0/0 has been assigned index number 1. We can now use NFSEN to graph traffic for this specific interface – This interface must have ‘ip flow egress’ or ingress enabled – With ‘snmp ifindex persist’ the index number is maintained
Graph a specific interface on the router
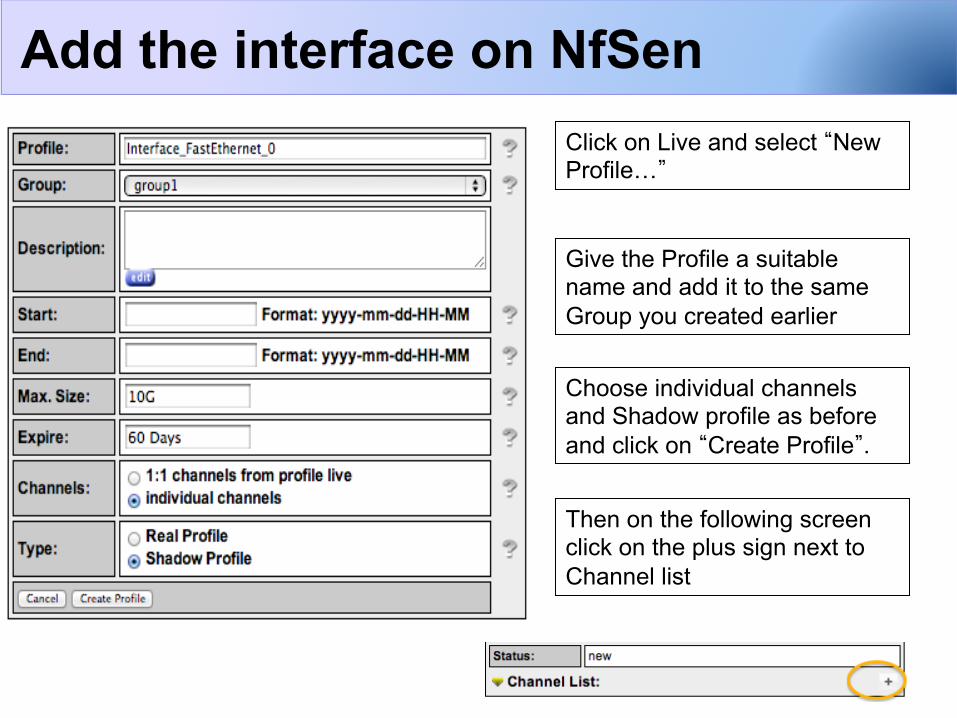
Give the Profile a suitable name and add it to the same Group you created earlier
Choose individual channels and Shadow profile as before and click on “Create Profile”.
Add the interface on NfSen Click on Live and select “New Profile…”
Then on the following screen click on the plus sign next to Channel list
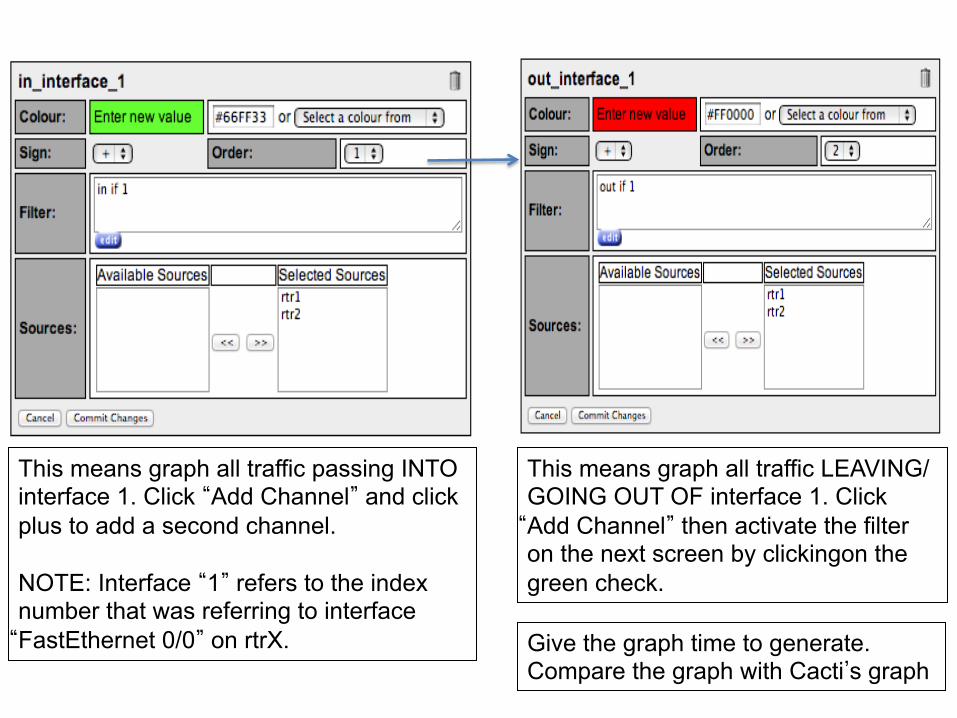
This means graph all traffic passing INTO interface 1. Click “Add Channel” and click plus to add a second channel. NOTE: Interface “1” refers to the index number that was referring to interface “FastEthernet 0/0” on rtrX.
This means graph all traffic LEAVING/GOING OUT OF interface 1. Click “Add Channel” then activate the filter on the next screen by clickingon the green check.
Give the graph time to generate. Compare the graph with Cacti’s graph
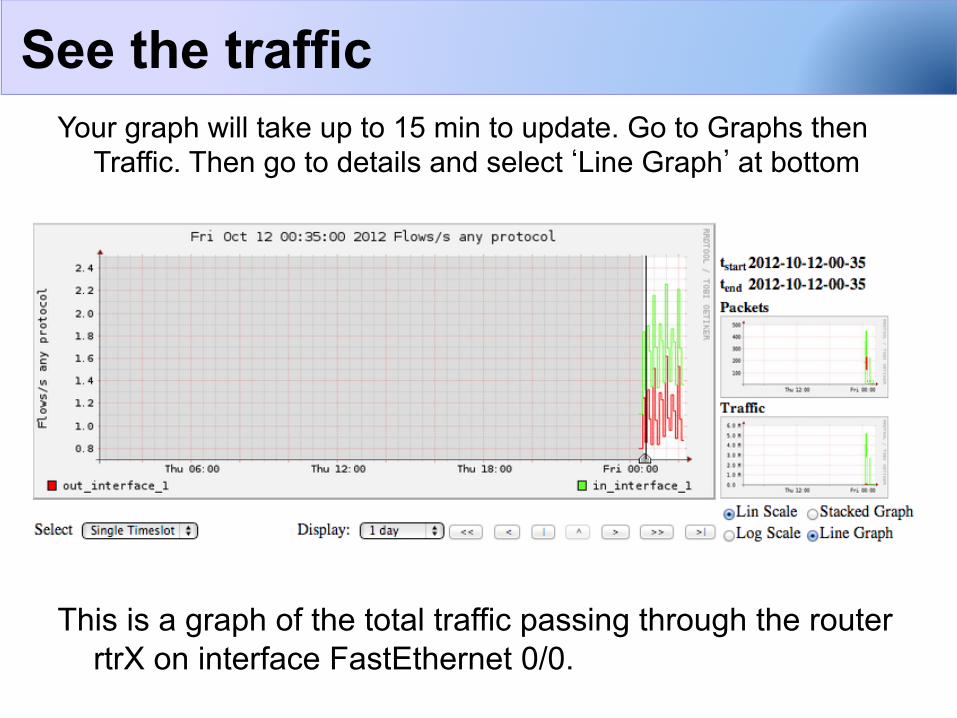
Your graph will take up to 15 min to update. Go to Graphs then Traffic. Then go to details and select ‘Line Graph’ at bottom
This is a graph of the total traffic passing through the router rtrX on interface FastEthernet 0/0.
See the traffic
rtrX
NfSen Cacti
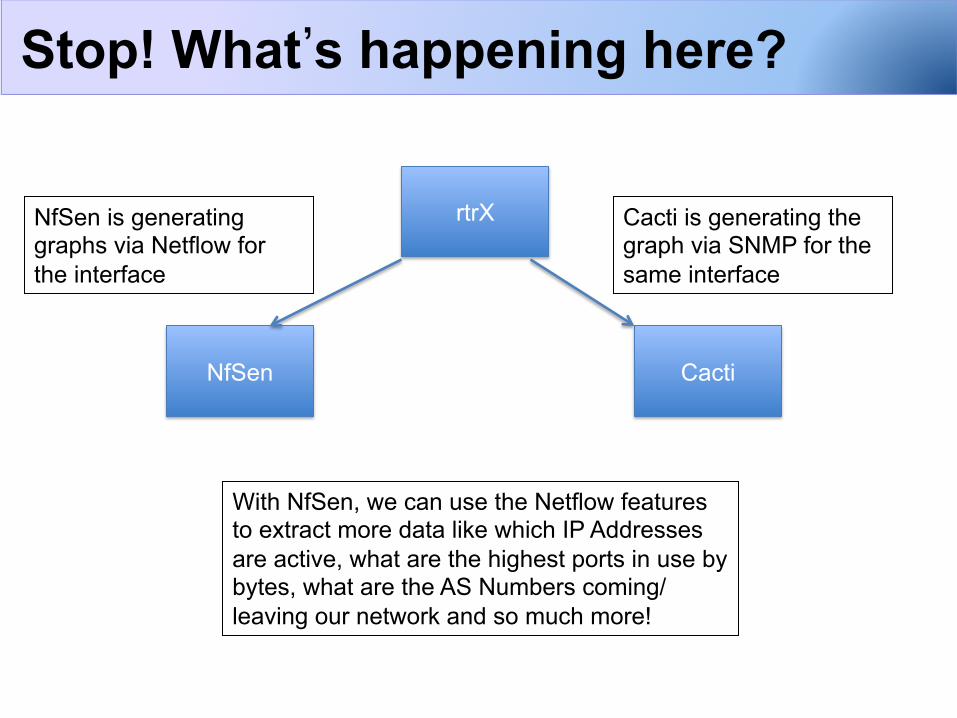
NfSen is generating graphs via Netflow for the interface
Cacti is generating the graph via SNMP for the same interface
With NfSen, we can use the Netflow features to extract more data like which IP Addresses are active, what are the highest ports in use by bytes, what are the AS Numbers coming/leaving our network and so much more!
Stop! What’s happening here?
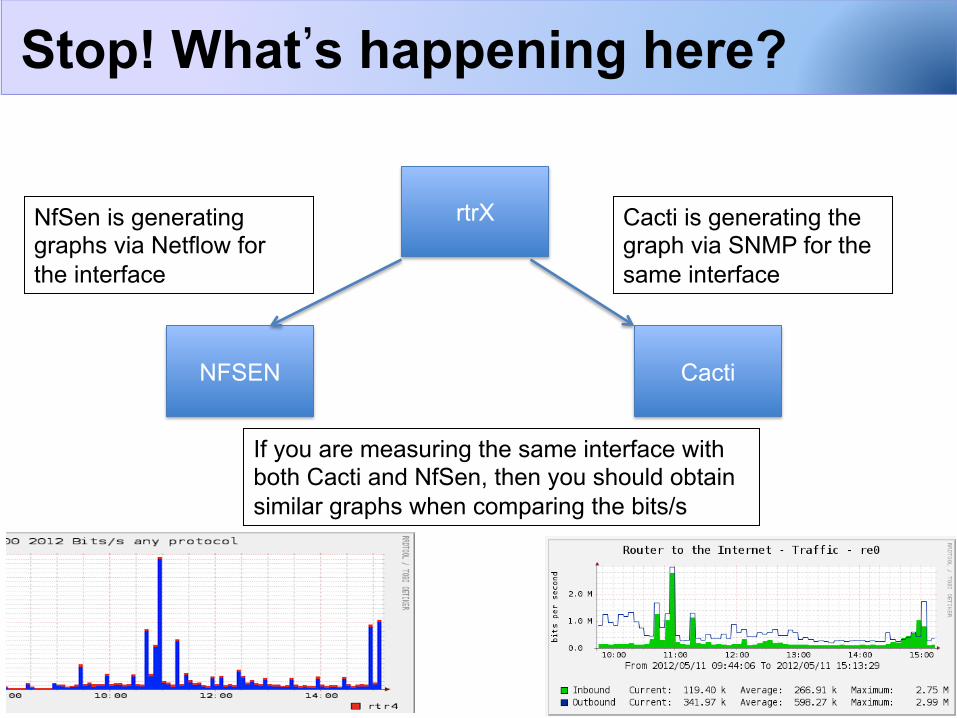
rtrX
NFSEN Cacti
NfSen is generating graphs via Netflow for the interface
Cacti is generating the graph via SNMP for the same interface
If you are measuring the same interface with both Cacti and NfSen, then you should obtain similar graphs when comparing the bits/s
Stop! What’s happening here?

Part 3
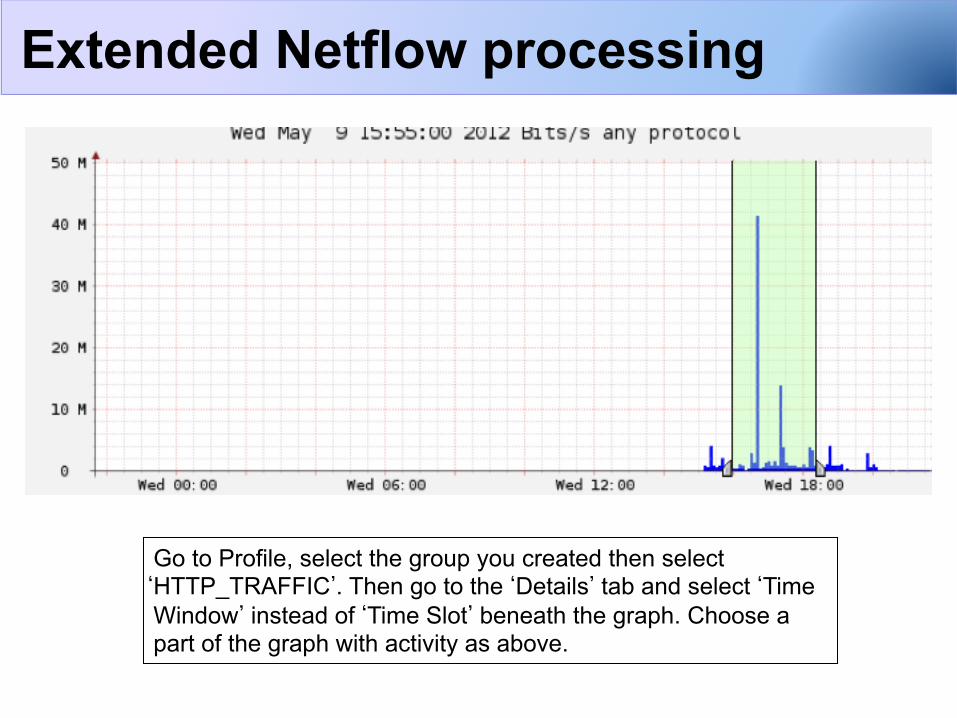
Go to Profile, select the group you created then select ‘HTTP_TRAFFIC’. Then go to the ‘Details’ tab and select ‘Time Window’ instead of ‘Time Slot’ beneath the graph. Choose a part of the graph with activity as above.
Extended Netflow processing
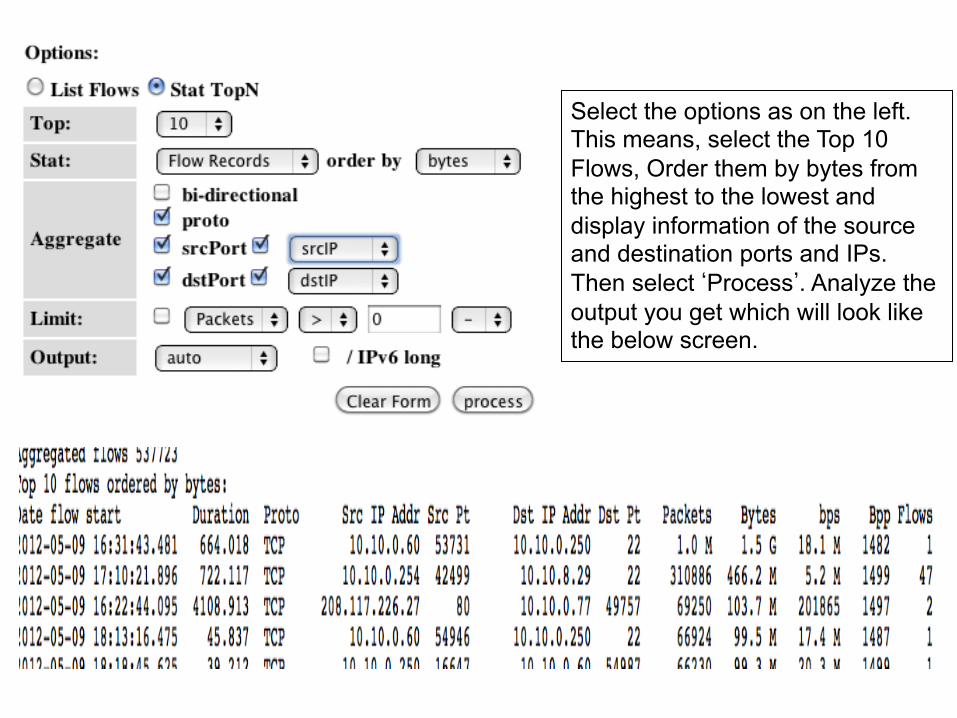
Select the options as on the left. This means, select the Top 10 Flows, Order them by bytes from the highest to the lowest and display information of the source and destination ports and IPs. Then select ‘Process’. Analyze the output you get which will look like the below screen.
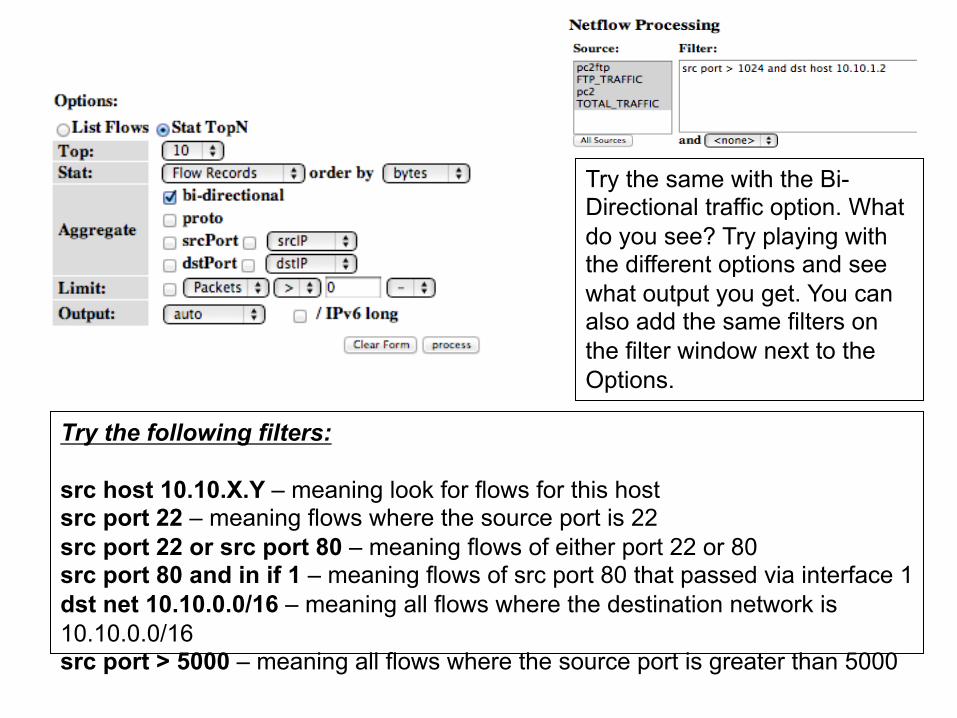
Try the same with the Bi-Directional traffic option. What do you see? Try playing with the different options and see what output you get. You can also add the same filters on the filter window next to the Options.
Try the following filters: src host 10.10.X.Y – meaning look for flows for this host src port 22 – meaning flows where the source port is 22 src port 22 or src port 80 – meaning flows of either port 22 or 80 src port 80 and in if 1 – meaning flows of src port 80 that passed via interface 1 dst net 10.10.0.0/16 – meaning all flows where the destination network is 10.10.0.0/16 src port > 5000 – meaning all flows where the source port is greater than 5000
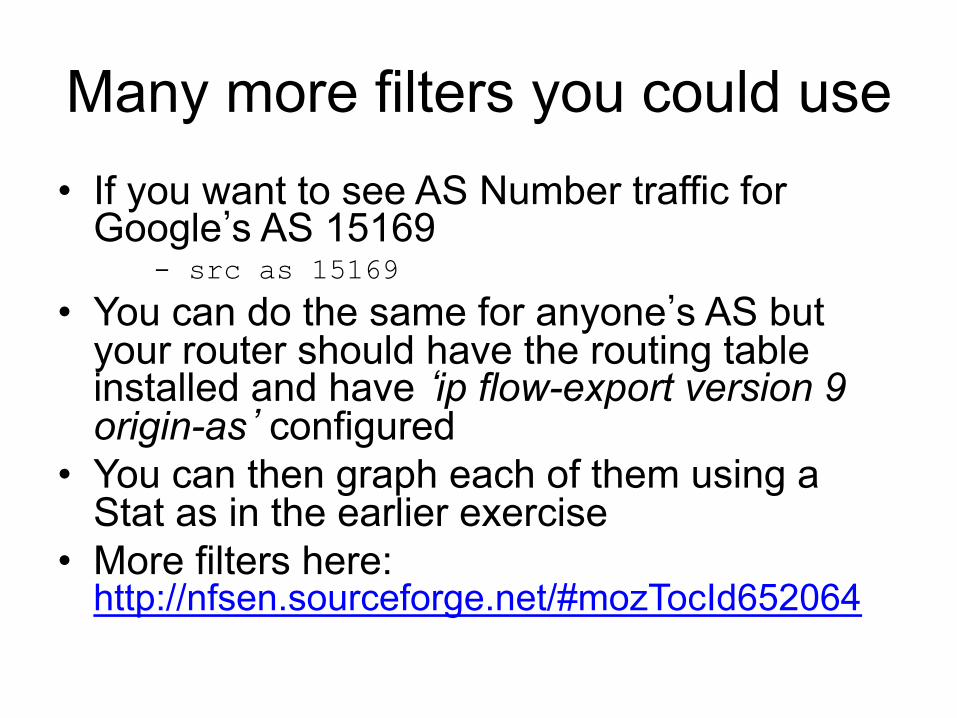
Many more filters you could use • If you want to see AS Number traffic for
Google’s AS 15169 - src as 15169
• You can do the same for anyone’s AS but your router should have the routing table installed and have ‘ip flow-export version 9 origin-as’ configured
• You can then graph each of them using a Stat as in the earlier exercise
• More filters here: http://nfsen.sourceforge.net/#mozTocId652064
ADDITIONAL/OPTIONAL Monitor a specific host
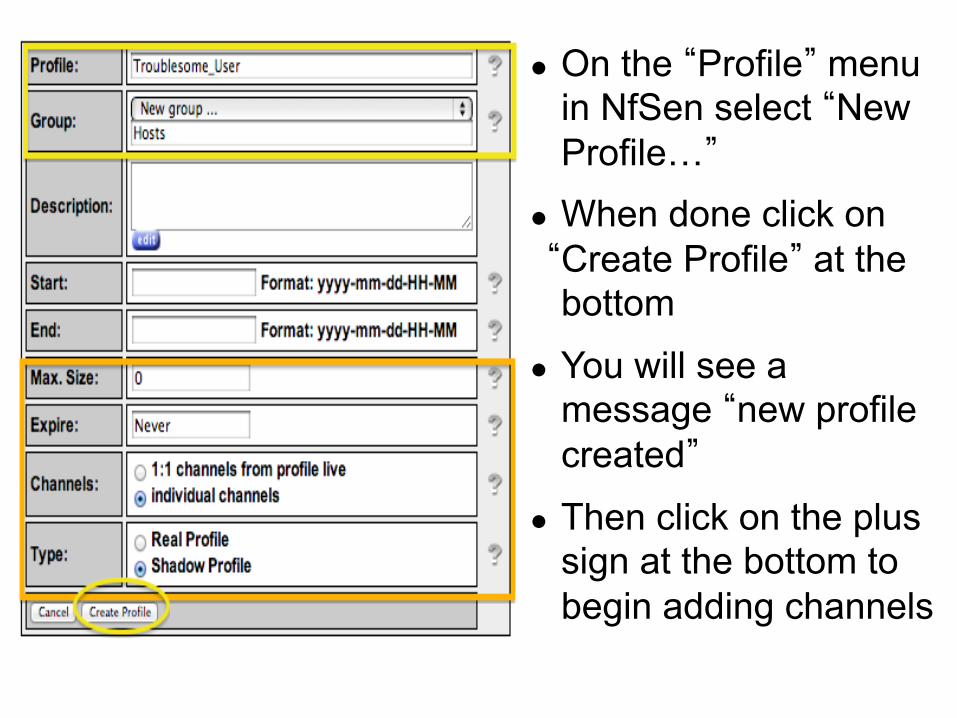
On the “Profile” menu in NfSen select “New Profile…”
When done click on “Create Profile” at the bottom
You will see a message “new profile created”
Then click on the plus sign at the bottom to begin adding channels
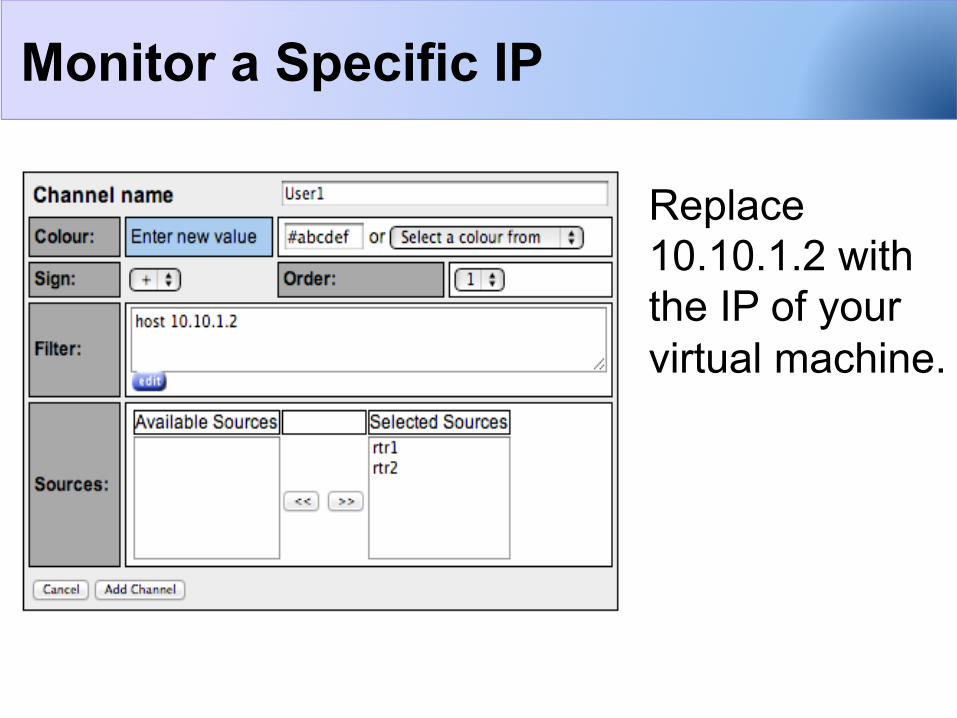
Monitor a Specific IP
Replace 10.10.1.2 with the IP of your virtual machine.
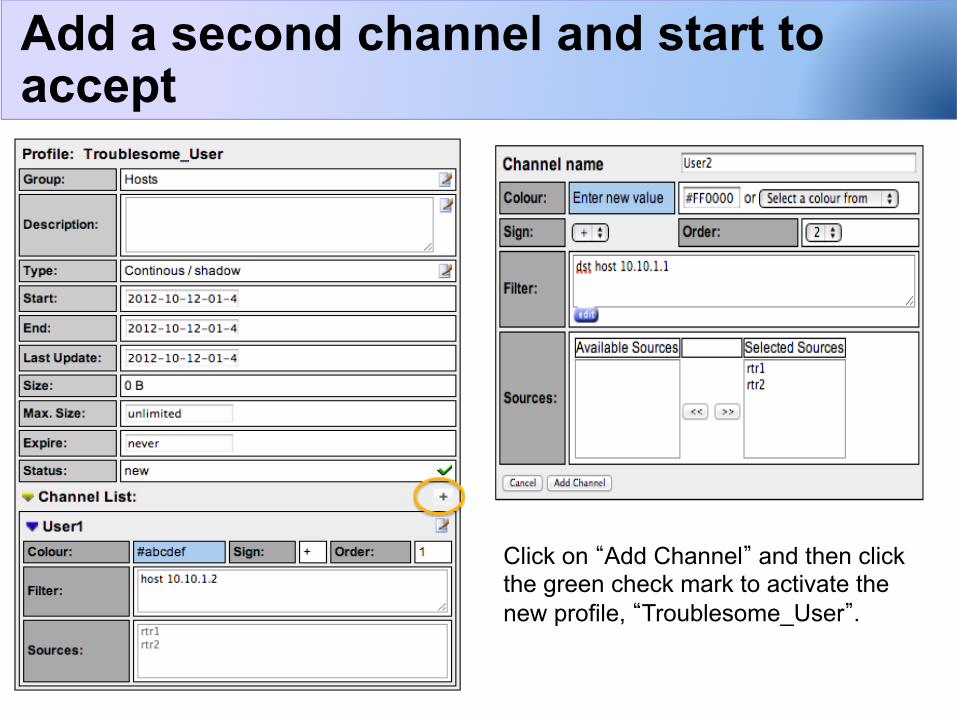
Add a second channel and start to accept
Click on “Add Channel” and then click the green check mark to activate the new profile, “Troublesome_User”.
Select a different color for the second channel so that the graphs can be distinguished
Note that the two filters are different - The first filter will capture any flows pertaining to host
one pc - The second filter will only capture flows where the host
the second pc is the DESTINATION host. - To generate traffic to see on graph details for this
profile try transferring files from the first host to the second host.
More attributes can be added here like src AS, dst AS, src ports etc based on the NfSen filter syntax
Filters
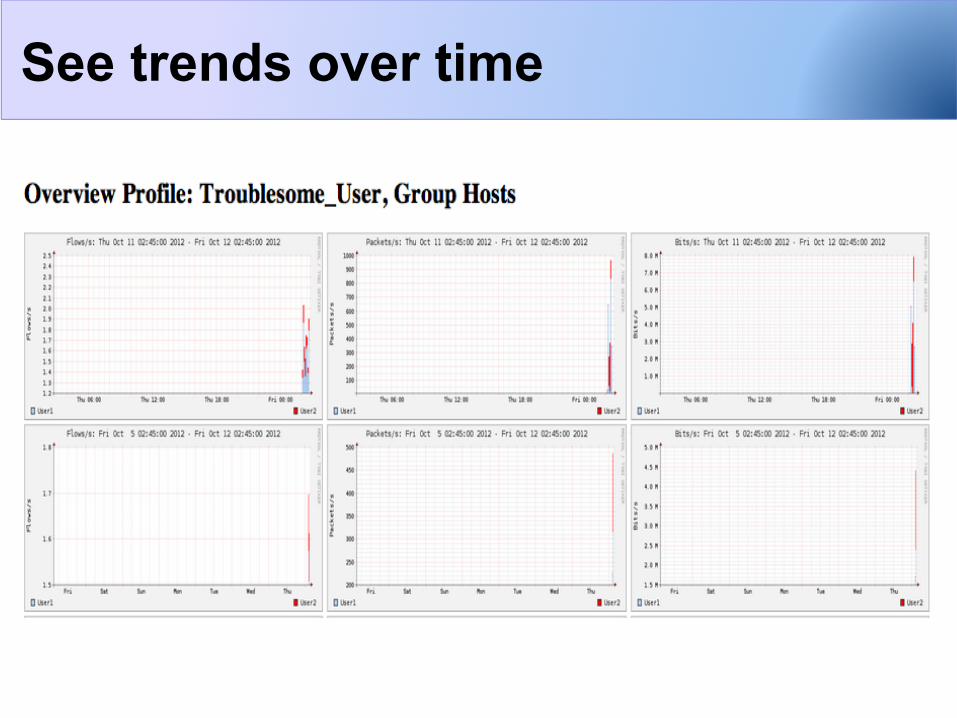
See trends over time
MOVE TO EXERCISE 3 PortTracker Plugin


