Embed Size (px)
Citation preview

ELSENIER Aquaculture 152 (1997) 273-285
Niacin requirement and inability of tryptophan to act as a precursor of NAD+ in channel catfish,
Ictalurus punctatus
Wing-Keong Ng, Giovanni Serrini ‘, Zhan Zhang, Robert P. Wilson *
Deparrment of Biochemistry and Molecular Biology, Mississippi State Uniuersity, Mississippi, MS 39762 USA
Accepted 3 1 October 1996
Abstract
Two separate experiments were conducted, firstly to determine the niacin requirement of channel catfish, and secondly to evaluate the efficacy of dietary tryptophan as a niacin precursor. In Experiment 1, purified diets containing graded levels of supplemental nicotinic acid (0, 3, 6, 9, 12, 15, 18, 21 and 24 mg per kg diet) were fed to channel catfish fingerlings for 12 weeks. The dietary niacin requirement for rapidly growing channel catfish was estimated to be 7.4 mg per kg diet. Fish that were fed diets without added niacin demonstrated poor growth, low feed intake, anaemia, lethargy, and mortality when stressed. Liver NAD concentrations increased linearly (r = 0.98) with increasing niacin supplementation in the diet, and did not plateau. In Experiment 2, 10 diets with different supplemental niacin and tryptophan combinations were formulated (niacin:tryptophan), 0:0, 5:0, lO:O, 15:0, 0:250, 0:500, 0:750, 5:250, lo:500 and 15:750 mg per kg diet, and fed to channel catfish fingerlings for 9 weeks. The addition of excess tryptophan in niacin-deficient diets did not significantly (P < 0.05) improve growth rates, feed efficiencies, haematocrits or liver NAD concentrations in channel catfish. Tryptophan is an inefficient precursor of dietary niacin for channel catfish. 0 1997 Elsevier Science B.V.
Keywords: Niacin; Tryptophan: Requirements; Channel catfish; NAD
* Corresponding author. ’ Present address: Instituto di Zootecnica Veterinaxia, Universita degli Studi di Milano, Via Trentacoste 2,
20134 Milan, Italy.
0044-8486/97/$17.00 0 1997 Elsevier Science B.V. All rights reserved.
PII SOO44-8486(96)01510-4

274 W.-K. Ng et al./Aquaculture 152 (19971273-285
1. Introduction
Niacin is essential for the optimal growth and health of fish. The signs of niacin deficiency in most fish species are loss of appetite, poor growth and increased mortality, but may also include photosensitivity or sunburn in rainbow trout (Poston and Wolfe, 1985), skin and fin lesions and haemorrhages in common carp (Aoe et al., 1967), deformed jaws and anaemia in channel catfish (Andrews and Murai, 1978), deformed snouts and gill edema in hybrid tilapia (Shiau and Suen, 1992), and abnormal swimming and ataxia in Japanese eels (Arai et al., 1972). The diverse effects of niacin deficiency in fish are not surprising, since niacin or its amide are used to form the pyridine nucleotides, NAD and NADP. These cofactors are well known to be involved in numerous metabolic reactions including critical roles in mitochondrial respiration and in the metabolism of amino acids, lipids, and carbohydrates. The role of NAD has also been expanded to include providing substrates for the ADP-ribosylation of proteins involved in DNA repair (Carson et al., 1987) and in the formation of cyclic ADP-ribose which is involved in calcium mobilization (Lee and Aarhus, 1991).
Published dietary niacin requirements in fish (on a per kg diet basis) seem to vary widely among species, from 10 mg for rainbow trout (Poston and Wolfe, 19851, 28 mg for common carp (Aoe et al., 1967), 63-83 mg for gilthead seabream (Morris and Davies, 1995), to 121 mg for hybrid tilapia (Shiau and Suen, 1992). Channel catfish fingerlings have been reported to require about 14 mg of niacin per kg diet (Andrews and Murai, 1978). Preliminary feeding trials in our laboratory indicated that the niacin requirement for channel catfish may be much lower than previously reported. The present study was therefore carried out to re-evaluate the niacin requirements for channel catfish.
Differences in the niacin requirement among land animals can primarily be attributed to the differences between species in their ability to utilize dietary tryptophan as a precursor of NAD(P) (National Research Council, 1987). Not much is known about the efficacy of tryptophan as a niacin precursor in different fish species. Tryptophan has been reported to be an inefficient precursor of niacin activity in several species of trout and salmon (Poston and DiLorenzo, 1973; Poston and Combs, 1980) based on the relative activities of two liver enzymes, 3-hydroxyanthranilic acid oxygenase (3HAA) and picolinic acid carboxylase (PC), which are involved in the pathway of conversion of tryptophan to NAD(P). Other researchers have suggested that the same conversion inefficiency may exist in channel catfish (Andrews and Murai, 1978) and hybrid tilapia (Shiau and Suen, 1992), based on the fact that niacin deficiency signs were induced in fish fed niacin-deficient diets, despite the high protein diets used in their studies. On the basis of this indirect evidence, fish are generally believed to be incapable of synthesizing NAD(P) from tryptophan. However, more recent work by Chuang (199 1) recorded 3HAA/PC ratios which indicated that carp, tilapia, red seabream, black seabream and milkfish may have the capacity to synthesize NAD(P) from tryptophan. It is currently unknown to what extent fish may depend on tryptophan as a source of niacin. The second objective of the present study was to evaluate the efficacy of tryptophan as a NAD(P) precursor, based on growth, absence of deficiency signs and liver NAD levels in rapidly growing channel catfish fingerlings.
W.-K. Ng et al. /Aquaculture 152 (19971273-285 215
2. Materials and methods
2.1. Diet preparation
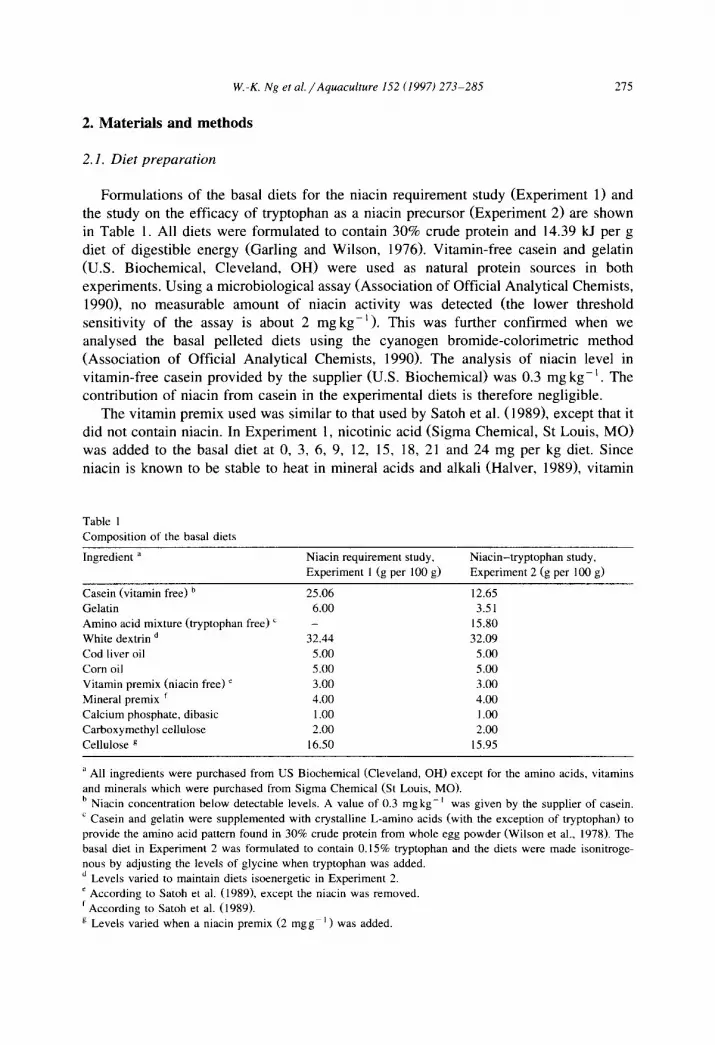
Formulations of the basal diets for the niacin requirement study (Experiment 1) and the study on the efficacy of tryptophan as a niacin precursor (Experiment 2) are shown in Table 1. All diets were formulated to contain 30% crude protein and 14.39 kJ per g diet of digestible energy (Garling and Wilson, 1976). Vitamin-free casein and gelatin (U.S. Biochemical, Cleveland, OH) were used as natural protein sources in both experiments. Using a microbiological assay (Association of Official Analytical Chemists, 1990), no measurable amount of niacin activity was detected (the lower threshold sensitivity of the assay is about 2 mg kg-‘). This was further confirmed when we analysed the basal pelleted diets using the cyanogen bromide-calorimetric method (Association of Official Analytical Chemists, 1990). The analysis of niacin level in vitamin-free casein provided by the supplier (U.S. Biochemical) was 0.3 mg kg-‘. The contribution of niacin from casein in the experimental diets is therefore negligible.
The vitamin premix used was similar to that used by Satoh et al. (19891, except that it did not contain niacin. In Experiment 1, nicotinic acid (Sigma Chemical, St Louis, MO) was added to the basal diet at 0, 3, 6, 9, 12, 15, 18, 21 and 24 mg per kg diet. Since niacin is known to be stable to heat in mineral acids and alkali (Halver, 1989), vitamin
Table 1
Composition of the basal diets
Ingredient a
Casein (vitamin free) b
Gelatin
Amino acid mixture (tryptophan free) ‘
White dextrin d
Cod liver oil
Corn oil
Vitamin premix (niacin free) ’
Mineral premix ’ Calcium phosphate, dibasic
Carboxymethyl cellulose
Cellulose B
Niacin requirement study, Niacin-tryptophan study, Experiment 1 (g per 100 g) Experiment 2 (g per 100 g)
25.06 12.65 6.00 3.51
- 15.80 32.44 32.09
5.00 5.00 5.00 5.00 3.00 3.00 4.00 4.00 1 .oo 1 .OO 2.00 2.00
16.50 15.95
a All ingredients were purchased from US Biochemical (Cleveland, OH) except for the amino acids, vitamins
and minerals which were purchased from Sigma Chemical (St Louis, MO).
b Niacin concentration below detectable levels. A value of 0.3 mgkg-’ was given by the supplier of casein. ’ Casein and gelatin were supplemented with crystalline L-amino acids (with the exception of tryptophan) to
provide the amino acid pattern found in 30% crude protein from whole egg powder (Wilson et al., 1978). The basal diet in Experiment 2 was formulated to contain 0.15% tryptophan and the diets were made isonitroge-
nous by adjusting the levels of glycine when tryptophan was added. ’ Levels varied to maintain diets isoenergetic in Experiment 2.
’ According to Satoh et al. (19891, except the niacin was removed.
’ According to Satoh et al. (1989).
g Levels varied when a niacin premix (2 mgg- ’ ) was added.

216 W.-K. Ng et al. /Aquaculture I52 (1997) 273-285
losses during diet preparation and storage should be minimal. The diets were prepared by mixing the dry ingredients with cod liver oil, corn oil and water in a Hobart mixer and the resultant moist mash extruded through a 2-mm die. The moist pellets were then oven-dried with forced air at room temperature to about 10% moisture, ground in a food blender and stored frozen at -20°C until needed. Morris and Davies (1995) reported minimal niacin losses using a similar diet preparation procedure resulting in dietary niacin levels which were close to the formulated content.
In Experiment 2, casein and gelatin were supplemented with crystalline L-amino acids (Sigma Chemical), with the exception of tryptophan, to provide the amino acid pattern found in 30% crude protein from whole egg powder (Wilson et al., 1978). Casein and gelatin levels were adjusted to provide 0.15% tryptophan in the basal diet. This is equivalent to 0.5% of the dietary protein which is the tryptophan requirement reported for fingerling channel catfish (Wilson et al., 1978). Since the tryptophan requirement was determined in channel catfish that were fed diets containing excess niacin (Wilson et al., 19781, dietary tryptophan in the basal diet was presumed to be just adequate for protein accretion and serotonin synthesis only. It is important that any excess tryptophan in the diet be minimized so that maximal growth responses can be obtained from added NAD(P) precursor compounds in the niacin-deficient basal diet (Oduho and Baker, 1993).
Assuming a conversion efficiency (wt/wt) of about 2% (50: 1) of tryptophan to niacin activity based on studies with chickens (Oduho and Baker, 1993), 10 experimental diets with different supplemental niacin and tryptophan combinations were formulated (niacin:tryptophan mg per kg diet); O:O, 5:0, lO:O, 15:0, 0:250, 0:500, 0:750, 5:250, lo:500 and 15:750. Diets l-4 had graded niacin levels without supplemental tryptophan; diets 5-7 had no niacin but with added tryptophan equal to the niacin levels in diets 2, 3 and 4, respectively, assuming a conversion efficiency of 2%; and diets 8 to 10 had both added niacin and tryptophan, to see if there is any feedback regulation of tryptophan conversion to NAD(P). Diets were made isonitrogenous by adjusting the levels of glycine as tryptophan levels increased. During the mixing of dietary ingredients, 6 N NaOH was added to establish a pH of about 7.0 units (Wilson et al., 1978). Diets were then prepared and stored as in Experiment 1.
2.2. Experimental procedure
Channel catfish (Zctalurus punctatus) fingerlings were obtained from the Mississippi Agricultural Experiment Station, MS, and were reared to experimental size in our Fish Nutrition Laboratory. All fish in the present study were maintained and handled humanely according to protocols developed in our laboratory. Prior to the start of Experiment 1, all experimental fish were acclimatized to the basal diet for two weeks. Catfish used in Experiment 2 underwent a shorter l-week conditioning period due to their larger initial size. The experiments were conducted in 27 (in Experiment 1) and 30 (in Experiment 2) 1 lo- 1 fl ow-through aquaria with a flow rate of about 900 ml mitt- ‘. Water temperature in both experiments was maintained at 28 + 2°C. Fluorescent lighting provided a diurnal 1ight:dark cycle of 14:lO.
At the start of the experiment, 20 catfish fingerlings (mean weight 5.6 f 0.1 g) in

W.-K. Ng et al. /Aquaculture 152 (1997) 273-285 211
Experiment 1, and 16 fish (mean weight 16.1 f 0.2 g) in Experiment 2, were stocked into each aquarium. The nine dietary treatments of graded niacin levels in Experiment 1 and the 10 dietary treatments of different niacin and tryptophan combinations in Experiment 2 were then fed to randomly assigned (by drawing lots) triplicate groups of fish. All fish were fed at a rate of 3% of their body weight per day in two equal feedings. Fish were batch-weighed by aquarium once every week and the daily ration adjusted accordingly. A prophylactic treatment of acriflavin (about 3 mgl-‘, Sigma Chemicals) was administered after each weighing, to reduce bacteriological infestation caused by handling (Garling and Wilson, 1976). Experiment 1 was conducted for 12 weeks and Experiment 2 for 9 weeks.
2.3. Sample collection and analysis
At the end of each feeding trial, all fish were killed by an over-exposure to tricaine methanesulfonate (MS222, Argent Laboratory Inc., Redmond, WA) and weighed. Blood was collected by severing the caudal peduncle of each fish, and haematocrits were estimated by the microcentrifugation method. Livers from five fish per aquarium were removed, pooled and stored frozen at -90°C for NAD assay. Pooled liver samples (about 1 g) were homogenized in 9 ml of ice-cold diluted hydrogen peroxide (5 g H,O, per 100 g) to oxidize the reduced nucleotides (Oduho and Baker, 1993). Subsequent acid extraction and spectrophotometric determination of NAD were carried out as described by Klingenberg (1974).
2.4. Statistical methods
Final fish weight, weight gain (expressed as the percent of initial body weight at the end of the experiment), specific growth rate [(ln final weight - In initial weight)/time in days], feed efficiency (wet weight gain/total dry diet fed), protein efficiency ratio (wet weight gain/total protein intake), survival, haematocrits and liver NAD concentrations were all subjected to one-way analysis of variance (SAS Institute, Cary, NC) to determine if significant differences occured in fish fed different diets. Differences between means were assessed by Duncan’s multiple range test (Duncan, 1955). Effects with a probability of P < 0.05 were considered significant. An estimation of the dietary niacin requirement, based on percentage weight gain in Experiment 1, was conducted by the broken-line analysis technique (Robbins et al., 1979). Regression analysis between dietary niacin and liver NAD levels in Experiment 1 was performed using Lotus l-2-3 (version 3.1, Lotus, Cambridge, MA).
3. Results
3.1. Experiment I
Growth rates of all fish fed the different experimental diets were similar during the first 5 weeks of the feeding trial. All diets were consumed quickly and there were no

278 W.-K. Ng et al./Aquaculture 152 (19971273-285
mortalities during this period. After 5 weeks, growth rates and feed intake in fish fed the unsupplemented basal diet began to drop drastically (data not shown). At this time, mortalites started to occur in these fish and also in fish fed diets with 3 mg niacin per kg diet, mainly associated with stress after the weekly weighings. After 8 weeks, growth rates and feed intake in fish fed diets supplemented with 3 mg niacin per kg diet became significantly lower (data not shown). Fish in all other dietary treatments continued to consume their feed vigorously and remained healthy until the end of the experiment.
Fish fed diets without added niacin and with 3 mg niacin per kg diet appeared lethargic and convulsions or muscle spasms usually preceded death or temporary body paralysis. No other gross deficiency signs were observed. Significantly higher mortali- ties were observed in fish fed the unsupplemented diet and diets with 3 mg niacin per kg diet compared to fish fed higher levels of niacin. The addition of 6 mg niacin per kg diet significantly increased survival. Very few or no mortalities occured in fish fed diets containing 6 mg niacin per kg diet or at higher niacin levels.
Weight gains, specific growth rates, feed efficiency and protein efficiency ratios responded significantly (P < 0.05) to niacin additions up to 9 mg per kg diet (Table 2). No further significant growth or feed efficiency response was obtained from higher niacin supplementation in the diet. Fish fed diets containing 9 mg niacin per kg diet and above showed excellent growth (about 800% average weight gains) and feed efficiency.
Significantly lower haematocrits were observed in fish fed the unsupplemented basal diet (Table 2). The addition of 3 mg niacin per kg diet significantly increased the haematocrit levels. No significant differences were observed between the haematocrits of fish fed 3 mg niacin per kg diet or fish fed higher niacin levels.
Liver NAD concentrations in fish fed diets containing 0, 3 and 6 mg niacin per kg
Table 2
Growth performance, survival and haematocrit levels of channel catfish fingerlings fed purified diets
supplemented with various niacin levels for 12 weeks in Experiment 1 a
Niacin Final weight
(mg per kg diet) (g)
0 10.8’
3 23.9’
6 43.9’
9 50.8’
12 50.9’
15 50.6’ 18 50.2’
21 50.4’ 24 48.7’
Pooled s.e.m. 4.6
Weight gain b
(%I
92.24
323.1’
675.0*
799.1’
811.3’
796.7’ 790.3’
806.0’ 770. 1’.2
82.1
SGR ’
(8 per day)
0.7g4
1.72’
2.44?
2.61’
2.63’
2.61’ 2.60’ 2.62 ’ 2.57’,’
0.20
FERd PER ’
0.1g4
0.48’
0.89’
1.02’
1.04’
1.03’ 1.00’
1.02’
1.01’
0.09
o.594
1.613
298’
3.39’
3.45 ’ 3.42 ’ 3.35’
3.42 ’ 3.37’ 0.32
Survival
(%I
80.0’
86.62
96.6’
98.3’
100.0’
100.0’ loo.0
100.0’
100.0’ 2.3
Haematocrit
levels
f%)
26.4?
31.1’
31.92
33.2’,’
33.8’,*
32.6’,* 35.2’
35.7’ 33.4’,?
0.8
a Values are the mean of triplicate groups of 20 fish. Average initial body weight of individual fish was 5.6 g.
Mean values in columns with different superscripts are significantly different (P < 0.05).
b Expressed as the percent of initial body weight at the end of 12 weeks.
’ Specific growth rate = [(ln final weight - In initial weight)/time in days] X 100.
d Feed efficiency ratio = wet weight gain (g)/total dry weight of diet fed (8).
’ Protein efficiency ratio = wet weight gain (g)/total protein intake (8).

W.-K. Ng et al./Aquaculture 152 (19971 273-285 219
0.50 ,
I a
=‘ f .F 0.40
$
5 0.30 w
s
B 9 0.20
z
z 3 0.10
0.00
0 3 6 9 12 15 16 21 24
Added niacin (mg/kg diet)
Fig. I. Liver NAD concentrations in channel catfish fingerlings fed graded levels of niacin for 12 weeks.
Values are means+s.e. of triplicate groups of pooled livers from five fish. Bars with different letters are
significantly different, P < 0.05.
diet were the lowest and were not significantly different among themselves (Fig. 1). A significant increase in liver NAD was observed in fish fed the 9 mg niacin per kg diet. Liver NAD concentrations continued to increase in fish fed increasing levels of dietary niacin. When regression analysis was performed on the amount of niacin in the diet (mg per kg diet) versus liver NAD concentration (km01 per g wet weight), a good fit resulted (r = 0.98). Liver NAD responded linearly to niacin supplementation within the range tested. The regression equation obtained was y = 0.014~ + 0.104 (where y = NAD concentration in liver and x = niacin concentration in the diet).
Using the one-slope broken line analysis model of Robbins et al. (1979) the dietary niacin requirement for channel catfish based on percentage weight gains was estimated to be 7.4 mg niacin per kg diet. This amount of niacin was estimated to be adequate for maximum growth of channel catfish fingerlings.
3.2. Experiment 2
In this 9-week study, growth and feed intake of fish fed diets without niacin supplementation (diets 1, 5, 6 and 7) were observed to decrease markedly after 7 weeks of feeding. Fish in all other groups consumed their feed vigorously. Fish appeared healthy and no gross deficiency signs were observed in fish in all dietary groups, including those without niacin supplementation. Mortalities were not significantly different among the 10 dietary groups (Table 3).
In general, fish fed diets without added niacin had the lowest specific growth rate, and feed efficiency ratios which were mostly not significantly lower than those fish fed only added niacin (diets 2-4) but were significantly lower than fish that were fed both
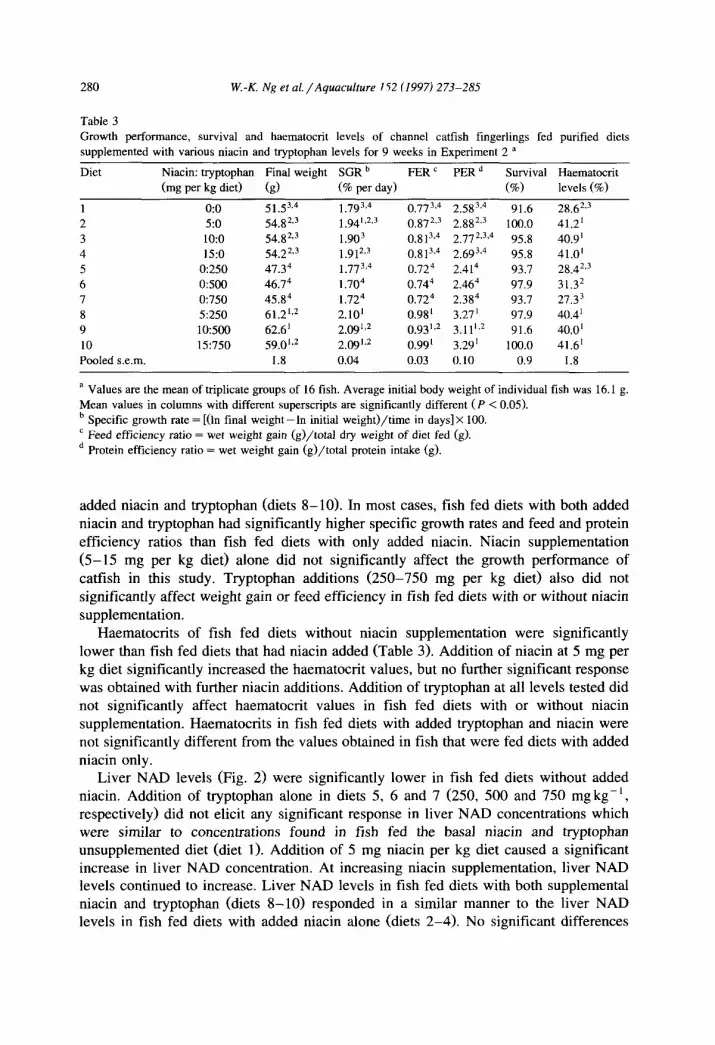
280 W.-K. Ng et al./Aguaculture 172 (1997) 273-285
Table 3
Growth performance, survival and haematocrit levels of channel catfish fingerlings fed purified diets
supplemented with various niacin and tryptophan levels for 9 weeks in Experiment 2 a
Diet Niacin: tryptophan Final weight SGR b FER’ PER* Survival Haematoctit
(mg per kg diet) (g) (% per day) (%o) levels (%o)
1 0:O 51.53,4 l.793,4 0.773,4 2.583.4 91.6 28.62.3
2 5:o 54.82,3 1.94’,2,3 0 872,3
O:813.4
2.882.3 100.0 41.2’
3 lo:o 54.82,3 1.903 2.772,3,4 95.8 40.9’
4 15:o 54.22,3 1.912.3 0.813,4 2.693,4 95.8 41.0’
5 0:250 47.34 1.773,4 0.724 2.414 93.7 28.42s3
6 0:500 46.74 1.704 o.744 2.464 97.9 31.32
7 ‘I750 45.84 l.724 0.724 2.384 93.7 27.33
8 5:250 61.2’~’ 2.10’ 0.98’ 3.27’ 97.9 40.4’
9 10:500 62.6’ 2.09’,’ 0.93’32 3.11’J 91.6 40.0’
10 15:750 59.0’*2 2.09’J 0.99’ 3.29’ 100.0 41.6’
Pooled s.e.m. 1.8 0.04 0.03 0.10 0.9 1.8
a Values are the mean of triplicate groups of 16 fish. Average initial body weight of individual fish was 16.1 g.
Mean values in columns with different superscripts are significantly different (P < 0.05).
b Specific growth rate = [(ln final weight-In initial weight)/time in days] X 100.
’ Feed efficiency ratio = wet weight gain (g)/total dry weight of diet fed (g).
* Protein efficiency ratio = wet weight gain (g)/total protein intake (g).
added niacin and tryptophan (diets 8-10). In most cases, fish fed diets with both added niacin and tryptophan had significantly higher specific growth rates and feed and protein efficiency ratios than fish fed diets with only added niacin. Niacin supplementation (5-15 mg per kg diet) alone did not significantly affect the growth performance of catfish in this study. Tryptophan additions (250-750 mg per kg diet) also did not significantly affect weight gain or feed efficiency in fish fed diets with or without niacin supplementation.
Haematocrits of fish fed diets without niacin supplementation were significantly lower than fish fed diets that had niacin added (Table 3). Addition of niacin at 5 mg per kg diet significantly increased the haematocrit values, but no further significant response was obtained with further niacin additions. Addition of tryptophan at all levels tested did not significantly affect haematocrit values in fish fed diets with or without niacin supplementation. Haematocrits in fish fed diets with added tryptophan and niacin were not significantly different from the values obtained in fish that were fed diets with added niacin only.
Liver NAD levels (Fig. 2) were significantly lower in fish fed diets without added niacin. Addition of tryptophan alone in diets 5, 6 and I (250, 500 and 750 mg kg-‘, respectively) did not elicit any significant response in liver NAD concentrations which were similar to concentrations found in fish fed the basal niacin and tryptophan unsupplemented diet (diet 1). Addition of 5 mg niacin per kg diet caused a significant increase in liver NAD concentration. At increasing niacin supplementation, liver NAD levels continued to increase. Liver NAD levels in fish fed diets with both supplemental niacin and tryptophan (diets S-10) responded in a similar manner to the liver NAD levels in fish fed diets with added niacin alone (diets 2-4). No significant differences

W.-K. Ng et al./Aquaculture 152 (1997) 273-285 281
s M
0.32 t a ‘8. 3 I abc
_ T
_.-_ 0:0 5:0 1o:o 15:o omo 0:500 0:750 5250 10:50015:750
Added niacixtryptophan (mg/kg diet)
Fig. 2. Liver NAD concentrations in channel catfish fingerlings fed various combinations of dietary niacin and
L-tryptophan for 9 weeks. Values are means + s.e. of triplicate groups of pooled livers from five fish. Bars
with different letters are significantly different, P < 0.05.
were observed in the liver NAD concentrations between these two groups of fish at each similar niacin level. Supplemental tryptophan did not have any significant effects.
4. Discussion
The dietary niacin requirement for rapidly growing channel catfish fingerlings was estimated to be 7.4 mg per kg diet. This value is about half of the previous reported niacin requirement for channel catfish (14 mg per kg diet; Andrews and Murai, 1978). Percentage weight gains, specific growth rates and feed efficiencies of fish fed niacin- sufficient diets in the present study were much higher than those reported by Andrews and Murai (1978). Initial fish size, duration of experiment and water temperature used in Experiment 1 of the present study were similar to that of Andrews and Murai (1978). The lower niacin requirement value obtained in the present study could therefore be mainly attributed to the different basal diet formulation and feeding protocol used. Andrews and Murai (1978) fed the fish twice a day (3% of their body weight) during weekdays but only once a day (2% of their body weight) during the weekends. Furthermore, all fish in the study of Andrews and Murai (1978) were weighed and their rations adjusted accordingly every 4 weeks. In Experiment 1 of the present study, all fish were fed twice a day at 3% of their body weight every day and their rations adjusted weekly. This may partly account for the much higher percentage weight gains of channel catfish observed in Experiment 1 of the present study compared to those reported by Andrews and Murai (1978). The niacin requirement value of channel catfish estimated from the present study was based on fish showing much better growth rates than those

282 W.-K. Ng et al./Aquaculture 152 (1997) 273-285
reported by Andrews and Murai (1978). Markedly different niacin requirement values (ranging from 1 to 150 mg per kg diet) have also been reported for the rainbow trout by different researchers (McLaren et al., 1947; Phillips and Brockway, 1947; Poston and Wolfe, 1985; Halver, 1989).
The niacin requirement of 7.4 mg per kg diet for the adequate growth of channel catfish was further confirmed by feed and protein efficiency ratios which paralleled the growth response of fish to added niacin in Experiment 1. Mortality and lethargy of fish were prevented by about 6 mg niacin per kg diet. Anaemia was prevented by as low as 3 mg niacin per kg diet. All these results would seem to suggest that channel catfish require less than 10 mg niacin per kg diet for optimum growth, feed efficiency, survival and prevention of deficiency signs.
A primary determinant of the variation in the niacin requirements of non-ruminant land vertebrates is in their ability to utilize dietary tryptophan as a precursor of NAD(P) (National Research Council, 1987). Results reported here in Experiment 2 provided direct evidence of the inability of dietary tryptophan to act as a precursor of NAD(P) in channel catfish. The same may be true in certain salmonid fish based on indirect liver enzyme evidence (Poston and DiLorenzo, 1973; Poston and Combs, 1980). Niacin deficiency signs have also been observed to occur relatively quickly in most fish species studied to date despite being fed high protein diets, which indirectly points to their lack of ability to utilize dietary tryptophan as a source of niacin.
The low niacin requirement determined for channel catfish is noteworthy from the standpoint of fish nutrition, as it brings into question the niacin requirements reported for other fish species which are well above this estimated value. Since the current literature (National Research Council, 1993) seems to indicate that most if not all fish species cannot efficiently utilize tryptophan as a source of NAD(P), another metabolic basis, if any, needs to be given to explain the wide variations in niacin requirements reported. Even though there may be some inherent species differences in niacin requirements, we believe that the wide range of reported niacin values for fish are mainly due to differences in experimental diets and conditions. For example, Shiau and Suen (1992) reported that the dietary niacin requirement for tilapia was 26 mg per kg diet in fish fed a glucose diet, whereas 121 mg niacin per kg diet was needed in fish fed a dextrin diet. A mere change in one dietary ingredient, in this case the type of carbohydrate, altered the niacin requirement of tilapia almost five-fold.
Some studies (Phillips and Brockway, 1947; Halver, 1989; Shimeno, 1991) have used maximal liver storage to define niacin requirement in fish. From Experiment 1 of the present study, liver NAD levels were observed to increase linearly with increasing levels of dietary niacin (Fig. 1) within the range tested. Work on rats indicates that liver NAD levels do not plateau, but continue to increase even at pharmacological doses of dietary niacin (Jackson et al., 1995). Liver storage of niacin would therefore not be a good basis for determining the niacin requirement in fish for optimal growth.
Fish fed the unsupplemented and 3 mg niacin per kg diets in Experiment 1 appeared lethargic and remained stationary at the bottom of the aquarium. No other gross deficiency signs were observed. In the last few weeks of the 12-week study, feed intake was drastically reduced and outright feed refusal was observed in fish fed the unsupple- mented basal diet. Body convulsions or muscle spasms preceded by imminent death or

W.-K. Ng et al./Aquaculture 152 (1997) 273-285 283
temporary paralysis often occurred in fish fed these two diets when the fish were stressed. This observation and the general weakness of the fish fed the niacin-deficient
diets is consistent with the critical roles NAD and NADP play in the synthesis of high energy phosphate bonds which furnish energy for intermediary metabolism and other normal physiological functions in animals. It is also posssible that some of the deficiency signs may be due to decreased post-translational modification of proteins with mono or poly(ADP-ribose) or through changes in the formation of cyclic(ADP- ribose), which all require NAD+ as a substrate.
Dupree (1966) reported tetany, high mortality after stress, lethargy and reduced coordination as niacin deficiency signs for channel catfish. These signs reported by Dupree (1966) were more similar to those observed in the present study than that by Andrews and Murai (1978) who reported anaemia, skin and fin lesions and haemor- rhages, deformed jaws, exophthalmia and extremely high mortality in channel catfish fed niacin-deficient diets for 12 weeks. Such variation in niacin deficiency signs has also been observed within the salmonid species (McLaren et al., 1947; Phillips and Brock- way, 1947; Halver, 1989) and among other fish species such as common carp (Aoe et al., 19671, Japanese eel (Arai et al., 1972) and hybrid tilapia (Shiau and Suen, 1992). Other researchers have reported no gross deficiency signs other than retarded growth in studies with rainbow trout (Kitarnura et al., 1967) and gilthead seabream (Morris and Davies, 1995). Andrews and Murai (1978) suggested that such discrepancies in defi- ciency signs among fishes may be due to differences in the experimental conditions, species, age of fish, and degree of bacterial synthesis in the gastrointestinal tract.
It was unfortunate that the feeding trial in Experiment 2 had to be stopped after 9 weeks, since the carrying capacity of the aquaria was exceeded in some dietary groups. Together with the larger initial fish size and the shorter conditioning period used in Experiment 2, this probably explains why the growth performance of fish fed the basal diet with no added niacin was much better than that observed in fish from Experiment 1. Other than a slight retardation of growth and the observed slower and incomplete consumption of the feed offered, all fish fed diets with no added niacin in Experiment 2 appeared healthy. However, haematocrit and liver NAD levels responded to changes in dietary niacin more rapidly than did the growth rates. Fish fed diets with no added niacin had significantly lower haematocrit and liver NAD levels. The objectives of Experiment 2 were therefore not compromised by the shorter duration of the feeding trial as fish fed diets with no added niacin were clearly in a niacin-deficient state. Rawling et al. (1994) showed that dietary niacin deficiency decreased tissue NAD+ pools in rats even in the absence of severe clinical signs. They reported that the NAD+ pool most sensitive to niacin deficiency in the rat was in the blood, which would therefore be reflected in the haematocrits since it is based on packed red blood cell volume.
The basal diet used in Experiment 2 contain synthetic amino acids which is known to decrease the growth performance in most fish (Dupree and Halver, 1970; Ng et al., 1996). This is reflected in the specific growth rates of fish fed niacin-adequate diets in Experiment 2, which were lower compared to the growth rates of fish fed similar niacin levels in Experiment 1.
In conclusion, the results of the present study indicate that the niacin requirement of channel catfish fingerlings is 7.4 mg per kg diet, about half the previously accepted

284 W.-K. Ng et al./Aquaculture 152 (1997) 273-285
value of 14 mg per kg diet. Data on growth, feed efficiency, haematocrit and liver NAD levels provided direct evidence that L-tryptophan is an inefficient precursor of NAD(P) for the channel catfish. This study also presents the first reported data on the influence of dietary niacin and tryptophan on liver NAD levels in fish.
Acknowledgements
We would like to thank the Aquaculture Unit at the Delta Research and Extension Center at Stoneville, Mississippi, for determining the niacin content of casein for this study. This research was supported in part by a grant from the Southern Regional Aquaculture Center. Publication No. J-8925 of the Mississippi Agricultural and Forestry Experiment Station, Mississippi State University.
References
Andrews, J.W. and Murai, T., 1978. Dietary niacin requirements for channel catfish. J. Nutr., 108: 1508-1511.
Aoe, H., Masuda, I. and Takada, T., 1967. Water-soluble vitamin requirements of carp-III. Requirement for
niacin. Bull. Jpn. Sot. Sci. Fish., 33: 681-685.
Arai. S., Nose, T. and Hashimoto, Y., 1972. Qualitative requirements of young eels, Anguilla japonica, for
water-soluble vitamins and their deficiency symptoms. Bull. Freshwater Res. Lab. Tokyo, 22: 69-83.
Association of Official Analytical Chemists, 1990. Official Methods of Analysis. Hehich, K. (Editor), 15th
edn. Association of Official Analytical Chemists, Arlington, Virginia.
Carson, D.A., Seto, S. and Wasson, D.B., 1987. Pyridine nucleotide cycling and poly(ADP-ribose) synthesis in
resting human lymphocytes. J. Immunol., 138: 1904-1907.
Chuang, J.L., 1991. Fish and Shrimp. In: R. Fenster and R.A. Blum (Editors), Niacin in Animal Nutrition.
Roche index No. 2288, Basel, Switzerland, pp. 34-37.
Duncan, D., 1955. Multiple range tests and multiple F tests. Biometrics, 11: l-42.
Dupree, H.K., 1966. Vitamins essential for growth of channel catfish, Ictalurus punctatus. Bureau of Sport
Fish and Wildl., Washington, DC. Tech. Paper No. 7, 12 pp.
Dupree, H.K. and Halver, J.E., 1970. Amino acids essential for the growth of channel catfish, lctalurus
punctatus. Trans. Am. Fish. Sot., 1: 90-92.
Garling, D.L., Jr. and Wilson, R.P., 1976. Optimum dietary protein to energy ratio for channel catfish
fingerlings, Ictalurus punctatus. J. Nutr., 106: 1368-1375.
Halver, J.E., 1989. The vitamins. In: J.E. Halver (Editor), Fish Nutrition, 2nd edition. Academic Press,
London, pp. 31-109. Jackson, T.M., Rawling, J.M., Roebuck, B.D. and Kirkland, J.B., 1995. Large supplements of nicotinic acid
and nicotinamide increase tisssue NAD+ and poly(ADP-ribose) levels but do not affect diethylni-
trosamine-induced altered hepatic foci in Fischer-344 rats. J. Nutr., 125: 1455-1461.
Kitamura, S., Suwa, T., Ohara, S. and Nakagawa, K., 1967. Studies on vitamin requirements of rainbow trout II. The deficiency symptoms of fourteen kinds of vitamins. Bull. Jpn. Sot. Sci. Fish., 33: 1120-l 125.
Klingenberg, M., 1974. Nicotinainide-Adenine Dinucleotides (NAD, NADP, NADH, NADPH). Spectrophote
metric and fluorimetric methods. In: H.U. Bergmeyer (Editor), Methods of Enzymatic Analysis, Vol. 4.
Verlag Chemie Weinheim and Academic Press, New York and London, pp. 2045-2072. Lee, H.C. aud Aarhus, R., 1991. ADP-ribosyl cyclase: an enzyme that cyclizes NAD+ into a calcium-mobiliz-
ing metabolite. Cell Regul., 2: 203-209. McLaren, B.A., Keller, E., O’Donnell, D.J. and Elvehjem, CA., 1947. The nutrition of rainbow trout. I.
Studies of vitamin requirements. Arch. Biochem. Biophys., 15: 169-178.
Morris, P.C. and Davies, S.J., 1995. The requiretient of the gilthead seabream (Sparus aurata L) for nicotinic
acid. Animal Science, 61: 437-443.

W.-K. Ng et al./Aquaculture 152 (1997) 273-285 285
National Research Council, 1987. Vitamin Tolerance of Animals. National Academy Press, Washington, DC,
96 PP. National Research Council, 1993. Nutrient requirements of fish. National Academy Press, Washington, DC,
114 pp. Ng, W.K., Hung, S.S.O. and Herold, M.A., 1996. Poor utilization of dietary free ammo acids by white
sturgeon. Fish Physiol. Biochem., 15: 131-142.
Oduho, G.W. and Baker, D.H., 1993. Quantitative efficacy of niacin sources for chicks: nicotinic acid,
nicotinamide, NAD and tryptophan. J. Nutr., 123: 2201-2206.
Phillips, A.M. and Brockway, D.R., 1947. The niacin and biotin requirement of trout. Trans. Am. Fish. Sot.,
76: 152-159.
Poston, H.A. and Combs, G.F., Jr., 1980. Nutritional implications of tryptophan catabolizing enzymes in
several species of trout and salmon. Proc. Sot. Exp. Biol. Med., 163: 452-454.
Poston, H.A. and DiLorenzo, R.N., 1973. Tryptophan conversion to niacin in the brook trout (Sa~oelinus
fontinalis). Proc. Sot. Exp. Biol. Med., 114: 110-112.
Poston, H.A. and Wolfe, M.J., 1985. Niacin requirement for optimum growth, feed conversion and protection
of rainbow trout, S&no gairdneri Richardson, from ultraviolet-B irradiation. J. Fish Dis., 8: 451-460.
Rawling, J.M., Jackson, T.M., Driscoll, E.R. and Kirkland, J.B., 1994. Dietary niacin deficiency lowers tissue
poly(ADP-ribose) and NAD+ concentrations in Fischer-344 rats. J. Nutr., 124: 1597-1603.
Robbins, K.R., Norton, H.W. and Baker, D.H., 1979. Estimation of nutrient requirements from growth data. J.
Nutr., 109: 1710-1714.
Satoh, S., Poe, W.E. and Wilson, R.P., 1989. Effect of dietary n-3 fatty acids on weight gain and liver polar
lipid fatty acid composition of fingerling channel catfish. J. Nutr., 119: 23-28.
Shimeno, S., 1991. Yellowtail, Sen’olu quinqueradiatu. In: R.P. Wilson (Editor), Nutrient Requirements of
Finfish. CRC Press, Boca Raton, FL, pp. 181-191.
Shiau, S.Y. and Suen, G.S., 1992. Estimation of the niacin requirements for tilapia fed diets containing glucose
or dextrin. J. Nutr., 122: 2030-2036.
Wilson, R.P., Allen, O.W., Jr., Robinson, E.H. and Poe, W.E., 1978. Tryptophan and threonine requirements
of fingerling channel catfish. J. Nutr., 108: 1595-1599.


