Embed Size (px)
Citation preview
Nickel/alumina catalysts modified by basic oxides for
the production of synthesis gas by methane
partial oxidation
J. Requies a, M.A. Cabrero a, V.L. Barrio a,*, J.F. Cambra a, M.B. Guemez a,P.L. Arias a, V. La Parola b, M.A. Pena b, J.L.G. Fierro b
a School of Engineering (UPV/EHU), Department of Chemical and Environmental Engineering, 48013 Bilbao, Spainb Institute of Catalysis and Petrochemistry, CSIC, Cantoblanco, 28049 Madrid, Spain
Available online 10 July 2006
Abstract
In the present work, Ni/a-Al2O3 catalysts modified with different amounts of CaO and MgO were used for the production of hydrogen by
catalytic partial oxidation (CPO) and wet-CPO processes of methane. In the wet-CPO process, small additions of water were introduced into the
feed of the reactor to improve both the H2 yield and methane conversion. The addition of water is also beneficial because coke formation becomes
thermodynamically unfavorable. The catalysts were characterized before and after the reaction with XRD, XPS, TPR and TPO techniques. Several
methane decomposition tests and methane pulse experiments were carried out with a view to correlating the ability of metal sites to activate
methane in the absence of oxygen with the performance for CPO and wet-CPO reactions.
# 2006 Elsevier B.V. All rights reserved.
Keywords: Magnesium and calcium additives; Catalytic partial oxidation; Nickel catalysts; Catalyst characterization
www.elsevier.com/locate/cattod
Catalysis Today 116 (2006) 304–312
1. Introduction
The catalytic partial oxidation (CPO) of methane is a process
of great interest since it provides a H2/CO ratio in the product
gas close to 2, which is appropriate for methanol synthesis and
for the production of synthetic fuels by means of Fischer–
Tropsch reactions. In addition, the reaction rate of CPO is much
higher – at least one order of magnitude – the conventional
steam reforming, thus requiring much smaller reactors.
Non-noble metals such as a nickel [1–4] and cobalt [5] are
highly active for CPO but are rapidly deactivated by carbon
deposits that form on the catalyst surface and also by the
sintering of metal crystallites. An alternative would be the use
of noble metal catalysts, because these are less sensitive to
carbon deposition [6], although in practice they are not used
owing to their high cost. Thus, non-noble metal catalysts are
widely used for this type of process, in particular Ni-based ones
[1–4]. Several substrates and additives have been used to
* Corresponding author. Tel.: +34 946017282; fax: +34 946014179.
E-mail address: [email protected] (V.L. Barrio).
0920-5861/$ – see front matter # 2006 Elsevier B.V. All rights reserved.
doi:10.1016/j.cattod.2006.05.084
minimize the extent of coke formation and sintering of metal
particles. Catalyst deactivation by coke formation is often a
serious drawback in CPO reactions and it has been found that
the extent of coke formation depends on the type of nickel
species, crystallite size, and the electronic density at the metal
site [7]. The incorporation of some additives can alter particle
size, the dispersion of the metal on the surface, and the
electronic density [8]. The additive may also affect the solid–
solid interaction between the oxide catalyst and the support [9],
and this influence may be accompanied by significant changes
in the catalytic activity of the modified catalyst.
In this work, both Ni/a-Al2O3 catalysts and those loaded with
small amounts of MgO and CaO were prepared and tested in CPO
and wet-CPO reactions. Since the acidity of the support is
detrimental to coke formation [10], basic oxides are usually
incorporated to neutralize acid sites. Accordingly, this work was
undertaken with the aim of analyzing the effects of different
additives incorporated to a base Ni/Al2O3 catalyst on stability to
coke deactivation during the reaction. CaO and MgO additives
were selected for this purpose because these basic oxides
exhibited good behavior in the analogous CO2 methane
J. Requies et al. / Catalysis Today 116 (2006) 304–312 305
reforming process [11], in which calcium oxide improved the
activity and stability of the Ni/a-Al2O3 catalysts.
2. Experimental procedure
2.1. Catalyst preparation
An a-Al2O3 (BET specific area = 2.5 m2 g�1, pore volume
0.02 cm3 g�1, particle size between 0.42 and 0.59 mm) was
employed as a support for the catalysts. The catalysts were
prepared by the wet impregnation method using Ni(CH3-
COO)2�4H2O as precursor. The a-Al2O3 was suspended in a
solution containing the required amount of nickel acetate to
obtain a nickel content of 15 or 25 wt.% in the final catalyst.
The excess of water was evaporated off to dryness in a rotary
evaporator at 343 K. The samples were then calcined in air at
1073 K for 4 h.
The Ca- and Mg-modified catalysts were prepared by
sequential wet impregnation, following the same procedure
as for the Ni/Al2O3 sample. The a-Al2O3 was first
impregnated with Ca or Mg acetate precursor and then
dried and calcined at 1073 K for 4 h. Then, nickel was
incorporated as described above. A list of the prepared
samples is given in Table 1.
2.2. Catalyst characterization
Specific areas were calculated with the BET method from
nitrogen adsorption isotherms recorded at 77 K (liquid nitrogen
temperature), using a Micromeritics ASAP-2000 apparatus,
taking a value of 0.162 nm2 for the cross-sectional area of the
N2 molecule adsorbed at 77 K. Prior to adsorption measure-
ment, the samples were outgassed at 413 K. The specific area of
the catalysts did not differ from the area of the a-Al2O3
substrate.
Thermogravimetric analyses were performed on a Mettler
Toledo microbalance TGA/SDTA 851. The sample temperature
was increased from 323 to 1373 K at 5 K min�1 while passing a
flow of 20% O2 in N2 at a rate of 250 mL(STP) min�1. In the
methane pulse experiments, the amount of coke deposited on
the used catalysts was underestimated (the sample weight
increase due to Ni oxidation was neglected) with this
methodology (see Table 7). Gravimetric TPR experiments
were also performed using a flow of 20% H2 in N2 at a rate of
250 mL(STP) min�1, from 323 to 1373 K at 5 K min�1.
Table 1
Catalysts prepared, nominal composition and NiO crystal size as determined by
XRD
Catalysts Nominal composition NiO size (nm)
15Ni/Al2O3 15.0% Ni 33.0
25Ni/Al2O3 25.0% Ni n.a.
15Ni/Al2O3–5Ca 5.0% Ca, 10.0% Ca 22.6
15Ni/Al2O3–10Ca 15.0% Ni, 5.0% Mg n.a.
15Ni/Al2O3–5Mg 15.0% Ni, 10.0% Mg 24.6
15Ni/Al2O3–10Mg 15.0% Ni n.a.
n.a.: not available.
Powder X-ray diffraction (XRD) patterns were recorded
using a Seifert 3000 P diffractometer, using a nickel filtered Cu
Ka1 (l = 0.15406 nm) radiation. The step scans were taken
over the range of 2u angles from 108 to 708.A Micromeritics TPD/TPR 2900 apparatus equipped with a
TCD was used for temperature-programmed reduction (TPR)
analyses. Reduction profiles were obtained by passing a 10%
H2/Ar flow through the samples (sample weight around 50 mg)
at a rate of 50 mL(STP) min�1. Temperature was increased
from 308 to 1273 K at a rate of 10 K min�1 and the amount of
hydrogen consumed was determined as a function of
temperature.
X-ray photoelectron spectra (XPS) were acquired with a VG
Escalab 200R spectrometer equipped with a hemispherical
electron analyzer and a Mg Ka (hn = 1253.6 eV) X-ray source.
The peaks were fitted with a non-linear least squares fitting
program using a properly weighted sum of Lorentzian and
Gaussian component curves after background subtraction
according to Shirley. Charging effects of the samples were
corrected by referencing all the energies to the Al 2p peak at
74.5 eV.
CH4 temperature-programmed decomposition and CH4
pulse experiments were performed on catalyst samples
(50 mg) loaded in a U-shaped quartz reactor connected to a
Baltzer Prisma QMS 200 TM quadrupole mass spectrometer.
Prior to being tested in the reaction, the catalysts were reduced
in a 10% H2/Ar flow while heating from room temperature up to
the temperature was reached at which total metal reduction was
achieved (as indicated by TPR experiment) and then left at this
temperature for 30 min. Following this, the reactor was cooled
down to room temperature in an Ar flow and finally a flow of
10% of CH4/Ar (150 mL min�1) was passed while heating to
1123 K (10 K min�1) for the decomposition experiment. The
procedure employed in the pulse experiments was different: the
samples were heated up to 1123 K in an Ar flow and then
exposed to pulses (0.1 mL) of 10% CH4/Ar mixture. In both
cases, the signals of H2, H2O, CH4, CO, CO2 and Ar were
recorded. In order to eliminate errors due to possible flow
variations all signals were referred to the Ar signal.
2.3. Activity measurements
The experiments were conducted at atmospheric pressure in
a bench-scale unit using a steel fixed-bed catalytic reactor. The
reactor (1.15 cm i.d. and 30 cm length) was heated electrically
in a furnace. The effluent stream was cooled down, thus water
was collected and weighted, and the gas phase was analyzed on-
line by a GC (HP5890) equipped with FID and TCD detectors.
Two columns, Porapak Q and Molecular Sieve 5A, were used in
a series/bypass arrangement for the complete separation of H2,
CH4, CO and CO2. Activity measurements were carried out in
the CPO of methane, under atmospheric pressure at 1073 K
with a feed of CH4/O2/N2 = 2/1/3.8 (molar ratio). The catalyst
weight (180 mg) was diluted with SiC at a 1:9 ratio to avoid
temperature variations in the bed. The particle size range was
between 0.42 and 0.59 mm. For wet-CPO tests, the steam/
carbon ratio (S/C) was increased from 0 to 0.6. For some
J. Requies et al. / Catalysis Today 116 (2006) 304–312306
Table 2
Activity tests for the Ca- and Mg-promoted catalysts and for 15% Ni–Al2O3 and the 25% Ni–Al2O3 catalysts at WHSV = 600 and 800
Catalysts CH4 conversion
(%), 95.1a
H2 yield, 1.87a H2 selectivity
(%), 98.3a
CO selectivity
(%), 98.2a
M, 1.95a
600b 800b 600b 800b 600b 800b 600b 800b 600b 800b
15Ni/Al2O3 88.9 85.8 1.60 1.45 93.9 93.1 95.1 91.7 1.80 1.71
25Ni/Al2O3 91.6 91.6 1.68 1.70 94.0 93.9 95.3 94.6 1.81 1.78
15Ni/Al2O3–5Ca 92.7 93.1 1.78 1.75 94.1 94.1 96.3 96.0 1.84 1.84
15Ni/Al2O3–10Ca 92.0 91.5 1.65 1.63 94.0 93.9 95.5 94.3 1.81 1.77
15Ni/Al2O3–5Mg 93.5 94.4 1.74 1.74 94.1 94.1 96.1 95.9 1.83 1.82
15Ni/Al2O3–10Mg 92.6 92.7 1.69 1.65 94.1 94.0 96.4 95.8 1.84 1.80
a Equilibrium data.b WHSV (gfeed/gcat h).
experiments the O2/CH4 ratio was decreased to 0.4 and the
pressure was changed to 3 bar (with 240 mg of catalyst and the
same dilution). Prior to the tests, the catalysts were pre-reduced
in situ at 1073 K at atmospheric pressure in an H2/N2 mixture of
270 mL(STP) min�1 (3:1, v/v) for 3.5 h. After catalyst
activation, activity measurements were performed, varying
WHSV between 600 and 1200 h�1 (ggas g�1cat h�1). The reaction
was kept running for each space velocity until steady-state was
reached.
For a better understanding of the catalytic activity and the
product distribution, the following parameters were calculated:
� M
Ta
A
Ca
15
25
15
15
15
15
b
ethane conversion: CH4 conversion ð%Þ ¼ 100� ððF feedCH4
�FoutCH4Þ=Fout
CH4Þ;
� H
ydrogen selectivity: H2 selectivity ð%Þ ¼ 100� ðFoutH2=ðFoutH2þ Fout
H2OÞÞ;
� H ydrogen yield: H2 yield ¼ FoutH2=Ffeed
CH4;
� C
O selectivity: CO selectivity ð%Þ ¼ 100� ðFoutCO=ðFoutCOþFout
CO2ÞÞ;
� M
parameter: M ¼ ðFoutH2� FoutCO2Þ=ðFout
CO2þ Fout
COÞ.
M is a useful parameter that determines the suitability of the
syngas produced in the Fischer–Tropsch process. In this
process, feeds containing significant amounts of CO2 are not
desirable, and hence M values of around 2.1 are of interest.
Finally, the corresponding values for the thermodynamic
equilibrium corresponding to reaction conditions were plotted
ble 3
ctivity tests for the Ca- and Mg-promoted catalysts and for 15% Ni–Al2O3 and
talysts CH4 conversion
(%), 95.1a
H2 yield, 1.87a
1000b 1200b 1000b 1200b
Ni/Al2O3 77.3 72.7 1.28 1.13
Ni/Al2O3 86.2 83.9 1.56 1.50
Ni/Al2O3–5Ca 88.2 83.1 1.64 1.50
Ni/Al2O3–10Ca 79.4 79.3 1.36 1.34
Ni/Al2O3–5Mg 89.7 84.2 1.64 1.47
Ni/Al2O3–10Mg 88.1 85.6 1.55 1.49
a Equilibrium data.
WHSV (gfeed/gcat h).
in order to compare them with the experimental results
obtained.
3. Results and discussion
3.1. Catalytic activity
3.1.1. Evaluation of the Ca- and Mg-supported catalysts
activity in CPO
Tables 2 and 3 show the activity of the Ca-modified catalysts
for different space velocities. The activity of the 15% and 25%
Ni is also shown for comparative purpose. The activity of the
Ca-modified catalysts increased slightly on increasing the
weight hourly space velocity (WHSV) from 600 to 800 h�1
while it decreased for higher space velocities. For the lowest
space velocity, transport limitations might be involved. For
WHSV = 800 h�1, the activity of the 5% Ca-containing catalyst
increases up to 93% (see Table 2). Increasing the Ca content up
to 10% did not seem to enhance CH4 conversion any more. The
H2 yield and the CO selectivity also increase upon Ca
incorporation, while the M value reaches 1.84, somewhat lower
than the optimum one for FTapplication. The same trend can be
observed in Tables 2 and 3 for the Mg-loaded catalysts. As
occurred with the Ca-modified catalysts, the addition of Mg
increased methane conversion up to 93–94%, although no
significant differences in activity were observed upon increas-
ing the Mg content from 5 to 10%.
the 25% Ni–Al2O3 catalysts at WHSV = 1000 and 1200
H2 selectivity
(%), 98.3a
CO selectivity
(%), 98.2a
M, 1.95a
1000b 1200b 1000b 1200b 1000b 1200b
89.7 87.8 87.2 81.9 1.60 1.46
93.6 93.5 92.5 91.6 1.73 1.71
93.8 93.5 94.1 91.6 1.78 1.71
89.5 91.0 88.5 88.5 1.61 1.62
93.9 92.6 94.3 91.5 1.79 1.69
93.8 92.7 93.9 92.6 1.76 1.74
J. Requies et al. / Catalysis Today 116 (2006) 304–312 307
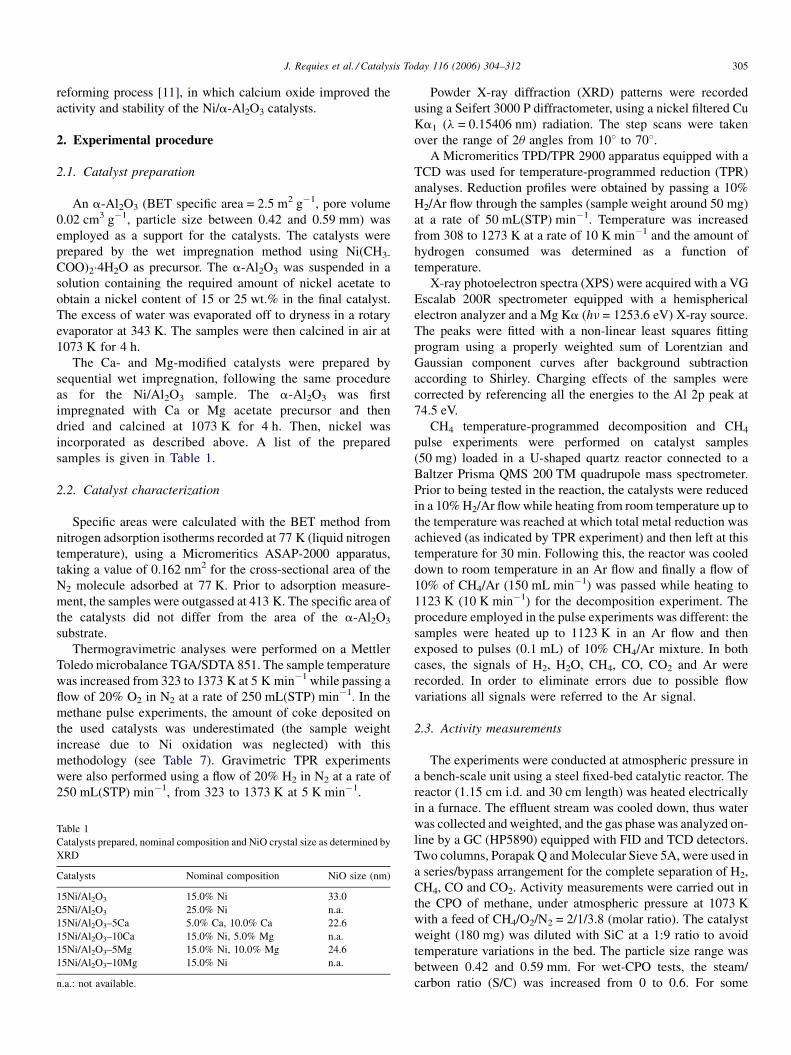
Fig. 2. Wet-CPO activity test of the 15% Ni/Al2O3–10Mg catalyst with S/
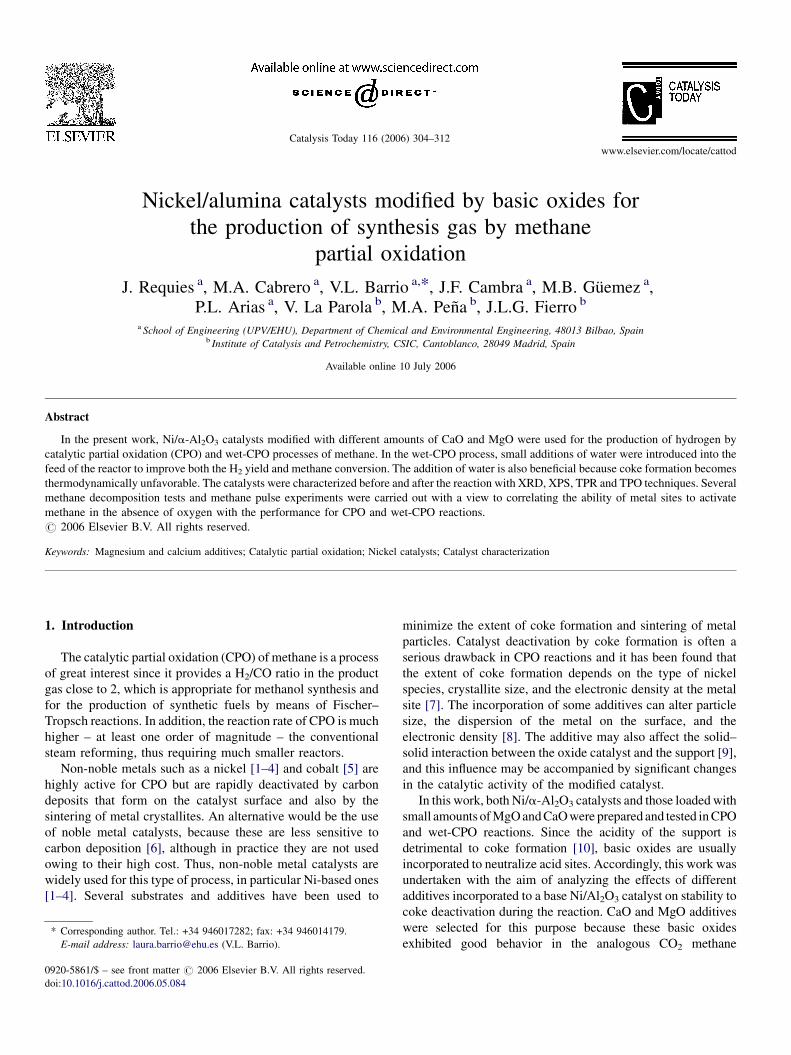
C = 0–0.24 and O2/CH4 = 0.5 at 1073 K and P = 1 bar (WHSV = 600 h�1).Fig. 1. Wet-CPO activity test of the 15% Ni/Al2O3–10Ca catalyst with S/
C = 0–0.24 and O2/CH4 = 0.5 at 1073 K and P = 1 bar (WHSV = 600 h�1).
3.1.2. Influence of the S/C and O2/CH4 ratios on the
activity of Ca- and Mg-modified catalysts
From thermodynamic predictions, a further increase in both
methane conversion and value of M parameter could be achieved
by adding water into the feed. For the non-doped Ni catalyst,
activity decreased strongly until values of 70% for an S/C ratio of
0.2. Fig. 1 shows the behavior of the 10% Ca-doped catalyst. For
S/C ratios lower than 0.1, activity did not change whereas both
activity and CO and H2 selectivities decreased for higher S/C
ratios. On the other hand, the M value remained close to 1.8. In
another set of experiments, as well as steam addition the oxygen
feed was decreased trying to force the steam reaction to occur.
Thus, several experiments were carried out, varying the S/C ratio
while decreasing the O2/CH4 ratio to 0.4. For all S/C ratios,
methane conversion decreases and the M value approached 1.9.
The addition of steam to the feed mixture did not enhance
the activity of the 10% Mg-loaded catalyst (see Fig. 2).
Similarly, for an O2/CH4 ratio of 0.4 methane conversion fell
markedly to 77% and remained almost unchanged on
increasing the S/C ratio. Despite the thermodynamics predic-
tion of higher methane conversion at lower O2/CH4 ratios,
catalyst activity decreased upon increasing the S/C ratio.
3.1.3. Further activity tests for the promoted catalysts
This third set of activity experiments included study of the
steam content in CH4 conversion over Ca- and Mg-loaded
Table 4
CPO and wet-CPO activity for the Ca- and Mg-promoted catalysts with S/C ratio
Catalysts
5Ca 10Ca
0a 0.1a 0.2a 0a 0.1a
CH4 conversion (%) 88.6 81.3 89.4 87.6 81.4
CO selectivity (%) 96.8 87.9 89.1 96.1 88.6
H2 selectivity (%) 97.2 92.5 91.5 96.6 90.4
H2 yield 1.70 1.55 1.76 1.63 1.52
M 1.85 1.73 1.83 1.82 1.72
a S/C ratio.
catalysts at higher pressures. Table 4 summarizes CPO and wet-
CPO activities at 1073 K and 3 bar. For the 10% Ca-containing
catalysts, CH4 conversion decreases slightly (from 87.6 to
81.4%) upon increasing the S/C ratio from 0 to 0.1.
Nevertheless, it increased again to 88.2% (see Table 4) for a
S/C ratio of 0.2, which is somewhat higher than that reached in
the absence of steam in the feed. In addition, CO and H2
selectivities decreases, the M value remained constant and the
H2 yield increased for higher S/C ratio. A similar kind of
behavior was found for the 5% Ca-loaded catalyst.
The Mg-loaded catalysts behaved similarly to the Ca-
containing counterparts. The activity of the 10% Mg-containing
catalyst decreased slightly for an S/C ratio of 0.1 (Fig. 3) and
then increased up to 93.2% for an S/C ratio of 0.2. Similarly, the
H2 yield increased significantly from 1.73 to 1.91 (Table 4). It
was also observed that activity was slightly higher for the 10%
Mg-loaded catalyst than for the 5% Mg-loaded counterpart. For
the two most promising catalysts, containing 10% Ca and 10%
Mg, the S/C ratio was increased until higher ratios. The results
shown in Table 5 indicate that the activity of the Ca-loaded
catalyst did not increase any further for higher S/C ratios. In
contrast, in the case of the Mg-loaded catalyst activity increases
up to an S/C ratio of 0.4 and remained nearly constant for higher
S/C ratios (96.3–96.5%). It was also noted that H2 and CO
selectivities decreases, but the H2 yield increased to 2.0, due to
the higher conversion achieved. Finally, temperature was also
s from 0 to 0.2 at 1073 K and P = 3 bar (O2/CH4 = 0.5)
5Mg 10Mg
0.2a 0a 0.1a 0.2a 0a 0.1a 0.2a
88.2 89.6 81.0 90.0 90.9 87.3 93.2
89.0 96.5 85.3 88.0 96.7 92.8 91.2
91.0 97.5 90.1 91.1 97.7 94.8 93.2
1.73 1.69 1.46 1.72 1.73 1.77 1.91
1.82 1.84 1.70 1.80 1.84 1.83 1.88
J. Requies et al. / Catalysis Today 116 (2006) 304–312308
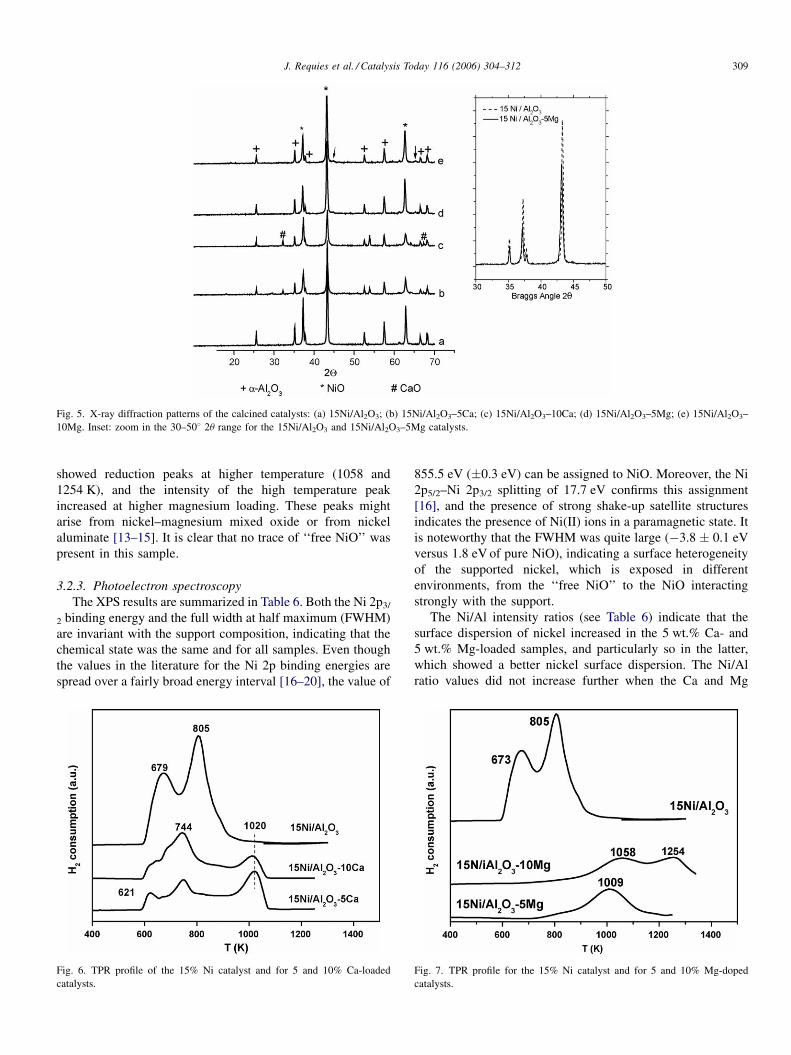
Fig. 4. Long-term activity test for the CPO reaction of the 15%Ni/Al2O3–10Mg
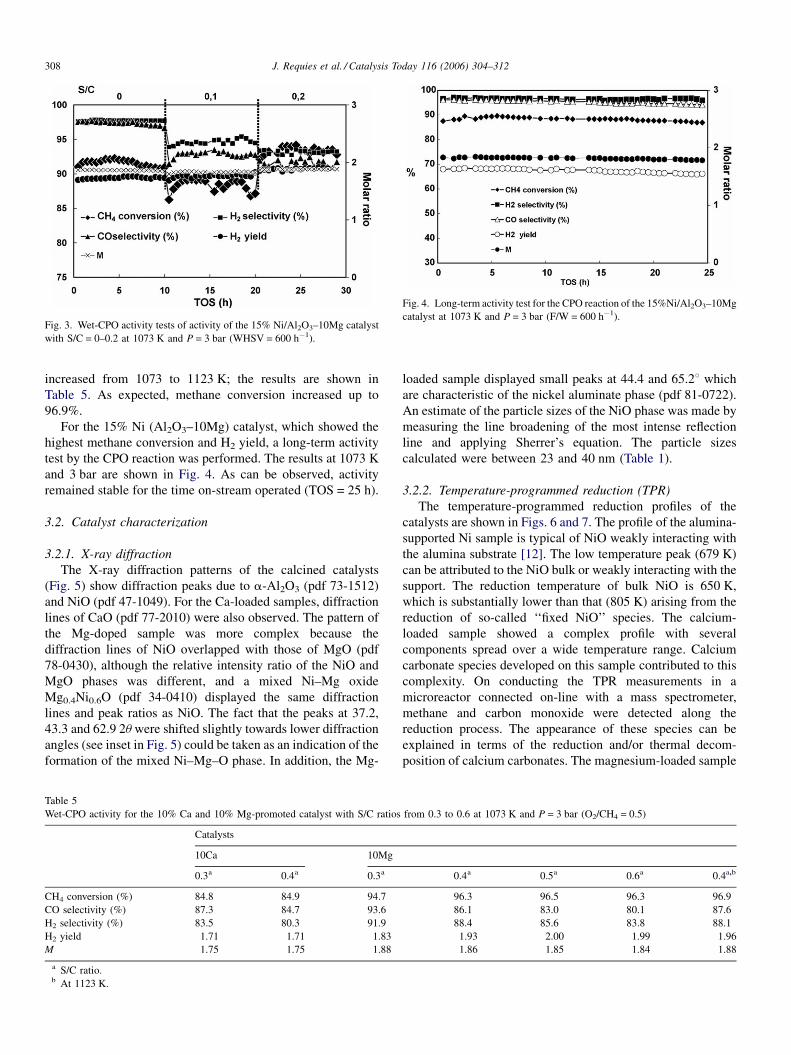
catalyst at 1073 K and P = 3 bar (F/W = 600 h�1).Fig. 3. Wet-CPO activity tests of activity of the 15% Ni/Al2O3–10Mg catalyst
with S/C = 0–0.2 at 1073 K and P = 3 bar (WHSV = 600 h�1).
increased from 1073 to 1123 K; the results are shown in
Table 5. As expected, methane conversion increased up to
96.9%.
For the 15% Ni (Al2O3–10Mg) catalyst, which showed the
highest methane conversion and H2 yield, a long-term activity
test by the CPO reaction was performed. The results at 1073 K
and 3 bar are shown in Fig. 4. As can be observed, activity
remained stable for the time on-stream operated (TOS = 25 h).
3.2. Catalyst characterization
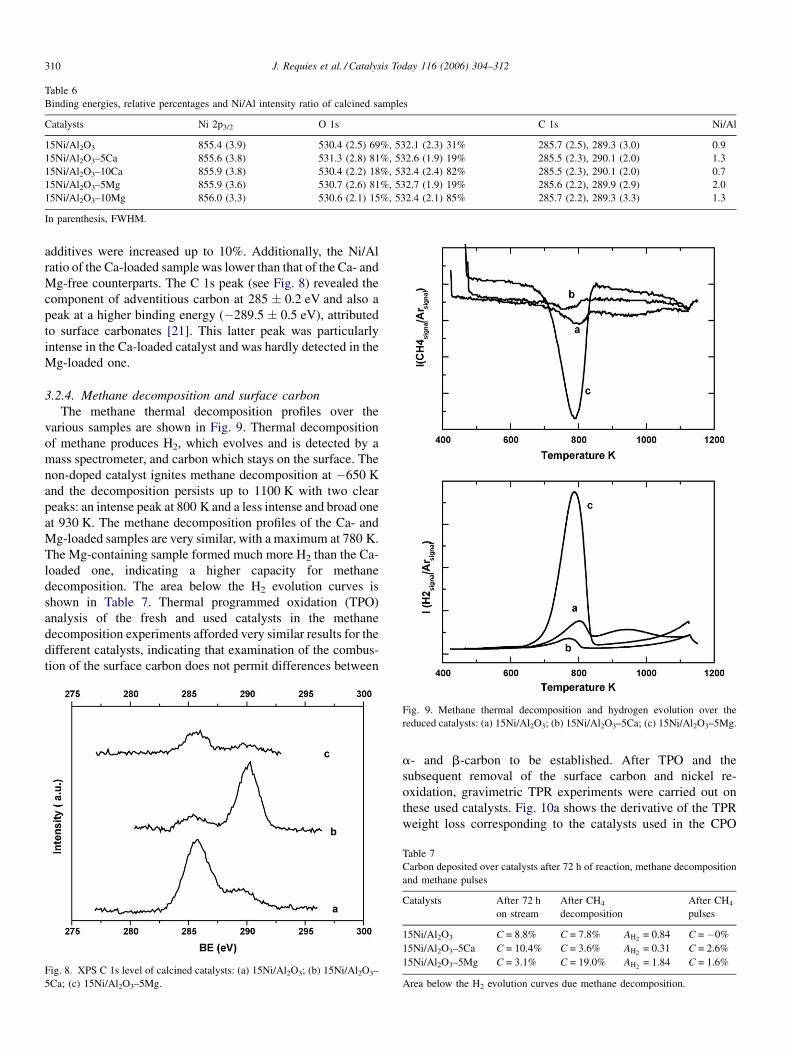
3.2.1. X-ray diffraction
The X-ray diffraction patterns of the calcined catalysts
(Fig. 5) show diffraction peaks due to a-Al2O3 (pdf 73-1512)
and NiO (pdf 47-1049). For the Ca-loaded samples, diffraction
lines of CaO (pdf 77-2010) were also observed. The pattern of
the Mg-doped sample was more complex because the
diffraction lines of NiO overlapped with those of MgO (pdf
78-0430), although the relative intensity ratio of the NiO and
MgO phases was different, and a mixed Ni–Mg oxide
Mg0.4Ni0.6O (pdf 34-0410) displayed the same diffraction
lines and peak ratios as NiO. The fact that the peaks at 37.2,
43.3 and 62.9 2u were shifted slightly towards lower diffraction
angles (see inset in Fig. 5) could be taken as an indication of the
formation of the mixed Ni–Mg–O phase. In addition, the Mg-
Table 5
Wet-CPO activity for the 10% Ca and 10% Mg-promoted catalyst with S/C ratios
Catalysts
10Ca 10Mg
0.3a 0.4a 0.3a
CH4 conversion (%) 84.8 84.9 94.7
CO selectivity (%) 87.3 84.7 93.6
H2 selectivity (%) 83.5 80.3 91.9
H2 yield 1.71 1.71 1.83
M 1.75 1.75 1.88
a S/C ratio.b At 1123 K.
loaded sample displayed small peaks at 44.4 and 65.28 which
are characteristic of the nickel aluminate phase (pdf 81-0722).
An estimate of the particle sizes of the NiO phase was made by
measuring the line broadening of the most intense reflection
line and applying Sherrer’s equation. The particle sizes
calculated were between 23 and 40 nm (Table 1).
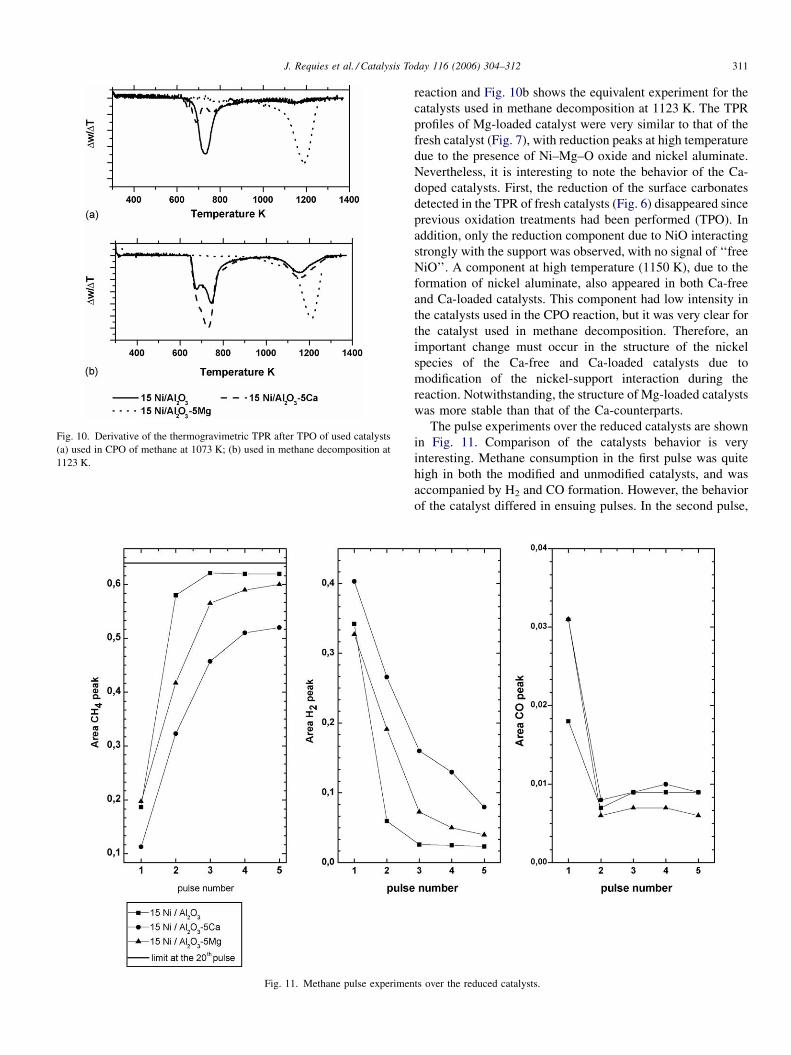
3.2.2. Temperature-programmed reduction (TPR)
The temperature-programmed reduction profiles of the
catalysts are shown in Figs. 6 and 7. The profile of the alumina-
supported Ni sample is typical of NiO weakly interacting with
the alumina substrate [12]. The low temperature peak (679 K)
can be attributed to the NiO bulk or weakly interacting with the
support. The reduction temperature of bulk NiO is 650 K,
which is substantially lower than that (805 K) arising from the
reduction of so-called ‘‘fixed NiO’’ species. The calcium-
loaded sample showed a complex profile with several
components spread over a wide temperature range. Calcium
carbonate species developed on this sample contributed to this
complexity. On conducting the TPR measurements in a
microreactor connected on-line with a mass spectrometer,
methane and carbon monoxide were detected along the
reduction process. The appearance of these species can be
explained in terms of the reduction and/or thermal decom-
position of calcium carbonates. The magnesium-loaded sample
from 0.3 to 0.6 at 1073 K and P = 3 bar (O2/CH4 = 0.5)
0.4a 0.5a 0.6a 0.4a,b
96.3 96.5 96.3 96.9
86.1 83.0 80.1 87.6
88.4 85.6 83.8 88.1
1.93 2.00 1.99 1.96
1.86 1.85 1.84 1.88
J. Requies et al. / Catalysis Today 116 (2006) 304–312 309
Fig. 5. X-ray diffraction patterns of the calcined catalysts: (a) 15Ni/Al2O3; (b) 15Ni/Al2O3–5Ca; (c) 15Ni/Al2O3–10Ca; (d) 15Ni/Al2O3–5Mg; (e) 15Ni/Al2O3–
10Mg. Inset: zoom in the 30–508 2u range for the 15Ni/Al2O3 and 15Ni/Al2O3–5Mg catalysts.
showed reduction peaks at higher temperature (1058 and
1254 K), and the intensity of the high temperature peak
increased at higher magnesium loading. These peaks might
arise from nickel–magnesium mixed oxide or from nickel
aluminate [13–15]. It is clear that no trace of ‘‘free NiO’’ was
present in this sample.
3.2.3. Photoelectron spectroscopy
The XPS results are summarized in Table 6. Both the Ni 2p3/
2 binding energy and the full width at half maximum (FWHM)
are invariant with the support composition, indicating that the
chemical state was the same and for all samples. Even though
the values in the literature for the Ni 2p binding energies are
spread over a fairly broad energy interval [16–20], the value of
Fig. 6. TPR profile of the 15% Ni catalyst and for 5 and 10% Ca-loaded
catalysts.
855.5 eV (�0.3 eV) can be assigned to NiO. Moreover, the Ni
2p5/2–Ni 2p3/2 splitting of 17.7 eV confirms this assignment
[16], and the presence of strong shake-up satellite structures
indicates the presence of Ni(II) ions in a paramagnetic state. It
is noteworthy that the FWHM was quite large (�3.8 � 0.1 eV
versus 1.8 eV of pure NiO), indicating a surface heterogeneity
of the supported nickel, which is exposed in different
environments, from the ‘‘free NiO’’ to the NiO interacting
strongly with the support.
The Ni/Al intensity ratios (see Table 6) indicate that the
surface dispersion of nickel increased in the 5 wt.% Ca- and
5 wt.% Mg-loaded samples, and particularly so in the latter,
which showed a better nickel surface dispersion. The Ni/Al
ratio values did not increase further when the Ca and Mg
Fig. 7. TPR profile for the 15% Ni catalyst and for 5 and 10% Mg-doped
catalysts.
J. Requies et al. / Catalysis Today 116 (2006) 304–312310
Table 6
Binding energies, relative percentages and Ni/Al intensity ratio of calcined samples
Catalysts Ni 2p3/2 O 1s C 1s Ni/Al
15Ni/Al2O3 855.4 (3.9) 530.4 (2.5) 69%, 532.1 (2.3) 31% 285.7 (2.5), 289.3 (3.0) 0.9
15Ni/Al2O3–5Ca 855.6 (3.8) 531.3 (2.8) 81%, 532.6 (1.9) 19% 285.5 (2.3), 290.1 (2.0) 1.3
15Ni/Al2O3–10Ca 855.9 (3.8) 530.4 (2.2) 18%, 532.4 (2.4) 82% 285.5 (2.3), 290.1 (2.0) 0.7
15Ni/Al2O3–5Mg 855.9 (3.6) 530.7 (2.6) 81%, 532.7 (1.9) 19% 285.6 (2.2), 289.9 (2.9) 2.0
15Ni/Al2O3–10Mg 856.0 (3.3) 530.6 (2.1) 15%, 532.4 (2.1) 85% 285.7 (2.2), 289.3 (3.3) 1.3
In parenthesis, FWHM.
additives were increased up to 10%. Additionally, the Ni/Al
ratio of the Ca-loaded sample was lower than that of the Ca- and
Mg-free counterparts. The C 1s peak (see Fig. 8) revealed the
component of adventitious carbon at 285 � 0.2 eV and also a
peak at a higher binding energy (�289.5 � 0.5 eV), attributed
to surface carbonates [21]. This latter peak was particularly
intense in the Ca-loaded catalyst and was hardly detected in the
Mg-loaded one.
3.2.4. Methane decomposition and surface carbon
The methane thermal decomposition profiles over the
various samples are shown in Fig. 9. Thermal decomposition
of methane produces H2, which evolves and is detected by a
mass spectrometer, and carbon which stays on the surface. The
non-doped catalyst ignites methane decomposition at �650 K
and the decomposition persists up to 1100 K with two clear
peaks: an intense peak at 800 K and a less intense and broad one
at 930 K. The methane decomposition profiles of the Ca- and
Mg-loaded samples are very similar, with a maximum at 780 K.
The Mg-containing sample formed much more H2 than the Ca-
loaded one, indicating a higher capacity for methane
decomposition. The area below the H2 evolution curves is
shown in Table 7. Thermal programmed oxidation (TPO)
analysis of the fresh and used catalysts in the methane
decomposition experiments afforded very similar results for the
different catalysts, indicating that examination of the combus-
tion of the surface carbon does not permit differences between
Fig. 8. XPS C 1s level of calcined catalysts: (a) 15Ni/Al2O3; (b) 15Ni/Al2O3–
5Ca; (c) 15Ni/Al2O3–5Mg.
Fig. 9. Methane thermal decomposition and hydrogen evolution over the
reduced catalysts: (a) 15Ni/Al2O3; (b) 15Ni/Al2O3–5Ca; (c) 15Ni/Al2O3–5Mg.
a- and b-carbon to be established. After TPO and the
subsequent removal of the surface carbon and nickel re-
oxidation, gravimetric TPR experiments were carried out on
these used catalysts. Fig. 10a shows the derivative of the TPR
weight loss corresponding to the catalysts used in the CPO
Table 7
Carbon deposited over catalysts after 72 h of reaction, methane decomposition
and methane pulses
Catalysts After 72 h
on stream
After CH4
decomposition
After CH4
pulses
15Ni/Al2O3 C = 8.8% C = 7.8% AH2= 0.84 C = �0%
15Ni/Al2O3–5Ca C = 10.4% C = 3.6% AH2= 0.31 C = 2.6%
15Ni/Al2O3–5Mg C = 3.1% C = 19.0% AH2= 1.84 C = 1.6%
Area below the H2 evolution curves due methane decomposition.
J. Requies et al. / Catalysis Today 116 (2006) 304–312 311
Fig. 10. Derivative of the thermogravimetric TPR after TPO of used catalysts
(a) used in CPO of methane at 1073 K; (b) used in methane decomposition at
1123 K.
Fig. 11. Methane pulse experimen
reaction and Fig. 10b shows the equivalent experiment for the
catalysts used in methane decomposition at 1123 K. The TPR
profiles of Mg-loaded catalyst were very similar to that of the
fresh catalyst (Fig. 7), with reduction peaks at high temperature
due to the presence of Ni–Mg–O oxide and nickel aluminate.
Nevertheless, it is interesting to note the behavior of the Ca-
doped catalysts. First, the reduction of the surface carbonates
detected in the TPR of fresh catalysts (Fig. 6) disappeared since
previous oxidation treatments had been performed (TPO). In
addition, only the reduction component due to NiO interacting
strongly with the support was observed, with no signal of ‘‘free
NiO’’. A component at high temperature (1150 K), due to the
formation of nickel aluminate, also appeared in both Ca-free
and Ca-loaded catalysts. This component had low intensity in
the catalysts used in the CPO reaction, but it was very clear for
the catalyst used in methane decomposition. Therefore, an
important change must occur in the structure of the nickel
species of the Ca-free and Ca-loaded catalysts due to
modification of the nickel-support interaction during the
reaction. Notwithstanding, the structure of Mg-loaded catalysts
was more stable than that of the Ca-counterparts.
The pulse experiments over the reduced catalysts are shown
in Fig. 11. Comparison of the catalysts behavior is very
interesting. Methane consumption in the first pulse was quite
high in both the modified and unmodified catalysts, and was
accompanied by H2 and CO formation. However, the behavior
of the catalyst differed in ensuing pulses. In the second pulse,
ts over the reduced catalysts.
J. Requies et al. / Catalysis Today 116 (2006) 304–312312
both CH4 conversion and H2 selectivity over the unmodified
catalyst were strongly inhibited. In contrast, the modified
catalysts displayed a higher CH4 conversion and H2 production.
Additional pulses showed some stabilization in CH4 conver-
sions for all the catalysts. The Ca-doped one remains the most
active after five pulses. Nevertheless, almost no CO production
was observed after the first pulse in either the modified or
unmodified catalysts and as a result the C must remain
accumulated on the catalyst surface. These observations are in
agreement with the amounts of coke accumulated on the
surface after the methane pulses (Table 7).
Pulse experiments were performed in the absence of oxygen
in the feed stream. Accordingly, in this set of experiments any
methane oxidation must be attributed to some oxygen released
by the support. It should be noted that the amount of oxygen
donated by the alumina substrate is very low and only occurs in
the first pulse [22], and this is accounted for by the formation of
CO only in the first pulse. Pulse experiments revealed that the
ability of the modified and unmodified catalysts to release
oxygen from the catalyst structure was very similar (first pulse).
Therefore, the differences in the CPO activity cannot be
correlated with the activity of the bulk oxygen (it must be also
consider that the CPO activity tests were all performed at
1073 K). Differences could only be established along
successive methane pulses, when no oxygen was available
and methane conversion was only occurring by means of the
decomposition step. In these pulses, the modified catalysts
maintained some activity, and this should be attributed to the
presence of active sites for the decomposition of methane in the
absence of oxygen.
4. Conclusions
Modification of Ni/Al2O3 catalysts by Ca- and Mg-additives
improves the performance in CPO reactions. For the Ca- and
Mg-modified catalysts, a higher Ni dispersion and a lower
carbon deposition (as measured by XPS in the CPO activity
tests used samples) and sintering were observed. Characteriza-
tion analysis of the used catalysts revealed that the structure of
the nickel species in Mg-loaded catalysts was more stable than
in the Ca-modified and unmodified catalysts. Nevertheless, the
improvement in catalytic activity of the Mg- and Ca-modified
catalysts could be related to the presence of active sites for the
decomposition of methane in the absence of oxygen.
Acknowledgements
The authors gratefully acknowledge the financial support of
this work by the European Union (V Framework Program,
LTCPO-GTL No. NNE5-2002-00424) and the University of the
Basque Country.
References
[1] F. Basile, L. Basini, M. D’Amore, G. Fornasari, A. Guarinoni, D.
Matteruzzi, G. del Piero, F. Trifiro, A. Vaccari, J. Catal. 173 (1998) 247.
[2] H. Provendier, C. Petit, C. Estournes, S. Lisbs, A. Kiennemann, Appl.
Catal. A: Gen. 180 (1999) 163.
[3] C.J. Michael, M. Bradford, Albert Vannice. Catal. Today 50 (1999) 87.
[4] N.N. Nichio, M.L. Casella, G.F. Santori, E.N. Ponzi, O.A. Ferretti, Catal.
Today 62 (2000) 231.
[5] H.Y. Wang, E. Ruckenstein, J. Catal. 199 (2001) 309.
[6] J.R. Rostrup-Nielsen, J.H.B. Hansen, J. Catal. 144 (1993) 38.
[7] J.R. Rostrup-Nielsen, in: J.R. Anderson, M. Boudart (Eds.), Catalysis,
Science and Technology, vol. 5, Springer, Berlin, 1984, pp. 1–117.
[8] E. Ruckenstein, Y.H. Hu, Catal. Rev. Sci. Eng. 44 (2002) 423.
[9] J. Houalla, B. Lemaitre, Delmon, J. Chem. Soc., Faraday Trans. 78 (1982)
1389.
[10] Z. Hou, O. Yokota, T. Tanaka, T. Yashima, Appl. Catal. A: Gen. 253
(2003) 381.
[11] S. Cavallaro, S. Freni, G. Calogero, J. Power Sources 87 (2000) 28.
[12] J.M. Rynkowski, T. Paryjczak, M. Lenik, Appl. Catal. A: Gen. 106 (1993)
73.
[13] T. Shishido, M. Sukenobu, H. Morioka, M. Kondo, Y. Wang, K. Takaki, K.
Takehira, Appl. Catal. A: Gen. 223 (2002) 35.
[14] J.T. Richardson, B. Turk, M.V. Twigg, Appl. Catal. A: Gen. 148 (1996) 97.
[15] W. Chu, W. Yang, L. Lin, Appl. Catal. A: Gen. 235 (2002) 39.
[16] B.W. Hoffer, A.D. van Langeveld, J.P. Janssens, R.L.C. Bonne, C.M. Lok,
J.A. Moulijn, J. Catal. 192 (2003) 432.
[17] F. van Looij, J.W. Geus, J. Catal. 168 (1997) 154.
[18] H. Morioka, Y. Shimizu, M. Sukenobu, K. Ito, E. Tanabe, T. Shishido, K.
Takehira, Appl. Catal. A: Gen. 215 (2001) 11.
[19] Z. Hou, O. Yokota, T. Tanaka, T. Yashima, Appl. Catal. A: Gen. 253
(2003) 381.
[20] A.A. Lemonidou, M.A. Goula, I.A. Vasalos, Catal. Today 46 (1998) 175.
[21] C.S. Gopinath, S.G. Hegde, A.V. Ramaswamy, S. Mahapatra, Mater. Res.
Bull. 37 (2002) 1323.
[22] K.H. Hofstad, J.H.B.J. Hoebink, A. Holmen, G.B. Marin, Catal. Today 40
(1998) 157.


