Embed Size (px)
Citation preview


Nishat Mills Limited
Annual Report | 2022
PROVEN PERFORMANCEPROMISING POTENTIAL

CORPORATECompany Information ................................................................................. 2Directors’ Profile.......................................................................................... 4Vision, Mission and Core Values ................................................................ 6Chairman’s Review Report ......................................................................... 7Directors’ Report ........................................................................................ 8Financial Highlights .................................................................................. 21Statement of Compliance with Listed Companies (Code of Corporate Governance) Regulations, 2019 ............................................................ 23Independent Auditors’ Review Report to the Members on the Statement of Compliance contained in Listed Companies (Code of Corporate Governance) Regulations, 2019 ........................................... 26Notice of Annual General Meeting ........................................................... 27
FINANCIAL STATEMENTS OF NISHAT MILLS LIMITEDIndependent Auditor’s Report to the members ....................................... 40Statement of Financial Position ................................................................ 46Statement of Profit or Loss ....................................................................... 48Statement of Comprehensive Income ...................................................... 49Statement of Changes in Equity ............................................................... 50Statement of Cash Flows ......................................................................... 51Notes to the Financial Statements ........................................................... 52
CONSOLIDATED FINANCIAL STATEMENTS OF NISHAT MILLS LIMITED AND ITS SUBSIDIARIESDirectors’ Report .................................................................................... 124Independent Auditor’s Report to the members ..................................... 125Consolidated Statement of Financial Position ....................................... 132Consolidated Statement of Profit or Loss ............................................. 134Consolidated Statement of Comprehensive Income ............................ 135Consolidated Statement of Changes in Equity ..................................... 136Consolidated Statement of Cash Flows ................................................. 137Notes to the Consolidated Financial Statements .................................. 138
Pattern of Holding of the Shares ............................................................ 229Directors’ Report Consolidated in Urdu ................................................. 236Directors’ Report in Urdu ....................................................................... 248Forms of Proxy in Urdu & English
CONTENTS
Annual Report 2022
01Page

JS Bank LimitedMeezan Bank LimitedMCB Bank LimitedMCB Islamic Bank LimitedNational Bank of Pakistan Pak Brunei Investment Company LimitedPakistan Kuwait Investment Company (Private) Limited Samba Bank LimitedSilk Bank LimitedSoneri Bank LimitedSummit Bank LimitedStandard Chartered Bank (Pakistan) LimitedThe Bank of PunjabThe Bank of Punjab - Taqwa Islamic BankingThe Bank of KhyberUnited Bank Limited
COMPANY INFORMATIONChief Financial OfficerMr. Mohammad Azam
Company SecretaryMr. Khalid Mahmood Chohan
AuditorsRiaz Ahmad & CompanyChartered Accountants
Legal Advisor Mr. M. Aurangzeb Khan, Advocate, Chamber No. 6, District Court, Faisalabad.
Bankers to the CompanyAlbaraka Bank (Pakistan) LimitedAllied Bank LimitedAskari Bank LimitedBank Alfalah LimitedBank Al Habib LimitedBank Islami Pakistan LimitedCitibank N.A.Dubai Islamic Bank Pakistan Limited Faysal Bank LimitedFaysal Bank Limited - Islamic BankingHabib Bank LimitedHabib Metropolitan Bank Limited Industrial and Commercial Bank of China Limited
Board of DirectorsMian Umer ManshaChief Executive Officer
Mian Hassan ManshaChairman
Mrs. Mehak AdilMrs. Sara AqeelSyed Zahid HussainMr. Farid Noor Ali FazalMr. Mahmood Akhtar
Audit CommitteeMrs. Mehak AdilChairperson / Member
Syed Zahid HussainMember
Mr. Mahmood AkhtarMember
Human Resource & Remuneration (HR & R)CommitteeMrs. Sara AqeelChairperson / Member
Mian Umer ManshaMember
Mr. Mahmood AkhtarMember
Nishat Mills Limited
02 Page

Terry Unit7 K.M. Nishat Avenue Off 22 K.M. Ferozepur Road, Lahore.
Apparel Unit2 K.M. Nishat Avenue Off 22 K.M. Ferozepur Road, Lahore.
Registered officeNishat House, 53 - A, Lawrence Road, Lahore.Tel: 042-36360154, 042-111 113 333 Fax: 042-36367414
Shares RegistrarTHK Associates (Private) Limited
Head Office, KarachiPlot No. 32-C Jami Commercial Street No. 2, DHA Phase VII,Karachi 75500.Tel: 021-111 000 322Fax: 021-35310191
Mills
Spinning units, Yarn Dyeing& Power plantNishatabad, Faisalabad.
Spinning units & Power plant20 K.M. Sheikhupura FaisalabadRoad, Feroze Watwan.
Spinning units & Power plantPlot No. 172-180 & 188-197,M-3 Industrial City, Sahianwala, FIEDMC, 2 K.M. Jhumra Chiniot Road, Chak Jhumra, Faisalabad.
Weaving units & Power plant12 K.M. Faisalabad Road, Sheikhupura.
Weaving units, Dyeing & Finishing unit, Processing unit, Stitching units and Power plants5 K.M. Nishat Avenue Off 22 K.M. Ferozepur Road, Lahore.
Branch Office, LahoreOffice No. 309, 3rd Floor,North Tower, LSE building,19-Sharah-e-Aiwan-e-IqbalLahore.Tel: 042-36302044
Head Office7, Main Gulberg, Lahore.Tel: 042-35716351-59, 042-111 332 200Fax: 042-35716349-50E-mail: [email protected] Website: www.nishatmillsltd.com
Liaison Office1st Floor, Karachi Chambers, Hasrat Mohani Road, Karachi. Tel: 021-32414721-23Fax: 021-32412936
Annual Report 2022
03Page

DIRECTORS’ PROFILE
Mian Umer Mansha received his Bachelors degree from Babson College, Boston, USA. He has been serving on the Board of Directors of various listed companies for more than 27 years.
He also serves on the Board of AdamjeeInsurance Company Limited, MCB Bank Limited, Adamjee Life Assurance Company Limited, Nishat Dairy (Private) Limited,Nishat Hotels and Properties Limited,Nishat (Raiwind) Hotels and Properties Limited, Nishat Developers(Private) Limited, Nishat Sutas Dairy Limited, HyundaiNishat Motor (Private) Limited, NishatAgriculture Farming (Private) Limited, Nishat Agrotech Farms (Private) Limited andNational Textile Foundation.
Mian Hassan Mansha has been serving on the Board of various listed companies for several years. He also serves on the Board of Nishat Power Limited, Security GeneralInsurance Company Limited, Lalpir Power Limited, Pakgen Power Limited, Nishat Hotels and Properties Limited, Nishat (Aziz Avenue) Hotels and Properties Limited, Nishat (Raiwind) Hotels and Properties Limited, Nishat Dairy (Private) Limited, PakistanAviators and Aviation (Private) Limited,Nishat Real Estate DevelopmentCompany (Private) Limited, NishatAgriculture Farming (Private) Limited and Hyundai Nishat Motor (Private) Limited.
Syed Zahid Hussain is a seasoned professional inPakistan’s corporate world. He possesses multi-faceted talents and has attainedexemplaryaccomplishments. He has in-depthknowledge of a wide range of subjects and has extensivelydiversified experience and exposure in senior positions. He hasearned B.Sc, LLB and MA in InternationalRelations. He has a vast experience of working as Chairman / Chief Executive / Director of various state owned enterprises and listed companies. He has also served as the High Commissioner / Ambassador ofPakistan in Kenya, with accredited assignments of Ambassadorship in Tanzania, Uganda, Rwanda, Krundse, Ethiopia and Eritrea. He is a fellow member of the Institute ofManagement, England, InternationalBiographical, Center, the USA and theInstitute of Marketing Management, Karachi.
Mr. Farid Noor Ali Fazal is a Bachelor ofCommerce, Bachelor of Laws and Bachelor of Management. He has more than 49 years’experience of marketing. He worked on various positions in Middle East and USA. He is associated with cement industry in one form or the other and was the acting chairman of All Pakistan Cement ManufacturersAssociation in 2002. He also serves on theBoard of D. G. Khan Cement Company Limited and Nishat Paper ProductsCompany Limited.
Mian Umer ManshaChief Executive Officer
Mian Hassan ManshaChairman
Syed Zahid HussainNon-Executive Director
Mr. Farid Noor Ali FazalNon-Executive Director
Nishat Mills Limited
04 Page

Mr. Mahmood Akhtar holds an MBA degree from Punjab Universityand has over 39 years of managerial experience spread across various industries. He also serves on the Board ofD. G. Khan Cement Company Limited, Lalpir Power Limited,Nishat Power Limited, Security GeneralInsurance Company Limited, NishatHospitality (Private) Limited, Nishat Paper Products Company Limited, and Nishat Commodities (Private) Limited.
Mrs. Sara Aqeel is a qualified lawyer, with a significant experience in litigation and academics. She holds a gold medal inBachelors of Law and has worked withRamday Law associates. Her work includes casespertaining to thecorporate sector with a special focus on theBanking Sector. In addition, she has also taught Law at Pakistan College of Law and acted as a coordinator for the externalprogram of Law offered by the University ofLondon. Over the years she has participated in a number of skills training programswhich have focused primarily onInternational Law, pertaining to Trade, Human Rights and ComparativeJurisprudence.
Mrs. Mehak Adil holds an LLM from theLondon School ofEconomics and Political Science, with a specialization in Corporate andCommercial Law. Mrs. Mehak started hercareer as a corporate lawyer at Cornelius,Lane and Mufti in 2015, where she wasengaged in various corporate andcommercial cases. Mrs. Mehak is anAdvocate of the High Courts in Pakistan, with expertise in domestic and internationaldispute resolution, including international arbitration.
Mr. Mahmood AkhtarNon-Executive Director
Mrs. Sara AqeelIndependent Director
Mrs. Mehak AdilIndependent Director
Annual Report 2022
05Page

VISION STATEMENT: To be and remain industry lead by safeguarding stakeholders’ interest, serving community and playing a meaningful role in the economy of Pakistan.
MISSION STATEMENT: To increase financial returns by pursuing sustainable business, producing the best quality products and providing excellent customer services while adopting best practices.
VISION, MISSION & CORE VALUES
CORE VALUES:
VALUE SLOGAN CONNOTATION
Nishat is open to innovation & creativity at organization level, systems level and individual level.
Be Open to Newness
Novelty
Nishat operates through lawful means and fulfils its legal, moral and ethical responsibilities.
Be HonestIntegrity
Nishat encourages culture of mutual respect, support and develops congenial environment for people at workplace.
Be EmpathicHumbleness
Nishat trusts its employees the most and believes in attaining sustainable competitive advantage through its Human Capital.
Trust the PeopleTrust
Nishat ensures best use of environmental resources by adopting benchmark process and bringing continuous improvement in the same.
Be Sensitive to EnvironmentSustainability
Nishat believes in 'participative decision making' and assures that everyone should take responsibility for all decisions at all levels.
Be ResponsibleAccountability
Nishat Mills Limited
06 Page

I am pleased to present you the annual report of Nishat Mills Limited (the “Company”) for the year ended 30 June 2022. The Company’s financial performance was exceptional as it earned historically the highest profit after tax during the year. I wholeheartedly congratulate the Board of Directors (the “Board”) and all stakeholders for this remarkable achievement. This unprecedented growth reflects Board’s effective and robust oversight in formulation, approval and implementation of corporate strategy.
The Board is composed of members with diverse background having relevant knowledge, skills and experience of textile business. Its appropriate balance of one executive, four non-executive and two independent directors ensure its independence and empowerment. Both independent directors are females.
The Board ensures implementation of the best corporate governance practices and compliance with all prevailing regulatory requirements. The Board members regularly review and consider the impact of new laws and regulations on affairs of the Company. This year, Mrs. Mehak Adil received Certificate of Directors Education from Institute of Chartered Accountants of Pakistan in accordance with the requirements of the Listed Companies (Code of Corporate Governance) Regulations, 2019 (“the Code”).
The Board has constituted adequate number of Committees like Audit Committee and Human Resource and Remuneration Committee. Both the Committees performed well according to their Terms of Reference. The Board has developed a mechanism for annual evaluation of Board’s own performance, Members of the Board and its Committees. The Board carried out annual evaluation of Board’s own performance, Members of the Board and its Committees on 28 April 2022. The performance of the Board, its Members and Committees was satisfactory. The Board has agreed on the same performance evaluation mechanism for the next year. The major functions performed by the Board during the financial year 2021-22 are as follows:
• Performed continuous and effective oversight. • Approved overall corporate strategy and annual business plan. • Ensured the quality and appropriateness of financial reporting and transparency of disclosures in
annual and quarterly financial statements. • Evaluated compliance of regulatory and legal requirements • Carried out risk assessment of cotton supply and prices, energy availability and cost, foreign
exchange fluctuations and interest rate. • Reviewed effectiveness of internal control system. • Performed the due diligence of investments and evaluated returns. • Reviewed and approved the financing / borrowing facilities. • Ensured timely dissemination of price sensitive and inside information to relevant regulatory
authorities.
Mian Hassan ManshaChairman
Lahore20 September 2022
CHAIRMAN’S REVIEW REPORT
Annual Report 2022
07Page

Directors’Report
Financial Performance
The Company recorded unprecedented financial performance during the current financial year. Revenue and profitability both grew remarkably. Profit after tax increased by 74.11% in the current year as compared to the corresponding last year. The main reason was increase in topline due to better marketing strategies and diversified product mix.
Revenue increased by Rs. 44.337 billion (62.07%) from Rs. 71.431 billion in the corresponding last year to Rs. 115.768 billion in the current year which is historically the highest. All business segments contributed towards this unprecedented growth in revenue in terms of increased volume and favorable prices. Export sales in USD also increased by USD 132.224 million (June 2022: USD 442.215 million, June 2021: USD 289.991 million). The following chart shows that the Company’s revenue grew by 115% over the last 5 years.
2022 2021Rupees (000) Rupees (000)Financial highlights
Revenue 115,768,065 71,431,010Gross Profit 17,335,571 9,317,855EBITDA 18,358,269 11,137,991Depreciation 3,290,619 2,838,310Finance Cost 2,160,365 1,229,179Dividend Income 3,328,797 2,722,637Profit before Tax 12,907,285 7,070,502Profit after Tax 10,311,674 5,922,470
Directors of Nishat Mills
Limited (“the Company”)
are pleased to present
the annual report of the
Company for the year
ended 30 June 2022
along with the financial
statements and auditors’
report thereon.
Nishat Mills Limited
08 Page

Annual Report 2022
09Page
Gross profit increased by Rs. 8.018 billion (86.05%) from Rs. 9.318 billion in the comparable last year to Rs. 17.336 billion in the current year. The Company achieved these remarkable results despite challenges such as huge increase in raw cotton prices, increase in RLNG rate, shutdown of gas supply, disruption in global supply chain and Covid-19 pandemic.
Better operational profitability and increased other income generated enough funds to fulfil financing requirements. The Company earned EBITDA of Rs. 18.358 billion in the current year which was an increase of Rs. 7.220 billion (64.83%) over the EBITDA of the last year.
Dividend income once again remained important source of cash inflows during the year. It increased by 22.26% from Rs. 2.723 billion in the corresponding last year to Rs. 3.329 billion in the current year. The Company made further equity investment in Nishat Sutas Dairy Limited and United Bank Limited by acquiring 127,624,900 and 353,000 shares respectively in order to further strengthened and diversify its portfolio.
Finance cost increased by Rs. 931.186 million in the current year due to increase in average borrowing cost and short-term loans which were obtained to finance increased working capital requirements.
The Company’s interest cover ratio increased slightly from 6.75 times to 6.97 times on account of improved profitability. A review of interest coverage over the last five years indicates that the Company is in a good financial health and is not exposed to any significant risks regarding its borrowings.
The Company earned profit before tax (PBT) amounting to Rs. 12.907 billion which is the highest in its entire history. PBT increased by Rs. 5.836 billion (82.53%) from Rs. 7.071 billion. PBT to sales percentage increased to 11.15% from 9.90% which is an increase of 1.25%. Efficient working capital management, cost reduction strategies and a well-diversified investment portfolio were the reasons for this remarkable profitability.
140,000,000120,000,000100,000,00080,000,00060,000,00040,000,00020,000,00010,000,000
-
Revenue
Years
Rup
ees
(000
)
2017-18 2018-19 2020-21 2021-222019-20
18,000,00016,000,00014,000,00012,000,00010,000,0008,000,0006,000,0004,000,000
Gross Profit
Years
Rup
ees
(000
)
2017-18 2018-19 2020-21 2021-222019-20
20,000,000
15,000,000
10,000,000
5,000,000
-
EBITDA
Years
Rup
ees
(000
)
2017-18 2018-19 2020-21 2021-222019-20
4,000,000
3,000,000
2,000,000
1,000,000
-
Dividend Income
Years
Rup
ees
(000
)
2017-18 2018-19 2020-21 2021-222019-20
2,500,000
2,000,000
1,500,000
1,000,000
500,000
-
Finance Cost
Years
Rup
ees
(000
)
2017-18 2018-19 2020-21 2021-222019-20
8.00
6.00
4.00
2.00
-
Interest Cover
Years
Tim
es
2017-18 2018-19 2020-21 2021-222019-20

Nishat Mills Limited
10 Page
Nishat Group (“the Group”) is one of the largest and leading business houses in Pakistan. It operates in 12 major sectors of national economy. The Group has 2 textile companies in Pakistan: Nishat Mills Limited and Nishat Linen (Private) Limited. Nishat Mills Limited is the parent company while Nishat Linen (Private) Limited is its wholly owned subsidiary. The principal objects of the Subsidiary are to operate retail outlets for sale of textile and other products and to sell the
Bottom line of the Company increased by Rs. 4.389 billion (74.11%). Profit after tax to sales percentage recorded only an insignificant increase of 0.62% in the current year as compared to the last year due to imposition of super tax in Finance Act, 2022-23. The Company booked the provision of Rs. 801.397 million for super tax.
Fixed Capital Expenditure
The Company believes that its financial strength and future cashflows depend on upgradation and expansion of its manufacturing facilities. Management expended Rs. 7.203 billion in the current year on fixed capital expenditure as compared to Rs. 7.616 billion in the corresponding last year. The major projects include commissioning into production of an open-end yarn spinning unit of 4,320 Rotors and a weaving unit 130 Tsudakoma Air Jet looms.
Working Capital Management
The Company’s short-term financial health remained steady during the current financial year despite increased financing requirements of huge sales
volume. Current Ratio remained unchanged at 1.39 while quick ratio dropped from 0.76 to 0.57 due to procurement of stocks and inventories keeping in view the sales forecast and market dynamics of raw materials.
Earnings per share
Earnings per share (EPS) recorded a remarkable increase of Rs. 12.49 (74.17%) over the last year. It increased to Rs. 29.33 per share in the current year as compared to Rs. 16.84 per share in the corresponding last year.
12.00%
11.00%
10.00%
9.00%
8.00%
7.00%
6.00%
Profit before Tax %
Years
Perc
enta
ge
2017-18 2018-19 2020-21 2021-222019-20
10.00%9.50%9.00%8.50%8.00%7.50%7.00%6.50%6.00%5.50%5.00%
Profit after Tax %
Years
Perc
enta
ge
2017-18 2018-19 2020-21 2021-222019-20
9,000,000
7,500,000
6,000,000
4,500,000
3,000,000
1,500,000
-
Fixed Capital Expenditure
Years
Rup
ees
(000
)
2017-18 2018-19 2020-21 2021-222019-20
1.40
1.35
1.30
1.25
1.20
Current Ratio
Years
Rat
io
2017-18 2018-19 2020-21 2021-222019-20
35.0030.0025.0020.0015.0010.005.00
-
Earnings per Share
Years
Rup
ees
per S
hare
2017-18 2018-19 2020-21 2021-222019-20
0.80
0.60
0.40
0.20
-
Quick Ratio
Years
Rat
io
2017-18 2018-19 2020-21 2021-222019-20

Annual Report 2022
11Page
Appropriations
The Board of Directors of the Company has recommended 40% cash dividend (2021: 40%) and transferring of Rupees 8,906 million (2021: Rupees 4,516 million) to general reserve.
SEGMENT ANALYSIS
Spinning
Raw cotton prices in international market consistently increased throughout financial year 2022 due to US-China trade commitments, bullish trading and improved Covid-19 situation in most parts of the world which accelerated demand. Local cotton prices also increased in line with international cotton trends, short cotton crop and rapid buying by spinners in start of the season. Trends in local and international cotton prices remained bullish. The Company immediately started procurement of raw cotton when harvesting season started because management foresaw that price would rise with the passage of time.
Local yarn prices followed the trend of raw cotton rates and moved upward in tandem with increase in demand and ban on yarn import from India. However, global demand of cotton yarn was low; therefore, yarn prices didn’t move along with cotton prices in local market. The situation further deteriorated due to 5th wave of Covid-19 in China (the main market of cotton yarn), world energy crisis,
textile products by processing the textile goods in own and outside manufacturing facilities.
Financial performance of both of these textile companies was exceptional during the year. Consolidated Earnings per Share (EPS) recorded an exponential growth of Rs. 11.12 (54.83%) from Rs. 20.28 in the corresponding last year to Rs. 31.40 in the current year. The review of last five years indicates that consolidated EPS was the highest during financial year 2022.
35.0030.0025.0020.0015.0010.005.00
-
Consolidated Earnings per Share of Nishat Mills Limited and Nishat Linen (Private) Limited
Years
Rup
ees
per S
hare
2017-18 2018-19 2020-21 2021-222019-20
40,000
30,000
20,000
10,000
-
Yarn Sales Quantity
Years
Kgs
(000
)
2017-18 2018-19 2020-21 2021-222019-20
30,000,000
20,000,000
10,000,000
-
Yarn Sales Value
Years
Rup
ees
(000
)
2017-18 2018-19 2020-21 2021-222019-20
700
600
500
400
300
200
100
-
Yarn Sales Rate
Years
Rup
ees
per k
g
2017-18 2018-19 2020-21 2021-222019-20
supply chain logistic difficulties and global inflation which restricted consumers from spending, resulting reduction in demand of textile products by major retail stores.
The Company sold major portion of its production in local market as compared to export market after considering demand dynamics of cotton yarn. The strategy resulted in good profits for the year.
Weaving
Grey cloth prices increased by around 40% as a result of increase in raw material cost. Demand for fabric remained steady for the first three quarters of FY 2022. Customers placed orders in excess of their short-term requirements keeping supply chain full due to expectation of rising raw material costs and logistics issues. We saw the highest growth in technical fabric segment. Workwear business also remained steady. Fashion fabric saw insignificant increase in demand. However, greige cloth sale for home textile went down as compared to the last year when most of the world population was staying at home due to lockdowns.

Nishat Mills Limited
12 Page
100,000
95,000
90,000
85,000
80,000
Grey Cloth Sales Quantity
Years
Met
ers
(000
)
2017-18 2018-19 2020-21 2021-222019-20
30,000,000
25,000,000
20,000,000
15,000,000
10,000,000
5,000,000
-
Grey Cloth Sales Value
Years
Rup
ees
(000
)
2017-18 2018-19 2020-21 2021-222019-20
300.00
250.00
200.00
150.00
100.00
50.00
-
Grey Cloth Sales Rate
Years
Rup
ees
per m
eter
2017-18 2018-19 2020-21 2021-222019-20
50,000
40,000
30,000
20,000
10,000
-
Processed Cloth Sales Quantity
Years
Met
ers
(000
)
2017-18 2018-19 2019-20 2020-21 2021-22
25,000,000
20,000,000
15,000,000
10,000,000
5,000,000
-
Processed Cloth Sales Value
Years
Rup
ees
(000
)
2017-18 2018-19 2019-20 2020-21 2021-22
600.00
500.00
400.00
300.00
200.00
100.00
-
Processed Cloth Sales Rate
Years
Rup
ees
per m
eter
2017-18 2018-19 2019-20 2020-21 2021-22
35,000
30,000
25,000
20,000
15,000
10,000
5,000
-
Processed Cloth and Made-ups Sales Quantity
Years
Met
ers
(000
)
2017-18 2018-19 2019-20 2020-21 2021-22
months due to shortage of local cotton, inflation and unprecedented depreciation of Pak Rupee.
Home Textile
Home Textile Division performed well during the financial year 2021-22. Top line of the Division grew by 23.76% during the current financial year as compared to the corresponding last financial year. However, unprecedented surge in raw material and shipping costs increased the cost of production of our finished goods. The Division was able to pass on only a small portion of that additional cost to our customers which affected the profitability of the Division.
In September 21, we commissioned into production our new weaving mill comprising of 130 brand new Tsudakoma model NEO 001 wider width (280 cm and 340 cm) looms. This project has given us great flexibility in terms of product diversity and can also be used to run double width for production of 63” greige cloth. Further, we intend to replace our older looms 2005 / 2006 model as part of company’s strategy to keep investing in the latest technologies.
Dyeing
Profitability of Dyeing Division remained steady during the financial year ended 30 June 2022. The management was able to mitigate the adverse impacts of skyrocketing raw material cost and extremely volatile market. Despite relatively slow start in first quarter, the Division did significantly well in rest of the year. Consequently, the Division surpassed its annual sales target.
The management is foreseeing more challenges ahead in fiscal year 2023 due to uncertain economic conditions in the country and slowdown in growth of global economies. The major issue would be raw material prices which are expected to rise in coming

Annual Report 2022
13Page
20,000,000
16,000,000
12,000,000
8,000,000
4,000,000
-
Processed Cloth and Made-ups Sales Value
Years
Rup
ees
(000
)
2017-18 2018-19 2019-20 2020-21 2021-22
600.00
550.00
500.00
450.00
400.00
350.00
300.00
-
Processed Cloth and Made-ups Sales Rate
Years
Rup
ees
per m
eter
2017-18 2018-19 2020-21 2021-222019-20
3,000
2,500
2,000
1,500
1,000
500
-
Terry products Sales Quantity
Years
Kgs
(000
)
2021-222020-21
3,500,000
3,000,000
2,500,000
2,000,000
1,500,000
1,000,000
500,000
-
Terry products Sales Value
Years
Rup
ees
(000
)
2021-222020-21
1,400.00
1,200.00
1,000.00
800.00
600.00
400.00
200.00
0.00
Terry products Sales Rate
Years
Rup
ees
per k
g
2020-21 2021-22
12,000
9,000
6,000
3,000
Garments Sales Quantity
Years
Gar
men
ts (0
00)
2017-18 2018-19 2020-212019-20 2021-22
15,000,000
12,000,000
9,000,000
6,000,000
3,000,000
-
Garments Sales Value
Years
Rup
ees
(000
)
2017-18 2018-19 2020-21 2021-222019-20
1,600.00
1,200.00
800.00
400.00
-
Garments Sales Rate
Years
Rup
ees
per g
arm
ent
2017-18 2018-19 2020-21 2021-222019-20
Garments
Garments Division has recorded the remarkable growth in profitability during the current financial year. Garments sales increased remarkably by Rs. 6.227 billion (79.77%) during the current year as compared to the corresponding last year. The main reason was building of close relations with customers by providing quality products. Consequently, profitability of the Division increased significantly.
The management foresees rise in demand for its products in future. The project to establish a new production facility is underway in order to further enhance production which will create a large number of direct and indirect employment opportunities.
Power Generation
Energy was the biggest challenge because prices of coal and oil increased many-fold during the current financial year. Further, Government of Pakistan revised subsidized rate of gas for Captive power plants of export-oriented sector from USD 6.5 per mmbtu to USD 9 per mmbtu. Moreover, required
Terry unit was commissioned into production during the last financial year and it is showing promising results.

quantity of gas was also not available. The Company received RLNG around half of its gas consumption requirement for its captive power plants. Energy requirements of Spinning Division, Sahianwala has grown after the commissioning of a new open-end yarn unit, therefore, plan for acquisition of 5.8 MW Wartsila dual fuel power engine is under consideration. Likewise, acquisition of two gas engines having total capacity of 4 MW with waste heat recovery boiler and air compressor and a 1 MW Diesel Engine is underway to cater the increased demand of towel manufacturing facility of Home Textile Division after increase in its capacity. Garments Division's expansion is in process; management has planned to acquire a 1 MW Diesel Engine.
RISKS AND OPPORTUNITIES
Nishat Mills Limited takes risks and creates opportunities in the normal course of business. Taking risk is important to remain competitive and maintain sustainable business success. Our risk and opportunity management encompass an effective framework to conduct business in a well-controlled environment where risks are mitigated and opportunities are availed. Each risk and opportunity are properly weighted and considered before making any choice. Decisions are formulated only if opportunities outweigh risks.
Following is the summary of risks and strategies to mitigate those risks:
STRATEGIC RISKS
We are operating in a competitive environment where innovation, quality and cost matters. Strategic risk is mitigated through continuous research & development and persistent introduction of new technologies under BMR. This risk is considered as the most crucial of all the risks. Heads of all business divisions meet at regular intervals to form an integrated approach towards tackling risks present both at the international and national level.
BUSINESS RISKS
The Company faces a number of following business risks:
Cotton Supply and Price
The supply and prices of cotton is subject to the act of nature and demand dynamics of local and international cotton markets. There is always a risk of non-availability of cotton and upward shift in the
cotton prices in local and international markets. The Company mitigates this risk by the procurement of major cotton stock in bulk at the start of the harvesting season.
Export Demand and Price
Exports are major part of our revenue. We face the risks of pandemics, competition and decline in demand of our products in international markets. We minimize this risk by building strong relations with customers, broadening our customer base, developing innovative products without compromising on quality and providing timely deliveries to customers.
Energy Availability and Cost
The rising cost and un-availability of energy i.e. electricity and gas shortage is a major threat to manufacturing industry. This risk, if remains unmitigated, can render us misfit to compete in the international markets. The Company has mitigated the risk of rising energy cost by opting for diversified fuels such as coal, furnace oil, bio-mass, diesel along with solar energy. The measures to conserve energy have also been taken at all manufacturing facilities of the Company. Likewise, risk of non-availability of the energy has been minimized by installing power plants for generating electricity at all locations of the Company along with securing electricity connections from WAPDA.
FINANCIAL RISKS
The Board of Directors of the Company is responsible to formulate the financial risk management policies which are implemented by the Finance Department of the Company. The Company faces the following financial risks:
Currency risk
The Company is exposed to currency risk arising from various currency exposures, primarily with respect to United States Dollar (USD), Arab Emirates Dirham (AED), Euro, Japanese Yen (JPY) and Swiss Franc (CHF). The Company’s foreign exchange risk exposure is restricted to the bank balances and the amounts receivable / payable from / to the foreign entities.
Interest rate risk
The Company’s interest rate risk arises from long term financing, short term borrowings, loans and
Nishat Mills Limited
14 Page

advances to subsidiary companies and bank balances in saving accounts. Financial instruments at fixed rate expose the Company to fair value interest rate risk.
Credit risk
The Company’s credit exposure to credit risk and impairment losses relates to its trade debts. This risk is mitigated by the fact that majority of our customers have a strong financial standing and we have a long-standing business relationship with all our customers. We do not expect non-performance by our customers; hence, the credit risk is minimal.
Liquidity risk
It is at the minimum due to the availability of enough funds through committed credit facilities from the Banks and Financial institutions.
Capital risk
When managing capital, it is our objective to safeguard the Company’s ability to continue as a going concern in order to provide returns for shareholders and benefits to other stakeholders and to maintain an optimal capital structure to reduce the cost of capital. The Company maintains low leveraged capital structure. We monitor the capital structure on the basis of the gearing ratio.
OPPORTUNITIES
As the leading textile company of the country, the Company is in a position to avail and exploit a number of opportunities. Following is the summary of some exciting opportunities:
• Regionally diversified customer base across the world provides a sustainable growth to export sales;
• Diversified product portfolio to attract the attention of textile buyers across the world;
• Vibrant local and international subsidiary companies create demand for our products;
• Vertical integration makes it possible to exploit operational synergies;
• High population growth of the country is a source of suitable manpower and a stimulus in creating the demand for textile products.
TEXTILE INDUSTRY OVERVIEW
Textile sector in Pakistan performed very well in fiscal year 2021-22. Textile exports increased 25.52 percent as compared to last fiscal year. In fiscal year 2021 textile exports were $15.40 billion, which surged to highest ever exports of $19.33 billion in fiscal year 2022.
Textile sector achieved exports landmark of $19.33 billion because of high demand of textile products worldwide and heavy investment by entrepreneurs which enabled them to expand their production capacities to cater the requirement of customers.
One important factor of high demand of textile products in fiscal year 2022, was relaxation in most of the Covid-19 restrictions. By the end of first quarter majority of population in U.S. and Europe was fully vaccinated, which helped people to move freely in safe environment. Global economy gradually recovered from the Covid-19 pandemic and companies posted healthy results.
In spite of surge in demand of fashion apparel from all brands in fiscal year 2022, value added segment of textile sector in Pakistan could not take full advantage of the situation mainly because of skyrocketing raw material cost. Cotton spot rate touched the highest level of Rs. 22,800 per maund and cotton prices in U.S. and other regions also remained on higher side. Besides cotton, cost of dyes & chemicals, polyester, spandex and other imported fibers increased considerably during this period.
Another challenge that value-added segment particularly faced, was highly disturbed vessel schedule, which abnormally increased transit times for import and export shipments during fiscal year 2022. This problem not only effected global supply chain but also significantly increased shipping cost.
Record 28.49 percent depreciation of Pak Rupee against U.S. Dollar in fiscal year 2022 gave temporary relief to textile exporters, as they got benefit of rupee depreciation on shipments against which raw material was already procured. However, for subsequent orders input cost also shot up.
Russian war in Ukraine, which started in third quarter of fiscal year 2022, has brought volatility to the markets.
Annual Report 2022
15Page
5. Nishat Linen Trading LLC
Nishat Linen Trading LLC is a Limited Liability Company incorporated in Dubai, UAE. It is a wholly owned subsidiary of the Company. The subsidiary is principally engaged in trading of textile, blankets, towels, linens, ready-made garments, garments accessories and leather products along with ancillaries thereto through retail outlets and warehouses across United Arab Emirates. The subsidiary started its commercial operations in May 2011 and is presently operating 14 retail outlets in UAE.
6. Nishat International FZE
This is also a wholly owned subsidiary of Nishat Mills Limited. It was incorporated as a Free Zone Establishment Limited Liability Company in Jebel Ali Free Zone, Dubai according to the laws of United Arab Emirates (UAE). It has been registered in the FZE register on February 07, 2013. The principal activity of the Subsidiary Company is trading in textile products such as blankets, towels & linens, ready-made garments, garments accessories and leather products such as shoes, handbags and all such ancillaries thereto.
7. China Guangzhou Nishat Global Co., Ltd.
China Guangzhou Nishat Global Co., Ltd. Is incorporated in Yuexiu District, Guangzhou, China, as Foreign Invested Commercial Enterprises “FICE”, in accordance with the Law of Peoples Republic of China on Foreign-Capital enterprises and other relevant Laws and Regulations. China Guangzhou Nishat Global Co., Ltd. is a wholly owned subsidiary of Nishat International FZE which is a wholly owned subsidiary of Nishat Mills Limited. The principal business of the Subsidiary is wholesale, commission agency (excluding auction), import and export of textile goods and women fashion accessories. The subsidiary started its commercial operations in January 2014.
8. Nishat USA Inc.
The subsidiary is a corporation service company incorporated in the State of New York. It is a wholly owned subsidiary of the Company and was acquired by the Company on 01 October 2008. The corporation is a liaison
SUBSIDIARY COMPANIES
The Company has also annexed consolidated financial statements along with separate financial statements in accordance with the requirements of International Financial Reporting Standards and Companies Act, 2017. Following is a brief description of all subsidiary companies of Nishat Mills Limited:
1. Nishat Power Limited
The Company owns and controls 51.01% shares of this subsidiary. The subsidiary is listed on Pakistan Stock Exchange Limited. The principle business of the subsidiary is to build, operate and maintain a fuel powered station having gross capacity of 200MW in Jamber Kalan, Tehsil Pattoki, District Kasur, Punjab, Pakistan. The subsidiary commenced its commercial production on 09 June 2010.
2. Nishat Linen (Private) Limited
This is a wholly owned subsidiary of the Company. The principle objects of the Subsidiary are to operate retail outlets for sale of textile and other products and to sell the textile products by processing the textile goods in own and outside manufacturing facilities. The subsidiary started its operations in July 2011 and is presently operating 106 retail outlets including e-stores in Pakistan.
3. Nishat Hospitality (Private) Limited
This is a wholly owned subsidiary of the Company. Subsidiary’s object is to run a chain of hotels across the country. Currently it is operating a four-star hotel in Lahore on international standards under the name of “The Nishat St. James Hotel”. The subsidiary started its operations on 01 March 2014.
4. Nishat Commodities (Private) Limited
This is a wholly owned subsidiary of the Company. The principle object of the subsidiary is to carry on the business of trading of commodities including fuels, coals, building material in any form or shape manufactured, semi-manufactured, raw materials and their import and sale in Pakistan. The subsidiary started its operations in March 2016.
Nishat Mills Limited
16 Page

office of the Company’s marketing department providing access, information and other services relating to US Market.
9. Lalpir Solar Power (Private) Limited
Lalpir Solar Power (Private) Limited was a Private Limited Company incorporated in Pakistan on 09 November 2015. It was a wholly owned subsidiary of Nishat Power Limited which was a subsidiary of Nishat Mills Limited. The subsidiary did not start its commercial operations because it did not get Power Acquisition Request and Consent from Central Power Purchasing Agency. Therefore, the Company voluntarily wound up during the year.
CORPORATE SOCIAL RESPONSIBILITY
Following is the brief summary of corporate social responsibility initiative taken by the Company:
Environment Protection
The Company regularly plants trees in an effort to offset carbon emissions, maintain biodiversity and combat climate change. Recently, the Company collaborated with WWF to plant 2,000 more trees. The Company is in the process of shifting from conventional to renewable energy sources. Currently, 4.34 MW of electricity is generated from solar power plants and projects of 9.86 MW are under acquisition and installation phase. The Company is committed to acquire more solar power plants in order to ensure environmental sustainability and cheap energy. The Company has also established Effluent Water Treatment Plants to treat waste water before its discharge in order to preserve clean water sources. Community Welfare Schemes
Engagement with community is one of the key elements of CSR activities. A clean-up activity was organized on World Environment Day to encourage our employees and the local community about the importance of keeping our surrounding clean. Also, a week-long training session on Gender-Based Violence was conducted for our management and production employees in collaboration with UN Women.
The Company arranged medical camps for malaria, typhoid, dengue, eye sight and polio vaccination for workers, their families and general public living near manufacturing facilities. The Company has also
Annual Report 2022
17Page

Listed Companies (Code of Corporate Governance) Regulations, 2019.
The statement of compliance with the Listed Companies (Code of Corporate Governance) Regulations, 2019 is enclosed.
Board Committees:
Audit Committee
The audit committee is performing its duties in line with its terms of reference as determined by the Board of Directors. During the year under review, four Audit Committee Meetings were held, attendance position was as under: -
No. ofSr.# Name of Director Meetings Attended
1 Mrs. Mehak Adil (Member/Chairperson) 32 Syed Zahid Hussain (Member) 43 Mr. Mahmood Akhtar (Member) 4
Human Resource & Remuneration (HR&R) Committee
The Human Resource & Remuneration Committee is performing its duties in line with its terms of reference as determined by the Board of Directors. During the year under review, one Human Resource & Remuneration Committee Meeting was held, attendance position was as under: -
established dispensaries under the supervision of qualified doctors at its mills which are equipped with ambulances.
Equal Opportunity Employer
The Company has recently signed an MOU with the United Nations (UN) Women to promote gender equality and empower women at workplace. We have expanded and upgraded our day-care facilities in our offices and mills to provide relief to working mothers. We also provide equal opportunity for employment and career progression to disabled and minorities. Occupational Safety and Health
The Company maintains world class occupational health and safety standards because we consider well-being of our employees as prime responsibility. We provide the facility of in-house dispensaries supervised by qualified doctors at all our production facilities. The Company also owns and operates ambulances and firefighting equipment. Most of the production facilities of the Company are ISO-9001 and SA-8000 certified ensuring excellent working conditions for employees.
Waste Recycling
We believe waste recycling is an important activity to protect environment. In addition to water treatment plants, cotton recycling plants, oil recycling machines and caustic recovery units, the Company recently invested in open-end yarn production facilities which use spinning waste to produce yarn.
Consumer Protection Measures
The Company takes responsibility for consumer protection right from procurement of raw material to production processes and supply chain until our goods reach to the consumers. We have also acquired various certifications to ensure that our consumers protection measures are of international standards. Such certifications include Customs-Trade Partnership Against Terrorism (C-TPAT), Oeko Tex Standards 100, SA-8000, WRAP and SEDEX certifications.
CORPORATE GOVERNANCE
Best Corporate Practices
Directors are committed to good corporate governance and comply with the requirements of the
Nishat Mills Limited
18 Page

No. ofSr.# Name of Director Meetings Attended 1 Mian Umer Mansha (Member) 12 Mrs. Sara Aqeel (Member/Chairperson) 13 Mr. Mahmood Akhtar (Member) 1
Meetings of the Board of Directors
During the year under review, five meetings of the Board of Directors of the Company were held in Pakistan and the attendance position was as follows:
No. ofSr.# Name of Director Meetings Attended 1 Mian Umer Mansha 5 (Chief Executive Officer) 2 Mian Hassan Mansha (Chairman) 5 3 Syed Zahid Hussain 5 4 Mr. Mahmood Akhtar 5 5 Mr. Farid Noor Ali Fazal 5 6 Mrs. Sara Aqeel 5 7 Mrs. Mehak Adil 4
Directors’ Statement
Following is the Directors’ statement on Corporate and Financial Reporting framework:
1. The financial statements, prepared by the management of the Company, present fairly its state of affairs, the result of its operations, cash flows and changes in equity.
2. Proper books of account of the Company have been maintained.
3. Appropriate accounting policies have been consistently applied in preparation of the financial statements and accounting estimates are based on reasonable and prudent judgment.
4. International Financial Reporting Standards, as applicable in Pakistan, have been followed in preparation of financial statements.
5. The system of internal control is sound in design and has been effectively implemented and monitored.
6. There are no significant doubts upon the Company’s ability to continue as a going concern.
7. There has been no material departure from the best practices of corporate governance.
8. Value of investments in respect of retirement benefits fund: Provident Fund: 30th June, 2022: Rs. 4,572.669 million Un-audited, (2021: Rs. 4,407.174 million Audited).
Transactions with related parties
The Company has fully complied with best practices on Transfer Pricing as contained in Companies (Related Party Transactions and Maintenance of Related Records) Regulations, 2018 while executing all transactions with related parties. The detail of arrangements for transactions, as approved by the Board during the year, other than transactions in the ordinary course of business is as follows:
Further equity investment of up to Rs. 1,000 million in Nishat Sutas Dairy Limited, an associated company, to earn dividend and prospective capital gains.
Auditors
Riaz Ahmad & Company, Chartered Accountants, current auditors will retire on the conclusion of Annual General Meeting of the Company. Being eligible, they have offered themselves for reappointment for the year ending 30 June 2023. As suggested by Audit Committee, the Board of Directors has recommended reappointment of Riaz Ahmad & Company, Chartered Accountants for approval of shareholders in forth coming Annual General Meeting.
SUBSEQUENT EVENTS
The Board of Directors of the Company has proposed a cash dividend of Rupees 4 per share in their meeting held on 20 September 2022.
No other material changes and commitments affecting the financial position of the Company occurred between 30 June 2022 and 20 September 2022.
Annual Report 2022
19Page

DIRECTORS’ REMUNERATION
The Board of Directors has approved Directors’ Remuneration Policy. The main features of the policy are as follows:
• The Company shall not pay remuneration to its non-executive directors including independent directors except for meeting fee for attending meetings of Board and its Committees.
• The Company will reimburse or incur expenses of travelling and accommodation of Directors in relation to attending meetings of the Board and its Committees.
• The Directors’ Remuneration Policy will be reviewed and approved by the Board of Directors from time to time.
Refer to note 38 of financial statements of the Company for remuneration of Chief Executive Officer and Directors of the Company.
PATTERN OF SHAREHOLDING
A statement of the pattern of shareholding as at June 30, 2022, which is required to be disclosed under the reporting framework, is annexed to this report.
ACKNOWLEDGEMENT
Directors are pleased and thankful to the employees for their continued dedication of efforts for the Company.
FUTURE PROSPECTS
Presently, country is facing devastating floods which have ruined most of cotton crop. Therefore, availability of raw material would be a major cause of concern during financial year 2022-23. Such situation is expected to disrupt our production. This would have adverse impact of our profitability.
We expect that higher cost of energy will also be a major issue during the next financial year. This may negatively affect our ability to compete in export market.
Diversification is one of the key elements of our investment policy. The Company plans to further diversify its product mix by installing a new unit of denim fabric. This will provide raw material to Garments Division as well as enhance sale in export market.
ADEQUACY OF INTERNAL FINANCIAL CONTROLS
The Company has established an effective and efficient system of internal and financial controls to safeguard the assets of the Company, prevent and detect fraud and ensure compliance with all statutory and legal requirements. The internal control structure is regularly reviewed and monitored by the Internal Audit function duly established by the Board. Audit Committee reviews the internal control system on quarterly basis in accordance with the term of its reference.
Mian Umer Mansha Farid Noor Ali FazalChief Executive Officer Director
Lahore20 September 2022
For and on behalf of the Board of Directors.
Nishat Mills Limited
20 Page
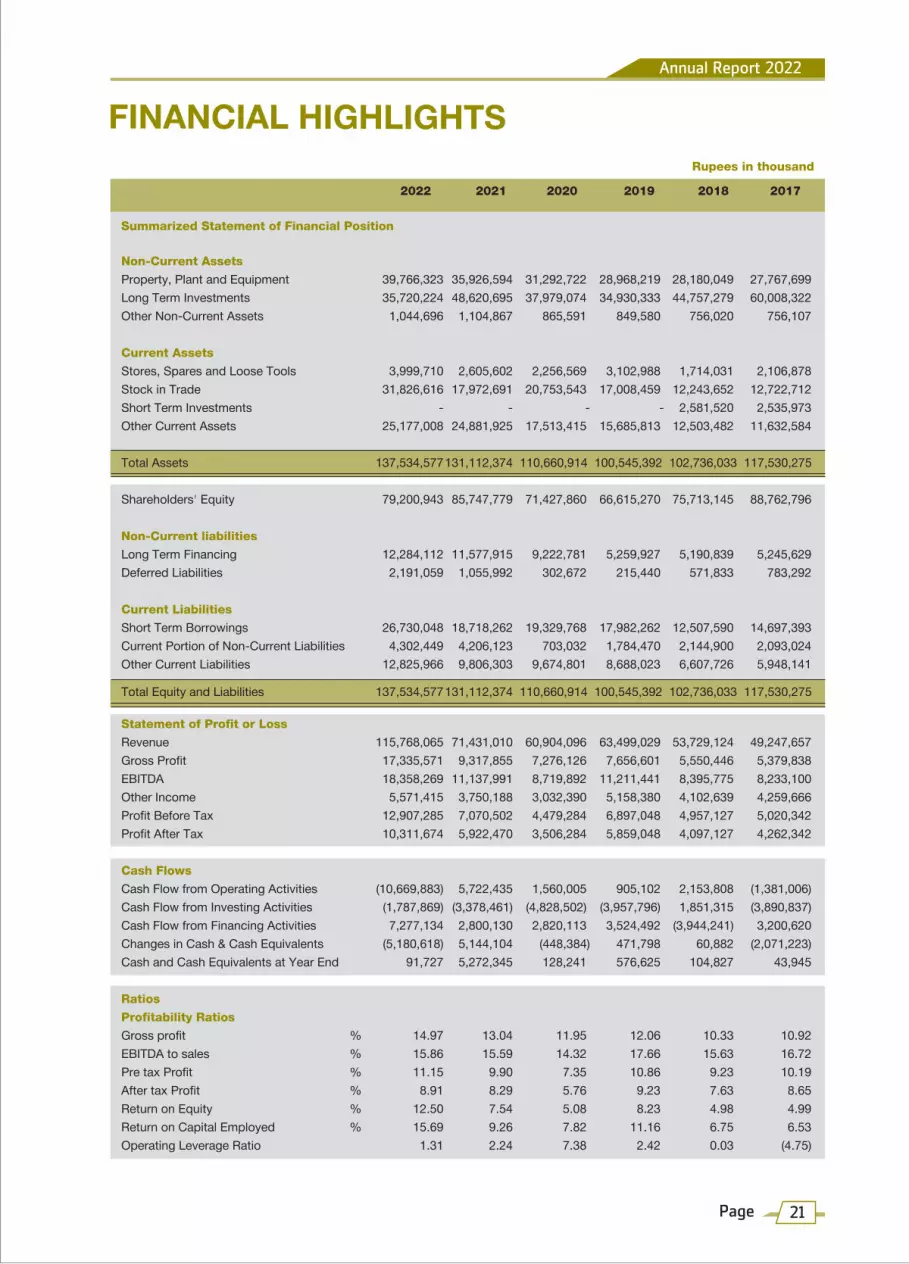
Rupees in thousand 2022 2021 2020 2019 2018 2017
Summarized Statement of Financial Position
Non-Current AssetsProperty, Plant and Equipment 39,766,323 35,926,594 31,292,722 28,968,219 28,180,049 27,767,699Long Term Investments 35,720,224 48,620,695 37,979,074 34,930,333 44,757,279 60,008,322Other Non-Current Assets 1,044,696 1,104,867 865,591 849,580 756,020 756,107
Current AssetsStores, Spares and Loose Tools 3,999,710 2,605,602 2,256,569 3,102,988 1,714,031 2,106,878Stock in Trade 31,826,616 17,972,691 20,753,543 17,008,459 12,243,652 12,722,712Short Term Investments - - - - 2,581,520 2,535,973Other Current Assets 25,177,008 24,881,925 17,513,415 15,685,813 12,503,482 11,632,584
Total Assets 137,534,577 131,112,374 110,660,914 100,545,392 102,736,033 117,530,275
Shareholders' Equity 79,200,943 85,747,779 71,427,860 66,615,270 75,713,145 88,762,796
Non-Current liabilitiesLong Term Financing 12,284,112 11,577,915 9,222,781 5,259,927 5,190,839 5,245,629Deferred Liabilities 2,191,059 1,055,992 302,672 215,440 571,833 783,292
Current LiabilitiesShort Term Borrowings 26,730,048 18,718,262 19,329,768 17,982,262 12,507,590 14,697,393Current Portion of Non-Current Liabilities 4,302,449 4,206,123 703,032 1,784,470 2,144,900 2,093,024Other Current Liabilities 12,825,966 9,806,303 9,674,801 8,688,023 6,607,726 5,948,141
Total Equity and Liabilities 137,534,577 131,112,374 110,660,914 100,545,392 102,736,033 117,530,275
Statement of Profit or LossRevenue 115,768,065 71,431,010 60,904,096 63,499,029 53,729,124 49,247,657Gross Profit 17,335,571 9,317,855 7,276,126 7,656,601 5,550,446 5,379,838EBITDA 18,358,269 11,137,991 8,719,892 11,211,441 8,395,775 8,233,100Other Income 5,571,415 3,750,188 3,032,390 5,158,380 4,102,639 4,259,666Profit Before Tax 12,907,285 7,070,502 4,479,284 6,897,048 4,957,127 5,020,342Profit After Tax 10,311,674 5,922,470 3,506,284 5,859,048 4,097,127 4,262,342
Cash FlowsCash Flow from Operating Activities (10,669,883) 5,722,435 1,560,005 905,102 2,153,808 (1,381,006)Cash Flow from Investing Activities (1,787,869) (3,378,461) (4,828,502) (3,957,796) 1,851,315 (3,890,837)Cash Flow from Financing Activities 7,277,134 2,800,130 2,820,113 3,524,492 (3,944,241) 3,200,620Changes in Cash & Cash Equivalents (5,180,618) 5,144,104 (448,384) 471,798 60,882 (2,071,223)Cash and Cash Equivalents at Year End 91,727 5,272,345 128,241 576,625 104,827 43,945
RatiosProfitability RatiosGross profit % 14.97 13.04 11.95 12.06 10.33 10.92EBITDA to sales % 15.86 15.59 14.32 17.66 15.63 16.72Pre tax Profit % 11.15 9.90 7.35 10.86 9.23 10.19After tax Profit % 8.91 8.29 5.76 9.23 7.63 8.65Return on Equity % 12.50 7.54 5.08 8.23 4.98 4.99Return on Capital Employed % 15.69 9.26 7.82 11.16 6.75 6.53Operating Leverage Ratio 1.31 2.24 7.38 2.42 0.03 (4.75)
FINANCIAL HIGHLIGHTSAnnual Report 2022
21Page

2022 2021 2020 2019 2018 2017
Liquidity RatiosCurrent Ratio 1.39 1.39 1.36 1.26 1.37 1.28Quick Ratio 0.57 0.76 0.59 0.55 0.71 0.62Cash to Current Liabilities Times 0.00 0.16 0.00 0.02 0.00 0.00Cash Flows from Operations to Sales Times (0.09) 0.08 0.03 0.01 0.04 (0.03)
Activity / Turnover RatiosInventory Turnover Ratio Times 3.95 3.21 2.84 3.82 3.86 3.87No. of Days in Inventory Days 92.41 113.71 128.87 95.55 94.56 94.32Debtors Turnover Ratio Times 13.69 13.19 13.54 14.53 17.12 21.89No. of Days in Receivables Days 26.66 27.67 27.03 25.12 21.32 16.67Creditors Turnover Ratio Times 6.08 3.75 3.49 4.39 4.46 4.30No. of Days in Creditors Days 60.03 97.33 104.87 83.14 81.84 84.88Operating Cycle Days 59.04 44.05 51.03 37.53 34.04 26.11Total Assets Turnover Ratio Times 0.84 0.54 0.55 0.63 0.52 0.42Fixed Assets turnover Ratio Times 2.91 1.99 1.95 2.19 1.91 1.77
Investment / Market RatiosEarnings Per Share Rs. 29.33 16.84 9.97 16.66 11.65 12.12Price Earning Ratio Times 2.52 5.54 7.82 5.60 12.10 13.09Dividend Yield Ratio % 5.41 4.29 5.13 4.29 3.37 3.15Dividend Payout Ratio % 13.64 23.75 40.12 24.01 40.77 41.24Dividend Cover Ratio Times 7.33 4.21 2.49 4.17 2.45 2.42Dividend Per Share Rs. 4.00 4.00 4.00 4.00 4.75 5.00Break-up Value Rs. 225.26 243.88 203.15 189.46 215.34 252.45Proposed Dividend % 40.00 40.00 40.00 40.00 47.50 50
Market value per shareClosing Rs. 73.91 93.30 78.01 93.34 140.92 158.68High Rs. 101.20 124.89 119.75 153.73 171.56 185.63Low Rs. 68.50 79.73 53.00 91.69 130.03 110.65
Capital Structure RatiosFinancial Leverage Ratio % 53.09 38.83 40.96 37.57 26.21 24.83Weighted Average Cost of Debt % 5.73 3.93 5.54 7.44 4.75 4.68 Debt to Equity Ratio % 15.51 13.50 12.91 7.90 6.86 5.91Interest Cover Ratio Times 6.97 6.75 3.98 5.13 5.99 6.49Gearing Ratio % 34.68 27.97 29.06 27.31 20.77 19.89
Production machinesNo. of Spindles 303,048 263,832 262,035 247,968 238,032 230,736No. of Looms 959 814 790 790 794 795No. of Thermosole Dyeing Machines 5 5 5 5 5 5No. of Rotary Printing Machines 4 4 4 4 4 4No. of Digital Printing Machines 11 10 10 9 8 7No. of Stitching Machines 4,713 4,489 3,592 4,149 4,239 3,757
Nishat Mills Limited
22 Page

STATEMENT OF COMPLIANCEwith Listed Companies (Code of Corporate Governance) Regulations, 2019 (“the Regulations”)
Non-Executive Directors Mian Hassan Mansha Syed Zahid Hussain Mr. Mahmood Akhtar Mr. Farid Noor Ali FazalExecutive Director Mian Umer Mansha (Chief Executive Officer)
Category Names
Independent Directors Mrs. Sara Aqeel (Female director) Mrs. Mehak Adil (Female director)
Name of company : Nishat Mills LimitedYear ended : June 30, 2022
The company has complied with the requirements of the Regulations in the following manner:
1. The total number of directors are Seven (7) as per the following:
a. Male: 5 b. Female: 2
2. The composition of board is as follows:
3. The Directors have confirmed that none of them is serving as a director on more than seven listed companies, including this company;
4. The company has prepared a code of conduct and has ensured that appropriate steps have been taken to disseminate it throughout the company along with its supporting policies and procedures;
5. The Board has developed a vision/mission statement, overall corporate strategy and significant policies of the company. The Board has ensured that complete record of particulars of the significant policies along with their date of approval or updating is maintained by the company;
6. All the powers of the Board have been duly exercised and decisions on relevant matters have been taken by the Board/ shareholders as empowered by the relevant provisions of the Companies Act, 2017 (the Act) and the Regulations;
7. The meetings of the Board were presided over by the Chairman and, in his absence, by a director elected by the Board for this purpose. The Board has complied with the requirements of Act and the Regulations with respect to frequency, recording and circulating minutes of meeting of the Board;
8. The Board have a formal policy and transparent procedures for remuneration of directors in accordance with the Act and these Regulations;
9. The Board has arranged Director’s Training Program for the following:
Names of Directors Mr. Mahmood Akhtar Mr. Farid Noor Ali Fazal Mrs. Sara Aqeel Mrs. Mehak Adil
Following Directors meet the exemption criteria of minimum of 14 years of education and 15 years of experience on the Boards of listed companies, hence are exempt from Director’s Training Program:
Names of Directors Mian Umer Mansha Syed Zahid Hussain
Annual Report 2022
23Page

10. The Board has approved appointment of chief financial officer, company secretary and head of internal audit, including their remuneration and terms and conditions of employment and complied with relevant requirements of the Regulations;
11. Chief financial officer and chief executive officer duly endorsed the financial statements before approval of the Board;
12. The board has formed committees comprising of members given below:
a) Audit Committee:
Names Designation held
Mrs. Mehak Adil Chairperson Syed Zahid Hussain Member Mr. Mahmood Akhtar Member
b) HR and Remuneration Committee:
Names Designation held
Mrs. Sara Aqeel Chairperson Mian Umer Mansha Member Mr. Mahmood Akhtar Member
13. The terms of reference of the aforesaid committees have been formed, documented and advised to the committee for compliance.
14. The frequency of meetings (quarterly/half yearly/ yearly) of the committee were as per following:
a) Audit Committee:
Four quarterly meetings were held during the financial year ended June 30, 2022.
b) HR and Remuneration Committee:
One Meeting of HR and Remuneration Committee was held during the financial year ended June 30, 2022.
15. The Board has set up an effective internal audit function who are considered suitably qualified and experienced for the purpose and are conversant with the policies and procedures of the company;
16. The statutory auditors of the company have confirmed that they have been given a satisfactory rating under the Quality Control Review program of the Institute of Chartered Accountants of Pakistan and registered with Audit Oversight Board of Pakistan, that they and all their partners are in compliance with International Federation of Accountants (IFAC) guidelines on code of ethics as adopted by the Institute of Chartered Accountants of Pakistan and that they and the partners of the firm involved in the audit are not a close relative (spouse, parent, dependent and non-dependent children) of the chief executive officer, chief financial officer, head of internal audit, company secretary or director of the company;
17. The statutory auditors or the persons associated with them have not been appointed to provide other services except in accordance with the Act, these Regulations or any other regulatory requirement and the auditors have confirmed that they have observed IFAC guidelines in this regard;
18. We confirm that all requirements of regulations 3, 6, 7, 8, 27,32, 33 and 36 of the Regulations have been complied with; and
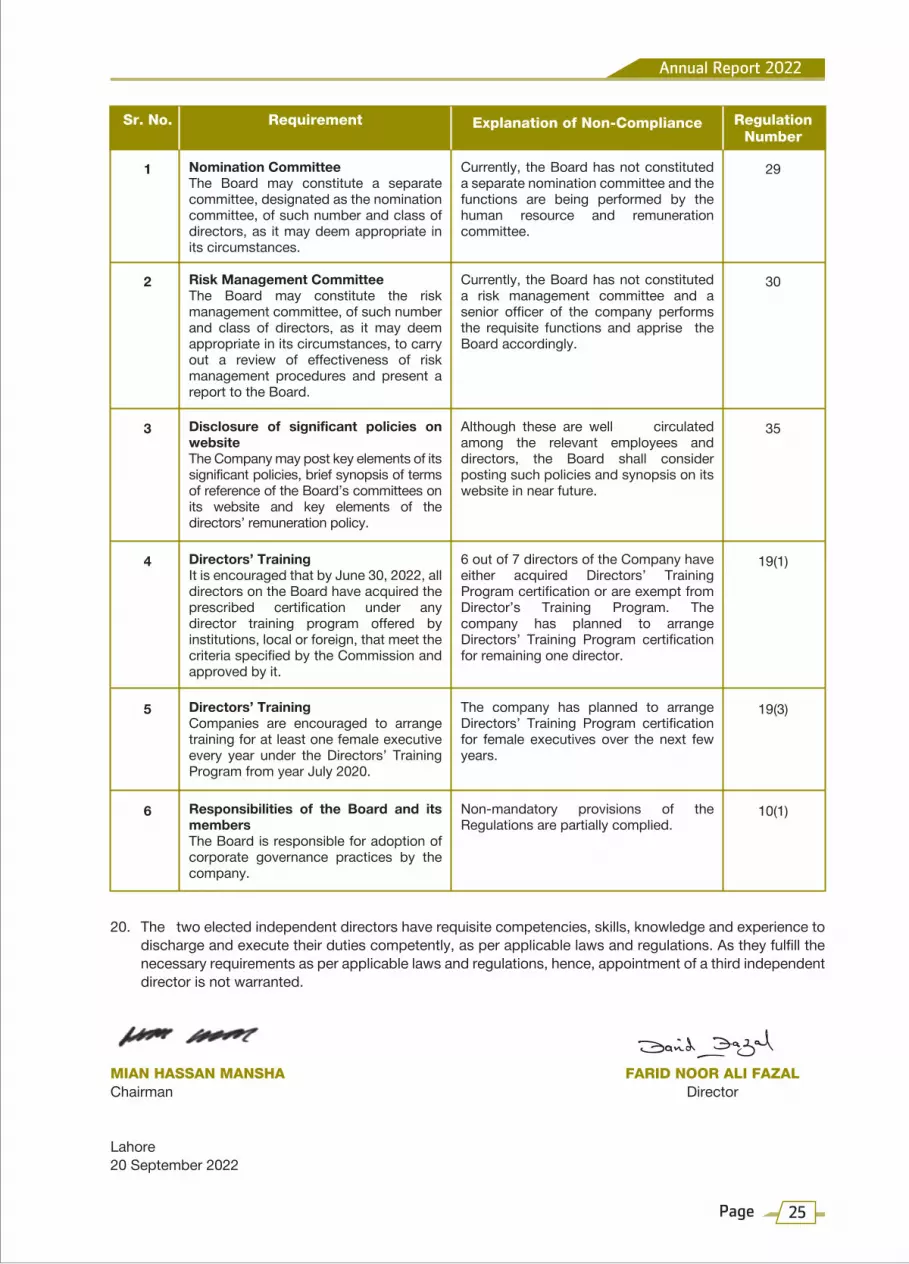
19. Explanation for non-compliance with requirements, other than regulations 3, 6, 7, 8, 27, 32, 33 and 36 are below (if applicable):
Nishat Mills Limited
24 Page
Annual Report 2022
25Page
Sr. No.
Nomination CommitteeThe Board may constitute a separate committee, designated as the nomination committee, of such number and class of directors, as it may deem appropriate in its circumstances.
Currently, the Board has not constituted a separate nomination committee and the functions are being performed by the human resource and remuneration committee.
1 29
Risk Management CommitteeThe Board may constitute the risk management committee, of such number and class of directors, as it may deem appropriate in its circumstances, to carry out a review of effectiveness of risk management procedures and present a report to the Board.
Currently, the Board has not constituted a risk management committee and a senior officer of the company performs the requisite functions and apprise the Board accordingly.
2 30
RegulationNumber
Requirement Explanation of Non-Compliance
Disclosure of significant policies on website The Company may post key elements of its significant policies, brief synopsis of terms of reference of the Board’s committees on its website and key elements of the directors’ remuneration policy.
Although these are well circulated among the relevant employees and directors, the Board shall consider posting such policies and synopsis on its website in near future.
3 35
Directors’ TrainingIt is encouraged that by June 30, 2022, all directors on the Board have acquired the prescribed certification under any director training program offered by institutions, local or foreign, that meet the criteria specified by the Commission and approved by it.
6 out of 7 directors of the Company have either acquired Directors’ Training Program certification or are exempt from Director’s Training Program. The company has planned to arrange Directors’ Training Program certification for remaining one director.
4 19(1)
Directors’ TrainingCompanies are encouraged to arrange training for at least one female executive every year under the Directors’ Training Program from year July 2020.
The company has planned to arrange Directors’ Training Program certification for female executives over the next few years.
5 19(3)
Responsibilities of the Board and its membersThe Board is responsible for adoption of corporate governance practices by the company.
Non-mandatory provisions of the Regulations are partially complied.
6 10(1)
20. The two elected independent directors have requisite competencies, skills, knowledge and experience to discharge and execute their duties competently, as per applicable laws and regulations. As they fulfill the necessary requirements as per applicable laws and regulations, hence, appointment of a third independent director is not warranted.
MIAN HASSAN MANSHA FARID NOOR ALI FAZALChairman Director
Lahore20 September 2022

INDEPENDENT AUDITOR’S REVIEW REPORTTo the members of Nishat Mills Limited
Review Report on the Statement of Compliance contained in Listed Companies (Code of Corporate Governance) Regulations, 2019
We have reviewed the enclosed Statement of Compliance with the Listed Companies (Code of Corporate Governance) Regulations, 2019 (the Regulations) prepared by the Board of Directors of Nishat Mills limited (the Company) for the year ended 30 June 2022 in accordance with the requirements of regulation 36 of the Regulations.
The responsibility for compliance with the Regulations is that of the Board of Directors of the Company. Our responsibility is to review whether the Statement of Compliance reflects the status of the Company's compliance with the provisions of the Regulations and report if it does not and to highlight any non-compliance with the requirements of the Regulations. A review is limited primarily to inquiries of the Company's personnel and review of various documents prepared by the Company to comply with the Regulations.
As a part of our audit of the financial statements we are required to obtain an understanding of the accounting and internal control systems sufficient to plan the audit and develop an effective audit approach. We are not required to consider whether the Board of Directors' statement on internal control covers all risks and controls or to form an opinion on the effectiveness of such internal controls, the Company's corporate governance procedures and risks.
The Regulations require the Company to place before the Audit Committee, and upon recommendation of the Audit Committee, place before the Board of Directors for their review and approval, its related party transactions. We are only required and have ensured compliance of this requirement to the extent of the approval of the related party transactions by the Board of Directors upon recommendation of the Audit Committee.
Based on our review, nothing has come to our attention which causes us to believe that the Statement of Compliance does not appropriately reflect the Company's compliance, in all material respects, with the requirements contained in the Regulations as applicable to the Company for the year ended 30 June 2022.
RIAZ AHMAD & COMPANYChartered Accountants
Lahore
27 September 2022
UDIN: CR202210168E4jthemWi
Nishat Mills Limited
26 Page

Notice is hereby given that the Annual General Meeting of the members of Nishat Mills Limited (“the Company”) will be held on October 28, 2022 (Friday) at 10:15 A.M. at Emporium Mall, The Nishat Hotel, Trade and Finance Centre Block, Near Expo Centre, Abdul Haq Road, Johar Town, Lahore to transact the following business:
1. To receive, consider and adopt the Audited Un-consolidated and Consolidated Financial Statements of the Company for the year ended June 30, 2022 together with the Chairman’s Review, Directors’ and Auditors’ reports thereon.
2. To approve Final Cash Dividend @ 40% [i.e. Rs. 4 (Rupees Four Only) per Ordinary Share as recommended by the Board of Directors.
3. To appoint statutory Auditors for the year 2022-23 and fix their remuneration.
4. Special Business:
To consider and if deemed fit, to pass the following resolutions as Special Resolutions under Section 199 of the Companies Act, 2017, as recommended by the Board of Directors with or without modification, addition(s) or deletion(s).
RESOLVED THAT approval of the members of Nishat Mills Limited (“the Company”) be and is hereby accorded and the Company be and is hereby authorized in terms of Section 199 and other applicable provisions of the Companies Act, 2017 to make additional long-term equity investment up to Rs. 1,080,000,000 (Rupees One Billion Eighty Million Only) in Hyundai Nishat Motor (Private) Limited (HNMPL), an associated company, from time to time by way of subscribing up to 108,000,000 right shares, at par value of Rs. 10/- each as and when offered by HNMPL to the Company on its shareholding, as per terms and conditions disclosed to the members.
RESOLVED FURTHER THAT this resolution shall be valid for a period of four (4) years starting from the date of approval by members and the Chief Executive Officer and / or Chief Financial Officer and / or Company Secretary of the Company be and are hereby singly empowered and authorized to do all acts, matters, deeds and things, take any or all necessary actions including signing and execution of agreement(s) and to complete all legal formalities including filing of documents as may be necessary or incidental expedient for the purpose of implementing the aforesaid resolutions.
RESOLVED FURTHER THAT the Company be and is hereby authorized to dispose of through any mode, a part or all of equity investment in HNMPL made by the Company from time to time and to dispose of and / or decline a part or all of its entitlement of right shares as and when offered by HNMPL and the Chief Executive Officer and / or Chief Financial Officer and / or Company Secretary be and are hereby authorized singly to take the decision of divestment and / or declining of right shares entitlement as they may deem appropriate and necessary in the best interest of the Company and its members.
A Statement of Material Facts as required under Section 134(3) of the Companies Act, 2017 is annexed to the notice of meeting circulated to the members of the Company.
By order of the Board
Lahore (KHALID MAHMOOD CHOHAN)September 20, 2022 COMPANY SECRETARY
NOTICE OF ANNUAL GENERAL MEETING
Annual Report 2022
27Page

Nishat Mills Limited
28 Page
NOTES:
BOOK CLOSURE NOTICE:
The Ordinary Shares Transfer Books of the Company will remain closed from 21-10-2022 to 28-10-2022 (both days inclusive) for entitlement of 40% Final Cash Dividend [i.e. Rs.4/- (Rupees Four Only) Per Ordinary Share] for the year ended June 30, 2022 and attending and voting at Annual General Meeting. Physical transfers / CDS Transactions IDs received in order in all respects up to 1:00 p.m. on 20-10-2022 at the office of Share Registrar, THK Associates (Private) Limited, Karachi Office, Plot No. 32-C, Jami Commercial Street No. 2, DHA, Phase VII, Karachi, Lahore Office, Office No. 309, 3rd Floor, North Tower, LSE Building, 19-Shahrah-e-Aiwan-e-Iqbal, Lahore shall be considered in time for entitlement of above said 40% Final Cash Dividend and attending of AGM.
PROXIES:
A member eligible to attend and vote at this meeting may appoint another member his / her proxy to attend and vote instead of him / her. Proxies in order to be effective must reach the Company's registered office not less than 48 hours before the time for holding the meeting. Proxies of the Members through CDC shall be accompanied with attested copies of their CNIC. In case of corporate entity, the Board’s Resolution / power of attorney with specimen signature shall be furnished along with proxy form to the Company. The shareholders through CDC are requested to bring original CNIC, Account Number and Participant Account Number to produce at the time of attending the meeting. The proxy shall produce his / her original valid CNIC or original passport at the time of meeting.
Shareholders are requested to immediately notify the Company of change in address, if any.
Members who have deposited their shares into Central Depository Company of Pakistan Limited (“CDC”) will further have to follow the under mentioned guidelines as laid down by the Securities and Exchange Commission of Pakistan.
A. For Attending the Meeting
a. In case of Individuals, the account holder and / or sub-account holder and their registration details are uploaded as per the CDC Regulations, shall authenticate his / her identity by showing his / her original CNIC or, original Passport at the time of attending the meeting.
b. In case of corporate entity, the Board’s resolution / power of attorney with specimen signature of the nominee shall be produced (unless it has been provided earlier) at the time of the meeting.
B. For Appointing Proxies
a. In case of individuals, the account holder and / or sub-account holder and their registration details are uploaded as per the CDC Regulations, shall submit the proxy form as per above requirements.
b. The proxy form shall be witnessed by two persons, whose names, addresses and CNIC numbers shall be mentioned on the form.
c. Attested copies of the CNIC or the passport of beneficial owners and the proxy shall be furnished with the proxy form.
d. The proxy shall produce his original CNIC or original passport at the time of the meeting.
e. In case of corporate entity, the Board’s resolution / power of attorney with specimen signature shall be furnished (unless it has been provided earlier) along with proxy form to the Company.

Annual Report 2022
29Page
DEDUCTION OF WITHHOLDING TAX ON DIVIDEND:
Pursuant to the provisions of the Finance Act, 2017 the rates of deduction of income tax from dividend payments under the Income Tax Ordinance, 2001 have been revised as follows:
- Filer 15% - Non-Filer 30%
All shareholders are advised to check their status on Active Taxpayers List (ATL) available on FBR Website and may, if required, take necessary actions for inclusion of their name in ATL to avail the lower rate of tax deduction.
DEDUCTION OF WITHHOLDING TAX ON DIVIDEND IN CASE OF JOINT ACCOUNT HOLDERS:
All shareholders who hold shares jointly are requested to provide following information regarding shareholding proportions of Principal Shareholder and Joint-holder(s) in respect of shares held by them to our Share Registrar THK Associates (Private) Limited latest by October 20, 2022, otherwise each joint holder shall be assumed to have an equal number of shares.
Signature of Primary Shareholder_______________________________
EXEMPTION OF WITHOLDING TAX:
Withholding tax exemption from dividend income, shall only be allowed if copy of valid tax exemption certificate is made available to our Share Registrar Office, THK Associates (Pvt) Limited up to October 20, 2022.
SUBMISSION OF COPY OF CNIC (MANDATORY):
Individuals including all joint holders holding physical share certificates are requested to submit a copy of their valid CNIC to the Company or the Company’s Share Registrar, if not provided already. All shareholders who have not so far submitted copy of their valid CNIC are once again requested to send a copy of their valid CNIC to our Share Registrar THK Associates (Private) Limited. The Shareholders while sending CNIC must quote their respective folio numbers.
In case of non-receipt of the copy of a valid CNIC, the Company would be unable to comply with SRO 831(1)/2012 dated July 05, 2012 issued by SECP and would be constrained under SECP’s Order dated June 08, 2016 under Section 251(2) of the Companies Ordinance, 1984 to withhold the payment of dividend warrants to such shareholders which will be released on submission of valid copy of CNIC.
ZAKAT DECLRATION (CZ-50):
Zakat will be deducted from the dividends at source under the Zakat & Usher Laws and will be deposited within the prescribed period with the relevant authority. Any shareholder who want to claim exemption shall submit his / her Zakat declarations under Zakat and Usher Ordinance, 1980 & Rule 4 of Zakat (Deduction & Refund) Rules, 1981 on prescribed Form CZ-50, to our Share Registrar, M/s. THK Associates (Private) Limited otherwise no exemption will
Name of the Company Nishat Mills LimitedFolio No. / CDS A/C No. No. of Shares Held Principal Name & CNIC Shareholder Shareholding Proportion (No. of Shares) Joint Name & CNIC Shareholder(s) Shareholding Proportion (No. of Shares)

be granted. The Shareholders while sending the Zakat Declarations, as the case may be, must quote company name and their respective Folio Numbers / CDC Account Numbers.
MANDATORY PAYMENT OF CASH DIVIDEND THROUGH ELECTRONIC MODE:
The provisions of Section 242 of the Companies Act, 2017 require the listed companies that any dividend payable in cash shall only be paid through electronic mode directly into the bank account designated by the entitled shareholders. Accordingly, the shareholders holding physical shares are requested to provide the following information to the Company’s Share Registrar at the address given herein above. In the case of shares held in CDC, the same information should be provided directly to the CDS participants for updating and forwarding to the Company.
Signature of Shareholder_______________________________
TRANSMISSION OF ANNUAL FINANCIAL STATEMENTS THROUGH EMAIL:
In pursuance of the directions given by the Securities and Exchange Commission of Pakistan (SECP) vide SRO 787 (I)/2014 dated September 8, 2014, those shareholders who desire to receive Annual Financial Statements in future through email instead of receiving the same by post are advised to give their formal consent along with their valid email address on a standard request form which is available at the Company’s website i.e. www.nishatmillsltd.com and send the form, duly signed by the shareholder, along with copy of his / her CNIC to the Company’s Share Registrar M/s THK Associates (Private) Limited.
CIRCULATION OF ANNUAL REPORTS THROUGH DIGITAL STORAGE:
Pursuant to the SECP’s notification SRO 470(I) / 2016 dated 31st May, 2016 the Members of Nishat Mills Limited in EOGM held on 31st March 2017 had accorded their consent for transmission of annual reports including audited annual financial statements and other information contained therein of the Company through CD/DVD/USB instead of transmitting the same in hard copies. The shareholders who wish to receive hard copies of the aforesaid documents may send to the Company Secretary / Share registrar, the standard request form available on the Company’s website and the Company will provide the aforesaid documents to the shareholders on demand, free of cost, within one week of such demand.
Folio No. / Investor Account Number / CDCSub Account No.
Title of Account
IBAN Number
Bank Name
Branch
Branch Address
Mobile NumberName of Network(if ported)
Email Address
Nishat Mills Limited
30 Page

Annual Report 2022
31Page
UNCLAIMED DIVIDEND / SHARES:
Shareholders who could not collect their dividend / physical shares are advised to contact our Share Registrar to collect / enquire about their unclaimed dividend or shares, if any.
VIDEO CONFERENCE FACILITY:
In terms of the Companies Act, 2017, members residing in a city holding at least 10% of the total paid up share capital may demand the facility of video-link for participating in the annual general meeting. The request for video-link facility shall be received by the Share Registrar at the address given hereinabove at least 7 days prior to the date of the meeting on the Standard Form available on the website of the Company.
VIDEO LINK FACILITY FOR MEETING:
In light of COVID-19 situation, the Securities and Exchange Commission of Pakistan (“SECP”) has advised vide Circular No. 4 of 2021 dated 15 February, 2021 to provide participation of the members through electronic means. The members can attend the AGM via video link using smart phones / tablets. To attend the meeting through video link, members and their proxies are requested to register themselves by providing the following information along with valid copy of Computerized National Identity Card (both sides) / passport, attested copy of board resolution / power of attorney (in case of corporate shareholders) through email at [email protected] or [email protected] by October 23, 2022.
CONVERSION OF PHYSICAL SHARES INTO BOOK ENTRY FORM:
As per Section 72 of the Companies Act, 2017 all existing companies are required to convert their physical shares into book-entry form within a period not exceeding four years from the date of commencement of the Companies Act, 2017.
The Securities & Exchange Commission of Pakistan through its circular # CSD/ED/Misc./2016-639-640 dated March 26, 2021 has advised the listed companies to pursue their such members who still hold shares in physical form, to convert their shares into book-entry form.
We hereby request all members who are holding shares in physical form to convert their shares into book-entry form at the earliest. They are also suggested to contact the Central Depository Company of Pakistan Limited or any active member / stock broker of the Pakistan Stock Exchange to open an account in the Central Depository System and to facilitate conversion of physical shares into book-entry form. Members are informed that holding shares in book-entry form has several benefits including but not limited to secure and convenient custody of shares, conveniently tradeable and transferable, no risk of the loss, damage or theft, no stamp duty on transfer of shares in book-entry form and hassle-free credit of bonus or right shares.
We once again strongly advise members of the Company, in their best interest, to convert their physical shares into book-entry form at earliest.
Name of Member /Proxyholder
Folio No. / CDCAccount No.
Cell No. /Whatsapp No.
Email IDCNIC No.

Nishat Mills Limited
32 Page
STATEMENT OF MATERIAL FACTS UNDER SECTION 134(3) OF THE COMPANIES ACT, 2017.
This statement sets out the material facts pertaining to the special business to be transacted at the Annual General Meeting of the Company to be held on October 28, 2022.
Additional Equity Investment in Hyundai Nishat Motor (Private) Limited
Hyundai Nishat Motor (Private) Limited (HNMPL) is a joint venture company which has set up a green field project for assembly and sale of Hyundai brand vehicles in Pakistan (the “Project”). The paid-up share capital of HNMPL is held by:
Nishat Mills Limited (12%)
DG Khan Cement Company Limited (10%)
Adamjee Insurance Company Limited (10%)
Security General Insurance Company Limited (12.14%)
Millat Tractors Limited (15.86%)
Sojitz Corporation (40%)
HNMPL intends to issue right shares amounting to Rs. 9 billion to meet working capital requirements and HNMPL will offer right shares for subscription at par value of Rs. 10 each. The Board of Directors has already approved the additional investment by way of subscription of right shares.
The already approved amount by members of equity investment of Rs. 1,267,680,000 (Rupees One Billion Two Hundred Sixty-Seven Million Six Hundred Eighty Thousand Only) in HNMPL shall increase to Rs. 2,347,680,000/- (Rupees Two Billion Three Hundred Forty-Seven Million Six Hundred Eighty Thousand Only).
The directors of the Company certify / undertake that the investment is being made after due diligence. The duly signed recommendation of the due diligence report and directors undertaking / certificate shall be made available to the members for inspection at the meeting.
HNMPL is not a member of the Company. Its sponsors / directors are directors / members of the Company. They have no interest except their directorship and to the extent of their shareholding in the Company which is as follows:
Name of Director % of Shareholding in Company
Mian Raza Mansha 8.41Mian Umer Mansha 12.60Mian Hassan Mansha 12.62

Annual Report 2022
33Page
Statement of Financial Position as on 31 December 2021:
Equity & Rs. Assets Rs.Liabilities
Non-CurrentEquity 7,800,970,467 Assets 17,960,411,178
Non-Current CurrentLiabilities 11,574,830,100 Assets 21,054,025,629
Current Liabilities 19,638,636,240
39,014,436,807 39,014,436,807
Profit and loss account for the year ended 31 December 2021:
Rs.
Revenue 34,298,694,455
Expenses 33,578,819,871
Other Income 752,317,911
Profit / (Loss) before tax 1,472,192,495
Profit / (Loss) after tax 1,351,574,072
Financial position, including main items of statement of financial position and profit and loss account on the basis of its latest financial statements
(v)
(a) Disclosure for all types of investments:
(A) Disclosure regarding associated company
Information under Regulation 3 of the Companies’ (Investment in Associated Companies or Associated Undertakings) Regulations, 2017
In case of investment in relation to a project of associated company or associated undertaking that has not commenced operations, following further information, namely
(vi)
Name of Associated Company or Associated Undertaking
Hyundai Nishat Motor (Private) Limited (“HNMPL”)(i)
Basis of Relationship Common Directorship(ii)
PKR 8.22 – 2021 - AuditedBreak-up value per Share, based on last audited financial statements
(iv)
Earnings / (Loss) per Share for the last three years
(iii) Year EPS (Rs.)2021 – Audited 1.442020 – Audited (2.96)2019 – Audited (1.18)
HNMPL is a joint venture company of Nishat Mills Limited (“Nishat”), DG Khan Cement Company Limited (“DGKCC”), Adamjee Insurance Company Limited (“AICL”), Security General Insurance Company Limited (“SGICL”), Millat Tractors Limited (“MTL”) and Sojitz Corporation, Tokyo,
Description of the project and its history since conceptualization
I

Nishat Mills Limited
34 Page
Japan (“Sojitz”) to establish a green field project for the assembly and sales of Hyundai brand vehicles in Pakistan. Nishat executed a shareholders’ agreement on 04th April, 2018 whereby the following shareholdings were decided amongst HNMPL shareholders as follows: Nishat (12%), DGKCC (10%), AICL (10%), SGICL (10%), MTL (18%) and Sojitz (40%) and HNMPL for the share subscription of HNMPL. Subsequently, the shareholding percentage of SGICL increased to 12.14% and MTL decreased to 15.86% while the shareholding percentage of other investors remained same. At present the subscribed equity stands at PKR 10,562.300 million.
HNMPL has been awarded with “Category-A Greenfield Investment Status” under the Automotive Development Policy 2016-21 by Ministry of Industries and Production, Government of Pakistan vide its Notification No. 2(55)2017-LED-II dated 21 June 2017. The ground-breaking ceremony of the project was held on 20 December 2017 and it became operational in January 2020.
The construction commenced in the 2nd Quarter of 2018. The Project became operational in January 2020.
Starting date and expected date of completion of work
II
The project became operational in January 2020.Time by which such project shall become commercially operational
III
By Financial Year 2025Expected time by which the project shall start paying return on investment
IV
NML and other parties of Shareholders Agreement have to date invested a combined PKR 10,562,300,000 in cash as per below detail:
Issued ShareShareholder Capital PKRNishat Mills Limited 1,267,476,000DG Khan Cement Company Limited 1,056,230,000Adamjee Insurance Company Limited 1,056,230,000Security and General Insurance Company Limited 1,282,020,990Millat Tractors Limited 1,675,423,010Sojitz Corporation Japan 4,224,920,000Total Equity Injected till 31 Aug 2022 10,562,300,000
Funds invested or to be invested by the promoters, sponsors, associated company or associated undertaking distinguishing between cash and non-cash amounts
V
(B) General Disclosures:
Maximum amount of investment to be made
PKR 1,080,000,000/-.(i)
Dividend income and / or prospective capital gains.
The investment will be for long term.
Purpose, benefits likely to accrue to the investing company and its members from such investment and period of investment
(ii)

HNMPL will offer right shares based on existing percentage of shareholding which is based on share subscription agreement with Nishat, DGKCC, AICL, SGICL, MTL, Sojitz and HNMPL. Shareholding is as follows:
Nishat 12%, DGKCC 10%, AICL 10%, SGICL 12.14%, MTL 15.86% and Sojitz 40%
Salient features of the agreement(s), if any, with associated company or associated undertaking with regards to the proposed investment
(iv)
N/ACost benefit analysis(III)
Two of the Directors of Nishat Mills Limited, Mian Umer Mansha and Mian Hassan Mansha and their brother Mian Raza Mansha each hold 1 share of HNMPL. Mian Hassan Mansha also holds the office of Chief Executive Officer at HNMPL. They being Directors and Shareholders of the investing company are interested to the extent of their shareholding in Nishat.
Directors: % of Shareholding
Mian Raza Mansha 8.41Mian Umer Mansha 12.60Mian Hassan Mansha 12.62
Associated Companies:
The Associated Companies holding shares of Nishat are interested in HNMPL to the extent of their shareholding as under:
D. G. Khan Cement Co. Ltd. 10%Adamjee Insurance Co. Ltd. 10%Security General Insurance Co. Ltd. 12.14%
The Associated Companies holding shares of HNMPL are interested in Nishat to the extent of their shareholding as under:
D. G. Khan Cement Co. Ltd. 8.61%Adamjee Insurance Co. Ltd. 0.00%
Direct or indirect interest of Directors, sponsors, majority shareholders and their relatives, if any, in the associated company or associated undertaking or the transaction under consideration
(iv)
N/A
N/A
Justification for investment through borrowings
(I)
Detail of Collateral, guarantees provided and assets pledged for obtaining such funds
(II)
The investment will be made from Nishat’s own funds. Sources of funds to be utilized for investment and where the investment is intended to be made using borrowed funds:
(iii)
Annual Report 2022
35Page

Nishat Mills Limited
36 Page
No indication of impairment or write off exists relating to equity investment already made.
In case any investment in associated company or associated undertaking has already been made, the performance review of such investment including complete information/justification for any impairment or write offs
(vi)
None Any other important details necessary for the members to understand the transaction
(vii)
No. of Shares %ageBefore 126,747,600 12.00New 108,000,000 12.00After 234,768,000 12.00
Number of securities and percentage thereof held before and after the proposed investment
(iv)
N/ACurrent and preceding twelve weeks’ weighted average market price where investment is proposed to be made in listed securities
(v)
An independent valuer has estimated a fair value of Rs. 25.15 per ordinary share as at June 30, 2022 through a valuation technique based on discounted cash flows.
Fair value determined in terms of sub-regulation (1) regulation 5 for investments in unlisted securities
(vi)
Additional disclosure regarding Equity Investment
Shares will be purchased at par value of Rs. 10/- per share which is less than fair value.
Maximum price at which securities will be acquired
(i)
Not applicable as shares are being acquired at face value of Rs. 10 each.
In case the purchase price is higher than market value in case of listed securities and fair value in case of unlisted securities, justification thereof
(ii)
108,000,000 sharesMaximum number of securities to be acquired
(iii)

Statement Under Rule 4(2) of the Companies (Investment in Associated Companies or Associated
Undertakings) Regulations, 2017
Total Investment Approved:
Amount of Investment Made to date:
Reasons for deviations from the approved timeline of investment, where investment decision was to be implemented in specified time:
Equity investmentup to Rupees 2.144 billion for the period of three (3) years was approved by members in EOGM held on March 31, 2020.
Nil
No investment has been made in investee company after the approval. Investment will be made depending on market conditions at appropriate time.
Corporate guarantee for an amount of up to Rupees 2,250 million was approved by members in EOGM held on December 15, 2020 for a tenure of 11 years.
Corporate guarantees of up to Rs. 1,750 million have been issued against this approval to date.
Two corporate guarantees from different banks have been extended after the approval. Further guarantees will be arranged on requirement of investee company.
Equity investment up to Rupees 950 million was approved by members in AGM held on October 28, 2019 which was subsequently enhanced up to Rs. 1,950 million for a period of four (4) years by members in EOGM held on 03 March 2022.
Investment of Rupees 1,442.549 million has been made against this approval to date.
Partial investment has been made in investee company. More investment will be made as soon as investee company issues further right shares.
Guarantee / continuing Stand by Letter(s) of Credit (SBLC) for an amount of up to Rupees 1,200 million was approved by members in EOGM held on March 28, 2018 which was subsequently enhanced up to Rupees 1,532.544 million for a tenure of 7.5 years by members in AGM held on October 28, 2019.
Guarantees/ Stand by Letter(s) of Credit (SBLC) of up to Rs. 1,500.429 million have been issued against this approval to date.
Eight guarantees/ Stand by Letter(s) of Credit (SBLC) from different banks have been extended after the approval. Further guarantees/ SBLC will be arranged on requirement of investee company.
Equity investment up to Rupees 960 million was approved by members in EOGM held on March 28, 2018 which was subsequently enhanced up to Rs. 1,267.680 million for a period of four (4) years by members in AGM held on October 28, 2019.
Investment of Rupees 1,267.476 million has been made against this approval to date.
Partial investment has been made in investee company. Further investment will be made depending on the financial need of investee company.
Hyundai Nishat Motor(Private) Limited Nishat Sutas Dairy LimitedMCB Bank
Limited
Name of InvesteeCompany
Annual Report 2022
37Page
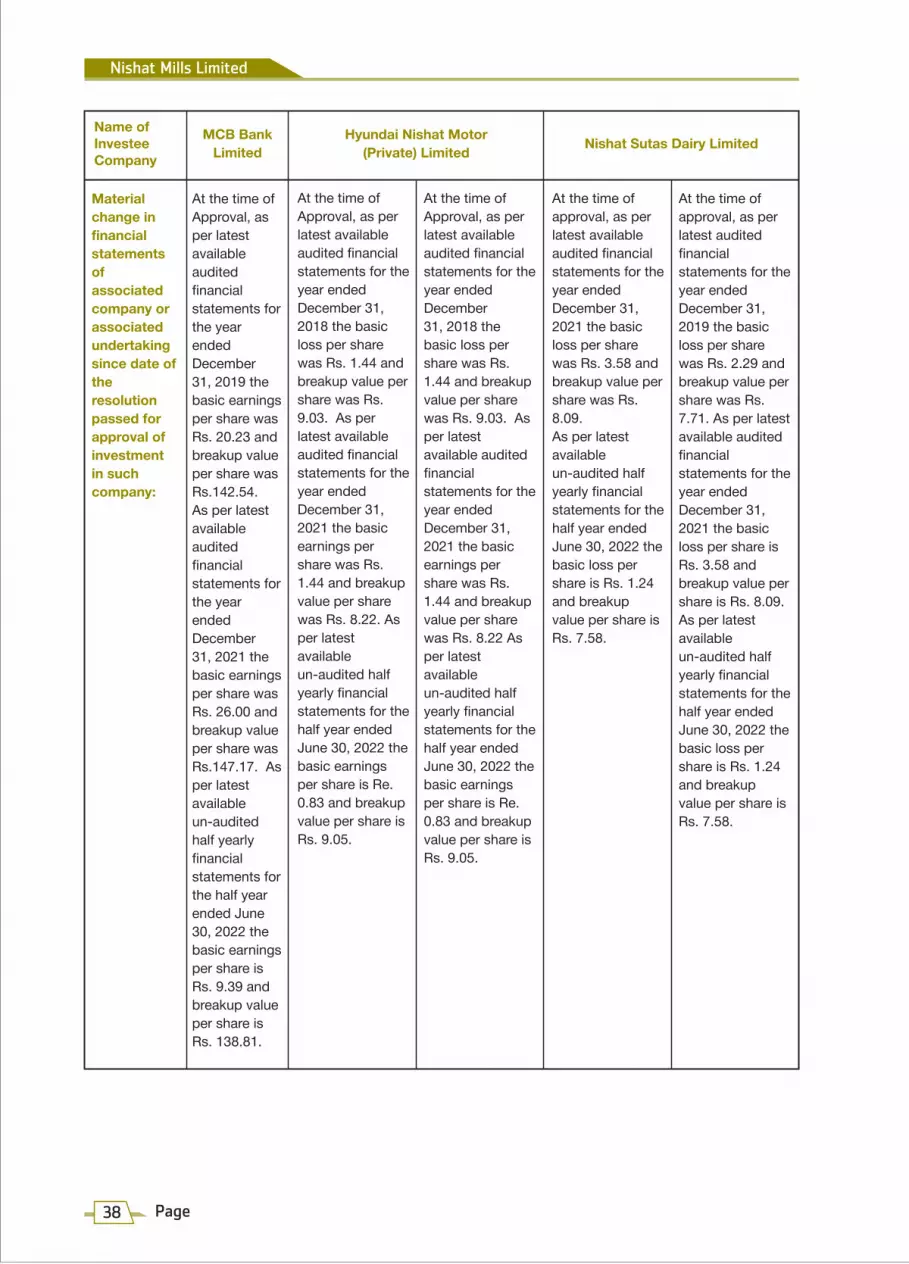
Nishat Mills Limited
38 Page
Material change in financial statements of associated company or associated undertaking since date of the resolution passed for approval of investment in such company:
At the time ofApproval, as per latest availableaudited financialstatements for the year endedDecember 31, 2019 the basic earnings per share was Rs. 20.23 andbreakup value per share wasRs.142.54.As per latest availableaudited financialstatements for the year endedDecember31, 2021 the basic earnings per share was Rs. 26.00 andbreakup value per share was Rs.147.17. As per latest available un-audited half yearly financial statements for the half year ended June 30, 2022 the basic earnings per share is Rs. 9.39 and breakup value per share is Rs. 138.81.
At the time of approval, as per latest audited financial statements for the year ended December 31, 2019 the basic loss per share was Rs. 2.29 and breakup value per share was Rs. 7.71. As per latest available audited financial statements for the year ended December 31, 2021 the basic loss per share is Rs. 3.58 and breakup value per share is Rs. 8.09. As per latest available un-audited half yearly financial statements for the half year ended June 30, 2022 the basic loss per share is Rs. 1.24 and breakup value per share is Rs. 7.58.
At the time of approval, as per latest available audited financial statements for the year ended December 31, 2021 the basic loss per share was Rs. 3.58 and breakup value per share was Rs. 8.09. As per latest available un-audited half yearly financial statements for the half year ended June 30, 2022 the basic loss per share is Rs. 1.24 and breakup value per share is Rs. 7.58.
At the time ofApproval, as per latest availableaudited financialstatements for the year ended December31, 2018 the basic loss per share was Rs. 1.44 and breakup value per share was Rs. 9.03. As per latest available audited financial statements for the year ended December 31, 2021 the basic earnings per share was Rs. 1.44 and breakup value per share was Rs. 8.22 As per latest available un-audited half yearly financial statements for the half year ended June 30, 2022 the basic earnings per share is Re. 0.83 and breakup value per share is Rs. 9.05.
At the time ofApproval, as per latest available audited financial statements for the year endedDecember 31, 2018 the basic loss per share was Rs. 1.44 and breakup value per share was Rs. 9.03. As per latest available audited financial statements for the year ended December 31, 2021 the basic earnings per share was Rs. 1.44 and breakup value per share was Rs. 8.22. As per latest available un-audited half yearly financial statements for the half year ended June 30, 2022 the basic earnings per share is Re. 0.83 and breakup value per share isRs. 9.05.
Hyundai Nishat Motor(Private) Limited Nishat Sutas Dairy LimitedMCB Bank
Limited
Name of InvesteeCompany

Nishat Mills LimitedFinancial Statements of
for the year ended June 30, 2022

1.
Sr.No. Key audit matters How the matters were addressed in our audit
INDEPENDENT AUDITOR’S REPORT
Inventory existence and valuation
Inventory as at 30 June 2022 amounted to Rupees 35,826.326 million, break up of which is as follows:
- Stores, spare parts and loose tools Rupees 3,999.710 million
- Stock-in-trade Rupees 31,826.616
million
Inventory is measured at the lower of cost
Our procedures over existence and valuation of inventory included, but were not limited to:
• To test the quantity of inventories at all locations, we assessed the corresponding inventory observation instructions and participated in inventory counts on sites. Based on samples, we performed test counts and compared the quantities counted by us with the results of the counts of the management.
To the members of Nishat Mills Limited
Report on the Audit of the Financial Statements
Opinion
We have audited the annexed financial statements of Nishat Mills Limited (the Company), which comprise the statement of financial position as at 30 June 2022, and the statement of profit or loss, the statement of comprehensive income, the statement of changes in equity, the statement of cash flows for the year then ended, and notes to the financial statements, including a summary of significant accounting policies and other explanatory information, and we state that we have obtained all the information and explanations which, to the best of our knowledge and belief, were necessary for the purposes of the audit.
In our opinion and to the best of our information and according to the explanations given to us, the statement of financial position, the statement of profit or loss, the statement of comprehensive income, the statement of changes in equity and the statement of cash flows together with the notes forming part thereof conform with the accounting and reporting standards as applicable in Pakistan and give the information required by the Companies Act, 2017 (XIX of 2017), in the manner so required and respectively give a true and fair view of the state of the Company's affairs as at 30 June 2022 and of the profit, other comprehensive loss, the changes in equity and its cash flows for the year then ended.
Basis for Opinion
We conducted our audit in accordance with International Standards on Auditing (ISAs) as applicable in Pakistan. Our responsibilities under those standards are further described in the Auditor’s Responsibilities for the Audit of the Financial Statements section of our report. We are independent of the Company in accordance with the International Ethics Standards Board for Accountants’ Code of Ethics for Professional Accountants as adopted by the Institute of Chartered Accountants of Pakistan (the Code) and we have fulfilled our other ethical responsibilities in accordance with the Code. We believe that the audit evidence we have obtained is sufficient and appropriate to provide a basis for our opinion.
Key Audit Matters
Key audit matters are those matters that, in our professional judgment, were of most significance in our audit of the financial statements of the current period. These matters were addressed in the context of our audit of the financial statements as a whole, and in forming our opinion thereon, and we do not provide a separate opinion on these matters.
Following are the key audit matters:
Nishat Mills Limited
40 Page

and net realizable value.
We identified existence and valuation of inventory as a key audit matter due to its size, representing 26.05% of the total assets of the Company as at 30 June 2022, and the judgment involved in valuation.
For further information on inventory, refer to the following:
- Summary of significant accounting policies, Inventories note 2.17 to the financial statements.
- Stores, spares parts and loose tools note 18 and Stock-in-trade note 19 to the financial statements.
• For a sample of inventory items, re-performed the weighted average cost calculation and compared the weighted average cost appearing on valuation sheets.
• We tested that the ageing report used by management correctly aged inventory items by agreeing a sample of aged inventory items to the last recorded invoice.
• On a sample basis, we tested the net realizable value of inventory items to recent selling prices and re-performed the calculation of the inventory write down, if any.
• We assessed the percentage write down applied to older inventory with reference to historic inventory write downs and recoveries on slow moving inventory.
• In the context of our testing of the calculation, we analysed individual cost components and traced them back to the corresponding underlying documents. We furthermore challenged changes in unit costs.
• We also made enquires of management, including those outside of the finance function, and considered the results of our testing above to determine whether any specific write downs were required.
Investments in equity securities
Quoted investments:
The Company’s portfolio of quoted investments, except for investment in quoted subsidiary company, makes up 17.65% of total assets. Due to materiality of quoted investments in the context of the financial statements as a whole and the requirements of applicable accounting and reporting standards relating to classification, measurement and disclosures of investments in related parties, they are considered to be the area which had the greatest effect on our overall audit strategy and allocation of resources in planning and completing our audit.
Our procedures included, but were not limited to:
• We documented and assessed the processes and controls in place to record investment transactions and to value the portfolio.
• We agreed the valuation of all of quoted investments from prices quoted on Pakistan Stock Exchange Limited and redemption price in case of open-end mutual fund except for investment in subsidiary company measured at cost less impairment loss, if any, in accordance with the provisions of IAS 27 ‘Separate Financial Statements’.
• We agreed the holding of all quoted investments from the Account Balance Report of Central Depository Company of Pakistan Limited, Statement of Account, in case of open-end mutual fund and physical share certificates in hand.
Sr.No.
2.
Key audit matters How the matters were addressed in our audit
Annual Report 2022
41Page

Un-quoted investments:
Investments in unquoted equity securities except for investments in unquoted subsidiary companies are accounted for as financial assets at fair value through other comprehensive income and are subject to fair valuation at each reporting date. Investments in unquoted subsidiary companies are stated at cost less impairment loss, if any. The investments as at 30 June 2022 are valued by an independent professional valuer. With reference to the valuation, management estimated the fair value of the investments at Rupees 6,917.218 million at year end.
Investee companies are operating in Insurance, Packaging, Dairy, Hotel and Shopping Mall, Automobile and Energy sectors and therefore, fair values are highly dependent on their expansion plans and significant management judgements. Accordingly, the valuation of the investments was considered as one of the key audit matters.
The fair values were determined based on the present value technique. The valuations involved significant judgements and estimates from management, including future business growth driven by future expansion plans, future products selling prices and operating costs of the investee, discount rate, etc.
For further information, refer to the following:
- Summary of significant accounting policies, Investments note 2.10 to the financial statements.
- Long term investments note 15 to the
financial statements.
• We verified the accuracy of management’s judgement used in classification of quoted investments in related parties.
Our procedures included, but were not limited to:
• We evaluated the independent professional valuer’s competence, capabilities and objectivity.
• We assessed the valuation methodology used by the independent professional valuer to estimate the fair value of the investments.
• We checked, on a sample basis, the accuracy and reasonableness of the input data provided by management to the independent professional valuer, to supporting evidence, such as approved budgets and considering the reasonableness of these budgets by comparing the budgets to the historical results and market data.
• We assessed the reasonableness of cash flows projection, challenging and performing audit procedures on management’s assumptions such as the future business growth driven by future expansion plan, future products selling prices and operating costs, discount rate by comparing the assumptions to historical results and published market and industry data and comparing the current year’s results with the prior year forecast and other relevant information. Our internal valuation expert has been engaged to assist the review on valuation methodology and discount rate. In addition, we had discussed with the management of the investee companies to understand the business and assessed if there was any inconsistency in the assumptions used in the cash flows projection.
• We agreed holding of all un-quoted investments from physical share certificates in hand.
• We performed sensitivity analysis in consideration of the potential impact of reasonably possible upside or downside changes in these key assumptions.
• We verified the accuracy of management calculation used for the impairment testing, in case of subsidiary companies carried at cost less impairment loss, if any.
Capital expenditures
The Company is investing significant amounts in its operations and there are a number of areas where management judgement impacts the carrying value of
Our procedures included, but were not limited to:
• We tested operating effectiveness of controls in place over the property, plant and equipment
Sr.No.
3.
Key audit matters How the matters were addressed in our audit
Nishat Mills Limited
42 Page

property, plant and equipment and its respective depreciation profile. These include among other the decision to capitalize or expense costs; and review of useful life of the assets including the impact of changes in the Company’s strategy.
We focused on this area since the amounts have a significant impact on the financial position of the Company and there is significant management judgment required that has significant impact on the reporting of the financial position for the Company. Therefore, considered as one of the key audit matters.
For further information, refer to the following:
- Summary of significant accounting policies, property, plant, equipment and depreciation note 2.6 to the financial statements.
- Property, plant and equipment note 13 to the financial statements.
cycle including the controls over whether costs incurred on activities is capital or operating in nature.
• We evaluated the appropriateness of capitalization policies and depreciation rates.
• We performed tests of details on costs capitalized.
• We verified the accuracy of management’s calculation used for the impairment testing.
Sr.No. Key audit matters How the matters were addressed in our audit
Revenue recognition
The Company recognized net revenue of Rupees 115,768.065 million for the year ended 30 June 2022.
We identified recognition of revenue as a key audit matter because revenue is one of the key performance indicator of the Company and gives rise to an inherent risk that revenue could be subject to misstatement to meet expectations or targets.
For further information, refer to the following:
- Summary of significant accounting policies, Revenue recognition note 2.24 to the financial statements.
- Revenue note 27 to the financial
statements.
Our procedures included, but were not limited to:
• We obtained an understanding of the process relating to recognition of revenue and testing the design, implementation and operating effectiveness of key internal controls over recording of revenue.
• We compared a sample of revenue transactions recorded during the year with sales orders, sales invoices, delivery documents and other relevant underlying documents.
• We compared a sample of revenue transactions recorded around the year-end with the sales orders, sales invoices, delivery documents and other relevant underlying documentation to assess if the related revenue was recorded in the appropriate accounting period.
• We assessed whether the accounting policies for revenue recognition complies with the requirements of IFRS 15 ‘Revenue from Contracts with Customers’.
• We also considered the appropriateness of disclosures in the financial statements.
4.
Annual Report 2022
43Page

Information Other than the Financial Statements and Auditor’s Report Thereon
Management is responsible for the other information. The other information comprises the information included in the annual report, but does not include the financial statements and our auditor’s report thereon.
Our opinion on the financial statements does not cover the other information and we do not express any form of assurance conclusion thereon.
In connection with our audit of the financial statements, our responsibility is to read the other information and, in doing so, consider whether the other information is materially inconsistent with the financial statements or our knowledge obtained in the audit or otherwise appears to be materially misstated. If, based on the work we have performed, we conclude that there is a material misstatement of this other information, we are required to report that fact. We have nothing to report in this regard.
Responsibilities of Management and Board of Directors for the Financial Statements
Management is responsible for the preparation and fair presentation of the financial statements in accordance with the accounting and reporting standards as applicable in Pakistan and the requirements of Companies Act, 2017 (XIX of 2017) and for such internal control as management determines is necessary to enable the preparation of financial statements that are free from material misstatement, whether due to fraud or error.
In preparing the financial statements, management is responsible for assessing the Company’s ability to continue as a going concern, disclosing, as applicable, matters related to going concern and using the going concern basis of accounting unless management either intends to liquidate the Company or to cease operations, or has no realistic alternative but to do so.
Board of directors are responsible for overseeing the Company’s financial reporting process.
Auditor’s Responsibilities for the Audit of the Financial Statements
Our objectives are to obtain reasonable assurance about whether the financial statements as a whole are free from material misstatement, whether due to fraud or error, and to issue an auditor’s report that includes our opinion. Reasonable assurance is a high level of assurance, but is not a guarantee that an audit conducted in accordance with ISAs as applicable in Pakistan will always detect a material misstatement when it exists. Misstatements can arise from fraud or error and are considered material if, individually or in the aggregate, they could reasonably be expected to influence the economic decisions of users taken on the basis of these financial statements.
As part of an audit in accordance with ISAs as applicable in Pakistan, we exercise professional judgment and maintain professional skepticism throughout the audit. We also:
• Identify and assess the risks of material misstatement of the financial statements, whether due to fraud or error, design and perform audit procedures responsive to those risks, and obtain audit evidence that is sufficient and appropriate to provide a basis for our opinion. The risk of not detecting a material misstatement resulting from fraud is higher than for one resulting from error, as fraud may involve collusion, forgery, intentional omissions, misrepresentations, or the override of internal control.
• Obtain an understanding of internal control relevant to the audit in order to design audit procedures that are appropriate in the circumstances, but not for the purpose of expressing an opinion on the effectiveness of the Company’s internal control.
• Evaluate the appropriateness of accounting policies used and the reasonableness of accounting estimates and related disclosures made by management.
• Conclude on the appropriateness of management’s use of the going concern basis of accounting and,
based on the audit evidence obtained, whether a material uncertainty exists related to events or conditions that may cast significant doubt on the Company’s ability to continue as a going concern. If we conclude that a material uncertainty exists, we are required to draw attention in our auditor’s report to the
Nishat Mills Limited
44 Page
related disclosures in the financial statements or, if such disclosures are inadequate, to modify our opinion. Our conclusions are based on the audit evidence obtained up to the date of our auditor’s report. However, future events or conditions may cause the Company to cease to continue as a going concern.
• Evaluate the overall presentation, structure and content of the financial statements, including the disclosures, and whether the financial statements represent the underlying transactions and events in a manner that achieves fair presentation.
We communicate with the board of directors regarding, among other matters, the planned scope and timing of the audit and significant audit findings, including any significant deficiencies in internal control that we identify during our audit.
We also provide the board of directors with a statement that we have complied with relevant ethical requirements regarding independence, and to communicate with them all relationships and other matters that may reasonably be thought to bear on our independence, and where applicable, related safeguards.
From the matters communicated with the board of directors, we determine those matters that were of most significance in the audit of the financial statements of the current period and are therefore the key audit matters. We describe these matters in our auditor’s report unless law or regulation precludes public disclosure about the matter or when, in extremely rare circumstances, we determine that a matter should not be communicated in our report because the adverse consequences of doing so would reasonably be expected to outweigh the public interest benefits of such communication.
Report on Other Legal and Regulatory Requirements
Based on our audit, we further report that in our opinion:
a) proper books of account have been kept by the Company as required by the Companies Act, 2017 (XIX of 2017);
b) the statement of financial position, the statement of profit or loss, the statement of comprehensive income, the statement of changes in equity and the statement of cash flows together with the notes thereon have been drawn up in conformity with the Companies Act, 2017 (XIX of 2017) and are in agreement with the books of account and returns;
c) investments made, expenditure incurred and guarantees extended during the year were for the purpose of the Company’s business; and
d) zakat deductible at source under the Zakat and Ushr Ordinance, 1980 (XVIII of 1980), was deducted by the Company and deposited in the Central Zakat Fund established under section 7 of that Ordinance.
The engagement partner on the audit resulting in this independent auditor’s report is Syed Mustafa Ali.
RIAZ AHMAD & COMPANYChartered Accountants
Lahore
27 September 2022
UDIN: AR202210168JS4Njl1I7
Annual Report 2022
45Page

2022 2021 Note (Rupees in thousand) EQUITY AND LIABILITIES
SHARE CAPITAL AND RESERVES
Authorized share capital
1,100,000,000 (2021: 1,100,000,000) ordinaryshares of Rupees 10 each 11,000,000 11,000,000
Issued, subscribed and paid-up share capital 3 3,515,999 3,515,999Reserves 4 75,684,944 82,231,780Total equity 79,200,943 85,747,779
LIABILITIES
NON-CURRENT LIABILITIES
Long term financing - secured 5 12,284,112 11,577,915Deferred liabilities 6 2,191,059 1,055,992 14,475,171 12,633,907
CURRENT LIABILITIES
Trade and other payables 7 11,997,292 9,512,304Accrued mark-up 8 376,723 196,382Short term borrowings 9 26,730,048 18,718,262Current portion of non-current liabilities 10 4,302,449 4,206,123Unclaimed dividend 11 101,928 97,617Taxation - net 22 350,023 - 43,858,463 32,730,688TOTAL LIABILITIES 58,333,634 45,364,595
CONTINGENCIES AND COMMITMENTS 12
TOTAL EQUITY AND LIABILITIES 137,534,577 131,112,374
The annexed notes form an integral part of these financial statements.
CHIEF EXECUTIVE OFFICER
Nishat Mills Limited
46 Page
As at June 30, 2022Statement of Financial Position

CHIEF FINANCIAL OFFICERDIRECTOR
2022 2021 Note (Rupees in thousand) ASSETS
NON-CURRENT ASSETS
Property, plant and equipment 13 39,766,323 35,926,594Investment properties 14 475,077 479,506Long term investments 15 35,720,224 48,620,695Long term loans 16 392,423 468,377Long term deposits 17 177,196 156,984 76,531,243 85,652,156
CURRENT ASSETS
Stores, spare parts and loose tools 18 3,999,710 2,605,602Stock-in-trade 19 31,826,616 17,972,691Trade debts 20 10,366,408 6,549,252Loans and advances 21 4,800,356 7,675,599Taxation - net 22 - 572,307Short term deposits and prepayments 23 137,383 80,828Other receivables 24 9,401,466 4,702,709Accrued interest 25 379,668 28,885Cash and bank balances 26 91,727 5,272,345 61,003,334 45,460,218
TOTAL ASSETS 137,534,577 131,112,374
Annual Report 2022
47Page

2022 2021 Note (Rupees in thousand) RREVENUE 27 115,768,065 71,431,010COST OF SALES 28 (98,432,494) (62,113,155)GROSS PROFIT 17,335,571 9,317,855 DISTRIBUTION COST 29 (5,665,953) (3,096,473)ADMINISTRATIVE EXPENSES 30 (1,671,369) (1,340,093)OTHER EXPENSES 31 (502,014) (331,796) (7,839,336) (4,768,362) 9,496,235 4,549,493 OTHER INCOME 32 5,571,415 3,750,188PROFIT FROM OPERATIONS 15,067,650 8,299,681 FINANCE COST 33 (2,160,365) (1,229,179)PROFIT BEFORE TAXATION 12,907,285 7,070,502 TAXATION 34 (2,595,611) (1,148,032)PROFIT AFTER TAXATION 10,311,674 5,922,470
EARNINGS PER SHARE - BASIC AND DILUTED (RUPEES) 35 29.33 16.84 The annexed notes form an integral part of these financial statements.
CHIEF EXECUTIVE OFFICER CHIEF FINANCIAL OFFICERDIRECTOR
Nishat Mills Limited
48 Page
For the year ended June 30, 2022Statement of Profit or Loss

2022 2021 (Rupees in thousand) PROFIT AFTER TAXATION 10,311,674 5,922,470
OTHER COMPREHENSIVE INCOME / (LOSS)
Items that will not be reclassified to profit or loss:
(Deficit) / surplus arising on remeasurement of investments at fair value through other comprehensive income (14,218,053) 10,400,145
Deferred income tax relating to this item (1,234,058) (596,297) (15,452,111) 9,803,848
Items that may be reclassified subsequently to profit or loss - -
Other comprehensive (loss) / income for the year - net of tax (15,452,111) 9,803,848
TOTAL COMPREHENSIVE (LOSS) / INCOME FOR THE YEAR (5,140,437) 15,726,318
The annexed notes form an integral part of these financial statements.
CHIEF EXECUTIVE OFFICER CHIEF FINANCIAL OFFICERDIRECTOR
Annual Report 2022
49Page
For the year ended June 30, 2022Statement of Comprehensive Income

(Rup
ees
in th
ousa
nd)
Res
erve
sC
apita
l Res
erve
sR
even
ue R
eser
ves
Shar
eC
apita
lTo
tal
Equi
tyPr
emiu
m o
nIs
sue
ofRi
ght S
hare
s
Fair
valu
ere
serv
e FV
TOCI
inve
stm
ents
Gen
eral
Res
erve
Una
ppro
p-ria
ted
Profi
t
Tota
lSu
b To
tal
Sub
Tota
l
Bala
nce
as a
t 30
June
202
0
3,51
5,99
9 5,
499,
530
13,7
39,1
58
19,2
38,6
88
45,1
65,0
28
3,50
8,14
5 48
,673
,173
67
,911
,861
71
,427
,860
Tran
sact
ion
with
ow
ners
- F
inal
div
iden
d fo
r the
yea
r
en
ded
30 J
une
2020
@ R
upee
s 4.
00 p
er s
hare
- -
- -
- (1
,406
,399
) (1
,406
,399
) (1
,406
,399
) (1
,406
,399
)
Tran
sfer
red
to g
ener
al re
serv
e
-
- -
- 2,
101,
000
(2,1
01,0
00)
- -
-
Prof
it fo
r the
yea
r
-
- -
- -
5,92
2,47
0 5,
922,
470
5,92
2,47
0 5,
922,
470
Othe
r com
preh
ensi
ve in
com
e fo
r the
yea
r
-
- 9,
803,
848
9,80
3,84
8 -
- -
9,80
3,84
8 9,
803,
848
Tota
l com
preh
ensi
ve in
com
e fo
r the
yea
r
- -
9,80
3,84
8 9,
803,
848
- 5,
922,
470
5,92
2,47
0 15
,726
,318
15
,726
,318
Bala
nce
as a
t 30
June
202
1
3,5
15,9
99
5,49
9,53
0 23
,543
,006
29
,042
,536
47
,266
,028
5,
923,
216
53,1
89,2
44
82,2
31,7
80
85,7
47,7
79
Tran
sact
ion
with
ow
ners
- F
inal
div
iden
d fo
r the
yea
r
en
ded
30 J
une
2021
@ R
upee
s 4.
00 p
er s
hare
-
- -
- -
(1,4
06,3
99)
(1,4
06,3
99)
(1,4
06,3
99)
(1,4
06,3
99)
Tran
sfer
red
to g
ener
al re
serv
e
-
- -
- 4,
516,
000
(4,5
16,0
00)
- -
-
Prof
it fo
r the
yea
r
-
- -
- -
10,3
11,6
74
10,3
11,6
74
10,3
11,6
74
10,3
11,6
74
Othe
r com
preh
ensi
ve lo
ss fo
r the
yea
r
-
- (1
5,45
2,11
1)
(15,
452,
111)
-
- -
(15,
452,
111)
(1
5,45
2,11
1)
Tota
l com
preh
ensi
ve lo
ss fo
r the
yea
r
-
- (1
5,45
2,11
1)
(15,
452,
111)
-
10,3
11,6
74
10,3
11,6
74
(5,1
40,4
37)
(5,1
40,4
37)
Bala
nce
as a
t 30
June
202
2
3,5
15,9
99
5,49
9,53
0 8,
090,
895
13,5
90,4
25
51,7
82,0
28
10,3
12,4
91
62,0
94,5
19
75,6
84,9
44
79,2
00,9
43
The
anne
xed
note
s fo
rm a
n in
tegr
al p
art o
f the
se fi
nanc
ial s
tate
men
ts.
CH
IEF
EXEC
UTI
VE O
FFIC
ERC
HIE
F FI
NAN
CIA
L O
FFIC
ERD
IREC
TOR
Nishat Mills Limited
50 Page
For the year ended June 30, 2022Statement of Changes In Equity

2022 2021 Note (Rupees in thousand) CASH FLOWS FROM OPERATING ACTIVITIES
Cash (used in) / generated from operations 36 (7,159,237) 8,488,377Finance cost paid (1,943,928) (1,185,463)Income tax paid (1,673,281) (1,161,259)Exchange gain on forward exchange contracts received 27,313 1,237Gas infrastructure development cess paid - (168,369)Net decrease / (increase) in long term loans 99,462 (199,887)Net increase in long term deposits (20,212) (52,201)
Net cash (used in) / generated from operating activities (10,669,883) 5,722,435
CASH FLOWS FROM INVESTING ACTIVITIES
Capital expenditure on property, plant and equipment (7,203,463) (7,615,598)Proceeds from sale of property, plant and equipment 102,188 172,056Investments made (1,317,582) (241,476)Loans and advances to subsidiary companies (49,623,420) (41,838,370)Repayment of loans by subsidiary companies 52,561,226 43,089,828Interest received 364,385 332,462Dividends received 3,328,797 2,722,637
Net cash used in investing activities (1,787,869) (3,378,461)
CASH FLOWS FROM FINANCING ACTIVITIES
Proceeds from long term financing 3,707,601 6,421,187Repayment of long term financing (3,040,165) (1,610,173)Short term borrowings - net 8,011,786 (611,506)Dividend paid (1,402,088) (1,399,378)
Net cash from financing activities 7,277,134 2,800,130
Net (decrease) / increase in cash and cash equivalents (5,180,618) 5,144,104
Cash and cash equivalents at the beginning of the year 5,272,345 128,241
Cash and cash equivalents at the end of the year 91,727 5,272,345
The annexed notes form an integral part of these financial statements.
CHIEF EXECUTIVE OFFICER CHIEF FINANCIAL OFFICERDIRECTOR
Annual Report 2022
51Page
For the year ended June 30, 2022Statement of Cash Flows

1 THE COMPANY AND ITS OPERATIONS
1.1 Nishat Mills Limited (the Company) is a public limited Company incorporated in Pakistan under the Companies Act, 1913 (Now Companies Act, 2017) and listed on Pakistan Stock Exchange Limited. Its registered office is situated at 53-A, Lawrence Road, Lahore. The Company is engaged in the business of textile manufacturing and of spinning, combing, weaving, bleaching, dyeing, printing, stitching, apparel, buying, selling and otherwise dealing in yarn, linen, cloth and other goods and fabrics made from raw cotton, synthetic fibre and cloth and to generate, accumulate, distribute, supply and sell electricity.
1.2 Geographical location and addresses of all business units are as follows:
Sr. No.
1 Spinning units, yarn dyeing unit and power plant Nishatabad, Faisalabad. 2 Spinning units and power plant Plot No. 172-180 and 188-197, M-3 Industrial City, Sahianwala and FIEDMC, 2 K.M., Jhumra Chiniot Road, Chak Jhumra, Faisalabad. 3 Spinning units and power plant 20 K.M., Sheikhupura Road, Feroze Wattwan. 4 Weaving units and power plant 12 K.M., Faisalabad Road, Sheikhupura. 5 Weaving units, dyeing and finishing unit, 5 K.M., Nishat Avenue Off 22 K.M., processing unit, stitching units and power plants Ferozepur Road, Lahore. 6 Terry unit 7 K.M., Nishat Avenue Off 22 K.M., Ferozepur Road, Lahore. 7 Apparel unit 2 K.M., Nishat Avenue Off 22 K.M., Ferozepur Road, Lahore. 8 Head office 7-Main Gulberg, Lahore. 9 Office 1st Floor, Karachi Chambers, Hasrat Mohani Road, Karachi. 10 Registered office Nishat House, 53-A, Lawrence Road, Lahore.
1.3 These financial statements are the separate financial statements of the Company. Consolidated financial statements of the Company are prepared separately. Details of the Company’s investments in subsidiaries and associates are stated in note 15 to these financial statements.
2 SUMMARY OF SIGNIFICANT ACCOUNTING POLICIES
The significant accounting policies applied in the preparation of these financial statements are set out below. These policies have been consistently applied to all years presented unless otherwise stated:
2.1 Basis of preparation
a) Statement of compliance
These financial statements have been prepared in accordance with the accounting and reporting standards as applicable in Pakistan. The accounting and reporting standards applicable in Pakistan comprise of:
- International Financial Reporting Standards (IFRSs) issued by the International Accounting Standards Board (IASB) as notified under the Companies Act, 2017; and
- Provisions of and directives issued under the Companies Act, 2017.
Where provisions of and directives issued under the Companies Act, 2017 differ from the IFRSs, the provisions of and directives issued under the Companies Act, 2017 have been followed.
b) Accounting convention
These financial statements have been prepared under the historical cost convention except as otherwise stated in the respective accounting policies.
AddressManufacturing units and offices
Nishat Mills Limited
52 Page
For the year ended June 30, 2022Notes to the Financial Statements

c) Critical accounting estimates and judgments
The preparation of financial statements in conformity with the approved accounting standards requires the use of certain critical accounting estimates. It also requires the management to exercise its judgment in the process of applying the Company's accounting policies. Estimates and judgments are continually evaluated and are based on historical experience and other factors, including expectations of future events that are believed to be reasonable under the circumstances. The areas where various assumptions and estimates are significant to the Company's financial statements or where judgments were exercised in application of accounting policies are as follows:
Financial instruments – fair value
The fair value of financial instruments that are not traded in an active market is determined by using valuation techniques based on assumptions that are dependent on conditions existing at the reporting date.
Useful lives, patterns of economic benefits and impairment
Estimates with respect to residual values and useful lives and pattern of flow of economic benefits are based on the analysis of the management of the Company. Further, the Company reviews the value of assets for possible impairment on an annual basis. Any change in the estimates in the future might affect the carrying amount of respective item of property, plant and equipment and investment properties with a corresponding effect on the depreciation charge and impairment.
Inventories
Inventory write-down is made based on the current market conditions, historical experience and selling goods of similar nature. It could change significantly as a result of changes in market conditions. A review is made on each reporting date on inventories for excess inventories, obsolescence and declines in net realisable value and an allowance is recorded against the inventory balances for any such declines.
Income tax
In making the estimates for income tax currently payable by the Company, the management takes into account the current income tax law and the decisions of appellate authorities on certain issues in the past.
Allowance for expected credit losses
The allowance for Expected Credit Losses (ECLs) assessment requires a degree of estimation and judgement. It is based on the lifetime expected credit loss, grouped based on days overdue, and makes assumptions to allocate an overall expected credit loss rate for each group. These assumptions include recent sales experience and historical collection rates.
Provisions
As the actual outflows can differ from estimates made for provisions due to changes in laws, regulations, public expectations, technology, prices and conditions, and can take place many years in the future, the carrying amounts of provisions are reviewed at each reporting date and adjusted to take account of such changes. Any adjustments to the amount of previously recognised provision is recognised in the statement of profit or loss unless the provision was originally recognised as part of cost of an asset.
Contingencies
The Company reviews the status of all pending litigations and claims against the Company. Based on the judgment and the advice of the legal advisors for the estimated financial outcome, appropriate disclosure or provision is made. The actual outcome of these litigations and claims can have an effect
Annual Report 2022
53Page

on the carrying amounts of the liabilities recognized at the statement of financial position date.
Impairment of investments in subsidiaries
In making an estimate of recoverable amount of the Company's investments in subsidiaries, the management considers future cash flows.
Revenue from contracts with customers involving sale of goods
When recognizing revenue in relation to the sale of goods to customers, the key performance obligation of the Company is considered to be the point of delivery of the goods to the customer, as this is deemed to be the time that the customer obtains control of the promised goods and therefore the benefits of unimpeded access.
d) Amendments to published approved accounting standards that are effective in current year and are relevant to the Company
Following amendments to published approved accounting standards are mandatory for the Company’s accounting periods beginning on or after 01 July 2021:
• Amendments to IFRS 16 ‘Leases’ – Covid-19 related rent concessions extended beyond 30 June 2021
• Interest Rate Benchmark Reform – Phase 2 which amended IFRS 9 ‘Financial Instruments’, IAS 39 ‘Financial Instruments: Recognition and Measurement’, IFRS 4 ‘Insurance Contracts’, IFRS 7 ‘Financial Instruments: Disclosures’, IFRS 4 ‘Insurance Contracts’ and IFRS 16 ‘Leases’
The above-mentioned amendments to approved accounting standards did not have any impact on the amounts recognised in prior period and are not expected to significantly affect the current or future periods.
e) Amendments to published approved accounting standards that are effective in current year but not relevant to the Company
There are amendments to published standards that are mandatory for accounting periods beginning on or after 01 July 2021 but are considered not to be relevant or do not have any significant impact on the Company’s financial statements and are therefore not detailed in these financial statements.
f) Amendments to published approved accounting standards that are not yet effective but relevant to the Company
Following amendments to existing standards have been published and are mandatory for the Company’s accounting periods beginning on or after 01 July 2022 or later periods:
Classification of liabilities as current or non-current (Amendments to IAS 1 ‘Presentation of Financial Statements’) effective for the annual period beginning on or after 01 January 2023. These amendments in the standards have been added to further clarify when a liability is classified as current. The standard also amends the aspect of classification of liability as non-current by requiring the assessment of the entity’s right at the end of the reporting period to defer the settlement of liability for at least twelve months after the reporting period. An entity shall apply those amendments retrospectively in accordance with IAS 8 ‘Accounting Policies, Changes in Accounting Estimates and Errors’.
Onerous Contracts – Cost of Fulfilling a Contract (Amendments to IAS 37 ‘Provisions, Contingent Liabilities and Contingent Assets’) effective for the annual period beginning on or after 01 January 2022 amends IAS 1 ‘Presentation of Financial Statements’ by mainly adding paragraphs which
Nishat Mills Limited
54 Page
For the year ended June 30, 2022Notes to the Financial Statements

clarifies what comprise the cost of fulfilling a contract. Cost of fulfilling a contract is relevant when determining whether a contract is onerous. An entity is required to apply the amendments to contracts for which it has not yet fulfilled all its obligations at the beginning of the annual reporting period in which it first applies the amendments (the date of initial application). Restatement of comparative information is not required, instead the amendments require an entity to recognize the cumulative effect of initially applying the amendments as an adjustment to the opening balance of retained earnings or other component of equity, as appropriate, at the date of initial application.
The following annual improvements to IFRS standards 2018-2020 are effective for annual reporting periods beginning on or after 01 January 2022:
- IFRS 9 ‘Financial Instruments’ – The amendment clarifies that an entity includes only fees paid or received between the entity (the borrower) and the lender, including fees paid or received by either the entity or the lender on the other’s behalf, when it applies the ‘10 per cent’ test in paragraph B3.3.6 of IFRS 9 in assessing whether to derecognize a financial liability.
- IFRS 16 ‘Leases’ – The amendment partially amends Illustrative Example 13 accompanying IFRS 16 ‘Leases’ by excluding the illustration of reimbursement of leasehold improvements by the lessor. The objective of the amendment is to resolve any potential confusion that might arise in lease incentives.
Disclosure of Accounting Policies (Amendments to IAS 1 ‘Presentation of Financial Statements’ and IFRS Practice Statement 2 ‘Making Materiality Judgement’) effective for annual periods beginning on or after 01 January 2023. These amendments are intended to help preparers in deciding which accounting policies to disclose in their financial statements. Earlier, IAS 1 states that an entity shall disclose its ‘significant accounting policies’ in their financial statements. These amendments shall assist the entities to disclose their ‘material accounting policies’ in their financial statements.
Deferred Tax related to Assets and Liabilities arising from a Single Transaction (Amendments to IAS 12 ‘Income taxes’) effective for annual periods beginning on or after 01 January 2023. These amendments clarify how companies account for deferred tax on transactions such as leases and decommissioning obligations.
Change in definition of Accounting Estimate (Amendments to IAS 8 ‘Accounting Policies, Changes in Accounting Estimates and Errors’) effective for annual periods beginning on or after 1 January 2023. This change replaced the definition of Accounting Estimate with a new definition, intended to help entities to distinguish between accounting policies and accounting estimates.
The International Accounting Standards Board (IASB) has published 'Reference to the Conceptual Framework (Amendments to IFRS 3)' with amendments to IFRS 3 'Business Combinations' that update an outdated reference in IFRS 3 without significantly changing its requirements. Effective for business combinations for which the acquisition date is on or after the beginning of annual period beginning on or after 01 January 2022. The amendments also add to IFRS 3 an exception to its requirement for an entity to refer to the Conceptual Framework to determine what constitutes an asset or a liability. The standard is effective for transactions in the future and therefore would not have an impact on past financial statements.
Amendments to IFRS 10 ‘Consolidated Financial Statements’ and IAS 28 ‘Investments in Associates and Joint Ventures’ (deferred indefinitely) to clarify the treatment of the sale or contribution of assets from an investor to its associates or joint venture, as follows: require full recognition in the investor’s financial statements of gains and losses arising on the sale or contribution of assets that constitute a business (as defined in IFRS 3 ‘Business Combinations’); require the partial recognition of gains and losses where the assets do not constitute a business, i.e. a gain or loss is recognized only to the extent of the unrelated investors’ interests in that associate or joint venture. These requirements apply regardless of the legal form of the transaction, e.g. whether the sale or contribution of assets occur by an investor transferring shares in a subsidiary that holds the assets (resulting in loss of control of the subsidiary), or by the direct sale of the assets themselves.
Annual Report 2022
55Page

The above amendments and improvements are likely to have no significant impact on the financial statements.
g) Standards and amendments to approved published standards that are not yet effective and not considered relevant to the Company
There are other standards and amendments to published standards that are mandatory for accounting periods beginning on or after 01 July 2022 but are considered not to be relevant or do not have any significant impact on the Company’s financial statements and are therefore not detailed in these financial statements.
2.2 Employee benefit
The Company operates an approved funded provident fund scheme covering all its permanent employees and permanent employees of a Nishat Linen (Private) Limited - Group Company. Equal monthly contributions are made both by the Company, Nishat Linen (Private) Limited - Group Company and employees at the rate of 9.5 percent of the basic salary to the fund. The Company's contributions to the fund are charged to statement of profit or loss.
2.3 Taxation
Current
Provision for current tax is based on the taxable income for the year determined in accordance with the prevailing law for taxation of income. The charge for current tax is calculated using prevailing tax rates or tax rates expected to apply to the profit for the year, if enacted. The charge for current tax also includes adjustments, where considered necessary, to provision for tax made in previous years arising from assessments framed during the year for such years.
Deferred
Deferred tax is accounted for using the liability method in respect of all temporary differences arising from differences between the carrying amount of assets and liabilities in the financial statements and the corresponding tax bases used in the computation of the taxable profit. Deferred tax liabilities are generally recognized for all taxable temporary differences and deferred tax assets to the extent that it is probable that taxable profits will be available against which the deductible temporary differences, unused tax losses and tax credits can be utilized.
Deferred tax is calculated at the rates that are expected to apply to the period when the differences reverse based on tax rates that have been enacted or substantively enacted by the reporting date. Deferred tax is charged or credited in the statement of profit or loss, except to the extent that it relates to items recognized in other comprehensive income or directly in equity. In this case, the tax is also recognized in other comprehensive income or directly in equity, respectively.
2.4 Functional and presentation currency
Items included in the financial statements of the Company are measured using the currency of the primary economic environment in which the Company operates (the functional currency). The financial statements are presented in Pak Rupees, which is the Company’s functional and presentation currency. Figures are rounded off to the nearest thousand of Pak Rupees.
2.5 Foreign currency transactions and translation
All monetary assets and liabilities in foreign currencies are translated into Pak Rupees at exchange rates prevailing at the reporting date. Transactions in foreign currencies are translated into Pak Rupees at exchange rates prevailing at the dates of the transactions. Foreign exchange gains and losses resulting from the settlement of such transactions and from the translation at year end exchange rates of monetary assets and liabilities denominated in foreign currencies are charged or credited to statement of profit or
Nishat Mills Limited
56 Page
For the year ended June 30, 2022Notes to the Financial Statements

loss. Non-monetary assets and liabilities that are measured in terms of historical cost in a foreign currency are translated into Pak Rupees at exchange rates prevailing at the date of transaction. Non-monetary assets and liabilities denominated in foreign currency that are stated at fair value are translated into Pak Rupees at exchange rates prevailing at the date when fair values are determined.
2.6 Property, plant, equipment and depreciation
Operating fixed assets
Operating fixed assets except freehold land are stated at cost less accumulated depreciation and accumulated impairment losses (if any). Cost of operating fixed assets consists of historical cost, borrowing cost pertaining to erection / construction period of qualifying assets and other directly attributable costs of bringing the asset to working condition. Freehold land is stated at cost less any recognized impairment loss.
Subsequent costs are included in the asset’s carrying amount or recognized as a separate asset, as appropriate, only when it is probable that future economic benefits associated with the item will flow to the Company and the cost of the item can be measured reliably. All other repair and maintenance costs are charged to statement of profit or loss during the period in which they are incurred.
Depreciation
Depreciation on operating fixed assets is charged to the statement of profit or loss applying the reducing balance method so as to write off the cost / depreciable amount of the assets over their estimated useful lives at the rates given in note 13.1. The Company charges the depreciation on additions from the date when the asset is available for use and on deletions up to the date when the asset is de-recognized. The residual values and useful lives are reviewed by the management, at each financial year-end and adjusted if impact on depreciation is significant.
De-recognition
An item of operating fixed assets is de-recognized upon disposal or when no future economic benefits are expected from its use or disposal. Any gain or loss arising on de-recognition of the asset is included in the statement of profit or loss in the year the asset is de-recognized.
Capital work-in-progress
Capital work-in-progress is stated at cost less identified impairment losses, if any. All expenditure connected with specific assets incurred during installation and construction period are carried under capital work-in-progress. These are transferred to operating fixed assets as and when these are available for use.
2.7 Investment properties
Land and buildings held for capital appreciation or to earn rental income are classified as investment properties. Investment properties except land, are stated at cost less accumulated depreciation and any recognized impairment loss. Land is stated at cost less any recognized impairment loss. Depreciation on buildings is charged to the statement of profit or loss applying the reducing balance method so as to write off the cost of buildings over their estimated useful lives at a rate of 10% per annum.
2.8 Right-of-use assets
A right-of-use asset is recognized at the commencement date of a lease. The right-of-use asset is measured at cost, which comprises the initial amount of the lease liability, adjusted for, as applicable, any lease payments made at or before the commencement date net of any lease incentives received, any initial direct costs incurred, and, except where included in the cost of inventories, an estimate of costs expected to be incurred for dismantling and removing the underlying asset, and restoring the site or asset.
Annual Report 2022
57Page

Right-of-use assets are depreciated on a straight-line basis over the unexpired period of the lease or the estimated useful life of the asset, whichever is shorter. Where the Company expects to obtain ownership of the leased asset at the end of the lease term, the depreciation is charged over its estimated useful life. Right-of use assets are subject to impairment or adjusted for any re-measurement of lease liabilities.
The Company has elected not to recognize a right-of-use asset and corresponding lease liability for short-term leases with terms of 12 months or less and leases of low-value assets. Lease payments on these assets are charged to income as incurred.
2.9 Lease liabilities
A lease liability is recognized at the commencement date of a lease. The lease liability is initially recognized at the present value of the lease payments to be made over the term of the lease, discounted using the interest rate implicit in the lease or, if that rate cannot be readily determined, the Company's incremental borrowing rate. Lease payments comprise of fixed payments less any lease incentives receivable, variable lease payments that depend on an index or a rate, amounts expected to be paid under residual value guarantees, exercise price of a purchase option when the exercise of the option is reasonably certain to occur, and any anticipated termination penalties. The variable lease payments that do not depend on an index or a rate are expensed in the period in which they are incurred.
Lease liabilities are measured at amortised cost using the effective interest method. The carrying amounts are re-measured if there is a change in the following: future lease payments arising from a change in an index or a rate used; residual guarantee; lease term; certainty of a purchase option and termination penalties. When a lease liability is re-measured, an adjustment is made to the corresponding right-of-use asset, or to statement of profit or loss if the carrying amount of the right-of-use asset is fully written down.
2.10 Investments and other financial assets
a) Classification
The Company classifies its financial assets in the following measurement categories:
• those to be measured subsequently at fair value (either through other comprehensive income, or through profit or loss), and
• those to be measured at amortized cost
The classification depends on the Company’s business model for managing the financial assets and the contractual terms of the cash flows.
For assets measured at fair value, gains and losses will either be recorded in profit or loss or other comprehensive income. For investments in debt instruments, this will depend on the business model in which the investment is held. For investments in equity instruments, this will depend on whether the Company has made an irrevocable election at the time of initial recognition to account for the equity investment at fair value through other comprehensive income. The Company reclassifies debt investments when and only when its business model for managing those assets changes.
b) Measurement
At initial recognition, the Company measures a financial asset at its fair value plus, in the case of a financial asset not at fair value through profit or loss, transaction costs that are directly attributable to the acquisition of the financial asset. Transaction costs of financial assets carried at fair value through profit or loss are expensed in profit or loss.
Financial assets with embedded derivatives are considered in their entirety when determining whether their cash flows are solely payment of principal and interest.
Nishat Mills Limited
58 Page
For the year ended June 30, 2022Notes to the Financial Statements

Debt instruments
Subsequent measurement of debt instruments depends on the Company’s business model for managing the asset and the cash flow characteristics of the asset. There are three measurement categories into which the Company classifies its debt instruments:
Amortized cost
Financial assets that are held for collection of contractual cash flows where those cash flows represent solely payments of principal and interest are measured at amortised cost. Interest income from these financial assets is included in other income using the effective interest rate method. Any gain or loss arising on derecognition is recognised directly in profit or loss and presented in other income / (other expenses) together with foreign exchange gains and losses. Impairment losses are presented as separate line item in the statement of profit or loss.
Fair value through other comprehensive income (FVTOCI)
Financial assets that are held for collection of contractual cash flows and for selling the financial assets, where the assets’ cash flows represent solely payments of principal and interest, are measured at FVTOCI. Movements in the carrying amount are taken through other comprehensive income, except for the recognition of impairment losses (and reversal of impairment losses), interest income and foreign exchange gains and losses which are recognised in profit or loss. When the financial asset is derecognised, the cumulative gain or loss previously recognised in other comprehensive income is reclassified from equity to profit or loss and recognised in other income / (other expenses). Interest income from these financial assets is included in other income using the effective interest rate method. Foreign exchange gains and losses are presented in other income / (other expenses) and impairment losses are presented as separate line item in the statement of profit or loss.
Fair value through profit or loss (FVTPL)
Assets that do not meet the criteria for amortised cost or FVTOCI are measured at FVTPL. A gain or loss on a debt instrument that is subsequently measured at FVTPL is recognised in profit or loss and presented net within other income / (other expenses) in the period in which it arises.
Equity instruments
The Company subsequently measures all equity investments at fair value for financial instruments quoted in an active market, the fair value corresponds to a market price (level 1). For financial instruments that are not quoted in an active market, the fair value is determined using valuation techniques including reference to recent arm’s length market transactions or transactions involving financial instruments which are substantially the same (level 2), or discounted cash flow analysis including, to the greatest possible extent, assumptions consistent with observable market data (level 3).
Fair value through other comprehensive income (FVTOCI)
Where the Company’s management has elected to present fair value gains and losses on equity investments in other comprehensive income, there is no subsequent reclassification of fair value gains and losses to profit or loss. Impairment losses (and reversal of impairment losses) on equity investments measured at FVTOCI are not reported separately from other changes in fair value.
Fair value through profit or loss
Changes in the fair value of equity investments at fair value through profit or loss are recognised in other income / (other expenses) in the statement of profit or loss as applicable.
Dividends from such investments continue to be recognised in profit or loss as other income when the Company’s right to receive payments is established.
Annual Report 2022
59Page

2.11 Financial liabilities – classification and measurement
Financial liabilities are classified as measured at amortized cost or FVTPL. A financial liability is classified as at FVTPL if it is classified as held-for-trading, it is a derivative or it is designated as such on initial recognition. Financial liabilities at FVTPL are measured at fair value and net gains and losses, including any interest expense, are recognized in profit or loss. Other financial liabilities are subsequently measured at amortized cost using the effective interest method. Interest expense and foreign exchange gains and losses are recognized in statement of profit or loss. Any gain or loss on de-recognition is also included in profit or loss.
2.12 Impairment of financial assets
The Company recognizes loss allowances for ECLs on:
- Financial assets measured at amortized cost; - Debt investments measured at FVTOCI; and - Contract assets.
The Company measures loss allowances at an amount equal to lifetime ECLs, except for the following, which are measured at 12-month ECLs:
- Debt securities that are determined to have low credit risk at the reporting date; and
- Other debt securities and bank balances for which credit risk (i.e., the risk of default occurring over the expected life of the financial instrument) has not increased significantly since initial recognition.
12-month ECLs are the portion of ECLs that result from default events that are possible within the 12
months after the reporting date (or a shorter period if the expected life of the instrument is less than 12 months).
When determining whether the credit risk of a financial asset has increased significantly since initial recognition and when estimating ECLs, the Company considers reasonable and supportable information that is relevant and available without undue cost or effort. This includes both quantitative and qualitative information and analysis, based on the Company’s historical experience and informed credit assessment and including forward-looking information.
The Company assumes that the credit risk on a financial asset has increased significantly if it is more than past due for a reasonable period of time. Lifetime ECLs are the ECLs that result from all possible default events over the expected life of a financial instrument. 12-month ECLs are the portion of ECLs that result from default events that are possible within the 12 months after the reporting date (or a shorter period if the expected life of the instrument is less than 12 months). The maximum period considered when estimating ECLs is the maximum contractual period over which the Company is exposed to credit risk.
The Company has elected to measure loss allowances for trade debts using IFRS 9 simplified approach and has calculated ECLs based on lifetime ECLs. The Company has established a matrix that is based on the Company's historical credit loss experience, adjusted for forward-looking factors specific to the debtors and the economic environment. When determining whether the credit risk of a financial asset has increased significantly since initial recognition and when estimating ECLs, the Company considers reasonable and supportable information that is relevant and available without undue cost or effort. This includes both quantitative and qualitative information and analysis, based on the Company's historical experience and informed credit assessment including forward-looking information.
Loss allowances for financial assets measured at amortized cost are deducted from the gross carrying amount of the assets.
The gross carrying amount of a financial asset is written off when the Company has no reasonable expectations of recovering of a financial asset in its entirety or a portion thereof. The Company individually makes an assessment with respect to the timing and amount of write-off based on whether
Nishat Mills Limited
60 Page
For the year ended June 30, 2022Notes to the Financial Statements

there is a reasonable expectation of recovery. The Company expects no significant recovery from the amount written off. However, financial assets that are written off could still be subject to enforcement activities in order to comply with the Company's procedures for recovery of amounts due.
At each reporting date, the Company assesses whether financial assets carried at amortised cost and debt securities at FVTOCI are credit-impaired. A financial asset is ‘credit-impaired’ when one or more events that have a detrimental impact on the estimated future cash flows of the financial asset have occurred.
Evidence that a financial asset is credit-impaired includes the following observable data:
- significant financial difficulty of the debtor; - a breach of contract such as a default; - the restructuring of a loan or advance by the Company on terms that the Company would not
consider otherwise; - it is probable that the debtor will enter bankruptcy or other financial reorganization; or - the disappearance of an active market for a security because of financial difficulties.
2.13 De-recognition of financial assets and financial liabilities
a) Financial assets
The Company derecognizes a financial asset when the contractual rights to the cash flows from the asset expire, or it transfers the rights to receive the contractual cash flows in a transaction in which substantially all of the risks and rewards of ownership of the financial asset are transferred, or it neither transfers nor retains substantially all of the risks and rewards of ownership and does not retain control over the transferred asset. Any interest in such derecognized financial assets that is created or retained by the Company is recognized as a separate asset or liability.
b) Financial liabilities
The Company derecognizes a financial liability (or a part of financial liability) from its statement of financial position when the obligation specified in the contract is discharged or cancelled or expires.
2.14 Offsetting of financial instruments
Financial assets and financial liabilities are set off and the net amount is reported in the financial statements when there is a legal enforceable right to set off and the Company intends either to settle on a net basis or to realize the assets and to settle the liabilities simultaneously.
2.15 Investment in subsidiaries
Investments in subsidiaries are stated at cost less impairment loss, if any, in accordance with the provisions of IAS 27 'Separate Financial Statements'.
2.16 Investment in associates - (with significant influence)
The Company is required to prepare separate financial statements, hence, in accordance with the requirements of IAS 27 'Separate Financial Statements', the investments in associates are accounted for in accordance with IFRS 9 'Financial Instruments’ and are classified as fair value through other comprehensive income (FVTOCI).
2.17 Inventories
Inventories, except for stock in transit and waste stock / rags, are stated at lower of cost and net realizable value. Cost is determined as follows:
Annual Report 2022
61Page

Stores, spare parts and loose tools
Useable stores, spare parts and loose tools are valued principally at moving average cost, while items considered obsolete are carried at nil value. Items in transit are valued at cost comprising invoice value plus other charges paid thereon.
Stock-in-trade
Cost of raw material, work-in-process and finished goods is determined as follows:
(i) For raw materials: Annual average basis. (ii) For work-in-process and finished goods: Average manufacturing cost including a portion of production overheads.
Materials in transit are valued at cost comprising invoice value plus other charges paid thereon. Waste stock / rags are valued at net realizable value.
Net realizable value signifies the estimated selling price in the ordinary course of business less the estimated costs of completion and the estimated costs necessary to make a sale.
2.18 Trade debts and other receivables
Trade debts are initially recognised at fair value and subsequently measured at amortised cost using the effective interest method, less any allowance for expected credit losses.
Other receivables are recognised at amortised cost, less any allowance for expected credit losses.
2.19 Non–current assets (or disposal groups) held for sale
Non-current assets (or disposal groups) are classified as assets held for sale when their carrying amount is to be recovered principally through a sale transaction and a sale is considered highly probable. They are stated at the lower of carrying amount and fair value less costs to sell.
2.20 Borrowings
Financing and borrowings are recognized initially at fair value and are subsequently stated at amortized cost. Any difference between the proceeds and the redemption value is recognized in the statement of profit or loss over the period of the borrowings using the effective interest method.
2.21 Borrowing cost
Interest, mark-up and other charges on long-term finances are capitalized up to the date of commissioning of respective qualifying assets acquired out of the proceeds of such long-term finances. All other interest, mark-up and other charges are recognized in statement of profit or loss.
2.22 Share capital
Ordinary shares are classified as share capital. Incremental costs directly attributable to the issue of new shares are shown in equity as a deduction, net of tax.
2.23 Trade and other payables
Liabilities for trade and other amounts payable are initially recognized at fair value, which is normally the transaction cost.
Nishat Mills Limited
62 Page
For the year ended June 30, 2022Notes to the Financial Statements

2.24 Revenue recognition
Sale of goods
Revenue from the sale of goods is recognised at the point in time when the customer obtains control of the goods, which is generally at the time of delivery.
Processing services
The Company provides processing services to local customers. These services are sold separately and the Company’s contract with the customer for services constitute a single performance obligation.
Revenue from services is recognized at the point in time, generally at the time of dispatch. There are no terms giving rise to variable consideration under the Company’s contracts with its customers.
Interest
Interest income is recognised as interest accrues using the effective interest method. This is a method of calculating the amortised cost of a financial asset and allocating the interest income over the relevant period using the effective interest rate, which is the rate that exactly discounts estimated future cash receipts through the expected life of the financial asset to the net carrying amount of the financial asset.
Rent
Rent revenue from investment properties is recognised on a straight-line basis over the lease term. Lease incentives granted are recognised as part of the rental revenue. Contingent rentals are recognised as income in the period when earned.
Sale of electricity
Revenue from sale of electricity is recognized at the time of transmission.
Dividend
Dividend on investments is recognized when right to receive the dividend is established.
Other revenue
Other revenue is recognised when it is received or when the right to receive payment is established.
2.25 Contract assets
Contract assets arise when the Company performs its performance obligations by transferring goods to a customer before the customer pays its consideration or before payment is due. Contract assets are treated as financial assets for impairment purposes.
2.26 Customer acquisition costs
Customer acquisition costs are capitalised as an asset where such costs are incremental to obtaining a contract with a customer and are expected to be recovered. Customer acquisition costs are amortised on a straight-line basis over the term of the contract.
Costs to obtain a contract that would have been incurred regardless of whether the contract was obtained or which are not otherwise recoverable from a customer are expensed as incurred to profit or loss. Incremental costs of obtaining a contract where the contract term is less than one year is immediately expensed to profit or loss.
Annual Report 2022
63Page

2.27 Customer fulfilment costs
Customer fulfilment costs are capitalised as an asset when all the following are met: (i) the costs relate directly to the contract or specifically identifiable proposed contract; (ii) the costs generate or enhance resources of the Company that will be used to satisfy future performance obligations; and (iii) the costs are expected to be recovered. Customer fulfilment costs are amortised on a straight-line basis over the term of the contract.
2.28 Right of return assets
Right of return assets represents the right to recover inventory sold to customers and is based on an estimate of customers who may exercise their right to return the goods and claim a refund. Such rights are measured at the value at which the inventory was previously carried prior to sale, less expected recovery costs and any impairment.
2.29 Contract liabilities
Contract liability is the obligation of the Company to transfer goods to a customer for which the Company has received consideration from the customer. If a customer pays consideration before the Company transfers goods, a contract liability is recognized when the payment is made. Contract liabilities are recognized as revenue when the Company performs its performance obligations under the contract.
2.30 Refund liabilities
Refund liabilities are recognised where the Company receives consideration from a customer and expects to refund some, or all, of that consideration to the customer. A refund liability is measured at the amount of consideration received or receivable for which the Company does not expect to be entitled and is updated at the end of each reporting period for changes in circumstances. Historical data is used across product lines to estimate such returns at the time of sale based on an expected value methodology.
2.31 Provisions
Provisions are recognized when the Company has a legal or constructive obligation as a result of past events and it is probable that an outflow of resources embodying economic benefits will be required to settle the obligations and a reliable estimate of the amount can be made.
2.32 Earnings per share
The Company presents earnings per share (EPS) data for its ordinary shares. EPS is calculated by dividing the profit or loss attributable to ordinary shareholders of the Company by the weighted average number of ordinary shares outstanding during the year.
2.33 Contingent assets
Contingent assets are disclosed when the Company has a possible asset that arises from past events and whose existence will only be confirmed by the occurrence or non-occurrence of one or more uncertain future events not wholly within the control of the Company. Contingent assets are not recognized until their realization becomes certain.
2.34 Contingent liabilities
Contingent liability is disclosed when the Company has a possible obligation as a result of past events whose existence will only be confirmed by the occurrence or non-occurrence of one or more uncertain future events not wholly within the control of the Company. Contingent liabilities are not recognized, only disclosed, unless the possibility of a future outflow of resources is considered remote. In the event that the outflow of resources associated with a contingent liability is assessed as probable, and if the size of the outflow can be reliably estimated, a provision is recognized in the financial statements.
Nishat Mills Limited
64 Page
For the year ended June 30, 2022Notes to the Financial Statements
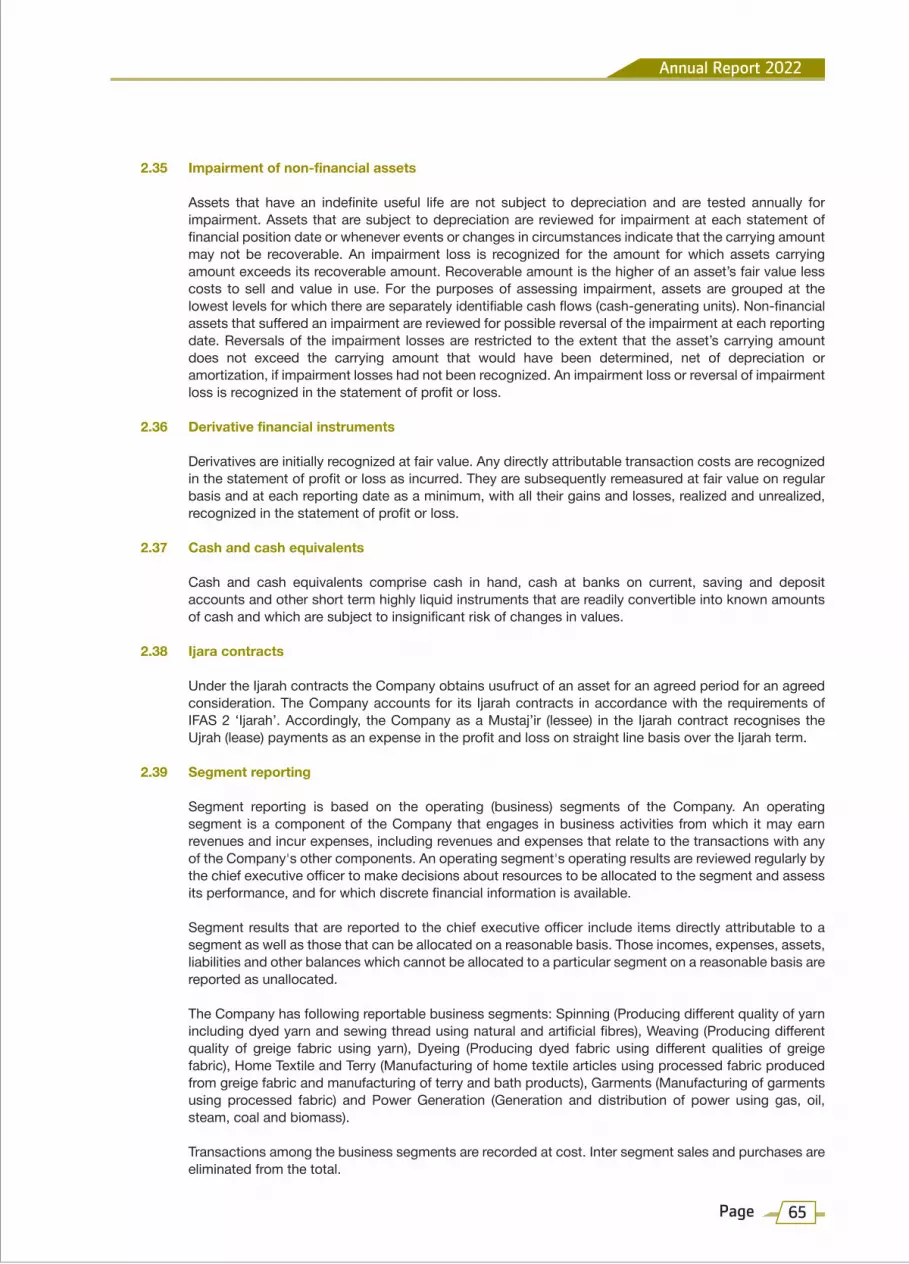
2.35 Impairment of non-financial assets
Assets that have an indefinite useful life are not subject to depreciation and are tested annually for impairment. Assets that are subject to depreciation are reviewed for impairment at each statement of financial position date or whenever events or changes in circumstances indicate that the carrying amount may not be recoverable. An impairment loss is recognized for the amount for which assets carrying amount exceeds its recoverable amount. Recoverable amount is the higher of an asset’s fair value less costs to sell and value in use. For the purposes of assessing impairment, assets are grouped at the lowest levels for which there are separately identifiable cash flows (cash-generating units). Non-financial assets that suffered an impairment are reviewed for possible reversal of the impairment at each reporting date. Reversals of the impairment losses are restricted to the extent that the asset’s carrying amount does not exceed the carrying amount that would have been determined, net of depreciation or amortization, if impairment losses had not been recognized. An impairment loss or reversal of impairment loss is recognized in the statement of profit or loss.
2.36 Derivative financial instruments
Derivatives are initially recognized at fair value. Any directly attributable transaction costs are recognized in the statement of profit or loss as incurred. They are subsequently remeasured at fair value on regular basis and at each reporting date as a minimum, with all their gains and losses, realized and unrealized, recognized in the statement of profit or loss.
2.37 Cash and cash equivalents
Cash and cash equivalents comprise cash in hand, cash at banks on current, saving and deposit accounts and other short term highly liquid instruments that are readily convertible into known amounts of cash and which are subject to insignificant risk of changes in values.
2.38 Ijara contracts
Under the Ijarah contracts the Company obtains usufruct of an asset for an agreed period for an agreed consideration. The Company accounts for its Ijarah contracts in accordance with the requirements of IFAS 2 ‘Ijarah’. Accordingly, the Company as a Mustaj’ir (lessee) in the Ijarah contract recognises the Ujrah (lease) payments as an expense in the profit and loss on straight line basis over the Ijarah term.
2.39 Segment reporting
Segment reporting is based on the operating (business) segments of the Company. An operating segment is a component of the Company that engages in business activities from which it may earn revenues and incur expenses, including revenues and expenses that relate to the transactions with any of the Company's other components. An operating segment's operating results are reviewed regularly by the chief executive officer to make decisions about resources to be allocated to the segment and assess its performance, and for which discrete financial information is available.
Segment results that are reported to the chief executive officer include items directly attributable to a segment as well as those that can be allocated on a reasonable basis. Those incomes, expenses, assets, liabilities and other balances which cannot be allocated to a particular segment on a reasonable basis are reported as unallocated.
The Company has following reportable business segments: Spinning (Producing different quality of yarn including dyed yarn and sewing thread using natural and artificial fibres), Weaving (Producing different quality of greige fabric using yarn), Dyeing (Producing dyed fabric using different qualities of greige fabric), Home Textile and Terry (Manufacturing of home textile articles using processed fabric produced from greige fabric and manufacturing of terry and bath products), Garments (Manufacturing of garments using processed fabric) and Power Generation (Generation and distribution of power using gas, oil, steam, coal and biomass).
Transactions among the business segments are recorded at cost. Inter segment sales and purchases are eliminated from the total.
Annual Report 2022
65Page

2.40 Government grants
Grants from the government are recognised at their fair value where there is a reasonable assurance that the grant will be received and the Company will comply with all attached conditions.
Government grants relating to costs are deferred and recognised in the profit or loss over the period necessary to match them with the costs that they are intended to compensate.
Government grants relating to the purchase of property, plant and equipment are included in non-current liabilities as deferred income and are credited to profit or loss over the expected lives of the related assets.
2.41 Dividend and other appropriations
Dividend distribution to the Company's shareholders is recognized as a liability in the Company's financial statements in the period in which the dividends are declared and other appropriations are recognized in the period in which these are approved by the Board of Directors.
3 ISSUED, SUBSCRIBED AND PAID-UP SHARE CAPITAL
2022 2021 2022 2021 (Number of Shares) Note (Rupees in thousand)
270,446,606 270,446,606 Ordinary shares of Rupees 10 each fully paid-up in cash 2,704,466 2,704,466
2,804,079 2,804,079 Ordinary shares of Rupees 10 each issued to shareholders of Nishat Apparel Limited under the Scheme of Amalgamation 28,041 28,041
23,577,990 23,577,990 Ordinary shares of Rupees 10 each issued as fully paid for consideration other than cash 3.1 235,780 235,780
54,771,173 54,771,173 Ordinary shares of Rupees 10 each issued as fully paid bonus shares 547,712 547,712
351,599,848 351,599,848 3,515,999 3,515,999
3.1 These mainly include shares issued to members of Umer Fabrics Limited as per the Scheme of Arrangement as approved by the Honourable Lahore High Court, Lahore.
3.2 Ordinary shares of the Company held by the associated companies:
2022 2021 (Number of Shares)
D.G. Khan Cement Company Limited 30,289,501 30,289,501 Adamjee Insurance Company Limited 2,050 2,050 MCB Bank Limited 227 227 Adamjee Life Assurance Company Limited 231,815 400 Nishat (Aziz Avenue) Hotels and Properties Limited 342,500 275,000 Nishat Real Estates Development Company (Private) Limited 127,000 - 30,993,093 30,567,178
Nishat Mills Limited
66 Page
For the year ended June 30, 2022Notes to the Financial Statements
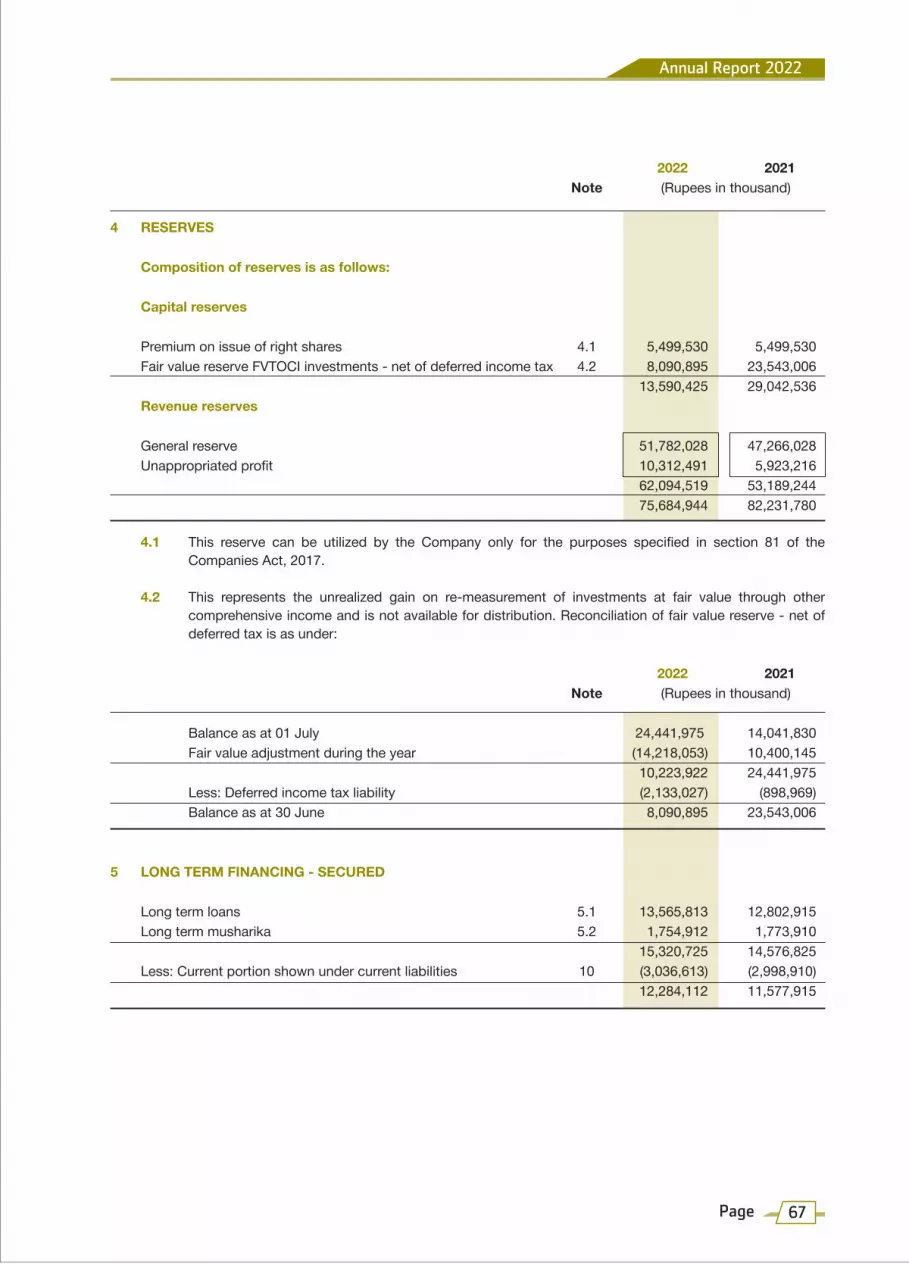
2022 2021 Note (Rupees in thousand)
4 RESERVES
Composition of reserves is as follows:
Capital reserves
Premium on issue of right shares 4.1 5,499,530 5,499,530 Fair value reserve FVTOCI investments - net of deferred income tax 4.2 8,090,895 23,543,006 13,590,425 29,042,536 Revenue reserves
General reserve 51,782,028 47,266,028 Unappropriated profit 10,312,491 5,923,216 62,094,519 53,189,244 75,684,944 82,231,780
4.1 This reserve can be utilized by the Company only for the purposes specified in section 81 of the Companies Act, 2017.
4.2 This represents the unrealized gain on re-measurement of investments at fair value through other comprehensive income and is not available for distribution. Reconciliation of fair value reserve - net of deferred tax is as under:
2022 2021 Note (Rupees in thousand)
Balance as at 01 July 24,441,975 14,041,830 Fair value adjustment during the year (14,218,053) 10,400,145 10,223,922 24,441,975 Less: Deferred income tax liability (2,133,027) (898,969) Balance as at 30 June 8,090,895 23,543,006
5 LONG TERM FINANCING - SECURED
Long term loans 5.1 13,565,813 12,802,915 Long term musharika 5.2 1,754,912 1,773,910 15,320,725 14,576,825 Less: Current portion shown under current liabilities 10 (3,036,613) (2,998,910) 12,284,112 11,577,915
Annual Report 2022
67Page

Lender 2022 2021 InterestRepricing
InterestPayable
Rate ofInterest Per
Annum
Number ofInstallments Security
(Rupees in thousand)
5.1 Long term loans
Two hundred and - Quarterlytwenty unequal installments commenced on 27 March 2018 andending on 05 June 2024(Note 5.3).
First pari passu hypothecation charge of Rupees 1,334 million over all present and future plant, machinery and equipment of the Company (excluding plant and machinery in respect of which the Company has already created exclusive charges in the favour of its existing creditors).
SBP rate for LTFF
+ 0.25%
Allied Bank 371,805 571,582Limited
First pari passu charge of Rupees 1,267 million over all present and future plant, machinery and equipment of the Company (excluding plant and machinery in respect of which the Company has already created exclusive charges in the favour of its existing charge holders / creditors).
Four hundred and - Quarterlyeighty four unequal installments commenced on 28 December 2018and ending on13 July 2025(Note 5.3).
First pari passu charge of Rupees 1,334 million (inclusive of 25% margin on all present and future plant and machinery of the Company).
SBP rate for LTFF
+ 0.25%
Allied Bank 543,054 739,561Limited
Two hundred and - Quarterlytwenty unequal installments commenced on 26 January 2020 andending on17 September 2026(Note 5.3).
First pari passu charge of Rupees 1,267 million over all present and future plant, machinery and equipment of the Company (excluding plant and machinery in respect of which the Company has already created exclusive charges in the favour of its existing creditors).
SBP rate for LTFF
+ 0.25%
Allied Bank 688,122 869,087Limited
Twenty four unequal - Quarterlyinstallments commenced on01 January 2021 and ending on16 November 2022(Note 5.4).
First pari passu hypothecation charge of Rupees 1,334 million over all the present and future plant, machinery and equipment of the Company (excluding plant and machinery in respect of which the Company has already created exclusive charges in favour of its existing creditors).
SBP rate for refinance
scheme for payment of salaries and
wages+ 0.50%
Allied Bank 246,620 716,713Limited
Sixty unequal - Quarterlyinstallments commenced on24 January 2022 andending on28 October 2026.
SBP rate for LTFF
+ 0.35%
Allied Bank 200,444 222,715Limited
Four hundred and - Quarterlyforty three unequalinstallmentscommenced on18 May 2021 and ending on11 February 2027.
SBP rate for LTFF
+ 0.50%
Twenty equal - Quarterlyquarterly installments commenced on14 May 2021 andending on14 February 2026.
SBP rate for financing
power plants using
renewable energy
+ 0.50%
480,062 545,572
75,000 95,000
755,506 863,287
Nishat Mills Limited
68 Page
For the year ended June 30, 2022Notes to the Financial Statements

Lender 2022 2021 InterestRepricing
InterestPayable
Rate ofInterest Per
Annum
Number ofInstallments Security
(Rupees in thousand)
Two hundred and - Quarterlyforty unequal installmentscommenced on23 February 2022 andending on 16 July 2027.
First pari passu hypothecation charge of Rupees 467 million over all present and future plant, machinery and equipment (excluding all exclusive charges over plant and machinery) of the Company.
SBP rate for LTFF
+ 0.65%
Askari Bank 301,187 315,989Limited
One hundred unequal - Quarterlyinstallments commenced on23 December 2021and ending on21 October 2026.
First pari passu hypothecation charge of Rupees 1,334 million on all present and future plant and machinery (excluding plant and machinery in respect of which the Company has already created exclusive charges in favour of its existing charge holders).
SBP ratefor LTFF + 0.50%
Bank Alfalah 187,278 218,714Limited
Sixty unequal - Quarterlyinstallments commencing on28 August 2022 andending on15 July 2027(Note 5.6).
SBP ratefor TERF+ 1.00%
Bank Alfalah 838,420 761,853Limited
Faysal Bank 79,438 119,156Limited
Twenty unequal - Quarterlyinstallments commenced on22 November 2018and ending on24 May 2024(Note 5.3).
First pari passu charge of Rupees 267 million on all present and future plant and machinery of the Company (excluding those on which charge has already been created).
SBP ratefor LTFF + 0.30%
Faysal Bank 207,453 266,725Limited
Eighty unequal - Quarterlyinstallments commenced on18 January 2020 andending on05 November 2025(Note 5.3).
First pari passu charge of Rupees 400 million on all present and future plant and machinery (excluding plant and machinery in respect of which the Company has already created exclusive charges in the favour of existing creditors).
SBP ratefor LTFF + 0.30%
First pari passu charge of Rupees 1,334 million on all present and future plant and machinery (excluding plant and machinery in respect of which the Company has already created exclusive charges in the favour of existing creditors).
Two hundred and - Quarterlysixty unequal installments commenced on 02 February 2018 andending on05 January 2024(Note 5.3).
SBP rate for LTFF
+ 0.35%
Bank Alfalah 136,196 226,101Limited
Two hundred - Quarterlyunequal installmentscommenced on10 June 2018 andending on25 May 2024(Note 5.3).
SBP rate for LTFF
+ 0.35%
Bank Alfalah 212,650 322,399Limited
First pari passu hypothecation charge of Rupees 400 million over all present and future plant and machinery of the Company.
Twenty equal quarterly - Quarterlyinstallments commenced on 31 August 2018 andending on31 May 2024(Note 5.3).
SBP ratefor LTFF+ 0.35%
Bank Alfalah 112,364 168,547Limited
Annual Report 2022
69Page

Lender 2022 2021 InterestRepricing
InterestPayable
Rate ofInterest Per
Annum
Number ofInstallments Security
(Rupees in thousand)
Twenty unequal - Quarterlyquarterly installments commenced on 27 February 2020 andending on27 November 2025(Note 5.3).
SBP ratefor LTFF+ 0.25%
Habib Bank 519,726 668,592Limited
Twenty equal quarterly - Quarterlyinstallments commenced on 27 February 2020 andending on27 November 2025.
First pari passu charge of Rupees 4,084 million over all present and future plant, machinery and equipment of the Company (excluding plant and machinery in respect of which the Company has already created exclusive charges in the favour of its existing creditors).
SBP rate for financing
power plants using
renewable energy
+ 0.25%
141,406 192,827
661,132 861,419
One hundred and - Quarterlytwenty unequal installmentscommenced on12 April 2017 and ending on03 June 2023(Note 5.3).
First pari passu hypothecation charge of Rupees 534 million on all present and future plant and machinery (excluding plant and machinery which is under exclusive charges in favour of creditors).
SBP rate for LTFF+ 0.50%
National Bank 17,275 39,028of Pakistan
One hundred and - Quarterlyninety two unequal installments commencing on17 September 2023and ending on04 October 2031.
First pari passu hypothecation charge of Rupees 1,334 million on present and future plant and machinery (excluding plant and machinery in respect of which the Company has already created exclusive charges in favour of its existing charges holders / creditors).
SBP rate for TERF
+ 0.50%
National Bank 800,000 139,545of Pakistan
One hundred unequal - Quarterlyinstallments commenced on 24 September 2021 and ending on 22 July 2026.
First pari passu hypothecation charge of Rupees 1,334 million over plant and machinery (excluding plant and machinery in respect of which the Company has already created exclusive charges in favour of its existing charge holders).
SBP ratefor LTFF+ 0.65%
Habib 804,684 997,499MetropolitanBank Limited
One hundred and - Quarterlytwenty eight unequal installmentscommencing on19 July 2023 andending on 29 July 2031(Note 5.6).
First pari passu hypothecation charge of Rupees 1,334 million over plant and machinery of the Company.
SBP ratefor TERF+ 0.85%
Habib 967,524 842,390MetropolitanBank Limited
One hundred and - Quarterlyeighty unequal installments commenced on 17 September 2017and ending on 25 November 2023(Note 5.3).
First pari passu hypothecation charge of Rupees 4,000 million on all present and future fixed assets of the Company excluding specific and exclusive charges.
SBP ratefor LTFF+ 0.40%
Habib Bank 229,844 424,904Limited
Eleven hundred and - Quarterlysixty four unequal installmentscommencing on 28 November 2023and ending on22 April 2032.
SBP rate for LTFF
+ 0.75%
Habib Bank 1,817,072 -Limited
Nishat Mills Limited
70 Page
For the year ended June 30, 2022Notes to the Financial Statements

Lender 2022 2021 InterestRepricing
InterestPayable
Rate ofInterest Per
Annum
Number ofInstallments Security
(Rupees in thousand)
Three hundred and - Quarterlytwenty unequalinstallments commenced on 30 August 2018 and ending on 28 December 2024(Note 5.3).
First pari passu charge of Rupees 400 million over all the present and future plant and machinery of the Company with 25% margin excluding those assets (part of the plant and machinery) on which the Company has created exclusive charges in favour of existing creditors.
SBP rate for LTFF+ 0.25%
Pak Brunei 128,314 188,286InvestmentCompany Limited
One hundred and - Quarterlysixty unequal installments commenced on11 June 2016 andending on26 January 2023(Note 5.3).
First pari passu charge of Rupees 400 million on all present and future plant and machinery of the Company with 25% margin.
Ranking hypothecation charge of Rupees 267 million on plant and machinery of the Company (excluding plant and machinery in respect of which the Company has already created exclusive charges in favour of its existing charge holders / creditors).
SBP rate for LTFF+ 1.00%
Pakistan Kuwait 9,677 35,679InvestmentCompany (Private)Limited
Two hundred and fifty - Quarterlyunequal installmentscommenced on15 September 2016and ending on 29 September 2023(Note 5.3).
SBP rate for LTFF+ 0.75%
8,079 14,807
17,756 50,486
Seventy two unequal - Quarterlyinstallments commenced on10 May 2021 andending on13 January 2028.
First pari passu hypothecation charge of Rupees 1,334 million on all present and future plant and machinery (excluding plant and machinery in respect of which the Company has already created exclusive charges in favour of its existing charge holders / creditors) of the Company with 25% margin.
SBP rate for LTFF
+ 0.65%
Pakistan Kuwait 875,525 981,040InvestmentCompany (Private)Limited
One hundred and sixty - Quarterlyunequal installments commenced on 30 January 2017 and ending on07 April 2023(Note 5.3).
First pari passu charge of Rupees 667 million on all present and future plant and machinery (other than the specific machinery against which exclusive charges have already been created in favour of existing charge holders) of the Company.
SBP rate for LTFF
+ 0.50%
The Bank 53,412 146,755of Punjab
Five hundred and - Quarterlyseventy five unequalinstallmentscommencing on08 July 2023 and ending on 02 September 2031(Note 5.6).
First pari passu hypothecation charge of Rupees 3,000 million over all present and future plant and machinery (excluding those assets over which exclusive charges has already been created in favour of existing creditors) of the Company.
3 Monthoffer
KIBOR+ 1.25%
United Bank - 110,980Limited
- QuarterlySBP ratefor TERF+ 1.25%
2,202,202 1,860,869
2,202,202 1,971,849
Annual Report 2022
71Page

Lender 2022 2021 InterestRepricing
InterestPayable
Rate ofInterest Per
Annum
Number ofInstallments Security
(Rupees in thousand)
One hundred and - Quarterlyninety three unequal installments commencing on29 July 2024 and ending on08 June 2032.
First pari passu charge of Rupees 2,200 million over present and future plant, machinery and equipment of the Company (excluding plant and machinery in respect of which the Company has already created exclusive charges in favour of its existing charge holders / creditors).
SBP rate for LTFF
+ 0.90%
Pakistan Kuwait 309,550 -Investment Company(Private) Limited
Thirty two equal - Quarterlyquarterly installmentscommencing on30 September 2024and ending on28 June 2032.
Ranking hypothecation charge of Rupees 667 million on all present and future plant and machinery (excluding plant and machinery in respect of which the Company has already created exclusive charges in favour of its existing charge holders / creditors) of the Company with 25% margin.
3 Month offer KIBOR
+ 0.90%
1,430 -
310,980 -
13,565,813 12,802,915
Eight equal quarterly - Quarterlyinstallments commenced on30 March 2021 andending on30 December 2022(Note 5.5).
First pari passu charge of Rupees 1,333 million over all the present and future plant, machinery and equipment of the Company (excluding plant and machinery in respect of which the Company has already created exclusive charges in favour of its existing creditors).
SBP rate for Islamic
refinance scheme for payment of salaries and
wages + 0.50%
Faysal Bank 243,782 707,633Limited
Two hundred and - Quarterlysixty five unequal installments commenced on24 March 2022 andending on10 August 2027.
SBP rate for ILTFF
+ 0.70%
Faysal Bank 1,005,729 803,328Limited
Ninety unequal - Quarterlyinstallmentscommencing on07 July 2022 andending on28 February 2028.
SBP rate for islamic
renewable energy
financing scheme+ 0.70%
505,401 262,949
1,511,130 1,066,277 1,754,912 1,773,910
15,320,725 14,576,825
5.2 Long term musharika
5.3 Repayment period includes deferment of repayment of principal loan amount by one year in accordance with the State Bank of Pakistan BPRD Circular Letter No. 13 of 2020 dated 26 March 2020.
5.4 This long term loan is obtained by the Company under SBP Refinance Scheme for payment of Salaries and Wages . This is recognized and measured in accordance with IFRS 9 'Financial Instruments'. Fair value adjustment is recognized at discount rates ranging from 6.87% to 7.36% per annum.
5.5 This long term musharika is obtained by the Company under SBP Islamic Refinance Scheme for payment of Salaries and Wages. This is recognized and measured in accordance with IFRS 9 'Financial Instruments'. Fair value adjustment is recognized at discount rates ranging from 7.45% to 7.49% per annum.
5.6 These loans are obtained by the Company under SBP Temporary Economic Refinance Facility (TERF). These are recognized and measured in accordance with IFRS 9 'Financial Instruments'. Fair value adjustment is recognized at discount rates ranging from 2.34% to 2.60% per annum.
Nishat Mills Limited
72 Page
For the year ended June 30, 2022Notes to the Financial Statements

2022 2021 Note (Rupees in thousand)
6 DEFERRED LIABILITIES
Deferred income tax 6.1 2,133,027 898,969 Gas Infrastructure Development Cess (GIDC) payable 6.2 - 78,039 Deferred income - Government grant 6.3 58,032 78,984 2,191,059 1,055,992
6.1 This represents deferred income tax liability on unrealized gain on remeasurement of investments at fair value through other comprehensive income. Provision for deferred income tax on other temporary differences was not considered necessary as the Company is chargeable to tax under section 169 of the Income Tax Ordinance, 2001.
6.2 Gas Infrastructure Development Cess (GIDC) Payable
2022 2021 Note (Rupees in thousand)
Opening balance 1,204,234 - Add: Gas Infrastructure Development Cess payable at amortized cost - 1,299,041 Add: Adjustment due to impact of IFRS 9 33 36,096 73,562 Less: Payments made during the year - (168,369) 1,240,330 1,204,234 Less: Current portion shown under current liabilities 10 (1,240,330) (1,126,195) - 78,039
6.2.1 This represents Gas Infrastructure Development Cess (GIDC) that was levied through GIDC Act, 2015. During the year ended 30 June 2021, Honourable Supreme Court of Pakistan upheld the GIDC Act, 2015 to be constitutional and intra vires. The Company has filed a review petition in Honourable Sindh High Court, Karachi which is pending adjudication. GIDC payable is recognized at amortized cost in accordance with IFRS 9.
2022 2021 Note (Rupees in thousand) 6.3 Deferred income - Government grant Opening balance 160,002 - Add: Government grant recognized during the year 5,406 253,819 Less: Amortized during the year (81,870) (93,817) 83,538 160,002 Less: Current portion shown under current liabilities 10 (25,506) (81,018) 58,032 78,984
6.3.1 The State Bank of Pakistan (SBP), through its Circular No. 01 and 02 of 2020 dated 17 March 2020 and Circular No. 09 of 2020 dated 08 May 2020 introduced a Temporary Economic Refinance Facility (TERF) for setting of new industrial units and for undertaking Balancing, Modernization and Replacement and / or expansion of projects / businesses and through Circular No. 06 of 2020 dated 10 April 2020 introduced a Refinance Scheme for payment of wages and salaries to the workers and employees of business concerns. These refinances were available through Banks / DFIs. One of the key feature of these refinance facilities is that the borrowers obtained loans at mark-up rates that were below normal lending
Annual Report 2022
73Page
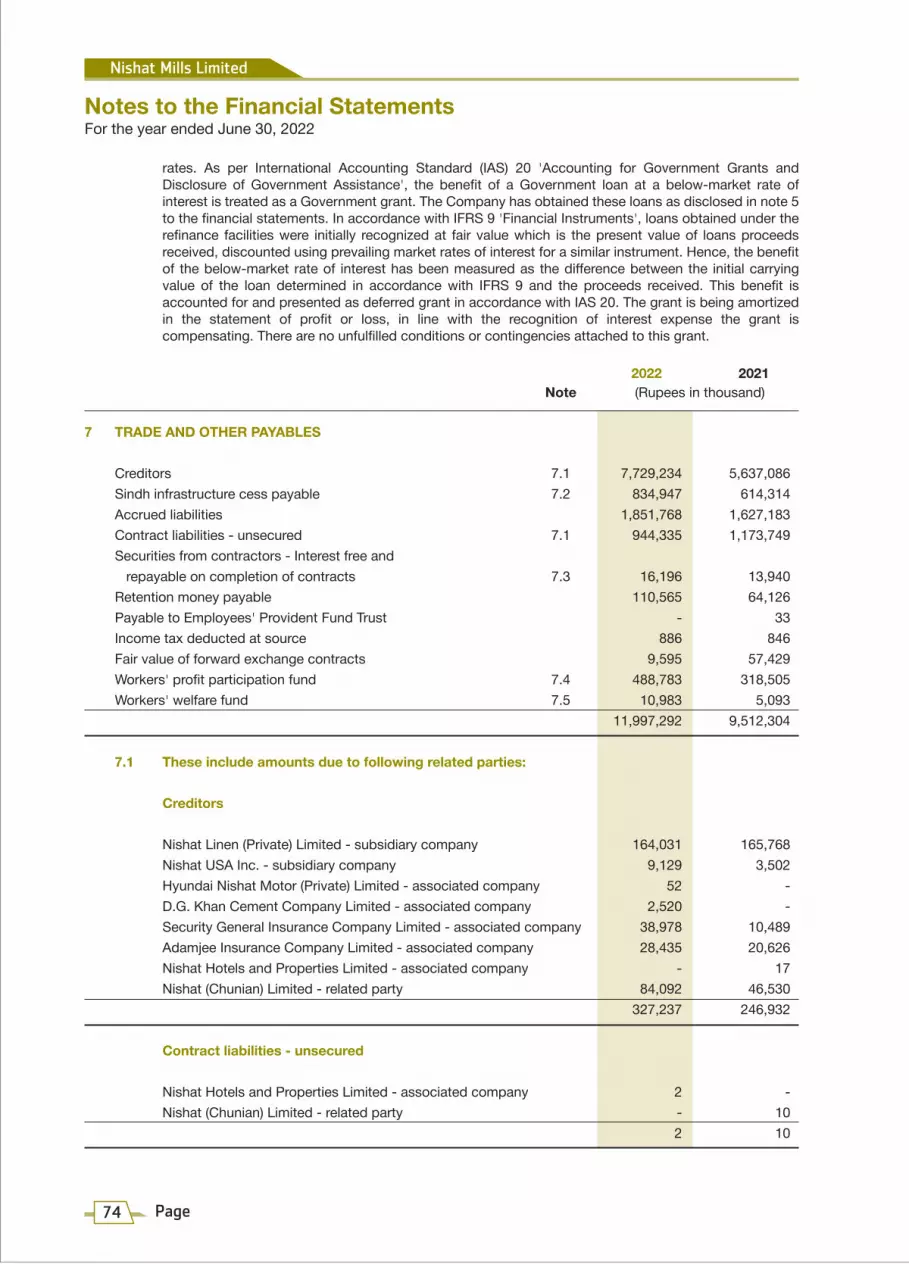
rates. As per International Accounting Standard (IAS) 20 'Accounting for Government Grants and Disclosure of Government Assistance', the benefit of a Government loan at a below-market rate of interest is treated as a Government grant. The Company has obtained these loans as disclosed in note 5 to the financial statements. In accordance with IFRS 9 'Financial Instruments', loans obtained under the refinance facilities were initially recognized at fair value which is the present value of loans proceeds received, discounted using prevailing market rates of interest for a similar instrument. Hence, the benefit of the below-market rate of interest has been measured as the difference between the initial carrying value of the loan determined in accordance with IFRS 9 and the proceeds received. This benefit is accounted for and presented as deferred grant in accordance with IAS 20. The grant is being amortized in the statement of profit or loss, in line with the recognition of interest expense the grant is compensating. There are no unfulfilled conditions or contingencies attached to this grant.
2022 2021 Note (Rupees in thousand)
7 TRADE AND OTHER PAYABLES
Creditors 7.1 7,729,234 5,637,086 Sindh infrastructure cess payable 7.2 834,947 614,314 Accrued liabilities 1,851,768 1,627,183 Contract liabilities - unsecured 7.1 944,335 1,173,749 Securities from contractors - Interest free and repayable on completion of contracts 7.3 16,196 13,940 Retention money payable 110,565 64,126 Payable to Employees' Provident Fund Trust - 33 Income tax deducted at source 886 846 Fair value of forward exchange contracts 9,595 57,429 Workers' profit participation fund 7.4 488,783 318,505 Workers' welfare fund 7.5 10,983 5,093 11,997,292 9,512,304
7.1 These include amounts due to following related parties:
Creditors Nishat Linen (Private) Limited - subsidiary company 164,031 165,768 Nishat USA Inc. - subsidiary company 9,129 3,502 Hyundai Nishat Motor (Private) Limited - associated company 52 - D.G. Khan Cement Company Limited - associated company 2,520 - Security General Insurance Company Limited - associated company 38,978 10,489 Adamjee Insurance Company Limited - associated company 28,435 20,626 Nishat Hotels and Properties Limited - associated company - 17 Nishat (Chunian) Limited - related party 84,092 46,530 327,237 246,932
Contract liabilities - unsecured
Nishat Hotels and Properties Limited - associated company 2 - Nishat (Chunian) Limited - related party - 10 2 10
Nishat Mills Limited
74 Page
For the year ended June 30, 2022Notes to the Financial Statements

2022 2021 (Rupees in thousand)
7.2 Sindh infrastructure cess payable
Balance as at 01 July 614,314 521,840 Add: Provision made during the year 220,633 92,474 Balance as at 30 June 834,947 614,314
7.2.1 This represents provision for infrastructure cess imposed by the Province of Sindh through Sindh Finance Act, 1994 and its subsequent versions including the final version i.e. Sindh Development and Maintenance of Infrastructure Cess Act, 2017. The Company filed writ petition in Honourable Sindh High Court, Karachi whereby stay was granted and directions were given to provide bank guarantees in favor of Director Excise and Taxation, Karachi. The Honourable Sindh High Court, Karachi passed order dated 04 June 2021 against the Company and directed that bank guarantees should be encashed. Being aggrieved by the order, the Company along with others filed petitions for leave to appeal before Honourable Supreme Court of Pakistan against the Sindh High Court’s judgment in relation to Sindh infrastructure development cess. On 01 September 2021, after hearing the petitioners, the Honourable Supreme Court dictated the order in open court granting leave to appeal to the petitioners and restraining the Sindh Government from encashing the bank guarantees furnished in pursuance of the interim orders passed by the Sindh High Court. The Honourable Supreme Court also direct the release of future consignments subject to furnishing of bank guarantees for the disputed amount.
7.3 These deposits have been utilized for the purpose of business in accordance with the terms of written agreements with contractors.
2022 2021 Note (Rupees in thousand)
7.4 Workers' profit participation fund
Balance as on 01 July 318,505 203,916 Add: Provision for the year 31 483,116 318,505 Add: Interest for the year 33 6,673 179 808,294 522,600 Less: Payments during the year (319,511) (204,095) Balance as on 30 June 488,783 318,505
7.4.1 Interest is paid at prescribed rate under the Companies Profits (Workers Participation) Act, 1968 on funds utilized by the Company till the date of allocation to workers.
2022 2021 Note (Rupees in thousand) 7.5 Workers welfare fund
Balance as on 01 July 5,093 - Add: Provision for the year 31 5,890 5,093 Balance as on 30 June 10,983 5,093
Annual Report 2022
75Page

2022 2021 Note (Rupees in thousand)
8 ACCRUED MARK-UP
Long term financing 98,826 73,458 Short term borrowings 8.1 277,897 122,924 376,723 196,382
8.1 This includes mark-up of Rupees 6.044 million (2021: Rupees 1.637 million) payable to MCB Bank Limited - associated company.
2022 2021 Note (Rupees in thousand)
9 SHORT TERM BORROWINGS
From banking companies - secured
State Bank of Pakistan (SBP) refinance 9.1 & 9.3 21,474,683 17,503,652 Other short term finances 9.1 & 9.4 3,681,692 - Temporary bank overdrafts 9.1, 9.2 & 9.5 1,573,673 1,214,610 26,730,048 18,718,262
9.1 These finances are obtained from banking companies under mark up arrangements and are secured against joint pari passu hypothecation charge on all present and future current assets, other instruments and ranking hypothecation charge on plant and machinery of the Company.
9.2 These finances includes balance of Rupees 928.127 million (2021: 278.182 million) with MCB Bank Limited – associated company, which has been utilized for working capital requirements.
9.3 The rates of mark up range from 1.00% to 10.49% (2021: 2.20% to 3.00%) per annum during the year on the balance outstanding.
9.4 The rates of mark up range from 7.80% to 14.41% (2021: 1.87% to 8.52%) per annum during the year on the balance outstanding.
9.5 The rates of mark up range from 7.47% to 15.31% (2021: 7.05% to 9.28%) per annum during the year on the balance outstanding.
2022 2021 Note (Rupees in thousand)
10 CURRENT PORTION OF NON-CURRENT LIABILITIES
Current portion of long term financing - secured 5 3,036,613 2,998,910 Current portion of GIDC payable 6.2 1,240,330 1,126,195 Current portion of deferred income - Government grant 6.3 25,506 81,018 4,302,449 4,206,123
11 UNCLAIMED DIVIDEND
101,928 97,617
Nishat Mills Limited
76 Page
For the year ended June 30, 2022Notes to the Financial Statements

12 CONTINGENCIES AND COMMITMENTS
a) Contingencies
i) Guarantees of Rupees 4,045.687 million (2021: Rupees 3,438.360 million) are given by the banks of the Company to Sui Northern Gas Pipelines Limited against gas connections, Shell Pakistan Limited and Pakistan State Oil Limited against purchase of furnace oil, Director Excise and Taxation, Karachi against infrastructure cess, Chairman Punjab Revenue Authority, Lahore against infrastructure cess, Directorate of Cotton Cess Management against cotton cess, Collector of Customs against regulatory duty, Inspector General Frontier Corps KP (South) and The President of Islamic Republic of Pakistan through the Controller of Military Accounts (Defence Purchase) against fulfillment of sales orders, High Court of Sindh, Karachi against the matter of importation of LED lights and to the bank of Hyundai Nishat Motor (Private) Limited (associated company) to secure financial assistance to the associated company. Further, the Company has issued cross corporate guarantees of Rupees 1,173.333 million (2021: Rupees 1,173.333 million), Rupees 41.60 million (2021: Rupees 41.60 million) and Rupees 1,750 million (2021: Rupees 1,750) on behalf of Nishat Linen (Private) Limited - wholly owned subsidiary company, Nishat Hospitality (Private) Limited - wholly owned subsidiary company and Nishat Sutas Dairy Limited - associated company respectively to secure the obligations of subsidiary companies and associated company towards their lenders.
ii) Post dated cheques of Rupees 13,356.688 million (2021: Rupees 10,758.912 million) are issued to customs authorities in respect of duties on imported items availed on the basis of consumption and export plans. If documents of exports are not provided on due dates, cheques issued as security shall be encashable.
iii) Post dated cheques of Rupees 122.180 million (2021: Rupees 122.180 million) are issued to Sui Northern Gas Pipeline Limited in pursuance of order of Lahore High Court, Lahore in the case of gas infrastructure development cess. Further, post dated cheques of Rupees 2.140 million are issued to Lahore Electric Supply Company Limited in pursuance of order of Lahore High Court, Lahore in the case of income tax on electricity bills for the month of July 2021.
b) Commitments
i) Contracts for capital expenditure are approximately of Rupees 2,277.395 million (2021: Rupees 3,469.028 million).
ii) Letters of credit other than for capital expenditure are of Rupees 2,788.575 million (2021: Rupees 4,219.586 million).
iii) Outstanding foreign currency forward contracts of Rupees 1,332.998 million (2021: Rupees 6,400.041 million).
2022 2021 Note (Rupees in thousand)
13 PROPERTY, PLANT AND EQUIPMENT
Operating fixed assets 13.1 34,938,589 29,713,681 Capital work-in-progress 13.2 4,827,734 6,212,913 39,766,323 35,926,594
Annual Report 2022
77Page

At 3
0 Ju
ne 2
020
Cos
t 1
,837
,056
11
,885
,766
38
,267
,071
1,
017,
736
431,
555
454,
609
257,
245
721,
108
54,8
72,1
46Ac
cum
ulat
ed d
epre
ciat
ion
- (5
,580
,938
) (1
8,70
2,57
3)
(652
,051
) (2
62,0
64)
(274
,701
) (2
07,4
83)
(357
,475
) (2
6,03
7,28
5)N
et b
ook
valu
e 1,
837,
056
6,30
4,82
8 19
,564
,498
36
5,68
5 16
9,49
1 17
9,90
8 49
,762
36
3,63
3 28
,834
,861
Year
end
ed 3
0 Ju
ne 2
021
Ope
ning
net
boo
k va
lue
1,
837,
056
6,30
4,82
8 19
,564
,498
36
5,68
5 16
9,49
1 17
9,90
8 49
,762
36
3,63
3 28
,834
,861
Addi
tions
20
,823
51
5,12
9 3,
135,
514
31,5
70
17,1
96
38,7
65
23,4
53
186,
739
3,96
9,18
9Re
vers
al o
f pro
visi
on
(98,
528)
-
- -
- -
- -
(98,
528)
Tran
sfer
red
to in
vest
men
t pro
perti
es:
C
ost
(19,
541)
(9
9,41
0)
- -
- -
- -
(118
,951
)
Accu
mul
ated
dep
reci
atio
n -
90,1
55
- -
- -
- -
90,1
55
(1
9,54
1)
(9,2
55)
- -
- -
- -
(28,
796)
Dis
posa
ls:
C
ost
(62,
001)
-
(142
,994
) -
- -
(1,9
86)
(78,
346)
(2
85,3
27)
Ac
cum
ulat
ed d
epre
ciat
ion
- -
118,
234
- -
- 1,
583
46,0
56
165,
873
(62,
001)
-
(24,
760)
-
- -
(403
) (3
2,29
0)
(119
,454
)
Dep
reci
atio
n ch
arge
-
(651
,571
) (2
,020
,417
) (3
8,03
1)
(17,
857)
(1
9,81
6)
(18,
358)
(7
7,54
1)
(2,8
43,5
91)
Clo
sing
net
boo
k va
lue
1,67
7,80
9 6,
159,
131
20,6
54,8
35
359,
224
168,
830
198,
857
54,4
54
440,
541
29,7
13,6
81
At 3
0 Ju
ne 2
021
Cos
t 1
,677
,809
12
,301
,485
41
,259
,591
1,
049,
306
448,
751
493,
374
278,
712
829,
501
58,3
38,5
29Ac
cum
ulat
ed d
epre
ciat
ion
- (6
,142
,354
) (2
0,60
4,75
6)
(690
,082
) (2
79,9
21)
(294
,517
) (2
24,2
58)
(388
,960
) (2
8,62
4,84
8)N
et b
ook
valu
e 1,
677,
809
6,15
9,13
1 20
,654
,835
35
9,22
4 16
8,83
0 19
8,85
7 54
,454
44
0,54
1 29
,713
,681
Year
end
ed 3
0 Ju
ne 2
022
Ope
ning
net
boo
k va
lue
1,67
7,80
9 6,
159,
131
20,6
54,8
35
359,
224
168,
830
198,
857
54,4
54
440,
541
29,7
13,6
81Ad
ditio
ns
134,
933
1,13
5,49
7 6,
606,
176
267,
315
67,7
96
155,
713
27,1
15
194,
306
8,58
8,85
1D
ispo
sals
:
Cos
t -
- (2
39,5
62)
- -
(175
) (2
,116
) (1
01,2
92)
(343
,145
)
Accu
mul
ated
dep
reci
atio
n -
- 19
8,20
4 -
- 16
1 1,
587
65,6
49
265,
601
- -
(41,
358)
-
- (1
4)
(529
) (3
5,64
3)
(77,
544)
Dep
reci
atio
n ch
arge
-
(675
,357
) (2
,404
,408
) (4
8,91
5)
(20,
846)
(2
6,01
4)
(20,
374)
(9
0,48
5)
(3,2
86,3
99)
Clo
sing
net
boo
k va
lue
1,
812,
742
6,61
9,27
1 24
,815
,245
57
7,62
4 21
5,78
0 32
8,54
2 60
,666
50
8,71
9 34
,938
,589
At 3
0 Ju
ne 2
022
Cos
t 1
,812
,742
13
,436
,982
47
,626
,205
1,
316,
621
516,
547
648,
912
303,
711
922,
515
66,5
84,2
35
Accu
mul
ated
dep
reci
atio
n -
(6,8
17,7
11)
(22,
810,
960)
(7
38,9
97)
(300
,767
) (3
20,3
70)
(243
,045
) (4
13,7
96)
(31,
645,
646)
Net
boo
k va
lue
1,81
2,74
2 6,
619,
271
24,8
15,2
45
577,
624
215,
780
328,
542
60,6
66
508,
719
34,9
38,5
89
Annu
al ra
te o
f dep
reci
atio
n (%
) -
10
10
10
10
10
30
20
Furn
iture
,fix
ture
s an
dof
fice
equi
pmen
t
Free
hold
land
Bui
ldin
gs o
nfr
eeho
ldla
nd
Plan
t and
mac
hine
ryEl
ectr
icin
stal
latio
nsFa
ctor
yeq
uipm
ent
Com
pute
req
uipm
ent
Vehi
cles
Tota
l
13.1
Ope
ratin
g fix
ed a
sset
s
(Rup
ees
in th
ousa
nd)
Nishat Mills Limited
78 Page
For the year ended June 30, 2022Notes to the Financial Statements

Plan
t and
Mac
hine
ry
Air C
ompr
esso
r 2
2,84
9 1,
800
1,04
9 71
6 (3
33)
Neg
otia
tion
Elec
tric
Engi
neer
ing
(Priv
ate)
Lim
ited,
Lah
ore.
Air C
ompr
esso
r 2
2,24
8 1,
352
896
803
(93)
N
egot
iatio
n M
ubas
har B
roth
ers,
Fai
sala
bad.
Draw
Fra
me
2
6,16
1 5,
468
693
641
(52)
N
egot
iatio
n M
ubas
har B
roth
ers,
Fai
sala
bad.
Ring
Fra
me
1 19
,141
15
,571
3,
570
2,56
4 (1
,006
) N
egot
iatio
n M
ubas
har B
roth
ers,
Fai
sala
bad.
Ring
Fra
me
1 19
,141
15
,576
3,
565
2,56
4 (1
,001
) N
egot
iatio
n
Mub
asha
r Bro
ther
s, F
aisa
laba
d.Ri
ng F
ram
e 1
19,1
41
15,5
77
3,56
4 2,
564
(1,0
00)
Neg
otia
tion
M
ubas
har B
roth
ers,
Fai
sala
bad.
Ring
Fra
me
1 19
,509
15
,962
3,
547
2,56
4 (9
83)
Neg
otia
tion
M
ubas
har B
roth
ers,
Fai
sala
bad.
Ring
Fra
me
1 19
,509
15
,962
3,
547
2,56
4 (9
83)
Neg
otia
tion
Mub
asha
r Bro
ther
s, F
aisa
laba
d.Au
to C
one
Win
der
1 25
,664
20
,783
4,
881
3,46
2 (1
,419
) N
egot
iatio
n
Mub
asha
r Bro
ther
s, F
aisa
laba
d.Au
to C
one
Win
der
1 12
,832
10
,404
2,
428
1,73
1 (6
97)
Neg
otia
tion
M
ubas
har B
roth
ers,
Fai
sala
bad.
Ring
Fra
me
1 19
,509
15
,978
3,
531
2,56
4 (9
67)
Neg
otia
tion
M
ubas
har B
roth
ers,
Fai
sala
bad.
Ring
Fra
me
1 19
,141
15
,594
3,
547
2,56
4 (9
83)
Neg
otia
tion
M
ubas
har B
roth
ers,
Fai
sala
bad.
Toyo
ta A
ir Je
t Loo
ms
6 14
,348
11
,930
2,
418
8,70
0 6,
282
Neg
otia
tion
G
agan
Tex
tile ,
Kara
chi.
Toyo
ta A
ir Je
t Loo
ms
5 11
,957
9,
952
2,00
5 7,
250
5,24
5 N
egot
iatio
n
Gag
an T
extile
, Ka
rach
i.Ka
wa
Mot
o Si
zing
Mac
hine
1
10,8
32
10,1
33
699
3,50
0 2,
801
Neg
otia
tion
Ra
fique
Tex
tile (P
rivat
e) L
imite
d, F
aisa
laba
d.
22
1,98
2 18
2,04
2 39
,940
44
,751
4,
811
Vehi
cles
Hon
da C
ivic
LE-1
7-23
79
1 1,
916
1,15
8 75
8 1,
042
284
Com
pany
's P
olic
y M
r. M
uham
mad
Aza
m, C
ompa
ny's
em
ploy
ee, L
ahor
e.BM
W X
5 LE
F-12
-500
1
23,2
98
18,9
74
4,32
4 7,
425
3,10
1 N
egot
iatio
n M
r. N
ajam
Aziz
Set
hi, L
ahor
e.Su
zuki
Cul
tus
LEF-
17-9
140
1 1,
276
729
547
731
184
Com
pany
's P
olic
y M
r. Ba
shir
Ahm
ad S
hahi
d, C
ompa
ny's
em
ploy
ee, L
ahor
e.H
onda
Civi
c LE
E-19
-170
3 1
3,51
3 1,
375
2,13
8 2,
178
40
Com
pany
's P
olic
y M
r. M
aqso
od A
hmad
, Com
pany
's e
mpl
oyee
, Lah
ore.
Hon
da C
ivic
LEA-
17A-
3082
1
2,43
4 1,
370
1,06
4 1,
443
379
Com
pany
's P
olic
y
Mr.
Ali Im
ran
Shah
Com
pany
's e
mpl
oyee
, Lah
ore.
Toyo
ta C
orol
la L
E-17
A-65
69
1 2,
039
1,14
5 89
4 1,
196
302
Neg
otia
tion
Mr.
Muh
amm
ad F
aisa
l Cha
udha
ry, L
ahor
e.H
onda
Civi
c LE
B-17
A-29
69
1 2,
440
1,38
4 1,
056
1,42
7 37
1 C
ompa
ny's
Pol
icy
Mr.
Sula
iman
Kay
ani,
Com
pany
's e
mpl
oyee
, Lah
ore.
Suzu
ki Sw
ift L
EC-1
7-57
76
1 1,
360
835
525
773
248
Neg
otia
tion
Mr.
Kash
if M
ufty,
Lah
ore.
Hon
da C
ity L
EA-2
0-12
78
1 2,
049
519
1,53
0 2,
098
568
Neg
otia
tion
Mr.
Bash
arat
Ela
hi, S
ialko
t.To
yota
Cor
olla
LEA
-16A
-692
7 1
2,29
2 1,
448
844
1,22
1 37
7 N
egot
iatio
n M
r. Ab
dul Q
adir
Khan
, Lah
ore.
Hon
da C
ivic
LEF-
17-5
357
1 2,
513
1,43
0 1,
083
1,48
0 39
7 N
egot
iatio
n M
r. An
war
Ahm
ad, N
anka
na S
ahib
.H
yund
ai S
anta
Fe
LEA-
19-4
04
1 16
,836
7,
918
8,91
8 7,
000
(1,9
18)
Neg
otia
tion
Mr.
Asim
Zul
ifqar
Ali,
Laho
re.
Hon
da C
ivic
LE-1
7A-1
865
1 2,
442
1,46
9 97
3 1,
310
337
Com
pany
's P
olic
y Sy
ed F
arid
Ali S
hah.
Com
pany
's e
mpl
oyee
, Lah
ore.
Hon
da C
ivic
LEB-
18-6
622
1 2,
491
1,37
5 1,
116
1,51
6 40
0 C
ompa
ny's
Pol
icy
M
r. Ha
feez
-ur-R
ehm
an S
iddi
qui,
Com
pany
's e
mpl
oyee
, Lah
ore.
Hon
da C
ivic
LEB-
17A-
3606
1
2,44
0 1,
411
1,02
9 1,
559
530
Com
pany
's P
olic
y M
r. M
ujee
b An
waa
r, C
ompa
ny's
em
ploy
ee, L
ahor
e.H
onda
Civi
c LE
-17A
-356
0 1
2,65
4 1,
578
1,07
6 1,
474
398
Com
pany
's P
olic
y M
r. Ah
mad
Ham
mad
Ash
raf S
iddiqu
e, C
ompa
ny's
emplo
yee
Laho
re.
Hon
da C
ivic
LE-1
8-34
28
1 2,
433
1,37
1 1,
062
1,44
2 38
0 C
ompa
ny's
Pol
icy
Mr.
Arif
Mun
sif, C
ompa
ny's
em
ploy
ee, F
aisa
laba
d.To
yota
Cor
olla
LEC
-18-
4752
1
1,88
8 1,
089
799
1,08
5 28
6 C
ompa
ny's
Pol
icy
Mr.
Zahe
er A
hmad
, Com
pany
's e
mpl
oyee
, She
ikhup
ura.
Hon
da C
ivic
LEE-
18-5
243
1 2,
591
1,46
3 1,
128
1,51
2 38
4 C
ompa
ny's
Pol
icy
Mr.
Zaw
war
Iqba
l Rao
, Com
pany
's e
mpl
oyee
, Lah
ore.
Suzu
ki C
ultu
s LE
-17A
-185
9 1
1,27
7 74
7 53
0 72
7 19
7 C
ompa
ny's
Pol
icy
Mr.
Aam
ir Sa
eed,
Com
pany
's e
mpl
oyee
, Lah
ore.
Hon
da C
ivic
LE-1
7A-3
060
1 2,
727
1,68
7 1,
040
1,45
5 41
5 C
ompa
ny's
Pol
icy
Mr.
Faisa
l Mus
htaq
, Com
pany
's e
mpl
oyee
, Lah
ore.
82,9
09
50,4
75
32,4
34
40,0
94
7,66
0
Ag
greg
ate
of o
ther
item
s of
pro
pert
y, pl
ant a
nd
equi
pmen
t with
indi
vidu
al b
ook
valu
es n
ot
exce
edin
g Ru
pees
500
,000
38,2
54
33,0
84
5,17
0 17
,343
12
,173
343,
145
265,
601
77,5
44
102,
188
24,6
44
13.1
.1
Det
ail o
f ope
ratin
g fix
ed a
sset
s, e
xcee
ding
the
book
val
ue o
f Rup
ees
500,
000,
dis
pose
d of
dur
ing
the
year
is a
s fo
llow
s:
Des
crip
tion
Acc
umul
ated
depr
ecia
tion
Net
boo
kva
lue
Sal
epr
ocee
dsG
ain
/(L
oss)
M
ode
ofdi
spos
alPa
rtic
ular
s of
pur
chas
ers
Qua
ntity
Nos
.C
ost
(Rup
ees
in th
ousa
nd)
Annual Report 2022
79Page

2022 2021 Note (Rupees in thousand)
13.1.2 Depreciation charge for the year has been allocated as follows:
Cost of sales 28 3,189,400 2,751,106 Distribution cost 29 12,553 10,415 Administrative expenses 30 84,237 71,955 Capital work-in-progress 209 10,115 3,286,399 2,843,591
13.1.3 Particulars of immovable properties (i.e. land and buildings) are as follows:
Manufacturing units and office Address Area of land Acres
Manufacturing units
Spinning units, Yarn dyeing unit Nishatabad, Faisalabad. 86.56 and Power plant Spinning units and Power plant Plot No. 172-180 & 188-197, M-3 Industrial City, 96.15 Sahianwala, FIEDMC, 2 K.M., Jhumra Chiniot Road, Chak Jhumra, Faisalabad.
Spinning units and Power plant 20 K.M., Sheikhupura Road, Feroze Wattwan. 67.12
Weaving units and Power plant 12 K.M., Faisalabad Road, Sheikhupura. 85.53
Weaving units, Dyeing and finishing 5 K.M., Nishat Avenue, Off 22 K.M., Ferozepur 116.39 units, Processing unit, Stitching Road, Lahore. units and Power plants
Terry unit 7 K.M., Nishat Avenue, Off 22 K.M., Ferozepur 12.54 Road, Lahore.
Apparel unit 2 K.M., Nishat Avenue, Off 22 K.M., Ferozepur 17.05 Road, Lahore.
Office 7-Main Gulberg, Lahore. 1.12
482.46
Nishat Mills Limited
80 Page
For the year ended June 30, 2022Notes to the Financial Statements

Furn
iture
,fix
ture
san
d of
fice
equi
pmen
t
Adva
nces
for
purc
hase
of
free
hold
land
Bui
ldin
gs o
nfr
eeho
ldla
nd
Plan
t and
mac
hine
ryEl
ectr
icin
stal
latio
nsVe
hicl
esUn
allo
cate
dca
pita
lex
pend
iture
sTo
tal
13.2
Cap
ital-w
ork-
in-p
rogr
ess
(Rup
ees
in th
ousa
nd)
At 3
0 Ju
ne 2
020
29,4
47
295,
961
2,02
3,52
5 3,
327
2,04
6 6,
259
97,2
96
2,45
7,86
1
Add:
Add
ition
s du
ring
the
year
12
,054
1,
679,
455
5,11
8,58
7 13
8,30
7 29
,629
21
5,26
2 36
,263
7,
229,
557
Less
: Tra
nsfe
rred
to o
pera
ting
fixed
as
sets
dur
ing
the
year
(1
5,00
8)
(484
,796
) (2
,607
,863
) (3
1,47
0)
(19,
056)
(1
86,7
39)
(129
,573
) (3
,474
,505
)
At 3
0 Ju
ne 2
021
26,4
93
1,49
0,62
0 4,
534,
249
110,
164
12,6
19
34,7
82
3,98
6 6,
212,
913
Add:
Add
ition
s du
ring
the
year
10
9,59
3 1,
213,
495
3,79
6,64
3 24
4,53
3 5,
348
238,
526
79,4
61
5,68
7,59
9
Le
ss: T
rans
ferre
d to
ope
ratin
g fix
ed
asse
ts d
urin
g th
e ye
ar
(134
,933
) (1
,046
,932
) (5
,361
,025
) (2
62,1
95)
(10,
132)
(1
84,8
76)
(72,
685)
(7
,072
,778
)
At
30
June
202
2 1,
153
1,65
7,18
3 2,
969,
867
92,5
02
7,83
5 88
,432
10
,762
4,
827,
734
13.2
.1
Vehi
cles
incl
ude
adva
nce
of R
upee
s 6.
414
milli
on (2
021:
Rup
ees
2.87
8 m
illion
) giv
en to
Hyu
ndai
Nis
hat M
otor
(Priv
ate)
Lim
ited
- ass
ocia
ted
com
pany
.
13.2
.2
Borro
win
g co
st a
mou
ntin
g to
Rup
ees
14.7
56 m
illion
(202
1: R
upee
s 19
.005
milli
on) h
as b
een
capi
taliz
ed d
urin
g th
e ye
ar. T
he e
ffect
ive
rate
of b
orro
win
g co
st c
apita
lized
dur
ing
the
year
rang
ing
from
1.8
5% to
8.7
0% (2
021:
1.8
5% to
8.7
5%) p
er a
nnum
.
Annual Report 2022
81Page

14 INVESTMENT PROPERTIES
Note Land Buildings Total (Rupees in thousand)
At 30 June 2020 Cost 415,672 175,034 590,706 Accumulated depreciation - (135,162) (135,162) Net book value 415,672 39,872 455,544
Year ended 30 June 2021 Opening net book value 415,672 39,872 455,544 Transferred from operating fixed assets: Cost 19,541 99,410 118,951 Accumulated depreciation - (90,155) (90,155) 19,541 9,255 28,796 Depreciation charge 31 - (4,834) (4,834) Closing net book value 435,213 44,293 479,506
At 30 June 2021 Cost 435,213 274,444 709,657 Accumulated depreciation - (230,151) (230,151) Net book value 435,213 44,293 479,506
Year ended 30 June 2022 Opening net book value 435,213 44,293 479,506 Depreciation charge 31 - (4,429) (4,429) Closing net book value 435,213 39,864 475,077
At 30 June 2022 Cost 435,213 274,444 709,657 Accumulated depreciation - (234,580) (234,580) Net book value 435,213 39,864 475,077
14.1 Depreciation at the rate of 10 percent per annum on buildings amounting to Rupees 4.429 million (2021: Rupees 4.834 million) charged during the year is allocated to other expenses. No expenses directly related to investment properties were incurred during the year. The market value of land and buildings is estimated at Rupees 5,388.378 million (2021: Rupees 4,887.528 million). Forced sale value of investment properties as on the reporting date is Rupees 4,322.320 million (2021: Rupees 4,151.557 million). The valuation has been carried out by an independent valuer.
14.2 Land and buildings having book value of Rupees 328.643 million (2021: Rupees 328.643 million) and Rupees 27.977 million (2021: Rupees 31.085 million) respectively have been given on operating lease to Nishat Hospitality (Private) Limited - subsidiary company.
14.3 Land having book value of Rupees 99.693 million (2021: Rupees 99.693 million) has been given on operating lease to Nishat Linen (Private) Limited - subsidiary company.
14.4 Land and buildings having book value of Rupees 0.006 million (2021: Rupees 0.006 million) and Rupees 7.567 million (2021: Rupees 8.408 million) respectively have been given on operating lease to Hyundai Nishat Motor (Private) Limited - associated company.
Nishat Mills Limited
82 Page
For the year ended June 30, 2022Notes to the Financial Statements

14.5 Particulars of investment properties (i.e. land and buildings) are as follows:
Description Address Area of land Kanal
Factory land 21 K.M., Ferozepur Road, Lahore. 33.65 Commercial building Mian Mehmood Kasuri Road, Gulberg III, Lahore. 6.04 Factory land and building Nishatabad, Faisalabad. 44.00
2022 2021 Note (Rupees in thousand)
15 LONG TERM INVESTMENTS
Equity instruments 15.1 35,720,224 48,620,695
15.1 Equity instruments
Subsidiary companies
Nishat Power Limited - quoted 180,632,955 (2021: 180,632,955) fully paid ordinary shares of Rupees 10 each. Equity held 51.01% (2021: 51.01%) 1,806,329 1,806,329
Nishat USA Inc. - unquoted 40 & 40.1 200 (2021: 200) fully paid shares with no par value per share. Equity held 100% (2021: 100%) 3,547 3,547
Nishat Linen (Private) Limited - unquoted 15.1.1 1,067,913 (2021: 1,067,913) fully paid ordinary shares of Rupees 10 each. Equity held 100% (2021: 100%) 261,603 261,603
Nishat Linen Trading LLC - unquoted 15.1.2, 40 & 40.1 4,900 (2021: 4,900) fully paid shares of UAE Dirhams 1,000 each. 259,403 259,403
Nishat Hospitality (Private) Limited - unquoted 169,999,901 (2021: 169,999,901) fully paid ordinary shares of Rupees 10 each. Equity held 100% (2021: 100%) 1,699,999 1,699,999
Nishat International FZE - unquoted 40 & 40.1 18 (2021: 18) fully paid shares of UAE Dirhams 1,000,000 each. Equity held 100% (2021: 100%) 492,042 492,042 Advance for purchase of shares 9,070 9,070 501,112 501,112
Nishat Commodities (Private) Limited - unquoted 15.1.3 1,000 (2021: 1,000) fully paid ordinary shares of Rupees 10 each. Equity held 100% (2021: 100%) 10 10
Annual Report 2022
83Page

2022 2021 Note (Rupees in thousand)
Equity instruments Fair value through other comprehensive income Associated companies (with significant influence)
D.G. Khan Cement Company Limited - quoted 137,574,201 (2021: 137,574,201) fully paid ordinary shares of Rupees 10 each. Equity held 31.40% (2021: 31.40%) 3,418,145 3,418,145
Nishat Paper Products Company Limited - unquoted 15.1.4 11,634,199 (2021: 11,634,199) fully paid ordinary shares of Rupees 10 each. Equity held 25% (2021: 25%) 106,802 106,802
Lalpir Power Limited - quoted 109,393,555 (2021: 109,393,555) fully paid ordinary shares of Rupees 10 each. Equity held 28.80% (2021: 28.80%) 1,640,306 1,640,306 Pakgen Power Limited - quoted 102,524,728 (2021: 102,524,728) fully paid ordinary shares of Rupees 10 each. Equity held 27.55% (2021: 27.55%) 1,272,194 1,272,194
Nishat Dairy (Private) Limited - unquoted 15.1.5 60,000,000 (2021: 60,000,000) fully paid ordinary shares of Rupees 10 each. Equity held 12.24% (2021: 12.24%) 496,200 496,200
Nishat Energy Limited - unquoted 15.1.6 250,000 (2021: 250,000) fully paid ordinary shares of Rupees 10 each. Equity held 25% (2021: 25%) - -
Nishat Hotels and Properties Limited - unquoted 15.1.7 74,022,917 (2021: 74,022,917) fully paid ordinary shares of Rupees 10 each. Equity held 6.08% (2021: 6.08%) 740,229 740,229
Hyundai Nishat Motor (Private) Limited - unquoted 15.1.8 & 15.1.9 113,847,600 (2021: 113,847,600) fully paid ordinary shares of Rupees 10 each. Equity held 12% (2021: 12%) 1,138,476 1,138,476
Security General Insurance Company Limited - unquoted 15.1.10 10,226,244 (2021: 10,226,244) fully paid ordinary shares of Rupees 10 each. Equity held 15.02% (2021: 15.02%) 11,188 11,188 Nishat Sutas Dairy Limited - unquoted 15.1.11 144,254,900 (2021: 16,630,000) fully paid ordinary shares of Rupees 10 each. Equity held 47.53% (2021: 34.46%) 1,442,549 166,300
Nishat Mills Limited
84 Page
For the year ended June 30, 2022Notes to the Financial Statements
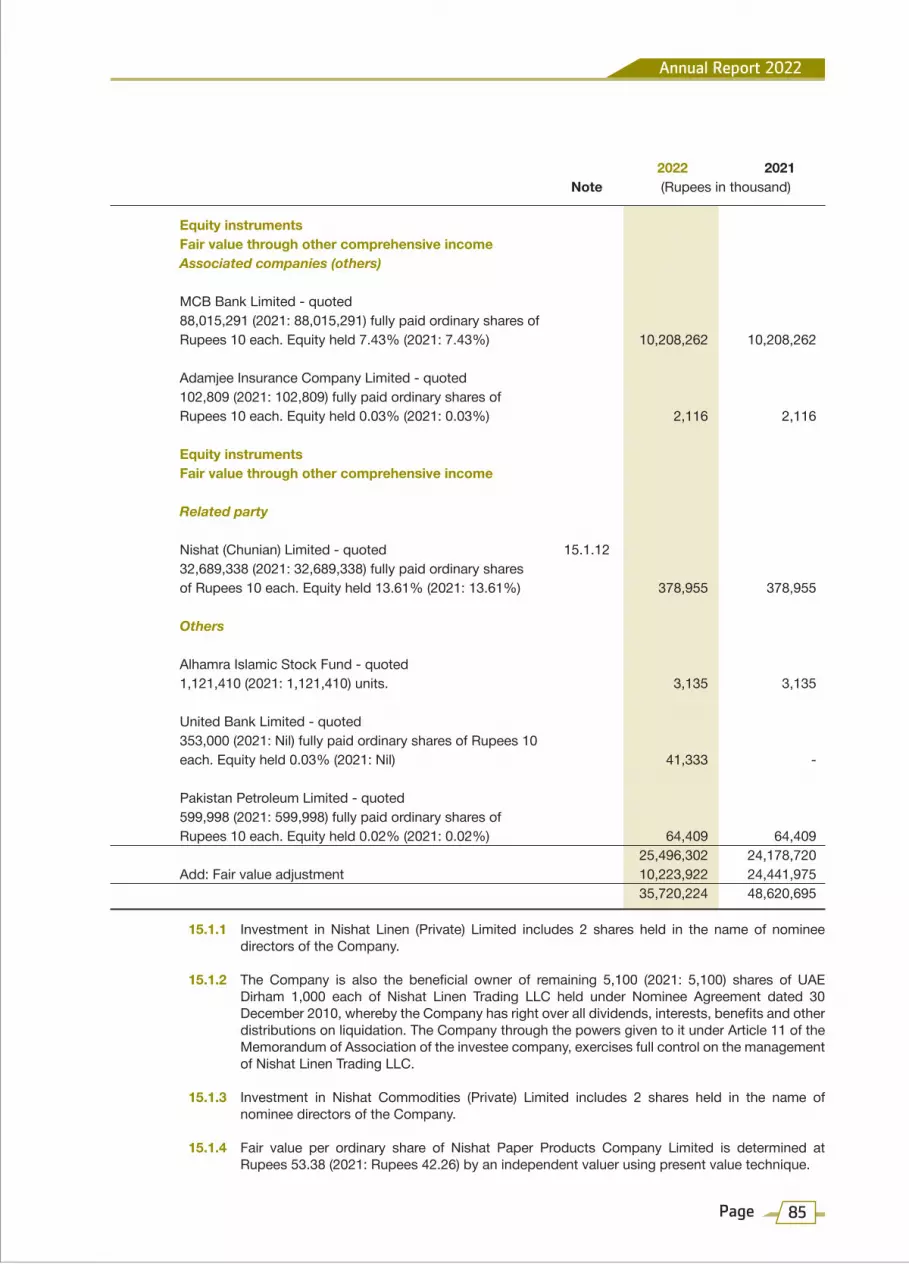
2022 2021 Note (Rupees in thousand)
Equity instruments Fair value through other comprehensive income Associated companies (others)
MCB Bank Limited - quoted 88,015,291 (2021: 88,015,291) fully paid ordinary shares of Rupees 10 each. Equity held 7.43% (2021: 7.43%) 10,208,262 10,208,262
Adamjee Insurance Company Limited - quoted 102,809 (2021: 102,809) fully paid ordinary shares of Rupees 10 each. Equity held 0.03% (2021: 0.03%) 2,116 2,116
Equity instruments Fair value through other comprehensive income
Related party
Nishat (Chunian) Limited - quoted 15.1.12 32,689,338 (2021: 32,689,338) fully paid ordinary shares of Rupees 10 each. Equity held 13.61% (2021: 13.61%) 378,955 378,955
Others
Alhamra Islamic Stock Fund - quoted 1,121,410 (2021: 1,121,410) units. 3,135 3,135
United Bank Limited - quoted 353,000 (2021: Nil) fully paid ordinary shares of Rupees 10 each. Equity held 0.03% (2021: Nil) 41,333 -
Pakistan Petroleum Limited - quoted 599,998 (2021: 599,998) fully paid ordinary shares of Rupees 10 each. Equity held 0.02% (2021: 0.02%) 64,409 64,409 25,496,302 24,178,720 Add: Fair value adjustment 10,223,922 24,441,975 35,720,224 48,620,695
15.1.1 Investment in Nishat Linen (Private) Limited includes 2 shares held in the name of nominee directors of the Company.
15.1.2 The Company is also the beneficial owner of remaining 5,100 (2021: 5,100) shares of UAE Dirham 1,000 each of Nishat Linen Trading LLC held under Nominee Agreement dated 30 December 2010, whereby the Company has right over all dividends, interests, benefits and other distributions on liquidation. The Company through the powers given to it under Article 11 of the Memorandum of Association of the investee company, exercises full control on the management of Nishat Linen Trading LLC.
15.1.3 Investment in Nishat Commodities (Private) Limited includes 2 shares held in the name of nominee directors of the Company.
15.1.4 Fair value per ordinary share of Nishat Paper Products Company Limited is determined at Rupees 53.38 (2021: Rupees 42.26) by an independent valuer using present value technique.
Annual Report 2022
85Page

15.1.5 Fair value per ordinary share of Nishat Dairy (Private) Limited is determined at Rupees 8.09 (2021: Rupees 7.29) by an independent valuer using present value technique.
15.1.6 Investment in Nishat Energy Limited has been fully provided during the year ended 30 June 2017, being no more a going concern.
15.1.7 Fair value per ordinary share of Nishat Hotels and Properties Limited is determined at Rupees 18.44 (2021: Rupees 19.73) by an independent valuer using present value technique.
15.1.8 Investment in Hyundai Nishat Motor (Private) Limited includes 4 shares held in the name of nominee directors of the Company.
15.1.9 Fair value per ordinary share of Hyundai Nishat Motor (Private) Limited is determined at Rupees 25.15 (2021: Rupees 38.42) by an independent valuer using present value technique.
15.1.10 Fair value per ordinary share of Security General Insurance Company Limited is determined at Rupees 36.40 (2021: Rupees 65.87) by an independent valuer using present value technique.
15.1.11 Fair value per ordinary share of Nishat Sutas Dairy Limited is determined at Rupees 8.39 by an independent valuer using present value technique. Previously, as on 30 June 2021, operations of Nishat Sutas Dairy Limited were not started, hence, cost of investment (Rupees 10 per share) was considered as an appropriate estimate of fair value.
15.1.12 Pursuant to the Scheme of Compromises, Arrangement and Reconstruction (Under Sections 279 to 283 and 285 of the Companies Act, 2017) amongst Nishat (Chunian) Limited and its members and Nishat Chunian Properties (Private) Limited and its members duly sanctioned by Honorable Lahore High Court, Lahore on 29 June 2022, the Company has, subsequent to the reporting period, on 18 August 2022, received 25,497,684 ordinary shares of Nishat Chunian Power Limited as one of the principal objects of the Scheme was to make Nishat (Chunian) Limited and Nishat Chunian Power Limited totally independent of each other by the transfer amongst the members of Nishat (Chunian) Limited of 187,585,820 ordinary shares of Nishat Chunian Power Limited owned by Nishat (Chunian) Limited. Hence, the Company has also become a shareholder of Nishat Chunian Power Limited with effect from 18 August 2022.
2022 2021 Note (Rupees in thousand)
16 LONG TERM LOANS
Considered good: Executives - secured 16.1 & 16.2 347,014 408,852 Other employees - secured 16.2 179,435 217,059 526,449 625,911
Less: Current portion shown under current assets 21 Executives 79,990 93,079 Other employees 54,036 64,455 134,026 157,534 392,423 468,377
16.1 Maximum aggregate balance due from executives at the end of any month during the year was Rupees 427.599 million (2021: Rupees 408.852 million).
16.2 These represent loans given to executives and other employees as per the Company's policy for house construction and general purposes. These are secured against balance to the credit of employees in the provident fund trust and are recoverable in equal monthly installments. Interest charged during the year range from 0% to 4% (2021: 0% to 4%) per annum on the balance outstanding.
Nishat Mills Limited
86 Page
For the year ended June 30, 2022Notes to the Financial Statements

16.3 The fair value adjustment in accordance with the requirements of IFRS 9 'Financial Instruments' arising in respect of staff loans is not considered material and hence not recognized.
2022 2021 Note (Rupees in thousand)
17 LONG TERM DEPOSITS
Security deposits 177,196 156,984
18 STORES, SPARE PARTS AND LOOSE TOOLS
Stores 18.1 3,017,601 1,761,183 Spare parts 978,635 842,338 Loose tools 7,615 6,222 4,003,851 2,609,743 Less: Provision for slow moving, obsolete and damaged store items 18.2 (4,141) (4,141) 3,999,710 2,605,602
18.1 These include stores in transit of Rupees 312.373 million (2021: Rupees 274.334 million).
18.2 Provision for slow moving, obsolete and damaged store items
2022 2021 Note (Rupees in thousand)
Balance as on 01 July 4,141 4,218 Less: Provision reversed during the year 32 - (77) Balance as on 30 June 4,141 4,141
19 STOCK-IN-TRADE
Raw materials 19.2 17,605,016 9,283,755 Work-in-process 19.3 6,049,041 2,814,471 Finished goods 19.4 8,172,559 5,874,465 31,826,616 17,972,691
19.1 Stock-in-trade of Rupees 623.782 million (2021: Rupees 503.811 million) is being carried at net realizable value.
19.2 Raw materials include stock in transit of Rupees 341.113 million (2021: Rupees 334.059 million).
19.3 This includes stock of Rupees 22.763 million (2021: Rupees 17.961 million) sent to outside parties for processing. Further, work in process includes stock in transit of Rupees 62.975 million.
19.4 Finished goods include stock in transit of Rupees 2,482.320 million (2021: Rupees 1,888.392 million).
19.5 The aggregate amount of write-down of inventories to net realizable value recognized as an expense during the year was Rupees 7.447 million (2021: Rupees 22.161 million).
Annual Report 2022
87Page

2022 2021 Note (Rupees in thousand)
20 TRADE DEBTS
Considered good:
Secured (against letters of credit) 1,502,050 1,048,918 Unsecured: - Related parties 20.3 & 20.4 482,412 365,157 - Others 8,402,077 5,150,837 10,386,539 6,564,912 Less: Allowance for expected credit losses 20.5 (20,131) (15,660) 10,366,408 6,549,252
20.1 Foreign jurisdictions of trade debts
Europe 2,215,597 1,826,134 Asia, Africa and Australia 1,474,995 1,061,145 America 2,250,331 1,178,982 5,940,923 4,066,261
20.2 Types of counterparties
Export Corporate 5,734,469 4,047,402 Other 206,454 18,859 5,940,923 4,066,261 Local Corporate 3,627,203 2,060,122 Other 818,413 438,529 4,445,616 2,498,651 10,386,539 6,564,912
20.3 This represents amounts due from following related parties. These are neither past due nor impaired:
2022 2021 (Rupees in thousand)
Nishat Linen (Private) Limited - subsidiary company 299,576 115,437 Nishat Hotels and Properties (Private) Limited - associated company - 72 Hyundai Nishat Motor (Private) Limited - associated company 1,494 547 Nishat Dairy (Private) Limited - associated company 165 - Nishat International FZE - subsidiary company 181,177 249,101 482,412 365,157
Nishat Mills Limited
88 Page
For the year ended June 30, 2022Notes to the Financial Statements

20.4 The maximum aggregate amount receivable from related parties at the end of any month during the year was as follows:
2022 2021 Note (Rupees in thousand)
D.G. Khan Cement Company Limited - associated company 73 -
Nishat Commodities (Private) Limited - subsidiary company 5 -
Nishat Linen (Private) Limited - subsidiary company 1,986,209 1,819,892
Nishat Hotels and Properties (Private) Limited - associated company 5,726 1,042
Hyundai Nishat Motor (Private) Limited - associated company 3,837 4,833
MCB Bank Limited - associated company 7 -
Nishat Dairy (Private) Limited - associated company 165 -
Nishat International FZE - subsidiary company 237,032 249,101
20.5 Allowance for expected credit losses
Balance as at 01 July 15,660 15,496 Add: Recognized during the year 31 4,471 164 Balance as at 30 June 20,131 15,660
21 LOANS AND ADVANCES
Considered good: Employees - interest free: – Executives 5,045 990 – Other employees 9,762 1,645 14,807 2,635
Current portion of long term loans 16 134,026 157,534 Advances to suppliers 21.1 91,266 96,187 Letters of credit 3,264 4,331 Receivable from Employees' Provident Fund Trust 63,075 - Other advances 21.1 4,493,918 7,414,912 4,800,356 7,675,599 Considered doubtful: Others 108 108 Less: Provision for doubtful 108 108 - - 4,800,356 7,675,599
Annual Report 2022
89Page

21.1 These include amounts due from following related parties. These are neither past due nor impaired:
2022 2021 Note (Rupees in thousand)
Advances to suppliers D.G. Khan Cement Company Limited - associated company - 3,533
Other advances Nishat Linen (Private) Limited - subsidiary company 21.1.1 4,364,178 7,301,984 Nishat Hotels and Properties Limited - associated company 44 - Nishat Commodities (Private) Limited - subsidiary company - 105 4,364,222 7,302,089
21.1.1 This represents unsecured advance for a period of one year and carries mark-up at the rates ranging from 7.51% to 14.31% per annum. This is neither past due nor impaired.
21.2 The maximum aggregate amount receivable from related parties at the end of any month during the year was as follows:
2022 2021 Note (Rupees in thousand)
Nishat Linen (Private) Limited - subsidiary company 11,946,636 12,459,012
D.G. Khan Cement Company Limited - associated company - 3,533
Nishat Hotels and Properties Limited - associated company 44 -
Nishat Commodities (Private) Limited - subsidiary company - 105
22 TAXATION - NET
Advance income tax 2,245,588 1,720,339 Less: Provision for taxation (2,595,611) (1,148,032) (350,023) 572,307
23 SHORT TERM DEPOSITS AND PREPAYMENTS
Deposits 486 486 Prepayments 136,897 80,342 137,383 80,828
24 OTHER RECEIVABLES
Considered good: Export rebate and claims 211,245 124,772 Duty draw back 363,950 1,218,043 Sales tax refundable 8,723,044 3,274,640 Fair value of forward exchange contracts 57,518 8,672 Miscellaneous receivables 24.1 45,709 76,582 9,401,466 4,702,709
Nishat Mills Limited
90 Page
For the year ended June 30, 2022Notes to the Financial Statements

24.1 These include Rupees Nil (2021: Rupees 41.677 million) receivable from Nishat Hospitality (Private) Limited - subsidiary company in the ordinary course of business. This was interest free. The maximum aggregate amount receivable from Nishat Hospitality (Private) Limited - subsidiary company at the end of any month during the year was Rupees 62.110 million (2021: Rupees 62.253 million). As on 30 June 2021, this balance was past due more than 6 months.
25 ACCRUED INTEREST
2022 2021 (Rupees in thousand)
On short term loans and advances to:
Nishat Linen (Private) Limited - subsidiary company 379,668 17,642 Profit receivable on deposits with MCB Bank Limited - associated company - 11,243 379,668 28,885
25.1 These are neither past due nor impaired. The maximum aggregate amount receivable from related parties at the end of any month during the year was as follows:
2022 2021 Note (Rupees in thousand)
Nishat Linen (Private) Limited - subsidiary company 379,668 41,855
MCB Bank Limited - associated company 14,856 11,243
26 CASH AND BANK BALANCES
With banks: On current accounts 26.1 & 26.2 Including US$ 201,284 (2021: US$ 195,575) 61,245 178,051
Term deposit receipts 26.3 - 5,075,000
On PLS saving accounts 26.4 Including US$ 117 (2021: US$ 117) 24 242 61,269 5,253,293 Cash in hand 30,458 19,052 91,727 5,272,345 26.1 Cash at banks includes balance of Rupees 5.707 million (2021: Rupees 3.906 million) with MCB Bank
Limited - associated company.
26.2 Cash at banks includes balance of Rupees 0.166 million (2021: Rupees 0.443 million) with MCB Islamic Bank Limited - related party.
26.3 These represent term deposit receipts of Rupees Nil (2021: Rupees 5,075 million) with maturity period of 30 days and carried profit at the rate 6.80% (2021: 6.80%) per annum with MCB Bank Limited - associated company. Term deposit receipts of one month maturity period with other banking companies which have matured during the year carried profit at the rate of 12.85% (2021: 6.35% to 7.20%) per annum.
26.4 Rate of profit on bank deposits ranges from 5.50% to 8.25% (2021: 5.50% to 5.55%) per annum.
Annual Report 2022
91Page

2022 2021 Note (Rupees in thousand) 27 REVENUE
Revenue from contracts with customers: -Export sales 75,102,165 46,364,366 -Local sales 27.1 33,229,903 18,021,220 -Processing income 27.2 7,024,143 6,021,237 115,356,211 70,406,823 Export rebate 397,036 228,790 Duty draw back 14,818 795,397 115,768,065 71,431,010
27.1 Local sales
Sales 27.1.1 38,339,466 20,851,467 Less: Sales tax (5,109,563) (2,830,247) 33,229,903 18,021,220
27.1.1 These include sales of Rupees 17,374.452 million (2021: Rupees 10,063.857 million) made to direct exporters against standard purchase orders (SPOs). Further, local sales include waste sales of Rupees 2,275.065 million (2021: Rupees 2,055.750 million).
2022 2021 (Rupees in thousand) 27.2 Processing income
Sales 8,218,247 7,072,453 Less: Sales tax (1,194,104) (1,051,216) 7,024,143 6,021,237
Nishat Mills Limited
92 Page
For the year ended June 30, 2022Notes to the Financial Statements

Reg
ion
Euro
pe
390
,084
2
80,0
73
16,
614,
625
8,2
97,8
97
552
,632
4
07,5
66
12,
403,
036
9,1
63,9
02
5,0
88,7
22
4,2
59,1
44
- -
35,
049,
099
22,
408,
582
Amer
ica
597
,876
1
11,3
51
919
,817
6
66,9
98
8,0
91
14,
967
3,8
18,6
58
3,2
72,9
02
8,5
65,6
32
3,5
52,6
38
- -
13,
910,
074
7,6
18,8
56
Asia
, Afri
ca, A
ustra
lia
7,1
20,6
49
5,4
18,1
79
2,2
32,9
82
2,0
45,8
55
14,
952,
303
7,7
17,4
03
1,7
18,5
49
1,7
94,5
30
530
,363
3
85,1
48
- -
26,
554,
846
17,
361,
115
Paki
stan
2
1,93
5,92
4 1
0,86
3,27
9 7
,957
,145
6
,279
,483
6
,453
,778
3
,504
,263
3
,599
,171
3
,173
,668
2
03,9
71
167
,945
1
04,0
57
53,
819
40,
254,
046
24,
042,
457
3
0,04
4,53
3 1
6,67
2,88
2 2
7,72
4,56
9 1
7,29
0,23
3 2
1,96
6,80
4 1
1,64
4,19
9 2
1,53
9,41
4 1
7,40
5,00
2 1
4,38
8,68
8 8
,364
,875
1
04,0
57
53,
819
115
,768
,065
7
1,43
1,01
0
Tim
ing
of re
venu
e re
cogn
ition
Prod
ucts
and
ser
vice
s tra
nsfe
rred
at a
poi
nt in
tim
e 3
0,04
4,53
3 16
,672
,882
27
,724
,569
17
,290
,233
21
,966
,804
11
,644
,199
21
,539
,414
17
,405
,002
14
,388
,688
8,
364,
875
104
,057
53
,819
11
5,76
8,06
5 71
,431
,010
Prod
ucts
and
ser
vice
s tra
nsfe
rred
over
tim
e -
- -
- -
- -
- -
- -
- -
-
3
0,04
4,53
3 16
,672
,882
27
,724
,569
17
,290
,233
21
,966
,804
11
,644
,199
21
,539
,414
17
,405
,002
14
,388
,688
8,
364,
875
104
,057
53
,819
11
5,76
8,06
5 71
,431
,010
Maj
or p
rodu
cts
/ ser
vice
line
s
Yarn
2
9,87
2,17
2 16
,439
,073
-
- -
- -
- -
- -
- 2
9,87
2,17
2 1
6,43
9,07
3
Com
ber N
oil
172
,361
23
3,80
9 -
- -
- -
- -
- -
- 1
72,3
61
233
,809
Gre
y C
loth
-
- 2
7,72
4,56
9 1
7,29
0,23
3 -
- -
- -
- -
- 2
7,72
4,56
9 1
7,29
0,23
3
Proc
ess
Clo
th
- -
- -
21,
966,
804
11,
644,
199
- -
- -
- -
21,
966,
804
11,
644,
199
Mad
e U
ps
- -
- -
- -
18,
246,
639
16,3
81,5
68
- -
- -
18,
246,
639
16,
381,
568
Gar
men
ts
- -
- -
- -
- -
14,
388,
688
8,36
4,87
5 -
- 1
4,38
8,68
8 8
,364
,875
Tow
els
and
Bath
Rob
es
- -
- -
- -
3,2
92,7
75
1,0
23,4
34
- -
- -
3,2
92,7
75
1,0
23,4
34
Elec
trici
ty
- -
- -
- -
- -
- -
104
,057
53
,819
1
04,0
57
53,
819
3
0,04
4,53
3 16
,672
,882
27
,724
,569
17
,290
,233
21
,966
,804
11
,644
,199
2
1,53
9,41
4 17
,405
,002
14
,388
,688
8,
364,
875
104
,057
53
,819
11
5,76
8,06
5 71
,431
,010
27.3
Th
e am
ount
of R
upee
s 1,
011.
840
milli
on in
clud
ed in
con
tract
liab
ilitie
s (N
ote
7) a
t 30
June
202
1 ha
s be
en re
cogn
ised
as
reve
nue
in 2
022
(202
1: R
upee
s 50
7.19
8 m
illion
).
27.4
D
isag
greg
atio
n of
reve
nue
from
con
trac
ts w
ith c
usto
mer
s
In
the
follo
win
g ta
ble,
reve
nue
from
con
tract
s w
ith c
usto
mer
s is
dis
aggr
egat
ed b
y pr
imar
y ge
ogra
phic
al m
arke
t, m
ajor
pro
duct
s an
d se
rvic
e lin
es a
nd ti
min
g of
reve
nue
reco
gniti
on:
27.5
Re
venu
e is
reco
gnis
ed a
t poi
nt in
tim
e as
per
the
term
s an
d co
nditi
ons
of u
nder
lyin
g co
ntra
cts
with
cus
tom
ers.
Des
crip
tion
Spin
ning
Wea
ving
Dye
ing
Hom
e Te
xtile
and
Terr
yG
arm
ents
Pow
er G
ener
atio
nTo
tal
2022
2021
2022
2021
2022
2021
2022
2021
2022
2021
2022
2021
2022
2021
(Rup
ees
in th
ousa
nd)
Annual Report 2022
93Page

2022 2021 Note (Rupees in thousand)
28 COST OF SALES
Raw materials consumed 28.1 65,677,833 35,741,113 Processing charges 551,930 368,169 Salaries, wages and other benefits 28.2 9,372,340 7,396,591 Stores, spare parts and loose tools consumed 10,268,232 7,683,252 Packing materials consumed 2,395,964 1,817,735 Repair and maintenance 664,796 451,401 Fuel and power 10,904,476 6,071,039 Insurance 65,222 45,340 Other factory overheads 874,965 544,570 Depreciation 13.1.2 3,189,400 2,751,106 103,965,158 62,870,316
Work-in-process Opening stock 2,814,471 2,032,268 Closing stock (6,049,041) (2,814,471) (3,234,570) (782,203) Cost of goods manufactured 100,730,588 62,088,113
Finished goods Opening stock 5,874,465 5,899,507 Closing stock (8,172,559) (5,874,465) (2,298,094) 25,042 98,432,494 62,113,155
28.1 Raw materials consumed
Opening stock 9,283,755 12,821,768 Add: Purchased during the year 73,999,094 32,203,100 83,282,849 45,024,868 Less: Closing stock (17,605,016) (9,283,755) 65,677,833 35,741,113
28.2 Salaries, wages and other benefits include provident fund contribution of Rupees 249.758 million (2021: Rupees 197.258 million) by the Company.
Nishat Mills Limited
94 Page
For the year ended June 30, 2022Notes to the Financial Statements

2022 2021 Note (Rupees in thousand)
29 DISTRIBUTION COST
Salaries and other benefits 29.1 660,687 536,995 Outward freight and handling 3,400,952 1,442,292 Commission to selling agents 1,055,201 774,117 Royalty 29.2 10,038 9,103 Fuel cost 195,346 139,261 Travelling and conveyance 110,053 23,604 Rent, rates and taxes 8,387 11,932 Postage and telephone 109,904 92,383 Insurance 26,336 16,802 Vehicles’ running 25,375 21,090 Entertainment 10,652 7,350 Printing and stationery 11,947 3,526 Repair and maintenance 24,724 5,571 Fee and subscription 3,798 2,032 Depreciation 13.1.2 12,553 10,415 5,665,953 3,096,473
29.1 Salaries and other benefits include provident fund contribution of Rupees 33.096 million (2021: Rupees 27.278 million) by the Company.
29.2 Particulars of royalty paid during the year are as follows:
Relationship with the Name of the company Registered address Company or directors
Related / Other (Rupees in thousand)
American and Efird LLC 22 American Street, Other 10,172 5,967 Mount Holly, North Carolina, 28120.
Circular Systems S.P.C. 719 S. Los Angeles St. # 924, Other 266 - Los Angeles, California 90014, United States of America. 10,438 5,967
2022 2021 Note (Rupees in thousand)
30 ADMINISTRATIVE EXPENSES
Salaries and other benefits 30.1 1,218,581 987,202 Vehicles’ running 66,759 47,109 Travelling and conveyance 40,430 14,880 Rent, rates and taxes 3,694 2,489 Insurance 10,204 8,715 Entertainment 44,316 29,416 Legal and professional 27,918 21,110 Auditor's remuneration 30.2 7,011 6,380 Advertisement 792 346 Postage and telephone 19,893 7,340 Electricity and gas 11,948 12,281 Printing and stationery 28,812 23,532 Repair and maintenance 52,329 48,084 Fee and subscription 9,863 8,851 Depreciation 13.1.2 84,237 71,955 Miscellaneous 44,582 50,403 1,671,369 1,340,093
2022 2021
Annual Report 2022
95Page

30.1 Salaries and other benefits include provident fund contribution of Rupees 49.285 million (2021: Rupees 40.529 million) by the Company.
2022 2021 Note (Rupees in thousand) 30.2 Auditor’s remuneration
Audit fee 5,558 5,053 Half yearly review 1,163 1,057 Other certifications 75 75 Reimbursable expenses 215 195 7,011 6,380
31 OTHER EXPENSES
Workers’ profit participation fund 7.4 483,116 318,505 Workers’ welfare fund 7.5 5,890 5,093 Allowance for expected credit losses 20.5 4,471 164 Depreciation on investment properties 14 4,429 4,834 Donations 31.1 & 31.2 4,108 3,200 502,014 331,796
31.1 The name of donee to whom donation amount exceeded Rupees 1 million is as follows:
Pakistan Textile Council 31.3 3,750 2,500
31.2 There is no interest of any director or his spouse in donees’ fund.
31.3 The Company is a member of Pakistan Textile Council (a company set up under Section 42 of the Companies Act, 2017).
2022 2021 Note (Rupees in thousand) 32 OTHER INCOME
Income from financial assets
Dividend income 32.1 3,328,797 2,722,637 Profit on deposits with banks 69,952 119,182 Net exchange gain 830,015 26,275 Interest income on loans and advances to subsidiary companies 726,411 313,445 Gain on initial recognition of GIDC payable at amortized cost - 52,766 Interest income on loans to employees 8,593 10,002 4,963,768 3,244,307
Income from non-financial assets
Gain on sale of property, plant and equipment 24,644 52,602 Scrap sales 399,381 286,786 Rental income 183,622 166,416 Reversal of provision for slow moving, obsolete and damaged store items 18.2 - 77 607,647 505,881 5,571,415 3,750,188
Nishat Mills Limited
96 Page
For the year ended June 30, 2022Notes to the Financial Statements

2022 2021 Note (Rupees in thousand)
32.1 Dividend income
From related party / associated companies / subsidiary companies
Nishat (Chunian) Limited - related party 261,515 32,689 Nishat International FZE - subsidiary company 8,309 - D.G. Khan Cement Company Limited - associated company 137,574 - MCB Bank Limited - associated company 1,716,298 1,716,298 Adamjee Insurance Company Limited - associated company 308 257 Security General Insurance Company Limited - associated company 51,131 51,131 Nishat Paper Products Company Limited - associated company 17,452 - Pakgen Power Limited - associated company 205,050 333,204 Nishat Commodities (Private) Limited - subsidiary company 30,000 30,000 Nishat Linen (Private) Limited - subsidiary company 42,717 21,358 Nishat USA Inc. - subsidiary company 46 40 Lalpir Power Limited - associated company 218,787 355,527 Nishat Power Limited - subsidiary company 632,215 180,633 3,321,402 2,721,137
Others
United Bank Limited 5,295 - Pakistan Petroleum Limited 2,100 1,500 3,328,797 2,722,637
33 FINANCE COST
Mark-up on: Long term financing 358,191 284,817 Short term borrowings 1,420,709 611,549 Interest on workers’ profit participation fund 7.4 6,673 179 Adjustment due to impact of IFRS 9 on GIDC 6.2 36,096 73,562 Bank charges and commission 338,696 259,072 2,160,365 1,229,179
34 TAXATION
Current 2,595,611 1,148,032
34.1 The Company falls under the ambit of presumptive tax regime under section 169 of the Income Tax Ordinance, 2001. Provision for income tax is made accordingly. Provision for super tax on income is calculated as per Section 4C of the Income Tax Ordinance, 2001. Further, provision against income from other sources is made under the relevant provisions of the Income Tax Ordinance, 2001.
34.2 Provision for deferred income tax is not required as the Company is chargeable to tax under section 169 of the Income Tax Ordinance, 2001 and no temporary differences are expected to arise in the foreseeable future except for deferred tax liability as explained in note 6.
Annual Report 2022
97Page

2022 2021 (Rupees in thousand)
34.3 Reconciliation between tax expense and accounting profit
Accounting profit before taxation 12,907,285 7,070,502 Applicable tax rate 29% 29%
Tax on accounting profit 3,743,113 2,050,446
Tax effect of dividend income taxed at a lower rate (545,235) (446,372) Tax effect of final tax regime income taxed at a lower rate (1,284,227) (160,505) Tax effect of income that are not considered in determining taxable liability (119,437) (297,014) Tax effect of super tax 801,397 - Others - 1,477 2,595,611 1,148,032
35 EARNINGS PER SHARE - BASIC AND DILUTED There is no dilutive effect on the basic earnings per share which is based on:
2022 2021
Profit attributable to ordinary shareholders (Rupees in thousand) 10,311,674 5,922,470
Weighted average number of ordinary shares (Numbers) 351,599,848 351,599,848
Earnings per share (Rupees) 29.33 16.84
2022 2021 Note (Rupees in thousand)
36 CASH (USED IN) / GENERATED FROM OPERATIONS
Profit before taxation 12,907,285 7,070,502 Adjustments for non-cash charges and other items:
Depreciation 3,290,619 2,838,310 Gain on sale of property, plant and equipment (24,644) (52,602) Dividend income (3,328,797) (2,722,637) Allowance for expected credit losses 4,471 164 Net exchange gain (830,015) (26,275) Interest income on loans and advances to subsidiary companies (726,411) (313,445) Finance cost 2,160,365 1,229,179 Reversal of provision for slow moving, obsolete and damaged store items - (77) Gain on initial recognition of GIDC payable at amortised cost - (110,431) Working capital changes 36.1 (20,612,110) 575,689
(7,159,237) 8,488,377
Nishat Mills Limited
98 Page
For the year ended June 30, 2022Notes to the Financial Statements

36.2 Reconciliation of movement of liabilities to cash flows arising from financing activities.
2022 Liabilities from financing activities Long term Short term Unclaimed Total financing borrowings dividend ( Rupees in thousand )
Balance as at 30 June 2021 14,576,825 18,718,262 97,617 33,392,704 Long term financing obtained 3,707,601 - - 3,707,601 Repayment of long term financing (3,040,165) - - (3,040,165) Short term borrowings - net - 8,011,786 - 8,011,786 Dividend declared - - 1,406,399 1,406,399 Dividend paid - - (1,402,088) (1,402,088) Other changes - non-cash movement 76,464 - - 76,464 Balance as at 30 June 2022 15,320,725 26,730,048 101,928 42,152,701
2021 Liabilities from financing activities Long term Short term Unclaimed Total financing borrowings dividend ( Rupees in thousand )
Balance as at 30 June 2020 9,925,813 19,329,768 90,596 29,346,177 Long term financing obtained 6,421,187 - - 6,421,187 Repayment of long term financing (1,610,173) - - (1,610,173) Short term borrowings - net - (611,506) - (611,506) Dividend declared - - 1,406,399 1,406,399 Dividend paid - - (1,399,378) (1,399,378) Other changes - non-cash movement (160,002) - - (160,002) Balance as at 30 June 2021 14,576,825 18,718,262 97,617 33,392,704
2022 2021 (Rupees in thousand)
36.1 Working capital changes
(Increase) / decrease in current assets: - Stores, spare parts and loose tools (1,394,108) (348,956) - Stock-in-trade (13,853,925) 2,780,852 - Trade debts (3,115,605) (2,196,379) - Loans and advances (86,071) (22,161) - Short term deposits and prepayments (56,555) (13,199) - Other receivables (4,638,668) (1,137,043) (23,144,932) (936,886)
Increase in trade and other payables 2,532,822 1,512,575 (20,612,110) 575,689
Annual Report 2022
99Page

2022 2021 (Rupees in thousand)
36.3 Non-cash financing activities
Other changes - non-cash movement 76,464 (160,002)
37 EVENTS AFTER THE REPORTING PERIOD
37.1 The Board of Directors of the Company has proposed a cash dividend for the year ended 30 June 2022 of Rupees 4 per share (2021: Rupees 4 per share) at their meeting held on 20 September 2022. The Board of Directors also proposed to transfer Rupees 8,906 million (2021: Rupees 4,516 million) from un-appropriated profit to general reserve. However, these events have been considered as non-adjusting events under IAS 10 'Events after the Reporting Period' and have not been recognized in these financial statements.
38 REMUNERATION OF CHIEF EXECUTIVE OFFICER AND EXECUTIVES
The aggregate amount charged in the financial statements for remuneration including all benefits to Chief Executive Officer and Executives of the Company is as follows:
38.1 Chief Executive Officer and certain executives of the Company are provided with Company maintained vehicles and certain executives are also provided with free housing facility along with utilities.
38.2 Aggregate amount charged in the financial statements for meeting fee to five directors (2021: five directors) was Rupees 1.490 million (2021: Rupees 1.490 million).
38.3 No remuneration was paid to directors of the Company.
Chief Executive Officer Executives2022 2021 2022 2021
( Rupees in thousand )
Managerial remuneration 43,703 37,189 883,652 683,563 Allowances Cost of living allowance - - 1,226 1,023 House rent 15,726 13,521 228,328 174,176 Conveyance - - 1,014 904 Medical 3,932 3,380 75,131 57,482 Utilities - - 98,795 75,673 Special allowance - - 830 646 Contribution to provident fund trust - - 72,462 56,650 Leave encashment - - 24,217 18,091 63,361 54,090 1,385,655 1,068,208
Number of persons 1 1 326 261
Nishat Mills Limited
100 Page
For the year ended June 30, 2022Notes to the Financial Statements
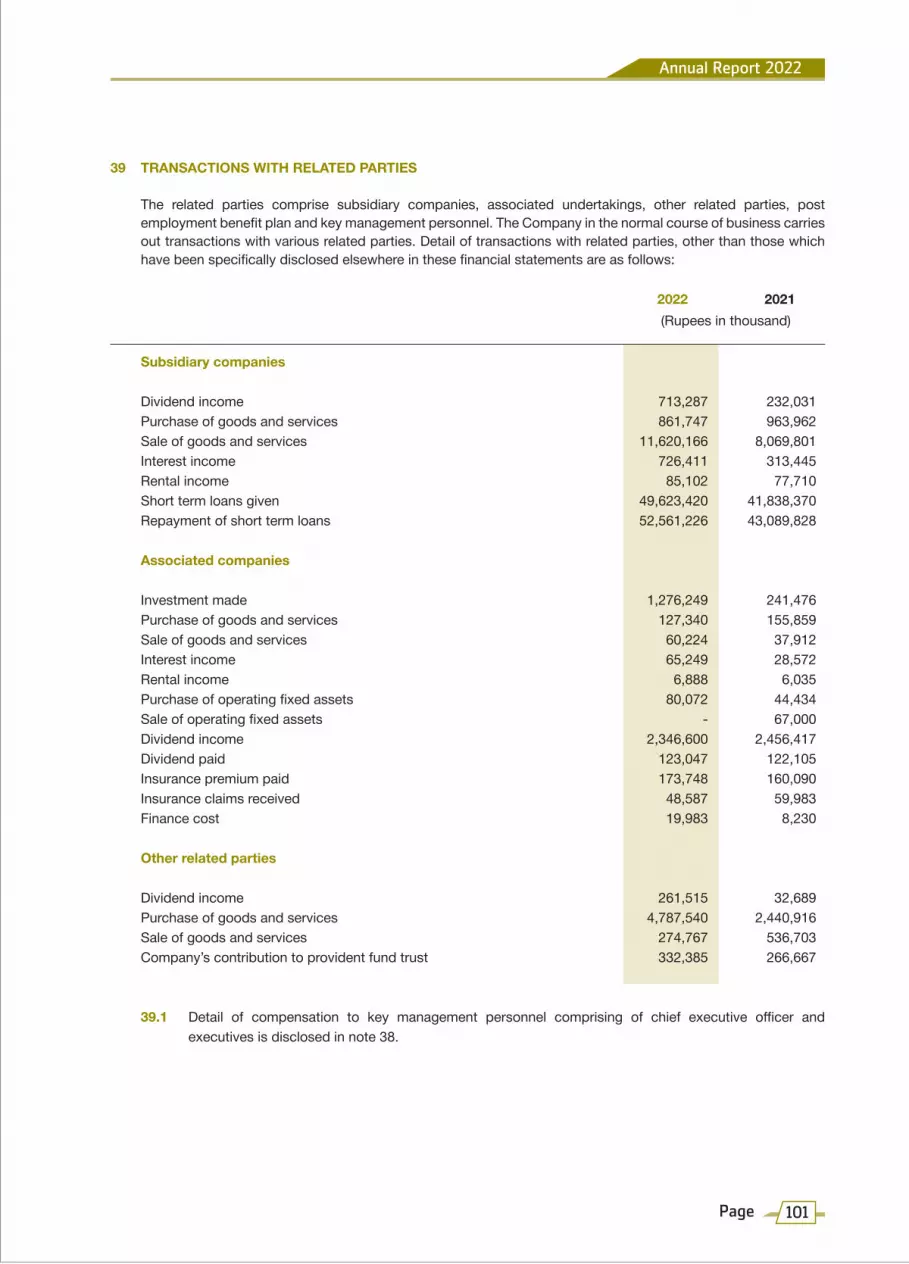
39 TRANSACTIONS WITH RELATED PARTIES
The related parties comprise subsidiary companies, associated undertakings, other related parties, post employment benefit plan and key management personnel. The Company in the normal course of business carries out transactions with various related parties. Detail of transactions with related parties, other than those which have been specifically disclosed elsewhere in these financial statements are as follows:
2022 2021 (Rupees in thousand)
Subsidiary companies
Dividend income 713,287 232,031 Purchase of goods and services 861,747 963,962 Sale of goods and services 11,620,166 8,069,801 Interest income 726,411 313,445 Rental income 85,102 77,710 Short term loans given 49,623,420 41,838,370 Repayment of short term loans 52,561,226 43,089,828
Associated companies
Investment made 1,276,249 241,476 Purchase of goods and services 127,340 155,859 Sale of goods and services 60,224 37,912 Interest income 65,249 28,572 Rental income 6,888 6,035 Purchase of operating fixed assets 80,072 44,434 Sale of operating fixed assets - 67,000 Dividend income 2,346,600 2,456,417 Dividend paid 123,047 122,105 Insurance premium paid 173,748 160,090 Insurance claims received 48,587 59,983 Finance cost 19,983 8,230
Other related parties
Dividend income 261,515 32,689 Purchase of goods and services 4,787,540 2,440,916 Sale of goods and services 274,767 536,703 Company’s contribution to provident fund trust 332,385 266,667
39.1 Detail of compensation to key management personnel comprising of chief executive officer and executives is disclosed in note 38.
Annual Report 2022
101Page

39.2 Following are the related parties with whom the Company had entered into transactions or have arrangements / agreements in place:
Transactions entered or agreements and / or arrangements in Percentage of place during the shareholding financial year ended
2022 2021
Nishat USA Inc. Wholly owned subsidiary company Yes Yes 100 Nishat Agriculture Farming (Private) Limited Common directorship No No None Nishat Dairy (Private) Limited Common directorship and shareholding Yes Yes 12.24 Nishat Sutas Dairy Limited Common directorship and shareholding Yes Yes 47.53 Nishat Hotels and Properties Limited Common directorship and shareholding Yes Yes 6.08 Nishat (Raiwind) Hotels and Properties Limited Common directorship No No None Nishat (Aziz Avenue) Hotels and Properties Limited Common directorship Yes No None Security General Insurance Company Limited Common directorship and shareholding Yes Yes 15.02 Nishat Commodities Wholly owned subsidiary company and (Private) Limited common directorship Yes Yes 100 Nishat Hospitality (Private) Limited Wholly owned subsidiary company Yes Yes 100 Nishat Power Limited Common directorship and subsidiary company Yes Yes 51.01 Nishat Energy Limited Shareholding No No 25 Pakgen Power Limited Common directorship and shareholding Yes Yes 27.55 Lalpir Power Limited Common directorship and shareholding Yes Yes 28.80 Nishat Paper Products Company Limited Common directorship and shareholding Yes No 25 Nishat Linen (Private) Limited Wholly owned subsidiary company Yes Yes 100 Nishat Linen Trading LLC Wholly owned subsidiary company No No 100 Nishat International FZE Wholly owned subsidiary company Yes Yes 100 China Guangzhou Nishat Wholly owned subsidiary of Nishat Global Co., Ltd. International FZE (subsidiary company) No No 100 Pakistan Aviators and Aviation (Private) Limited Common directorship Yes No None Nishat Developers (Private) Limited Common directorship No No None Nishat Real Estates Development Company (Private) Limited Common directorship Yes No None Hyundai Nishat Motor (Private) Limited Common directorship and shareholding Yes Yes 12 D.G. Khan Cement Company Limited Common directorship and shareholding Yes Yes 31.40 Adamjee Life Assurance Company Limited Common directorship Yes Yes None Adamjee Insurance Company Limited Common directorship and shareholding Yes Yes 0.03 MCB Bank Limited Common directorship and shareholding Yes Yes 7.43 MCB Islamic Bank Limited Wholly owned subsidiary of associated company No No None Nishat (Chunian) Limited Shareholding Yes Yes 13.61 Lalpir Solar Power (Private) Wholly owned subsidiary of Nishat Power Limited * Limited (subsidiary company) No No 51.01 Nishat Agrotech Farms Supplies (Private) Limited Common directorship No No None Nishat Chunian Power Executive of the Company is appointed as Limited (NCPL) Director on the Board of NCPL No No None Sanifa Agri Services Limited Associate of wholly owned subsidiary company Yes No None Nishat Mills Employees Provident Fund Trust Post-employment benefit plan Yes Yes None Golf View Land (Private) Limited Spouse of chief executive officer of the Company is director in Golf View Land (Private) Limited No No None *During the year, Lalpir Solar Power (Private) Limited has been wound up.
Name of the related party Basis of relationship
Nishat Mills Limited
102 Page
For the year ended June 30, 2022Notes to the Financial Statements

39.3 Particulars of companies incorporated outside Pakistan with whom the Company had entered into transactions or had agreements and / or arrangements in place are as follows:
Nishat USA Inc. USA Wholly owned subsidiary company 100
Nishat Linen Trading LLC UAE Wholly owned subsidiary company 100
Nishat International FZE UAE Wholly owned subsidiary company 100
China Guangzhou Nishat Global Co., Ltd. China Wholly owned subsidiary of Nishat International FZE 100
Name of the Company Country ofincorporation Basis of association Percentage of
shareholding
Annual Report 2022
103Page

Long
term
inve
stm
ents
:
Nis
hat U
SA In
c.
USA
N
isha
t Mills
20
09
3,5
47
USD
37,
500
In
vest
men
t in
86
Non
e N
one
Not
app
licab
le
Li
mite
d
shar
es o
f
su
bsid
iary
com
pany
Nis
hat L
inen
Tra
ding
LLC
U
AE
Nis
hat M
ills
2011
2
59,4
03
AED
10,
000,
000
In
vest
men
t in
Non
e N
one
Non
e N
ot a
pplic
able
Lim
ited
sh
ares
of
subs
idia
ry
co
mpa
ny
Nis
hat I
nter
natio
nal F
ZE
UAE
N
isha
t Mills
20
13
492
,042
AE
D 1
8,00
0,00
0
Inve
stm
ent i
n 15
,889
N
one
Non
e N
ot a
pplic
able
Lim
ited
sh
ares
of
subs
idia
ry
co
mpa
ny
Adva
nce:
Nis
hat I
nter
natio
nal F
ZE
UAE
N
isha
t Mills
20
14
9,0
70
AED
337
,500
Ad
vanc
e fo
r N
one
Non
e N
one
Not
app
licab
le
Li
mite
d
purc
hase
of
shar
es o
f
su
bsid
iary
com
pany
40
As o
n 30
Jun
e 20
22, d
iscl
osur
es re
latin
g to
inve
stm
ents
and
adv
ance
mad
e in
fore
ign
com
pani
es a
re a
s fo
llow
s:
Gain
/ (lo
ss) o
n d
ispo
sal o
f fo
reig
nin
vest
men
t
Defa
ult /
bre
ach
rela
ting
to fo
reig
n c
ompa
ny
Litig
atio
nsag
ains
tin
vest
eeco
mpa
ny
Amou
nt o
fre
turn
s re
ceiv
ed
Term
s an
dco
nditi
ons
ofin
vest
men
t /ad
vanc
eRu
pees
inth
ousa
nd
Mad
e du
ring
the
year
ende
d 30
Jun
e
Nam
e of
the
com
pany
Bene
ficia
low
ner
Fore
ign
curr
ency
Rupe
es in
thou
sand
Juris
dict
ion
Amou
nt o
f inv
estm
ent /
adv
ance
Nishat Mills Limited
104 Page
For the year ended June 30, 2022Notes to the Financial Statements

41
PRO
VID
ENT
FUN
D
As
at t
he re
porti
ng d
ate,
The
Nis
hat M
ills E
mpl
oyee
s Pr
ovid
ent F
und
Trus
t is
in th
e pr
oces
s of
regu
lariz
ing
its in
vest
men
ts in
acc
orda
nce
with
sec
tion
218
of th
e C
ompa
nies
Act
, 201
7 an
d th
e re
gula
tions
form
ulat
ed fo
r thi
s pu
rpos
e by
Sec
uriti
es a
nd E
xcha
nge
Com
mis
sion
of P
akis
tan.
42
NU
MB
ER O
F EM
PLO
YEES
2022
20
21
Num
ber o
f em
ploy
ees
as o
n 30
Jun
e
24
,086
20
,599
Av
erag
e nu
mbe
r of e
mpl
oyee
s du
ring
the
year
22,
935
19,3
69
Long
term
inve
stm
ents
:
Nis
hat U
SA In
c.
USA
N
isha
t Mills
20
09
3,5
47
USD
37,
500
In
vest
men
t in
40
Non
e N
one
Not
app
licab
le
Li
mite
d
shar
es o
f
su
bsid
iary
com
pany
Nis
hat L
inen
Tra
ding
LLC
U
AE
Nis
hat M
ills
2011
2
59,4
03
AED
10,
000,
000
In
vest
men
t in
Non
e N
one
Non
e N
ot a
pplic
able
Lim
ited
sh
ares
of
subs
idia
ry
co
mpa
ny
Nis
hat I
nter
natio
nal F
ZE
UAE
N
isha
t Mills
20
13
492
,042
AE
D 1
8,00
0,00
0
Inve
stm
ent i
n 7,
580
Non
e N
one
Not
app
licab
le
Li
mite
d
shar
es o
f
su
bsid
iary
com
pany
Ad
vanc
e:
N
isha
t Int
erna
tiona
l FZE
U
AE
Nis
hat M
ills
2014
9
,070
AE
D 3
37,5
00
Adva
nce
for
Non
e N
one
Non
e N
ot a
pplic
able
Lim
ited
pu
rcha
se o
f
sh
ares
of
subs
idia
ry
co
mpa
ny
40.1
As
on
30 J
une
2021
, dis
clos
ures
rela
ting
to in
vest
men
ts a
nd a
dvan
ce m
ade
in fo
reig
n co
mpa
nies
are
as
follo
ws:
Gai
n / (
loss
)on
dis
posa
l of
fore
ign
inve
stm
ent
Def
ault
/ b
reac
hre
latin
g to
fore
ign
com
pany
Litig
atio
nsag
ains
tin
vest
eeco
mpa
ny
Amou
nt o
fre
turn
s re
ceiv
ed
Rupe
es in
thou
sand
Term
s an
dco
nditi
ons
ofin
vest
men
t /ad
vanc
eR
upee
s in
thou
sand
Mad
e du
ring
the
year
ende
d 30
Jun
e
Nam
e of
the
com
pany
Ben
efic
ial
owne
rFo
reig
n cu
rren
cyJu
risdi
ctio
n
Amou
nt o
f inv
estm
ent /
adv
ance
Annual Report 2022
105Page

Nishat Mills Limited
106 Page
For the year ended June 30, 2022Notes to the Financial Statements43
SE
GMEN
T IN
FORM
ATIO
N
Reve
nue
from
con
tract
s w
ith c
usto
mer
s
Ex
tern
al
30,0
44,5
33
16,6
72,8
82
27,7
24,5
69
17,2
90,2
33
21,9
66,8
04
11,6
44,1
99
21,5
39,4
14
17,4
05,0
02
14,
388,
688
8,36
4,87
5 10
4,05
7 53
,819
-
- 11
5,76
8,06
5 71
,431
,010
In
ters
egm
ent
9,23
4,00
7 8,
202,
469
17,3
42,1
60
10,7
59,3
97
1,67
5,03
8 74
3,50
1 28
9,88
7 29
2,49
0 69
3 4,
156
11,3
79,5
28
6,81
4,58
5 (3
9,92
1,31
3)
(26,
816,
598)
-
-
39,
278,
540
24,8
75,3
51
45,0
66,7
29
28,0
49,6
30
23,6
41,8
42
12,3
87,7
00
21,8
29,3
01
17,6
97,4
92
14,3
89,3
81
8,36
9,03
1 11
,483
,585
6,
868,
404
(39,
921,
313)
(2
6,81
6,59
8)
115,
768,
065
71,4
31,0
10
Cost
of s
ales
(3
2,76
0,84
4)
(22,
337,
437)
(3
9,92
8,44
8)
(25,
977,
186)
(2
1,66
1,67
3)
(11,
019,
991)
(2
0,38
0,52
8)
(15,
615,
741)
(1
2,18
9,36
7)
(7,1
31,6
40)
(11,
432,
947)
(6
,847
,758
) 39
,921
,313
26
,816
,598
(9
8,43
2,49
4)
(62,
113,
155)
Gro
ss p
rofit
6,
517,
696
2,53
7,91
4 5,
138,
281
2,07
2,44
4 1,
980,
169
1,36
7,70
9 1,
448,
773
2,08
1,75
1 2,
200,
014
1,23
7,39
1 50
,638
20
,646
-
- 17
,335
,571
9,
317,
855
Dist
ribut
ion
cost
(6
16,8
51)
(321
,616
) (1
,739
,272
) (7
57,6
06)
(1,0
98,2
49)
(582
,011
) (1
,347
,789
) (8
52,1
60)
(863
,792
) (5
83,0
80)
- -
- -
(5,6
65,9
53)
(3,0
96,4
73)
Adm
inist
rativ
e ex
pens
es
(454
,935
) (3
89,1
66)
(352
,662
) (2
78,9
28)
(216
,261
) (1
71,8
47)
(357
,864
) (2
96,6
02)
(229
,017
) (1
48,3
98)
(60,
630)
(5
5,15
2)
- -
(1,6
71,3
69)
(1,3
40,0
93)
(1,0
71,7
86)
(710
,782
) (2
,091
,934
) (1
,036
,534
) (1
,314
,510
) (7
53,8
58)
(1,7
05,6
53)
(1,1
48,7
62)
(1,0
92,8
09)
(731
,478
) (6
0,63
0)
(55,
152)
-
- (7
,337
,322
) (4
,436
,566
)
Prof
it / (
loss
) bef
ore
taxa
tion
and
unal
loca
ted
in
com
e an
d ex
pens
es
5,44
5,91
0 1,
827,
132
3,04
6,34
7 1,
035,
910
665,
659
613,
851
(256
,880
) 93
2,98
9 1,
107,
205
505,
913
(9,9
92)
(34,
506)
-
- 9,
998,
249
4,88
1,28
9
Unal
loca
ted
inco
me
and
expe
nses
:
Oth
er e
xpen
ses
(502
,014
) (3
31,7
96)
Oth
er in
com
e
5
,571
,415
3,
750,
188
Fina
nce
cost
(2
,160
,365
) (1
,229
,179
)
Taxa
tion
(2,5
95,6
11)
(1,1
48,0
32)
Prof
it af
ter t
axat
ion
10,
311,
674
5,92
2,47
0
2022
2021
Tota
l - C
ompa
ny
2022
2021
Pow
er G
ener
atio
n
2022
2021
Gar
men
ts
2022
2021
Hom
e Te
xtile
and
Ter
ry
2022
2021
Dye
ing
2022
2021
Wea
ving
2022
2021
Spin
ning
2022
2021
Elim
inat
ion
of in
ter-s
egm
ent
trans
actio
ns
(Rup
ees
in th
ousa
nd)
43.1
Re
conc
iliat
ion
of re
port
able
seg
men
t ass
ets
and
liabi
litie
s
Tota
l ass
ets
for r
epor
tabl
e se
gmen
ts
25,3
88,9
36
20,3
82,3
45
13,9
84,6
43
10,0
71,6
14
13,4
36,0
58
7,88
4,05
0 16
,471
,284
12
,634
,317
9,
529,
041
5,88
5,32
7 8,
061,
122
7,15
6,36
6
86,8
71,0
84
64,0
14,0
19
Unal
loca
ted
asse
ts:
Long
term
inve
stm
ents
3
5,72
0,22
4 48
,620
,695
Oth
er re
ceiva
bles
9
,401
,466
4,
702,
709
Cash
and
ban
k ba
lanc
es
91,7
27
5,27
2,34
5
Oth
er c
orpo
rate
ass
ets
5,45
0,07
6 8,
502,
606
Tota
l ass
ets
as p
er s
tate
men
t of f
inan
cial
pos
ition
1
37,5
34,5
77
131,
112,
374
Tota
l lia
bilit
ies
for r
epor
tabl
e se
gmen
ts
2,30
6,43
4 1,
404,
775
1,93
3,56
7 1,
243,
109
1,40
2,60
5 1,
059,
416
1,50
5,58
8 2,
044,
090
1,15
3,99
6 1,
117,
157
1,92
0,78
1 1,
575,
018
10,2
22,9
71
8,44
3,56
5
Unal
loca
ted
liabi
litie
s:
Defe
rred
liabi
litie
s
2,
191,
059
1,05
5,99
2
Oth
er c
orpo
rate
liabi
litie
s
4
5,91
9,60
4 35
,865
,038
Tota
l lia
bilit
ies
as p
er s
tate
men
t of f
inan
cial
pos
ition
58
,333
,634
45
,364
,595
2022
2021
Tota
l - C
ompa
ny
2022
2021
Pow
er G
ener
atio
n
2022
2021
Gar
men
ts
2022
2021
Hom
e Te
xtile
and
Ter
ry
2022
2021
Dye
ing
2022
2021
Wea
ving
2022
2021
Spin
ning
(Rup
ees
in th
ousa
nd)

43.2 Geographical information
The Company's revenue from external customers by geographical locations is detailed below:
2022 2021 (Rupees in thousand)
Europe 35,049,099 22,408,582 America 13,910,074 7,618,856 Asia, Africa and Australia 26,554,846 17,361,115 Pakistan 40,254,046 24,042,457 115,768,065 71,431,010
43.3 All non-current assets of the Company as at reporting dates are located and operating in Pakistan.
43.4 Revenue from major customers
The Company's revenue is earned from a large mix of customers. 2022 2021 (Figures in thousand)
44 PLANT CAPACITY AND ACTUAL PRODUCTION
Spinning 100% plant capacity converted to 20s count based on 3 shifts per day for 1,095 shifts (2021: 1,095 shifts) (Kgs.) 98,973 90,821
Actual production converted to 20s count based on 3 shifts per day for 1,095 shifts (2021: 1,095 shifts) (Kgs.) 85,580 79,689
Weaving 100% plant capacity at 50 picks based on 3 shifts per day for 1,095 shifts (2021: 1,095 shifts) (Sq.Mtr.) 365,620 309,458
Actual production converted to 50 picks based on 3 shifts per day for 1,095 shifts (2021: 1,095 shifts) (Sq.Mtr.) 347,818 295,932
Dyeing and Finishing Production capacity for 3 shifts per day for 1,095 shifts (2021: 1,095 shifts) (Mtr.) 56,400 56,400
Actual production on 3 shifts per day for 1,095 shifts (2021: 1,095 shifts) (Mtr.) 51,567 33,105
Power Plant Generation capacity (MWH) 1,242 989
Actual generation (MWH) 431 389
Processing, Stitching, Apparel and Terry
The plant capacity of these divisions is indeterminable due to multi product plants involving varying processes of manufacturing and run length of order lots.
Annual Report 2022
107Page

44.1 Reason for low production
Under utilization of available capacity for spinning, weaving, dyeing and finishing is mainly due to normal maintenance. Actual power generation in comparison to installed is low due to periodical, scheduled and unscheduled maintenance and low demand.
45 FINANCIAL RISK MANAGEMENT
45.1 Financial risk factors The Company's activities expose it to a variety of financial risks: market risk (including currency risk,
other price risk and interest rate risk), credit risk and liquidity risk. The Company's overall risk management programme focuses on the unpredictability of financial markets and seeks to minimize potential adverse effects on the Company's financial performance. The Company uses derivative financial instruments to hedge certain risk exposures.
Risk management is carried out by the Company's finance department under policies approved by the Board of Directors. The Company's finance department evaluates and hedges financial risks. The Board provides principles for overall risk management, as well as policies covering specific areas such as currency risk, other price risk, interest rate risk, credit risk, liquidity risk, use of derivative financial instruments and non-derivative financial instruments and investment of excess liquidity.
a) Market risk
i) Currency risk
Currency risk is the risk that the fair value or future cash flows of a financial instrument will fluctuate because of changes in foreign exchange rates. Currency risk arises mainly from future commercial transactions or receivables and payables that exist due to transactions in foreign currencies.
The Company is exposed to currency risk arising from various currency exposures, primarily with respect to the United States Dollar (USD), Arab Emirates Dirham (AED), Euro, Japanese Yen (JPY) and Swiss Franc (CHF). Currently, the Company's foreign exchange risk exposure is restricted to bank balances and the amounts receivable / payable from / to the foreign entities. The Company's exposure to currency risk was as follows:
2022 2021
Cash at banks - USD 201,401 195,692 Trade debts - USD 65,215,681 22,937,415 Trade debts - Euro 4,467,763 1,652,710 Trade debts - AED 3,288,143 5,840,582 Trade and other payables - USD (1,705,526) (2,094,954) Trade and other payables - Euro (52,213) (170,203) Trade and other payables - JPY (2,370,216) (652,985) Trade and other payables - CHF (17,977) - Net exposure - USD 63,711,556 21,038,153 Net exposure - Euro 4,415,550 1,482,507 Net exposure - AED 3,288,143 5,840,582 Net exposure – JPY (2,370,216) (652,985) Net exposure – CHF (17,977) -
Nishat Mills Limited
108 Page
For the year ended June 30, 2022Notes to the Financial Statements
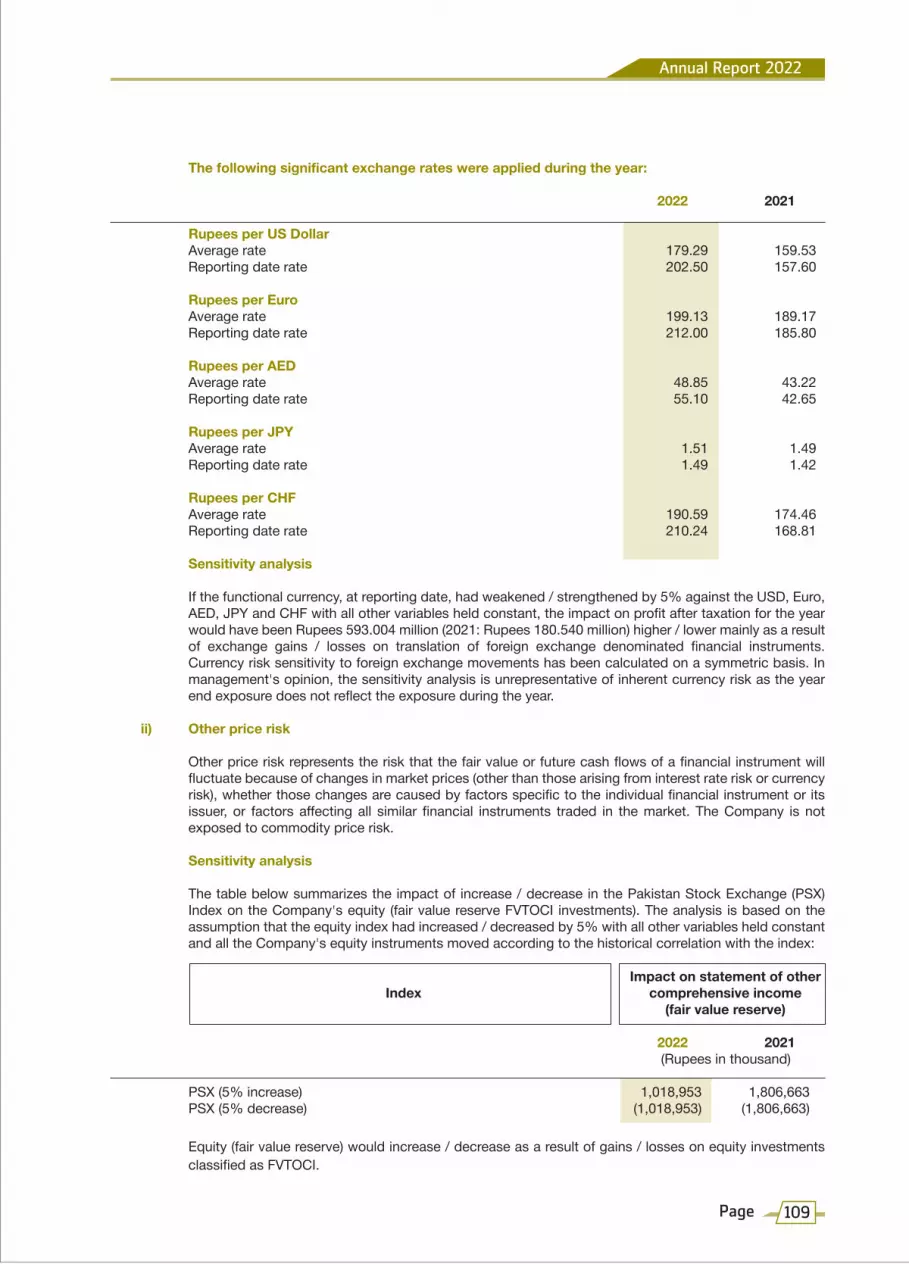
The following significant exchange rates were applied during the year:
2022 2021
Rupees per US Dollar Average rate 179.29 159.53 Reporting date rate 202.50 157.60
Rupees per Euro Average rate 199.13 189.17 Reporting date rate 212.00 185.80
Rupees per AED Average rate 48.85 43.22 Reporting date rate 55.10 42.65
Rupees per JPY Average rate 1.51 1.49 Reporting date rate 1.49 1.42
Rupees per CHF Average rate 190.59 174.46 Reporting date rate 210.24 168.81
Sensitivity analysis
If the functional currency, at reporting date, had weakened / strengthened by 5% against the USD, Euro, AED, JPY and CHF with all other variables held constant, the impact on profit after taxation for the year would have been Rupees 593.004 million (2021: Rupees 180.540 million) higher / lower mainly as a result of exchange gains / losses on translation of foreign exchange denominated financial instruments. Currency risk sensitivity to foreign exchange movements has been calculated on a symmetric basis. In management's opinion, the sensitivity analysis is unrepresentative of inherent currency risk as the year end exposure does not reflect the exposure during the year.
ii) Other price risk
Other price risk represents the risk that the fair value or future cash flows of a financial instrument will fluctuate because of changes in market prices (other than those arising from interest rate risk or currency risk), whether those changes are caused by factors specific to the individual financial instrument or its issuer, or factors affecting all similar financial instruments traded in the market. The Company is not exposed to commodity price risk.
Sensitivity analysis
The table below summarizes the impact of increase / decrease in the Pakistan Stock Exchange (PSX) Index on the Company's equity (fair value reserve FVTOCI investments). The analysis is based on the assumption that the equity index had increased / decreased by 5% with all other variables held constant and all the Company's equity instruments moved according to the historical correlation with the index:
Impact on statement of other Index comprehensive income (fair value reserve)
2022 2021 (Rupees in thousand)
PSX (5% increase) 1,018,953 1,806,663 PSX (5% decrease) (1,018,953) (1,806,663)
Equity (fair value reserve) would increase / decrease as a result of gains / losses on equity investments classified as FVTOCI.
Annual Report 2022
109Page

iii) Interest rate risk This represents the risk that the fair value or future cash flows of a financial instrument will fluctuate
because of changes in market interest rates.
The Company's interest rate risk arises from long term financing, short term borrowings, bank balances in saving accounts, term deposit receipts, loans to employees and advances to subsidiary company. Financial instruments at variable rates expose the Company to cash flow interest rate risk. Financial instruments at fixed rate expose the Company to fair value interest rate risk.
At the reporting date, the interest rate profile of the Company’s interest bearing financial instruments was:
2022 2021 (Rupees in thousand)
Fixed rate instruments
Financial liabilities Long term financing 15,319,295 14,326,300 Short term borrowings 21,474,683 17,503,652
Financial assets Term deposit receipts - 5,075,000 Loans to employees 165,109 265,626
Floating rate instruments
Financial assets Bank balances - saving accounts 24 242 Advances to subsidiary company 4,364,178 7,301,984
Financial liabilities Long term financing 1,430 250,525 Short term borrowings 5,255,365 1,214,610 Fair value sensitivity analysis for fixed rate instruments The Company does not account for any fixed rate financial assets and liabilities at fair value through profit
or loss. Therefore, a change in interest rate at the reporting date would not affect profit or loss of the Company.
Cash flow sensitivity analysis for variable rate instruments If interest rates at the year end date, fluctuates by 1% higher / lower with all other variables held constant,
profit after taxation for the year would have been Rupees 8.480 million lower / higher (2021: Rupees 55.452 million higher / lower), mainly as a result of higher / lower interest expense / income on floating rate financial instruments. This analysis is prepared assuming the amounts of financial instruments outstanding at reporting dates were outstanding for the whole year.
b) Credit risk Credit risk represents the risk that one party to a financial instrument will cause a financial loss for the
other party by failing to discharge an obligation. The carrying amount of financial assets represents the maximum credit exposure. The maximum exposure to credit risk at the reporting date was as follows:
2022 2021 (Rupees in thousand)
Long term investments 31,188,221 44,088,692 Loans and advances 5,035,174 8,043,458 Deposits 177,682 157,470 Trade debts 10,366,408 6,549,252 Other receivables 103,227 85,254 Accrued interest 379,668 28,885 Bank balances 61,269 5,253,293
47,311,649 64,206,304
Nishat Mills Limited
110 Page
For the year ended June 30, 2022Notes to the Financial Statements

Rating 2022 2021
Short term Long term Agency (Rupees in thousand)
The credit quality of financial assets that are neither past due nor impaired can be assessed by reference to external credit ratings (if available) or to historical information about counterparty default rate:
Banks
National Bank of Pakistan A1+ AAA PACRA 409 526Allied Bank Limited A1+ AAA PACRA 31 4,533Askari Bank Limited A1+ AA+ PACRA 51 46Bank Alfalah Limited A1+ AA+ PACRA 917 356Faysal Bank Limited A1+ AA PACRA 3,262 8Habib Bank Limited A-1+ AAA VIS 17,460 18,722Habib Metropolitan Bank Limited A1+ AA+ PACRA 1,288 23,163JS Bank Limited A1+ AA- PACRA - 24MCB Bank Limited A1+ AAA PACRA 5,707 5,078,905Samba Bank Limited A-1 AA VIS 13 274Silk Bank Limited A-2 A - VIS 68 68Standard Chartered Bank (Pakistan) Limited A1+ AAA PACRA 1,097 70,560United Bank Limited A-1+ AAA VIS 4,723 1,710Al-Baraka Bank (Pakistan) Limited A-1 A PACRA 264 268Bank Islamic Pakistan Limited A1 A+ PACRA 394 190Meezan Bank Limited A-1+ AAA VIS 21,812 36,469Dubai Islamic Bank Pakistan Limited A-1+ AA VIS 594 352The Bank of Punjab A1+ AA+ PACRA 686 285Soneri Bank Limited A1+ AA- PACRA 158 2,470Summit Bank Limited A-3 BBB- VIS 2 257Industrial and Commercial Bank of China P-1 A1 Moody’s 6 97MCB Islamic Bank Limited A1 A PACRA 166 443Bank Al-Habib Limited A1+ AAA PACRA 1,928 13,412Citi Bank N.A P-1 Aa3 Moody's 233 149Bank of Khyber A1 A PACRA - 6 61,269 5,253,293
Long term investments
Adamjee Insurance Company Limited A++ PACRA 3,245 4,263Security General Insurance Company Limited AA+ VIS 372,235 673,603Alhamra Islamic Stock Fund AA- PACRA 10,205 12,661Nishat (Chunian) Limited A-2 A VIS 1,464,155 1,643,947MCB Bank Limited A1+ AAA PACRA 10,824,120 14,067,484Pakistan Petroleum Limited Unknown - 40,506 52,098D.G. Khan Cement Company Limited A1+ AA- PACRA 8,598,388 16,222,749Pakgen Power Limited A1 AA PACRA 1,895,682 2,528,260Lalpir Power Limited A1 AA PACRA 1,394,768 1,953,769United Bank Limited A-1+ AAA VIS 39,934 -Nishat Paper Products Company Limited A1 A PACRA 621,034 491,661Nishat Hotels and Properties Limited A2 A- PACRA 1,364,983 1,460,472Hyundai Nishat Motor (Private) Limited Unknown - 2,863,267 4,374,025Nishat Dairy (Private) Limited Unknown - 485,400 437,400Nishat Sutas Dairy Limited Unknown - 1,210,299 166,300 31,188,221 44,088,692 31,249,490 49,341,985
Annual Report 2022
111Page

Lossallowance
Tradedebts
Expectedloss rate
Lossallowance
Tradedebts
Local sales Export sales
(Rupees in thousand)%% (Rupees in thousand)
Expectedloss rate
Lossallowance
Tradedebts
Expectedloss rate
Lossallowance
Tradedebts
Local sales Export sales
(Rupees in thousand)%% (Rupees in thousand)
Expectedloss rate
The Company's exposure to credit risk and allowance for expected credit losses related to trade debts is disclosed in Note 20.
Due to the Company's long standing business relationships with these counterparties and after giving due consideration to their strong financial standing, the management does not expect non-performance by these counterparties on their obligations to the Company. Accordingly, the credit risk is minimal.
Trade debts
The Company applies the IFRS 9 simplified approach to measure expected credit losses which uses a lifetime expected loss allowance for all trade debts.
To measure the expected credit losses, trade receivables have been grouped based on shared credit risk characteristics and the days past due. These trade receivables are netted off with the collateral obtained, if any, from these customers to calculate the net exposure towards these customers. The Company has concluded that the expected loss rates for trade debts against local sales are different from the expected loss rates for trade debts against export sales.
The expected loss rates are based on the payment profiles of sales over a period of 36 months before 30 June 2022 and the corresponding historical credit losses experienced within this period. The historical loss rates are adjusted to reflect current and forward-looking information on macroeconomic factors affecting the ability of the customers to settle the receivables. The Company has identified the Gross Domestic Product, Unemployment, Interest and the inflation Index to be the most relevant factors, and accordingly adjusts the historical loss rates based on expected changes in these factors.
On that basis, the loss allowance as at 30 June 2022 and 30 June 2021 was determined as follows:
At 30 June 2022
Not past due 0% 4,388,981 - 0% 5,935,410 - Up to 30 days 4.26% 30,913 1,318 0.00% - - 31 to 60 days 22.98% 12,917 2,968 0.00% - - 61 to 90 days 47.15% 403 190 0.00% - - 91 to 180 days 82.12% 5,728 4,704 0.00% - - 181 to 360 days 81.14% 716 581 0.00% - - Above 360 days 100.00% 5,958 5,958 100.00% 4,412 4,412 4,445,616 15,719 5,939,822 4,412 Trade debts which are not subject to risk of default - - 1,101 - Total 4,445,616 15,719 5,940,923 4,412
At 30 June 2021
Not past due 0% 2,477,007 - 0% 4,066,261 - Up to 30 days 0.20% 109 - 0.00% - - 31 to 60 days 15.27% 1,984 303 0.00% - - 61 to 90 days 30.63% 35 11 0.00% - - 91 to 180 days 57.69% 36 21 0.00% - - 181 to 360 days 68.48% 13,182 9,027 0.00% - - Above 360 days 100.00% 6,298 6,298 100.00% - - 2,498,651 15,660 4,066,261 - Trade debts which are not subject to risk of default - - - - Total 2,498,651 15,660 4,066,261 -
Nishat Mills Limited
112 Page
For the year ended June 30, 2022Notes to the Financial Statements

Carryingamount
Contractualcash flows
6 monthsor less
6-12months
1-2Years
More than2 Years
(Rupees in thousand)
Carryingamount
Contractualcash flows
6 monthsor less
6-12months
1-2Years
More than2 Years
(Rupees in thousand)
c) Liquidity risk
Liquidity risk is the risk that an entity will encounter difficulty in meeting obligations associated with financial liabilities.
The Company manages liquidity risk by maintaining sufficient cash and the availability of funding through an adequate amount of committed credit facilities. At 30 June 2022, the Company had Rupees 37,915.102 million (2021: Rupees 32,361.240 million) available borrowing limits from financial institutions and Rupees 91.727 million (2021: Rupees 5,272.345 million) cash and bank balances. The management believes the liquidity risk to be low. Following are the contractual maturities of financial liabilities, including interest payments. The amount disclosed in the table are undiscounted cash flows:
Contractual maturities of financial liabilities as at 30 June 2022
Non-derivative financial liabilities:
Long term financing 15,320,725 16,662,468 1,931,530 1,423,722 3,130,176 10,177,040 Trade and other payables 9,707,763 9,707,763 9,707,763 - - - Unclaimed dividend 101,928 101,928 101,928 - - - Short term borrowings 26,730,048 27,821,891 27,436,519 385,372 - - Accrued mark-up 376,723 376,723 376,723 - - -
Derivative financial liabilities 9,595 9,595 9,595 - - - 52,246,782 54,680,368 39,564,058 1,809,094 3,130,176 10,177,040
Contractual maturities of financial liabilities as at 30 June 2021
Non-derivative financial liabilities:
Long term financing 14,576,825 15,810,353 1,594,565 1,744,091 3,250,652 9,221,045 Trade and other payables 7,342,335 7,342,335 7,342,335 - - - Unclaimed dividend 97,617 97,617 97,617 - - - Short term borrowings 18,718,262 19,074,836 19,024,948 49,888 - - Accrued mark-up 196,382 196,382 196,382 - - -
Derivative financial liabilities 57,429 57,429 57,429 - - - 40,988,850 42,578,952 28,313,276 1,793,979 3,250,652 9,221,045
The contractual cash flows relating to the above financial liabilities have been determined on the basis of interest rates / mark-up rates effective as at 30 June. The rates of interest / mark up have been disclosed in note 5 and note 9 to these financial statements.
Annual Report 2022
113Page

45.2 Financial instruments by categories
Amortised cost
(Rupees in thousand)
As at 30 June 2022 Assets as per statement of financial position Long term investments - - 31,188,221 31,188,221 Loans and advances - 5,035,174 - 5,035,174 Deposits - 177,682 - 177,682 Trade debts - 10,366,408 - 10,366,408 Other receivables 57,518 45,709 - 103,227 Accrued interest - 379,668 - 379,668 Cash and bank balances - 91,727 - 91,727 57,518 16,096,368 31,188,221 47,342,107
(Rupees in thousand)
Liabilities as per statement of financial position
Long term financing 15,320,725 - 15,320,725 Accrued mark-up 376,723 - 376,723 Short term borrowings 26,730,048 - 26,730,048 Trade and other payables 9,707,763 9,595 9,717,358 Unclaimed dividend 101,928 - 101,928
52,237,187 9,595 52,246,782
Amortised cost
(Rupees in thousand)
As at 30 June 2021 Assets as per statement of financial position Long term investments - - 44,088,692 44,088,692 Loans and advances - 8,043,458 - 8,043,458 Deposits - 157,470 - 157,470 Trade debts - 6,549,252 - 6,549,252 Other receivables 8,672 76,582 - 85,254 Accrued interest - 28,885 - 28,885 Cash and bank balances - 5,272,345 - 5,272,345 8,672 20,127,992 44,088,692 64,225,356
TotalFVTOCIFVTPL
TotalFVTOCIFVTPL
TotalFVTPLAmortized cost
Nishat Mills Limited
114 Page
For the year ended June 30, 2022Notes to the Financial Statements

Liabilities as per statement of financial position
Long term financing 14,576,825 - 14,576,825 Accrued mark-up 196,382 - 196,382 Short term borrowings 18,718,262 - 18,718,262 Trade and other payables 7,342,335 57,429 7,399,764 Unclaimed dividend 97,617 - 97,617 40,931,421 57,429 40,988,850
45.3 Reconciliation of financial assets and financial liabilities to the line items presented in the statement of financial position is as follows:
Assets Long term investments 31,188,221 4,532,003 35,720,224 Loans and advances 5,035,174 157,605 5,192,779 Deposits and prepayments 177,682 136,897 314,579 Trade debts 10,366,408 - 10,366,408 Other receivables 103,227 9,298,239 9,401,466 Accrued interest 379,668 - 379,668 Cash and bank balances 91,727 - 91,727 47,342,107 14,124,744 61,466,851
Liabilities Long term financing 15,320,725 - 15,320,725 Accrued mark-up 376,723 - 376,723 Short term borrowings 26,730,048 - 26,730,048 Trade and other payables 9,717,358 2,279,934 11,997,292 Unclaimed dividend 101,928 - 101,928 52,246,782 2,279,934 54,526,716
TotalFVTPLAmortized cost
Assets as perstatement of
financialposition
Financialassets
Non-financialassets
2022
(Rupees in thousand)
Liabilities asper statement
of financialposition
Financialliabilities
Non-financialliabilities
2022
(Rupees in thousand)
(Rupees in thousand)
Annual Report 2022
115Page

Assets Long term investments 44,088,692 4,532,003 48,620,695 Loans and advances 8,043,458 100,518 8,143,976 Deposits and prepayments 157,470 80,342 237,812 Trade debts 6,549,252 - 6,549,252 Other receivables 85,254 4,617,455 4,702,709 Accrued interest 28,885 - 28,885 Cash and bank balances 5,272,345 - 5,272,345 64,225,356 9,330,318 73,555,674
Liabilities Long term financing 14,576,825 - 14,576,825 Accrued mark-up 196,382 - 196,382 Short term borrowings 18,718,262 - 18,718,262 Trade and other payables 7,399,764 2,112,540 9,512,304 Unclaimed dividend 97,617 - 97,617 40,988,850 2,112,540 43,101,390
45.4 Offsetting financial assets and financial liabilities
As on reporting date, recognized financial instruments are not subject to off setting as there are no enforceable master netting arrangements and similar agreements.
45.5 Capital risk management
The Company's objectives when managing capital are to safeguard the Company's ability to continue as a going concern in order to provide returns for shareholders and benefits for other stakeholders and to maintain an optimal capital structure to reduce the cost of capital. In order to maintain or adjust the capital structure, the Company may adjust the amount of dividends paid to shareholders, issue new shares or sell assets to reduce debt. Consistent with others in the industry and the requirements of the lenders, the Company monitors the capital structure on the basis of gearing ratio. This ratio is calculated as borrowings divided by total capital employed. Borrowings represent long term financing and short term borrowings obtained by the Company as referred to in note 5 and note 9 respectively. Total capital employed includes 'total equity' as shown in the statement of financial position plus 'borrowings'. The Company's strategy, remained unchanged from last year.
Assets as perstatement of
financialposition
Financialassets
Non-financialassets
2021
(Rupees in thousand)
Liabilities asper statement
of financialposition
Financialliabilities
Non-financialliabilities
2021
(Rupees in thousand)
Nishat Mills Limited
116 Page
For the year ended June 30, 2022Notes to the Financial Statements

Level 1 Level 2 Level 3 Total
Level 1 Level 2 Level 3 Total
2022 2021 Borrowings Rupees in thousand 42,050,773 33,295,087 Total equity Rupees in thousand 79,200,943 85,747,779 Total capital employed Rupees in thousand 121,251,716 119,042,866
Gearing ratio Percentage 34.68 27.97
The increase in the gearing ratio resulted primarily from increase in borrowings of the Company.
46 RECOGNIZED FAIR VALUE MEASUREMENTS - FINANCIAL INSTRUMENTS
i) Fair value hierarchy
Judgements and estimates are made in determining the fair values of the financial instruments that are recognized and measured at fair value in these financial statements. To provide an indication about the reliability of the inputs used in determining fair value, the Company has classified its financial instruments into the following three levels. An explanation of each level follows underneath the table.
Recurring fair value measurements At 30 June 2022 (Rupees in thousand)
Financial assets Fair value through other comprehensive income 24,271,003 - 6,917,218 31,188,221 Derivative financial assets - 57,518 - 57,518 Total financial assets 24,271,003 57,518 6,917,218 31,245,739
Financial liabilities Derivative financial liabilities - 9,595 - 9,595 Total financial liabilities - 9,595 - 9,595
Recurring fair value measurements At 30 June 2021 (Rupees in thousand)
Financial assets Fair value through other comprehensive income 36,485,231 - 7,603,461 44,088,692 Derivative financial assets - 8,672 - 8,672 Total financial assets 36,485,231 8,672 7,603,461 44,097,364
Financial liabilities Derivative financial liabilities - 57,429 - 57,429 Total financial liabilities - 57,429 - 57,429
Annual Report 2022
117Page
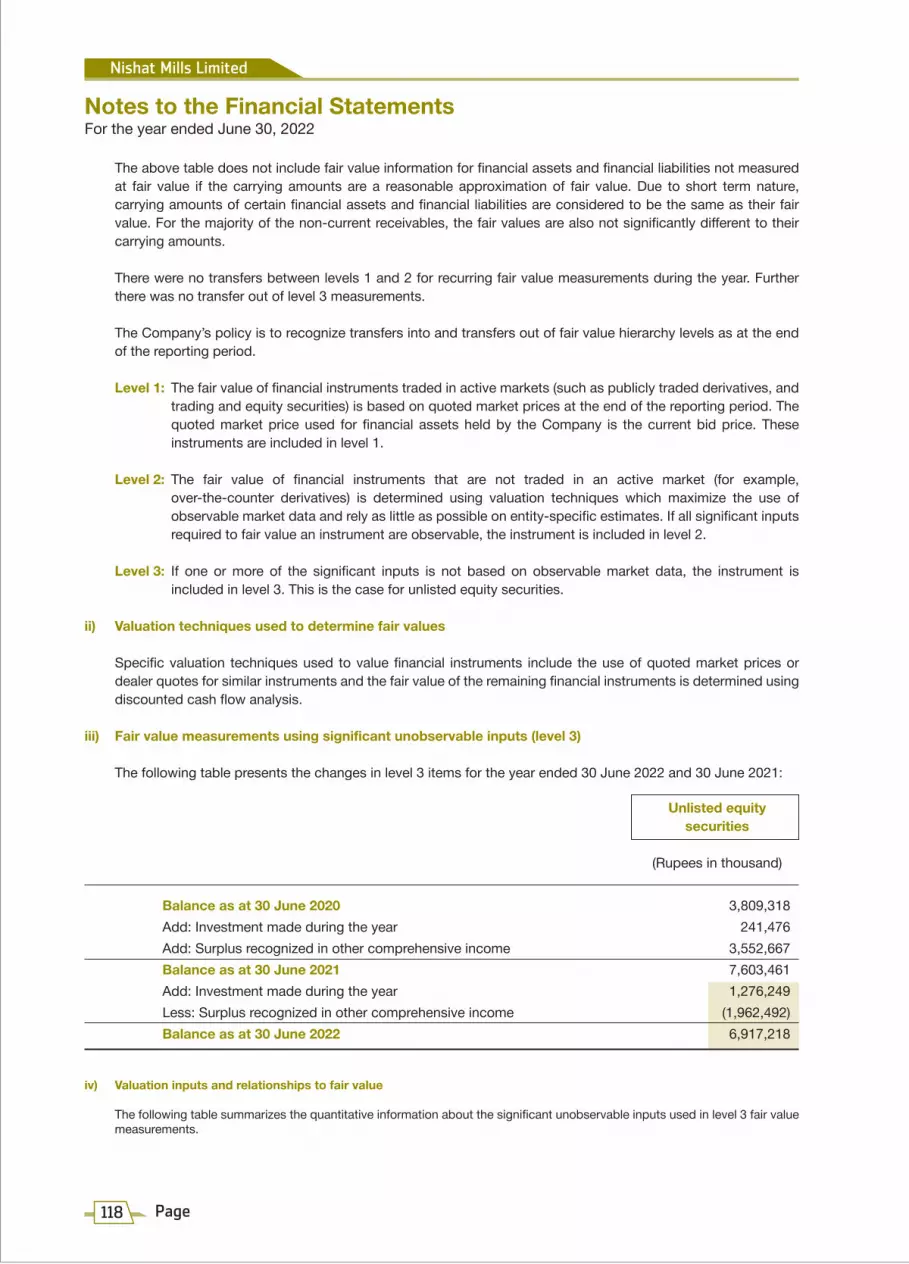
The above table does not include fair value information for financial assets and financial liabilities not measured at fair value if the carrying amounts are a reasonable approximation of fair value. Due to short term nature, carrying amounts of certain financial assets and financial liabilities are considered to be the same as their fair value. For the majority of the non-current receivables, the fair values are also not significantly different to their carrying amounts.
There were no transfers between levels 1 and 2 for recurring fair value measurements during the year. Further there was no transfer out of level 3 measurements.
The Company’s policy is to recognize transfers into and transfers out of fair value hierarchy levels as at the end of the reporting period.
Level 1: The fair value of financial instruments traded in active markets (such as publicly traded derivatives, and trading and equity securities) is based on quoted market prices at the end of the reporting period. The quoted market price used for financial assets held by the Company is the current bid price. These instruments are included in level 1.
Level 2: The fair value of financial instruments that are not traded in an active market (for example, over-the-counter derivatives) is determined using valuation techniques which maximize the use of observable market data and rely as little as possible on entity-specific estimates. If all significant inputs required to fair value an instrument are observable, the instrument is included in level 2.
Level 3: If one or more of the significant inputs is not based on observable market data, the instrument is included in level 3. This is the case for unlisted equity securities.
ii) Valuation techniques used to determine fair values
Specific valuation techniques used to value financial instruments include the use of quoted market prices or dealer quotes for similar instruments and the fair value of the remaining financial instruments is determined using discounted cash flow analysis.
iii) Fair value measurements using significant unobservable inputs (level 3)
The following table presents the changes in level 3 items for the year ended 30 June 2022 and 30 June 2021:
Unlisted equity securities
(Rupees in thousand)
Balance as at 30 June 2020 3,809,318 Add: Investment made during the year 241,476 Add: Surplus recognized in other comprehensive income 3,552,667 Balance as at 30 June 2021 7,603,461 Add: Investment made during the year 1,276,249 Less: Surplus recognized in other comprehensive income (1,962,492) Balance as at 30 June 2022 6,917,218
iv) Valuation inputs and relationships to fair value
The following table summarizes the quantitative information about the significant unobservable inputs used in level 3 fair value measurements.
Nishat Mills Limited
118 Page
For the year ended June 30, 2022Notes to the Financial Statements

There were no significant inter-relationships between unobservable inputs that materially affect fair values.
Valuation processes
Independent valuer performs the valuations of non-property items required for financial reporting purposes, including level 3 fair values. The independent valuer reports directly to the Chief Financial Officer. Discussions of valuation processes and results are held between the Chief Financial Officer and the valuation team at least once every year, in line with the Company’s annual reporting period.
(Rupees in thousand)
Fair value through other comprehensive income
Description Fair value at Unobservable inputs
Range of inputs(probability-
weighted average)
Relationship ofunobservable
inputs tofair value30 June 2022 30 June 202230 June 2021
Terminal growth 4.00% factor
Risk adjusted 17.14% discount rate
Increase / decrease in terminal growth factor by 1% and decrease / increase in discount rate by 1% would increase / decrease fair value by Rupees +201.271 million / -148.453 million.
Nishat Paper Products 621,034 491,661Company Limited
Terminal growth 4.00% factor
Risk adjusted 19.32% discount rate
Increase / decrease in terminal growth factor by 1% and decrease / increase in discount rate by 1% would increase / decrease fair value by Rupees +64.200 million / - 49.800 million.
Nishat Dairy (Private) Limited 485,400 437,400
Terminal growth 4.00% factor
Risk adjusted 17.65% discount rate
Increase / decrease in terminal growth factor by 1% and decrease / increase in discount rate by 1% would increase / decrease fair value by Rupees +43.155 million / -32.826 million.
Security General Insurance 372,235 673,603Company Limited
Terminal growth 4.00% factor
Risk adjusted 14.14% discount rate
Increase / decrease in terminal growth factor by 1% and decrease / increase in discount rate by 1% would increase / decrease fair value by Rupees +384.179 million / -262.781 million.
Nishat Hotels and 1,364,983 1,460,472Properties Limited
Terminal growth 4.00% factor
Risk adjusted 20.94% discount rate
Increase / decrease in terminal growth factor by 1% and decrease / increase in discount rate by 1% would increase / decrease fair value by Rupees +236.803 million / -193.541 million.
Hyundai Nishat Motor 2,863,267 4,374,025(Private) Limited
Terminal growth 4.00% factor
Risk adjusted 14.22% discount rate
Increase / decrease in terminal growth factor by 1% and decrease / increase in discount rate by 1% would increase / decrease fair value by Rupees +513.547 million / -350.539 million.
Nishat Sutas Dairy Limited 1,210,299 166,300
Annual Report 2022
119Page

The main level 3 inputs used by the Company are derived and evaluated as follows:
Discount rates for financial instruments are determined using a capital asset pricing model to calculate a rate that reflects current market assessments of the time value of money and the risk specific to the asset.
Earnings growth factor for unlisted equity securities are estimated based on market information for similar types of companies. Changes in level 2 and 3 fair values are analyzed at the end of yearly reporting period during the valuation discussion between the Chief Financial Officer and the independent valuer. As part of this discussion the independent valuer presents a report that explains the reason for the fair value movements.
47 FAIR VALUE MEASUREMENTS - NON-FINANCIAL ASSETS
i) Fair value hierarchy
Judgements and estimates are made for non-financial assets not measured at fair value in these financial statements but for which the fair value is described in these financial statements. To provide an indication about the reliability of the inputs used in determining fair value, the Company has classified its non-financial assets into the following three levels.
At 30 June 2022 Level 1 Level 2 Level 3 Total (Rupees in thousand)
Investment properties - 5,388,378 - 5,388,378 Total non-financial assets - 5,388,378 - 5,388,378
At 30 June 2021 Level 1 Level 2 Level 3 Total (Rupees in thousand)
Investment properties - 4,887,528 - 4,887,528 Total non-financial assets - 4,887,528 - 4,887,528
The Company’s policy is to recognize transfers into and transfers out of fair value hierarchy levels as at the end of the reporting period.
There were no transfers between levels 1 and 2 for recurring fair value measurements during the year. Further, there was no transfer in and out of level 3 measurements.
ii) Valuation techniques used to determine level 2 fair values
The Company obtains independent valuations for its investment properties at least annually. At the end of each reporting period, the management updates the assessment of the fair value of each property, taking into account the most recent independent valuations. The management determines a property’s value within a range of reasonable fair value estimates. The best evidence of fair value is current prices in an active market for similar properties.
Valuation processes
The Company engages external, independent and qualified valuer to determine the fair value of the Company’s investment properties at the end of every financial year. As at 30 June 2022, the fair values of the investment properties have been determined by Al-Hadi Financial & Legal Consultants (an approved valuer).
Changes in fair values are analyzed at the end of each year during the valuation discussion between the Chief Financial Officer and the valuer. As part of this discussion the team presents a report that explains the reason for the fair value movements.
Nishat Mills Limited
120 Page
For the year ended June 30, 2022Notes to the Financial Statements
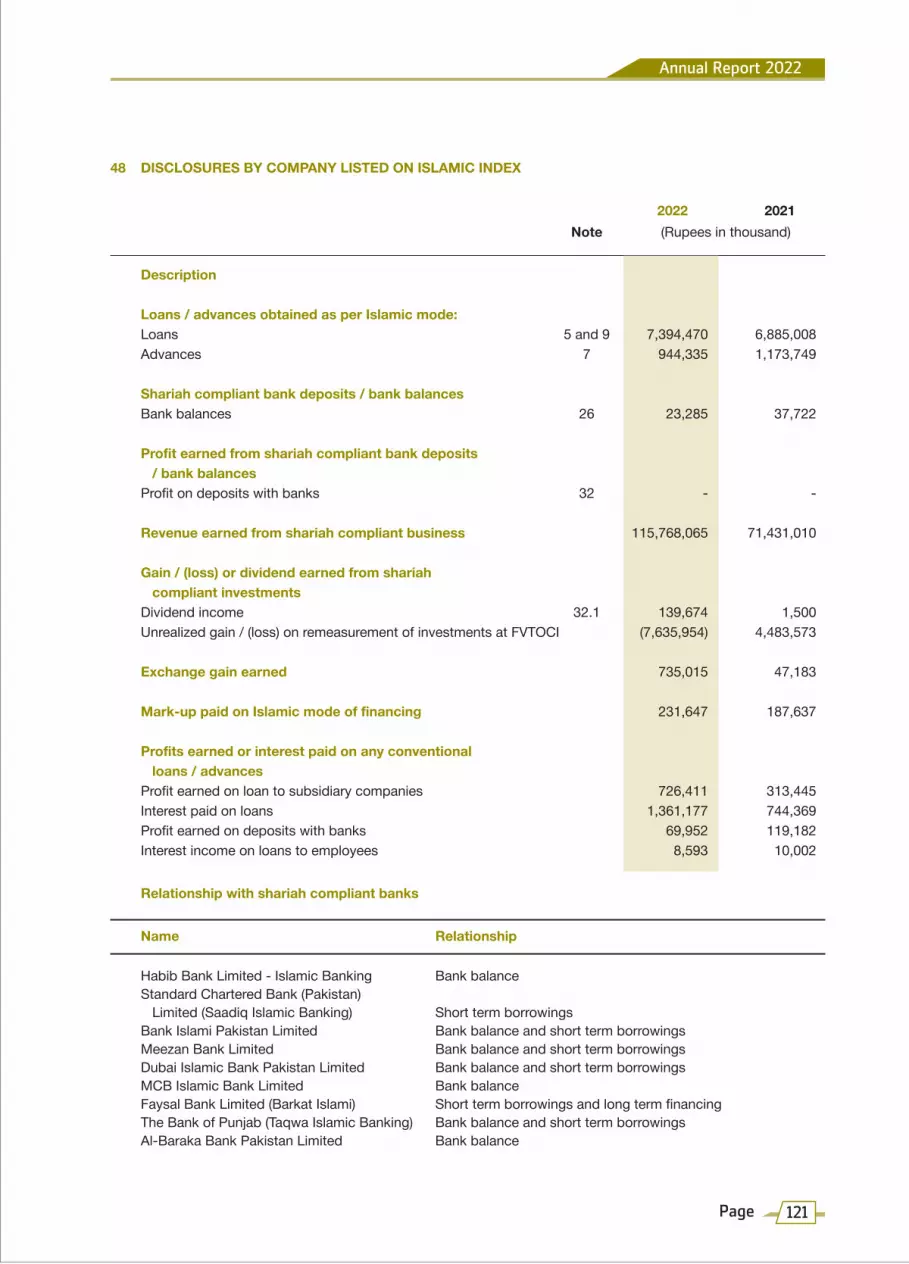
48 DISCLOSURES BY COMPANY LISTED ON ISLAMIC INDEX
2022 2021 Note (Rupees in thousand)
Description
Loans / advances obtained as per Islamic mode: Loans 5 and 9 7,394,470 6,885,008 Advances 7 944,335 1,173,749
Shariah compliant bank deposits / bank balances Bank balances 26 23,285 37,722
Profit earned from shariah compliant bank deposits / bank balances Profit on deposits with banks 32 - -
Revenue earned from shariah compliant business 115,768,065 71,431,010
Gain / (loss) or dividend earned from shariah compliant investments Dividend income 32.1 139,674 1,500 Unrealized gain / (loss) on remeasurement of investments at FVTOCI (7,635,954) 4,483,573
Exchange gain earned 735,015 47,183
Mark-up paid on Islamic mode of financing 231,647 187,637
Profits earned or interest paid on any conventional loans / advances Profit earned on loan to subsidiary companies 726,411 313,445 Interest paid on loans 1,361,177 744,369 Profit earned on deposits with banks 69,952 119,182 Interest income on loans to employees 8,593 10,002
Relationship with shariah compliant banks Name Relationship Habib Bank Limited - Islamic Banking Bank balance Standard Chartered Bank (Pakistan) Limited (Saadiq Islamic Banking) Short term borrowings Bank Islami Pakistan Limited Bank balance and short term borrowings Meezan Bank Limited Bank balance and short term borrowings Dubai Islamic Bank Pakistan Limited Bank balance and short term borrowings MCB Islamic Bank Limited Bank balance Faysal Bank Limited (Barkat Islami) Short term borrowings and long term financing The Bank of Punjab (Taqwa Islamic Banking) Bank balance and short term borrowings Al-Baraka Bank Pakistan Limited Bank balance
Annual Report 2022
121Page

CHIEF EXECUTIVE OFFICER CHIEF FINANCIAL OFFICERDIRECTOR
2022 2021 2022 2021
FundedNon-funded
Total facilities 14,070,000 14,975,000 86,341,000 72,455,000 Utilized at the end of the year 9,139,865 8,764,087 48,425,898 40,093,760 Unutilized at the end of the year 4,930,135 6,210,913 37,915,102 32,361,240
50 DATE OF AUTHORIZATION FOR ISSUE
These financial statements were authorized for issue on 20 September 2022 by the Board of Directors of the Company.
51 CORRESPONDING FIGURES
Corresponding figures have been re-arranged, wherever necessary, for the purpose of comparison. However, no significant rearrangements have been made.
52 GENERAL
Figures have been rounded off to the nearest thousand of Rupees unless otherwise stated.
(Rupees in thousand)
49 UNUTILIZED CREDIT FACILITIES
Nishat Mills Limited
122 Page
For the year ended June 30, 2022Notes to the Financial Statements

Nishat Mills LimitedConsolidated Financial Statements of
and its Subsidiaries for the year ended June 30, 2022

The Directors are pleased to present their report together with the consolidated financial statement of Nishat Mills Limited (“the Holding Company”) and its Subsidiary Companies (together referred to as Group) for the year ended 30 June 2022. The consolidated results comprise of financial statements of Nishat Mills Limited, Nishat Power Limited, Nishat Linen (Private) Limited, Nishat Hospitality (Private) Limited, Nishat USA Inc., Nishat Linen Trading LLC, Nishat International FZE, China Guangzhou Nishat Global Company Limited and Nishat Commodities (Private) Limited.
The Holding Company has annexed its consolidated financial statements along with its separate financial statements, in accordance with the requirements of International Financial Reporting Standards and Companies Act, 2017. The Directors’ Report, giving a commentary on the performance of Nishat Mills Limited for the year ended 30 June 2022 has been presented separately. It also includes a brief description of all the subsidiary companies of the Holding Company.
Clarification to Qualifications in Audit Report
In their Report to the Members, Auditors have stated that consolidated financial statements include un-audited figures pertaining to Nishat USA Incorporated, a wholly owned subsidiary of Nishat Mills Limited. This Subsidiary Company is incorporated under the Business Corporation Law of the State of New York. The governing law does not require audit of financial statements of the Subsidiary Company. Hence, we have used un-audited financial statements of the Subsidiary Company to prepare Consolidated Financial Statements.
For and on behalf of the Board of Directors
Mian Umer Mansha Farid Noor Ali FazalChief Executive Officer Director
20 September 2022Lahore
DIRECTORS’ REPORT
Nishat Mills Limited and its Subsidiaries
124 Page

INDEPENDENT AUDITOR’S REPORTTo the members of Nishat Mills Limited
Qualified Opinion
We have audited the annexed consolidated financial statements of Nishat Mills Limited and its subsidiaries (the Group), which comprise the consolidated statement of financial position as at 30 June 2022, and the consolidated statement of profit or loss, the consolidated statement of comprehensive income, the consolidated statement of changes in equity and the consolidated statement of cash flows for the year then ended, and notes to the consolidated financial statements, including a summary of significant accounting policies and other explanatory information.
In our opinion, except for the effects of the matter described in the Basis for Qualified Opinion section of our report, the consolidated financial statements give a true and fair view of the consolidated financial position of the Group as at 30 June 2022, and its consolidated financial performance and its consolidated cash flows for the year then ended in accordance with the accounting and reporting standards as applicable in Pakistan.
Basis for Qualified Opinion
The financial statements of Nishat USA, Inc. (Subsidiary Company) for the year ended 30 June 2022 were unaudited. Hence, total assets of Rupees 20,382,951 as at 30 June 2022 and total turnover and net profit of Rupees 57,787,308 and Rupees 1,382,867 respectively for the year ended 30 June 2022 pertaining to the aforesaid Company have been incorporated in these consolidated financial statements by the management using un-audited financial statements.
We conducted our audit in accordance with International Standards on Auditing (ISAs) as applicable in Pakistan. Our responsibilities under those standards are further described in the Auditor’s Responsibilities for the Audit of the Consolidated Financial Statements section of our report. We are independent of the Group in accordance with the International Ethics Standards Board for Accountants’ Code of Ethics for Professional Accountants as adopted by the Institute of the Chartered Accountants of Pakistan (the Code), and we have fulfilled our other ethical responsibilities in accordance with the Code. We believe that the audit evidence we have obtained is sufficient and appropriate to provide a basis for our qualified opinion.
Key Audit Matters Key audit matters are those matters that, in our professional judgment, were of most significance in our audit of the consolidated financial statements of the current period. These matters were addressed in the context of our audit of the consolidated financial statements as a whole, and in forming our opinion thereon, and we do not provide a separate opinion on these matters. In addition to the matter described in the Basis for Qualified Opinion section we have determined the matters described below to be the key audit matters to be communicated in our report.
Annual Report 2022
125Page

Nishat Mills Limited and its Subsidiaries
126 Page
Accounting for equity accounted associates
Investments in equity-accounted associates amounted to Rupees 40,000 million (20.20% of total assets) as at 30 June 2022.
There is a risk that associates are not accounted for and disclosed properly.
As such, we have identified the impairment assessment, equity accounting and disclosure for the investments in equity accounted associates as representing key audit matters due to the significance of the balance to the consolidated financial statements as a whole.
The Group’s management conducts its impairment test to assess the recoverability of the equity accounted associates and considers whether there are indicators of impairment with respect to these investments. Impairment assessments of these investments require significant judgement and there is the risk that valuation of the investments may be incorrect and any potential impairment charge miscalculated.
For further information on investments in equity-accounted associates, refer to the following:
- Summary of significant accounting policies, Consolidation – Associates note 2.2(b) to the consolidated financial statements.
- Critical accounting estimates and judgements note 2.1(c)
- Long term investments note 18 to the consolidated financial statements.
Our procedures included, but were not limited to:
• We perused the supporting documentation and ensured that they are properly accounted for in accordance with International Accounting Standard (IAS) 28 ‘Investments in Associates and Joint Ventures’.
• We ensured proper equity accounting was carried out during the year by looking at the post-acquisition change in the Group’s share of net assets of the associates. In particular, we have:
- Tested additions of investments made during the year.
- Checked the accuracy for computation of share of dividend income and profit or loss and other comprehensive income of the associates.
• We assessed the adequacy of the disclosures presented within the consolidated financial statements to ensure they are in accordance with International Financial Reporting Standard (IFRS) 12 ‘Disclosure of Interests in Other Entities’.
• We sent group audit instructions to the respective component auditors to gain comfort on the audit procedures performed by the component auditors over the financial statements of associates.
• We evaluated the reasonableness of management’s assumptions and estimates used in determining the recoverable values of material investments. We assessed the assumptions and estimates based on our knowledge of the Group and the industries.
Assessment of control and significant influence on investments
There is a risk that management has made an error in judgement or may have not fully considered all rules, facts and circumstances in assessing whether the
Our procedures included, but were not limited to:
• We tested the design and implementation of key controls around the application of the accounting
Sr.No.
2.
Following are the key audit matters:
1.
Key audit matters How the matters were addressed in our audit

standards and evaluated the significant judgements that management exercised in determining whether the Group controls or have significant influence over the investee companies.
• We reviewed documents to support any key judgments management has made in determining whether they control or have significant influence over an investee e.g. power over relevant activities.
• We have tested the consolidation process to assess whether the conclusions reached have been appropriately applied in the preparation of the consolidated financial statements and adequate disclosures have been made in the consolidated financial statements.
Inventory existence and valuation
Inventory of the textile business of the Group as at 30 June 2022 represented a material position in the consolidated statement of financial position.
Inventory is measured at the lower of cost and net realizable value.
We identified existence and valuation of inventory as a key audit matter due to its size, representing 21.75% of total assets of the Group as at 30 June 2022, and the judgment involved in valuation.
For further information on inventory, refer to the following:
- Summary of significant accounting policies, Inventories note 2.17 to the consolidated financial statements.
- Stores, spare parts and loose tools note 20 and Stock-in-trade note 21 to the consolidated financial statements.
Group has control or significant influence on its investments which may have significant consequences on the consolidated financial statements.
For further information, refer to the following:
- Summary of significant accounting policies, Consolidation note 2.2 to the consolidated financial statements.
- Note 1 and Note 18 to the consolidated financial statements.
Our procedures over existence and valuation of inventory included, but were not limited to:
• To test the quantity of inventories at all locations, we assessed the corresponding inventory observation instructions and participated in inventory counts on sites. Based on samples, we performed test counts and compared the quantities counted by us with the results of the counts of the management.
• For a sample of inventory items, re-performed the weighted average cost calculation and compared the weighted average cost appearing on valuation sheets.
• We tested that the ageing report used by management correctly aged inventory items by agreeing a sample of aged inventory items to the last recorded invoice.
• On a sample basis, we tested the net realizable value of inventory items to recent selling prices and re-performed the calculation of the inventory write down, if any.
• We assessed the percentage write down applied to older inventory with reference to historic inventory write downs and recoveries on slow moving inventory.
• In the context of our testing of the calculation, we
Sr.No.
3.
Key audit matters How the matters were addressed in our audit
Annual Report 2022
127Page

Nishat Mills Limited and its Subsidiaries
128 Page
analysed individual cost components and traced them back to the corresponding underlying documents. We furthermore challenged changes in unit costs.
• We also made inquires of management, including those outside of the finance function, and considered the results of our testing above to determine whether any specific write downs were required.
Sr.No.
Capital expenditures
The textile business of the Group is investing significant amounts in its operations and there are a number of areas where management judgement impacts the carrying value of property, plant and equipment and its respective depreciation profile. These include among other the decision to capitalize or expense costs; and review of useful life of the assets including the impact of changes in the Group’s strategy.
We focused on this area since the amounts have a significant impact on the financial position of the Group and there is significant management judgment required that has significant impact on the reporting of the financial position for the Group. Therefore, considered as one of the key audit matters.
For further information, refer to the following:
- Summary of significant accounting policies, Property, plant, equipment and deprecation note 2.7 to the consolidated financial statements.
- Property, plant and equipment note 15 to the consolidated financial statements.
Our procedures included, but were not limited to:
• We tested operating effectiveness of controls in place over the property, plant and equipment cycle including the controls over whether costs incurred on activities is capital or operating in nature.
• We evaluated the appropriateness of capitalization policies and depreciation rates.
• We performed tests of details on costs capitalized.
• We verified the accuracy of management’s calculation used for the impairment testing.
4.
Revenue recognition
We identified recognition of revenue of textile business of the Group as a key audit matter because revenue is one of the key performance indicators and gives rise to an inherent risk that revenue could be subject
Our procedures included, but were not limited to:
• We obtained an understanding of the process relating to recognition of revenue and testing the design, implementation and operating
5.
Key audit matters How the matters were addressed in our audit

Sr.No. Key audit matters How the matters were addressed in our audit
to misstatement to meet expectations or targets.
For further information, refer to the following:
- Summary of significant accounting policies, Revenue from contracts with customers note 2.24 to the consolidated financial statements.
- Revenue note 30 to the consolidated financial statements.
effectiveness of key internal controls over recording of revenue.
• We compared a sample of revenue transactions recorded during the year with sales orders, sales invoices, delivery documents and other relevant underlying documents.
• We compared a sample of revenue transactions recorded around the year-end with the sales orders, sales invoices, delivery documents and other relevant underlying documentation to assess if the related revenue was recorded in the appropriate accounting period.
• We assessed whether the accounting policies for revenue recognition complies with the requirements of IFRS 15 ‘Revenue from Contracts with Customers’.
• We also considered the appropriateness of disclosures in the consolidated financial statements.
Information Other than the Financial Statements and Auditor’s Report Thereon
Management is responsible for the other information. The other information comprises the information included in the annual report, but does not include the consolidated financial statements and our auditor’s report thereon.
Our opinion on the consolidated financial statements does not cover the other information and we do not express any form of assurance conclusion thereon.
In connection with our audit of the consolidated financial statements, our responsibility is to read the other information and, in doing so, consider whether the other information is materially inconsistent with the consolidated financial statements or our knowledge obtained in the audit or otherwise appears to be materially misstated.
If, based on the work we have performed, we conclude that there is a material misstatement of this other information, we are required to report that fact. As described in the Basis for Qualified Opinion section above, the Group should have consolidated Nishat USA, Inc. (Subsidiary Company) based on audited financial statements. Accordingly, we are unable to conclude whether or not the other information is materially misstated with respect to this matter.
Responsibilities of Management and the Board of Directors for the Consolidated Financial Statements
Management is responsible for the preparation and fair presentation of the consolidated financial statements in accordance with accounting and reporting standards as applicable in Pakistan and Companies Act, 2017 and for such internal control as management determines is necessary to enable the preparation of consolidated financial statements that are free from material misstatement, whether due to fraud or error.
Annual Report 2022
129Page

In preparing the consolidated financial statements, management is responsible for assessing the Group’s ability to continue as a going concern, disclosing, as applicable, matters related to going concern and using the going concern basis of accounting unless management either intends to liquidate the Group or to cease operations, or has no realistic alternative but to do so.
The Board of Directors is responsible for overseeing the Group’s financial reporting process.
Auditor’s Responsibilities for the Audit of the Consolidated Financial Statements
Our objectives are to obtain reasonable assurance about whether the consolidated financial statements as a whole are free from material misstatement, whether due to fraud or error, and to issue an auditor’s report that includes our opinion. Reasonable assurance is a high level of assurance, but is not a guarantee that an audit conducted in accordance with ISAs as applicable in Pakistan will always detect a material misstatement when it exists. Misstatements can arise from fraud or error and are considered material if, individually or in the aggregate, they could reasonably be expected to influence the economic decisions of users taken on the basis of these consolidated financial statements.
As part of an audit in accordance with ISAs as applicable in Pakistan, we exercise professional judgment and maintain professional skepticism throughout the audit. We also:
• Identify and assess the risks of material misstatement of the consolidated financial statements, whether due to fraud or error, design and perform audit procedures responsive to those risks, and obtain audit evidence that is sufficient and appropriate to provide a basis for our opinion. The risk of not detecting a material misstatement resulting from fraud is higher than for one resulting from error, as fraud may involve collusion, forgery, intentional omissions, misrepresentations, or the override of internal control.
• Obtain an understanding of internal control relevant to the audit in order to design audit procedures that are appropriate in the circumstances, but not for the purpose of expressing an opinion on the effectiveness of the Group’s internal control.
• Evaluate the appropriateness of accounting policies used and the reasonableness of accounting estimates and related disclosures made by management.
• Conclude on the appropriateness of management’s use of the going concern basis of accounting and, based on the audit evidence obtained, whether a material uncertainty exists related to events or conditions that may cast significant doubt on the Group’s ability to continue as a going concern. If we conclude that a material uncertainty exists, we are required to draw attention in our auditor’s report to the related disclosures in the consolidated financial statements or, if such disclosures are inadequate, to modify our opinion. Our conclusions are based on the audit evidence obtained up to the date of our auditor’s report. However, future events or conditions may cause the Group to cease to continue as a going concern.
• Evaluate the overall presentation, structure and content of the consolidated financial statements,
including the disclosures, and whether the consolidated financial statements represent the underlying transactions and events in a manner that achieves fair presentation.
• Obtain sufficient appropriate audit evidence regarding the financial information of the entities or business activities within the Group to express an opinion on the consolidated financial statements. We are responsible for the direction, supervision and performance of the group audit. We remain solely responsible for our audit opinion.
Nishat Mills Limited and its Subsidiaries
130 Page
We communicate with the Board of Directors regarding, among other matters, the planned scope and timing of the audit and significant audit findings, including any significant deficiencies in internal control that we identify during our audit.
We also provide the Board of Directors with a statement that we have complied with relevant ethical requirements regarding independence, and to communicate with them all relationships and other matters that may reasonably be thought to bear on our independence, and where applicable, related safeguards. From the matters communicated with the Board of Directors, we determine those matters that were of most significance in the audit of the consolidated financial statements of the current period and are therefore the key audit matters. We describe these matters in our auditor’s report unless law or regulation precludes public disclosure about the matter or when, in extremely rare circumstances, we determine that a matter should not be communicated in our report because the adverse consequences of doing so would reasonably be expected to outweigh the public interest benefits of such communication. The engagement partner on the audit resulting in this independent auditor’s report is Syed Mustafa Ali.
RIAZ AHMAD & COMPANYChartered Accountants
LAHORE
27 September 2022
UDIN: AR2022101688V07P2nuX
Annual Report 2022
131Page

2022 2021 Note (Rupees in thousand) EQUITY AND LIABILITIES
SHARE CAPITAL AND RESERVES
Authorized share capital
1,100,000,000 (2021: 1,100,000,000) ordinaryshares of Rupees 10 each 11,000,000 11,000,000
Issued, subscribed and paid-up share capital 3 3,515,999 3,515,999Reserves 4 109,678,786 104,414,731
Equity attributable to equity holders of the Holding Company 113,194,785 107,930,730
Non-controlling interest 13,762,616 12,741,966
Total equity 126,957,401 120,672,696
LIABILITIES
NON-CURRENT LIABILITIES
Long term financing 5 12,304,450 11,705,985Lease liabilities 6 1,858,072 1,368,868Long term security deposits 7 258,410 269,078Retirement benefit obligation 35,747 23,008Deferred liabilities 8 4,339,086 2,572,634 18,795,765 15,939,573
CURRENT LIABILITIES
Trade and other payables 9 14,820,644 11,390,058Accrued mark-up 10 460,206 269,569Short term borrowings 11 31,692,994 22,385,156Current portion of non-current liabilities 12 5,175,398 5,144,607Unclaimed dividend 13 122,072 115,497 52,271,314 39,304,887
TOTAL LIABILITIES 71,067,079 55,244,460
CONTINGENCIES AND COMMITMENTS 14
TOTAL EQUITY AND LIABILITIES 198,024,480 175,917,156
The annexed notes form an integral part of these consolidated financial statements.
CHIEF EXECUTIVE OFFICER
Nishat Mills Limited and its Subsidiaries
132 Page
As at June 30, 2022Consolidated Statement of Financial Position

2022 2021 Note (Rupees in thousand) ASSETS
NON-CURRENT ASSETS
Property, plant and equipment 15 51,047,970 47,644,512Intangible assets 16 - -Right-of-use assets 17 2,196,882 1,739,404Long term investments 18 52,382,499 55,330,247Long term loans 19 471,140 532,541Long term deposits 310,461 277,579 106,408,952 105,524,283
CURRENT ASSETS
Stores, spare parts and loose tools 20 4,961,761 3,307,714Stock-in-trade 21 43,167,440 25,795,008Trade debts 22 23,326,877 27,111,194Loans and advances 23 1,319,242 1,089,975Advance income tax - net 24 175,731 1,054,299Short term deposits and prepayments 25 352,165 191,671Other receivables 26 10,815,393 5,431,355 Accrued interest 27 4,394 13,659Short term investments 28 5,733,709 -Cash and bank balances 29 1,758,816 6,397,998 91,615,528 70,392,873
TOTAL ASSETS 198,024,480 175,917,156
CHIEF FINANCIAL OFFICERDIRECTOR
Annual Report 2022
133Page

2022 2021 Note (Rupees in thousand) REVENUE 30 165,697,007 104,727,458COST OF SALES 31 (136,819,482) (86,066,252)GROSS PROFIT 28,877,525 18,661,206
DISTRIBUTION COST 32 (9,656,144) (6,456,276)ADMINISTRATIVE EXPENSES 33 (2,664,443) (2,182,075)OTHER EXPENSES 34 (770,544) (597,767) (13,091,131) (9,236,118) 15,786,394 9,425,088
OTHER INCOME 35 3,588,208 2,732,075PROFIT FROM OPERATIONS 19,374,602 12,157,163
FINANCE COST 36 (2,755,124) (1,881,452) 16,619,478 10,275,711 SHARE OF PROFIT FROM ASSOCIATES 18.2 1,667,447 2,848,522PROFIT BEFORE TAXATION 18,286,925 13,124,233 TAXATION 37 (4,354,397) (1,918,637)PROFIT AFTER TAXATION 13,932,528 11,205,596
SHARE OF PROFIT ATTRIBUTABLE TO:EQUITY HOLDERS OF HOLDING COMPANY 12,304,783 9,896,748NON-CONTROLLING INTEREST 1,627,745 1,308,848 13,932,528 11,205,596
EARNINGS PER SHARE - BASIC AND DILUTED (RUPEES) 38 35.00 28.15
The annexed notes form an integral part of these consolidated financial statements.
CHIEF EXECUTIVE OFFICER CHIEF FINANCIAL OFFICERDIRECTOR
Nishat Mills Limited and its Subsidiaries
134 Page
For the year ended June 30, 2022Consolidated Statement of Profit or Loss

2022 2021 (Rupees in thousand) PROFIT AFTER TAXATION 13,932,528 11,205,596
OTHER COMPREHENSIVE INCOME / (LOSS)
Items that will not be reclassified to profit or loss: Remeasurement of retirement benefits of associates - net of tax (19,273) 20,439(Deficit) / surplus arising on remeasurement of investments at fair value through other comprehensive income (3,439,620) 389,857Share of (deficit) / surplus on remeasurement of investments at fair value through other comprehensive income of associates - net of tax (1,893,890) 977,284Deferred income tax relating to investments at fair value through other comprehensive income (445,750) 302,512 (5,798,533) 1,690,092
Items that may be reclassified subsequently to profit or loss: Exchange differences on translating foreign operations 164,204 (37,902) Other comprehensive (loss) / income for the year - net of tax (5,634,329) 1,652,190
TOTAL COMPREHENSIVE INCOME FOR THE YEAR 8,298,199 12,857,786
SHARE OF TOTAL COMPREHENSIVE INCOME ATTRIBUTABLE TO:
EQUITY HOLDERS OF HOLDING COMPANY 6,670,454 11,548,938NON-CONTROLLING INTEREST 1,627,745 1,308,848 8,298,199 12,857,786
The annexed notes form an integral part of these consolidated financial statements.
CHIEF EXECUTIVE OFFICER CHIEF FINANCIAL OFFICERDIRECTOR
Annual Report 2022
135Page
For the year ended June 30, 2022Consolidated Statement of Comprehensive Income

Shar
eC
apita
lPr
emiu
m o
niss
ue o
frig
ht sh
ares
Exch
ange
Tran
slat
ion
Rese
rve
Capi
tal
Rede
mpt
ion
Rese
rve F
und
Non
-C
ontro
lling
Inte
rest
Fair
valu
ere
serv
eFV
TOCI
inve
stm
ents
Stat
utor
yRe
serv
e S
ub To
tal
Sub
Tota
l To
tal
Rese
rves
Tota
lEq
uity
Gen
eral
Rese
rve
Mai
nten
ance
Rese
rve
Unap
prop
riate
dPr
ofit
Shar
ehold
ers’
Equit
y
Cap
ital R
eser
ves
Reve
nue
Rese
rves
Attri
buta
ble
to E
quity
Hol
ders
of t
he H
oldi
ng C
ompa
ny
(Rup
ees
in th
ousa
nd)
Bala
nce
as a
t 30
June
202
0 3,
515,
999
5,49
9,53
0 7,
930,
664
224,
659
835
1
11,0
02
1,60
8,66
8 15
,375
,358
71
,163
,214
6,
298,
146
77,4
61,3
60
92,8
36,7
18
96,3
52,7
17
11,6
06,5
74
107,
959,
291
Adju
stm
ents
due
to e
quity
acc
ount
ed in
vest
ee c
ompa
nies
-
- (5
79,7
89)
- -
-
-
(579
,789
) -
2,01
5,26
3 2,
015,
263
1,43
5,47
4 1,
435,
474
- 1,
435,
474
Tran
sact
ion
with
ow
ners
- F
inal
div
iden
d fo
r the
yea
r
en
ded
30 J
une
2020
@ R
upee
s 4.
00 p
er s
hare
-
-
- -
-
-
- -
- (1
,406
,399
) (1
,406
,399
) (1
,406
,399
) (1
,406
,399
) -
(1,4
06,3
99)
Tran
sfer
red
to g
ener
al re
serv
e -
-
- -
-
-
- -
4,89
0,00
0 (4
,890
,000
) -
- -
- -
Tran
sact
ion
with
ow
ners
- d
ivid
end
rela
ting
to y
ear
20
20 p
aid
to n
on-c
ontro
lling
inte
rest
-
- -
- -
-
-
- -
- -
- -
(173
,456
) (1
73,4
56)
Tran
sfer
red
to s
tatu
tory
rese
rve
- -
- -
3,34
7
-
- 3,
347
- (3
,347
) (3
,347
) -
- -
-
Prof
it fo
r the
yea
r -
- -
- -
-
-
- -
9,89
6,74
8 9,
896,
748
9,89
6,74
8 9,
896,
748
1,30
8,84
8 11
,205
,596
Othe
r com
preh
ensi
ve in
com
e fo
r the
yea
r -
- 1,
669,
653
(37,
902)
-
-
- 1,
631,
751
- 20
,439
20
,439
1,
652,
190
1,65
2,19
0 -
1,65
2,19
0
Tota
l com
preh
ensi
ve in
com
e fo
r the
yea
r -
- 1,
669,
653
(37,
902)
-
-
-
1,63
1,75
1 -
9,91
7,18
7 9,
917,
187
11,5
48,9
38
11,5
48,9
38
1,30
8,84
8
12,8
57,7
86
Bala
nce
as a
t 30
June
202
1 3,
515,
999
5,49
9,53
0 9,
020,
528
186,
757
4,18
2
111
,002
1,
608,
668
16,4
30,6
67
76,0
53,2
14
11,9
30,8
50
87,9
84,0
64
104,
414,
731
107,
930,
730
12,7
41,9
66
120,
672,
696
Tran
sact
ion
with
ow
ners
- F
inal
div
iden
d fo
r the
yea
r
en
ded
30 J
une
2021
@ R
upee
s 4.
00 p
er s
hare
-
- -
- -
-
-
- -
(1,4
06,3
99)
(1,4
06,3
99)
(1,4
06,3
99)
(1,4
06,3
99)
- (1
,406
,399
)
Tran
sfer
red
to s
tatu
tory
rese
rve
- -
-
- 6,
864
-
-
6,86
4 -
(6,8
64)
(6,8
64)
- -
- -
Tran
sfer
red
to g
ener
al re
serv
e -
- -
- -
-
-
- 10
,524
,000
(1
0,52
4,00
0)
- -
- -
-
Tran
sact
ion
with
ow
ners
- d
ivid
end
rela
ting
to y
ear
20
21 p
aid
to n
on-c
ontro
lling
inte
rest
-
- -
- -
-
-
- -
- -
- -
(607
,095
) (6
07,0
95)
Prof
it fo
r the
yea
r -
- -
- -
-
-
- -
12,3
04,7
83
12,3
04,7
83
12,3
04,7
83
12,3
04,7
83
1,62
7,74
5 13
,932
,528
Othe
r com
preh
ensi
ve lo
ss fo
r the
yea
r -
- (5
,779
,260
) 16
4,20
4 -
-
-
(5,6
15,0
56)
- (1
9,27
3)
(19,
273)
(5
,634
,329
) (5
,634
,329
) -
(5,6
34,3
29)
Tota
l com
preh
ensi
ve in
com
e fo
r the
yea
r -
- (5
,779
,260
) 16
4,20
4 -
-
-
(5,6
15,0
56)
- 12
,285
,510
12
,285
,510
6,
670,
454
6,67
0,45
4 1,
627,
745
8,29
8,19
9
Bala
nce
as a
t 30
June
202
2 3,
515,
999
5,49
9,53
0 3,
241,
268
350,
961
11,0
46
111
,002
1,
608,
668
10,8
22,4
75
86,5
77,2
14
12,2
79,0
97
98,8
56,3
11
109,
678,
786
113,
194,
785
13,7
62,6
16
126,
957,
401
The
anne
xed
note
s fo
rm a
n in
tegr
al p
art o
f the
se c
onso
lidat
ed fi
nanc
ial s
tate
men
ts.
CH
IEF
EXEC
UTI
VE O
FFIC
ERC
HIE
F FI
NAN
CIA
L O
FFIC
ERD
IREC
TOR
Nishat Mills Limited and its Subsidiaries
136 Page
For the year ended June 30, 2022Consolidated Statement of Changes In Equity

2022 2021 Note (Rupees in thousand) CASH FLOWS FROM OPERATING ACTIVITIES
Cash generated from operations 39 4,654,625 13,601,745Finance cost paid (2,528,391) (1,933,834)Income tax paid (2,055,569) (1,579,446)Long term security deposits paid (10,668) (2,055)Exchange gain on forward exchange contracts received 27,313 1,237Gas infrastructure development cess paid - (168,369)Net increase in retirement benefit obligation 11,053 2,550Net decrease / (increase) in long term loans 84,516 (211,159)Net increase in long term deposits (32,882) (51,697)Net cash generated from operating activities 149,997 9,658,972
CASH FLOWS FROM INVESTING ACTIVITIES
Proceeds from sale of property, plant and equipment 151,497 397,167Capital expenditure on property, plant and equipment (7,790,487) (7,919,907)Dividends received 2,615,510 2,490,606Investments made (10,901,742) (259,820)Proceeds from sale of investments 3,767,658 36,021 Interest received 124,551 122,563Net cash used in investing activities (12,033,013) (5,133,370)
CASH FLOWS FROM FINANCING ACTIVITIES
Proceeds from long term financing 3,734,958 6,744,988Repayment of long term financing (3,300,234) (1,756,252)Repayment of lease liabilities (656,013) (566,179)Exchange differences on translation of net investments in foreign subsidiaries 164,204 (37,902)Short term borrowings - net 9,307,838 (1,695,361)Dividend paid (2,006,919) (1,575,625)
Net cash from financing activities 7,243,834 1,113,669
Net (decrease) / increase in cash and cash equivalents (4,639,182) 5,639,271Cash and cash equivalents at the beginning of the year 6,397,998 758,727
Cash and cash equivalents at the end of the year 1,758,816 6,397,998
The annexed notes form an integral part of these consolidated financial statements.
CHIEF EXECUTIVE OFFICER CHIEF FINANCIAL OFFICERDIRECTOR
Annual Report 2022
137Page
For the year ended June 30, 2022Consolidated Statement of Cash Flows

1 THE GROUP AND ITS OPERATIONS
a) The Group consists of:
Holding Company
- Nishat Mills Limited
Subsidiary Companies
- Nishat Power Limited - Nishat Linen (Private) Limited - Nishat Hospitality (Private) Limited - Nishat USA, Inc. - Nishat Linen Trading LLC - Nishat International FZE - China Guangzhou Nishat Global Co., Ltd. - Nishat Commodities (Private) Limited
NISHAT MILLS LIMITED
Nishat Mills Limited is a public limited Company incorporated in Pakistan under the repealed Companies Act, 1913 (Now Companies Act, 2017) and listed on Pakistan Stock Exchange Limited. Its registered office is situated at 53-A, Lawrence Road, Lahore. The Company is engaged in the business of textile manufacturing and of spinning, combing, weaving, bleaching, dyeing, printing, stitching, apparel, buying, selling and otherwise dealing in yarn, linen, cloth and other goods and fabrics made from raw cotton, synthetic fibre and cloth and to generate, accumulate, distribute, supply and sell electricity. Geographical location and addresses of all business units are as follows:
Sr. No.
1 Spinning units, yarn dyeing unit and power plant Nishatabad, Faisalabad. 2 Spinning units and power plant Plot No. 172-180 and 188-197, M-3 Industrial City,
Sahianwala and FIEDMC, 2 K.M., Jhumra Chiniot Road, Chak Jhumra, Faisalabad. 3 Spinning units and power plant 20 K.M., Sheikhupura Road, Feroze Wattwan. 4 Weaving units and power plant 12 K.M., Faisalabad Road, Sheikhupura. 5 Weaving units, dyeing and finishing unit, 5 K.M., Nishat Avenue Off 22 K.M., Ferozepur processing unit, stitching units and power plants Road, Lahore. 6 Terry unit 7 K.M., Nishat Avenue Off 22 K.M., Ferozepur Road, Lahore. 7 Apparel unit 2 K.M., Nishat Avenue Off 22 K.M., Ferozepur Road, Lahore. 8 Head office 7-Main Gulberg, Lahore. 9 Office 1st Floor, Karachi Chambers, Hasrat Mohani Road, Karachi. 10 Registered office Nishat House, 53-A, Lawrence Road, Lahore.
NISHAT POWER LIMITED
Nishat Power Limited is a public limited Company incorporated in Pakistan under the repealed Companies Ordinance, 1984 (Now Companies Act, 2017) and listed on Pakistan Stock Exchange Limited. The Company is a subsidiary of Nishat Mills Limited. The principal activity of the Company is to build, own, operate and maintain a fuel fired power station having gross capacity of 200 MW in Jamber Kalan, Tehsil Pattoki, District Kasur, Punjab, Pakistan. Its registered office is situated at 53-A, Lawrence Road, Lahore. Its head office is situated at 1-B, Aziz Avenue, Canal
Manufacturing units and offices Address
Nishat Mills Limited and its Subsidiaries
138 Page
For the year ended June 30, 2022Notes to the Consolidated Financial Statements

Road, Gulberg V, Lahore. The Company had a Power Purchase Agreement (‘PPA’) with its sole customer, National Transmission and Despatch Company Limited (‘NTDC’) for twenty five years which commenced from 09 June 2010. On 12 February 2021, the Company entered into a Novation Agreement to the PPA with NTDC and Central Power Purchasing Agency (Guarantee) Limited (‘CPPA-G’ and also referred to as the ‘Power Purchaser’), whereby, NTDC irrevocably transferred all of its rights, obligations and liabilities under the PPA to CPPA-G and thereafter, NTDC ceased to be a party to the PPA, and CPPA-G became a party to the PPA in place of NTDC. Further, on the same day, the Company entered into the PPA Amendment Agreement, whereby, the Agreement Year that was ending on 08 June 2021 was extended by sixty eight (68) days to 15 August 2021. Therefore, the existing term of the PPA Agreement has been extended by sixty eight days to twenty five years and sixty eight days ending on 15 August 2035. Ownership interest held by non-controlling interests in Nishat Power Limited is 48.99% (2021: 48.99%).
Master Agreement and Power Purchase Amendment Agreement of Nishat Power Limited – Subsidiary Company
Nishat Power Limited – Subsidiary Company in the larger national interest and sustainability of the power sector, voluntarily had agreed to alter its existing contractual arrangements with the CPPA-G for the sale and purchase of electricity. In this respect, the Subsidiary Company entered into a “Master Agreement” and a “PPA Amendment Agreement” (hereinafter referred to as the 'Agreements') on 12 February 2021. Under these Agreements, the Subsidiary Company and CPPA-G had primarily agreed on the following matters that are subject to fulfilment of certain terms and conditions mentioned in the Agreements:
- The long outstanding receivables as at 30 November 2020, aggregating to Rupees 14,252.802 million be paid in two instalments. During the current year first instalment of 40% of the aforementioned outstanding amount was received on 06 January 2022, and second instalment of 60% of the aforementioned outstanding amount was received on 30 June 2022. These instalments comprised of 1/3rd cash, 1/3rd in the form of tradeable Ijarah Sukuk, and 1/3rd in the form of tradeable Pakistan Investment Bonds (PIBs).
- Pursuant to Agreements, the Company had agreed that, the discounts in tariff components i.e. Return on Equity (ROE) including Return on Equity During Construction (RoEDC) shall be changed to 17% per annum in Pak Rupee (PKR) calculated at PKR/USD exchange rate of PKR 148/USD, with no future USD indexation. However, the existing ROE and RoEDC, together with applicable indexation, shall continue to be applied until the date when the applicable exchange rate under the present tariff reaches PKR 168/USD, whereupon the revised RoE and RoEDC shall become applicable for remainder of the term of the PPA. Whereas the above stated revised tariff shall be effective subject to notification by Government of Pakistan ('GoP') and payment of first instalment by CPPA-G.
During the current year on payment of first instalment by CPPA-G according to the agreements and the NEPRA decision on revised tariff dated 02 April 2021 and its notification by GoP dated 06 January 2022, the Company has reduced its Capacity Purchase Price (CPP) relating to ROE and ROEDC components, by giving discount (effective from 06 January 2022) to CPPA-G as stated above. Whereas on payment of second instalment as stated above, the discounts became effective and revised tariff has become applicable for remainder of the term of the PPA from 01 July 2022. Accordingly, the aforesaid Agreements become effective as per terms agreed.
- On 16 March 2020, Government of Pakistan ('GoP') issued a report through which it was alleged that savings were made by the Independent Power Producers ('IPPs'), including the Company, in the tariff components in violation of applicable GoP Policies, tariff determined by National Electric Power Regulatory Authority ('NEPRA') and the relevant Project Agreements. The Company rejected such claims, and discussions were made with the GoP to resolve the dispute. On 12 February 2021, the Company under the Agreements, agreed that the abovementioned dispute will be resolved through arbitration under the Arbitration Submission Agreement between the Company and GoP. During the year, on 15 June 2022, the Company and the GoP have signed the Arbitration Submission Agreement.
- Amicable resolution of the capacity revenue dispute involving Rupees 816.033 million for the period ('disputed period') in which the plant was not fully available for power generation due to non-availability of fuel owing to non-payment by CPPA-G. Pursuant to the PPA Amendment Agreement, the disputed period has been treated as an Other Force Majeure Event ('OFME') under the PPA. The OFME period has commenced on 09 June 2021 and ended on 15 August 2021, consequently, the term of PPA has been extended by 68 days, till 15 August 2035. The disputed
Annual Report 2022
139Page

amounts have been received during the year. The accounting implications of the same have been detailed under note 22.6 to these consolidated financial statements.
NISHAT LINEN (PRIVATE) LIMITED
Nishat Linen (Private) Limited, a wholly owned subsidiary of Nishat Mills Limited, is a private limited company incorporated in Pakistan under the repealed Companies Ordinance, 1984 (Now Companies Act, 2017) on 15 March 2011. The registered office of Nishat Linen (Private) Limited is situated at 7- Main, Gulberg Lahore. The principal objects of the Company are to operate retail outlets for sale of textile and other products and to sale the textile products by processing the textile goods in own and outside manufacturing facility. Geographical location and addresses of all business units are as follows:
Sr. No.
Manufacturing unit and office
1 Stitching Unit and office 21 K.M., Ferozepur Road, Lahore. Stores 1 Nishat Emporium Mall Shop No. G-26, Nishat Emporium Mall, Abdul Haque Road, Johar Town, Lahore. 2 Swarovski-Emporium Mall Shop No. KG-05, Ground Floor, Nishat Emporium Mall, Abdul Haque Road, Johar Town, Lahore. 3 Gulberg Galleria Shop No. 13, Ground Floor U/G1 & L/G2, Gulberg Galleria, 18-Main Boulevard, Gulberg III, Lahore. 4 Packages Mall Packages Mall, Walton Road, Lahore. 5 Tariq Road Plot No. 172-5, P.E.C.H.S, Block 2, Tariq Road, Karachi. 6 Wapda Town Main Boulevard, Johar Town, (Opposite Shaukat Khanum Hospital), Lahore. 7 Fashion Avenue Fashion Avenue, Shop No. 5-7, College Block, Main Boulevard, Allama Iqbal Town, Lahore. 8 Swarovski Forum Mall Shop No. 78, Ground Floor, Forum Mall, Clifton, Karachi. 9 Canal West Bank Shop No. 1-3, Ground Floor, Sraw Plaza, Near Muhafiz Town, Phase 1, Canal West Bank Road, Lahore. 10 Phase IV DHA 176 DD, Commercial Area, Phase 4, DHA, Lahore. 11 Doctors Hospital 86 G/1, Johar Town (Opposite Doctors Hospital), Lahore. 12 Link Road Model Town Opposite Raja Sahib, Link Road Model Town, Lahore. 13 Sukkur Shop No. 63, Military Road, Sukkur. 14 Shadman 118-Shadman, Lahore. 15 FPS Chauburji Shop No. 2, Development Scheme, Chauburji, Lahore. 16 Gulshan Ravi Factory Outlet, Shop No. 12-C, Main Boulevard, Gulshan Ravi, Lahore. 17 Thokar Niaz Baig Factory Outlet, Ground Floor, 55th Avenue, Thokar Niaz Baig, Raiwind Road, Lahore. 18 E-Store 21 K.M., Ferozepur Road, Lahore. 19 Clifton G.F2, Jamalistan Shopping Center, DC-1, Block 8, Clifton, Karachi. 20 Dolmen Clifton D-3, 1st Floor, Dolmen City, Block 4, Scheme 5, Clifton, Karachi. 21 Dolmen Tariq Road SF-21, 2nd Floor, Dolmen Mall, Block 3, P.E.C.H.S., Tariq Road, Karachi. 22 Wazirabad G-58, Hajipura, Wazirabad.
Business Units Address
Nishat Mills Limited and its Subsidiaries
140 Page
For the year ended June 30, 2022Notes to the Consolidated Financial Statements

Sr. No.
23 Ocean Mall Shop No. 250-254, 2nd Floor, Ocean Mall, Plot No. G-3, Khyaban-e-Iqbal, Block 9, Clifton, Karachi. 24 KDA Outlet Store NL Outlet Store, 565-A, Block 3, KDA Scheme 24, Gulshan-e-Iqbal, Karachi. 25 Mariam Heights Shop No. 2, Mariam Heights, Plot No. 1, Main Shaheed-e-Millat Road (Opposite Naheed and Chase Super Market), Karachi. 26 Lucky One Mall Lucky One Mall, Shop No. F-31, First Floor, Block 21, F.B. Area, Main Rashid Minhas Road, Karachi. 27 Millennium Mall Millennium Mall, Main Rashid Minhas Road, Adjacent Drive-In Cinema, Gulshan-e-Iqbal, Karachi. 28 ANB Center ANB Center, Plot No. 13-V, (Behind PSO Petrol Pump) Jinnah Super Market, F-7 Markaz, Islamabad. 29 F-10 Block No. 7, Malik Arcade, F-10 Markaz, Islamabad. 30 Centaurus Mall Shop No. 120, 1st Floor, Centaurus Shopping Mall, Jinnah Avenue, Plot No. 1, Blue Area, F-8/G-8, Islamabad. 31 Bahria Town Phase 7 Plaza 155, (Near Shaheen Chowk), Spring North, Phase 7, Bahria Town, Islamabad. 32 PWD Ground Floor, Plaza No. 10, Main Road, Block A, PWD, Islamabad. 33 World Trade Center World Trade Center, G.T. Road, Defence Housing Authority, Phase II, Islamabad. 34 Awami Trade Center Awami Trade Center, Ground Floor, 31-33, G9 Markaz, Islamabad. 35 Adamjee Road Plot No. 5, Saddar, Adamjee Road, Rawalpindi. 36 Satellite Town Shop No. 3, Abbas Arcade, 5th Road, Satellite Town, Commercial Market, Rawalpindi. 37 Crystal Mall Crystal Mall, Main Bosan Road, Multan. 38 Gulshan Market Factory Outlet, Shop No. 3, Block-S, 100 Feet Road, Gulshan Market, New Multan Colony, Multan. 39 S.P Chowk Plot No. 1-A, S.P Chowk, Nusrat Road, Multan Cantt, Multan. 40 Masooma Shop No. 2-3, Masooma Shopping Center, Legacy Tower, Koh-e-Noor City, Jaranwala Road, Faisalabad. 41 D-Ground 1298/B, Chen One Road, Peoples Colony No. 1, Faisalabad. 42 Gulberg Road Shop No. P-424, Jinnah Colony, Gulberg Road, Faisalabad. 43 The Boulevard Mall Shop No. 1, Ground Floor, The Boulevard Mall, Near Suzuki Burj Motors, East Canal Road, Faisalabad. 44 Taj Shopping Center Ground Floor, Taj Shopping Center, (Near National Bank) Govt. Girls College Road, Satellite Town, Gujranwala. 45 Fazal Centre Hall No. 5, Fazal Centre, G.T. Road, Rahwali Cantt., Gujranwala. 46 Town Branch JB Tower, Ground Floor, University Road, Peshawar. 47 Cantt Branch Deans Trade Center, Islamia Road Cantt, Peshawar. 48 Abdullah Mall Abdullah Mall, Ground Floor, Kutchery Road, Gujrat. 49 Sialkot 97-A, Liberty Market, Aziz Shaheed Road, (Near Silver Spoon Restaurant) Cantt, Sialkot. 50 Bahawalpur Shop No. 2, Haqqi Centre, (Opposite Commissioner House) Adjacent to DIG House, Bahawalpur. 51 Sargodha Shop No. 39, Raas Tower, Qasim Park, Opposite MCB Bank, Main University Road, Sargodha. 52 Abbottabad Mansehra Road, Opposite Faisal Bank, Abbottabad.
Business Units Address
Annual Report 2022
141Page

Sr. No.
53 Mardan Afaq Centre, (Opposite Premier Sugar Mills) Nowshera Road, Mardan.
54 Sahiwal Azaan Heights, Jahaz Chowk, Sahiwal. 55 Swat Shop No. F-1 & F-2, Swat Trade Center, (Opposite Swat Serena Hotel) Allah Chowk, Saidu Sharif, Swat. 56 Mandi Bahauddin Shop No. G9, Ground Floor, Hakim Mall, Jail Road, Mandi Bahauddin. 57 Jhelum Shop No. 1-14, Ground Floor, Adnan Plaza, Jhelum. 58 Boulevard Mall First Floor A-14, Boulevard Mall, Auto Bhan Road, S.I.T.E., Hyderabad. 59 Burewala Opposite Imran Petroleum, Near Stadium Road, Multan Road, Burewala. 60 Quetta Shop No. 1, Ground Floor, Millennium Mall, Gulistan Road, Quetta. 61 Muzaffarabad Shop No. 1, Ground Floor, Al-Rahim Plaza, Neelum Valley Road (Lower Plate), Muzaffarabad. 62 Sheikhupura Lower Ground, Khanjee Center, Civil Quarter Road, Sheikhupura. 63 D.G. Khan Shop No. 32-33, Block No. 15, Traffic Chowk, Dera Ghazi Khan. 64 Rahim Yar Khan 5-Model Town, Near Town Hall, Opposite U Microfinance Bank, Rahim Yar Khan. 65 Lalamusa Factory Outlet, Lower Ground Floor, City Mall, G.T. Road, Lalamusa. 66 Fair Price Shop Sukheki Nishat Dairy, Sukheki. 67 Wah Cantt Shop No. 7-8 Lower Ground & Shop No. 7-8 Ground Floor, City Centre Phase 2, New City, Wah Cantt. 68 Kasur Chandani Chowk, Plaza No. 216, Near Bank Alfalah, Railway Road, Kasur. 69 Fair Price Shop - Lahore 21 K.M., Ferozepur Road, Lahore. 70 Fair Price Shop – Bhikhi Nishat Mills Limited, Weaving Unit Bhikhi, Sheikhupura. 71 Fair Price Shop –Faisalabad Nishat Mills Limited, Nishatabad, Faisalabad. 72 Centaurus – Inglot Shop No. 315, 3rd Floor, The Centaurus Mall, F-8, Islamabad. 73 WTC – Inglot* Shop No. 25, Hyperstar Floor, Plot No. 1, Main G.T. Road, DHA Phase 2, Islamabad. 74 DMC – Inglot D-3, 1st Floor, Dolmen City, Block 4, Scheme 5, Clifton, Karachi. 75 Emporium – Inglot Ground Floor, G-43, Emporium Mall, Lahore. 76 Swarovski Centaurus Plot No. 1, Tower A, 16th Floor, The Centaurus Mall, Islamabad. 77 Packages – Inglot Shop No. 1065, First Floor, Packages Mall, Lahore 78 Crystal Mall – Inglot Crystal Mall, Chungi No. 9, Bosan Road, Multan. 79 Sargodha – Inglot Plot No. 39, Raas Tower, Qasim Park, University Road, Sargodha. 80 Nishat Linen Tower 5-A-3, Mian Mahmood Ali Kasuri Road, Gulberg III, Lahore. 81 Factory Outlet - Lahore Karim Block, Allama Iqbal Town, Lahore. 82 The Mall – Karachi Shop No. 105, Ground Floor, Shanti Nagar, Main Rashid Minhas Road, Opposite Aladin Amusement Park, Karachi. 83 Bahria Town - Rawalpindi Building 117, Civic Center, Phase 4, Bahria Town, Rawalpindi.
Business Units Address
Nishat Mills Limited and its Subsidiaries
142 Page
For the year ended June 30, 2022Notes to the Consolidated Financial Statements

Sr. No.
84 Al Barkat Center – Gujranwala Shop No. 1839-A, Al Barkat Center, Near Marinate Restaurant, G.T Road, Gujranwala. 85 Dera Ismail Khan Opposite Liaqat Park, East Circular Road, Dera Ismail Khan. 86 Jhang 1 K.M., Faisalabad Road, Jhang Sadar. 87 Layyah Shop No. 2, College Road, Layyah. 88 Mirpur Shop No. 64, Sector F-1, Kotli Road, Mirpur Azad Kashmir. 89 Okara Tehsil Road, A-Block, Okara. 90 Hafizabad Vanike Road, Hafizabad. 91 Attock Kamra Road, Near Fuel Mart CNG Station, Attock. 92 Phalia Shop No. 01, French Galleria, Gujrat Road, Phalia. 93 Boulevard Mall – Inglot Shop No. 8, The Boulevard Mall, East Canal Road, Near Suzuki Burj Motors Showroom, Saeed Colony, Faisalabad. 94 Lucky Mall – Inglot Lucky One Mall, F-13, 1st Floor, Lucky One Mall, Rashid Minhas Road, Karachi. 95 Swarovski – DMC Swarovski Shop No. 11A, Ground Floor, World Trade Center, Islamabad. 96 Nishat Linen Tower – Inglot 5-A-3, Mian Mahmood Ali Kasuri Road, Gulberg III, Lahore. 97 Nishat Linen Tower – Swarovski 5-A-3, Mian Mahmood Ali Kasuri Road, Gulberg III, Lahore. 98 Swarovski-WTC Shop No. 11A, Ground Floor, World Trade Center, Islamabad. 99 Faisalabad – Swarovski Shop No. G-10, Ground Floor, The Boulevard Shopping Mall, East Canal Road, Faisalabad. 100 North Nazimabad Karachi Plot No. D-10/A, Block H, Main Khayaban-e-Sher Shah Suri, North Nazimabad, Karachi. 101 Hyderabad Shop No. 23-A, Unit 3, Main Auto Bhan Road, Hyderabad. 102 Vehari Shop No.1, Ground and First Floor, Mall of Vehari, Hasilpur Road, Vehari. 103 Daska Shop No.1, College Road, Daska. 104 Chandni Chowk Plot No. 221/B, 4th Road, Adjacent to KFC, Chandni Chowk, Satellite Town, Rawalpindi. 105 Gojra Opposite Paradise City, Jhang Road, Gojra. 106 Sahiwal Shop No.1, Girls College Road, Sahiwal. 107 Haripur Akhtar Nawaz Plaza, Main Haripur Road, Haripur. 108 Atrium Mall* 1st Floor, Atrium Mall, Staff Lines, Fatima Jinnah Road, Karachi Cantt. 109 Fair Price Shop* Plot No. CA-1-2, Ali Centre, Alfalah Co-operative Housing Society Limited, Shah Faisal Colony, Karachi.
* These stores have been closed during the year.
NISHAT HOSPITALITY (PRIVATE) LIMITED
Nishat Hospitality (Private) Limited, a wholly owned subsidiary of Nishat Mills Limited, is a private limited company incorporated in Pakistan under the repealed Companies Ordinance, 1984 (Now Companies Act, 2017) on 01 July 2011. The registered office of Nishat Hospitality (Private) Limited is situated at 1-B Aziz Avenue, Canal Bank, Gulberg-V, Lahore. The principal business place of the Company is situated at 8-A, 9-A and 28-A to 31-A, Mian Mehmood Ali Kasuri Road, Gulberg-III, Lahore. The principal activity of the Company is to carry on the business of hotels, cafes, restaurants and lodging or apartment houses, bakers and confectioners.
NISHAT USA, INC.
Nishat USA, Inc. is a foreign subsidiary incorporated under the Business Corporation Laws of the State of New York. The registered office of Nishat USA, Inc. is situated at 676 Broadway, New York, NY 10012, U.S.A. The principal
Business Units Address
Annual Report 2022
143Page

Nishat Mills Limited and its Subsidiaries
144 Page
For the year ended June 30, 2022Notes to the Consolidated Financial Statements
business of the Company is to provide marketing services to Nishat Mills Limited - Holding Company. Nishat Mills Limited acquired 100% shareholding of Nishat USA, Inc. on 01 October 2008.
NISHAT LINEN TRADING LLC
Nishat Linen Trading LLC is a limited liability company formed in pursuance to statutory provisions of the United Arab Emirates (UAE) Federal Law No. (8) of 1984 as amended and registered with the Department of Economic Development, Government of Dubai. Nishat Linen Trading LLC is a subsidiary of Nishat Mills Limited as Nishat Mills Limited, through the powers given to it under Article 11 of the Memorandum of Association, exercise full control on the management of Nishat Linen Trading LLC. Date of incorporation of the Company was 29 December 2010. The principal business of Nishat Linen Trading LLC is to operate retail outlets in UAE for sale of textile and related products. The registered office address of Nishat Linen Trading LLC in U.A.E. is Shop No. SC 128, Dubai Festival City, P.O. Box 28189 Dubai, United Arab Emirates and the retail outlets are located at:
Sr. No. Business Units 1 DFC Mall Store Shop No. SC128, 1st Floor, Dubai Festival City, Dubai 2 Dubai Outlet Store Shop No. F29 & F30, 1st Floor Outlet Mall, Dubai 3 Oasis Center Store Shop No. M-101C 1st Floor, Oasis Centre, Dubai 4 Arabian Center Store Shop No. 1543, Ground Floor, Arabian Centre, Dubai 5 Meena Bazar Store Shop No. 03(A), Al Esbeq Building, Souk Al Kabeer, Dubai 6 Al Ghurair Mall Shop No. FC34, 1st Floor, Al Ghurair Centre, Deira, Dubai 7 Mega Mall Sharjah Shop No. F232 / F233, Mega Mall, Sharjah 8 Sharjah City Centre Shop No. U-029, 1st Floor, City Centre, Sharjah 9 Sharq Mall Shop No. RB154–RB155-RB156, 1st Floor, Sharq Mall, Abu Dhabi 10 Al Wahda Mall Store Shop No. E276, Second Floor, Al Wahda Mall, Abu Dhabi 11 Al Ain Mall Store Shop No. F-17, Al Ain Mall, Al Ain 12 City Centre Mirdif Store Shop No. C072, Ground Floor, Dubai 13 City Centre Al Zahia Store Shop No. B-015, 2nd Floor, City Centre, Al Zahia, Sharjah 14 City Centre Ajman Shop No. B-016, Ground Floor, City Centre, Ajman
NISHAT INTERNATIONAL FZE
Nishat International FZE is incorporated as free zone establishment with limited liability in accordance with the Law No. 9 of 1992 and licensed by the Registrar of Jebel Ali Free Zone Authority. Nishat International FZE is a wholly owned subsidiary of Nishat Mills Limited. Date of incorporation of the Company was 07 February 2013. The registered office of Nishat International FZE is situated at P.O. Box 114622, Jebel Ali Free Zone, Dubai. The principal business of the Company is trading in textile and related products.
CHINA GUANGZHOU NISHAT GLOBAL CO., LTD.
China Guangzhou Nishat Global Co., Ltd. is a Company incorporated in People's Republic of China on 25 November 2013. It is a wholly owned subsidiary of Nishat International FZE which is a wholly owned subsidiary of Nishat Mills Limited. The primary function of China Guangzhou Nishat Global Co., Ltd. is to competitively source products for the retail outlets operated by Group companies in Pakistan and the UAE. The registered office of China Guangzhou Nishat Global CO., LTD. is situated at N801, No. 371-375 East Huanshi Road, Yuexiu District, Guangzhou City, China.
NISHAT COMMODITIES (PRIVATE) LIMITED
Nishat Commodities (Private) Limited is a private limited Company incorporated in Pakistan on 16 July 2015 under the repealed Companies Ordinance, 1984 (Now Companies Act, 2017). It is a wholly owned subsidiary of Nishat Mills Limited. Its registered office is situated at 53-A, Lawrence Road, Lahore. The principal object of the Company is to carry on the business of trading of commodities including fuels, coals, building material in any form or shape manufactured, semi-manufactured, raw materials and their import and sale in Pakistan. Geographical location and addresses of all business units are as follows:

Annual Report 2022
145Page
Sr. No. Business units Address
1 Head office 5 K.M., Nishat Avenue, Off 22 K.M., Ferozepur Road, Lahore. 2 Registered office Nishat House, 53-A, Lawrence Road, Lahore.
b) Lalpir Solar Power (Private) Limited (wound-up)
Lalpir Solar Power (Private) Limited was a private limited Company incorporated in Pakistan on 19 November 2015 under the repealed Companies Ordinance, 1984 (Now Companies Act, 2017). It was a wholly owned subsidiary of Nishat Power Limited which is a subsidiary of Nishat Mills Limited. Its registered office was situated at 53-A, Lawrence Road, Lahore. The principal activity of the Company was to build, own, operate and maintain or invest in a solar power project. During the year, the process of members’ voluntary winding up was initiated. On 30 June 2022, winding up process has been concluded and final documents have been submitted to SECP whereby no amount was distributable to Nishat Power Limited – Subsidiary Company out of net assets of the Company.
c) Significant restrictions
Cash and bank balances held in foreign countries are subject to local exchange control regulations. These regulations provide for restrictions on exporting capital from these countries, other than through normal dividends. The carrying amount of these assets included within the consolidated financial statements to which these restrictions apply is Rupees 953.348 million (2021: Rupees 597.422 million).
2 SUMMARY OF SIGNIFICANT ACCOUNTING POLICIES
The significant accounting policies applied in the preparation of these consolidated financial statements are set out below. These policies have been consistently applied to all years presented, unless otherwise stated:
2.1 Basis of preparation
a) Statement of compliance
These consolidated financial statements have been prepared in accordance with the accounting and reporting standards as applicable in Pakistan. The accounting and reporting standards applicable in Pakistan comprise of:
- International Financial Reporting Standards (IFRSs) issued by the International Accounting Standards Board (IASB) as notified under the Companies Act, 2017; and
- Provisions of and directives issued under the Companies Act, 2017.
Where provisions of and directives issued under the Companies Act, 2017 differ from the IFRSs, the provisions of and directives issued under the Companies Act, 2017 have been followed.
b) Accounting convention
These consolidated financial statements have been prepared under the historical cost convention except as otherwise stated in the respective accounting policies.
c) Critical accounting estimates and judgments
The preparation of these consolidated financial statements in conformity with the approved accounting standards requires the use of certain critical accounting estimates. It also requires the management to exercise its judgment in the process of applying the accounting policies. Estimates and judgments are continually evaluated and are based on historical experience and other factors, including expectations of future events that are believed to be reasonable under the circumstances. The areas where various assumptions and estimates are significant to the consolidated financial statements or where judgments were exercised in application of accounting policies are as follows:

Financial instruments – fair value
The fair value of financial instruments that are not traded in an active market is determined by using valuation techniques based on assumptions that are dependent on conditions existing at the reporting date.
Useful lives, patterns of economic benefits and impairment
Estimates with respect to residual values and useful lives and pattern of flow of economic benefits are based on the analysis of the management. Further, the Group reviews the value of assets for possible impairment on an annual basis. Any change in the estimates in the future might affect the carrying amount of respective item of property, plant and equipment and investment properties with a corresponding effect on the depreciation charge and impairment.
Inventories
Inventory write-down is made based on the current market conditions, historical experience and selling goods of similar nature. It could change significantly as a result of changes in market conditions. A review is made on each reporting date on inventories for excess inventories, obsolescence and declines in net realisable value and an allowance is recorded against the inventory balances for any such declines.
Income tax
In making the estimates for income tax currently payable by the Group, the management takes into account the current income tax law and the decisions of appellate authorities on certain issues in the past.
Allowance for expected credit losses
The allowance for Expected Credit Losses (ECLs) assessment requires a degree of estimation and judgement. It is based on the lifetime expected credit loss, grouped based on days overdue, and makes assumptions to allocate an overall expected credit loss rate for each group. These assumptions include recent sales experience and historical collection rates.
Provisions
As the actual outflows can differ from estimates made for provisions due to changes in laws, regulations, public expectations, technology, prices and conditions, and can take place many years in the future, the carrying amounts of provisions are reviewed at each reporting date and adjusted to take account of such changes. Any adjustments to the amount of previously recognised provision is recognised in the consolidated statement of profit or loss unless the provision was originally recognised as part of cost of an asset.
Contingencies
The Group reviews the status of all pending litigations and claims against the Group. Based on the judgment and the advice of the legal advisors for the estimated financial outcome, appropriate disclosure or provision is made. The actual outcome of these litigations and claims can have an effect on the carrying amounts of the liabilities recognized at the consolidated statement of financial position date.
Revenue from contracts with customers involving sale of goods
When recognizing revenue in relation to the sale of goods to customers, the key performance obligation of the Group is considered to be the point of delivery of the goods to the customer, as this is deemed to be the time that the customer obtains control of the promised goods and therefore the
Nishat Mills Limited and its Subsidiaries
146 Page
For the year ended June 30, 2022Notes to the Consolidated Financial Statements

benefits of unimpeded access.
Impairment of investments in equity method accounted for associates
In making an estimate of recoverable amount of the Group's investments in equity method accounted for associates, the management considers future cash flows.
d) Amendments to published approved accounting standards that are effective in current year and are relevant to the Group
Following amendments to published approved accounting standards are mandatory for the Group’s accounting periods beginning on or after 01 July 2021:
• Amendments to IFRS 16 ‘Leases’ – Covid-19 related rent concessions extended beyond 30 June 2021
• Interest Rate Benchmark Reform – Phase 2 which amended IFRS 9 ‘Financial Instruments’, IAS 39 ‘Financial Instruments: Recognition and Measurement’, IFRS 4 ‘Insurance Contracts’, IFRS 7 ‘Financial Instruments: Disclosures’, IFRS 4 ‘Insurance Contracts’ and IFRS 16 ‘Leases’
The above-mentioned amendments to approved accounting standards did not have any impact on the amounts recognized in prior period and are not expected to significantly affect the current or future periods.
e) Amendments to published approved accounting standards that are effective in current year but not relevant to the Group
There are amendments to published standards that are mandatory for accounting periods beginning on or after 01 July 2021 but are considered not to be relevant or do not have any significant impact on the Group’s financial statements and are therefore not detailed in these consolidated financial statements.
f) Amendments to published approved accounting standards that are not yet effective but relevant to the Group
Following amendments to existing standards have been published and are mandatory for the Company’s accounting periods beginning on or after 01 July 2022 or later periods:
Classification of liabilities as current or non-current (Amendments to IAS 1 ‘Presentation of Financial Statements’) effective for the annual period beginning on or after 01 January 2023. These amendments in the standards have been added to further clarify when a liability is classified as current. The standard also amends the aspect of classification of liability as non-current by requiring the assessment of the entity’s right at the end of the reporting period to defer the settlement of liability for at least twelve months after the reporting period. An entity shall apply those amendments retrospectively in accordance with IAS 8 ‘Accounting Policies, Changes in Accounting Estimates and Errors’.
Onerous Contracts – Cost of Fulfilling a Contract (Amendments to IAS 37 ‘Provisions, Contingent Liabilities and Contingent Assets’) effective for the annual period beginning on or after 01 January 2022 amends IAS 1 ‘Presentation of Financial Statements’ by mainly adding paragraphs which clarifies what comprise the cost of fulfilling a contract. Cost of fulfilling a contract is relevant when determining whether a contract is onerous. An entity is required to apply the amendments to contracts for which it has not yet fulfilled all its obligations at the beginning of the annual reporting period in which it first applies the amendments (the date of initial application). Restatement of comparative information is not required, instead the amendments require an entity to recognize the cumulative effect of initially applying the amendments as an adjustment to the opening balance of retained earnings or other component of equity, as appropriate, at the date of initial application.
Annual Report 2022
147Page

The following annual improvements to IFRS standards 2018-2020 are effective for annual reporting periods beginning on or after 01 January 2022:
- IFRS 9 ‘Financial Instruments’ – The amendment clarifies that an entity includes only fees paid or received between the entity (the borrower) and the lender, including fees paid or received by either the entity or the lender on the other’s behalf, when it applies the ‘10 per cent’ test in paragraph B3.3.6 of IFRS 9 in assessing whether to derecognize a financial liability.
- IFRS 16 ‘Leases’ – The amendment partially amends Illustrative Example 13 accompanying IFRS 16 ‘Leases’ by excluding the illustration of reimbursement of leasehold improvements by the lessor. The objective of the amendment is to resolve any potential confusion that might arise in lease incentives.
Disclosure of Accounting Policies (Amendments to IAS 1 ‘Presentation of Financial Statements’ and IFRS Practice Statement 2 ‘Making Materiality Judgement’) effective for annual periods beginning on or after 01 January 2023. These amendments are intended to help preparers in deciding which accounting policies to disclose in their financial statements. Earlier, IAS 1 states that an entity shall disclose its ‘significant accounting policies’ in their financial statements. These amendments shall assist the entities to disclose their ‘material accounting policies’ in their consolidated financial statements.
Deferred Tax related to Assets and Liabilities arising from a Single Transaction (Amendments to IAS 12 ‘Income taxes’) effective for annual periods beginning on or after 01 January 2023. These amendments clarify how companies account for deferred tax on transactions such as leases and decommissioning obligations.
Change in definition of Accounting Estimate (Amendments to IAS 8 ‘Accounting Policies, Changes in Accounting Estimates and Errors’) effective for annual periods beginning on or after 1 January 2023. This change replaced the definition of Accounting Estimate with a new definition, intended to help entities to distinguish between accounting policies and accounting estimates.
The International Accounting Standards Board (IASB) has published 'Reference to the Conceptual Framework (Amendments to IFRS 3)' with amendments to IFRS 3 'Business Combinations' that update an outdated reference in IFRS 3 without significantly changing its requirements. Effective for business combinations for which the acquisition date is on or after the beginning of annual period beginning on or after 01 January 2022. The amendments also add to IFRS 3 an exception to its requirement for an entity to refer to the Conceptual Framework to determine what constitutes an asset or a liability. The standard is effective for transactions in the future and therefore would not have an impact on past consolidated financial statements.
Amendments to IFRS 10 ‘Consolidated Financial Statements’ and IAS 28 ‘Investments in Associates and Joint Ventures’ (deferred indefinitely) to clarify the treatment of the sale or contribution of assets from an investor to its associates or joint venture, as follows: require full recognition in the investor’s financial statements of gains and losses arising on the sale or contribution of assets that constitute a business (as defined in IFRS 3 ‘Business Combinations’); require the partial recognition of gains and losses where the assets do not constitute a business, i.e. a gain or loss is recognized only to the extent of the unrelated investors’ interests in that associate or joint venture. These requirements apply regardless of the legal form of the transaction, e.g. whether the sale or contribution of assets occur by an investor transferring shares in a subsidiary that holds the assets (resulting in loss of control of the subsidiary), or by the direct sale of the assets themselves.
The above amendments and improvements are likely to have no significant impact on the consolidated financial statements.
Nishat Mills Limited and its Subsidiaries
148 Page
For the year ended June 30, 2022Notes to the Consolidated Financial Statements

g) Standards and amendments to approved published standards that are not yet effective and not considered relevant to the Group
There are other standards and amendments to published standards that are mandatory for accounting periods beginning on or after 01 July 2022 but are considered not to be relevant or do not have any significant impact on the Group’s financial statements and are therefore not detailed in these consolidated financial statements.
2.2 Consolidation
a) Subsidiaries
Subsidiaries are all entities over which the Group has control. The Group controls an entity when the Group is exposed to, or has rights to, variable returns from its involvement with the entity and has the ability to affect those returns through its power to direct the activities of the entity. Subsidiaries are fully consolidated from the date on which control is transferred to the Group. They are deconsolidated from the date that control ceases.
The assets and liabilities of Subsidiary Companies have been consolidated on a line by line basis and carrying value of investments held by the Holding Company is eliminated against Holding Company's share in paid up capital of the Subsidiary Companies.
Intragroup balances and transactions have been eliminated.
Non-controlling interests are that part of net results of the operations and of net assets of Subsidiary Companies attributable to interest which are not owned by the Holding Company. Non-controlling interests are presented as separate item in the consolidated financial statements.
b) Associates
Associates are all entities over which the Group has significant influence but not control or joint control. Investments in associates are accounted for using the equity method of accounting, after initially being recognised at cost.
Under the equity method of accounting, the investments are initially recognised at cost and adjusted thereafter to recognise the Group’s share of the post-acquisition profits or losses of the investee in profit or loss, and the Group’s share of movements in other comprehensive income of the investee in other comprehensive income. Dividends received or receivable from associates are recognised as a reduction in the carrying amount of the investment.
When the Group’s share of losses in an equity-accounted investment equals or exceeds its interest in the entity, including any other unsecured long-term receivables, the Group does not recognise further losses, unless it has incurred obligations or made payments on behalf of the other entity.
Unrealised gains on transactions between the Group and its associates are eliminated to the extent of the Group’s interest in these entities. Unrealised losses are also eliminated unless the transaction provides evidence of an impairment of the asset transferred. Accounting policies of equity accounted investees have been changed where necessary to ensure consistency with the policies adopted by the Group.
Investments in equity method accounted for associates are tested for impairment in accordance with the provision of IAS 36 ‘Impairment of Assets’.
c) Translation of the financial statements of foreign subsidiaries
The financial statements of foreign subsidiaries of which the functional currency is different from that used in preparing the Group's financial statements are translated in functional currency of the
Annual Report 2022
149Page

Group. Statement of financial position items are translated at the exchange rate at the reporting date and statement of profit or loss items are converted at the average rate for the period. Any resulting translation differences are recognized under exchange translation reserve in consolidated reserves.
2.3 Employee benefit
Nishat Mills Limited – Holding Company and Nishat Power Limited, Nishat Linen (Private) Limited and Nishat Hospitality (Private) Limited – Subsidiary Companies operate approved funded provident fund schemes covering all permanent employees. Equal monthly contributions are made both by the employer and employees to the fund. The employer's contributions to the fund are charged to consolidated statement of profit or loss.
End of service indemnity - Nishat Linen Trading LLC and Nishat International FZE – Subsidiary Companies
Provision is made for the full amount of end of service indemnity due to non-U.A.E. national employees in accordance with the applicable Labour Law and is based on current remuneration and their period of service at the end of the reporting year.
Short-term and other long term employee benefits - Nishat Linen Trading LLC and Nishat International FZE – Subsidiary Companies
A liability is recognized for benefits accruing to employees in respect of wages and salaries, annual leave and sick leave in the period the related service is rendered at the undiscounted amount of the benefits expected to be paid in exchange for that service.
Liabilities recognized in respect of short-term employee benefits are measured at the undiscounted amount of the benefits expected to be paid in exchange for the related service.
Liabilities recognized in respect of other long-term employee benefits are measured at the present value of the estimated future cash outflows expected to be made by the Entity in respect of services provided by employees up to the reporting date.
Accumulating compensated absences - Nishat Hospitality (Private) Limited – Subsidiary Company
Nishat Hospitality (Private) Limited – Subsidiary Company provides for accumulating compensated absences when the employees render services that increase their entitlement to future compensated absences in accordance with the terms of employment. Under the terms, all employees are entitled to 25 days leave per year. Unavailed leaves for each year can be carried forward for 2 years and utilized at any time by all employees up to the accumulated balance. Provisions are made annually on the basis of unavailed accumulated leaves. The benefit is calculated with reference to last drawn salary and accumulated leave balances of the employees. The management is of the view that actuarial valuation will not result in any material adjustment to these consolidated financial statements. The liability has been accounted for on the basis that all employees leave at the consolidated statement of financial position date. Retirement benefits are payable to staff on completion of prescribed qualifying period of service under these schemes.
2.4 Taxation
Current
Provision for current tax is based on the taxable income for the year determined in accordance with the prevailing law for taxation of income. The charge for current tax is calculated using prevailing tax rates or tax rates expected to apply to the profit for the year if enacted. The charge for current tax also includes adjustments, where considered necessary, to provision for tax made in previous years arising from assessments framed during the year for such years.
Nishat Mills Limited and its Subsidiaries
150 Page
For the year ended June 30, 2022Notes to the Consolidated Financial Statements

The profits and gains of Nishat Power Limited - Subsidiary Company derived from electric power generation are exempt from tax in terms of Clause (132) of Part I of the Second Schedule to the Income Tax Ordinance, 2001, subject to the conditions and limitations provided therein. Under Clause 11(v) of Part IV of the Second Schedule to the Income Tax Ordinance, 2001, the Subsidiary Company is also exempt from levy of minimum tax on 'turnover' under section 113 of the Income Tax Ordinance, 2001. However, full provision is made in the consolidated statement of profit or loss on income from sources not covered under the above clauses at current rates of taxation after taking into account, tax credits and rebates available, if any.
Provision for income tax on the income of foreign subsidiaries - Nishat USA, Inc. and China Guangzhou Nishat Global Co., Ltd. is computed in accordance with the tax legislation in force in the country where the income is taxable.
Deferred
Deferred tax is accounted for using the liability method in respect of all temporary differences arising from differences between the carrying amount of assets and liabilities in the consolidated financial statements and the corresponding tax bases used in the computation of the taxable profit. Deferred tax liabilities are generally recognized for all taxable temporary differences and deferred tax assets to the extent that it is probable that taxable profits will be available against which the deductible temporary differences, unused tax losses and tax credits can be utilized.
Deferred tax is calculated at the rates that are expected to apply to the period when the differences reverse based on tax rates that have been enacted or substantively enacted by the reporting date. Deferred tax is charged or credited in the consolidated statement of profit or loss, except to the extent that it relates to items recognized in other comprehensive income or directly in equity. In this case the tax is also recognized in other comprehensive income or directly in equity, respectively.
Nishat Power Limited - Subsidiary Company has not made provision for deferred tax as the Subsidiary Company's management believes that the temporary differences will not reverse in the foreseeable future due to the fact that the profits and gains of the Company derived from electric power generation are exempt from tax subject to the conditions and limitations provided for in terms of Clause 132 of Part I of the Second Schedule to the Income Tax Ordinance, 2001.
2.5 Goodwill
Goodwill is measured as the excess of the sum of the consideration transferred, the amount of any non controlling interests in the acquiree, and the fair value of the acquirer’s previously held equity interest in the acquiree (if any) over the net of the acquisition date amounts of the identifiable assets acquired and the liabilities assumed. If, after reassessment, the net of the acquisition date amounts of the identifiable assets acquired and liabilities assumed exceeds the sum of the consideration transferred, the amount of any non controlling interests in the acquiree and the fair value of the acquirer’s previously held interest in the acquiree (if any), the excess is recognised immediately in profit or loss as a bargain purchase gain. Goodwill is not amortised but is reviewed for impairment at least annually.
2.6 Foreign currencies
These consolidated financial statements are presented in Pak Rupees, which is the Group’s functional currency. All monetary assets and liabilities denominated in foreign currencies are translated into Pak Rupees at the rates of exchange prevailing at the reporting date, while the transactions in foreign currencies (except the results of foreign operation which are translated to Pak Rupees at the average rate of exchange for the year) during the year are initially recorded in functional currency at the rates of exchange prevailing at the transaction date. All non-monetary items are translated into Pak Rupees at exchange rates prevailing on the date of transaction or on the date when fair values are determined. Exchange gains and losses are recorded in the consolidated statement of profit or loss.
Annual Report 2022
151Page
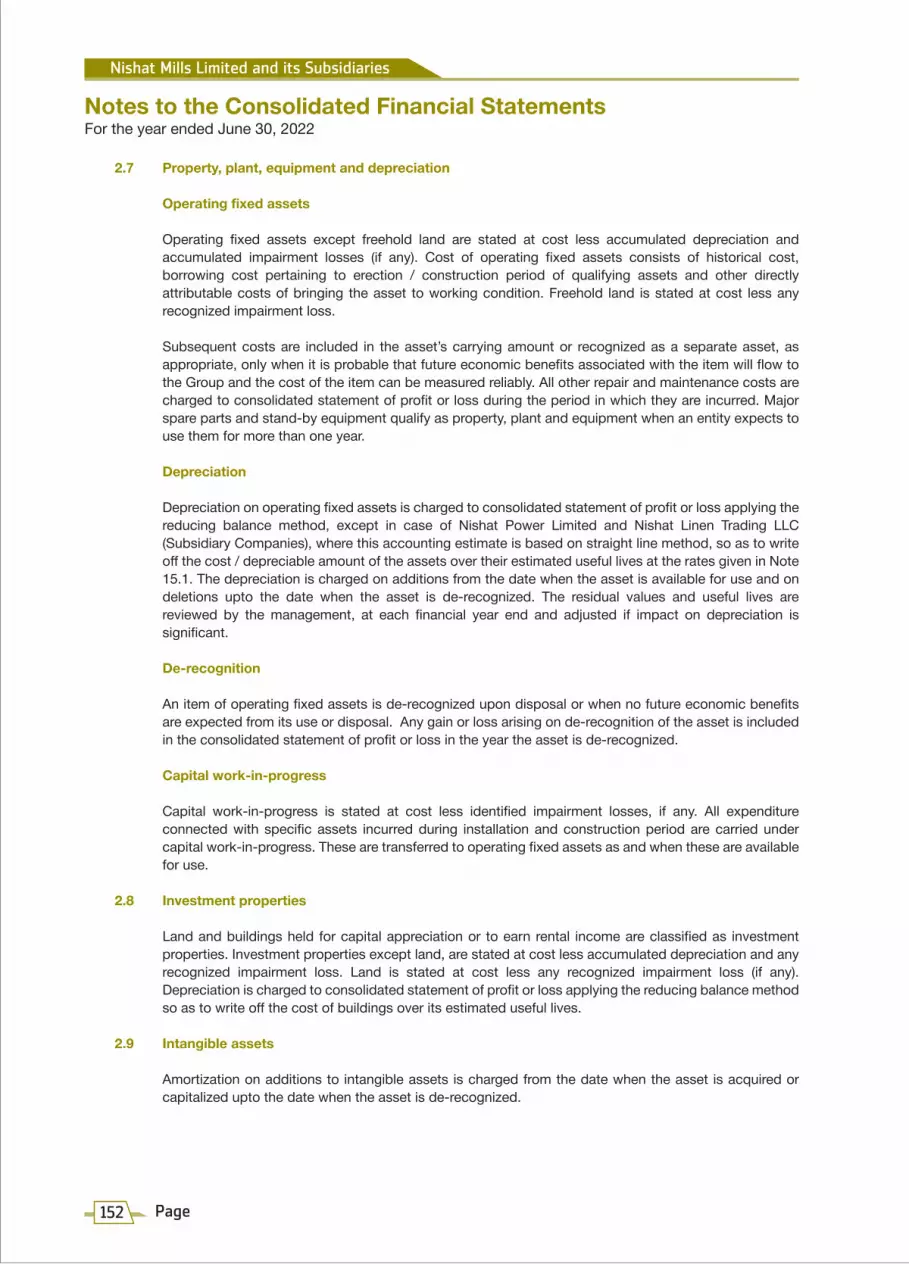
2.7 Property, plant, equipment and depreciation
Operating fixed assets
Operating fixed assets except freehold land are stated at cost less accumulated depreciation and accumulated impairment losses (if any). Cost of operating fixed assets consists of historical cost, borrowing cost pertaining to erection / construction period of qualifying assets and other directly attributable costs of bringing the asset to working condition. Freehold land is stated at cost less any recognized impairment loss.
Subsequent costs are included in the asset’s carrying amount or recognized as a separate asset, as appropriate, only when it is probable that future economic benefits associated with the item will flow to the Group and the cost of the item can be measured reliably. All other repair and maintenance costs are charged to consolidated statement of profit or loss during the period in which they are incurred. Major spare parts and stand-by equipment qualify as property, plant and equipment when an entity expects to use them for more than one year.
Depreciation
Depreciation on operating fixed assets is charged to consolidated statement of profit or loss applying the reducing balance method, except in case of Nishat Power Limited and Nishat Linen Trading LLC (Subsidiary Companies), where this accounting estimate is based on straight line method, so as to write off the cost / depreciable amount of the assets over their estimated useful lives at the rates given in Note 15.1. The depreciation is charged on additions from the date when the asset is available for use and on deletions upto the date when the asset is de-recognized. The residual values and useful lives are reviewed by the management, at each financial year end and adjusted if impact on depreciation is significant.
De-recognition
An item of operating fixed assets is de-recognized upon disposal or when no future economic benefits are expected from its use or disposal. Any gain or loss arising on de-recognition of the asset is included in the consolidated statement of profit or loss in the year the asset is de-recognized.
Capital work-in-progress
Capital work-in-progress is stated at cost less identified impairment losses, if any. All expenditure connected with specific assets incurred during installation and construction period are carried under capital work-in-progress. These are transferred to operating fixed assets as and when these are available for use.
2.8 Investment properties
Land and buildings held for capital appreciation or to earn rental income are classified as investment properties. Investment properties except land, are stated at cost less accumulated depreciation and any recognized impairment loss. Land is stated at cost less any recognized impairment loss (if any). Depreciation is charged to consolidated statement of profit or loss applying the reducing balance method so as to write off the cost of buildings over its estimated useful lives.
2.9 Intangible assets
Amortization on additions to intangible assets is charged from the date when the asset is acquired or capitalized upto the date when the asset is de-recognized.
Nishat Mills Limited and its Subsidiaries
152 Page
For the year ended June 30, 2022Notes to the Consolidated Financial Statements

2.10 Right-of-use assets
A right-of-use asset is recognized at the commencement date of a lease. The right-of-use asset is measured at cost, which comprises the initial amount of the lease liability, adjusted for, as applicable, any lease payments made at or before the commencement date net of any lease incentives received, any initial direct costs incurred, and, except where included in the cost of inventories, an estimate of costs expected to be incurred for dismantling and removing the underlying asset, and restoring the site or asset.
Right-of-use assets are depreciated on a straight line basis over the unexpired period of the lease or the estimated useful life of the asset, whichever is shorter. Where the Group expects to obtain ownership of the leased asset at the end of the lease term, the depreciation is charged over its estimated useful life. Right-of use assets are subject to impairment or adjusted for any re-measurement of lease liabilities.
The Group has elected not to recognize a right-of-use asset and corresponding lease liability for short-term leases with terms of 12 months or less and leases of low-value assets. Lease payments on these assets are charged to income as incurred.
2.11 Lease liabilities
A lease liability is recognized at the commencement date of a lease. The lease liability is initially recognized at the present value of the lease payments to be made over the term of the lease, discounted using the interest rate implicit in the lease or, if that rate cannot be readily determined, the Group's incremental borrowing rate. Lease payments comprise of fixed payments less any lease incentives receivable, variable lease payments that depend on an index or a rate, amounts expected to be paid under residual value guarantees, exercise price of a purchase option when the exercise of the option is reasonably certain to occur, and any anticipated termination penalties. The variable lease payments that do not depend on an index or a rate are expensed in the period in which they are incurred.
Lease liabilities are measured at amortised cost using the effective interest method. The carrying amounts are re-measured if there is a change in the following: future lease payments arising from a change in an index or a rate used; residual guarantee; lease term; certainty of a purchase option and termination penalties. When a lease liability is re-measured, an adjustment is made to the corresponding right-of-use asset, or to consolidated statement of profit or loss if the carrying amount of the right-of-use asset is fully written down.
Nishat Power Limited - Subsidiary Company has a Power Purchase Agreement (PPA) with its sole customer, CPPA-G for twenty five years and sixty eight days which commenced from 09 June 2010. SECP through SRO 986(I)/2019 dated 02 September 2019, has granted exemption from the requirements of IFRS 16 ‘Leases’ to all companies to the extent of their power purchase agreements executed before 01 January 2019. Therefore, IFRS 16 will not have any impact on the consolidated financial statements to the extent of power purchase agreement of Nishat Power Limited - Subsidiary Company.
Under IFRS 16, the consideration required to be made by the lessee for the right to use the asset is to be accounted for as a finance lease. Nishat Power Limited - Subsidiary Company’s power plant’s control due to purchase of total output by CPPA-G appears to fall under the scope of finance lease under IFRS 16. Consequently, if Nishat Power Limited - Subsidiary Company was to follow IFRS 16 with respect to its power purchase agreement, the effect on these consolidated financial statements would be as follows:
Annual Report 2022
153Page

2022 2021 (Rupees in thousand)
De-recognition of property, plant and equipment (7,918,485) (8,467,959)
De-recognition of trade debts (487,418) (7,134,685)
Recognition of lease debtor 4,032,082 10,748,829
Decrease in un-appropriated profit at the beginning of the year (4,853,815) (5,452,679) Increase in profit for the year 479,994 598,864 Decrease in un-appropriated profit at the end of the year (4,373,821) (4,853,815)
2.12 Investments and other financial assets a) Classification
The Group classifies its financial assets in the following measurement categories:
• those to be measured subsequently at fair value (either through other comprehensive income, or through profit or loss), and
• those to be measured at amortized cost
The classification depends on the Group's business model for managing the financial assets and the contractual terms of the cash flows.
For assets measured at fair value, gains and losses will either be recorded in profit or loss or other comprehensive income. For investments in debt instruments, this will depend on the business model in which the investment is held. For investments in equity instruments, this will depend on whether the Group has made an irrevocable election at the time of initial recognition to account for the equity investment at fair value through other comprehensive income. The Group reclassifies debt investments when and only when its business model for managing those assets changes.
b) Measurement
At initial recognition, the Group measures a financial asset at its fair value plus, in the case of a financial asset not at fair value through profit or loss, transaction costs that are directly attributable to the acquisition of the financial asset. Transaction costs of financial assets carried at fair value through profit or loss are expensed in profit or loss.
Financial assets with embedded derivatives are considered in their entirety when determining whether their cash flows are solely payment of principal and interest.
Debt instruments
Subsequent measurement of debt instruments depends on the Group's business model for managing the asset and the cash flow characteristics of the asset. There are three measurement categories into which the Group classifies its debt instruments:
Amortized cost
Financial assets that are held for collection of contractual cash flows where those cash flows represent solely payments of principal and interest are measured at amortised cost. Interest income
Nishat Mills Limited and its Subsidiaries
154 Page
For the year ended June 30, 2022Notes to the Consolidated Financial Statements
from these financial assets is included in other income using the effective interest rate method. Any gain or loss arising on derecognition is recognised directly in profit or loss and presented in other income / (other expenses) together with foreign exchange gains and losses. Impairment losses are presented as separate line item in the consolidated statement of profit or loss.
Fair value through other comprehensive income (FVTOCI)
Financial assets that are held for collection of contractual cash flows and for selling the financial assets, where the assets’ cash flows represent solely payments of principal and interest, are measured at FVTOCI. Movements in the carrying amount are taken through other comprehensive income, except for the recognition of impairment losses (and reversal of impairment losses), interest income and foreign exchange gains and losses which are recognised in profit or loss. When the financial asset is derecognised, the cumulative gain or loss previously recognised in other comprehensive income is reclassified from equity to profit or loss and recognised in other income / (other expenses). Interest income from these financial assets is included in other income using the effective interest rate method. Foreign exchange gains and losses are presented in other income / (other expenses) and impairment losses are presented as separate line item in the consolidated statement of profit or loss.
Fair value through profit or loss (FVTPL)
Assets that do not meet the criteria for amortised cost or FVTOCI are measured at FVTPL. A gain or loss on a debt instrument that is subsequently measured at FVTPL is recognised in profit or loss and presented net within other income / (other expenses) in the period in which it arises.
Equity instruments
The Group subsequently measures all equity investments at fair value for financial instruments quoted in an active market, the fair value corresponds to a market price (level 1). For financial instruments that are not quoted in an active market, the fair value is determined using valuation techniques including reference to recent arm’s length market transactions or transactions involving financial instruments which are substantially the same (level 2), or discounted cash flow analysis including, to the greatest possible extent, assumptions consistent with observable market data (level 3).
Fair value through other comprehensive income (FVTOCI)
Where the Group's management has elected to present fair value gains and losses on equity investments in other comprehensive income, there is no subsequent reclassification of fair value gains and losses to profit or loss. Impairment losses (and reversal of impairment losses) on equity investments measured at FVTOCI are not reported separately from other changes in fair value.
Fair value through profit or loss
Changes in the fair value of equity investments at fair value through profit or loss are recognised in other income / (other expenses) in the consolidated statement of profit or loss as applicable.
Dividends from such investments continue to be recognised in profit or loss as other income when the Group's right to receive payments is established.
2.13 Financial liabilities – classification and measurement
Financial liabilities are classified as measured at amortized cost or FVTPL. A financial liability is classified as at FVTPL if it is classified as held-for-trading, it is a derivative or it is designated as such on initial recognition. Financial liabilities at FVTPL are measured at fair value and net gains and losses, including any interest expense, are recognized in profit or loss. Other financial liabilities are subsequently measured at amortized cost using the effective interest method. Interest expense and foreign exchange gains and
Annual Report 2022
155Page

losses are recognized in consolidated statement of profit or loss. Any gain or loss on de-recognition is also included in profit or loss.
2.14 Impairment of financial assets
a. Financial assets other than those due from Government of Pakistan The Group recognizes loss allowances for ECLs on:
- Financial assets measured at amortized cost; - Debt investments measured at FVTOCI; and - Contract assets.
The Group measures loss allowances at an amount equal to lifetime ECLs, except for the following, which are measured at 12-month ECLs:
- Debt securities that are determined to have low credit risk at the reporting date; and
- Other debt securities and bank balances for which credit risk (i.e. the risk of default occurring over the expected life of the financial instrument) has not increased significantly since initial recognition.
12-month ECLs are the portion of ECLs that result from default events that are possible within the 12
months after the reporting date (or a shorter period if the expected life of the instrument is less than 12 months).
When determining whether the credit risk of a financial asset has increased significantly since initial recognition and when estimating ECLs, the Group considers reasonable and supportable information that is relevant and available without undue cost or effort. This includes both quantitative and qualitative information and analysis, based on the Group’s historical experience and informed credit assessment and including forward-looking information.
The Group assumes that the credit risk on a financial asset has increased significantly if it is more than past due for a reasonable period of time. Lifetime ECLs are the ECLs that result from all possible default events over the expected life of a financial instrument. 12-month ECLs are the portion of ECLs that result from default events that are possible within the 12 months after the reporting date (or a shorter period if the expected life of the instrument is less than 12 months). The maximum period considered when estimating ECLs is the maximum contractual period over which the Group is exposed to credit risk.
The Group has elected to measure loss allowances for trade debts using IFRS 9 simplified approach and has calculated ECLs based on lifetime ECLs. The Group has established a matrix that is based on the Group 's historical credit loss experience, adjusted for forward-looking factors specific to the debtors and the economic environment. When determining whether the credit risk of a financial asset has increased significantly since initial recognition and when estimating ECLs, the Group considers reasonable and supportable information that is relevant and available without undue cost or effort. This includes both quantitative and qualitative information and analysis, based on the Group's historical experience and informed credit assessment including forward-looking information.
Loss allowances for financial assets measured at amortized cost are deducted from the gross carrying amount of the assets.
The gross carrying amount of a financial asset is written off when the Group has no reasonable expectations of recovering of a financial asset in its entirety or a portion thereof. The Group individually makes an assessment with respect to the timing and amount of write-off based on whether there is a reasonable expectation of recovery. The Group expects no significant recovery from the amount written off. However, financial assets that are written off could still be subject to enforcement activities in order to comply with the Group's procedures for recovery of amounts due.
Nishat Mills Limited and its Subsidiaries
156 Page
For the year ended June 30, 2022Notes to the Consolidated Financial Statements

At each reporting date, the Group assesses whether financial assets carried at amortised cost and debt securities at FVTOCI are credit-impaired. A financial asset is ‘credit-impaired’ when one or more events that have a detrimental impact on the estimated future cash flows of the financial asset have occurred.
Evidence that a financial asset is credit-impaired includes the following observable data:
- significant financial difficulty of the debtor; - a breach of contract such as a default; - the restructuring of a loan or advance by the Group on terms that the Group would not consider
otherwise; - it is probable that the debtor will enter bankruptcy or other financial reorganization; or - the disappearance of an active market for a security because of financial difficulties.
b. Financial assets other than those due from Government of Pakistan
In respect of financial assets due from the Government of Pakistan, SECP through SRO 1177(I)/2021 dated 13 September 2021 partially modified its previous SRO 985(I)/2019 dated 02 September 2019 and notified that the requirements contained in IFRS 9 with respect to application of Expected Credit Losses (ECLs) method shall not be applicable till 30 June 2022 and that such companies shall follow relevant requirements of International Accounting Standard ('IAS') 39 in respect of above referred financial assets during the exemption period. Accordingly, the Group has not followed the requirements of IFRS 9 with respect to application of Expected Credit Losses in respect of trade debts and other receivables due from CPPA-G.
2.15 De-recognition of financial assets and financial liabilities
a) Financial assets
The Group derecognizes a financial asset when the contractual rights to the cash flows from the asset expire, or it transfers the rights to receive the contractual cash flows in a transaction in which substantially all of the risks and rewards of ownership of the financial asset are transferred, or it neither transfers nor retains substantially all of the risks and rewards of ownership and does not retain control over the transferred asset. Any interest in such derecognized financial assets that is created or retained by the Group is recognized as a separate asset or liability.
b) Financial liabilities
The Group derecognizes a financial liability (or a part of financial liability) from its consolidated statement of financial position when the obligation specified in the contract is discharged or cancelled or expires.
2.16 Offsetting of financial instruments
Financial assets and financial liabilities are set off and the net amount is reported in the consolidated financial statements when there is a legal enforceable right to set off and the Group intends either to settle on a net basis or to realize the assets and to settle the liabilities simultaneously.
2.17 Inventories
Inventories, except for stock in transit and waste stock / rags are stated at lower of cost and net realizable value. Cost is determined as follows:
Stores, spare parts and loose tools
Useable stores, spare parts and loose tools are valued principally at moving average cost, while items considered obsolete are carried at nil value. Items in transit are valued at cost comprising invoice value plus other charges paid thereon.
Annual Report 2022
157Page

Stock-in-trade
Cost of raw material, work-in-process and finished goods is determined as follows:
(i) For raw materials: Annual average basis. (ii) For work-in-process and finished goods: Average manufacturing cost including a portion of production overheads.
Materials in transit are valued at cost comprising invoice value plus other charges paid thereon. Waste stock / rags are valued at net realizable value.
Net realizable value signifies the estimated selling price in the ordinary course of business less the estimated costs of completion and the estimated costs necessary to make a sale.
2.18 Trade debts and other receivables
Trade debts are initially recognised at fair value and subsequently measured at amortised cost using the effective interest method, less any allowance for expected credit losses.
Other receivables are recognised at amortised cost, less any allowance for expected credit losses.
However, in respect of companies holding financial assets due from the Government of Pakistan, SECP through SRO 1177(I)/2021 dated 13 September 2021 partially modified its previous SRO 985(I)/2019 dated 02 September 2019 and has notified that the requirements contained in IFRS 9 with respect to application of expected credit losses method shall not be applicable till 30 June 2022 and that such companies shall follow relevant requirements of IAS 39 in respect of above referred financial assets during the exemption period.
2.19 Non–current assets (or disposal groups) held for sale
Non-current assets (or disposal groups) are classified as assets held for sale when their carrying amount is to be recovered principally through a sale transaction and a sale is considered highly probable. They are stated at the lower of carrying amount and fair value less costs to sell.
2.20 Borrowings
Financing and borrowings are recognized initially at fair value and are subsequently stated at amortized cost. Any difference between the proceeds and the redemption value is recognized in the consolidated statement of profit or loss over the period of the borrowings using the effective interest method.
2.21 Borrowing cost
Interest, mark-up and other charges on finances are capitalized up to the date of commissioning of respective qualifying assets acquired out of the proceeds of such finances. All other interest, mark-up and other charges are recognized in consolidated statement of profit or loss.
2.22 Share capital
Ordinary shares are classified as share capital. Incremental costs directly attributable to the issue of new shares are shown in equity as a deduction, net of tax.
2.23 Trade and other payables
Liabilities for trade and other amounts payable are initially recognized at fair value, which is normally the transaction cost.
Nishat Mills Limited and its Subsidiaries
158 Page
For the year ended June 30, 2022Notes to the Consolidated Financial Statements
2.24 Revenue recognition
Sale of goods
Revenue from the sale of goods is recognised at the point in time when the customer obtains control of the goods, which is generally at the time of delivery.
Processing services
The Group provides processing services to local customers. These services are sold separately and the Company’s contract with the customer for services constitute a single performance obligation.
Revenue from services is recognized at the point in time, generally at the time of dispatch. There are no terms giving rise to variable consideration under the Group’s contracts with its customers.
Interest
Interest income is recognised as interest accrues using the effective interest method. This is a method of calculating the amortised cost of a financial asset and allocating the interest income over the relevant period using the effective interest rate, which is the rate that exactly discounts estimated future cash receipts through the expected life of the financial asset to the net carrying amount of the financial asset.
Rent
Rent revenue from investment properties is recognised on a straight-line basis over the lease term. Lease incentives granted are recognised as part of the rental revenue. Contingent rentals are recognised as income in the period when earned.
Sale of electricity
Revenue from the sale of electricity to CPPA-G, the sole customer of Nishat Power Limited – Subsidiary Group, is recorded on the following basis:
Capacity purchase price revenue is recognized over time, based on the capacity made available to CPPA-G, at rates as specified under the PPA with CPPA-G, as amended from time to time; and Energy purchase price revenue is recognized at a ‘point in time’, as and when the Net Electrical Output (NEO) are delivered to NTDC.
Capacity and Energy revenue is recognized based on the rates determined under the mechanism laid down in the PPA.
Delayed payment mark-up on amounts due under the PPA is accrued on time proportion basis by reference to the amount outstanding and the applicable rate of return under the PPA.
Invoices are generally raised on a monthly basis and are due after 30 days from acknowledgment by CPPA-G.
Dividend
Dividend on equity investments is recognized when right to receive the dividend is established.
Hotel business
Revenue from hotel ownership comprises amounts earned in respect of rental of rooms, loyalty card sales, food and beverage sales, and other ancillary services and goods supplied by the Group. For each of the revenue streams, the Group recognizes revenue over time or at a point in time specifically after the performance obligation of transfer of goods or services to the customer has been fulfilled. Revenue is
Annual Report 2022
159Page

recognized over the period when rooms are occupied or services are performed. Revenue from sale of loyalty cards is recognized on a straight line basis over the respective period of validity of loyalty cards. Revenue from sale of food and beverages and goods is recognized at the point of sale when the food and beverages and goods are delivered to customers. Payment is due immediately when the hotel guests occupies the room and receives the services and goods.
2.25 Contract assets
Contract assets arise when the Group performs its performance obligations by transferring goods to a customer before the customer pays its consideration or before payment is due. Contract assets are treated as financial assets for impairment purposes.
2.26 Customer acquisition costs
Customer acquisition costs are capitalised as an asset where such costs are incremental to obtaining a contract with a customer and are expected to be recovered. Customer acquisition costs are amortised on a straight-line basis over the term of the contract.
Costs to obtain a contract that would have been incurred regardless of whether the contract was obtained or which are not otherwise recoverable from a customer are expensed as incurred to profit or loss. Incremental costs of obtaining a contract where the contract term is less than one year is immediately expensed to profit or loss.
2.27 Customer fulfilment costs
Customer fulfilment costs are capitalised as an asset when all the following are met: (i) the costs relate directly to the contract or specifically identifiable proposed contract; (ii) the costs generate or enhance resources of the Group that will be used to satisfy future performance obligations; and (iii) the costs are expected to be recovered. Customer fulfilment costs are amortised on a straight-line basis over the term of the contract.
2.28 Right of return assets
Right of return assets represents the right to recover inventory sold to customers and is based on an estimate of customers who may exercise their right to return the goods and claim a refund. Such rights are measured at the value at which the inventory was previously carried prior to sale, less expected recovery costs and any impairment.
2.29 Contract liabilities
Contract liability is the obligation of the Group to transfer goods to a customer for which the Group has received consideration from the customer. If a customer pays consideration before the Group transfers goods, a contract liability is recognized when the payment is made. Contract liabilities are recognized as revenue when the Group performs its performance obligations under the contract.
2.30 Refund liabilities
Refund liabilities are recognised where the Group receives consideration from a customer and expects to refund some, or all, of that consideration to the customer. A refund liability is measured at the amount of consideration received or receivable for which the Group does not expect to be entitled and is updated at the end of each reporting period for changes in circumstances. Historical data is used across product lines to estimate such returns at the time of sale based on an expected value methodology.
2.31 Provisions
Provisions are recognized when the Group has a legal or constructive obligation as a result of past events and it is probable that an outflow of resources embodying economic benefits will be required to settle the
Nishat Mills Limited and its Subsidiaries
160 Page
For the year ended June 30, 2022Notes to the Consolidated Financial Statements

obligations and a reliable estimate of the amount can be made.
2.32 Earnings per share
Earnings per share (EPS) is calculated by dividing the profit or loss attributable to ordinary shareholders of the Holding Company by the weighted average number of ordinary shares outstanding during the year.
2.33 Contingent assets
Contingent assets are disclosed when the Group has a possible asset that arises from past events and whose existence will only be confirmed by the occurrence or non-occurrence of one or more uncertain future events not wholly within the control of the Group. Contingent assets are not recognized until their realization becomes certain.
2.34 Contingent liabilities
Contingent liability is disclosed when the Group has a possible obligation as a result of past events whose existence will only be confirmed by the occurrence or non-occurrence of one or more uncertain future events not wholly within the control of the Group. Contingent liabilities are not recognized, only disclosed, unless the possibility of a future outflow of resources is considered remote. In the event that the outflow of resources associated with a contingent liability is assessed as probable, and if the size of the outflow can be reliably estimated, a provision is recognized in the consolidated financial statements.
2.35 Impairment of non-financial assets
Assets that have an indefinite useful life are not subject to depreciation and are tested annually for impairment. Assets that are subject to depreciation are reviewed for impairment at each consolidated statement of financial position date or whenever events or changes in circumstances indicate that the carrying amount may not be recoverable. An impairment loss is recognized for the amount for which assets carrying amount exceeds its recoverable amount. Recoverable amount is the higher of an asset’s fair value less costs to sell and value in use. For the purposes of assessing impairment, assets are grouped at the lowest levels for which there are separately identifiable cash flows (cash-generating units). Non-financial assets that suffered an impairment are reviewed for possible reversal of the impairment at each reporting date. Reversals of the impairment losses are restricted to the extent that the asset’s carrying amount does not exceed the carrying amount that would have been determined, net of depreciation or amortization, if impairment losses had not been recognized. An impairment loss or reversal of impairment loss is recognized in the consolidated statement of profit or loss.
2.36 Derivative financial instruments
Derivatives are initially recognized at fair value. Any directly attributable transaction costs are recognized in the consolidated statement of profit or loss as incurred. They are subsequently remeasured at fair value on regular basis and at each reporting date as a minimum, with all their gains and losses, realized and unrealized, recognized in the consolidated statement of profit or loss.
2.37 Cash and cash equivalents
Cash and cash equivalents comprise cash in hand, cash at banks on current, saving and deposit accounts and other short term highly liquid instruments that are readily convertible into known amounts of cash and which are subject to insignificant risk of changes in values.
2.38 Ijara contracts
Under the Ijarah contracts the Group obtains usufruct of an asset for an agreed period for an agreed consideration. The Group accounts for its Ijarah contracts in accordance with the requirements of IFAS 2 ‘Ijarah’. Accordingly, the Group as a Mustaj’ir (lessee) in the Ijarah contract recognises the Ujrah (lease) payments as an expense in the profit and loss on straight line basis over the Ijarah term.
Annual Report 2022
161Page

2.39 Segment reporting
Segment reporting is based on the operating (business) segments of the Group. An operating segment is a component of the Group that engages in business activities from which it may earn revenues and incur expenses, including revenues and expenses that relate to the transactions with any of the Group's other components. An operating segment's operating results are reviewed regularly by the Group's chief operating decision makers to make decisions about resources to be allocated to the segment and assess its performance, and for which discrete financial information is available.
Segment results that are reported to the chief operating decision makers include items directly attributable to a segment as well as those that can be allocated on a reasonable basis. Those incomes, expenses, assets, liabilities and other balances which can not be allocated to a particular segment on a reasonable basis are reported as unallocated.
The Group has following reportable business segments: Spinning (Producing different quality of yarn including dyed yarn and sewing thread using natural and artificial fibres), Weaving (Producing different quality of greige fabric using yarn), Dyeing (Producing dyed fabric using different qualities of greige fabric), Home Textile and Terry (Manufacturing of home textile articles using processed fabric produced from greige fabric and manufacturing of terry and bath products), Garments (Manufacturing of garments using processed fabric), Power Generation (Generation, transmission and distribution of power using gas, oil, steam, coal and biomass) and Hotel (Business of hotel and allied services).
Transaction among the business segments are recorded at cost. Inter segment sales and purchases are eliminated from the total.
2.40 Government grants
Grants from the government are recognised at their fair value where there is a reasonable assurance that the grant will be received and the Group will comply with all attached conditions.
Government grants relating to costs are deferred and recognised in the profit or loss over the period necessary to match them with the costs that they are intended to compensate.
Government grants relating to the purchase of property, plant and equipment are included in non-current liabilities as deferred income and are credited to profit or loss over the expected lives of the related assets.
2.41 Dividend and other appropriations
Dividend distribution to the shareholders is recognized as a liability in the consolidated financial statements in the periods in which the dividends are declared and other appropriations are recognized in the period in which these are approved by the Board of Directors.
Nishat Mills Limited and its Subsidiaries
162 Page
For the year ended June 30, 2022Notes to the Consolidated Financial Statements

3 ISSUED, SUBSCRIBED AND PAID-UP SHARE CAPITAL
2022 2021 2022 2021 (Number of Shares) Note (Rupees in thousand)
270,446,606 270,446,606 Ordinary shares of Rupees 10 each fully paid up in cash 2,704,466 2,704,466
2,804,079 2,804,079 Ordinary shares of Rupees 10 each issued to shareholders of Nishat Apparel Limited under the Scheme of Amalgamation 28,041 28,041
23,577,990 23,577,990 Ordinary shares of Rupees 10 each issued as fully paid for consideration other than cash 3.1 235,780 235,780
54,771,173 54,771,173 Ordinary shares of Rupees 10 each issued as fully paid bonus shares 547,712 547,712
351,599,848 351,599,848 3,515,999 3,515,999
3.1 These mainly include shares issued to members of Umer Fabrics Limited as per the Scheme of Arrangement as approved by the Honourable Lahore High Court, Lahore.
3.2 Ordinary shares of the Holding Company held by the associated companies: 2022 2021 (Number of Shares)
D.G. Khan Cement Company Limited 30,289,501 30,289,501 Adamjee Insurance Company Limited 2,050 2,050 MCB Bank Limited 227 227 Adamjee Life Assurance Company Limited 231,815 400 Nishat (Aziz Avenue) Hotels and Properties Limited 342,500 275,000 Nishat Real Estates Development Company (Private) Limited 127,000 - 30,993,093 30,567,178
Annual Report 2022
163Page

2022 2021 Note (Rupees in thousand)
4 RESERVES
Composition of reserves is as follows:
Capital reserves
Premium on issue of right shares 4.1 5,499,530 5,499,530 Fair value reserve FVTOCI investments - net of deferred income tax 4.2 3,241,268 9,020,528 Exchange translation reserve 350,961 186,757 Statutory reserve 4.3 11,046 4,182 Maintenance reserve 1,608,668 1,608,668 Capital redemption reserve fund 4.4 111,002 111,002 10,822,475 16,430,667 Revenue reserves
General 86,577,214 76,053,214 Unappropriated profit 12,279,097 11,930,850 98,856,311 87,984,064 109,678,786 104,414,731
4.1 This reserve can be utilized by the Holding Company only for the purposes specified in section 81 of the Companies Act, 2017.
4.2 This represents the unrealized gain on re-measurement of investments at fair value through other
comprehensive income and is not available for distribution. Reconciliation of fair value reserve net of deferred tax is as under:
2022 2021 (Rupees in thousand)
Balance as on 01 July 8,844,120 8,056,768 Adjustment due to equity accounted investee - (579,789) Fair value adjustment on investments held by the Holding Company (3,439,620) 389,857 Share of fair value reserve of associates (1,893,890) 977,284 3,510,610 8,844,120 Add: Deferred income tax on equity investment (269,342) 176,408 Balance as on 30 June 3,241,268 9,020,528
Nishat Mills Limited and its Subsidiaries
164 Page
For the year ended June 30, 2022Notes to the Consolidated Financial Statements

Annual Report 2022
165Page
4.3 As required by UAE Federal Law No. (2) of 2015 and the Articles of Association of Nishat Linen Trading LLC - Subsidiary Company, 10% of the profit for the year has to be transferred to a legal reserve until it is equivalent to 50% of paid-up capital of the Subsidiary Company. This reserve is not available for distribution.
4.4 An equity accounted associate created the fund for redemption of preference shares. The preference shares were redeemed during the year ended 30 June 2007.
2022 2021 Note (Rupees in thousand)
5 LONG TERM FINANCING
From banking companies - secured
Long term loans 5.1 13,594,803 12,821,438 Long term musharika 5.2 1,875,027 2,125,677 Motor vehicles' loans 5.8 3,801 1,186 15,473,631 14,948,301 Less: Current portion shown under current liabilities 12 (3,169,181) (3,242,316) 12,304,450 11,705,985

Lender 2022 2021 InterestRepricing
InterestPayable
Rate ofInterest Per
Annum
Number ofInstallments Security
(Rupees in thousand)
5.1 Long term loans
Nishat Mills Limited - Holding Company
Two hundred and - Quarterlytwenty unequalinstallments commenced on 27 March 2018 andending on 05 June 2024(Note 5.3).
First pari passu hypothecation charge of Rupees 1,334 million over all present and future plant, machinery and equipment of the Holding Company (excluding plant and machinery in respect of which the Holding Company has already created exclusive charges in the favour of its existing creditors).
SBP rate for LTFF
+ 0.25%
Allied Bank 371,805 571,582Limited
Four hundred and - Quarterlyeighty four unequalinstallmentscommenced on28 December 2018and ending on 13 July 2025(Note 5.3).
First pari passu charge of Rupees 1,334 million (inclusive of 25% margin on all present and future plant and machinery of the Holding Company).
SBP rate for LTFF
+ 0.25%
Allied Bank 543,054 739,561Limited
Sixty unequal - Quarterlyinstallments commenced on24 January 2022 andending on28 October 2026.
First pari passu charge of Rupees 1,267 million over all present and future plant, machinery and equipment of the Holding Company (excluding plant and machinery in respect of which the Holding Company has already created exclusive charges in the favour of its existing charge holders / creditors).
SBP rate for LTFF
+ 0.35%
Allied Bank 200,444 222,715Limited
Two hundred and - Quarterlytwenty unequalinstallments commenced on 26 January 2020 andending on17 September 2026(Note 5.3).
First pari passu charge of Rupees 1,267 million over all present and future plant, machinery and equipment of the Holding Company (excluding plant and machinery in respect of which the Company has already created exclusive charges in the favour of its existing creditors).
SBP rate for LTFF
+ 0.25%
Allied Bank 688,122 869,087Limited
Twenty four unequal - Quarterlyinstallments commenced on 01 January 2021 andending on16 November 2022(Note 5.4).
First pari passu hypothecation charge of Rupees 1,334 million over all the present and future plant, machinery and equipment of the Holding Company (excluding plant and machinery in respect of which the Holding Company has already created exclusive charges in favour of its existing creditors).
SBP rate for refinance
scheme for payment of salaries and
wages+ 0.50%
Allied Bank 246,620 716,713Limited
Four hundred and - Quarterlyforty three unequal installments commenced on 18 May 2021 andending on11 February 2027.
SBP rate for LTFF
+ 0.50%
Twenty equal quarterly - Quarterlyinstallments commenced on 14 May 2021 and ending on14 February 2026.
SBP rate for financing
power plants using
renewable energy
+ 0.50%
480,062 545,572
75,000 95,000
755,506 863,287
Nishat Mills Limited and its Subsidiaries
166 Page
For the year ended June 30, 2022Notes to the Consolidated Financial Statements

Lender 2022 2021 InterestRepricing
InterestPayable
Rate ofInterest Per
Annum
Number ofInstallments Security
(Rupees in thousand)
Two hundred and - Quarterlyforty unequal installments commenced on 23 February 2022 andending on16 July 2027.
First pari passu hypothecation charge of Rupees 467 million over all present and future plant, machinery and equipment (excluding all exclusive charges over plant and machinery) of the Holding Company.
SBP rate for LTFF
+ 0.65%
Askari Bank 301,187 315,989Limited
One hundred unequal - Quarterlyinstallmentscommenced on23 December 2021and ending on21 October 2026.
First pari passu hypothecation charge of Rupees 1,334 million on all present and future plant and machinery (excluding plant and machinery in respect of which the Holding Company has already created exclusive charges in favour of its existing charge holders).
SBP ratefor LTFF + 0.50%
Bank Alfalah 187,278 218,714Limited
Sixty unequal - Quarterlyinstallments commencing on28 August 2022 andending on15 July 2027(Note 5.6).
SBP ratefor TERF+ 1.00%
Bank Alfalah 838,420 761,853Limited
Faysal Bank 207,453 266,725Limited
Eighty unequal - Quarterlyinstallmentscommenced on18 January 2020 andending on05 November 2025(Note 5.3).
First pari passu charge of Rupees 400 million on all present and future plant and machinery (excluding plant and machinery in respect of which the Holding Company has already created exclusive charges in the favour of existing creditors).
SBP ratefor LTFF + 0.30%
Faysal Bank 79,438 119,156Limited
Twenty unequal - Quarterlyinstallmentscommenced on22 November 2018and ending on24 May 2024(Note 5.3).
First pari passu charge of Rupees 267 million on all present and future plant and machinery of the Holding Company (excluding those on which charge has already been created).
SBP ratefor LTFF + 0.30%
First pari passu charge of Rupees 1,334 million on all present and future plant and machinery (excluding plant and machinery in respect of which the Holding Company has already created exclusive charges in the favour of existing creditors).
Two hundred and - Quarterlysixty unequal installments commenced on 02 February 2018 andending on05 January 2024(Note 5.3).
SBP rate for LTFF
+ 0.35%
Bank Alfalah 136,196 226,101Limited
Two hundred - Quarterlyunequal installments commenced on10 June 2018 and ending on25 May 2024(Note 5.3).
SBP rate for LTFF
+ 0.35%
Bank Alfalah 212,650 322,399Limited
First pari passu hypothecation charge of Rupees 400 million over all present and future plant and machinery of the Holding Company.
Twenty equal quarterly - Quarterlyinstallments commenced on 31 August 2018 andending on31 May 2024(Note 5.3).
SBP ratefor LTFF+ 0.35%
Bank Alfalah 112,364 168,547Limited
Annual Report 2022
167Page

Lender 2022 2021 InterestRepricing
InterestPayable
Rate ofInterest Per
Annum
Number ofInstallments Security
(Rupees in thousand)
One hundred and - Quarterlytwenty unequal installments commenced on12 April 2017 andending on03 June 2023(Note 5.3).
First pari passu hypothecation charge of Rupees 534 million on all present and future plant and machinery (excluding plant and machinery of the Holding Company which is under exclusive charges in favour of creditors).
SBP rate for LTFF+ 0.50%
National Bank 17,275 39,028of Pakistan
One hundred and - Quarterlyninety two unequal installments commencing on 17 September 2023and ending on 04 October 2031.
First pari passu hypothecation charge of Rupees 1,334 million on present and future plant and machinery (excluding plant and machinery in respect of which the Holding Company has already created exclusive charges in favour of its existing charges holders / creditors).
SBP rate for TERF
+ 0.50%
National Bank 800,000 139,545of Pakistan
One hundred unequal - Quarterlyinstallments commenced on24 September 2021and ending on 22 July 2026.
First pari passu hypothecation charge of Rupees 1,334 million over plant and machinery (excluding plant and machinery in respect of which the Holding Company has already created exclusive charges in favour of its existing charge holders).
SBP ratefor LTFF+ 0.65%
Habib 804,684 997,499MetropolitanBank Limited
One hundred and - Quarterlytwenty eight unequalinstallmentscommencing on19 July 2023 andending on 29 July 2031(Note 5.6).
First pari passu hypothecation charge of Rupees 1,334 million over plant and machinery of the Holding Company.
SBP ratefor TERF+ 0.85%
Habib 967,524 842,390MetropolitanBank Limited
Twenty unequal - Quarterlyquarterly installmentscommenced on 27 February 2020 andending on27 November 2025(Note 5.3).
SBP ratefor LTFF+ 0.25%
Habib Bank 519,726 668,592Limited
Twenty equal quarterly - Quarterly installmentscommenced on27 February 2020 andending on27 November 2025.
First pari passu charge of Rupees 4,084 million over all present and future plant, machinery and equipment of the Holding Company (excluding plant and machinery in respect of which the Holding Company has already created exclusive charges in the favour of its existing creditors).
SBP rate for financing
power plants using
renewable energy
+ 0.25%
141,406 192,827
661,132 861,419
One hundred and - Quarterlyeighty unequal installments commenced on 17 September 2017and ending on25 November 2023(Note 5.3).
First pari passu hypothecation charge of Rupees 4,000 million on all present and future fixed assets of the Holding Company excluding specific and exclusive charges.
SBP rate for LTFF
+ 0.40%
Habib Bank 229,844 424,904Limited
Eleven hundred and - Quarterlysixty four unequalinstallmentscommencing on28 November 2023and ending on22 April 2032.
SBP rate for LTFF
+ 0.75%
Habib Bank 1,817,072 -Limited
Nishat Mills Limited and its Subsidiaries
168 Page
For the year ended June 30, 2022Notes to the Consolidated Financial Statements

Lender 2022 2021 InterestRepricing
InterestPayable
Rate ofInterest Per
Annum
Number ofInstallments Security
(Rupees in thousand)
One hundred and sixty - Quarterlyunequal installmentscommenced on11 June 2016 andending on26 January 2023(Note 5.3).
SBP rate for LTFF
+ 1.00%
Pakistan Kuwait 9,677 35,679InvestmentCompany(Private) Limited
Two hundred and fifty - Quarterlyunequal installmentscommenced on15 September 2016and ending on 29 September 2023(Note 5.3).
First pari passu charge of Rupees 400 million on all present and future plant and machinery of the Holding Company with 25% margin.
Ranking hypothecation charge of Rupees 267 million on plant and machinery of the Holding Company (excluding plant and machinery in respect of which the Holding Company has already created exclusive charges in favour of its existing charge holders / creditors).
SBP rate for LTFF
+ 0.75%
8,079 14,807
17,756 50,486
One hundred and - Quarterlysixty unequalinstallmentscommenced on 30 January 2017 and ending on07 April 2023(Note 5.3).
First pari passu charge of Rupees 667 million on all present and future plant and machinery (other than the specific machinery against which exclusive charges have already been created in favour of existing charge holders) of the Holding Company.
SBP rate for LTFF+ 0.50%
The Bank of 53,412 146,755Punjab
Five hundred and - Quarterlyseventy five unequalinstallments commencing on 08 July 2023 and ending on02 September 2031(Note 5.6).
First pari passu hypothecation charge of Rupees 3,000 million over all present and future plant and machinery (excluding those assets over which exclusive charges has already been created in favour of existing creditors) of the Holding Company.
3 Month offer KIBOR
+ 1.25%
United Bank - 110,980Limited
- QuarterlySBP rate for TERF
+ 1.25%
2,202,202 1,860,869
2,202,202 1,971,849
Seventy two unequal - Quarterlyinstallments commenced on 10 May 2021 andending on 13 January 2028.
First pari passu hypothecation charge of Rupees 1,334 million on all present and future plant and machinery (excluding plant and machinery in respect of which the Holding Company has already created exclusive charges in favour of its existing charge holders / creditors) of the Holding Company with 25% margin.
SBP rate for LTFF
+ 0.65%
Pakistan Kuwait 875,525 981,040InvestmentCompany(Private) Limited
Three hundred and - Quarterlytwenty unequal installments commenced on30 August 2018 andending on28 December 2024(Note 5.3).
First pari passu charge of Rupees 400 million over all the present and future plant and machinery of the Holding Company with 25% margin excluding those assets (part of the plant and machinery) on which the Holding Company has created exclusive charges in favour of existing creditors.
SBP rate for LTFF
+ 0.25%
Pak Brunei 128,313 188,286InvestmentCompany Limited
Annual Report 2022
169Page
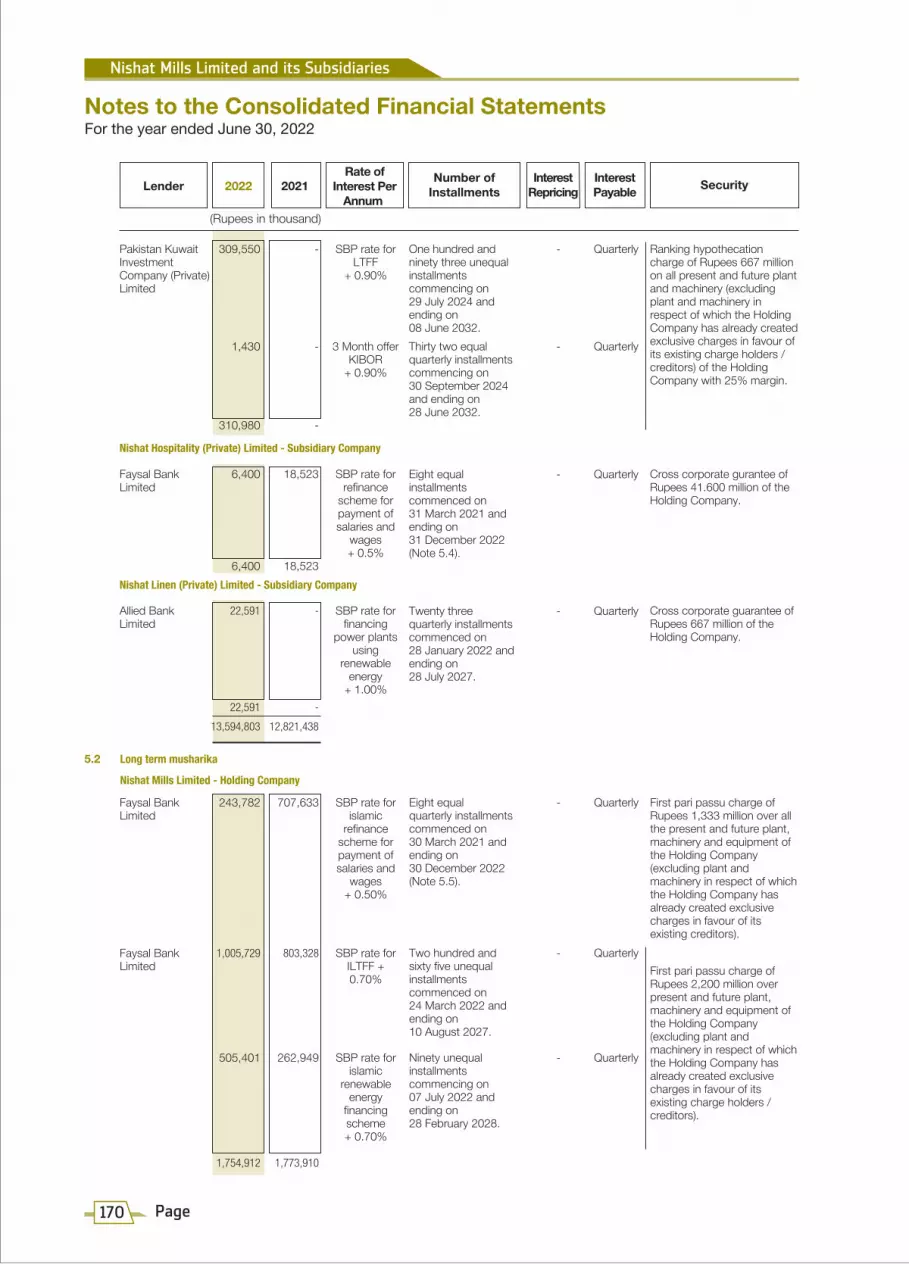
Lender 2022 2021 InterestRepricing
InterestPayable
Rate ofInterest Per
Annum
Number ofInstallments Security
(Rupees in thousand)
One hundred and - Quarterlyninety three unequal installments commencing on 29 July 2024 andending on08 June 2032.
Ranking hypothecation charge of Rupees 667 million on all present and future plant and machinery (excluding plant and machinery in respect of which the Holding Company has already created exclusive charges in favour of its existing charge holders / creditors) of the Holding Company with 25% margin.
SBP rate for LTFF
+ 0.90%
Pakistan Kuwait 309,550 -InvestmentCompany (Private)Limited
Thirty two equal - Quarterlyquarterly installmentscommencing on30 September 2024and ending on 28 June 2032.
3 Month offer KIBOR
+ 0.90%
1,430 -
310,980 -
Eight equal - Quarterlyinstallmentscommenced on31 March 2021 andending on 31 December 2022(Note 5.4).
Cross corporate gurantee of Rupees 41.600 million of the Holding Company.
SBP rate for refinance
scheme for payment of salaries and
wages+ 0.5%
Faysal Bank 6,400 18,523Limited
6,400 18,523
SBP rate for financing
power plants using
renewable energy
+ 1.00%
Eight equal - Quarterlyquarterly installmentscommenced on30 March 2021 andending on 30 December 2022 (Note 5.5).
First pari passu charge of Rupees 1,333 million over all the present and future plant, machinery and equipment of the Holding Company (excluding plant and machinery in respect of which the Holding Company has already created exclusive charges in favour of its existing creditors).
SBP rate for islamic
refinance scheme for payment of salaries and
wages+ 0.50%
Faysal Bank 243,782 707,633Limited
Two hundred and - Quarterlysixty five unequalinstallmentscommenced on24 March 2022 and ending on10 August 2027.
First pari passu charge of Rupees 2,200 million over present and future plant, machinery and equipment of the Holding Company (excluding plant and machinery in respect of which the Holding Company has already created exclusive charges in favour of its existing charge holders / creditors).
SBP rate for ILTFF + 0.70%
Faysal Bank 1,005,729 803,328Limited
Ninety unequal - Quarterlyinstallments commencing on07 July 2022 andending on28 February 2028.
SBP rate for islamic
renewable energy
financing scheme+ 0.70%
505,401 262,949
1,754,912 1,773,910
5.2 Long term musharika
Nishat Mills Limited - Holding Company
Nishat Hospitality (Private) Limited - Subsidiary Company
Twenty three - Quarterlyquarterly installments commenced on 28 January 2022 and ending on 28 July 2027.
Cross corporate guarantee of Rupees 667 million of the Holding Company.
Allied Bank 22,591 -Limited
22,591 -
13,594,803 12,821,438
Nishat Linen (Private) Limited - Subsidiary Company
Nishat Mills Limited and its Subsidiaries
170 Page
For the year ended June 30, 2022Notes to the Consolidated Financial Statements

Annual Report 2022
171Page
Lender 2022 2021 InterestRepricing
InterestPayable
Rate ofInterest Per
Annum
Number ofInstallments Security
(Rupees in thousand)
Cross corporate guarantee of Rupees 506.667 million of Holding Company.
Eight equal quarterly - Quarterlyinstallments commenced on 30 March 2021 andending on 31 December 2022(Note 5.5).
SBP rate for Islamic
refinance scheme for payment of salaries and
wages+ 0.5%
Faysal Bank 83,212 241,059Limited
83,212 241,059
Nishat Linen (Private) Limited - Subsidiary Company
Pari passu charge over all the present and future fuel stock / inventory and energy revenue receivables of Nishat Power Limited - Subsidiary Company.
Eight equal - Quarterlyinstallmentscommenced on 31 March 2021 and ending on 31 December 2022(Note 5.7).
SBP rate for refinance
scheme for payment of salaries and
wages+ 0.5% to
0.75%
Faysal Bank 36,903 110,708Limited
36,903 110,708
1,875,027 2,125,677
Nishat Power Limited - Subsidiary Company
5.3 Repayment period includes deferment of repayment of principal loan amount by one year in accordance with the State Bank of Pakistan BPRD Circular Letter No. 13 of 2020 dated 26 March 2020.
5.4 This long term loan is obtained by the Group companies under SBP Refinance Scheme for payment of Salaries and Wages. This is recognized and measured in accordance with IFRS 9 'Financial Instruments'. Fair value adjustment is recognized at discount rate ranging from 6.87% to 8.08% (2021: 6.87% to 7.76%) per annum.
5.5 This long term musharika is obtained by the Company under SBP Islamic Refinance Scheme for payment of Salaries and Wages. This is recognized and measured in accordance with IFRS 9 'Financial Instruments'. Fair value adjustment is recognized at discount rate ranging from 7.44% to 8.44% (2021: 7.44% to 8.44%) per annum.
5.6 These loans are obtained by the Company under SBP Temporary Economic Refinance Facility (TERF). These are recognized and measured in accordance with IFRS 9 'Financial Instruments'. Fair value adjustment is recognized at discount rate ranging from 2.34% to 2.60% (2021: 2.34% to 2.60%) per annum.
5.7 The fair value adjustment in accordance with the requirement of IFRS 9 'Financial Instruments' arising in respect of this loan is not considered material and hence not recognized.
5.8 This represents loan obtained by Nishat International FZE - Subsidiary Company from a bank for purchase of a vehicle at an interest rate of 4.00% (2021: 8.80%) per annum repayable in 48 monthly installments.

2022 2021 Note (Rupees in thousand)
6 LEASE LIABILITIES
Total lease liabilities 2,596,010 2,049,784 Less: Current portion shown under current liabilities 12 (737,938) (680,916) 1,858,072 1,368,868
6.1 Reconciliation of lease liabilities
Balance as on 01 July 2,049,784 2,266,071 Add: Additions during the year 199,140 342,406 Add: Interest accrued on lease liabilities 260,035 244,750 Add: Impact of lease modifications / renewals 965,049 180,387 Less: Impact of rent concessions (28,478) (90,344) Less: Impact of lease termination (16,477) (79,390) Less: Payments during the period (916,048) (794,088) Add: Currency retranslation 83,005 (20,008) Balance as on 30 June 2,596,010 2,049,784
6.2 Maturity analysis of lease liabilities is as follows:
Upto 6 months 487,848 462,607 6-12 months 457,890 393,753 1-2 year 790,817 536,644 More than 2 years 1,399,353 1,200,654 3,135,908 2,593,658 Less: Future finance cost (539,898) (543,874) Present value of finance lease liabilities 2,596,010 2,049,784
6.3 Implicit rate against lease liabilities ranges from 7.71% to 16.59% (2021: 7.71% to 14.59%) per annum.
7 LONG TERM SECURITY DEPOSITS
These represent interest free security deposits received from stockists in connection with 'Nishat Linen' retail outlets in Pakistan. These security deposits have been utilized for the purpose of business in accordance with the terms of written agreements with stockists.
2022 2021 Note (Rupees in thousand)
8. DEFERRED LIABILITIES
Deferred income tax 8.1 4,277,259 2,411,249 Gas Infrastructure Development Cess (GIDC) payable 8.2 - 78,039 Deferred income - Government grant 8.3 58,034 81,409 Accumulating compensated absences 3,793 1,937 4,339,086 2,572,634
Nishat Mills Limited and its Subsidiaries
172 Page
For the year ended June 30, 2022Notes to the Consolidated Financial Statements

Recognised inStatement of
othercomprehensive
income
ClosingBalance
OpeningBalance
Recognised inStatement ofprofit or loss
2022
Rupees in thousand
2022 2021 Note (Rupees in thousand)
8.1 Deferred income tax
The liability for deferred taxation originated due to temporary difference relating to:
Taxable temporary differences on:
Investments in associates under equity method 4,275,441 3,085,803 Right-of-use assets 610,537 448,930 Equity Investments at FVTOCI 269,342 (176,408) Accelerated tax depreciation 8.1.3 168,331 148,554 5,323,651 3,506,879
Deductible temporary difference on:
Turnover tax carried forward 8.1.4 - (301,656) Lease liabilities (745,018) (552,889) Accumulating compensated absences 8.1.5 (1,100) (561) Unabsorbed tax depreciation losses 8.1.5 (198,621) (205,297) Expected credit loss against debtors (8,274) - Expected credit loss against other advance (40,095) - Others 8.1.5 (53,284) (35,227) (1,046,392) (1,095,630) 4,277,259 2,411,249
8.1.1 Movement in taxable temporary differences and deductible temporary differences during the year is as follows:
Taxable temporary differences on: Investments in associates under equity method 3,085,803 1,189,638 - 4,275,441 Right-of-use assets 448,930 161,607 - 610,537 Accelerated tax depreciation 148,554 19,777 - 168,331 Equity Investments at FVTOCI (176,408) - 445,750 269,342
Deductible temporary difference on: Turnover tax carried forward (301,656) 301,656 - - Lease liabilities (552,889) (192,129) - (745,018) Accumulating compensated absences (561) (539) - (1,100) Unabsorbed tax depreciation losses (205,297) 6,676 - (198,621) Others (35,227) (18,057) - (53,284) Expected credit loss against debtors - (8,274) - (8,274) Expected credit loss against other advance - (40,095) - (40,095) 2,411,249 1,420,260 445,750 4,277,259
Annual Report 2022
173Page

Taxable temporary differences on: Un-quoted equity investment at FVTOCI 126,104 - (126,104) - Investments in associates under equity method 2,566,707 519,096 - 3,085,803 Right-of-use assets 547,136 (98,206) - 448,930 Accelerated tax depreciation 156,652 (8,098) - 148,554
Deductible temporary difference on: Turnover tax carried forward (588,552) 286,896 - (301,656) Lease liabilities (625,366) 72,477 - (552,889) Equity Investments at FVTOCI - - (176,408) (176,408) Accumulating compensated absences (447) (114) - (561) Unabsorbed tax depreciation losses (198,136) (7,161) - (205,297) Others (11,087) (24,140) - (35,227) 1,973,011 740,750 (302,512) 2,411,249
8.1.2 Deductible temporary differences are considered to the extent that the realization of related tax benefits is probable from reversal of existing taxable temporary differences and future taxable profits. Based on the approved business plan, it is probable that sufficient taxable profits will be available for utilization of deferred tax asset. Provision for deferred tax on temporary differences other than relating to unrealized gain on remeasurement of investments at FVTOCI of the Holding Company was not considered necessary as it is chargeable to tax under section 169 of the Income Tax Ordinance, 2001. Temporary differences of Nishat Power Limited - Subsidiary Company are not expected to reverse in the foreseeable future due to the fact that the profits and gains derived from electric power generation are exempt from tax. Nishat Hospitality (Private) Limited - Subsidiary Company has not recognised deferred tax assets of Rupees 24.600 million (2021: Rupees 30.100 million) in respect of minimum tax paid and available for carry forward under section 113 of the Income Tax Ordinance, 2001, as sufficient tax profit would not be available to set these off in the foreseeable future.
8.1.3 This relates to Nishat Hospitality (Private) Limited, Nishat Linen (Private) Limited and Nishat Commodities (Private)
Limited - Subsidiary Companies.
8.1.4 This was relating to Nishat Linen (Private) Limited - Subsidiary Company.
8.1.5 These relate to Nishat Hospitality (Private) Limited - Subsidiary Company.
2022 2021 Note (Rupees in thousand)
8.2 Gas Infrastructure Development Cess (GIDC) Payable
Opening balance 1,204,234 - Gas Infrastructure Development Cess payable at amortized cost - 1,299,041 Add: Adjustment due to impact of IFRS 9 36 36,096 73,562 Less: Payments made during the year - (168,369) Balance as on 30 June 1,240,330 1,204,234 Less: Current portion shown under current liabilities 12 (1,240,330) (1,126,195) - 78,039
Recognised inStatement of
othercomprehensive
income
ClosingBalance
OpeningBalance
Recognised inStatement ofprofit or loss
2021
Rupees in thousand
Nishat Mills Limited and its Subsidiaries
174 Page
For the year ended June 30, 2022Notes to the Consolidated Financial Statements

8.2.1 This represents Gas Infrastructure Development Cess (GIDC) that was levied through GIDC Act, 2015. During the year ended 30 June 2021, Honourable Supreme Court of Pakistan upheld the GIDC Act, 2015 to be constitutional and intra vires. Nishat Mills Limited - Holding Company has filed a review petition in Honourable Sindh High Court, Karachi which is pending adjudication. GIDC payable has been recognized at amortized cost in accordance with IFRS 9.
2022 2021 Note (Rupees in thousand)
8.3 Deferred income - Government grant
Opening Balance 176,589 - Add: Government grant recognized during the year 5,406 291,514 Less: Amortized during the year (96,012) (114,925) 85,983 176,589 Less: Current portion shown under current liabilities 12 (27,949) (95,180) 58,034 81,409
8.3.1 The State Bank of Pakistan (SBP), through its Circular No. 01 and 02 of 2020 dated 17 March 2020 and Circular No. 09 of 2020 dated 08 May 2020 introduced a Temporary Economic Refinance Facility (TERF) for setting of new industrial units and for undertaking Balancing, Modernization and Replacement and / or expansion of projects / businesses and through Circular No. 06 of 2020 dated 10 April 2020 introduced a Refinance Scheme for payment of wages and salaries to the workers and employees of business concerns. These refinances were available through Banks / DFIs. One of the key feature of these refinance facilities is that borrowers obtained loans at mark-up rates that were below normal lending rates. As per International Accounting Standard (IAS) 20 'Accounting for Government Grants and Disclosure of Government Assistance', the benefit of a Government loan at a below-market rate of interest is treated as a Government grant. The Holding Company, Nishat Linen (Private) Limited - Subsidiary Company and Nishat Hospitality (Private) Limited - Subsidiary Company has obtained these loans as disclosed in note 5 to these consolidated financial statements. In accordance with IFRS 9 'Financial Instruments', loans obtained under the refinance facilities were initially recognized at fair value which is the present value of loans proceeds received, discounted using prevailing market rates of interest for a similar instrument. Hence, the benefit of the below-market rate of interest has been measured as the difference between the initial carrying value of the loan determined in accordance with IFRS 9 and the proceeds received. This benefit is accounted for and presented as deferred grant in accordance with IAS 20. The grant is being amortized in the consolidated statement of profit or loss, in line with the recognition of interest expense the grant is compensating. There are no unfulfilled conditions or contingencies attached to this grant.
Annual Report 2022
175Page

2022 2021 Note (Rupees in thousand)
9 TRADE AND OTHER PAYABLES
Creditors 9.1 9,150,427 6,317,153 Sindh infrastructure cess payable 9.2 931,309 674,951 Accrued liabilities 2,290,307 1,799,436 Contract liabilities - unsecured 9.1 1,088,619 1,248,442 Securities from contractors - interest free and repayable on completion of contracts 9.3 20,107 19,174 Retention money payable 110,670 68,600 Income tax deducted at source 886 846 Payable to employees provident fund trust 3,826 5,165 Royalty and other payable 79,042 45,667 Fair value of forward exchange contracts 9,595 57,429 Workers' profit participation fund 9.4 875,495 967,594 Workers' welfare fund 9.5 260,361 185,601 14,820,644 11,390,058
9.1 These include amounts due to following related parties:
Creditors
D.G. Khan Cement Company Limited - associated company 2,520 383 Security General Insurance Company Limited - associated company 45,880 12,837 Adamjee Insurance Company Limited - associated company 37,010 27,595 Adamjee Life Assurance Company Limited - related party 3,133 - Hyundai Nishat Motors (Private) Limited - associated company 143 59 Nishat (Chunian) Limited - related party 84,092 75,050 Nishat Dairy (Private) Limited - associated company 587 - Nishat Hotels and Properties Limited - associated company 1,675 95 175,040 116,019
Contract liabilities - unsecured
Nishat (Chunian) Limited - related party - 10 Nishat Hotels and Properties Limited - associated company 2 - 2 10
9.2 Sindh infrastructure cess payable
Balance as on 01 July 674,951 567,973 Add: Provision made during the year 256,358 106,978 Balance as on 30 June 931,309 674,951
Nishat Mills Limited and its Subsidiaries
176 Page
For the year ended June 30, 2022Notes to the Consolidated Financial Statements

Annual Report 2022
177Page
9.2.1 This represents provision for infrastructure cess imposed by the Province of Sindh through Sindh Finance Act, 1994 and its subsequent versions including the final version i.e. Sindh Development and Maintenance of Infrastructure Cess Act, 2017. Nishat Mills Limited - Holding Company, Nishat Commodities (Private) Limited - Subsidiary Company and Nishat Linen (Private) Limited - Subsidiary Company filed writ petition in Honourable Sindh High Court, Karachi whereby stay was granted and directions were given to provide bank guarantees in favor of Director Excise and Taxation, Karachi. The Honourable Sindh High Court, Karachi passed order dated 04 June 2021 against the Group Companies and directed that bank guarantees should be encashed. Being aggrieved by the order, the Group Companies along with others filed petitions for leave to appeal before Honourable Supreme Court of Pakistan against the Sindh High Court’s judgment in relation to Sindh infrastructure development cess. On 01 September 2021, after hearing the petitioners, the Honourable Supreme Court dictated the order in open court granting leave to appeal to the petitioners and restraining the Sindh Government from encashing the bank guarantees furnished in pursuance of the interim orders passed by the Sindh High Court. The Honourable Supreme Court also directed to release the future consignments subject to furnishing of bank guarantees for the disputed amount.
9.3 These deposits have been utilized for the purpose of business in accordance with the terms of written agreements with contractors.
2022 2021 (Rupees in thousand)
9.4 Workers' profit participation fund
Balance as on 01 July 967,594 639,524 Add: Provision for the year 719,709 531,986 Add: Interest for the year 36 23,137 179 Add: Adjustment against prior years 702 - 1,711,142 1,171,689 Less: Payments during the year (835,647) (204,095) 875,495 967,594
9.4.1 Interest is paid at prescribed rate under the Companies Profit (Workers' Participation) Act, 1968 on funds utilized till the date of allocation to workers.
2022 2021 (Rupees in thousand)
9.5 Workers' Welfare Fund
Balance as on 1 July 185,601 153,201 Add: Provision for the year 102,015 32,400 287,616 185,601 Less: Payment for the year (27,255) - Balance as on 30 June 260,361 185,601

2022 2021 Note (Rupees in thousand)
10 ACCRUED MARK-UP
Long term financing 99,240 73,697 Short term borrowings 10.1 360,966 195,872 460,206 269,569
10.1 This includes markup of Rupees 6.044 million (2021: Rupees 1.637 million) payable to MCB Bank Limited - associated company.
2022 2021 Note (Rupees in thousand) 11 SHORT TERM BORROWINGS
From banking companies - secured
Nishat Mills Limited - Holding Company State Bank of Pakistan (SBP) refinance 11.1 & 11.3 21,474,683 18,371,589 Other short term finances 11.1 & 11.4 3,681,692 - Temporary bank overdrafts 11.1, 11.2 & 11.5 1,573,673 346,674 26,730,048 18,718,263
Nishat Power Limited - Subsidiary Company Short term running finances 11.6 3,737,946 3,192,050 Term finances 11.7 750,000 450,000 4,487,946 3,642,050
Nishat Linen (Private) Limited - Subsidiary Company Temporary bank overdrafts 11.9 - 24,843 Other short term finances 11.9 & 11.10 475,000 - 475,000 24,843 31,692,994 22,385,156
11.1 These finances are obtained from banking companies under mark up arrangements and are secured against joint pari passu hypothecation charge on all present and future current assets, other instruments and ranking hypothecation charge on plant and machinery of the Holding Company.
11.2 These finances include Rupees 928.127 million (2021: Rupees 278.182 million) from MCB Bank Limited - associated company, which has been utilized for working capital requirements.
11.3 The rates of mark-up range from 1.00% to 10.49% (2021: 2.20% to 3.00%) per annum during the year on the balance outstanding.
11.4 The rates of mark-up range from 7.80% to 14.41% (2021: 1.87% to 8.52%) per annum during the year on the balance outstanding.
11.5 The rates of mark-up range from 7.47% to 15.31% (2021: 7.05% to 9.28%) per annum during the year on the balance outstanding.
Nishat Mills Limited and its Subsidiaries
178 Page
For the year ended June 30, 2022Notes to the Consolidated Financial Statements

11.6 The total running finance and running musharka main facilities obtained from various commercial banks under mark-up arrangements aggregate Rupees 10,600.94 million (2021: Rupees 10,251.52 million). Such facilities have been obtained at mark-up rates ranging from one month to three months KIBOR plus 0.2% to 2.5% per annum, payable quarterly, on the balance outstanding. The aggregate facilities are secured against charge on present and future current assets of Nishat Power Limited - Subsidiary Company. The mark-up rate charged during the year on the outstanding balance ranged from 7.65% to 15.52% (2021: 7.46% to 12.19%) per annum. Various sub facilities comprising money market loans and letters of guarantee have also been utilized under the aforementioned main facilities.
11.7 The total murabaha, term finance / money market main and sub-limit facilities obtained from various commercial banks under mark-up arrangements aggregate Rupees 2,000 million (2021: Rupees 1,400 million). Such facilities have been obtained at mark-up rates ranging from one week to six months KIBOR plus 0.05% to 0.60%, payable at the maturity of the respective murabaha transaction / term finance facility. The aggregate facilities are secured against charge on present and future current assets of Nishat Power Limited - Subsidiary Company. The mark-up rate charged during the year on the outstanding balance ranged from 7.54% to 14.99% (2021: 7.55% to 7.72%) per annum.
11.8 The main facilities for opening letters of credit and guarantees aggregate Rupees 750 million (2021: Rupees 750 million). The amount utilized at 30 June 2022, for letters of credit was Rupees 135.41 million (2021: Rupees 2.33 million) and for letters of guarantee was Rupees 552.51 million (2021: Rupees 613.000 million). The aggregate facilities for opening letters of credit and guarantee are secured by charge on present and future current assets including fuel stocks / inventory of the Nishat Power Limited - Subsidiary Company and by lien over import documents.
11.9 This finance is obtained from Allied Bank Limited under mark up arrangement and is secured against first pari passu hypothecation charge over all present and future current assets of Nishat Linen (Private) Limited - Subsidiary Company and corporate guarantee from Nishat Mills Limited - Holding Company. The rate of mark up ranges from 8.70% to 13.20% (2021: 8.54% to 8.84%) per annum during the year on the balance outstanding.
11.10 The rate of mark up is 13.90% (2021: Nil) per annum during the year on the balance outstanding. 2022 2021 Note (Rupees in thousand)
12 CURRENT PORTION OF NON-CURRENT LIABILITIES
CCurrent portion of long term financing 5 3,169,181 3,242,316 Current portion of lease liabilities 6 737,938 680,916 Current portion of GIDC payable 8.2 1,240,330 1,126,195 Current portion of deferred income - Government grant 8.3 27,949 95,180 5,175,398 5,144,607
13 UNCLAIMED DIVIDEND 122,072 115,497
14 CONTINGENCIES AND COMMITMENTS
a) Contingencies
i) Guarantees of Rupees 4,045.687 million (2021: Rupees 3,438.360 million) are given by the banks of Holding Company to Sui Northern Gas Pipelines Limited against gas connections, Shell Pakistan Limited and Pakistan State Oil Limited against purchase of furnace oil, Director Excise and
Annual Report 2022
179Page

Taxation, Karachi against infrastructure cess, Chairman Punjab Revenue Authority, Lahore against infrastructure cess, Directorate of Cotton Cess Management against cotton cess, Collector of Customs against regulatory duty, Inspector General Frontier Corps KP (South) and The President of Islamic Republic of Pakistan through the Controller of Military Accounts (Defence Purchase) against fulfillment of sales orders, High Court of Sindh, Karachi against the matter of importation of LED lights and to the bank of Hyundai Nishat Motor (Private) Limited - associated company to secure financial assistance to the associated company. Further, the Holding Company has issued cross corporate guarantees of Rupees 1,173.333 million (2021: Rupees 1,173.333 million), Rupees 41.60 million (2021: Rupees 41.60 million) and Rupees 1,750 million (2021: Rupees 1,750) on behalf of Nishat Linen (Private) Limited - Subsidiary Company, Nishat Hospitality (Private) Limited - Subsidiary Company and Nishat Sutas Dairy Limited - associated company respectively to secure the obligations of subsidiary companies and associated company towards their lenders.
ii) Post dated cheques of Rupees 13,356.688 million (2021: Rupees 10,758.912 million) are issued by the Holding Company to customs authorities in respect of duties on imported items availed on the basis of consumption and export plans. If documents of exports are not provided on due dates, cheques issued as security shall be encashable.
iii) Post dated cheques of Rupees 122.180 million (2021: Rupees 122.180 million) are issued by the Holding Company to Sui Northern Gas Pipeline Limited in pursuance of order of Lahore High Court, Lahore in the case of gas infrastructure development cess. Further, post dated cheques of Rupees 2.140 million are issued by the Holding Company to Lahore Electric Supply Company Limited in pursuance of order of Lahore High Court Lahore, Lahore in the case of income tax on electricity bills for the month of July 2021.
iv) Holding Company's share in contingencies of associates accounted for under equity method is Rupees 10,446.560 million (2021: Rupees 4,137 million).
v) Guarantees of Rupees 157.350 million (2021: Rupees 107.350 million) are given by the Nishat Linen (Private) Limited - Subsidiary Company to Director Excise and Taxation, Karachi against infrastructure cess, Chairman Punjab Revenue Authority, Lahore against infrastructure cess and Collectors of Customs against import consignments.
vi) The deemed assessment for the tax year 2017 was amended by Deputy Commissioner Inland Revenue (DCIR) through order dated 31 May 2021 issued under sections 122(5) / 214C of the Income Tax Ordinance, 2001, whereby tax demand of Rupees 2,436.967 million was raised on various grounds. Being aggrieved by the order of DCIR, the Nishat Linen (Private) Limited - Subsidiary Company filed an appeal before Commissioner Inland Revenue (Appeals) [CIR(A)] who vide order dated 13 September 2021 granted significant relief to the Nishat Linen (Private) Limited - Subsidiary Company . Against the order of CIR(A)], both the Nishat Linen (Private) Limited - Subsidiary Company and the department have filed cross appeals before Appellate Tribunal Inland Revenue (ATIR) which are pending for adjudication. Based on the advice of the legal counsel, Nishat Linen (Private) Limited - Subsidiary Company is hopeful for the favourable outcome of the matter, hence, no provision has been made in these consolidated financial statements.
vii) Deputy Commissioner Inland Revenue (DCIR) passed order under Sections 11(2) and Section 11(4) of the Sales Tax Act,1990 and raised tax demand of Rupees 5.885 million (including penalty of Rupees 0.280 million) for adjustment of inadmissible input tax for the tax period from July 2021 to November 2021. Being aggrieved, Nishat Linen (Private) Limited - Subsidiary Company filed an appeal before Commissioner Inland Revenue (Appeals) [CIR(A)]. Subsequent to the reporting date, [CIR(A)] dismissed the appeal and confirmed the demand raised by DCIR. Nishat Linen (Private)
Nishat Mills Limited and its Subsidiaries
180 Page
For the year ended June 30, 2022Notes to the Consolidated Financial Statements

Limited - Subsidiary Company is in the process of filing appeal before Appellate Tribunal Inland Revenue (ATIR). Based on the advice of the legal counsel, Nishat Linen (Private) Limited - Subsidiary Company is hopeful for the favourable outcome of the matter, hence, no provision has been made in these consolidated financial statements.
viii) A sales tax demand of Rupees 1,218.132 million was raised against Nishat Power Limited - Subsidiary Company through order dated 11 December 2013, passed by the Assistant Commissioner Inland Revenue ('ACIR') disallowing input sales tax for the tax periods of July 2010 through June 2012. The disallowance was primarily made on the grounds that since revenue derived by Subsidiary Company on account of 'capacity revenue' was not chargeable to sales tax, input sales tax claimed by the Subsidiary Company was required to be apportioned with only the input sales tax attributable to other revenue stream i.e. 'energy revenue' admissible to the Subsidiary Company. Upon appeal before Commissioner Inland Revenue (Appeals) ['CIR(A)'], such issue was decided in Subsidiary Company's favour, however, certain other issues agitated by the Subsidiary Company were not adjudicated. Both the Subsidiary Company and department have filed appeals against the order of CIR(A) before Appellate Tribunal Inland Revenue ('ATIR'). Subsequent to the year end, on 02 August 2022, the Subsidiary company has received favourable decision from ATIR.
Moreover, the above explained issue was taken up by department for tax periods of July 2009 to June 2013 (involving input sales tax of Rupees 1,722.811 million), however, the Subsidiary Company assailed the underlying proceedings before Lahore High Court ('LHC') directly and in this respect, through order dated 31 October 2016, LHC accepted the Subsidiary Company's stance and annulled the proceedings. The department has challenged the decision of LHC before Supreme Court of Pakistan and has also preferred an Intra Court Appeal against such order which are pending adjudication.
Similarly, for financial year 2014, Nishat Power Limited - Subsidiary Company's case was selected for 'audit' and such issue again formed the core of audit proceedings (involving input sales tax of Rupees 596.091 million). The Subsidiary Company challenged the jurisdiction in respect of audit proceedings before LHC and while LHC directed the management to join the subject proceedings, department was debarred from passing the adjudication order. During the year 2019, LHC dismissed the petition in favour of the department, by allowing the department to complete the audit proceedings that are pending completion. During the prior year on 26 January 2021, the department raised demand against such proceedings, however, Subsidiary Company obtained interim relief from Appellate Tribunal Inland Revenue by applying stay against such demand. Later, CIR(A) through its order dated 24 September 2021, has removed the demand in favour of the Nishat Power Limited - Subsidiary Company.
Similarly, during the year in respect of tax periods July 2016 to June 2017, Nishat Power Limited - Subsidiary Company's case was selected for 'audit' and such issue again formed the core of audit proceedings (involving input sales tax of Rupees 541.486 million). During the year, the Subsidiary company received favourable decision from CIR(A) and ATIR, against which the department has filed appeal in ATIR which is in pending adjudication.
Since the issue has already been decided in Subsidiary Company's favour on merits by LHC and based on advice of the Nishat Power Limited - Subsidiary Company's legal counsel, no provision on these accounts have been made in these consolidated financial statements.
ix) On 16 April 2019, the Commissioner Inland Revenue through an order raised a demand of Rupees 179.046 million against Nishat Power Limited - Subsidiary Company, mainly on account of input tax
Annual Report 2022
181Page

claimed on inadmissible expenses in sales tax return for the tax periods of July 2014 to June 2017 and sales tax default on account of suppression of sales related to tax period June 2016. The Subsidiary Company filed application for grant of stay before the ATIR against recovery of the aforesaid demand that was duly granted. Further, the Subsidiary Company has filed appeals before CIR(A) and ATIR against the order which are pending adjudication. Management has strong grounds to believe that the case will be decided in Subsidiary Company's favour. Therefore, no provision has been made on this account in these consolidated financial statements.
x) On 13 February 2019, National Electric Power Regulatory Authority ('NEPRA') issued a show cause to Nishat Power Limited - Subsidiary Company along with other Independent Power Producers to provide rationale of abnormal profits earned since commercial operation date (COD) that eventually led to initiation of proceedings against the Subsidiary Company by NEPRA on 18 March 2019. The Subsidiary Company challenged the authority of NEPRA to take suo moto action before the Islamabad High Court (IHC) wherein, on 01 April 2019, IHC provided interim relief by suspending the suo moto proceedings. The case is currently pending adjudication before IHC. Management is confident that based on the facts and law, there will be no adverse implications for the Subsidiary Company.
xi) On 16 March 2020, Government of Pakistan ('GoP') issued a report through which it was alleged that savings were made by the Independent Power Producers ('IPPs'), including Nishat Power Limited - Subsidiary Company, in the tariff components in violation of applicable GoP Policies, tariff determined by National Electric Power Regulatory Authority ('NEPRA') and the relevant Project Agreements. The Subsidiary Company rejected such claims, and discussions were made with the GoP to resolve the dispute.
On 12 February 2021, Nishat Power Limited - Subsidiary Company under the Agreements, agreed that the abovementioned dispute will be resolved through arbitration under the Arbitration Submission Agreement between the Subsidiary Company and GoP. During the year, on 15 June 2022, the Subsidiary Company and the GoP have signed the Arbitration Submission Agreement.
Management of Nishat Power Limited - Subsidiary Company believes that there are strong grounds that the matter will ultimately be decided in Subsidiary Company's favor. Furthermore, its financial impact cannot be reasonably estimated at this stage, hence, no provision in this respect has been made in these consolidated financial statements.
xii) The banks have issued the following on behalf of Nishat Power Limited - Subsidiary Company:
(a) Letter of guarantee of Rupees 11.5 million (2021: Rupees 11.5 million) and Rupees 6.9 million (2021: Rupees Nil) in favour of Director Excise and Taxation, Karachi, under direction of Sindh High Court and Supreme Court of Pakistan respectively, in respect of suit filed for levy of infrastructure cess.
(b) Letters of guarantee of Rupees 500 million (2021: Rupees 600 million) in favour of fuel suppliers.
(c) Letter of guarantee of Rupees 1.5 million (2021: Rupees 1.5 million) in favour of Punjab Revenue Authority, Lahore.
(d) Letter of guarantee of Rupees 1 million (2021:Nil) in favour of Collector of Customs, Lahore and Rupees 31.61 million (2021: Rupees Nil) in favour of Collector of Customs, Karachi under directions of Lahore High Court and Sindh High Court respectively, in respect of suit filed for
Nishat Mills Limited and its Subsidiaries
182 Page
For the year ended June 30, 2022Notes to the Consolidated Financial Statements

concessionary rate of duty under Customs Act, 1969.
xiii) The bank has issued the following guarantees on Nishat Hospitality (Private) Limited - Subsidiary Company's behalf in favor of Director, Excise and Taxation, Karachi under direction of Sindh High Court in respect of suit filed for levy of infrastructure cess amounting to Rupees 1.27 million (2021: Rupees 1.27 million).
xiv) Bank guarantee of Rupees 1.900 million (2021: Rupees 1.900 million) is given by the bank of Nishat Commodities (Private) Limited - Subsidiary Company in favour of Director, Excise and Taxation, Karachi to cover the disputed amount of Sindh infrastructure cess.
xv) Proceedings under section 122 of the Income Tax Ordinance, 2001 for the tax year 2014 were initiated by Deputy Commissioner Inland Revenue ('DCIR'), who through order dated 31 October 2017, raised a demand of Rupees 1.474 million in respect minimum tax under section 113 on account of disallowances in the light of sections 111 and 174 and disallowed income tax refund amounting to Rupees 14.14 million under section 148 of the Income Tax Ordinance, 2001. Being aggrieved with the impugned order, Nishat Hospitality (Private) Limited - Subsidiary Company preferred an appeal before the Commissioner Inland Revenue (Appeals) ['CIR(A)'] who via its order dated 13 February 2020, upheld the imposition of minimum tax. Consequently, Nishat Hospitality (Private) Limited - Subsidiary Company has preferred an appeal against the order of CIR(A) before the Appellate Tribunal Inland Revenue ('ATIR') which is pending adjudication. No provision has been recognised in these consolidated financial statements in this respect as, based on the view of legal counsel, the management of the Subsidiary Company is confident of the favourable resolution of this matter.
Simultaneously Nishat Hospitality (Private) Limited - Subsidiary Company also filed a rectification application with the DCIR as a result of which an income tax refund of Rupees 474,557 was created. However, while passing the rectification order dated 13 December 2017, the DCIR disallowed adjustment of income tax collected of Rupees 14.14 million under section 148 of the Ordinance. The Subsidiary Company feeling aggrieved by the order, filed a rectification application before the CIR(A). CIR(A) through order dated 28 January 2022 accepted Nishat Hospitality (Private) Limited - Subsidiary Company's rectification application, however, upheld the treatment of the assessing officer of disallowing adjustment of income tax deducted under section 148 of the Ordinance. The Subsidiary Company has preferred an appeal against the aforementioned appellate order before the ATIR and the appeal has not been fixed for hearing till date. Based on the view of legal counsel, the management of the Subsidiary Company is confident of the favourable resolution of this matter.
xvi) Proceedings under section 122 of the Income Tax Ordinance, 2001 for the tax year 2015 were initiated by Deputy Commissioner Inland Revenue ('DCIR'), who through order dated 27 December 2018, disallowed certain expenses amounting to Rupees 100.117 million under section 174 and ordered an addition of Rupees 165.902 million to 'income from other sources' under section 39 of the Income Tax Ordinance, 2001. Being aggrieved with the impugned order, Nishat Hospitality (Private) Limited - Subsidiary Company preferred an appeal before the Commissioner Inland Revenue (Appeals) ['CIR(A)']. The CIR(A) via its order dated 2 December 2021, has confirmed the disallowance under section 174 to the extent of Rupees 60.385 million whereas the issue under section 39 has been remanded back to the DCIR for re-examination in the light of evidence provided by the Subsidiary Company. The Subsidiary Company further preferred an appeal against the said order before the Appellate Tribunal Inland Revenue which is pending adjudication. No provision has been recognised in these consolidated financial statements in this respect as, based on the view of its legal counsel,
Annual Report 2022
183Page

the management of the Subsidiary company is confident of the favourable resolution of this matter.
b) Commitments
i) Contracts for capital expenditure of the Group are approximately of Rupees 2,277.395 million (2021: Rupees 3,469.028 million).
ii) Letters of credit other than for capital expenditure of the Group are of Rupees 2,973.904 million (2021: Rupees 4,451.831 million).
iii) Outstanding foreign currency forward contracts of the Group are Rupees 1,332.998 million (2021: Rupees 6,400.041 million).
2022 2021 Note (Rupees in thousand)
15 PROPERTY, PLANT AND EQUIPMENT
Operating fixed assets 15.1 45,766,365 41,256,832 Capital work in progress 15.2 4,859,326 6,283,283 Major spare parts and standby equipment 15.3 422,279 104,397 51,047,970 47,644,512
Nishat Mills Limited and its Subsidiaries
184 Page
For the year ended June 30, 2022Notes to the Consolidated Financial Statements

At 3
0 Ju
ne 2
020
Cos
t 2
,719
,618
14
,453
,079
55
,087
,107
1,
424,
850
446,
603
1,11
9,25
1 43
9,11
8 1,
035,
882
33,6
38
76,7
59,1
46C
urre
ncy
retra
nsla
tion
-
9,11
6 -
- -
657
277
501
- 10
,551
2,7
19,6
18
14,4
62,1
95
55,0
87,1
07
1,42
4,85
0 44
6,60
3 1,
119,
908
439,
395
1,03
6,38
3 33
,638
76
,769
,697
Accu
mul
ated
dep
reci
atio
n -
(6,7
16,3
38)
(26,
385,
777)
(7
89,0
61)
(266
,510
) (4
91,1
67)
(327
,610
) (5
19,2
75)
(26,
573)
(3
5,52
2,31
1)C
urre
ncy
retra
nsla
tion
- (7
,562
) -
- -
(358
) (3
61)
(347
) -
(8,6
28)
- (6
,723
,900
) (2
6,38
5,77
7)
(789
,061
) (2
66,5
10)
(491
,525
) (3
27,9
71)
(519
,622
) (2
6,57
3)
(35,
530,
939)
Accu
mul
ated
impa
irmen
t -
- (1
62,6
01)
- -
- -
- -
(162
,601
)N
et b
ook
valu
e 2,
719,
618
7,73
8,29
5 28
,538
,729
63
5,78
9 18
0,09
3 62
8,38
3 11
1,42
4 51
6,76
1 7,
065
41,0
76,1
57
Year
end
ed 3
0 Ju
ne 2
021
Ope
ning
net
boo
k va
lue
2,
719,
618
7,73
8,29
5 28
,538
,729
63
5,78
9 18
0,09
3 62
8,38
3 11
1,42
4 51
6,76
1 7,
065
41,0
76,1
57Ad
ditio
ns
20,8
23
585,
474
3,14
8,47
5 43
,114
18
,010
61
,356
37
,682
39
8,60
3 58
4,
313,
595
Reve
rsal
of p
rovi
sion
(9
8,52
8)
- -
- -
- -
- -
(98,
528)
Dis
posa
ls:
Cos
t (1
07,7
22)
(28,
905)
(1
44,2
43)
(45)
-
(278
) (3
,485
) (1
43,8
30)
- (4
28,5
08)
Accu
mul
ated
dep
reci
atio
n -
8,24
9 11
9,48
3 -
- 21
2,
792
105,
033
- 23
5,57
8
(1
07,7
22)
(20,
656)
(2
4,76
0)
(45)
-
(257
) (6
93)
(38,
797)
-
(192
,930
)D
epre
ciat
ion
char
ge
- (8
14,8
89)
(2,6
80,6
82)
(65,
459)
(1
8,95
1)
(69,
774)
(4
0,35
3)
(143
,000
) (1
,570
) (3
,834
,678
)C
urre
ncy
retra
nsla
tion
- (5
,640
) -
- -
(761
) (5
9)
(324
) -
(6,7
84)
Clo
sing
net
boo
k va
lue
2,
534,
191
7,48
2,58
4 28
,981
,762
61
3,39
9
179,
152
618,
947
108,
001
733,
243
5,55
3 41
,256
,832
At 3
0 Ju
ne 2
021
Cos
t 2
,534
,191
15
,018
,764
58
,091
,339
1,
467,
919
464,
613
1,18
0,98
6 47
3,59
2 1,
291,
156
33,6
96
80,5
56,2
56C
urre
ncy
retra
nsla
tion
-
(22,
190)
-
- -
(1,5
58)
(873
) (1
,535
) -
(26,
156)
2,5
34,1
91
14,9
96,5
74
58,0
91,3
39
1,46
7,91
9 46
4,61
3 1,
179,
428
472,
719
1,28
9,62
1 33
,696
80
,530
,100
Accu
mul
ated
dep
reci
atio
n -
(7,5
30,5
40)
(28,
946,
976)
(8
54,5
20)
(285
,461
) (5
61,2
78)
(365
,532
) (5
57,5
89)
(28,
143)
(3
9,13
0,03
9)C
urre
ncy
retra
nsla
tion
- 16
,550
-
- -
797
814
1,21
1 -
19,3
72
-
(7,5
13,9
90)
(28,
946,
976)
(8
54,5
20)
(285
,461
) (5
60,4
81)
(364
,718
) (5
56,3
78)
(28,
143)
(3
9,11
0,66
7)Ac
cum
ulat
ed im
pairm
ent
- -
(162
,601
) -
- -
- -
- (1
62,6
01)
Net
boo
k va
lue
2,53
4,19
1 7,
482,
584
28,9
81,7
62
613,
399
179,
152
618,
947
108,
001
733,
243
5,55
3 41
,256
,832
Year
end
ed 3
0 Ju
ne 2
022
Ope
ning
net
boo
k va
lue
2,
534,
191
7,48
2,58
4 28
,981
,762
61
3,39
9 17
9,15
2 61
8,94
7 10
8,00
1 73
3,24
3 5,
553
41,2
56,8
32Ad
ditio
ns
254,
390
1,14
1,68
3 6,
693,
695
277,
767
67,8
46
174,
725
51,4
09
235,
047
- 8,
896,
562
Dis
posa
ls:
Cos
t -
- (2
50,8
40)
- -
(4,7
91)
(8,7
43)
(156
,066
) -
(420
,440
)Ac
cum
ulat
ed d
epre
ciat
ion
- -
209,
482
- -
1,79
1 7,
404
114,
143
- 33
2,82
0
-
- (4
1,35
8)
- -
(3,0
00)
(1,3
39)
(41,
923)
-
(87,
620)
Dep
reci
atio
n ch
arge
-
(837
,977
) (3
,109
,953
) (7
5,03
9)
(24,
820)
(6
7,75
9)
(40,
656)
(1
67,3
54)
(1,2
12)
(4,3
24,7
70)
Cur
renc
y re
trans
latio
n -
20,5
05
- -
- 2,
631
137
2,08
8 -
25,3
61C
losi
ng n
et b
ook
valu
e
2,78
8,58
1 7,
806,
795
32,5
24,1
46
816,
127
222,
178
725,
544
117,
552
761,
101
4,34
1 45
,766
,365
At
30
June
202
2C
ost
2,7
88,5
81
16,1
38,2
57
64,5
34,1
94
1,74
5,68
6 53
2,45
9 1,
349,
362
515,
385
1,36
8,60
2 33
,696
89
,006
,222
Cur
renc
y re
trans
latio
n -
101,
390
- -
- 6,
189
418
2,48
7 -
110,
484
2,7
88,5
81
16,2
39,6
47
64,5
34,1
94
1,74
5,68
6 53
2,45
9 1,
355,
551
515,
803
1,37
1,08
9 33
,696
89
,116
,706
Accu
mul
ated
dep
reci
atio
n -
(8,3
51,9
67)
(31,
847,
447)
(9
29,5
59)
(310
,281
) (6
26,4
49)
(397
,970
) (6
09,5
89)
(29,
355)
(4
3,10
2,61
7)C
urre
ncy
retra
nsla
tion
- (8
0,88
5)
- -
- (3
,558
) (2
81)
(399
) -
(85,
123)
- (8
,432
,852
) (3
1,84
7,44
7)
(929
,559
) (3
10,2
81)
(630
,007
) (3
98,2
51)
(609
,988
) (2
9,35
5)
(43,
187,
740)
Accu
mul
ated
impa
irmen
t -
- (1
62,6
01)
- -
- -
- -
(162
,601
)N
et b
ook
valu
e 2,
788,
581
7,80
6,79
5 32
,524
,146
81
6,12
7 22
2,17
8 72
5,54
4 11
7,55
2 76
1,10
1 4,
341
45,7
66,3
65
Annu
al ra
te o
f dep
reci
atio
n (%
) -
3.99
-10
4-32
.9 a
nd
10
10
10
30-3
3 20
20
-33
num
ber o
f
ho
urs
used
Furn
iture
,fix
ture
s an
dof
fice
equi
pmen
t
Free
hold
land
Bui
ldin
gs o
nfr
eeho
ldla
nd
Plan
t and
mac
hine
ryEl
ectr
icin
stal
latio
nsFa
ctor
yeq
uipm
ent
Com
pute
req
uipm
ent
Kitc
hen
equi
pmen
tan
d cr
ocke
ryite
ms
Vehi
cles
Tota
l
15.1
OPE
RATI
NG F
IXED
ASS
ETS
(Rup
ees
in th
ousa
nd)
Annual Report 2022
185Page

Plan
t and
Mac
hine
ry
Air C
ompr
esso
r 2
2,84
9 1,
800
1,04
9 71
6 (3
33)
Neg
otia
tion
Elec
tric
Engi
neer
ing
(Priv
ate)
Lim
ited,
Lah
ore.
Air C
ompr
esso
r 2
2,24
8 1,
352
896
803
(93)
N
egot
iatio
n M
ubas
har B
roth
ers,
Fai
sala
bad.
Draw
Fra
me
2
6,16
1 5,
468
693
641
(52)
N
egot
iatio
n M
ubas
har B
roth
ers,
Fai
sala
bad.
Ring
Fra
me
1 19
,141
15
,571
3,
570
2,56
4 (1
,006
) N
egot
iatio
n M
ubas
har B
roth
ers,
Fai
sala
bad.
Ring
Fra
me
1 19
,141
15
,576
3,
565
2,56
4 (1
,001
) N
egot
iatio
n M
ubas
har B
roth
ers,
Fai
sala
bad.
Ring
Fra
me
1 19
,141
15
,577
3,
564
2,56
4 (1
,000
) N
egot
iatio
n M
ubas
har B
roth
ers,
Fai
sala
bad.
Ring
Fra
me
1 19
,509
15
,962
3,
547
2,56
4 (9
83)
Neg
otia
tion
Mub
asha
r Bro
ther
s, F
aisa
laba
d.Ri
ng F
ram
e 1
19,5
09
15,9
62
3,54
7 2,
564
(983
) N
egot
iatio
n M
ubas
har B
roth
ers,
Fai
sala
bad.
Auto
Con
e W
inde
r 1
25,6
64
20,7
83
4,88
1 3,
462
(1,4
19)
Neg
otia
tion
Mub
asha
r Bro
ther
s, F
aisa
laba
d.Au
to C
one
Win
der
1 12
,832
10
,404
2,
428
1,73
1 (6
97)
Neg
otia
tion
Mub
asha
r Bro
ther
s, F
aisa
laba
d.Ri
ng F
ram
e 1
19,5
09
15,9
78
3,53
1 2,
564
(967
) N
egot
iatio
n M
ubas
har B
roth
ers,
Fai
sala
bad.
Ring
Fra
me
1 19
,141
15
,594
3,
547
2,56
4 (9
83)
Neg
otia
tion
Mub
asha
r Bro
ther
s, F
aisa
laba
d.To
yota
Air
Jet L
oom
s 6
14,
348
11,9
30
2,41
8 8,
700
6,28
2 N
egot
iatio
n G
agan
Tex
tile, K
arac
hi.
Toyo
ta A
ir Je
t Loo
ms
5 11
,957
9,
952
2,00
5 7,
250
5,24
5
Neg
otia
tion
Gag
an T
extile
, Kar
achi
.Ka
wa
Mot
o Si
zing
Mac
hine
1
10,8
32
10,1
33
699
3,50
0 2,
801
Neg
otia
tion
Rafiq
ue T
extile
(Priv
ate)
Lim
ited,
Fai
sala
bad.
221,
982
182,
042
39,9
40
44,7
51
4,81
1
Furn
iture
and
fixt
ures
A/C
Cas
sette
Typ
e 4
Ton
Hea
t & C
ool
1 1,
530
393
1,13
7 1,
137
- In
sura
nce
Cla
im
Secu
rity
Gen
eral
Insu
ranc
e C
ompa
ny L
imite
d
- r
elat
ed p
arty,
Lah
ore
.
15.1
.1
Det
ail o
f ope
ratin
g fix
ed a
sset
s, e
xcee
ding
the
book
val
ue o
f Rup
ees
500,
000
disp
osed
of d
urin
g th
e ye
ar is
as
follo
ws:
Des
crip
tion
Accu
mul
ated
depr
ecia
tion
Net
boo
kva
lue
Sal
epr
ocee
dsG
ain
/(lo
ss)
Mod
e of
disp
osal
Part
icul
ars
of p
urch
aser
sQ
uant
ityN
os.
Cos
t
(Rup
ees
in th
ousa
nd)
Nishat Mills Limited and its Subsidiaries
186 Page
For the year ended June 30, 2022Notes to the Consolidated Financial Statements
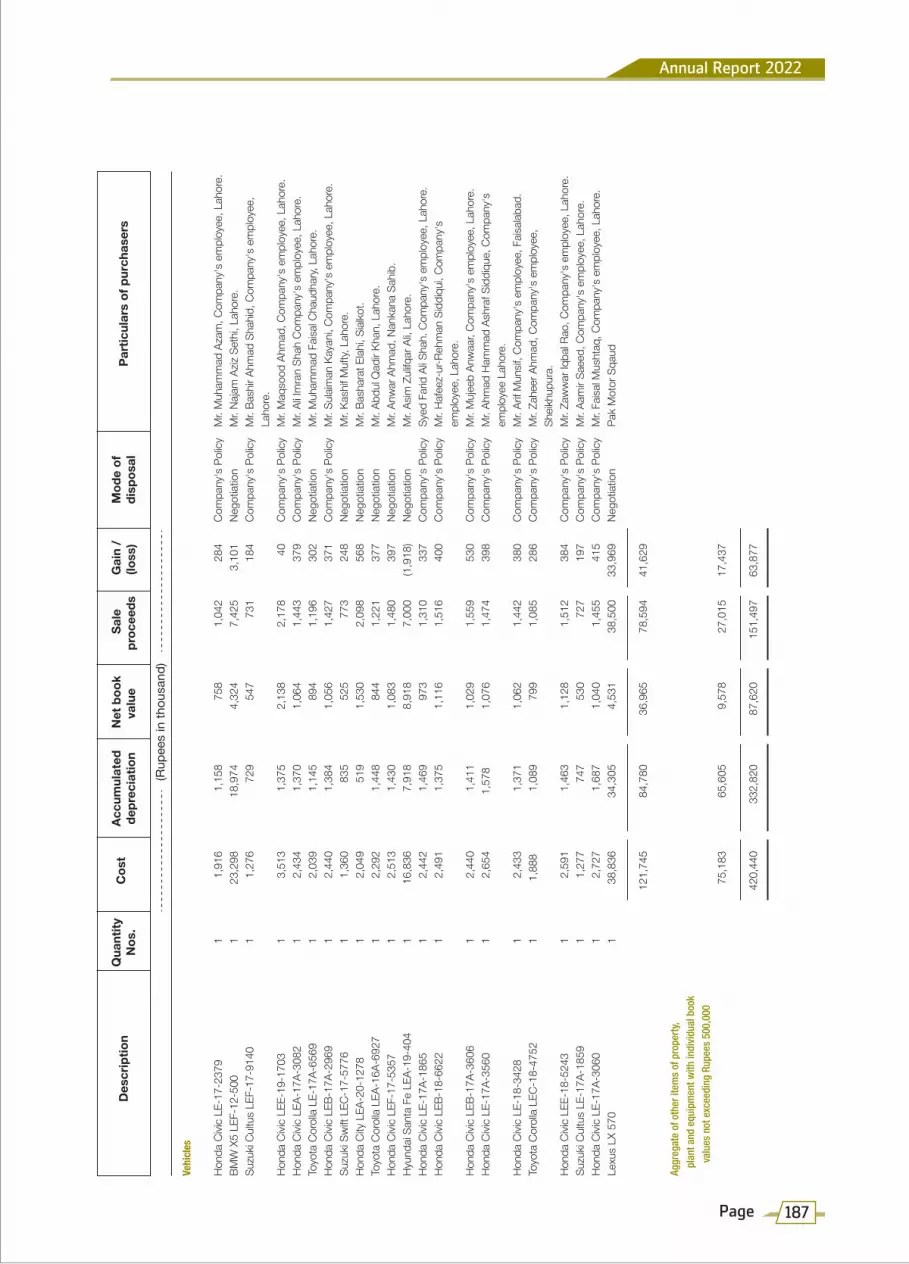
Vehi
cles
Hon
da C
ivic
LE-1
7-23
79
1 1,
916
1,15
8 75
8 1,
042
284
C
ompa
ny's
Pol
icy
Mr.
Muh
amm
ad A
zam
, Com
pany
's e
mpl
oyee
, Lah
ore.
BMW
X5
LEF-
12-5
00
1 23
,298
18
,974
4,
324
7,42
5 3,
101
Neg
otia
tion
Mr.
Naj
am A
ziz S
ethi
, Lah
ore.
Suzu
ki C
ultu
s LE
F-17
-914
0 1
1,27
6 72
9 54
7 73
1 18
4 C
ompa
ny's
Pol
icy
Mr.
Bash
ir Ah
mad
Sha
hid,
Com
pany
's e
mpl
oyee
,
La
hore
.H
onda
Civi
c LE
E-19
-170
3 1
3,51
3 1,
375
2,13
8 2,
178
40
Com
pany
's P
olic
y M
r. M
aqso
od A
hmad
, Com
pany
's e
mpl
oyee
, Lah
ore.
Hon
da C
ivic
LEA-
17A-
3082
1
2,43
4 1,
370
1,06
4 1,
443
379
Com
pany
's P
olic
y M
r. Al
i Imra
n Sh
ah C
ompa
ny's
em
ploy
ee, L
ahor
e.To
yota
Cor
olla
LE-
17A-
6569
1
2,03
9 1,
145
894
1,19
6 30
2 N
egot
iatio
n M
r. M
uham
mad
Fai
sal C
haud
hary,
Lah
ore.
Hon
da C
ivic
LEB-
17A-
2969
1
2,44
0 1,
384
1,05
6 1,
427
371
Com
pany
's P
olic
y M
r. Su
laim
an K
ayan
i, C
ompa
ny's
em
ploy
ee, L
ahor
e.Su
zuki
Swift
LEC
-17-
5776
1
1,36
0 83
5 52
5 77
3 24
8 N
egot
iatio
n
Mr.
Kash
if M
ufty,
Lah
ore.
Hon
da C
ity L
EA-2
0-12
78
1 2,
049
519
1,53
0 2,
098
568
Neg
otia
tion
Mr.
Bash
arat
Ela
hi, S
ialko
t.To
yota
Cor
olla
LEA
-16A
-692
7 1
2,29
2 1,
448
844
1,22
1 37
7 N
egot
iatio
n M
r. Ab
dul Q
adir
Khan
, Lah
ore.
Hon
da C
ivic
LEF-
17-5
357
1 2,
513
1,43
0 1,
083
1,48
0 39
7 N
egot
iatio
n M
r. An
war
Ahm
ad, N
anka
na S
ahib
.H
yund
ai S
anta
Fe
LEA-
19-4
04
1 16
,836
7,
918
8,91
8 7,
000
(1,9
18)
Neg
otia
tion
Mr.
Asim
Zul
ifqar
Ali,
Laho
re.
Hon
da C
ivic
LE-1
7A-1
865
1 2,
442
1,46
9 97
3 1,
310
337
Com
pany
's P
olic
y Sy
ed F
arid
Ali S
hah.
Com
pany
's e
mpl
oyee
, Lah
ore.
Hon
da C
ivic
LEB-
18-6
622
1 2,
491
1,37
5 1,
116
1,51
6 40
0 C
ompa
ny's
Pol
icy
Mr.
Haf
eez-
ur-R
ehm
an S
iddi
qui,
Com
pany
's
empl
oyee
, Lah
ore.
Hon
da C
ivic
LEB-
17A-
3606
1
2,44
0 1,
411
1,02
9 1,
559
530
Com
pany
's P
olic
y M
r. M
ujee
b An
waa
r, C
ompa
ny's
em
ploy
ee, L
ahor
e.H
onda
Civi
c LE
-17A
-356
0 1
2,65
4 1,
578
1,
076
1,47
4 39
8 C
ompa
ny's
Pol
icy
Mr.
Ahm
ad H
amm
ad A
shra
f Sid
diqu
e, C
ompa
ny's
em
ploy
ee L
ahor
e.H
onda
Civi
c LE
-18-
3428
1
2,43
3 1,
371
1,06
2 1,
442
380
Com
pany
's P
olic
y M
r. Ar
if M
unsif
, Com
pany
's e
mpl
oyee
, Fai
sala
bad.
Toyo
ta C
orol
la L
EC-1
8-47
52
1 1,
888
1,
089
799
1,08
5 28
6 C
ompa
ny's
Pol
icy
Mr.
Zahe
er A
hmad
, Com
pany
's e
mpl
oyee
,
Sh
eikh
upur
a.H
onda
Civi
c LE
E-18
-524
3 1
2,59
1 1,
463
1,12
8 1,
512
384
Com
pany
's P
olic
y M
r. Za
ww
ar Iq
bal R
ao, C
ompa
ny's
em
ploy
ee, L
ahor
e.Su
zuki
Cul
tus
LE-1
7A-1
859
1 1,
277
747
530
727
197
Com
pany
's P
olic
y M
r. Aa
mir
Saee
d, C
ompa
ny's
em
ploy
ee, L
ahor
e.H
onda
Civi
c LE
-17A
-306
0 1
2,72
7 1,
687
1,04
0 1,
455
415
Com
pany
's P
olic
y M
r. Fa
isal M
usht
aq, C
ompa
ny's
em
ploy
ee, L
ahor
e.Le
xus
LX 5
70
1 38
,836
34
,305
4,
531
38,5
00
33,9
69
Neg
otia
tion
Pak
Mot
or S
qaud
121,
745
84,7
80
36,9
65
78,5
94
41,6
29
Ag
greg
ate
of o
ther
item
s of
pro
pert
y,
plan
t and
equ
ipm
ent w
ith in
divi
dual
boo
k
val
ues
not e
xcee
ding
Rup
ees
500,
000
75,
183
65,6
05
9,57
8 27
,015
17
,437
420,
440
332,
820
87,6
20
151,
497
63,8
77
Des
crip
tion
Accu
mul
ated
depr
ecia
tion
Net
boo
kva
lue
Sal
epr
ocee
dsG
ain
/(lo
ss)
Mod
e of
disp
osal
Part
icul
ars
of p
urch
aser
sQ
uant
ityN
os.
Cos
t
(Rup
ees
in th
ousa
nd)
Annual Report 2022
187Page

2022 2021 Note (Rupees in thousand)
15.1.2 Depreciation and amortization charge for the year has been allocated as follows:
Cost of sales 31 4,047,071 3,580,811 Distribution cost 32 57,678 54,942 Administrative expenses 33 219,812 190,069 Capital work-in-progress 209 10,115 4,324,770 3,835,937
15.1.3 Particulars of immovable fixed assets are as follows:
Description Address Area of land Acres
Spinning units, Yarn dyeing unit Nishatabad, Faisalabad. 86.56 and Power plant
Spinning units and Power plant Plot No. 172-180 & 188-197, M-3 Industrial City, Sahianwala, FIEDMC, 2 K.M., Jhumra Chiniot Road, Chak Jhumra, Faisalabad. 96.15 Spinning units and Power plant 20 K.M., Sheikhupura Road, Feroze Wattwan. 67.12 Weaving units and Power plant 12 K.M., Faisalabad Road, Sheikhupura. 85.53 Weaving units, Dyeing and finishing 5 K.M., Nishat Avenue Off 22 K.M., units, Processing unit, Stitching Ferozepur Road, Lahore. 116.39 units and Power plants Terry unit 7 K.M., Nishat Avenue Off 22 K.M., Ferozepur Road, Lahore. 12.54 Apparel unit 2 K.M., Nishat Avenue Off 22 K.M., Ferozepur Road, Lahore. 17.05 Office 7-Main Gulberg, Lahore. 1.12 NL Tower (Retail Outlet) 5/A-3 Gulberg, Lahore. 0.25 Open Plot 20-A-III Gulberg, Lahore. 0.05 Power Plant - Nishat Power Limited Jamber Kalan, Tehsil Pattoki, District Kasur. 34.07 - Subsidiary Company Factory land 21 K.M. Ferozepur Road, Lahore. 4.21 Commercial building Mian Mehmood Kasuri Road, Gulberg III, Lahore. 0.76 Commercial plot Defence Housing Authority, Lahore. 0.16
521.96
Nishat Mills Limited and its Subsidiaries
188 Page
For the year ended June 30, 2022Notes to the Consolidated Financial Statements

Furn
iture
,fix
ture
san
d of
fice
equi
pmen
t
Adva
nces
for
purc
hase
of
free
hold
land
Bui
ldin
gs o
nfr
eeho
ldla
nd
Plan
t and
mac
hine
ryEl
ectr
icin
stal
latio
ns
Adva
nces
for
purc
hase
of
vehi
cles
Unal
loca
ted
capi
tal
expe
nditu
res
Tota
l
15.2
Cap
ital-w
ork-
in-p
rogr
ess
(Rup
ees
in th
ousa
nd)
At 3
0 Ju
ne 2
020
50,7
58
320,
429
2,02
2,85
1 3,
327
2,04
6 41
,259
10
2,07
0 2,
542,
740
Add:
Add
ition
s du
ring
the
year
1
2,05
4 1,
698,
866
5,15
1,86
5 13
8,30
7 34
,810
18
0,26
2 37
,178
7,
253,
342
Less
: Tra
nsfe
rred
to o
pera
ting
fixed
ass
ets
d
urin
g th
e ye
ar
(15,
008)
(5
20,2
07)
(2,5
98,9
60)
(31,
470)
(2
3,70
4)
(186
,739
) (1
29,5
73)
(3,5
05,6
61)
Less
: Cha
rged
to p
rofit
or l
oss
durin
g th
e ye
ar
- (7
,138
) -
- -
- -
(7,1
38)
At 3
0 Ju
ne 2
021
47,
804
1,49
1,95
0 4,
575,
756
110,
164
13,1
52
34,7
82
9,67
5 6,
283,
283
Add:
Add
ition
s du
ring
the
year
2
07,7
39
1,21
9,78
9 3,
807,
515
244,
533
5,34
8 26
1,27
5 81
,876
5,
828,
075
Less
: Tra
nsfe
rred
to o
pera
ting
fixed
ass
ets
d
urin
g th
e ye
ar
(254
,390
) (1
,050
,100
) (5
,415
,911
) (2
62,1
95)
(10,
132)
(1
84,8
76)
(74,
371)
(7
,251
,975
)Le
ss: C
harg
ed to
pro
fit o
r los
s du
ring
the
year
-
(57)
-
- -
- -
(57)
At 3
0 Ju
ne 2
022
1,1
53
1,66
1,58
2 2,
967,
360
92,5
02
8,36
8 11
1,18
1 17
,180
4,
859,
326
15.2
.1
Adva
nce
for p
urch
ase
of v
ehic
les
incl
udes
adv
ance
of R
upee
s 6.
414
milli
on (2
021:
Rup
ees
2.87
8 m
illion
) giv
en to
Hyu
ndai
Nis
hat M
otor
(Priv
ate)
Lim
ited
- ass
ocia
ted
com
pany
.
Annual Report 2022
189Page

2022 2021 (Rupees in thousand)
15.3 Major spare parts and standby equipment
Opening balance 104,397 105,246 Add: Additions during the year 334,355 17,808 438,752 123,054 Less: Transferred during the year (16,473) (18,657) Closing balance 422,279 104,397
16 INTANGIBLE ASSETS
FRANCHISE COMPUTER FEE SOFTWARE (Rupees in thousand)
At 30 June 2020 Cost 9,834 25,178 35,012 Accumulated amortization (9,834) (23,919) (33,753) Net book value - 1,259 1,259
Year ended 30 June 2021 Opening net book value - 1,259 1,259 Amortization charged - (1,259) (1,259) Closing net book value - - -
At 30 June 2021 Cost 9,834 25,178 35,012 Accumulated amortization (9,834) (25,178) (35,012) Net book value - - -
Year ended 30 June 2022 Opening net book value - - - Amortization charged - - - Closing net book value - - -
At 30 June 2022 Cost - - - Accumulated amortization - - - Net book value - - -
Annual amortization rate (%) 20 20
16.1 Intangible assets have been fully amortised till 30 June 2021 and are still in use.
Total
Nishat Mills Limited and its Subsidiaries
190 Page
For the year ended June 30, 2022Notes to the Consolidated Financial Statements

17 RIGHT-OF-USE ASSETS
Land Buildings Total (Rupees in thousand)
Reconciliation of net carrying amount of right-of-use assets: Balance as on 01 July 2020 19,673 2,011,063 2,030,736 Add: Additions during the year - 339,233 339,233 Add: Impact of lease modifications / renewals - 180,387 180,387 Less: Impact of lease termination - (69,406) (69,406) Less: Depreciation for the year (6,549) (717,041) (723,590) Less: Currency retranslation (1,263) (16,693) (17,956) Balance as at 30 June 2021 11,861 1,727,543 1,739,404 Add: Additions during the year - 199,140 199,140 Add: Impact of lease modifications / renewals - 965,049 965,049 Less: Impact of lease termination - (15,226) (15,226) Less: Depreciation for the year (7,402) (770,308) (777,710) Add: Currency retranslation 2,516 83,709 86,225 Balance as at 30 June 2022 6,975 2,189,907 2,196,882
Lease of land
The Nishat International FZE - Subsidiary Company obtained land on lease for warehouse purpose. Lease period is 5 years.
Lease of buildings
The Group obtained buildings on lease for godowns and shops. Lease terms are negotiated on an individual basis and contain a wide range of different terms and conditions. Lease periods range from three to sixteen years.
2022 2021 Note (Rupees in thousand)
17.1 Depreciation charge for the year has been allocated as follows:
Distribution cost 32 770,308 717,041 Administrative expenses 33 7,402 6,549 777,710 723,590
18 LONG TERM INVESTMENTS
Equity instruments 18.1 52,382,499 55,330,247
Annual Report 2022
191Page

2022 2021 Note (Rupees in thousand)
18.1 Equity instruments
Associates (with significant influence) - under equity method
D.G. Khan Cement Company Limited - quoted 137,574,201 (2021: 137,574,201) fully paid ordinary shares of Rupees 10 each. Equity held 31.40% (2021: 31.40%) 22,565,622 23,683,395
Lalpir Power Limited - quoted 109,393,555 (2021: 109,393,555) fully paid ordinary shares Rupees 10 each. Equity held 28.80% (2021: 28.80%) 4,899,163 5,013,325
Pakgen Power Limited - quoted 102,524,728 (2021: 102,524,728) fully paid ordinary shares of Rupees 10 each. Equity held 27.55% (2021: 27.55%) 6,600,600 6,443,324
Nishat Paper Products Company Limited - unquoted 11,634,199 (2021:11,634,199) fully paid ordinary shares of Rupees 10 each. Equity held 25% (2020: 25%) 554,222 511,656
Nishat Dairy (Private) Limited - unquoted 60,000,000 (2021: 60,000,000) fully paid ordinary shares of Rupees 10 each. Equity held 12.24% (2021: 12.24%) 328,216 306,768
Hyundai Nishat Motor (Private) Limited - unquoted 18.1.1 113,847,600 (2021: 113,847,600) fully paid ordinary shares of Rupees 10 each. Equity held 12% (2021: 12%) 1,030,261 809,210
Sanifa Agri Services Limited - unquoted 18.1.2 11,591,600 (2021: 6,591,600) fully paid ordinary shares of Rupees 10 each. Equity held 33.12% (2021: 33.33%) - -
Nishat Hotels and Properties Limited - unquoted 74,022,917 (2021: 74,022,917) fully paid ordinary shares of Rupees 10 each. Equity held 6.08% (2021: 6.08%) 617,091 556,422
Nishat Sutas Dairy Limited - unquoted 144,254,900 (2021: 16,630,000) fully paid ordinary shares of Rupees 10 each. Equity held 47.53% (2021: 34.46%) 1,189,878 117,682
Security General Insurance Company Limited - unquoted 10,226,244 (2021: 10,226,244) fully paid ordinary shares of Rupees 10 each. Equity held 15.02% (2021: 15.02%) 2,215,280 2,108,012
Equity investments accounted for under equity method 40,000,333 39,549,794
Nishat Mills Limited and its Subsidiaries
192 Page
For the year ended June 30, 2022Notes to the Consolidated Financial Statements

2022 2021 (Rupees in thousand)
Equity instruments Fair value through other comprehensive income Associated companies (Others)
Adamjee Insurance Company Limited - quoted 102,809 (2021: 102,809) fully paid ordinary shares of Rupees 10 each. Equity held 0.03% (2021: 0.03%) 2,116 2,116
MCB Bank Limited - quoted 88,015,291 (2021: 88,015,291) fully paid ordinary shares of Rupees 10 each. Equity held 7.43% (2021: 7.43%) 12,851,084 12,851,084 12,853,200 12,853,200
Related party Nishat (Chunian) Limited - quoted 18.1.3 32,689,338 (2021: 32,689,338) fully paid ordinary shares of Rupees 10 each. Equity held 13.61% (2021: 13.61%) 378,955 378,955
Others Alhamra Islamic Stock Fund - quoted 1,121,410 (2021: 1,121,410) units. 3,135 3,135
United Bank Limited - quoted 353,000 (2021: Nil) fully paid ordinary shares of Rupees 10 each. Equity held 0.03% (2021: Nil) 41,333 -
Pakistan Petroleum Limited - quoted 599,998 (2021: 599,998) fully paid ordinary shares of Rupees 10 each. Equity held 0.02% (2021: 0.02%) 64,409 64,409 108,877 67,544 13,341,032 13,299,699 Add: Fair value adjustment (958,866) 2,480,754 Equity investments classified at fair value through other comprehensive income 12,382,166 15,780,453 52,382,499 55,330,247
18.1.1 Investments in Hyundai Nishat Motor (Private) Limited include 4 shares held in the name of nominee directors of the Holding Company.
18.1.2 This includes 1,600 (2021: 1,600) shares held in the name of chief financial officer of the Holding Company and senior officer of the Holding Company.
18.1.3 Pursuant to the Scheme of Compromises, Arrangement and Reconstruction (Under Sections 279 to 283 and 285 of the Companies Act, 2017) amongst Nishat (Chunian) Limited and its members and Nishat Chunian Properties (Private) Limited and its members duly sanctioned by Honorable Lahore High Court, Lahore on 29 June 2022, the Holding Company has, subsequent to the reporting period, on 18 August 2022, received 25,497,684 ordinary shares of Nishat Chunian Power Limited as one of the principal objects of the Scheme was to make Nishat (Chunian) Limited and Nishat Chunian Power Limited totally independent of each other by the transfer amongst the members of Nishat (Chunian) Limited of 187,585,820 ordinary shares of Nishat Chunian Power Limited owned by Nishat (Chunian) Limited. Hence, the Holding Company has also become a shareholder of Nishat Chunian Power Limited with effect from 18 August 2022.
Annual Report 2022
193Page

Nam
e of
ass
ocia
ted
com
pany
Not
eCo
untry
of
inco
rpor
atio
n%
of o
wne
rshi
pin
tere
stM
easu
rem
ent
met
hod
Quo
ted
fair
valu
eC
arry
ing
amou
nt
2022
2021
2022
2021
2021
2022
(Rup
ees
in th
ousa
nd)
D.
G. K
han
Cem
ent C
ompa
ny L
imite
d
18.4
.1
Pakis
tan
31.4
0%
31.4
0%
Equit
y met
hod
8,59
8,38
8 16
,222
,750
2,
565,
622
23,6
83,3
95
Nish
at P
aper
Pro
duct
s Co
mpa
ny L
imite
d 18
.4.2
Pa
kista
n 25
.00%
25
.00%
Eq
uity m
etho
d -*
-* 55
4,22
2 51
1,65
6
Nish
at D
airy (
Priva
te) L
imite
d 18
.4.3
Pa
kista
n 12
.24%
12
.24%
Eq
uity m
etho
d -*
-*
328,
216
306
,768
La
lpir
Powe
r Lim
ited
18.4
.4
Pakis
tan
28.8
0%
28.8
0%
Equit
y met
hod
1,39
4,76
8 1,
953,
769
4,89
9,16
3 5,
013,
325
Pa
kgen
Pow
er L
imite
d
18.4
.5
Pakis
tan
27.5
5%
27.5
5%
Equit
y met
hod
1,89
5,68
2 2,
528,
260
6,60
0,60
0 6
,443
,324
Ni
shat
Ene
rgy L
imite
d 18
.4.6
Pa
kista
n 37
.75%
37
.75%
Eq
uity m
etho
d -*
-*
- -
Ni
shat
Hot
els a
nd P
rope
rties
Lim
ited
18.4
.7
Pakis
tan
6.08
%
6.08
%
Equit
y met
hod
-* -*
617,
091
556,
422
Hy
unda
i Nish
at M
otor
(Priv
ate)
Lim
ited
18.4
.8
Pakis
tan
12.0
0%
12.0
0%
Equit
y met
hod
-* -*
1,03
0,26
1 80
9,21
0
Sanif
a Ag
ri Se
rvice
s Lim
ited
18.4
.9
Pakis
tan
33.1
2%
33.3
3%
Equit
y met
hod
-* -*
- -
Se
curit
y Gen
eral
Insu
ranc
e Co
mpa
ny L
imite
d 18
.4.1
0 Pa
kista
n 15
.02%
15
.02%
Eq
uity m
etho
d -*
-* 2,
215,
280
2,10
8,01
2
Nish
at S
utas
Dair
y Lim
ited
18.4
.11
Pakis
tan
47.5
3%
34.4
6%
Equit
y met
hod
-* -*
1,18
9,87
8 11
7,68
2
18.4
.1
D.G.
Kha
n Ce
men
t Com
pany
Lim
ited
is en
gage
d in
prod
uctio
n an
d sa
le of
clin
ker,
ordi
nary
por
tland
and
sulp
hate
resis
tant
cem
ent.
18
.4.2
Ni
shat
Pap
er P
rodu
cts
Com
pany
Lim
ited
is en
gage
d in
the
man
ufac
ture
and
sale
of p
aper
pro
duct
s an
d pa
ckag
ing m
ater
ial.
18
.4.3
Ni
shat
Dair
y (Pr
ivate
) Lim
ited
is en
gage
d in
the
busin
ess
of p
rodu
ction
of r
aw m
ilk.
18
.4.4
Th
e pr
incip
al ac
tivitie
s of
Lalp
ir Po
wer L
imite
d ar
e to
own
, ope
rate
and
main
tain
an o
il fire
d po
wer s
tatio
n ha
ving
gros
s ca
pacit
y of 3
62 M
W in
Meh
moo
d Ko
t, M
uzaf
farg
arh,
Pun
jab, P
akist
an.
18
.4.5
Th
e pr
incip
al ac
tivitie
s of
Pak
gen
Powe
r Lim
ited
are
to o
wn, o
pera
te a
nd m
ainta
in an
oil f
ired
powe
r sta
tion
havin
g gr
oss
capa
city o
f 365
MW
in M
ehm
ood
Kot,
Muz
affa
rgar
h, P
unjab
, Pak
istan
.
18.4
.6
The
princ
ipal
activ
ity o
f Nish
at E
nerg
y Lim
ited
is to
buil
d, o
wn, o
pera
te a
nd m
ainta
in co
al po
wer s
tatio
n ha
ving
gros
s ca
pacit
y of 6
60 M
W w
ith n
et e
stim
ated
gen
erat
ion c
apac
ity o
f 600
MW
at M
ouza
Am
eer P
ur, R
ahim
Yar
Kha
n, P
unjab
, Pak
istan
.
18.4
.7
The
princ
ipal
activ
ity o
f Nish
at H
otels
and
Pro
perti
es L
imite
d is
to e
stab
lish
and
man
age
shop
ping
mall
and
hot
el op
erat
ions
in Pa
kista
n.
18
.4.8
Th
e pr
incip
al ac
tivity
of H
yund
ai Ni
shat
Mot
or (P
rivat
e) L
imite
d is
to im
port,
ass
embl
y and
dist
ribut
ion o
f bot
h pa
ssen
ger a
nd c
omm
ercia
l cat
egor
y aut
omob
iles.
18.4
.9
The
princ
ipal
activ
ity o
f San
ifa A
gri S
ervic
es L
imite
d is
to p
rodu
ce a
nd m
arke
t high
qua
lity c
otto
n se
eds
in Pa
kista
n.
18
.4.1
0 Th
e pr
incip
le ac
tivity
of S
ecur
ity G
ener
al In
sura
nce
Com
pany
Lim
ited
is to
pro
vide
gene
ral in
sura
nce
serv
ices
in sp
here
s of
fire,
mar
ine, m
otor
and
misc
ellan
eous
.
18.4
.11
The
princ
ipal
activ
ity o
f Nish
at S
utas
Dair
y Lim
ited
is to
man
ufac
ture
, pro
duce
, dist
ribut
e, m
arke
t, ac
quire
, pro
cess
, pac
kage
, sell
, res
ell, im
port,
exp
ort,
pres
erve
, dee
p fre
eze
and
othe
rwise
dea
l in a
ll typ
es a
nd k
inds
of m
ilk a
nd d
airy b
ased
pro
duct
s.
*N
o qu
oted
pric
e av
ailab
le.
D. G
. Kha
n Ce
men
tCo
mpa
ny Li
mite
d
18.2
Re
conc
iliat
ion
of in
vest
men
ts in
ass
ocia
tes
unde
r equ
ity m
etho
d:
Nish
at P
aper
Pro
duct
sCo
mpa
ny Li
mite
dNi
shat
Dair
y(P
rivat
e) Lim
ited
Lalpi
r Pow
er Li
mite
dPa
kgen
Pow
er Li
mite
dNi
shat
Ene
rgy L
imite
dSe
curit
y Gen
eral
Insur
ance
Comp
any L
imite
dSa
nifa A
gri
Serv
ices L
imite
dNi
shat
Sut
asDa
iry Li
mite
dNi
shat
Hot
els an
dPr
oper
ties L
imite
d
2022
2021
2021
2021
2021
2021
2021
2021
2021
2022
2022
2022
2022
2022
2022
Hyun
dai N
ishat
Mot
or(P
rivat
e) Lim
ited
2021
2022
2022
2022
2021
(Rup
ees i
n tho
usan
d)
2022
2021
Tota
l
2022
2021
Co
st 3,
418,1
45
3,418
,145
116,3
42
116,3
42
600,0
00
600,0
00
1,640
,306
1,640
,306
1,272
,194
1,272
,194
5,000
5,0
00
740,2
29
740,2
29
1,187
,899
1,187
,899
115,9
16
65,91
6 1,9
77,02
8 1,9
77,02
8 1,4
42,54
9 16
6,300
12
,515,6
08
11,18
9,359
Sh
are o
f pos
t acq
uisiti
on re
serv
es:
As
at 01
July
20,26
5,250
18
,119,4
63
395,3
14
264,8
74
(293,2
32)
(284
,490)
3,37
3,019
3,1
58,46
0 5,1
71,13
0 4,5
98,52
3 (3,
314)
(3,31
4) (18
3,807
) (2
86,15
4) (37
8,689
) (2
87,33
0) (65
,916)
(65,9
16)
130,9
84
- (48
,618)
- 28
,362,1
21
25,21
4,116
Sh
are of
profi
t / (lo
ss) a
fter in
come
tax
933,2
49
1,168
,480
72,91
5 13
1,247
21
,448
(8,74
2) 10
6,024
57
0,014
36
3,184
90
4,091
-
- 56
,080
18,68
7 24
9,510
(91
,359)
(50,0
00)
- 14
2,960
16
2,684
(2
04,05
3) (4
8,618
) 1,
691,3
17
2,806
,484
Pr
ior ye
ar ad
justm
ents
relati
ng to
profi
t or lo
ss
- -
- -
- -
- -
- -
- -
4,589
42
,038
(28,4
59)
- -
- -
- -
- (23
,870)
42,03
8
Adjus
tmen
t due
to de
emed
disp
osal
of eq
uity
a
ccou
nted i
nves
tee
- -
- -
- -
- -
- -
- -
- 41
,622
- -
- -
- -
- -
- 41
,622
Sh
are of
othe
r com
prehe
nsive
inco
me / (
loss)
(1,91
3,448
) 97
7,307
(12
,897)
(807
) -
- (1,
399)
72
(858
) 1,7
20
- -
- -
- -
- -
(478,0
06)
19,43
1 -
- (2
,406,6
08)
997,7
23
Prior
year
adjus
tmen
ts rel
ating
to ot
her
c
ompre
hens
ive in
come
-
- -
- -
- -
- -
- -
- -
- -
- -
- 49
3,445
-
- -
493,4
45
-
Divide
nd re
ceive
d (1
37,57
4) -
(17,4
52)
- -
- (21
8,787
) (3
55,52
7) (2
05,05
0) (33
3,204
) -
- -
- -
- -
- (5
1,131
) (51
,131)
- -
(629,9
94)
(739
,862)
As
at 30
June
(1
,117,7
73)
2,145
,787
42,56
6 13
0,440
21
,448
(8,74
2) (1
14,16
2) 21
4,559
15
7,276
57
2,607
-
- 60
,669
102,3
47
221,0
51
(91,3
59)
(50,00
0) -
107,2
68
130,9
84
(204,0
53)
(48,6
18)
(875
,710)
3,148
,005
19,14
7,477
20
,265,2
50
437,8
80
395,3
14
(271,7
84)
(293
,232)
3,25
8,857
3,3
73,01
9 5,3
28,40
6 5,1
71,13
0 (3,
314)
(3,31
4) (12
3,138
) (1
83,80
7) (15
7,638
) (3
78,68
9) (1
15,91
6) (6
5,916
) 23
8,252
13
0,984
(2
52,67
1) (4
8,618
) 27
,486,4
11
28,36
2,121
Im
pairm
ent lo
ss
- -
- -
- -
- -
- -
(1,68
6) (1
,686)
- -
- -
- -
- -
- -
(1,68
6) (1,
686)
As
at 30
June
22
,565,6
22
23,68
3,395
55
4,222
51
1,656
32
8,216
30
6,768
4,8
99,16
3 5,0
13,32
5 6,6
00,60
0 6,4
43,32
4 -
- 61
7,091
55
6,422
1,0
30,26
1 80
9,210
-
- 2,2
15,28
0 2,1
08,01
2 1,1
89,87
8 11
7,682
40
,000,3
33
39,54
9,794
18.2.
1 Su
mmar
ized s
tatem
ent o
f fina
ncial
posit
ion
Cu
rrent
asse
ts
40,81
3,163
36
,851,2
64
2,902
,690
4,371
,178
970,6
79
658,4
96
19,92
1,651
19
,943,0
86
25,81
2,744
20
,692,1
61
47
47
4,381
,636
5,308
,085
23,17
7,537
12
,792,1
45
127,6
42
188,1
62
- -
872,6
44
280,3
76
Non-c
urren
t ass
ets
95,74
8,850
10
1,043
,433
1,528
,306
1,571
,757
2,778
,897
2,664
,456
5,211
,498
6,329
,438
4,839
,774
5,530
,199
- -
22,78
6,064
22
,463,8
04
18,26
3,684
15
,127,4
80
155,1
59
124,3
76
- -
3,069
,359
303,5
14
Total
asse
ts
136,5
62,01
3 13
7,894
,697
4,430
,996
5,942
,935
3,749
,576
3,322
,952
25,13
3,149
26
,272,5
24
30,65
2,518
26
,222,3
60
47
47
27,16
7,700
27
,771,8
89
41,44
1,221
27
,919,6
25
282,8
01
312,5
38
21,91
5,700
28
,126,7
27
3,942
,003
583,8
90
Curre
nt liab
ilities
46
,089,0
31
40,29
5,520
1,5
77,06
1 3,1
22,72
8 70
4,658
68
5,045
8,0
92,61
9 8,8
18,47
2 6,6
86,61
9 2,8
08,16
7 30
0 22
5 2,0
60,39
3 3,4
09,52
6 19
,330,0
69
11,32
7,001
33
0,422
36
8,488
-
- 25
5,322
6,1
36
Non-c
urren
t liab
ilities
20
,554,8
80
24,12
1,304
63
7,799
77
4,345
38
4,131
15
2,352
29
,557
46,68
8 5,
754
25,04
2 -
- 15
,054,5
34
15,30
8,086
13
,525,6
41
9,849
,211
148,4
59
19,86
1 -
- 1,3
84,80
8 -
To
tal lia
bilitie
s 66
,643,9
11
64,41
6,824
2,2
14,86
0 3,8
97,07
3 1,0
88,78
9 83
7,397
8,1
22,17
6 8,
865,1
60
6,692
,373
2,833
,209
300
225
17,11
4,927
18
,717,6
12
32,85
5,710
21
,176,2
12
478,8
81
388,3
49
7,166
,722
14,09
2,026
1,6
40,13
0 6,1
36
Share
depo
sit m
oney
-
- -
- -
- -
- -
- -
- -
- -
- -
- -
- 3
236,2
38
Ne
t ass
ets
69,91
8,102
73
,477,8
73
2,216
,136
2,045
,862
2,660
,787
2,485
,555
17,01
0,973
17
,407,3
64
23,96
0,145
23
,389,1
51
(253
) (1
78)
10,05
2,773
9,0
54,27
7 8,5
85,51
1 6,7
43,41
3 (19
6,080
) (7
5,811
) 14
,748,9
78
14,03
4,701
2,3
01,87
0 34
1,516
Re
conc
iliatio
n to c
arry
ing am
ount
s:
As
at 01
July
73
,477,8
73
66,64
4,157
2,0
45,86
2 1,5
24,10
4 2,4
85,55
5 2,5
57,12
1 17
,407,3
64
16,66
2,372
23
,389,1
51
21,31
0,535
(17
8) (10
3) 9,0
54,27
7 6,
051,1
85
6,743
,413
5,492
,438
(75,81
1) (1
,306)
14,03
4,701
13
,162,5
25
341,5
16
428,2
78
Prior
year
adjus
tmen
ts
- -
- -
- (14
1) -
- -
- -
- 92
2,974
1,7
50,64
5 (23
7,148
) -
- -
3,285
,252
- -
-
Trans
actio
ns w
ith ow
ners
in the
ir cap
acity
as ow
ners
-
- -
- -
- -
- -
- -
- -
1,000
,000
- 2,0
12,30
0 15
2,244
-
- -
2,552
,498
-
Prof
it / (lo
ss) a
fter in
come
tax
2,972
,132
3,721
,273
291,6
65
524,9
87
175,2
32
(71,42
5) 36
8,143
1,9
79,21
8 1,3
18,27
2 3,2
81,63
9 (75
) (75
) 75
,522
252,4
47
2,079
,246
(761
,325)
(272
,513)
(74,50
5) 95
1,799
1,0
83,11
5 (59
2,144
) (8
6,762
)
Othe
r com
prehe
nsive
inco
me / (
loss)
(6,09
3,784
) 3,1
12,44
3 (51
,586)
(3,22
9) -
- (4
,856)
250
(3,11
4) 6,2
43
- -
- -
- -
- -
(3,18
2,462
) 12
9,373
-
-
Divid
end p
aid
(438,1
19)
- (69
,805)
- -
- (7
59,67
8) (1
,234,4
76)
(744
,164)
(1,20
9,266
) -
- -
- -
- -
- (34
0,312
) (34
0,312
) -
-
As a
t 30 J
une
69,91
8,102
73
,477,8
73
2,216
,136
2,045
,862
2,660
,787
2,485
,555
17,01
0,973
17
,407,3
64
23,96
0,145
23
,389,1
51
(253)
(178)
10,05
2,773
9,0
54,27
7 8,
585,5
11
6,743
,413
(196
,080)
(75,81
1) 14
,748,9
78
14,03
4,701
2,3
01,87
0 34
1,516
Gr
oup's
share
(%)
31.40
% 31
.40%
25.00
% 25
.00%
12.24
% 12
.24%
28.80
% 28
.80%
27.55
% 27
.55%
37.75
% 37
.75%
6.08%
6.0
8%
12.00
% 12
.00%
33.12
% 33
.33%
15.02
% 15
.02%
47.53
% 34
.46%
Gr
oup's
share
21
,954,2
30
23,07
2,003
55
4,033
51
1,467
32
5,698
30
4,250
4,8
99,16
3 5,
013,3
25
6,600
,600
6,443
,324
- -
610,8
11
550,1
42
1,030
,261
809,2
10
- -
2,215
,280
2,10
8,012
1,0
94,07
9 11
7,682
Go
odwi
ll 61
1,392
61
1,392
18
9 18
9 2,5
18
2,518
-
- -
- -
- 6,2
80
6,280
-
- -
- -
- 95
,799
-
Carry
ing am
ount
22
,565,6
22
23,68
3,395
55
4,222
51
1,656
32
8,216
30
6,768
4,
899,1
63
5,013
,325
6,600
,600
6,443
,324
- -
617,0
91
556,4
22
1,030
,261
809,2
10
- -
2,215
,280
2,108
,012
1,189
,878
117,6
82
18.2.
2 Su
mmar
ized s
tatem
ent o
f com
preh
ensiv
e inc
ome
Re
venu
e
58,04
3,863
45
,107,6
90
3,070
,167
3,979
,518
2,826
,376
2,026
,538
33,03
4,775
15
,106,5
83
41,54
9,392
13
,475,0
15
- -
6,156
,352
6,075
,016
54,20
5,320
21
,804,9
42
306,2
17
256,2
11
926,4
63
867,7
21
333,5
58
-
Pr
ofit /
(loss
) for th
e peri
od
2,972
,132
3,721
,273
291,6
65
524,9
87
175,2
32
(71,4
25)
368,1
43
1,979
,218
1,318
,272
3,281
,639
(75)
(75)
75,52
2 25
2,447
2,0
79,24
6 (76
1,325
) (27
2,513
) (7
4,505
) 95
1,799
1,0
83,11
5 (5
92,14
4) (86
,762)
Ot
her c
ompre
hens
ive in
come
/ (los
s)
(6,09
3,784
) 3,1
12,44
3 (51
,586)
(3,22
9) -
- (4,
856)
250
(3,11
4) 6,2
43
- -
- -
- -
- -
(3,18
2,462
) 12
9,373
-
-
Total
comp
rehen
sive i
ncom
e / (lo
ss)
(3,12
1,652
) 6,
833,7
16
240,0
79
521,7
58
175,2
32
(71,4
25)
363,2
87
1,979
,468
1,315
,158
3,287
,882
(75)
(75)
75,52
2 25
2,447
2,0
79,24
6 (76
1,325
) (27
2,513
) (7
4,505
) (2
,230,6
63)
1,212
,488
(592,1
44)
(86,76
2)
Div
idend
rece
ived f
rom as
socia
tes
137,5
74
- 17
,452
- -
- 21
8,787
35
5,527
20
5,050
33
3,204
-
- -
- -
- -
- 51
,131
51,13
1 -
-
18.3
Adam
jee In
suran
ce C
ompa
ny Li
mited
and M
CB B
ank L
imite
d are
asso
ciated
comp
anies
due t
o com
mon d
irecto
rship.
18.4
Inter
ests
in as
socia
tes
Nishat Mills Limited and its Subsidiaries
194 Page
For the year ended June 30, 2022Notes to the Consolidated Financial Statements

2022 2021 Note (Rupees in thousand)
19 LONG TERM LOANS
Considered good: Executives - secured 19.1 & 19.2 388,995 441,035 Other employees - secured 19.2 238,127 270,603 627,122 711,638
Less: Current portion shown under current assets 23 Executives 85,901 97,851 Other employees 70,081 81,246 155,982 179,097 471,140 532,541
19.1 Maximum aggregate balance due from executives at the end of any month during the year was Rupees 469.580 million (2021: Rupees 445.436 million).
19.2 These represent house construction and motor vehicle loans given to executives and employees of the Holding Company, Nishat Linen (Private) Limited - Subsidiary Company and Nishat Power Limited - Subsidiary Company and are secured against balance to the credit of employee in the provident fund trusts of the respective Group companies and against registration of cars in the joint name of the respective Group companies and the employee. These are recoverable in equal monthly installments. Interest charged during the year range from 0% to 4% (2021: 0% to 4%) per annum on the balance outstandings.
19.3 The fair value adjustment in accordance with the requirements of IFRS 9 'Financial Instruments' arising in respect of staff loans is not considered material and hence not recognized.
20 STORES, SPARE PARTS AND LOOSE TOOLS
2022 2021 Note (Rupees in thousand)
Stores 20.1 3,069,511 1,798,256 Spare parts 1,879,347 1,497,981 Loose tools 17,044 15,618 4,965,902 3,311,855Less: Provision for slow moving, obsolete and damaged store items 20.2 (4,141) (4,141) 4,961,761 3,307,714
20.1 This includes stores in transit of Rupees 314.474 million (2021: Rupees 276.755 million).
20.2 Provision for slow moving, obsolete and damaged store items
2022 2021 Note (Rupees in thousand)
Balance as on 01 July 4,141 4,218 Less: Provision reversed during the year 35 - (77) Balance as on 30 June 4,141 4,141
Annual Report 2022
195Page

2022 2021 Note (Rupees in thousand)
21 STOCK IN TRADE
Raw materials 24,309,799 13,129,823 Work in process 21.2 6,364,578 3,044,441
Finished goods 21.5 12,514,128 9,641,809 Less: Provision for slow moving and obsolete stocks (21,065) (21,065) 12,493,063 9,620,744 43,167,440 25,795,008
21.1 Stock in trade of Rupees 807.814 million (2021: Rupees 605.335 million) is being carried at net realizable value.
21.2 This includes stock of Rupees 22.763 million (2021: Rupees 17.961 million) sent to outside parties for processing.
21.3 Stock in trade includes stock in transit of Rupees 3,194.415 million (2021: Rupees 2,215.892 million).
21.4 The aggregate amount of write-down of inventories to net realizable value recognized as an expense during the year was Rupees 8.876 million (2021: Rupees 22.249 million).
21.5 Finished goods include stock of Rupees 707.640 million (2021: Rupees 705.532 million) which is in the possession of stockists of Nishat Linen (Private) Limited - Subsidiary Company.
2022 2021 Note (Rupees in thousand)
22 TRADE DEBTS
Considered good:
Secured 13,035,506 20,013,100 Unsecured: - Related parties 22.2, 22.3 & 22.4 5,178 6,851 - Other 22.5 10,331,556 7,119,480 23,372,240 27,139,431 Less: Allowance for expected credit losses 22.7 (45,363) (28,237) 23,326,877 27,111,194
22.1 Types of counterparties
Export Corporate 5,734,469 4,050,897 Other 206,454 18,859 5,940,923 4,069,756
Local Corporate 16,164,787 22,467,750 Other 1,266,530 601,925 17,431,317 23,069,675 23,372,240 27,139,431
Nishat Mills Limited and its Subsidiaries
196 Page
For the year ended June 30, 2022Notes to the Consolidated Financial Statements

2022 2021 (Rupees in thousand)
22.2 This represents amount due from following related parties:
Adamjee Insurance Company Limited - associated company - 16 Hyundai Nishat Motor (Private) Limited - associated company 1,630 547 Adamjee Life Assurance Company Limited - associated company 37 18 Nishat Hotels and Properties Limited - associated company - 2,926 MCB Bank Limited - associated company 1,359 70 MCB Islamic Bank Limited - related party 1,565 - Nishat Dairy (Private) Limited - associated company 166 - Nishat Sutas Dairy limited - associated company 360 - Nishat (Chunian) Limited - related party 61 3,274 5,178 6,851
22.3 The maximum aggregate amount receivable from related parties at the end of any month during the year was as follows:
2022 2021 (Rupees in thousand)
Adamjee Insurance Company Limited - associated company 134 234 Hyundai Nishat Motor (Private) Limited - associated company 3,973 4,833 Adamjee Life Assurance Company Limited - associated company 36 72 Nishat Hotels and Properties Limited - associated company 7,085 1,327 MCB Bank Limited - associated company 7 1,190 MCB Islamic Bank Limited - related party 1,565 - Nishat Dairy (Private) Limited - associated company 165 - D.G. Khan Cement Company Limited - associated company 73 - Nishat Sutas Dairy Limited - associated company 360 - Nishat (Chunian) Limited - related party 3,832 36,736
22.4 As at 30 June 2022, trade debts due from related parties amounting to Rupees 2.006 million (2021: Rupees 0.543 million) were pas due but not impaired. The ageing analysis of these trade debts is as follows:
2022 2021 (Rupees in thousand)
Upto 1 month - 525 1 to 6 months 2,004 16 More than 6 months 2 2 2,006 543
Annual Report 2022
197Page

22.5 Trade receivables of Nishat Power Limited - Subsidiary Company from CAPP-G are considered good. These are secured by a guarantee from the Government of Pakistan under the Implementation Agreement and are in the normal course of business and interest free, however, a delayed payment mark-up at the rate of three months KIBOR plus 4.5% per annum is charged in case the amounts are not paid within due dates. The rate of delayed payment mark-up charged during the year on outstanding amounts ranged from 11.53% to 19.49% (2021: 11.53% to 18.42%) per annum. Trade debts include unbilled receivables of Rupees 4,574.509 million (2021: Rupees 3,533.134 million).
22.6 Trade debts of Nishat Power Limited - Subsidiary Company was included an amount of Rupees 816.033 million relating to capacity revenue not acknowledged by NTDC / CPPA -G and the Nishat Power Limited - Subsidiary Company had contested it at various forums including arbitration in the London Court of International Arbitration (LCIA).
On 29 October 2017, the Arbitrator declared his Final Award whereby he ordered NTDC / CPPA-G to pay certain amounts to Nishat Power Limited - Subsidiary Company. Thereafter, on 29 November 2017, Nishat Power Limited - Subsidiary Company filed an application before Lahore High Court for implementation / enforcement of Final Award that is pending adjudication.
On 12 February 2021, as part of the PPA Amendment Agreement as referred to in note 1(a) to these consolidated financial statements, the CPPA-G and Nishat Power Limited - Subsidiary Company settled the dispute through the extension period of 68 days treated as "other force majeure event" (OFME) under the PPA. Further, CPPA-G agreed to make certain payments to the Nishat Power Limited - Subsidiary Company, subject to certain terms, as compensation of the withheld capacity payments. In return, Nishat Power Limited - Subsidiary Company agreed to forgo certain amounts declared under the Final Award as enumerated above. Further, subject to fulfillment of certain conditions, Nishat Power Limited - Subsidiary Company and CPPA-G agreed to file a joint application before the Lahore High Court for the withdrawal of the enforcement proceedings before the Honorable Lahore High Court.
On 30 June 2021, out of the recognised recongized receivable of Rupees 816.033 million, Nishat Power Limited - Subsidiary Company had written off aggregating Rupees 141.47 million. During the year, pursuant to the provisions of PPA Amendment Agreement as mentioned above the remaining receivables amounts of Rupees 674.563 million have been paid by the CPPA-G.
2022 2021 (Rupees in thousand)
22.7 Allowance for expected credit losses
Opening balance 28,237 30,590
Add / (Less): Allowance for / (reversal of) expected credit losses 34 & 35 17,126 (2,353) 45,363 28,237
Nishat Mills Limited and its Subsidiaries
198 Page
For the year ended June 30, 2022Notes to the Consolidated Financial Statements

2022 2021 Note (Rupees in thousand)
23 LOANS AND ADVANCES Considered good:
Employees - interest free: – Executives 5,045 990 – Other employees 24,294 10,801 29,339 11,791 Current portion of long term loans 19 155,982 179,097 Advances to suppliers 23.1 647,745 449,356 Letters of credit 3,321 4,586 Other advances 23.1 482,855 340,845 Advance to Sanifa Agri Services Limited - associated company 23.2 - 104,300 1,319,242 1,089,975
Considered doubtful:
Advance to Sanifa Agri Services Limited - associated company 23.2 121,500 - Others 108 108 Less: Expected credit loss against doubtful advances 23.3 (121,608) (108) - - 1,319,242 1,089,975
23.1 These include amounts due from following related parties. These are neither past due nor impaired:
2022 2021 (Rupees in thousand)
Advances to suppliers Security General Insurance Company Limited - associated company 300 - D.G. Khan Cement Company Limited - associated company - 3,533
Other advances Nishat Hotels and Properties Limited - associated company 44 -
23.2 This represents unsecured amount advanced to Sanifa Agri services Limited - associated company for a period of one year. This advance carries markup at the rate ranging from 8.95% to 13.39% (2021: 8.53% to 12.69%) per annum. During the year, expected credit loss against this advance has been recognised. The maximum aggregate amount advanced to associated company at the end of any month during the year was Rupees 180.600 million (2021: 104.300 million).
2022 2021 (Rupees in thousand)
23.3 Expected credit loss against doubtful loans and advances
Opening balance 108 108 Add: Recognised during the year 34 121,500 -
121,608 108
Annual Report 2022
199Page

2022 2021 (Rupees in thousand)
24 ADVANCE INCOME TAX - NET Advance income tax 3,108,415 2,235,684 Provision for taxation (2,932,684) (1,181,385) 175,731 1,054,299
25 SHORT TERM DEPOSITS AND PREPAYMENTS
Deposits 144,746 59,409 Prepayments 207,419 132,262 352,165 191,671
26 OTHER RECEIVABLES
Considered good:
Export rebate and claims 211,880 124,772 Duty drawback 363,950 1,218,043 Sales tax refundable 26.1 9,471,711 3,307,061 Fair value of forward exchange contracts 57,518 8,672 Workers' profit participation fund receivable 26.2 315,609 583,636 Workers' welfare fund receivable 217,494 151,035 Receivable from employees' provident fund trust 63,081 - Miscellaneous receivables 26.3 114,150 38,136 10,815,393 5,431,355
26.1 This includes sales tax claimable by Nishat Hospitality (Private) Limited - Subsidiary Company from Federal Board of Revenue ('FBR') of Rupees 4.39 million (2021: Rupees 4.39 million), however the same couldn't be claimed as Nishat Hospitality (Private) Limited - subsidiary company now files return with Punjab Revenue Authority ('PRA'). The matter of transfer of balance to PRA is still under negotiation with FBR and the Nishat Hospitality (Private) Limited - subsidiary company's tax consultant are confident that the amount will be adjusted in due course, therefore no provision has been recognized against the above amount in these consolidated financial statements.
26.2 Under section 9.3(a) of the Power Purchase Agreement (PPA) between Nishat Power Limited - Subsidiary
Company and NTDCL, payments to Workers' Profit Participation Fund are recoverable from NTDCL as a pass through item.
26.3 These include receivable from Security General Insurance Company Limited - associated company on
account of insurance claim amounting to Rupees 23.960 million (2021: Rupees Nil)
2022 2021 Note (Rupees in thousand)
27 ACCRUED INTEREST Accrued interest 27.1 4,394 13,659
Nishat Mills Limited and its Subsidiaries
200 Page
For the year ended June 30, 2022Notes to the Consolidated Financial Statements

27.1 This includes interest receivable from Sanifa Agri Services Limited - associated company amounting to Rupees 4.089 million (2021: Rupees 2.095 million). This is neither past due nor impaired. The maximum aggregate amount receivable from related party at the end of any month during the year was Rupees 10.900 million (2021: Rupees 2.095 million).
2022 2021 Note (Rupees in thousand)
28 SHORT TERM INVESTMENTS
At amortized cost
Investment in Riba Free Certifcate 28.1 1,600 - Investment in Term Deposit Receipts 28.2 31,010 -
At fair value through profit or loss (FVTPL) Pakistan Investment Bonds 28.3 2,850,550 - Government Ijara Sukuk 28.4 2,850,549 - 5,733,709 -
28.1 This represents Riba Free Certifcate with maturity period of 6 months and carrying profit at the rate of 4.42% per annum.
28.2 This represents term deposit receipts with maturity period of 6 months and carrying profit at the rate of
14.50% per annum. 28.3 This represents investment in Pakistan Investment Bonds (PIBs) having face value of Rupees 2,836.00
million. Profit is receivable on half yearly basis, with coupon rate of annualized weighted average yield of 6 months T-bills + 0.70% per annum. These PIBs' issue date is 18 June 2020 having a term of ten years and are maturing on 18 June 2030.
28.4 This represents investment in Government of Pakistan Ijara Sukus Bonds (GISs) having face value of
Rupees 2,784.50 million. Proft is receivable on half yearly basis, with coupon rate of average yield of 6-months T-bills. These GISs' issue date is 27 April 2022 having a term of five years and are maturing on 27 April 2027.
2022 2021 Note (Rupees in thousand)
29 CASH AND BANK BALANCES With banks: On current accounts 29.1 & 29.2 Including US$ 223,486 (2021: US$ 233,398) and UAE Dirhams 16,893,110 (2021: UAE Dirhams 13,381,880) 1,042,880 1,209,586 Term deposit receipts 29.1 & 29.3 - 5,104,500 On PLS saving accounts 29.1 & 29.4 Including US$ 117 (2021: US$ 117) 656,260 34,281 1,699,140 6,348,367 Cash in hand Including UAE Dirhams 327,454 (2021: UAE Dirhams 485,897) 59,676 49,631 1,758,816 6,397,998
Annual Report 2022
201Page

29.1 Cash at banks includes balance of Rupees 1,343.317 million (2021: Rupees 5,128.271 million) with MCB Bank Limited - associated company.
29.2 Cash at banks includes balance of Rupees 0.227 million (2021: Rupees 0.705 million) with MCB Islamic Bank Limited - related party.
29.3 These represent term deposit receipts of Rupees Nil (2021: Rupees 5,075 million) with maturity period of 30 days and carried profit at the rate of 6.80% (2021: 6.80%) per annum with MCB Bank Limited - associated company. Term deposits receipts of one month maturity period with other banking companies which have matured during the year carried profit at the rate of 12.85% (2021: 6.35% to 7.20%) per annum.
29.4 Rate of profit on Pak Rupees bank deposits ranges from 1.25% to 13.25% (2021: 5.50% to 7.00%) per annum.
2022 2021 Note (Rupees in thousand)
30 REVENUE
Revenue from contracts with customers: -Export sales 75,857,818 47,467,270 -Local sales 30.1 88,706,402 55,599,701 -Processing income 30.2 720,933 636,300 165,285,153 103,703,271 Export rebate 397,036 228,790 Duty drawback 14,818 795,397 165,697,007 104,727,458
30.1 Local sales
Sales 30.1.1 104,646,544 66,241,618 Less: Sales tax (13,278,558) (8,147,069) Less: Discount (2,661,584) (2,494,848) 88,706,402 55,599,701
30.1.1 These include sale of Rupees 18,970.538 million (2021: Rupees 12,865.817 million) made to direct exporters against standard purchase orders (SPOs). Further, local sales includes waste sale of Rupees 3,157.189 million (2021: Rupees 2,738.545 million).
2022 2021 (Rupees in thousand)
30.2 Processing Income
Sales 843,492 744,471 Less: Sales tax (122,559) (108,171) 720,933 636,300
Nishat Mills Limited and its Subsidiaries
202 Page
For the year ended June 30, 2022Notes to the Consolidated Financial Statements

(Rup
ees
in th
ousa
nd)
Tota
l - G
roup
2022
2021
Roo
m R
enta
lSe
rvic
es
2022
2021
Pow
er G
ener
atio
n
2022
2021
Gar
men
ts
2022
2021
Hom
e Te
xtile
and
Terr
y20
2220
21
Dye
ing
2022
2021
Wea
ving
2022
2021
Spin
ning
Des
crip
tion
2022
2021
Oth
er H
otel
Anci
llary
Ser
vice
s
2022
2021
Reg
ion
Eu
rope
39
0,08
4 2
80,0
73
16,
614,
626
8,2
97,8
97
552
,631
4
07,5
66
11,
827,
779
9,1
63,9
02
5,0
88,7
22
4,2
59,1
44
- -
- -
- -
34,
473,
842
22,
408,
582
Amer
ica
597
,876
1
11,3
51
919
,817
6
66,9
98
8,0
91
14,
967
3,8
18,6
58
3,2
72,9
02
8,5
65,6
34
3,6
00,5
89
- -
- -
- -
13,
910,
076
7,6
66,8
07As
ia, A
frica
, Aus
tralia
7,
120,
649
4,2
99,1
39
2,2
32,9
82
2,0
45,8
55
14,
952,
303
7,7
65,3
54
3,0
49,4
57
3,9
68,5
23
530
,363
3
37,1
97
- -
- -
- -
27,
885,
754
18,
416,
068
Paki
stan
3
7,21
8,58
8 2
5,69
5,28
4 6
,441
,604
5
,585
,355
6
,453
,778
3
,456
,312
1
4,80
1,12
8 9
,554
,104
2
03,9
71
167
,945
2
3,78
7,13
1 1
1,48
6,32
1 4
12,4
75
246
,322
1
08,6
60
44,
358
89,
427,
335
56,
236,
001
45
,327
,197
30
,385
,847
26
,209
,029
16
,596
,105
21
,966
,803
11
,644
,199
33
,497
,022
25
,959
,431
14
,388
,690
8,
364,
875
23,7
87,1
31
11,4
86,3
21
412,
475
246,
322
108,
660
44,3
58
165,
697,
007
104,
727,
458
Ti
min
g of
reve
nue
reco
gniti
on
Prod
ucts
and
ser
vice
s tra
nsfe
rred
at a
poi
nt in
tim
e 4
5,32
7,19
7 30
,385
,847
26
,209
,029
16
,596
,105
21
,966
,803
11
,644
,199
33
,497
,022
25
,959
,431
14
,388
,690
8,
364,
875
20,9
87,3
59
8,84
7,61
4 41
2,47
5 24
6,32
2 10
8,66
0 44
,358
16
2,89
7,23
5 10
2,08
8,75
1
Prod
ucts
and
ser
vice
s tra
nsfe
rred
over
tim
e -
- -
- -
- -
- -
- 2
,799
,772
2
,638
,707
-
- -
- 2
,799
,772
2
,638
,707
45,
327,
197
30,3
85,8
47
26,2
09,0
29
16,5
96,1
05
21,9
66,8
03
11,6
44,1
99
33,4
97,0
22
25,9
59,4
31
14,3
88,6
90
8,36
4,87
5 23
,787
,131
11
,486
,321
41
2,47
5 2
46,3
22
108,
660
44,3
58
165
,697
,007
1
04,7
27,4
58
Maj
or p
rodu
cts
/ ser
vice
line
s
Yarn
4
4,66
5,04
6 29
,621
,073
-
- -
- -
- -
- -
- -
- -
- 4
4,66
5,04
6 2
9,62
1,07
3C
ombe
r Noi
l 1
72,3
61
233,
809
- -
- -
- -
- -
- -
- -
- -
17
2,36
1 2
33,8
09G
rey
Clo
th
- -
26,
209,
029
16,5
96,1
05
- -
23,
116
1,1
99
- -
- -
- -
- -
26,
232,
145
16,
597,
304
Proc
esse
d C
loth
-
- -
- 2
1,96
6,80
3 1
1,64
4,19
9 8
,217
,991
2
2,64
5,19
9 -
- -
- -
- -
-
30,1
84,7
94
34,
289,
398
Cos
met
ics
- -
- -
- -
170
,621
1
59,3
88
- -
- -
- -
- -
170
,621
1
59,3
88W
aste
4
89,7
90
530
,965
-
- -
-
173,
984
121
,728
-
- -
- -
- -
- 6
63,7
74
652
,693
Oth
ers
- -
- -
- -
37,
482
249
,155
-
- -
- -
- -
- 3
7,48
2 2
49,1
55M
ade
Ups
-
- -
- -
-
21,5
83,8
36
1,7
59,3
28
- -
- -
- -
- -
21,
583,
836
1,7
59,3
28G
arm
ents
-
- -
- -
- -
- 1
4,38
8,69
0 8
,364
,875
-
- -
- -
- 1
4,38
8,69
0 8
,364
,875
Tow
els
and
Bath
Rob
e -
- -
- -
- 3
,289
,992
1
,023
,434
-
- -
- -
- -
-
3,28
9,99
2 1
,023
,434
Elec
trici
ty
- -
- -
- -
- -
- -
23,
787,
131
11,
486,
321
- -
- -
23
,787
,131
1
1,48
6,32
1Ro
om R
enta
l Ser
vice
s
- -
- -
- -
- -
- -
- -
412
,475
2
46,3
22
- -
41
2,47
5 2
46,3
22O
ther
Hot
el A
ncilla
ry S
ervi
ces
-
- -
- -
- -
- -
- -
- -
- 1
08,6
60
44,3
58
108
,660
4
4,35
8
45,
327,
197
30,3
85,8
47
26,2
09,0
29
16,5
96,1
05
21,9
66,8
03
11,6
44,1
99
33,4
97,0
22
25,9
59,4
31
14,3
88,6
90
8,36
4,87
5 23
,787
,131
11
,486
,321
41
2,47
5 24
6,32
2 10
8,66
0 44
,358
16
5,69
7,00
7 10
4,72
7,45
8
30.3
Th
e am
ount
of R
upee
s 1,
055.
300
milli
on in
clud
ed in
con
tract
liab
ilitie
s (N
ote
9) a
t 30
June
202
1 ha
s be
en re
cogn
ised
as
reve
nue
in 2
022
(202
1: R
upee
s 56
1.74
6 m
illion
).
30.4
D
isag
greg
atio
n of
reve
nue
from
con
trac
ts w
ith c
usto
mer
s
In th
e fo
llow
ing
tabl
e, re
venu
e fro
m c
ontra
cts
with
cus
tom
ers
is d
isag
greg
ated
by
prim
ary
geog
raph
ical
mar
ket,
maj
or p
rodu
cts
and
serv
ice
lines
and
tim
ing
of re
venu
e re
cogn
ition
:
30.5
Re
venu
e is
mai
nly
reco
gnis
ed a
t poi
nt in
tim
e as
per
the
term
s an
d co
nditi
ons
of u
nder
lyin
g co
ntra
cts
with
cus
tom
ers.
Annual Report 2022
203Page

2022 2021 Note (Rupees in thousand)
31 COST OF SALES
Raw materials consumed 100,860,999 56,873,417 Processing charges 1,220,083 782,206 Salaries, wages and other benefits 31.1 10,587,611 8,393,421 Stores, spare parts and loose tools consumed 10,475,455 7,822,218 Packing materials consumed 2,555,698 1,936,572 Repair and maintenance 743,088 490,681 Fuel and power 11,003,340 6,131,769 Insurance 353,409 341,551 Other factory overheads 1,165,184 762,165 Depreciation and amortization 15.1.2 4,047,071 3,580,811 143,011,938 87,114,811
Work-in-process
Opening stock 3,044,441 2,244,439 Closing stock (6,364,578) (3,044,441) (3,320,137) (800,002) Cost of goods manufactured 139,691,801 86,314,809
Finished goods
Opening stock 9,641,809 9,393,252 Closing stock (12,514,128) (9,641,809) (2,872,319) (248,557) 136,819,482 86,066,252
31.1 Salaries, wages and other benefits include provident fund contributions of Rupees 293.380 million (2021: Rupees 235.457 million) and Rupees 1.25 million (2021: Rupees 0.788 million) in respect of provision for compensated absences.
Nishat Mills Limited and its Subsidiaries
204 Page
For the year ended June 30, 2022Notes to the Consolidated Financial Statements

2022 2021 Note (Rupees in thousand)
32 DISTRIBUTION COST
Salaries and other benefits 32.1 1,250,237 1,034,984 Outward freight and shop handling 4,090,177 1,929,363 Sales promotion 1,127,679 902,095 Commission to selling agents 1,055,201 774,117 Royalty 32.2 105,506 84,940 Fuel cost 195,346 140,160 Travelling and conveyance 134,186 30,258 Rent, rates and taxes 22,396 20,427 Postage and telephone 114,640 103,989 Insurance 35,466 25,355 Vehicles’ running 29,513 24,857 Entertainment 26,609 19,032 Advertisement 281,185 266,671 Electricity and gas 148,898 101,838 Printing and stationery 14,296 5,641 Repair and maintenance 191,481 217,936 Fee and subscription 5,342 2,630 Depreciation on right-of-use assets 17.1 770,308 717,041 Depreciation 15.1.2 57,678 54,942 9,656,144 6,456,276
32.1 Salaries and other benefits include provident fund contributions of Rupees 54.745 million (2021: Rupees 48.239 million).
32.2 Particulars of royalty paid during the year are as follows:
Relationship with the Name of the company Registered address Group or directors
Related / Other (Rupees in thousand)
American and Efird LLC 22 American Street, Other 106,944 71,110 Mount Holly, North Carolina, 28120.
Circular Systems S.P.C. 719 S. Los Angeles Other 266 - St. No. 924, Los Angeles, California 90014, United States of America.
2022 2021
Annual Report 2022
205Page
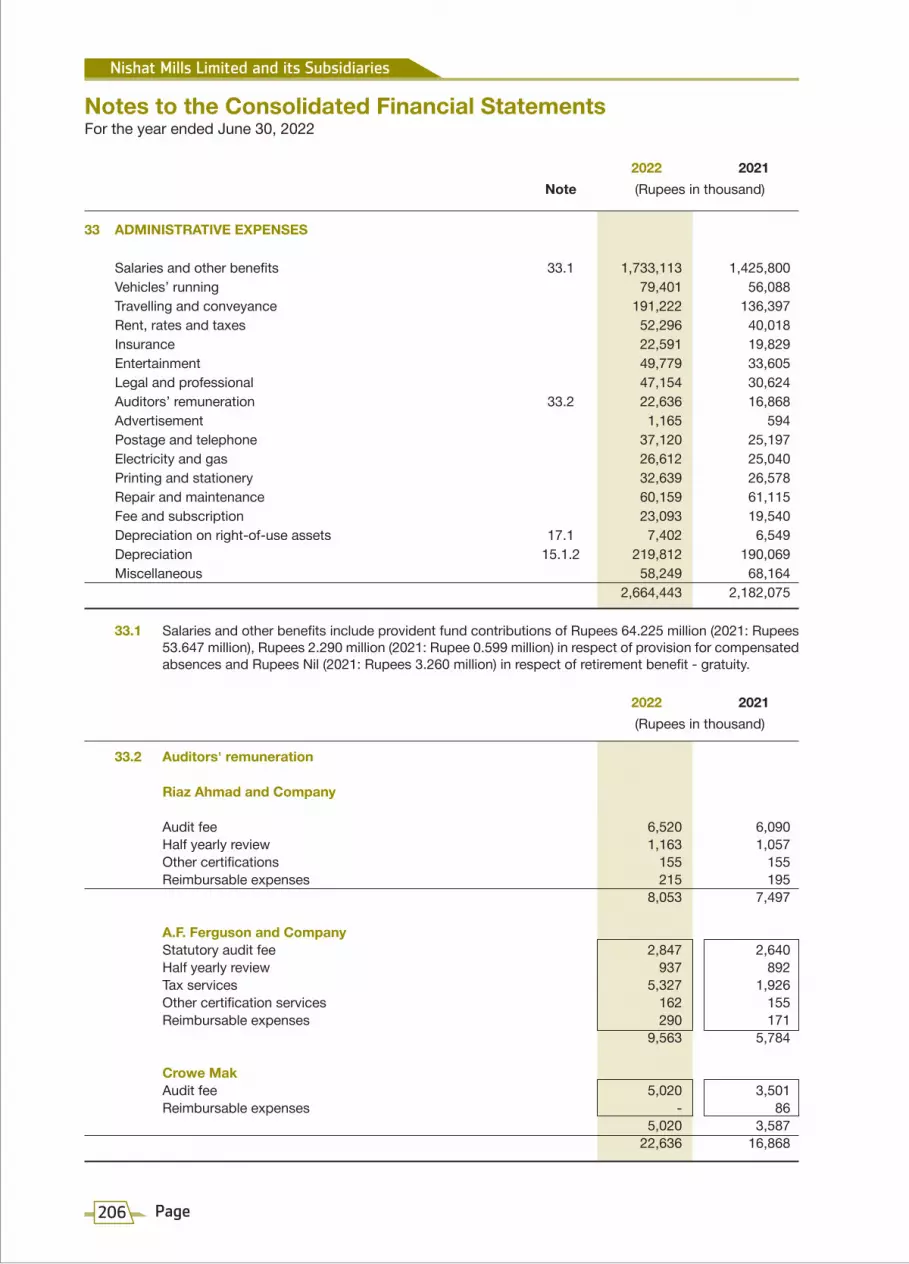
2022 2021 Note (Rupees in thousand)
33 ADMINISTRATIVE EXPENSES
Salaries and other benefits 33.1 1,733,113 1,425,800 Vehicles’ running 79,401 56,088 Travelling and conveyance 191,222 136,397 Rent, rates and taxes 52,296 40,018 Insurance 22,591 19,829 Entertainment 49,779 33,605 Legal and professional 47,154 30,624 Auditors’ remuneration 33.2 22,636 16,868 Advertisement 1,165 594 Postage and telephone 37,120 25,197 Electricity and gas 26,612 25,040 Printing and stationery 32,639 26,578 Repair and maintenance 60,159 61,115 Fee and subscription 23,093 19,540 Depreciation on right-of-use assets 17.1 7,402 6,549 Depreciation 15.1.2 219,812 190,069 Miscellaneous 58,249 68,164 2,664,443 2,182,075
33.1 Salaries and other benefits include provident fund contributions of Rupees 64.225 million (2021: Rupees 53.647 million), Rupees 2.290 million (2021: Rupee 0.599 million) in respect of provision for compensated absences and Rupees Nil (2021: Rupees 3.260 million) in respect of retirement benefit - gratuity.
2022 2021 (Rupees in thousand)
33.2 Auditors' remuneration
Riaz Ahmad and Company
Audit fee 6,520 6,090 Half yearly review 1,163 1,057 Other certifications 155 155 Reimbursable expenses 215 195 8,053 7,497
A.F. Ferguson and Company Statutory audit fee 2,847 2,640 Half yearly review 937 892 Tax services 5,327 1,926 Other certification services 162 155 Reimbursable expenses 290 171 9,563 5,784
Crowe Mak Audit fee 5,020 3,501 Reimbursable expenses - 86 5,020 3,587 22,636 16,868
Nishat Mills Limited and its Subsidiaries
206 Page
For the year ended June 30, 2022Notes to the Consolidated Financial Statements

2022 2021 Note (Rupees in thousand)
34 OTHER EXPENSES
Workers’ profit participation fund 553,560 398,631 Trade debts written off - 163,536 Impairment loss on receivable 1,750 - Expected credit loss against doubtful advance to Sanifa Agri Services Limited - associated company 23.3 121,500 - Workers' welfare fund 35,559 32,400 Allowance for expected credit loss against trade debts 22.7 17,126 - Donations 34.1 & 34.2 8,256 3,200 Loss on sale of short term investments 32,793 - 770,544 597,767
34.1 The names of donees to whom donation amount exceeded Rupees 1 million is as follows:
Pakistan Textile Council 34.3 3,750 2,500 Mr. Rajesh Kumar 1,000 -
34.2 There is no interest of any director or his spouse in donees’ fund. 34.3 Nishat Mills Limited - Holding Company is a member of Pakistan Textile Council (a company set up under
Section 42 of the Companies Act, 2017).
2022 2021 Note (Rupees in thousand)
35 OTHER INCOME
Income from financial assets Dividend income 35.1 1,985,516 1,750,744 Profit on deposits with banks 100,297 127,631 Net exchange gain 794,863 25,917 Reversal of allowance for expected credit losses 22.7 - 2,353 Interest income on advance to associated company 14,989 6,290 Others 39,824 - 2,935,489 1,912,935
Income from non-financial assets Gain on sale of property, plant and equipment 63,877 204,237 Scrap sales 442,294 291,815 Rental income 116,819 103,254 Gain on initial recognition of GIDC payable at amortized cost - 52,766 Rent concessions 28,478 90,344 Gain on termination of leases 1,251 9,983 Reversal of provision for slow moving, obsolete and damaged store items 20.2 - 77 Liabilities written back - 10,990 Others - 55,674 652,719 819,140 3,588,208 2,732,075
Annual Report 2022
207Page

2022 2021 Note (Rupees in thousand)
35.1 Dividend income
From related party / associated companies
MCB Bank Limited - associated company 1,716,298 1,716,298 Nishat (Chunian) Limited - related party 261,515 32,689 Adamjee Insurance Company Limited - associated company 308 257 1,978,121 1,749,244
Others
Pakistan Petroleum Limited 2,100 1,500 United Bank Limited 5,295 - 7,395 1,500 1,985,516 1,750,744
36 FINANCE COST
Mark-up on: Long term financing 361,889 288,902 Short term borrowings 1,657,047 950,833 Lease liabilities 260,035 244,750 Interest on workers’ profit participation fund 9.4 23,137 179 Adjustment due to impact of IFRS 9 on GIDC 8.2 36,096 73,562 Bank charges and commission 416,920 323,226 2,755,124 1,881,452
37 TAXATION
Current - for the year 2,932,684 1,181,385 Deferred 1,420,260 740,750 Prior year adjustment 1,453 (3,498) 4,354,397 1,918,637
38 EARNINGS PER SHARE - BASIC AND DILUTED There is no dilutive effect on the basic earnings per share which is based on:
2022 2021
Profit attributable to ordinary shareholders of Holding Company (Rupees in thousand) 12,304,783 9,896,748
Weighted average number of ordinary shares of Holding Company (Numbers) 351,599,848 351,599,848
Earnings per share (Rupees) 35.00 28.15
Nishat Mills Limited and its Subsidiaries
208 Page
For the year ended June 30, 2022Notes to the Consolidated Financial Statements

2022 2021 Note (Rupees in thousand)
39 CASH GENERATED FROM OPERATIONS
Profit before taxation 18,286,925 13,124,233
Adjustments for non-cash charges and other items:
Depreciation and amortization 4,324,561 3,825,822 Depreciation on right-of-use assets 777,710 723,590 Trade debts written off - 163,536 Reversal of provision for slow moving, obsolete and damaged store items - (77) Allowance for / (reversal of) expected credit loss against trade debts 17,126 (2,353) Impairment loss on receivable 1,750 - Expected credit loss against doubtful advance to Sanifa Agri Services Limited - associated company 121,500 - Loss on sale of short term investments 32,793 - Net exchange gain (794,863) (25,917) Gain on sale of property, plant and equipment (63,877) (204,237) Dividend income (1,985,516) (1,750,744) Profit on deposits with banks (100,297) (127,631) Interest income on advance to associated company (14,989) (6,290) Share of profit from associates (1,667,447) (2,848,522) Provision for accumulated compensated absences 3,540 1,388 Adjustment due to deemed disposal of equity accounted investee - (41,622) Liabilities written back - (10,990) Finance cost 2,755,124 1,881,452 Gain on initial recognition of GIDC payable at amortized cost - (110,431) Rent concessions (28,478) (90,344) Gain on termination of leases (1,251) (9,983) Working capital changes 39.1 (17,009,686) (889,135) 4,654,625 13,601,745
39.1 Working capital changes
(Increase) / decrease in current assets: - Stores, spare parts and loose tools (1,654,047) (328,097) - Stock in trade (17,372,432) 2,572,127 - Trade debts 4,438,061 (3,600,208) - Loans and advances (373,774) (329,963) - Short term deposits and prepayments (160,494) (7,270) - Other receivables (5,336,942) (770,761) (20,459,628) (2,464,172) Increase in trade and other payables 3,449,942 1,575,037 (17,009,686) (889,135)
Annual Report 2022
209Page

Liabilities from financing activities
2022
39.2 Reconciliation of movement of liabilities to cash flows arising from financing activities.
(Rupees in thousand)
Balance as at 01 July 2021 14,948,301 2,049,784 22,385,156 115,497 186,757 39,685,495 Lease liabilities recognized - 199,140 - - - 199,140 Repayment of lease liabilities - (916,048) - - - (916,048) Financing obtained 3,734,958 - - - - 3,734,958 Repayment of financing (3,300,234) - - - - (3,300,234) Dividend declared - - - 2,013,494 - 2,013,494 Dividend paid - - - (2,006,919) - (2,006,919) Short term borrowings - net - - 9,307,838 - - 9,307,838 Exchange differences on translation of net investments in subsidiary companies - - - - 164,204 164,204 Grant amortisation - net 90,606 - - - - 90,606 Interest accrued on lease liabilities - 260,035 - - - 260,035 Impact of lease modifications / renewals - 965,049 - - - 965,049 Impact of rent concessions - (28,478) - - - (28,478) Impact of lease termination - (16,477) - - - (16,477) Currency retranslation - 83,005 - - - 83,005 Balance as at 30 June 2022 15,473,631 2,596,010 31,692,994 122,072 350,961 50,235,668
(Rupees in thousand)
Balance as at 01 July 2020 10,136,154 2,266,071 24,080,517 111,267 224,659 36,818,668 Lease liabilities recognized - 342,406 - - - 342,406 Repayment of lease liabilities - (794,088) - - - (794,088) Financing obtained 6,744,988 - - - - 6,744,988 Repayment of financing (1,756,252) - - - - (1,756,252) Dividend declared - - - 1,579,855 - 1,579,855 Dividend paid - - - (1,575,625) - (1,575,625) Short term borrowings - net - - (1,695,361) - - (1,695,361) Exchange differences on translation of net investments in subsidiary companies - - - - (37,902) (37,902) Grant amortisation - net (176,589) - - - - (176,589) Interest accrued on lease liabilities - 244,750 - - - 244,750 Impact of lease modification/renewals - 180,387 - - - 180,387 Impact of rent concessions - (90,344) - - - (90,344) Impact of lease termination - (79,390) - - - (79,390) Currency retranslation - (20,008) - - - (20,008) Balance as at 30 June 2021 14,948,301 2,049,784 22,385,156 115,497 186,757 39,685,495
Exchangetranslation
reserve
Unclaimeddividend
Short termborrowings
Long termfinancing
Leaseliabilities Total
Exchangetranslation
reserve
Unclaimeddividend
Short termborrowings
Long termfinancing
Leaseliabilities Total
Liabilities from financing activities
2021
Nishat Mills Limited and its Subsidiaries
210 Page
For the year ended June 30, 2022Notes to the Consolidated Financial Statements

Annual Report 2022
211Page
Chief Executive Officer Executives2022 2021 2022 2021
(Rupees in thousand)
2022 2021 (Rupees in thousand)
39.3 Non-cash financing activities Lease liabilities recognized 199,140 342,406 Exchange differences on translation of net investments in subsidiary companies 164,204 (37,902) Grant amortisation - net 90,606 (176,589) Impact of lease modifications / renewals 965,049 180,387 Impact of rent concessions (28,478) (90,344) Impact of lease termination (16,477) (79,390) Currency retranslation 83,005 (20,008)
40 EVENTS AFTER THE REPORTING PERIOD
40.1 The Board of Directors of the Nishat Mills Limited - Holding Company has proposed a cash dividend for the year ended 30 June 2022 of Rupees 4.00 per share (2021: Rupees 4.00 per share) at their meeting held on 20 September 2022. The Board of Directors also proposed to transfer Rupees 10,872 million (2021: Rupees 10,524 million) from un-appropriated profit to general reserve. However, these events have been considered as non-adjusting events under IAS 10 'Events after the Reporting Period' and have not been recognized in these consolidated financial statements.
41 REMUNERATION OF CHIEF EXECUTIVE OFFICER AND EXECUTIVES
The aggregate amount charged in these consolidated financial statements for remuneration including all benefits to Chief Executive Officer and Executives of the Holding Company is as follows:
Managerial remuneration 43,703 37,189 883,652 683,563
Allowances Cost of living allowance - - 1,226 1,023 House rent 15,726 13,521 228,328 174,176 Conveyance - - 1,014 904 Medical 3,932 3,380 75,131 57,482 Utilities - - 98,795 75,673 Special allowance - - 830 646 Contribution to provident fund trust - - 72,462 56,650 Leave encashment - - 24,217 18,091 63,361 54,090 1,385,655 1,068,208
Number of persons 1 1 326 261
41.1 Chief Executive Officer and certain executives of the Holding Company are provided with Company maintained vehicles and certain executives are also provided with free housing facility along with utilities.

41.2 Aggregate amount charged in these consolidated financial statements for meeting fee to five directors (2021: five directors) of the Holding Company was Rupees 1.490 million (2021: Rupees 1.490 million).
41.3 No remuneration was paid to directors of the Holding Company.
42 TRANSACTIONS WITH RELATED PARTIES The related parties comprise associated undertakings, other related companies, post employment benefit plan
and key management personnel. The Group in the normal course of business carries out transactions with various related parties. Detail of transactions with related parties, other than those which have been specifically disclosed elsewhere in these consolidated financial statements are as follows:
2022 2021 (Rupees in thousand)
Associated companies
Investment made 1,326,249 241,476 Short term loans made 76,300 69,300 Purchase of goods and services 257,488 781,080 Repayment of short term loans 59,100 10,000 Sharing of expenses 1,369 8,100 Sale of goods and services 94,081 282,711 Rental income 6,888 6,035 Purchase of operating fixed assets 85,074 64,227 Sale of operating fixed assets - 67,270 Rent paid 90,005 80,092 Dividend paid 123,047 122,105 Insurance premium paid 481,879 487,777 Interest income 101,796 40,647 Insurance claims received 117,169 72,620 Profit on term deposit receipt 625 - Finance cost 19,983 8,230 Commission paid 29,684 -
Other related parties
Dividend Income 261,515 32,689 Purchase of goods and services 5,496,954 2,440,916 Sale of goods and services 283,546 536,734 Group’s contribution to provident fund trust 412,589 338,947
Nishat Mills Limited and its Subsidiaries
212 Page
For the year ended June 30, 2022Notes to the Consolidated Financial Statements

42.1 Detail of compensation to key management personnel of the Holding Company comprising of chief executive officer and executives is disclosed in note 41.
42.2 Following are the related parties with whom the Holding Company had entered into transactions or have arrangements / agreements in place:
Transactions entered or agreements and / or arrangements in place during the financial year ended
2022 2021
Nishat Agriculture Farming (Private) Limited Common directorship No No None Nishat Dairy (Private) Limited Common directorship and shareholding Yes Yes 12.24 Nishat Sutas Dairy Limited Common directorship and shareholding Yes Yes 47.53 Nishat Hotels and Properties Limited Common directorship and shareholding Yes Yes 6.08 Nishat (Raiwind) Hotels and Properties Limited Common directorship No No None Nishat (Aziz Avenue) Hotels and Properties Limited Common directorship Yes No None Security General Insurance Company Limited Common directorship and shareholding Yes Yes 15.02 Nishat Energy Limited Shareholding No No 37.75 Pakgen Power Limited Common directorship and shareholding Yes Yes 27.55 Lalpir Power Limited Common directorship and shareholding Yes Yes 28.80 Nishat Paper Products Company Limited Common directorship and shareholding No No 25.00 Pakistan Aviators and Aviation (Private) Limited Common directorship Yes Yes None Nishat Developers (Private) Limited Common directorship No No None Nishat Real Estates Development Company
(Private) Limited Common directorship Yes No None Hyundai Nishat Motor (Private) Limited Common directorship and shareholding Yes Yes 12.00 D.G. Khan Cement Company Limited Common directorship and shareholding Yes Yes 31.40 Adamjee Life Assurance Company Limited Common directorship Yes Yes None Adamjee Insurance Company Limited Common directorship and shareholding Yes Yes 0.03 MCB Bank Limited Common directorship and shareholding Yes Yes 7.43 MCB Islamic Bank Limited Wholly owned subsidiary of associated company Yes Yes None Nishat (Chunian) Limited Shareholding Yes Yes 13.61 Nishat Agrotech Farms Supplies (Private) Limited Common directorship No No None Nishat Chunian Power Executive of the Holding Company is Limited (NCPL) appointed as Director on the Board of NCPL No No None Sanifa Agri Services Limited Shareholding Yes Yes 33.12 Golf View Land Spouse of chief executive officer of the Holding (Private) Limited Company is Director on the Board of Golf View Land (Private) Limited No No None Employees Provident Fund Trusts Post-employment benefit plans Yes Yes None
Name of the related party Basis of relationship Percentage ofshareholding
Annual Report 2022
213Page

43 PROVIDENT FUNDS
43.1 Nishat Mills Limited - Holding Company and Nishat Linen (Private) Limited - Subsidiary Company
As at the reporting date, the Nishat Mills Employees Provident Fund Trust is in the process of regularizing its investments in accordance with section 218 of the Companies Act, 2017 and the regulations formulated for this purpose by Securities and Exchange Commission of Pakistan.
43.2 Nishat Power Limited - Subsidiary Company
The investments by the provident fund in collective investment schemes, listed equity and debt securities have been made in accordance with the provisions of section 218 of the Companies Act, 2017 and the conditions specified thereunder.
43.3 Nishat Hospitality (Private) Limited - Subsidiary Company
The investments by the provident fund in collective investment schemes, listed equity and debt securities have been made in accordance with the provisions of section 218 of the Companies Act, 2017 and the Employees Contributory Funds (Investment in Listed Securities) Regulations, 2018 ('Regulations') formulated for this purpose.
2022 2021 44 NUMBER OF EMPLOYEES
Number of employees as on 30 June 27,760 23,907
Average number of employees during the year 26,423 22,732
Nishat Mills Limited and its Subsidiaries
214 Page
For the year ended June 30, 2022Notes to the Consolidated Financial Statements

2022 2021 (Figures in thousand)
45 PLANT CAPACITY AND ACTUAL PRODUCTION
a) Holding Company - Nishat Mills Limited
Spinning 100 % plant capacity converted to 20s count based on 3 shifts per day for 1,095 shifts (2021: 1,095 shifts) (Kgs.) 98,973 90,821
Actual production converted to 20s count based on 3 shifts per day for 1,095 shifts (2021: 1,095 shifts) (Kgs.) 85,580 79,689
Weaving 100 % plant capacity at 50 picks based on 3 shifts per day for 1,095 shifts (2021: 1,095 shifts) (Sq. Mtr) 365,620 309,458 Actual production converted to 50 picks based on 3 shifts per day for 1,095 shifts (2021: 1,095 shifts) (Sq. Mtr) 347,818 295,932 Dyeing and Finishing Production capacity for 3 shifts per day for 1,095 shifts (2021: 1,095 shifts) (Mtr) 56,400 56,400
Actual production on 3 shifts per day for 1,095 shifts (2021: 1,095 shifts) (Mtr) 51,567 33,105
Power Plant Generation capacity (MWH) 1,242 989 Actual generation (MWH) 431 389
Processing, Stitching, Apparel and Terry
The plant capacity of these divisions is indeterminable due to multi product plants involving varying processes of manufacturing and run length of order lots.
b) Subsidiary Company - Nishat Power Limited
Installed capacity [Based on 8,760 hours (2021: 8,760 hours)] (MWH) 1,711 1,711 Actual energy delivered (MWH) 794 523
c) Subsidiary Company - Nishat Hospitality (Private) Limited Total rooms available
Nishat Suites 31,754 31,753
Average occupancy 81% 57%
45.1 REASON FOR LOW PRODUCTION
a) Under utilization of available capacity by the Holding Company for spinning, weaving, dyeing and finishing is mainly due to normal maintenance. Actual power generation in comparison to installed is low due to periodical, scheduled and unscheduled maintenance and low demand.
b) Output produced by the plant of Nishat Power Limited - Subsidiary Company is dependent on the load demanded by CPPA-G and plant availability.
Annual Report 2022
215Page

Nishat Mills Limited and its Subsidiaries
216 Page
For the year ended June 30, 2022Notes to the Consolidated Financial Statements46
SE
GMEN
T IN
FORM
ATIO
N
2022
2021
Tota
l - G
roup
2022
2021
Hote
l
2022
2021
Pow
er G
ener
atio
n
2022
2021
Garm
ents
2022
2021
Hom
e Te
xtile
and
Ter
ry
2022
2021
Dyei
ng
2022
2021
Wea
ving
2022
2021
Spin
ning
2022
2021
Elim
inatio
n of i
nter
-seg
men
ttra
nsac
tions
(Rup
ees
in th
ousa
nd)
Reve
nue
Ex
tern
al 45
,327
,197
30
,385
,847
26
,209
,029
16
,596
,105
21
,966
,803
11
,644
,199
33
,497
,022
25
,959
,431
14
,388
,690
8,
364,
875
23,7
87,1
31
11,4
86,3
21
521,
135
290,
680
- -
165,
697,
007
104,
727,
458
In
ters
egm
ent
9,24
4,67
4 12
,848
,059
18
,857
,701
11
,453
,525
1,
725,
633
743,
501
291,
649
297,
290
693
4,15
6 11
,379
,528
6,
814,
585
- 76
5 (4
1,49
9,87
8)
(32,
161,
881)
-
-
54
,571
,871
43
,233
,906
45
,066
,730
28
,049
,630
23
,692
,436
12
,387
,700
33
,788
,671
26
,256
,721
14
,389
,383
8,
369,
031
35,1
66,6
59
18,3
00,9
06
521,
135
291,
445
(41,
499,
878)
(3
2,16
1,88
1)
165,
697,
007
104,
727,
458
Cost
of s
ales
(45,
421,
801)
(3
8,90
9,97
0)
(38,
412,
907)
(2
5,97
7,18
6)
(21,
661,
673)
(1
1,03
3,99
7)
(29,
025,
628)
(2
0,06
8,43
3)
(12,
189,
368)
(7
,131
,640
) (3
1,24
2,23
8)
(14,
837,
120)
(3
65,7
45)
(269
,787
) 41
,499
,878
32
,161
,881
(13
6,81
9,48
2)
(86,
066,
252)
Gros
s pr
ofit
9,
150,
070
4,32
3,93
6 6,
653,
823
2,07
2,44
4 2,
030,
763
1,35
3,70
3 4,
763,
043
6,18
8,28
8 2,
200,
015
1,23
7,39
1 3,
924,
421
3,46
3,78
6 15
5,39
0 21
,658
-
- 28
,877
,525
18
,661
,206
Dist
ribut
ion
cost
(9
70,2
93)
(599
,155
) (1
,739
,272
) (7
57,6
06)
(1,0
98,2
49)
(595
,743
) (4
,984
,538
) (3
,928
,069
) (8
63,7
92)
(575
,703
) -
- -
- -
- (9
,656
,144
) (6
,456
,276
)Ad
min
istra
tive
expe
nses
(4
58,7
31)
(391
,826
) (3
52,6
62)
(278
,928
) (2
16,2
61)
(171
,847
) (9
49,2
50)
(773
,189
) (2
29,0
17)
(148
,398
) (3
95,7
18)
(358
,899
) (6
2,80
4)
(58,
988)
-
- (2
,664
,443
) (2
,182
,075
)
(1
,429
,024
) (9
90,9
81)
(2,0
91,9
34)
(1,0
36,5
34)
(1,3
14,5
10)
(767
,590
) (5
,933
,788
) (4
,701
,258
) (1
,092
,809
) (7
24,1
01)
(395
,718
) (3
58,8
99)
(62,
804)
(5
8,98
8)
- -
(12,
320,
587)
(8
,638
,351
)Pr
ofit
/ (lo
ss) b
efor
e ta
xatio
n an
d un
allo
cate
d
inco
me
and
expe
nses
7
,721
,046
3,
332,
955
4,56
1,88
9 1,
035,
910
716,
253
586,
113
(1,1
70,7
45)
1,48
7,03
0 1,
107,
206
513,
290
3,52
8,70
3 3,
104,
887
92,5
86
(37,
330)
-
- 16
,556
,938
10
,022
,855
Unal
loca
ted
inco
me
and
expe
nses
:Ot
her e
xpen
ses
(770
,544
) (5
97,7
67)
Othe
r inc
ome
3,5
88,2
08
2,7
32,0
75Fi
nanc
e co
st
(2,7
55,1
24)
(1,8
81,4
52)
Shar
e of
pro
fit fr
om a
ssoc
iates
1
,667
,447
2
,848
,522
Taxa
tion
(4,3
54,3
97)
(1,9
18,6
37)
Prof
it af
ter t
axat
ion
13,
932,
528
11,
205,
596
46.1
Re
conc
iliat
ion
of re
port
able
seg
men
t ass
ets
and
liabi
litie
s
2022
2021
Hote
l
2022
2021
Pow
er G
ener
atio
n
2022
2021
Garm
ents
2022
2021
Hom
e Te
xtile
and
Ter
ry
2022
2021
Dyei
ng
2022
2021
Wea
ving
2022
2021
Spin
ning
2022
2021
Tota
l - G
roup
(Rup
ees
in th
ousa
nd)
Tota
l ass
ets
for r
epor
tabl
e se
gmen
ts
29,
055,
215
24,2
57,8
85
13,9
84,6
43
10,0
71,6
14
13,4
36,0
58
7,89
3,11
0 24
,989
,263
19
,717
,909
9,
529,
041
5,88
5,32
7 8,
088,
646
36,5
62,8
08
1,82
0,64
8 1,
255,
855
100,
903,
514
105,
644,
508
Unal
loca
ted
asse
ts:
Long
term
inve
stm
ents
52
,382
,499
55
,330
,247
Shor
t ter
m in
vest
men
t
5,
733,
709
-O
ther
rece
ivabl
es
10,8
15,3
93
5,43
1,35
5Ca
sh a
nd b
ank
bala
nces
1,
758,
816
6,39
7,99
8O
ther
cor
pora
te a
sset
s
26
,430
,549
3,
113,
048
Tota
l ass
ets
as p
er c
onso
lidat
ed s
tate
men
t
of fi
nanc
ial p
ositi
on
198,
024,
480
175,
917,
156
Tota
l lia
bilit
ies
for r
epor
tabl
e se
gmen
ts
3,1
29,9
39
1,50
0,55
2 1,
933,
567
1,24
3,10
9 1,
402,
605
1,06
7,20
0 4,
365,
108
3,32
5,10
0 1,
153,
996
1,11
5,09
8 1,
927,
992
6,35
3,66
5 70
3,63
0 58
,134
14
,616
,837
14
,662
,858
Unal
loca
ted
liabi
litie
s:De
ferre
d lia
bilit
ies
4,3
39,0
86
2,5
72,6
34O
ther
cor
pora
te lia
bilit
ies
52,
111,
156
38,
008,
968
Tota
l lia
bilit
ies
as p
er c
onso
lidat
ed s
tate
men
t
of fi
nanc
ial p
ositi
on
71,
067,
079
55,
244,
460
46.2
Geog
raph
ical in
form
ation
Th
e Gro
up's
reven
ue fr
om ex
terna
l cus
tome
rs by
geog
raphic
al loc
ation
is de
tailed
below
:
20
22
2021
(Rup
ees
in th
ousa
nd)
Eu
rope
34
,473,8
42
22,40
8,582
As
ia, A
frica a
nd A
ustra
lia
27,88
5,754
18
,416,0
68
Ameri
ca
13,91
0,076
7,6
66,80
7
Pakis
tan
89,4
27,33
5 56
,236,0
01
1
65,69
7,007
10
4,727
,458
46.3
Signif
icant
non-
curre
nt as
sets
of the
Gro
up as
at re
portin
g date
s are
locate
d and
opera
ting i
n Pak
istan
.
46.4
Reve
nue f
rom
majo
r cus
tom
ers
Ni
shat
Powe
r Lim
ited -
Sub
sidiar
y Com
pany
sells
elec
tricity
only
to C
PPA-
G wh
ereas
the G
roup
's rev
enue
from
othe
r seg
ments
is ea
rned
from
a lar
ge m
ix of
custo
mers.

Annual Report 2022
217Page
47 INTERESTS IN OTHER ENTITIES
47.1 Non-controlling interest (NCI)
Set out below is summarised financial information for Nishat Power Limited - Subsidiary Company that has non-controlling interests that are material to the Group. The amount disclosed for Subsidiary Company are before inter-company eliminations.
2022 2021 (Rupees in thousand)
Summarised statement of financial position
Current assets 24,865,351 21,958,021 Current liabilities 5,276,730 4,738,890 Net current assets 19,588,621 17,219,131
Non-current assets 8,504,939 8,828,036 Non-current liabilities - 36,903 Net non-current assets 8,504,939 8,791,133 Net assets 28,093,560 26,010,264 Accumulated non-controlling interest 13,762,616 12,741,966
Summarised statement of comprehensive income
Revenue 23,684,340 11,432,571
Profit for the year 3,322,606 2,681,134 Other comprehensive income - - Total comprehensive income 3,322,606 2,681,134
Profit allocated to non-controlling interest 1,627,745 1,308,848
Dividend paid to non-controlling interest 607,095 173,456
Summarised cash flows
Cash flows from operating activities 6,722,297 1,928,789 Cash used in investing activities (6,152,924) (105,526) Cash used in financing activities (1,310,851) (316,807) Net (decrease) / increase in cash and cash equivalents (741,478) 1,506,456

Nishat Mills Limited and its Subsidiaries
218 Page
For the year ended June 30, 2022Notes to the Consolidated Financial Statements
48 FINANCIAL RISK MANAGEMENT
48.1 Financial risk factors
The Group's activities expose it to a variety of financial risks: market risk (including currency risk, other price risk and interest rate risk), credit risk and liquidity risk. The Group's overall risk management programme focuses on the unpredictability of financial markets and seeks to minimize potential adverse effects on the Group's financial performance. The Group uses derivative financial instruments to hedge certain risk exposures.
Risk management is carried out by the finance departments of the Holding Company and Subsidiary Companies under the policies approved by their respective Board of Directors. The Holding Company and Subsidiary Companies' finance departments evaluates and hedge financial risks. The Board of each Group Company provides principles for overall risk management, as well as policies covering specific areas such as currency risk, other price risk, interest rate risk, credit risk, liquidity risk, use of derivative financial instruments and non-derivative financial instruments and investment of excess liquidity.
a) Market risk
i) Currency risk
Currency risk is the risk that the fair value or future cash flows of a financial instrument will fluctuate because of changes in foreign exchange rates. Currency risk arises mainly from future commercial transactions or receivables and payables that exist due to transactions in foreign currencies.
The Group is exposed to currency risk arising from various currency exposures, primarily with respect to the United States Dollar (USD), Euro, United Arab Emirates Dirham (AED), Japanese Yen (JPY), Swiss Franc (CHF) and CNY. Currently, the Group's foreign exchange risk exposure is restricted to bank balances, long term loan, security deposit and the amounts receivable / payable from / to the foreign entities. The Group's exposure to currency risk was as follows:
2022 2021
Cash at banks - USD 223,603 233,515 Cash in hand and at banks - AED 17,220,564 13,867,777 Trade debts - USD 65,262,261 22,937,415 Trade debts - Euro 4,467,763 1,652,710 Trade debts - AED 10,244,433 9,642,554 Trade and other payables - USD (2,151,639) (2,519,879) Trade and other payables - Euro (735,806) (170,203) Trade and other payables - AED (2,327,092) (9,029,257) Trade and other payables - JPY (2,370,216) (652,985) Trade and other payables - CHF (17,977) - Trade and other payables - CNY (54,597) - Net exposure - USD 63,334,225 20,651,051 Net exposure - Euro 3,731,957 1,482,507 Net exposure - AED 25,137,905 14,481,074 Net exposure - JPY (2,370,216) (652,985) Net exposure - CHF (17,977) - Net exposure - CNY (54,597) -

Annual Report 2022
219Page
2022 2021
The following significant exchange rates were applied during the year:
Rupees per US Dollar Average rate 179.29 159.53 Reporting date rate 202.50 157.60 Rupees per Euro Average rate 199.13 189.17 Reporting date rate 212.00 185.80 Rupees per AED Average rate 48.85 43.22 Reporting date rate 55.10 42.65 Rupees per JPY Average rate 1.51 1.49 Reporting date rate 1.49 1.42 Rupees per CHF Average rate 190.59 174.46 Reporting date rate 210.24 168.81 Rupees per CNY Average rate 28.04 - Reporting date rate 31.50 - Sensitivity Analysis
If the functional currency, at reporting date, had weakened / strengthened by 5% against the USD, Euro, AED, JPY, CHF and CNY with all other variables held constant, the impact on profit after taxation for the year would have been Rupees 749.621 million (2021: Rupees 207.337 million) higher / lower, mainly as a result of exchange gains / losses on translation of foreign exchange denominated financial instruments. Currency risk sensitivity to foreign exchange movements has been calculated on a symmetric basis. In management's opinion, the sensitivity analysis is unrepresentative of inherent currency risk as the year end exposure does not reflect the exposure during the year.
ii) Other price risk
Other price risk represents the risk that the fair value or future cash flows of a financial instrument will fluctuate because of changes in market prices (other than those arising from interest rate risk or currency risk), whether those changes are caused by factors specific to the individual financial instrument or its issuer, or factors affecting all similar financial instruments traded in the market. The Group is not exposed to commodity price risk.
Sensitivity Analysis
The table below summarises the impact of increase / decrease in the Pakistan Stock Exchange (PSX) Index on Group's other comprehensive income (fair value reserve) for the year. The analysis is based on the assumption that the equity index had increased / decreased by 5% with all other variables held constant and all the Group's equity instruments moved according to the historical correlation with the index.
Impact on statement of other comprehensive income (fair value reserve)
2022 2021 (Rupees in thousand)
PSX (5% increase) 519,622 771,424 PSX (5% decrease) (519,622) (771,424)
Equity (fair value reserve) would increase / decrease as a result of gains / losses on equity investments classified as fair value through other comprehensive income.
Index

iii) Interest rate risk
This represents the risk that the fair value or future cash flows of a financial instrument will fluctuate because of changes in market interest rates.
The Group's interest rate risk mainly arises from long term financing, short term borrowings, loans to employees, trade debts, advance to associated company, bank balances in saving accounts and term deposit receipts. Financial instruments at variable rates expose the Group to cash flow interest rate risk. Financial instruments at fixed rate expose the Group to fair value interest rate risk.
At the reporting date the interest rate profile of the Group’s interest bearing financial instruments was:
2022 2021 (Rupees in thousand)
Fixed rate instruments Financial assets Short term investment 5,733,709 - Loans to employees 165,109 265,626 Term deposit receipts - 5,104,500 Financial liabilities Long term financing 15,472,201 14,837,321 Short term borrowings 21,474,683 18,371,589
Floating rate instruments Financial assets Bank balances - saving accounts 656,260 34,281 Advance to Sanifa Agri Services Limited - associated company - 104,300 Trade debts - overdue 3,967,436 11,802,542 Financial liabilities Long term financing 1,430 110,980 Short term borrowings 10,218,311 4,013,567
Fair value sensitivity analysis for fixed rate instruments
The Group does not account for any fixed rate financial assets and liabilities at fair value through profit or loss. Therefore, a change in interest rate at the reporting date would not affect profit or loss of the Group.
Cash flow sensitivity analysis for variable rate instruments
If interest rates at the year end date, fluctuates by 1% higher / lower with all other variables held constant, profit after taxation for the year would have been Rupees 55.960 million lower / higher (2021: Rupees 78.166 million higher / lower) mainly as a result of lower / higher interest expense on floating rate financial instruments. This analysis is prepared assuming the amount of financial instruments outstanding at reporting date were outstanding for the whole year.
b) Credit risk
Credit risk represents the risk that one party to a financial instrument will cause a financial loss for the other party by failing to discharge an obligation. The carrying amount of financial assets represents the maximum credit exposure. The maximum exposure to credit risk at the reporting date was as follows:
Investments 12,382,166 15,780,453 Loans and advances 1,139,316 1,168,574 Deposits 455,207 336,988 Trade debts 23,326,877 27,111,194 Other receivables 171,668 46,808 Accrued interest 4,394 13,659 Short term investments 5,733,709 - Bank balances 1,699,140 6,348,367 44,912,477 50,806,043
Nishat Mills Limited and its Subsidiaries
220 Page
For the year ended June 30, 2022Notes to the Consolidated Financial Statements

Rating 2022 2021
Short term Long term Agency (Rupees in thousand)
The credit quality of financial assets that are neither past due nor impaired can be assessed by reference to external credit ratings (If available) or to historical information about counterparty default rate:
Banks
National Bank of Pakistan A1+ AAA PACRA 1,317 1,434Allied Bank Limited A1+ AAA PACRA 64 4,549Askari Bank Limited A1+ AA+ PACRA 77 61Bank Alfalah Limited A1+ AA+ PACRA 12,849 12,087Faysal Bank Limited A1+ AA PACRA 7,535 15,811Habib Bank Limited A-1+ AAA VIS 18,448 19,585Habib Metropolitan Bank Limited A1+ AA+ PACRA 1,408 23,163JS Bank Limited A1+ AA- PACRA - 24MCB Bank Limited A1+ AAA PACRA 1,426,573 6,026,704Samba Bank Limited A1+ AAA VIS 14 274Silk Bank Limited A-1 AA VIS 68 68Standard Chartered Bank (Pakistan) Limited A-2 A - PACRA 36,562 80,265United Bank Limited A1+ AAA VIS 4,894 1,790Al Baraka Bank (Pakistan) Limited A-1+ AAA PACRA 264 268Citi Bank N.A. P-1 Aa3 Moody's 288 203Bank Islami Pakistan Limited A1 A+ PACRA 403 191Meezan Bank Limited A-1+ AAA VIS 21,852 36,573Dubai Islamic Bank Pakistan Limited A-1+ AA VIS 596 352The Bank of Punjab A1+ AA+ PACRA 701 297Soneri Bank Limited A1+ AA- PACRA 169 2,470Summit Bank Limited A-3 BBB- VIS 2 257Industrial and Commercial Bank of China P-1 A1 Moody’s 6 114MCB Islamic Bank Limited A1 A PACRA 245 705HAB Bank Unknown - 4,496 5,961Bank of China P-1 A1 Moody’s 23,864 4,913Habib Bank AG Zurich, UAE Unknown - 55,912 53,957ICBC Standard Bank P-2 A3 Moody’s 78,395 42,788Bank Al-Habib Limited A1+ AAA PACRA 2,133 13,496Burj Bank Limited Unknown - - 1The Bank of Khyber A1 A PACRA 5 6 1,699,140 6,348,367
Investments
Adamjee Insurance Company Limited AA+ PACRA 3,245 4,263Alhamra Islamic Stock Fund AA- PACRA 10,205 12,661Nishat (Chunian) Limited A A-2 VIS 1,464,156 1,643,947United Bank Limited A-1+ AAA VIS 39,934 -MCB Bank Limited A1+ AAA PACRA 10,824,120 14,067,484Pakistan Petroleum Limited Unknown - 40,506 52,098Riba Free Certifcate A-1+ AA+ PACRA 1,600 -Term deposit receipts A-1+ AA- PACRA 31,010 -Pakistan Investment Bonds Not available 2,850,550 -Government Ijara Sukuk Not available 2,850,549 - 18,115,875 15,780,453 19,815,015 22,128,820
Annual Report 2022
221Page

Carryingamount
Contractualcash flows
6 monthsor less
6-12months
1-2Years
More than2 Years
(Rupees in thousand)
The Group's exposure to credit risk and impairment losses related to trade debts is disclosed in Note 22.
Due to the Group's long standing business relationships with these counterparties and after giving due consideration to their strong financial standing, management does not expect non-performance by these counterparties on their obligations to the Group. Accordingly the credit risk is minimal.
Trade debts
The Group applies the IFRS 9 simplified approach to measure expected credit losses which uses a lifetime expected loss allowance for all trade debts other than those due from Government of Pakistan.
To measure the expected credit losses, trade receivables have been grouped based on shared credit risk characteristics and the days past due. These trade receivables are netted off with the collateral obtained, if any, from these customers to calculate the net exposure towards these customers. The Group has concluded that the expected loss rates for trade debts against local sales are different from the expected loss rates for trade debts against export sales.
The expected loss rates are based on the payment profiles of sales over a period of 36 months before 30 June 2022 and the corresponding historical credit losses experienced within this period. The historical loss rates are adjusted to reflect current and forward-looking information on macroeconomic factors affecting the ability of the customers to settle the receivables. The Group has identified the Gross Domestic Product, Unemployment, Interest and the inflation Index to be the most relevant factors, and accordingly adjusts the historical loss rates based on expected changes in these factors.
c) Liquidity risk
Liquidity risk is the risk that an entity will encounter difficulty in meeting obligations associated with financial liabilities.
The Group manages liquidity risk by maintaining sufficient cash and the availability of funding through an adequate amount of committed credit facilities. At 30 June 2022, the Group had Rupees 54,727.266 million (2021: Rupees 58,213.768 million) available borrowing / financing limits from financial institutions and Rupees 1,758.816 million (2021: Rupees 6,397.998 million) cash and bank balances. Management believes the liquidity risk to be low. Following are the contractual maturities of financial liabilities, including interest payments. The amounts disclosed in the table are undiscounted cash flows.
Contractual maturities of financial liabilities as at 30 June 2022:
Non-derivative financial liabilities
Long term financing 15,473,631 16,819,545 2,062,943 1,427,909 3,137,008 10,191,685 Long term security deposits 258,410 258,410 - - - 258,410 Trade and other payables 11,650,553 11,650,553 11,650,553 - - - Unclaimed dividend 122,072 122,072 122,072 - - - Short term borrowings 31,692,994 33,132,944 32,747,572 385,372 - - Accrued mark-up 460,206 460,207 460,207 - - -
Derivative financial liabilities 9,595 9,595 9,595 - - - 59,667,461 62,453,326 47,052,942 1,813,281 3,137,008 10,450,095
Nishat Mills Limited and its Subsidiaries
222 Page
For the year ended June 30, 2022Notes to the Consolidated Financial Statements

Contractual maturities of financial liabilities as at 30 June 2021:
Non-derivative financial liabilities:
Long term financing 14,948,301 16,198,322 1,767,748 1,829,938 3,379,591 9,221,045 Long term security deposits 269,078 269,078 - - - 269,078 Trade and other payables 8,250,030 8,250,030 8,250,030 - - - Unclaimed dividend 115,497 115,497 115,497 - - - Short term borrowings 22,385,156 22,742,829 22,692,941 49,888 - - Accrued mark-up 269,569 269,569 269,569 - - -
Derivative financial liabilities 57,429 57,429 57,429 - - - 46,295,060 47,902,754 33,153,214 1,879,826 3,379,591 9,490,123
The contractual cash flows relating to the above financial liabilities have been determined on the basis of interest rates / mark-up rates effective as at 30 June. The rates of interest / markup have been disclosed in note 5 and note 11 to these consolidated financial statements.
Carryingamount
Contractualcash flows
6 monthsor less
6-12months
1-2Years
More than2 Years
(Rupees in thousand)
48.2 Financial instruments by categories
(Rupees in thousand)
As at 30 June 2022
Assets as per consolidated statement of financial position Investments - - 12,382,166 12,382,166 Loans and advances - 1,139,316 - 1,139,316 Deposits - 455,207 - 455,207 Trade debts - 23,326,877 - 23,326,877 Other receivables 57,518 114,150 - 171,668 Accrued interest - 4,394 - 4,394 Short term investments 5,701,099 32,610 - 5,733,709 Cash and bank balances - 1,758,816 - 1,758,816 5,758,617 26,831,370 12,382,166 44,972,153
(Rupees in thousand)
Liabilities as per consolidated statement of financial position
Long term financing - 15,473,631 15,473,631 Long term security deposits - 258,410 258,410 Trade and other payables 9,595 11,650,553 11,660,148 Short term borrowings - 31,692,994 31,692,994 Unclaimed dividend - 122,072 122,072 Accrued mark-up - 460,206 460,206 9,595 59,657,866 59,667,461
TotalFVTPL FVTOCIAmortizedcost
TotalAmortized costFVTPL
Annual Report 2022
223Page

Assets as perconsolidatedstatement of
financial position
Financialassets
Non-financialassets
2022
(Rupees in thousand)
Nishat Mills Limited and its Subsidiaries
224 Page
For the year ended June 30, 2022Notes to the Consolidated Financial Statements
TotalFVTOCIFVTPL Amortisedcost
(Rupees in thousand)
As at 30 June 2021
Assets as per consolidated statement of financial position Investments - - 15,780,453 15,780,453 Loans and advances - 1,168,574 - 1,168,574 Deposits - 336,988 - 336,988 Trade debts - 27,111,194 - 27,111,194 Other receivables 8,672 38,136 - 46,808 Accrued interest - 13,659 - 13,659 Cash and bank balances - 6,397,998 - 6,397,998 8,672 35,066,549 15,780,453 50,855,674
(Rupees in thousand)
Liabilities as per consolidated statement of financial position
Long term financing - 14,948,301 14,948,301 Long term security deposits - 269,078 269,078 Trade and other payables 57,429 8,250,030 8,307,459 Short term borrowings - 22,385,156 22,385,156 Unclaimed dividend - 115,497 115,497 Accrued mark-up - 269,569 269,569 57,429 46,237,631 46,295,060
48.3 Reconciliation of financial assets and financial liabilities to the line items presented in the statement of financial position is as follows:
Assets Investments 12,382,166 40,000,333 52,382,499 Loans and advances 1,139,316 651,066 1,790,382 Deposits and prepayments 455,207 207,419 662,626 Trade debts 23,326,877 - 23,326,877 Other receivables 171,668 10,643,725 10,815,393 Accrued interest 4,394 - 4,394 Cash and bank balances 1,758,816 - 1,758,816
39,238,444 51,502,543 90,740,987
TotalAmortized costFVTPL
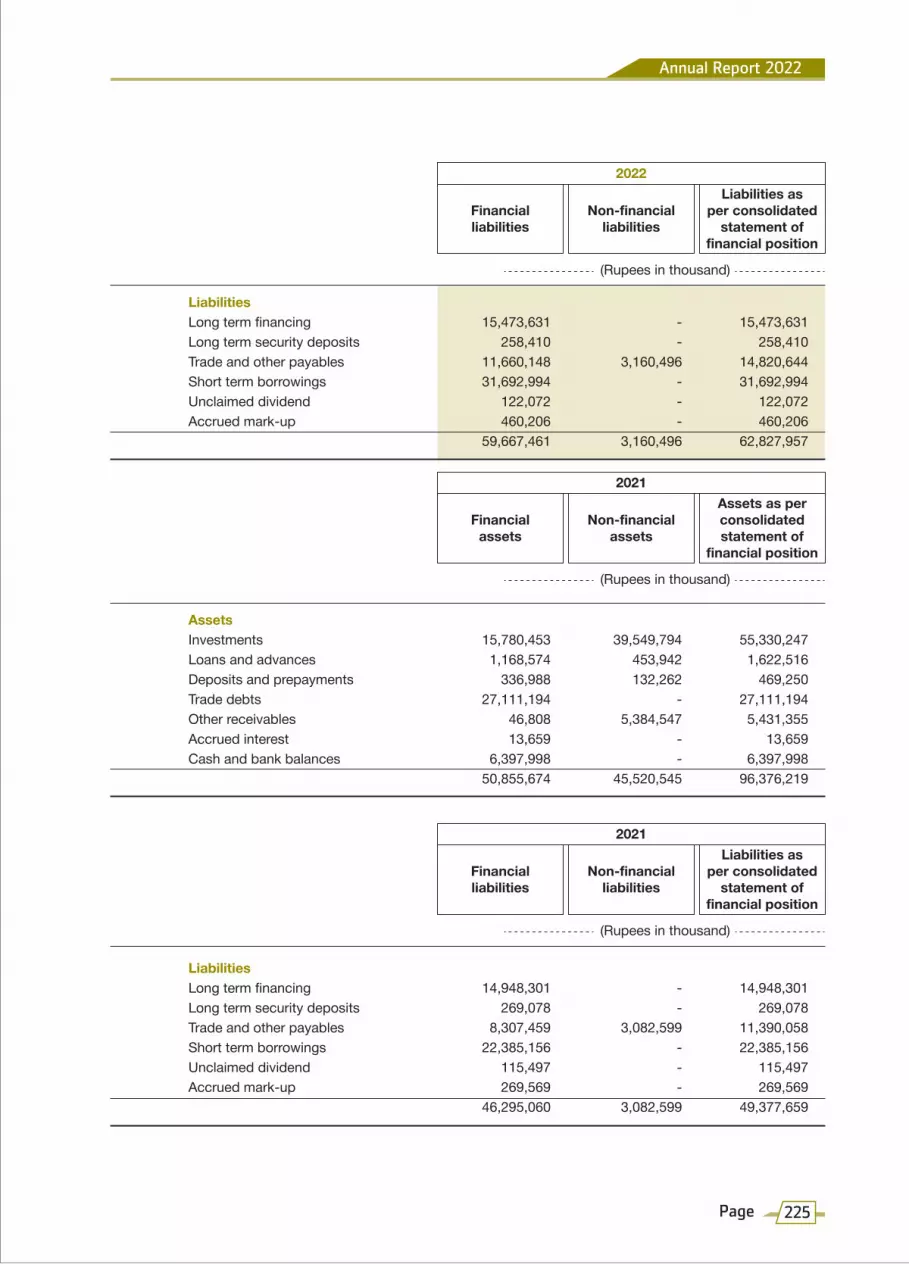
Liabilities asper consolidated
statement offinancial position
Financialliabilities
Non-financialliabilities
2022
(Rupees in thousand)
Liabilities Long term financing 15,473,631 - 15,473,631 Long term security deposits 258,410 - 258,410 Trade and other payables 11,660,148 3,160,496 14,820,644 Short term borrowings 31,692,994 - 31,692,994 Unclaimed dividend 122,072 - 122,072 Accrued mark-up 460,206 - 460,206 59,667,461 3,160,496 62,827,957
Assets Investments 15,780,453 39,549,794 55,330,247 Loans and advances 1,168,574 453,942 1,622,516 Deposits and prepayments 336,988 132,262 469,250 Trade debts 27,111,194 - 27,111,194 Other receivables 46,808 5,384,547 5,431,355 Accrued interest 13,659 - 13,659 Cash and bank balances 6,397,998 - 6,397,998 50,855,674 45,520,545 96,376,219
Liabilities Long term financing 14,948,301 - 14,948,301 Long term security deposits 269,078 - 269,078 Trade and other payables 8,307,459 3,082,599 11,390,058 Short term borrowings 22,385,156 - 22,385,156 Unclaimed dividend 115,497 - 115,497 Accrued mark-up 269,569 - 269,569 46,295,060 3,082,599 49,377,659
Liabilities asper consolidated
statement offinancial position
Financialliabilities
Non-financialliabilities
2021
(Rupees in thousand)
Assets as perconsolidatedstatement of
financial position
Financialassets
Non-financialassets
2021
(Rupees in thousand)
Annual Report 2022
225Page

49 Capital risk management
The Group's objectives when managing capital are to safeguard the Group's ability to continue as a going concern in order to provide returns for shareholders and benefits for other stakeholders and to maintain an optimal capital structure to reduce the cost of capital. In order to maintain or adjust the capital structure, the Group may adjust the amount of dividends paid to shareholders, issue new shares or sell assets to reduce debt. Consistent with others in the industry and the requirements of the lenders, the Group monitors the capital structure on the basis of gearing ratio. This ratio is calculated as borrowings divided by total capital employed. Borrowings represent long term financing, short term borrowings obtained by the Group as referred to in note 5 and note 11 respectively. Total capital employed includes 'total equity' as shown in the consolidated statement of financial position plus 'borrowings'.
2022 2021
Borrowings Rupees in thousand 47,166,625 37,333,457
Total equity Rupees in thousand 126,957,401 120,672,696
Total capital employed Rupees in thousand 174,124,026 158,006,153
Gearing ratio Percentage 27.09 23.63
50 FAIR VALUE MEASUREMENTS - FINANCIAL INSTRUMENTS
i) Fair value hierarchy
Judgments and estimates are made in determining the fair values of the financial instruments that are recognised and measured at fair value in these consolidated financial statements. To provide an indication about the reliability of the inputs used in determining fair value, the Group has classified its financial instruments into the following three levels. An explanation of each level follows underneath the table.
Recurring fair value measurements At 30 June 2022 (Rupees in thousand)
Financial assets Fair value through other comprehensive income 12,382,166 - - 12,382,166 Derivative financial assets - 57,518 - 57,518 Total financial assets 12,382,166 57,518 - 12,439,684
Financial liabilities Derivative financial liabilities - 9,595 - 9,595 Total financial liabilities - 9,595 - 9,595
Level 1 Level 2 Level 3 Total
Nishat Mills Limited and its Subsidiaries
226 Page
For the year ended June 30, 2022Notes to the Consolidated Financial Statements

Recurring fair value measurements At 30 June 2021 (Rupees in thousand)
Financial assets Fair value through other comprehensive income 15,780,453 - - 15,780,453 Derivative financial assets - 8,672 - 8,672 Total financial assets 15,780,453 8,672 - 15,789,125
Financial liabilities Derivative financial liabilities - 57,429 - 57,429 Total financial liabilities - 57,429 - 57,429
The above table does not include fair value information for financial assets and financial liabilities not measured at fair value if the carrying amounts are a reasonable approximation of fair value. Due to short term nature, carrying amounts of certain financial assets and financial liabilities are considered to be the same as their fair value. For the majority of the non-current receivables, the fair values are also not significantly different to their carrying amounts.
There were no transfers between levels 1 and 2 for recurring fair value measurements during the year. Further there was no transfer out of level 3 measurements.
The Group’s policy is to recognise transfers into and transfers out of fair value hierarchy levels as at the end of the reporting period.
Level 1: The fair value of financial instruments traded in active markets (such as publicly traded derivatives, and equity securities) is based on quoted market prices at the end of the reporting period. The quoted market price used for financial assets held by the Group is the current bid price. These instruments are included in level 1.
Level 2: The fair value of financial instruments that are not traded in an active market (for example, over-the-counter derivatives) is determined using valuation techniques which maximise the use of observable market data and rely as little as possible on entity-specific estimates. If all significant inputs required to fair value an instrument are observable, the instrument is included in level 2.
Level 3: If one or more of the significant inputs is not based on observable market data, the instrument is included in level 3. This is the case for unlisted equity securities.
(ii) Valuation techniques used to determine fair values
Specific valuation techniques used to value financial instruments include the use of quoted market prices or dealer quotes for similar instruments.
Level 1 Level 2 Level 3 Total
Annual Report 2022
227Page

CHIEF EXECUTIVE OFFICER CHIEF FINANCIAL OFFICERDIRECTOR
2022 2021 2022 2021
FundedNon-funded
Total facilities 15,750,000 15,832,350 112,846,940 83,747,869 Utilized at the end of the year 9,985,135 8,766,417 58,119,674 25,534,101 Unutilized at the end of the year 5,764,865 7,065,933 54,727,266 58,213,768
52 DATE OF AUTHORIZATION FOR ISSUE
These consolidated financial statements were authorized for issue on 20 September 2022 by the Board of Directors.
53 CORRESPONDING FIGURES
Corresponding figures have been re-arranged, wherever necessary, for the purpose of comparison. However, no significant rearrangements have been made.
54 GENERAL
Figures have been rounded off to the nearest thousand of Rupees unless otherwise stated.
(Rupees in thousand)
51 UNUTILIZED CREDIT FACILITIES
Nishat Mills Limited and its Subsidiaries
228 Page
For the year ended June 30, 2022Notes to the Consolidated Financial Statements

Number ofShareholders
Having sharesPercentage
From ToShares Held
4,607 1 100 169,660 0.05 4,253 101 500 1,142,716 0.33 1,455 501 1,000 1,176,737 0.33 1,820 1,001 5,000 4,603,258 1.31 417 5,001 10,000 3,168,658 0.90 177 10,001 15,000 2,275,792 0.65 111 15,001 20,000 1,996,917 0.57 71 20,001 25,000 1,676,241 0.48 42 25,001 30,000 1,182,130 0.34 34 30,001 35,000 1,113,174 0.32 21 35,001 40,000 810,653 0.23 15 40,001 45,000 641,909 0.18 32 45,001 50,000 1,576,442 0.45 19 50,001 55,000 1,005,929 0.29 13 55,001 60,000 751,431 0.21 7 60,001 65,000 444,998 0.13 7 65,001 70,000 486,400 0.14 14 70,001 75,000 1,021,290 0.29 5 75,001 80,000 394,201 0.11 7 80,001 85,000 581,598 0.17 4 85,001 90,000 351,608 0.10 5 90,001 95,000 463,877 0.13 19 95,001 100,000 1,878,699 0.53 3 100,001 105,000 309,100 0.09 6 105,001 110,000 649,825 0.18 5 110,001 115,000 565,797 0.16 5 115,001 120,000 585,342 0.17 5 120,001 125,000 606,856 0.17 5 125,001 130,000 640,600 0.18 4 130,001 135,000 532,722 0.15 4 135,001 140,000 549,381 0.16 2 140,001 145,000 285,942 0.08 9 145,001 150,000 1,335,012 0.38 3 150,001 155,000 460,000 0.13 6 155,001 160,000 952,858 0.27 2 160,001 165,000 324,160 0.09 2 165,001 170,000 334,100 0.10 1 170,001 175,000 174,700 0.05 3 175,001 180,000 531,115 0.15 1 190,001 195,000 195,000 0.06 6 195,001 200,000 1,197,100 0.34 1 200,001 205,000 201,062 0.06 1 215,001 220,000 218,575 0.06 1 220,001 225,000 225,000 0.06 1 230,001 235,000 231,815 0.07 2 235,001 240,000 475,000 0.14 2 240,001 245,000 486,000 0.14 3 245,001 250,000 750,000 0.21 1 255,001 260,000 259,000 0.07 1 265,001 270,000 268,000 0.08
of the Shares held by the Shareholders of Nishat Mills Limited as at June 30, 2022Pattern of Holding
Annual Report 2022
229Page

of the Shares held by the Shareholders of Nishat Mills Limited as at June 30, 2022Pattern of Holding
Number ofShareholders
Having sharesPercentage
From ToShares Held
2 270,001 275,000 546,400 0.16 3 275,001 280,000 836,879 0.24 1 285,001 290,000 290,000 0.08 1 290,001 295,000 294,394 0.08 1 295,001 300,000 300,000 0.09 1 300,001 305,000 302,500 0.09 2 305,001 310,000 612,592 0.17 1 310,001 315,000 313,170 0.09 1 325,001 330,000 326,842 0.09 1 330,001 335,000 333,000 0.09 1 340,001 345,000 342,500 0.10 3 345,001 350,000 1,047,174 0.30 3 355,001 360,000 1,070,800 0.30 5 365,001 370,000 1,832,251 0.52 1 370,001 375,000 373,285 0.11 1 385,001 390,000 388,800 0.11 1 395,001 400,000 400,000 0.11 1 435,001 440,000 440,000 0.13 1 455,001 460,000 455,800 0.13 1 460,001 465,000 462,992 0.13 2 495,001 500,000 1,000,000 0.28 2 510,001 515,000 1,027,471 0.29 1 545,001 550,000 548,443 0.16 1 555,001 560,000 556,805 0.16 1 570,001 575,000 572,815 0.16 1 590,001 595,000 593,280 0.17 1 595,001 600,000 600,000 0.17 1 600,001 605,000 601,700 0.17 1 610,001 615,000 612,427 0.17 1 620,001 625,000 624,500 0.18 1 660,001 665,000 664,500 0.19 1 665,001 670,000 668,500 0.19 1 670,001 675,000 675,000 0.19 1 680,001 685,000 684,595 0.19 1 690,001 695,000 693,022 0.20 1 695,001 700,000 700,000 0.20 1 800,001 805,000 804,520 0.23 2 830,001 835,000 1,669,400 0.47 1 840,001 845,000 840,427 0.24 1 845,001 850,000 850,000 0.24 1 855,001 860,000 860,000 0.24 1 925,001 930,000 930,000 0.26 1 980,001 985,000 982,356 0.28 1 995,001 1,000,000 1,000,000 0.28 1 1,060,001 1,065,000 1,061,285 0.30 1 1,080,001 1,085,000 1,082,100 0.31 1 1,095,001 1,100,000 1,100,000 0.31 1 1,105,001 1,110,000 1,105,944 0.31 1 1,120,001 1,125,000 1,125,000 0.32 1 1,155,001 1,160,000 1,158,900 0.33
Nishat Mills Limited
230 Page

Number ofShareholders
Having sharesPercentage
From ToShares Held
1 1,190,001 1,195,000 1,190,828 0.34 1 1,295,001 1,300,000 1,300,000 0.37 2 1,310,001 1,315,000 2,624,000 0.75 1 1,345,001 1,350,000 1,346,900 0.38 1 1,375,001 1,380,000 1,380,000 0.39 1 1,385,001 1,390,000 1,386,531 0.39 1 1,450,001 1,455,000 1,451,500 0.41 1 1,475,001 1,480,000 1,477,074 0.42 1 1,570,001 1,575,000 1,572,000 0.45 1 1,620,001 1,625,000 1,625,000 0.46 1 1,690,001 1,695,000 1,692,780 0.48 1 1,945,001 1,950,000 1,946,841 0.55 1 2,175,001 2,180,000 2,176,118 0.62 1 2,410,001 2,415,000 2,415,000 0.69 1 2,475,001 2,480,000 2,477,545 0.70 1 2,485,001 2,490,000 2,488,299 0.71 1 2,655,001 2,660,000 2,656,000 0.76 1 2,810,001 2,815,000 2,814,900 0.80 1 2,935,001 2,940,000 2,939,871 0.84 1 2,995,001 3,000,000 3,000,000 0.85 1 3,245,001 3,250,000 3,250,000 0.92 1 3,335,001 3,340,000 3,338,999 0.95 1 3,485,001 3,490,000 3,488,454 0.99 1 3,500,001 3,505,000 3,504,707 1.00 1 3,995,001 4,000,000 4,000,000 1.14 1 4,370,001 4,375,000 4,372,707 1.24 1 4,880,001 4,885,000 4,885,000 1.39 1 5,255,001 5,260,000 5,256,831 1.50 1 6,450,001 6,455,000 6,450,913 1.83 1 9,865,001 9,870,000 9,869,800 2.81 1 10,885,001 10,890,000 10,886,947 3.10 1 14,495,001 14,500,000 14,496,760 4.12 1 15,075,001 15,080,000 15,075,149 4.29 1 18,695,001 18,700,000 18,698,357 5.32 1 21,190,001 21,195,000 21,191,146 6.03 1 23,100,001 23,105,000 23,101,426 6.57 1 25,670,001 25,675,000 25,673,659 7.30 1 26,245,001 26,250,000 26,248,841 7.47 1 29,225,001 29,230,000 29,228,216 8.31 13,345 351,599,848 100.00
of the Shares held by the Shareholders of Nishat Mills Limited as at June 30, 2022Pattern of Holding
Annual Report 2022
231Page

of the Shares held by the Shareholders of Nishat Mills Limited as at June 30, 2022Pattern of Holding
Sr. Categories of Shareholders Shares Held Percentage No.
1 DIRECTORS, CEO, THEIR SPOUSE AND MINOR CHILDREN 88,667,588 25.22
2 ASSOCIATED COMPANIES, UNDERTAKINGS AND RELATED PARTIES 30,993,093 8.82
3 NIT AND ICP 85,203 0.02
4 Banks Development Financial Institutions, Non banking Financial Institutions 29,023,741 8.25
5 Insurance Companies 13,421,170 3.82
6 Modarabas And Mutual Funds 28,206,486 8.02
7 Shareholders Holding 5% or above 177,714,710 50.54
8 General Public Local 100,141,290 28.48 Foreign 4,465,036 1.27
9 Others Foreign Companies 21,420,000 6.09 Investment Companies 835,886 0.24 Joint Stock Companies 19,858,945 5.65 Provident / Pension Funds And Miscellaneous 14,481,410 4.12
Nishat Mills Limited
232 Page

Information Under Listing Regulation No. 5.19.11 (X) of PakistanStock Exchange Limited Rule Book as on June 30, 2022 Sr. Categories of Shareholders Shares Held Percentage No.
I) ASSOCIATED COMPANIES, UNDERTAKINGS AND RELATED PARTIES
D. G. KHAN CEMENT COMPANY LIMITED 30,289,501 8.61 ADAMJEE INSURANCE COMPANY LIMITED 2,050 0.00 MCB BANK LIMITED 227 0.00 ADAMJEE LIFE ASSURANCE COMPANY LIMITED 231,815 0.07 NISHAT (AZIZ AVENUE) HOTELS AND PROPERITIES LIMITED 342,500 0.10 NISHAT REAL ESTATES DEVELOPMENT COMPANY (PRIVATE) LIMITED 127,000 0.04
II) MUTUAL FUNDS:
PRUDENTIAL STOCKS FUND LTD (03360) 23,500 0.01 PRUDENTIAL STOCKS FUND LIMITED 110 0.00 SAFEWAY MUTUAL FUND LIMITED 13 0.00 CDC - TRUSTEE MCB PAKISTAN STOCK MARKET FUND 2,477,545 0.70 CDC - TRUSTEE PAKISTAN CAPITAL MARKET FUND 55,000 0.02 CDC - TRUSTEE ALHAMRA ISLAMIC STOCK FUND 835,000 0.24 CDC - TRUSTEE ATLAS STOCK MARKET FUND 2,656,000 0.76 CDC - TRUSTEE MEEZAN BALANCED FUND 86,427 0.02 CDC - TRUSTEE ALFALAH GHP VALUE FUND 104,000 0.03 CDC - TRUSTEE AKD INDEX TRACKER FUND 41,047 0.01 CDC - TRUSTEE AKD OPPORTUNITY FUND 50,000 0.01 CDC-TRUSTEE ALHAMRA ISLAMIC ASSET ALLOCATION FUND 400,000 0.11 CDC - TRUSTEE AL MEEZAN MUTUAL FUND 355,300 0.10 CDC - TRUSTEE MEEZAN ISLAMIC FUND 2,488,299 0.71 CDC - TRUSTEE UBL STOCK ADVANTAGE FUND 371 0.00 CDC - TRUSTEE ATLAS ISLAMIC STOCK FUND 1,692,780 0.48 CDC - TRUSTEE AL-AMEEN SHARIAH STOCK FUND 1,477,074 0.42 CDC - TRUSTEE NBP STOCK FUND 2,176,118 0.62 CDC - TRUSTEE NBP BALANCED FUND 137,300 0.04 CDC - TRUSTEE MEEZAN TAHAFFUZ PENSION FUND - EQUITY SUB FUND 455,800 0.13 CDC - TRUSTEE APF-EQUITY SUB FUND 160,000 0.05 CDC - TRUSTEE ALFALAH GHP ISLAMIC STOCK FUND 347,174 0.10 CDC - TRUSTEE NBP ISLAMIC SARMAYA IZAFA FUND 601,700 0.17 CDC - TRUSTEE APIF - EQUITY SUB FUND 237,500 0.07 CDC - TRUSTEE HBL MULTI - ASSET FUND 8,000 0.00 CDC - TRUSTEE MCB PAKISTAN ASSET ALLOCATION FUND 30,000 0.01 CDC - TRUSTEE ALFALAH GHP STOCK FUND 366,535 0.10 CDC - TRUSTEE ALFALAH GHP ALPHA FUND 154,900 0.04 CDC - TRUSTEE NIT-EQUITY MARKET OPPORTUNITY FUND 1,946,841 0.55 CDC - TRUSTEE ABL STOCK FUND 693,022 0.20 CDC - TRUSTEE LAKSON EQUITY FUND 294,394 0.08 CDC - TRUSTEE NBP SARMAYA IZAFA FUND 115,900 0.03 CDC-TRUSTEE HBL ISLAMIC STOCK FUND 54,048 0.02
Annual Report 2022
233Page

Sr. Categories of Shareholders Shares Held Percentage No.
CDC - TRUSTEE HBL IPF EQUITY SUB FUND 41,400 0.01 CDC - TRUSTEE HBL PF EQUITY SUB FUND 18,500 0.01 CDC - TRUSTEE KSE MEEZAN INDEX FUND 512,471 0.15 MCBFSL - TRUSTEE PAK OMAN ADVANTAGE ASSET ALLOCATION FUND 5,000 0.00 MCBFSL - TRUSTEE ABL ISLAMIC STOCK FUND 612,427 0.17 CDC - TRUSTEE UBL ASSET ALLOCATION FUND 6,400 0.00 CDC - TRUSTEE FIRST CAPITAL MUTUAL FUND 30,000 0.01 CDC - TRUSTEE AL-AMEEN ISLAMIC ASSET ALLOCATION FUND 59,900 0.02 CDC - TRUSTEE AWT ISLAMIC STOCK FUND 43,000 0.01 CDC - TRUSTEE NATIONAL INVESTMENT (UNIT) TRUST 3,338,999 0.95 CDC - TRUSTEE HBL ISLAMIC EQUITY FUND 14,551 0.00 CDC - TRUSTEE ABL ISLAMIC PENSION FUND - EQUITY SUB FUND 500 0.00 CDC - TRUSTEE ABL PENSION FUND - EQUITY SUB FUND 18,000 0.01 CDC - TRUSTEE NBP ISLAMIC STOCK FUND 804,520 0.23 CDC - TRUSTEE AWT STOCK FUND 18,153 0.01 CDC - TRUSTEE NIT ISLAMIC EQUITY FUND 365,100 0.10 CDC-TRUSTEE NITIPF EQUITY SUB-FUND 20,000 0.01 CDC-TRUSTEE NITPF EQUITY SUB-FUND 14,500 0.00 CDC - TRUSTEE NBP ISLAMIC ACTIVE ALLOCATION EQUITY FUND 85,281 0.02 CDC - TRUSTEE HBL ISLAMIC ASSET ALLOCATION FUND 26,700 0.01 CDC - TRUSTEE FAYSAL MTS FUND - MT 159,858 0.05 CDC - TRUSTEE MEEZAN ASSET ALLOCATION FUND 75,700 0.02 CDC - TRUSTEE LAKSON TACTICAL FUND 36,581 0.01 CDC - TRUSTEE LAKSON ISLAMIC TACTICAL FUND 10,099 0.00 MCBFSL TRUSTEE ABL ISLAMIC DEDICATED STOCK FUND 95,400 0.03 CDC - TRUSTEE ALFALAH GHP ISLAMIC DEDICATED EQUITY FUND 46,626 0.01 CDC TRUSTEE - MEEZAN DEDICATED EQUITY FUND 116,200 0.03 DCCL - TRUSTEE AKD ISLAMIC STOCK FUND 75,000 0.02 CDC - TRUSTEE NBP ISLAMIC REGULAR INCOME FUND 27,500 0.01 CDC - TRUSTEE ATLAS ISLAMIC DEDICATED STOCK FUND 198,600 0.06 CDC - TRUSTEE GOLDEN ARROW STOCK FUND 275,000 0.08 CDC - TRUSTEE NIT ASSET ALLOCATION FUND 25,000 0.01 CDC - TRUSTEE ALFALAH CONSUMER INDEX EXCHANGE TRADED FUND 45,305 0.01 CDC-TRUSTEE ALHAMRA ISLAMIC PENSION FUND - EQUITY SUB FUND 200,000 0.06 CDC - TRUSTEE PAKISTAN PENSION FUND - EQUITY SUB FUND 99,259 0.03 CDC - TRUSTEE AGIPF EQUITY SUB-FUND 18,600 0.01 CDC - TRUSTEE AGPF EQUITY SUB-FUND 12,800 0.00
Information Under Listing Regulation No. 5.19.11 (X) of PakistanStock Exchange Limited Rule Book as on June 30, 2022
Nishat Mills Limited
234 Page

Sr. Categories of Shareholders Shares Held Percentage No.
III) DIRECTORS, CEO, THEIR SPOUSE AND MINOR CHILDREN
1. MIAN UMER MANSHA DIRECTOR / CHIEF EXECUTIVE OFFICER 44,292,572 12.60 2. MIAN HASSAN MANSHA DIRECTOR / CHAIRMAN 44,372,016 12.62 3. MR. MAHMOOD AKHTAR DIRECTOR 500 0.00 4. MR. FARID NOOR ALI FAZAL DIRECTOR 500 0.00 5. MRS. SARA AQEEL DIRECTOR 1,500 0.00 6. MRS. MEHAK ADIL DIRECTOR 500 0.00
IV) EXECUTIVES
MR. MAQSOOD AHMAD 500 0.00
V) PUBLIC SECTOR, COMPANIES AND CORPORATIONS
JOINT STOCK COMPANIES 19,858,945 5.65
VI) SHAREHOLDERS HOLDING FIVE PERCENT OR MORE VOTING INTEREST IN THE LISTED COMPANY
1. MRS NAZ MANSHA SHAREHOLDER 29,188,712 8.30 2. MIAN RAZA MANSHA SHAREHOLDER 29,571,909 8.41 3. MIAN UMER MANSHA DIRECTOR / CHIEF EXECUTIVE OFFICER 44,292,572 12.60 4. MIAN HASSAN MANSHA DIRECTOR / CHAIRMAN 44,372,016 12.62 5. D. G. KHAN CEMENT ASSOCIATED COMPANY 30,289,501 8.61 COMPANY LIMITED
VII) BANKS, DEVELOPMENT FINANCIAL INSTITUTIONS, NON-BANKING FINANCIAL INSTITUTIONS, INSURANCE COMPANIES, TAKAFUL, MODARABAS AND PENSION FUNDS
1. INVESTMENT COMPANIES 835,886 0.24 2. INSURANCE COMPANIES 13,421,170 3.82 3. FINANCIAL INSTITUTIONS 29,023,741 8.25 4. MODARABAS COMPANIES 131,858 0.04 5. PENSION / PROVIDENT FUNDS 14,481,410 4.12
INFORMATION UNDER LISTING REGULATION NO. 5.19.11 (XII) OF PAKISTAN STOCK EXCHANGE LIMITED RULE BOOK AS ON JUNE 30, 2022
There is no trading in the shares of the Company, carried out by its Directors, Chief Executive Officer, Chief Financial Officer, Head of Internal Audit, Company Secretary, their spouses and minor children and other employees of the Company for whom the Board of Directors have set the threshold.
Information Under Listing Regulation No. 5.19.11 (X) of PakistanStock Exchange Limited Rule Book as on June 30, 2022
Annual Report 2022
235Page

Nishat Mills Limited
236 Page

Annual Report 2022
237Page

Nishat Mills Limited
238 Page
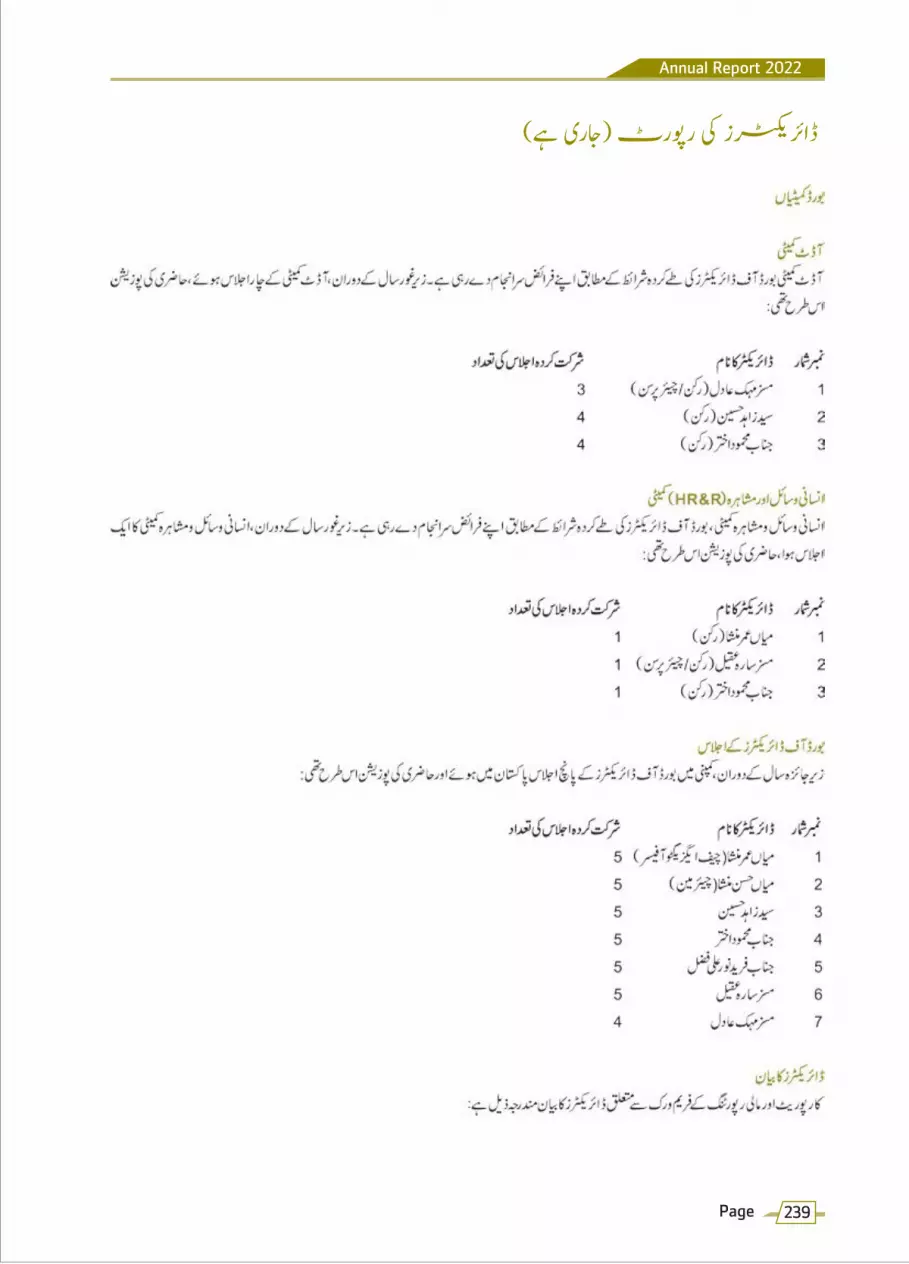
Annual Report 2022
239Page

Nishat Mills Limited
240 Page
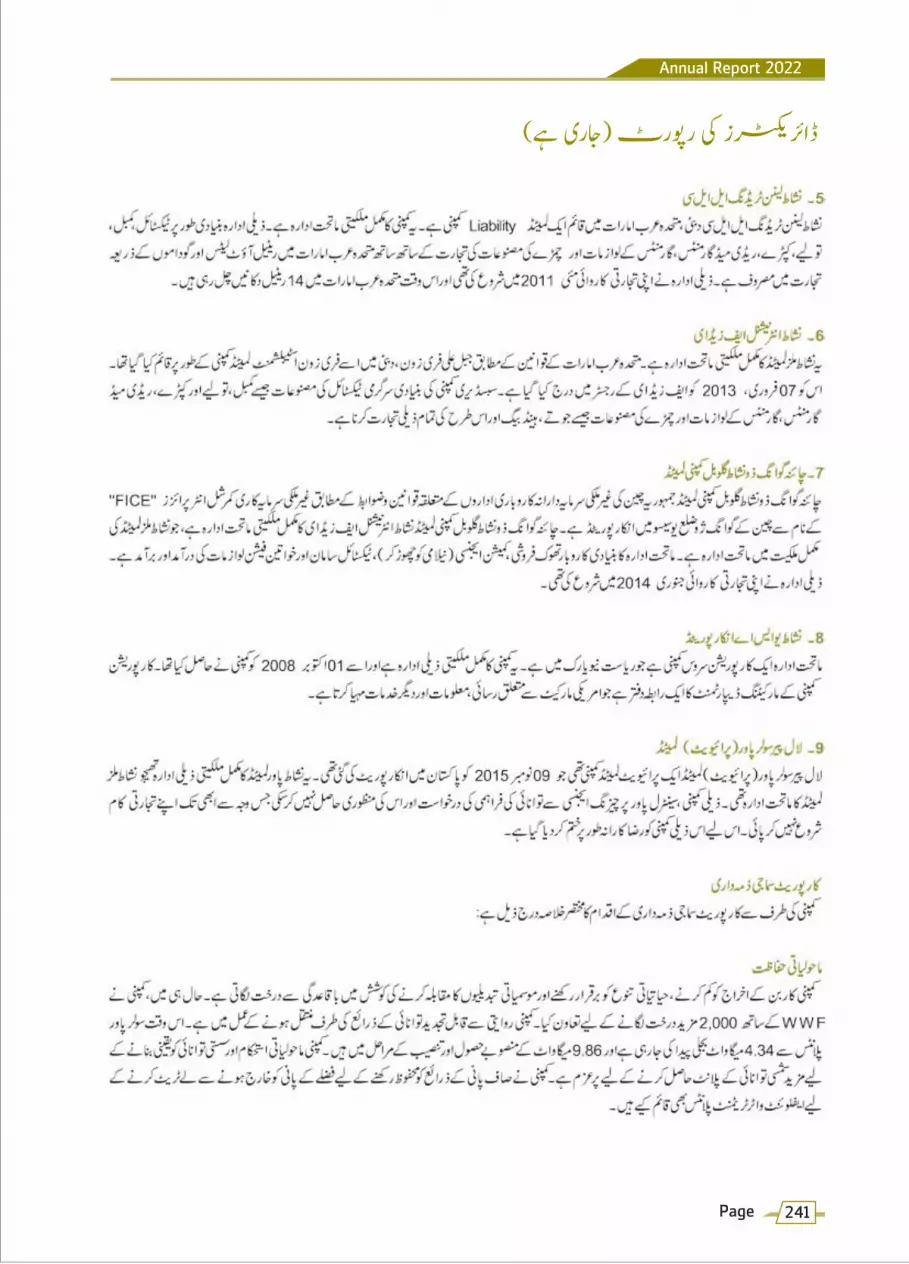
Annual Report 2022
241Page

Nishat Mills Limited
242 Page

Annual Report 2022
243Page

Nishat Mills Limited
244 Page

Annual Report 2022
245Page

Nishat Mills Limited
246 Page

Annual Report 2022
247Page

(000) 2022(000) 2021
115,768,065
17,335,571
18,358,269
3,290,619
2,160,365
3,328,797
12,907,285
10,311,674
71,431,010
9,317,855
11,137,991
2,838,310
1,229,179
2,722,637
7,070,502
5,922,470
Nishat Mills Limited
248 Page
(000) 2022(000) 2021
115,768,065
17,335,571
18,358,269
3,290,619
2,160,365
3,328,797
12,907,285
10,311,674
71,431,010
9,317,855
11,137,991
2,838,310
1,229,179
2,722,637
7,070,502
5,922,470

Form of Proxy
as witness may hand this day of 2022
Signed by the said member
in presence of
Signature of witness
Name
Address
CNIC #
Signature of witness
Name
Address
CNIC #
Please quote:
Pleaseaffix
revenuestampRs. 50
Signature(s) of Member(s)
I /We
of
being a member of Nishat Mills Limited, hereby appoint
of
or failing him/her
of
member(s) of the Company, as my/our proxy in my/our absence to attend and vote for me/us and on my/our behalf at the Annual General Meeting of the Company to be held on October 28, 2022 (Friday), at 10:15 A.M at Emporium Mall, The Nishat Hotel, Trade and Finance Centre Block, Near Expo Centre, Abdul Haq Road, Johar Town, Lahore.
Folio No. Shares held CDC A/C. No.
Important: This instrument appointing a proxy, duly completed, must be received at the Registered Office of the Company at Nishat House, 53-A, Lawrence Road, Lahore not later than 48 hours before the time to holding the annual general meeting.
AFFIXCORRECTPOSTAGE
The Company Secretary
NISHAT MILLS LIMITEDNishat House, 53-A, Lawrence Road, Lahore.Tel: 042 - 36360154UAN: 042 - 111 113 333

2022

AFFIXCORRECTPOSTAGE
The Company Secretary
NISHAT MILLS LIMITEDNishat House, 53-A, Lawrence Road, Lahore.Tel: 042 - 36360154UAN: 042 - 111 113 333


VE
RS
AT
ILE
P
h: +
92 4
2 37
12 1
920
REGISTERED OFFICE:Nishat House, 53-A, Lawrence Road, Lahore
Tel: 042-36360154, 042-111 113 333
www.nishatmillsltd.com


