Embed Size (px)
Citation preview

Free Radical Biology and Medicine 59 (2013) 14–26
Contents lists available at SciVerse ScienceDirect
Free Radical Biology and Medicine
0891-58
http://d
n Corr
E-m
journal homepage: www.elsevier.com/locate/freeradbiomed
Methods in Free Radical Biology and Medicine
Nitrated fatty acids: synthesis and measurement
Steven R. Woodcock, Gustavo Bonacci, Stacy L. Gelhaus, Francisco J. Schopfer n
a Department of Pharmacology & Chemical Biology, University of Pittsburgh, Pittsburgh, PA 15261, USA
a r t i c l e i n f o
Available online 29 November 2012
Keywords:
Nitrated fatty acid
Nitration
Mass spectrometry
Organic synthesis
Quantification
Free radicals
49/$ - see front matter & 2012 Elsevier Inc. A
x.doi.org/10.1016/j.freeradbiomed.2012.11.01
esponding author. Fax: þ1 412 648 2999.
ail address: [email protected] (F.J. Schopfer).
a b s t r a c t
Nitrated fatty acids are the product of nitrogen dioxide reaction with unsaturated fatty acids. The
discovery of peroxynitrite and peroxidase-induced nitration of biomolecules led to the initial reports of
endogenous nitrated fatty acids. These species increase during ischemia/reperfusion, but concentra-
tions are often at or near the limits of detection. Here, we describe multiple methods for nitrated fatty
acid synthesis and sample extraction from complex biological matrices and a rigorous method of
qualitative and quantitative detection of nitrated fatty acids by liquid chromatography–mass spectro-
metry. In addition, optimized instrument conditions and caveats regarding data interpretation are
discussed.
& 2012 Elsevier Inc. All rights reserved.
Introduction
The enzymatic and free radical-induced oxidation of unsatu-rated fatty acids generates bioactive molecules that participate incell signaling [1–3]. These signaling actions include the activationof G-protein-coupled receptors [4] and alkylation of both thiol-containing small molecules and cysteine residues in proteins [3]. Inaddition to oxidative stress, nitrative stress is characterized bysustained nitration through the formation of the nitrogen dioxide(�NO2) radical. The biomolecules that are targets of nitrationinclude tyrosine residues [5], nucleic acids (guanine, cGMP, GTP)[6], and unsaturated fatty acids [7]. In particular, the nitration ofunsaturated fatty acids results in the formation of electrophilicspecies that contain a conjugated nitroalkene moiety. The electro-philicity of nitrated fatty acids (NO2-FA), mainly represented bynitro-oleic (NO2-OA), nitro-linoleic (NO2-LA), and nitro-arachidonicacids, promotes reaction with nucleophiles to generate Michaeladdition products [8]. The targeting of specific cysteine residues bylipid-derived electrophiles is central to modulating enzymaticactivity and signaling pathways. Nitrated fatty acids have beenshown to potently activate the Nrf2/Keap1 pathway, chaperoneheat shock pathways, and inhibit inflammatory responses throughmultilevel inhibition of NF-kB [3]. These actions result in protec-tive effects in various animal models ranging from metabolicdisorders (diabetes) and atherosclerosis to sepsis and ischemia/reperfusion [3]. The data stemming from the pharmacologicalactions of NO2-FA is in stark contrast to their characterizationand quantification in vivo. This is partially due to syntheticchallenges of obtaining pure regioisomers, sensitivity to alkaline
ll rights reserved.
5
conditions, the electrophilic nature of the nitrated fatty acid, andthe reversible binding to cysteines, all of which result in additionalchallenges for accurate quantification.
Principles
Nitrated fatty acids form upon exposure of unsaturated fattyacids to nitrating species. In particular, �NO2 plays a central rolein the formation of these fatty acid nitroalkenes [9]. The type andcharacteristics of the precursor fatty acid define the formation ofvarious products. Two main mechanisms have been proposed forthe formation of NO2-FA (Fig. 1). The first involves hydrogen atomabstraction from the bis-allylic carbon of a polyunsaturated fattyacid, yielding a delocalized pentadienyl radical. Various radicalsmay participate in this initial step including hydroxyl, peroxyl,and carbon-centered radicals derived from fatty acid oxidationand �NO2. These steps are common to the formation of other lipidoxidation products such as isoprostanes and hydroperoxides.Whereas the formation of hydroperoxides and isoprostanes ischaracterized by the subsequent insertion of oxygen to form aperoxyl radical [10], NO2-FA are generated by addition of �NO2 tothe fatty acid radical. A second, less studied, pathway initiallyinvolves the direct addition of �NO2 to the fatty acid to form anitroalkenyl radical. This radical can then react with oxygen toform a nitroperoxyl fatty acid, react with another �NO2 to formunstable nitro-nitrito or dinitro compounds, or lose a hydrogenatom via abstraction by another radical (i.e., �NO2, �OH) to re-form the double bond [11]. Thus, the formation of a nitrated fattyacid can occur via multiple reaction mechanisms and its analysisinvolves the development of mass spectrometry tools that allowfor the proper characterization of the various regioisomers [12].

Fig. 1. Radical-induced mechanism of polyunsaturated acid nitration. Starting with a radical abstraction from the bis-allylic position, the delocalized radical may react
with oxygen or nitrogen dioxide. Alternatively, direct addition of nitrogen dioxide to one double bond produces a nonstabilized radical intermediate that may react with
available oxygen or nitrogen dioxide (the products of which may in turn eliminate nitrous acid and generate the double bond) or lose a second hydrogen to radical
abstraction and regenerate the double bond. Radical intermediates may also abstract available bis-allylic hydrogens and propagate the radical chain reaction.
Fig. 2. Nitroselenation/nitromercuration synthesis of nitro-oleic acid. This is a two-step method of synthesizing an equimolar distribution of nitrated regioisomers. The
combination of selenyl and mercurial reagents activates the double bond to nitration and are oxidized in a second step to generate the nitroalkene. This approach provides
a convenient method of synthesizing NO2-FA appropriate to many uses, particularly isotopically labeled material.
S.R. Woodcock et al. / Free Radical Biology and Medicine 59 (2013) 14–26 15
Consequently, synthetic strategies are critical for the confirma-tion of proposed structures derived from mass spectrometricanalysis.
Pros and cons of available nitro fatty acid synthetic strategies
Many different approaches have been described for generatingNO2-FA. These methods can be separated into three groups basedon specificity (product diversity) and practicality.
Nitrogen dioxide/nitronium ion
This method is based on the direct application of a nitrogendioxide source to unsaturated fatty acids. Despite giving an array ofproducts and by-products, these approaches are of value because thereaction mimics some biological conditions. Applying this reaction toa biological matrix results in the formation of higher concentrationsof putative endogenous products; thus allowing for the initialidentification, analysis, and characterization of multiple novel nitrated
species that could be formed during pathophysiological conditionsresulting in increased NO2
� levels and decreased pH values, withoutregard to stability or subsequent reactivity. The limitation of �NO2-induced nitration is its high reactivity and low selectivity.
Nitroselenation/nitromercuriation
This approach generates nitroalkenes through a nitroselenationreaction, which activates the alkene to direct nitration. These reac-tions require additional synthetic skills and have at least two steps,but greatly reduce the purification phase and allow for well-definedproducts. Although nitromercuriation [13] has not been specificallyapplied to fatty acids, it has been successfully used in other synthe-tic procedures. Nitroselenation [14] is a subsequent version ofthe method that is preferred for synthesis of NO2-FA when mono-or diunsaturated fatty acids are used as substrates. In particular, thisreaction has been used to generate NO2-LA and NO2-OA regioisomersthat were obtained in equal proportions (25% of each of the fourNO2-LA isomers and 50% of each NO2-OA) [7,15].

S.R. Woodcock et al. / Free Radical Biology and Medicine 59 (2013) 14–2616
Full synthesis
The third approach consists of specific isomer synthesis. All of thestrategies used to this end are based on the Henry nitroaldol reactionand have been used to successfully synthesize positional and stereo-selective isomers of NO2-OA and NO2-LA, namely 9(E)-nitro-octadec-9-enoic acid (9(E)-NO2-OA), 10(E)-nitro-octadec-9-enoic acid (10(E)-NO2-OA) [16,17], 10, 12(E, Z)-nitro-octoadeca-10, 12-dienoic acid(10(E)-NO2-LA) [18], and the positional analogue 12(E)-nitro-octa-dec-12-enoic acid [19]. These techniques require better syntheticskills than the previously mentioned techniques, but afford stereo-and regiospecific synthetic products that can reach upward of 99%purity. This is the main advantage over the other techniques in whichsingle-species purification is very difficult or not possible. Thisapproach requires protecting the carboxylic acid group during thesynthetic steps. Two strategies have been successfully used for this:methyl [17] and allyl esters [16]. Methyl esters are easy to synthesize,but require either 6 M HCl reflux or an enzymatic lipase-basedsaponification method with unknown scalability. In contrast, allylesters can be removed under milder conditions (i.e., formic acid andcatalytic palladium) for higher yields. With regard to the selection ofthe base to catalyze the nitro aldol condensation, either 1,8-diazabi-cyclo[5.4.0]undec-7-ene (DBU) or t-BuOK has been successfully used.The activation/elimination step has been typically performed byacetylating the nitrohydroxy intermediates. The acetoxy groups weresubsequently eliminated to form the nitroalkene double bond, using4-dimethylaminopyridine (DMAP) or Na2CO3 as a mild base.
Commercial sources
Two different nitrated fatty acids are commercially available frommultiple vendors. These are 9(E)-NO2-OA (CAS 875685-44-2) and10(E)-NO2-OA (CAS 88127-53-1). Unfortunately, the actual cost of theproducts makes their use in animal models prohibitively expensive. Ifdelivery in animal or other large-scale use is planned, in-housesynthetic strategies are encouraged. No commercial sources arecurrently available for isotopically labeled NO2-FA.
Synthesis of isotopically labeled standards
Various isotopically labeled standards can be synthesized andpurified. The utility of the various NO2-FA isotopes differs andtheir benefits and drawbacks are specifically discussed in view oftheir use in stable isotope dilution mass spectrometry-basedquantifications and radioactive tracer experiments.
15N-labeled standards15N-labeled standards are easy to obtain by acidic nitration and
nitroselenation reactions. A 99% Na[15N]O2 is available from Cam-bridge Isotope Labs at a low cost, making it easy and affordable toreplace [14N]O2
� salts. The full synthetic approach, based on thenitroaldol condensation, relies on one of the alkyl chains containing aterminal NO2 group. Thus, if not available, a [15N]O2
� is added duringthe initial synthetic steps to the terminal position of the starting alkylmaterial using a nitroaldol or Kornblum nitration reaction [20]. Thesubsequent loss of material at each step requires the generation of alarge amount of 15N-labeled starting material, which is not econom-ical. This makes the full synthesis of [15N]O2-labeled products lessconvenient compared to the other approaches used to generateisotopically labeled internal standards.
Stable isotope 13C- and 2H-labeled standards
Various fatty acids labeled with 13C at one or all backbone carbonsare commercially available, making methods that start from a13C-labeled unsaturated fatty acid very attractive. The first and mostnonspecific method (nitration under acidic conditions) is not a viableoption to obtain 13C-labeled products. The yields are too low,
purification is difficult, and the initial 13C-labeled material is tooexpensive for this strategy to be of value. The second approach,nitroselenation, is the best option for obtaining labeled standards.The yields are high enough (�30%) to obtain pure labeled products.The third approach, nitroaldol condensation, is less practicalfor synthesizing and purifying 13C-labeled products because itagain relies on obtaining 13C-labeled substrates for the nitroaldolcondensation reactions, in larger quantities because of subsequentmass loss (often less than 10% overall yield). Most potential reactantseither are not commercially available or are more expensive than theavailable 13C18-labeled oleic or linoleic acids. Some 2H-labeled lipidsare also available, but often the deuteration is placed only on thealkenyl positions, resulting in the loss of a deuterium duringsynthesis.
3H-labeled standards
These standards are of value for following the metabolic path-ways of NO2-FA both in vivo and in vitro. Commercially availablelipids are typically 3H-labeled on the double bonds. Similar to 13Clabeling, the use of acidic nitration is impractical when startingfrom 3H-labeled unsaturated fatty acids. Note that the last step ofthe nitroselenation reaction proceeds through an oxidation/elim-ination that eliminates one olefinic hydrogen located at the carbona to the NO2 group. The loss of one 3H atom reduces the effectivelabeling by 50% in the case of NO2-OA and by 25% for NO2-LA. Thismethodology has been previously used to radioactively follow themetabolites of NO2-OA in vivo [21].
Synthetic protocols
Reagents for synthetic protocols
Note. In general, use caution as most of the reagents inthese protocols are toxic or dangerous in quantity. Please readthe associated MSDS for specific precautions. For all syntheticprocedures, ensure adequate ventilation, and preferably handlechemicals in well-ventilated fume hoods. Use gloves and safetygoggles during all procedures.
Method 1: nitroselenation
�
Oleic acid (Nucheck Prep, Cat. No. U-46-A) � Sodium nitrite (Sigma–Aldrich, Cat. No. 237213) � Phenylselenyl bromide (Sigma–Aldrich, Cat. No. 243965)(CAUTION: stench, toxic, and a powerful lachrymator)
� Mercury (II) chloride (Sigma–Aldrich, Cat. No. 215465) � Hydrogen peroxide, 30% (Sigma–Aldrich, Cat. No. 216763) � Acetonitrile (Acroseal, Fisher, Cat. No. AC61096)Method 2: 9-nitro-oleic acid full synthesis
�
9-Bromononanoic acid (TCI America, Cat. No. B2323) � Allyl alcohol (Sigma–Aldrich, Cat. No. 240532) � Silver nitrite (Sigma–Aldrich, Cat. No. 227188) � p-Toluenesulfonic acid (Sigma–Aldrich, Cat. No. 402885) � DBU (Sigma–Aldrich, Cat. No. 139009) � Acetic anhydride (Sigma–Aldrich, Cat. No. 242845) � DMAP (Sigma–Aldrich, Cat. No. 107700) � Sodium carbonate (Sigma–Aldrich, Cat. No. 223484) � Toluene (Fisher, Cat. No. AC17716) � Palladium tetrakis(triphenylphosphine) (Strem, Cat. No. 46-2150) � Formic acid (95%) (Sigma–Aldrich, Cat. No. F0507)
S.R. Woodcock et al. / Free Radical Biology and Medicine 59 (2013) 14–26 17
Common reagents for both methods
�
Ethyl ether, anhydrous ACS (Fisher) � Tetrahydrofuran (Acroseal, Fisher, Cat. No. AC32697) � Ethyl acetate (Fisher, Cat. No. E145) � Silica gel (Silicycle, F60 Silica 40–63 mm, Cat. No. R10030B) � Sodium sulfate (Sigma–Aldrich, Cat. No. 238597) � Celite 545 (Sigma–Aldrich, Cat. No. 22140) � Iodine (Aldrich, Cat. No. 207772) � Phosphomolybdic acid solution (for chromatography) (Sigma–Aldrich, Cat. No. 02553)
Prepared solutions
�
Sodium hydroxide, 1 M � Hydrochloric acid, 1 M � Hydrochloric acid, 0.1 M � Saturated sodium bicarbonate � Diluted sodium bicarbonate (dilute the saturated solution toone-half concentration)
� Saturated ammonium chloride � Saturated sodium chloride (brine)Equipment for synthetic protocols
�
Magnetic stir bar(s) � Separatory funnel, 60 ml � Separatory funnel, 125 ml � Round-bottom flask, 25 ml � Round-bottom flask, 50 ml � Round-bottom flask, 100 ml � Heating mantle or oil bath � Variac heating control � Condenser (Quark, Cat. No. QC-21) � Rubber septa � N2 source (manifold or balloon) � Ice bath � Glass syringe (Aldrich, Cat. No. Z181455) � Needles, 18-gauge�10 in. (Aldrich, Cat. No. Z117102) � Disposable syringe, 1 ml (VWR, Cat. No. 89174-490) � Disposable syringe, 3 ml (Aldrich, Cat. No. Z248002) � Disposable syringe, 10 ml (Aldrich, Cat. No. Z248029) � Needles, 18-gauge�1½ in. (Aldrich, Cat. No. Z118044) � Dean-Stark trap (2 ml) (Quark, Cat. No. QD-43) � Fritted glass Buchner funnel (coarse, 15–30 ml) (Quark, Cat.No. QFN-10)
� Chromatography column, 203�19 mm (Quark, Cat. No. QCH-3) � Culture tubes, 13�100 mm (VWR, 47729-572) � Culture tubes, 16�100 mm (VWR, 47729-576) � Thin-layer chromatography (TLC) plates, analytical (silica gel,aluminum or glass back, i.e., VWR, Cat. No. EMD-5549-4 orEM-15326-1)
� TLC plates, preparatory (20�20 cm, silica gel, glass back,Analtech, GF 81003)
� Pipettes, 53/4 in. � UV lamp, 254 nm (Fisher, Cat. No. 11-992-29)General techniques
See [22,23] for general methods and descriptions of thesetechniques.
Air-sensitive reactions
�
Cut off the large end of a 3 ml plastic syringe.�
Attach and seal a balloon filled with N2 or Ar to the open end. � Top with an 18-gauge needle to provide a constant source oflow-pressure inert atmosphere in the absence of a nitrogen orargon line system.
Drying glassware
�
Glassware for reactions, including glass syringes and needlesfor solvent transfers, should be oven-dried and cooled underdry nitrogen before using.TLC
�
Spot solutions of products or reaction mixtures along with aco-spot of starting material for comparison. � Elute with the given solvent mixture. � Allyl esters can be easily visualized by using an iodinechamber.
� Nitroalkenes can be easily visualized with a UV lamp at254 nm.
� Other impurities or reagents may be visualized with a phos-phomolybdic acid dip.
Nitroselenation protocol for NO2-OA (1 g scale) (Fig. 2) [7]
Synthesis
�
Oven-dry a 100 ml round-bottom flask containing a stir bar(see Drying glassware). � Cool to room temperature under nitrogen (see Air-sensitivereactions).
� Add 12 ml tetrahydrofuran to the flask via a glass syringe. � Add one freshly opened 1.00 g ampoule of oleic acid(3.5 mmol) to the flask.
� Rinse in with 9 ml acetonitrile (ACN) via glass syringe. � Stir and cool the flask in an ice bath for 20 min. � Add 1.15 g mercury chloride (4.2 mmol). � Stir cold for 10 min. � Add 0.93 g phenylselenyl bromide (3.9 mmol). CAUTION: phe-nylselenyl bromide is a powerful lachrymator. Weigh andtransfer rapidly with adequate ventilation.
� Stir cold for 10 min. � Add 0.49 g sodium nitrite (7.1 mmol). � Rinse in with 3 ml remaining ACN to the flask. � Stir the flask under nitrogen, in the ice bath, at approximately0 1C for 4 h.
� The solution should gradually develop cloudiness and a yellowcolor. (Note: This reaction is difficult to follow by TLC.)
� Layer 5 ml silica gel (bottom) and 5 ml Celite (top) in a30 ml fritted glass Buchner funnel and cover with afilter paper.
� Filter the yellow cloudy suspension containing the nitroselenylintermediate through the fritted glass funnel and collect in a100 ml round-bottom flask.
� Wash the flask and silica twice with 5 ml portions of tetra-hydrofuran and combine the filtrate and washings.
� Remove the solvents by rotary evaporation. CAUTION: nitro-gen dioxide vapors, use adequate ventilation.
� Redissolve the residual oil in 12 ml tetrahydrofuran. � Transfer to a clean 50 ml round-bottom flask containing a stir bar. � Cool the solution in an ice bath. (Note: No nitrogen inletnecessary for this step.)
� Add aqueous hydrogen peroxide (30% aqueous, 4.0 ml,35 mmol) to the stirred solution dropwise over 10 min.
� Stir the resulting solution cold for 1 h.
S.R. Woodcock et al. / Free Radical Biology and Medicine 59 (2013) 14–2618
�
Add 10 ml deionized water and 10 ml diethyl ether to quenchand partition, stir 5 min.Aqueous workup
�
Transfer the mixture to a 60 ml separatory funnel. � Separate and set aside the (top) product-containing organic layer. � Extract the aqueous phase 3� with 10 ml portions of ether. � Combine the organic layers and replace in separatory funnel.The aqueous layer may be discarded.
� Wash 3� with 10 ml water. These and subsequent aqueouslayers may also be discarded.
� Wash 2� with 5 ml diluted sodium bicarbonate. � Wash 3� with 5 ml water. � Wash 2� with 5 ml 0.1 M hydrochloric acid. � Wash 3� with 5 ml water. � Wash 2� with 5 ml brine. � Transfer the organic layer to an Erlenmeyer flask. � Add 2–4 g of anhydrous sodium sulfate to dry solution, letstand 20 min.
� Filter through a plug of Celite and silica gel in a fritted glassfunnel.
� Collect the crude product in a 100 ml round-bottom flask. � Remove the solvents from the collected solution by rotaryevaporation.
� Purify the crude product by chromatography. � TLC (5% MeOH/CHCl3) Rf ¼ 0.58. (Note: Product formed onlyafter hydrogen peroxide step.)
� UV–Vis: the product NO2-OA or 9-NO2-OA can be identified byUV–Vis, lmax ¼ 257 (MeOH), e ¼ 7000 M�1 cm�1.
� 1H NMR: the product has two diagnostic triplet signalscentered at d7.06 ppm corresponding to the nitroalkene pro-ton. This may appear as a quadruplet in some instruments.
Purification method: chromatography column [24]
This method is used for separating approximately 1 g of freefatty acid.
�
Suspend 50–60 ml of silica gel in hexanes. � Fill a flash chromatography column with hexanes. � Slurry the silica gel in hexanes into the column. � Pack the column with shaking and air- or nitrogen-line pressure. � Top off silica gel with a layer of sand. � Preelute the column with 100 ml 0.5% acetic acid/hexanes (v/v). � Dissolve the crude product in a minimal amount of 0.5% aceticacid/hexanes solvent mixture.
� Apply the crude product solution to the sand at the top of thecolumn.
� Elute with air- or nitrogen-line pressure and solvent steps ofincreasing polarity:0.5% acetic acid/hexanes (v/v), 100 ml,0.5% acetic acid þ 1% ether (v/v), 100 ml,0.5% acetic acid þ 2% ether (v/v), 100 ml,0.5% acetic acid þ 5% ether (v/v), 200 ml.
�
Collect the runoff in 13�100 mm or 16�100 mm culturetubes until well after the product elutes. � The typical elution order is:diphenyl diselenide (strong yellow band, UV active,solidifies upon evaporation),unreacted oleic acid,nitrated lipid (pale yellow oil),oxidized side products (waxy yellow).
�
Recycle the column runoff until the first yellow band elutes. � Check collected fractions by TLC (strong UV activity at254 nm).
�
Combine the fractions containing the majority of nitrated lipidproduct and remove the solvent by rotary evaporation. � Dry the final product under high vacuum for 2–3 h to removeresidual solvents.
� Repurify the column runoff if necessary in a second cycle ofcolumn chromatography, using similar conditions. A secondchromatography column is the easiest way to ensure purematerial.
� The theoretical yield is 1.16 g (3.5 mmol); the typical yield is0.25–0.30 g.
Suggestions
This method is used with other purification steps by changingthe solvent mixtures used. Esterified fatty acids (such as allyl esters)are more easily purified by column chromatography. The product isan equimolar combination of 9-NO2-OA and 10-NO2-OA isomers.Most applications have not shown a difference in reactivity and cellsignaling between the isomers. Positional isomers may be separableby preparatory liquid chromatography (LC). The purification can beperformed alternatively with an MPLC system (such as a SorbtechEZ Flash, Yamazen Smart Flash, or Teledyne Isco CombiFlashsystem) or by dividing the compound into portions and purifyingwith preparatory TLC.
Notes on isotopic standard synthesis
This method is preferred for synthesizing isotopic standards,i.e., NO2-[13C]LA and NO2-[13C]OA. Starting materials (100 mg of[13C18]LA or [13C18]OA) are commercially available. To synthesizethese lipids on an appropriate scale, the preceding method shouldbe modified as follows: (a) divide reagent quantities by 10 toaccount for 0.1 g starting material; (b) divide solvent amounts by4; (c) divide aqueous wash amounts by 2; and (d) purify theproduct by preparatory TLC plate, performed twice to removeimpurities.
Protocol for 9-NO2-OA (9-nitro-oleic acid) synthesis (0.25 g scale)
(Fig. 3) [16]
Note that each intermediate product is stable and can bestored, and the synthesis can be continued at a later time.
Synthesis of 9-bromononanoic acid, allyl ester [25]
�
Place 1.00 g bromononanoic acid (4.2 mmol) in a 50 ml round-bottom flask � For TLC of bromononanoic acid (ethyl acetate:hexanes, 1:3):Rf¼0.24.
� Add 3 ml allyl alcohol. � Add 20 ml toluene. � Add approximately 5 mg of p-toluenesulfonic acid. � Connect the flask to a condenser and Dean-stark trap undernitrogen.
� Heat to near-reflux at 95–100 1C for 16 h. � Cool to room temperature. � Concentrate the solution by rotary evaporation. � Blow a gentle stream of nitrogen over the product until odorless. � Redissolve the concentrates in 30 ml ether and transfer to a60 ml separatory funnel.
� Extract the organic layer twice with 1 M NaOH solution. � Combine and back-extract the aqueous fractions twice with10 ml ether.
� Combine the ether layers. � Wash once with 10 ml water. � Wash once with 10 ml brine. � Transfer the organic layer to an Erlenmeyer flask.
S.R. Woodcock et al. / Free Radical Biology and Medicine 59 (2013) 14–26 19
�
Add 2–3 g of anhydrous sodium sulfate to dry the organic layerand let stand 20 min. � Filter the solution through a fritted glass funnel containing alayer of Celite and silica covered by a filter.
� Remove the solvents by rotary evaporation to yield crude 9-bromononanoic acid, allyl ester.
� The theoretical yield is 1.17 g; the typical yield is 1.08 g. � TLC (ethyl acetate:hexanes, 1:3) Rf ¼ 0.58. The product iseasily visible with iodine.
� 1H NMR: the product has signals at d5.92, d5.31, d5.23, andd4.53 ppm corresponding to the allyl group protons.
� IR: the broad –CO2H signal at 2500–3300 cm�1 has disappeared.Synthesis of 9-nitrononanoic acid, allyl ester [20]
�
Oven-dry a 50 ml round-bottom flask containing a stir bar. � Cool to room temperature under nitrogen. � Add 0.89 g (5.8 mmol) silver nitrite. � Add 30 ml ether. � Purge the suspension with nitrogen for 10 min (see Air-sensitive reactions).
� Add 1.07 g of 9-bromononanoic acid, allyl ester (3.9 mmol) tothe stirred solution.
� Stopper the flask with a glass stopper. � Cover the flask with aluminum foil to protect from light. � Stir at room temperature for 7 days. � Check reaction progress by TLC. � Filter the suspension through a plug of silica and Celite. � Remove the solvents by rotary evaporation. � Purify the crude material via flash chromatography (50–60 mlsilica gel, ethyl acetate/hexanes, 0–5%) to obtain 9-nitrononanoicacid, allyl ester as the second fraction.
� The theoretical yield is 0.94 g; the typical yield is 0.66 g. � TLC (ethyl acetate:hexanes, 1:3) Rf ¼ 0.50. � 1H NMR: the product has a diagnostic triplet signal centered atd4.33 ppm corresponding to the nitroalkyl methylene protons.The bromoalkyl methylene triplet at d3.40 ppm has disappeared.
� IR: the –NO2 signals are at 1553 and 1378 cm�1.Synthesis of 10-hydroxy-9-nitro-octadecanoic acid, allyl ester [26]
�
Oven-dry a 25 ml round-bottom flask containing a stir bar. � Cool the flask to room temperature under nitrogen. � Add 0.32 g nitrononanoic acid, allyl ester (1.3 mmol). � Add 0.27 ml nonyl aldehyde (0.22 g, 1.6 mmol). � Cool the flask in an ice bath. � Add 1 to 2 drops of DBU (0.05 ml) to the stirred solution. � Stir the neat solution cold, 1 h. � Remove the ice bath and allow warming to room temperature. � Stir the solution for 2 days at room temperature. � Check reaction progress by TLC. � Add 10 ml ether and 10 ml 1 M HCl to partition the solution. � Stir 30 min. � Transfer the layers to a separatory funnel and remove theorganic layer.
� Extract the aqueous layer 3� with 10 ml ether. � Combine the organic layers. � Wash the combined organic layers once with 10 ml water andonce with 10 ml brine.
� Transfer the organic layer to an Erlenmeyer flask. � Dry over 2–4 g sodium sulfate for 20 min. � Filter through a plug of silica and Celite. � Remove the solvent by rotary evaporation.�
Purify by column chromatography (30–40 ml silica gel, ethylacetate/hexanes, 0–10%) to isolate 10-hydroxy-9-nitro-octade-canoic acid, allyl ester as a colorless oil. � The theoretical yield is 0.51 g; the typical yield is 0.41 g. � TLC (ethyl acetate:hexanes, 1:3) Rf ¼0.38. (Note that theproduct is more polar than the starting materials and is amixture of two diastereomers that will typically show up astwo distinct spots on TLC.)
� 1H NMR: the product has a methyl signal at d0.85 ppm, andtwo broad diagnostic signals centered at d3.95 and d3.83 ppmcorresponding to both diastereomers of the (–CH-OH) protons.The d4.33 ppm triplet should be replaced by a broad peak atd4.39 ppm.
Synthesis of 10-acetoxy-9-nitro-octadecanoic acid, allyl ester [27]
�
Oven-dry a 50 ml round-bottom flask containing a stir bar. � Cool to room temperature under nitrogen. � Add 0.41 g (1.1 mmol) hydroxynitro intermediate. � Add 3–4 ml acetic anhydride. � Add approximately 5 mg p-toluenesulfonic acid. � Stir the solution under nitrogen for 16 h at room temperature. � Remove the excess anhydride with a gentle stream ofnitrogen.
� Redissolve the residue in 10 ml ether. � Filter the solution through a plug of Celite and silica. � Remove solvents by rotary evaporation to isolate crude10-acetoxy-9-nitro-octadecanoic acid, allyl ester as an oil.
� The theoretical yield is 0.45 g; the typical yield is 0.39 g. � TLC (ethyl acetate:hexanes, 1:3) Rf ¼ 0.51. � 1H NMR: the product has diagnostic signals centered in thed5.35–5.15 and d4.60–4.55 ppm regions obscured by the allylalkene signals. Total integration for each region is 3H. Acetylmethyl singlets appear at d2.09 and d2.05 ppm.
� IR: the broad 3400 cm�1 –OH signal is lost.Synthesis of 9-NO2-OA allyl ester [28]
�
Oven-dry a 50 ml round-bottom flask containing a stir bar. � Cool to room temperature under nitrogen. � Add 0.39 g (0.91 mmol) acetoxynitro intermediate. � Add 25–30 ml toluene. � Add 0.10 g (0.94 mmol) sodium carbonate. � Connect the flask to a condenser and a Dean-stark trap undernitrogen.
� Reflux solution with vigorous stirring for azeotropic removal ofwater, 24 h at 110–120 1C.
� Cool the solution to room temperature. � Check reaction progress by TLC. � Continue heating if insufficient product formation. � Partition with 10 ml 1 M HCl and 10 ml ether. � Stir 30 min. � Transfer to 125 ml separatory funnel. � Separate the aqueous layer. � Extract the aqueous layer three times with 10 ml ether. � Combine the organic layers. � Wash once with 20 ml water and then 20 ml brine. � Transfer the organic layer to an Erlenmeyer flask. � Dry over 2–4 g sodium sulfate for 20 min. � Filter through a plug of silica and Celite. � Remove the solvent by rotary evaporation. � Isolate the 9-nitro-oleic acid, allyl ester by column chromato-graphy (25–30 ml silica gel, ethyl acetate/hexanes, 0–5%). Theproduct is a pale yellow oil at room temperature.
� The theoretical yield is 0.34 g; the typical yield is 0.23 g.
S.R. Woodcock et al. / Free Radical Biology and Medicine 59 (2013) 14–2620
�
TLC (ethyl acetate:hexanes, 1:3) Rf ¼ 0.60. The product issignificantly more active by UV at 254 nm. � 1H NMR: the product has a diagnostic triplet signal atd7.08 ppm corresponding to the nitroalkene proton.
Synthesis of 9-nitro-oleic acid [29]
�
Oven-dry a 50 ml round-bottom flask containing a stir bar. � Cool to room temperature under nitrogen. � Add 0.28 g (0.76 mmol) nitro-oleic acid, allyl ester. � Add 20–25 ml tetrahydrofuran. � Sparge the solution with nitrogen via a needle for 5 min. � Add 0.4 ml formic acid (�8 mmol). � Add 40 mg (35 mmol) dry palladium tetrakis (triphenylphos-phine).
� Sparge the solution with nitrogen for 10 min. � Seal the flask under a condenser. � Reflux at 95–100 1C under nitrogen for 16 h. � Cool the solution to room temperature. � Filter the solution through a plug of silica and Celite in a frittedglass funnel.
� Remove the solvent by rotary evaporation. � Remove residual formic acid with a stream of nitrogen. � Purify the 9-nitro-oleic acid as a pale yellow oil by columnchromatography (20–25 ml silica gel 0.5% HOAc, 0–5% ether/hexanes; scaled down from the method under Purificationmethod: chromatography column).
� The theoretical yield is 0.25 g; the typical yield is 0.23 g. � TLC (5% MeOH/CHCl3) Rf ¼ 0.58. UV lmax (MeOH) 257 nm. � 1H NMR: the product has a single triplet signal at d7.08 ppmcorresponding to the nitroalkene proton similar to the ester,but without the signals at d6–4 ppm corresponding to the allylgroup protons (see Nitroselenation protocol for NO2-OA foradditional analysis).
Suggestions
The final product is a single regioisomer, 9-NO2-OA. Thisprocedure can be easily adapted to produce other desired esters,such as methyl ester 9-NO2-OA, by changing the alcohol usedunder the Section ‘‘Synthesis of 9-bromononanoic acid, allylester’’. Esterified fatty acids (such as allyl esters) are more easilypurified by column chromatography than free fatty acids. Userswithout access to NMR can easily find commercial analysisservices. In the intermediate purification steps, refer to thegeneral procedure under the Section ‘‘Purification method: chro-matography column’’ and change the amount of silica and thesolvent mixtures used to those given at each product step.Typically a product is eluted with a solvent mixture (0, 1, 2, 5,10% ethyl acetate or ether, up to the stated concentration) two tothree times the volume of silica gel used, followed by a similaramount of the next more polar solvent mixture, until the productbegins to elute. As stated before, the purifications can be per-formed alternatively with a commercially available MPLC systemor by dividing the intermediate products into portions andpurifying with preparatory TLC.
Measurement of nitrated fatty acids by mass spectrometry
Principles
Mass spectrometry has played a central role in the determina-tion of nitrated biomolecules. One of the best characterized nitratedbiomolecules is nitrotyrosine [30]. Unlike the single, well-definedproduct of tyrosine nitration, the multiplicity of substrates andreaction mechanisms involved in the nitration of fatty acids results
in a diversity of products. Nitrotyrosine is chemically stable inaqueous solutions, organic solvents, a wide range of pH values, andbiological environments in which it may undergo a very slowmetabolic degradation. In contrast, NO2-FAs are highly reactiveelectrophiles that rapidly and reversibly adduct to cysteines andhistidines. In addition, rapid metabolic consumption of NO2-FAsoccurs through b-oxidation and double-bond saturation. Thus, thedevelopment of rigorous methods for proper elucidation of thevarious isomers of NO2-FAs found in vivo is necessary. The twomain techniques used for the detection and quantification of NO2-FAs are gas chromatography (GC) or LC coupled to mass spectro-metry (MS). GC-based methods are lengthy and require severalderivatization steps during sample preparation that not only aretedious, but promote the degradation and modification of nitratedmetabolites. Thus, LC–MS-based methods are preferential as theyhave the advantage of rapid sample preparation and are less proneto artifact generation during the sample workup. At this point it isimportant to consider that matrix interference is an important issuefor both analytical procedures. GC–MS always requires intensivesample cleanup, whereas LC–MS is more forgiving, but may requireadditional preparation steps depending on matrix complexity.
Characterization
NO2-FA can be generated by either �NO2 addition to olefinspresent in unsaturated fatty acids followed by hydrogen abstrac-tion and re-formation of the double bond or through hydrogenabstraction, radical rearrangement, and a termination reactionbetween the carbon-centered radical and an additional �NO2
radical (Fig. 1). The main difference between the species formedthrough these mechanisms is that the addition reaction leads toelectrophilic products (also termed conjugated nitroalkenes, a,b-unsaturated nitroalkenes, or vinyl nitro groups) and the hydro-gen abstraction reaction leads to nonelectrophilic species (alsotermed nonconjugated nitroalkenes, allylic nitro groups, nitroalk-ane alkenes). This distinction is of relevance because the electro-philic nature of endogenously formed NO2-FA modulates itsbiological signaling, half-life, and metabolism. Moreover, conju-gated nitroalkenes can be rapidly converted into nitroalkanes ornonconjugated nitroalkenes by reduction, catalyzed by a yetunidentified NADPH-dependent enzymatic activity. Thus, thedifferences between nitrated products and their electrophilicnature are important when characterizing and quantifying biolo-gical samples. Furthermore, the electrophilicity of the NO2-FA willgreatly affect stability, sample handling and determination of theconcentration of these species.
Extraction
There are many considerations to take into account whenchoosing a method to process any sample from a biological matrixand the same is true for the extraction of NO2-FA. The relevantfactors include analyte concentration in the biological sample,amount of sample, pH, solvent, concentration of NO2
� in thesample, and potential interest in detecting metabolic productsof the NO2-FA. Strategies include ACN precipitation, biphasicorganic extraction, and solid-phase extraction. Analysis of endo-genous content of NO2-FA usually requires approaches thatinclude concentrating and purification steps to reduce ionizationdampening and maximize sensitivity when measuring by LC–MS.Thus, the preferred techniques are solid-phase extraction andsolvent-based extractions. Acetonitrile precipitation is a veryconvenient technique for determining the plasma concentrationof NO2-FA and their metabolites in animals exposed to exogen-ously administered NO2-FA (either by gavage, ip injection, ivinjection, or osmotic minipump delivery) using as little as 5 mlof sample. Acetonitrile or methanol precipitation can be used

S.R. Woodcock et al. / Free Radical Biology and Medicine 59 (2013) 14–26 21
followed by solid-phase extraction to detect endogenous levels ofNO2-FA. This combination technique has also been effectivelyused to detect eicosanoids, isoprostanes, and docosanoids [31].One of the advantages of ACN precipitation is that it allows for therecovery of many of the nitro-containing fatty acid metabolites(including carnitine and CoA thioesters, b-oxidation products,nitroalkene reduction products, and nucleophilic amino acidadditions). Although these products can be obtained by solid-phase extraction, additional attention has to be given to theconditions used to equilibrate the column and elute the com-pounds to ensure their proper recovery. Organic extraction offersthe highest recovery of NO2-FA from samples, but many of themetabolites will be lost because of their increased hydrophilicitycompared to the parent NO2-FA.
Protocols
Reagents and materials
�
TabHPL
P
In
T
R
R
Sa
R
R
C
P
So
So
D
E
C
C
C
Fl
C
A
A
Io
So
C
ACN
ACN (Burdick and Jackson, HPLC grade, Cat. No. 015-4)
� Water (Burdick and Jackson, HPLC grade, Cat. No. 365-4) � Methanol (Burdick and Jackson, HPLC grade, Cat. No. 230-4) � 1.5 ml Eppendorf tubes (Fisherbrand, Cat. No. 05 408 129) � 2 ml screw-top glass vials (Sun Sri, Cat. No. 200 252, or Fisher,Cat. No. 22313377)
� Screw polypropylene/PTFE/silicone caps for 2-ml glass vials(Sun Sri, Cat. No. 500 062, or Fisher, Cat. No. 14823306)
� 100 ml conical glass inserts for glass vials (Sun Sri, Fisher, Cat.No. 22035113)
� C18 disposable solid-phase extraction columns � Sample dryer:Analytical nitrogen evaporator, N EVAP 112 from Orga-nomation Associates, Berlin, MA, USASolid-phase extraction vacuum manifolds, SupelcoVisiprepVacuum dry evaporation systems, RapidVap byLabconco Corp
le 1C and M
aramete
jection
otal flow
insing v
insing s
mpling
inse dip
inse mo
ooler en
ump me
lvent A
lvent B
ecluster
ntrance
ollision
ollision
olumn
ow rate
urtain g
uxiliary
uxiliary
nization
urce te
ollision-
, aceton
�
Transfer pipettes, Samco Scientific Model 202 � 16�100 mm borosilicate tubes (VWR Cat. No. 47729-576)S conditions for characterization and quantification of NO2-FA.
r Value
Nitrated fatty acid quantification met
volume 20.00 ml (range 10–40 ml)
0.7500 ml/min
olume 300 ml
peed 35 ml/s
speed 15.0 ml/s
time 3 s
de Before and after aspiration
abled Cooler temperature 4 1C
thod Rinse pump and port between analys
Water þ 0.1% acetic acid
ACN þ 0.1% acetic acid
ing potential �75
potential �10
energy �35
exit potential �15
Phenomenex Gemini (C18, 2�20-mm
750 ml/min
as 40
gas 1 60
gas 2 50
voltage �4500 V
mperature 550 1C
activated dissociation gas 4
itrile.
�
hod
es
ca
13�100 mm borosilicate tubes (VWR Cat. No. 47729-572)
� 13�100 mm silanized borosilicate tubes (Kimble Chase Cat.No. 73500-13100).
� A standard mix of NO2-FA (1 mM) � A 100 nM internal standard mix (NO2-[13C18]OA and NO2-[13C18]LA) in MeOH
� Cold ACN (�20 1C) � Eppendorf adjustable volume mechanical micropipettes,volumes 0.5–10, 2–20, 10–100, and 100–1000 ml.
Instruments
�
Mass spectrometer, 4000 QTrap (Applied Biosystems) � LC20 with autosampler and rack changer (Shimadzu)Mass spectrometer settings
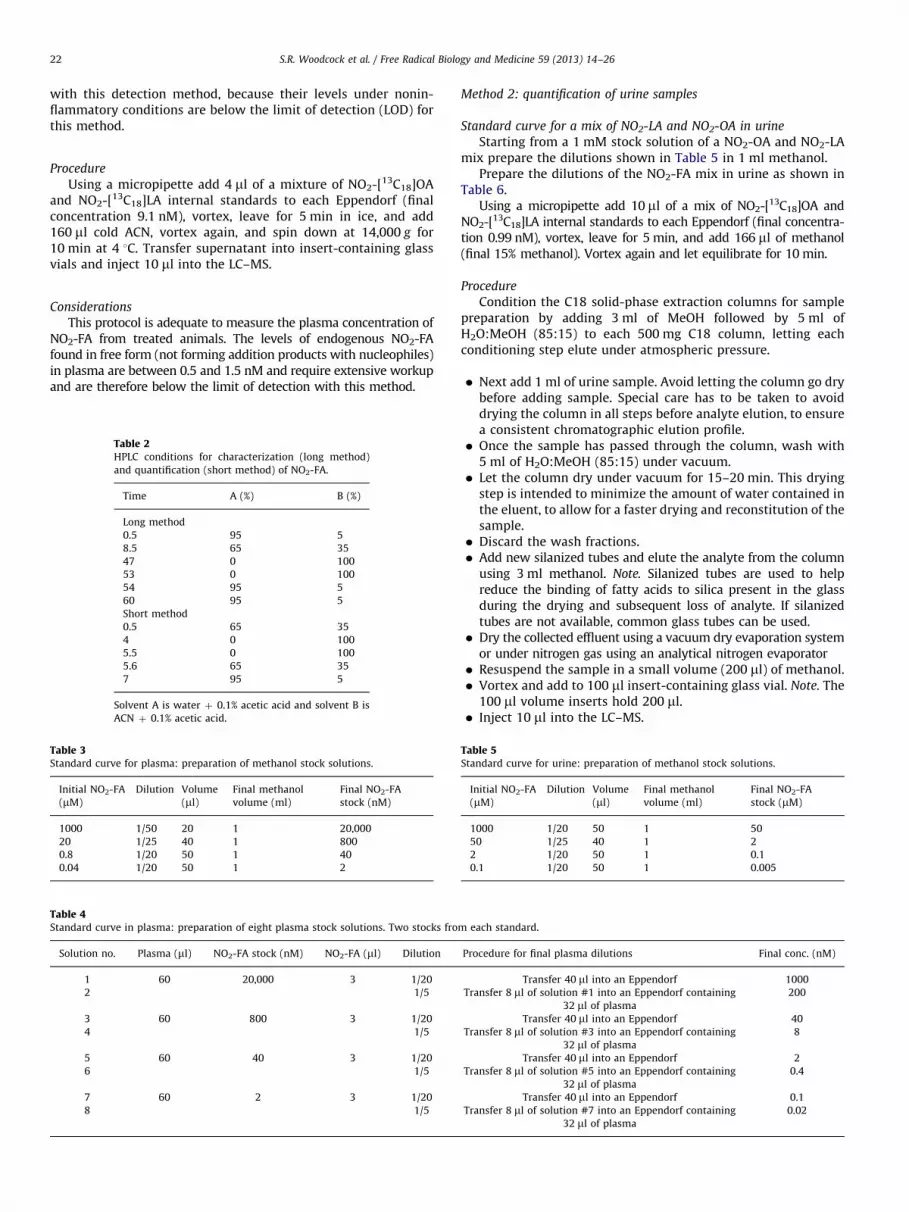
Tables 1 and 2 show the parameters and settings of the massspectrometers and HPLCs used to determine nitrated fatty acids.
Method 1: quantification of small plasma volumes
This protocol is adequate to measure the plasma concentrationof NO2-FA from treated animals.
Preparation of a standard curve for NO2-LA and NO2-OA
quantification
Starting from the 1 mM standard mix of NO2-OA and NO2-LAstock solutions are prepared (Table 3).
Final concentrations of NO2-OA and NO2-LA in the plasmasamples that will be used to build the standard curve are 1000,200, 40, 8, 2, 0.4, 0.1, 0.02, and 0 nM (Table 4). Determinationsbased on LC–MS data usually have a dynamic range of 3 orders ofmagnitude, which can be extended on the upper end using lesssensitive multiple reaction monitoring (MRM) transitions [32].The proposed standard curve spans over 5 orders of magnitude toaccommodate quantifications using instruments with higher orlower sensitivity. Endogenous levels will generally not interfere
Nitrated fatty acid characterization method
20.00 ml (range 10–40 ml)
0.2500 ml/min
300 ml
35 ml/s
15.0 ml/s
3 s
Before and after aspiration
Cooler temperature 4 1C
Rinse pump and port between analyses
Water þ 0.1% acetic acid
ACN þ 0.1% acetic acid
�75
�10
�35.00 to follow NO2�; �17 to �23 to follow specific
chain-breaking fragments
�15
rtridges) Phenomenex Luna (C18, 2�150 mm, 3 mm)
250 ml/min
30
55
50
�4500 V
500 1C
4
S.R. Woodcock et al. / Free Radical Biology and Medicine 59 (2013) 14–2622
with this detection method, because their levels under nonin-flammatory conditions are below the limit of detection (LOD) forthis method.
Procedure
Using a micropipette add 4 ml of a mixture of NO2-[13C18]OAand NO2-[13C18]LA internal standards to each Eppendorf (finalconcentration 9.1 nM), vortex, leave for 5 min in ice, and add160 ml cold ACN, vortex again, and spin down at 14,000 g for10 min at 4 1C. Transfer supernatant into insert-containing glassvials and inject 10 ml into the LC–MS.
Considerations
This protocol is adequate to measure the plasma concentration ofNO2-FA from treated animals. The levels of endogenous NO2-FAfound in free form (not forming addition products with nucleophiles)in plasma are between 0.5 and 1.5 nM and require extensive workupand are therefore below the limit of detection with this method.
Table 2HPLC conditions for characterization (long method)
and quantification (short method) of NO2-FA.
Time A (%) B (%)
Long method
0.5 95 5
8.5 65 35
47 0 100
53 0 100
54 95 5
60 95 5
Short method
0.5 65 35
4 0 100
5.5 0 100
5.6 65 35
7 95 5
Solvent A is water þ 0.1% acetic acid and solvent B is
ACN þ 0.1% acetic acid.
Table 3Standard curve for plasma: preparation of methanol stock solutions.
Initial NO2-FA
(mM)
Dilution Volume
(ml)
Final methanol
volume (ml)
Final NO2-FA
stock (nM)
1000 1/50 20 1 20,000
20 1/25 40 1 800
0.8 1/20 50 1 40
0.04 1/20 50 1 2
Table 4Standard curve in plasma: preparation of eight plasma stock solutions. Two stocks fro
Solution no. Plasma (ml) NO2-FA stock (nM) NO2-FA (ml) Dilution
1 60 20,000 3 1/20
2 1/5
3 60 800 3 1/20
4 1/5
5 60 40 3 1/20
6 1/5
7 60 2 3 1/20
8 1/5
Method 2: quantification of urine samples
Standard curve for a mix of NO2-LA and NO2-OA in urine
Starting from a 1 mM stock solution of a NO2-OA and NO2-LAmix prepare the dilutions shown in Table 5 in 1 ml methanol.
Prepare the dilutions of the NO2-FA mix in urine as shown inTable 6.
Using a micropipette add 10 ml of a mix of NO2-[13C18]OA andNO2-[13C18]LA internal standards to each Eppendorf (final concentra-tion 0.99 nM), vortex, leave for 5 min, and add 166 ml of methanol(final 15% methanol). Vortex again and let equilibrate for 10 min.
Procedure
Condition the C18 solid-phase extraction columns for samplepreparation by adding 3 ml of MeOH followed by 5 ml ofH2O:MeOH (85:15) to each 500 mg C18 column, letting eachconditioning step elute under atmospheric pressure.
�
m e
Pro
Tra
Tra
Tra
Tra
TabSta
In
(m
1
5
2
0
Next add 1 ml of urine sample. Avoid letting the column go drybefore adding sample. Special care has to be taken to avoiddrying the column in all steps before analyte elution, to ensurea consistent chromatographic elution profile.
� Once the sample has passed through the column, wash with5 ml of H2O:MeOH (85:15) under vacuum.
� Let the column dry under vacuum for 15–20 min. This dryingstep is intended to minimize the amount of water contained inthe eluent, to allow for a faster drying and reconstitution of thesample.
� Discard the wash fractions. � Add new silanized tubes and elute the analyte from the columnusing 3 ml methanol. Note. Silanized tubes are used to helpreduce the binding of fatty acids to silica present in the glassduring the drying and subsequent loss of analyte. If silanizedtubes are not available, common glass tubes can be used.
� Dry the collected effluent using a vacuum dry evaporation systemor under nitrogen gas using an analytical nitrogen evaporator
� Resuspend the sample in a small volume (200 ml) of methanol. � Vortex and add to 100 ml insert-containing glass vial. Note. The100 ml volume inserts hold 200 ml.
� Inject 10 ml into the LC–MS.ach standard.
cedure for final plasma dilutions Final conc. (nM)
Transfer 40 ml into an Eppendorf 1000
nsfer 8 ml of solution #1 into an Eppendorf containing
32 ml of plasma
200
Transfer 40 ml into an Eppendorf 40
nsfer 8 ml of solution #3 into an Eppendorf containing
32 ml of plasma
8
Transfer 40 ml into an Eppendorf 2
nsfer 8 ml of solution #5 into an Eppendorf containing
32 ml of plasma
0.4
Transfer 40 ml into an Eppendorf 0.1
nsfer 8 ml of solution #7 into an Eppendorf containing
32 ml of plasma
0.02
le 5ndard curve for urine: preparation of methanol stock solutions.
itial NO2-FA
M)
Dilution Volume
(ml)
Final methanol
volume (ml)
Final NO2-FA
stock (mM)
000 1/20 50 1 50
0 1/25 40 1 2
1/20 50 1 0.1
.1 1/20 50 1 0.005

Table 6Standard curve in urine: preparation of eight urine stock solutions. Two stocks from each standard.
Solution no. Urine (ml) NO2-FA stock (mM) NO2-FA (ml) Dilution Final urine dilutions Final conc. (nM)
1 1.3 50 26 1/50 Transfer 1000 ml into an Eppendorf 1000
2 1/5 Transfer 200 ml of solution #1 into an Eppendorf
containing 800 ml of urine
200
3 1.3 2 26 1/50 Transfer 1000 ml into an Eppendorf 40
4 1/5 Transfer 200 ml of solution #3 into an Eppendorf
containing 800 ml of urine
8
5 1.3 0.1 26 1/50 Transfer 1000 ml into an Eppendorf 2
6 1/5 Transfer 200 ml of solution #5 into an Eppendorf
containing 800 ml of urine
0.4
7 1.3 0.005 26 1/50 Transfer 1000 ml into an Eppendorf 0.1
8 1/5 Transfer 200 ml of solution #7 into an Eppendorf
containing 800 ml of urine
0.02
After adding the corresponding NO2-FA acid stock, vortex and incubate for 15 min to allow for analyte equilibration.
S.R. Woodcock et al. / Free Radical Biology and Medicine 59 (2013) 14–26 23
Considerations
This protocol is adequate to measure the NO2-FA concentra-tion in urine of human or animal origin. The mean concentrationof free nitrated linoleic acid isomers in urine (first void of the day)from healthy human volunteers is 9.2 nM (9.9 pmol/mg creati-nine). The urinary values display a significant dispersion withconcentrations typically ranging from 0.7 to 57 nM. Standardcurves are important to determine several important parameters(e.g., stability, linearity of response, reproducibility of response,LOQ, LOD, matrix interferences). The proper procedure includesperforming the standard curve in urine. This allows for properdetermination of parameters including LOD, LOQ, and the relativestandard deviation values for each of the standard concentrations.These parameters can be calculated from a standard curveperformed in methanol; however, the values will be meaninglesswhen quantifying the biological sample. It is important to estab-lish quality controls when measuring samples (using a low,medium, and high concentration of spiked analyte or at least alow and high one). This ensures that determinations are properlyperformed the day of measurement. The analyte and the internalstandard need to be incubated for 15–30 min with the sample onice to allow for proper distribution and reaction equilibrium in thematrix to better mimic endogenous distribution and free levels.
Chromatographic and mass spectrometric considerations
Recovery and stability in matrix analysis
For a new biological matrix, it is always important to know thepercentage recovery and the stability of the analyte of interest.NO2-FAs containing a nitroalkene group are electrophilic and willrapidly react with nucleophilic amino acid residues, such ascysteine and histidine. One can account for this reactivity byusing spiked plasma samples to monitor the loss of free NO2-FAover time. These samples can be directly compared to methanolspiked with standard, which would provide the greatest intensityupon LC–MS analysis.
�
Spike 198 ml plasma with 2 ml NO2-FA standards (20 mMsolution) to give a 200 nM solution. � Vortex and at 0, 10, 20, and 30 min transfer 40 ml intoEppendorf tubes.
� Immediately add 4 ml of IS � Vortex and add 160 ml of ACN. � Vortex samples and spin them down. � Remove the supernatant.In addition, comparisons can also be made between theanalyte spiked in methanol and plasma previously acidified to
pH 5. Acidification of the plasma will inhibit Michael additionreactions. To prepare these samples, repeat the steps listed aboveafter acidifying the plasma. A comparison of the spiked methanol,plasma, and acidified plasma will provide an indication of the lossof NO2-FA signal intensity due to covalent adduction, nonspecificbinding, and matrix suppression of the signal.
NO2-FA detection in positive-ion mode
NO2-FA can be detected as Liþ or Naþ adducts. Depending onthe concentration of Liþ or Naþ ions used, they will be preferen-tially detected as single or double adducts. The associated cation(Liþ or Naþ) is usually infused postcolumn to maintain a consistentchromatographic profile and to be comparable to runs performed innegative-ion mode. For Liþ , the optimal concentration infusedpostcolumn to detect singly charged positive ions is between 20and 35 mM. This greatly favors single adducts over double adducts,making this method 100 to 1000 times more sensitive than theoriginal reported use of 1–5 mM Liþ addition for polyunsaturatedfatty acid characterization [33]. The advantage of positive-ion modedetection of nitroalkenes is based on the NO2-FA heterolytic chainfragmentation upon low energy collision-induced dissociation(CID), thus generating almost exclusively moieties containing analdehyde and a nitrosamine. These well-defined fragmentationpathways are very helpful for structural elucidation when new,unidentified products are observed and to confirm already estab-lished analytes. At higher energies the charged or neutral loss ofNO2� or HNO2 is respectively observed.
NO2-FA detection in negative ion mode
NO2-FAs are detected as [M�H]�. The advantage of the negative-ion mode is its sensitivity and the specific fragmentation of mole-cules containing nitroalkenes and nitroalkanes that lead to the[NO2]� and [NO2FA-HNO2]� product ions. MRM, multiple reactionmonitoring, denotes a specific parent mass fragmentation that isused to monitor product ions in a triple-stage-quadrupole massspectrometer. The following transitions are used for NO2-FA analysis:
�
The transitions below are used for highest sensitivity:[NO2-FA-H]� - [NO2]� (326.3 - 46 and 324.3 - 46for NO2-OA and NO2-LA, respectively).�
In most triple quadrupoles, the MRM following the formation of46 m/z anion will be the most sensitive. Owing to instrumentdesign, Thermo Fisher triple quadrupoles are better suited tostabilizing and transmitting higher m/z ions. Thus, the detection ofthe anion resulting from neutral loss of HNO2 (47 amu) ispreferred. Fragments involving the loss of NO2� or HNO2 usuallyrequire high collision energies (35 eV). If the collision energy is set

Fig. 3. Full synthesis of 9-NO2-OA. An available bromoalkyl acid is transformed over six steps to the desired nitroalkene product. Each step produces clean, single
regioisomer products, but the length of the procedure and associated loss of material (only 12–36% expected overall yield) limit the practicality of the approach.
S.R. Woodcock et al. / Free Radical Biology and Medicine 59 (2013) 14–2624
lower (17–25 eV) fragments that contain structural informationabout the lipid backbone can be detected [12].
� Nitroalkanes: these molecules have no conjugated nitroalkeneand fragment only through losses of NO2� or HNO2 [12].
�
NO2-OA: in addition to the NO2�-related losses, fragmentsoccur almost exclusively through forming an aldehyde and anitrosamine (similar to positive-ion mode). These fragmentsallow for the correct identification of NO2-OA positionalisomers [12]. A product ion of 168.1 m/z is observed for 9-NO2-OA and an ion of 169.1 m/z for the 10-NO2-OA isomer.
� The presence of an additional double bond (such as in NO2-LA)generates, in addition to the previously described fragments ofNO2-OA, product ions derived from cyclization reactions. A con-figuration with an additional double bond one or two carbonsaway from the nitroalkene promotes cyclization reactions thatfacilitate formation of 5- or 6-atom heterocycles [12].
�Fig. 4. Typical chromatogram obtained from the plasma of mice injected intrave-
nously with NO2-OA and extracted with ACN that shows the three characteristic
peaks (following the 326.2 - 46 MRM) that are obtained. The first peak
corresponds to an unidentified noncovalent adduct of m/z 82. This peak corre-
sponds to nitrododecanoic acid (NO2-12:0), which can be specifically followed at
244.1 - 46. The second peak coelutes with the internal standard (342.3 - 46)
and is the true NO2-OA. The third peak corresponds to a noncovalent adduct of
linoleic acid, as coelution with linoleic acid (279.2 - 261.2) is shown.
Vicinal NO2-OH-FA (nitrohydroxy fatty acids). These moleculesoriginate from NO2-FA hydration reactions in aqueous envir-onments. They are easy to characterize, because CID fragmentsresult in a specific fragmentation pattern that clearly indicatesthe positions of NO2 and OH groups in the molecule [34].
HPLC solvent selection:
Basic solvents may result in increased degradation and/or hydra-tion of nitroalkenes, have higher sensitivity in the negative-ion mode,and have impaired isomer separation compared to acidic solventsystems. Basic solvents used include (A) H2O þ 0.1% ammoniumhydroxide and (B) ACN þ 0.1% ammonium hydroxide.

S.R. Woodcock et al. / Free Radical Biology and Medicine 59 (2013) 14–26 25
Acidic solvents are slightly less sensitive, but offer betterchromatographic resolution and separation of isomers. MeOHand ACN provide good separation of NO2-FA, although ACN ismost commonly used. Solvents such as formic acid and acetic acidcan be used, but acetic acid is a weaker acid, resulting in lessionization dampening and in a more sensitive method comparedto formic acid when working in negative-ion mode. Solvents usedinclude (A) H2O þ 0.1% acetic acid and (B) ACN þ 0.1% acetic acid.
Standard curve
It is preferable that the standard curve (plotting standardanalyte area/IS area as a function of standard analyte concentra-tion) be performed the same day as the unknown measurements.However, if this is not possible, it is important to use qualitycontrols the day of the measurement. For this, biological sampleswill be spiked with a low, medium, and high concentration ofanalyte. The concentration of the spiked sample should beselected from the range of values normally detected in thosebiological samples (2–200 nM). In this regard, the range shouldinclude a low concentration reflecting the lowest values detected(a value that should be above the LOQ), a concentration close tothe median, and a concentration reflecting the highest concentra-tion detected in the biological samples. Because the matrixcontains measurable levels of endogenous NO2-FA, the interceptof the y axis will be higher than 0. The endogenous level ofthe sample used as matrix can be calculated as the value of they-intercept times the internal standard concentration divided bythe slope.
Quantification
Peaks are quantified using the area under the curve. Chroma-tographic methods can be shortened and many MRM transitionscan be simultaneously monitored in a single analysis. It isimportant to verify that at least 8–10 data points have beendetermined for each peak to ensure an accurate determination ofthe area under the curve.
Ionization dampening
Many metabolites of NO2-FA are present in urine. Becauseinternal standards may not be available for all the various species,it is important to understand how the matrix and solventcompositions affect the sensitivity of the mass spectrometerduring the chromatographic run. To investigate these effectsinfuse a 100 nM solution of NO2-LA at 5 ml/min into a T-connected postcolumn to the mass spectrometer and solvent linefrom the LC. Perform a run using matrix (i.e., urine, plasmaextraction) or solvent. Analyze the instrument response (peakintensity) at various times to determine if dampening is an issueat the elution time of the analytes of interest.
Characterization
NO2-FAs are separated using a C18 reversed-phase column(2�150 mm, 3 mm; Phenomenex, Torrance, CA, USA) at a 250 ml/min flow rate. NO2-FAs are eluted from the column and detectedusing the conditions shown in Table 1. For positive-ion mode, alithium acetate solution (10 mM) is infused post-column at a 1 ml/min flow rate to reach a final concentration of 40 mM.
Artifacts common to NO2-FA determinations by MS–MS
�
Following the formation of an ion with 46 m/z can lead toartifacts if further characterization is not performed andinternal standards are not used. The origin of these falsepositives does not stem from a single mechanism and a varietyof artifacts are caused by different issues. Most importantly,false positives are caused by various noncovalent adducts.These adducts can be caused by NO2
� ion pairing withmolecules that do not contain a nitro group or by other ionspairing with molecules that have a nitro group (Fig. 4).
� Noncovalent NO2� adducts are commonly observed with unsa-turated fatty acids, particularly linoleic and linolenic acid. Theyhave longer retention times compared to nitro fatty acids uponC18 chromatographic separation. They are observed after theneutral loss of HNO2 and the formation of the product ionNO2� . Peaks stemming from these NO2
� adducts are easilymisinterpreted as NO2-FA in the absence of internal standards.These species display correct high accuracy mass determina-tions, but do not present chain-breaking specific fragmenta-tion ions other than NO2
� and neutral loss of HNO2.
� NO2-FA can be detected in positive-ion mode as Liþ or Naþadducts. Additionally, in negative-ion mode an undefined adduct(þ82 m/z) is observed (Fig. 4). This adduct is prominent for someb-oxidation metabolic products of NO2-FA. In particular, nitrodo-decenoic (NO2-12:1) and nitrododecanoic (NO2-12:0) acids aremost prominently detected as these adducts.
� If the concentration of a NO2-FA in the sample is sufficient,specific transitions having sensitivity between 1 and 10%, com-pared to the more sensitive, but less specific loss of NO2
� , shouldbe followed. These transitions are not to be used for quantifica-tion purposes, which usually require a 20:1 signal-to-noise ratio,but for the identification purposes that require them only to beabove LOD (usually a 3:1 signal-to-noise ratio).
� If possible, the mass of the parent ion should always beconfirmed when studying an unknown nitro-containing mole-cule without internal standards. This ensures that the selectedion is less likely to be an ion pair.
Summary
Our methods employ a combination of synthetic approaches andhigh-resolution analytical techniques to identify and quantifynitrated lipids in biological samples. These methods are appropriatefor detecting previously described NO2-FAs, but can also detect arange of other nitrated and nonnitrated electrophilic lipids pro-duced biologically. These approaches demonstrate the synergybetween synthetic techniques and powerful analytical methods.Optimizing both components has allowed for improved structuralcharacterization, greater confidence in structural assignments, andthe avoidance of artifacts in obtaining reliable quantification.
Acknowledgments
We thank Bruce Freeman for insightful comments and helpfuldiscussion. This work was supported by National Institutes ofHealth Grants R01 AT006822-01 (to F.J.S.) and R01-HL058115,R01-HL64937, and P01-HL103455 (to Bruce Freeman). F.J.S.declares a financial interest in Complexa, Inc.
References
[1] Brown, H. A.; Marnett, L. J. Introduction to lipid biochemistry, metabolism,and signaling. Chem. Rev. 111:5817–5820; 2011.
[2] Groeger, A. L.; Cipollina, C.; Cole, M. P.; Woodcock, S. R.; Bonacci, G.; Rudolph, T. K.;Rudolph, V.; Freeman, B. A.; Schopfer, F. J. Cyclooxygenase-2 generates anti-inflammatory mediators from omega-3 fatty acids. Nat. Chem. Biol. 6:433–441;2010.
[3] Schopfer, F. J.; Cipollina, C.; Freeman, B. A. Formation and signaling actions ofelectrophilic lipids. Chem. Rev. 111:5997–6021; 2011.
[4] Serhan, C. N.; Krishnamoorthy, S.; Recchiuti, A.; Chiang, N. Novel anti-inflammatory–pro-resolving mediators and their receptors. Curr. Top. Med.Chem. 11:629–647; 2011.
S.R. Woodcock et al. / Free Radical Biology and Medicine 59 (2013) 14–2626
[5] Schopfer, F. J.; Baker, P. R. S.; Freeman, B. A. NO-dependent protein nitration:a cell signaling event or an oxidative inflammatory response? Trends Biochem.Sci. 28:646–654; 2003.
[6] Sawa, T.; Zaki, M. H.; Okamoto, T.; Akuta, T.; Tokutomi, Y.; Kim-Mitsuyama, S.;Ihara, H.; Kobayashi, A.; Yamamoto, M.; Fujii, S.; Arimoto, H.; Akaike, T. ProteinS-guanylation by the biological signal 8-nitroguanosine 30 ,50-cyclic monopho-sphate. Nat. Chem. Biol. 3:727–735; 2007.
[7] Baker, P. R. S.; Schopfer, F. J.; Sweeney, S.; Freeman, B. A. Red cell membraneand plasma linoleic acid nitration products: synthesis, clinical identification,and quantitation. Proc. Natl. Acad. Sci. USA 101:11577–11582; 2004.
[8] Batthyany, C.; Schopfer, F. J.; Baker, P. R. S.; Duran, R.; Baker, L. M. S.; Huang, Y.;Cervenansky, C.; Branchaud, B. P.; Freeman, B. A. Reversible post-translationalmodification of proteins by nitrated fatty acids in vivo. J. Biol. Chem.281:20450–20463; 2006.
[9] O’Donnell, V. B.; Eiserich, J. P.; Chumley, P. H.; Jablonsky, M. J.; Krishna, N. R.;Kirk, M.; Barnes, S.; Darley-Usmar, V. M.; Freeman, B. A. Nitration ofunsaturated fatty acids by nitric oxide-derived reactive nitrogen speciesperoxynitrite, nitrous acid, nitrogen dioxide, and nitronium ion. Chem. Res.Toxicol. 12:83–92; 1999.
[10] Yin, H.; Xu, L.; Porter, N. A. Free radical lipid peroxidation: mechanisms andanalysis. Chem. Rev. 111:5944–5972; 2011.
[11] d’Ischia, M.; Napolitano, A.; Manini, P.; Panzella, L. Secondary targets ofnitrite-derived reactive nitrogen species: nitrosation/nitration pathways,antioxidant defense mechanisms and toxicological implications. Chem. Res.Toxicol. 24:2071–2092; 2011.
[12] Bonacci, G.; Asciutto, E. K.; Woodcock, S. R.; Salvatore, S. R.; Freeman, B. A.;Schopfer, F. J. Gas-phase fragmentation analysis of nitro-fatty acids. J. Am. Soc.Mass Spectrom 22:1534–1551; 2011.
[13] Corey, E. J.; Estreicher, H. New synthesis of conjugated nitro cyclo olefins,unusually versatile synthetic intermediates. J. Am. Chem. Soc. 100:6294–6295;1978.
[14] Hayama, T.; Tomoda, S.; Takeuchi, Y.; Nomura, Y. Synthesis of conjugatednitroalkenes via nitroselenenylation of alkenes. Tetrahedron Lett. 23:4733–4734;1982.
[15] Alexander, R. L.; Bates, D. J. P.; Wright, M. W.; King, S. B.; Morrow, C. S.Modulation of nitrated lipid signaling by multidrug resistance protein 1(MRP1): glutathione conjugation and MRP1-mediated efflux inhibit nitroli-noleic acid-induced, PPAR gamma-dependent transcription activation.Biochemistry 45:7889–7896; 2006.
[16] Woodcock, S. R.; Marwitz, A. J. V.; Bruno, P.; Branchaud, B. P. Synthesis ofnitrolipids: all four possible diastereomers of nitrooleic acids: (E)- and (Z)-,9- and 10-nitro-octadec-9-enoic acids. Org. Lett. 8:3931–3934; 2006.
[17] Gorczynski, M. J.; Huang, J. M.; King, S. B. Regio- and stereospecific synthesesand nitric oxide donor properties of (E)-9- and (E)-10-nitrooctadec-9-enoicacids. Org. Lett 8:2305–2308; 2006.
[18] Dunny, E.; Evans, P. Stereocontrolled synthesis of the PPAR-gamma agonist10-nitrolinoleic acid. J. Org. Chem. 75:5334–5336; 2010.
[19] Zanoni, G.; Bendjeddou, M. V. L; Porta, A.; Bruno, P.; Vidari, G. Improvedsynthesis of (E)-12-nitrooctadec-12-enoic acid, a potent PPAR gamma
activator: development of a ’’buffer-free’’ enzymatic method for hydrolysisof methyl esters. J. Org. Chem. 75:8311–8314; 2010.
[20] Kornblum, N.; Ungnade, H. E. 1-Nitrooctane. Org. Synth. 4:724; 1963.[21] Rudolph, V.; Schopfer, F. J.; Khoo, N. K. H.; Rudolph, T. K.; Cole, M. P.; Woodcock,
S. R.; Bonacci, G.; Groeger, A. L.; Golin-Bisello, F.; Chen, C. S.; Baker, P. R. S.;
Freeman, B. A. Nitro-fatty acid metabolome: saturation, desaturation, b-oxidation,and protein adduction. J. Biol. Chem. 284:1461–1473; 2009.
[22] Vogel, A. I.; Furniss, B. S., Eds. Vogel’s Textbook of Practical Organic Chemistry.1989.
[23] Pavia, D. L., Lampman, G. M., Kriz, G. S., Engel, R. G., editors. Brooks/Cole
Laboratory Series for Organic Chemistry. Pacific Grove, CA: Brooks Cole; 2010.[24] Still, W. C.; Kahn, M.; Mitra, A. Rapid chromatographic technique for preparative
separations with moderate resolution. J. Org. Chem. 43:2923–2925; 1978.[25] Waldmann, H.; Kunz, H. The allyl group as mildly and selectively removable
carboxy-protecting group for the synthesis of labile 0-glycopeptides. Liebigs
Ann. Chem 10:1712–1725; 1983.[26] Ono, N.; Maruyama, K. Preparation of pyrroles having long alkyl chains from
nitroalkenes. B Chem. Soc. Jpn 61:4470–4472; 1988.[27] Soengas, R. G.; Estevez, J. C.; Estevez, R. J. Transformation of D-glucose into
1D-3-deoxy-3-hydroxymethyl-myo-inositol by stereocontrolled intramole-
cular Henry reaction. Org. Lett. 5:4457–4459; 2003.[28] Myers, A. G.; Barbay, J. K.; Zhong, B. Y. Asymmetric synthesis of chiral
organofluorine compounds: use of nonracemic fluoroiodoacetic acid as apractical electrophile and its application to the synthesis of monofluorohydroxyethylene dipeptide isosteres within a novel series of HIV protease
inhibitors. J. Am. Chem. Soc 123:7207–7219; 2001.[29] Hey, H.; Arpe, H. J. Removal of allyl groups by formic-acid catalyzed by
(triphenylphosphane)palladium. Angew. Chem. Int. Ed. 12:928–929; 1973.[30] Radi, R. Nitric oxide, oxidants, and protein tyrosine nitration. Proc. Natl. Acad.
Sci. USA 101:4003–4008; 2004.[31] Farias, S. E.; Basselin, M.; Chang, L.; Heidenreich, K. A.; Rapoport, S. I.;
Murphy, R. C. Formation of eicosanoids, E-2/D-2 isoprostanes, and docosa-noids following decapitation-induced ischemia, measured in high-energy-microwaved rat brain. J. Lipid Res. 49:1990–2000; 2008.
[32] Yuan, L.; Zhang, D.; Jemal, M.; Aubry, A. F. Systematic evaluation of the rootcause of non-linearity in liquid chromatography/tandem mass spectrometry
bioanalytical assays and strategy to predict and extend the linear standardcurve range. Rapid Commun. Mass Spectrom 26:1465–1474; 2012.
[33] Hsu, F. F.; Turk, J. Elucidation of the double-bond position of long-chainunsaturated fatty acids by multiple-stage linear ion-trap mass spectrometrywith electrospray ionization. J. Am. Soc. Mass Spectrom 19:1673–1680; 2008.
[34] Baker, P. R. S.; Lin, Y.; Schopfer, F. J.; Woodcock, S. R.; Groeger, A. L.; Batthyany, C.;Sweeney, S.; Long, M. H.; Iles, K. E.; Baker, L. M. S.; Branchaud, B. P.; Chen, Y. E.;
Freeman, B. A. Fatty acid transduction of nitric oxide signaling: multiple nitratedunsaturated fatty acid derivatives exist in human blood and urine and serve asendogenous peroxisome proliferator-activated receptor ligands. J. Biol. Chem.
280:42464–42475; 2005.