Embed Size (px)
Citation preview
This article was published in an Elsevier journal. The attached copyis furnished to the author for non-commercial research and
education use, including for instruction at the author’s institution,sharing with colleagues and providing to institution administration.
Other uses, including reproduction and distribution, or selling orlicensing copies, or posting to personal, institutional or third party
websites are prohibited.
In most cases authors are permitted to post their version of thearticle (e.g. in Word or Tex form) to their personal website orinstitutional repository. Authors requiring further information
regarding Elsevier’s archiving and manuscript policies areencouraged to visit:
http://www.elsevier.com/copyright
Author's personal copy
Available at www.sciencedirect.com
journal homepage: www.elsevier.com/locate/watres
N-nitrosodimethylamine (NDMA) removal by reverseosmosis and UV treatment and analysis via LC–MS/MS
Megan H. Plumleea, Montserrat Lopez-Mesasa,1, Andy Heidlbergerb,Kenneth P. Ishidac, Martin Reinharda,�
aDepartment of Civil and Environmental Engineering, Terman Engineering Center, Stanford University, Stanford, CA 94305-4020, USAbDepartment of Chemistry, Universitat Duisburg-Essen, 47057 Duisburg, GermanycOrange County Water District, 10500 Ellis Avenue, Fountain Valley, CA 92708, USA
a r t i c l e i n f o
Article history:
Received 30 January 2007
Received in revised form
27 June 2007
Accepted 18 July 2007
Available online 26 July 2007
Keywords:
Nitrosamines
NDMA
LC–MS/MS
Reverse osmosis
Advanced treatment
a b s t r a c t
N-nitrosodimethylamine (NDMA) is a probable human carcinogen found in ng/l concen-
trations in chlorinated and chloraminated water. A method was developed for the
determination of ng/l levels of NDMA using liquid chromatography–tandem mass
spectrometry (LC–MS/MS) preceded by sample concentration via solid-phase extraction
with activated charcoal. Recoveries were greater than 90% and allowed a method reporting
limit as low as 2 ng/l. Using this method, the removal of NDMA was determined for the
Interim Water Purification Facility (IWPF), an advanced wastewater treatment facility
operated by the Orange County Water District (OCWD) in Southern California. The facility
treats effluent from an activated sludge treatment plant with microfiltration (MF), reverse
osmosis (RO), and an ultraviolet-hydrogen peroxide advanced oxidation process (UV-AOP).
Six nitrosamines were surveyed: NDMA, N-nitrosomethylethylamine (NMEA), N-nitroso-
diethylamine (NDEA), N-nitrosodi-n-propylamine (NDPA), N-nitrosopiperidine (NPip), and
N-nitrosopyrrolidine (NPyr). Only NDMA was detected and at all treatment steps in the
IWPF, with influent concentrations ranging from 20 to 59 ng/l. Removals for RO and UV
ranged from 24% to 56% and 43% to 66%, respectively. Overall, 6977% of the original NDMA
concentration was removed from the product water across the advanced treatment process
and, in combination with blending, the final concentration did not exceed the California
drinking water notification level of 10 ng/l. NDMA removal data are consistent with findings
reviewed for other advanced treatment facilities and laboratory studies.
& 2007 Elsevier Ltd. All rights reserved.
1. Introduction
N-nitrosodimethylamine (NDMA) is one of several N-nitrosa-
mines classified as probable human carcinogens by the US
Environmental Protection Agency (US EPA, 1993). NDMA
received much attention as a potential drinking water
contaminant after its 1998 detection in California drinking
water wells (up to 3 mg/l) due to contamination from
unsymmetrical dimethylhydrazine (UDMH)-based rocket fuel.
Subsequent monitoring led to the discovery that NDMA was
also a disinfection byproduct arising from the chlorination
and chloramination of drinking water and wastewater (CA
DHS, 2006). More potent than the trihalomethanes, NDMA
concentrations of 20–100 ng/l typically result from the chlor-
ination of wastewater effluent (Mitch et al., 2003). In 2002, the
California Department of Health Services established a 10 ng/l
ARTICLE IN PRESS
0043-1354/$ - see front matter & 2007 Elsevier Ltd. All rights reserved.doi:10.1016/j.watres.2007.07.022
�Corresponding author. Tel.: +1 650 723 0308; fax: +1 650 723 7058.E-mail address: [email protected] (M. Reinhard).1 Currently at: Centre GTS, Unitat de Quımica Analıtica, Departament de Quımica, Universitat Autonoma de Barcelona, Facultat de
Ciencies, Edifici CN, 08193 Bellaterra, Barcelona, Spain.
WAT E R R E S E A R C H 4 2 ( 2 0 0 8 ) 3 4 7 – 3 5 5
Author's personal copy
notification level (action level) in drinking water (CA DHS,
2006).
The indirect reuse of highly treated municipal wastewater
is being increasingly considered as an alternative water
source for domestic and ecological applications. Conse-
quently, the performance of secondary and advanced water
treatment schemes with regard to their mitigation of
potential contaminants like NDMA is an area of active
research. In addition to NDMA, the EPA has listed five other
nitrosamines on the Unregulated Contaminant Monitoring
Rule 2 (UCMR 2) to be monitored from 2008 to 2010 (US EPA,
2006). These probable human carcinogens have been found in
soil, air, plants, food, and water (Fine et al., 1977; US EPA,
2007).
A recent study found that secondary wastewater treatment
achieves variable NDMA removals ranging from 0% to 75%
(Sedlak et al., 2005); consequently, NDMA must be mitigated
at the source or during advanced treatment. While reverse
osmosis (RO) has been found to significantly remove salts,
emerging contaminants (499% for pharmaceuticals), and
other compounds (Reinhard et al., 1986; Reinhard et al.,
2003), the rejection of NDMA by RO is relatively low (Mitch
et al., 2003), necessitating additional removal technologies
such as UV treatment to meet regulatory limits. UV irradia-
tion is the most commonly applied treatment for NDMA and
has been used for drinking water, wastewater, and industrial
effluents. However, it is estimated that the dose required for
an order of magnitude reduction in NDMA is 10 times that for
equivalent virus removal in a drinking water system, high-
lighting the expense of such an approach for adequate
treatment (Mitch et al., 2003). While a variety of UV photolysis
studies under different laboratory conditions show NDMA
half-lives on the order of minutes (Ho et al., 1996; Stefan and
Bolton, 2002; Sharpless and Linden, 2003), there are fewer
reports for online UV treatment systems, in which other
factors like path length, lamp choice, and light screening may
play a role (Sharpless and Linden, 2003). In one such report
from an Ohsweken drinking water plant in Ontario, Canada,
NDMA was discovered in the water above the Ontario limit of
9 ng/l. Laboratory, pilot tests, and finally full-scale implemen-
tation of UV irradiation removed NDMA to below detectable
levels (Jobb et al., 1994).
For the detection of NDMA in wastewater and drinking
water, some existing methods are based on continuous
liquid–liquid extraction followed by gas chromatography
(Raksit and Johri, 2001; Mitch et al., 2003; Richardson, 2003).
These methods are labor intensive, require large volumes of
toxic solvents, and achieve low recoveries. Grebel et al. (2006)
recently developed a solid-phase microextraction method for
NDMA and other nitrosamines, which requires a conveniently
short analysis time but does not achieve detection limits in
the 1–10 ng/l range required for drinking water. While some
methods utilizing solid-phase extraction (SPE) have achieved
recoveries of only 30–60% (Mitch et al., 2003), other techniques
show 480% recovery and generally rely on gas chromato-
graphy coupled to mass spectrometry (GC–MS) (Ontario
Ministry of the Environment, 2003; Charrois et al., 2004) or
tandem mass spectrometry (GC–MS/MS) (Munch and Bassett,
2004). Recently, Zhao et al. (2006) developed a method for
nitrosamine analysis using liquid chromatography–tandem
mass spectrometry (LC–MS/MS), also coupled to SPE for
sample concentration.
The objectives of the present study were to assess NDMA
removal efficiencies during microfiltration (MF), RO, and UV
treatment at an advanced wastewater treatment facility, and
to develop a simple SPE–LC–MS/MS technique for analysis of
NDMA and other nitrosamines given in Table 1. The method
combines the extraction efficiency of SPE with the conve-
nience and selectivity of LC–MS/MS detection. The selectivity
of the technique is due to the detection of multiple specific
mass spectral fragmentations (‘‘transitions’’) (Budde, 2001).
Findings are compared to literature reports of both laboratory
and treatment plant data in an effort to provide a useful
summary of NDMA removal via advanced wastewater treat-
ment processes, with particular emphasis on rejection data
for RO.
2. Experimental
2.1. Materials
Chemicals, sources, and purities were as follows: methanol
and acetonitrile, HPLC grade from Fisher Scientific (Fair Lawn,
NJ, USA); acetone UltimAR from Mallinckrodt Chemicals
(Phillipsburg, NJ, USA); neutralized activated charcoal from
Sigma (St. Louis, MO, USA); NDMA, N-nitrosopiperidine
(NPip), N-nitrosodiethylamine (NDEA), and N-nitrosodi-
n-propylamine (NDPA) from Supelco (Bellefonte, PA, USA);
N-nitrosomethylethylamine (NMEA) and N-nitrosodi-n-buty-
lamine (NDBA) from Ultra Scientific (North Kingstown,
RI, USA); N-nitrosopyrrolidine (NPyr) from Aldrich (St. Louis,
MO, USA), and NDMA-d6 99.8% from CDN isotopes (Pointe-
Claire, Canada). Glass fiber filters were obtained from What-
man (Florham Park, NJ, USA). Teflon 1/800 tubing, weights,
tube adaptors, and a 16-port vacuum manifold for performing
SPE sample loading were purchased from Supelco. Extract-
Clean SPE 8 ml cartridges, frits, and syringe adapters (for
connecting SPE cartridges in-series) and the SPE vacuum
manifold were purchased from Alltech (Deerfield, IL, USA).
Strata Phenyl SPE cartridges were from Phenomenex (Tor-
rance, CA, USA). Milli-Q water was generated using a Synergy
185 Millipore with Simpak2 purifying system (Billerica, MA,
USA).
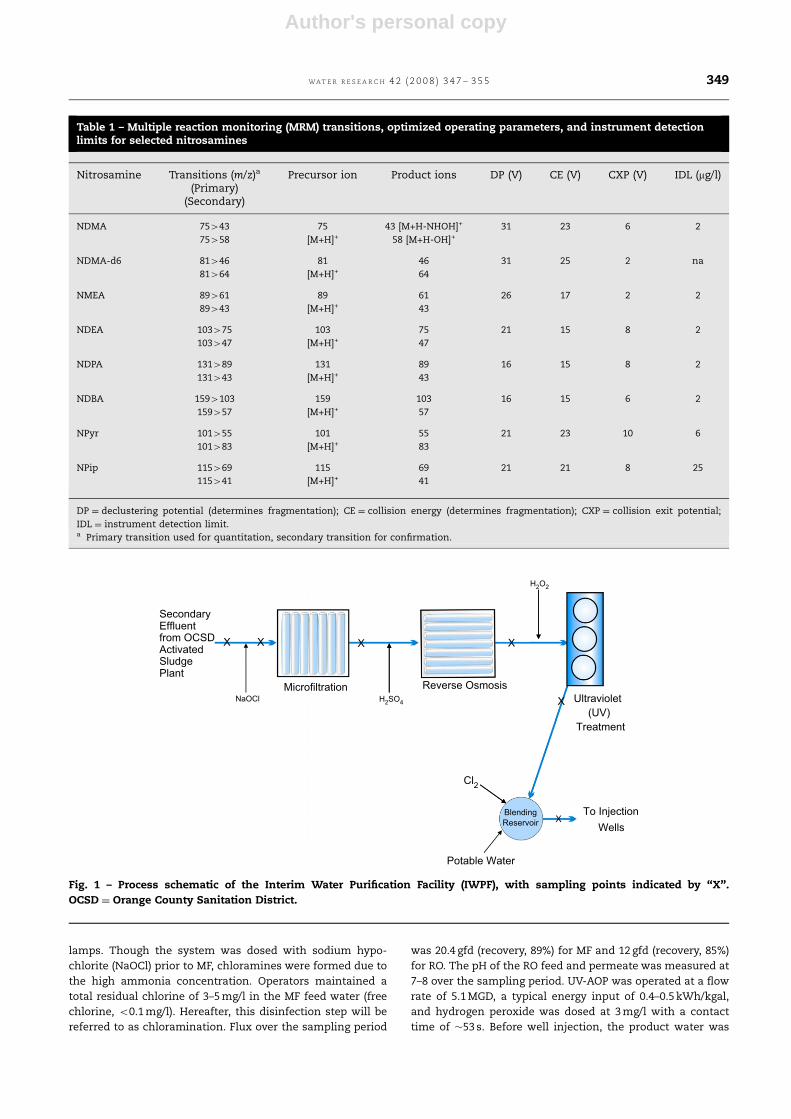
2.2. Site description and sample collection
Water samples were obtained from different stages through-
out the IWPF (Fig. 1), also known as Interim Water Factory 21,
a now-decommissioned advanced wastewater treatment
plant operated by the OCWD in Southern California. This
facility reclaimed effluent from the Orange County Sanitation
District (OCSD) secondary sludge plant to potable standards
for injection into a coastal aquifer as a hydraulic seawater
barrier. Advanced treatment at the IWPF included the
following: disinfection by chlorination, MF (Siemens), RO
(Hydranautics ESPA2 composite polyamide membranes),
and an ultraviolet-hydrogen peroxide advanced oxidation
(UV-AOP; Trojan Technologies UVPhox) system of six reactors
each equipped with 72 low-pressure, high-intensity UV
ARTICLE IN PRESS
WA T E R R E S E A R C H 4 2 ( 2 0 0 8 ) 3 4 7 – 3 5 5348
Author's personal copy
lamps. Though the system was dosed with sodium hypo-
chlorite (NaOCl) prior to MF, chloramines were formed due to
the high ammonia concentration. Operators maintained a
total residual chlorine of 3–5 mg/l in the MF feed water (free
chlorine, o0.1 mg/l). Hereafter, this disinfection step will be
referred to as chloramination. Flux over the sampling period
was 20.4 gfd (recovery, 89%) for MF and 12 gfd (recovery, 85%)
for RO. The pH of the RO feed and permeate was measured at
7–8 over the sampling period. UV-AOP was operated at a flow
rate of 5.1 MGD, a typical energy input of 0.4–0.5 kWh/kgal,
and hydrogen peroxide was dosed at 3 mg/l with a contact
time of �53 s. Before well injection, the product water was
ARTICLE IN PRESS
X X
X
Potable Water
X
NaOCl
X
H2SO4
H2O2
Cl2
MicrofiltrationUltraviolet
(UV)
Treatment
To InjectionBlending
ReservoirWells
Secondary Effluent from OCSD ActivatedSludge Plant
X
Reverse Osmosis
Fig. 1 – Process schematic of the Interim Water Purification Facility (IWPF), with sampling points indicated by ‘‘X’’.
OCSD ¼ Orange County Sanitation District.
Table 1 – Multiple reaction monitoring (MRM) transitions, optimized operating parameters, and instrument detectionlimits for selected nitrosamines
Nitrosamine Transitions (m/z)a Precursor ion Product ions DP (V) CE (V) CXP (V) IDL (mg/l)(Primary)
(Secondary)
NDMA 75443 75 43 [M+H-NHOH]+ 31 23 6 2
75458 [M+H]+ 58 [M+H-OH]+
NDMA-d6 81446 81 46 31 25 2 na
81464 [M+H]+ 64
NMEA 89461 89 61 26 17 2 2
89443 [M+H]+ 43
NDEA 103475 103 75 21 15 8 2
103447 [M+H]+ 47
NDPA 131489 131 89 16 15 8 2
131443 [M+H]+ 43
NDBA 1594103 159 103 16 15 6 2
159457 [M+H]+ 57
NPyr 101455 101 55 21 23 10 6
101483 [M+H]+ 83
NPip 115469 115 69 21 21 8 25
115441 [M+H]+ 41
DP ¼ declustering potential (determines fragmentation); CE ¼ collision energy (determines fragmentation); CXP ¼ collision exit potential;
IDL ¼ instrument detection limit.a Primary transition used for quantitation, secondary transition for confirmation.
WAT E R R E S E A R C H 4 2 ( 2 0 0 8 ) 3 4 7 – 3 5 5 349
Author's personal copy
blended with potable water (to increase product flow) and
disinfected using chlorine gas.
Grab samples of the reclaimed water were taken at each of
the locations indicated in Fig. 1 on May 24, June 14, and July
26, 2006. The samples (3–5 l per site) were collected in 1 l glass
amber bottles (I-CHEM; Rockwood, TN, USA) and sodium
thiosulfate (100 mg) was added to samples to quench
chlorine. Samples were packed on ice and shipped to Stanford
University, where they were filtered through 0.2mm nylon
membranes (Supelco), acidified to pH 2.3 using sulfuric acid
(Sigma), and kept at 4 1C until analyzed using the SPE–LC/
MS–MS method described.
2.3. LC–MS/MS
A liquid chromatograph from Shimadzu (LC-10AD VP) with a
Shimadzu SIL-10AD VP autosampler (Columbia, MD, USA)
connected to a triple quadrupole mass spectrometer (API3000)
from Applied Biosystems (Foster City, CA, USA) was used for
analysis of the nitrosamines given in Table 1. A volume of
50ml of sample was injected at a flow rate of 0.15 ml/min onto
a 50 mm�2.1 mm Targa Sprite C18 column (5 mm pore size,
Higgins Analytical, Mountain View, CA, USA) equipped with a
C18 Guard Column (Higgins Analytical). The mass spectro-
meter was operated in multiple reaction-monitoring transi-
tion mode at an optimized voltage for each transition in
positive-ion mode. To select the MS/MS parameters, stan-
dards of NDMA, NDMA-d6, and the other tested nitrosamines
were injected in continuous-flow mode and the declustering
potential, collision energy, and collision cell exit potential
were optimized for each transition. The nebulizer, curtain,
and collision gas flows were 6, 6, and 5 au, respectively, and
the ion spray voltage was operated at 5000 V with a source
temperature of 375 1C. A dwell time of 150 ms was used per
ion pair monitored. The nebulizer and drier gas were
generated by a Parker-Balston Zero Air Generator (Haverhill,
MA, USA) and nitrogen for the curtain and collision gas was
generated by a Parker-Balston N2-4000 Generator. The deut-
erated compound NDMA-d6 (110 mg/l) was added as an
internal standard to sample extracts and nitrosamine stan-
dards at a ratio of 0.3 internal standard volume/sample
volume.
Deuterated internal standards that elute with the analyte of
interest allow a correction for the ion suppression effect but
with the disadvantage of losing sensitivity since ion suppres-
sion still occurs (e.g. Miao and Metcalfe, 2003). Ion suppres-
sion is produced by the co-elution of the target analyte and
organic compounds present in the matrix which compete for
ionization at the source (Pat et al., 2002). To prevent ion
suppression of NDMA, the method was optimized to chro-
matographically resolve NDMA and the matrix components,
which were observed to produce ion suppression. A natural
surface water (Upper Silver Creek, San Jose, CA, USA) was
used as a representative matrix.
2.4. SPE method development
A variety of sorbents and elution solvents were tested to
optimize the SPE method for NDMA (see Supplementary
information for details). The recovery of NDMA from Milli-Q
water and surface water (Upper Silver Creek) at environmen-
tally relevant concentrations (100 ng/l), the effect of sample
pH, filtration pore size, extract evaporation technique, and
the presence of an additional cartridge in-series (Strata
Phenyl) were evaluated.
To test the applicability of the optimized NDMA SPE method
to other similar nitrosamines, a method recovery test was
performed by extracting and analyzing 500 ml of Milli-Q water
(n ¼ 6) and surface water (n ¼ 6) spiked with 100 ng/l each of
six nitrosamines. The nitrosamines included NMEA, NDEA,
NDPA, NDBA, NPyr, and NPip (structures given in Fig. 2); all
but NPip are included in UCMR 2.
Different SPE cartridges commonly recommended for the
extraction of trace organic compounds were tested in order to
evaluate the adsorption of NDMA, if any. A single water
sample may be extracted for multiple compounds with
different properties by placing appropriate SPE cartridges in-
series, with the second cartridge extracting compounds that
sorb negligibly to the first. For extraction of NDMA, it is
therefore important to verify that it has no affinity for the first
cartridge. Results of these tests with several commercial
SPE cartridges are summarized in the Supplementary infor-
mation.
2.5. Quantification
Nitrosamine standards consisted of a mixed standard solu-
tion in Milli-Q water which contained NDMA and the six other
tested nitrosamines. The instrument detection limit (IDL) for
each nitrosamine was determined as the lowest injected
standard that gave a signal-to-noise ratio of at least three and
an accuracy of 70–130%. The SPE method was evaluated by
determining the recoveries and relative standard deviation
(RSD) of spiked samples processed through the entire
analytical method (SPE, elution, concentration). Method
detection limits (MDLs) were calculated using the known
extraction recovery, concentration factor, and IDL.
Calibration standards from 0.1 to 200mg/l nitrosamines
were injected before and after sample groups and were
analyzed using linear regression with inverse weighting
(1/x). Satisfactory r2 values were obtained for all nitrosamines
(0.98–0.99). Blanks processed through the entire method were
also analyzed with each sample set. Nitrosamine identifica-
tion and quantification were made for samples with a signal-
to-noise ratio of at least three and a minimum of two
transitions eluting at the expected retention time.
3. Results and discussion
3.1. LC–MS/MS method optimization
For all nitrosamines, the precursor ion detected was the
[M+H]+ ion. The most abundant transition was used for
quantitation and a second transition was used for qualitative
confirmation. Few additional product ions were observed due
to the low molecular weight of the compounds. NDMA
showed an adduct of molecular weight 92, suspected to be
due to the presence of ammonium in the mobile phase, which
fragmented into mass 75 (the [M+H]+ ion) and was used as an
ARTICLE IN PRESS
WA T E R R E S E A R C H 4 2 ( 2 0 0 8 ) 3 4 7 – 3 5 5350
Author's personal copy
additional qualifier transition. The optimized mass spectro-
metry parameters and IDLs are given in Table 1. Precision
expressed as % RSD was evaluated by injecting each calibra-
tion standard six times; for all nitrosamines, the RSD was less
than 15% for all standards at or above the IDL. For NDMA, the
IDL was found to be 2 mg/l, and ranged between 2 and 25mg/l
for the other nitrosamines (Table 1) for a 50ml injection
volume. One of the benefits to LC-based analyses over GC is
the fact that samples may be directly injected as an aqueous
aliquot. This is a major advantage for laboratory studies or for
environmental and wastewater samples in which the analyte
concentration exceeds the IDL. For example, NDMA concen-
trations in industrial effluent from circuit board manufac-
turers have been measured as high as 105mg/l, well above the
NDMA IDL reported here. Department of Defense and aero-
space testing facility superfund sites also regularly show high
mg/l-range NDMA concentrations due to contamination from
the use of UDMH-based rocket fuel (Mitch et al., 2003).
Therefore, these types of samples may be injected directly
onto the column without prior extraction into an organic
solvent.
A mobile phase consisting of methanol and 2 mM ammo-
nium acetate in water resulted in optimal retention time
and peak shape. It was noted that if standards of NDMA
were prepared in solvents other than water, the compound
was not retained well by the column. The final conditions
for the mobile phase were as follows: 10–45% methanol
over 4 min, to 100% methanol at 5 min, held until 10 min,
and finally returned to 10% methanol at a flow rate of 0.15 ml/
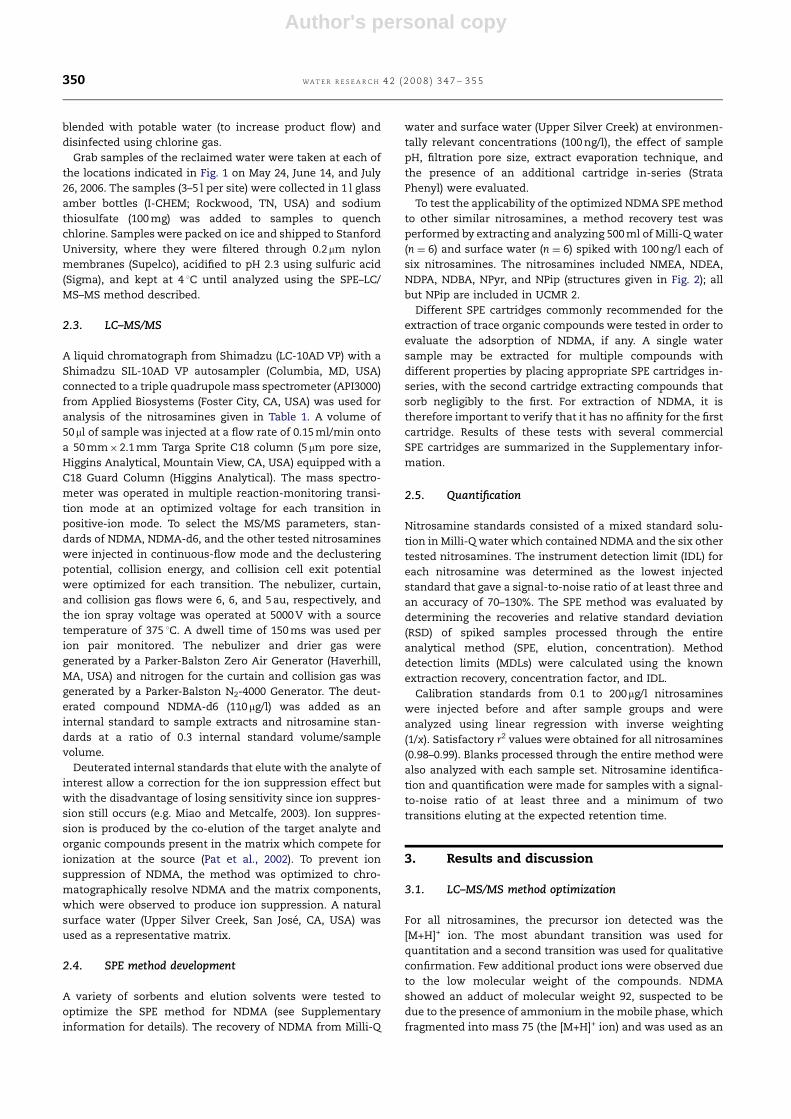
min. The total run time was 11 min. The nitrosamines
were eluted in order of increasing chain length; compounds
present in the matrix, which were observed to cause ion
suppression of NDMA, were chromatographically separated
from the analytes, eluting at 1–2 min while NDMA eluted
at 3.1 min and the other nitrosamines between 4 and 8 min
(Fig. 2).
3.2. SPE recovery and method detection limit
In a preliminary evaluation, activated charcoal showed the
highest adsorption capacity for NDMA among alternative
sorbents. While other methods rely on more than one sorbent
(Charrois et al., 2004; Zhao et al., 2006), high NDMA recoveries
were achieved here using only activated charcoal. Under
typical SPE conditions (1 g of charcoal packed into an 8 ml SPE
cartridge) and a loading rate o5 ml/min, the retention
efficiency of NDMA from the water sample to the sorbent
was greater than 98%. Glass fiber filters inside the packed
cartridge below the frit were required to prevent loss of the
fine charcoal during sample loading. The charcoal was not
ARTICLE IN PRESS
0
1.2e4
0
8e4
NMEA
0
3e4
NDEA
8e4
2
NDMA
NDPA
0
1.5e5
NDBA
0
7e4
NPyr
0
8e4
NPip
0 4 6 10 11
Time (min)
Inte
nsity
1 3 5 7 8 9
Fig. 2 – Molecular structures and typical LC–MS/MS chromatogram for seven nitrosamines (100 lg/l standard) showing the
major (quantitation) transition for each nitrosamine.
WAT E R R E S E A R C H 4 2 ( 2 0 0 8 ) 3 4 7 – 3 5 5 351
Author's personal copy
allowed to dry before elution in order to retain some water in
the extract. A recovery of 99.971.5% NDMA was achieved for
spiked Milli-Q water (30mg/l) with an elution of 2 ml of
acetonitrile, followed by 2 ml of methanol and finally 2 ml of
acetone (each two times and drained completely under
vacuum in between each addition). The elution solvents were
evaporated from the extract at 37 1C in a sand bath, leaving
1–3 ml water for injection onto the LC–MS/MS.
When the SPE technique was tested using natural surface
waters spiked with environmentally relevant concentrations
(100 ng/l) of NDMA, 90711% recovery was obtained by sample
pH adjustment to 2.3, filtration with either 0.2 or 0.45mm
filters, sample loading with activated charcoal alone or in-
series with an additional SPE cartridge, and extract evapora-
tion using a 37 1C sand bath. Additional details on the sorbent
selection, elution optimization, and NDMA recovery tests are
provided in the Supplementary information.
Spiked samples (100 ng/l) were processed through the entire
analytical method to determine the recoveries and MDLs for
all nitrosamines. The calculated MDL for the combined
SPE–LC–MS/MS technique depends upon the IDL of the
LC–MS/MS, the SPE percent recovery, and the concentration
factor (ratio of volume loaded to volume of concentrated
extract). For NDMA, mean recoveries were 90711% and
10575% in surface water and Milli-Q water, respectively.
The recoveries of the other tested nitrosamines were variable,
with higher recoveries achieved for shorter alkyl-chain
lengths. The mean recoveries in Milli-Q water were 8676%,
66713%, 26710%, and 574% for NMEA, NDEA, NDPA, and
NDBA, respectively, and 10478% and 14275% for the cyclic
nitrosamines NPip and NPyr. The results were inversely
correlated with the octanol-water partition coefficient (log -
Kow), suggesting that the strongly sorbing nitrosamines were
not eluted as effectively from the activated charcoal. In the
case of 1000 ml water samples concentrated to 1 ml extracts,
the optimal MDLs using the SPE–LC–MS/MS technique are
2 ng/l for NDMA, NMEA, and NDEA, and 4, 6, and 24 ng/l for
NPyr, NDPA, and NPip, respectively.
3.3. Nitrosamines in advanced water treatment
NDMA was detected in the secondary effluent and at all
sampling points throughout the IWPF advanced treatment
train (Table 2). A range of 20–59 ng/l NDMA was determined
for the secondary effluent (input to the advanced treatment)
prior to chloramination, which is consistent with a recent
survey of wastewater treatment plants showing a median
concentration of 80 ng/l NDMA in untreated wastewater and
variable removals of 0–75% for secondary (biological) treat-
ment (Sedlak et al., 2005). While NDMA is expected to form
following wastewater chlorination or chloramination,
there are other sources (Najm and Trussell, 2001; Mitch et al.,
2003). Sources of NDMA to the IWPF are known point
sources, domestic wastewater, industrial sources (OCSD,
2002; Sedlak et al., 2005), and potentially the use of polymeric
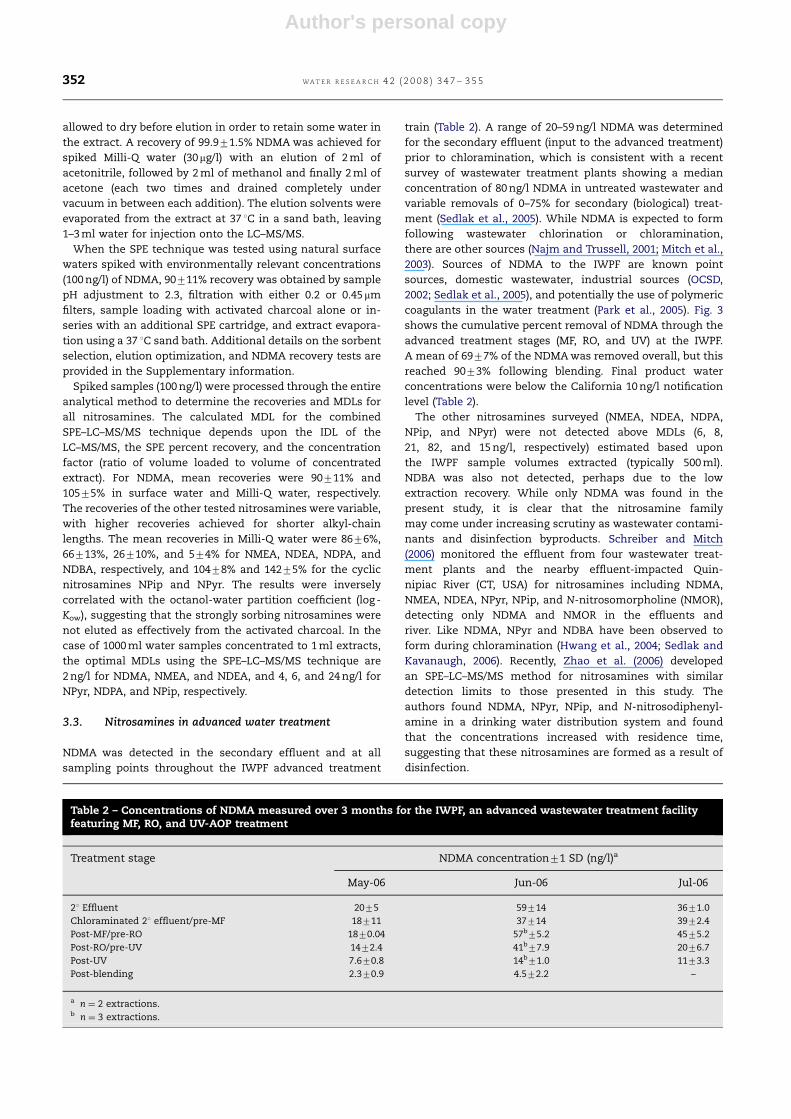
coagulants in the water treatment (Park et al., 2005). Fig. 3
shows the cumulative percent removal of NDMA through the
advanced treatment stages (MF, RO, and UV) at the IWPF.
A mean of 6977% of the NDMA was removed overall, but this
reached 9073% following blending. Final product water
concentrations were below the California 10 ng/l notification
level (Table 2).
The other nitrosamines surveyed (NMEA, NDEA, NDPA,
NPip, and NPyr) were not detected above MDLs (6, 8,
21, 82, and 15 ng/l, respectively) estimated based upon
the IWPF sample volumes extracted (typically 500 ml).
NDBA was also not detected, perhaps due to the low
extraction recovery. While only NDMA was found in the
present study, it is clear that the nitrosamine family
may come under increasing scrutiny as wastewater contami-
nants and disinfection byproducts. Schreiber and Mitch
(2006) monitored the effluent from four wastewater treat-
ment plants and the nearby effluent-impacted Quin-
nipiac River (CT, USA) for nitrosamines including NDMA,
NMEA, NDEA, NPyr, NPip, and N-nitrosomorpholine (NMOR),
detecting only NDMA and NMOR in the effluents and
river. Like NDMA, NPyr and NDBA have been observed to
form during chloramination (Hwang et al., 2004; Sedlak and
Kavanaugh, 2006). Recently, Zhao et al. (2006) developed
an SPE–LC–MS/MS method for nitrosamines with similar
detection limits to those presented in this study. The
authors found NDMA, NPyr, NPip, and N-nitrosodiphenyl-
amine in a drinking water distribution system and found
that the concentrations increased with residence time,
suggesting that these nitrosamines are formed as a result of
disinfection.
ARTICLE IN PRESS
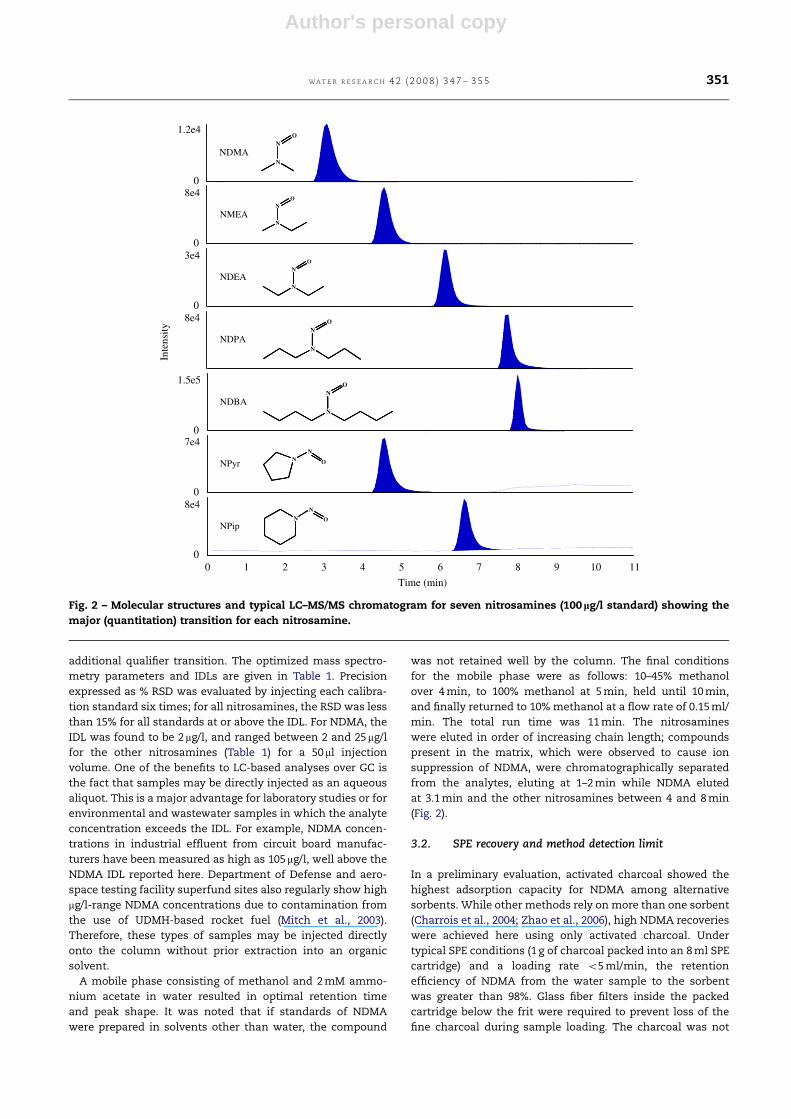
Table 2 – Concentrations of NDMA measured over 3 months for the IWPF, an advanced wastewater treatment facilityfeaturing MF, RO, and UV-AOP treatment
Treatment stage NDMA concentration71 SD (ng/l)a
May-06 Jun-06 Jul-06
21 Effluent 2075 59714 3671.0
Chloraminated 21 effluent/pre-MF 18711 37714 3972.4
Post-MF/pre-RO 1870.04 57b75.2 4575.2
Post-RO/pre-UV 1472.4 41b77.9 2076.7
Post-UV 7.670.8 14b71.0 1173.3
Post-blending 2.370.9 4.572.2 –
a n ¼ 2 extractions.b n ¼ 3 extractions.
WA T E R R E S E A R C H 4 2 ( 2 0 0 8 ) 3 4 7 – 3 5 5352
Author's personal copy
3.3.1. MicrofiltrationAs expected, MF was not effective in removing NDMA. The
small NDMA molecule easily passes through the MF mem-
brane. In fact, the NDMA concentration increased (by 5–56%),
which is consistent with communications from advanced
treatment facilities (Mitch et al., 2003) and findings by Sedlak
and Kavanaugh (2006) for three advanced treatment facilities
showing increases of 0–32%. The authors attribute the
increase to NDMA formation as a result of chlorination
performed prior to MF to prevent MF membrane fouling. In
this case, chloramination was performed prior to MF, which
produces significantly more NDMA than chlorination (Najm
and Trussell, 2001; Mitch and Sedlak, 2002a, b).
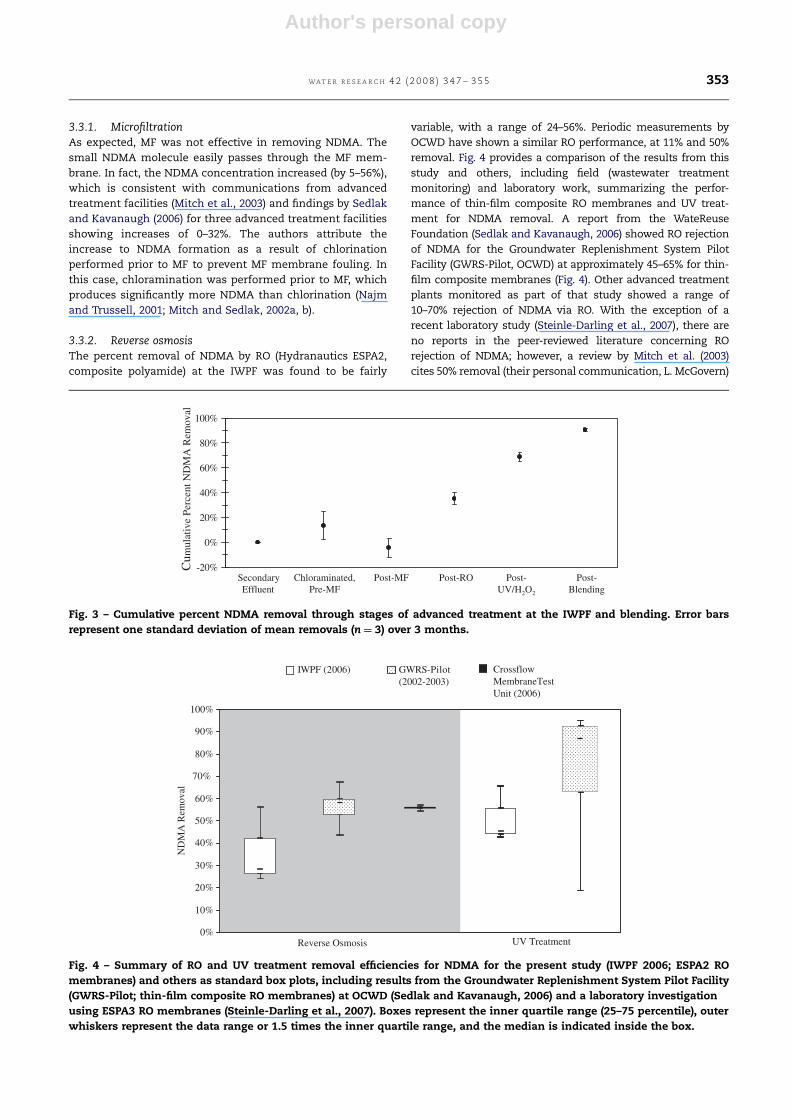
3.3.2. Reverse osmosisThe percent removal of NDMA by RO (Hydranautics ESPA2,
composite polyamide) at the IWPF was found to be fairly
variable, with a range of 24–56%. Periodic measurements by
OCWD have shown a similar RO performance, at 11% and 50%
removal. Fig. 4 provides a comparison of the results from this
study and others, including field (wastewater treatment
monitoring) and laboratory work, summarizing the perfor-
mance of thin-film composite RO membranes and UV treat-
ment for NDMA removal. A report from the WateReuse
Foundation (Sedlak and Kavanaugh, 2006) showed RO rejection
of NDMA for the Groundwater Replenishment System Pilot
Facility (GWRS-Pilot, OCWD) at approximately 45–65% for thin-
film composite membranes (Fig. 4). Other advanced treatment
plants monitored as part of that study showed a range of
10–70% rejection of NDMA via RO. With the exception of a
recent laboratory study (Steinle-Darling et al., 2007), there are
no reports in the peer-reviewed literature concerning RO
rejection of NDMA; however, a review by Mitch et al. (2003)
cites 50% removal (their personal communication, L. McGovern)
ARTICLE IN PRESS
-20%
0%
20%
40%
60%
80%
100%
Cum
ulat
ive
Perc
ent N
DM
A R
emov
al
SecondaryEffluent
Chloraminated,Pre-MF
Post-MF Post-RO Post-UV/H2O2
Post-Blending
Fig. 3 – Cumulative percent NDMA removal through stages of advanced treatment at the IWPF and blending. Error bars
represent one standard deviation of mean removals (n ¼ 3) over 3 months.
0%
10%
20%
30%
40%
50%
60%
70%
80%
90%
100%
ND
MA
Rem
oval
Reverse Osmosis UV Treatment
IWPF (2006) GWRS-Pilot(2002-2003)
CrossflowMembraneTestUnit (2006)
Fig. 4 – Summary of RO and UV treatment removal efficiencies for NDMA for the present study (IWPF 2006; ESPA2 RO
membranes) and others as standard box plots, including results from the Groundwater Replenishment System Pilot Facility
(GWRS-Pilot; thin-film composite RO membranes) at OCWD (Sedlak and Kavanaugh, 2006) and a laboratory investigation
using ESPA3 RO membranes (Steinle-Darling et al., 2007). Boxes represent the inner quartile range (25–75 percentile), outer
whiskers represent the data range or 1.5 times the inner quartile range, and the median is indicated inside the box.
WAT E R R E S E A R C H 4 2 ( 2 0 0 8 ) 3 4 7 – 3 5 5 353
Author's personal copy
for thin-film composite RO membranes, in agreement with the
data shown here. A National Water Research Institute (NWRI)
report showed quite low rejections for a variety of membranes
(DOW/Filmtec BW30: 17.7%; Hydranautics ESPA2: 19.2%;
Hydranautics LFC1: 15.8%; Koch/Fluid Systems TFC-HR: 21.3%;
Osmonics cellulose acetate: 5.9%), but the bench-scale system
lacked a cross-flow component representative of real systems
and the authors note that the removal of poorly rejected
compounds, like NDMA, was impacted by this design difference
(Rodriguez et al., 2004). A recent result by Steinle-Darling et al.
(2007) is included in Fig. 4, showing 55.871.3% removal for
NDMA in deionized water using a cross-flow, bench-scale
system with ESPA3 (Hydranautics) membranes. As may be
expected, these laboratory results show less measurement
variability than do the field studies, but they generally agree.
Importantly, Steinle-Darling et al. (2007) show that while a
rejection near 56% may be expected under pure water
(deionized) conditions, the rejection of NDMA will decrease
with changing feed characteristics and membrane fouling due
to concentration polarization. This may explain NDMA rejec-
tions of o50% measured in actual treatment facilities such as
the IWPF and GWRS-Pilot (Fig. 4).
3.3.3. UV treatmentUV treatment of NDMA resulted in removals of 43–66% for the
IWPF. This range is consistent with performance found for
GWRS-Pilot (Sedlak and Kavanaugh, 2006), as shown in Fig. 4.
While UV treatment at the IWPF was performed in combina-
tion with H2O2, this is not expected to enhance NDMA
destruction (Mitch et al., 2003; Sharpless and Linden, 2003).
In addition to blending the final product water with potable
water, the advanced treatment effluent was chlorinated.
Although there is some debate over whether NDMA may be
reformed from degradation products when a chlorination or
chloramination step follows UV treatment (Mitch et al., 2003),
final concentrations measured in this study did not appear to
increase following the chlorination and blending of product
water, and ranged from 2 to 5 ng/l, below the 10 ng/l
notification level. The lack of significant NDMA formation
may be explained by the choice of chlorination over
chloramination, and by the fact that the upstream RO
treatment is expected to nearly completely remove NDMA
precursors (Sedlak and Kavanaugh, 2006).
Currently, UV treatment is the most accepted method for
removal of NDMA. While RO may not be as effective for
NDMA as it is for pharmaceuticals (Reinhard et al., 1986,
2003), it nevertheless contributes to removal. In fact, RO in
combination with UV treatment may be necessary for
adequate and reliable NDMA removal. In the case of the
present study, 59–75% was removed across RO and UV
treatment together. In combination with blending performed
to increase product flow, the final product water (reclaimed
wastewater) met potable standards at NDMA concentrations
of non-detect or below the 10 ng/l CA notification level.
4. Conclusions
Many communities already rely on water recycling to
meet their freshwater needs, and more water agencies are
working to expand their reclamation of wastewater for this
purpose. Consequently, the fate of wastewater-derived con-
taminants like NDMA in the environment and in wastewater
treatment must be evaluated. The present study reports
NDMA removal efficiencies for advanced wastewater treat-
ment in an actual facility operated by the OCWD featuring MF,
RO, and UV-AOP, with nitrosamines measured using a
developed LC–MS/MS analytical method. Results of other
field and laboratory studies have also been reviewed. In
summary,
� The described method for NDMA features a high extrac-
tion efficiency using SPE and accurate identification and
quantification via LC–MS/MS at a reporting limit of 2 ng/l,
below the 10 ng/l notification level specified by the
California Department of Health Services, and may be
applied for additional nitrosamine analyses.
� Contaminated industrial effluents or other waters having
concentrations of nitrosamines above the LC–MS/MS
instrument detection limit (2 mg/l for NDMA and 2–25mg/l
for other tested nitrosamines) may be directly injected (no
pre-concentration) and as water, in contrast to GC-based
techniques.
� NDMA was detected in the secondary effluent of the OCSD
(20–59 ng/l) and throughout the advanced treatment at the
IWPF. Of the other nitrosamines monitored (NMEA, NDEA,
NDPA, NPip, NPyr), none were detected above the 6–82 ng/l
method detection limits.
� MF of wastewater effluent is not expected to reduce
NDMA concentrations and may in fact lead to
NDMA formation when used in combination with chlor-
ination or chloramination to prevent MF membrane
fouling.
� RO treatment of secondary effluent using thin-film com-
posite membranes typically results in NDMA rejection of
approximately 50–65% or less. For the overall treatment
train, this rejection is an important contribution to NDMA
removal. Lower rejection may be associated with changing
feed conditions and fouling observed in real treatment
systems.
� UV irradiation in combination with RO treatment and, in
some cases, blending allows operators to reliably maintain
the residual NDMA below the 10 ng/l CA drinking water
notification level.
Acknowledgment
This research was funded by the Santa Clara Valley Water
District (CA), the California Department of Water Resources,
Nanyang Technological University (Singapore), the National
Science Foundation Graduate Research Fellowship program,
and WaterCAMPWS (under Director Vern Snoeyink), a Science
and Technology Center of the National Science Foundation
(CTS-0120978). Any opinions, findings, conclusions, and
recommendations expressed in this publication are those of
the authors and do not necessarily reflect the views of the
sponsoring agencies.
ARTICLE IN PRESS
WA T E R R E S E A R C H 4 2 ( 2 0 0 8 ) 3 4 7 – 3 5 5354
Author's personal copy
Appendix A. Supplementary Materials
Supplementary data associated with this article can be found
in the online version at doi:10.1016/j.watres.2007.07.022.
R E F E R E N C E S
Budde, W.L., 2001. Analytical Mass Spectrometry: Strategies forEnvironmental and Related Applications. American ChemicalSociety, Washington, DC, 400pp.
Charrois, J.W.A., Arend, M.W., Froese, K.L., Hrudey, S.E., 2004.Detecting N-nitrosamines in drinking water at nanogram perliter levels using ammonia positive chemical ionization.Environ. Sci. Technol. 38, 4835–4841.
CA DHS, 2006. A Brief History of NDMA Findings in Drinking WaterSupplies and Related Activities. /http://www.dhs.ca.gov/ps/ddwem/chemicals/NDMA/history.htmS (accessed December,2006). California Department of Health Services.
Fine, D.H., Rounbehler, D.P., Fan, T., Ross, R., 1977. Humanexposure to N-nitroso compounds in the environment. In:Hiatt, H.H., Watson, J.D., Winsten, J.A. (Eds.), Origins of HumanCancer. Cold Spring Harbor Lab., Cold Spring Harbor, NY,pp. 293–308.
Grebel, J.E., Young, C.C., Suffet, I.H., 2006. Solid-phase microex-traction of N-nitrosamines. J. Chromatogr. A 1117, 11–18.
Ho, T.-F.L., Bolton, J.R., Lipczynska-Kochany, E., 1996. Quantumyields for the photodegradation of pollutants in diluteaqueous solution: phenol, 4-chlorophenol and N-nitrosodi-methylamine. J. Adv. Oxid. Technol. 1, 170–178.
Hwang, C.J., Guo, Y.C., Krasner, S.W., 2004. Contribution of treatedwastewater to nitrosamine occurrence and formation indrinking water. In: The 227th American Chemical SocietyNational Meeting, Anaheim, CA.
Jobb, D.B., Hunsinger, R.B., Meresz, O., Taguchi, V., 1994. Removalof N-nitrosodimethylamine from the Ohsweken (Six Nations)water supply. Final Report, Ontario Ministry of Environmentand Energy.
Mitch, W.A., Sedlak, D.L., 2002a. Factors controlling nitrosamineformation during wastewater chlorination. Water Sci. Tech-nol.: Water Supply 2, 191–198.
Mitch, W.A., Sedlak, D.L., 2002b. Formation of N-nitrosodimethyl-amine (NDMA) from dimethylamine during chlorination.Environ. Sci. Technol. 36, 588–595.
Mitch, W.A., Sharp, J.O., Trussell, R.R., Valentine, R.L., Alvarez-Cohen, L., Sedlak, D.L., 2003. N-nitrosodimethylamine (NDMA)as a drinking water contaminant: a review. Environ. Eng. Sci.20, 389–404.
Munch, J.W., Bassett, M.V., 2004. Method 521: Determination ofNitrosamines in Drinking Water by Solid Phase Extraction andCapillary Column Gas Chromatography with Large VolumeInjection and Chemical Ionization Tandem Mass Spectrometry(MS/MS). National Exposure Research Laboratory Office of Re-search and Development, US Environmental Protection Agency.
Najm, I., Trussell, R.R., 2001. NDMA formation in water andwastewater. J. Am. Water Works Assoc. 93, 92–98.
OCSD, 2002. NDMA Source Control: Sources of n-Nitrosodimethyl-amine in the Orange County Sanitation District Service Area,
Source Control Division, Orange County Sanitation District,California.
Ontario Ministry of the Environment, 2003. The Determination ofN-Nitrosodimethylamine (NDMA) in Water by Gas Chromato-graphy–High Resolution Mass Spectrometry (GC–HRMS).
Park, S.-H., Piyachaturawat, P., Aral, M., Huang, C.-H., 2005.Potential enhanced N-nitrosodimethylamine (NDMA) forma-tion under water treatment conditions. Environ. Expos. Health85, 528–537.
Pat, S., Nogueira, J., Sandra, T., David, F., 2002. Recent Applicationsin LC–MS: Environmental Analysis. LCGC Europe, November.
Raksit, A., Johri, S., 2001. Determination of N-nitrosodimethyl-amine in environmental aqueous samples by isotope-dilutionGC/MS-SIM. J. AOAC Int. 84 (5), 1413–1419.
Reinhard, M., Goodman, N.L., McCarty, P.L., Argo, D.G., 1986.Removing trace organics by reverse osmosis using celluloseacetate and polyamide membranes. J. Am. Water Works Assoc.78, 163–174.
Reinhard, M., Montgomery-Brown, J., Louie, J.S., Gross, B., 2003.From effluent to new water: performance evaluation andquality assurance. Chimia 57, 561–566.
Richardson, S.D., 2003. Water analysis: emerging contaminantsand current issues. Anal. Chem. 75, 2831–2857.
Rodriguez, G., Buonora, S., Knoell, T., Don Phipps, J., Ridgway, H.,2004. Rejection of pharmaceuticals by reverse osmosis mem-branes: quantitative structure activity relationship (QSAR)analysis. Final Report, National Water Research Institute(NWRI) Project 01-EC-002.
Schreiber, I.M., Mitch, W.A., 2006. Occurrence and fate ofnitrosamines and nitrosamine precursors in wastewater-impacted surface waters using boron as a conservative tracer.Environ. Sci. Technol. 40, 3203–3210.
Sedlak, D.L., Kavanaugh, M., 2006. Removal and Destruction ofNDMA and NDMA Precursors during Wastewater Treatment.WateReuse Foundation, Alexandria, VA.
Sedlak, D.L., Deeb, R.A., Hawley, E.L., Mitch, W.A., Durbin, T.D.,Mowbray, S., Carr, S., 2005. Sources and fate of nitrosodi-methylamine and its precursors in municipal wastewatertreatment plants. Water Environ. Res. 77, 32–39.
Sharpless, C.M., Linden, K.G., 2003. Experimental and modelcomparisons of low- and medium-pressure Hg lamps for thedirect and H2O2 assisted UV photodegradation of N-nitroso-dimethylamine in simulated drinking water. Environ. Sci.Technol. 37, 1933–1940.
Stefan, M.I., Bolton, J.R., 2002. UV direct photolysis of N-nitrosodimethylamine (NDMA): kinetic and product study.Helv. Chim. Acta 85, 1416–1426.
Steinle-Darling, E., Zedda, M., Plumlee, M.H., Ridgway, H.F.,Reinhard, M., 2007. Evaluating the impacts of membranetype, coating, fouling, chemical properties and water chem-istry on reverse osmosis rejection of seven nitrosoalkyl-amines, including NDMA. Water Res., in press, doi:10.1016/j.waters.2007.05.034.
US EPA, 1993. N-Nitrosodimethylamine (CASRN 62-75-9) Inte-grated Risk Information System (IRIS).
US EPA, 2006. Unregulated Contaminant Monitoring Rule 2 (UCMR 2).US EPA, 2007. Integrated Risk Information System (IRIS) Sub-
stance List.Zhao, Y.-Y., Boyd, J., Hrudey, S., Li, X.-F., 2006. Characterization of
new nitrosamines in drinking water using liquid chromato-graphy tandem mass spectrometry. Environ. Sci. Technol. 40,7636–7641.
ARTICLE IN PRESS
WAT E R R E S E A R C H 4 2 ( 2 0 0 8 ) 3 4 7 – 3 5 5 355


