Embed Size (px)
Citation preview
Non-destructive analysis of metals and alloys using prompt
gamma activation analysis and complementary methods
PhD dissertation
by
Boglárka Maróti
Supervisors:
Dr. Tamás Belgya, MTA Centre for Energy Research
Dr. Zoltán Homonnay, Faculty of Sciences, Eötvös Loránd University
Consultant:
Dr. László Szentmiklósi, MTA Centre for Energy Research
PhD School of Chemistry
Head: Dr. Attila Császár
Analytical Chemistry,Colloid and Environmental Chemistry, Electrochemistry Programme
Head of Programme: Dr. Éva Kiss
Nuclear Analysis and Radiography Deparment
Centre for Energy Research
Hungarian Academy of Sciences
Eötvös Loránd University,
Faculty of Science,
Institute of Chemistry
Budapest, 2018
1
Table of Contents
Table of Contents ....................................................................................................... 1
Key to acronyms ......................................................................................................... 3
Symbols ...................................................................................................................... 5
1 Introduction ............................................................................................................ 7
2 Aims of research ..................................................................................................... 9
3 Overview of literature .......................................................................................... 12
3.1 Fundamentals of the applied methods ..................................................................... 16
3.1.1 Interactions of neutrons with matter ............................................................................ 16
3.1.2 Interactions of photons with matter ............................................................................. 18
3.1.3 Macroscopic description of the interactions ................................................................ 19
3.1.4 Irradiated volume, information depth .......................................................................... 20
3.2 Prompt gamma activation analysis ......................................................................... 23
3.2.1 Basic phenomenon of prompt gamma activation analysis .......................................... 24
3.2.2 Structure of the prompt gamma spectra ...................................................................... 26
3.2.3 Qualitative and quantitative analysis ........................................................................... 31
3.2.4 PGAA combined with off-line counting ..................................................................... 33
3.2.5 PGAA facilities ........................................................................................................... 35
3.3 Complementary methods ........................................................................................ 37
3.3.1 X-ray fluorescence spectroscopy ................................................................................. 37
3.3.2 X-ray and neutron imaging .......................................................................................... 42
4 Experimental results and Discussion ................................................................... 49
4.1 Methodological developments for the analysis of metals ....................................... 49
4.1.1 Improving nuclear data for the interference correction on bronze objects .................. 49
4.1.2 Improving the selectivity of PGAA with a high-resolution germanium detector ....... 54
4.1.3 Application of a low-energy gamma attenuator .......................................................... 58
4.2 Applications in the analytical practice .................................................................... 62
4.2.1 Measurements with a high-resolution planar Ge detector ........................................... 62
2
4.2.2 Comparison of the performances of PGAA, INAA, in-beam activation analysis and
handheld XRF in the analysis of copper alloys .................................................................... 73
4.2.3 Combination of handheld XRF and conventional PGAA ........................................... 76
4.2.4 Combination of handheld XRF, PGAI and NI ............................................................ 80
Summary................................................................................................................. 100
Összefoglalás .......................................................................................................... 102
References .............................................................................................................. 104
New scientific results ............................................................................................. 117
Tézispontok ............................................................................................................ 119
List of publications related to the theses ................................................................ 122
Additional publications related to the subject of the dissertation .......................... 123
Further publications ................................................................................................ 124
Oral presentations ................................................................................................... 126
Posters ..................................................................................................................... 127
Acknowledgements ................................................................................................ 129
Appendix ................................................................................................................ 130
3
Key to acronyms
AAS atomic absorption spectrometry
AES atomic emission spectrometry
BGO bismuth germanate scintillator
BNC Budapest Neutron Center
BRR Budapest Research Reactor
CAD Computer-Aided Design
CCD charge-coupled device
CMOS complementary metal-oxide semiconductor
CN Compton Normalization
CWO catalytic wet oxidation
EDS, EDX Energy-dispersive X-ray spectroscopy
EDXRF Energy-dispersive X-ray spectroscopy
ERM European Reference Material
FP Fundamental Parameters
FRM II Forschungs-Neutronenquelle Heinz Maier-Leibnitz
FWHM Full-Widh at Half Maximum
HH XRF handheld XRF
HPGe high-purity germanium
HR-ICP-MS high-resolution sector-field inductively coupled plasma mass spectrometry
IAEA Internatial Atomic Energy Agency
ICP-MS inductively coupled plasma mass spectrometry
ICP-OES inductively coupled plasma – atomic emission spectroscopy
INAA Instrumental Neutron Activation Analysis
IRMM Institute for Reference Materials and Measurements
LA-ICP-MS laser-ablation ICP-MS
LEGe low-energy germanium
LIBS laser-induced breakdown spectroscopy
MC-ICP-MS multicollector inductively coupled plasma mass spectrometry
MCNP Monte Carlo N-Particle Transport Code
MTA EK Centre for Energy Research, Hungarian Academy of Sciences
NI neutron imaging
NIPS-NORMA
Neutron-Induced Prompt Gamma-ray Spectroscopy –
Neutron Optics and Radiography for Material Analysis
NIST National Institute of Standards and Technology
NR neutron radiography
4
NT neutron tomography
PGAA
Prompt Gamma Activation Analysis method,
Prompt Gamma Activation Analysis facility at MTA EK
PGAI-NT
Promt Gamma Activation Imaging (neutron-imaging-driven PGAA) –
Neutron Tomography
PIXE particle-induced X-ray emission
PTFE poly-tetrafluor-ethylene
pXRF, SXRF portable XRF, synchrothron XRF
QQQ-ICP-MS triple quadrupole inductively coupled plasma mass spectrometry
RAD Static/dynamic thermal-neutron and X-ray imaging station
REE Rare Earth Elements
SDD Silicon Drift Detector
SEM scanning electron microscopy
TEM transmission electron microscopy
TIMS thermal ionization mass spectrometry
TOF-ND time-of-flight neutron diffraction
TUM Technische Universität München
WDXRF wavelength dispersive XRF
XPS X-ray Photoelectron Spectroscopy
XRF X-ray Fluorescence Spectrometry
5
Symbols
µ linear absorption coefficient
A peak area
c velocity of light
C counting factor
D decay factor
d1/2 half-thickness
E energy
E0, E1, E2, EK... electron binding energies on different shells and subshells
Eγ photon energy
I, Itr transmitted intensity
I0 initial intensity of photons
Idb dark beam image (beam is closed)
Iob open beam image
Ki, Kα, Kβ indexes of the electron transitions
m mass
M standard atomic weight
m0 rest mass of an electron
n number of atoms
NAv Avogadro constant
NK number of created vacancies
Np collected counts
NV number of atoms present in unit volume
Pγ γ-ray emission probability
S saturation factor
Sn binding energy
t tive time of the measurement
t1/2 half-life
td decay time (cooling time)
tirr irradiation time
tm length of the measurement
x, d thickness
ε full-energy peak efficiency
θ natural abundance of an isotope
λ decay constant
ν, ν0 velocity, relative velocity of thermal neutrons
ρ density
6
σ, σtot, σabs,
σscat, σpe, σincoh,
σpair, σcoh, σtrip,
σph.n.
total cross section, absorption-, scattering,
photoelectric-, incoherent-, pair production-,
coherent-, photonuclear- cross sections
σ0 thermal neutron capture cross section
σγ partial gamma production cross section
φ angle
ϕ thermal equivalent neutron flux
ωK, ωK fluorescence yields
7
1 Introduction
The chemical analysis of metals has a long history. In the 17th-18th century, the main goal
was the determination of the major and minor constituents in alloys, especially in jewelry and in
valuable objects. Titration and gravimetry were used from the first half of the 19th century to
determine the concentrations of elements of interest in solutions. Even today, these are regarded
as highly accurate analytical methods.
The instrumental revolution of analytical chemistry started with the application of flame-
emission spectrometry in the second half of the 19th century. Nowadays, a broad portfolio of
destructive and non-destructive methods are available to determine the elemental composition.
The analyst can choose between portable devices e.g. handheld X-ray fluorescence spectrometer
(HH XRF), laser-induced breakdown spectrometer (LIBS), etc., desktop instruments in
laboratories and nuclear research reactor- or synchrotron-based large-scale facilities.
In many fields of science, the focus lies on the analysis of the surface (e.g. catalysts,
protective coating layers of modern alloys). There is also a sustained interest in bulk analysis, e.g.
monitoring of the precious-metal content, of absorbed chemical elements in catalysts in situ [1],
[2], of catalytic reaction products in different phases ex situ [3], and in base alloy composition of
valuable archaeological objects [4], [5]. In the latter case, especially in the case of bronze objects,
the surface patina may hinder the determination of the representative components when analyzing
with X-rays, due to their small penetration depth. On the other hand, the composition of the
corroded outer layer can already identify certain fake objects [6].
The idea of using the minor and trace elements in ancient copper artefacts for provenance
analysis emerged already in the 19th century, based on the similarity of compositional profiles
between the objects and the suspected raw material [7], [8]. Direct element fingerprinting became
inapplicable as soon as the recycling of previously cast artefacts appeared and spread [9], so it can
mainly be applied to copper objects from the Chalcolithic Period [10]. For objects from the Bronze
Age, it can be used with restrictions taking into account the copper-ore origin and the effect of the
smelting process. Nowadays, thermal ionization mass spectrometry (TIMS) and multicollector
inductively coupled plasma mass spectrometry (MC-ICP-MS) are typically used for the precise
determination of the stable isotopes of copper and tin in bronze objects originating from the Early
to the Late Bronze Age. Despite the merits and the precision of these techniques, the analysis
8
requires the dissolution of 0.2-3 g fraction from the object [11], [12], which means a destructive
analysis.
Despite the accumulated knowledge over the centuries and the development of the
analytical techniques, the non-destructive characterization of bulky, heterogeneous metal samples
is still not completely solved. My major task was to help further solve this problem with the
combination of different instrumental analytical techniques available at MTA EK.
9
2 Aims of research
The major scope of my thesis work has been the quantitative analysis of metal components
in different solid matrices, such as catalysts, contemporary alloys from material science, and
valuable archaeological metallic finds (e.g. artefacts made of bronze or precious metals) in an
effective, but completely non-destructive way. I worked out and applied complex characterization
procedures, including multiple element analytical, and even imaging techniques.
Prompt gamma actication analysis (PGAA) was my primary method of choice. Thanks to
a systematic development and application programme in the past, it has gradually evolved into an
easy-to-use tool in the non-destructive bulk analysis of alloys and metal-containing samples.
Although PGAA is usually considered as a matrix-independent analytical technique, where the
analysis can be performed even without matrix-matched standards, the detection limits of the
elements depend not only on their elemental sensitivities, but also strongly on the matrix
composition. If the matrix components have large neutron capture cross sections, the method can
only quantify major and minor components [13] and important minor or trace elements can remain
undetectable. In the following paragraphs, some problems of the everyday PGAA practice are
exposed via case studies.
A modern alloy, a Co-Re-Cr superalloy used for manufacturing durable and heat-resistant
gas turbines [14] contains Co to improve its heat and wear resistance. While irradiating the sample
with neutrons, a long-lived radioactive cobalt isotope is produced: from 59Co – the only stable Co
isotope – 60mCo (T1/2 = 10.5 minutes) and 60Co (T1/2 = 5.27 years) are produced. The latter has a
long half-life and its high production yield may hinder the subsequent work with the irradiated
specimen outside the laboratory, if activated beyond the legal clearance level [15] (487/2015. (XII.
30.) Korm. Rendelet). In this case, the sample must be stored until it can be cleared for general
use. These factors make it difficult to achieve sufficiently good statistical precision for other major
components with lower cross sections.
Most noble metals have useful catalytic properties. These catalysts are made of highly-
dispersed nano-scale noble metal particles or their oxides, which are dispersed on the surface of
an inert support material (e.g. carbon, silica, alumina, titanium) [16]. In neutron activation, gold,
silver and iridium produce long-lived β- emitting radioactive nuclides, i.e. 198Au (T1/2 = 2.70 days),
110mAg (T1/2 = 110 days) and 192Ir (T1/2 = 73.8 days), which delay the clearing process and also
cause problems in the analysis of other components.
10
Tin and lead are very important alloying components of bronze objects ever since the
Bronze Age. Their quantities in the surface bronze patina or altered layer is different than in the
bulk, so for a reliable analysis, the application of a bulk method (such as PGAA) is important. As
copper has a significantly higher neutron capture cross section, and consequently a high specific
count rate in the spectrum, signals from tin and lead are difficult to quantify with PGAA even at
percentage levels. The measurement time needs to be long to acquire statistically significant
number of counts in the low-intensity peaks of Pb and Sn. This reduces the throughput, i.e. the
number of samples per unit beam time. Many statistical analyses used in provenance studies or
classification require a large number of studied objects, so there is always a tradeoff between the
number of measured samples and the quality of the analytical results. Thus there is a pressure
towards producing better-quality results in a given amount of time.
Ancient silver and gold objects are precious finds, for which destructive sampling for
chemical analysis is rarely allowed. These alloys can be analyzed with X-ray based methods, but
the results might be biased by possible surface enrichment [17] or gilding. The presence of a thin
altered layer or an artificial coating can be easily identified by cross-checking the PGAA and XRF
results. Just like the catalysts and modern alloys mentioned earlier, these objects contain
elements/nuclides with a high possible activation risk, so minimization of the neutron fluence is
crucial.
Modern alloys, catalysts and archaeological finds might contain elements with strong
prompt gamma lines at low energies (e.g. Au, Ag, Cu, Co, Re, Ir); their PGAA spectra are highly
complicated due to the presence of tens or hundreds of analytical peaks. The interferences of these
are difficult to resolve using the standard high-purity germanium (HPGe) detectors, thus, the use
of these analytical lines in the evaluation procedure has so far been limited.
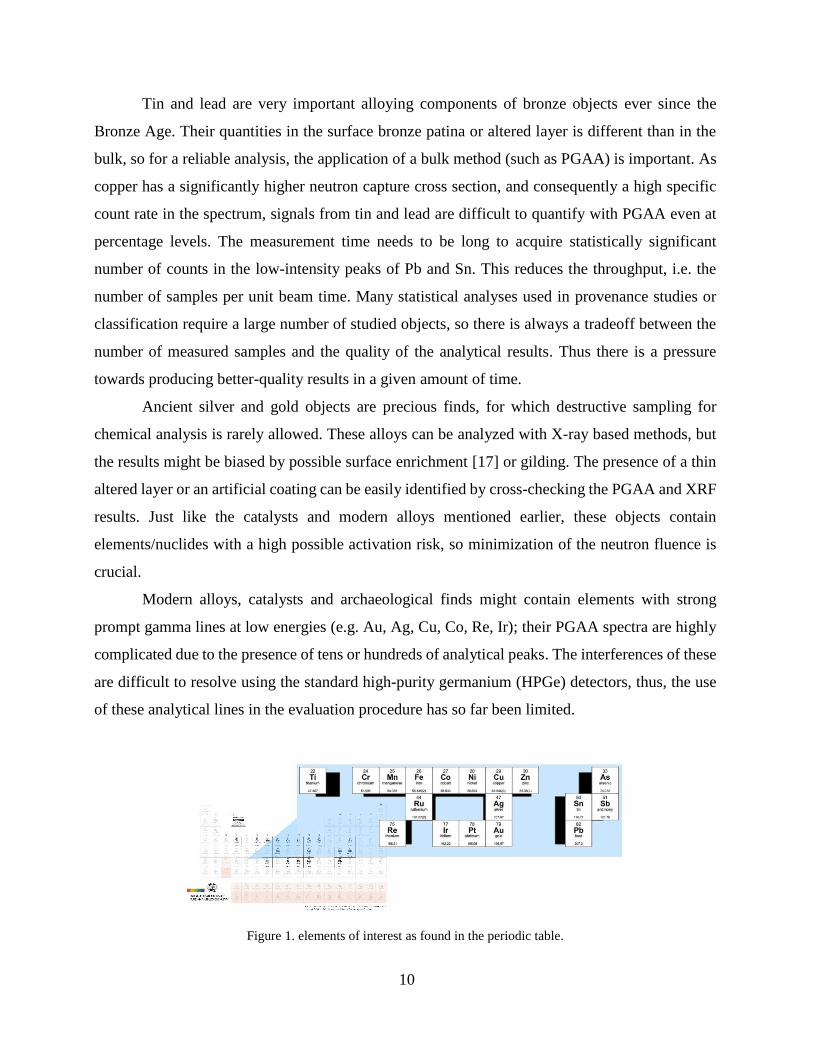
Figure 1. elements of interest as found in the periodic table.
11
Figure 2 presents the subset of elements that are most affected by the above-listed problems
and at the same time have practical relevance in the routine element analysis with PGAA. The
main objectives of the present work were to improve the PGAA methodology: (1) in order to make
the technique more neutron-effective, i.e. to attain the needed information in a shorter beam time
and hence lower the activation risk, (2) to make the spectrum evaluation more productive, and (3)
to improve analytical performance, such as selectivity, sensitivity, signal-to-background ratio,
trueness and confidence in peak identification for the complicated spectra of the highlighted
elements, and finally (4) to apply these procedures on real samples.
For the analysis of complex, sometimes heterogeneous samples, I benefited from the
combination of PGAA with other techniques, such as XRF or imaging. In this way one can broaden
the scope of applicability, can make the analysis more productive and answer questions that the
PGAA technique alone cannot answer.
XRF is a suitable complement to PGAA, not just in the determination of trace components
that fall below the detection limits of PGAA or when correlated surface and bulk composition are
required, but also it was found to be practical in the identification of the few samples out of a larger
pool that are worth measuring with the more expensive and sophisticated neutron-based
techniques.
When using imaging methods, the macroscopic structural inhomogeneity of the sample can
be visualized non-invasively and the local variations in composition can be interpreted with higher
confidence.
12
3 Overview of literature
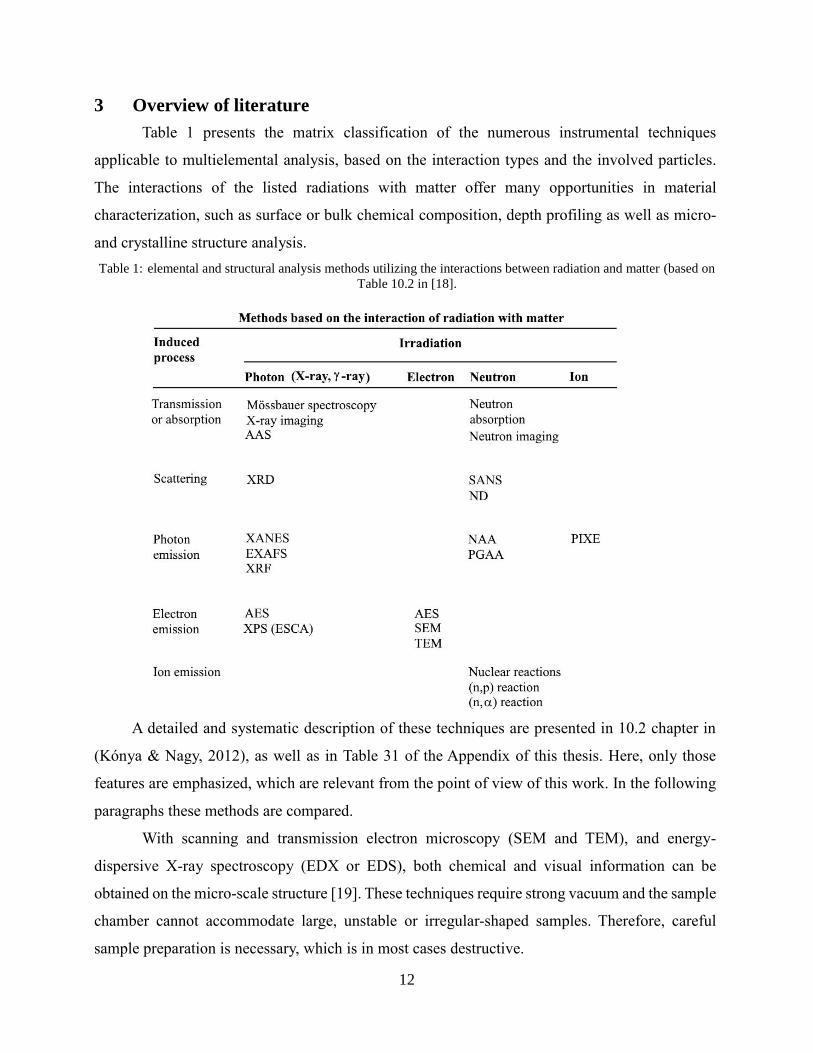
Table 1 presents the matrix classification of the numerous instrumental techniques
applicable to multielemental analysis, based on the interaction types and the involved particles.
The interactions of the listed radiations with matter offer many opportunities in material
characterization, such as surface or bulk chemical composition, depth profiling as well as micro-
and crystalline structure analysis.
Table 1: elemental and structural analysis methods utilizing the interactions between radiation and matter (based on
Table 10.2 in [18].
A detailed and systematic description of these techniques are presented in 10.2 chapter in
(Kónya & Nagy, 2012), as well as in Table 31 of the Appendix of this thesis. Here, only those
features are emphasized, which are relevant from the point of view of this work. In the following
paragraphs these methods are compared.
With scanning and transmission electron microscopy (SEM and TEM), and energy-
dispersive X-ray spectroscopy (EDX or EDS), both chemical and visual information can be
obtained on the micro-scale structure [19]. These techniques require strong vacuum and the sample
chamber cannot accommodate large, unstable or irregular-shaped samples. Therefore, careful
sample preparation is necessary, which is in most cases destructive.
13
Atomic Absorption Spectroscopy (AAS), Atomic Emission Spectroscopy (AES), or
inductively coupled plasma Optical Emission Spectroscopy (ICP-OES) can be well automated in
the analysis of liquid samples, however a solid material has to be first brought into a solution that
often requires time-consuming and manpower-intensive sample preparation, too. Their detection
limits are low, but not all the elements can be analyzed simultanaeously [20]–[23].
Inductively coupled plasma mass spectrometry (ICP-MS) separates ions produced in the
plasma, based on their mass-to-charge ratios. Isotopes of the elements can be analyzed
simultanaeously with a high precision in this way. The quadrupole MS, common in the routine
analytical instrumentation, suffers from isobaric interferences when analyzing neighbouring
elements. High-resolution sector-field inductively coupled plasma mass spectrometers (HR-ICP-
MS) or the more recently developed triple quadrupole QQQ-ICP-MS, are capable of resolving the
isobaric interferences, but they are of limited availability [24]. This new methodology requires
about three-five times longer measurements and it is still very expensive.
X-ray-detection based methods, such as particle induced X-ray emission (PIXE) and X-ray
Fluorescence (XRF) spectrometry are widespread techniques in metal analysis. In case of XRF,
the sensitivity increases with the atomic number, as the sample is irradiated with high-energy
photons, while PIXE uses charged particles (e.g. protons) and is more sensitive for lighter
elements. Synchrontron-based sources can provide unmatched brilliance and therefore very good
sensitivities. All X-ray based techniques are sensitive to matrix effects. As matrix-mached
calibration is usually required, the lack of adequate reference material can be a burden in the
analysis of uncommon materials.
Laser-induced breakdown spectroscopy (LIBS) and laser-ablation ICP-MS (LA-ICP-MS)
are considered as micro-destructive methods, since the laser beam creates a small, but visible
damage on the surface. The evaporated sample weight depends on the duration and the intensity
of the laser impulse. As the exact ablated sample mass is not known, quantification is often not
reliable, thus these techniques can be used as relative methods, but with the capability of depth-
profiling.
Instrumental neutron activation analysis (INAA) belongs to the group of nuclear analytical
techniques. The sample is irradiated with neutrons in the core of a nuclear reactor, and the
produced radioactive nuclides are measured separately in space and time after the irradiation. As
almost all the elements of our interest can be activated, this technique is highly advantageous in
14
the trace element analysis. Compared to ICP-MS, the sample preparation is simpler, because it
avoids digestion, thus blank-effect and contamination are completely absent [25]. The precise
weighing of the samples is important before they are filled into the irradiation capsules.
Prompt Gamma Activation Analysis (PGAA), yet another nuclear analytical technique, is
used for the non-destructive chemical analysis of the objects. The sample is irradiated with a
neutron beam, and the emerging gamma photons are detected [26] simultanaeously. Both neutrons
and gamma photons are of high penetration power, thus PGAA provides information on the bulk
composition. This makes the analysis of corroded metals [27], [28] and glasses [29] possible,
where the original composition cannot be determined with surface-probing techniques, such as the
most commonly used X-ray based methods [5].
It can be seen that no single technique is applicable to solve all analytical challenges, so
the analyst has to choose considering the requirements of a particular application field. Non-
destructivity, for example, is not so important in environmental science, while it is essential in
heritage science (e.g. for valuable and unique archaeological finds) [30], and for expensive
material-science samples where destructive material testing is either not allowed or not practical.
Permission to sampling may be granted only after promising results from a non-destructive pre-
screening. In particular cases of cultural-heritage objects, only non-destructive methods are
accepted. Whenever samples are difficult to dissolve, the simplicity or the absence of any sample
preparation makes the non-destructive methods preferable.
In other cases, the non-destructivity is dictated by the need to carry out further experiments
on the identical object, e.g. lifecycle analysis of catalysts at different stages of the catalytic
reaction, or when multiple neutron-based [31]–[34] or X-ray based techniques [35] are involved
in sequence for a comprehensive characterization of an object, potentially leading to significant
conclusions about its method of manufacturing, provenance or authenticity.
In the present work, metal samples were analyzed where non-destructivity was important.
The need to measure the bulk composition of metals and alloys have increased in the recent years
in our national and international cooperations. Since the major technique at our laboratory is
PGAA, our investigations were based on it and other supplementary techniques available by us
and on campus were also involved. Experimental stations (PGAA, NIPS-NORMA, NAA, RAD)
at the Budapest Neutron Centre (BNC, a consortium of MTA EK and MTA Wigner FK to co-
ordinate research activities at the Budapest Research Reactor) and a handheld XRF device were

15
accessible for my research program. This infrastructure is operated by the Nuclear Analysis and
Radiography Department of the Centre for Energy Research, Hungarian Academy of Sciences
(MTA EK). I carried out additional PGAA and in-beam activation measurements at the FRM II
neutron source in Garching, Germany, in the frame of beam-time proposals.
16
3.1 Fundamentals of the applied methods
3.1.1 Interactions of neutrons with matter
Neutron is a chargeless particle with the mass of 1.67492716×10⁻²⁷ kg, 1.00866491560(55)
atomic mass unit (amu), and its mass is equivalent to 939.565360(81) MeV, where
1 eV=1.602176462(63)×10–19 J [36]. Neutrons bound in the atomic nucleus are stable. The
neutrons used for chemical and structural analysis at large-scale research facilities are usually
produced via fission or spallation reactions. These free neutrons are unstable, they decay into a
proton, a particle (electron) and an anti-neutrino with a half-life of 10.2 minutes [37], [38]. The
kinetic properties of the neutrons can be characterized with their velocities, kinetic energies or
wavelengths [39].
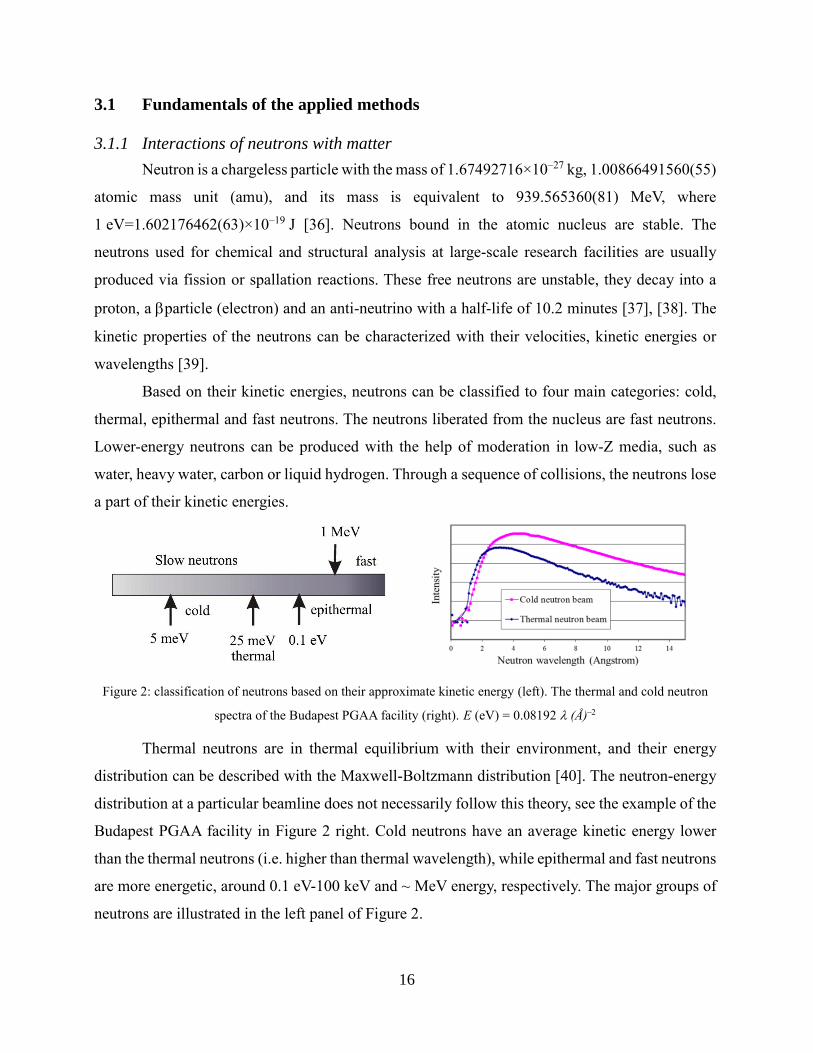
Based on their kinetic energies, neutrons can be classified to four main categories: cold,
thermal, epithermal and fast neutrons. The neutrons liberated from the nucleus are fast neutrons.
Lower-energy neutrons can be produced with the help of moderation in low-Z media, such as
water, heavy water, carbon or liquid hydrogen. Through a sequence of collisions, the neutrons lose
a part of their kinetic energies.
Figure 2: classification of neutrons based on their approximate kinetic energy (left). The thermal and cold neutron
spectra of the Budapest PGAA facility (right). E (eV) = 0.08192 (Å)–
Thermal neutrons are in thermal equilibrium with their environment, and their energy
distribution can be described with the Maxwell-Boltzmann distribution [40]. The neutron-energy
distribution at a particular beamline does not necessarily follow this theory, see the example of the
Budapest PGAA facility in Figure 2 right. Cold neutrons have an average kinetic energy lower
than the thermal neutrons (i.e. higher than thermal wavelength), while epithermal and fast neutrons
are more energetic, around 0.1 eV-100 keV and ~ MeV energy, respectively. The major groups of
neutrons are illustrated in the left panel of Figure 2.
17
The penetration depth of neutrons into the material is usually high, up to mm-s or cm-s,
when compared to that of the charged particles, such as protons or alphas, as neutrons are
chargeless, and they are not repelled by the Coulomb-field of the nuclei [41].
The neutrons interact with the atomic nuclei in the material via nuclear reactions. The microscopic
cross section (σ) describes the probability of the interaction between the nuclide of interest and the
incoming particle. Its accepted non-SI unit is 1 barn equivalent to 10-28 m2 or 10-24 cm2. The cross-
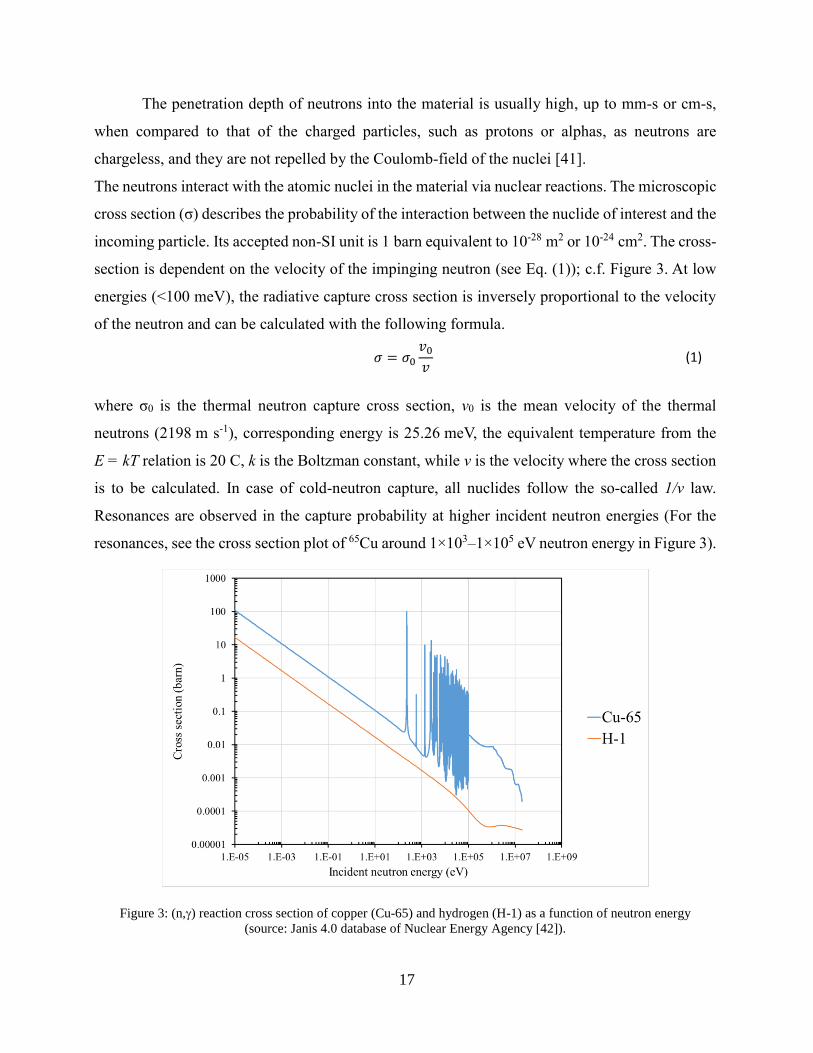
section is dependent on the velocity of the impinging neutron (see Eq. (1)); c.f. Figure 3. At low
energies (<100 meV), the radiative capture cross section is inversely proportional to the velocity
of the neutron and can be calculated with the following formula.
𝜎 = 𝜎0𝑣0𝑣
(1)
where σ0 is the thermal neutron capture cross section, v0 is the mean velocity of the thermal
neutrons (2198 m s-1), corresponding energy is 25.26 meV, the equivalent temperature from the
E = kT relation is 20 C, k is the Boltzman constant, while v is the velocity where the cross section
is to be calculated. In case of cold-neutron capture, all nuclides follow the so-called 1/v law.
Resonances are observed in the capture probability at higher incident neutron energies (For the
resonances, see the cross section plot of 65Cu around 1×10³–1×10⁵ eV neutron energy in Figure 3).
Figure 3: (n,) reaction cross section of copper (Cu-65) and hydrogen (H-1) as a function of neutron energy
(source: Janis 4.0 database of Nuclear Energy Agency [42]).
18
Neutron absorption results in a so-called compound nucleus. This de-excitates mostly with
the emission of one or more gamma rays. For certain light nuclides, other reaction channels
involving proton or alfa particle emission, become competetive with the gamma-ray emission: 15N
or 14N(n,p)14C, 10B(n,)6Li and 7Li(n,)3H. For 235U, thermal-neutron induced fission has also to
be considered (235U(n,f)). An important other interaction of neutron with matter is the elastic and/or
inelastic scattering on the nucleus, that are the basis of neutron spectroscopy techniques.
The two main interaction of the impigning neutron and the target nucleus is the scattering
and the absorption, so the total cross section σtot can be defined as the sum of this two cross sections
(σscat and σabs, not considering neutron-induced fission) (Eq (2)).
𝜎𝑡𝑜𝑡 = 𝜎𝑠𝑐𝑎𝑡 + 𝜎𝑎𝑏𝑠 (2)
3.1.2 Interactions of photons with matter
X-rays and gamma rays are energetic electromagnetic radiation. These types of ionizing
radiation are composed of photons, particles with no charge and rest mass [41]. The main
difference between X-rays and gamma radiation is their origin: gamma photons are originated
from the atomic nucleus, while X-rays emerge from the electronic shell of the atom. Based on their
energies, there is no sharp limit between X-rays and gamma rays.
The wavelength of the X-rays is typically between 10-11–10-8 m (0.01 and 10 nm), while
gamma photons are in the range of 10-15–10-11 m (1 fm and 10 nm). The photon energy can be
calculated from its wavelength λ using the following, well-known formula (Eq. (3)).
𝐸 =ℎ × 𝑐
𝜆 (3)
where E is the photon energy, h is the Plank constant (4.14×10⁻¹⁵ eV/s), c is the speed of light
(3×10⁸ m/s). The ratio of c / λ is the frequency (1/s, Hz). From this equation, the X-ray and
gamma ray photon energies are typically between 0.1–100 keV, and over 100 keV, respectively.
X-rays below 10 keV energy are called soft X-rays, above 10 keV, hard X-rays, while gamma rays
around 100 keV are considered as low-energy gamma-rays.
X- and gamma rays interact with matter through similar mechanisms. The most important
interaction of these photons are the photoelectric effect, the coherent, Compton scattering [43] and
for MeV gamma rays, the pair production. The physics of these processes is extensively discussed
in Refs. [41] and [44].
19
3.1.3 Macroscopic description of the interactions
The linear attenuation coefficient (µ, 1/cm) for photons and neutrons can be calculated, if the total
cross section (σtot, cm2) is multiplied by the number of atoms present in the unit volume (NV, 1/cm3).
See the simplified form in Equation (4).
µ = 𝑁𝑉𝜎𝑡𝑜𝑡 (4)
The penetration of X rays and gamma rays and the change in the photon intensities or fluxes
through a material with thickness x can be calculated using the Beer-Lambert law (Eq. 5). This
formula is valid for a narrow beam of monoenergetic particles travelling through a slab with the
thickness of x. µ is the linear attenuation coefficient, I0 is the initial intensity of photons, I is the
transmitted intensity.
𝐼
𝐼0= exp(−µ𝑥) (5)
Linear attenuation coefficient (µ) is dependent on the density of the sample, so the use of the mass
attenuation coefficient is more practical (𝜇𝑚 =𝜇
𝜌). In the formula ρ is the sample density (g/cm3),
μ is the linear attenuation coefficient (1/cm). Consequently, the unit of the mass attenuation
coefficient is cm2/g. In most databases, attenuation data are given as mass attenuation coefficients
(μm).
In practice, I0, I and x are measurable quantities, from which μ can be obtained using the Equation
(6), after rearranging Equation (5).
𝜇 =𝑙𝑛 (
𝐼0𝐼 )
𝑥
(6)
Specific mass attenuation coefficients for 150, and 500 keV gamma photons and for thermal
neutrons are depicted in different chemical elements Figure 4.
If the material under study is a mixture, or a chemical compound, the mass attenuation
coefficient (μmtot) of the mixture equals to those of the elements weighted by the concentrations
(Cj) and the mass attenuation coefficients (µmj) of the components (rule of mixtures).
The neutron beam attenuation for voluminous samples is much more complicated than the
attenuation of gamma rays. Before a radiative capture process, the neutron may undergo several
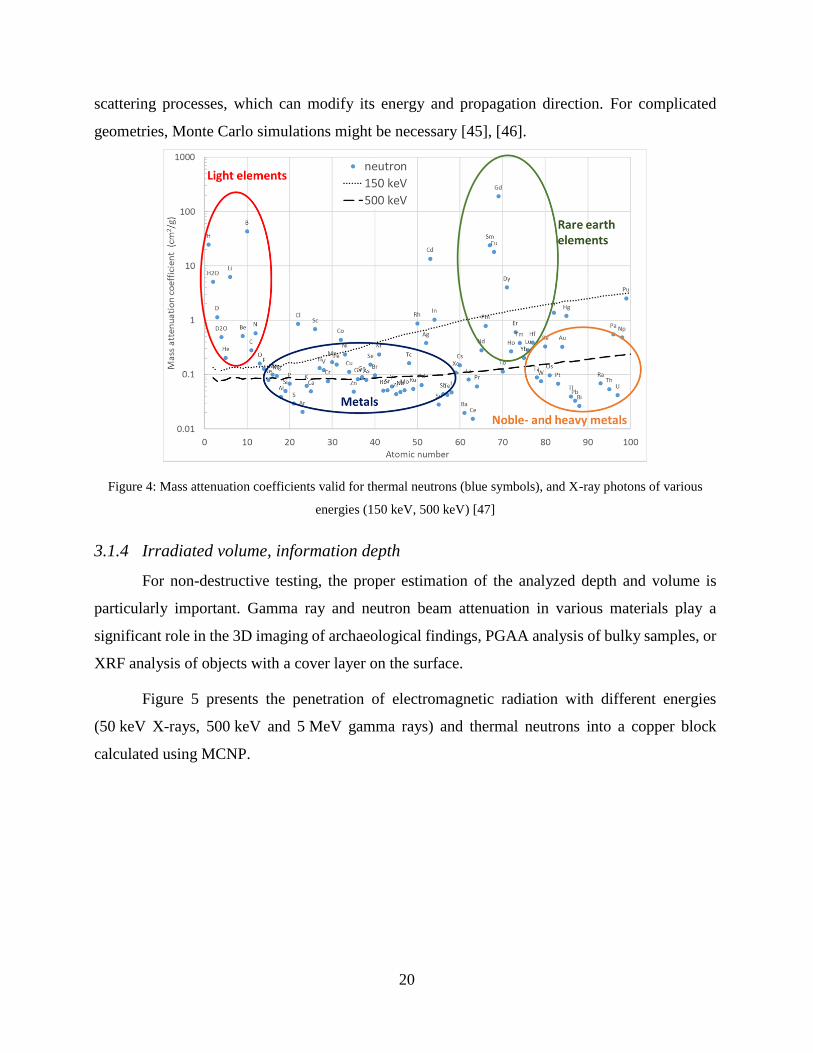
20
scattering processes, which can modify its energy and propagation direction. For complicated
geometries, Monte Carlo simulations might be necessary [45], [46].
Figure 4: Mass attenuation coefficients valid for thermal neutrons (blue symbols), and X-ray photons of various
energies (150 keV, 500 keV) [47]
3.1.4 Irradiated volume, information depth
For non-destructive testing, the proper estimation of the analyzed depth and volume is
particularly important. Gamma ray and neutron beam attenuation in various materials play a
significant role in the 3D imaging of archaeological findings, PGAA analysis of bulky samples, or
XRF analysis of objects with a cover layer on the surface.
Figure 5 presents the penetration of electromagnetic radiation with different energies
(50 keV X-rays, 500 keV and 5 MeV gamma rays) and thermal neutrons into a copper block
calculated using MCNP.
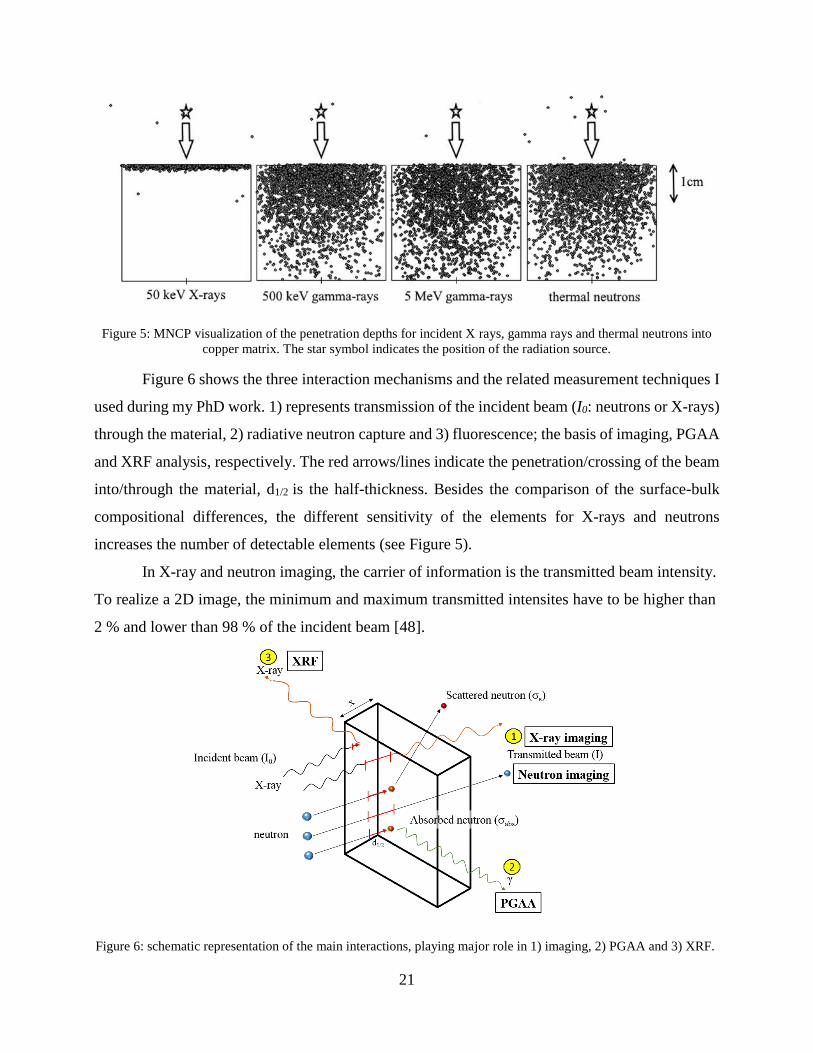
21
Figure 5: MNCP visualization of the penetration depths for incident X rays, gamma rays and thermal neutrons into
copper matrix. The star symbol indicates the position of the radiation source.
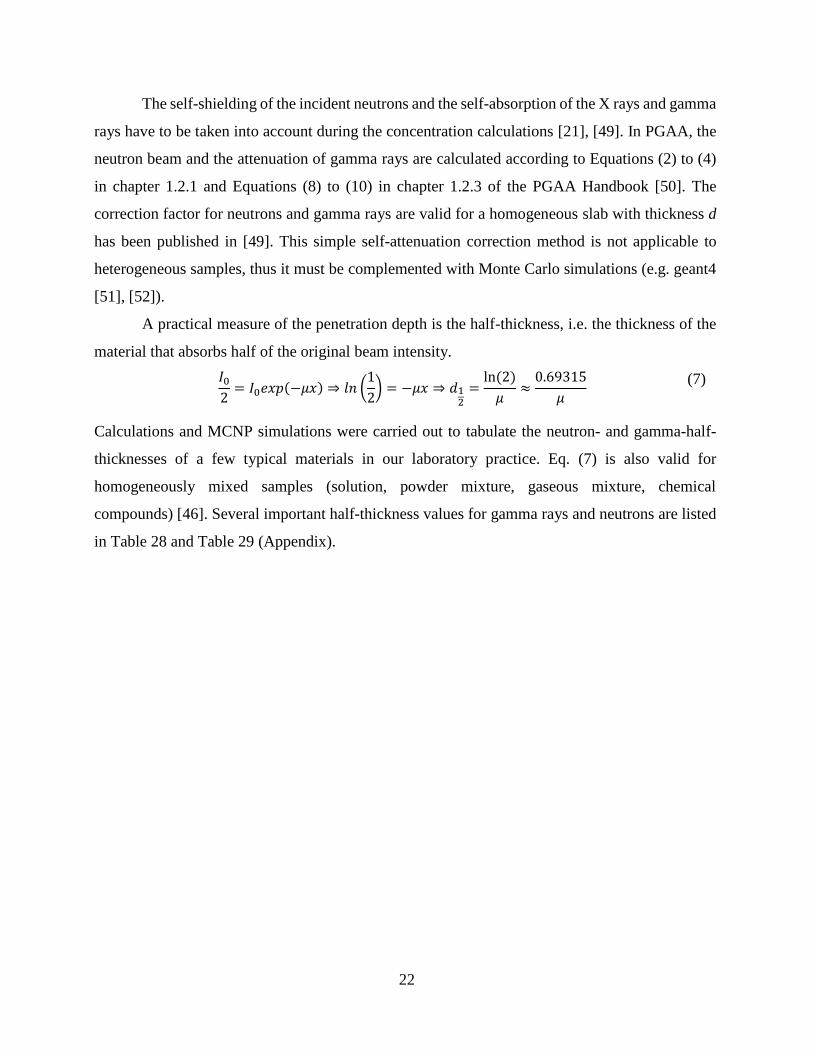
Figure 6 shows the three interaction mechanisms and the related measurement techniques I
used during my PhD work. 1) represents transmission of the incident beam (I0: neutrons or X-rays)
through the material, 2) radiative neutron capture and 3) fluorescence; the basis of imaging, PGAA
and XRF analysis, respectively. The red arrows/lines indicate the penetration/crossing of the beam
into/through the material, d1/2 is the half-thickness. Besides the comparison of the surface-bulk
compositional differences, the different sensitivity of the elements for X-rays and neutrons
increases the number of detectable elements (see Figure 5).
In X-ray and neutron imaging, the carrier of information is the transmitted beam intensity.
To realize a 2D image, the minimum and maximum transmitted intensites have to be higher than
2 % and lower than 98 % of the incident beam [48].
Figure 6: schematic representation of the main interactions, playing major role in 1) imaging, 2) PGAA and 3) XRF.
22
The self-shielding of the incident neutrons and the self-absorption of the X rays and gamma
rays have to be taken into account during the concentration calculations [21], [49]. In PGAA, the
neutron beam and the attenuation of gamma rays are calculated according to Equations (2) to (4)
in chapter 1.2.1 and Equations (8) to (10) in chapter 1.2.3 of the PGAA Handbook [50]. The
correction factor for neutrons and gamma rays are valid for a homogeneous slab with thickness d
has been published in [49]. This simple self-attenuation correction method is not applicable to
heterogeneous samples, thus it must be complemented with Monte Carlo simulations (e.g. geant4
[51], [52]).
A practical measure of the penetration depth is the half-thickness, i.e. the thickness of the
material that absorbs half of the original beam intensity.
𝐼02= 𝐼0𝑒𝑥𝑝(−𝜇𝑥) ⇒ 𝑙𝑛 (
1
2) = −𝜇𝑥 ⇒ 𝑑1
2=ln(2)
𝜇≈0.69315
𝜇
(7)
Calculations and MCNP simulations were carried out to tabulate the neutron- and gamma-half-
thicknesses of a few typical materials in our laboratory practice. Eq. (7) is also valid for
homogeneously mixed samples (solution, powder mixture, gaseous mixture, chemical
compounds) [46]. Several important half-thickness values for gamma rays and neutrons are listed
in Table 28 and Table 29 (Appendix).
23
3.2 Prompt gamma activation analysis
Prompt gamma activation analysis (PGAA) is a non-destructive nuclear analytical
technique to determine the bulk chemical composition. One of its main advantages is that the
amounts of all detectable elements (major, minor and some trace elements) can be obtained at
once, even without any prior information on the sample, i.e. panoramic analysis can be performed.
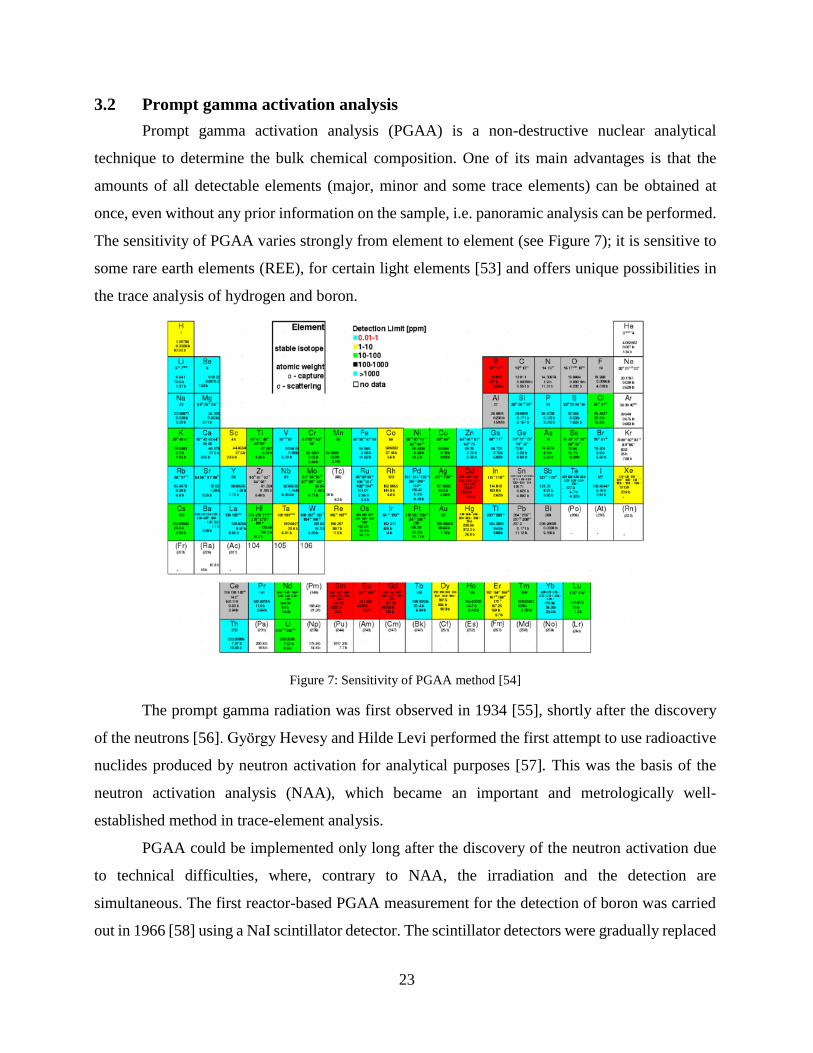
The sensitivity of PGAA varies strongly from element to element (see Figure 7); it is sensitive to
some rare earth elements (REE), for certain light elements [53] and offers unique possibilities in
the trace analysis of hydrogen and boron.
Figure 7: Sensitivity of PGAA method [54]
The prompt gamma radiation was first observed in 1934 [55], shortly after the discovery
of the neutrons [56]. György Hevesy and Hilde Levi performed the first attempt to use radioactive
nuclides produced by neutron activation for analytical purposes [57]. This was the basis of the
neutron activation analysis (NAA), which became an important and metrologically well-
established method in trace-element analysis.
PGAA could be implemented only long after the discovery of the neutron activation due
to technical difficulties, where, contrary to NAA, the irradiation and the detection are
simultaneous. The first reactor-based PGAA measurement for the detection of boron was carried
out in 1966 [58] using a NaI scintillator detector. The scintillator detectors were gradually replaced
24
the from the end of the 1960’s with semi-conductor detectors combined with Compton suppression
systems, in order to reduce the spectral background [59]. The first PGAA measurements on iron
ore, stainless steel and gold-alloy samples were carried out already in the 1970s [60], [61]. The
real boost in the development of PGAA technique was the appearance of the neutron guides [62].
This delivered much higher neutron flux at the instrument, while keeping the general gamma-ray
and neutron background low, thereby the signal-to-background ratio became orders of magnitude
better. The neutron flux could be further increased using cold neutron sources [63]. Nowadays,
sophisticated focusing neutron guides allow to reach neutron fluxes up to 1010 cm-2s-1.
The widespread application of the technique would not have been possible without a
comprehensive spectroscopic data library for all the naturally occurring elements [64]. The
elemental gamma-ray production cross-section measurements performed with the guided neutron
beam at the Budapest Research Reactor have been combined with nuclear physics information to
produce the Evaluated Gamma-ray Activation File (EGAF) database [65]–[67]. The present form
of the library was published in 2004 [68]. Besides this, the Handbook of Prompt Gamma
Activation Analysis [50] gives a comprehensive summary of the method development and its
applications in various fields [69], [70]. The method has already matured in the 2000’s.
Improvements can however still be made in PGAA, when focusing on special applications, e.g. to
emphasize certain spectrum regions to analyze specific elements, reducing the necessary
acquisition time, or for the better understanding of results from heterogeneous samples [71].
3.2.1 Basic phenomenon of prompt gamma activation analysis
In PGAA, the primary source of the analytical signal is the radiative neutron capture
reaction, when characteristic gamma radiation emerges from the sample while it is being irradiated
by a beam of neutrons. In this reaction, the neutron is absorbed by the nucleus and a compound
nucleus is formed in a highly excited state. The excitation energy is equal to the neutron binding
energy plus its kinetic energy. The binding energy is in the order of several MeVs and can be as
high as 12 MeV for some nuclei, whereas kinetic energy is in the order of meV, i.e. negligible for
slow neutrons. After the neutron is absorbed, the compound nucleus de-excitates most frequently
with the emission of gamma rays in a cascade until it reaches the ground state or a metastable state
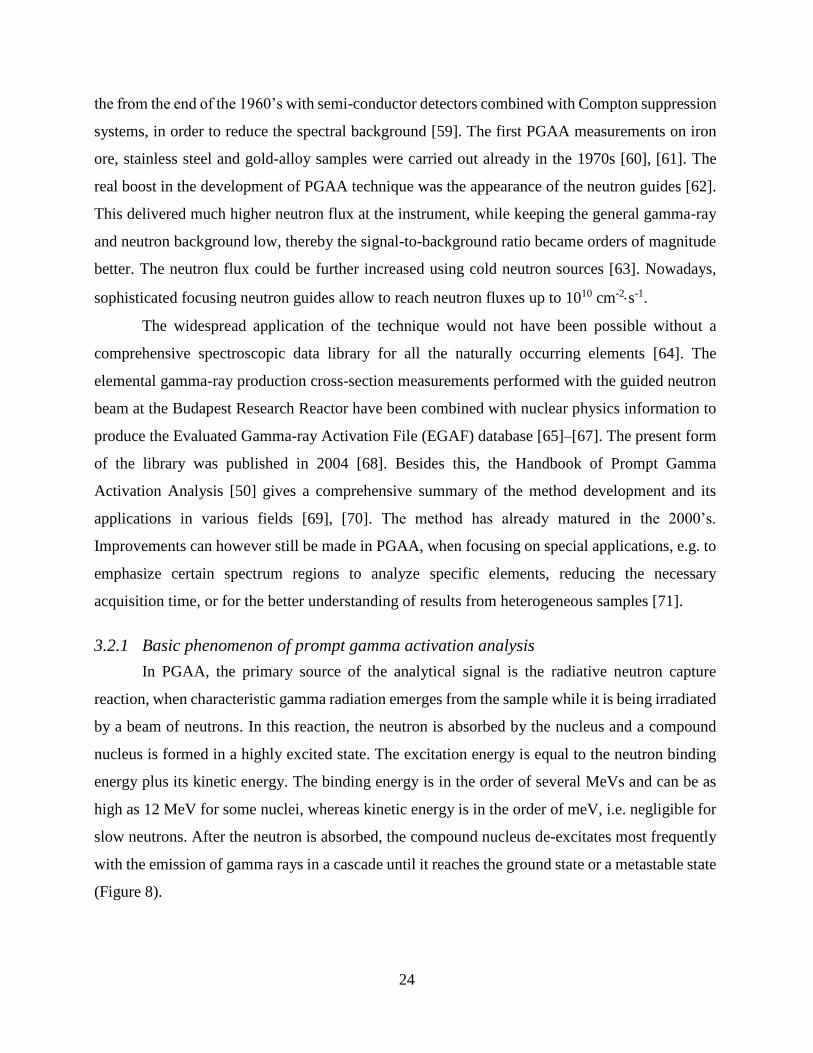
(Figure 8).
25
Figure 8: basic phenomenon of PGAA, i.e. radiative neutron capture, (n,) reaction (left). The right side of the
picture shows the energy levels and the transitions (e.g. emitted gamma photons) involved in the process.
In Figure 8 the X denotes the chemical symbol of the nuclide with mass number A and atomic
number Z, X* represents the compound nucleus with the mass number A+1 and its atomic number
remains Z. The radiative neutron capture can be written in following short form: 𝑋(𝑛, 𝛾) 𝑋∗𝑍
𝐴+1𝑍𝐴
In parentheses, the nuclear reaction is presented, here n represents the projectile (neutron)
and γ is the adjectile (gamma photon). If the formed nucleus is radioactive, with a certain half-life
T1/2, it will decay further until it reaches a stable daughter nuclide. The most frequent reaction is
the β– decay. If the decay has accompanying gamma radiation, the decay gammas will appear in
the gamma spectrum as well.
For PGAA with proper sensitivites, thermal, or cold neutrons are used. In the latter case,
the neutron capture cross section strictly follows the 1/v law (see chapter 3.1.1, Eq. (1)).
26
3.2.2 Structure of the prompt gamma spectra
The photons arising from the sample during neutron irradiation are detected by one or more
gamma-ray detectors that convert the energy of the photon into an electronic signal. This process
is based on the interactions of photons with the matter of the detector. The most suitable detector
for PGAA is the high-purity germanium (HPGe) semiconductor. As a consequence of the
complicated interaction scheme, even if the detector is exposed to a monoenergetic gamma
radiation, the resulting spectrum will have many features (see page 487–491in [40]). If there is an
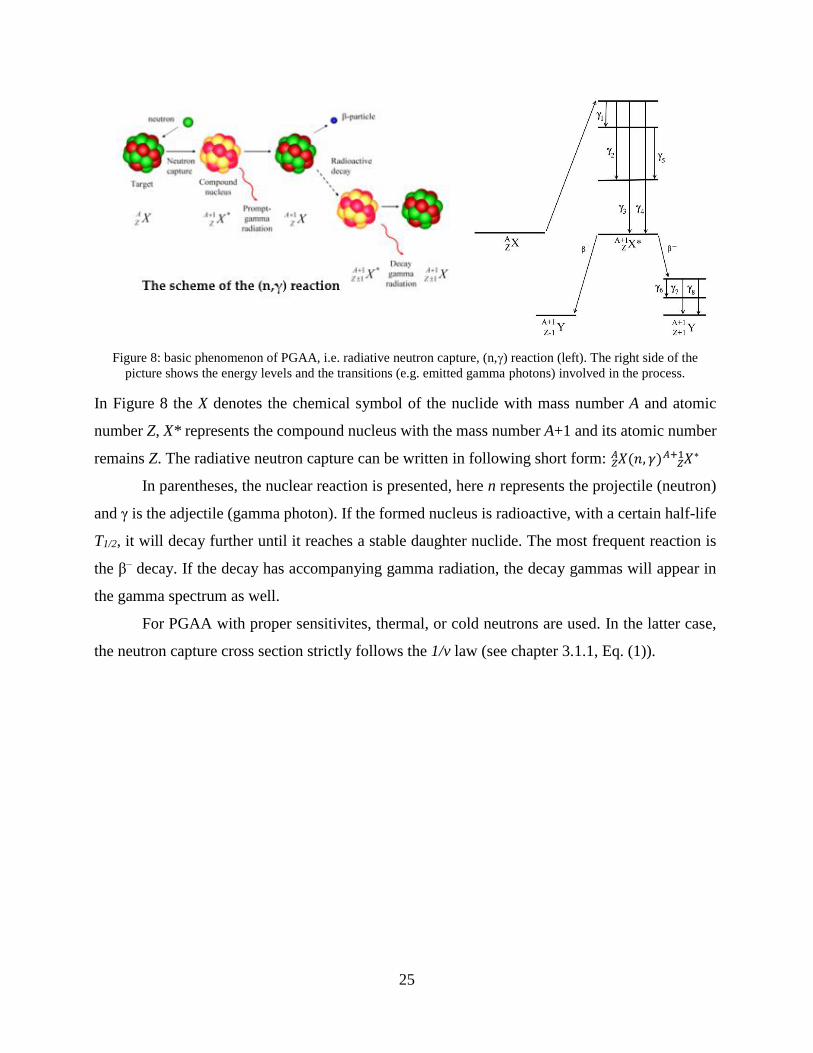
energy niveau below the capture state, the spectra will contain a few distinct peaks. Such peaks
can be seen in prompt gamma spectra of low-Z materials, that is from hydrogen, carbon, up to
nickel (see Figure 9), or when a magic nucleus is irradiated (e.g. 206Pb). In contrast, for heavy
elemens, to be exact Z > 28, the spectra are usually more complex. Besides the FEPs, the escape
peaks will also be present in the spectrum. The Compton plateaus from the peaks increase
cumulatively (see strong peaks and the step between them in the spectrum of silicon in Fig. 13).
To lower the Compton plateau, the detector can be surrounded with a Compton suppressor, in our
case a bismuth germanate scintillator (BGO) annulus [72]. With this setup, the spectral baseline
can be reduced by one order of magnitude, which improves the detectability of small peaks.
Figure 9: prompt gamma spectrum of pure silicon (upper part, a few transitions only) and copper (lower part, many
transitions) in log-log scale [26].
27
Heavier elements might have several hundreds or thousands of possible transitions (see
Figure 9), making the spectra rich in peaks [73]. The peaks at the high-energy region are well-
separated, whereas the low-energy peaks are stronger. In the middle region of the spectra, the
manyfold of peaks might form an elevated continuous background, where no analytically useful
peaks can be identified. This region, with unresolvable, low-intensity transitions is called quasi-
continuum (see Figure 9 lower panel).
Spectra of a light element (silicon) and a heavier one (copper) are depicted in Figure 9,
representing the two PGAA spectrum types [26]. Compton plateau of silicon (type 1 spectrum)
increases stepwise towards the lower energies, and seven intense peaks are visible which are
superimposed on the Compton plateaus of the higher energy gamma-lines. The Compton baseline
of copper increases almost continouosly towards the lower energies (type 2 spectrum).
To have a prior estimation about the proportion of the analytically useful peaks from the
total capture cross section, the binding energy test was carried out (see Equation (10) in [69]). That
is based on the theory that the sum of all gamma rays weighted by their emission probabilites must
be equal to the neutron binding energy in the given nucleus (first expression of Equation (10) in
Chapter 1 in Handbook of PGAA [69]), which is valid for monoisotopic elements only.
I derived a quantity characterizing the quality of the spectrum numerically. I calculated
with the most abundant and/or the highest neutron capture cross section isotopes of the given
elements (see Figure 10), using Equation (8) from the referred chapter of the Handbook [69]. In
Equation (8), σ0 is the thermal capture cross section, θ is the natural abundance of the parent
isotope, Eγ,i and σγ,i is the energy and the partial gamma-ray production cross section of the ith
gamma ray and Sn is the neutron binding energy in the daughter nucleus.
The differences in the normalized running sum or cumulative value of the σγ weighted with
Eγ and θ of a certain element are plotted against the emission energy on Figure 10. To calculate
the cumulative σγ values we used gamma rays with σγ of more than 1% relative intensities to the
most intense peak’s σγ value. The calculated capture cross sections of Cu, Fe and Pb are equal to
the thermal neutron capture cross section in the literature [74], meaning that all peaks were
identified and taken into account. The calculated capture cross section for Sb and Ag are 23% and
15% of the literature values. The missing part of the capture cross section originates from the
transitions that cannot be resolved in the spectrum. This appears in the prompt gamma spectra as
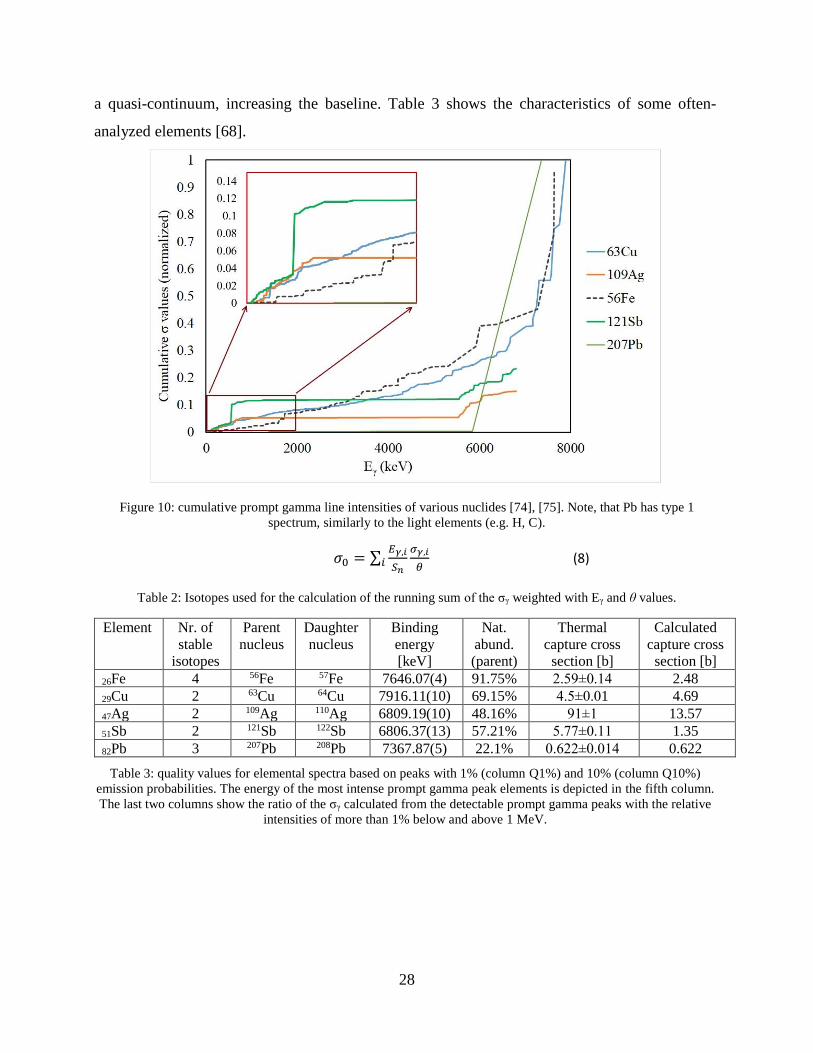
28
a quasi-continuum, increasing the baseline. Table 3 shows the characteristics of some often-
analyzed elements [68].
Figure 10: cumulative prompt gamma line intensities of various nuclides [74], [75]. Note, that Pb has type 1
spectrum, similarly to the light elements (e.g. H, C).
𝜎0 = ∑𝐸𝛾,𝑖
𝑆𝑛𝑖
𝜎𝛾,𝑖
𝜃 (8)
Table 2: Isotopes used for the calculation of the running sum of the σγ weighted with Eγ and θ values.
Element Nr. of
stable
isotopes
Parent
nucleus
Daughter
nucleus
Binding
energy
[keV]
Nat.
abund.
(parent)
Thermal
capture cross
section [b]
Calculated
capture cross
section [b]
26Fe 4 56Fe 57Fe 7646.07(4) 91.75% 2.59±0.14 2.48
29Cu 2 63Cu 64Cu 7916.11(10) 69.15% 4.5±0.01 4.69
47Ag 2 109Ag 110Ag 6809.19(10) 48.16% 91±1 13.57
51Sb 2 121Sb 122Sb 6806.37(13) 57.21% 5.77±0.11 1.35
82Pb 3 207Pb 208Pb 7367.87(5) 22.1% 0.622±0.014 0.622
Table 3: quality values for elemental spectra based on peaks with 1% (column Q1%) and 10% (column Q10%)
emission probabilities. The energy of the most intense prompt gamma peak elements is depicted in the fifth column.
The last two columns show the ratio of the σγ calculated from the detectable prompt gamma peaks with the relative
intensities of more than 1% below and above 1 MeV.
29
Z Element Q(1%) Q(10%) E peak
(I=100%)
MeV
Peaks<1
MeV
Peaks>1
MeV
1 Hydrogen 100 100 2.223 0% 100%
27 Cobalt 59.2 2.42 0.230 61% 39%
28 Nickel 80.9 60.6 0.465 27% 73%
29 Copper 73.9 38.8 0.278 61% 39%
30 Zinc 48.0 17.2 0.115 27% 73%
33 Arsenic 30.7 12.2 0.165 98% 2%
47 Silver 4.3 0.29 0.199 98% 2%
50 Tin 9.8 6.66 1.294 27% 73%
51 Antimony 11.5 0.67 0.121 90% 10%
79 Gold 3.43 0 0.215 92% 8%
82 Lead 84.5 79.1 7.368 0% 100%
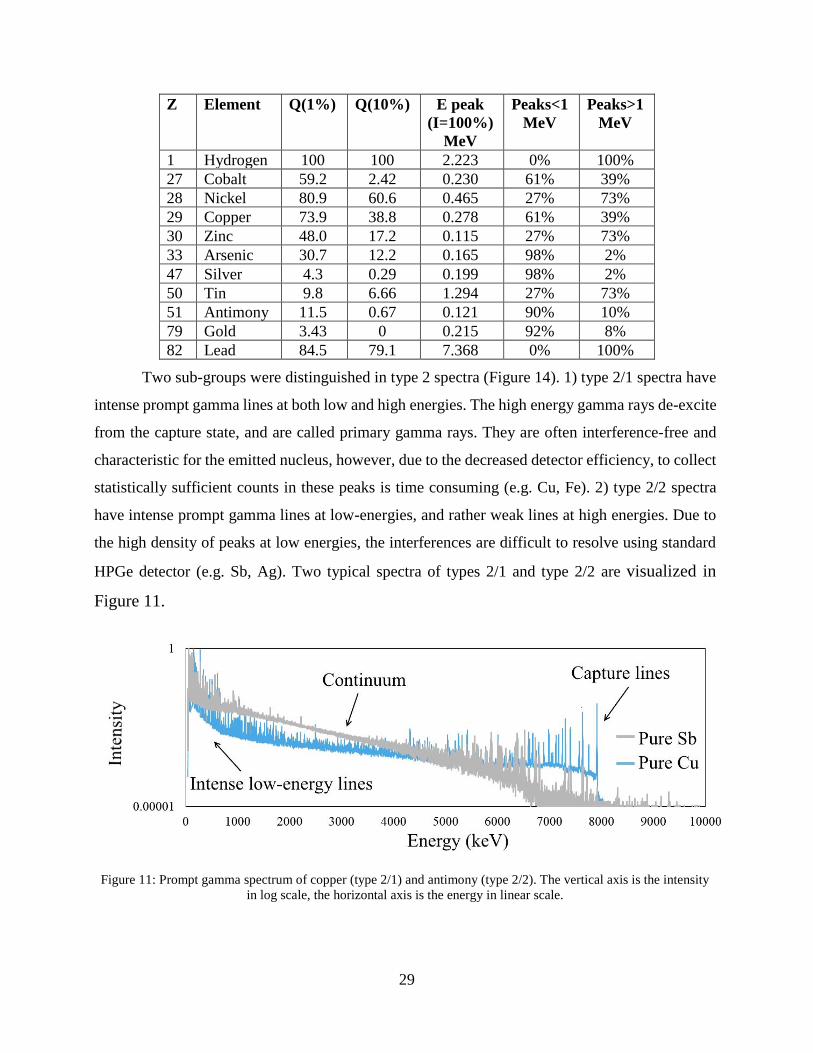
Two sub-groups were distinguished in type 2 spectra (Figure 14). 1) type 2/1 spectra have
intense prompt gamma lines at both low and high energies. The high energy gamma rays de-excite
from the capture state, and are called primary gamma rays. They are often interference-free and
characteristic for the emitted nucleus, however, due to the decreased detector efficiency, to collect
statistically sufficient counts in these peaks is time consuming (e.g. Cu, Fe). 2) type 2/2 spectra
have intense prompt gamma lines at low-energies, and rather weak lines at high energies. Due to
the high density of peaks at low energies, the interferences are difficult to resolve using standard
HPGe detector (e.g. Sb, Ag). Two typical spectra of types 2/1 and type 2/2 are visualized in
Figure 11.
Figure 11: Prompt gamma spectrum of copper (type 2/1) and antimony (type 2/2). The vertical axis is the intensity
in log scale, the horizontal axis is the energy in linear scale.
30
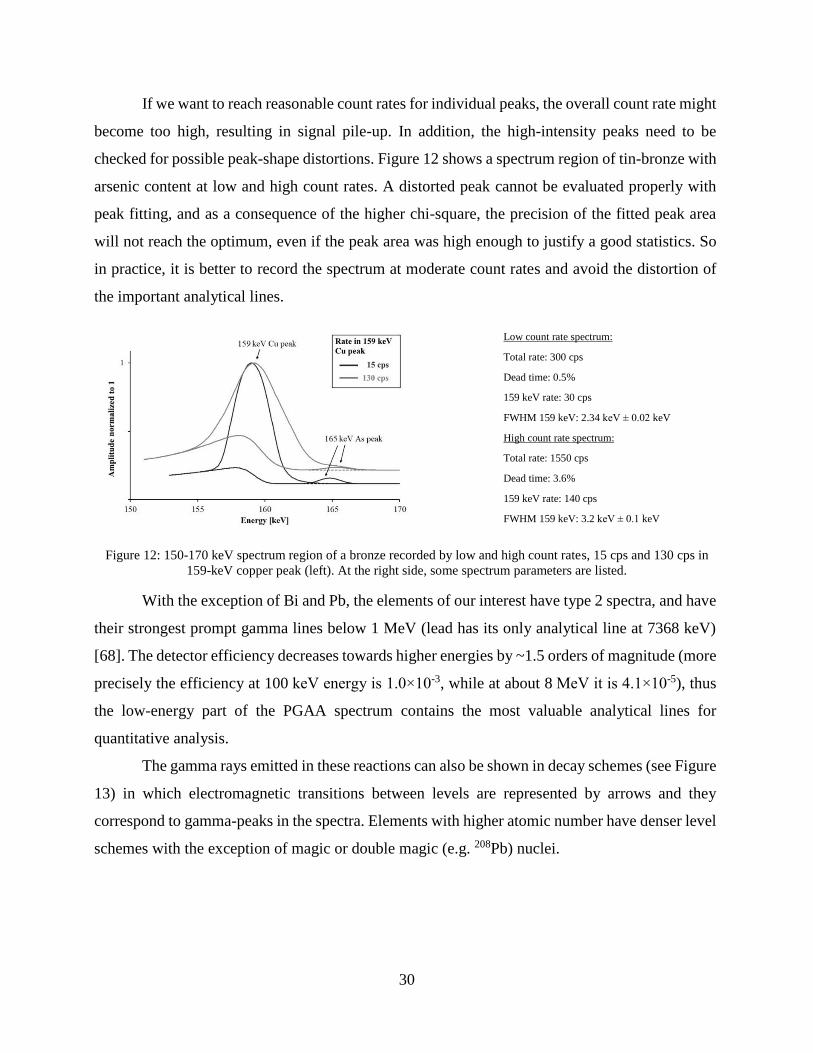
If we want to reach reasonable count rates for individual peaks, the overall count rate might
become too high, resulting in signal pile-up. In addition, the high-intensity peaks need to be
checked for possible peak-shape distortions. Figure 12 shows a spectrum region of tin-bronze with
arsenic content at low and high count rates. A distorted peak cannot be evaluated properly with
peak fitting, and as a consequence of the higher chi-square, the precision of the fitted peak area
will not reach the optimum, even if the peak area was high enough to justify a good statistics. So
in practice, it is better to record the spectrum at moderate count rates and avoid the distortion of
the important analytical lines.
Low count rate spectrum:
Total rate: 300 cps
Dead time: 0.5%
159 keV rate: 30 cps
FWHM 159 keV: 2.34 keV ± 0.02 keV
High count rate spectrum:
Total rate: 1550 cps
Dead time: 3.6%
159 keV rate: 140 cps
FWHM 159 keV: 3.2 keV ± 0.1 keV
Figure 12: 150-170 keV spectrum region of a bronze recorded by low and high count rates, 15 cps and 130 cps in
159-keV copper peak (left). At the right side, some spectrum parameters are listed.
With the exception of Bi and Pb, the elements of our interest have type 2 spectra, and have
their strongest prompt gamma lines below 1 MeV (lead has its only analytical line at 7368 keV)
[68]. The detector efficiency decreases towards higher energies by ~1.5 orders of magnitude (more
precisely the efficiency at 100 keV energy is 1.0×10⁻³, while at about 8 MeV it is 4.1×10⁻⁵), thus
the low-energy part of the PGAA spectrum contains the most valuable analytical lines for
quantitative analysis.
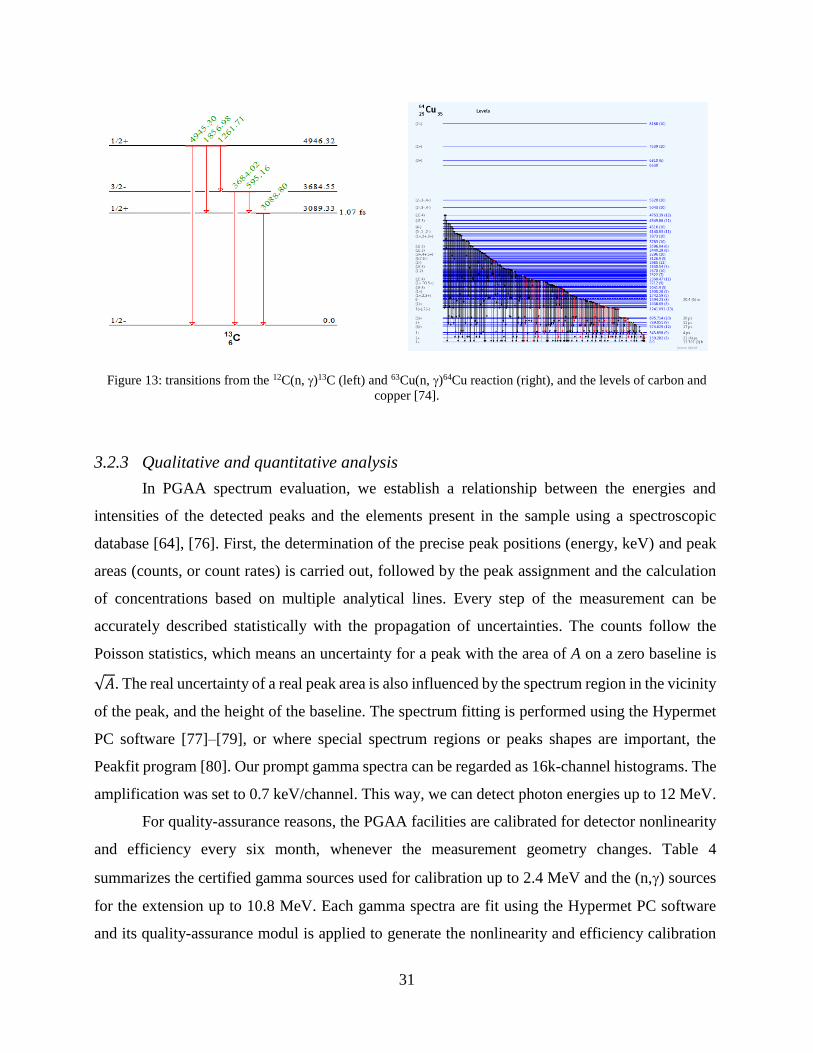
The gamma rays emitted in these reactions can also be shown in decay schemes (see Figure
13) in which electromagnetic transitions between levels are represented by arrows and they
correspond to gamma-peaks in the spectra. Elements with higher atomic number have denser level
schemes with the exception of magic or double magic (e.g. 208Pb) nuclei.
31
Figure 13: transitions from the 12C(n, )13C (left) and 63Cu(n, )64Cu reaction (right), and the levels of carbon and
copper [74].
3.2.3 Qualitative and quantitative analysis
In PGAA spectrum evaluation, we establish a relationship between the energies and
intensities of the detected peaks and the elements present in the sample using a spectroscopic
database [64], [76]. First, the determination of the precise peak positions (energy, keV) and peak
areas (counts, or count rates) is carried out, followed by the peak assignment and the calculation
of concentrations based on multiple analytical lines. Every step of the measurement can be
accurately described statistically with the propagation of uncertainties. The counts follow the
Poisson statistics, which means an uncertainty for a peak with the area of A on a zero baseline is
√𝐴. The real uncertainty of a real peak area is also influenced by the spectrum region in the vicinity
of the peak, and the height of the baseline. The spectrum fitting is performed using the Hypermet
PC software [77]–[79], or where special spectrum regions or peaks shapes are important, the
Peakfit program [80]. Our prompt gamma spectra can be regarded as 16k-channel histograms. The
amplification was set to 0.7 keV/channel. This way, we can detect photon energies up to 12 MeV.
For quality-assurance reasons, the PGAA facilities are calibrated for detector nonlinearity
and efficiency every six month, whenever the measurement geometry changes. Table 4
summarizes the certified gamma sources used for calibration up to 2.4 MeV and the (n,) sources
for the extension up to 10.8 MeV. Each gamma spectra are fit using the Hypermet PC software
and its quality-assurance modul is applied to generate the nonlinearity and efficiency calibration
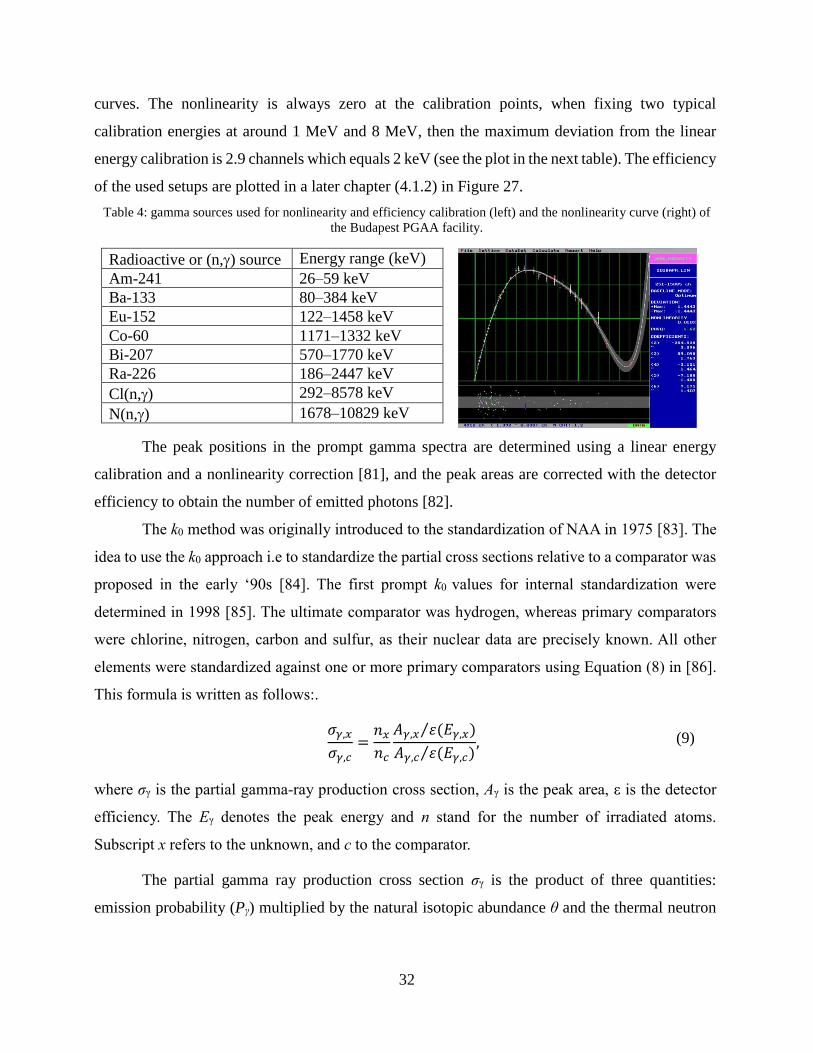
32
curves. The nonlinearity is always zero at the calibration points, when fixing two typical
calibration energies at around 1 MeV and 8 MeV, then the maximum deviation from the linear
energy calibration is 2.9 channels which equals 2 keV (see the plot in the next table). The efficiency
of the used setups are plotted in a later chapter (4.1.2) in Figure 27.
Table 4: gamma sources used for nonlinearity and efficiency calibration (left) and the nonlinearity curve (right) of
the Budapest PGAA facility.
Radioactive or (n,) source Energy range (keV)
Am-241 26–59 keV
Ba-133 80–384 keV
Eu-152 122–1458 keV
Co-60 1171–1332 keV
Bi-207 570–1770 keV
Ra-226 186–2447 keV
Cl(n,) 292–8578 keV
N(n,) 1678–10829 keV
The peak positions in the prompt gamma spectra are determined using a linear energy
calibration and a nonlinearity correction [81], and the peak areas are corrected with the detector
efficiency to obtain the number of emitted photons [82].
The k0 method was originally introduced to the standardization of NAA in 1975 [83]. The
idea to use the k0 approach i.e to standardize the partial cross sections relative to a comparator was
proposed in the early ‘90s [84]. The first prompt k0 values for internal standardization were
determined in 1998 [85]. The ultimate comparator was hydrogen, whereas primary comparators
were chlorine, nitrogen, carbon and sulfur, as their nuclear data are precisely known. All other
elements were standardized against one or more primary comparators using Equation (8) in [86].
This formula is written as follows:.
𝜎𝛾,𝑥
𝜎𝛾,𝑐=𝑛𝑥𝑛𝑐
𝐴𝛾,𝑥 𝜀(𝐸𝛾,𝑥)⁄
𝐴𝛾,𝑐 𝜀(𝐸𝛾,𝑐⁄ ), (9)
where σγ is the partial gamma-ray production cross section, Aγ is the peak area, ε is the detector
efficiency. The Eγ denotes the peak energy and n stand for the number of irradiated atoms.
Subscript x refers to the unknown, and c to the comparator.
The partial gamma ray production cross section σγ is the product of three quantities:
emission probability (Pγ) multiplied by the natural isotopic abundance θ and the thermal neutron
33
capture cross section σ0. This is essential in the quantitative PGAA and it is available in a form of
a database [75], [87].
𝜎𝛾 = 𝑃𝛾 ∙ 𝜃 ∙ 𝜎0 (10)
is the quantity that can be directly measured, so its uncertainty is smaller than those of the three
quantities in the product. By the end of the 1990s and the beginning of the 2000s, all elements, as
well as their stoichiometric chlorine and/or hydrogen compounds were measured and the partical
gamma ray production cross sections (σγ) of the gamma rays were determined [64], [75], [88]. The
energies of the emitted gammas are nuclide specific, which in principle means that the isotopic
composition of the sample can be determined [26].
To determine the mass of the elements, the list of precise peak areas is necessary. The count
rate (counts per second or cps) of a peak at the energy of Eγ is proportional to the number of atoms
present in the irradiated volume. The calculation of the masses is based on Equation 11 (see Eq.
(2) in Ref. [49]), where A is the net peak area, ε is the detector efficiency, t is the live time of the
measurement, m is the mass and M is the molar mass. Φ is the thermal equivalent neutron flux.
𝐴
𝜀𝑡=𝑚
𝑀𝑁𝐴𝜎𝛾𝛷 (11)
To avoid the systematic error caused by the inhomogeneous neutron-flux profile and
inaccurate dead-time correction, the ratios of masses or cross sections of two different chemical
elements present in the sample can be calculated. Thus, by modifying Formula (9) modifying with
𝑛 =𝑚
𝑀𝑁𝐴 (see Eq. 4a and 4b in [49]) can be used in practice. With the ProSpeRo MS Excel macro
utility [49] with built-in spectroscopic library [75], uncertainty and detection limit calculation [89],
the qualitative and quantitative analysis of unkown samples is now a routine task.
3.2.4 PGAA combined with off-line counting
With neutron irradiation, radionuclides with short and medium half-lives (ms – few days,
or more) can sometimes be detected. According to radiation protection regulations, such
radioactive samples must be stored until their radioactivity decreases to the clearance level. These
short and medium half-life nuclides can be measured quantitatively for obtaining further analytical
information [90]. PGAA combined with off-line counting is called in-beam neutron activation
34
analysis (IB NAA), [91]. As decay gamma spectra are often much simpler and have lower spectral
background, detection limits can be improved in this way.
The samples are irradiated in neutron beam preferably combined with the PGAA
measurement. Even oversized samples can be analyzed this way. The exposure is followed by a
separate counting of the induced radioactivity using a HPGe detector in a low-background chamber
[91], just like in INAA. The lower flux of the beam compared to that of a vertical irradiation
channel is partly compensated by the use of more massive samples and longer irradiation times.
As the samples may be larger than the beam, the exact irradiated mass is typically unknown.
Element masses can be determined from the decay measurement when both PGAA and NAA
spectra contain at least one common element for normalization. Another major advantage of cold-
neutron in-beam activation analysis is that almost all nuclides strictly follow the 1/v law and
epithermal activation is completely avoided. Shortly after the irradiation, when numerous short-
lived nuclides are still present, the spectrum contains many peaks and the Compton plateau is high.
The longer lived radionuclides can be more accurately determined when other nuclides have
already decayed away.
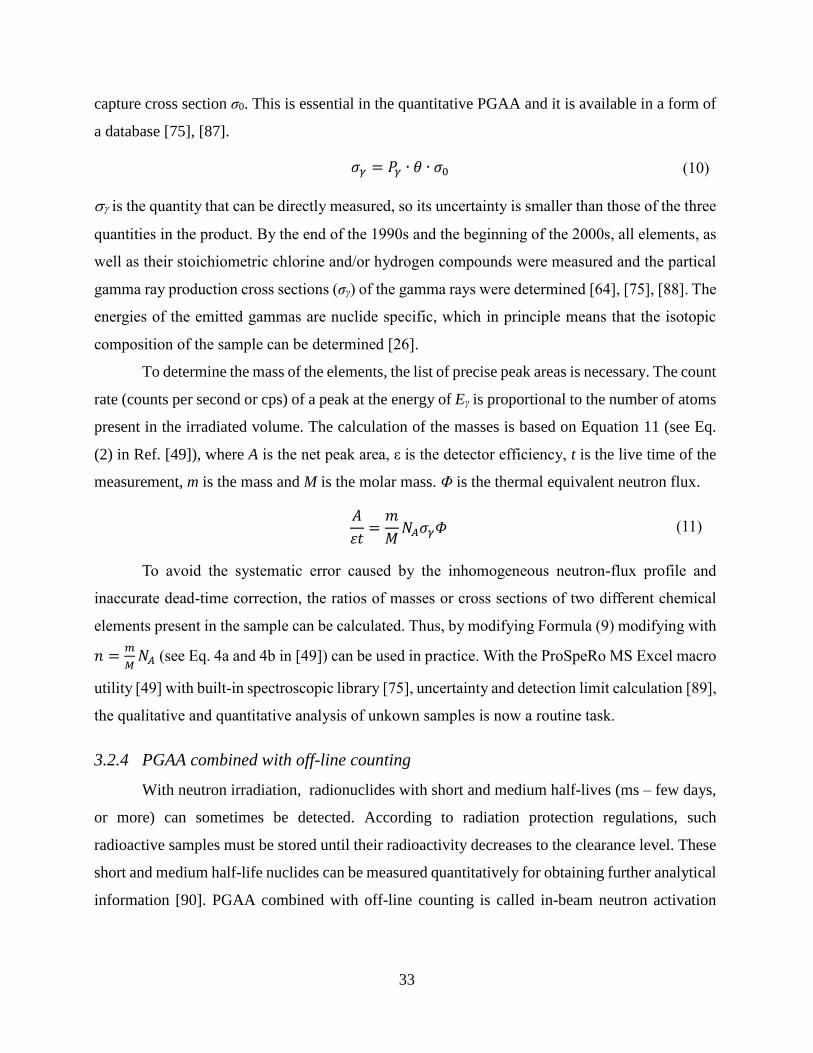
Figure 14: representation of three nuclides with different half-lives present in the same sample. tirr is the irradiation
time, td1 and td2 are the cooling times, tm1 and tm2 are the measurement times.
Figure 14 above shows irradiation and measurement of three different nuclides with
different half-lives. In the first measurement, all three radionuclides are detectable, however,
35
radionuclide 3 almost completely decayed away. In the case of the second measurement, only
nuclide 1 and 2 are detectable. In practice, the analyst must consider the elements of interest,
preferably prior to the experiment, and based on the known half-lives, the most advantageous
cooling times are to be chosen.
The concentration calculation relies on the k0 database [92], [93] and on the general
formulae of INAA simplified to subthermal activation, containing the saturation, decay and
counting factors. To calculate the concentrations from the decay spectra, Equation 12 was used.
This formula contains the saturation, decay and counting (SDC) factors as well, see the last three
terms in Eq. (12).
In Equation 12, tirr is the irradiation time, td is the decay time (equal to tc, i.e. cooling time,
elapsed time from the end of irradiation to the beginning of the off-line counting), tm is the length
of the decay measurement. Np is the collected counts (net peak area). Nav is the Avogadro constant.
m is the calculated mass, M is the molar mass and θ is the natural isotopic abundance. Pγ is the
emission probability, σ0 is the neutron capture cross section of the nuclide. Φ0 is the thermal
equivalent neutron flux, ε is the full-energy peak efficiency. If all other quantities are known then
m can be determined.
𝑁𝑃 = ∫ (𝑑𝑁𝑝(𝑡)
𝑑𝑡)
𝑡𝑖𝑟𝑟+𝑡𝑑+𝑡𝑚
𝑡=𝑡𝑖𝑟𝑟+𝑡𝑑
𝑑𝑡
=𝑚𝜃𝑁𝐴𝑣𝑀
Φ0𝜎0𝑃𝛾𝜀𝑡𝑚[1 − 𝑒−𝜆𝑡𝑖𝑟𝑟]𝑒−𝜆𝑡𝑑 [1 − 𝑒−𝜆𝑡𝑚
𝜆𝑡𝑚]
(12)
3.2.5 PGAA facilities
Since scientific-grade PGAA measurements presently require a research reactor or a
spallation source (preferably a thermal or cold neutron beam, with reasonable distance from the
neutron source in order to decrease the neutron and the gamma background), there are fifteen
PGAA facilities in the world, in the USA, Japan, Czech Republic, Germany, Hungary, Netherlands,
Republic of Korea, Argentina, Brazil, China, Egypt, India, Marocco, Thailand and in Vietnam,
which are in routine operation or will start operating in the near future [71], [94]. My
measurements were carried out at the BNC (Budapest Neutron Centre) and in the FRM II PGAA
station in Garching, Germany.
36
BNC
The Budapest Research Reactor (BRR) has been equipped with a cold neutron source since
2000, a tank of 400 cm3 filled with liquid hydrogen at the temperature of 20 K [95]. The neutrons
are transferred from the source with evacuated neutron guides to the instruments [96]. The neutron
guides of PGAA are curved to filter out the high-energy neutrons and gamma rays. The colder
neutrons have better transmission in the curved neutron guides and produce higher capture rates,
assuring better signal-to-background conditions. For this reason, PGAA facilities are preferably
installed far from the reactor. At BRR, the length of the neutron guide is 30 m [97]. Two
experimental stations are now located at the end of the guide: PGAA [98] and NIPS-NORMA [99],
[100].
I was using both PGAA and NIPS-NORMA stations for my measurements. They have
thermal equivalent neutron fluxes of 9.6×107 cm-2s-1 and 2.7×107 cm-2s-1, respectively. Both
facilities are equipped with adjustable neutron beam apertures (collimators) to set the proper
neutron beam cross section that helps to maintain the count rate within the desired range during
the data acqusition. PGAA facility was designed for the measurement of samples with moderate
size, approximately with dimensions not exceeding 80×60×30 mm3, while NIPS-NORMA station
can accommodate larger samples with dimension up to 200×200×200 mm3.
FRM II
The PGAA facility at the Forschungs-Neutronenquelle Heinz Maier-Leibnitz (FRM II)
operates with a high flux cold neutron beam. The maximum thermal equivalent neutron flux is
6.1×1010cm-2s-1 [101]. Thus, samples as small as 0.1 mg [102] and up to 10 g with dimensions not
exceeding 40×40×40 mm3 can be analyzed using an elliptical guide extension or a set of
collimators, at a neutron flux of 5×1010cm-2s-1 or 2×109cm-2s-1, respectively [91][103]. The high
flux allows, similarly to INAA, the activation of many elements in the sample. Thus, in-beam
activation analysis can be performed by irradiating during the PGAA measurement, and the off-
line counting takes place in low-background counting chamber [91], [104].
37
3.3 Complementary methods
3.3.1 X-ray fluorescence spectroscopy
Since the discovery of X-radiation in 1896 [105], X-ray-based techniques, including X-ray
fluorescence spectroscopy (XRF), have became routine analytical techniques. Due to its non-
destructive nature and the capability of doing multi-elemental analysis after a simple sample
preparation, it became an important method in geology and metal industry between 1960-1980
[21].
The energy range applied in X-ray spectroscopy is usually between 1-50 keV [106]. At
these low energies, the two main interactions of photons with the matter is Rayleigh scattering and
even more importantly, the photoelectric effect (see chapter 3.1.3). The shell electrons are excited
by the energetic radiation, and due to the photoelectric effect, vacancies in the inner electron shell
are created. These vacancies are then filled with electrons from the outer shells, while the energy
difference is emitted in the form of characteristic X-ray photons (or an Auger-electron).
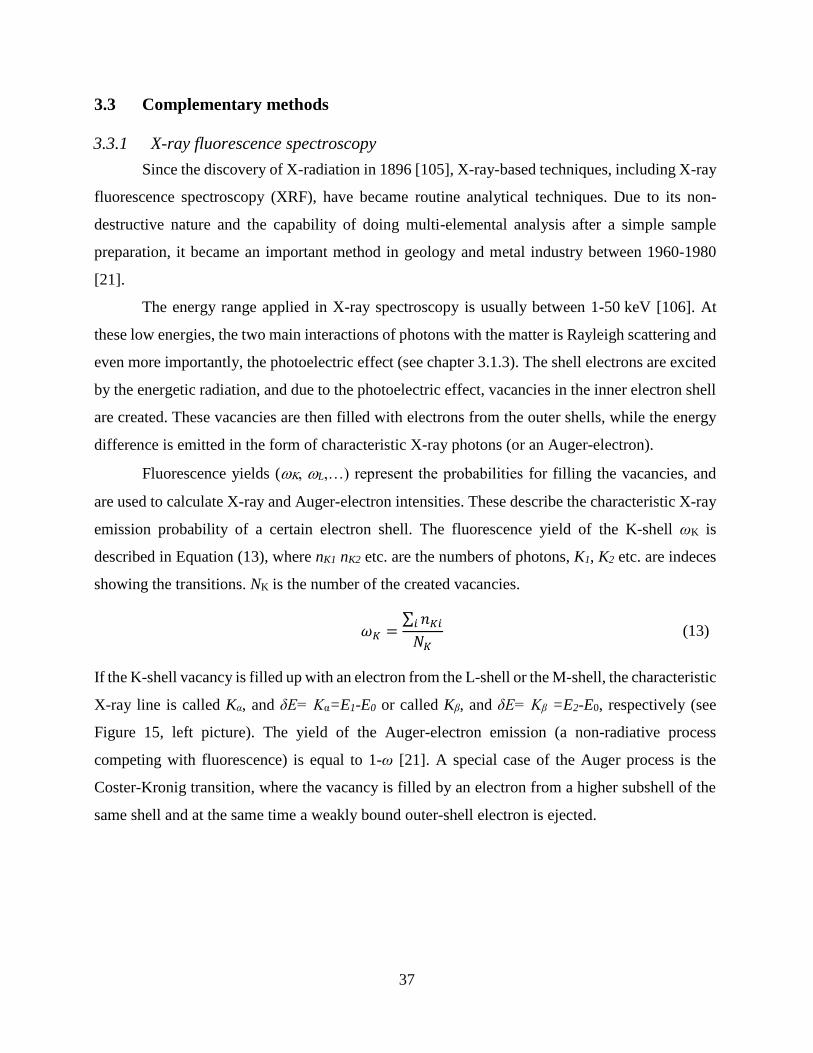
Fluorescence yields ( L,…) represent the probabilities for filling the vacancies, and
are used to calculate X-ray and Auger-electron intensities. These describe the characteristic X-ray
emission probability of a certain electron shell. The fluorescence yield of the K-shell ωK is
described in Equation (13), where nK1 nK2 etc. are the numbers of photons, K1, K2 etc. are indeces
showing the transitions. NK is the number of the created vacancies.
𝜔𝐾 =∑ 𝑛𝐾𝑖𝑖
𝑁𝐾 (13)
If the K-shell vacancy is filled up with an electron from the L-shell or the M-shell, the characteristic
X-ray line is called Kα, and δE= Kα=E1-E0 or called Kβ, and δE= Kβ =E2-E0, respectively (see
Figure 15, left picture). The yield of the Auger-electron emission (a non-radiative process
competing with fluorescence) is equal to 1-ω [21]. A special case of the Auger process is the
Coster-Kronig transition, where the vacancy is filled by an electron from a higher subshell of the
same shell and at the same time a weakly bound outer-shell electron is ejected.
38
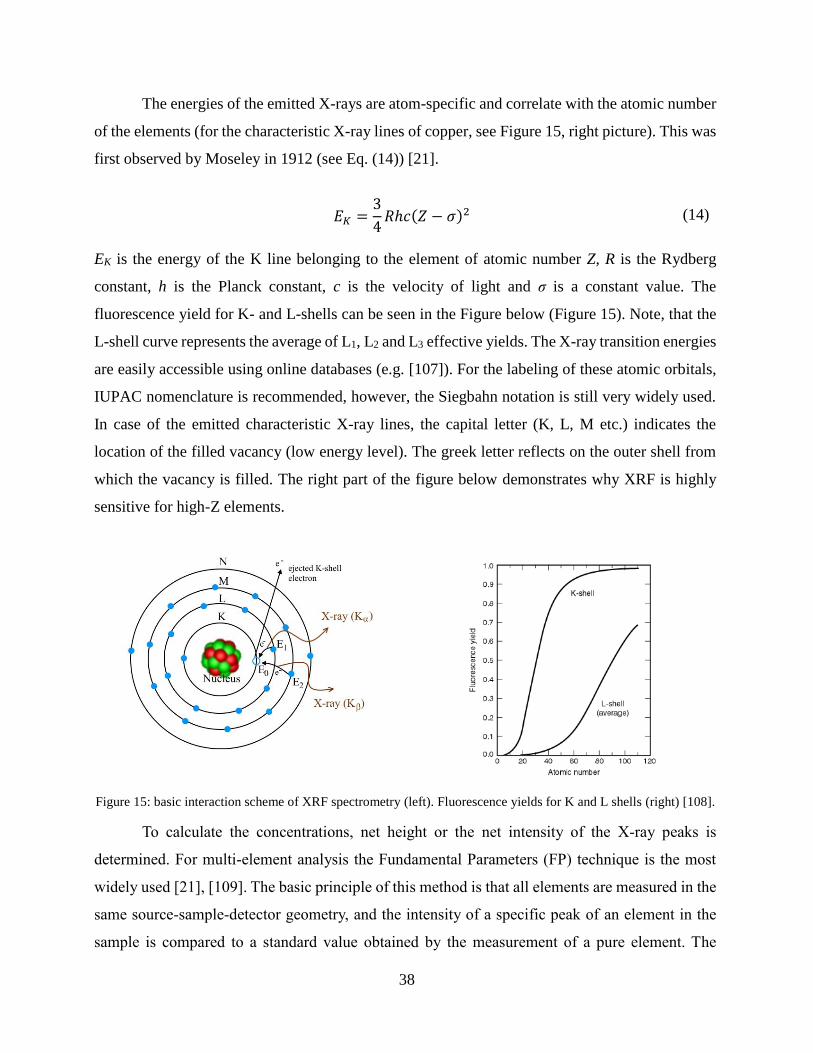
The energies of the emitted X-rays are atom-specific and correlate with the atomic number
of the elements (for the characteristic X-ray lines of copper, see Figure 15, right picture). This was
first observed by Moseley in 1912 (see Eq. (14)) [21].
EK is the energy of the K line belonging to the element of atomic number Z, R is the Rydberg
constant, h is the Planck constant, c is the velocity of light and σ is a constant value. The
fluorescence yield for K- and L-shells can be seen in the Figure below (Figure 15). Note, that the
L-shell curve represents the average of L1, L2 and L3 effective yields. The X-ray transition energies
are easily accessible using online databases (e.g. [107]). For the labeling of these atomic orbitals,
IUPAC nomenclature is recommended, however, the Siegbahn notation is still very widely used.
In case of the emitted characteristic X-ray lines, the capital letter (K, L, M etc.) indicates the
location of the filled vacancy (low energy level). The greek letter reflects on the outer shell from
which the vacancy is filled. The right part of the figure below demonstrates why XRF is highly
sensitive for high-Z elements.
Figure 15: basic interaction scheme of XRF spectrometry (left). Fluorescence yields for K and L shells (right) [108].
To calculate the concentrations, net height or the net intensity of the X-ray peaks is
determined. For multi-element analysis the Fundamental Parameters (FP) technique is the most
widely used [21], [109]. The basic principle of this method is that all elements are measured in the
same source-sample-detector geometry, and the intensity of a specific peak of an element in the
sample is compared to a standard value obtained by the measurement of a pure element. The
𝐸𝐾 =3
4𝑅ℎ𝑐(𝑍 − 𝜎)2 (14)
39
determination of the relative intensities is a time-consuming procedure and requires standard
materials as well.
In the analysis of samples with low-Z matrix, the standard-based Compton normalization
(CN) method is an alternative. In this case, the Compton-peak is used as an internal standard, as
its intensity is dependent on the matrix composition (average Z of the sample). CN method is the
best for analyzing heavy elements in a low-density material (e.g. sand, plastic etc.).
The performance of XRF is mainly dependent on the excitation source and the detection
mode. The possible X-ray sources are: X-ray tube, radioactive isotope, electron beam (e.g. in
SEM), positron or other charged-particle beams and synchrotrons [21]. The portable and
laboratory-scale instruments are capable of analyzing a wide concentration range of elements with
moderate sensitivities, while accelerator-, and synchrotron-based XRF have the lowest detection
limits [21]. Amongst the main XRF spectrometer configurations e.g. wavelength-dispersive-
(WDXRF) and energy-dispersive XRF instruments (ED-XRF) [110], the latter configuration is
dominant. Based on the excitation and detection, one can classify different techniques within X-
ray fluorescence spectrometry. In addition to standard, lab-scale ED-XRF instruments, micro-
focus XRF, total-reflection XRF, synchrotron XRF (SXRF) and portable XRF (pXRF, or handheld
XRF) can be mentioned. This latter category includes battery-powered, low-cost, light-weight
devices that can be taken out of the laboratory (e.g. to field geology, industrial production plants,
or museums) and can be operated in a simple way. In terms of unit cost, simplicity and turnover
time, handheld X-ray devices can outperform neutron-based techniques, while having different
advantages and limitations (e.g. sample size), so they complement them well.
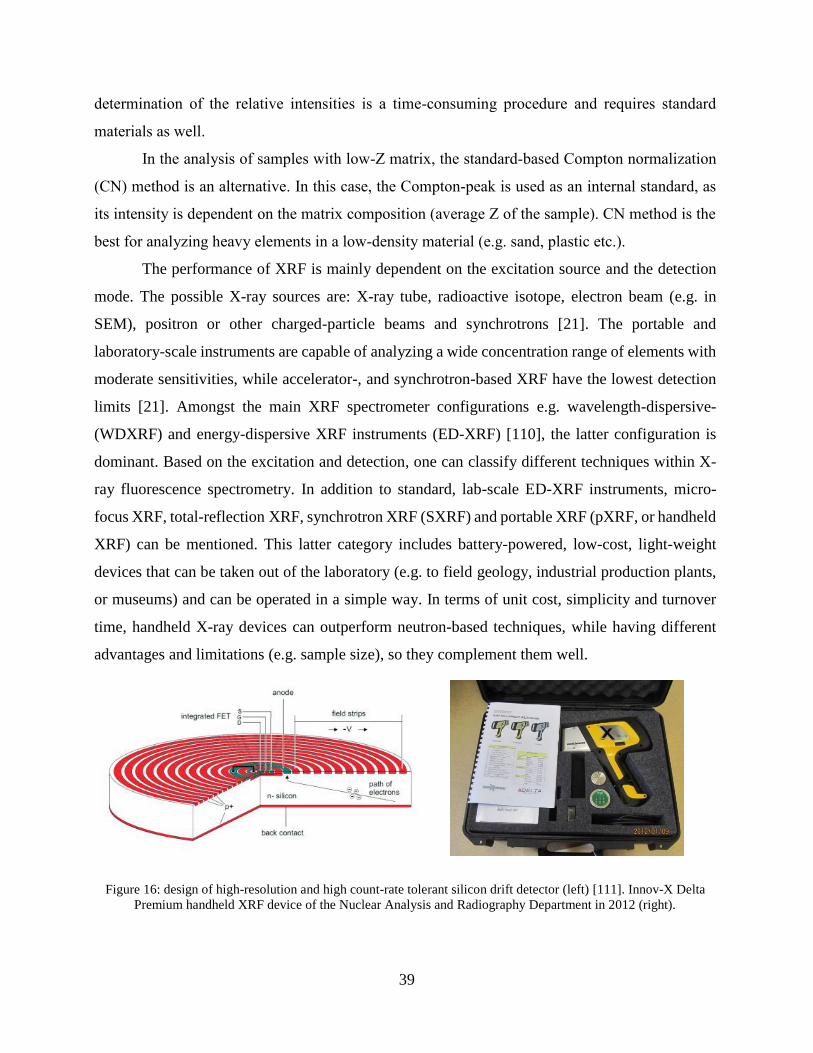
Figure 16: design of high-resolution and high count-rate tolerant silicon drift detector (left) [111]. Innov-X Delta
Premium handheld XRF device of the Nuclear Analysis and Radiography Department in 2012 (right).
40
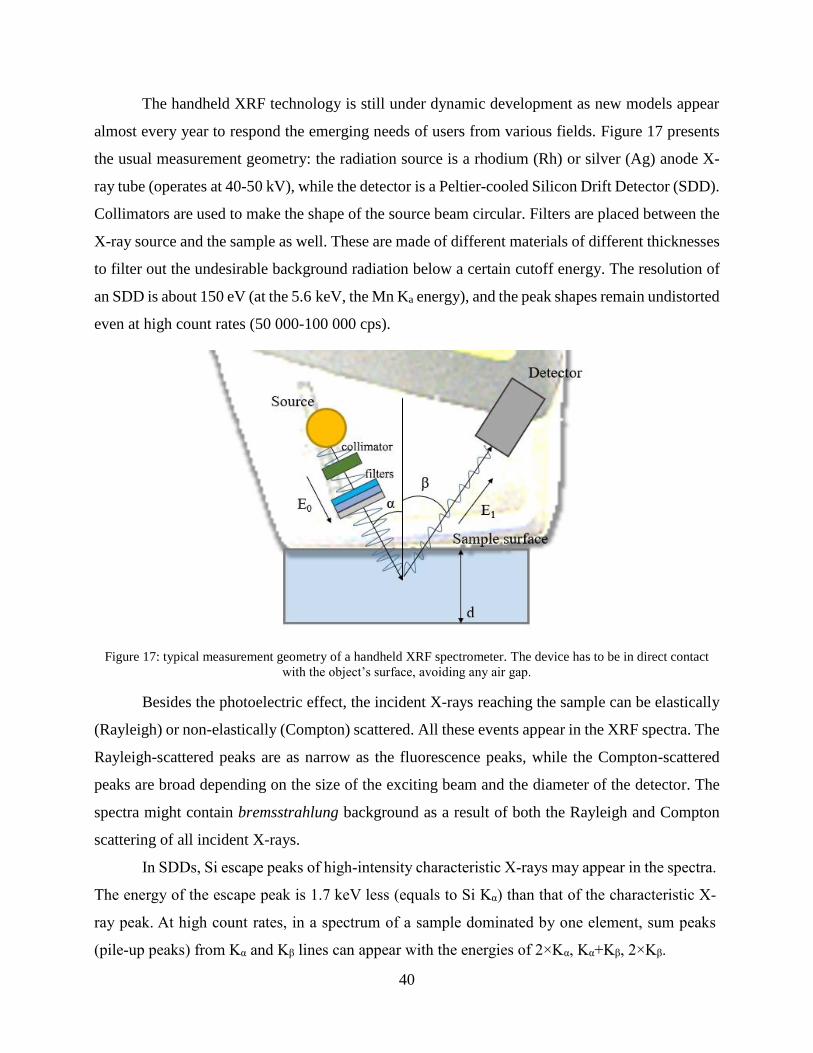
The handheld XRF technology is still under dynamic development as new models appear
almost every year to respond the emerging needs of users from various fields. Figure 17 presents
the usual measurement geometry: the radiation source is a rhodium (Rh) or silver (Ag) anode X-
ray tube (operates at 40-50 kV), while the detector is a Peltier-cooled Silicon Drift Detector (SDD).
Collimators are used to make the shape of the source beam circular. Filters are placed between the
X-ray source and the sample as well. These are made of different materials of different thicknesses
to filter out the undesirable background radiation below a certain cutoff energy. The resolution of
an SDD is about 150 eV (at the 5.6 keV, the Mn Ka energy), and the peak shapes remain undistorted
even at high count rates (50 000-100 000 cps).
Figure 17: typical measurement geometry of a handheld XRF spectrometer. The device has to be in direct contact
with the object’s surface, avoiding any air gap.
Besides the photoelectric effect, the incident X-rays reaching the sample can be elastically
(Rayleigh) or non-elastically (Compton) scattered. All these events appear in the XRF spectra. The
Rayleigh-scattered peaks are as narrow as the fluorescence peaks, while the Compton-scattered
peaks are broad depending on the size of the exciting beam and the diameter of the detector. The
spectra might contain bremsstrahlung background as a result of both the Rayleigh and Compton
scattering of all incident X-rays.
In SDDs, Si escape peaks of high-intensity characteristic X-rays may appear in the spectra.
The energy of the escape peak is 1.7 keV less (equals to Si Kα) than that of the characteristic X-
ray peak. At high count rates, in a spectrum of a sample dominated by one element, sum peaks
(pile-up peaks) from Kα and Kβ lines can appear with the energies of 2×Kα, Kα+Kβ, 2×Kβ.
41
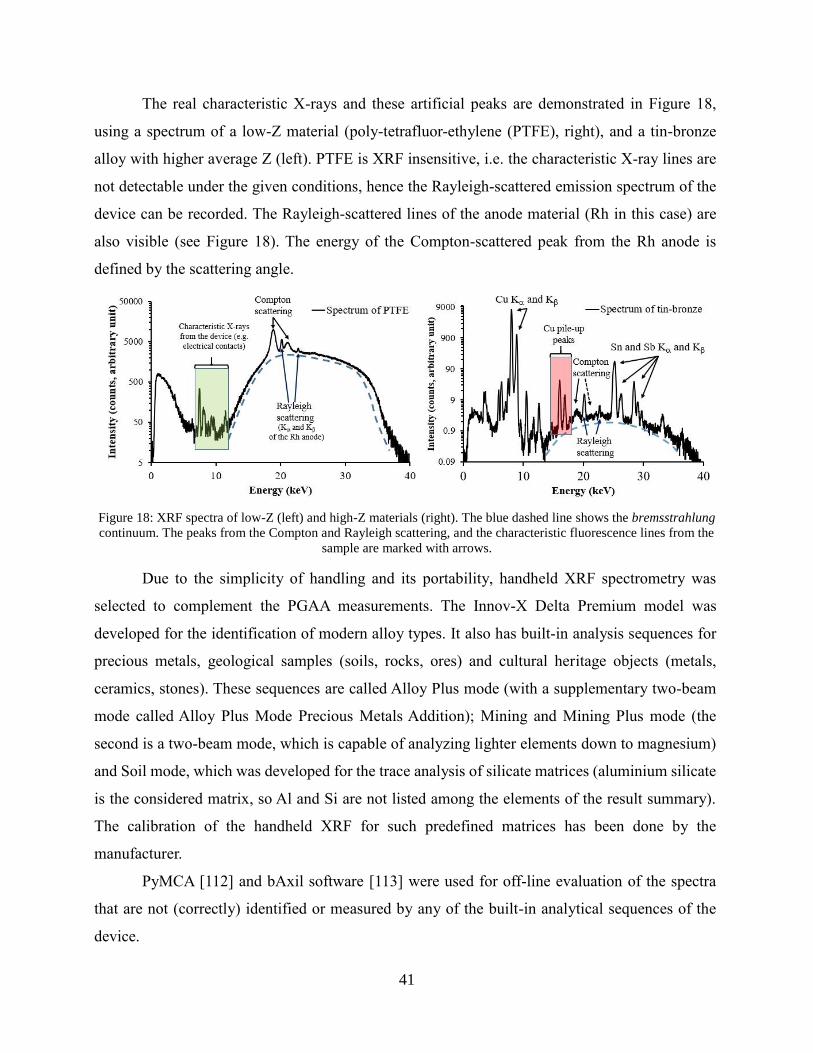
The real characteristic X-rays and these artificial peaks are demonstrated in Figure 18,
using a spectrum of a low-Z material (poly-tetrafluor-ethylene (PTFE), right), and a tin-bronze
alloy with higher average Z (left). PTFE is XRF insensitive, i.e. the characteristic X-ray lines are
not detectable under the given conditions, hence the Rayleigh-scattered emission spectrum of the
device can be recorded. The Rayleigh-scattered lines of the anode material (Rh in this case) are
also visible (see Figure 18). The energy of the Compton-scattered peak from the Rh anode is
defined by the scattering angle.
Figure 18: XRF spectra of low-Z (left) and high-Z materials (right). The blue dashed line shows the bremsstrahlung
continuum. The peaks from the Compton and Rayleigh scattering, and the characteristic fluorescence lines from the
sample are marked with arrows.
Due to the simplicity of handling and its portability, handheld XRF spectrometry was
selected to complement the PGAA measurements. The Innov-X Delta Premium model was
developed for the identification of modern alloy types. It also has built-in analysis sequences for
precious metals, geological samples (soils, rocks, ores) and cultural heritage objects (metals,
ceramics, stones). These sequences are called Alloy Plus mode (with a supplementary two-beam
mode called Alloy Plus Mode Precious Metals Addition); Mining and Mining Plus mode (the
second is a two-beam mode, which is capable of analyzing lighter elements down to magnesium)
and Soil mode, which was developed for the trace analysis of silicate matrices (aluminium silicate
is the considered matrix, so Al and Si are not listed among the elements of the result summary).
The calibration of the handheld XRF for such predefined matrices has been done by the
manufacturer.
PyMCA [112] and bAxil software [113] were used for off-line evaluation of the spectra
that are not (correctly) identified or measured by any of the built-in analytical sequences of the
device.
42
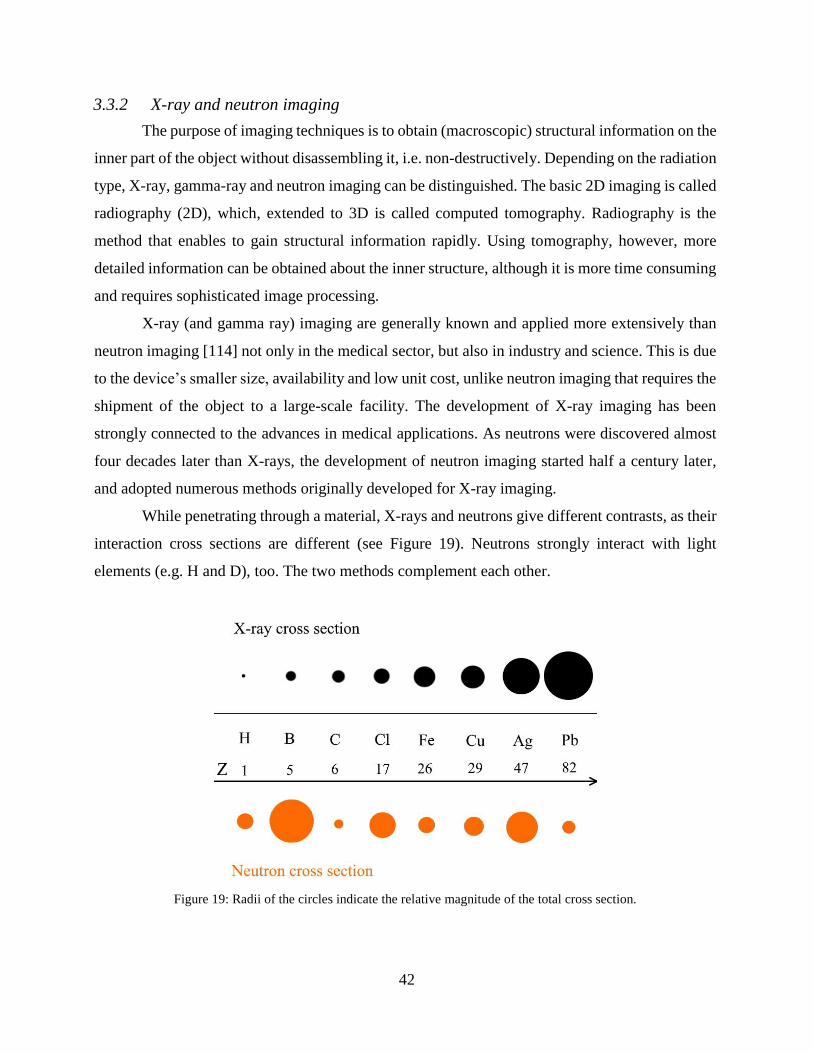
3.3.2 X-ray and neutron imaging
The purpose of imaging techniques is to obtain (macroscopic) structural information on the
inner part of the object without disassembling it, i.e. non-destructively. Depending on the radiation
type, X-ray, gamma-ray and neutron imaging can be distinguished. The basic 2D imaging is called
radiography (2D), which, extended to 3D is called computed tomography. Radiography is the
method that enables to gain structural information rapidly. Using tomography, however, more
detailed information can be obtained about the inner structure, although it is more time consuming
and requires sophisticated image processing.
X-ray (and gamma ray) imaging are generally known and applied more extensively than
neutron imaging [114] not only in the medical sector, but also in industry and science. This is due
to the device’s smaller size, availability and low unit cost, unlike neutron imaging that requires the
shipment of the object to a large-scale facility. The development of X-ray imaging has been
strongly connected to the advances in medical applications. As neutrons were discovered almost
four decades later than X-rays, the development of neutron imaging started half a century later,
and adopted numerous methods originally developed for X-ray imaging.
While penetrating through a material, X-rays and neutrons give different contrasts, as their
interaction cross sections are different (see Figure 19). Neutrons strongly interact with light
elements (e.g. H and D), too. The two methods complement each other.
Figure 19: Radii of the circles indicate the relative magnitude of the total cross section.
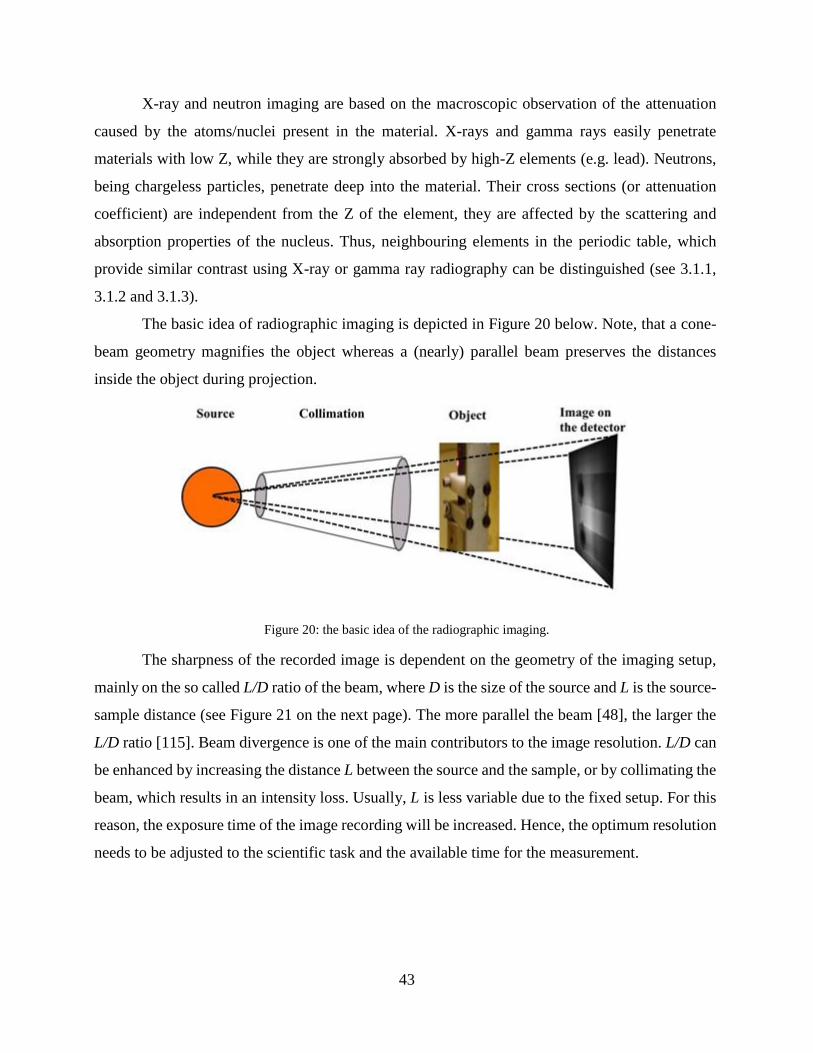
43
X-ray and neutron imaging are based on the macroscopic observation of the attenuation
caused by the atoms/nuclei present in the material. X-rays and gamma rays easily penetrate
materials with low Z, while they are strongly absorbed by high-Z elements (e.g. lead). Neutrons,
being chargeless particles, penetrate deep into the material. Their cross sections (or attenuation
coefficient) are independent from the Z of the element, they are affected by the scattering and
absorption properties of the nucleus. Thus, neighbouring elements in the periodic table, which
provide similar contrast using X-ray or gamma ray radiography can be distinguished (see 3.1.1,
3.1.2 and 3.1.3).
The basic idea of radiographic imaging is depicted in Figure 20 below. Note, that a cone-
beam geometry magnifies the object whereas a (nearly) parallel beam preserves the distances
inside the object during projection.
Figure 20: the basic idea of the radiographic imaging.
The sharpness of the recorded image is dependent on the geometry of the imaging setup,
mainly on the so called L/D ratio of the beam, where D is the size of the source and L is the source-
sample distance (see Figure 21 on the next page). The more parallel the beam [48], the larger the
L/D ratio [115]. Beam divergence is one of the main contributors to the image resolution. L/D can
be enhanced by increasing the distance L between the source and the sample, or by collimating the
beam, which results in an intensity loss. Usually, L is less variable due to the fixed setup. For this
reason, the exposure time of the image recording will be increased. Hence, the optimum resolution
needs to be adjusted to the scientific task and the available time for the measurement.
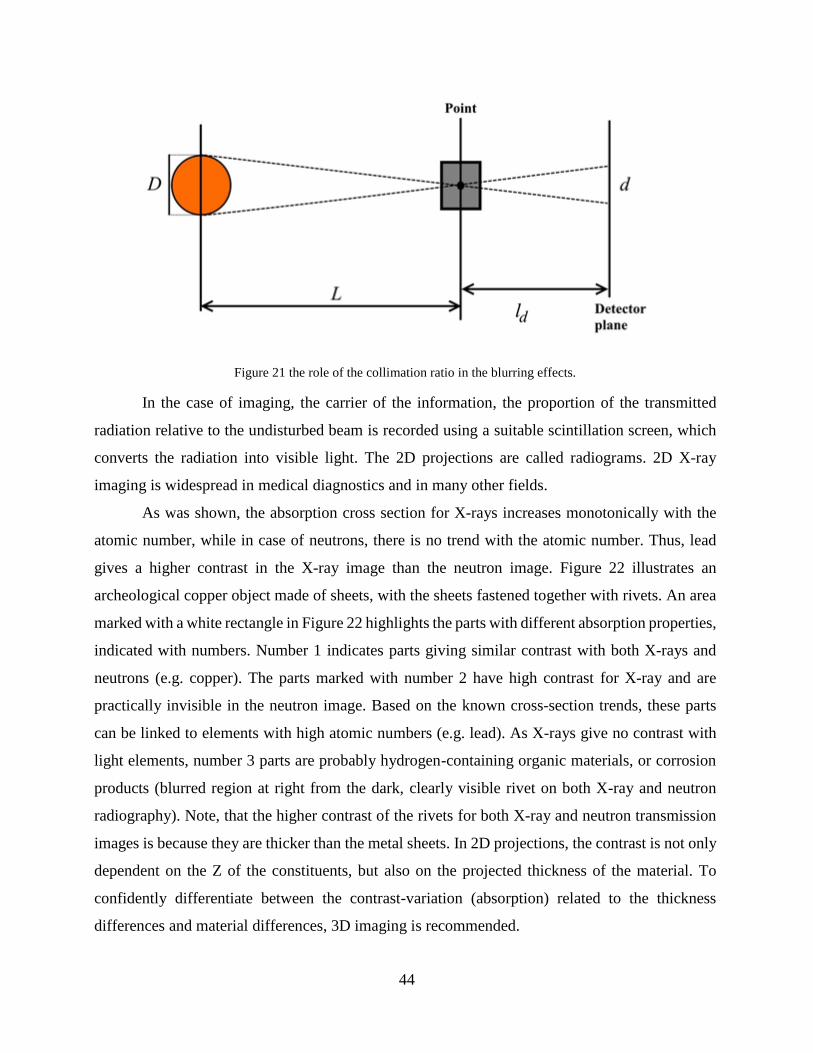
44
Figure 21 the role of the collimation ratio in the blurring effects.
In the case of imaging, the carrier of the information, the proportion of the transmitted
radiation relative to the undisturbed beam is recorded using a suitable scintillation screen, which
converts the radiation into visible light. The 2D projections are called radiograms. 2D X-ray
imaging is widespread in medical diagnostics and in many other fields.
As was shown, the absorption cross section for X-rays increases monotonically with the
atomic number, while in case of neutrons, there is no trend with the atomic number. Thus, lead
gives a higher contrast in the X-ray image than the neutron image. Figure 22 illustrates an
archeological copper object made of sheets, with the sheets fastened together with rivets. An area
marked with a white rectangle in Figure 22 highlights the parts with different absorption properties,
indicated with numbers. Number 1 indicates parts giving similar contrast with both X-rays and
neutrons (e.g. copper). The parts marked with number 2 have high contrast for X-ray and are
practically invisible in the neutron image. Based on the known cross-section trends, these parts
can be linked to elements with high atomic numbers (e.g. lead). As X-rays give no contrast with
light elements, number 3 parts are probably hydrogen-containing organic materials, or corrosion
products (blurred region at right from the dark, clearly visible rivet on both X-ray and neutron
radiography). Note, that the higher contrast of the rivets for both X-ray and neutron transmission
images is because they are thicker than the metal sheets. In 2D projections, the contrast is not only
dependent on the Z of the constituents, but also on the projected thickness of the material. To
confidently differentiate between the contrast-variation (absorption) related to the thickness
differences and material differences, 3D imaging is recommended.
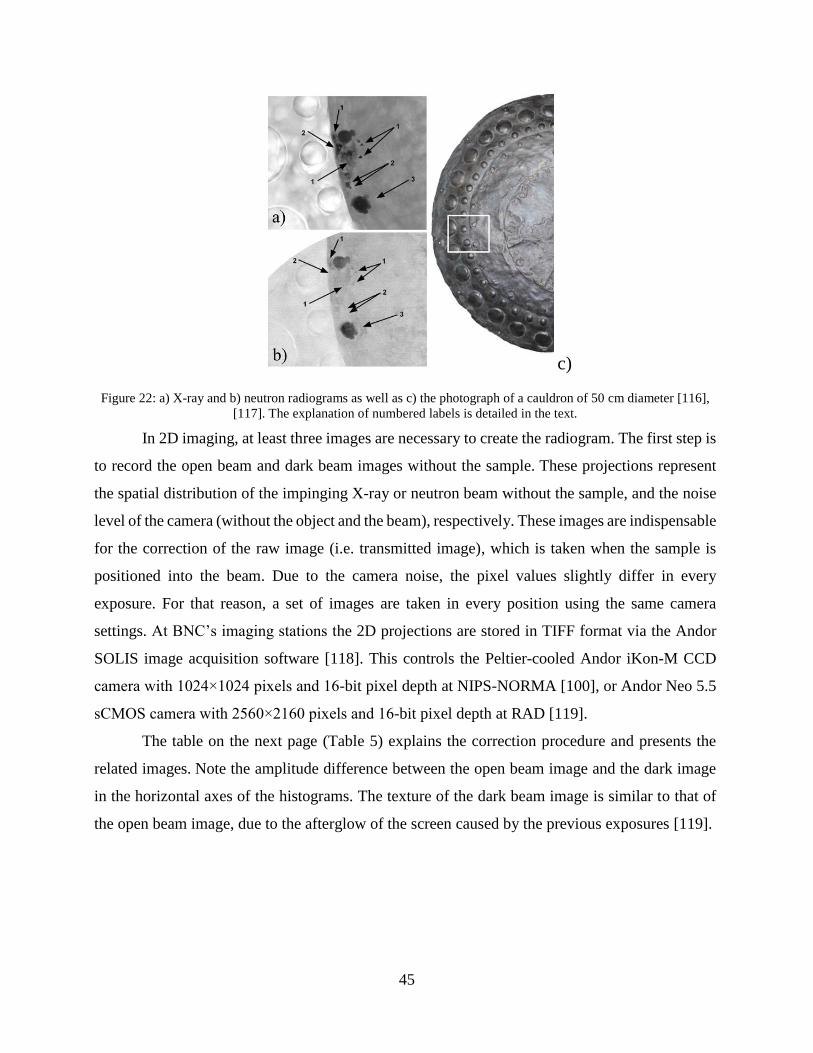
45
c)
Figure 22: a) X-ray and b) neutron radiograms as well as c) the photograph of a cauldron of 50 cm diameter [116],
[117]. The explanation of numbered labels is detailed in the text.
In 2D imaging, at least three images are necessary to create the radiogram. The first step is
to record the open beam and dark beam images without the sample. These projections represent
the spatial distribution of the impinging X-ray or neutron beam without the sample, and the noise
level of the camera (without the object and the beam), respectively. These images are indispensable
for the correction of the raw image (i.e. transmitted image), which is taken when the sample is
positioned into the beam. Due to the camera noise, the pixel values slightly differ in every
exposure. For that reason, a set of images are taken in every position using the same camera
settings. At BNC’s imaging stations the 2D projections are stored in TIFF format via the Andor
SOLIS image acquisition software [118]. This controls the Peltier-cooled Andor iKon-M CCD
camera with 1024×1024 pixels and 16-bit pixel depth at NIPS-NORMA [100], or Andor Neo 5.5
sCMOS camera with 2560×2160 pixels and 16-bit pixel depth at RAD [119].
The table on the next page (Table 5) explains the correction procedure and presents the
related images. Note the amplitude difference between the open beam image and the dark image
in the horizontal axes of the histograms. The texture of the dark beam image is similar to that of
the open beam image, due to the afterglow of the screen caused by the previous exposures [119].
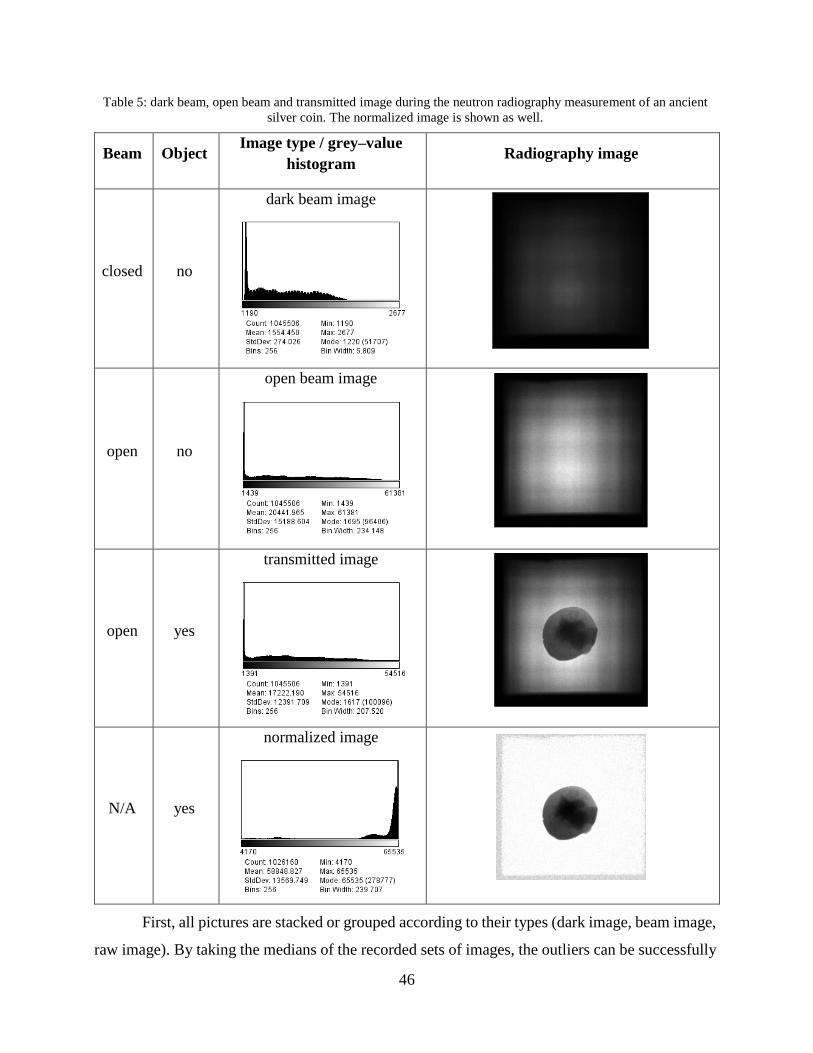
46
Table 5: dark beam, open beam and transmitted image during the neutron radiography measurement of an ancient
silver coin. The normalized image is shown as well.
Beam Object Image type / grey–value
histogram Radiography image
closed no
dark beam image
open no
open beam image
open yes
transmitted image
N/A yes
normalized image
First, all pictures are stacked or grouped according to their types (dark image, beam image,
raw image). By taking the medians of the recorded sets of images, the outliers can be successfully
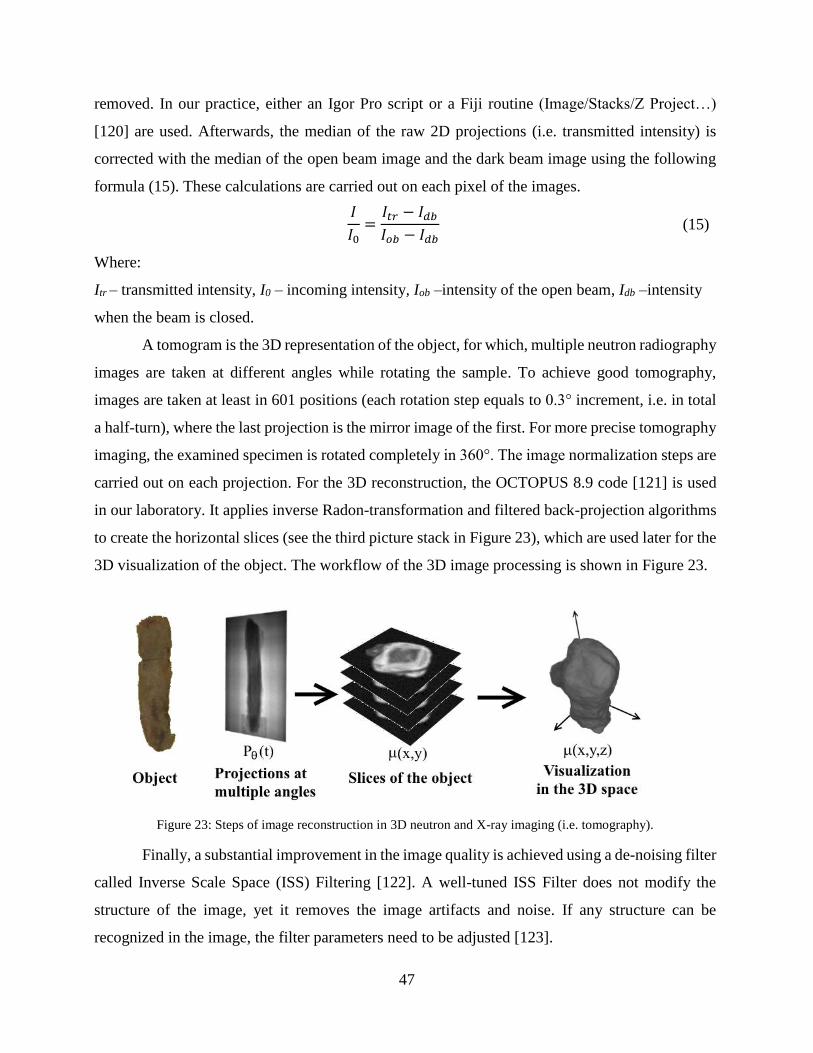
47
removed. In our practice, either an Igor Pro script or a Fiji routine (Image/Stacks/Z Project…)
[120] are used. Afterwards, the median of the raw 2D projections (i.e. transmitted intensity) is
corrected with the median of the open beam image and the dark beam image using the following
formula (15). These calculations are carried out on each pixel of the images.
𝐼
𝐼0=𝐼𝑡𝑟 − 𝐼𝑑𝑏𝐼𝑜𝑏 − 𝐼𝑑𝑏
(15)
Where:
Itr – transmitted intensity, I0 – incoming intensity, Iob –intensity of the open beam, Idb –intensity
when the beam is closed.
A tomogram is the 3D representation of the object, for which, multiple neutron radiography
images are taken at different angles while rotating the sample. To achieve good tomography,
images are taken at least in 601 positions (each rotation step equals to 0.3° increment, i.e. in total
a half-turn), where the last projection is the mirror image of the first. For more precise tomography
imaging, the examined specimen is rotated completely in 360°. The image normalization steps are
carried out on each projection. For the 3D reconstruction, the OCTOPUS 8.9 code [121] is used
in our laboratory. It applies inverse Radon-transformation and filtered back-projection algorithms
to create the horizontal slices (see the third picture stack in Figure 23), which are used later for the
3D visualization of the object. The workflow of the 3D image processing is shown in Figure 23.
Figure 23: Steps of image reconstruction in 3D neutron and X-ray imaging (i.e. tomography).
Finally, a substantial improvement in the image quality is achieved using a de-noising filter
called Inverse Scale Space (ISS) Filtering [122]. A well-tuned ISS Filter does not modify the
structure of the image, yet it removes the image artifacts and noise. If any structure can be
recognized in the image, the filter parameters need to be adjusted [123].
48
For 3D visualization VGStudio MAX 3.1 software is used [124]. This software puts the
slices stacked along the z axis and visualizes it in 3D space by voxel rendering (voxel is a “3D
pixel”). Contrary to 2D radiography, direct information can be obtained on the pointwise
attenuation properties, i.e. implicit material identification can be done based on the grayscale
values. Parts of the objects can be hidden based on their attenuation parameters, or via geometrical
cutting planes, thereby revealing internal heterogeneities.
The amounts of minor components in binary alloys were successfully identified by means
of neutron transmission measurements [33]. Both polychromatic and energy-selective neutron
imaging were carried out on a set of copper binary alloys in order to obtain their neutron cross
sections. The conclusion was that a calibration-based scattering correction is necessary when a
polychromatic beam is used. In the case of velocity-selected neutrons in the absorption domain
there is no need for scattering correction. Reliable quantitative concentration data were obtained
during the transmission measurement of binary alloys. However, it was not possible to distinguish
between Sn and Zn as alloy components besides copper, as their neutron attenuation properties are
similar at these neutron energies. With the combination of transmission imaging and a direct
elemental analysis technique (e.g. XRF), the quantitative information can be supplemented with
qualitative information [33].
Both neutron imaging facilities at BNC: RAD and the NIPS-NORMA were applied in the
present research. NIPS-NORMA is located at the end of the PGAA neutron guide, and fed with
cold neutrons. The RAD station is located next to the reactor, at a thermal neutron beamport of a
radial channel. The NIPS-NORMA facility (see Figure 52 in Appendix) was designed to perform
neutron radiography and tomography on small samples (less than 40×40×40 mm3). This combined
station is able to analyze heterogeneous samples by radiography or tomography driven position-
sensitive local chemical analysis. The RAD station enables the imaging of relatively large objects
by means of thermal neutrons and X-rays, thereby benefiting from the complementary features of
the different radiations. RAD was extended in 2014 with digital imaging and tomographic
capabilities. The image detection is based on suitable scintillator screens. The radiography and
tomography images are acquired by a large-area sCMOS camera. The technical details of the two
imaging facilities at the BNC are published in [100], [119], and a few important characteristics are
summarized in Table 30 (Appendix).
49
4 Experimental results and Discussion
The analysis of metals has always been an important task in our laboratory. In the first
phase of the methodological development it was recognized that the metallic analysis is often
biased with systematic errors. My task was to further improve PGAA or to combine the
conventional PGAA with other techniques to overcome these constraints.
In the first subchapter the methodological development of PGAA is described; first the
improvement in the data library for a better interference correction. Then we changed the counting
efficiency to improve the selectivity for certain elements: 1) with the use of a planar detector which
has good efficiency at low energies only, and 2) with the use of gamma attenuators in front of a
coaxial HPGe, thus suppressing the low energy lines. Then the application of these improvements
is shown.
When combining PGAA with other techniques, an even broader range of objects could be
analyzed. Other techniques used were handheld XRF as the fastest analytical technique available
by us, neutron activation analysis and neutron imaging. With combined techniques, very precious
archaeological objects and material science samples were investigated successfully.
4.1 Methodological developments for the analysis of metals
4.1.1 Improving nuclear data for the interference correction on bronze objects
The analysis of archaeological bronze samples has always been a major task at our
laboratory, though the analyis of metals suffered from the above-mentioned difficulties. On the
other hand PGAA is a suitable tool for this type of samples because of its nondestructivity. During
these analyses a certain systematic error was uncovered. Because of the large need it was decided
to solve this problem.
Copper is the dominant component of bronze, and it has a neutron capture cross section of
3.8 barn (chapter 3.2.2), i.e. it activates strongly. In the spectrum of pure copper, one fifth of the
overall count rate is collected in the two strongest prompt gamma peaks at the energies of 159 keV
and 278 keV. In the alloys of copper, around 70% (for brasses, Cu-Zn alloy) and 90% (for Cu-Sn,
Cu-Sn-Pb or Cu-Pb bronze alloys) of the overall counts are emitted by copper.
A recent publication compared destructive EDXRF and non-destructive techniques on a
flanged axe from Zalaszabar [125]. The object was recovered from a burial place in good
condition; for that reason, it was not chemically treated by the conservators, but was only cleaned
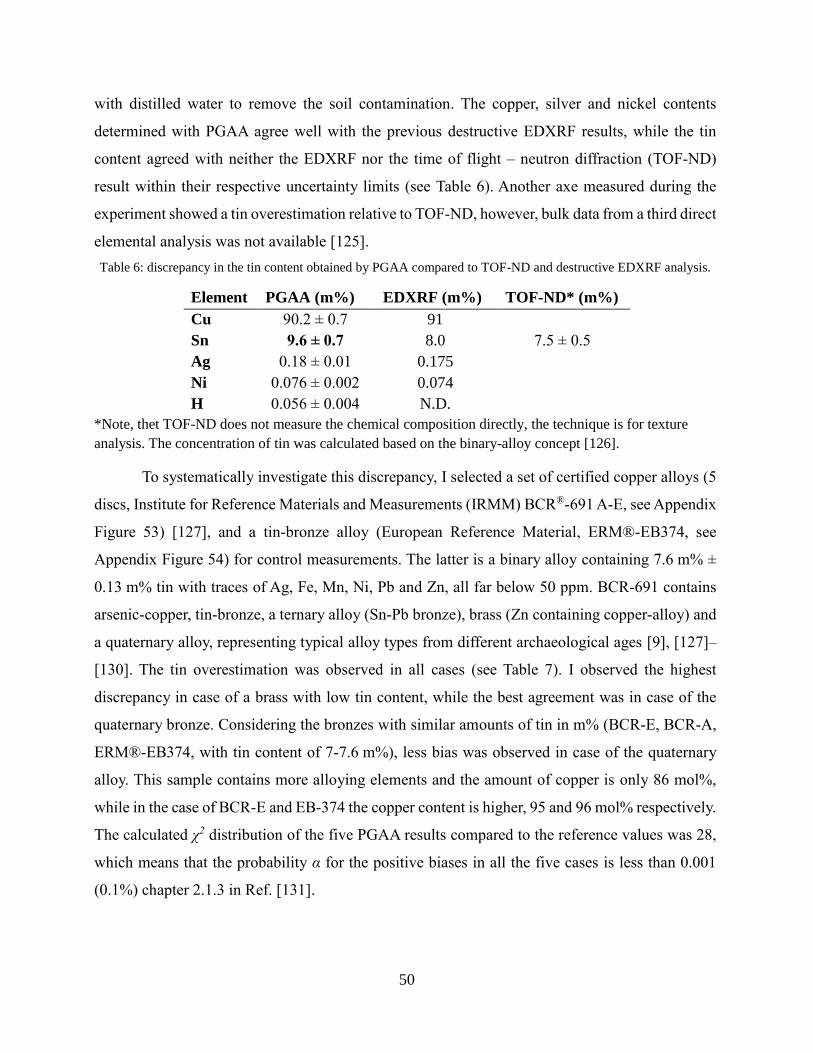
50
with distilled water to remove the soil contamination. The copper, silver and nickel contents
determined with PGAA agree well with the previous destructive EDXRF results, while the tin
content agreed with neither the EDXRF nor the time of flight – neutron diffraction (TOF-ND)
result within their respective uncertainty limits (see Table 6). Another axe measured during the
experiment showed a tin overestimation relative to TOF-ND, however, bulk data from a third direct
elemental analysis was not available [125].
Table 6: discrepancy in the tin content obtained by PGAA compared to TOF-ND and destructive EDXRF analysis.
Element PGAA (m%) EDXRF (m%) TOF-ND* (m%)
Cu 90.2 ± 0.7 91
Sn 9.6 ± 0.7 8.0 7.5 ± 0.5
Ag 0.18 ± 0.01 0.175
Ni 0.076 ± 0.002 0.074
H 0.056 ± 0.004 N.D.
*Note, thet TOF-ND does not measure the chemical composition directly, the technique is for texture
analysis. The concentration of tin was calculated based on the binary-alloy concept [126].
To systematically investigate this discrepancy, I selected a set of certified copper alloys (5
discs, Institute for Reference Materials and Measurements (IRMM) BCR®-691 A-E, see Appendix
Figure 53) [127], and a tin-bronze alloy (European Reference Material, ERM®-EB374, see
Appendix Figure 54) for control measurements. The latter is a binary alloy containing 7.6 m% ±
0.13 m% tin with traces of Ag, Fe, Mn, Ni, Pb and Zn, all far below 50 ppm. BCR-691 contains
arsenic-copper, tin-bronze, a ternary alloy (Sn-Pb bronze), brass (Zn containing copper-alloy) and
a quaternary alloy, representing typical alloy types from different archaeological ages [9], [127]–
[130]. The tin overestimation was observed in all cases (see Table 7). I observed the highest
discrepancy in case of a brass with low tin content, while the best agreement was in case of the
quaternary bronze. Considering the bronzes with similar amounts of tin in m% (BCR-E, BCR-A,
ERM®-EB374, with tin content of 7-7.6 m%), less bias was observed in case of the quaternary
alloy. This sample contains more alloying elements and the amount of copper is only 86 mol%,
while in the case of BCR-E and EB-374 the copper content is higher, 95 and 96 mol% respectively.
The calculated χ2 distribution of the five PGAA results compared to the reference values was 28,
which means that the probability α for the positive biases in all the five cases is less than 0.001
(0.1%) chapter 2.1.3 in Ref. [131].
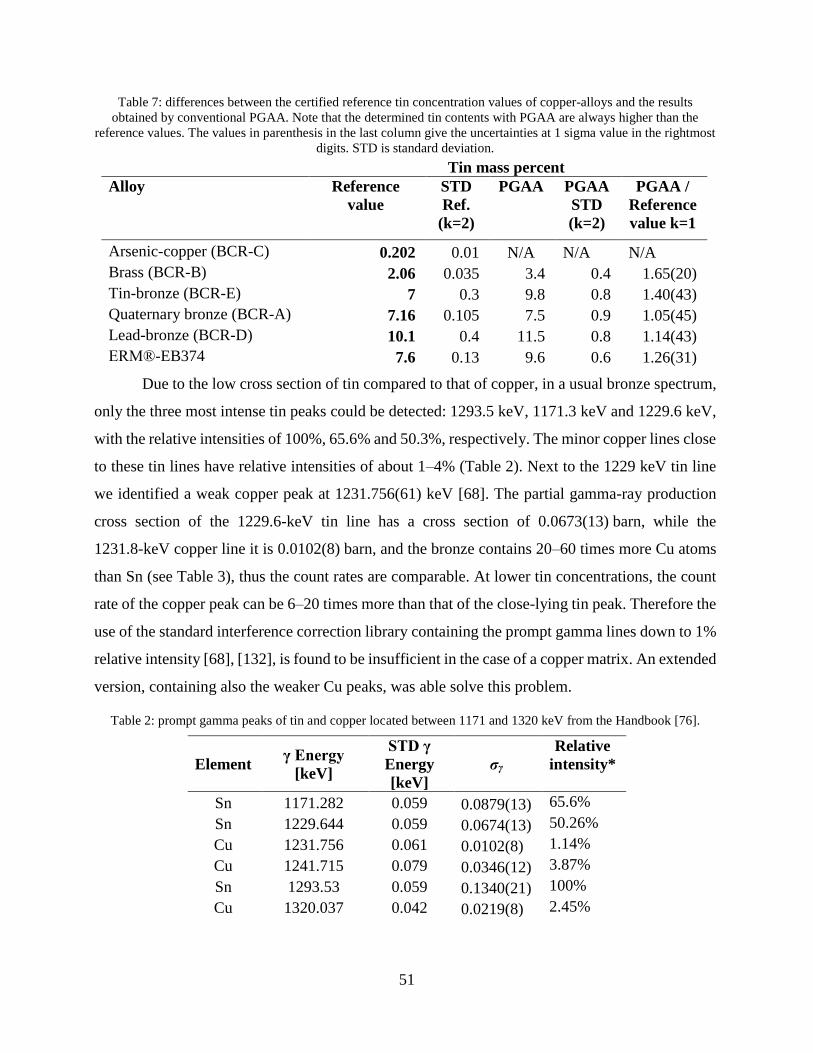
51
Table 7: differences between the certified reference tin concentration values of copper-alloys and the results
obtained by conventional PGAA. Note that the determined tin contents with PGAA are always higher than the
reference values. The values in parenthesis in the last column give the uncertainties at 1 sigma value in the rightmost
digits. STD is standard deviation.
Tin mass percent
Alloy Reference
value
STD
Ref.
(k=2)
PGAA PGAA
STD
(k=2)
PGAA /
Reference
value k=1
Arsenic-copper (BCR-C) 0.202 0.01 N/A N/A N/A
Brass (BCR-B) 2.06 0.035 3.4 0.4 1.65(20)
Tin-bronze (BCR-E) 7 0.3 9.8 0.8 1.40(43)
Quaternary bronze (BCR-A) 7.16 0.105 7.5 0.9 1.05(45)
Lead-bronze (BCR-D) 10.1 0.4 11.5 0.8 1.14(43)
ERM®-EB374 7.6 0.13 9.6 0.6 1.26(31)
Due to the low cross section of tin compared to that of copper, in a usual bronze spectrum,
only the three most intense tin peaks could be detected: 1293.5 keV, 1171.3 keV and 1229.6 keV,
with the relative intensities of 100%, 65.6% and 50.3%, respectively. The minor copper lines close
to these tin lines have relative intensities of about 1–4% (Table 2). Next to the 1229 keV tin line
we identified a weak copper peak at 1231.756(61) keV [68]. The partial gamma-ray production
cross section of the 1229.6-keV tin line has a cross section of 0.0673(13) barn, while the
1231.8-keV copper line it is 0.0102(8) barn, and the bronze contains 20–60 times more Cu atoms
than Sn (see Table 3), thus the count rates are comparable. At lower tin concentrations, the count
rate of the copper peak can be 6–20 times more than that of the close-lying tin peak. Therefore the
use of the standard interference correction library containing the prompt gamma lines down to 1%
relative intensity [68], [132], is found to be insufficient in the case of a copper matrix. An extended
version, containing also the weaker Cu peaks, was able solve this problem.
Table 2: prompt gamma peaks of tin and copper located between 1171 and 1320 keV from the Handbook [76].
Element γ Energy
[keV]
STD γ
Energy
[keV]
σγ
Relative
intensity*
Sn 1171.282 0.059 0.0879(13) 65.6%
Sn 1229.644 0.059 0.0674(13) 50.26%
Cu 1231.756 0.061 0.0102(8) 1.14%
Cu 1241.715 0.079 0.0346(12) 3.87%
Sn 1293.53 0.059 0.1340(21) 100%
Cu 1320.037 0.042 0.0219(8) 2.45%
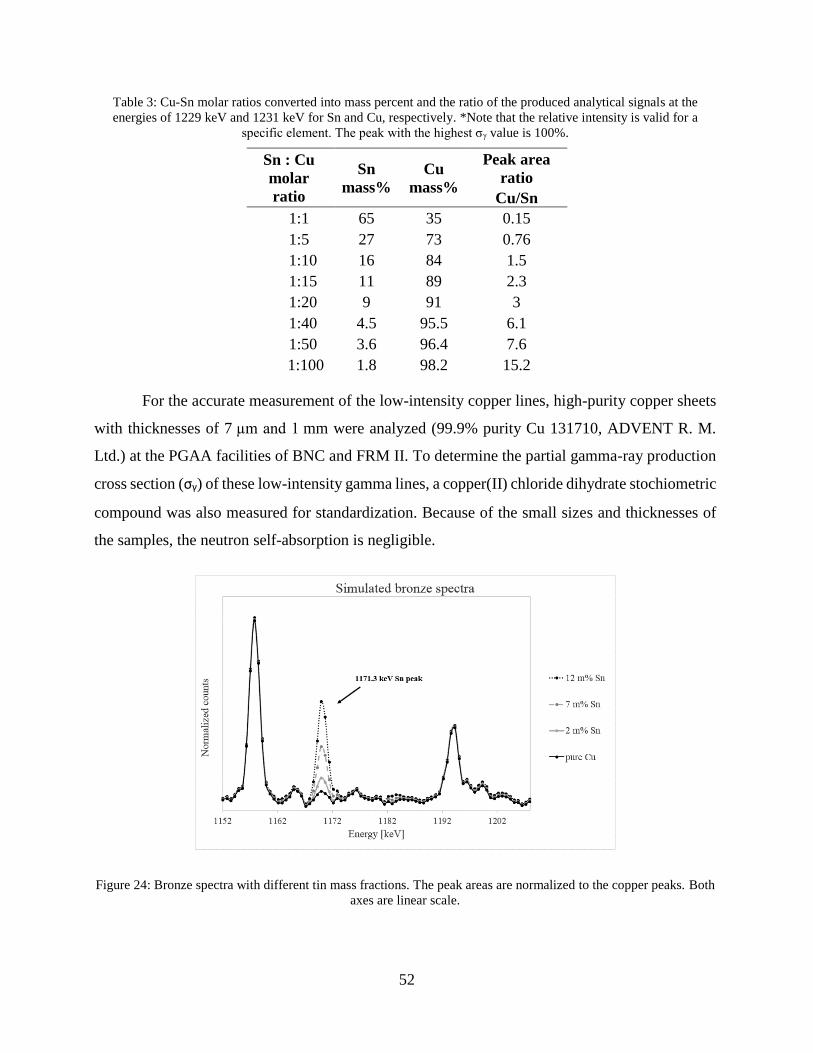
52
Table 3: Cu-Sn molar ratios converted into mass percent and the ratio of the produced analytical signals at the
energies of 1229 keV and 1231 keV for Sn and Cu, respectively. *Note that the relative intensity is valid for a
specific element. The peak with the highest σγ value is 100%.
Sn : Cu
molar
ratio
Sn
mass%
Cu
mass%
Peak area
ratio
Cu/Sn
1:1 65 35 0.15
1:5 27 73 0.76
1:10 16 84 1.5
1:15 11 89 2.3
1:20 9 91 3
1:40 4.5 95.5 6.1
1:50 3.6 96.4 7.6
1:100 1.8 98.2 15.2
For the accurate measurement of the low-intensity copper lines, high-purity copper sheets
with thicknesses of 7 µm and 1 mm were analyzed (99.9% purity Cu 131710, ADVENT R. M.
Ltd.) at the PGAA facilities of BNC and FRM II. To determine the partial gamma-ray production
cross section (σγ) of these low-intensity gamma lines, a copper(II) chloride dihydrate stochiometric
compound was also measured for standardization. Because of the small sizes and thicknesses of
the samples, the neutron self-absorption is negligible.
Figure 24: Bronze spectra with different tin mass fractions. The peak areas are normalized to the copper peaks. Both
axes are linear scale.
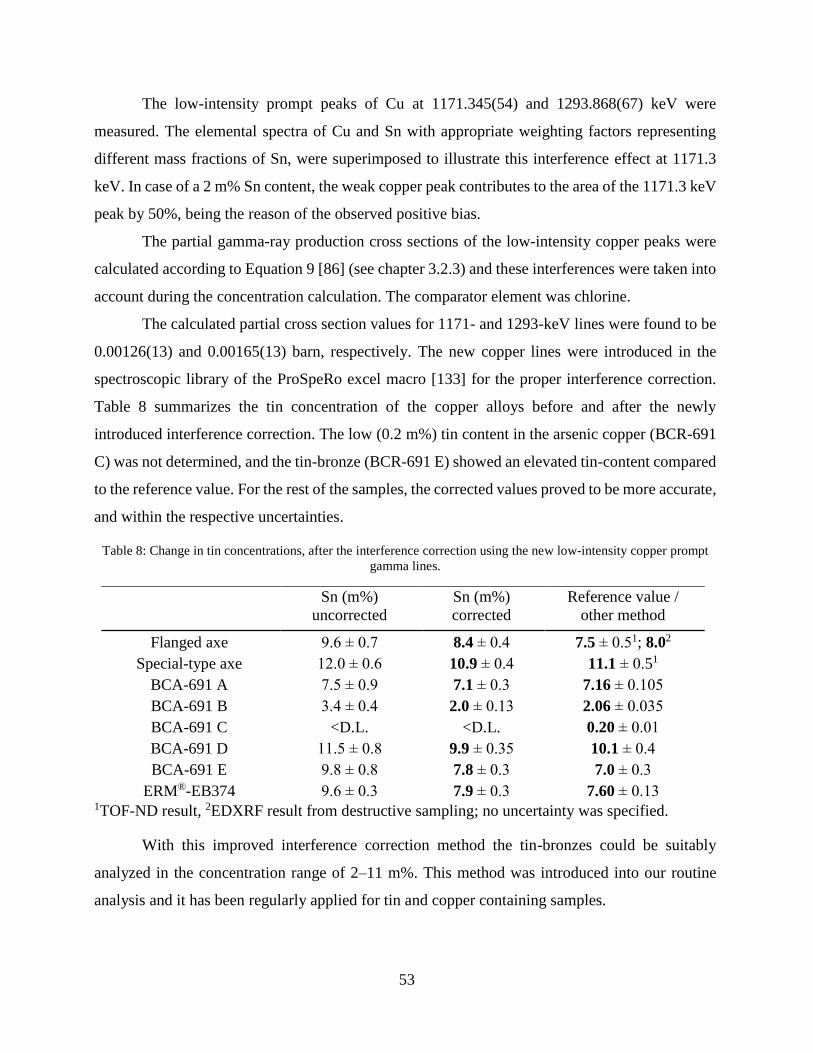
53
The low-intensity prompt peaks of Cu at 1171.345(54) and 1293.868(67) keV were
measured. The elemental spectra of Cu and Sn with appropriate weighting factors representing
different mass fractions of Sn, were superimposed to illustrate this interference effect at 1171.3
keV. In case of a 2 m% Sn content, the weak copper peak contributes to the area of the 1171.3 keV
peak by 50%, being the reason of the observed positive bias.
The partial gamma-ray production cross sections of the low-intensity copper peaks were
calculated according to Equation 9 [86] (see chapter 3.2.3) and these interferences were taken into
account during the concentration calculation. The comparator element was chlorine.
The calculated partial cross section values for 1171- and 1293-keV lines were found to be
0.00126(13) and 0.00165(13) barn, respectively. The new copper lines were introduced in the
spectroscopic library of the ProSpeRo excel macro [133] for the proper interference correction.
Table 8 summarizes the tin concentration of the copper alloys before and after the newly
introduced interference correction. The low (0.2 m%) tin content in the arsenic copper (BCR-691
C) was not determined, and the tin-bronze (BCR-691 E) showed an elevated tin-content compared
to the reference value. For the rest of the samples, the corrected values proved to be more accurate,
and within the respective uncertainties.
Table 8: Change in tin concentrations, after the interference correction using the new low-intensity copper prompt
gamma lines.
Sn (m%)
uncorrected
Sn (m%)
corrected
Reference value /
other method
Flanged axe 9.6 ± 0.7 8.4 ± 0.4 7.5 ± 0.51; 8.02
Special-type axe 12.0 ± 0.6 10.9 ± 0.4 11.1 ± 0.51
BCA-691 A 7.5 ± 0.9 7.1 ± 0.3 7.16 ± 0.105
BCA-691 B 3.4 ± 0.4 2.0 ± 0.13 2.06 ± 0.035
BCA-691 C <D.L. <D.L. 0.20 ± 0.01
BCA-691 D 11.5 ± 0.8 9.9 ± 0.35 10.1 ± 0.4
BCA-691 E 9.8 ± 0.8 7.8 ± 0.3 7.0 ± 0.3
ERM®-EB374 9.6 ± 0.3 7.9 ± 0.3 7.60 ± 0.13 1TOF-ND result, 2EDXRF result from destructive sampling; no uncertainty was specified.
With this improved interference correction method the tin-bronzes could be suitably
analyzed in the concentration range of 2–11 m%. This method was introduced into our routine
analysis and it has been regularly applied for tin and copper containing samples.
54
4.1.2 Improving the selectivity of PGAA with a high-resolution germanium detector
In the everyday practice, HPGe detectors are used for PGAA analysis, with high relative
efficiencies (from 15% up to about 60%). As was introduced earlier in chapter 3.2.2, in the analysis
of metals, the quality of the prompt gamma spectrum can become worse due to the peak-shape
distortion caused by a high overall count rate or by interfering multiplets. To achieve the goals (2)
and (3) presented in chapter 2, I worked out different detection strategies. A high-resolution planar
germanium detector (LEGe) was installed in addition to or instead of our 25% HPGe detector used
in the conventional PGAA analysis, to improve the energy-resolution of the low-energy part of the
gamma spectrum.
At first, the test-setup was installed at the PGAA station of the Budapest Research Reactor
[134]. The standard PGAA setup (Canberra GR2718/S n-type coaxial HPGe, 27% relative
efficiency, with Compton suppression) was extended with our low-energy germanium detector
(Canberra GL 1015 LEGe, 15 cm3 active volume) placed at the opposite side of the sample
chamber, inside 10-15 cm of lead shielding. The CAD images of the measurement geometries are
shown in Figure 25 a). The distances of the 27% HPGe and the LEGe detectors from the beam center
were 235 mm and 122 mm, respectively. In this geometry the goal was to achieve higher full-
energy peak efficiency with the LEGe detector than with the coaxial Ge, at least at the low energies.
To achieve comparable background conditions to the conventional coaxial HPGe detectors,
in the second sets of experiments the LEGe detector was placed into the BGO Compton suppressor
of the NIPS-NORMA station (originally operating with a Canberra GR2318/S n-type coaxial
HPGe, 23%) [100], and the experiments were repeated on the same samples (for the CAD image
of the setup, see Figure 25 b). Due to geometrical incompatibilities the sample-to-detector distance
had to be increased to 313 mm from the sample for the LEGe detector instead of the usual 268 mm
that is valid for the conventional NIPS-NORMA setup. This second experiment allowed the
assessment of the other analytic parameters, such as detection limits and signal-to-background
ratios. The LEGe detector’s acquisition systems were set up to cover the 10-2500 keV energy
range, whereas the HPGe detector was used to detect photons from 45 keV up to 11 MeV.
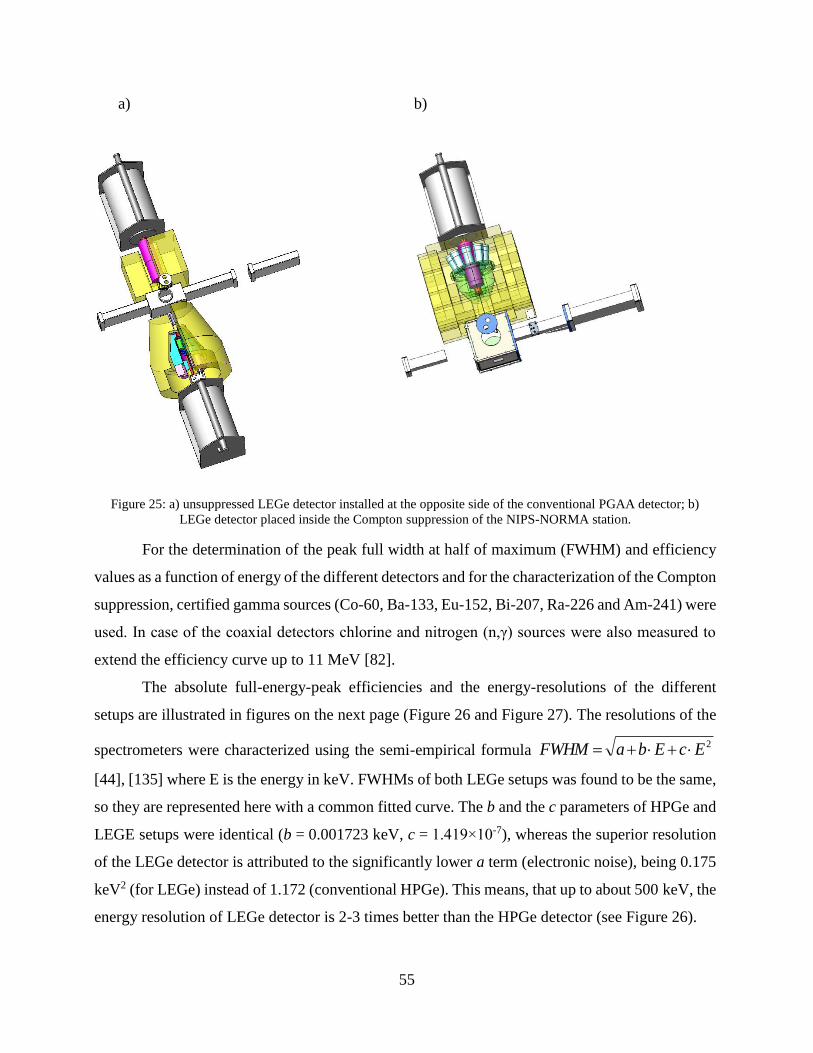
55
a)
b)
Figure 25: a) unsuppressed LEGe detector installed at the opposite side of the conventional PGAA detector; b)
LEGe detector placed inside the Compton suppression of the NIPS-NORMA station.
For the determination of the peak full width at half of maximum (FWHM) and efficiency
values as a function of energy of the different detectors and for the characterization of the Compton
suppression, certified gamma sources (Co-60, Ba-133, Eu-152, Bi-207, Ra-226 and Am-241) were
used. In case of the coaxial detectors chlorine and nitrogen (n,γ) sources were also measured to
extend the efficiency curve up to 11 MeV [82].
The absolute full-energy-peak efficiencies and the energy-resolutions of the different
setups are illustrated in figures on the next page (Figure 26 and Figure 27). The resolutions of the
spectrometers were characterized using the semi-empirical formula 2EcEbaFWHM ++=
[44], [135] where E is the energy in keV. FWHMs of both LEGe setups was found to be the same,
so they are represented here with a common fitted curve. The b and the c parameters of HPGe and
LEGE setups were identical (b = 0.001723 keV, c = 1.419×10⁻⁷), whereas the superior resolution
of the LEGe detector is attributed to the significantly lower a term (electronic noise), being 0.175
keV2 (for LEGe) instead of 1.172 (conventional HPGe). This means, that up to about 500 keV, the
energy resolution of LEGe detector is 2-3 times better than the HPGe detector (see Figure 26).
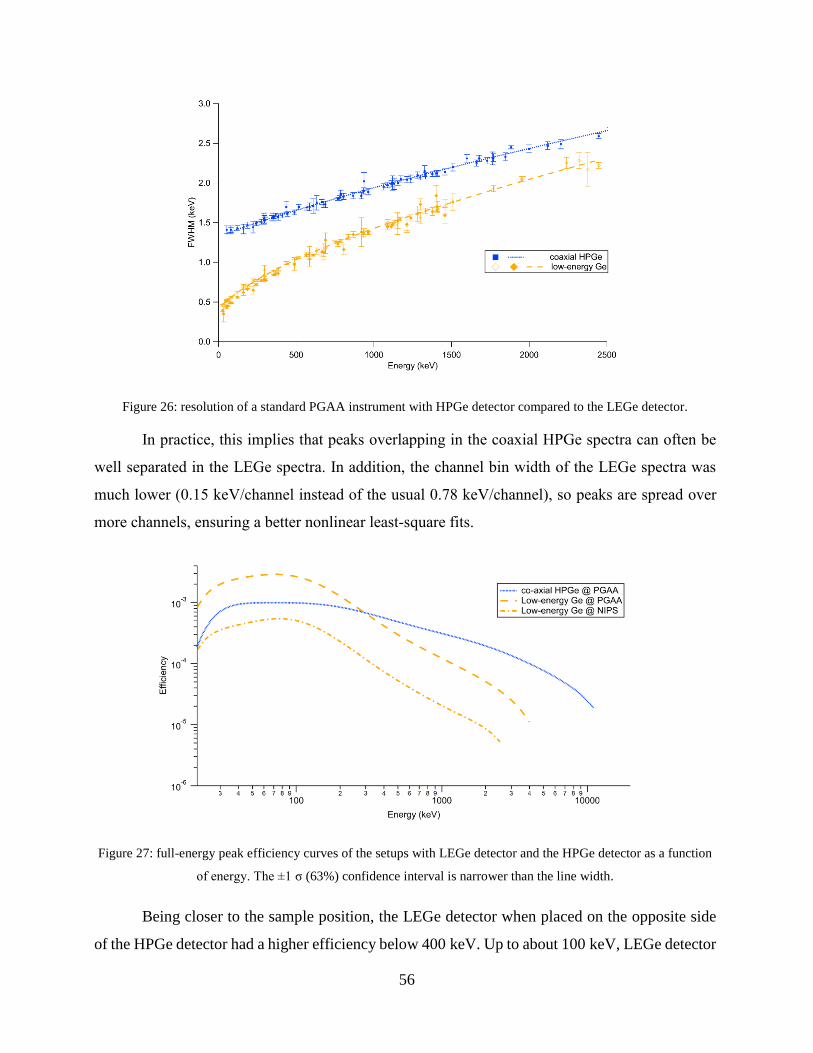
56
Figure 26: resolution of a standard PGAA instrument with HPGe detector compared to the LEGe detector.
In practice, this implies that peaks overlapping in the coaxial HPGe spectra can often be
well separated in the LEGe spectra. In addition, the channel bin width of the LEGe spectra was
much lower (0.15 keV/channel instead of the usual 0.78 keV/channel), so peaks are spread over
more channels, ensuring a better nonlinear least-square fits.
Figure 27: full-energy peak efficiency curves of the setups with LEGe detector and the HPGe detector as a function
of energy. The ±1 σ (63%) confidence interval is narrower than the line width.
Being closer to the sample position, the LEGe detector when placed on the opposite side
of the HPGe detector had a higher efficiency below 400 keV. Up to about 100 keV, LEGe detector
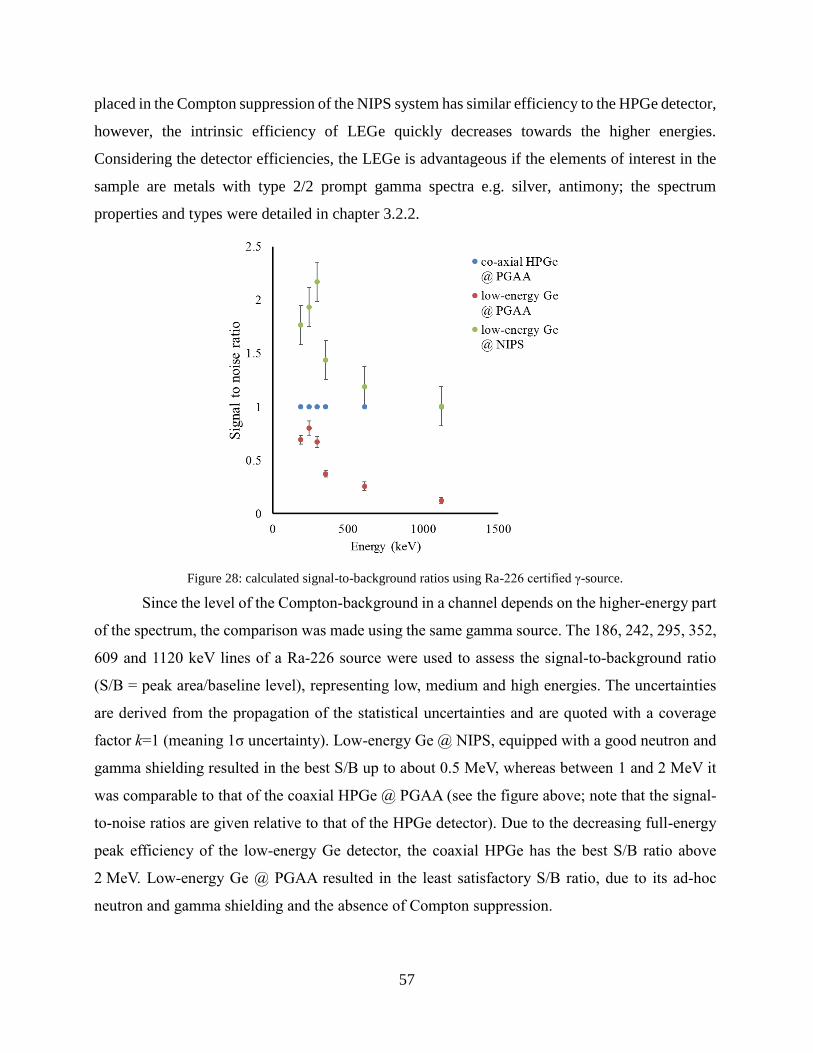
57
placed in the Compton suppression of the NIPS system has similar efficiency to the HPGe detector,
however, the intrinsic efficiency of LEGe quickly decreases towards the higher energies.
Considering the detector efficiencies, the LEGe is advantageous if the elements of interest in the
sample are metals with type 2/2 prompt gamma spectra e.g. silver, antimony; the spectrum
properties and types were detailed in chapter 3.2.2.
Figure 28: calculated signal-to-background ratios using Ra-226 certified γ-source.
Since the level of the Compton-background in a channel depends on the higher-energy part
of the spectrum, the comparison was made using the same gamma source. The 186, 242, 295, 352,
609 and 1120 keV lines of a Ra-226 source were used to assess the signal-to-background ratio
(S/B = peak area/baseline level), representing low, medium and high energies. The uncertainties
are derived from the propagation of the statistical uncertainties and are quoted with a coverage
factor k=1 (meaning 1σ uncertainty). Low-energy Ge @ NIPS, equipped with a good neutron and
gamma shielding resulted in the best S/B up to about 0.5 MeV, whereas between 1 and 2 MeV it
was comparable to that of the coaxial HPGe @ PGAA (see the figure above; note that the signal-
to-noise ratios are given relative to that of the HPGe detector). Due to the decreasing full-energy
peak efficiency of the low-energy Ge detector, the coaxial HPGe has the best S/B ratio above
2 MeV. Low-energy Ge @ PGAA resulted in the least satisfactory S/B ratio, due to its ad-hoc
neutron and gamma shielding and the absence of Compton suppression.
58
Due to distorted peak shapes of high count-rate peaks and the complex multiplets, the fit
of spectra from coaxial detectors might be labor-intensive. If large peaks are fitted with a poor χ2,
the uncertainties of the peak areas do not reach the statistically expected values. The peak shapes
of the spectra collected with a LEGe detector are fairly symmetric even at higher count rates.
Therefore, with low-energy Ge detector even if fewer counts were collected, often a better
spectrum evaluation resulted in lower uncertainties.
The advantages of the LEGe setups using real samples [136], representing the main scopes
of our analytical practice [137], i.e. chemistry (noble-metal containing catalysts [138], [139]),
cultural heritage science (ancient silver coins [140]), and material science (ternary Co-Cr-Re alloys
[141]) will be detailed later in chapter 4.2.1.
4.1.3 Application of a low-energy gamma attenuator
A gamma-ray attenuator layer between the sample and the detector was successfully used
in the analysis of chemical compounds with high boron content [142], in parallel and
independently from the present experiments. Boron has a single, intense, broad peak at 477.6 keV
from the 10B(n,,)7Li reaction with a high neutron capture cross section. This peak energy can be
regarded as relatively low in PGAA. The analytical sensitivities of the other elements in its
chemical compounds are orders of magnitude less, therefore the quantification of the other
components is difficult even at 1:1 atomic ratio. A lead gamma-ray attenuator with a thickness of
10 mm was found to be the best choice for the efficient suppression of low-energy gamma photons
from boron, thereby decreasing the systematic error due to the random coincidence summing at
high count rates. The analysis of chemical compounds with high amounts of boron was possible
with 1-2% relative uncertainty [142]. It was tested on peaks other than boron only for a pilot
experiment. [143]
Lead is an important alloy component e.g. in ancient bronzes as it improves the casting
properties of copper and decreases the melting temperature even in small amounts [128]. Lead is
poorly soluble in the copper-matrix [128], [144]. Thus, after the casting followed by the cooling
stage it segregates in the alloy. The size of these lead-rich inclusions is dependent on the total
amount of lead and the cooling speed, but they can exceed several tens-, or hundreds of
micrometers. When applying micro-beam methods (e.g. µXRF, µPIXE), or in micro-destructive
and destructive methods with a small amount (~10 mg or less) of sample, the results may not be
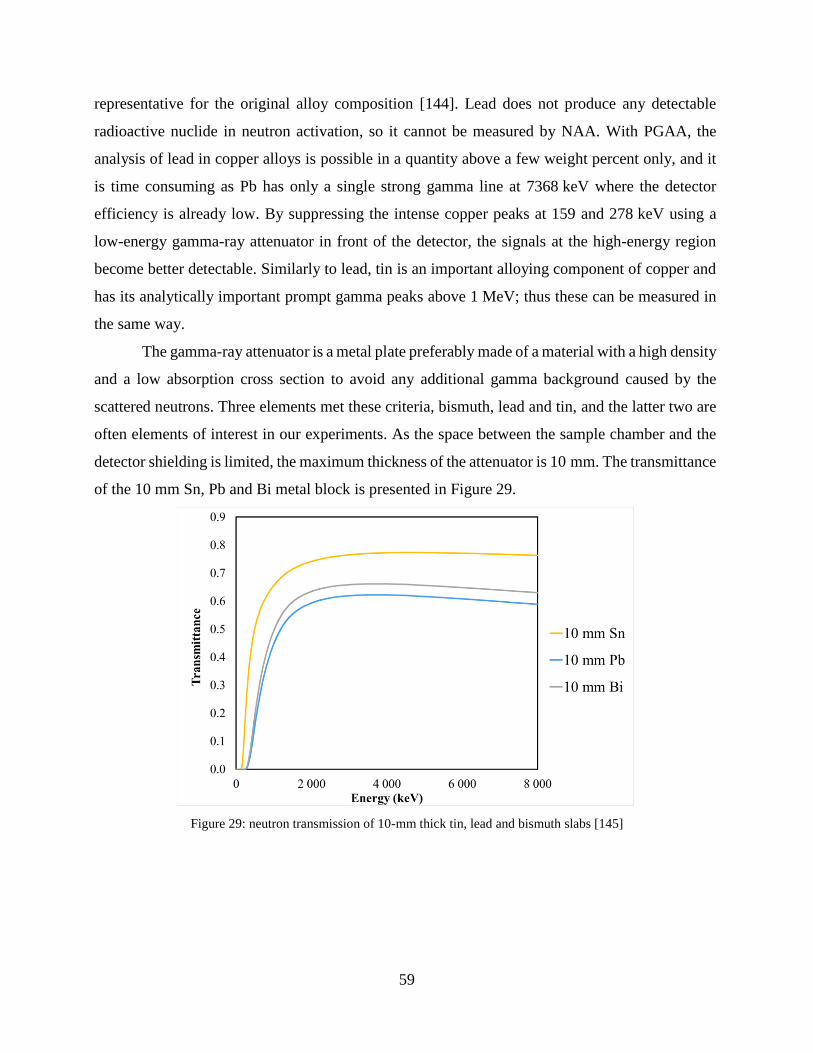
59
representative for the original alloy composition [144]. Lead does not produce any detectable
radioactive nuclide in neutron activation, so it cannot be measured by NAA. With PGAA, the
analysis of lead in copper alloys is possible in a quantity above a few weight percent only, and it
is time consuming as Pb has only a single strong gamma line at 7368 keV where the detector
efficiency is already low. By suppressing the intense copper peaks at 159 and 278 keV using a
low-energy gamma-ray attenuator in front of the detector, the signals at the high-energy region
become better detectable. Similarly to lead, tin is an important alloying component of copper and
has its analytically important prompt gamma peaks above 1 MeV; thus these can be measured in
the same way.
The gamma-ray attenuator is a metal plate preferably made of a material with a high density
and a low absorption cross section to avoid any additional gamma background caused by the
scattered neutrons. Three elements met these criteria, bismuth, lead and tin, and the latter two are
often elements of interest in our experiments. As the space between the sample chamber and the
detector shielding is limited, the maximum thickness of the attenuator is 10 mm. The transmittance
of the 10 mm Sn, Pb and Bi metal block is presented in Figure 29.
Figure 29: neutron transmission of 10-mm thick tin, lead and bismuth slabs [145]
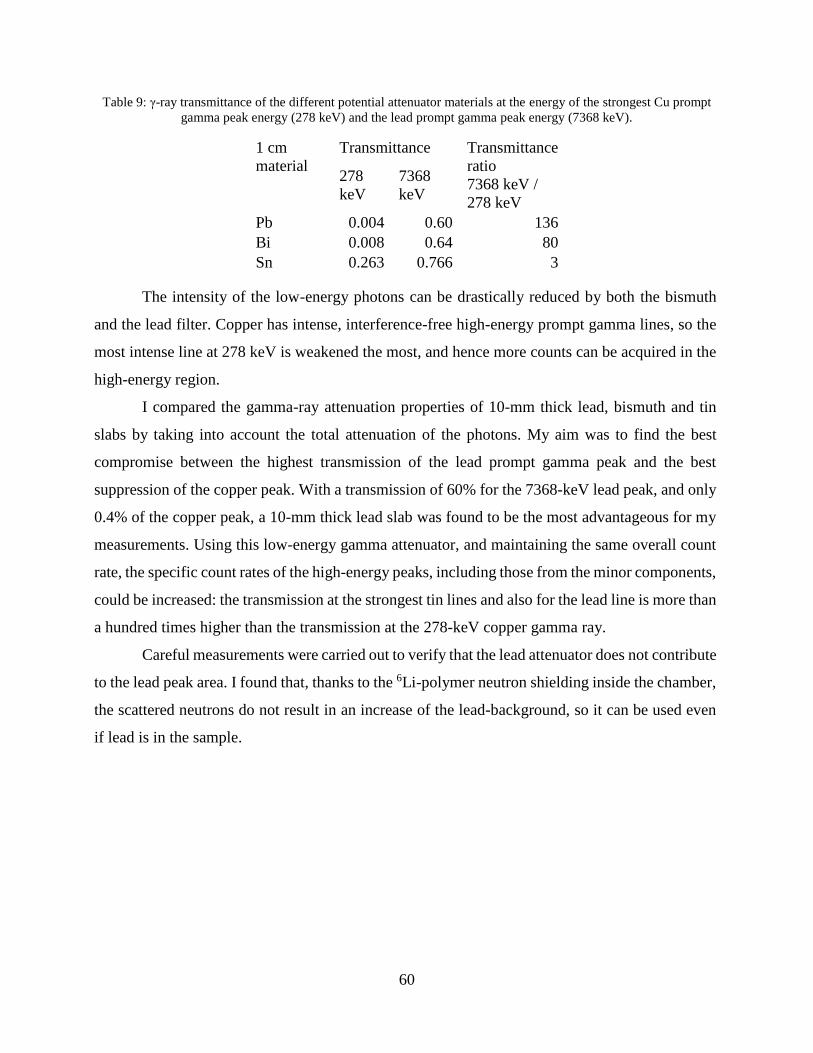
60
Table 9: γ-ray transmittance of the different potential attenuator materials at the energy of the strongest Cu prompt
gamma peak energy (278 keV) and the lead prompt gamma peak energy (7368 keV).
1 cm
material
Transmittance Transmittance
ratio
7368 keV /
278 keV
278
keV
7368
keV
Pb 0.004 0.60 136
Bi 0.008 0.64 80
Sn 0.263 0.766 3
The intensity of the low-energy photons can be drastically reduced by both the bismuth
and the lead filter. Copper has intense, interference-free high-energy prompt gamma lines, so the
most intense line at 278 keV is weakened the most, and hence more counts can be acquired in the
high-energy region.
I compared the gamma-ray attenuation properties of 10-mm thick lead, bismuth and tin
slabs by taking into account the total attenuation of the photons. My aim was to find the best
compromise between the highest transmission of the lead prompt gamma peak and the best
suppression of the copper peak. With a transmission of 60% for the 7368-keV lead peak, and only
0.4% of the copper peak, a 10-mm thick lead slab was found to be the most advantageous for my
measurements. Using this low-energy gamma attenuator, and maintaining the same overall count
rate, the specific count rates of the high-energy peaks, including those from the minor components,
could be increased: the transmission at the strongest tin lines and also for the lead line is more than
a hundred times higher than the transmission at the 278-keV copper gamma ray.
Careful measurements were carried out to verify that the lead attenuator does not contribute
to the lead peak area. I found that, thanks to the 6Li-polymer neutron shielding inside the chamber,
the scattered neutrons do not result in an increase of the lead-background, so it can be used even
if lead is in the sample.
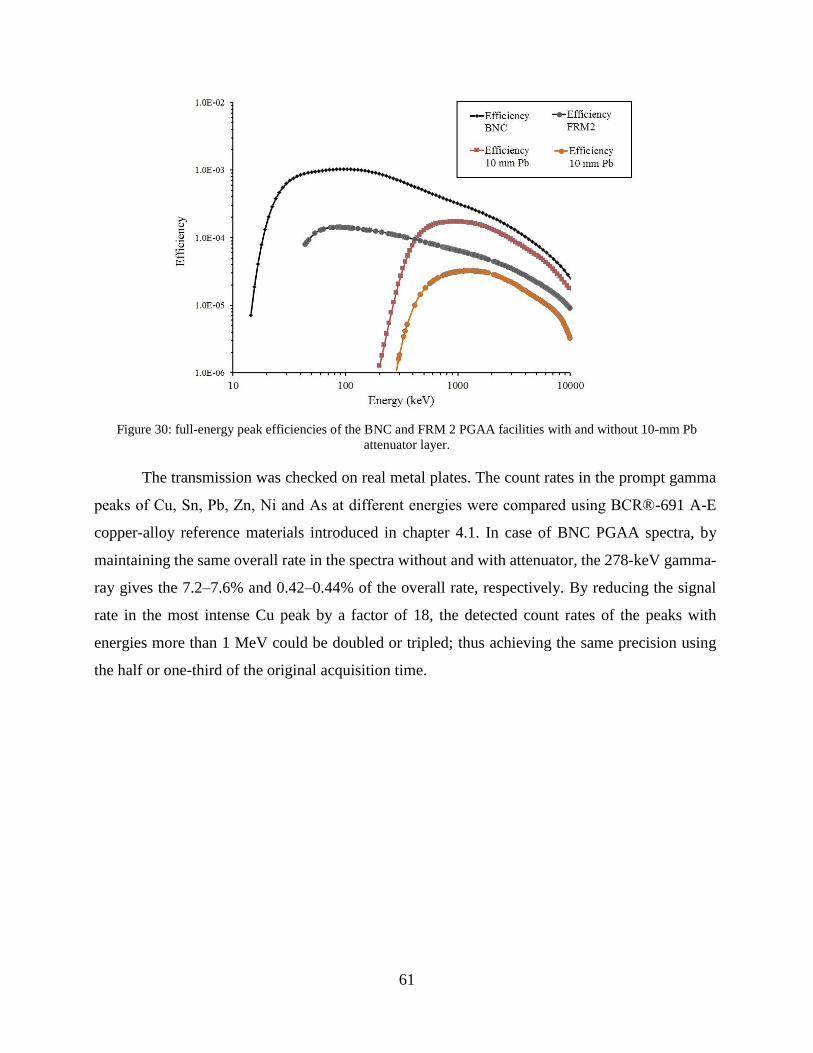
61
Figure 30: full-energy peak efficiencies of the BNC and FRM 2 PGAA facilities with and without 10-mm Pb
attenuator layer.
The transmission was checked on real metal plates. The count rates in the prompt gamma
peaks of Cu, Sn, Pb, Zn, Ni and As at different energies were compared using BCR®-691 A-E
copper-alloy reference materials introduced in chapter 4.1. In case of BNC PGAA spectra, by
maintaining the same overall rate in the spectra without and with attenuator, the 278-keV gamma-
ray gives the 7.2–7.6% and 0.42–0.44% of the overall rate, respectively. By reducing the signal
rate in the most intense Cu peak by a factor of 18, the detected count rates of the peaks with
energies more than 1 MeV could be doubled or tripled; thus achieving the same precision using
the half or one-third of the original acquisition time.
62
4.2 Applications in the analytical practice
4.2.1 Measurements with a high-resolution planar Ge detector
In the following cases the spectra proved to be always very complicated below 1 MeV.
Hence, we used the planar detector which has much better resolution at low energies.
4.2.1.1 Quality control of bimetallic Au-Ag supported catalysts
Since 2002 many different catalysts have been analyzed in our laboratory [146]. Now, the
task was to determine the bulk Ag and Au content of SiO2-supported bimetallic catalysts [147]. To
fulfill this aim, I used PGAA for quality control to complement the surface methods (UV-VIS
spectroscopy and XRF) used in the study. The nominal compositions were 10/90, 20/80, 33/67,
and 50/50 Ag/Au molar ratios, and their macroscopic structures and catalytic activities were studied
in a glucose oxidation reaction.
The prompt gamma spectra of Au and Ag are both extremely complex at low energies. They
have many interfering peaks and the measurements must be long because of the high Compton
scattering baseline. Because of the interferences and the complex background, the chance of a
systematic error in peak fitting is rather high. The 117-keV peak of silver and 97-keV peak of gold
do not interfere with the peaks of each other. Because of their low energy, these peaks alone cannot
be used for concentration calculation, as these might be affected by the self-absorption of the
sample itself. The strongest Ag lines at 198.7 and 235.6 keV are affected by the close-lying Au
peaks. In the region of 185–237 keV, Au and Ag have 3 and 14 prompt gamma lines respectively
with more than 0.2 barn partial gamma-ray production cross sections [76]. In Hypermet PC which
we apply for peak fitting, the maximum number of peaks in a region is limited by 10 [148]. The
selection of the start and end channel of the fitted region is often difficult because of the large
number of peaks. Thus, the spectrum fitting procedure is labour-intensive.
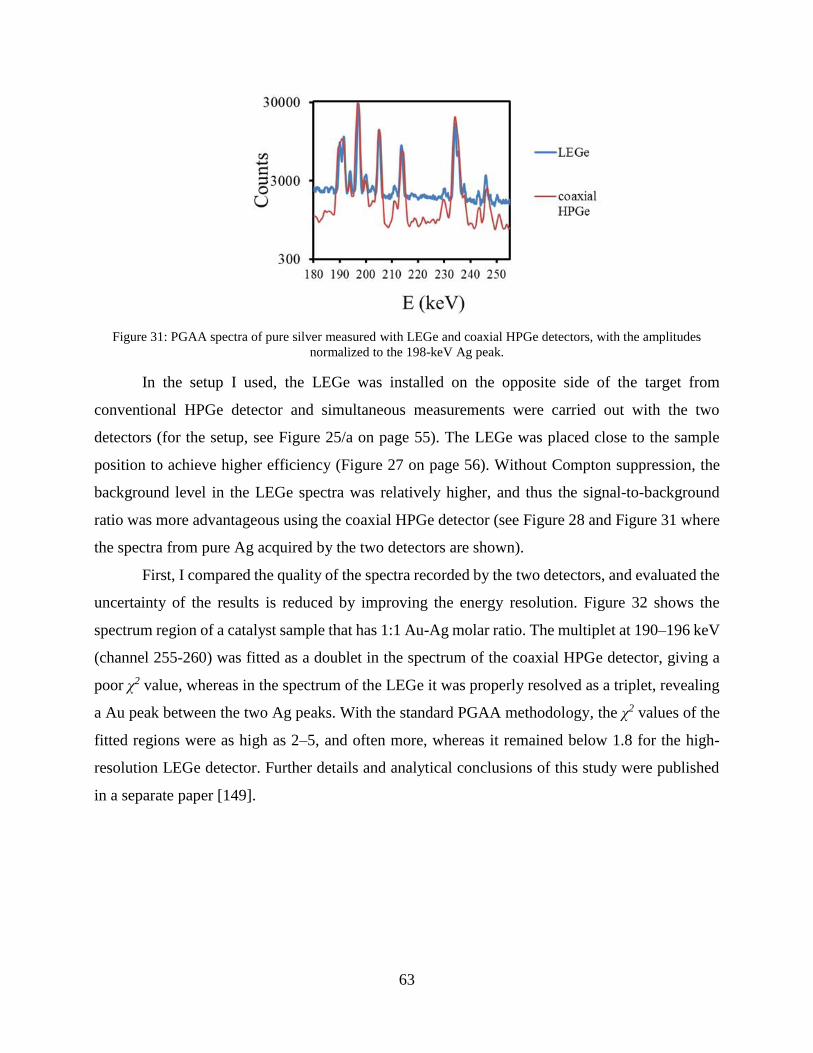
63
Figure 31: PGAA spectra of pure silver measured with LEGe and coaxial HPGe detectors, with the amplitudes
normalized to the 198-keV Ag peak.
In the setup I used, the LEGe was installed on the opposite side of the target from
conventional HPGe detector and simultaneous measurements were carried out with the two
detectors (for the setup, see Figure 25/a on page 55). The LEGe was placed close to the sample
position to achieve higher efficiency (Figure 27 on page 56). Without Compton suppression, the
background level in the LEGe spectra was relatively higher, and thus the signal-to-background
ratio was more advantageous using the coaxial HPGe detector (see Figure 28 and Figure 31 where
the spectra from pure Ag acquired by the two detectors are shown).
First, I compared the quality of the spectra recorded by the two detectors, and evaluated the
uncertainty of the results is reduced by improving the energy resolution. Figure 32 shows the
spectrum region of a catalyst sample that has 1:1 Au-Ag molar ratio. The multiplet at 190–196 keV
(channel 255-260) was fitted as a doublet in the spectrum of the coaxial HPGe detector, giving a
poor χ2 value, whereas in the spectrum of the LEGe it was properly resolved as a triplet, revealing
a Au peak between the two Ag peaks. With the standard PGAA methodology, the χ2 values of the
fitted regions were as high as 2–5, and often more, whereas it remained below 1.8 for the high-
resolution LEGe detector. Further details and analytical conclusions of this study were published
in a separate paper [149].
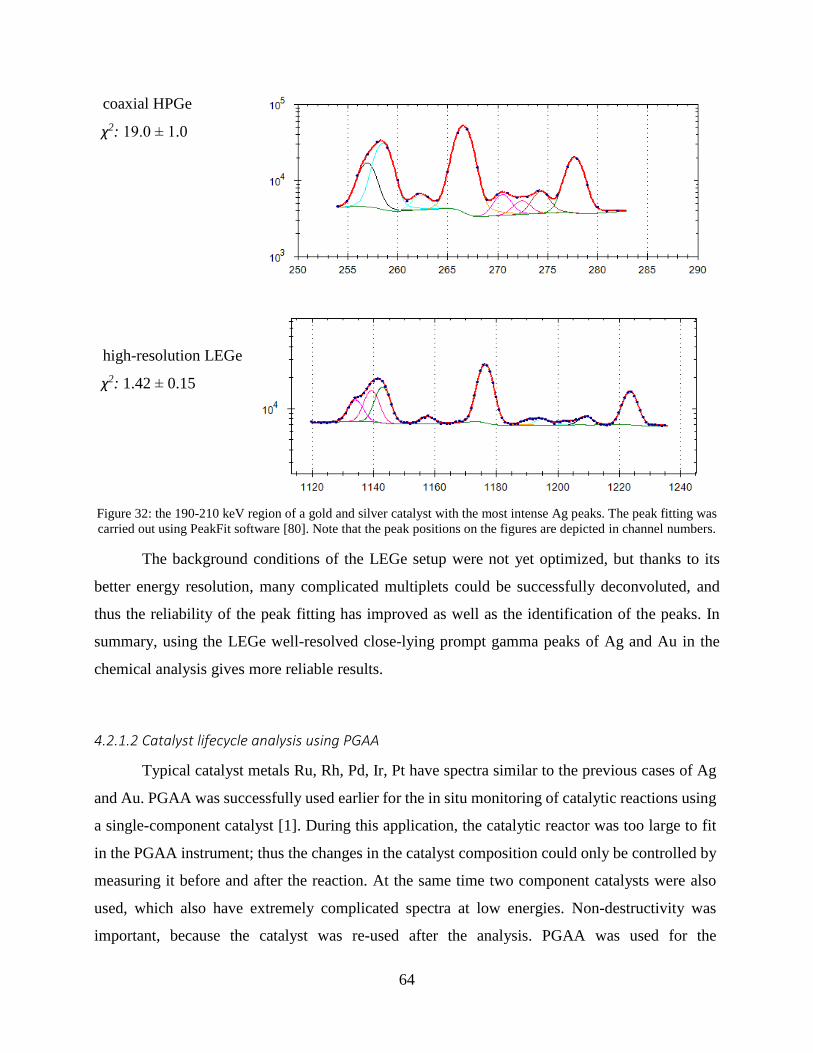
64
coaxial HPGe
χ2: 19.0 ± 1.0
high-resolution LEGe
χ2: 1.42 ± 0.15
Figure 32: the 190-210 keV region of a gold and silver catalyst with the most intense Ag peaks. The peak fitting was
carried out using PeakFit software [80]. Note that the peak positions on the figures are depicted in channel numbers.
The background conditions of the LEGe setup were not yet optimized, but thanks to its
better energy resolution, many complicated multiplets could be successfully deconvoluted, and
thus the reliability of the peak fitting has improved as well as the identification of the peaks. In
summary, using the LEGe well-resolved close-lying prompt gamma peaks of Ag and Au in the
chemical analysis gives more reliable results.
4.2.1.2 Catalyst lifecycle analysis using PGAA
Typical catalyst metals Ru, Rh, Pd, Ir, Pt have spectra similar to the previous cases of Ag
and Au. PGAA was successfully used earlier for the in situ monitoring of catalytic reactions using
a single-component catalyst [1]. During this application, the catalytic reactor was too large to fit
in the PGAA instrument; thus the changes in the catalyst composition could only be controlled by
measuring it before and after the reaction. At the same time two component catalysts were also
used, which also have extremely complicated spectra at low energies. Non-destructivity was
important, because the catalyst was re-used after the analysis. PGAA was used for the
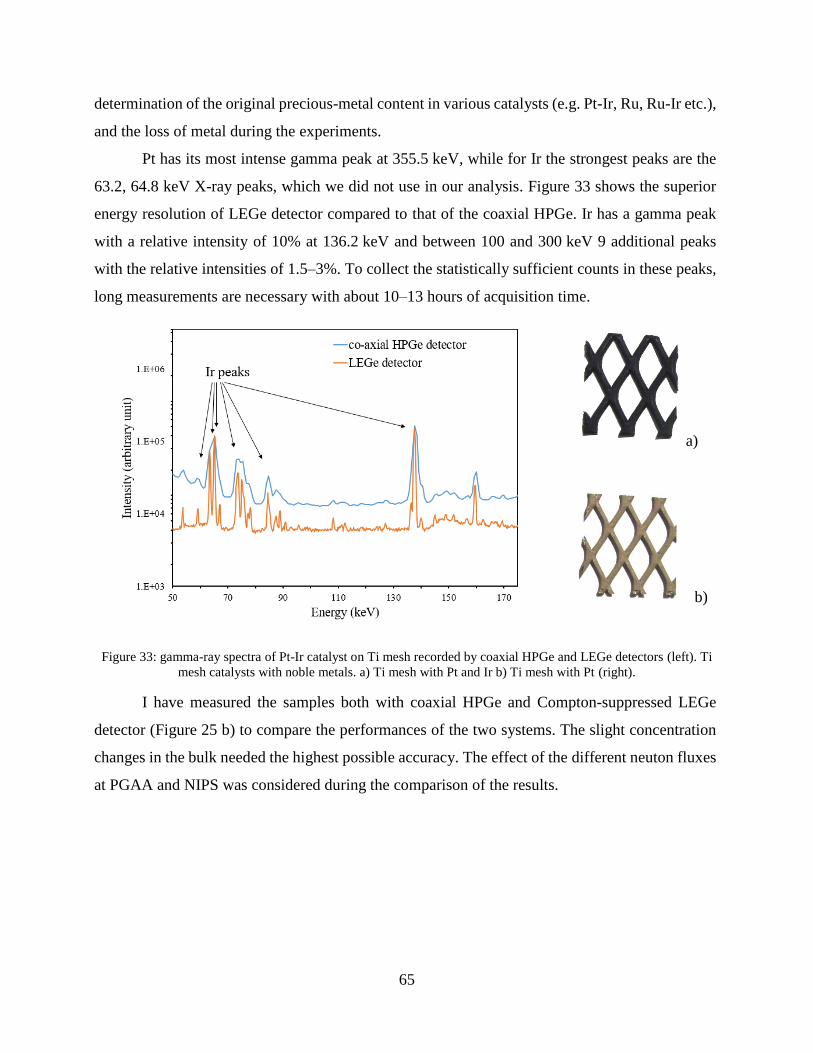
65
determination of the original precious-metal content in various catalysts (e.g. Pt-Ir, Ru, Ru-Ir etc.),
and the loss of metal during the experiments.
Pt has its most intense gamma peak at 355.5 keV, while for Ir the strongest peaks are the
63.2, 64.8 keV X-ray peaks, which we did not use in our analysis. Figure 33 shows the superior
energy resolution of LEGe detector compared to that of the coaxial HPGe. Ir has a gamma peak
with a relative intensity of 10% at 136.2 keV and between 100 and 300 keV 9 additional peaks
with the relative intensities of 1.5–3%. To collect the statistically sufficient counts in these peaks,
long measurements are necessary with about 10–13 hours of acquisition time.
a)
b)
Figure 33: gamma-ray spectra of Pt-Ir catalyst on Ti mesh recorded by coaxial HPGe and LEGe detectors (left). Ti
mesh catalysts with noble metals. a) Ti mesh with Pt and Ir b) Ti mesh with Pt (right).
I have measured the samples both with coaxial HPGe and Compton-suppressed LEGe
detector (Figure 25 b) to compare the performances of the two systems. The slight concentration
changes in the bulk needed the highest possible accuracy. The effect of the different neuton fluxes
at PGAA and NIPS was considered during the comparison of the results.
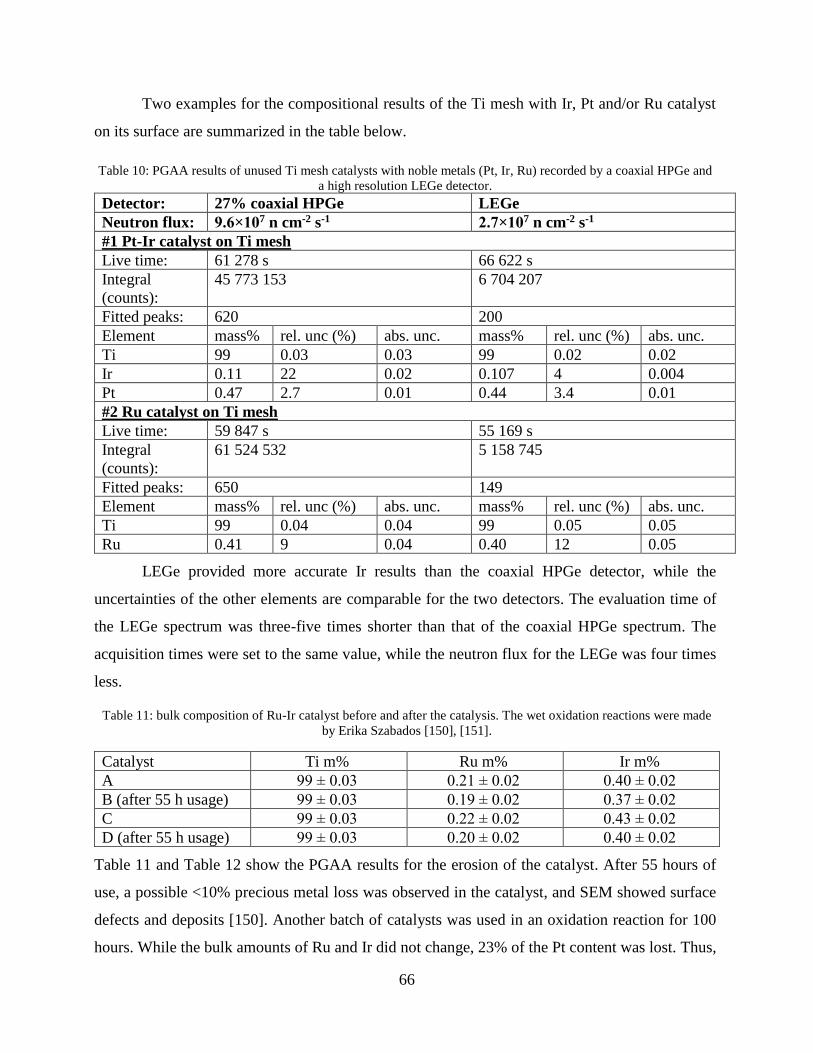
66
Two examples for the compositional results of the Ti mesh with Ir, Pt and/or Ru catalyst
on its surface are summarized in the table below.
Table 10: PGAA results of unused Ti mesh catalysts with noble metals (Pt, Ir, Ru) recorded by a coaxial HPGe and
a high resolution LEGe detector.
Detector: 27% coaxial HPGe LEGe
Neutron flux: 9.6×10⁷ n cm-2 s-1 2.7×10⁷ n cm-2 s-1
#1 Pt-Ir catalyst on Ti mesh
Live time: 61 278 s 66 622 s
Integral
(counts):
45 773 153 6 704 207
Fitted peaks: 620 200
Element mass% rel. unc (%) abs. unc. mass% rel. unc (%) abs. unc.
Ti 99 0.03 0.03 99 0.02 0.02
Ir 0.11 22 0.02 0.107 4 0.004
Pt 0.47 2.7 0.01 0.44 3.4 0.01
#2 Ru catalyst on Ti mesh
Live time: 59 847 s 55 169 s
Integral
(counts):
61 524 532 5 158 745
Fitted peaks: 650 149
Element mass% rel. unc (%) abs. unc. mass% rel. unc (%) abs. unc.
Ti 99 0.04 0.04 99 0.05 0.05
Ru 0.41 9 0.04 0.40 12 0.05
LEGe provided more accurate Ir results than the coaxial HPGe detector, while the
uncertainties of the other elements are comparable for the two detectors. The evaluation time of
the LEGe spectrum was three-five times shorter than that of the coaxial HPGe spectrum. The
acquisition times were set to the same value, while the neutron flux for the LEGe was four times
less.
Table 11: bulk composition of Ru-Ir catalyst before and after the catalysis. The wet oxidation reactions were made
by Erika Szabados [150], [151].
Catalyst Ti m% Ru m% Ir m%
A 99 ± 0.03 0.21 ± 0.02 0.40 ± 0.02
B (after 55 h usage) 99 ± 0.03 0.19 ± 0.02 0.37 ± 0.02
C 99 ± 0.03 0.22 ± 0.02 0.43 ± 0.02
D (after 55 h usage) 99 ± 0.03 0.20 ± 0.02 0.40 ± 0.02
Table 11 and Table 12 show the PGAA results for the erosion of the catalyst. After 55 hours of
use, a possible <10% precious metal loss was observed in the catalyst, and SEM showed surface
defects and deposits [150]. Another batch of catalysts was used in an oxidation reaction for 100
hours. While the bulk amounts of Ru and Ir did not change, 23% of the Pt content was lost. Thus,
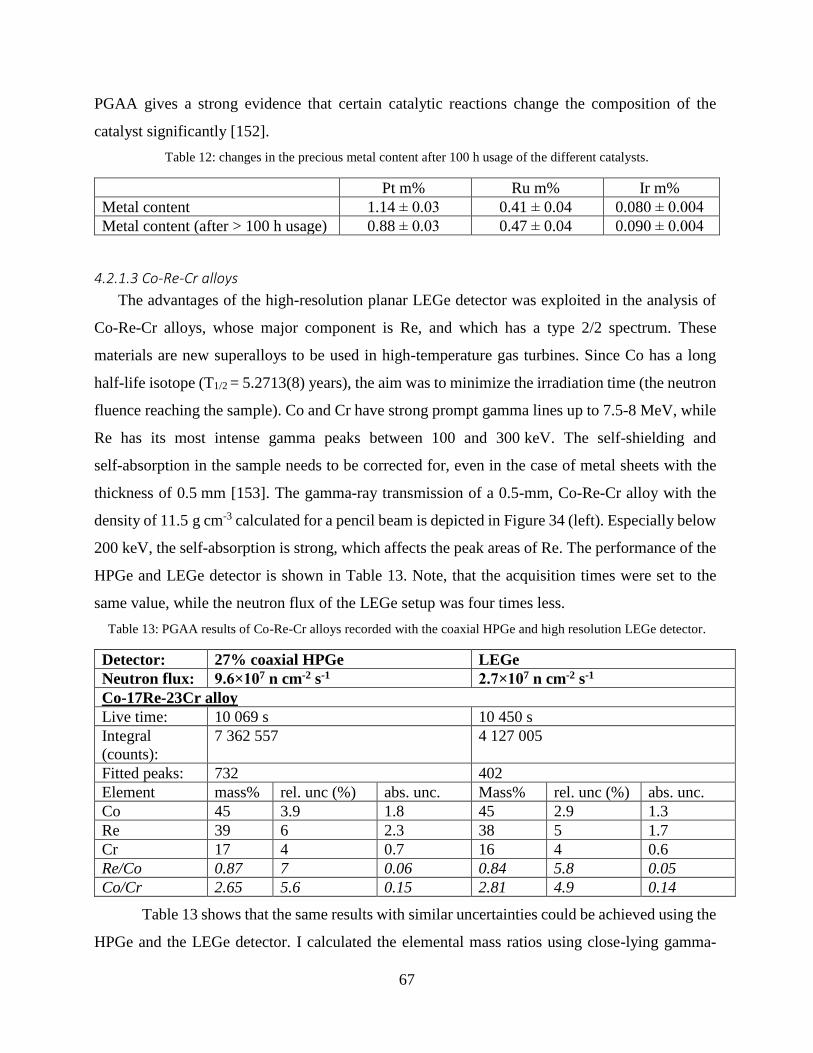
67
PGAA gives a strong evidence that certain catalytic reactions change the composition of the
catalyst significantly [152].
Table 12: changes in the precious metal content after 100 h usage of the different catalysts.
Pt m% Ru m% Ir m%
Metal content 1.14 ± 0.03 0.41 ± 0.04 0.080 ± 0.004
Metal content (after > 100 h usage) 0.88 ± 0.03 0.47 ± 0.04 0.090 ± 0.004
4.2.1.3 Co-Re-Cr alloys
The advantages of the high-resolution planar LEGe detector was exploited in the analysis of
Co-Re-Cr alloys, whose major component is Re, and which has a type 2/2 spectrum. These
materials are new superalloys to be used in high-temperature gas turbines. Since Co has a long
half-life isotope (T1/2 = 5.2713(8) years), the aim was to minimize the irradiation time (the neutron
fluence reaching the sample). Co and Cr have strong prompt gamma lines up to 7.5-8 MeV, while
Re has its most intense gamma peaks between 100 and 300 keV. The self-shielding and
self-absorption in the sample needs to be corrected for, even in the case of metal sheets with the
thickness of 0.5 mm [153]. The gamma-ray transmission of a 0.5-mm, Co-Re-Cr alloy with the
density of 11.5 g cm-3 calculated for a pencil beam is depicted in Figure 34 (left). Especially below
200 keV, the self-absorption is strong, which affects the peak areas of Re. The performance of the
HPGe and LEGe detector is shown in Table 13. Note, that the acquisition times were set to the
same value, while the neutron flux of the LEGe setup was four times less.
Table 13: PGAA results of Co-Re-Cr alloys recorded with the coaxial HPGe and high resolution LEGe detector.
Detector: 27% coaxial HPGe LEGe
Neutron flux: 9.6×10⁷ n cm-2 s-1 2.7×10⁷ n cm-2 s-1
Co-17Re-23Cr alloy
Live time: 10 069 s 10 450 s
Integral
(counts):
7 362 557 4 127 005
Fitted peaks: 732 402
Element mass% rel. unc (%) abs. unc. Mass% rel. unc (%) abs. unc.
Co 45 3.9 1.8 45 2.9 1.3
Re 39 6 2.3 38 5 1.7
Cr 17 4 0.7 16 4 0.6
Re/Co 0.87 7 0.06 0.84 5.8 0.05
Co/Cr 2.65 5.6 0.15 2.81 4.9 0.14
Table 13 shows that the same results with similar uncertainties could be achieved using the
HPGe and the LEGe detector. I calculated the elemental mass ratios using close-lying gamma-
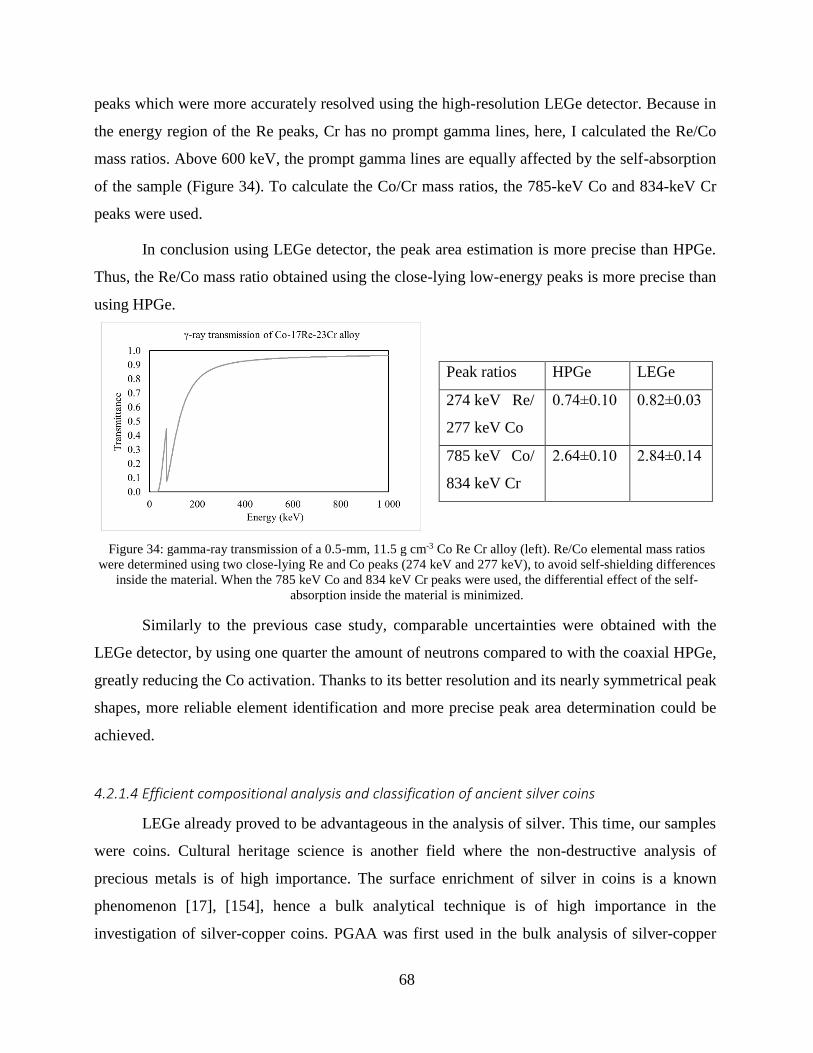
68
peaks which were more accurately resolved using the high-resolution LEGe detector. Because in
the energy region of the Re peaks, Cr has no prompt gamma lines, here, I calculated the Re/Co
mass ratios. Above 600 keV, the prompt gamma lines are equally affected by the self-absorption
of the sample (Figure 34). To calculate the Co/Cr mass ratios, the 785-keV Co and 834-keV Cr
peaks were used.
In conclusion using LEGe detector, the peak area estimation is more precise than HPGe.
Thus, the Re/Co mass ratio obtained using the close-lying low-energy peaks is more precise than
using HPGe.
Peak ratios HPGe LEGe
274 keV Re/
277 keV Co
0.74±0.10 0.82±0.03
785 keV Co/
834 keV Cr
2.64±0.10 2.84±0.14
Figure 34: gamma-ray transmission of a 0.5-mm, 11.5 g cm-3 Co Re Cr alloy (left). Re/Co elemental mass ratios
were determined using two close-lying Re and Co peaks (274 keV and 277 keV), to avoid self-shielding differences
inside the material. When the 785 keV Co and 834 keV Cr peaks were used, the differential effect of the self-
absorption inside the material is minimized.
Similarly to the previous case study, comparable uncertainties were obtained with the
LEGe detector, by using one quarter the amount of neutrons compared to with the coaxial HPGe,
greatly reducing the Co activation. Thanks to its better resolution and its nearly symmetrical peak
shapes, more reliable element identification and more precise peak area determination could be
achieved.
4.2.1.4 Efficient compositional analysis and classification of ancient silver coins
LEGe already proved to be advantageous in the analysis of silver. This time, our samples
were coins. Cultural heritage science is another field where the non-destructive analysis of
precious metals is of high importance. The surface enrichment of silver in coins is a known
phenomenon [17], [154], hence a bulk analytical technique is of high importance in the
investigation of silver-copper coins. PGAA was first used in the bulk analysis of silver-copper
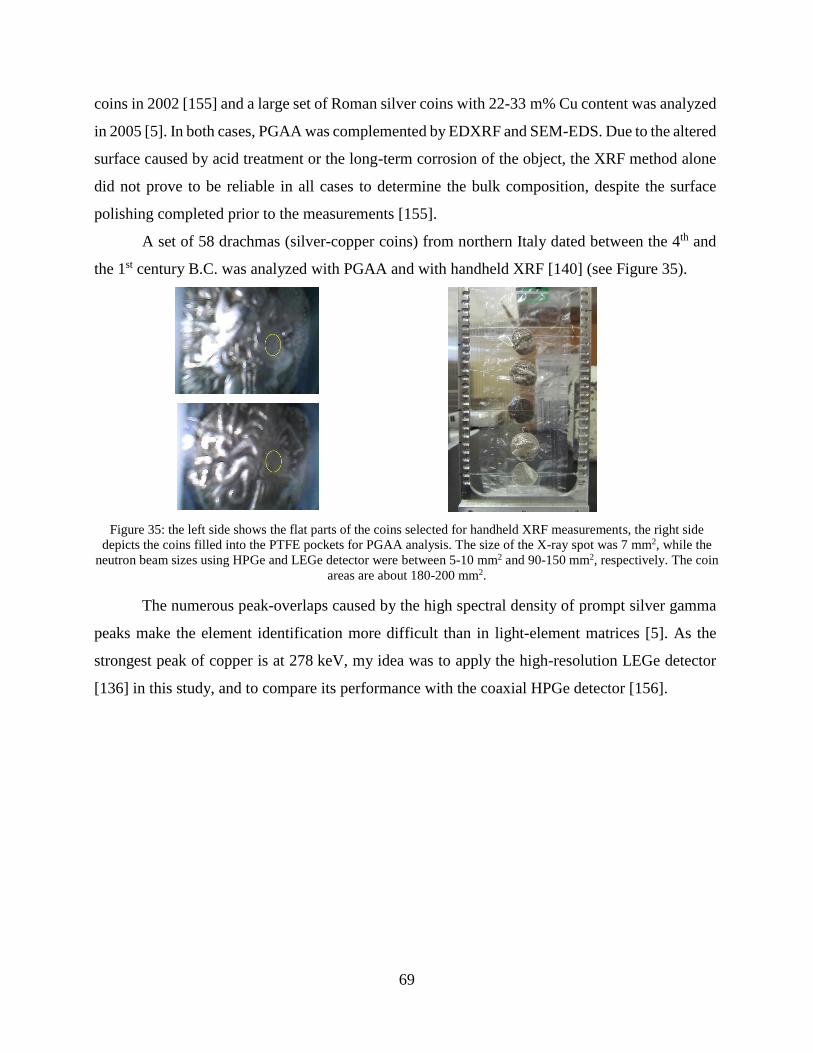
69
coins in 2002 [155] and a large set of Roman silver coins with 22-33 m% Cu content was analyzed
in 2005 [5]. In both cases, PGAA was complemented by EDXRF and SEM-EDS. Due to the altered
surface caused by acid treatment or the long-term corrosion of the object, the XRF method alone
did not prove to be reliable in all cases to determine the bulk composition, despite the surface
polishing completed prior to the measurements [155].
A set of 58 drachmas (silver-copper coins) from northern Italy dated between the 4th and
the 1st century B.C. was analyzed with PGAA and with handheld XRF [140] (see Figure 35).
Figure 35: the left side shows the flat parts of the coins selected for handheld XRF measurements, the right side
depicts the coins filled into the PTFE pockets for PGAA analysis. The size of the X-ray spot was 7 mm2, while the
neutron beam sizes using HPGe and LEGe detector were between 5-10 mm2 and 90-150 mm2, respectively. The coin
areas are about 180-200 mm2.
The numerous peak-overlaps caused by the high spectral density of prompt silver gamma
peaks make the element identification more difficult than in light-element matrices [5]. As the
strongest peak of copper is at 278 keV, my idea was to apply the high-resolution LEGe detector
[136] in this study, and to compare its performance with the coaxial HPGe detector [156].
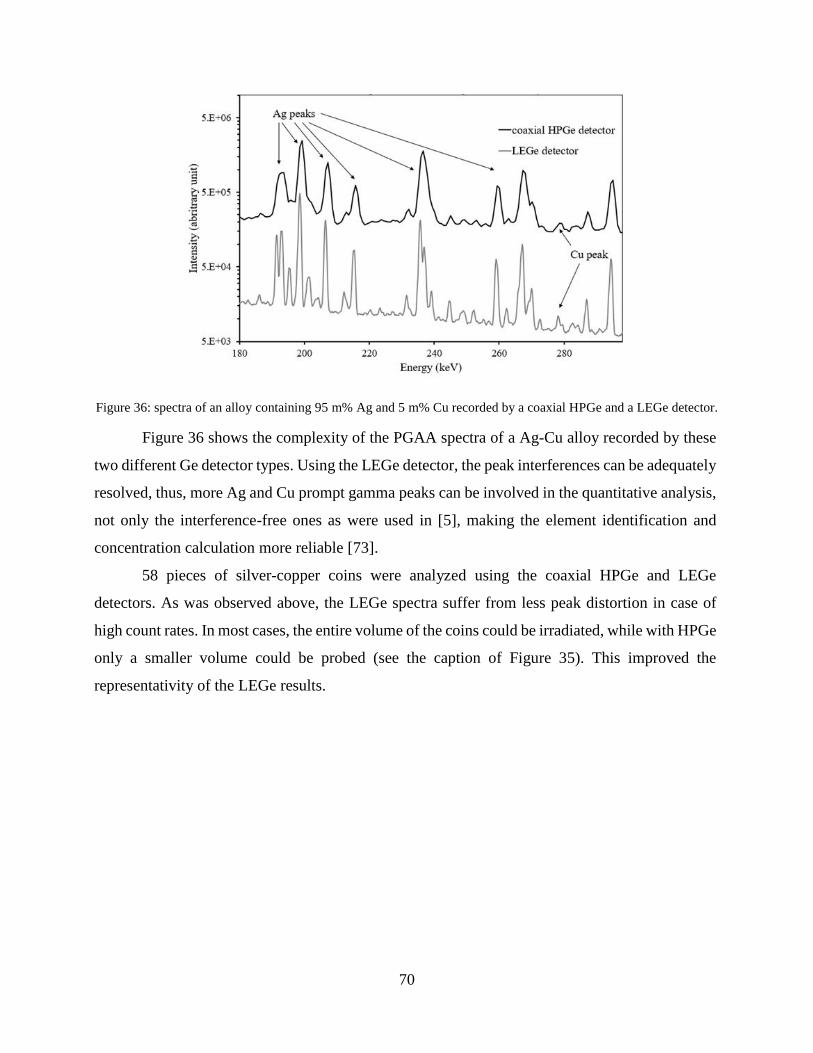
70
Figure 36: spectra of an alloy containing 95 m% Ag and 5 m% Cu recorded by a coaxial HPGe and a LEGe detector.
Figure 36 shows the complexity of the PGAA spectra of a Ag-Cu alloy recorded by these
two different Ge detector types. Using the LEGe detector, the peak interferences can be adequately
resolved, thus, more Ag and Cu prompt gamma peaks can be involved in the quantitative analysis,
not only the interference-free ones as were used in [5], making the element identification and
concentration calculation more reliable [73].
58 pieces of silver-copper coins were analyzed using the coaxial HPGe and LEGe
detectors. As was observed above, the LEGe spectra suffer from less peak distortion in case of
high count rates. In most cases, the entire volume of the coins could be irradiated, while with HPGe
only a smaller volume could be probed (see the caption of Figure 35). This improved the
representativity of the LEGe results.
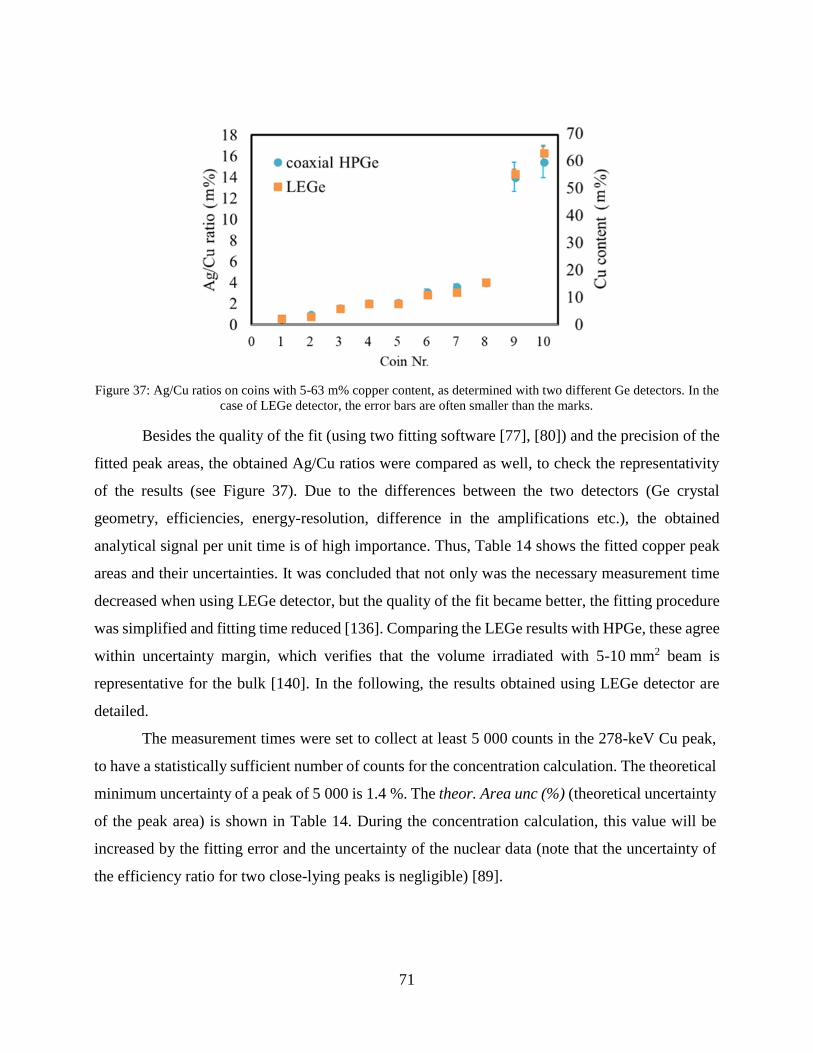
71
Figure 37: Ag/Cu ratios on coins with 5-63 m% copper content, as determined with two different Ge detectors. In the
case of LEGe detector, the error bars are often smaller than the marks.
Besides the quality of the fit (using two fitting software [77], [80]) and the precision of the
fitted peak areas, the obtained Ag/Cu ratios were compared as well, to check the representativity
of the results (see Figure 37). Due to the differences between the two detectors (Ge crystal
geometry, efficiencies, energy-resolution, difference in the amplifications etc.), the obtained
analytical signal per unit time is of high importance. Thus, Table 14 shows the fitted copper peak
areas and their uncertainties. It was concluded that not only was the necessary measurement time
decreased when using LEGe detector, but the quality of the fit became better, the fitting procedure
was simplified and fitting time reduced [136]. Comparing the LEGe results with HPGe, these agree
within uncertainty margin, which verifies that the volume irradiated with 5-10 mm2 beam is
representative for the bulk [140]. In the following, the results obtained using LEGe detector are
detailed.
The measurement times were set to collect at least 5 000 counts in the 278-keV Cu peak,
to have a statistically sufficient number of counts for the concentration calculation. The theoretical
minimum uncertainty of a peak of 5 000 is 1.4 %. The theor. Area unc (%) (theoretical uncertainty
of the peak area) is shown in Table 14. During the concentration calculation, this value will be
increased by the fitting error and the uncertainty of the nuclear data (note that the uncertainty of
the efficiency ratio for two close-lying peaks is negligible) [89].
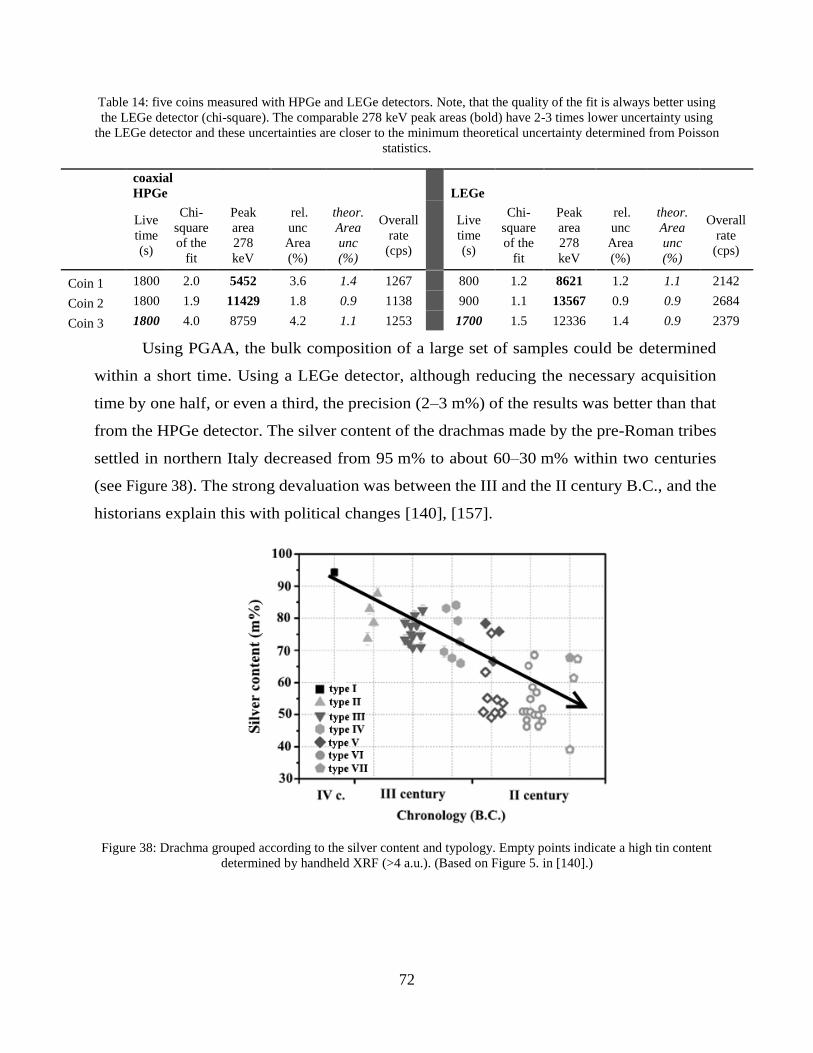
72
Table 14: five coins measured with HPGe and LEGe detectors. Note, that the quality of the fit is always better using
the LEGe detector (chi-square). The comparable 278 keV peak areas (bold) have 2-3 times lower uncertainty using
the LEGe detector and these uncertainties are closer to the minimum theoretical uncertainty determined from Poisson
statistics.
coaxial
HPGe LEGe
Live
time
(s)
Chi-
square
of the
fit
Peak
area
278
keV
rel.
unc
Area
(%)
theor.
Area
unc
(%)
Overall
rate
(cps)
Live
time
(s)
Chi-
square
of the
fit
Peak
area
278
keV
rel.
unc
Area
(%)
theor.
Area
unc
(%)
Overall
rate
(cps)
Coin 1 1800 2.0 5452 3.6 1.4 1267 800 1.2 8621 1.2 1.1 2142
Coin 2 1800 1.9 11429 1.8 0.9 1138 900 1.1 13567 0.9 0.9 2684
Coin 3 1800 4.0 8759 4.2 1.1 1253 1700 1.5 12336 1.4 0.9 2379
Using PGAA, the bulk composition of a large set of samples could be determined
within a short time. Using a LEGe detector, although reducing the necessary acquisition
time by one half, or even a third, the precision (2–3 m%) of the results was better than that
from the HPGe detector. The silver content of the drachmas made by the pre-Roman tribes
settled in northern Italy decreased from 95 m% to about 60–30 m% within two centuries
(see Figure 38). The strong devaluation was between the III and the II century B.C., and the
historians explain this with political changes [140], [157].
Figure 38: Drachma grouped according to the silver content and typology. Empty points indicate a high tin content
determined by handheld XRF (>4 a.u.). (Based on Figure 5. in [140].)
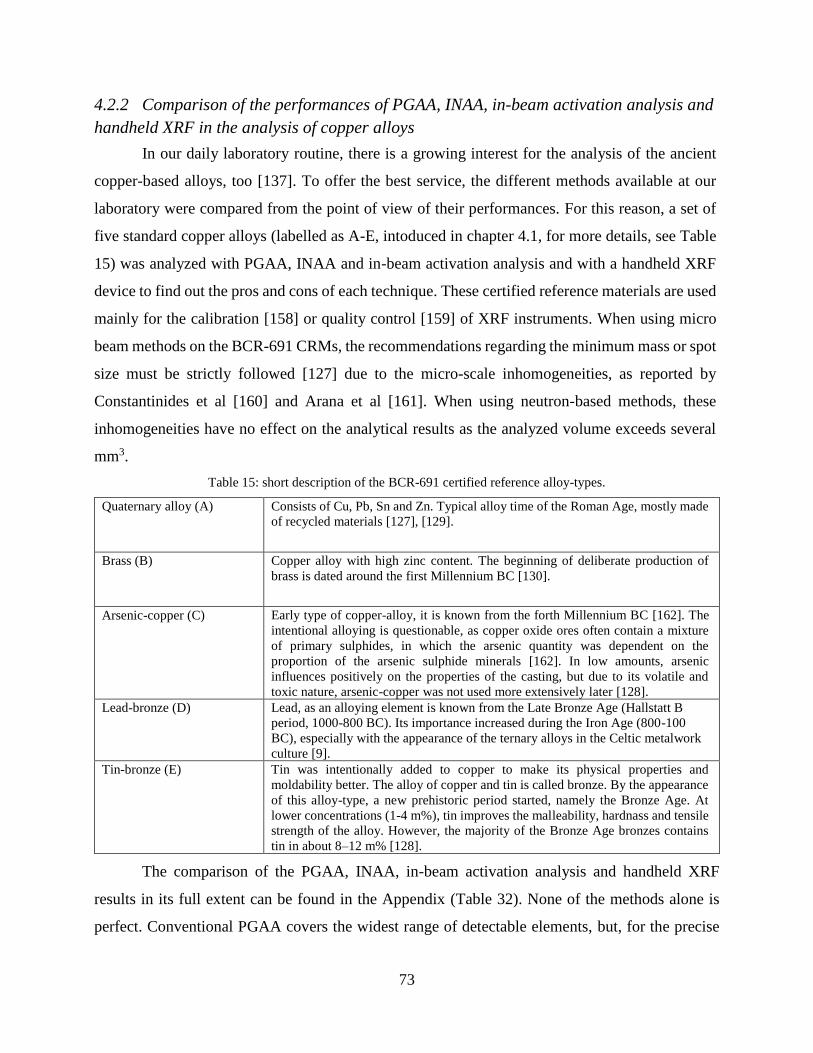
73
4.2.2 Comparison of the performances of PGAA, INAA, in-beam activation analysis and
handheld XRF in the analysis of copper alloys
In our daily laboratory routine, there is a growing interest for the analysis of the ancient
copper-based alloys, too [137]. To offer the best service, the different methods available at our
laboratory were compared from the point of view of their performances. For this reason, a set of
five standard copper alloys (labelled as A-E, intoduced in chapter 4.1, for more details, see Table
15) was analyzed with PGAA, INAA and in-beam activation analysis and with a handheld XRF
device to find out the pros and cons of each technique. These certified reference materials are used
mainly for the calibration [158] or quality control [159] of XRF instruments. When using micro
beam methods on the BCR-691 CRMs, the recommendations regarding the minimum mass or spot
size must be strictly followed [127] due to the micro-scale inhomogeneities, as reported by
Constantinides et al [160] and Arana et al [161]. When using neutron-based methods, these
inhomogeneities have no effect on the analytical results as the analyzed volume exceeds several
mm3.
Table 15: short description of the BCR-691 certified reference alloy-types.
Quaternary alloy (A)
Consists of Cu, Pb, Sn and Zn. Typical alloy time of the Roman Age, mostly made
of recycled materials [127], [129].
Brass (B)
Copper alloy with high zinc content. The beginning of deliberate production of
brass is dated around the first Millennium BC [130].
Arsenic-copper (C)
Early type of copper-alloy, it is known from the forth Millennium BC [162]. The
intentional alloying is questionable, as copper oxide ores often contain a mixture
of primary sulphides, in which the arsenic quantity was dependent on the
proportion of the arsenic sulphide minerals [162]. In low amounts, arsenic
influences positively on the properties of the casting, but due to its volatile and
toxic nature, arsenic-copper was not used more extensively later [128].
Lead-bronze (D)
Lead, as an alloying element is known from the Late Bronze Age (Hallstatt B
period, 1000-800 BC). Its importance increased during the Iron Age (800-100
BC), especially with the appearance of the ternary alloys in the Celtic metalwork
culture [9].
Tin-bronze (E)
Tin was intentionally added to copper to make its physical properties and
moldability better. The alloy of copper and tin is called bronze. By the appearance
of this alloy-type, a new prehistoric period started, namely the Bronze Age. At
lower concentrations (1-4 m%), tin improves the malleability, hardnass and tensile
strength of the alloy. However, the majority of the Bronze Age bronzes contains
tin in about 8–12 m% [128].
The comparison of the PGAA, INAA, in-beam activation analysis and handheld XRF
results in its full extent can be found in the Appendix (Table 32). None of the methods alone is
perfect. Conventional PGAA covers the widest range of detectable elements, but, for the precise
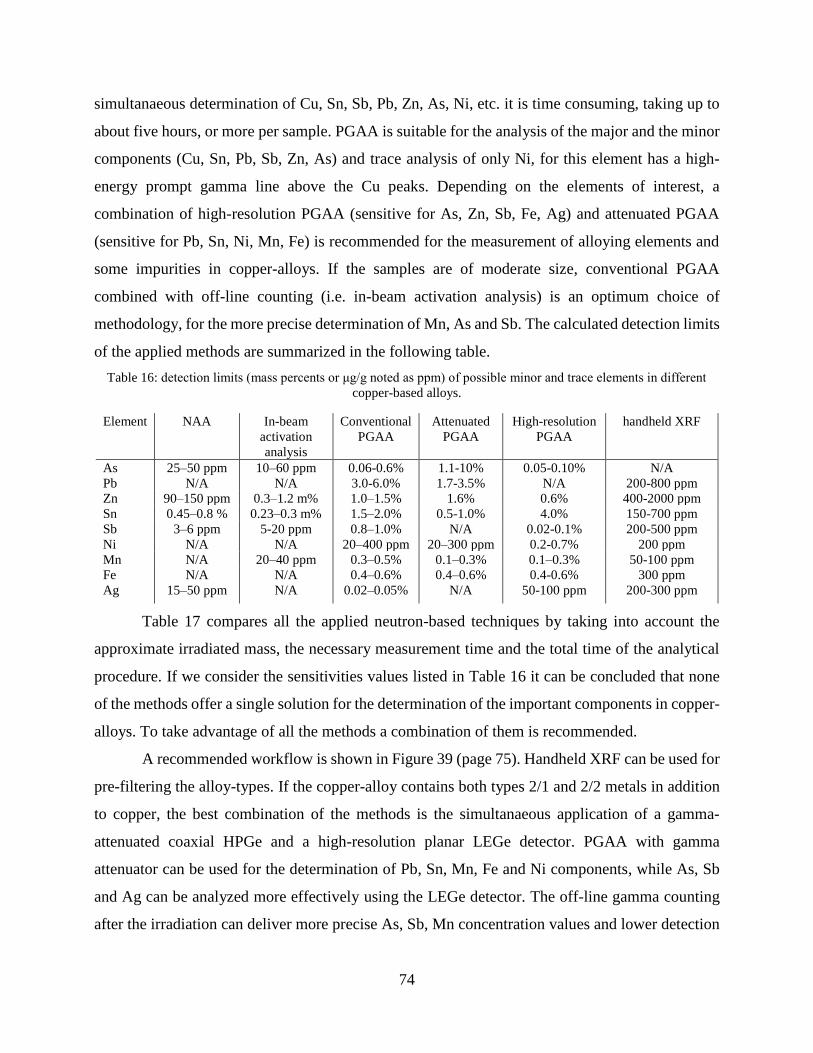
74
simultanaeous determination of Cu, Sn, Sb, Pb, Zn, As, Ni, etc. it is time consuming, taking up to
about five hours, or more per sample. PGAA is suitable for the analysis of the major and the minor
components (Cu, Sn, Pb, Sb, Zn, As) and trace analysis of only Ni, for this element has a high-
energy prompt gamma line above the Cu peaks. Depending on the elements of interest, a
combination of high-resolution PGAA (sensitive for As, Zn, Sb, Fe, Ag) and attenuated PGAA
(sensitive for Pb, Sn, Ni, Mn, Fe) is recommended for the measurement of alloying elements and
some impurities in copper-alloys. If the samples are of moderate size, conventional PGAA
combined with off-line counting (i.e. in-beam activation analysis) is an optimum choice of
methodology, for the more precise determination of Mn, As and Sb. The calculated detection limits
of the applied methods are summarized in the following table.
Table 16: detection limits (mass percents or μg/g noted as ppm) of possible minor and trace elements in different
copper-based alloys.
Element NAA In-beam
activation
analysis
Conventional
PGAA
Attenuated
PGAA
High-resolution
PGAA
handheld XRF
As 25–50 ppm 10–60 ppm 0.06-0.6% 1.1-10% 0.05-0.10% N/A
Pb N/A N/A 3.0-6.0% 1.7-3.5% N/A 200-800 ppm
Zn 90–150 ppm 0.3–1.2 m% 1.0–1.5% 1.6% 0.6% 400-2000 ppm
Sn 0.45–0.8 % 0.23–0.3 m% 1.5–2.0% 0.5-1.0% 4.0% 150-700 ppm
Sb 3–6 ppm 5-20 ppm 0.8–1.0% N/A 0.02-0.1% 200-500 ppm
Ni N/A N/A 20–400 ppm 20–300 ppm 0.2-0.7% 200 ppm
Mn N/A 20–40 ppm 0.3–0.5% 0.1–0.3% 0.1–0.3% 50-100 ppm
Fe N/A N/A 0.4–0.6% 0.4–0.6% 0.4-0.6% 300 ppm
Ag 15–50 ppm N/A 0.02–0.05% N/A 50-100 ppm 200-300 ppm
Table 17 compares all the applied neutron-based techniques by taking into account the
approximate irradiated mass, the necessary measurement time and the total time of the analytical
procedure. If we consider the sensitivities values listed in Table 16 it can be concluded that none
of the methods offer a single solution for the determination of the important components in copper-
alloys. To take advantage of all the methods a combination of them is recommended.
A recommended workflow is shown in Figure 39 (page 75). Handheld XRF can be used for
pre-filtering the alloy-types. If the copper-alloy contains both types 2/1 and 2/2 metals in addition
to copper, the best combination of the methods is the simultanaeous application of a gamma-
attenuated coaxial HPGe and a high-resolution planar LEGe detector. PGAA with gamma
attenuator can be used for the determination of Pb, Sn, Mn, Fe and Ni components, while As, Sb
and Ag can be analyzed more effectively using the LEGe detector. The off-line gamma counting
after the irradiation can deliver more precise As, Sb, Mn concentration values and lower detection
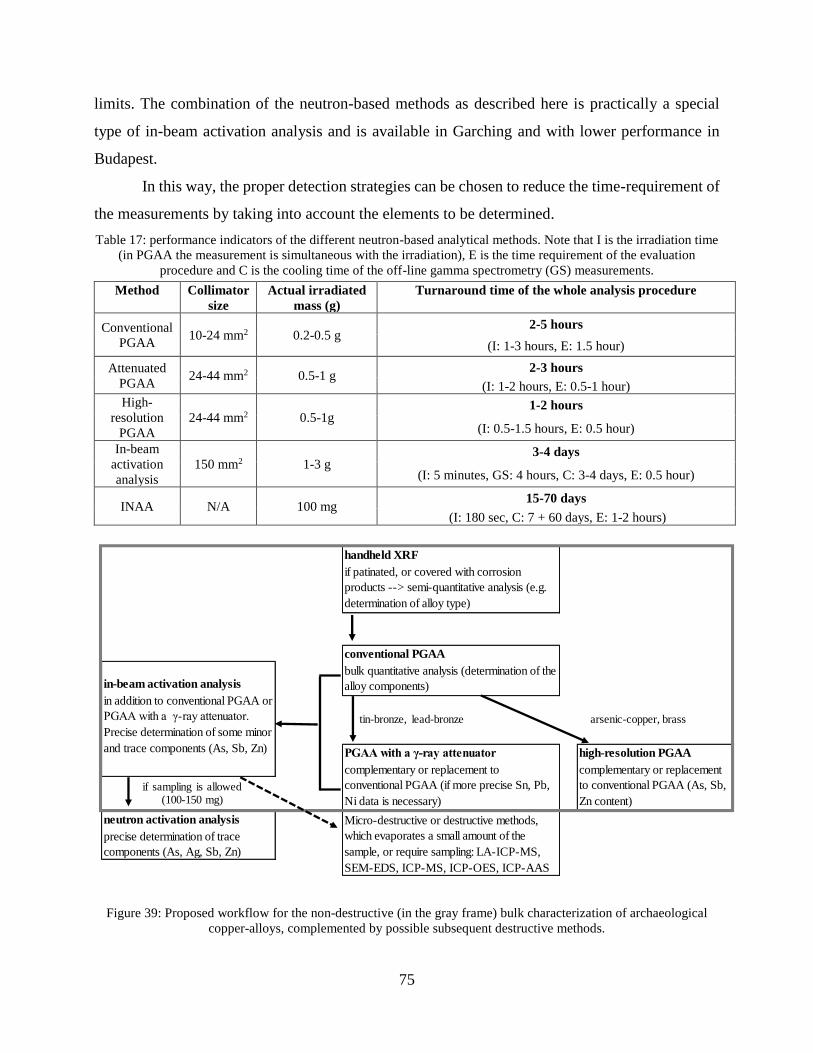
75
limits. The combination of the neutron-based methods as described here is practically a special
type of in-beam activation analysis and is available in Garching and with lower performance in
Budapest.
In this way, the proper detection strategies can be chosen to reduce the time-requirement of
the measurements by taking into account the elements to be determined.
Table 17: performance indicators of the different neutron-based analytical methods. Note that I is the irradiation time
(in PGAA the measurement is simultaneous with the irradiation), E is the time requirement of the evaluation
procedure and C is the cooling time of the off-line gamma spectrometry (GS) measurements.
Method Collimator
size
Actual irradiated
mass (g)
Turnaround time of the whole analysis procedure
Conventional
PGAA 10-24 mm2 0.2-0.5 g
2-5 hours
(I: 1-3 hours, E: 1.5 hour)
Attenuated
PGAA 24-44 mm2 0.5-1 g
2-3 hours
(I: 1-2 hours, E: 0.5-1 hour)
High-
resolution
PGAA
24-44 mm2 0.5-1g 1-2 hours
(I: 0.5-1.5 hours, E: 0.5 hour)
In-beam
activation
analysis
150 mm2 1-3 g 3-4 days
(I: 5 minutes, GS: 4 hours, C: 3-4 days, E: 0.5 hour)
INAA N/A 100 mg 15-70 days
(I: 180 sec, C: 7 + 60 days, E: 1-2 hours)
Figure 39: Proposed workflow for the non-destructive (in the gray frame) bulk characterization of archaeological
copper-alloys, complemented by possible subsequent destructive methods.
precise determination of trace
components (As, Ag, Sb, Zn)
Micro-destructive or destructive methods,
which evaporates a small amount of the
sample, or require sampling: LA-ICP-MS,
SEM-EDS, ICP-MS, ICP-OES, ICP-AAS
in-beam activation analysis
neutron activation analysis
conventional PGAA
bulk quantitative analysis (determination of the
alloy components)
PGAA with a γ-ray attenuator
complementary or replacement to
conventional PGAA (if more precise Sn, Pb,
Ni data is necessary)
in addition to conventional PGAA or
PGAA with a γ-ray attenuator.
Precise determination of some minor
and trace components (As, Sb, Zn) high-resolution PGAA
complementary or replacement
to conventional PGAA (As, Sb,
Zn content)
handheld XRF
if patinated, or covered with corrosion
products --> semi-quantitative analysis (e.g.
determination of alloy type)
tin-bronze, lead-bronze arsenic-copper, brass
if sampling is allowed (100-150 mg)
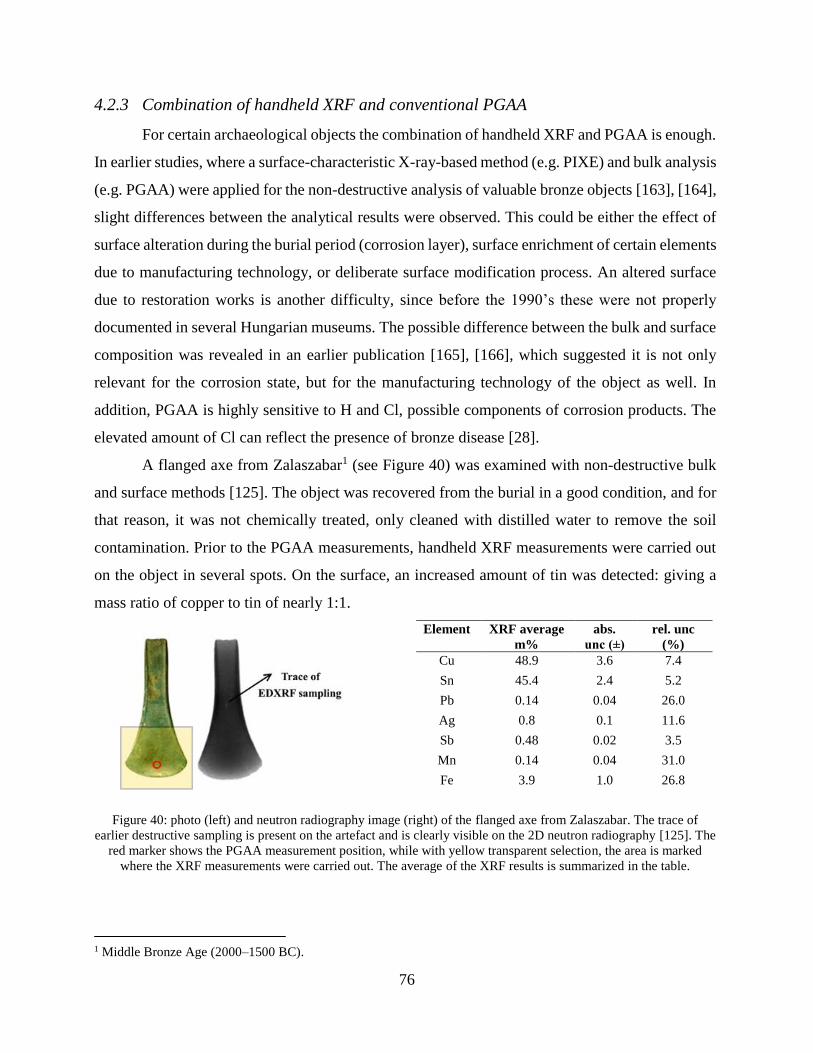
76
4.2.3 Combination of handheld XRF and conventional PGAA
For certain archaeological objects the combination of handheld XRF and PGAA is enough.
In earlier studies, where a surface-characteristic X-ray-based method (e.g. PIXE) and bulk analysis
(e.g. PGAA) were applied for the non-destructive analysis of valuable bronze objects [163], [164],
slight differences between the analytical results were observed. This could be either the effect of
surface alteration during the burial period (corrosion layer), surface enrichment of certain elements
due to manufacturing technology, or deliberate surface modification process. An altered surface
due to restoration works is another difficulty, since before the 1990’s these were not properly
documented in several Hungarian museums. The possible difference between the bulk and surface
composition was revealed in an earlier publication [165], [166], which suggested it is not only
relevant for the corrosion state, but for the manufacturing technology of the object as well. In
addition, PGAA is highly sensitive to H and Cl, possible components of corrosion products. The
elevated amount of Cl can reflect the presence of bronze disease [28].
A flanged axe from Zalaszabar1 (see Figure 40) was examined with non-destructive bulk
and surface methods [125]. The object was recovered from the burial in a good condition, and for
that reason, it was not chemically treated, only cleaned with distilled water to remove the soil
contamination. Prior to the PGAA measurements, handheld XRF measurements were carried out
on the object in several spots. On the surface, an increased amount of tin was detected: giving a
mass ratio of copper to tin of nearly 1:1.
Element XRF average
m%
abs.
unc (±)
rel. unc
(%)
Cu 48.9 3.6 7.4
Sn 45.4 2.4 5.2
Pb 0.14 0.04 26.0
Ag 0.8 0.1 11.6
Sb 0.48 0.02 3.5
Mn 0.14 0.04 31.0
Fe 3.9 1.0 26.8
Figure 40: photo (left) and neutron radiography image (right) of the flanged axe from Zalaszabar. The trace of
earlier destructive sampling is present on the artefact and is clearly visible on the 2D neutron radiography [125]. The
red marker shows the PGAA measurement position, while with yellow transparent selection, the area is marked
where the XRF measurements were carried out. The average of the XRF results is summarized in the table.
1 Middle Bronze Age (2000–1500 BC).
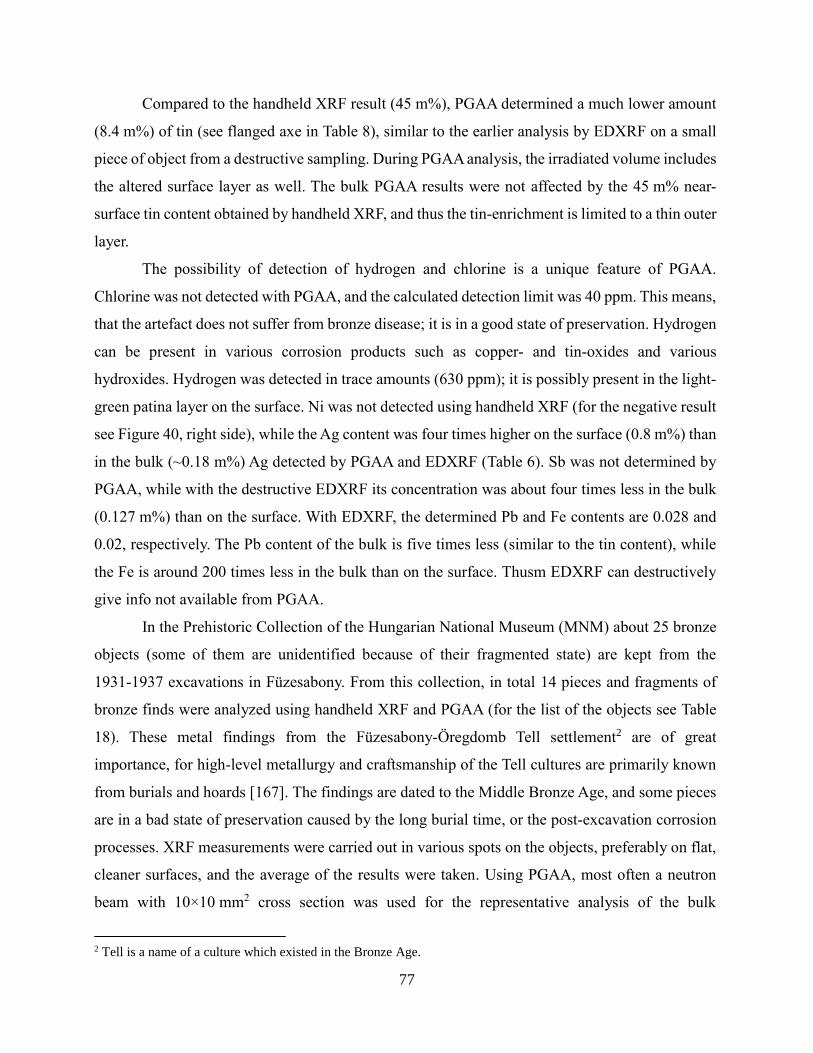
77
Compared to the handheld XRF result (45 m%), PGAA determined a much lower amount
(8.4 m%) of tin (see flanged axe in Table 8), similar to the earlier analysis by EDXRF on a small
piece of object from a destructive sampling. During PGAA analysis, the irradiated volume includes
the altered surface layer as well. The bulk PGAA results were not affected by the 45 m% near-
surface tin content obtained by handheld XRF, and thus the tin-enrichment is limited to a thin outer
layer.
The possibility of detection of hydrogen and chlorine is a unique feature of PGAA.
Chlorine was not detected with PGAA, and the calculated detection limit was 40 ppm. This means,
that the artefact does not suffer from bronze disease; it is in a good state of preservation. Hydrogen
can be present in various corrosion products such as copper- and tin-oxides and various
hydroxides. Hydrogen was detected in trace amounts (630 ppm); it is possibly present in the light-
green patina layer on the surface. Ni was not detected using handheld XRF (for the negative result
see Figure 40, right side), while the Ag content was four times higher on the surface (0.8 m%) than
in the bulk (~0.18 m%) Ag detected by PGAA and EDXRF (Table 6). Sb was not determined by
PGAA, while with the destructive EDXRF its concentration was about four times less in the bulk
(0.127 m%) than on the surface. With EDXRF, the determined Pb and Fe contents are 0.028 and
0.02, respectively. The Pb content of the bulk is five times less (similar to the tin content), while
the Fe is around 200 times less in the bulk than on the surface. Thusm EDXRF can destructively
give info not available from PGAA.
In the Prehistoric Collection of the Hungarian National Museum (MNM) about 25 bronze
objects (some of them are unidentified because of their fragmented state) are kept from the
1931-1937 excavations in Füzesabony. From this collection, in total 14 pieces and fragments of
bronze finds were analyzed using handheld XRF and PGAA (for the list of the objects see Table
18). These metal findings from the Füzesabony-Öregdomb Tell settlement2 are of great
importance, for high-level metallurgy and craftsmanship of the Tell cultures are primarily known
from burials and hoards [167]. The findings are dated to the Middle Bronze Age, and some pieces
are in a bad state of preservation caused by the long burial time, or the post-excavation corrosion
processes. XRF measurements were carried out in various spots on the objects, preferably on flat,
cleaner surfaces, and the average of the results were taken. Using PGAA, most often a neutron
beam with 10×10 mm2 cross section was used for the representative analysis of the bulk
2 Tell is a name of a culture which existed in the Bronze Age.
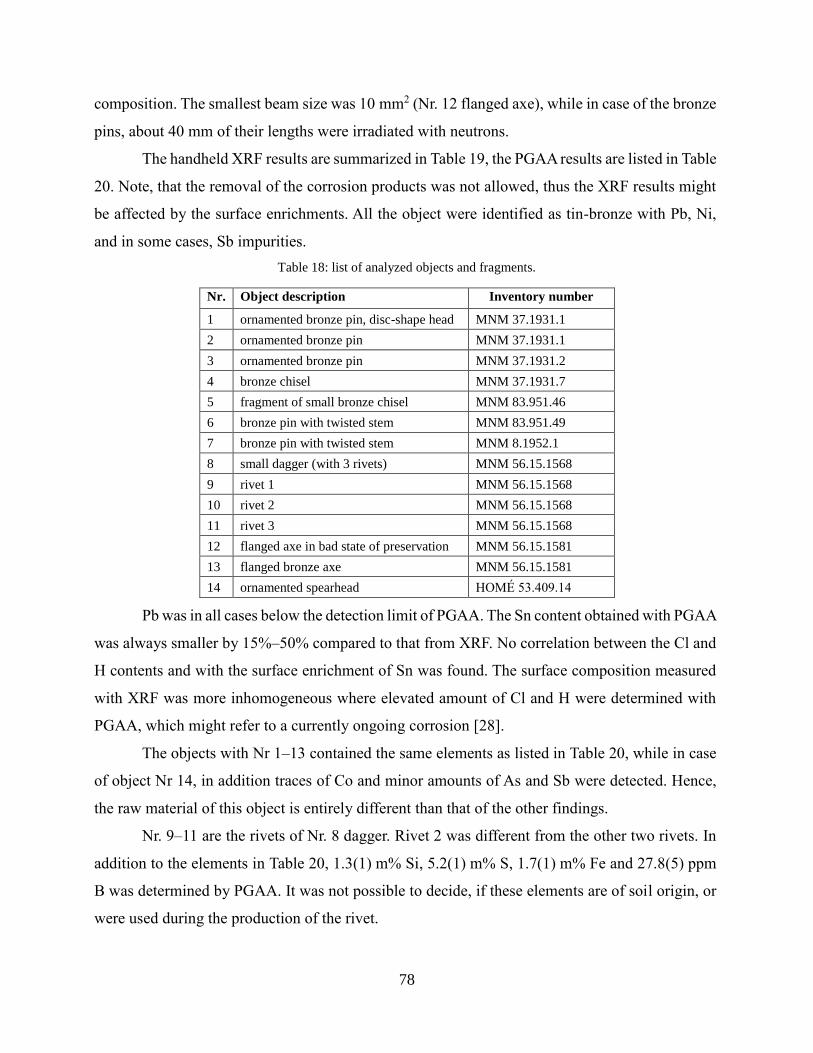
78
composition. The smallest beam size was 10 mm2 (Nr. 12 flanged axe), while in case of the bronze
pins, about 40 mm of their lengths were irradiated with neutrons.
The handheld XRF results are summarized in Table 19, the PGAA results are listed in Table
20. Note, that the removal of the corrosion products was not allowed, thus the XRF results might
be affected by the surface enrichments. All the object were identified as tin-bronze with Pb, Ni,
and in some cases, Sb impurities.
Table 18: list of analyzed objects and fragments.
Nr. Object description Inventory number
1 ornamented bronze pin, disc-shape head MNM 37.1931.1
2 ornamented bronze pin MNM 37.1931.1
3 ornamented bronze pin MNM 37.1931.2
4 bronze chisel MNM 37.1931.7
5 fragment of small bronze chisel MNM 83.951.46
6 bronze pin with twisted stem MNM 83.951.49
7 bronze pin with twisted stem MNM 8.1952.1
8 small dagger (with 3 rivets) MNM 56.15.1568
9 rivet 1 MNM 56.15.1568
10 rivet 2 MNM 56.15.1568
11 rivet 3 MNM 56.15.1568
12 flanged axe in bad state of preservation MNM 56.15.1581
13 flanged bronze axe MNM 56.15.1581
14 ornamented spearhead HOMÉ 53.409.14
Pb was in all cases below the detection limit of PGAA. The Sn content obtained with PGAA
was always smaller by 15%–50% compared to that from XRF. No correlation between the Cl and
H contents and with the surface enrichment of Sn was found. The surface composition measured
with XRF was more inhomogeneous where elevated amount of Cl and H were determined with
PGAA, which might refer to a currently ongoing corrosion [28].
The objects with Nr 1–13 contained the same elements as listed in Table 20, while in case
of object Nr 14, in addition traces of Co and minor amounts of As and Sb were detected. Hence,
the raw material of this object is entirely different than that of the other findings.
Nr. 9–11 are the rivets of Nr. 8 dagger. Rivet 2 was different from the other two rivets. In
addition to the elements in Table 20, 1.3(1) m% Si, 5.2(1) m% S, 1.7(1) m% Fe and 27.8(5) ppm
B was determined by PGAA. It was not possible to decide, if these elements are of soil origin, or
were used during the production of the rivet.
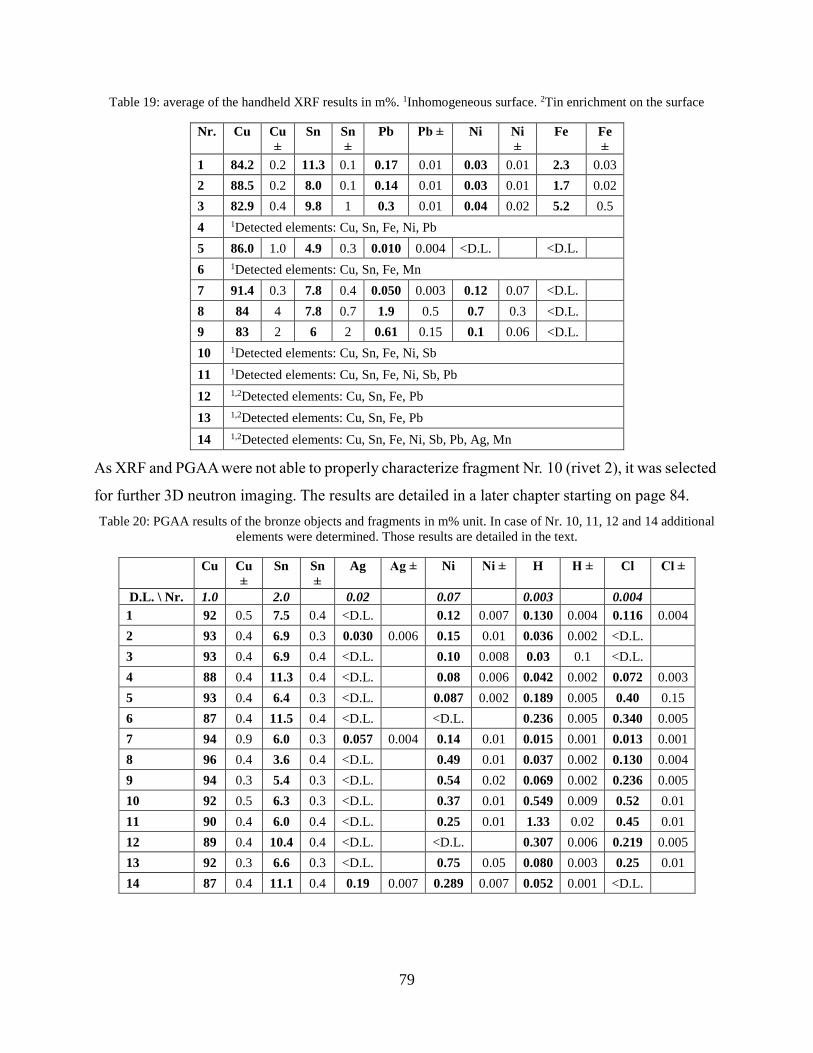
79
Table 19: average of the handheld XRF results in m%. 1Inhomogeneous surface. 2Tin enrichment on the surface
Nr. Cu Cu
±
Sn Sn
±
Pb Pb ± Ni Ni
±
Fe Fe
±
1 84.2 0.2 11.3 0.1 0.17 0.01 0.03 0.01 2.3 0.03
2 88.5 0.2 8.0 0.1 0.14 0.01 0.03 0.01 1.7 0.02
3 82.9 0.4 9.8 1 0.3 0.01 0.04 0.02 5.2 0.5
4 1Detected elements: Cu, Sn, Fe, Ni, Pb
5 86.0 1.0 4.9 0.3 0.010 0.004 <D.L. <D.L.
6 1Detected elements: Cu, Sn, Fe, Mn
7 91.4 0.3 7.8 0.4 0.050 0.003 0.12 0.07 <D.L.
8 84 4 7.8 0.7 1.9 0.5 0.7 0.3 <D.L.
9 83 2 6 2 0.61 0.15 0.1 0.06 <D.L.
10 1Detected elements: Cu, Sn, Fe, Ni, Sb
11 1Detected elements: Cu, Sn, Fe, Ni, Sb, Pb
12 1,2Detected elements: Cu, Sn, Fe, Pb
13 1,2Detected elements: Cu, Sn, Fe, Pb
14 1,2Detected elements: Cu, Sn, Fe, Ni, Sb, Pb, Ag, Mn
As XRF and PGAA were not able to properly characterize fragment Nr. 10 (rivet 2), it was selected
for further 3D neutron imaging. The results are detailed in a later chapter starting on page 84.
Table 20: PGAA results of the bronze objects and fragments in m% unit. In case of Nr. 10, 11, 12 and 14 additional
elements were determined. Those results are detailed in the text.
Cu Cu
±
Sn Sn
±
Ag Ag ± Ni Ni ± H H ± Cl Cl ±
D.L. \ Nr. 1.0 2.0 0.02 0.07 0.003 0.004
1 92 0.5 7.5 0.4 <D.L. 0.12 0.007 0.130 0.004 0.116 0.004
2 93 0.4 6.9 0.3 0.030 0.006 0.15 0.01 0.036 0.002 <D.L.
3 93 0.4 6.9 0.4 <D.L. 0.10 0.008 0.03 0.1 <D.L.
4 88 0.4 11.3 0.4 <D.L. 0.08 0.006 0.042 0.002 0.072 0.003
5 93 0.4 6.4 0.3 <D.L. 0.087 0.002 0.189 0.005 0.40 0.15
6 87 0.4 11.5 0.4 <D.L. <D.L. 0.236 0.005 0.340 0.005
7 94 0.9 6.0 0.3 0.057 0.004 0.14 0.01 0.015 0.001 0.013 0.001
8 96 0.4 3.6 0.4 <D.L. 0.49 0.01 0.037 0.002 0.130 0.004
9 94 0.3 5.4 0.3 <D.L. 0.54 0.02 0.069 0.002 0.236 0.005
10 92 0.5 6.3 0.3 <D.L. 0.37 0.01 0.549 0.009 0.52 0.01
11 90 0.4 6.0 0.4 <D.L. 0.25 0.01 1.33 0.02 0.45 0.01
12 89 0.4 10.4 0.4 <D.L. <D.L. 0.307 0.006 0.219 0.005
13 92 0.3 6.6 0.3 <D.L. 0.75 0.05 0.080 0.003 0.25 0.01
14 87 0.4 11.1 0.4 0.19 0.007 0.289 0.007 0.052 0.001 <D.L.
80
4.2.4 Combination of handheld XRF, PGAI and NI
For solid, homogeneous objects, PGAA is the suitable analytical technique. For the
analysis of a quasi homogeneous object (i.e. covered with thin silvered layer, patina, gilding or
other outer protective layer which is negligible compared to the bulk volume), the combination of
XRF and PGAA can deliver reliable results and the surface-bulk differences can be interpreted
properly, as was detailed in the previous chapter 4.2.3.
If the object of interest is macroscopically heterogeneous, these two methods might not be
entirely sufficient for the comprehensive characterization of the specimen. In such cases, there is
need for a technique, which can obtain information about the 3D structure of the object. Here the
3D neutron imaging comes into the scope of the useful methods. After the full-tomography is done,
virtual cross sections can be made of any part of the object. The pixel values (gray scale) of the
cross section cuts carries information about the neutron absorption and scattering properties of the
different parts (i.e. neutron attenuation). But if the neutron attenuation properties of two
components agree using the same beam (e.g. Fe and Ni in thermal neutron beam (neutron ~1.8 Å);
Sn and Zn in cold neutron beam (~5–10 Å) [33], [168]) then imaging alone is not enough to
conclude about the materials.
Using prompt gamma activation imaging (PGAI), where the cross sectional areas of the
incoming neutron beam and the gamma collimator in front of the detector are reduced to few mm,
bulk 3D element mapping can be performed [169]. The complete 3D scan of a large object is very
time consuming, especially, if only a low neutron flux is available. To reduce the necessary beam
time, a two-step approach can be applied. The desired parts are pre-selected with the help of
neutron imaging, and then local PGAA measurements are performed [170] with adequate spatial
resolution [169]. The combination of the simultanaeously used prompt gamma activation imaging
(PGAI) and neutron tomography (NT) is known as PGAI-NT [171].
Four case studies are detailed in the following 0–0 subchapters, where XRF, local PGA
analysis and 3D neutron imaging were combined to characterize macroscopically heterogeneous
metals, where the spatial resolution of conventional PGAA is larger than the spatial heterogeneity
of the objects.
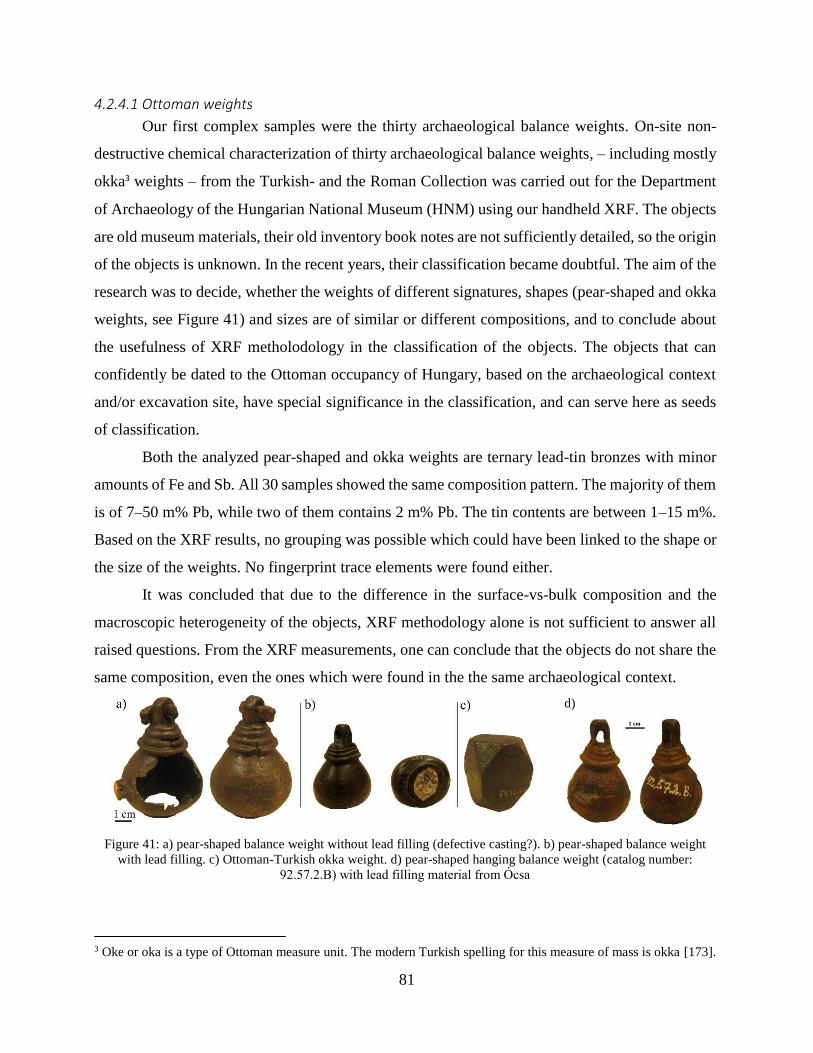
81
4.2.4.1 Ottoman weights
Our first complex samples were the thirty archaeological balance weights. On-site non-
destructive chemical characterization of thirty archaeological balance weights, – including mostly
okka3 weights – from the Turkish- and the Roman Collection was carried out for the Department
of Archaeology of the Hungarian National Museum (HNM) using our handheld XRF. The objects
are old museum materials, their old inventory book notes are not sufficiently detailed, so the origin
of the objects is unknown. In the recent years, their classification became doubtful. The aim of the
research was to decide, whether the weights of different signatures, shapes (pear-shaped and okka
weights, see Figure 41) and sizes are of similar or different compositions, and to conclude about
the usefulness of XRF metholodology in the classification of the objects. The objects that can
confidently be dated to the Ottoman occupancy of Hungary, based on the archaeological context
and/or excavation site, have special significance in the classification, and can serve here as seeds
of classification.
Both the analyzed pear-shaped and okka weights are ternary lead-tin bronzes with minor
amounts of Fe and Sb. All 30 samples showed the same composition pattern. The majority of them
is of 7–50 m% Pb, while two of them contains 2 m% Pb. The tin contents are between 1–15 m%.
Based on the XRF results, no grouping was possible which could have been linked to the shape or
the size of the weights. No fingerprint trace elements were found either.
It was concluded that due to the difference in the surface-vs-bulk composition and the
macroscopic heterogeneity of the objects, XRF methodology alone is not sufficient to answer all
raised questions. From the XRF measurements, one can conclude that the objects do not share the
same composition, even the ones which were found in the the same archaeological context.
d)
Figure 41: a) pear-shaped balance weight without lead filling (defective casting?). b) pear-shaped balance weight
with lead filling. c) Ottoman-Turkish okka weight. d) pear-shaped hanging balance weight (catalog number:
92.57.2.B) with lead filling material from Ócsa
3 Oke or oka is a type of Ottoman measure unit. The modern Turkish spelling for this measure of mass is okka [173].
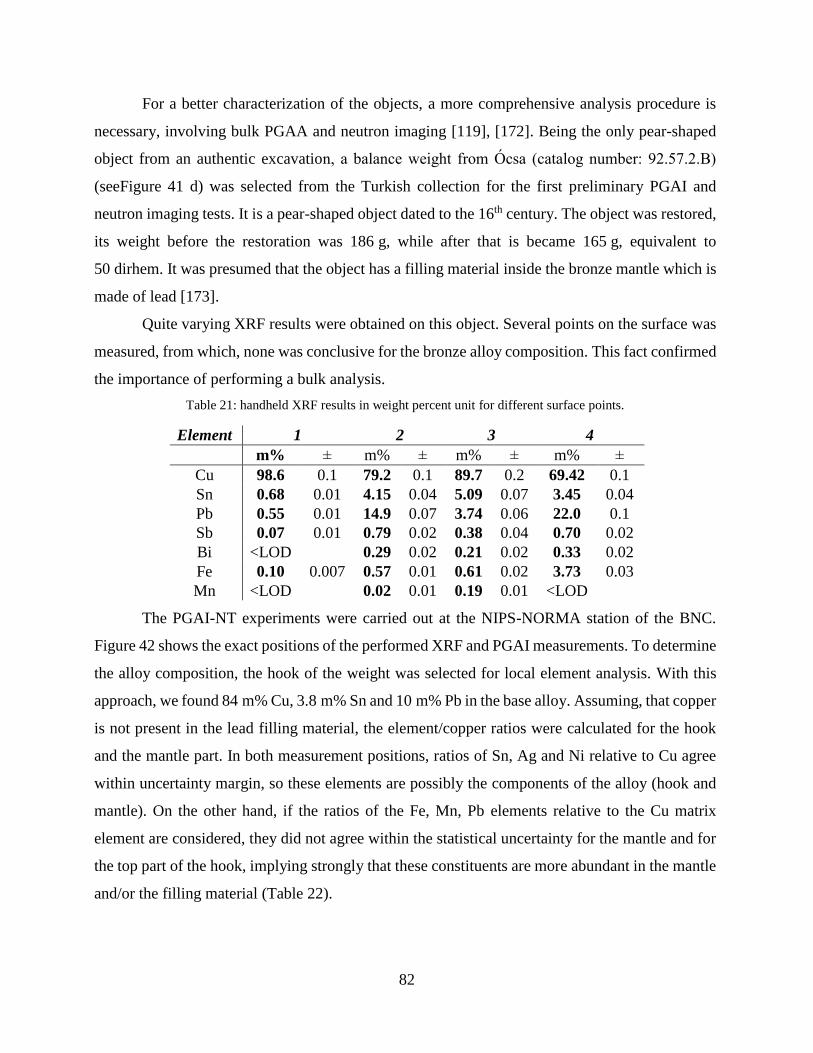
82
For a better characterization of the objects, a more comprehensive analysis procedure is
necessary, involving bulk PGAA and neutron imaging [119], [172]. Being the only pear-shaped
object from an authentic excavation, a balance weight from Ócsa (catalog number: 92.57.2.B)
(seeFigure 41 d) was selected from the Turkish collection for the first preliminary PGAI and
neutron imaging tests. It is a pear-shaped object dated to the 16th century. The object was restored,
its weight before the restoration was 186 g, while after that is became 165 g, equivalent to
50 dirhem. It was presumed that the object has a filling material inside the bronze mantle which is
made of lead [173].
Quite varying XRF results were obtained on this object. Several points on the surface was
measured, from which, none was conclusive for the bronze alloy composition. This fact confirmed
the importance of performing a bulk analysis.
Table 21: handheld XRF results in weight percent unit for different surface points.
Element 1 2 3 4
m% ± m% ± m% ± m% ±
Cu 98.6 0.1 79.2 0.1 89.7 0.2 69.42 0.1
Sn 0.68 0.01 4.15 0.04 5.09 0.07 3.45 0.04
Pb 0.55 0.01 14.9 0.07 3.74 0.06 22.0 0.1
Sb 0.07 0.01 0.79 0.02 0.38 0.04 0.70 0.02
Bi <LOD 0.29 0.02 0.21 0.02 0.33 0.02
Fe 0.10 0.007 0.57 0.01 0.61 0.02 3.73 0.03
Mn <LOD 0.02 0.01 0.19 0.01 <LOD
The PGAI-NT experiments were carried out at the NIPS-NORMA station of the BNC.
Figure 42 shows the exact positions of the performed XRF and PGAI measurements. To determine
the alloy composition, the hook of the weight was selected for local element analysis. With this
approach, we found 84 m% Cu, 3.8 m% Sn and 10 m% Pb in the base alloy. Assuming, that copper
is not present in the lead filling material, the element/copper ratios were calculated for the hook
and the mantle part. In both measurement positions, ratios of Sn, Ag and Ni relative to Cu agree
within uncertainty margin, so these elements are possibly the components of the alloy (hook and
mantle). On the other hand, if the ratios of the Fe, Mn, Pb elements relative to the Cu matrix
element are considered, they did not agree within the statistical uncertainty for the mantle and for
the top part of the hook, implying strongly that these constituents are more abundant in the mantle
and/or the filling material (Table 22).
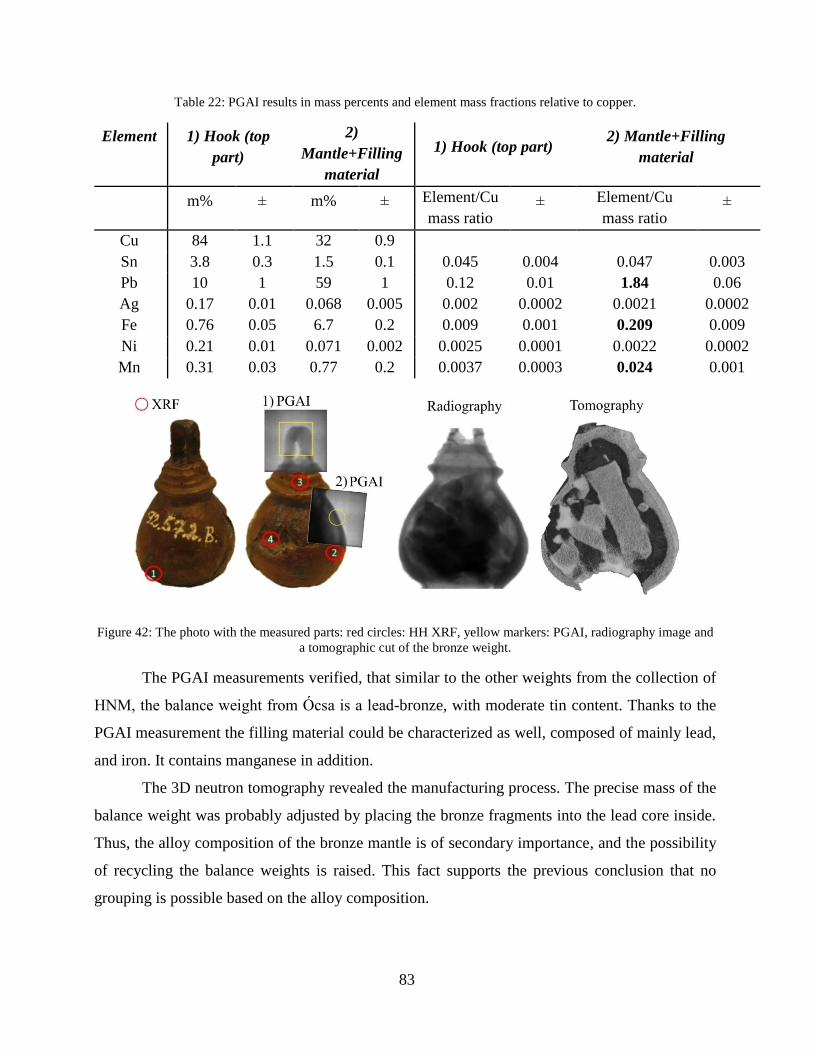
83
Table 22: PGAI results in mass percents and element mass fractions relative to copper.
Element
1) Hook (top
part)
2)
Mantle+Filling
material
1) Hook (top part) 2) Mantle+Filling
material
m% ± m% ± Element/Cu
mass ratio ± Element/Cu
mass ratio ±
Cu 84 1.1 32 0.9
Sn 3.8 0.3 1.5 0.1 0.045 0.004 0.047 0.003
Pb 10 1 59 1 0.12 0.01 1.84 0.06
Ag 0.17 0.01 0.068 0.005 0.002 0.0002 0.0021 0.0002
Fe 0.76 0.05 6.7 0.2 0.009 0.001 0.209 0.009
Ni 0.21 0.01 0.071 0.002 0.0025 0.0001 0.0022 0.0002
Mn 0.31 0.03 0.77 0.2 0.0037 0.0003 0.024 0.001
Figure 42: The photo with the measured parts: red circles: HH XRF, yellow markers: PGAI, radiography image and
a tomographic cut of the bronze weight.
The PGAI measurements verified, that similar to the other weights from the collection of
HNM, the balance weight from Ócsa is a lead-bronze, with moderate tin content. Thanks to the
PGAI measurement the filling material could be characterized as well, composed of mainly lead,
and iron. It contains manganese in addition.
The 3D neutron tomography revealed the manufacturing process. The precise mass of the
balance weight was probably adjusted by placing the bronze fragments into the lead core inside.
Thus, the alloy composition of the bronze mantle is of secondary importance, and the possibility
of recycling the balance weights is raised. This fact supports the previous conclusion that no
grouping is possible based on the alloy composition.
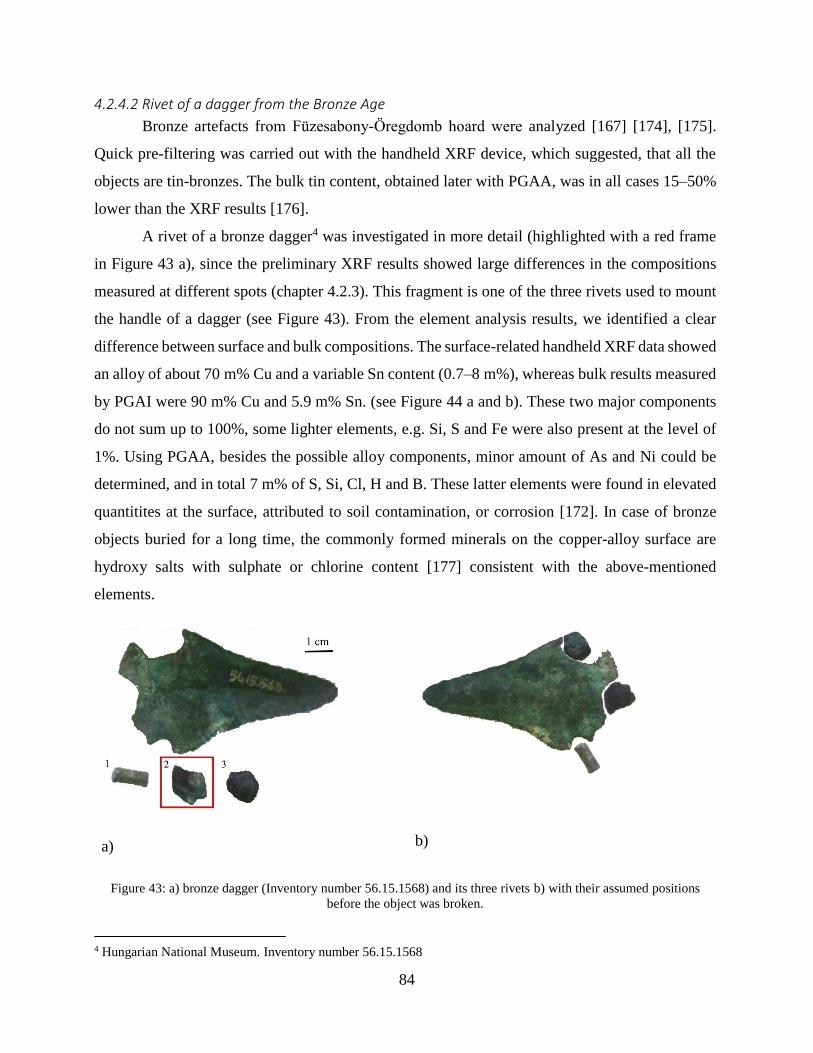
84
4.2.4.2 Rivet of a dagger from the Bronze Age
Bronze artefacts from Füzesabony-Öregdomb hoard were analyzed [167] [174], [175].
Quick pre-filtering was carried out with the handheld XRF device, which suggested, that all the
objects are tin-bronzes. The bulk tin content, obtained later with PGAA, was in all cases 15–50%
lower than the XRF results [176].
A rivet of a bronze dagger4 was investigated in more detail (highlighted with a red frame
in Figure 43 a), since the preliminary XRF results showed large differences in the compositions
measured at different spots (chapter 4.2.3). This fragment is one of the three rivets used to mount
the handle of a dagger (see Figure 43). From the element analysis results, we identified a clear
difference between surface and bulk compositions. The surface-related handheld XRF data showed
an alloy of about 70 m% Cu and a variable Sn content (0.7–8 m%), whereas bulk results measured
by PGAI were 90 m% Cu and 5.9 m% Sn. (see Figure 44 a and b). These two major components
do not sum up to 100%, some lighter elements, e.g. Si, S and Fe were also present at the level of
1%. Using PGAA, besides the possible alloy components, minor amount of As and Ni could be
determined, and in total 7 m% of S, Si, Cl, H and B. These latter elements were found in elevated
quantitites at the surface, attributed to soil contamination, or corrosion [172]. In case of bronze
objects buried for a long time, the commonly formed minerals on the copper-alloy surface are
hydroxy salts with sulphate or chlorine content [177] consistent with the above-mentioned
elements.
a)
b)
Figure 43: a) bronze dagger (Inventory number 56.15.1568) and its three rivets b) with their assumed positions
before the object was broken.
4 Hungarian National Museum. Inventory number 56.15.1568
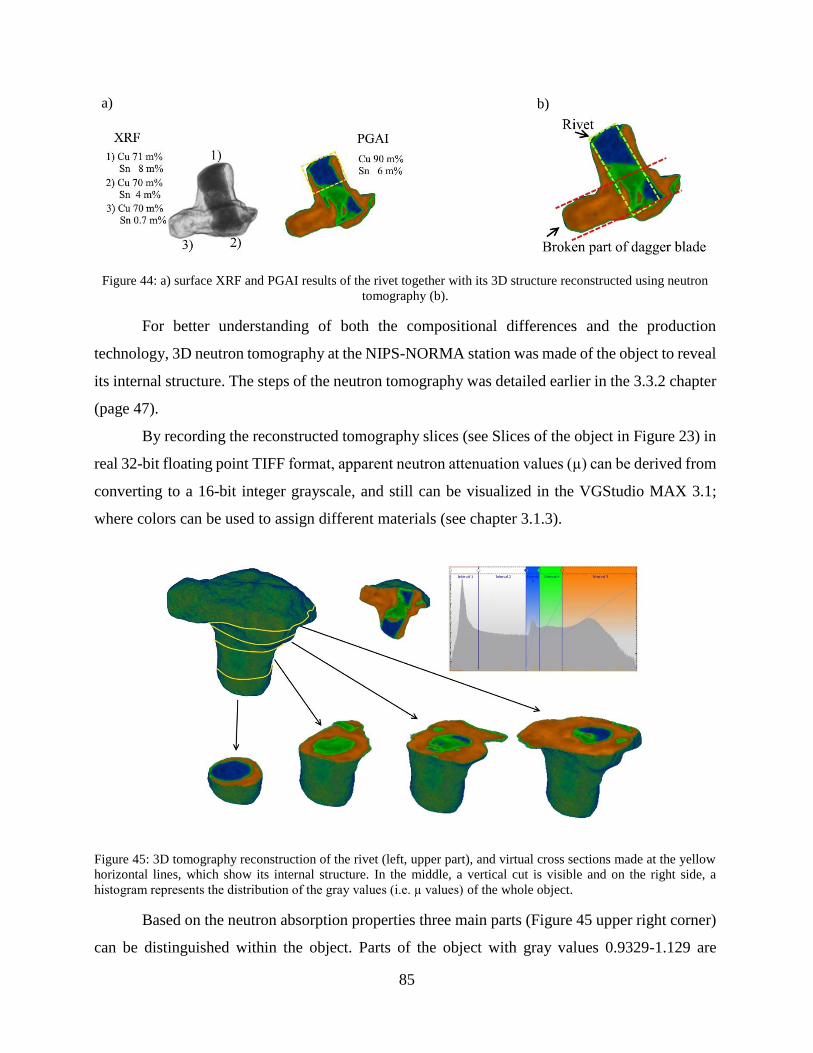
85
a)
b)
Figure 44: a) surface XRF and PGAI results of the rivet together with its 3D structure reconstructed using neutron
tomography (b).
For better understanding of both the compositional differences and the production
technology, 3D neutron tomography at the NIPS-NORMA station was made of the object to reveal
its internal structure. The steps of the neutron tomography was detailed earlier in the 3.3.2 chapter
(page 47).
By recording the reconstructed tomography slices (see Slices of the object in Figure 23) in
real 32-bit floating point TIFF format, apparent neutron attenuation values (µ) can be derived from
converting to a 16-bit integer grayscale, and still can be visualized in the VGStudio MAX 3.1;
where colors can be used to assign different materials (see chapter 3.1.3).
Figure 45: 3D tomography reconstruction of the rivet (left, upper part), and virtual cross sections made at the yellow
horizontal lines, which show its internal structure. In the middle, a vertical cut is visible and on the right side, a
histogram represents the distribution of the gray values (i.e. µ values) of the whole object.
Based on the neutron absorption properties three main parts (Figure 45 upper right corner)
can be distinguished within the object. Parts of the object with gray values 0.9329-1.129 are
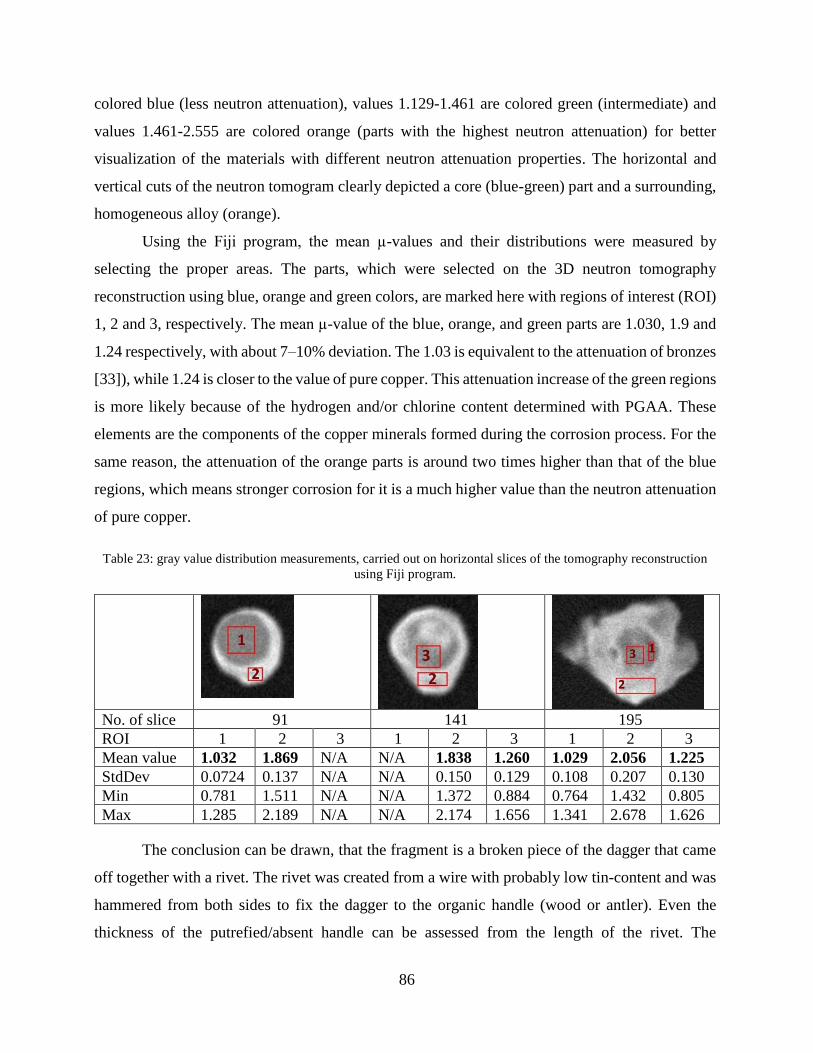
86
colored blue (less neutron attenuation), values 1.129-1.461 are colored green (intermediate) and
values 1.461-2.555 are colored orange (parts with the highest neutron attenuation) for better
visualization of the materials with different neutron attenuation properties. The horizontal and
vertical cuts of the neutron tomogram clearly depicted a core (blue-green) part and a surrounding,
homogeneous alloy (orange).
Using the Fiji program, the mean µ-values and their distributions were measured by
selecting the proper areas. The parts, which were selected on the 3D neutron tomography
reconstruction using blue, orange and green colors, are marked here with regions of interest (ROI)
1, 2 and 3, respectively. The mean µ-value of the blue, orange, and green parts are 1.030, 1.9 and
1.24 respectively, with about 7–10% deviation. The 1.03 is equivalent to the attenuation of bronzes
[33]), while 1.24 is closer to the value of pure copper. This attenuation increase of the green regions
is more likely because of the hydrogen and/or chlorine content determined with PGAA. These
elements are the components of the copper minerals formed during the corrosion process. For the
same reason, the attenuation of the orange parts is around two times higher than that of the blue
regions, which means stronger corrosion for it is a much higher value than the neutron attenuation
of pure copper.
Table 23: gray value distribution measurements, carried out on horizontal slices of the tomography reconstruction
using Fiji program.
No. of slice 91 141 195
ROI 1 2 3 1 2 3 1 2 3
Mean value 1.032 1.869 N/A N/A 1.838 1.260 1.029 2.056 1.225
StdDev 0.0724 0.137 N/A N/A 0.150 0.129 0.108 0.207 0.130
Min 0.781 1.511 N/A N/A 1.372 0.884 0.764 1.432 0.805
Max 1.285 2.189 N/A N/A 2.174 1.656 1.341 2.678 1.626
The conclusion can be drawn, that the fragment is a broken piece of the dagger that came
off together with a rivet. The rivet was created from a wire with probably low tin-content and was
hammered from both sides to fix the dagger to the organic handle (wood or antler). Even the
thickness of the putrefied/absent handle can be assessed from the length of the rivet. The
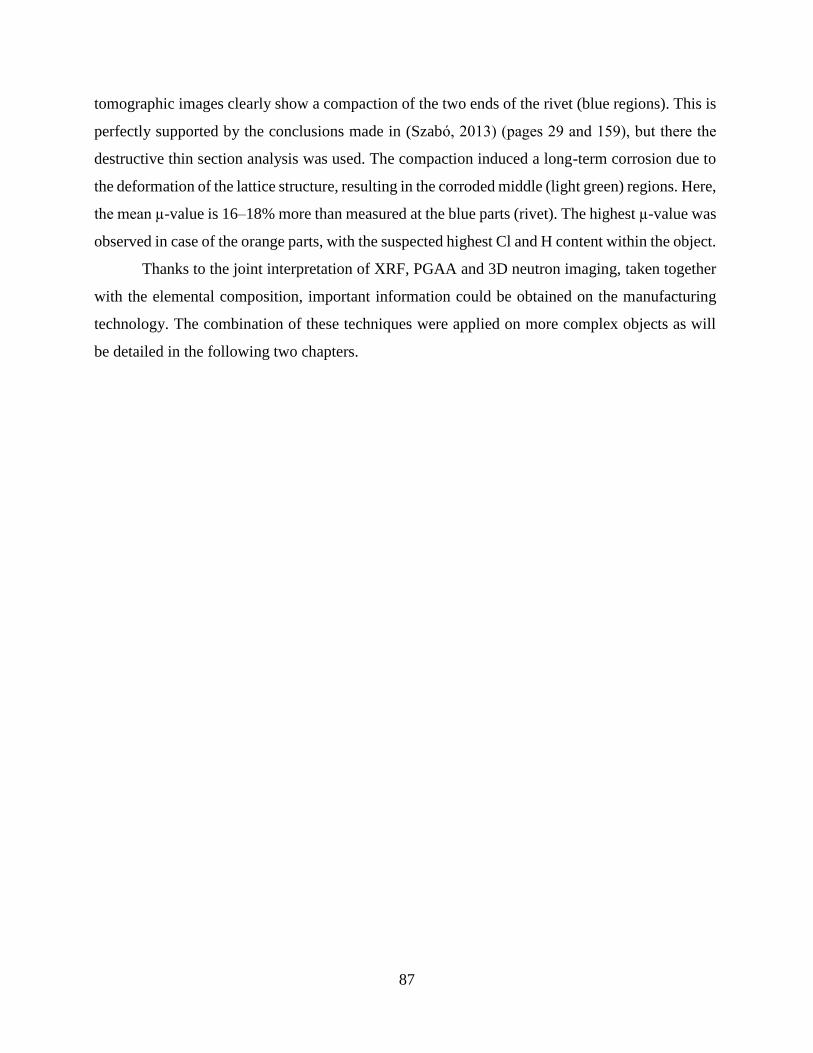
87
tomographic images clearly show a compaction of the two ends of the rivet (blue regions). This is
perfectly supported by the conclusions made in (Szabó, 2013) (pages 29 and 159), but there the
destructive thin section analysis was used. The compaction induced a long-term corrosion due to
the deformation of the lattice structure, resulting in the corroded middle (light green) regions. Here,
the mean µ-value is 16–18% more than measured at the blue parts (rivet). The highest µ-value was
observed in case of the orange parts, with the suspected highest Cl and H content within the object.
Thanks to the joint interpretation of XRF, PGAA and 3D neutron imaging, taken together
with the elemental composition, important information could be obtained on the manufacturing
technology. The combination of these techniques were applied on more complex objects as will
be detailed in the following two chapters.
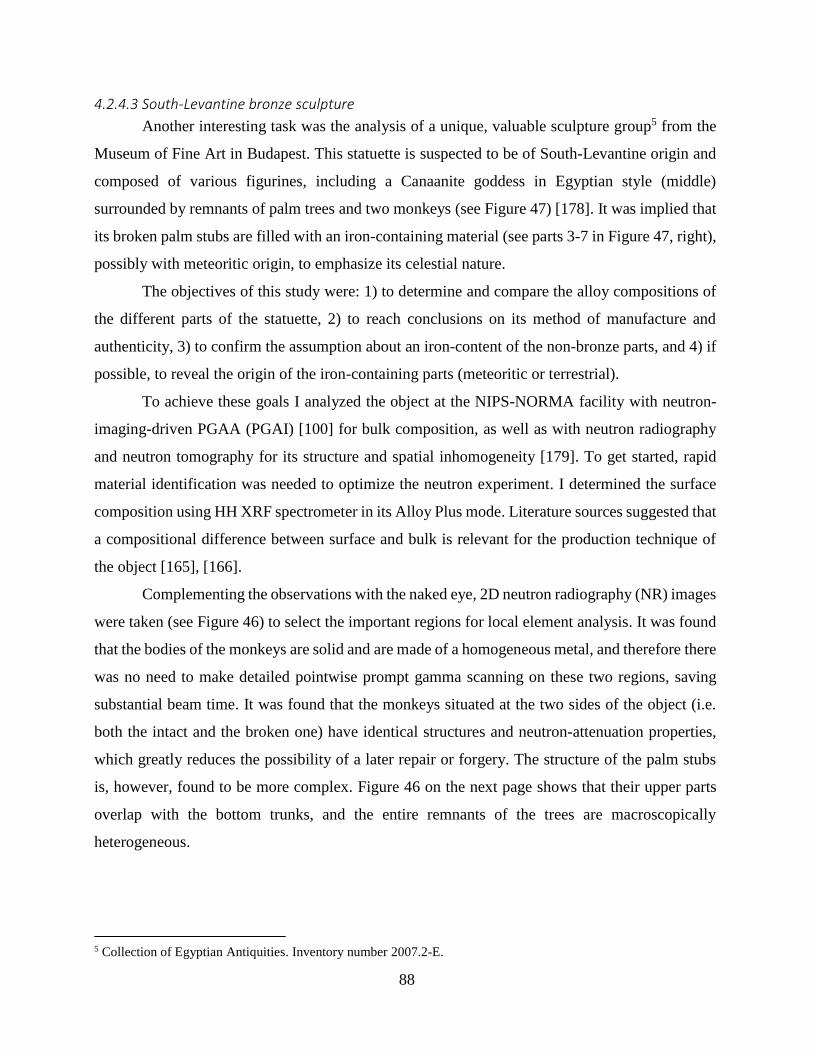
88
4.2.4.3 South-Levantine bronze sculpture
Another interesting task was the analysis of a unique, valuable sculpture group5 from the
Museum of Fine Art in Budapest. This statuette is suspected to be of South-Levantine origin and
composed of various figurines, including a Canaanite goddess in Egyptian style (middle)
surrounded by remnants of palm trees and two monkeys (see Figure 47) [178]. It was implied that
its broken palm stubs are filled with an iron-containing material (see parts 3-7 in Figure 47, right),
possibly with meteoritic origin, to emphasize its celestial nature.
The objectives of this study were: 1) to determine and compare the alloy compositions of
the different parts of the statuette, 2) to reach conclusions on its method of manufacture and
authenticity, 3) to confirm the assumption about an iron-content of the non-bronze parts, and 4) if
possible, to reveal the origin of the iron-containing parts (meteoritic or terrestrial).
To achieve these goals I analyzed the object at the NIPS-NORMA facility with neutron-
imaging-driven PGAA (PGAI) [100] for bulk composition, as well as with neutron radiography
and neutron tomography for its structure and spatial inhomogeneity [179]. To get started, rapid
material identification was needed to optimize the neutron experiment. I determined the surface
composition using HH XRF spectrometer in its Alloy Plus mode. Literature sources suggested that
a compositional difference between surface and bulk is relevant for the production technique of
the object [165], [166].
Complementing the observations with the naked eye, 2D neutron radiography (NR) images
were taken (see Figure 46) to select the important regions for local element analysis. It was found
that the bodies of the monkeys are solid and are made of a homogeneous metal, and therefore there
was no need to make detailed pointwise prompt gamma scanning on these two regions, saving
substantial beam time. It was found that the monkeys situated at the two sides of the object (i.e.
both the intact and the broken one) have identical structures and neutron-attenuation properties,
which greatly reduces the possibility of a later repair or forgery. The structure of the palm stubs
is, however, found to be more complex. Figure 46 on the next page shows that their upper parts
overlap with the bottom trunks, and the entire remnants of the trees are macroscopically
heterogeneous.
5 Collection of Egyptian Antiquities. Inventory number 2007.2-E.
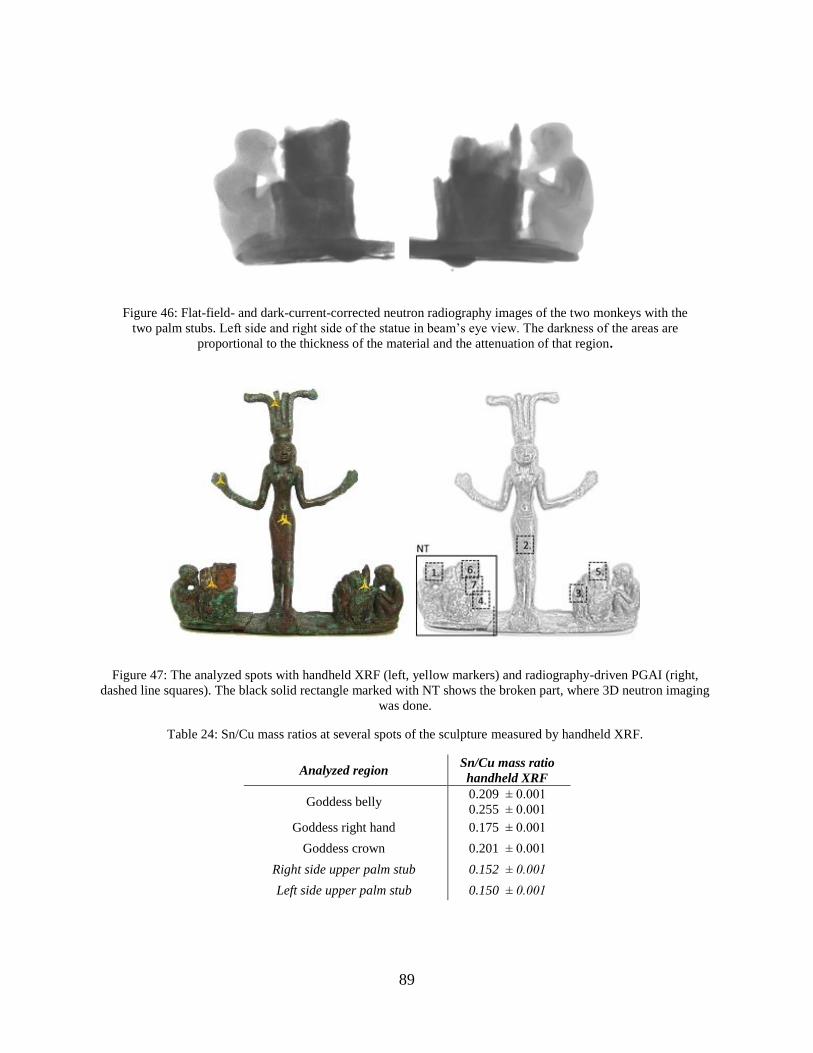
89
Figure 46: Flat-field- and dark-current-corrected neutron radiography images of the two monkeys with the
two palm stubs. Left side and right side of the statue in beam’s eye view. The darkness of the areas are
proportional to the thickness of the material and the attenuation of that region.
Figure 47: The analyzed spots with handheld XRF (left, yellow markers) and radiography-driven PGAI (right,
dashed line squares). The black solid rectangle marked with NT shows the broken part, where 3D neutron imaging
was done.
Table 24: Sn/Cu mass ratios at several spots of the sculpture measured by handheld XRF.
Analyzed region Sn/Cu mass ratio
handheld XRF
Goddess belly 0.209 ± 0.001
0.255 ± 0.001
Goddess right hand 0.175 ± 0.001
Goddess crown 0.201 ± 0.001
Right side upper palm stub 0.152 ± 0.001
Left side upper palm stub 0.150 ± 0.001
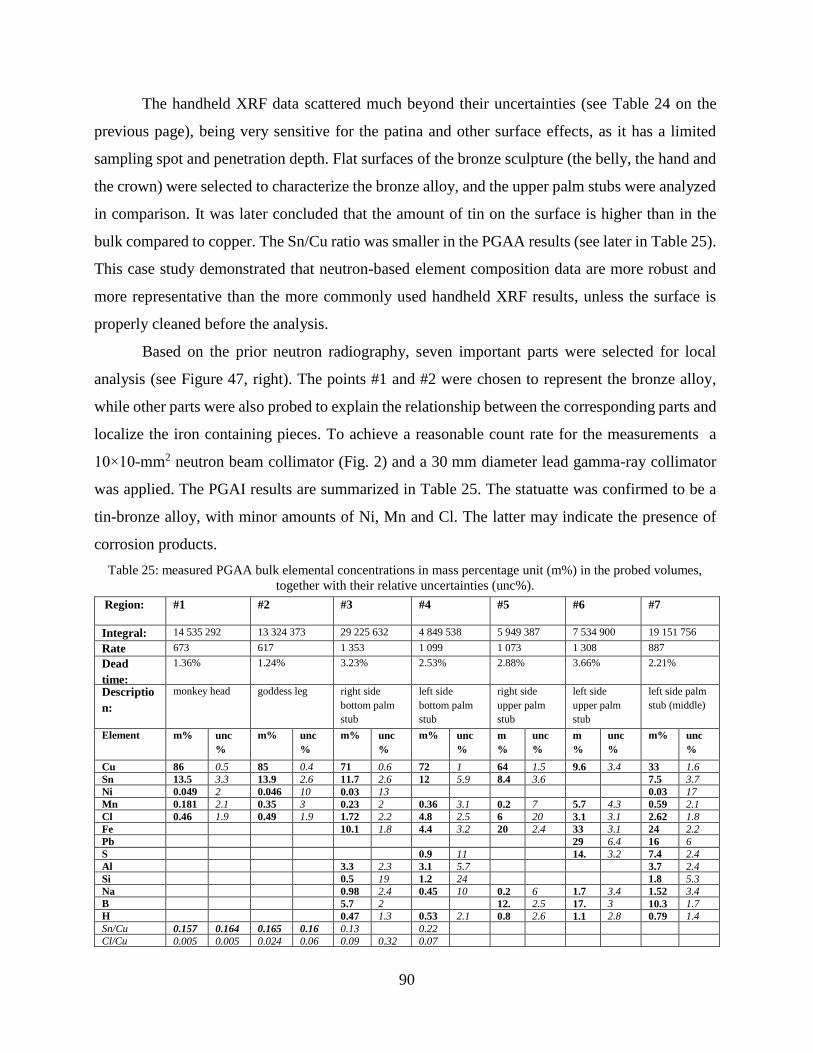
90
The handheld XRF data scattered much beyond their uncertainties (see Table 24 on the
previous page), being very sensitive for the patina and other surface effects, as it has a limited
sampling spot and penetration depth. Flat surfaces of the bronze sculpture (the belly, the hand and
the crown) were selected to characterize the bronze alloy, and the upper palm stubs were analyzed
in comparison. It was later concluded that the amount of tin on the surface is higher than in the
bulk compared to copper. The Sn/Cu ratio was smaller in the PGAA results (see later in Table 25).
This case study demonstrated that neutron-based element composition data are more robust and
more representative than the more commonly used handheld XRF results, unless the surface is
properly cleaned before the analysis.
Based on the prior neutron radiography, seven important parts were selected for local
analysis (see Figure 47, right). The points #1 and #2 were chosen to represent the bronze alloy,
while other parts were also probed to explain the relationship between the corresponding parts and
localize the iron containing pieces. To achieve a reasonable count rate for the measurements a
10×10-mm2 neutron beam collimator (Fig. 2) and a 30 mm diameter lead gamma-ray collimator
was applied. The PGAI results are summarized in Table 25. The statuatte was confirmed to be a
tin-bronze alloy, with minor amounts of Ni, Mn and Cl. The latter may indicate the presence of
corrosion products.
Table 25: measured PGAA bulk elemental concentrations in mass percentage unit (m%) in the probed volumes,
together with their relative uncertainties (unc%).
Region: #1 #2 #3 #4 #5 #6 #7
Integral: 14 535 292 13 324 373 29 225 632 4 849 538 5 949 387 7 534 900 19 151 756
Rate
(cps):
673 617 1 353 1 099 1 073 1 308 887
Dead
time:
1.36% 1.24% 3.23% 2.53% 2.88% 3.66% 2.21%
Descriptio
n:
monkey head goddess leg right side
bottom palm
stub
left side
bottom palm
stub
right side
upper palm
stub
left side
upper palm
stub
left side palm
stub (middle)
Element m% unc
%
m% unc
%
m% unc
%
m% unc
%
m
%
unc
%
m
%
unc
%
m% unc
%
Cu 86 0.5 85 0.4 71 0.6 72 1 64 1.5 9.6 3.4 33 1.6
Sn 13.5 3.3 13.9 2.6 11.7 2.6 12 5.9 8.4 3.6
7.5 3.7
Ni 0.049 2 0.046 10 0.03
2
13
0.03 17
Mn 0.181 2.1 0.35 3 0.23
4
2 0.36 3.1 0.2
8
7 5.7 4.3 0.59 2.1
Cl 0.46 1.9 0.49 1.9 1.72 2.2 4.8 2.5 6 20 3.1
2
3.1 2.62 1.8
Fe
10.1 1.8 4.4 3.2 20 2.4 33 3.1 24 2.2
Pb
29 6.4 16 6
S
0.9 11
14.
1
3.2 7.4 2.4
Al
3.3 2.3 3.1 5.7
3.7 2.4
Si
0.5 19 1.2 24
1.8 5.3
Na
0.98 2.4 0.45 10 0.2
3
6 1.7 3.4 1.52 3.4
B
5.7
pp
m
2
12.
8
pp
m
2.5 17.
3
pp
m
3 10.3
pp
m
1.7
H
0.47
3
1.3 0.53 2.1 0.8
9
2.6 1.1
8
2.8 0.79
6
1.4
Sn/Cu 0.157
±
0.005
0.164
±
0.004
0.165
±
0.004
0.16
±
0.01
0.13
1 ±
0.00
5
0.22
7 ±
0.00
9
Cl/Cu 0.005
3 ±
0.000
1
0.005
8 ±
0.000
1
0.024
2 ±
0.000
6
0.06
6 ±
0.00
2
0.09
±
0.02
0.32
5 ±
0.01
5
0.07
9 ±
0.00
2
91
Considering, that tin is present only in the copper alloy, the Sn/Cu ratio was calculated for
each probed volume. For the corroded bronze parts, the Sn/Cu ratio is 0.157 ± 0.005 and
0.164 ± 0.004. Based on the analyses carried out at different parts of the sculpture group it was
concluded that the figurines, the base and the lower parts of the palm stubs are all made of the the
same tin-bronze alloy. Iron was determined in both palm stubs and it is present in elevated amounts
in the upper parts.
Complementary information was obtained with TOF-ND, at the MTA Wigner Research
Centre for Physics by György Káli. The crystalline structure confirmed the use of lost-wax casting.
The lattice parameter based on the two-component assumption yielded a 14 total m% tin. This
agreed well with our result using using PGAA. Comparison with other available compositional
data from the Middle Bronze Age [180]–[182] shows that the Sn content detected here is in line
with the Sn-content of other finely detailed ornamental figurines or expensive weapons from the
Bronze Age Levant culture [180], [181].
The hypothesized iron content in the palm stubs was successfully determined by PGAA.
Note that measuring oxygen by this method is difficult due to its very low partial gamma-ray
production cross-sections, so oxygen was not quantified. To verify its meteoritic origin, texture
analysis was carried out using ToF-ND method, to identify textures typical for meteorites (e.g.
Widmanstätten pattern). The measurements made at the iron-containing part of the sculpture group
indicated no intact metallic Fe-phase, i.e. the iron is present in completely oxidized form (e.g.
hematite, magnetite or pyrite). Thus, concerning the source of the iron, only speculations are
available so far. The PGAA method itself is suitable to confirm meteoritic origin of completely
corroded iron artifacts based on Ni and Co signatures, as was previously shown in [183]. However,
significant amounts of Ni and Co are not present in the analyzed material, so the theory implying
re-use of an iron-nickel meteorite can be confidently excluded.
Afterwards, the left part (a sitting monkey and a palm stub) of the object was detached
from the statuette at an existing fracture and was subject of an imaging experiment to reveal the
properties of the macroscopic imhomogeneities observed earlier in the palm stubs. The steps of
imaging and 3D image reconstruction was detailed on page 47 (in chapter 3.3.2). The volume-
rendered 3D tomography and a virtual cross section are visible in Figure 48. These 3D data are
easier to interpret than 2D radiograms, since the projected thickness does not influence the
interpretation of the attenuation information. The lower grayscale values (darker areas) correspond
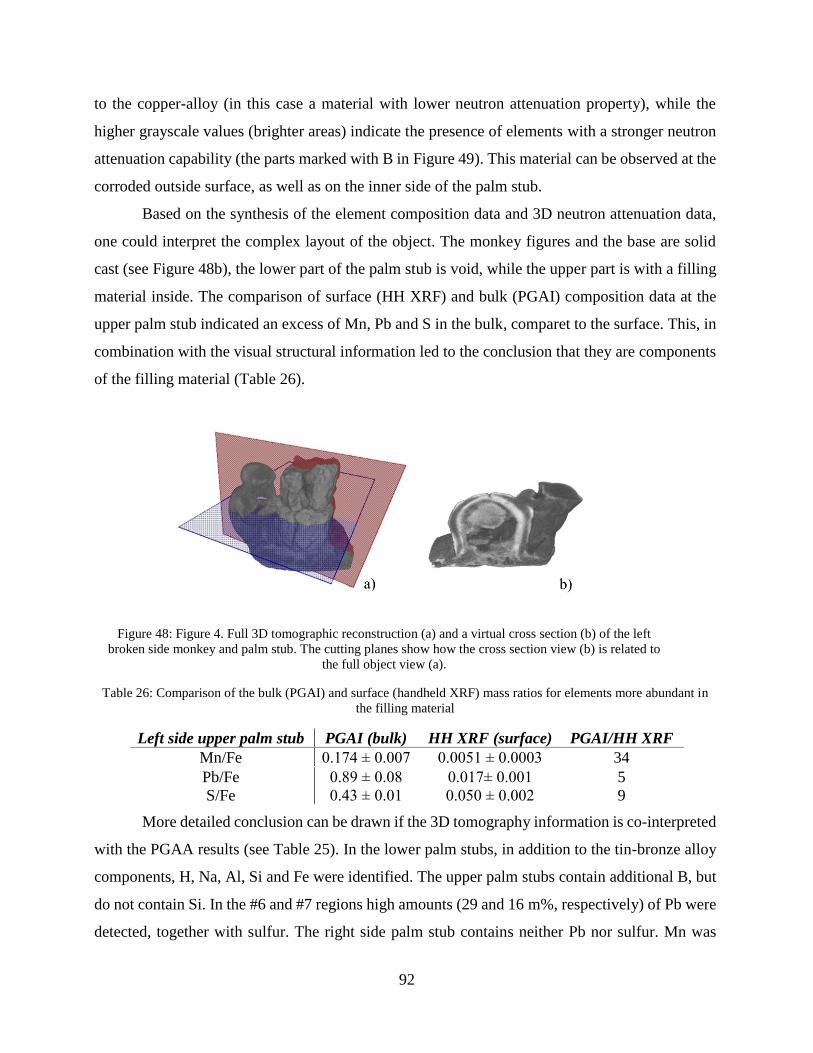
92
to the copper-alloy (in this case a material with lower neutron attenuation property), while the
higher grayscale values (brighter areas) indicate the presence of elements with a stronger neutron
attenuation capability (the parts marked with B in Figure 49). This material can be observed at the
corroded outside surface, as well as on the inner side of the palm stub.
Based on the synthesis of the element composition data and 3D neutron attenuation data,
one could interpret the complex layout of the object. The monkey figures and the base are solid
cast (see Figure 48b), the lower part of the palm stub is void, while the upper part is with a filling
material inside. The comparison of surface (HH XRF) and bulk (PGAI) composition data at the
upper palm stub indicated an excess of Mn, Pb and S in the bulk, comparet to the surface. This, in
combination with the visual structural information led to the conclusion that they are components
of the filling material (Table 26).
Figure 48: Figure 4. Full 3D tomographic reconstruction (a) and a virtual cross section (b) of the left
broken side monkey and palm stub. The cutting planes show how the cross section view (b) is related to
the full object view (a).
Table 26: Comparison of the bulk (PGAI) and surface (handheld XRF) mass ratios for elements more abundant in
the filling material
Left side upper palm stub PGAI (bulk) HH XRF (surface) PGAI/HH XRF
Mn/Fe 0.174 ± 0.007 0.0051 ± 0.0003 34
Pb/Fe 0.89 ± 0.08 0.017± 0.001 5
S/Fe 0.43 ± 0.01 0.050 ± 0.002 9
More detailed conclusion can be drawn if the 3D tomography information is co-interpreted
with the PGAA results (see Table 25). In the lower palm stubs, in addition to the tin-bronze alloy
components, H, Na, Al, Si and Fe were identified. The upper palm stubs contain additional B, but
do not contain Si. In the #6 and #7 regions high amounts (29 and 16 m%, respectively) of Pb were
detected, together with sulfur. The right side palm stub contains neither Pb nor sulfur. Mn was
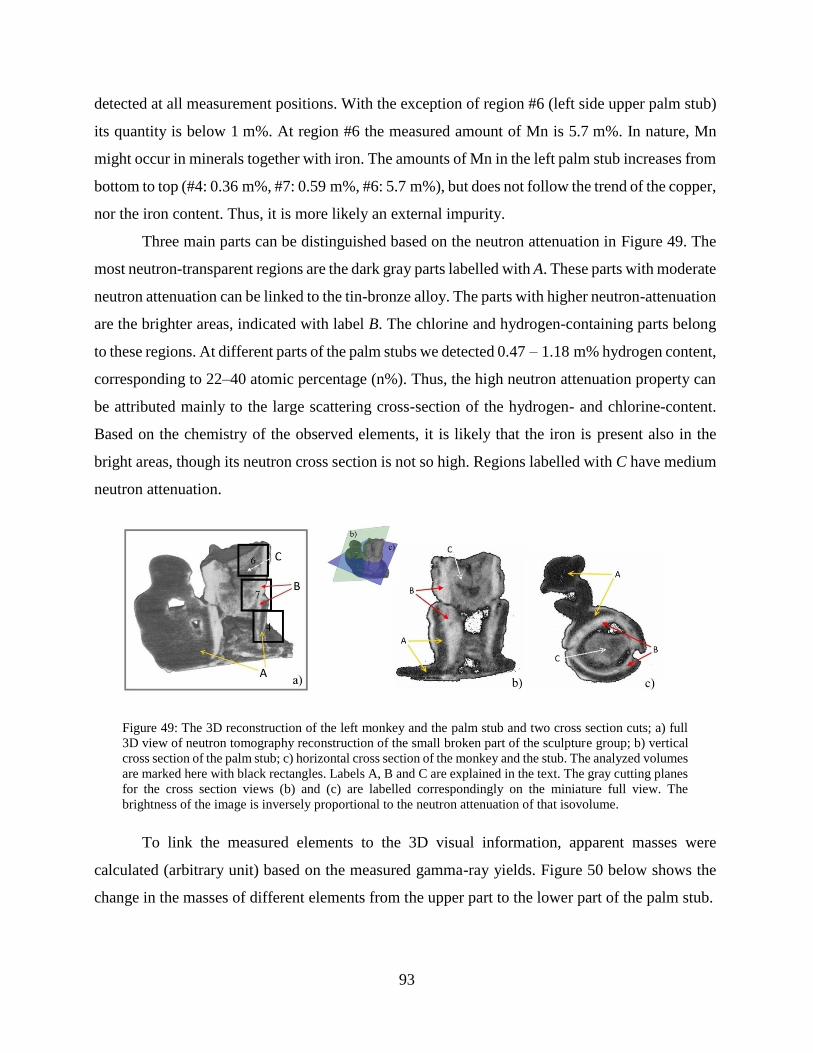
93
detected at all measurement positions. With the exception of region #6 (left side upper palm stub)
its quantity is below 1 m%. At region #6 the measured amount of Mn is 5.7 m%. In nature, Mn
might occur in minerals together with iron. The amounts of Mn in the left palm stub increases from
bottom to top (#4: 0.36 m%, #7: 0.59 m%, #6: 5.7 m%), but does not follow the trend of the copper,
nor the iron content. Thus, it is more likely an external impurity.
Three main parts can be distinguished based on the neutron attenuation in Figure 49. The
most neutron-transparent regions are the dark gray parts labelled with A. These parts with moderate
neutron attenuation can be linked to the tin-bronze alloy. The parts with higher neutron-attenuation
are the brighter areas, indicated with label B. The chlorine and hydrogen-containing parts belong
to these regions. At different parts of the palm stubs we detected 0.47 – 1.18 m% hydrogen content,
corresponding to 22–40 atomic percentage (n%). Thus, the high neutron attenuation property can
be attributed mainly to the large scattering cross-section of the hydrogen- and chlorine-content.
Based on the chemistry of the observed elements, it is likely that the iron is present also in the
bright areas, though its neutron cross section is not so high. Regions labelled with C have medium
neutron attenuation.
Figure 49: The 3D reconstruction of the left monkey and the palm stub and two cross section cuts; a) full
3D view of neutron tomography reconstruction of the small broken part of the sculpture group; b) vertical
cross section of the palm stub; c) horizontal cross section of the monkey and the stub. The analyzed volumes
are marked here with black rectangles. Labels A, B and C are explained in the text. The gray cutting planes
for the cross section views (b) and (c) are labelled correspondingly on the miniature full view. The
brightness of the image is inversely proportional to the neutron attenuation of that isovolume.
To link the measured elements to the 3D visual information, apparent masses were
calculated (arbitrary unit) based on the measured gamma-ray yields. Figure 50 below shows the
change in the masses of different elements from the upper part to the lower part of the palm stub.
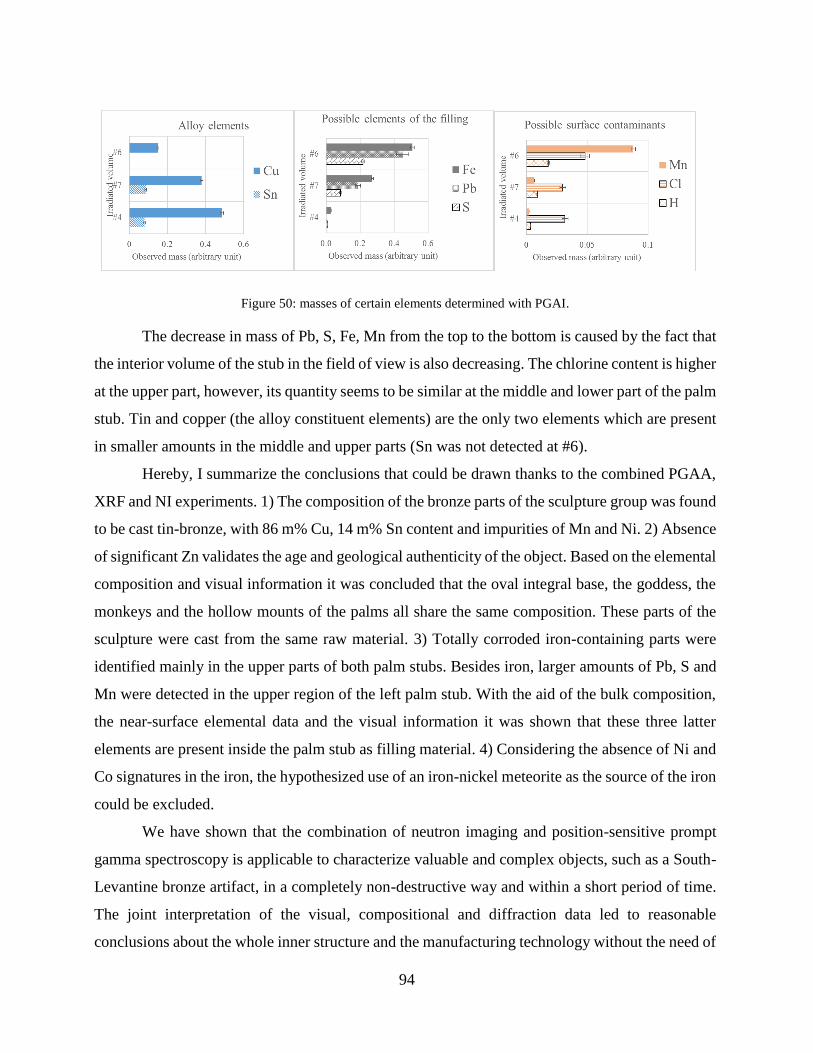
94
Figure 50: masses of certain elements determined with PGAI.
The decrease in mass of Pb, S, Fe, Mn from the top to the bottom is caused by the fact that
the interior volume of the stub in the field of view is also decreasing. The chlorine content is higher
at the upper part, however, its quantity seems to be similar at the middle and lower part of the palm
stub. Tin and copper (the alloy constituent elements) are the only two elements which are present
in smaller amounts in the middle and upper parts (Sn was not detected at #6).
Hereby, I summarize the conclusions that could be drawn thanks to the combined PGAA,
XRF and NI experiments. 1) The composition of the bronze parts of the sculpture group was found
to be cast tin-bronze, with 86 m% Cu, 14 m% Sn content and impurities of Mn and Ni. 2) Absence
of significant Zn validates the age and geological authenticity of the object. Based on the elemental
composition and visual information it was concluded that the oval integral base, the goddess, the
monkeys and the hollow mounts of the palms all share the same composition. These parts of the
sculpture were cast from the same raw material. 3) Totally corroded iron-containing parts were
identified mainly in the upper parts of both palm stubs. Besides iron, larger amounts of Pb, S and
Mn were detected in the upper region of the left palm stub. With the aid of the bulk composition,
the near-surface elemental data and the visual information it was shown that these three latter
elements are present inside the palm stub as filling material. 4) Considering the absence of Ni and
Co signatures in the iron, the hypothesized use of an iron-nickel meteorite as the source of the iron
could be excluded.
We have shown that the combination of neutron imaging and position-sensitive prompt
gamma spectroscopy is applicable to characterize valuable and complex objects, such as a South-
Levantine bronze artifact, in a completely non-destructive way and within a short period of time.
The joint interpretation of the visual, compositional and diffraction data led to reasonable
conclusions about the whole inner structure and the manufacturing technology without the need of
95
a high-resolution elemental mapping of the entire object. This made it possible to judge the object’s
significance in a cultural-heritage context in a more objective way than using only one method and
without an unwanted activation risk.
4.2.4.4 Corroded spearhead from the Late Bronze Age
PGAA is suitable for the non-destructive analysis of corroded archaeological finds, and
can reveal their original alloy composition (see chapter 4.2.3). Copper-based alloy artefacts from
the Bronze Age are often covered with a thick layer of corrosion products, or with soil remains.
The present object of interest is a spearhead6 which was found in the marshlands of Kikinda, in
the northern part of Serbia. The primary goal was to determine the alloy composition i.e. if the
copper and tin ratio indicates a high-quality functional weapon.
Because the whole object is evenly covered with patina, XRF alone is not suitable to
conclude about its original elemental composition. For this reason I contributed to this project7
with both XRF and PGAA measurements. The altered layer on the surface can be the result either
of corrosion processes while buried possibly in a humid muddy environment, or of surface
treatment carried out earlier in the museum for the purpose of restoration, none of which was
allowed to be removed (see the photo of the object, Figure 51 a).
At first, I did on-site handheld XRF measurements in the HNM for the determination of
the alloy-type. Based on the surface results, the object is a copper-tin alloy (see Table 27, column
handheld XRF). Antimony, lead and iron content was measured in minor amounts. Due to the high
Sn content determined with XRF, a strongly altered surface layer was assumed, with a prevalence
of tin-compounds. For the more accurate characterization of the object, neutron imaging-driven
local PGAI mesurements were carried out at three selected points: 1) at the lower part, about 5 mm
from the end of the object, 2) at the middle part, with wooden shaft fragment inside, 3) at the upper
metal part, well above the cavity visible inside the object in the neutron radiography (see Figure
51 and Table 27).
The results are summarized in Table 27. Note, that neither PGAA nor XRF are sensitive to
oxygen, and since the chemical form and oxidation state of the elements are unknown, the accurate
oxygen content cannot be given.
6 The object was passed into the collection of the Hungarian National Museum in 1893 from the collector László
Pokorni [187]. Inventory number 75.1893.1200. 7 The Spear Project started at 2017 with the supervision of János Gábor Tarbay [187].
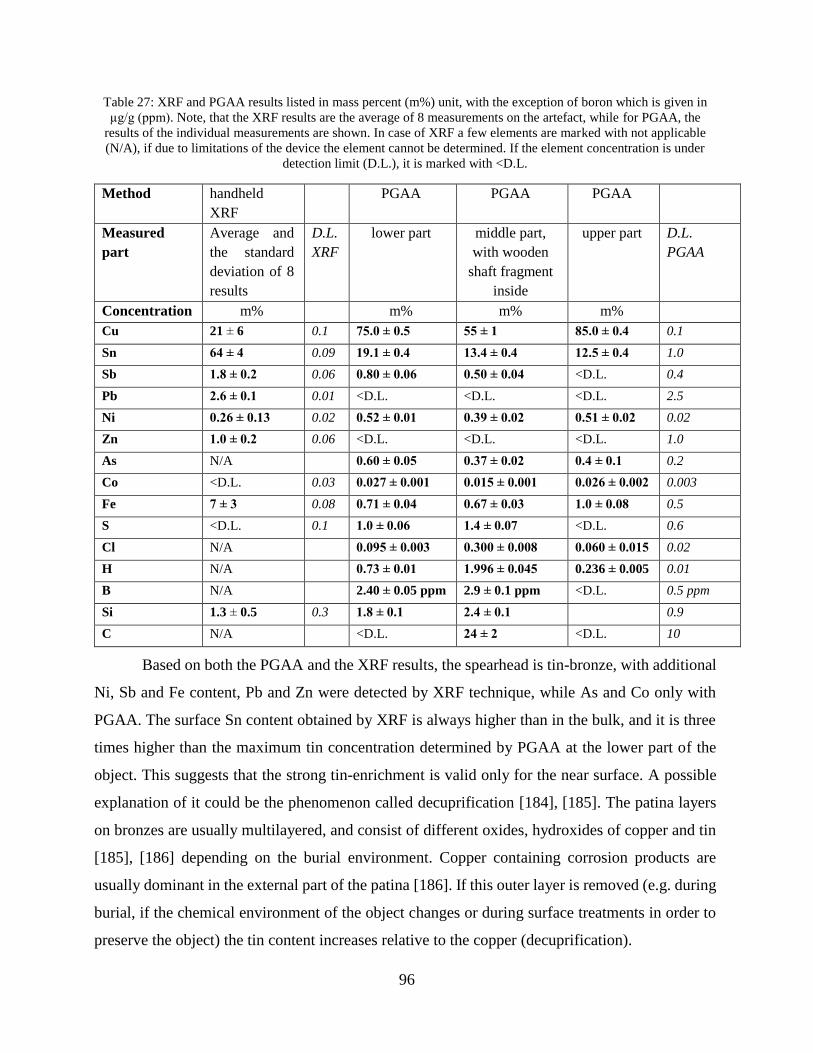
96
Table 27: XRF and PGAA results listed in mass percent (m%) unit, with the exception of boron which is given in
µg/g (ppm). Note, that the XRF results are the average of 8 measurements on the artefact, while for PGAA, the
results of the individual measurements are shown. In case of XRF a few elements are marked with not applicable
(N/A), if due to limitations of the device the element cannot be determined. If the element concentration is under
detection limit (D.L.), it is marked with <D.L.
Method handheld
XRF
PGAA PGAA PGAA
Measured
part
Average and
the standard
deviation of 8
results
D.L.
XRF
lower part middle part,
with wooden
shaft fragment
inside
upper part D.L.
PGAA
Concentration m% m% m% m%
Cu 21 ± 6 0.1 75.0 ± 0.5 55 ± 1 85.0 ± 0.4 0.1
Sn 64 ± 4 0.09 19.1 ± 0.4 13.4 ± 0.4 12.5 ± 0.4 1.0
Sb 1.8 ± 0.2 0.06 0.80 ± 0.06 0.50 ± 0.04 <D.L. 0.4
Pb 2.6 ± 0.1 0.01 <D.L. <D.L. <D.L. 2.5
Ni 0.26 ± 0.13 0.02 0.52 ± 0.01 0.39 ± 0.02 0.51 ± 0.02 0.02
Zn 1.0 ± 0.2 0.06 <D.L. <D.L. <D.L. 1.0
As N/A 0.60 ± 0.05 0.37 ± 0.02 0.4 ± 0.1 0.2
Co <D.L. 0.03 0.027 ± 0.001 0.015 ± 0.001 0.026 ± 0.002 0.003
Fe 7 ± 3 0.08 0.71 ± 0.04 0.67 ± 0.03 1.0 ± 0.08 0.5
S <D.L. 0.1 1.0 ± 0.06 1.4 ± 0.07 <D.L. 0.6
Cl N/A 0.095 ± 0.003 0.300 ± 0.008 0.060 ± 0.015 0.02
H N/A 0.73 ± 0.01 1.996 ± 0.045 0.236 ± 0.005 0.01
B N/A 2.40 ± 0.05 ppm 2.9 ± 0.1 ppm <D.L. 0.5 ppm
Si 1.3 ± 0.5 0.3 1.8 ± 0.1 2.4 ± 0.1 0.9
C N/A <D.L. 24 ± 2 <D.L. 10
Based on both the PGAA and the XRF results, the spearhead is tin-bronze, with additional
Ni, Sb and Fe content, Pb and Zn were detected by XRF technique, while As and Co only with
PGAA. The surface Sn content obtained by XRF is always higher than in the bulk, and it is three
times higher than the maximum tin concentration determined by PGAA at the lower part of the
object. This suggests that the strong tin-enrichment is valid only for the near surface. A possible
explanation of it could be the phenomenon called decuprification [184], [185]. The patina layers
on bronzes are usually multilayered, and consist of different oxides, hydroxides of copper and tin
[185], [186] depending on the burial environment. Copper containing corrosion products are
usually dominant in the external part of the patina [186]. If this outer layer is removed (e.g. during
burial, if the chemical environment of the object changes or during surface treatments in order to
preserve the object) the tin content increases relative to the copper (decuprification).
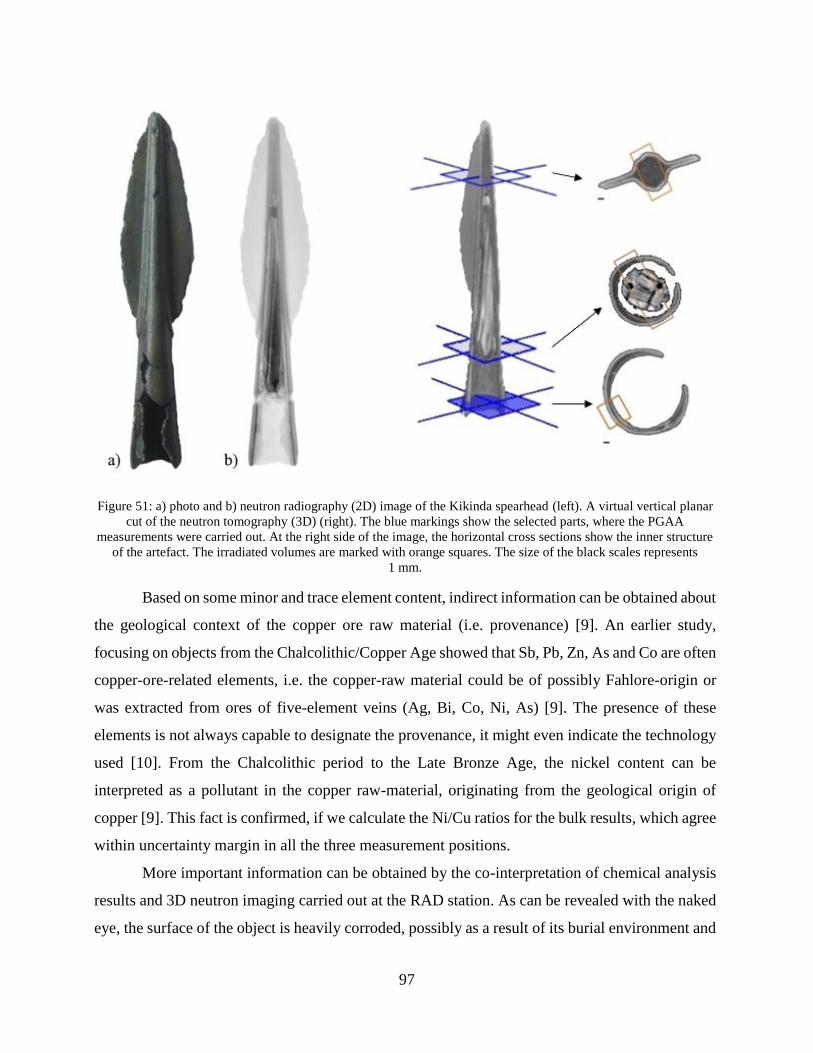
97
Figure 51: a) photo and b) neutron radiography (2D) image of the Kikinda spearhead (left). A virtual vertical planar
cut of the neutron tomography (3D) (right). The blue markings show the selected parts, where the PGAA
measurements were carried out. At the right side of the image, the horizontal cross sections show the inner structure
of the artefact. The irradiated volumes are marked with orange squares. The size of the black scales represents
1 mm.
Based on some minor and trace element content, indirect information can be obtained about
the geological context of the copper ore raw material (i.e. provenance) [9]. An earlier study,
focusing on objects from the Chalcolithic/Copper Age showed that Sb, Pb, Zn, As and Co are often
copper-ore-related elements, i.e. the copper-raw material could be of possibly Fahlore-origin or
was extracted from ores of five-element veins (Ag, Bi, Co, Ni, As) [9]. The presence of these
elements is not always capable to designate the provenance, it might even indicate the technology
used [10]. From the Chalcolithic period to the Late Bronze Age, the nickel content can be
interpreted as a pollutant in the copper raw-material, originating from the geological origin of
copper [9]. This fact is confirmed, if we calculate the Ni/Cu ratios for the bulk results, which agree
within uncertainty margin in all the three measurement positions.
More important information can be obtained by the co-interpretation of chemical analysis
results and 3D neutron imaging carried out at the RAD station. As can be revealed with the naked
eye, the surface of the object is heavily corroded, possibly as a result of its burial environment and
98
the post-excavation corrosion processes. From the 3D neutron tomography it can be concluded,
that nearly the outer 1 mm is an altered surface with higher neutron attenuation properties than
that of the metal core. For this reason, at the lower part of the object (see Figure 51, the lower right
edge of the figure on the right side), where the total thickness of the object is 2.5-3 mm, the
proportion of the corrosion products is more than the half of the irradiated volume. This can be the
reason of the increased tin content (19.1 m%) in the bulk, however, this tin increase is less than
obtained by XRF, which means that the decuprification phenomenon is less significant in the inner
corroded layers. Hydrogen and chlorine can be attributed to the corrosion products and the
components of the wood material as well. Their concentrations are the highest where the fragment
of the wooden shaft was present inside the spear during the PGAA measurement. The carbon
content determined by PGAA at the middle position unambiguously indicates the components of
the wooden shaft. The other detected elements be attributed to soil contamination.
The lowest hydrogen and chlorine content was determined at the upper position (see Figure
51, right upper corner), where the ratio of the corroded material relative to the tin-bronze core is
relatively low. The virtual planar cut of the 3D tomographic dataset of the object confirms this,
because in this region there is less material with stronger neutron attenuation properties (lighter
grey regions), i.e. no wood just the inner and outer surfaces of the spearhead.
PGAA and XRF results showed, that the spearhead is made of a two-component alloy, tin-
bronze, while the other constituents can be 1) the impurities of the raw-material (e.g. nickel), or 2)
related to the smelting process (e.g. S, Fe) and 3) contaminants incorporated into the artefacts
during burial or the restoration work (e.g. hydrogen, chlorine, silicon).
To determine the original alloy recipe, the co-interpretation of PGAA chemical
composition results and 3D neutron imaging information is inevitable. If a cylinder shape
approximation is used for the calculation of the high-neutron absorbing corrosion products – then
for the less-neutron absorption parts the high to low absorption ratio at the upper PGAA
measurement place, is only 10–15 % of the irradiated volume, while 85–90 % is the original alloy.
The smallest – 0.15 m% ± 3% – Sn to Cu ratio was observed here as well, while 0.24 m% ± 4 %
and 0.25 m% ± 2.5 % was calculated at the middle and the lower measurement positions.
The PGAA results showed that the spearhead was cast from a tin-copper alloy with minor
nickel, antimony, lead, arsenic and cobalt content. Despite the 1-mm corroded outer layer, the
original alloy composition could be determined. The high, 12 m% tin content refers to a valuable
99
object that could be used as a resilient, good quality functional weapon [187]. The Co, Ni and As
content refers to the type of the metal ore used, while Fe was probably added during the production
of the alloy [10], [128]. Carbon content refers to the wooden shaft fragment inside the spearhead,
while the other determined elements are present in the wood, the soil remainings and the corrosion
products. With further measurements on additional objects involved in the study, archeologists can
draw important conclusions about the Late Bronze Age weaponry in Central Europe.
The above listed results are just the beginning of this ongoing project. Using the
experiences gained while analyzing various types of alloys, in the future PGAA and combined
experiments can be done in a more efficient way to answer the questions asked by our cooperators
from various scientific fields.
100
Summary
The main motivation of my PhD work was to further improve the PGAA method and
overcome its present limits of applicability by developing specific detection and evaluation
methods, as well as by combining it with surface-analytical and imaging techniques. Most
challenges in our everyday analytical practice were addressed, and although there is no single
solution to all issues, specific procedures for each problem were worked out. Besides the
improvements of the analytical performance, my aim was to shorten the required measurement
time, and thereby reduce the risk of activation above the clearance level, and on the other hand to
gain in productivity of the facility (both beam time allocation and data analysis aspects).
In order to find solutions, first I refined the classification of the metallic elements based on
their spectrum properties. Within the so-called type 2 PGAA spectra, I identified two subgroups:
1) elements that have just a few strong gamma lines at both low and high energies (e.g. Fe, Cu,
predominantly Z <30); 2) elements with intense gamma peaks predominantly below 500 keV
energy (eg. Ag, Sb, predominantly Z >30). This classification made it possible to work out different
experimental strategies for these subgroups.
I developed a new methodology to selectively measure Z >30 alloying elements in metallic
matrices, using a high-resolution planar germanium detector (LEGe). For these samples, a
significant part of the detected gamma-rays is registered in the energy range below 500 keV. By
focusing on this region, thanks to the LEGe’s better energy resolution, the peak interferences are
reduced or become easier to resolve. Thus, the element identification and the reliability of the peak
fitting can be improved, while the acquisition and spectrum evaluation times are shortened. Surch
high-resolution PGAA was successfully applied to the quick and accurate analysis of ancient silver
coins, Au-Ag catalysts and Co-Re-Cr alloys.
For the other subgroup, i.e. Z <30 metals, I established another detection method which
uses a coaxial high-purity germanium detector equipped with a low-energy gamma attenuator
which is also very useful to analyze important copper-alloying elements, such as Sn and Pb. These
elements have intense prompt gamma lines above 1 MeV. By attenuating the gamma rays below
500 keV, and so enhancing the detected signals in the high-energy region, the required
measurement and evaluation times became shorter.
I analyzed about 30 copper objects and standard copper alloys (IRMM BCR-691) with
PGAA, where I discovered the need for a better interference correction between Cu and Sn gamma-
101
rays, and after its implementation, I validated it with the standards where a better agreement with
the known compositions was found. I also compared the various PGAA techniques with in-beam
activation analysis, XRF, and INAA method, and compared their analytical performance. I
concluded that the most advantageous configuration for the non-destructive analysis of alloys uses
two detection methods in parallel.
The main alloying elements of copper, e.g. Pb, Sn, Ni, Fe and Mn (type 1 ans type 2/1) are
measured with gamma-attenuated PGAA, while other important additives, mainly type 2/2
elements, such as As, Sb, and Ag, based on the LEGe measurement can be analyzed suitably and
faster than with the standard PGAA alone. In the case of high-flux irradiation, the quantity of As,
Sb and Mn can be more accurately determined by off-line counting after the PGAA measurements.
I showed that the various surface coatings (patina, other corroded surfaces, surface
modification for preservation) do not have a significant effect on the bulk analysis. Thus PGAA
provides reliable bulk composition results even for objects with corroded surfaces. Comparing the
results from surface (XRF) and bulk analytical methods (PGAA), we can make conclusions on the
nature and/or origin of the surface layer of the samples.
Finally, I extended the various basic analytical methods to analyze inhomogeneous metallic
objects, e.g. archeological samples, using handheld XRF at multiple spots for the surface analysis,
and position-sensitive PGAI for the bulk analysis on pre-defined parts of the objects, selected on
the basis of a 3D neutron image of the object. Besides their compositions, I managed to characterize
their inner structure and also gave answers to production technology questions.
102
Összefoglalás
PhD munkám fő célja a PGAA technika továbbfejlesztése és jelenlegi korlátainak átlépése
fémek és fémötvözetek analízisében új detektálási és kiértékelési technikák alkalmazásával,
valamint felületi analitikai és képalkotó módszerekkel való kombinálásával. A mindennapi
analitikai gyakorlatban felmerült kihívásokat egyenként megvizsgáltam, és minden esetre
probléma-specifikus eljárásokat dolgoztam ki. Az összetétel adatok pontosságának és
helyességének javítása mellett cél volt az is, hogy lerövidítsem a mérési időket, ezáltal csökkentve
a neutronbesugárzás okozta aktiválódás kockázatát, másrészt javítsam a berendezés
termelékenységét (mind a nyalábidőbeli kihasználása, mind az adatok elemzése szempontjából). A
kutatás folyamán először finomítottam a fémes elemek felosztását a spektrális tulajdonságaik
alapján. Az úgynevezett 2-es típusú PGAA spektrumokon (az Sn és Pb kivételével) belül két
alcsoportot azonosítottam: 1.) elemek, melyek rendelkeznek néhány nagy intenzitású gamma
vonalallal kis- és nagy energiáknál is (pl. Fe, Cu, túlnyomórészt Z <28); 2), olyan elemek, amelyek
főleg 500 keV-nál kisebb energiájú gamma fotonokat bocsátanak ki (pl. Ag, Sb, túlnyomóan Z>
28). Ez a besorolás megalapozta az ezen alcsoportokkal kapcsolatban követendő kísérleti
stratégiákat.
Kidolgoztam egy új detektási technikát a Z> 28 ötvözőelemek szelektív mérésére fémes
mátrixokban (Sn, Pb), nagyfelbontású planár germánium detektor (LEGe) alkalmazásával. Ezen
minták esetén az észlelt gamma-fotonok jelentős része az 500 keV alatti energiatartományban
található. Tehát, ha erőfeszítéseinket erre a régióra koncentráljuk, a LEGe jobb
energiafelbontásának köszönhetően a csúcsinterferenciák csökkenthetők vagy könnyebben
feloldhatók, így az elemek azonosítása és a csúcsillesztés megbízhatósága javítható, miközben a
mérési idő és a spektrum feldolgozása lerövidült. Az úgynevezett nagyfelbontású PGAA módszert
(LEGe detektor) sikeresen alkalmaztam ókori ezüst érmék, Au-Ag katalizátorok és Co-Re-Cr
ötvözetek gyors és pontos elemzésére.
A másik alcsoporthoz, azaz Z <28 fémekhez egy másik módszert dolgoztam ki, amely egy
koaxiális nagy tisztaságú germánium detektort használ kis energiájú gamma-gyengítővel, a fontos
rézötvözető elemek, például Sn és Pb elemzésére. Ezek az elemek intenzív 1 MeV feletti prompt-
gamma vonalakkal rendelkeznek. Az 500 keV alatti csúcsok gyengítésével csökkentettem a
szükséges mérési és értékelési időt azáltal, hogy növeltem a nagy energiájú csúcsokban észlelt
jeleket, és elnyomtam az egyébként domináns mátrix jeleket.
103
Standard rézötvözet-mintákat (IRMM BCR-691) és kb 30 réztárgyat elemeztem először a
PGAA-val, ahol kiderült, hogy továbbfejleszett interferencia korrekcióra van szükség a Cu és Sn
között. Ezt a korrekciós eljárást validáltam és jó egyezést értem el. Összehasonlítottam a különböző
PGAA detektálási módszereket a kivezett nyalábbal végzet neutronaktivációs analízissel, az XRF,
a PIXE és az INAA módszerekkel, és meghatároztam a módszerek analitikai
teljesítményjellemzőit. Megállapítottam, hogy az ötvözetek roncsolásmentes elemösszetétel-
analízisének legelőnyösebb konfigurációja két, a fentiekben ismertetett stratégiát megvalósító, a
mintakamra két oldalán elhelyezett detektorból áll.
A réz legfontosabb ötvöző elemei, pl. Pb, Sn, Ni, Fe és Mn gamma-gyengítős PGAA-val,
más fontos adalékok, mint pl. As, Sb és Ag a LEGe spektrumok alapján kedvezőbben és
gyorsabban elemezhetők, a hagyományos PGAA-hoz képest. Nagy fluxusú besugárzás esetén az
As, Sb, Mn mennyisége pontosabban meghatározható a PGAA méréseket követő off-line gamma-
spektrometriás mérésekkel.
Bebizonyítottam, hogy a különböző bevonatok (patina, egyéb korrodált felületek,
konzerválási célú felületi bevonatok) nem befolyásolják számottevően a tömbi elemzést, így a
PGAA megbízható tömbi összetétel adatokat szolgáltat még korrodált felületű tárgyak esetén is. A
felületi (XRF) és a tömbi roncsolásmentes elemanalitikai módszerek (PGAA, TOF-ND)
eredményeit összehasonlítva a minták felületének jellegére és / vagy eredetére vonatkozó
következtetéseket vonhatunk le.
Végül kiterjesztettem az alapmódszert nem homogén fémes elemekre, pl. régészeti fém
tárgyakra. Ezeket kézi XRF készülékkel mért felszíni- és pozíció-érzékeny PGAI módszerrel
meghatározott tömbi összetétel adatok kombinálásával, valamint 3D neutronos képalkotás
segítségével jellemeztem. Bemutattam az eredményeimet a következő régészeti leletekre: körte
alakú bronzsúly a magyarországi török hódoltság idejéből; egyiptomi stílusban készült, a kánaáni
meztelen istennőt ábrázoló szobor a Középső Bronzkor időszakából; Középső Bronzkorból
származó bronz tőr nyelének rögzítéséhez használt nitszeg; és Késő Bronzkori bronz lándzsahegy
fa-nyélmaradvánnyal. Összetételük meghatározásán kívül jellemeztem belső szerkezetüket, és
készítéstechnikai kérdésekre is választ tudtam adni.
104
References
[1] Z. Revay et al., “In situ determination of hydrogen inside a catalytic reactor using prompt
gamma activation analysis,” Anal. Chem., vol. 80, no. 15, pp. 6066–6071, 2008.
[2] D. Teschner et al., “An integrated approach to Deacon chemistry on RuO2-based
catalysts,” J. Catal., vol. 285, no. 1, pp. 273–284, 2012.
[3] A. M. Hosseini et al., “Comparison of precious metal oxide/titanium monolith catalysts in
wet oxidation of wastewaters,” Appl. Catal. B Environ., vol. 127, 2012.
[4] Z. Kasztovszky et al., “Prompt-gamma activation analysis of Roman brooches,” in 31st
International Symposium on Archaeometry, 1998, vol. II, pp. 399–403.
[5] Z. Kasztovszky, E. Panczyk, W. Fedorowicz, Z. Révay, and B. Sartowska, “Comparative
archaeometrical study of Roman silver coins by prompt gamma activation analysis and
SEM-EDX,” J. Radioanal. Nucl. Chem., vol. 265, no. 2, pp. 193–199, 2005.
[6] Q. Wang, S. Priewe, K. Chen, and and S. La Niece, “A Chinese bronze gui vessel:
genuine Western Zhou object or fake?,” Br. MuseumTechnical Res. Bull., vol. 5, pp. 59–
66, 2011.
[7] F. Pulszky, A rézkor Magyarországon. Budapest: MTA, 1883.
[8] F. Wibel, Beitrag zur Kenntnis antiker Bronzen vom chemischen Standpunkte. Hamburg,
1863.
[9] Z. Czajlik, A Kárpát-medence fémnyersanyag-forgalma a későbronzkorban és a
vaskorban. Budapest: ELTE Bölcsészettudományi Kar, 2012.
[10] E. Pernicka, “Trace element fingerprinting of ancient copper: a guide to technology or
provenance?,” Met. Antiq. BAR Int. Ser., pp. 163–171, 1999.
[11] A. H. Mason et al., “Tin isotope characterization of bronze artifacts of the central
Balkans,” J. Archaeol. Sci., vol. 69, pp. 110–117, 2016.
[12] W. Powell et al., “Digging deeper: Insights into metallurgical transitions in European
prehistory through copper isotopes,” J. Archaeol. Sci., vol. 88, pp. 37–46, 2017.
[13] V. Lyubomirova, R. Djingova, and I. Kuleff, “Comparison of analytical techniques for
analysis of archaeological bronze,” Archaeometry, vol. 57, no. 4, pp. 677–686, 2015.
[14] D. Mukherji et al., “Effects of boron addition on microstructure and mechanical properties
of Co-Re-based high temperature alloys,” Scr. Mater., vol. 66, pp. 60–63, 2012.
[15] Országgyűlés, “487/2015. (XII. 30.) Korm. rendelet az ionizáló sugárzás elleni védelemről
és a kapcsolódó engedélyezési, jelentési és ellenőrzési rendszerről.” [Online]. Available:
https://net.jogtar.hu/jogszabaly?docid=a1500487.kor. [Accessed: 10-May-2018].
[16] T. Muroi, “Role of Precious Metal Catalysts,” in Noble Metals, Y.-H. Su, Ed. IntechOpen,
2012.
105
[17] L. Beck, S. Bosonnet, S. Réveillon, D. Eliot, and F. Pilon, “Silver surface enrichment of
silver–copper alloys: a limitation for the analysis of ancient silver coins by surface
techniques,” Nucl. Instruments Methods Phys. Res. Sect. B Beam Interact. with Mater.
Atoms, vol. 226, no. 1–2, pp. 153–162, Nov. 2004.
[18] J. Kónya and N. M. Nagy, “Radioanalytical Methods Using the Interaction of Radiation
with Matter,” in Nuclear and Radiochemistry, First edit., Elsevier Inc., 2012, pp. 283–318.
[19] S. Majumdar, J. R. Peralta-Videa, H. Castillo-Michel, J. Hong, C. M. Rico, and J. L.
Gardea-Torresdey, “Applications of synchrotron μ-XRF to study the distribution of
biologically important elements in different environmental matrices: A review,” Anal.
Chim. Acta, vol. 755, pp. 1–16, Nov. 2012.
[20] G. Pokol et al., Analitikai kémia. Budapest: COPYRIGHT: 2011-2016, Dr. Pokol György,
Dr. Gyurcsányi E. Róbert, Dr. Simon András, Dr. Bezúr László, Dr. Horvai György, Dr.
Horváth Viola, Dudás Katalin Mária, BME Vegyészmérnöki és Biomérnöki Kar
Szervetlen és Analitikai Kémia Tanszék, Typotex Kiadó, 2011.
[21] J. Osán, S. Kurunczi, S. Török, and I. Varga, Az elemanalitika korszerű módszerei.
Budapest: Akadémiai Kiadó, 2006.
[22] E. Oliveira, “Sample preparation for atomic spectroscopy: evolution and future trends,” J.
Braz. Chem. Soc., vol. 14, no. 2, pp. 174–182, 2003.
[23] B. Welz, M. G. Rodrigues Vale, É. R. Pereira, I. N. B. Castilho, and M. B. Dessuy,
“Continuum Source Atomic Absorption Spectrometry: Past, Present and Future Aspects –
A Critical Review,” J. Braz. Chem. Soc., vol. 25, no. 5, pp. 799–821, 2014.
[24] S. D. Fernández, N. Sugishama, J. R. Encinar, and A. Sanz-Medel, “Triple quad ICPMS
(ICPQQQ) as a new tool for absolute quantitative proteomics and phosphoproteomics,”
Anal. Chem., vol. 84, no. 14, pp. 5851–5857, 2012.
[25] L. Moens and R. Dams, “NAA and ICP-MS: A comparison between two methods for trace
and ultra-trace element analysis,” J. Radioanal. Nucl. Chem. Artic., vol. 192, no. 1, pp. 29–
38, 1995.
[26] Z. Révay and T. Belgya, “Principles of the PGAA method,” G. L. Molnár, Ed. Kluwer
Academic Publishers, Dordrecht, Boston, London, 2004, pp. 1–30.
[27] Z. Kasztovszky, A. Vaday, Z. Révay, T. Belgya, and G. L. Molnár, “Prompt gamma
activation analysis of bronze archaeological objects,” 2000.
[28] K. Zs, V. Szilágyi, and I. Sajó, “Neolitikus rézgyöngyök vizsgálata Polgár-Csőszhalom
lelőhelyről - előzetes eredmények.[Scientific investigation of Neolithic copper beads from
Polgár-Csőszhalom - Preliminary results],” Archeometriai Műhely, vol. 7, no. 2, pp. 137–
140, 2010.
[29] A. Moropoulou et al., “Analytical and technological examination of glass tesserae from
Hagia Sophia,” Microchem. J., vol. 125, pp. 170–184, 2016.
106
[30] M. Strlič, “Heritage Science : A Future-Oriented Cross-disciplinary Field,” Angew.
Chemie Int. Ed., pp. 2–4, 2018.
[31] D. Grolimund et al., “Combined neutron and synchrotron X-ray microprobe analysis:
attempt to disclose 3600 years-old secrets of a unique bronze age metal artifact,” J. Anal.
At. Spectrom., vol. 26, no. 5, pp. 1012–1023, 2011.
[32] R. van Langh et al., “New insights into alloy compositions: studying Renaissance bronze
statuettes by combined neutron imaging and neutron diffraction techniques,” J. Anal. At.
Spectrom., vol. 26, no. 5, pp. 949–958, 2011.
[33] S. Peetermans, R. van Langh, E. Lehmann, and A. Pappot, “Quantification of the material
composition of historical copper alloys by means of neutron transmission measurements,”
J. Anal. At. Spectrom., vol. 27, no. 10, pp. 1674–1679, 2012.
[34] J. Agresti, I. Osticioli, M. C. Guidotti, N. Kardjilov, and S. Siano, “Non-invasive
archaeometallurgical approach to the investigations of bronze figurines using neutron,
laser, and X-ray techniques,” Microchem. J., vol. 124, pp. 765–774, Jan. 2016.
[35] E. Figueiredo, M. F. Araújo, R. J. C. Silva, J. C. Senna-Martinez, and J. L. Inĉs Vaz,
“Characterisation of Late Bronze Age large size shield nails by EDXRF, micro-EDXRF
and X-ray digital radiography,” Appl. Radiat. Isot., vol. 69, no. 9, pp. 1205–1211, 2011.
[36] R. B. Firestone, G. L. Molnár, and Z. Révay, “Reference Data,” in Handbook of Prompt
Gamma Activation Analysis with Neutron Beams, Kluwer Academic Publishers, 2004, pp.
365–366.
[37] R. B. Firestone, “Appendix to Part II – Table of Nuclides BT - Handbook of Nuclear
Chemistry,” A. Vértes, S. Nagy, Z. Klencsár, R. G. Lovas, and F. Rösch, Eds. Boston,
MA, MA: Springer US, 2011, pp. 1033–1261.
[38] A. Vértes, S. Nagy, and Z. Klencsár, Handbook of Nuclear Chemistry. Eötvös Lorand
University: Kluwer, 2003.
[39] R. B. Firestone, G. L. Molnár, and Z. Révay, “Reference Data,” G. L. Molnár, Ed. Kluwer
Academic Publishers, Dordrecht, Boston, London, 2004, pp. 365–418.
[40] I. Salma, “Elemanalitikai koszerű módszerei,” in Elemanalitika korszerű módszerei, G.
Záray, Ed. Akademiai Kiado, 2006, pp. 417–506.
[41] G. Gilmore and J. D. Hemingway, “Practical Gamma-ray Spectrometry,” 1rst ed.,
Chichester: Wiley, 1995.
[42] “Janis 4.0.” [Online]. Available: https://www.oecd-nea.org/janis/.
[43] O. Klein and Y. Nishina, “Über die Streuung von Strahlung durch freie Elektronen nach
der neuen relativistischen Quantendynamik von Dirac,” Zeitschrift für Phys., vol. 52, no.
11, pp. 853–868, 1929.
[44] G. F. Knoll, Radiation Detection and Measurement, vol. 3. 2000.
107
[45] T. Belgya, “personal communication with Tamás Belgya.”
[46] T. Belgya and Z. Kasztovszky, “Half thickness for gamma radiation and for thermal
neutrons in various materials,” in ANCIENT CHARM Kick-off meeting, 2006.
[47] L. Szentmiklósi, Z. Kis, T. Belgya, B. Maróti, L. Horváth, and M. Papp, “Roncsolásmentes
képalkotás neutronokkal és röntgensugárzással a Budapesti Neutron Centrumban,” Fiz.
Szle., vol. 67, no. 7–8, pp. 240–244, 2017.
[48] Z. Kis and L. Szentmiklósi, “NEUTRON IMAGING LABORATORY EXCERCISE.” pp.
1–10, 2017.
[49] Z. Révay, “Determining Elemental Composition Using Prompt,gamma Activation
Analysis,” Anal. Chem., vol. 81, pp. 6851–6859, 2009.
[50] G. L. Molnár, Handbook of Prompt Gamma Activation Analysis with Neutron Beams.
Budapest: Kluwer Academic Publisher Dordrecht, Boston, London, 2004.
[51] Szentmiklosi L, Belgya T, Maroti B, and Kis Z, “Characterization of HPGe gamma
spectrometers by geant4 Monte Carlo simulations,” J. Radioanal. Nucl. Chem., vol. 300,
no. 2, pp. 553–558, 2014.
[52] S. Chauvie et al., “Geant4 low energy electromagnetic physics,” in IEEE Symposium
Conference Record Nuclear Science 2004., 2004, vol. 3, p. 1881–1885 Vol. 3.
[53] R. L. Paul and R. M. Lindstrom, “Prompt gamma-ray activation analysis: Fundamentals
and applications,” J. Radioanal. Nucl. Chem., vol. 243, no. 1, pp. 181–189, 2000.
[54] Z. Révay, “personal communication with Zsolt Révay.”
[55] D. E. Lea, “Combination of Proton and Neutron,” Nature, vol. 133, p. 24, 1934.
[56] J. Chadwick, “Possible exinstence of neutrons,” Nature, vol. 129, p. 312, 1932.
[57] G. Hevesy and H. Levi, “The Action of Neutrons on the Rare Earth Elements,” Det. Kgl.
Danski Vidensk. Selsk. Math. Meddelelser., vol. 14, no. 5, pp. 3–34, 1936.
[58] T. L. Isenhour and G. H. Morrison, “Determination of Boron by Thermal Neutron
Activation Analysis Using a Modulation Technique,” Anal. Chem., vol. 38, pp. 167–169,
1966.
[59] V. J. Orphan and N. C. Rasmussen, “A Ge(Li) Spectrometer for Studying Neutron Capture
Gamma Rays,” Nucl. Instruments Methods, vol. 48, pp. 282–295, 1967.
[60] M. R. Najam, M. Anwar-Ul-Islam, A. F. M. Ishaq, J. A. Mirza, A. M. Khan, and I. H.
Qureshi, “In-beam neutron activation analysis of stainless steel and iron ore,” J.
Radioanal. Chem., vol. 27, pp. 115–124, 1975.
[61] M. Heurtebise and J. A. Lubkowitz, “Determination of Metals in Alloys by Neutron
Capture Gamma-Ray Spectrometry,” Trans. Am. Nucl. Soc., vol. 21(2), pp. 60–61, 1975.
108
[62] M. Rossbach et al., “The Use of Focusing Supermirror Neutron Guides to Enhance Cold
Neutron Fluence Rates,” Nucl. Instruments Methods, vol. B35, pp. 181–190, 1988.
[63] D. D. Clark, C. G. Oullet, and J. S. Berg, “On the Design of a Cold Neutron Source,” Nucl.
Sci. Eng., vol. 110, pp. 445–454, 1992.
[64] Z. Révay, G. L. Molnár, T. Belgya, Z. Kasztovszky, and R. B. Firestone, “A new gamma-
ray spectrum catalog and library for PGAA,” J. Radioanal. Nucl. Chem., vol. 248, no. 2,
pp. 395–399, 2001.
[65] R. B. Firestone, G. L. Molnár, Z. Révay, T. Belgya, D. P. McNabb, and B. W. Sleaford,
“The Evaluated Gamma-ray Activation File (EGAF),” 2004.
[66] Firestone RB et al., “EGAF: Measurement and Analysis of Gamma-ray Cross Sections,”
Nucl. DATA SHEETS, vol. 119, no. 0, pp. 79–87, 2014.
[67] C. HD et al., Database of Prompt Gamma Rays from slow Neutron Capture for Elemental
Analysis. Vienna PG - 253: International Atomic Energy Agency (IAEA), 2007.
[68] Z. Révay, R. B. Firestone, T. Belgya, and G. L. Molnár, “Prompt Gamma-Ray Spectrum
Catalog,” G. L. Molnár, Ed. Kluwer Academic Publishers, Dordrecht, Boston, London,
2004, pp. 173–366.
[69] Z. Révay and T. Belgya, “Principles of the PGAA method BT - Handbook of Prompt
Gamma Activation Analysis: with Neutron Beams,” G. L. Molnár, Ed. Boston, MA:
Springer US, 2004, pp. 1–30.
[70] D. L. Anderson and Z. Kasztovszky, “Applicatons of PGAA with Neutron Beams,” G. L.
Molnár, Ed. Kluwer Academic Publishers, Dordrecht, Boston, London, 2004, pp. 137–172.
[71] R. M. Lindstrom and Z. Révay, “Prompt gamma neutron activation analysis (PGAA):
recent developments and applications,” J. Radioanal. Nucl. Chem., vol. 314, no. 2, pp.
843–858, 2017.
[72] L. Szentmiklosi et al., “Upgrade of the prompt gamma activation analysis and the neutron-
induced prompt gamma spectroscopy facilities at the Budapest research reactor,” J.
Radioanal. Nucl. Chem., vol. 286, no. 2, pp. 501–505, 2010.
[73] R. Zs and T. Belgya, “Principles of PGAA method,” in Handbook of Prompt Gamma
Activation Analysis with Neutron Beams, Dordrecht: Kluwer Academic Publishers, 2004,
pp. 1–30.
[74] IAEA, “NDS IAEA, Live Chart of Nuclides, nuclear structure and decay data.” [Online].
Available: https://www-nds.iaea.org/relnsd/vcharthtml/VChartHTML.html.
[75] R. Zs, F. RB, T. Belgya, and M. GL, “Prompt Gamma-Ray Spectrum Catalog,” in
Handbook of Prompt Gamma Activation Analysis with Neutron Beams, Dordrecht: Kluwer
Academic Publishers, 2004, pp. 173–364.
[76] Z. Révay, R. B. Firestone, T. Belgya, and G. L. Molnár, “Prompt Gamma-Ray Spectrum
109
Catalog BT - Handbook of Prompt Gamma Activation Analysis: with Neutron Beams,” G.
L. Molnár, Ed. Boston, MA: Springer US, 2004, pp. 173–364.
[77] B. Fazekas et al., “HYPERMET-PC: Program for automatic analysis of complex gamma-
ray spectra,” J. TRACE MICROPROBE Tech., vol. 14, no. 1, pp. 167–172, 1996.
[78] Z. Révay, T. Belgya, P. P. Ember, and G. L. Molnár, “Recent developments in
HYPERMET PC,” J. Radioanal. Nucl. Chem., vol. 248, no. 2, pp. 401–405, 2001.
[79] R. Zs and T. Belgya, “Application of Hypermet-PC in PGAA,” J. Radioanal. Nucl. Chem.,
vol. 265, no. 2, pp. 261–265, 2005.
[80] L. Szentmiklósi, “Fitting special peak shapes of prompt gamma spectra,” J. Radioanal.
Nucl. Chem., vol. 315, no. 3, pp. 663–670, 2018.
[81] Z. Révay, T. Belgya, and G. L. Molnár, “Application of Hypermet-PC in PGAA,” J.
Radioanal. Nucl. Chem., vol. 265, no. 2, pp. 261–265, 2005.
[82] G. L. Molnár, Z. Révay, and T. Belgya, “Wide energy range efficiency calibration method
for Ge detectors,” Nucl. Instruments Methods Phys. Res. Sect. a- Accel. Spectrometers
Detect. Assoc. Equip., vol. 489, no. 1–3, pp. 140–159, 2002.
[83] A. Simonits, F. De Corte, and J. Hoste, “Single-Comparator Methods in Reactor Neutron
Activation Analysis,” J. Radioanal. Chem., vol. 24, pp. 31–46, 1975.
[84] Z. Révay, T. Belgya, and G. L. Molnár, “New prompt k0 and partial cross section values
measured in the cold neutron beam of Budapest Research Reactor,” J. Radioanal. Nucl.
Chem., vol. 265, no. 2, pp. 169–173, 2005.
[85] G. L. Molnár, Z. Révay, R. L. Paul, and R. M. Lindstrom, “Prompt-gamma activation
analysis using the k0 approach,” J. Radioanal. Nucl. Chem., vol. 234, no. 1–2, pp. 21–26,
1998.
[86] Z. Révay and G. L. Molnár, “Standardisation of the prompt gamma activation analysis
method,” Radiochim. Acta, vol. 91, no. 6, pp. 361–369, 2003.
[87] F. RB et al., “EGAF: Measurement and Analysis of Gamma-ray Cross Sections,” Nucl.
DATA SHEETS, vol. 119, no. 0, pp. 79–87, 2014.
[88] Z. Révay, G. L. Molnár, T. Belgya, Z. Kasztovszky, and R. B. Firestone, “A new gamma-
ray spectrum catalog for PGAA,” J. Radioanal. Nucl. Chem., vol. 244, no. 2, pp. 383–389,
2000.
[89] Z. Révay, “Calculation of uncertainties in prompt gamma activation analysis,” Nucl.
Instruments Methods Phys. Res. Sect. a- Accel. Spectrometers Detect. Assoc. Equip., vol.
A 564, no. 4–6, pp. 688–697, 2006.
[90] L. Szentmiklósi, Z. Révay, T. Belgya, A. Simonits, and Z. Kis, “Combining prompt
gamma activation analysis and off-line counting,” J. Radioanal. Nucl. Chem., vol. 278, no.
3, pp. 657–660, 2008.
110
[91] Z. Révay, P. Kudějová, K. Kleszcz, S. Söllradl, and C. Genreith, “In-beam activation
analysis facility at MLZ, Garching,” Nucl. Instruments Methods Phys. Res. Sect. A Accel.
Spectrometers, Detect. Assoc. Equip., vol. 799, pp. 114–123, Nov. 2015.
[92] “2015 edition of k0 database.” [Online]. Available:
http://www.kayzero.com/k0naa/k0naaorg/Nuclear_Data_SC/Entries/2016/1/11_New_k0-
data_Library_2015_files/k0_database_2015_12_04.xls Accessed 20 September 2017.
[93] R. Jaćimović, F. De Corte, G. Kennedy, P. Vermaercke, and Z. Revay, “The 2012
recommended k0 database,” J. Radioanal. Nucl. Chem., vol. 300, no. 2, pp. 589–592,
2014.
[94] TUM and IAEA, “Database of PGNAA facilities,” 2015. .
[95] T. Grosz, V. A. Mityukhlyaev, L. Rosta, A. P. Serebrov, and A. A. Zaharov, “Liquid
hydrogen cold moderator optimisation at the Budapest Research Reactor,” Phys. B, vol.
234, pp. 1194–1195, 1997.
[96] L. Rosta et al., “Neutron guide system at the Budapest Research Reactor,” Phys. B -
Condens. MATTER, vol. 234, pp. 1196–1198, 1997.
[97] G. Molnár et al., “The New Prompt Gamma Activation Facility at Budapest,” J.
Radioanal. Nucl. Chem., vol. 215, no. 1, pp. 111–115, 1997.
[98] L. Szentmiklósi, T. Belgya, Z. Révay, and Z. Kis, “Upgrade of the Prompt-Gamma
Activation Analysis (PGAA) and the Neutron Induced Prompt-gamma Spectroscopy
(NIPS) facilities at the Budapest Research Reactor,” J. Radioanal. Nucl. Chem., vol. 286,
pp. 501–505, 2010.
[99] L. Szentmiklósi, Z. Kis, T. Belgya, and A. N. Berlizov, “On the design and installation of a
Compton-suppressed HPGe spectrometer at the Budapest neutron-induced prompt gamma
spectroscopy (NIPS) facility,” J. Radioanal. Nucl. Chem., vol. 298, no. 3, 2013.
[100] Z. Kis, L. Szentmiklósi, and T. Belgya, “NIPS-NORMA station - A combined facility for
neutron-based nondestructive element analysis and imaging at the Budapest Neutron
Centre,” Nucl. Instruments Methods Phys. Res. Sect. A Accel. Spectrometers, Detect.
Assoc. Equip., vol. 779, 2015.
[101] Z. Revay and C. Stieghorst, “PERSPECTIVES OF IN-BEAM ACTIVATION
ANALYSIS,” 2017, pp. 1–2.
[102] P. Kudejova, Z. Révay, K. Kleszcz, C. Genreith, and M. Rossbach, “High-flux PGAA for
milligram-weight samples,” EPJ Web Conf., vol. 93, no. April, pp. 08001–08002, 2015.
[103] “Prompt gamma and in-beam neutron activation analysis facility.” [Online]. Available:
https://www.mlz-garching.de/pgaa.
[104] Heinz Maier-Leibnitz Zentrum and Z. Révay, “PGAA: Prompt gamma and in-beam
neutron activation analysis facility,” J. large-scale Res. Facil., vol. 1, no. A20, pp. 1–3,
2015.
111
[105] W. C. Röntgen, “On a new kind or rays,” J. Franklin Inst., vol. 141, no. 3, pp. 183–191,
Mar. 1896.
[106] K. Janssens, “X-ray fluorescence analysis,” in Handbook of Spectroscopy, G. Gauglitz and
T. Vo-Dinh, Eds. Weinheim: WILEY-VCH Verlag GmbH & Co. KGaA, 2003, pp. 365–
420.
[107] NIST, “X-ray transition energies database.” .
[108] A. Thompson et al., “Section 1.2 X-RAY EMISSION ENERGIES,” in X-ray data booklet,
3rd ed., Berkeley: Lawrence Berkeley National Laboratory, 2009, p. 176.
[109] K. Janssens, “X-ray {Fluorescence} {Analysis},” in Handbook of {Spectroscopy},
Weinheim: WILEY-VCH Verlag GmbH & Co. KGaA, 2003, pp. 365–419.
[110] C. Streli, P. Wobrauschek, and P. Kregsamer, “X-Ray Fluorescence Spectroscopy,
Applications*,” in Encyclopedia of Spectroscopy and Spectrometry, Elsevier, 1999, pp.
3000–3009.
[111] K. Thompson, “Technology Focus: Silicon Drift Detectors.” .
[112] V. A. Solé, E. Papillon, M. Cotte, P. Walter, and J. Susini, “A multiplatform code for the
analysis of energy-dispersive X-ray fluorescence spectra,” Spectrochim. Acta Part B At.
Spectrosc., vol. 62, no. 1, pp. 63–68, 2007.
[113] Brightspec, “bAxil,” 2014. [Online]. Available:
http://www.brightspec.be/brightspec/?q=node/31.
[114] J. S. Brenizer, “A Review of Significant Advances in Neutron Imaging from Conception to
the Present,” Phys. Procedia, vol. 43, pp. 10–20, Jan. 2013.
[115] R. J. Brook and A. Cheetham, “Advanced tomographic methods in materials research and
engineering,” p. 490, 2008.
[116] V. Szilágyi, Z. Kis, and L. Szentmiklósi, “Neutron Imaging for Archaeometry,”
Archeometria Műhely, vol. XIII., no. 3, pp. 157–172, 2016.
[117] J. G. Tarbay, Z. Kis, and B. Maróti, “The bottom of the looted cauldron. Part I,” Acta
Archaeol. Acad. Sci. Hungaricae, vol. 68, no. 2, 2017.
[118] “Andor Solis.” .
[119] Z. Kis et al., “Neutron Based Imaging and Element-mapping at the Budapest Neutron
Centre,” Phys. Procedia, vol. 69, pp. 40–47, 2015.
[120] “ImageJ Z-Functions.” [Online]. Available: https://imagej.net/Z-functions. [Accessed: 06-
Apr-2018].
[121] “Octopus Imaging Software.” [Online]. Available: https://octopusimaging.eu/. [Accessed:
07-Apr-2018].
112
[122] A. P. Kaestner, “MuhRec - A new tomography reconstructor,” in Nuclear Instruments and
Methods in Physics Research, Section A: Accelerators, Spectrometers, Detectors and
Associated Equipment, 2011, vol. 651, no. 1, pp. 156–160.
[123] A. P. Kaestner, “User manual for KipTool,” 2017. .
[124] “VGSTUDIO MAX 3.1.” [Online]. Available:
https://www.volumegraphics.com/en/news/release-3-1.html. [Accessed: 07-Apr-2018].
[125] V. Kiss et al., “Non-destructive analyses of bronze artefacts from Bronze Age Hungary
using neutron-based methods,” J. Anal. At. Spectrom., vol. 30, no. 3, pp. 685–693, 2015.
[126] L. Vergard, “Die Konstitution der Mischkristalle und die Raumfullung der Atome,”
Zeitschrift für Phys., vol. 5, no. 1, pp. 17–26, 1921.
[127] C. Ingelbrecht, A. Adriaens, and E. A. Maier, “The Certification of Arsenic, Lead, Tin and
Zinc (Mass Fractions) in Five Copper Alloys - BCR-691,” 2001.
[128] M. B. Merkl, “Bell Beaker metallurgy and the emergence of Fahlore-copper use in central
Europe,” Interdiscip. Archaeol., vol. 1, no. 1, pp. 19–27, 2010.
[129] D. Dungworth, “Roman Copper Alloys: Analysis of Artefacts from Northern Britain,” J.
Archaeol. Sci., vol. 24, no. 10, pp. 901–910, 1997.
[130] P. T. Craddock, “The composition of the copper alloys used by the Greek, Etruscan and
Roman civilizations: 3. The Origins and Early Use of Brass,” J. Archaeol. Sci., vol. 5, no.
1, pp. 1–16, Mar. 1978.
[131] S. Kemény, A. Deák, K. Lakné Komka, and P. Kunovszki, Kísérletek tervezése és
értékelése. Budapest: Typotex Elektronikus Kiadó Kft., 2017.
[132] Z. Revay, “Determining Elemental Composition Using Prompt,gamma Activation
Analysis,” Anal. Chem., vol. 81, no. 16, pp. 6851–6859, 2009.
[133] Z. Révay, “In-Beam Prompt Gamma-Activation Analysis,” Encycl. Anal. Chem., 2009.
[134] L. Szentmiklosi, T. Belgya, Z. Revay, and Z. Kis, “Upgrade of the prompt gamma
activation analysis and the neutron-induced prompt gamma spectroscopy facilities at the
Budapest research reactor,” J. Radioanal. Nucl. Chem., vol. 286, no. 2, pp. 501–505, 2010.
[135] L. Szentmiklosi, T. Belgya, and Z. Revay, “Digital signal processing in prompt-gamma
activation analysis,” J. Radioanal. Nucl. Chem., vol. 264, no. 1, pp. 229–234, 2005.
[136] B. Maróti, L. Szentmiklósi, and T. Belgya, “Comparison of low-energy and coaxial HPGe
detectors for prompt gamma activation analysis of metallic samples,” J. Radioanal. Nucl.
Chem., vol. 310, no. 2, pp. 743–749, 2016.
[137] L. Szentmiklósi et al., “Fifteen years of success: user access programs at the Budapest
prompt-gamma activation analysis laboratory,” J. Radioanal. Nucl. Chem., pp. 1–7, 2016.
[138] E. Szabados, G. Sági, F. Somodi, B. Maróti, D. Srankó, and A. Tungler, “Wet air oxidation
113
of paracetamol over precious metal/Ti mesh monolith catalyst,” J. Ind. Eng. Chem., vol.
46, 2017.
[139] T. Benko et al., “Bimetallic Ag–Au/SiO2 catalysts: Formation, structure and synergistic
activity in glucose oxidation,” Appl. Catal. A-GENERAL, vol. 479, pp. 103–111, 2014.
[140] J. Corsi et al., “Compositional analysis of a historical collection of Cisalpine Gaul’s coins
kept at the Hungarian National Museum,” J. Anal. At. Spectrom., vol. 30, no. 3, pp. 730-
737–8, 2015.
[141] D. Mukherji et al., “Neutron and synchrotron probes in the development of Co-Re-based
alloys for next generation gas turbines with an emphasis on the influence of boron
additives,” J. Appl. Crystallogr., vol. 47, pp. 1417–1430, 2014.
[142] S. Söllradl, H. Lührs, Z. Révay, P. Kudejova, L. Canella, and A. Türler, “Increasing the
dynamic range for the analysis of boron in PGAA,” J. Radioanal. Nucl. Chem., vol. 298,
no. 3, pp. 2069–2073, 2013.
[143] S. Söllradl, “Developments in prompt gamma-ray neutron activation analysis and cold
neutron tomography and their application in non-destructive testing,” Universität Bern,
2014.
[144] D. Bourgarit and B. Mille, “The elemental analysis of ancient copper based artefacts by
ICP-AES: an optimised methodology reveals some secrets of the Vix crater,” Meas. Sci.
Technol., vol. 14, pp. 1538–1555, 2003.
[145] R. Nowotny, “XMuDat: Photon attenuation data on PC,” 1998. .
[146] A. DL and K. Zs, “Applications of PGAA with Neutron Beams,” in Handbook of Prompt
Gamma Activation Analysis with Neutron Beams, Dordrecht: Kluwer Academic
Publishers, 2004, pp. 137–172.
[147] Benko T et al., “Bimetallic Ag–Au/SiO2 catalysts: Formation, structure and synergistic
activity in glucose oxidation,” Appl. Catal. A-GENERAL, vol. 479, pp. 103–111, 2014.
[148] B. Fazekas, A. Simonits, J. Östör, Z. Kis, and M. GL, “New features of the program
Hypermet-PC,” 1997, pp. 85–88.
[149] T. Benkó et al., “Bimetallic Ag–Au/SiO2 catalysts: Formation, structure and synergistic
activity in glucose oxidation,” Appl. Catal. A-GENERAL, vol. 479, pp. 103–111, 2014.
[150] E. Szabados, S. DF, F. Somodi, B. Maróti, S. Kemény, and A. Tungler, “Wet oxidation of
dimethylformamide via designed experiments approach studied with Ru and Ir containing
Ti mesh monolith catalysts,” J. Ind. Eng. Chem., vol. 34, pp. 405–414, 2016.
[151] E. Szabados, “Szervesanyag- tartalmú hulladékvizek nedves oxidációja,” BUDAPESTI
MŰSZAKI ÉS GAZDASÁGTUDOMÁNYI EGYETEM, 2016.
[152] E. Szabados, D. F. Srankó, F. Somodi, B. Maróti, S. Kemény, and A. Tungler, “Wet
oxidation of dimethylformamide via designed experiments approach studied with Ru and
114
Ir containing Ti mesh monolith catalysts,” J. Ind. Eng. Chem., vol. 34, 2016.
[153] Mukherji D et al., “Application of in situ neutron and X-ray measurements at high
temperatures in the development of Co-Re-based alloys for gas turbines,” Metall. Mater.
Trans. A-PHYSICAL Metall. Mater. Sci., vol. 44, no. 1, pp. 22–30, 2013.
[154] C. J. and P. M., “THE INFLUENCE OF CORROSION AND DIFFUSION ON THE
PERCENTAGE OF SILVER IN ROMAN DENARII,” Archaeometry, vol. 7, no. 1, pp.
98–105, May 1964.
[155] Z. Sandor, S. Tolgyesi, I. Gresits, and Z. Kasztovszky, “Determination of the alloying
elements in ancient silver coins by x-ray fluorescence,” J. Radioanal. Nucl. Chem., vol.
254, no. 2, pp. 283–288, 2002.
[156] L. Szentmiklósi, Z. Kis, and T. Belgya, “On the design and installation of a Compton–
suppressed HPGe spectrometer at the Budapest neutron-induced prompt gamma
spectroscopy (NIPS) facility,” J. Radioanal. Nucl. Chem., vol. 298, no. 3, pp. 1605–1611,
2013.
[157] J. Corsi, “Multi-technique study of coins circulating in northern Italy between 4th and 1st
century,” 2015.
[158] C. Bottaini et al., “New insights on Late Bronze Age Cu-metallurgy from Coles de Samuel
hoard (Central Portugal): A combined multi-analytical approach,” J. Archaeol. Sci.
Reports, vol. 7, pp. 344–357, 2016.
[159] T. Rehren, L. Boscher, and E. Pernicka, “Large scale smelting of speiss and arsenical
copper at Early Bronze Age Arisman, Iran,” J. Archaeol. Sci., vol. 39, no. 6, pp. 1717–
1727, 2012.
[160] I. Constantinides, M. Gritsch, A. Adriaens, H. Hutter, and F. Adams, “Microstructural
characterisation of five simulated archaeological copper alloys using light microscopy,
scanning electron microscopy, energy dispersive X-ray microanalysis and secondary ion
mass spectrometry,” Anal. Chim. Acta, vol. 440, no. 2, pp. 189–198, Aug. 2001.
[161] G. Arana, U. Wätjen, C. Ingelbrecht, and P. Robouch, “Bronze analysis by k0-NAA and
PIXE,” in Journal of Radioanalytical and Nuclear Chemistry, 2003, vol. 257, no. 3, pp.
603–608.
[162] H. Lechtman and S. Klein, “Cosmelting : Modern Experiment , Ancient Practice,” pp.
497–526, 1999.
[163] M. Mödlinger et al., “Archaeometallurgical characterization of the earliest European metal
helmets,” Mater. Charact., vol. 79, pp. 22–36, 2013.
[164] M. Modlinger et al., “Non-invasive PGAA, PIXE and ToF-ND analyses on Hungarian
Bronze Age defensive armour,” J. Radioanal. Nucl. Chem., vol. 300, no. 2, pp. 787–799,
2014.
[165] G. Szabó, “Evaluation of Late Bronze Age Carpathian tinbronzes based on the alloying
115
content,” in Archaeometrical Research in Hungary II., L. Költő and L. Bartosiewicz, Eds.
Magyar Nemzeti Múzeum; Somogy-megyei Múzeumok Igazgatósága, 1998, pp. 159–173.
[166] G. Szabó, “Archaeometallurgical investigations of the LBA bronze objects in the
Carpathian Basin,” in Archaeometry 98: Proceedings of the 31st Symposium, 2002, BAR
Intern., pp. 481–490.
[167] I. Szathmári, “On the matallurgy of the Füzesabony Culture. Bronze finds and casting
moulds from the Füzesabony Bronze Age tell settlement,” Commun. Archaeol. Hungariae,
no. 2017, pp. 57–78, 2018.
[168] V. F. Sears, “Neutron Scattering Lengths and Cross Sections,” Neutron News, vol. 3, no. 3,
pp. 26–37, 1992.
[169] R. Schulze et al., “The ANCIENT CHARM project at FRM II: Three-dimensional
elemental mapping by prompt gamma activation imaging and neutron tomography,” J.
Anal. At. Spectrom., vol. 28, no. 9, 2013.
[170] L. Szentmiklosi and Z. Kis, “Characterizing nuclear materials hidden in lead containers by
neutron-tomography-driven prompt gamma activation imaging (PGAI-NT),” Anal.
METHODS Adv. METHODS Appl., vol. 7, no. 7, pp. 3157–3163, 2015.
[171] L. Szentmiklósi et al., “A new PGAI-NT setup and elemental imaging experiments at the
Budapest Research Reactor,” p. CD ROM, 2008.
[172] L. Szentmiklósi, B. Maróti, Z. Kis, and Z. Kasztovszky, “Integration of neutron-based
element analysis and imaging and its applications to cultural heritage research,” J.
Archaeol. Sci. Reports, vol. 20, no. February, pp. 476–482, 2018.
[173] G. Fehér, “Oszmán-török mérlegsúlyok,” in Communicationes archaeologicae Hungariae,
1993, pp. 231–247.
[174] I. Szathmári, “The florescence of the Middle Bronze Age in the Tisza Region: the
Füzesabony Culture,” in Hungarian Archaeology at the Turn of the Millennium, V. Z, Ed.
Department of Monuments of the Ministry of National Cultural Heritage, 2003, pp. 156–
157.
[175] “Momentum Mobility Research Group.” [Online]. Available:
http://mobilitas.ri.btk.mta.hu/?page_id=1084&lang=en.
[176] B. Maróti, I. Harsányi, and Z. Kasztovszky, “Non-destructive analysis of bronze objects
from Füzesabony-Öregdomb. Communicationes Archaeologicae Hungariae,” Commun.
Archaeol. Hungariae, no. 2017, pp. 81–84, 2018.
[177] S. V. Kasztovszky Zs., “Neolitikus rézgyöngyök vizsgálata Polgár-Csőszhalom lelőhelyről
– előzetes eredmények,” 2010. .
[178] P. Gaboda, “personal communication.” 2016.
[179] B. Maróti, Z. Kis, L. Szentmiklósi, E. Horváth, G. Káli, and T. Belgya, “Characterization
116
of a South-Levantine bronze sculpture using position-sensitive prompt gamma activation
analysis and neutron imaging,” J. Radioanal. Nucl. Chem., vol. 312, no. 2, 2017.
[180] A. Rosenfeld, S. Ilani, and M. Dvorachek, “Bronze Alloys from Canaan During the Middle
Bronze Age,” J. Archaeol. Sci., vol. 24, no. 9, pp. 857–864, 1997.
[181] Z. E. L. Morr and M. Pernot, “Middle Bronze Age metallurgy in the Levant: evidence
from the weapons of Byblos,” J. Archaeol. Sci., vol. 38, no. 10, pp. 2613–2624, Oct. 2011.
[182] S. Shalev, “Southern levant, bronze age metal production and utilization.,” in
Encyclopedia of Archaeology, Academic Press, New York, 2008, pp. 898–899.
[183] Rehren T et al., “5,000 years old Egyptian iron beads made from hammered meteoritic
iron,” J. Archaeol. Sci., vol. 40, no. 12, pp. 4785–4792, 2013.
[184] L. Robbiola, J. M. Blengino, and C. Fiaud, “Morphology and mechanisms of formation of
natural patinas on archaeological Cu-Sn alloys,” Corros. Sci., vol. 40, no. 12, pp. 2083–
2111, 1998.
[185] K. P. Fitzgerald, J. Nairn, and A. Atrens, “The chemistry of copper patination,” Corros.
Sci., vol. 40, no. 12, pp. 2029–2050, 1998.
[186] O. Oudbashi, “Multianalytical study of corrosion layers in some archaeological copper
alloy artefacts,” Surf. Interface Anal., vol. 47, no. 13, pp. 1133–1147, 2015.
[187] J. G. Tarbay, B. Maróti, and Z. Kis, “Introducing the Spear Project: The Tale of a Late
Bronze Age Spearhead with Wooden Shaft from the Marshland of Kikinda, Serbia,” J.
Archaeol. Sci. Reports, 2018.
[188] D. B. and B. Mille, “The elemental analysis of ancient copper-based artefacts by
inductively-coupled-plasma atomic-emission spectrometry: an optimized methodology
reveals some secrets of the Vix crater,” Meas. Sci. Technol., vol. 14, no. 9, p. 1538, 2003.
117
New scientific results
1. I introduced a new measure based on the cumulative gamma line intensities of PGAA
spectra to classify the elements. For those where around 100% of the normalized cumulative line
intensity values, i.e. the large proportion of the gamma yield, is concentrated in easily detectable
peaks, the standard coaxial HPGe detectors are preferred for the PGAA measurements. If the
cumulative line intensity values are small and only 10-20% of the counts appear in detectable
peaks, the peak evaluation procedure is difficult. The missing part of the neutron capture cross
section is fragmented to a large number of weak transitions that are not adequately resolved by the
most frequently used HPGe detectors. These counts greatly increase the total count rate, but appear
in the continuously increasing baseline of the spectrum towards low-energies and can not be used
for analytical purposes. [A7]
2. I established two subgroups within the type 2 PGAA spectra by using the binding
energy test and available literature data. Type 2/1 includes elements that have intense gamma
lines at low and at high energies. This group contains Z <30 metals (e.g. Cu). The 2/2-type elements
emit gamma-photons with energy up to 500 keV. Most of this group includes Z> 30 elements (e.g.
Ag and Sb). My experimental strategy was based on this classification. [A1, A7]
3. I observed a positive systematic bias of the tin concentrations in bronze alloys by the
PGAA, when analyzing 30 binary copper-alloys with XRF, TOF-ND and PGAA. To clarify the
reason of the difference, I made targeted PGAA measurements on high-purity copper and tin
samples, as well as on their stoichiometric compounds for the refinement of spectroscopic data. I
showed that for the reliable analysis of tin, the interference even with the low-intensity (around
0.2%) copper peaks at 1171 and 1293 keV has to be taken into account. I validated my correction
procedure using certified reference copper-alloys, and found the results to be in good agreement
with the reference values. [A1, A4, A8, A10]
4. I introduced two new PGAA detection strategies in the analysis of copper-alloys i.e.
using a high-resolution planar LEGe detector, and a gamma attenuator placed between the
sample chamber and the conventionally used coaxial HPGe detector. The analytical
performance indicators of the classical PGAA and the newly developed detection strategies were
compared with each other and also with INAA and in-beam activation analysis. I showed that in
the analysis of samples with unknown compositions, the most appropriate setup is a coaxial HPGe
with gamma attenuator, complemented with a high-resolution planar LEGe detector placed at the
118
other side of the sample chamber, and combined with off-line gamma spectrometry (in-beam NAA)
measurements. PGAA with a gamma-attenuator should be used for Pb, Sn, Mn, Fe and Ni
components; As, Sb and Ag can be analyzed more effectively and in a more productive way using
a LEGe detector compared to the conventional PGAA. The off-line counting measurements provide
more precise results for some important minor components, such as As, Sb and Mn. [A7, A1]
5. The 2/2 type metals have numerous, intense prompt gamma peaks below 500 keV. I
demonstrated that, using a high-resolution planar LEGe detector in the analysis of precious-
metal containing samples, similar or more precise results can be obtained in a shorter
measurement time and with decreased activation risk compared to the traditional PGAA
method. The complicated multiplets unresolvable by the coaxial HPGe due to its larger peak width
and peak-shape distortion can be successfully decomposed using a LEGe detector. These precisely
fitted, non-overlapping peak-pairs at close gamma-ray energies are well suited for analytical
purposes, and the systematic error caused by the gamma self-absorption can also be minimalized.
[A7, A9]
6. I used a handheld XRF device for the time- and cost-effective prefiltering/grouping of
archaeological objects prior to PGAA measurements. Based on these results, I optimized the
PGAA measurement conditions, i.e. acquisition time and counting rate. If the surface XRF and the
bulk PGAA results did not agree, or if the scale of structural heterogeneities was smaller than the
spatial resolution of the local PGAA method, 3D neutron imaging was additionally used. With the
joint interpretation of the results from multiple techniques, I revealed the complex internal
structures of precious heterogeneous archaeological objects. [A2, A3, A4, A5, A6]
7. Based on my experiences, I developed and established a recommended analytical
workflow (combination and sequence of techniques) to non-destructively characterize alloys.
Using this protocol, samples can be analyzed more accurately and efficiently than before. [A1]
119
Tézispontok
1. A PGAA spektroszkópiai adatokból levezett, kumulatív vonalintenzitásokon alapuló új
mérőszámot vezettem be az elemek csoportosítására. Azon elemek esetén, ahol a termikus
neutronbefogási hatáskeresztmetszetre normált kumulatív vonalintenzitások értéke egyhez közeli
érték, azaz a gamma hozam túlnyomó része jól detektálható csúcsokban összpontosul, a
spektrumbéli csúcsok feloldhatók a PGAA mérésekhez használt koaxiális HPGe detektorokkal.
Ahol a kumulatív vonalintenzitások értéke kicsi, 0,1 vagy 0,2, azaz a beütéseknek csupán 10-20%-
a jelenik meg jól detektálható csúcsokban, ott a csúcskiértékelés gyakran nehézségekbe ütközik. A
neutronbefogási hatáskeresztmetszet hiányzó részét olyan csúcsok adják, amelyek nem bonthatók
fel megfelelően a legtöbbször alkalmazott koaxiális HPGe detektorral. Ezek a beütések az össz-
beütésszám értékét nagyban növelik, de a spektrum kis energiák felé folyamatosan emelkedő
alapvonalában jelennek meg, és analitikai célra nem használhatók. [A7]
2. Az irodalomban rendelkezésre álló adatok és a kötési-energia teszt segítségével a 2-es
típusú PGAA spektrummal rendelkező elemeken belül két alcsoportot különböztettem meg.
A 2/1-es típusba tartoznak azon elemek, melyek kis és nagy energiáknál is rendelkeznek néhány
nagy intenzitású gamma vonallal. Ebbe a csoportba Z <30 fémek tartoznak (pl. Cu). A 2/2-es
típusba tartozó elemek főleg 500 keV-nál kisebb energiájú gamma fotonokat bocsátanak ki. Ebbe
a csoportba sorolhatók többnyire a Z >30 elemek (pl. Ag és Sb). Ez a besorolás megalapozta
kísérleti stratégiákat. [A1, A7]
3. Mintegy harminc kétkomponensű bronz mintán végeztem szisztematikus összehasonlító
méréseket PGAA-val és Röntgen-fluoreszcencia spektroszkópiával. A kapott adatokat
neutrondiffrakciós módszerből levezetett, indirekt összetétel adatokkal is összevetettem. Ezek
alapján a PGAA módszerrel mért ónkoncentrációk pozitív szisztematikus eltérését figyeltem meg.
Célzott PGAA méréseket végeztem nagytisztaságú réz és ón mintákon, valamint ezek
sztöchiometrikus vegyületein a PGAA spektroszkópiai adatok pontosítása céljából. Megmutattam,
hogy az ón helyes elemzéséhez a réz gyengébb (kb. 0,2% relatív intenzitású) vonalaival történő
interferenciát is figyelembe kell venni. Az általam kidolgozott korrekciós eljárást rézötvözet
referenciaanyagokkal validáltam, és a referencia értékekkel hibahatáron belüli egyezést értem el.
[A1, A4, A8, A10]
120
4. Igazoltam, hogy ismeretlen összetételű bronz és sárgaréz minták roncsolásmentes
elemanalízisére a leggyorsabb megoldást egy kétdetektoros beállítás teszi lehetővé, amelyet
egy nagyfelbontású planár detektor (LEGe) és egy gamma-sugár gyengítővel felszerelt
koaxiális HPGe detektor alkot. A klasszikus és az általam bevezetett új PGAA detektálási
módokkal (gamma-gyengítővel, ill. nagyfelbontású LEGe detektorral), valamint reaktor- és in-
beam NAA módszerrel méréseket végeztem a módszerek analitikai teljesítményjellemzőinek
összehasonlítására. Az 1-es és 2/1-es spektrumtípusú fémek a gamma-gyengítős PGAA-val, a 2/2-
es típusúak pedig a LEGe spektrum alapján elemezhetők kedvezőbben a szokásos egydetektoros
PGAA-hoz viszonyítva. Az As, Sb, Mn mellékalkotók mennyisége a PGAA-mérést követő off-
line gamma spektrometriás (azaz in-beam NAA) mérésből határozható meg a legpontosabban. [A7,
A1]
5. Bizonyítottam, hogy az intenzív, kis energiás (<500 keV) prompt-γ vonalakkal rendelkező,
2/2-es típusú nemesfémeket tartalmazó minták (pl. Au, Ag, Ir-tartalmú katalizátorok, Ag-Cu
érmék, Co-Re ötvözetek) elemanalízise esetén nagyfelbontású LEGe detektor alkalmazásával
rövidebb mérési idő alatt pontosabb eredmények érhetők el. Jól illeszthető, közeli energiájú,
interferenciamentes csúcspárokra alapozva a gamma-önabszorpció okozta szisztematikus hiba is
minimalizálható volt. Megmutattam, hogy kis energiájú multiplettek illesztésekor a nagyfelbontású
LEGe detektor alkalmazásával helyes csúcsterület-felbontás érhető el olyan esetekben is, amikor a
standard PGAA spektrumból az elemzés nem végezhető el megfelelően a rosszabb
energiafelbontás és a csúcsalaktorzulások miatt. A mérési idő rövidítésével a neutron-besugárzás
okozta felaktiválódási kockázatot is sikerült csökkentenem. [A7, A9]
6. Kézi XRF módszert alkalmaztam a PGAA mérésre váró minták gyors és költséghatékony
előzetes csoportosítására, amellyel optimalizálni tudtam a PGAA mérési körülményeket (pl.
mérési idő, számlálási sebesség). Ahol a PGAA módszer térbeli felbontása nem érte el a tárgy
makroszkopikus szerkezeti heterogenitásának mérettartományát, ill. a tárgy felszínén mért XRF és
a tömbi PGAA adatok között jelentős különbség mutatkozott, 3D neutronos képalkotás
segítségével értelmeztem az eredményeket. Az eljárást sikeresen alkalmaztam ismeretlen
összetételű heterogén műtárgyakon és feltártam azok komplex belső szerkezetét [A2, A3, A4, A5,
A6].
121
7. Az elvégzett mérésekből levont következtetéseim alapján kidolgoztam egy analitikai
protokollt, amely megadja a fémötvözetek roncsolásmentes elemzésekor javasolt mérési
módszereket és azok célszerű sorrendjét. A protokoll segítségével a minták az eddigieknél
pontosabban és hatékonyabban elemezhetők. [A1]
122
List of publications related to the theses
A1.Maróti B, Révay Zs, Szentmiklósi L, Kleszcz K, Párkányi D, Belgya T. Benchmarking PGAA,
in-beam NAA, reactor-based NAA and handheld XRF spectrometry for analysis of archeological
bronzes, Journal of Radioanalytical and Nuclear Chemistry DOI: 10.1007/s10967-018-5990-2
(2018)
A2.Tarbay J G, Maróti B, Kis Z. Introducing the Spear Project: The Tale of the Late Bronze Age
Spearhead with Wooden Shaft from the Marshland of Kikinda, Serbia, Journal of Archaeological
Science: Reports DOI: 10.1016/j.jasrep.2018.05.028 (2018)
A3.Szentmiklósi L, Maróti B, Kis Z, Kasztovszky Zs. Integration of neutron-based element analysis
and imaging and its applications to cultural heritage research, Journal of Archaeological Science:
Reports 2018 20, 476-482.
A4.Maróti B, Harsányi I, Kasztovszky Zs. Non-destructive analysis of bronze objects from
Füzesabony-Öregdomb. Communicationes Archaeologicae Hungariae 2017 (2018) 81-84.
A5.Maróti B, Kis Z, Szentmiklósi L, Horváth E, Káli Gy and Belgya T. Characterization of a South-
Levantine bronze sculpture using position-sensitive prompt gamma activation analysis and neutron
imaging, Journal of Radioanalytical and Nuclear Chemistry 2017 312, 367-375 [IF 0,983],
Number of citations: 2 Without self-citations: 2
A6.Szentmiklósi László, Kis Zoltán, Belgya Tamás, Maróti Boglárka, Horváth László Zoltán, Papp
Mariann. Roncsolásmentes képalkotás neutronokkal és röntgensugárzással a Budapesti Neutron
Centrumban, Fizikai Szemle 2017 67, 240-244.
A7.Maróti B, Szentmiklósi L, and Belgya T. Comparison of low-energy and coaxial HPGe detectors
for prompt gamma activation analysis of metallic samples, Journal of Radioanalytical and Nuclear
Chemistry 2016 310, 743-749. [IF 0,983], Number of citations: 2 Without self-citations: 2
A8.Kiss V, Fischl KP, Horváth E, Káli G, Kasztovszky Zs, Kis Z, Maróti B, Szabó G. Non-destructive
analyses of bronze artefacts from Bronze Age Hungary using neutron-based methods Journal of
Analytical Atomic Spectrometry 2015 30, 685-693. [IF 3.379], Number of citations: 6 Without
self-citations: 3
A9.Corsi J, Maroti B, Re A, Kasztovszky Z, Szentmiklósi L, Torbágyi M, Agostino A, Angelici D,
Allegretti S. Compositional analysis of a historical collection of Cisalpine Gaul's coins kept at the
Hungarian National Museum Journal of Analytical Atomic Spectrometry 2015 30, 730-737. [IF
3.379], Number of citations: 10 Without self-citations: 2
123
A10.Mödlinger M, Kasztovszky Zs, Kis Z, Maróti B, Kovács I, Szőkefalvi-Nagy Z, Káli Gy, Horváth
E, Sánta Zs, El Morr Z. Non-invasive PGAA, PIXE and ToF-ND analyses on Hungarian Bronze
Age defensive armour Journal of Radioanalytical and Nuclear Chemistry 2014 300, 787-799. [IF
1,034], Number of citations: 5 Without self-citations: 1
Additional publications related to the subject of the dissertation
A11.Kozsda-Barsy E, Pintér-Csordás A, Maróti B, Perez-Feró E, Nagy I, Kulacsy K, Szentmiklósi L,
Horváth M, Nagy R, Novotny T, Hozer Z, Kis Z: Post-test examinations on Zr-1%Nb claddings
after ballooning and burst, high-temperature oxidation and secondary hydriding. Journal of
Nuclear Materials DOI: 10.1016/j.jnucmat.2018.05.072
A12.Tarbay JG, Kis Z, Maróti B. The bottom of the looted cauldron. Part I, Acta Archaeologica
Academiae Scientiarum Hungaricae 2017 68, 219-240.
A13.Kis Z, Szentmiklósi L, Belgya T, Balaskó M, Horváth LZ, Maróti B. Neutron Based Imaging and
Element-mapping at the Budapest Neutron Centre. Physics Procedia 2015 69, 40-47. [IF 0],
Number of citations: 3 Without self-citations: 1
A14.Kasztovszky Zs, Maróti B. Potentials and limitations of neutron-based methods in archaeometry
of silver [Ezüsttárgyak neutronos vizsgálatának lehetőségei és nehézségei], Archeometriai Műhely
2015 12, 25-32.
A15.Kiss Viktória, P Fischl K , Kasztovszky Zs , Káli Gy, Kis Z , Maróti B , Horváth E , Szabó G.
Bronzkori fémtárgyak roncsolásmentes neutron analitikai vizsgálatának eredményei, GESTA
Miskolc 2014 13, 19-32.
A16.Watkinson D, Rimmer M, Kasztovszky Zs, Kis Z, Maróti B, and Szentmiklósi L. The Use of
neutron analysis techniques for detecting the concentration and distribution of chloride ions in
archaeological iron Archaeometry 2014 56, 841-859. [IF 1,519], Number of citations: 8 Without
self-citations: 4
A17.Rehren T, Belgya T, Jambon A, Káli Gy, Kasztovszky Zs, Kis Z, Kovács I, Maróti B, Martinón-
Torres M, Miniaci G, Pigott V C, Radivojević M, Rosta L, Szentmiklósi L, and Szokefalvi-Nagy
Z. 5,000 years old Egyptian iron beads made from hammered meteoritic iron, Journal of
Archaeological Science 2013 40, 4785-4792. [IF 2,139], Number of citations: 33 Without self-
citations: 25
124
Further publications
A18.Szentmiklósi L, Maróti B, Párkányi D, Harsányi I, Révay Z. High-energy detector calibration data
for k0-neutron activation analysis Journal of Radioanalytical and Nuclear Chemistry 2018 315,
743-750.
A19.Dias MI, Kasztovszky Zs, Prudêncio MI, Valera AC, Maróti B, Harsányi I, Kovács I, Szokefalvi-
Nagy Z. X-ray and neutron-based non-invasive analysis of prehistoric stone artefacts: a
contribution to understand mobility and interaction networks Archaeological and Anthropological
Sciences DOI: 10.1007/s12520-016-0457-2 (2018)
A20.Kasztovszky Z, Maróti B, Harsányi I, Párkányi D, Szilágyi V. A comparative study of PGAA and
portable XRF used for non-destructive provenancing archaeological obsidian. Quaternary
International X 2018 468, 179-189
A21.Gatera A, Belgya T, Geerts W, Göök A, Hambsch F-J, Lebois M, Maróti B, Moens A, Oberstedt
A, Oberstedt S, Postelt F, Qi L, Szentmiklósi L, Sibbens G, Vanleeuw D, Vidali M, Zeiser F.
Prompt-fission γ -ray spectral characteristics from Pu 239 (nth,f), Physical Review C 2017 95, 5
A22.Dias MI, Prudêncio MI, Kasztovszky Z, Maróti B, Harsányi I, Flor P. Nuclear techniques applied
to provenance and technological studies of Renaissance majolica roundels from Portuguese
museums attributed to della Robbia Italian workshop Journal of Radioanalytical and Nuclear
Chemistry 2017 312, 205-219.
A23.Rogante M, Rosta L, Káli Gy, Kasztovszky Zs, Kis Z, Kovács I, Maróti B, Szőkefalvi-Nagy Z.
Neutron based archaeometallurgical investigation of Picenan and Roman age metal objects from
the Academia Georgica Treiensis collection (Italy) STAR: Science & Technology of
Archaeological Research 2017 3, 1-14.
A24.Rogante M, Horváth E, Káli Gy, Kasztovszky Zs, Kis Z, Kovács I, Maróti B, Rosta L, Szőkefalvi-
Nagy Z. Neutron Investigations of a Zinc Lamp of Unknown Origin from the Academia Georgica
Treiensis Archaeological Collection (Italy), Restaurierung und Archaeologie 2017 8, 45-53. [IF ]
A25.Szabados E, Sági Gy, Somodi F, Maróti B, Srankó D, Tungler A. Wet air oxidation of paracetamol
over precious metal/Ti mesh monolith catalyst Journal of Industrial and Engineering Chemistry
2017 46, 364-372. [IF 4,179], Number of citations: 2 Without self-citations: 2
A26.Kasztovszky Zs, Káli Gy, Kis Z, Kovács I, Len A, Maróti B, Pánczél-Bajnok K, Rosta L,
Szőkefalvi-Nagy Z. Applications of neutron-based and ion beam methods in Cultural Heritage
125
research at the Budapest Neutron Centre, TECHNE : La Science au Service de l Histoire de l Art
et des Civilisations 2016 43, 70-74
A27.Szabados E, Srankó DF, Somodi F, Maróti B, Kemény S, Tungler A. Wet oxidation of
dimethylformamide via designed experiments approach studied with Ru and Ir containing Ti mesh
monolith catalysts Journal of Industrial and Engineering Chemistry 2016 34, 405-414. [IF 4,179],
Number of citations: 4 Without self-citations: 1
A28.Moropoulou A, Zacharias N, Delegou ET, Maróti B, Kasztovszky Zs. Analytical and
technological examination of glass tesserae from Hagia Sophia, Microchemical Journal 2016 125,
170-184. [IF ]
A29.Prudêncio MI, Dias MI, Burbidge CI, Kasztovszky Zs, Marques R, Marques JG, Cardoso GJO,
Trindade MJ, Maróti B, Ruiz F, Esteves L, Matos MA, Pais A. PGAA, INAA and luminescence
to trace the “history” of “The Panoramic View of Lisbon”: Lisbon before the earthquake of 1755
in painted tiles (Portugal), Journal of Radioanalytical and Nuclear Chemistry 2016 307, 541-547.
A30.Szentmiklósi L, Kasztovszky Z, Belgya T, Révay Z, Kis Z, Maróti B, Gméling K, Szilágyi V.
Fifteen years of success: user access programs at the Budapest prompt-gamma activation analysis
laboratory, Journal of Radioanalytical and Nuclear Chemistry 2016 309, 71-77.
A31.Benkó T, Beck A, Frey K, Srankó DF, Geszti O, Sáfrán Gy, Maróti B, Schay Z. Bimetallic Ag–
Au/SiO2 catalysts: Formation, structure and synergistic activity in glucose oxidation Applied
Catalysis A-General 2014 479, 103-111. [IF 3,942], Number of citations: 22 Without self-citations:
20
A32.Bendő Zs , Szakmány Gy , Kasztovszky Zs , Maróti B , Szilágyi Sz , Szilágyi V , T Biró K. Results
of non-destructive SEM-EDX and PGAA analyses of jade and eclogite polished stone tools in
Hungary = Magyarországi jade és eklogit nyersanyagú csiszolt kőeszközök roncsolásmentes
vizsgálatának eredményei, ARCHEOMETRIAI MŰHELY 2014 11, 187-206.
A33.Peterdi B, Szakmany G, Judik K, Dobosi G, Kasztovszky Z, Szilagyi V, Maroti B, Bendo Z, Gil
G. Petrographic and geochemical investigation of a stone adze made of nephrite from the
Balatonoszod - Temetoi dulo site (Hungary), with a review of the nephrite occurrences in Europe
(especially in Switzerland and in the Bohemian Massif), Geological Quarterly 2014 58, 181-192.
A34.Szentmiklosi L, Belgya T, Maroti B, Kis Z. Characterization of HPGe gamma spectrometers by
geant4 Monte Carlo simulations, Journal of Radioanalytical and Nuclear Chemistry 2014 300,
553-558.
126
A35.Rosta L, Belgya T, Káli Gy, Kasztovszky Zs, Kis Z, Kovács I, Maróti B, Szentmiklósi L,
Szőkefalvi-Nagy Z, Jambon A, Rehren T. „Vasgyöngyök az égből” a legősibb ember által készített
vastárgyak meteorit eredetének igazolása röntgen- és neutronanalízissel - Proof of the Meteoritic
origin of Mankind’s earliest iron artefacts through neutron and X-ray analysis, Magyar Régészet
IV: p. online. (2013)
A36.Zacharias N , Kaparou M , Kasztovszky Zs, Maróti B , Beltsios K , Murphy J , Kantarelou V ,
Karydas AG. Mükénéi üvegek korróziójának és eredetének vizsgálata SEM-EDS, XRF ÉS PGAA
módszerekkel= An alteration and provenance study of mycenaean glass objects using neutron-
beam and X-RAY methods, Archeometriai Műhely 2013 10, 127-140.
A37.Kasztovszky Zs, T. Dobosi V, T. Biro K, Szilagyi V, Maroti B. Japán obszidiánok PGAA vizsgálata
a Magyar Nemzeti Múzeum Litotéka gyűjteményéből. [Prompt Gamma Activation Analysis of
Japanese obsidians in the Lithotheca Collection of the HNM], ARCHEOMETRIAI MŰHELY
2012 9, 247-254.
Oral presentations
O1.Comparative measurements of certified reference copper alloys using neutron-based techniques:
26th Seminar on Activation Analysis and Gamma Spectroscopy (Wien, Ausztria 2017. február 19-
22.) oral presentation (in English)
O2.Késő bronzkori fegyverzet komplex archeometriai elemzése: Bronzművesség az őskortól a
középkorig, Műhelykonferencia régészeti és történeti korú bronztárgyak vizsgálatának
lehetőségeiről (Budapest, 2016. november 25.), oral presentation (in Hungarian)
O3.Characterization of an Egypto-Canaanite bronze sculpture group using position-sensitive prompt
gamma activation analysis and neutron imaging: BNC User Meeting (Budapest, 2016. november
11.) oral presentation (in English)
O4.Különböző PGAA méréstechnikák összehasonlítása hitelesített rézötvözet mintákon: Őszi
Radiokémiai Napok (Balatonszárszó, 2016. október 10–12.) oral presentation (in Hungarian) –
Vértes Attila Ifjúsági Nívódíj különdíja
O5.Kis energiás germánium detektor használata fémes minták analízisében: Őszi Radiokémiai Napok
(Balatonszárszó, 2015. október 19–21.) oral presentation (in Hungarian) – Vértes Attila Ifjúsági
Nívódíj különdíja
127
O6.Compton-suppressed low energy germanium (LEGe) detector for metal analysis by PGAA: 25th
Seminar on Activation Analysis and Gamma Spectroscopy (Aachen, Németország 2015. február
23-25.) oral presentation (in English)
O7.Fémek vizsgálata PGAA-val és komplementer módszerekkel: Archeometriai Előadóülés
(Budapest, 2014. november 27.) oral presentation (in Hungarian)
O8.Egyiptomi bronz műtárgy vizsgálata PGAA-val és komplementer képalkotó módszerekkel: Őszi
Radiokémiai Napok (Balatonszárszó, 2014. október 13–15.) oral presentation (in Hungarian) –
Vértes Attila Ifjúsági Nívódíj
O9.A prompt-gamma aktivációs analízis optimalizálása fémmintákra: Őszi Radiokémiai Napok (Eger,
2013. október 16–18.) oral presentation (in Hungarian)
O10.Analysis of metals by high-resolution prompt-gamma spectrometry: 6th International k0-Users’
Workshop (Budapest 2013. szeptember 22-27.) oral presentation (in English)
O11.CH research in the Nuclear Analysis and Radiography Department: Training Course In the field
of Analytical and Instrumental Techniques, Seibersdorf RER/0/034 (Seibersdorf, Ausztria 2013.
március 4-15.) oral presentation (in English)
O12.Neutron analitikai módszerek archeometriai alkalmazása. NEUTRON 80 Előadói Nap (Budapest,
2012. november 27.) oral presentation (in Hungarian)
O13.Fémminták vizsgálata PGAA-val és kézi XRF készülékkel: Őszi Radiokémiai Napok (Siófok,
2012. október 8–10.) oral presentation (in Hungarian)
Posters
P1.Kis Z, Maróti B, Horváth L.Z, Szentmiklósi L. Neutron and X-ray imaging of cultural heritage
objects at the Budapest Neutron Centre (BNC), MLZ Conference: Neutrons for Culture and Arts
(Lenggries, Németország, 2018. június 19-21)
P2.Maróti B, Kis Z, Kasztovszky Zs, Szabó G, Tarbay J G, Wilhelm G, Király Á, Kiss V. Production
of bronze spirals in the 2nd Millennium BC Carpathian Basin: Neutron Imaging and Neutron
Methods in Archaeology and Cultural Heritage (Budapest, 2017. október 11-13.), poster
P3.Maróti B, Szentmiklósi L, Kis Z, Mitcsenkov-Horváth E, Liptay É, Belgya T. Neutron-based
analytical and imaging methods for the non-destructive investigation of archaeological metal
findings: International Conference on Radioanalytical and Nuclear Chemistry (Budapest, 2016.
április 10-15.), poster
128
P4.Kulcsár G, Endrődi A, Kasztovszky Zs, Káli Gy, Kis Z, Maróti B, Patay R, Szabó G, Kiss V.
Contributions to Central European Early Bronze Age metallurgy: 41rst International Symposium
on Archaeometry (Kalamata, Görögország, 2016. május 15-21.), poster
P5.Maróti B, Kovács I, Kocsonya A. Analytic capabilities and detection limits of X-ray emission
spectrometry on paint pigments: 41rst International Symposium on Archaeometry (Kalamata,
Görögország, 2016. május 15-21.), poster
P6.Corsi J, Lo Guicide A, Re A, Agostino A, Scherillo A, Grazzi F, Kasztovszky Zs, Maróti B,
Szentmiklósi L, Barello F. Characterization of silver pre-Roman coins from northern Italy with
neutron-based techniques: Synchrotron Radiation and Neutrons in Art and Archaeology (Paris,
Franciaország, 2014. szeptember 9-12.). poster
P7.Kiss V, P. Fischl K, Horváth E, Káli Gy, Kasztovszky Zs, Kis Z, Maróti B, Szabó G. Non-
destructive analyses of bronze artefacts from hoards and graves of the Bronze Age in Hungary:
Synchrotron Radiation and Neutrons in Art and Archaeology (Paris, Franciaország, 2014.
szeptember 9-12.), poster
129
Acknowledgements
I express my gratitude to the Hungarian Academy of Sciences for the young scientist grant
supporting my PhD work. I gratefully acknowledge the financial support provided by FRM II to
perform the PGAA measurements at the Heinz Maier-Leibnitz Zentrum (MLZ), Garching,
Germany. I conducted measurements within the following beamtime proposals Nr. 8417; Nr.
10922 and Nr. 11641. This work was part of the project No. 124068 that has been implemented
with the support provided from the National Research, Development and Innovation Fund of
Hungary, financed under the K_17 funding scheme.
I thank my supervisors, Prof. Zoltán Homonnay and Dr. Tamás Belgya for their support and their
time dedicated to our useful conversations.
I would like to thank my consultant, Dr. László Szentmiklósi for his patient guidance,
encouragement and persistent support he has provided throughout the years we have been working
together.
I also thank my reviwers for their positive judgement on my work, especially to Prof. Zsolt Révay
for his valuable suggestions. He spared no time sharpening the concision of my English text.
I thank the archaeologist collegues, the members and the leader of the Momentum Research Group
Dr. Viktória Kiss and the leader of Project Spear, Gábor Tarbay for the possibility to participate in
their interesting research projects and the fruitful cooperations.
I thank Dr. Éva Liptay and Dr. Péter Gaboda (Museum of Fine Arts, Budapest) as well as Dr. Gábor
Tomka and Dr. Ibolya Gerelyes (Hungarian National Museum, Budapest) for providing the
valuable archaeological findings for analysis as well as the useful discussions concerning the origin
of the objects.
I am thankful for the good partnership with the colleagues from the Wigner FK during the
CHARISMA and IPERION CH projects.
I would also like to thank all my collegues working in the Nuclear Analysis of Radiography
Department for their support and kindness, while I was working on my dissertation. I thank Dr.
Zoltán Kis for the joint work and our interesting conversations in the field of neutron imaging.
Although I slipped with all my deadlines, I really thank Dr. Jesse L. Weil for the last-minute, still
careful proofreading of my dissertation.
I express my gratitude to András Szórád, my husband, for his continued support and
encouragement, as well as his proofreading on a lot of pages and his kind remarks.
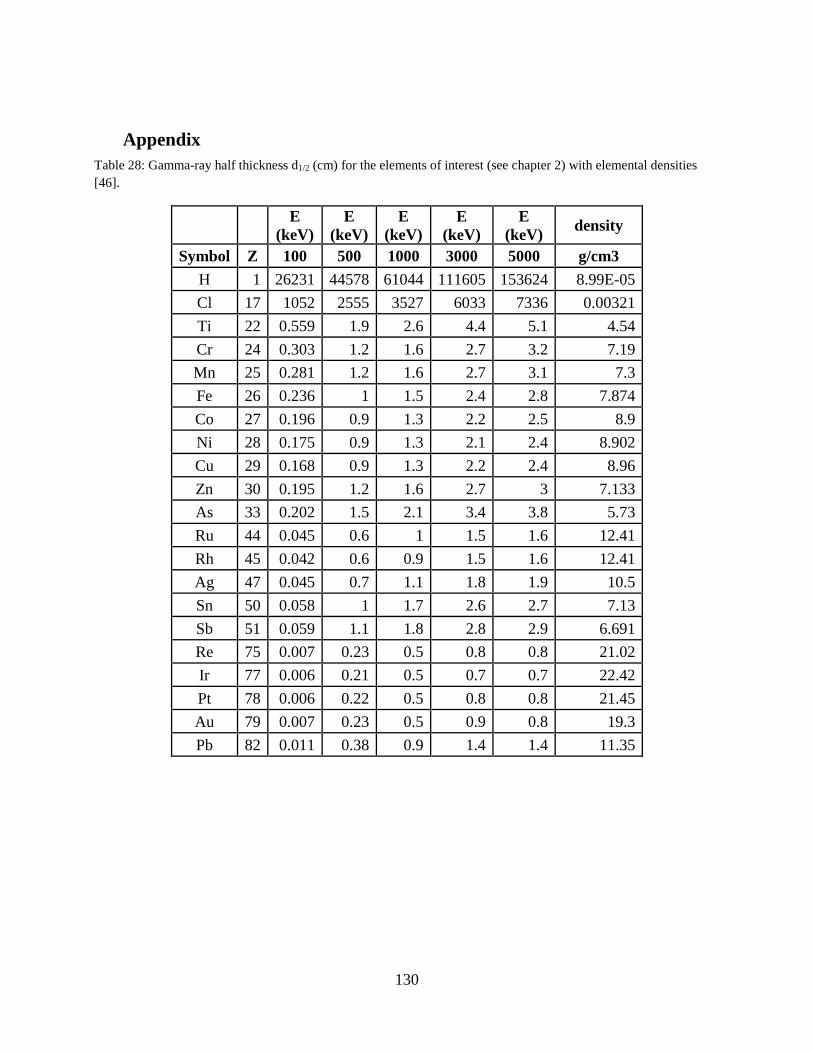
130
Appendix
Table 28: Gamma-ray half thickness d1/2 (cm) for the elements of interest (see chapter 2) with elemental densities
[46].
E
(keV)
E
(keV)
E
(keV)
E
(keV)
E
(keV) density
Symbol Z 100 500 1000 3000 5000 g/cm3
H 1 26231 44578 61044 111605 153624 8.99E-05
Cl 17 1052 2555 3527 6033 7336 0.00321
Ti 22 0.559 1.9 2.6 4.4 5.1 4.54
Cr 24 0.303 1.2 1.6 2.7 3.2 7.19
Mn 25 0.281 1.2 1.6 2.7 3.1 7.3
Fe 26 0.236 1 1.5 2.4 2.8 7.874
Co 27 0.196 0.9 1.3 2.2 2.5 8.9
Ni 28 0.175 0.9 1.3 2.1 2.4 8.902
Cu 29 0.168 0.9 1.3 2.2 2.4 8.96
Zn 30 0.195 1.2 1.6 2.7 3 7.133
As 33 0.202 1.5 2.1 3.4 3.8 5.73
Ru 44 0.045 0.6 1 1.5 1.6 12.41
Rh 45 0.042 0.6 0.9 1.5 1.6 12.41
Ag 47 0.045 0.7 1.1 1.8 1.9 10.5
Sn 50 0.058 1 1.7 2.6 2.7 7.13
Sb 51 0.059 1.1 1.8 2.8 2.9 6.691
Re 75 0.007 0.23 0.5 0.8 0.8 21.02
Ir 77 0.006 0.21 0.5 0.7 0.7 22.42
Pt 78 0.006 0.22 0.5 0.8 0.8 21.45
Au 79 0.007 0.23 0.5 0.9 0.8 19.3
Pb 82 0.011 0.38 0.9 1.4 1.4 11.35
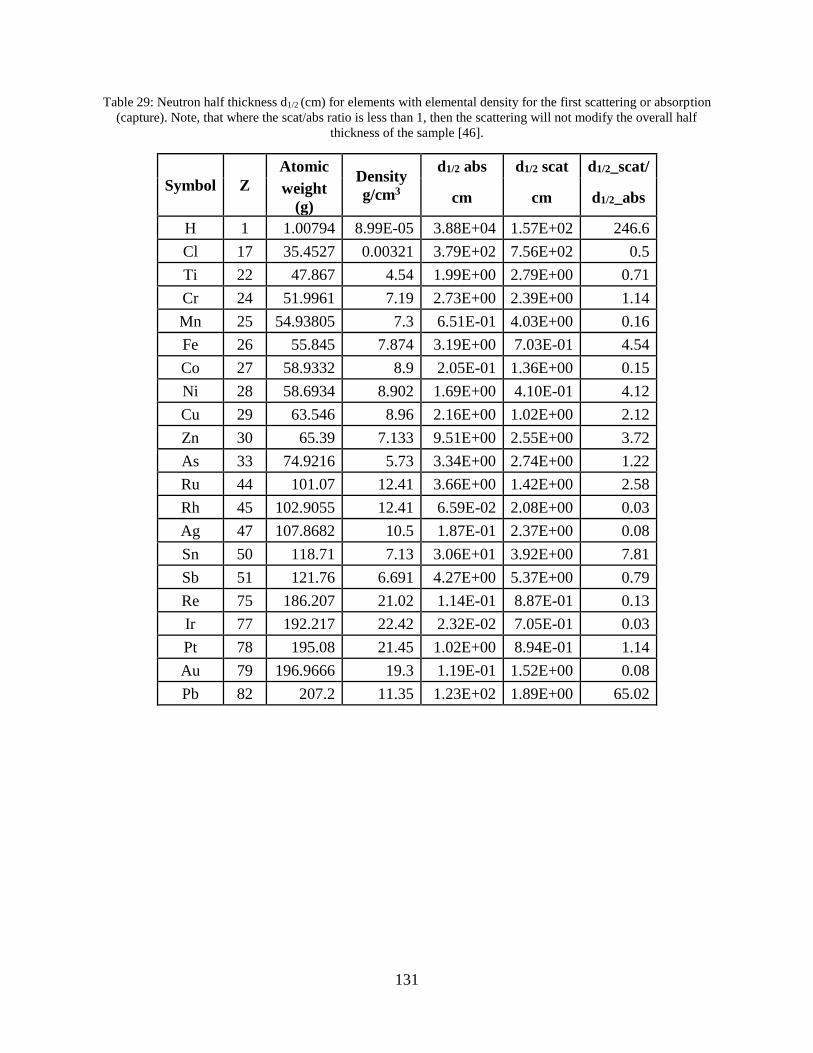
131
Table 29: Neutron half thickness d1/2 (cm) for elements with elemental density for the first scattering or absorption
(capture). Note, that where the scat/abs ratio is less than 1, then the scattering will not modify the overall half
thickness of the sample [46].
Symbol Z
Atomic Density
g/cm3
d1/2 abs d1/2 scat d1/2_scat/
weight
(g) cm cm d1/2_abs
H 1 1.00794 8.99E-05 3.88E+04 1.57E+02 246.6
Cl 17 35.4527 0.00321 3.79E+02 7.56E+02 0.5
Ti 22 47.867 4.54 1.99E+00 2.79E+00 0.71
Cr 24 51.9961 7.19 2.73E+00 2.39E+00 1.14
Mn 25 54.93805 7.3 6.51E-01 4.03E+00 0.16
Fe 26 55.845 7.874 3.19E+00 7.03E-01 4.54
Co 27 58.9332 8.9 2.05E-01 1.36E+00 0.15
Ni 28 58.6934 8.902 1.69E+00 4.10E-01 4.12
Cu 29 63.546 8.96 2.16E+00 1.02E+00 2.12
Zn 30 65.39 7.133 9.51E+00 2.55E+00 3.72
As 33 74.9216 5.73 3.34E+00 2.74E+00 1.22
Ru 44 101.07 12.41 3.66E+00 1.42E+00 2.58
Rh 45 102.9055 12.41 6.59E-02 2.08E+00 0.03
Ag 47 107.8682 10.5 1.87E-01 2.37E+00 0.08
Sn 50 118.71 7.13 3.06E+01 3.92E+00 7.81
Sb 51 121.76 6.691 4.27E+00 5.37E+00 0.79
Re 75 186.207 21.02 1.14E-01 8.87E-01 0.13
Ir 77 192.217 22.42 2.32E-02 7.05E-01 0.03
Pt 78 195.08 21.45 1.02E+00 8.94E-01 1.14
Au 79 196.9666 19.3 1.19E-01 1.52E+00 0.08
Pb 82 207.2 11.35 1.23E+02 1.89E+00 65.02
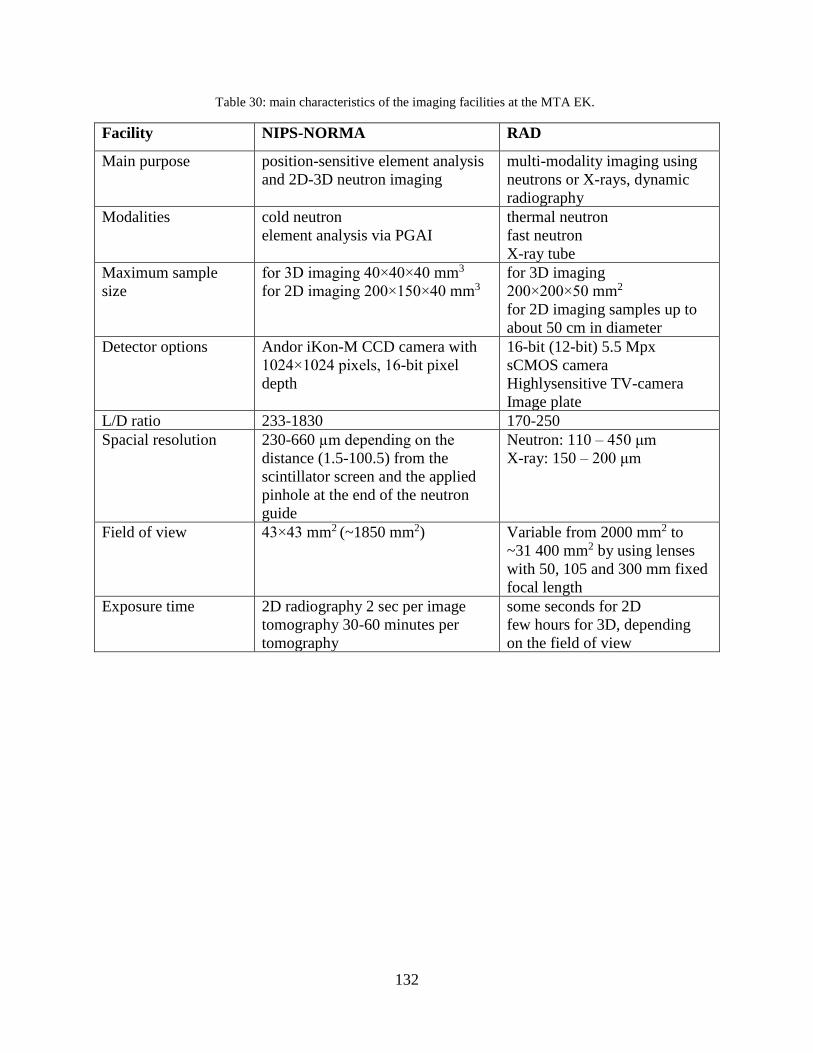
132
Table 30: main characteristics of the imaging facilities at the MTA EK.
Facility NIPS-NORMA RAD
Main purpose position-sensitive element analysis
and 2D-3D neutron imaging
multi-modality imaging using
neutrons or X-rays, dynamic
radiography
Modalities cold neutron
element analysis via PGAI
thermal neutron
fast neutron
X-ray tube
Maximum sample
size
for 3D imaging 40×40×40 mm3
for 2D imaging 200×150×40 mm3
for 3D imaging
200×200×50 mm2
for 2D imaging samples up to
about 50 cm in diameter
Detector options Andor iKon-M CCD camera with
1024×1024 pixels, 16-bit pixel
depth
16-bit (12-bit) 5.5 Mpx
sCMOS camera
Highlysensitive TV-camera
Image plate
L/D ratio 233-1830 170-250
Spacial resolution 230-660 µm depending on the
distance (1.5-100.5) from the
scintillator screen and the applied
pinhole at the end of the neutron
guide
Neutron: 110 – 450 μm
X-ray: 150 – 200 μm
Field of view 43×43 mm2 (~1850 mm2) Variable from 2000 mm2 to
~31 400 mm2 by using lenses
with 50, 105 and 300 mm fixed
focal length
Exposure time 2D radiography 2 sec per image
tomography 30-60 minutes per
tomography
some seconds for 2D
few hours for 3D, depending
on the field of view
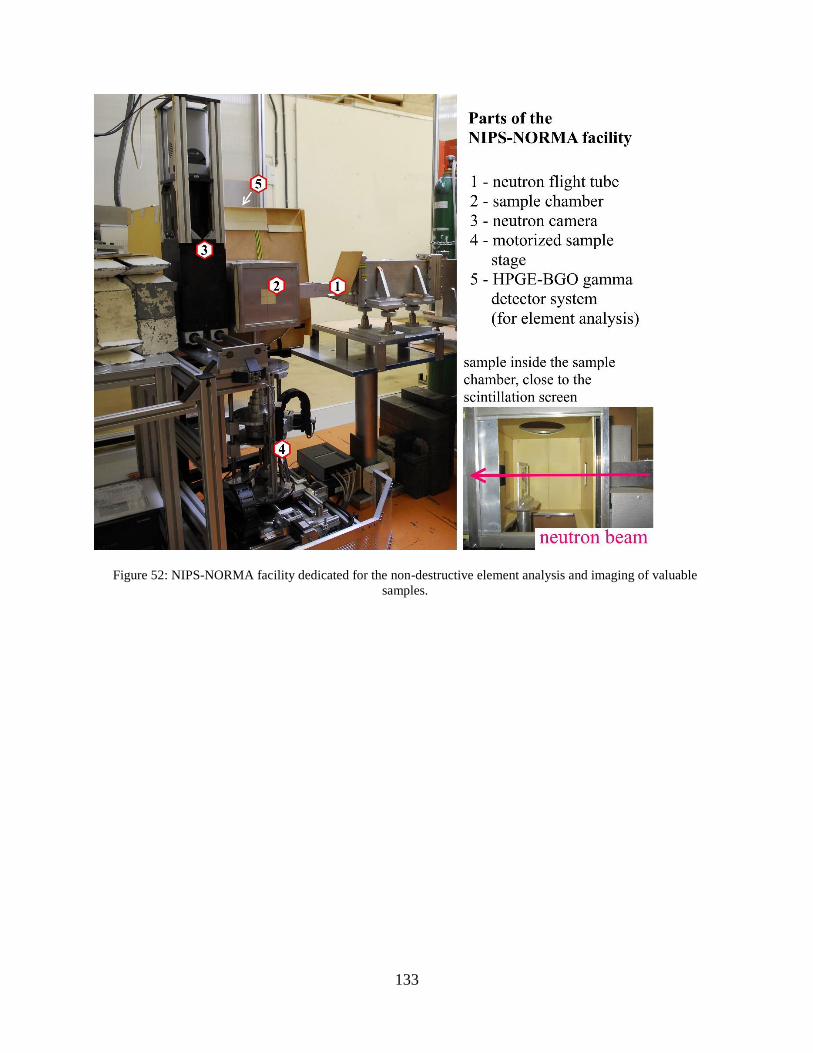
133
Figure 52: NIPS-NORMA facility dedicated for the non-destructive element analysis and imaging of valuable
samples.
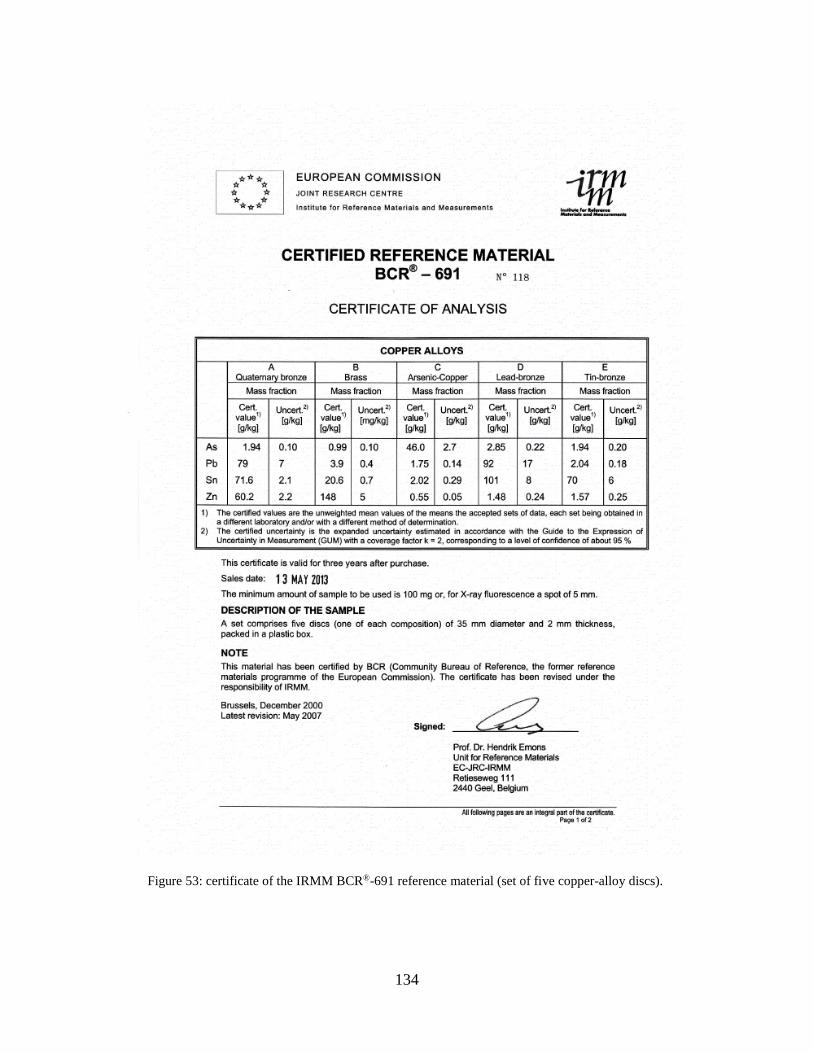
134
Figure 53: certificate of the IRMM BCR®-691 reference material (set of five copper-alloy discs).
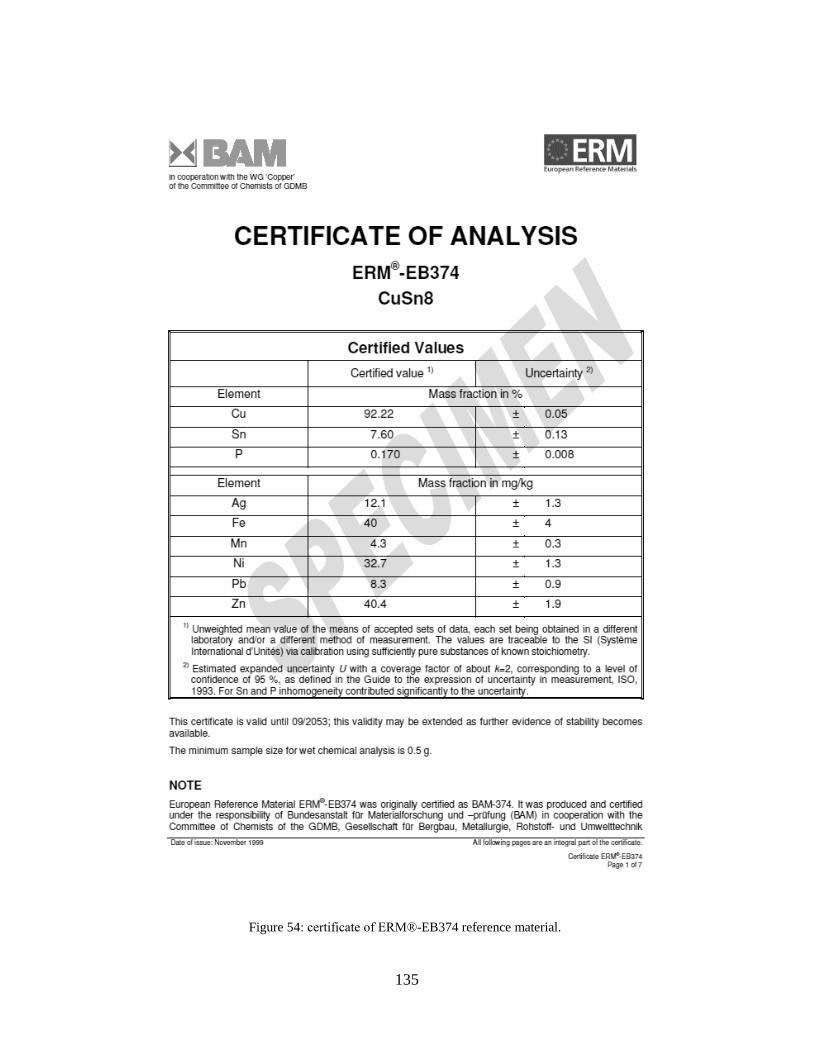
135
Figure 54: certificate of ERM®-EB374 reference material.
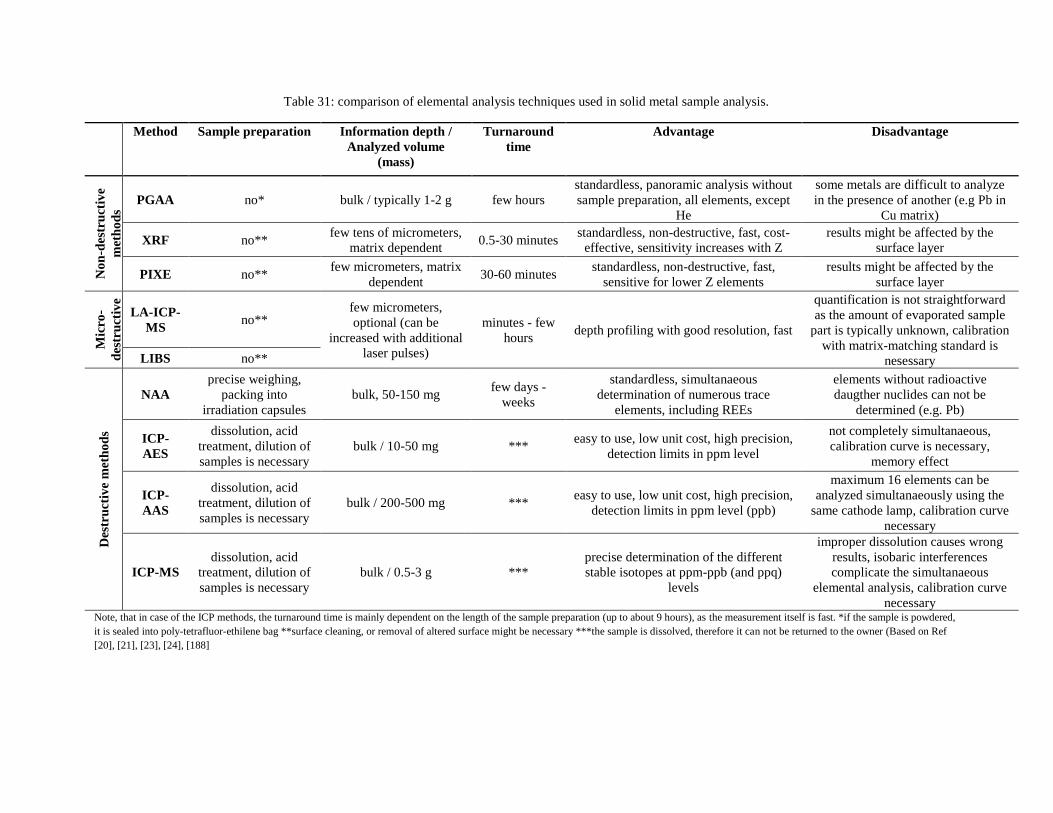
Table 31: comparison of elemental analysis techniques used in solid metal sample analysis.
Method Sample preparation Information depth /
Analyzed volume
(mass)
Turnaround
time
Advantage Disadvantage
No
n-d
estr
uct
ive
met
ho
ds
PGAA no* bulk / typically 1-2 g few hours
standardless, panoramic analysis without
sample preparation, all elements, except
He
some metals are difficult to analyze
in the presence of another (e.g Pb in
Cu matrix)
XRF no** few tens of micrometers,
matrix dependent 0.5-30 minutes
standardless, non-destructive, fast, cost-
effective, sensitivity increases with Z
results might be affected by the
surface layer
PIXE no** few micrometers, matrix
dependent 30-60 minutes
standardless, non-destructive, fast,
sensitive for lower Z elements
results might be affected by the
surface layer
Mic
ro-
des
tru
ctiv
e
met
ho
ds LA-ICP-
MS no**
few micrometers,
optional (can be
increased with additional
laser pulses)
minutes - few
hours depth profiling with good resolution, fast
quantification is not straightforward
as the amount of evaporated sample
part is typically unknown, calibration
with matrix-matching standard is
nesessary LIBS no**
Des
tru
ctiv
e m
eth
od
s
NAA
precise weighing,
packing into
irradiation capsules
bulk, 50-150 mg few days -
weeks
standardless, simultanaeous
determination of numerous trace
elements, including REEs
elements without radioactive
daugther nuclides can not be
determined (e.g. Pb)
ICP-
AES
dissolution, acid
treatment, dilution of
samples is necessary
bulk / 10-50 mg *** easy to use, low unit cost, high precision,
detection limits in ppm level
not completely simultanaeous,
calibration curve is necessary,
memory effect
ICP-
AAS
dissolution, acid
treatment, dilution of
samples is necessary
bulk / 200-500 mg *** easy to use, low unit cost, high precision,
detection limits in ppm level (ppb)
maximum 16 elements can be
analyzed simultanaeously using the
same cathode lamp, calibration curve
necessary
ICP-MS
dissolution, acid
treatment, dilution of
samples is necessary
bulk / 0.5-3 g ***
precise determination of the different
stable isotopes at ppm-ppb (and ppq)
levels
improper dissolution causes wrong
results, isobaric interferences
complicate the simultanaeous
elemental analysis, calibration curve
necessary Note, that in case of the ICP methods, the turnaround time is mainly dependent on the length of the sample preparation (up to about 9 hours), as the measurement itself is fast. *if the sample is powdered,
it is sealed into poly-tetrafluor-ethilene bag **surface cleaning, or removal of altered surface might be necessary ***the sample is dissolved, therefore it can not be returned to the owner (Based on Ref
[20], [21], [23], [24], [188]
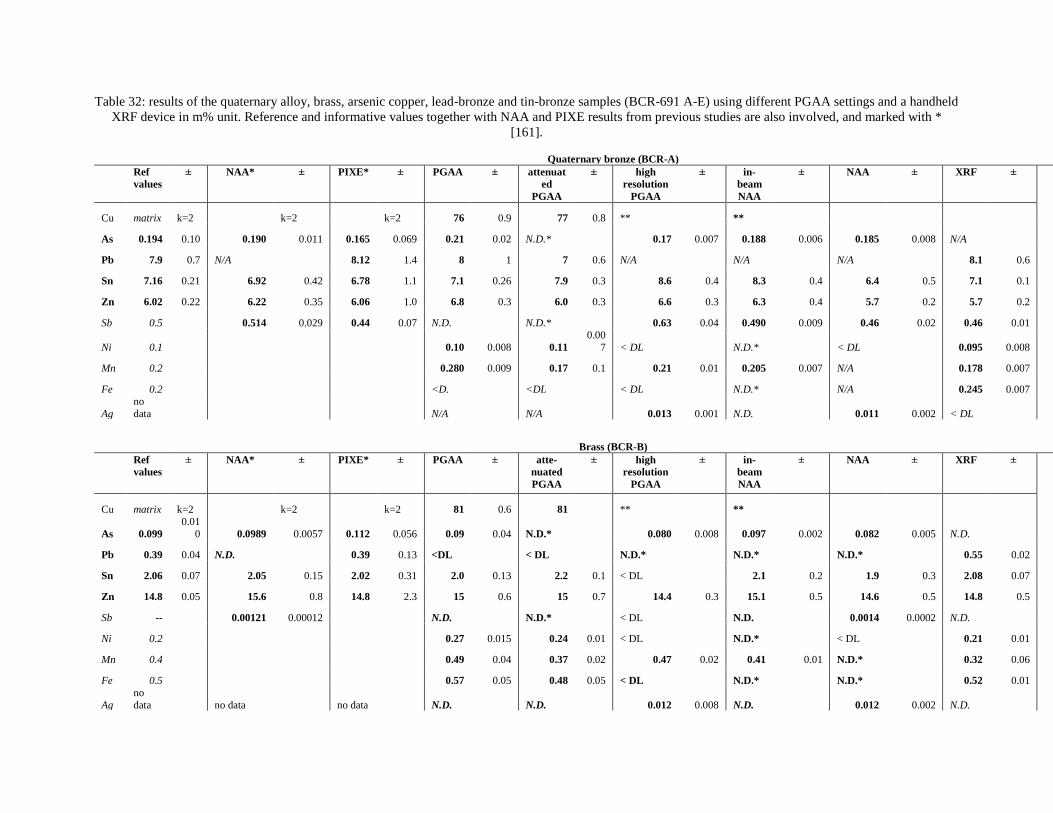
Table 32: results of the quaternary alloy, brass, arsenic copper, lead-bronze and tin-bronze samples (BCR-691 A-E) using different PGAA settings and a handheld
XRF device in m% unit. Reference and informative values together with NAA and PIXE results from previous studies are also involved, and marked with *
[161].
Quaternary bronze (BCR-A)
Ref
values
± NAA* ± PIXE* ± PGAA ± attenuat
ed
PGAA
± high
resolution
PGAA
± in-
beam
NAA
± NAA ± XRF ±
Cu matrix k=2 k=2 k=2 76 0.9 77 0.8 ** **
As 0.194 0.10 0.190 0.011 0.165 0.069 0.21 0.02 N.D.* 0.17 0.007 0.188 0.006 0.185 0.008 N/A
Pb 7.9 0.7 N/A 8.12 1.4 8 1 7 0.6 N/A N/A N/A 8.1 0.6
Sn 7.16 0.21 6.92 0.42 6.78 1.1 7.1 0.26 7.9 0.3 8.6 0.4 8.3 0.4 6.4 0.5 7.1 0.1
Zn 6.02 0.22 6.22 0.35 6.06 1.0 6.8 0.3 6.0 0.3 6.6 0.3 6.3 0.4 5.7 0.2 5.7 0.2
Sb 0.5 0.514 0.029 0.44 0.07 N.D. N.D.* 0.63 0.04 0.490 0.009 0.46 0.02 0.46 0.01
Ni 0.1 0.10 0.008 0.11
0.00
7 < DL N.D.* < DL 0.095 0.008
Mn 0.2 0.280 0.009 0.17 0.1 0.21 0.01 0.205 0.007 N/A 0.178 0.007
Fe 0.2 <D. <DL < DL N.D.* N/A 0.245 0.007
Ag
no
data N/A N/A 0.013 0.001 N.D. 0.011 0.002 < DL
Brass (BCR-B)
Ref
values
± NAA* ± PIXE* ± PGAA ± atte-
nuated
PGAA
± high
resolution
PGAA
± in-
beam
NAA
± NAA ± XRF ±
Cu matrix k=2 k=2 k=2 81 0.6 81 ** **
As 0.099
0.01
0 0.0989 0.0057 0.112 0.056 0.09 0.04 N.D.* 0.080 0.008 0.097 0.002 0.082 0.005 N.D.
Pb 0.39 0.04 N.D. 0.39 0.13 <DL < DL N.D.* N.D.* N.D.* 0.55 0.02
Sn 2.06 0.07 2.05 0.15 2.02 0.31 2.0 0.13 2.2 0.1 < DL 2.1 0.2 1.9 0.3 2.08 0.07
Zn 14.8 0.05 15.6 0.8 14.8 2.3 15 0.6 15 0.7 14.4 0.3 15.1 0.5 14.6 0.5 14.8 0.5
Sb -- 0.00121 0.00012 N.D. N.D.* < DL N.D. 0.0014 0.0002 N.D.
Ni 0.2 0.27 0.015 0.24 0.01 < DL N.D.* < DL 0.21 0.01
Mn 0.4 0.49 0.04 0.37 0.02 0.47 0.02 0.41 0.01 N.D.* 0.32 0.06
Fe 0.5 0.57 0.05 0.48 0.05 < DL N.D.* N.D.* 0.52 0.01
Ag
no
data no data no data N.D. N.D. 0.012 0.008 N.D. 0.012 0.002 N.D.
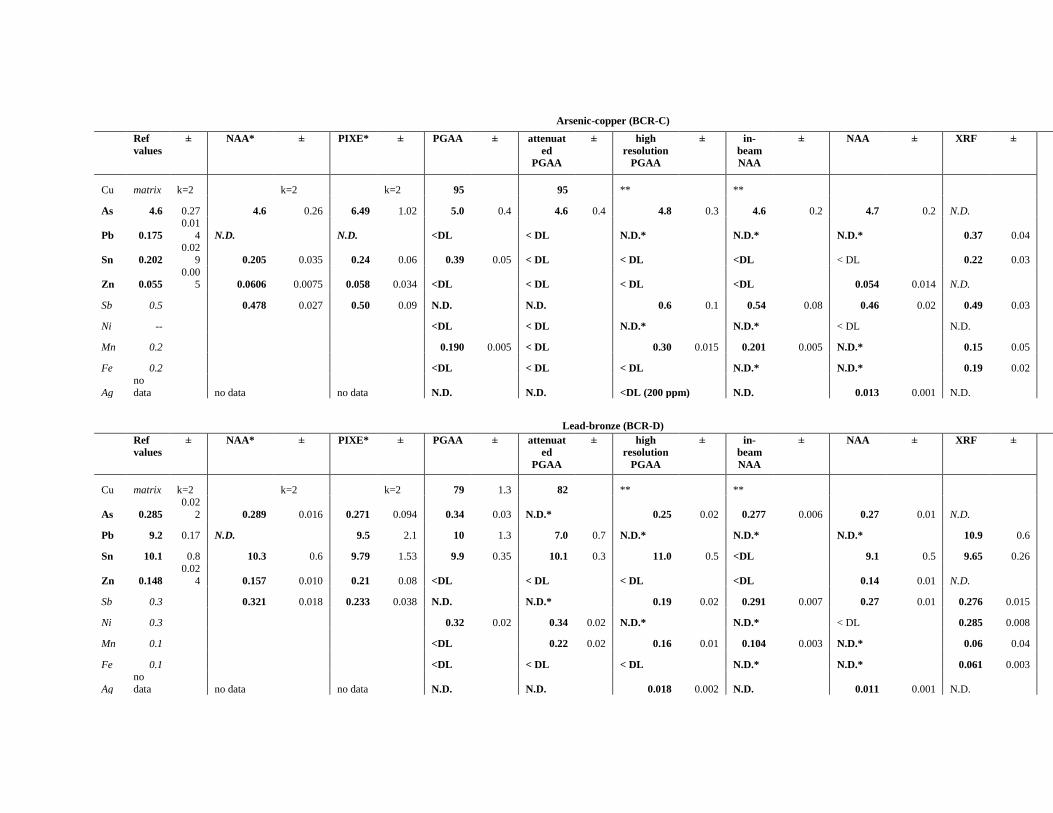
Arsenic-copper (BCR-C)
Ref
values
± NAA* ± PIXE* ± PGAA ± attenuat
ed
PGAA
± high
resolution
PGAA
± in-
beam
NAA
± NAA ± XRF ±
Cu matrix k=2 k=2 k=2 95 95 ** **
As 4.6 0.27 4.6 0.26 6.49 1.02 5.0 0.4 4.6 0.4 4.8 0.3 4.6 0.2 4.7 0.2 N.D.
Pb 0.175
0.01
4 N.D. N.D. <DL < DL N.D.* N.D.* N.D.* 0.37 0.04
Sn 0.202
0.02
9 0.205 0.035 0.24 0.06 0.39 0.05 < DL < DL <DL < DL 0.22 0.03
Zn 0.055
0.005 0.0606 0.0075 0.058 0.034 <DL < DL < DL <DL 0.054 0.014 N.D.
Sb 0.5 0.478 0.027 0.50 0.09 N.D. N.D. 0.6 0.1 0.54 0.08 0.46 0.02 0.49 0.03
Ni -- <DL < DL N.D.* N.D.* < DL N.D.
Mn 0.2 0.190 0.005 < DL 0.30 0.015 0.201 0.005 N.D.* 0.15 0.05
Fe 0.2 <DL < DL < DL N.D.* N.D.* 0.19 0.02
Ag
no
data no data no data N.D. N.D. <DL (200 ppm) N.D. 0.013 0.001 N.D.
Lead-bronze (BCR-D)
Ref
values
± NAA* ± PIXE* ± PGAA ± attenuat
ed
PGAA
± high
resolution
PGAA
± in-
beam
NAA
± NAA ± XRF ±
Cu matrix k=2 k=2 k=2 79 1.3 82 ** **
As 0.285
0.02
2 0.289 0.016 0.271 0.094 0.34 0.03 N.D.* 0.25 0.02 0.277 0.006 0.27 0.01 N.D.
Pb 9.2 0.17 N.D. 9.5 2.1 10 1.3 7.0 0.7 N.D.* N.D.* N.D.* 10.9 0.6
Sn 10.1 0.8 10.3 0.6 9.79 1.53 9.9 0.35 10.1 0.3 11.0 0.5 <DL 9.1 0.5 9.65 0.26
Zn 0.148
0.02
4 0.157 0.010 0.21 0.08 <DL < DL < DL <DL 0.14 0.01 N.D.
Sb 0.3 0.321 0.018 0.233 0.038 N.D. N.D.* 0.19 0.02 0.291 0.007 0.27 0.01 0.276 0.015
Ni 0.3 0.32 0.02 0.34 0.02 N.D.* N.D.* < DL 0.285 0.008
Mn 0.1 <DL 0.22 0.02 0.16 0.01 0.104 0.003 N.D.* 0.06 0.04
Fe 0.1 <DL < DL < DL N.D.* N.D.* 0.061 0.003
Ag
no
data no data no data N.D. N.D. 0.018 0.002 N.D. 0.011 0.001 N.D.
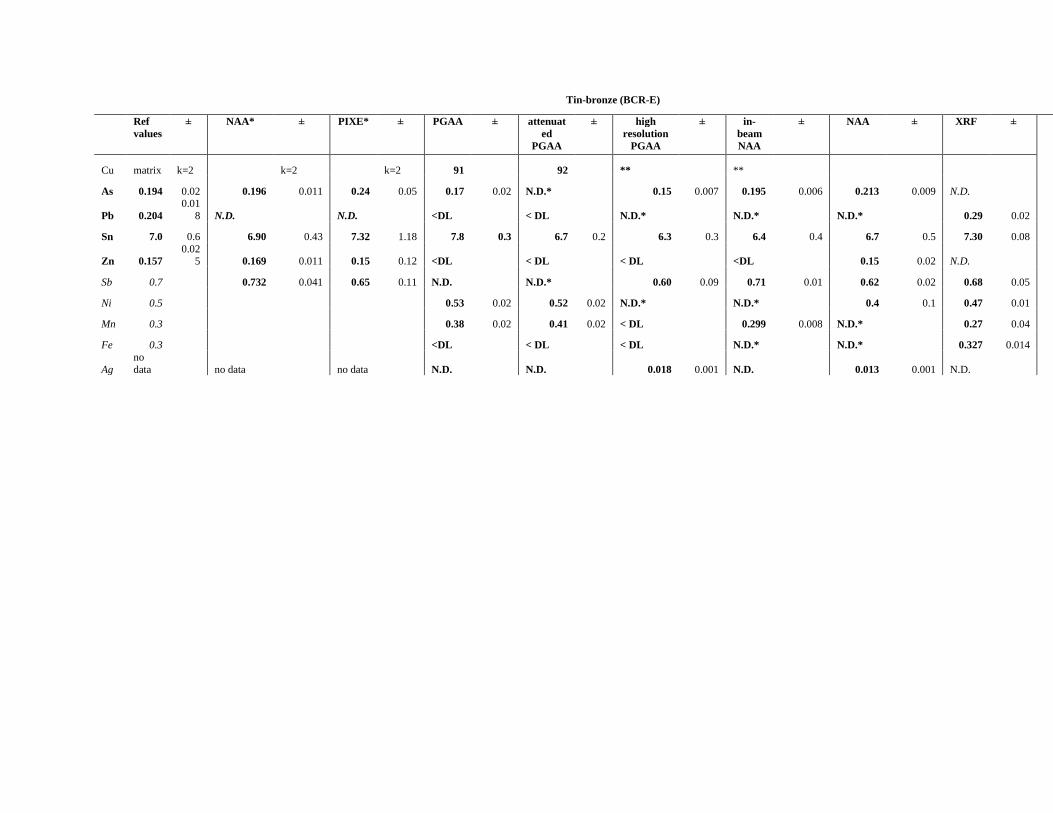
Tin-bronze (BCR-E)
Ref
values
± NAA* ± PIXE* ± PGAA ± attenuat
ed
PGAA
± high
resolution
PGAA
± in-
beam
NAA
± NAA ± XRF ±
Cu matrix k=2 k=2 k=2 91 92 ** **
As 0.194 0.02 0.196 0.011 0.24 0.05 0.17 0.02 N.D.* 0.15 0.007 0.195 0.006 0.213 0.009 N.D.
Pb 0.204
0.01
8 N.D. N.D. <DL < DL N.D.* N.D.* N.D.* 0.29 0.02
Sn 7.0 0.6 6.90 0.43 7.32 1.18 7.8 0.3 6.7 0.2 6.3 0.3 6.4 0.4 6.7 0.5 7.30 0.08
Zn 0.157
0.025 0.169 0.011 0.15 0.12 <DL < DL < DL <DL 0.15 0.02 N.D.
Sb 0.7 0.732 0.041 0.65 0.11 N.D. N.D.* 0.60 0.09 0.71 0.01 0.62 0.02 0.68 0.05
Ni 0.5 0.53 0.02 0.52 0.02 N.D.* N.D.* 0.4 0.1 0.47 0.01
Mn 0.3 0.38 0.02 0.41 0.02 < DL 0.299 0.008 N.D.* 0.27 0.04
Fe 0.3 <DL < DL < DL N.D.* N.D.* 0.327 0.014
Ag
no
data no data no data N.D. N.D. 0.018 0.001 N.D. 0.013 0.001 N.D.
Boglárka Maróti: Non-destructive analysis of metals and alloys using prompt gamma
activation analysis and complementary methods
Summary
The motivation of my PhD work was to improve the prompt gamma activation analysis (PGAA) to
overcome some of its limits by developing specific detection and evaluation methods, as well as by
combining it with surface-analytical and imaging techniques. Most of the challenges of our everyday
analytical practice were addressed. As there is no single solution to all issues, specific procedures for each
problem were worked out. Besides improving the analytical performance, another aim was to shorten the
required measurement time, and thereby on one hand to keep the induced radioactivity of the samples low, on
the other hand, to gain in the productivity of the facility (both beam time allocation and data analysis
aspects).
First I refined the classification of the metallic elements based on their prompt-gamma spectrum
properties. Within the type 2 PGAA spectra, I identified two subgroups: 1) elements that have just a few
strong γ-lines at both low and high energies (e.g. Fe, Cu, typically Z <30); 2) elements with intense γ-peaks
predominantly below 500 keV energy (eg. Ag, Sb, typically Z >30). This classification made it possible to
elaborate on different experimental strategies for these subgroups.
I developed a new methodology to selectively measure Z >30 alloying elements in 2/1 type metal
matrices, using a high-resolution planar germanium detector (LEGe). For these samples, a significant part of
the detected γ-rays is registered in the energy range below 500 keV. The better energy resolution of the LEGe
reduced the peak interferences or made them easier to resolve. Thus, the element identification and the
reliability of the peak fitting can be improved, while the acquisition and spectrum evaluation times are
shortened. Such high-resolution PGAA was successfully used during the quick and accurate analysis of
ancient silver coins, Au-Ag catalysts and Co-Re-Cr alloys.
For the other subgroup, i.e. Z <30 metals, I established another detection method, using a coaxial
high-purity germanium detector equipped with a low-energy gamma attenuator, advantageous in analyzing
important copper-alloying elements, such as Sn and Pb. These elements have intense prompt gamma lines
above 1 MeV. By attenuating the <500 keV gamma rays from the matrix, and enhancing the detected count
rates in the high-energy region, the required measurement and evaluation times became shorter, while
statistical precision is improved.
I analyzed approximately 30 binary bronze objects and standard copper alloys (IRMM BCR-691)
with PGAA, where I identified the need for a better interference correction between Cu and Sn γ-rays, and
after its implementation, I validated the procedure. Thanks to these improvements an agreement was found
with the certified compositions and with other techniques. I completed an intercomparison of the various
PGAA techniques with in-beam activation analysis, XRF, and INAA method, and compared their analytical
performances. I concluded that the most advantageous configuration for the non-destructive analysis of alloys
uses two detection methods in parallel.
The main alloying elements of copper, e.g. Pb, Sn, Ni, Fe and Mn (type 1 ans type 2/1) shall be
measured with gamma-attenuated PGAA, while other important additives, mainly type 2/2 elements, such as
As, Sb, and Ag, can be more adequately determined applying the LEGe measurement than with the standard
PGAA alone. In the case of high-flux irradiation, the quantity of As, Sb and Mn can be more accurately
analyzed by off-line counting following the PGAA measurements.
Finally, I extended the basic analytical method to inhomogeneous metallic objects, e.g. archeological
samples, using handheld XRF at multiple spots for the surface analysis, and position-sensitive PGAI for the
localized bulk analysis, where the spots were identified on the basis of a 3D neutron image of the object.
Besides the compositions of four cultural heritage objects, I also managed to characterize their inner
structures and gave answers to production-technology related questions.
Keywords: metals, alloys, prompt gamma activation analysis, neutron imaging, non-destructive
chemical analysis
Maróti Boglárka: Fémek és ötvözeteik roncsolásmentes vizsgálata prompt-gamma
aktivációs analízissel és kiegészítő módszerekkel
Összefoglalás
PhD munkám célja a PGAA technika továbbfejlesztése és alkalmazása volt fémek és fémötvözetek
vizsgálatában. Az analitikai gyarorlatunkban felmerült problémákat és módszertani korlátokat egyenként
megvizsgáltam, és ezekre probléma-specifikus eljárásokat dolgoztam ki, új detektálási és kiértékelési
technikák alkalmazásával, valamint felületanalitikai és képalkotó módszerekkel való kombinálásával. Az
összetételadatok pontosságának és helyességének javítása mellett cél volt, hogy lerövidítsem a szükséges
mérési időt, ezáltal csökkentve a neutronbesugárzás okozta aktiválódás kockázatát, másrészt javítva a
berendezés termelékenységét (mind a nyalábidő jobb kihasználása, mind az adatok kiértékelése
szempontjából).
A kutatás során először finomítottam az elemek felosztását a prompt-gamma spektrumaik alapján. Az
úgynevezett 2-es típusú PGAA spektrumokon belül két alcsoportot azonosítottam: 1.) elemek, melyek
rendelkeznek néhány nagy intenzitású gamma vonalallal kis- és nagy energiáknál is (pl. Fe, Cu,
túlnyomórészt Z <30); 2), olyan elemek, amelyek főleg 500 keV-nál kisebb energiájú gamma fotonokat
bocsátanak ki (pl. Ag, Sb, túlnyomóan Z >30, az Sn és Pb kivételével). Ez a besorolás megalapozta az ezen
alcsoportokkal kapcsolatban követendő kísérleti stratégiákat.
Kidolgoztam egy új detektási technikát a Z >30 ötvözőelemek szelektív mérésére 2/1-es típusú fém
mátrixokban nagyfelbontású planár germánium detektor (LEGe) alkalmazásával. Ezen minták esetén az
észlelt gamma-fotonok jelentős része az 500 keV alatti energiatartományban található. Tehát, ha az
energiaspektrum <500 keV régiójára koncentrálunk, a LEGe jobb energiafelbontásának köszönhetően a
csúcsinterferenciák csökkenthetők vagy könnyebben feloldhatók. Így az elemek azonosítása és a
csúcsillesztés megbízhatósága javítható, miközben a mérési idő és a spektrum feldolgozása lerövidül. Ezt a
nagyfelbontású PGAA módszert sikeresen alkalmaztam ókori ezüst érmék, Au-Ag katalizátorok és Co-Re-Cr
ötvözetek gyors és pontos elemzésére. A rézötvözetekben előforduló adalélok, mint pl. As, Sb és Ag a LEGe
spektrumok alapján kedvezőbben és gyorsabban elemezhetők a hagyományos PGAA-hoz képest.
A másik alcsoporthoz, azaz a Z <30 fémekhez egy koaxiális, nagytisztaságú germánium detektort
szereltem fel kisenergiájú gamma-gyengítővel. Az Sn és Pb fontos rézötvöző elemek (Z >>30), melyek
PGAA spektrumuk alapján az 1-es csoportba tartoznak, szintén intenzív 1 MeV feletti prompt-gamma
vonalakkal rendelkeznek. Az 500 keV alatti csúcsok gyengítésével csökkentettem a szükséges mérési és
értékelési időt annak köszönhetően, hogy a teljes spektrum beütésszámát állandóan tartva növeltem a
nagyenergiájú csúcsokban észlelt jelek számlálási sebességét, és elnyomtam az egyébként domináns Cu
mátrix jeleket. A réz legfontosabb ötvözőelemei, pl. Pb, Sn, Ni, Fe és Mn a gamma-gyengítős PGAA-val
gyorsabban és pontosabban elemezhetők, mint gamma-gyengítő nélkül.
Standard rézötvözet-mintákat (IRMM BCR-691) és kb. 30 db kétkomponensű bronztárgyat
elemeztem PGAA-val, ahol kimutattam, hogy az ónkoncentrációban tapasztalt eltérés kiküszöböléséhez
továbbfejleszett interferencia korrekcióra van szükség a Cu és Sn között. A továbbfejlesztett korrekciós
eljárást validáltam és segítségével jó egyezést értem el a specifikált értékekkel, illetve más módszerekkel.
Összehasonlítottam a különböző PGAA detektálási módszereket a kivezett nyalábbal végzett
neutronaktivációs analízissel, az XRF, a PIXE és az INAA módszerekkel, és meghatároztam ezek analitikai
teljesítményjellemzőit. Megállapítottam, hogy az ötvözetek roncsolásmentes elemösszetétel-analízisének
legelőnyösebb konfigurációja két, a fentiekben ismertetett stratégiát megvalósító, a mintakamra két oldalán
elhelyezett detektorból áll. Nagyfluxusú besugárzás esetén az As, Sb, Mn mennyisége pontosabban
meghatározható a PGAA méréseket követő off-line gamma-spektrometriás mérésekből.
Végül kiterjesztettem az alapmódszert nem homogén fémes elemekre, pl. régészeti leletekre. Ezeket
kézi XRF készülékkel mért felszíni- és pozíció-érzékeny PGAI módszerrel meghatározott tömbi összetétel
adatok kombinálásával, valamint 3D neutronos képalkotás segítségével jellemeztem. Négy értékes régészeti
tárgy összetétel-meghatározásán kívül feltártam belső szerkezetüket, és készítéstechnikai kérdésekre is
választ tudtam adni.
Kulcsszavak: fémek, ötvözetek, prompt-gamma aktivációs analízis, neutronos képalkotás,
roncsolásmentes elemanalízis