Embed Size (px)
Citation preview
REGULATU NFORMATION DISTRIBUTION 'TEM (RIDS)l
ACCESSION NBR:8507190302 DOC ~ DATE: 85/07/31 NOTARlZED: No DOCKETFACIL;50-387 Susquehanna Steam Electric Stationi Unit 1< Pennsylva 05000387
50-388 Susquehanna Steam Electric Stationi Unit 2< Pennsylva, 05000388AUTHeNAME AUTHOR AFFII IATION
Pennsylvania Power 8 Light Co ~
REC IP ~ NAME RECIPIEN'I'FFILIATION
SUBJECT: Nonproprietary version of Rev 9 to Vols 1 8 2 of "DesignAssessment Rept~" for Susquehanna Steam Electric'tationUnits 1 8 2 ~ >.e
DISTRIBUTION CODE: S001D COPIES RECEIVED:LTR 'NCL SI E':C'3 z: 7TITLE: Licensing Submittal: PSAR/FSAR Amdts 8 Related Correspondence
NOTES: 1cyNMSS/FCAF/PM'L:07/17/82
1cy NMSS/FCAF/PM.
RECIPIENTID CODE/NAME
NRR/OL/ADLNRR LB2 LA
COPIESI TTR ENCL
RECIPIENTIO CODE/NAME
NRR LB2 BCCAt1PAGNONE 01
LPDR 2cys Transcripts.
LPDH 2cys Transcripts'OPIES
LTTR ENCL0in
05000387
05000388
INTERNAL; ACRS 41ELD/HDS4IE/DEPER/EPB 36NRR ROEtM ~ LNRR/DE/CEB 11NRR/DE/EQS 13NRR/DE/MEB 18NRR/OE/SAB 24NRR/DHFS/HFEB40NRR/DHFS/PSRBNRR/DSI/AEB 26NRR/DS I/CPB 10NRR/DSI/ICSB 16NRR/DSI/PSB 19NRR/DSI/RSB 23RGN1
1 1
go
1o10
ADM/LFMBIE FILEIE/OQAVT/QAB21NRR/OE/AEABNRR/DE/EHEBNRR/DE/GB 28NRR/OE/MTEB 17NRR/DE/SGEB 25NRR/DHFS/LQB 32NRR/DL/SSPBNRR/DS I/ASBNRR/DSI/CSB 09NRR/DS I/METB 12NRP " RAB 22
04Rr~ A I/t<IB
1 11o
1 ct1 101
EXTERNAL: 24XDMS/DSS (AMDTS)NRC POR 02PNL GRUELgR
NOTFS ~
10 BNL (AtlDTS ONLY)i LPOR 031o NS I C 05
G'OTAL.NUMBER OF COPIES REQUIRE,D: LTTR 6 ENCL 48
PP&L FORM 3208 (5/>s
a
SUSQUEHANNA SES RECORDS MAMGRKNT SISTREN
CONTROLLED DOCUMENT TRAHSMXTTAL
Director of Nuclear Reactor RegulationW. R. Butler, Chief ~ P1-13, NPl-13Licensing Branch -No. 2.Division of Licensing - .
'*U.S. Nuclear Regulatory CommissionWashington, D.C.'. 20555
Prom: 5 Nuclear Department Libzary, A6-1Q Supervisor-Document Control Center40,'6-2Q Supervisor-Document Control Center-SSES,'SESQ Supervisor-SRMS Correspondence & Drawing Hles, A6»2
Attached are the folloving nev or revised document(s):(When document'is procedure, iaclude manual title)
~ ~ I
PP&L SUSQUEHANNA STEAM ELECTRIC STATION, UNITS 1 AND 2DESIGN ASSESSMENT REPORT DAR - VOLS. 1 - 4
Please refer to the enclosed letter for further information.If any material is missing, please contact:Nucl ear Depar tment Library A6-1Pennsylvania Power & Light CompanyTwo North .Ninth StreetAllentown, PA 18101(215) 770-7539 or. 7540
'estroy/voidthe following superseded document(s):NA
Q Please check this olock if any documents aze missing aad indicate themissing documents oa the zeverse side of this form.
Please siga and date this transmittal belov. It shou'd be returned to senderMf.thin TEN work days to acknovledge rece'pt.
The addressee hereby attests that the document(s) received agree vith theabove listing, that all removed/replaced documents have been destzoved/voided,that the documents have been incorporated into the proper files, and that theappropr'ate personnel have been made amaze of the changes.
850719'0295 850718 '1
PDR ADOCK 05000387P 'PDR.
Received By Date
Attached please find a controlled copy of the Susquehanna Steam Electric
Station Design Assessment Report (DAR) which is being provided as a'sister'ocument
to the Final Safety Analysis Report (FSAR).
The DAR provides a detailed explanation of the suppression pool hydrodynamic
loads caused by the actuation of the main steam SRV's and LOCA event
quantifies the hydrodynamic load definitions used to evaluate the Susquehanna
SES plant design; provides analysis. and test data to technically 5ustify these
load definitions; and summarizes the results of the re-assessment of the
Susquehanna SES design basis for these loads.
If'ou are the holder of a previously issued DAR » please discard it. This
DAR revision does not contain updated material but is merely a reprinting of
the original DAR and subsequent amendments.
DAR TABLE OF CONTENTS
VOLUME 1 — NON-PROPRIETARY
Chapter 1 GENERAL INFORMATION
1.1 Purpose and Organization of Report1.2 History of Problem1.3 SSES Containment Program1.4 Plant Description
Chapter 2 SUMMARY
2.1 Load Definition Summary2.2 Design Assessment Summary
. Chapter 3 SRV DISCHARGE AND LOCA TRANSIENT DESCRIPTIONY
3.1 Description of Safety Relief Valve (SRV) Discharg'e3.2 Description of Loss-of-Coolant. Accident (LOCA)
Chapter 4 . LOAD DEFINITION
4.1 Safety Relief Valve (SRV) Discharge Load Definition4.2 Loss-of-Coolant Accident, (LOCA) Load Definition4.3 Annulus Pressurization
Chapter 5 LOAD COMBINATIONS FOR STRUCTURES, PIPING, ANDEQUIPMENT
Chapter 6 DESIGN CAPABILITY ASSESSMENT
6.1 Concrete Containment and Reactor Building CapabilityAssessment Criteria
6.2 Structural Steel Capability Assessment Criteria6.3 Liner Plate Capability Assessment Criteria
5.1 Concrete Containment and Reactor Building Load Combinations5.2 Structural Steel Load Combinations5.3 Liner Plate Load Combinations5.4 Downcomer Load Combinations5.5 Piping, Quencher, and Quencher Support. Load Combinations5.6 NSSS Load Combinations5.7 Balance of Plant (BOP) Equipment Load Combinations5.8 Electrical Raceway System Load Combinations5.9 HVAC Duct System Load Combinations
S507190302 850718PDR ADOCK 05000387P PDR
Rev. 9, 07/85
TABLE OF CONTENTS (Continued)
6.4 Downcomer Capability Assessment Criteria6.5 Piping, Quencher, and Quencher Support Capability
Assessment Criteria6.6 NSSS Capability Assessment Criteria6.7 BOP Equipment Capability Assessment Criteria6.8 Electrical Raceway System Capability Assessment Criteria6.9 HVAC Duct System Capability Assessment CriteriaChapter 7 DESIGN ASSESSMENT
7.1 Assessment Methodology7.2 Design Capability Margins
Chapter 8 SSES QUENCHER VERIFICATION TEST (PROPRIETARY)
8.1 Introduction8.2 Test Facility and Instrumentation8.3 Test Parameters and Matrix8.4 Test Results8.5 Data Analysis and Verification of Load Specification
Chapter 9 GKM IIM STEAM BLOWDOWN TESTS
9.1 Introduction9.2 Test Facility and Instrumentation9.3 Test Parameters and Matrix9.4 Test Results9.5 Data Analysis and Load Specification9.6 Verification of the Design Specification
Chapter 10 RESPONSES TO NRC QUESTIONS
10.110.2
NRC QuestionsResponses
Chapter 11 REFERENCES
VOLUME 2 — NON-PROPRIETARY
Appendix A CONTAINMENT DESIGN ASSESSMENT
A.l Containment Structural Design AssessmentA.2 Submerged Structures Design Assessment
Appendix B CONTAINMENT RESPONSE SPECTRA DUE TO SRV ANDLOCA LOADS
B.1 Containment Mode ShapesB.2 Containment Response Spectra
Rev. 9, 07/85
TABLE OF CONTENTS (Continued)
Appendix C REACTOR/CONTROL BUILDXNG RESPONSE SPECTRADUE -TO LOCA AND SRV LOADS
Appendix D PROGRAM VERIFICATION
D.l Poolswell Model VerificationD.2 Velpot Computer Code Description and VerificationAppendix E
Appendix F
Appendix G
Appendix H
Appendix I
Appendix J
Appendix K
REACTOR AND CONTROL BUILDING DESIGNASSESSMENT
BOP AND NSSS PIPING DESIGN ASSESSMENT
NSSS DESIGN ASSESSMENT (DELETED)
EQUIPMENT DESIGN ASSESSMENT (DELETED)
SUPPRESSION POOL TEMPERATURE RESPONSE TO SRVDISCHARGE
VERIFICATION OF SRV 'SUBMERGED STRUCTUREDRAG LOAD PROPRIETARY)
DRYWELL FLOOR VACCUM BREAKER (VB) CYCLING DURINGCHUGGING
Appendix L SUPPLEMENTAL DESIGN ASSESSMENT
L.l Assessment MethodologyL.2 Assessment Results
VOLUME 3 — PROPRXETARY
Chapter 4 PROPRIETARY LOAD DEFINITXON
Chapter 8
Appendix D
PROPRIETARY SSES QUENCHER VERIFXCATION TEST
PROGRAM VERIFICATION
APPENDIX J VERIFICATION OF SRV SUBMERGED STRUCTURE LOAD
VOLUME 4 — PROPRIETARY
Chapter 9 SSES LOCA STEAM CONDENSATION VERIFICATION TEST
Rev. 9, 07/85

PREFACE
This Report contains data, descriptions and anaylsis relative tothe adequacy of the Susquehanna Steam Electric Station design toaccommodate loads resultiaq from a safety relief valve (SRV)discharge and/or a loss-of-coolant accident (I,OCA).

.
Cl
CHAPTER 1
GENERAL IitFORMATION
T ABLF. OF CONTENTS
1 1 PURPOSE OF REPORT
1 2 HISTORY OF PROBLEM
1 3 SSES CONTAINMENT 'PROGRAM
1 4 PLANT DESCRIPTION1. 4.1 Primar.y Containment1. 4. 1. 1 Pene trations1. 4. 1. 2 Internal Structures
Rev. 9, 07/85 1-1
CHAPTER lF1GUHES
Number. Title-1-1
1-2
1-4
Cross Section of Containment
Suppression Chamber, Partial Plan
Suppression Chamber, Section View
Quencher Distribution
Bev. 9 ~ 07/85 1-2

Number
CHAPTER 1
TABLES
Title
E 1 2
1-3
1-4
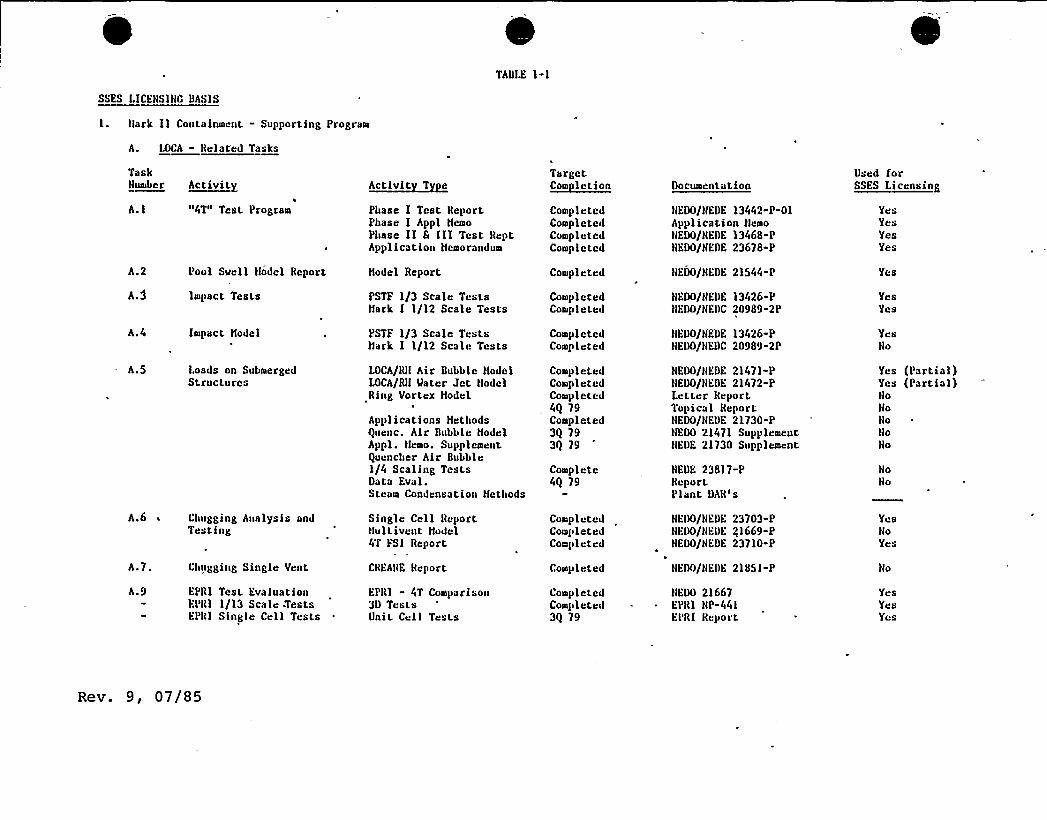
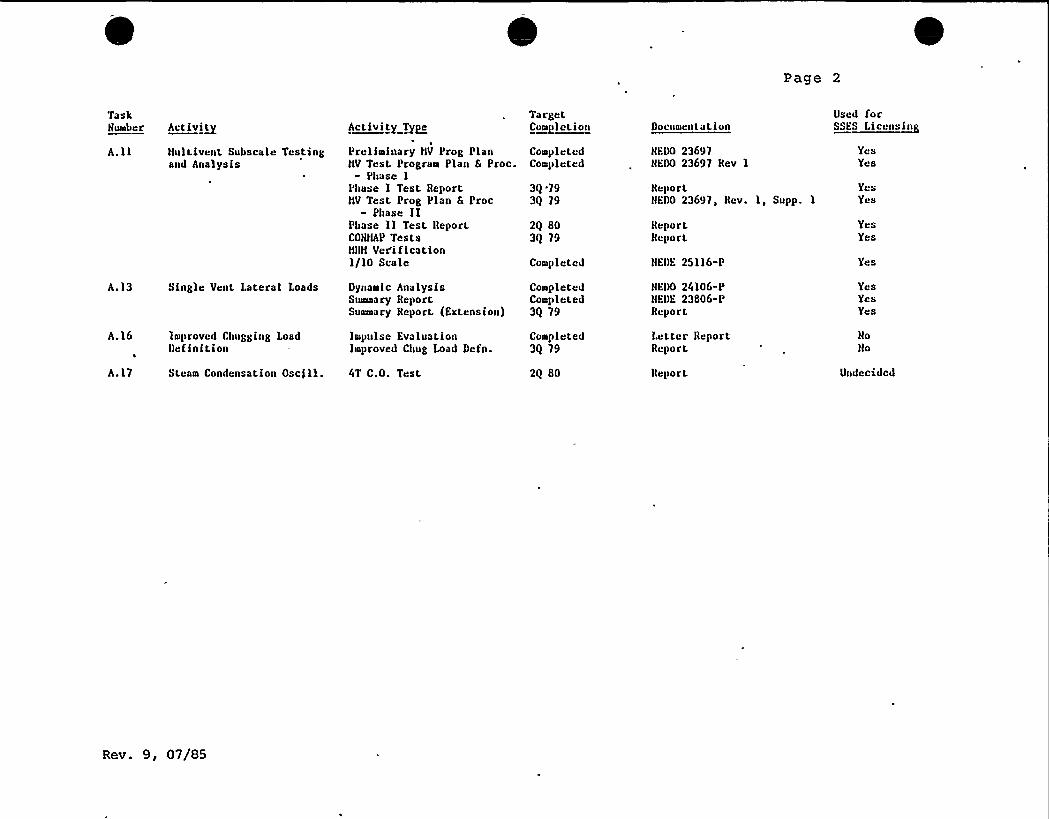
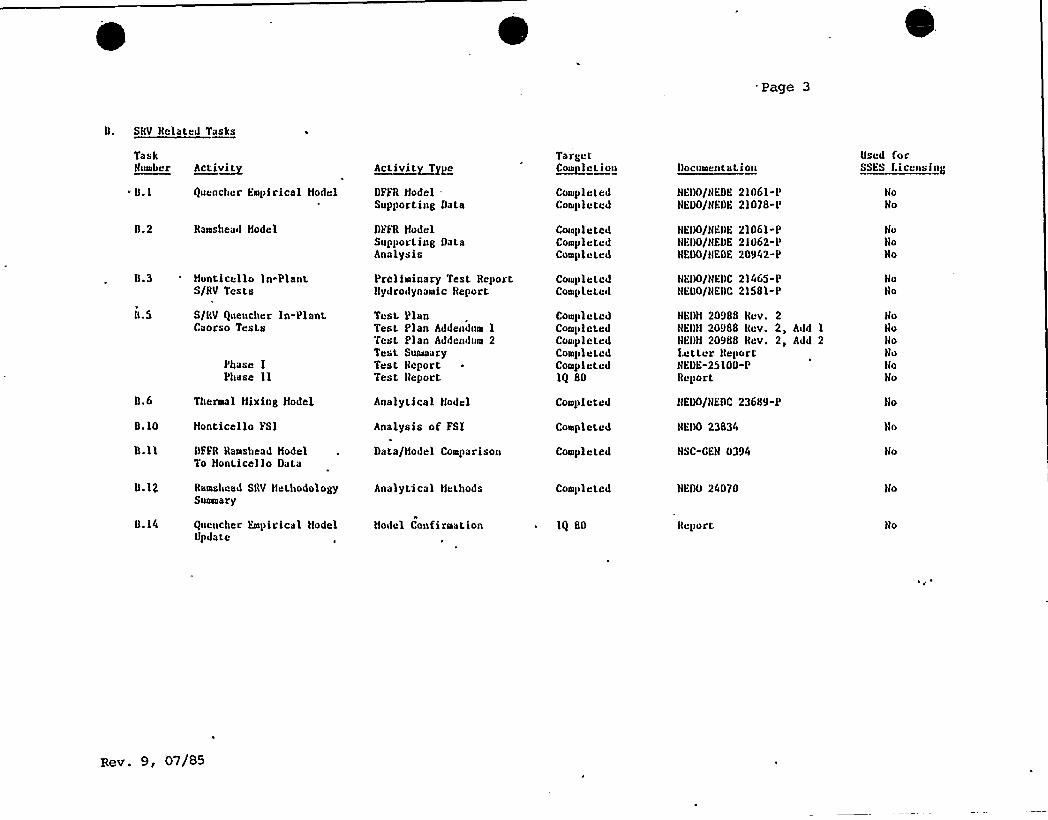
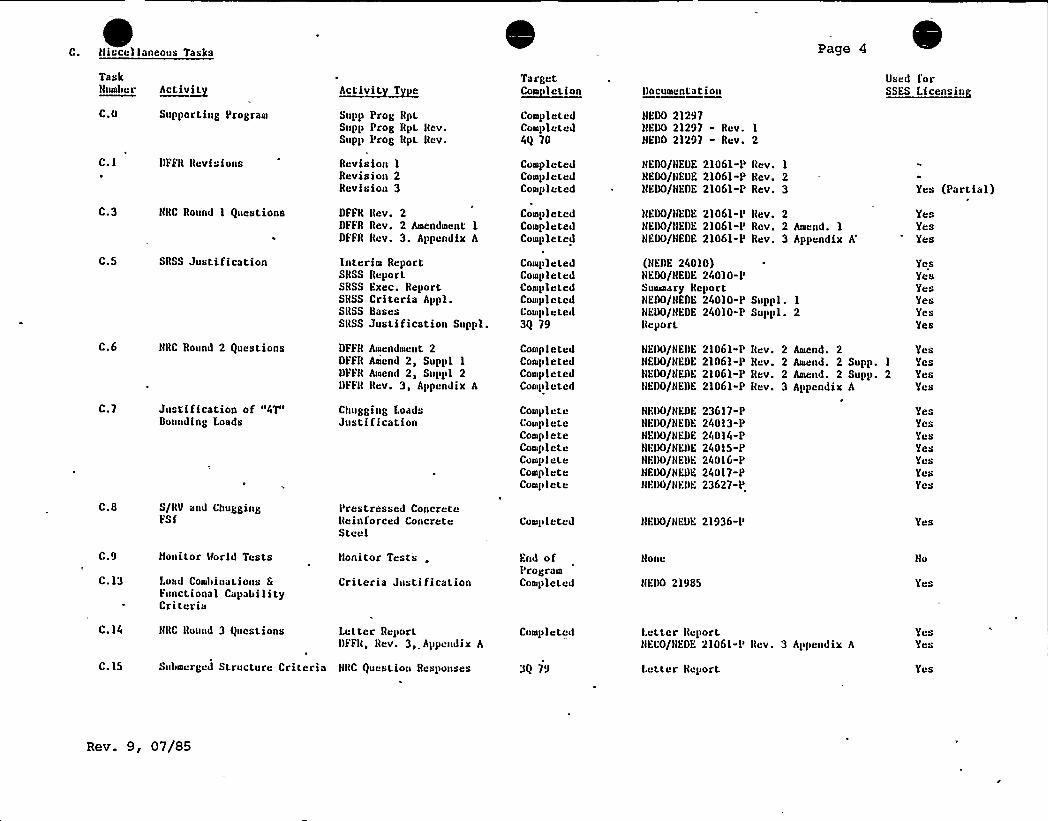
SSFS Licensing Basis
SSES Containment Dimensions
SSES Containment Design Parameters
Comparison of the SSES Program for SRV andLOCA loadings with the NUHEG 0487 AcceptanceCriteria, Lead Plant Program and Generic Long.Term Program
Rev. 9, 07/85 1-3
1 0 G EN EB AL INFORMATION
1 1 ~ PURPOSE AND ORGANIZATION OF REPORT
The purpose of this report is to present evidence that theSusquehanna Steam Electric Station (SS=S) design margins areadeguate should the plant be subjected to the recently definedthermohydrodynamic loads which result from safety relief valve(SRV) operations and/or discharges during a loss-of-coolantaccident (LOCA) in a GE boiling water reactor (BMR).
Rev 9, 07/85
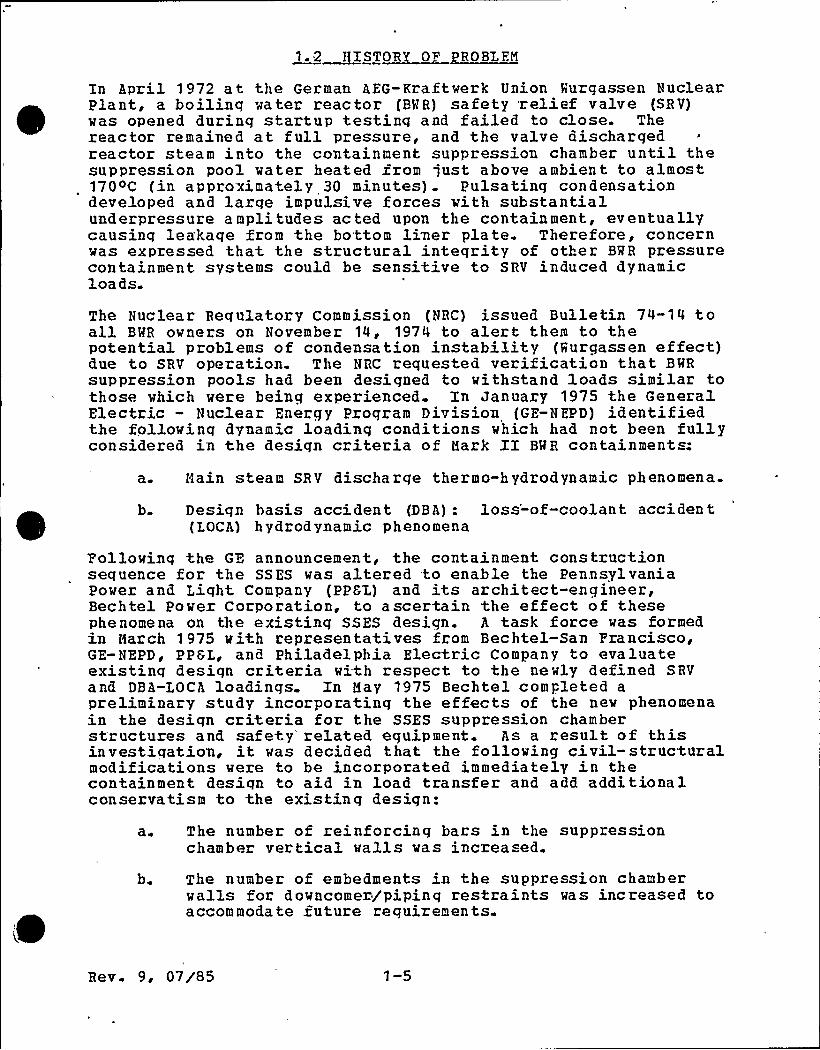
1. 2 HISTORY OF PROBLEH
In April 1972 at the German AEG-Kraftwerk Union Wurgassen NuclearPlant, a boiling water reactor {BWR) safety zelief valve (SRV)was opened durinq startup testing and failed to close. Thereactor remained at full pressure, and the valve dischargedreactor steam into the containment suppression chamber until thesuppression pool water heated from just above ambient to almost1700C (in approximately 30 minutes) Pulsating condensationdeveloped and large impulsive forces with substantialunderpressure a mpli tudes ac ted upon the containment, eventuallycausinq leakaqe from the bottom liver plate. Therefore, concernwas expressed that the structural integrity of other BWR pressurecontainment systems could be sensitive to SRV induced dynamicloa ds.
The Nuclear Regulatory Commission (NRC) issued Bulletin 74-14 toall BWR owners on November 'l4, 1974 to alert them to thepotential problems of condensation instability (Wurqassen effect)due to SRV operation. The NRC reguested verification that BWR
suppression pools had been designed to withstand loads similar tothose which were being experienced Xn January 1975 the GeneralElectric — Nuclear Energy Program Division (GE-NEPD) identifiedthe followinq dynamic loading conditions which had not been fullyconsidered in the desiqn criteria of Hark EI BWR containments.
a. Hain steam SRV discharge thermo-hydrodynamic phenomena.
b. Design basis accident (DBA): loss'-of-coolant accident(LOCA) hydrodynamic phenomena
Pollowinq the GE announcement, the containment constructionsequence for the SSES was altered to enable the PennsylvaniaPower and Light Company (PPGL) and its architect-engineer,Bechtel Power Corporation, to ascertain the effect of thesephe nome na on the existinq SSES design. A task force was formedin Harch 1975 with representatives from Bechtel-San Francisco,GE-NEPD, PPGL, and Philadelphia Electric Company to evaluateexistinq desiqn criteria with respect to the newly defined SRVand DBA-LOCA loadinqs. In Hay 1975 Bechtel completed apreliminary study incorporating the effects of the new phenomenain the design criteria for the SSES suppression chamberstructures and safety related equipment. As a result of thisinvestigation, it was decided that the following civil-structuralmodifications were to be incorporated immediately in thecontainment desiqn to aid in load transfer and add additionalconservatism to the existinq design:
a4 The number of reinforcinq bars in the suppressionchamber vertical walls was inczeased.
b The number of embedments in the suppression chamberwalls for downcomez/pipinq restraints was increased to
. accommoda te future requizemen ts.
Rev. 9, 07/85 1-5
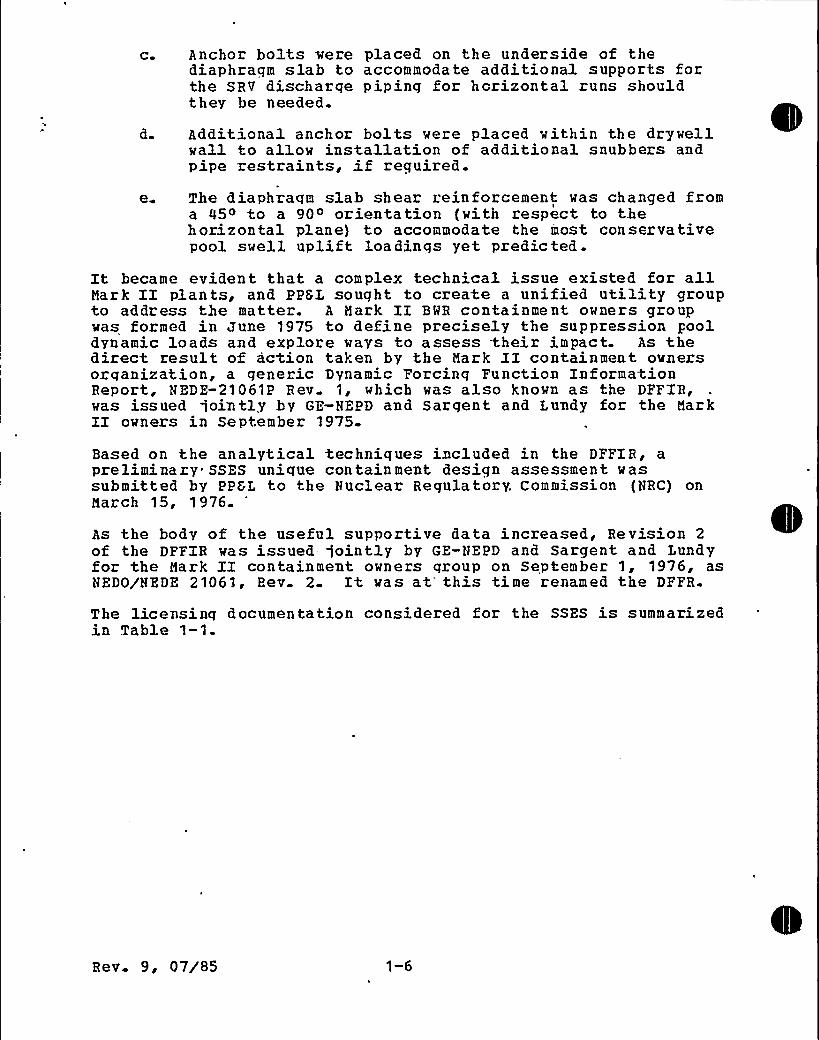
Co Anchor bolts were placed on the underside of thediaphragm slab to accommodate additiona1 supports forthe SRV discharge piping for horizontal runs shouldthey be needed.
d. Additional anchor bolts were placed vithin the drywellwall to allow installation of additional snubbers andpipe restraints, if required.
e. The diaphragm slab shear reinforcement vas changed froma 450 to a 900 orientation (vith respect to thehorizontal plane) to accommodate the most conservativepool swell uplift loadinqs yet pzedicted.
It became evident that a complex technical issue existed for allMark II plants, and PPGL sought to create a unified utility groupto address the matter. A Mark II BMR containment owners groupvas formed in June 1975 to define precisely the suppression pooldynamic loads and explore ways to assess .their impact. As thedirect result of action taken by the Mark ZI containment ovnersorqanization, a generic Dynamic Forcinq Function InformationReport, NEDE-21061P Rev 1, which was also known as the DFFIR,was issued jointly by GE-NEPD and Sargent and Lundy foz the HarkII owners in September 1975
Based on the analytical techniques included in the DFFIR, apreliminary SSES unique containment design assessment vassubmitted by PPGL to the Nuclear Regulatory. Commission (NRC) onMarch 15, 1976.
's
the body of the useful supportive data increased, Revision 2of the DFFIR was issued goint1y by GE-NEPD and Sargent and Lundyfor the Hark II containment owners group on September 1, 1976, asNEDOJ'NEDE 21061, Rev. 2 It vas at this time renamed the DFFR.
The licensinq documentation considered for the SSES is summarizedin Table 1-1.
Rev. 9, 07/85 1-6
1 3 - SSES CONTAINMENT PROGRAM
PPGL is a member of, the Mark II owners group that was formed inJune, 1975 to define and investiqate the dynamic loads due to SRVdischarqe and LOCA. The Mark II owners group containment programconcentrated initially o~ the tasks required for the licensing ofthe lead plants (Zimmer, LaSalle, and Shoreham) . This phase ofwork, called the short term program, is complete and a longerterm program is underway. The final goal of the Mark II programis to evolve a complete D77R which will support the plant-uniqueDARs submitted by ea'ch plant for its license to operate.
After qaininq some understanding of the containment loads tnroughthe initial Hazk II work, PPGL decided to find a qualif iedconsultant to supplement in-house technical resources and assistin the determination of a realistic course of action forSusquehanna. In November, 1976, Stanford Research Institute, nowcalled SRI International (SRI), was selected, and an informationexchange between SRI and PPGL ensued. to determine what caused the.qreatest loads on the containment structure. After conducting acomplete review of known data from the Mark II program 'and
other'nowledgeablepersons and organizations, PPGL and SRI decidedthat the loads from main steam safety relief valve (SRV)discharqe were the key loads to be controlled. A study ofpossible methods of controllinq the load and a zeview of whatactivities were occuzring in Europe led PPGL and SRI to theconclusion that an SRV discharge mitigating device (guencher)should be employed to reduce this loading on the Susquehannacontainment. Although the Mark II owners group had quencher-related tasks in their program, these tasks were not sufficientlytimely to satisfy SSES-construction schedule weeds.
Prom reviewinq the work done in Europe by such firms as ASEATOH,HARVIKEN, and Kraftwerk Union, PPGL discovered that all knownquencher designs were based on data from Kraftwerk Orion (KQU).Thus, in March, 1977, SRI, Bechtel (the SSES Architect/Engineer)and PPGL visited K~IU foz discussion and tour of guencher-relatedfacilities. In late July, 1977, PPGL employed the services ofKHU to desiqn a SSES-unique guencher device.
Kraftwork Union provided PPGL a package of significant design andtest reports pertaining to the quencher development todemonstrate design adequacy and quality of their device (refer toTable 1-1). These documents were submitted to the NRC inJanuary, 1978 The quencher load specification was submitted tothe NRC in Apzil, 1978. To verify KMU~ s design approach, a ful1-scale SSES unique unit cell test, as described in Chapter 8, wasperformed by K'RU for PPGL. The documentation of this test seriesand verification of the design specification was submitted inMarch, 1979. Subsequently the quencher design by KMU for use onSSES has been adooted as the SRV discharge used by six of theseven other Hark II owners and the SSES program has become thegeneric Mark II proqram.
Rev. 9, 07/'85 1-7
The def inition of LOCA loads {Section 4. 2) is in basic accordancewith the Mark II program. In addition though, PPGL has decidedto conduct a series of transient steam blowdown tests in amodified GEM II test tank in Hannheim, Germany {refer to Chapter9). These tests will provide data to resolve NRC concerns on thedifferences in vent configuration between the original GE 4Tfacility and a prototypical Mark II containment and to verify thecondensation oscillation load specification used on the SSESdesign.
Table 1-1 provides a summary of the documentation supporting theSSES licensingIn addition, Table 1-4 provides a comparison of the SSES programfor SRV and LOCA loading with the NUREG 0487 acceptance criteria,Lead Plant Program and Generic Long Term Program. In accordancewith the directions of the NRC staff at the October 19, 1978meeting with the Mark II Owners Group these positions assume thatthe use of the SRSS method of load combination will be acceptedfor use on the Mark .II containments.
Rev 9, 07/85 1-8
1.4 PLANT DZSCRIPTICN
The SSES, Units 1 and 2, is being built ia Salem Township,Luzezne County, about 5 miles northeast of the Borouqh ofBerwick. Two qeneratinq units of approximately 1,100 megawattseach are scheduled. for operation: Unit 1 for November 1, 1980, .
and Unit 2 for Hay 1, 1982. General Electric is. supplying thenuclear steam supply systems; Bechtel Power Corporation is theazc hi tect-en qineer a nd cons true tor.The reactor building contains the major nuclear systems andequipment. The nuclear reactors for Units 1 and 2 are boilingwater, direct cycle types with a rated heat output of 11.2 x 10~Btu/hr. Each reactor supplies '13.4 x 10⁶ lb/hz of steam to thetandem compound, double flow turbines.
1. 4. 1 Pzi ma ry ~ Con tainme nt
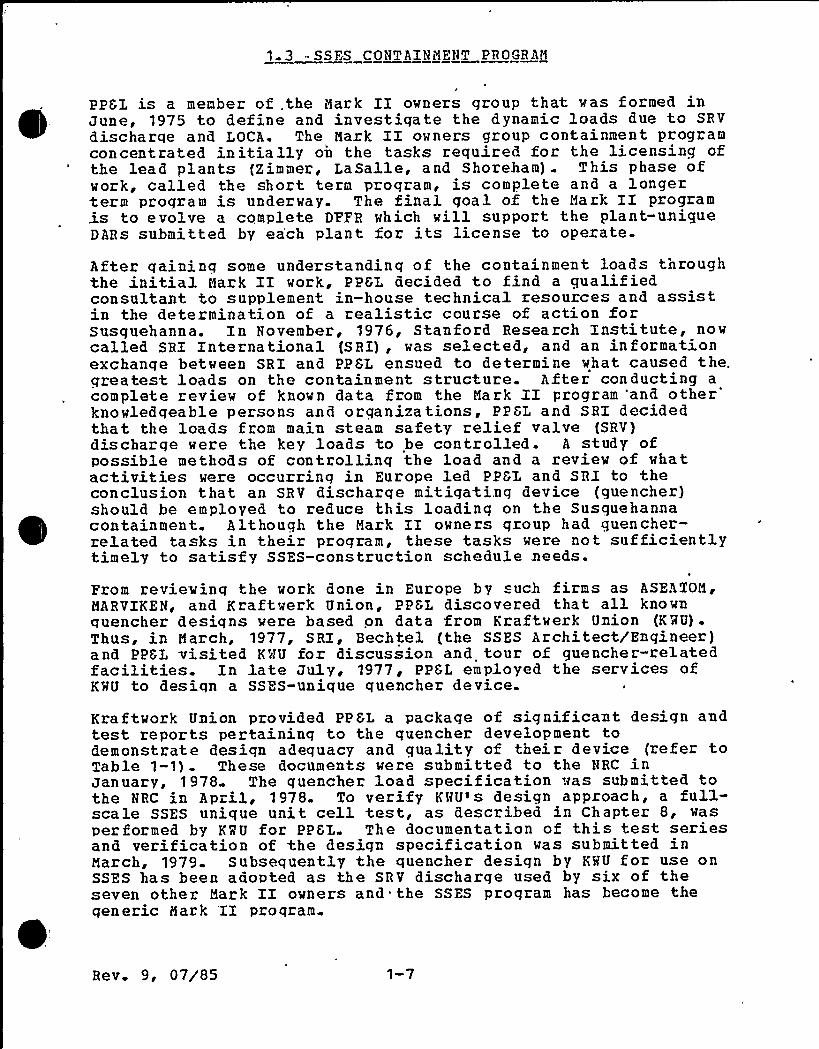
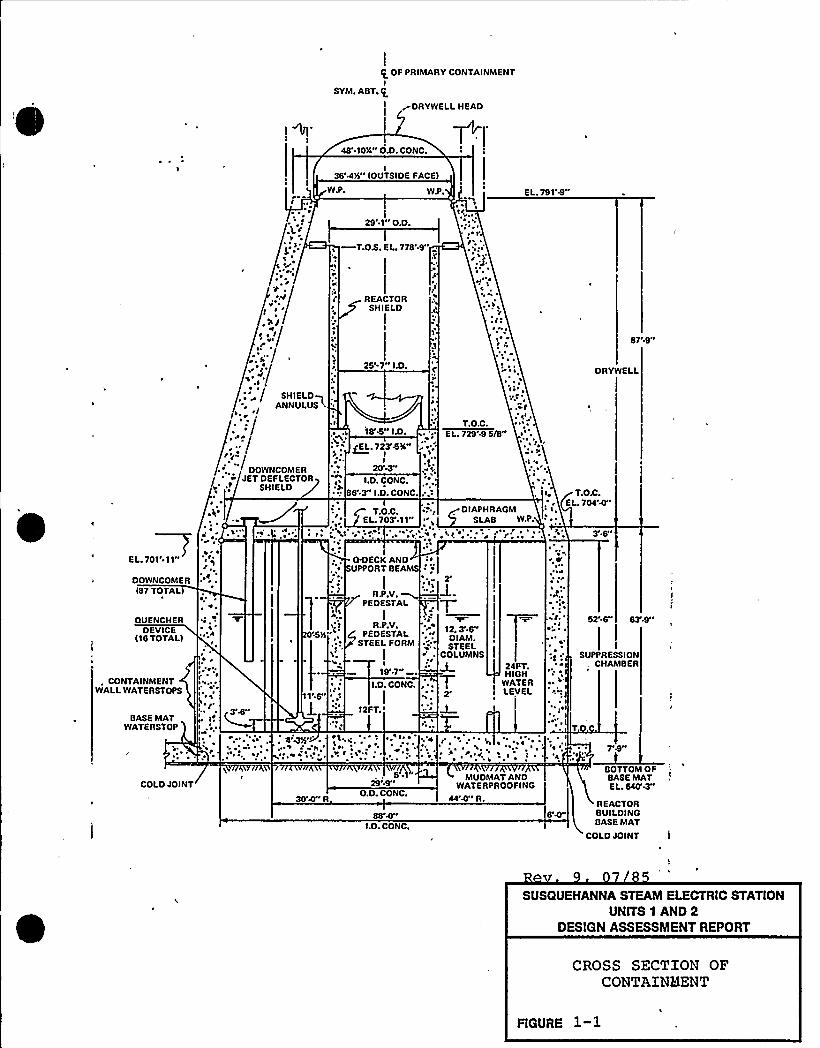
The containment is a reinforced concrete structure consisting ofa cylindrical suppression chamber beneath a truncated conicaldrywell. Figure 1- 1 shows the qeometry of the containment andinternal structures. The conical portion of the primarycontainment (drywell) encloses the reactor vessel, reac torcoolant recirculation loops, and associated components of thereactor coolant system.,The drywell is separated from thewetwell, ie, the pressure suppression chamber and pool, by thedrywell floor, also named the diaphragm slab. Hajor systems andcomponents in the containment include the vent pipe system(downcomers) connecting the drywell and wetwell, isolationvalves, vacuum relief system, containment cooling systems, aadother service equipment. The cone and cylinder form astructurally integrated reinforced concrete vessel, lined withsteel plate and closed at the top of the drywell with a steeldomed head. The carbon steel liner plate is anchored to theconcrete by structural steel members embedded in the concrete andwelded to the plate.The entire containment is structurally separated from thesurroundinq reactor building except at the base foundation slab(a reinforced concrete mat, top lined with a cazbon steel linerplate) where a cold joint between the two adjoining foundationslabs is provided. The containment structure dimensions andparameters are listed in Tables 1-2 and 1-3. A detailed plantdescription can be found in the SSES TSAR, Section 3.8.
1. 4. 1. 1. Penetrations
Services and communication between the inside and outside of thecontainment are made possible by penetrations through thecontainment wall. The basic types of penetrations are thedrywell head, access hatches (equipment hatches, personnel lock,suppression chamber access hatches, CRD removal hatch),electrical penetrations, and pipe penetzations. The piping
Re v. 9, 07/85 1-9
penetrations consist basically of a pipe with plate flange weldedto it. The plate flanqe is embedded "in the concrete wall andprovides an anchorage for the penetration to resist normaloperating and accident pipe reaction loads.
1 4.1 2 Internal Structures
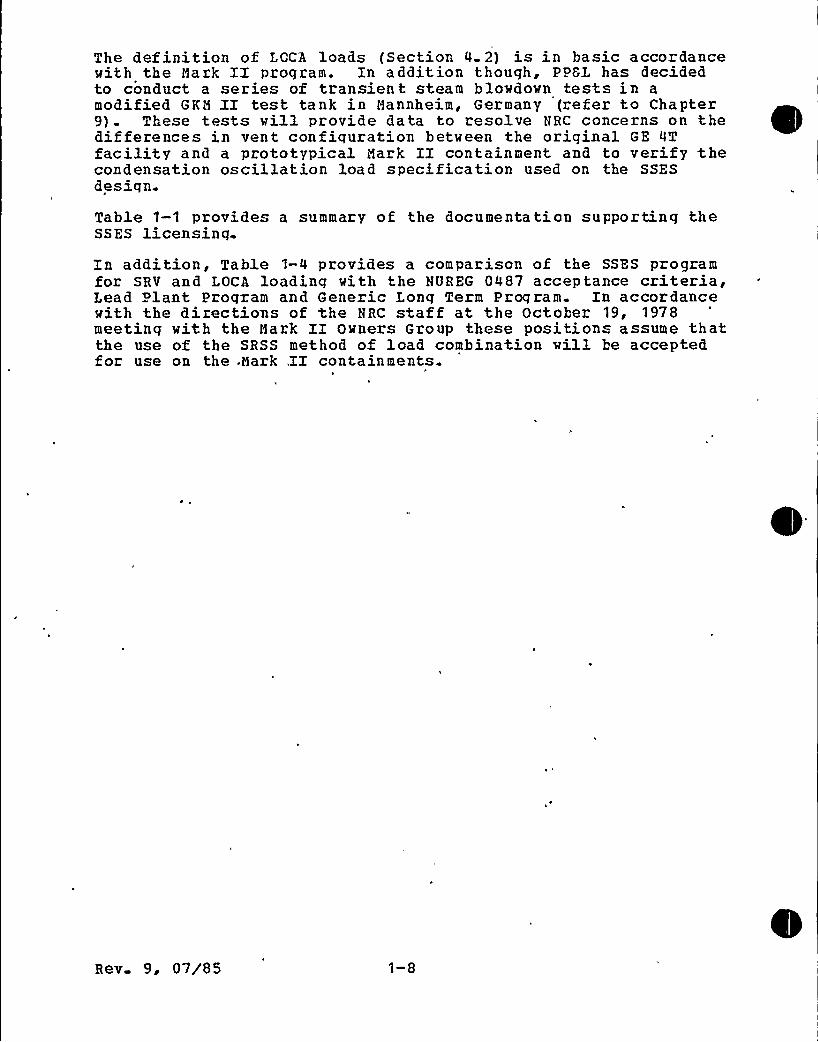
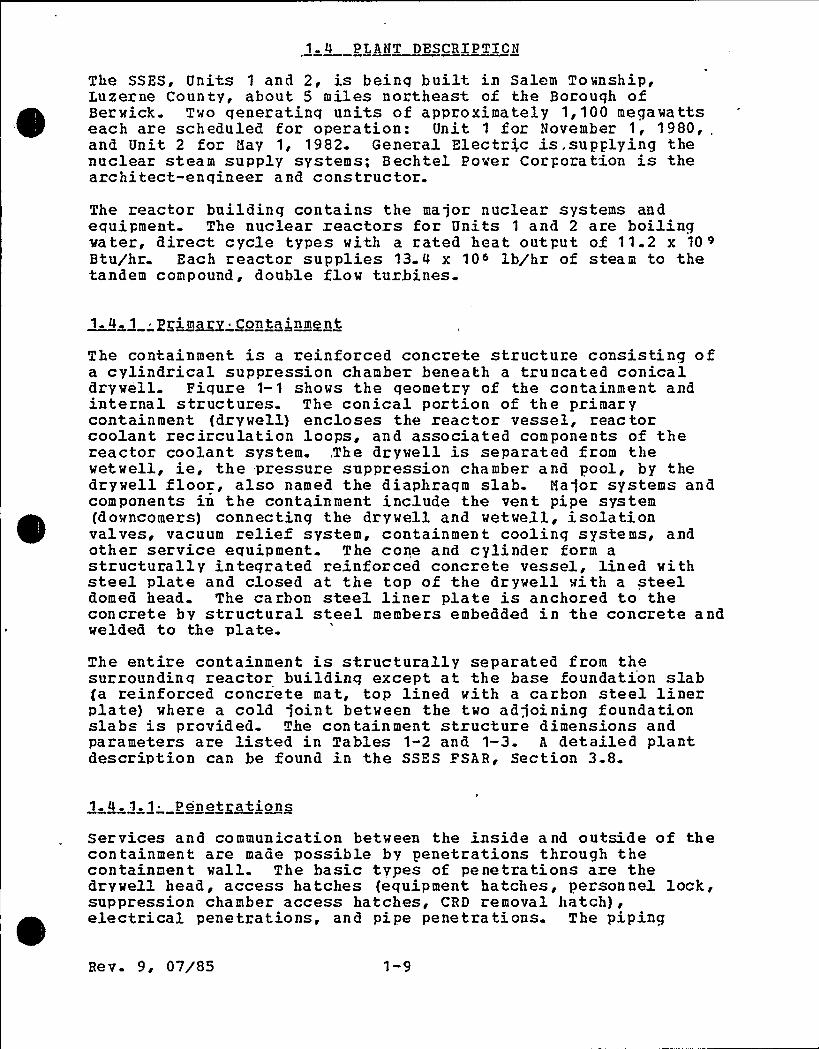
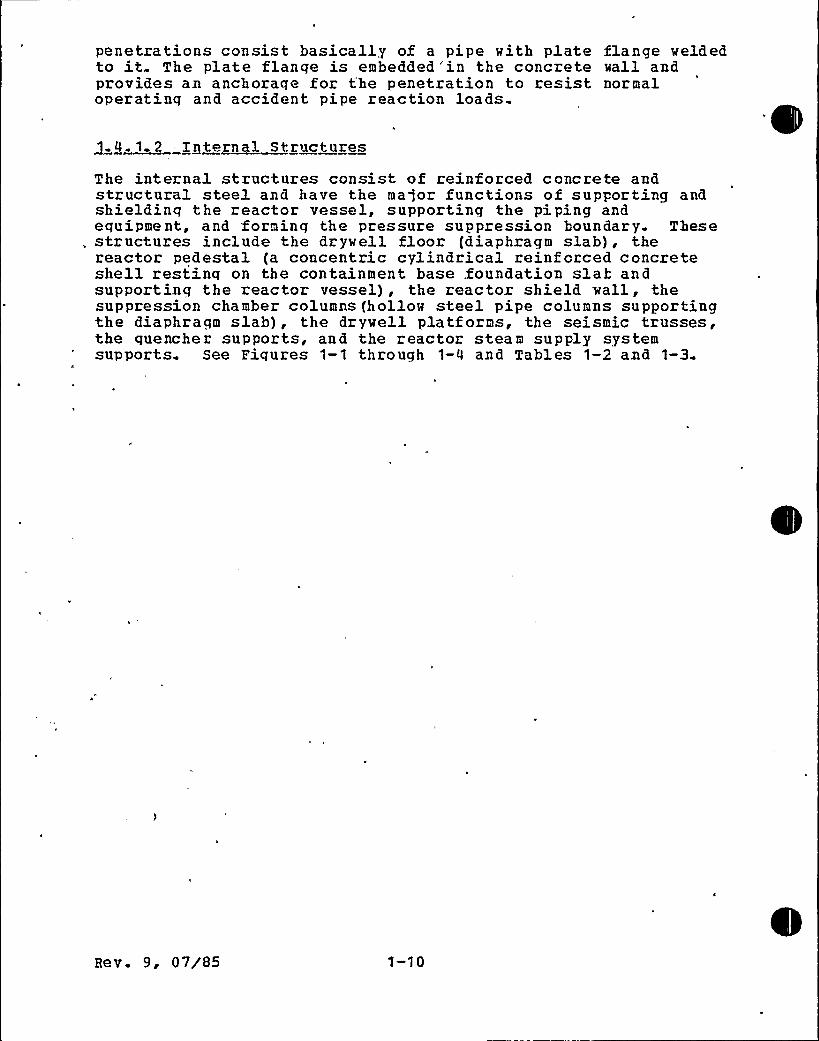
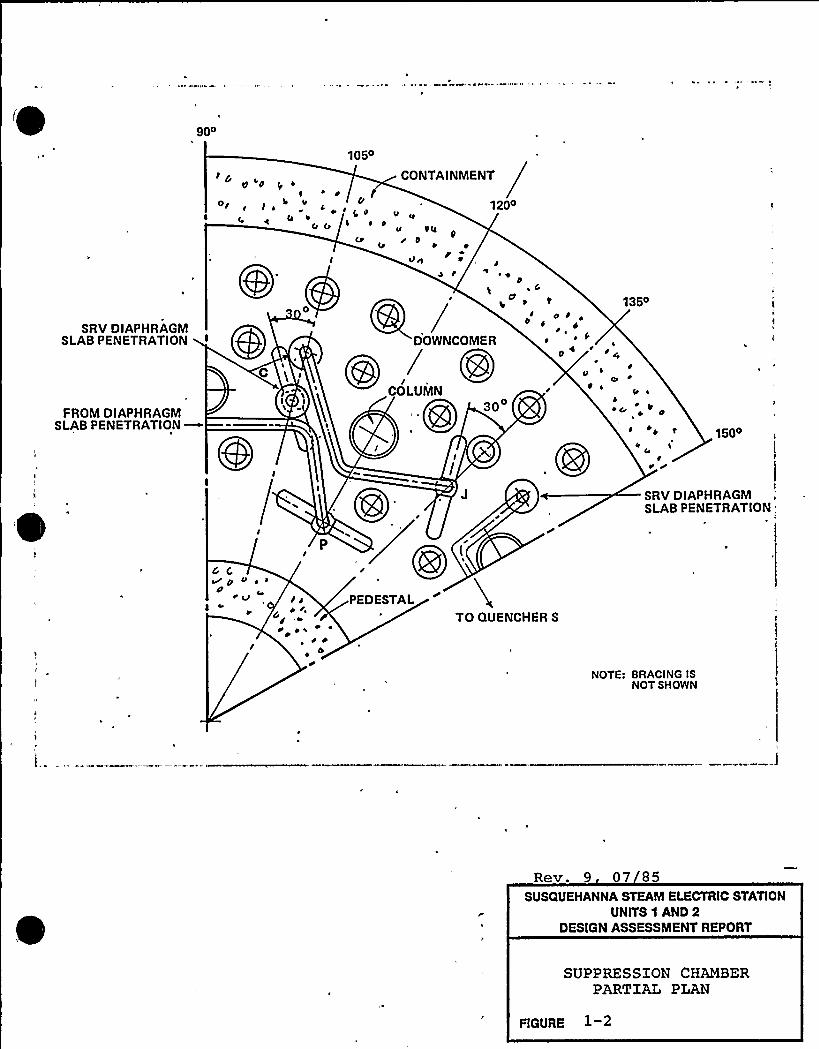
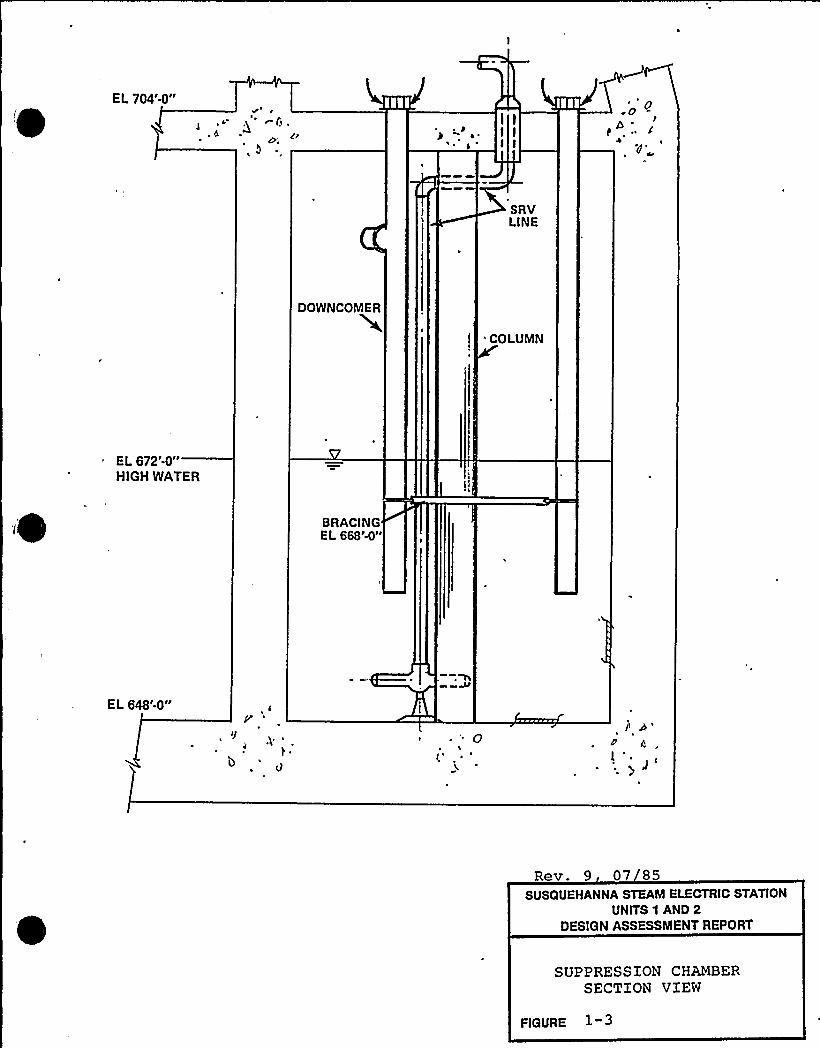
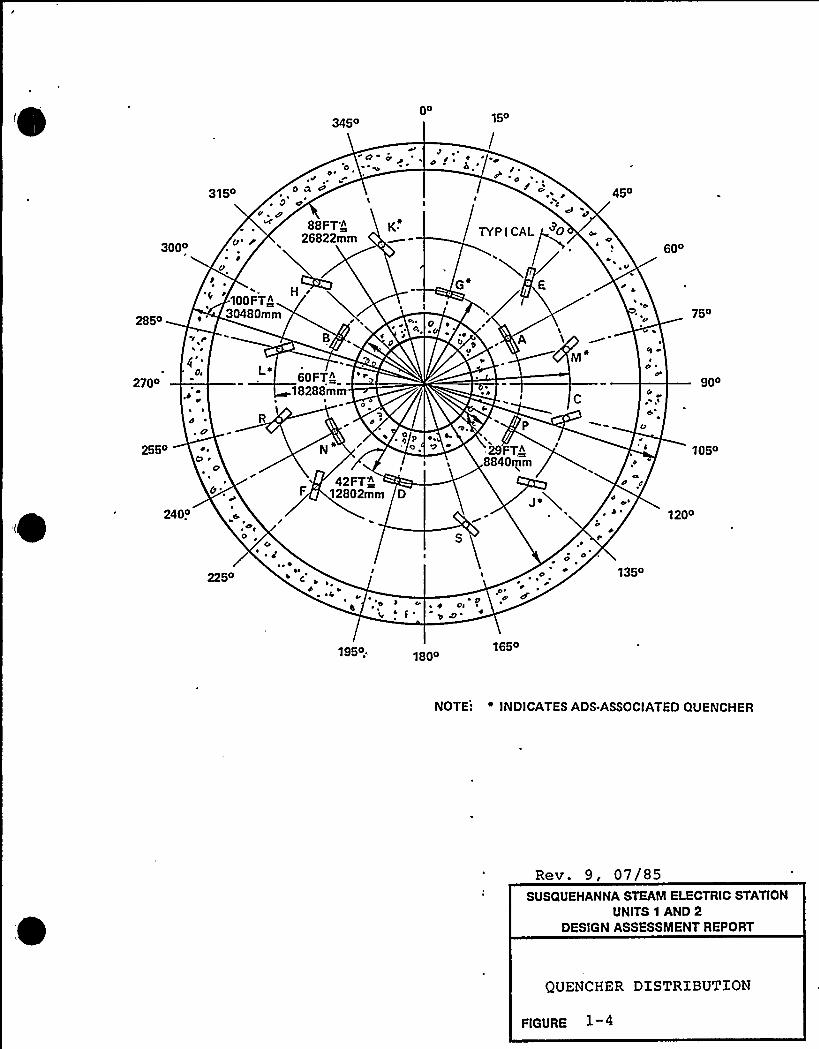
The internal structures consist of reinforced concrete andstructural steel and have the ma d'or functions of supporting andshieldinq the reactor vessel, supporting the piping andequipment, and forming the pressure suppression boundary. Thesestructures include the drywell floor (diaphragm slab), thereactor pedestal (a concentric cylindrical reinf orced concreteshell restinq on the containment base foundation slab andsupportinq the reactor vessel), the reactor shield wall, thesuppression chamber columns (hollow steel pipe columns supportingthe diaphraqm slab), the drywell platforms, the seismic trusses,the quencher supports, and the reactor steam supply systemsupports. See Figures 1-1 through 1-4 and Tables 1-2 and 1-3.
Rev. 9, 07/85
IL OF PRIMARY CONTAINMENTI
SYM. ABT. (L
r DRYWELLHEAD
48'0K" OJ7. CONC.
I36'R" (OUTSIDE FACEI
WP. E L. 791'-9"
.Lc
5 'r!i
/ ,'/
SHIELD ~ANNULUS
~ '.. iDOWNCOMERJET DEFLECTOR
SHIELD
.\~,
I
I29'" O.O.
T.OS. EL. 778'"
I
III'EACTORSHIELD
p4
25"7" I.O.
1(TJI" 117.
~EL. 723'6%"II
20'.3"I.D. CONC.
.: 86'.3" I.O.CONC
T.O.C.EL. 703'1"
I4
~ ~ !'
j
! 4 ~
I~ ~
r ~ ~
II'.St
4!TO C ~" ~
EL. 729'-9 5/8"
DIAPHRAGMSLAB W.P
87'
:r EI
'
ORYWELL
T.O.C.L.
704'4T''.6"
EL. 701'1"
t D NCOMER(87 TOTAL(
QUENCHERDEVICE
(18 TOTAL)
II
. CONTAINMENTWALLWATERSTOPS
BASE MATWATERSTOP
~ i ~1 ~! i
~4
!,
'4
I ~
I 'e ~
I!&I
~ ~ ~ !
0'45(
'I
F45
~5
'1'6"',
. 8'GII" ~
vi
O-DECK ANOUPPORT BEAM
IR P.V.
PEDESTAL
IR.P.V.
PEDESTALSTEEL FORM
II
19'.7"
I.O. CONC
I12FT.'
~
~ ~
~ I",
'12,
3'4P'IAM.
STEELCOLUMNS
T.
24FTHIGH
WATERLEVEL
r
~~
c.I
~ ~
~'(
~
~
I
~ I",~ I' I
~ I
4
SUPPRECHAM
SSI ONBER
7'41"~ ',
9 ~
COLD JOINT
30'JP'
29'.9"O.O. CONC.
88'-0"I.D. CONC.
MUDMATANDWATERPROOFING
44'JP'.
BOTTOM OFBASE MATE L. 640'4"
REACTORBUILDINGBASE MAT
COLD JOINT
SUSQUEHANNA STEAM ELECTRtC STATlONUNlTS 1 AND 2
DESlGN ASSESSMENT REPORT
CROSS SECTION OFCONTAINMENT
FIGURE 1-1

90o
I g p y s
'L u
u 4 u
105o
0~
g ys
CONTAINMENT
120o
o0
un e
r ~e ~
p
135o
SR V D IAPH RAG M
SLAB PENETRATION
FROM DIAPHRAGMSLAB PENETRATION
lC
0+,
DOWNCOMER
0s..i 08
03"
0<
0 ~s s
s
y t +
u
~ Q
1500
SRV DIAPHRAGMSLAB PENETRATION;
~ y u ~ jp r g
P
Igs ri
~ i~'
0
O~'EDESTAL
TO QUENCHER S
NOTE: BRACING ISNOT SHOWN
eRev. 9 07 85
SUSQUEHANNA STEAM ELECTRIC STATIONUNITS 1 AND 2
DESIGN ASSESSMENT REPORT
SUPPRESSION CHAMBERPARTXAL PLAN
FIGURE 1-2
EL 704'4"
SRVLINE
DOWNCOMER
I 'OLUMN
EL 672'-0"HIGH WATER
BRACINGE L 668'-0"
EL 648'-0", C
y e
IJ
b
4 gt
~'
c
g J
Rev. 9 07 85SUSQUEHANNA STEAM ELECTRIC STATION
UNITS 1 AND 2DESIGN ASSESSMENT REPORT
SUPPRESSION CHAMBERSECTION VIEW
FIGURE 1" 3
345000
15o
0
~O y r.'0,
, ~.'~ / ~
3000
2850
3'l50
d
d
100FT"~
~ 30480m m
0 A
88FT n
26822mm
B
~'\
I 'dy
TYP I CAL 0
Op''~ .'A
450
60
750
p'Oo
270o,d
~ ~
d ~
2550b ~
0
0'.
2400
2250
R
0~
~ C
60FT"18288mm
I0
d
42FT~12802mm D
I'
C
0
4
pad Pi
~ d
P
29FTn8840rqm
0
0d(
'
d d
1350
a'001050
120o
1950. 1800165o
NOTE: % INDICATES ADS-ASSOCIATED QUENCHER
Rev. 9, 07/85SUSQUEHANNA STEAM ELECTRIC STATION
UNITS 1 AND 2DESIGN ASSESSMENT REPORT
QUENCHER DISTRIBUTION
FIGURE
SSES I.ICEHSIHC BASIS
TABID 1-1
l. Hark Il Containment - Supporting Program
A. LOCA - Related Tasks
TaskHumber A~ctivii
"4T" Test Program
A~iccivii L 8
Phase I Test ReportPhase I Appl HemoPhase II S III Test ReptApplication Hemorandum
TargetC~ol ti*n
CompletedCompletedCompletedCompleted
Documentation
REDO/HEDE 13442"P"01Application NemoHEDO/HFDE 1346&-PREDO/NFDE 2367B-P
Used forSSES Licensing
YesYesYesYes
h.2
A.i Impact Tests
Pool SMell Hodel Report Hodel Report
PSTF 1/3 Scale TestsHark I I/12 Scale Tests
Completed
CompletedCompleted
HEDO/NEDE 21544-P
HEDO/HEBE 13426-PREDO/HEDC 20989-2P
YesYes
A.4 Impact Hodel PSTF 1/3 Scale 'featsHark I 1/12 Scale Tests
CompletedCompleted
REDO/NEUE 13426-PREDO/NEDC 209S9-2P
YesNo
A.5 I.oads on SubmergedStructures
A.6 . Chugging Analysis andTesting
Cln>gging Single Vent
EPRI Test EvaluationRPRI I/13 Scale TestsEPRI Single Cell Tests
LOCA/RN hir Bubble HodelLOCA/RN Mater Jet HodelRing Vortex Hodel
Applications HethodsQueue. Air Bubble HodelAppl. tiemo. SupplementQuencher Air Bubble1/4 Scaling TestsData Eval.Steam Condensatiou Hethods
Single Cell ReportHultivent Hodel4T FSI Report.
CREARE Report
EPRI - 4T Comparison3D TestsUnit. Ci:11 'feats
CompletedCompletedCompleted4Q 19Comp)cled3Q 793Q 19
Complete4Q 79
CompletedComl>letedCompleted
Completed
CompletedCompleted3Q 79
REDO/NEDE 21471-PHEUO/HEDE 21472-PLetter Report.Topical ReportREDO/HEBE 21730-PNEDO 21471 SupplementNEDE 21730 Supplement
BEDE 238)7-PReportPlant DAR's
NEDO/HEBE 23703-PNEDO/NEUE 21669-PHEDO/NEDE 23710-P
REDO/HEDE 21851"P
REDO 21661EPRI HP-441El'RI Report
Yes (Partial)Yes (Partial)HoHoHoNoHo
HoHo
YesNoYes
Ho
YesYesYes
Rev. 9, 07/85
Page 2
TaskNumber
A.ll
A.13
A.16
A.17
Activist
Hultivcut Subscale Testingaud Analysis
Single Vent. Lateral l.oads
improved Chugging LoadDefinition
Stcam Condensation Oscjll.
Activity %~pe
Preliminary HV Prog PlanHV Test Program Plan S Proc.- Phase 1
1'hase I Test RcportHV Test Prog Plan S Proc
- Phase IIPhase ll Test ReportCONHAP TestsHNH Vcr'ification1/10 Scale
Dynamic AnalysisSummary ReportSuasnary Report (Extension)
impulse Evaluationimproved Chug Load Defn.
4T C.O. Test
TargetLCow >lotion
CompletedCompleted
3Q 793Q 79
2Q 803Q 79
Completed
CompletedCompleted3Q 79
Completed3Q 79
2Q 80
Documentation
HEDO 23697NEDO 23697 Rev 1
RcportHEDO 23697, Rcv. 1, Supp. 1
Rcport.Rcpof tNEDE 25116-P
NEDO 24106-PNEDE 23806-PReport
Letter Rcport,Report
Rcport
Used for
YcsYes
YcsYes
YcsYes
Yes
YesYesYcs
HoHo
Undecided
Rev. 9, 07/85
Page 3
O. SIIV Helated Tasks
TaskHumber Act fait
"U.l Quet Ichor Empirical Model
Raiashead Model
Monticello ln"Plant.S/RV Tests
Activity Tylie
DFFR Model .
Supporting Data
i)FFR ModelSupporting DataAnalysis
Preliminary Test ReportHydrodynamic Report
'far&etC~om! let I cn
CompletedCompleted
CompletedCompletedCompleted
CompletedCompleted
Uoc<uaentation
REDO/HEOE 21061-PNEOO/HEOE
2107&-I'EIS/HEDE
21061-PNEOO/HEUE 2I062-PREDO/HEOE 20942-P
NEDO/NEDC 21465-PNEUO/NEDC 215&1-P
Used forSSES Licensing
NoHo
NuHoHo
NoHo
lt.5
8.10
8.14
S/l(V Quencher In-PlantCaorso Tests
Phase 1
Phase 11
Thermal Mixing Model
Monticcllo FS1
DFFR Ramshead ModelTo Monticello Data
Ramshcad SRV Met.hodologySummary
Quencher Empirical ModelUpdate
Test. PlanTest Plan Addendum 1'fest. Plan Addendum 2Test SummaryTest ReportTest Report
Analytical Model
Analysis of FSl
Data/Model Comparison
Analytical Methods
Model Confirmation
CompletedComplet.edCompletedCompletedComplet«d1Q 80
Completed
Completed
Completed
Completed
1Q 80
HEDM 209SS Rcv. 2NEDH 20988 Rcv. 2, Add 1
NEON 20988 kev. 2, Add 2Letter lteportNEDE-25100-PRcport
REDO/HEDC 236&9-P
NElS 23S34
NSC-GEH 0394
NEDO 24070
ltcport
HoNoNoHoHoHo
No
No
Rev. 9, 07/85
C. Iliscellaneous 'I'asks Page 4
TaskNumber
C.l
C.3
Activit)>
Supporting Program
DFFR Revisions
HRC ltound 1 Questions
~Ace> iL > e
Supp Prog RptSupp Prog Rpt. Itev.Supp Prog ltpt Itev.
Revision 1
Revision 2Revlsiou 3
DFFR Rev. 2DFFR Rev. 2 Amendment 1
DFFR Rr:v. 3. Appendix A
fa rgr'.t.
C~e» Lice
CompletedCompleted4Q 70
CompletedCompletedCompleted
CompletedCompletedCompleted
Documentation
HEDO 21297REDO 21297 - Rev. 1
REDO 21297 - Rev. 2
NEDO/NEDE 21061-P Itev. 1
NEDO/HEBE 21061-P Nev. 2REDO/HEBE 21061-P Rev. 3
REDO/NEDE 21061-P kev. 2NEDO/HEBE 21061-P Rcv. 2 Arucnd. 1
REDO/NEDE 21061-P Rev. 3 Appendix
A'sed
SSESforLicensing
Yes (Partial)
YesYesYes
C.5 SRSS Justification interim ReportSHSS ReportSRSS Exec. ReportSltSS Criteria Appl.SIISS BasesSltSS Justification Suppl.
CompletedCompletedCompletedCompletedCou>piete(I3Q 79
(NFDE 24010)NEDO/HEDE 24010-PSuuuuary ReportNEDO/HEBE 24010-PNEDO/HEDE 24010-PIteport
Suppl. 1
Suppl. 2
YcsYesYesYesYesYes
C.6 HIIC Round 2 Questions DFFR Amendment 2DFFR Amend 2, Suppl 1
Dl'Flt Aruend 2, Suppl 2DFFII ltcv. 3, Appendix A
CompletedCompletedCompletedCoa>pleted
HEIM/HEBE 21061"P Rev. 2 Amend. 2NEDO/HEBE 21061-P Itev. 2 Amend. 2 Supp. 1
REDO/HEBE 21061-P Rev. 2 Amend. 2 Supp. 2NEDO/NEDE 21061-P ftev. 3 Appendix A
YesYcsYesYes
C.7 Just:ification of "4T"Bounding Loads
Chuggiug LoadsJustification
Cou>pieteCouip le toCompleteCompleteCompleteCompleteComplete
NEDO/NEDENFDO/HFDF.REDO/NEDEHEDO/IIEDEHI!DO/HEBENF DO/HEDEHEUO/NEDE
23617-P24013-P24014-P24015-P240I6-P24017-P23627-P
YesYcsYr:sYesYesYesYes
C.B S/ItV and ChuggingFSi
Prestressed ConcreteReinforced ConcreteSteel
Coup> letrrd REDO/HEDE 21936-I'es0.9 Honitor ltorld Tests
C.13 I.uud Corul>inutior>s 6Funct.ional CapabilityCriteria
C.14 HIIC Ituund 3 Questions
Honitor Tests
Crit.eris Justification
Letter RcportDFF)t, Rev. 3, Appc»dix A
Eral ofProgramComplet.i:d
Complete>I
Hot>re
REDO 21985
I.utter Report.HECO/HEBE 21061-I'tcv. 3 Appendix A
YesYes
C.15 Subiuergcd St.ructure Criteria NIIC Question Responses 3Q 79 I.utter Rcport Ycs
Rev. 9, 07/85
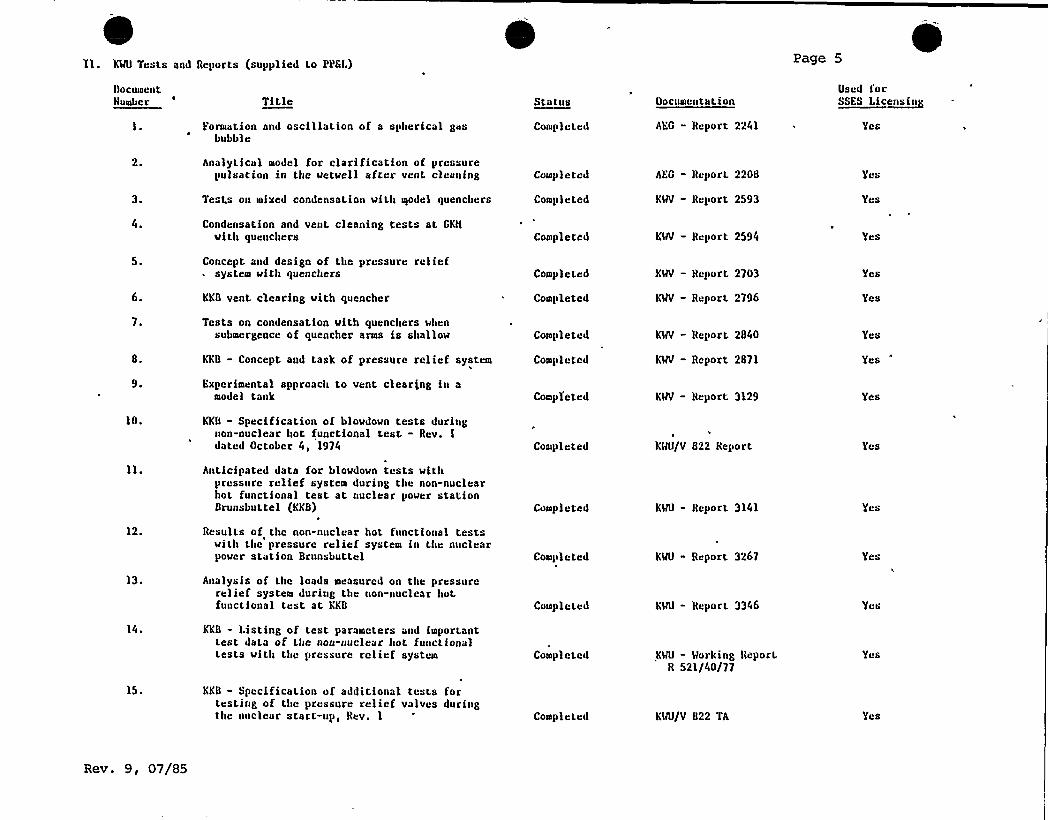
'll. KNI Tests and Reports (supplied to PPSL) Page 5
BocumelltNumber
Eormation and oscillation of a sph«rical gasbubble
Status
Completed
Oocum«ntation
AEC - Report 2241
Used i'orMES LiCB~I~
Yes
Analytical model for clarification of pressurepulsation in tbe wetwell after v«ut cleaning
Test.s on mixed condensation with alod«i quenchers
Completed
Completed
AEC - Report 2208
KNl - Report 2593
Condensation and vent. cleaning tests at CKtiwith quenchers Completed KWV - Report 2594 Yes
6.
Concept and design of the pressure reliefsystem with quencbers
KKB vent clearing with quencher
Completed
Completed
KWV — Rcport 2703
KWV - Report, 2796
Yes
Tests on condensation with quenchers whensubmergence of quencher arms is shallow
KKB - Concept and task of pressure relief syst«m
Experimental approach to vent clear)ng iu amodel tank
Completed
Compl«tcd
Completed
KWV - Report. 2840
KWV - Report 2871
KWV - Report 3129
Yes
Yes
Yes
10.
12.
13.
14.
KKB - Specification of blowdown tests duringnon-nuclear hot functional test. - Rev. ldated October 4, 1974
Anticipated data for blowdown tests withprcssure relief system during the non-nucl«arhot functional test at nucl«ar power stationBrunsbuttel (KKB)
Results of thc non-nuclear hot functional testswith the pressure relief system in the nuclearpower station Brnnsbuttel
Analysis of the loads measured on the pressurerelief system during the uon"nuclear botfunct.ional test at KKB
KKB - l.isting of test parameters aud importanttest data of the non-nuclear bot functionaltests with the pressure relief system
Completed
Completed
Completed
Compl«ted
Completed
KNl/V 822 Report.
KWO - Report 3141
KNI - Report 3267
KNl - Report. 3346
KNI - Woikang Report*
R 521/40/77
Yes
Yes
Y«s
15. KKB - Specification of additional tests fortesting of the pr«ssure relief valves duringthe nuclear start-up, R«v. 1 Complet«d KWU/V 822 TA Yes
Rev. 9, 07/85
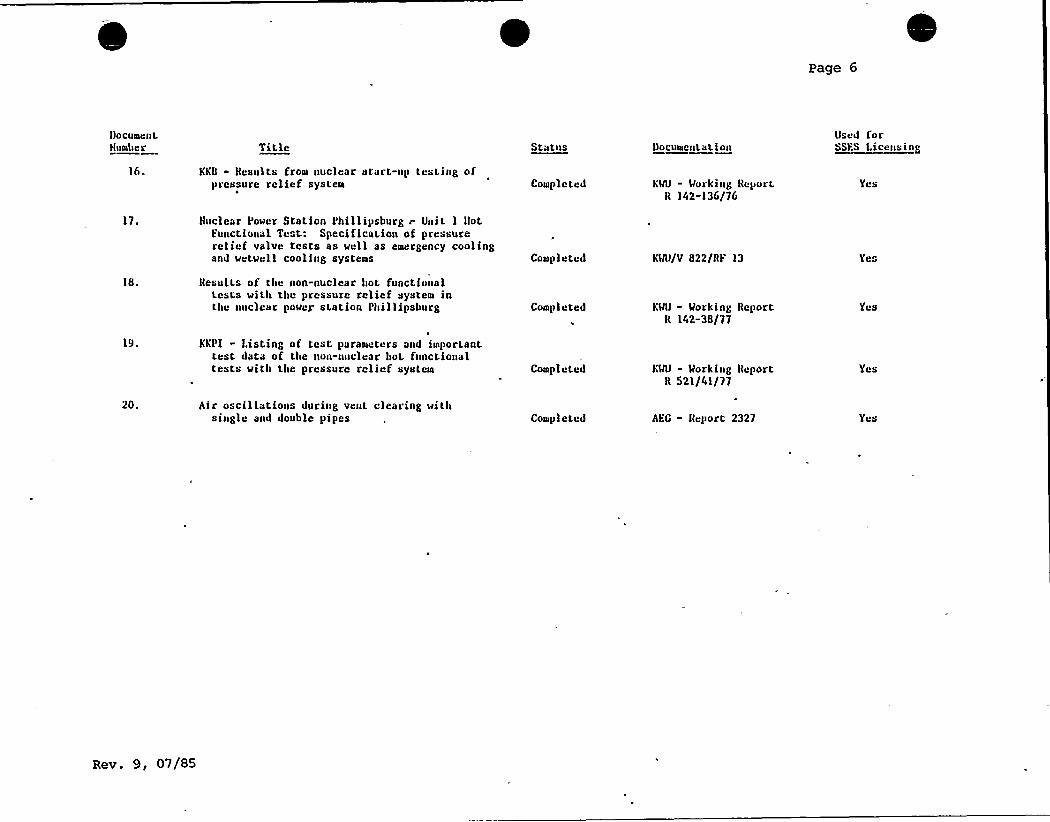
Page 6
Uocument.Ihimber Title
KKII - Results from nuclear start-up tesI.ing ofpressure relief system
S'tutus
Completed
Document»tion
KWU - Working ReportR 142-136/76
Used iorSSES f.iteusing
Yes
17. Huclear Power Station Phillipsburg ~ Uuit. 1 Ilotpunction»l Test: Specificat,ion of pressurerelief valve tests as well as emergency coolingand wetwell cooling systems Completed KNI/V &22/RF 13
Results of the non-nuclear hot functionaltests with the pressure relief system inthe nucle»r power station Phillipsburg Completed KNI - Working Report
R 142-3&/77Yes
KKPl « l.isting of test p»rameters and important.test d»t» of the uon-nuclear bot functionaltests with tbe pressure relief syst.em Completed KWU - Workiug Report
R 521/41/77Yes
20. Air oscillations during veut clearing withsingle and double pipes Completed AKG - Report 2327 Yes
Rev. 9, 07/85
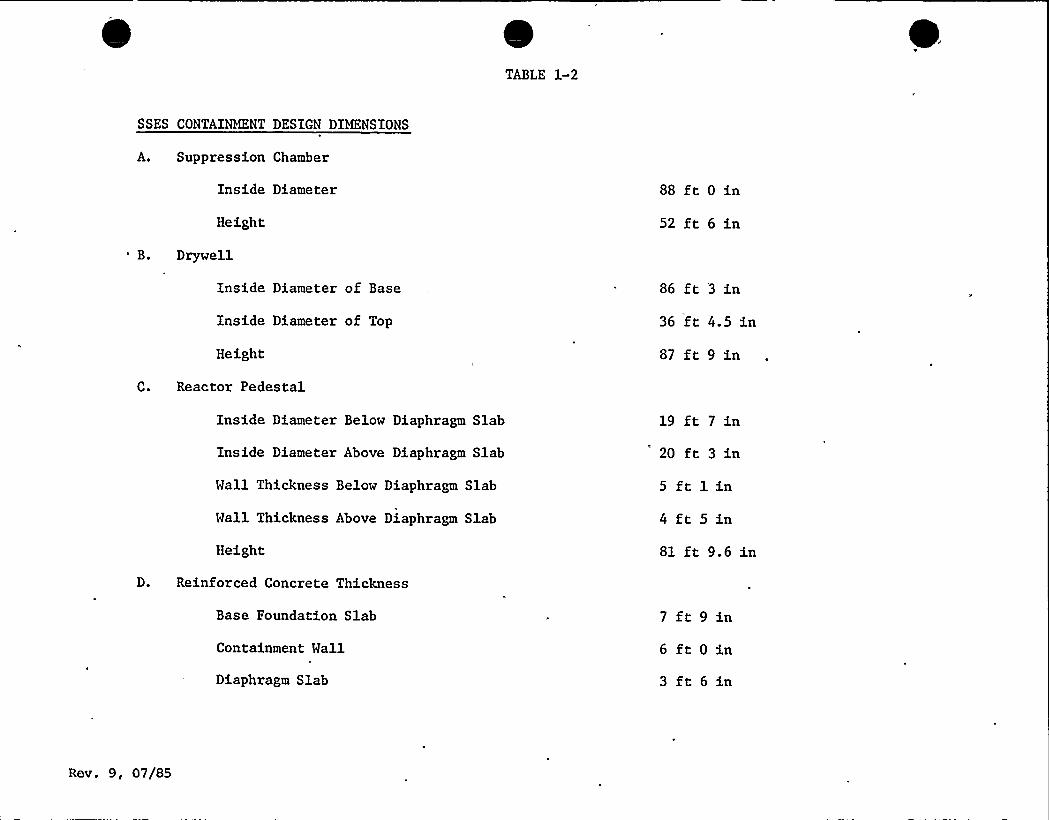
0TABLE 1-2
SSES CONTAINMENT DESIGN DIMENSIONS
A. Suppression Chamber
Inside Diameter
Height
'. Drywell
Inside Diameter of Base
Inside Diameter of Top
Height
C. Reactor Pedestal
88 ft 0 in
52 ft 6 in
86 ft '3 in
36 ft 4.5 in
87 ft 9 in
Inside Diameter Below Diaphragm Slab
Inside Diameter Above Diaphragm Slab
Wall Thickness Below Diaphragm Slab
Wall Thickness Above Diaphragm Slab
Height
D. Reinforced Concrete Thickness
19 ft 7 in
20 ft 3 in
5 ft 1 in
4 ft 5 in
81 ft 9.6 in
Base Foundation Slab
Containment Wall
Diaphragm Slab
7 ft 9 in
6 ft 0 in
3 ft 6 in
Rev. 9, 07/85
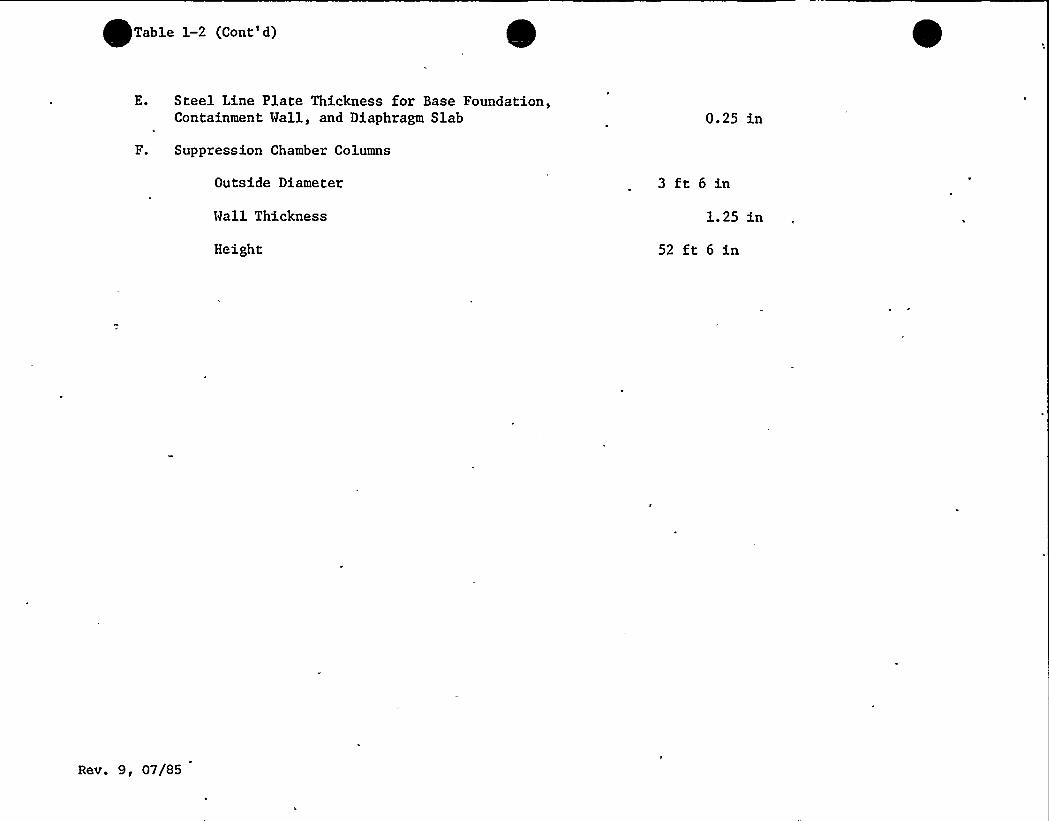
E. Steel Line Plate Thickness for Base Foundation,Containment Wall, and Diaphragm Slab 0.25 in
F. Suppression Chamber Columns
Outside Diameter
Wall Thickness
Height
3 ft 6 in
1.25 in
52 ft 6 in
Rev. 9, 07/85

0
E 1-3
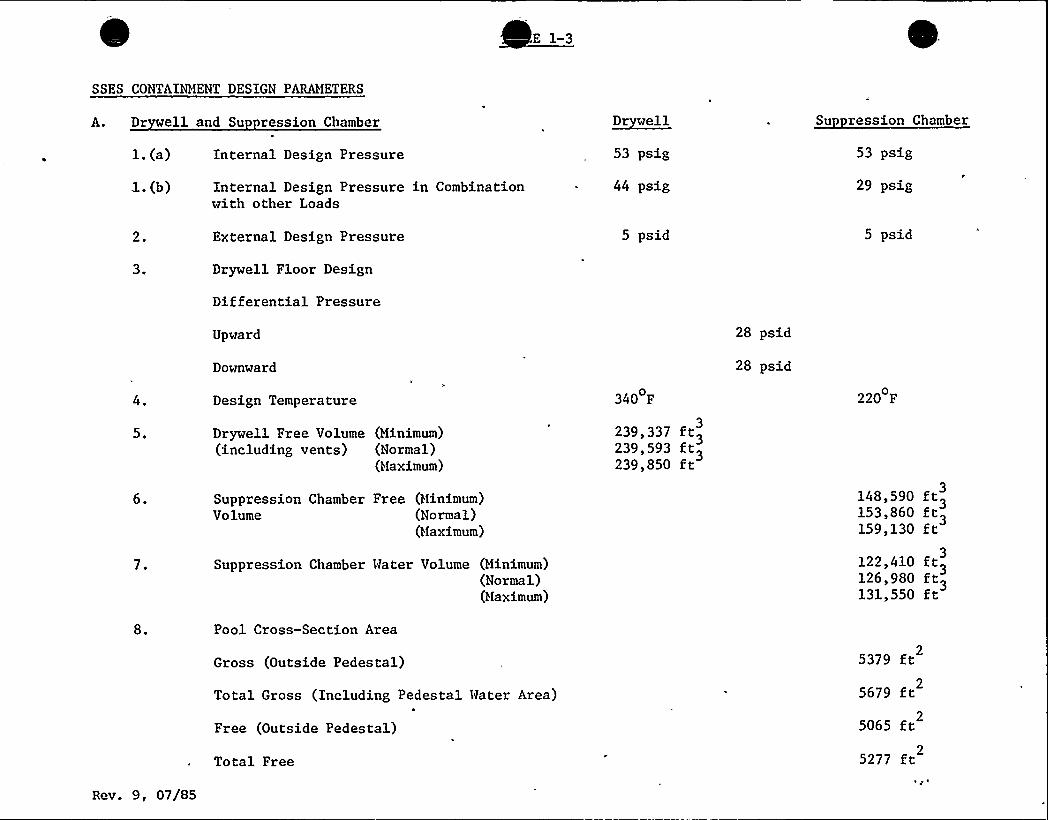
SSES CONTAINMENT DESIGN PARAMETERS
A. Dr ell and Su ression Chamber ~De well Su ression Chamber
1. (a) Internal Design Pressure
Internal Design Pressure in Combinationwith other Loads
53 psig
44 psig
53 psig
29 psig
2.
3.
5.
6.
7.
External Design Pressure
Drywell Floor Design
Differential Pressure
Upward
Downward
Design Temperature
Drywell Free Volume (Minimum)(including vents) (Normal)
(Maximum)
Suppression Chamber Free (Minimum)Volume (Normal)
(Maximum)
Suppression Chamber Mater Volume (Minimum)(Normal)(Maximum)
5 psid
340 F
239,337 ft33239,593 ft3239,850 ft
28 psid
28 psid
5 psid
220 F
148,590 ft33
159,130 ft122,410 ft33126,980 ft3131,550 ft
8. Pool Cross-Section Area
Gross (Outside Pedestal)
Total Gross (Including Pedestal Mater Area)
Free (Outside Pedestal)
Total Free
5379 ft5679 ft5065 ft5277 ft
Rev. 9, 07/85
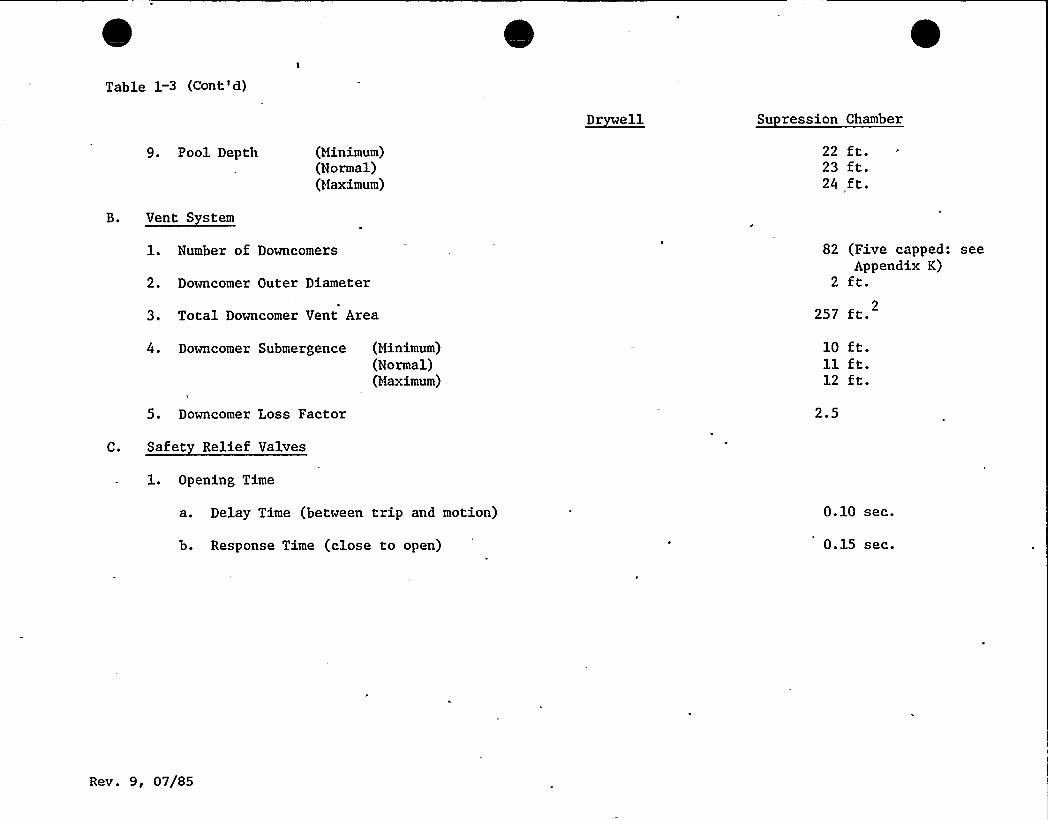
Table 1-3 (Cont'd)
~Dr el'| Su ression Chamber
9. Pool Depth (Minimum)(Normal)(Maximum)
22 ft.23 ft.24 ft.
1. Number of Downcomers
2. Downcomer Outer Diameter
3. Total Downcomer Vent Area
82 (Five capped: seeAppendix K)
2 ft.257 ft. 2
4. Downcomer Submergence (Minimum)(Normal)(Maximum)
5. Downcomer Loss Factor 2.5
C. Safet Relief Valves
l. Opening Time
a. Delay Time (between trip and motion)
b. Response Time (close to open)
0.10 sec.
0.15 sec.
Rev. 9, 07/85
T 1-3 (Cont'd)
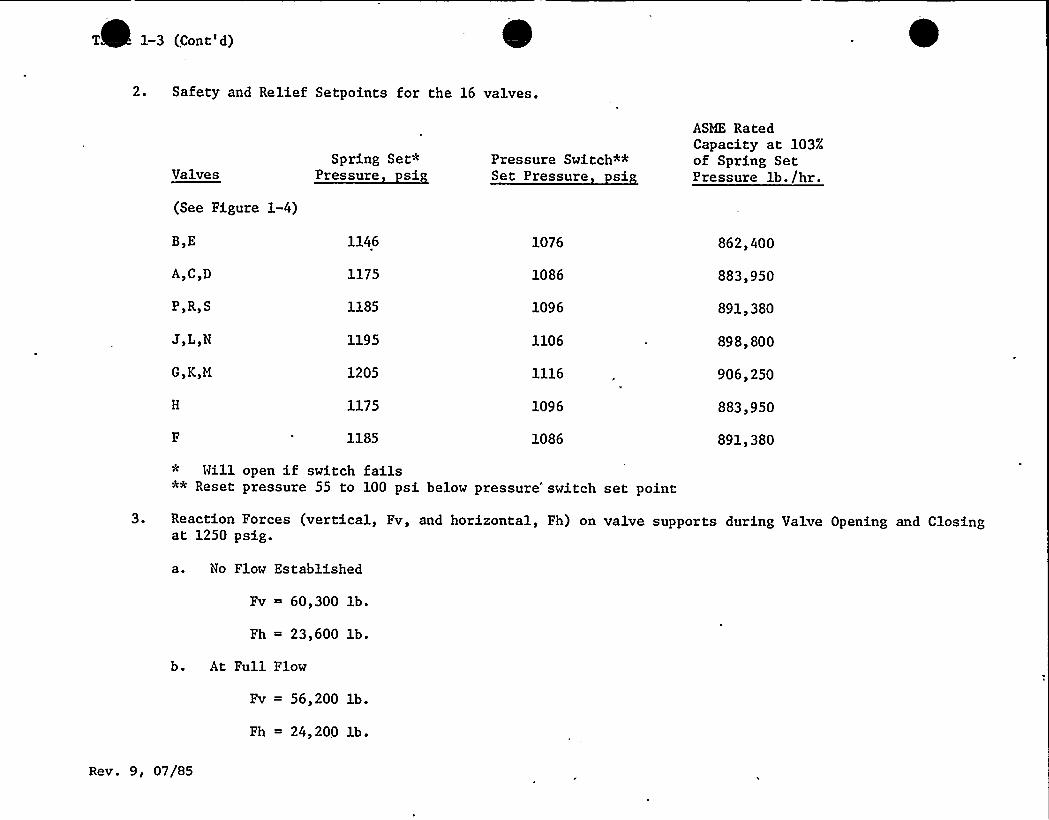
2. Safety and Relief Setpoints for the 16 valves.
ValvesSpring Set*
Pressure siPressure Switch**Set Pressure si
ASME RatedCapacity at 103%of Spring SetPressure lb./hr.
(See Figure 1-4)
B$ E
A$ C$ D
P$ R$ S
J$ L$ N
G$ K$M
1146
1175
1185
1195
1205
1175
1185
1076
1086
1096
1106
1116
1096
1086
862,400
883,950
891,380
898,800
906,250
883,950
891,380
Will open if switch fails** Reset pressure 55 to 100 psi below pressure" switch set point
3. Reaction Forces (vertical, Fv, and horizontal, Fh) on valve supports during Valve Opening and Closingat 1250 psig.
a. No Flow Established
Fv = 60,300 lb.
Fh = 23$ 600 lb.
b. At Full Flow
Fv = 56,200 lb.
Fh = 24,200 lb.
Rev. 9, 07/85
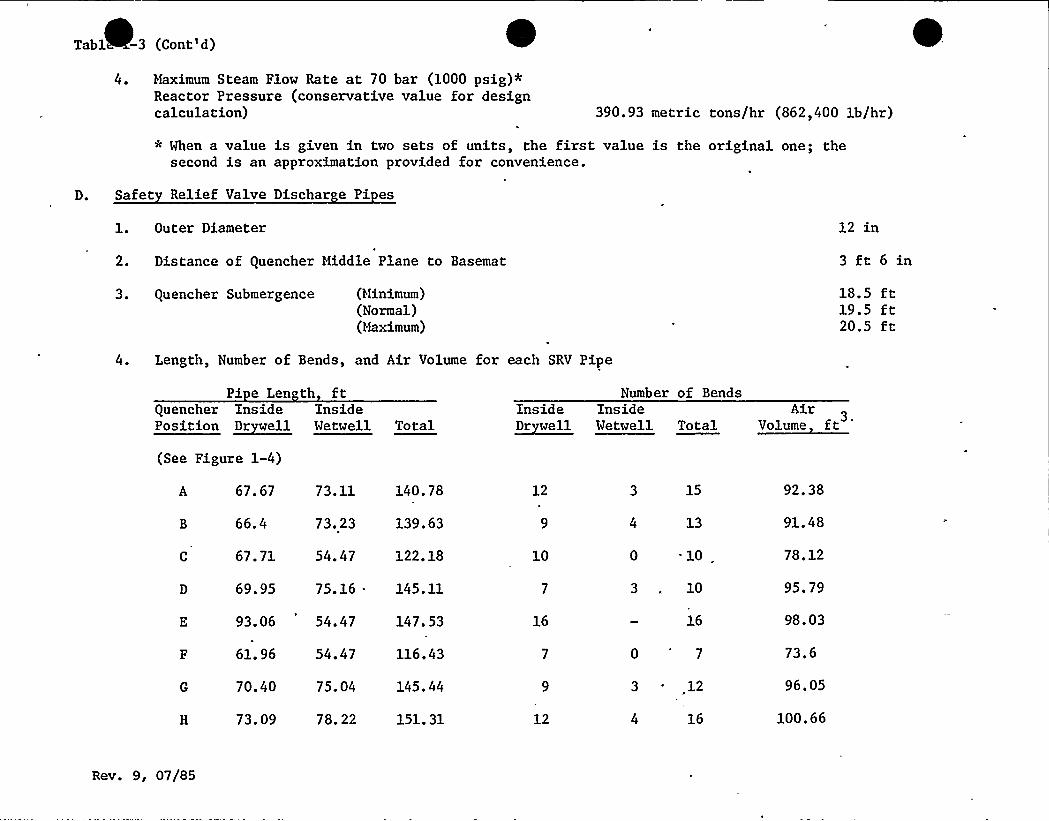
Tabl -3 (Cont'd)
D.
4. Maximum Steam Flow Rate at 70 bar (1000 psig)*Reactor Pressure (conservative value for designcalculation) 390.93 metric tons/hr (862,400 lb/hr)
~ When a value is given in two sets of units, the first value is the original one; thesecond is an approximation provided for convenience.
Safet Relief Valve Dischar e Pi es
1. Outer Diameter
2. Distance of Quencher Middle Plane to Basemat
3. Quencher Submergence (Minimum)(Normal)(Maximum)
12 in
3ft6in18.5 ft19.5 ft20.5 ft
4. Length, Number of Bends, and Air Volume for each SRV Pipe
Pi e Len th ft Number of BendsQuencher InsidePosition ~Dr ell
(See Figure 1-4)
InsideWetwell Total
Inside Inside~Dr well Wetwell Total
AirVolume ft
A 67. 67
B 66.4
67. 71
69. 95
93. 06
61. 96
70. 40
73. 09
73. 11
73 ~ .23
54. 47
140.78
139.63
122. 18
75. 16 145.11
54. 47
54. 47
75. 04
147. 53
116.43
145.44
78. 22 151. 31
12
10
16
12
15
13
0 .10
3 . 10
12
16
92.38
91.48
78.12
95.79
98.03
73.6
96.05
100.66
Rev. 9, 07/85
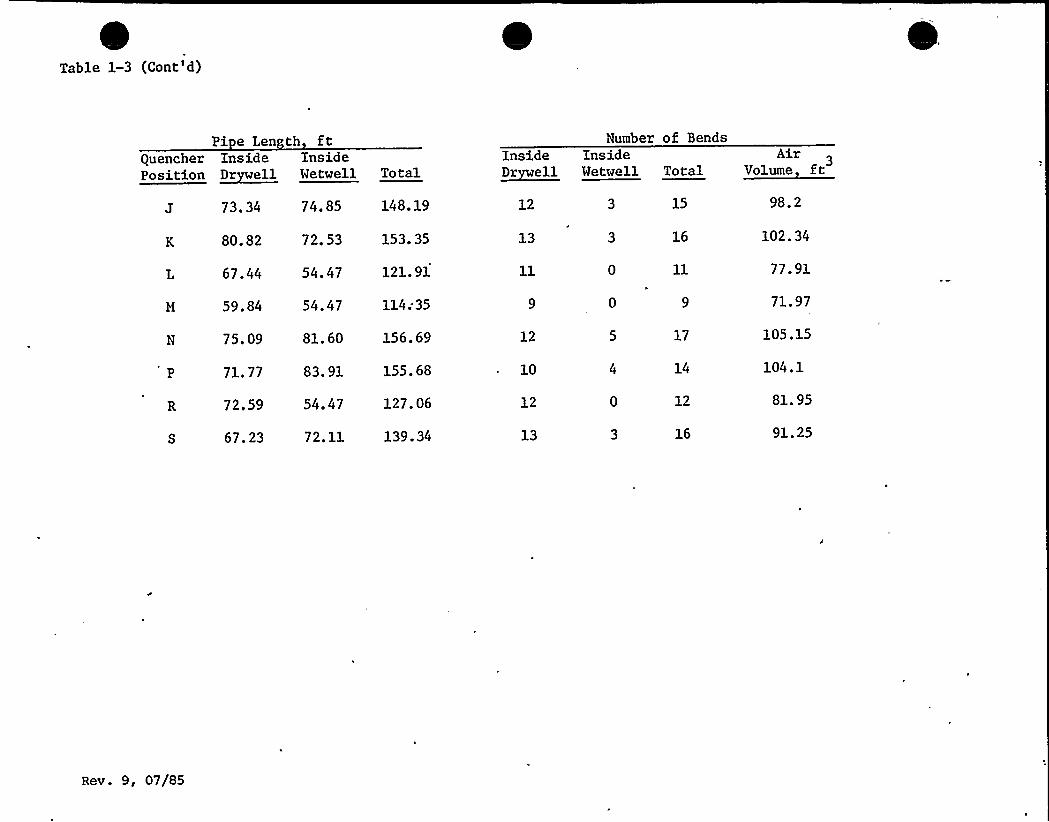
Table 1-3 (Cont'd)
Pi e Len th ft Number of Bends
Quencher InsidePosition ~Dt ell
73. 34
80. 82
67. 44
59. 84
75. 09
71. 77
72.59
67.23
InsideWetwell
74. 85
72. 53
54. 47
54.47
81.60
83. 91
54. 47
72. 11
Total
148. 19
153. 35
121.91
114;35
156.69
155.68
127.06
139.34
Inside Inside~Dr ell Wetwell
12
13
12
10
12
13
98. 2
16 102.34
77.91
71.97
17 105.15
14 104. 1
12 81. 95
91.25
AirTotal Volume ft
Rev. 9, 07/SS
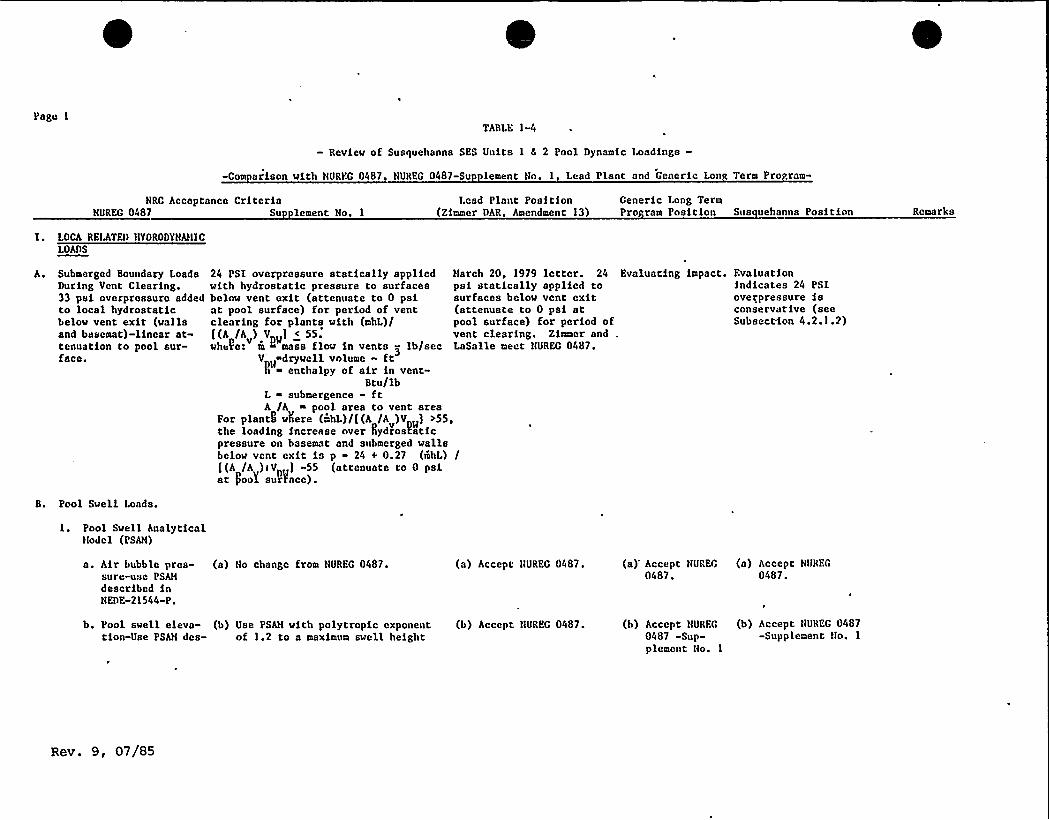
Page ITABLE 1-4
— Review of Susquehanna SES Units I h 2 Pool Dynamic I.oadings-
-Com arisen with NUREG 0487, NUREG 0487-Su lement No. I, Lead Plant and Generic Lon Term Pro ram-
NRC Acceptance CriteriaNUREG 0487 Su lement No. I
l.cad Plant Position(Zimmer DAR, Amendment 13)
Generic Long TermPro ram Position Sus uehanna Position Remarks
I. LOCh REULTED IIYORODYHAMICLOADS
h. Submerged Boundary LoadsDuring Vent Clearing.33 psi overpressuro addedto local hydrostaticbelow vent exit (wallsand basemat)-linear at-tenuation to pool sur-face.
24 PSI overprcssure statically appliedwith hydrostatic pressure to surfacesbelow vent exit (attenuate to 0 psiat pool surface) for period of ventclearing for plants with (mhL)/[(h /A ) VDJ < 55
'he4:m mass flow in vents — lb/sec3
VD «drywall volume - ftDNn « enthalpy of air in vent-
Btu/lbL « submergence - ftA /A « pool area to vent area
For plantR where (mhL)/t(A /A )V U] >55the loading increase over 8ydrosPnticpressure on basemat and submerged wallsbelow vent exit is p « 24 + 0.27 (mhL)[(A /A )< VD ) -55 (attenuate to 0 psiat )ooY s Race).
March 20, 1979 letter. 24 Evaluating impact.psi statically applied tosurfaces below vent exit(attenuate to 0 psi atpool surface) for period ofvent clearing. Zimmcr and ,LaSalle meet NUREG 0487.
Fvaluationindicates 24 PSIoverpressure isconservative (seeSubsection 4.2.1.2)
B. Pool Swell Loads.
1. Pool Swell AnalyticalHodcl (PSAM)
a. Air bubble pres-sure-use PSAMdescribed inHEBE-21544-P.
(a) Ho change from NUREG 0487. (a) Accept NUREG 0487. (a)'ccept HUREG (a) Accept NURFG
0487. 0487.
b. Pool swell eleve- (b) Use PSAM with polytropic exponenttion-Use PSAM dcs- of 1.2 to a maximum swell height
(b) Accept HUREG 0487. (b) Accept NUREG (b) Accept HUREG 04870487 -Sup- -Supplement No. Iplemcnt No. 1
Rev. 9, 07/85
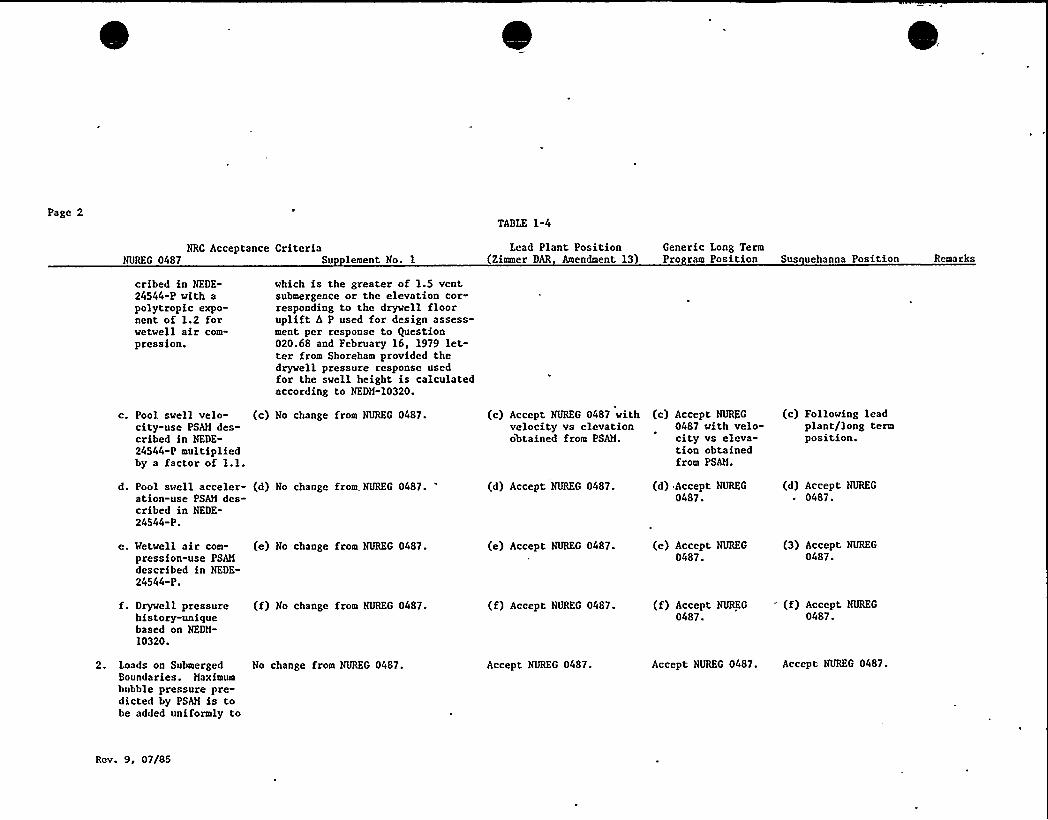
Page 2TABLE 1-4
NRC Acceptance CriteriaNUREG 0487 Su lement No. 1
Lead Plant Position Generic I.ong Term(Zimmer DAR Amendment 13 Pro ram Position Sus uehanna Position Remarks
cribed in NEDE-24544-P with apolytropic expo-nent of 1.2 forwetwell air com-pression.
c. Pool swell velo-city-use PSAH des-cribed in NEDE-24544-P multipliedby a factor of 1.1.
which is the greater of 1.5 ventsubmergence or the elevation cor-responding to the drywell flooruplift A P used for design assess-ment per response to Question020.68 and February 16, 1979 let-ter from Shoreham provided thedrywell pressure response usedfor the swell height is calculatedaccording to NEDH-10320.
(c) No change from NUREG 0487. (c) Accept NUREG 0487 with (c) Accept NUREG
velocity vs elevation 0487 with velo-obtained from PSAH. city vs eleva-
tion obtainedfrom PSAH.
(c) Following leadplant/long termposition.
d. Pool swell acceler- (d) No change from NUREG 0487.ation-use PSAH des-cribed in NEDE-24544-P.
(d) Accept NUREG 0487. (d) Accept NUREG
0487.(d) Accept NUREG
~ 0487.
c. Wetwell air com-pression-use PSAHdescribed in NEDE-24544-P.
(e) No change from NUREG 0487. (e) Accept NUREG 0487. (e) Accept NUREG (3) Accept NUREG
0487. 0487.
f. Drywell pressurehistory-uniquebased on NEDH-10320.
(f) No change from NUREG 0487. (f) Accept NUREG 0487. (f) Accept NUREG (f) Accept NlJREG
0487. 0487.
2. Loads on SubmergedBoundaries. Haximumbubble prcssure pre-dicted by PSAH is tobe added uniformly to
No change from NUREG 0487. Accept NUREG 0487. Accept NUREG 0487. Accept NUREG 0487.
Rov. 9, 07/85
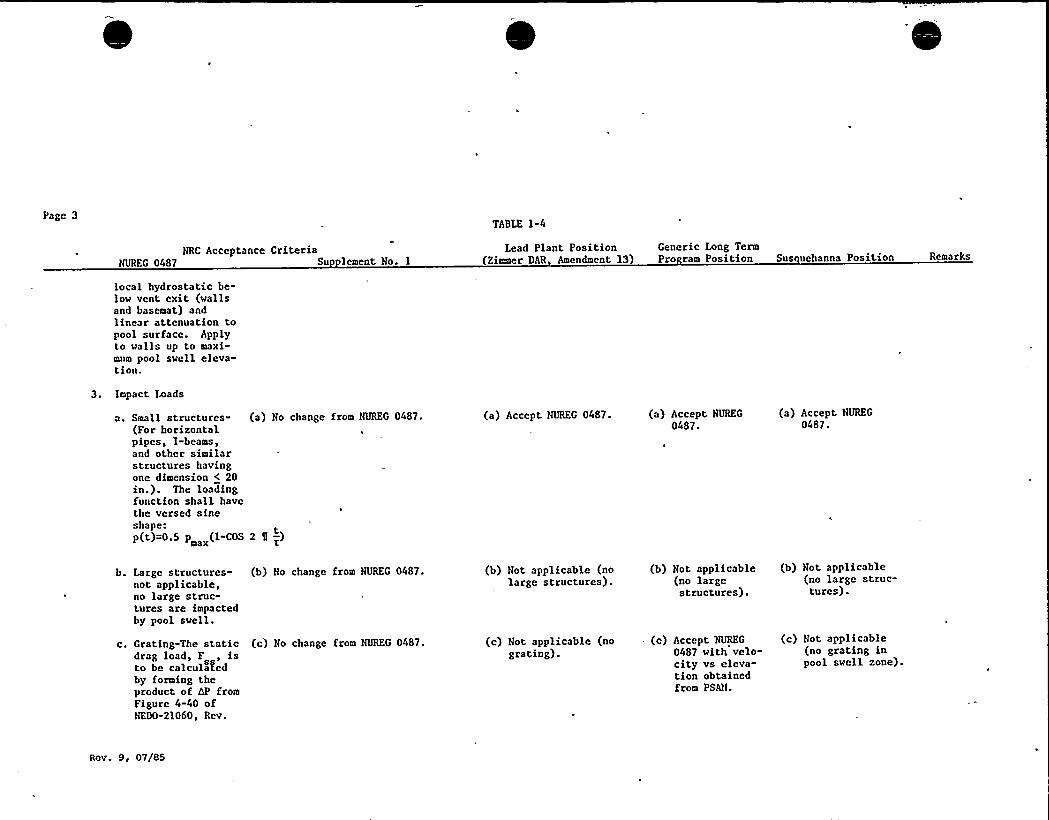
Page 3TABLE 1-4
NRC Acceptance CriteriaNUREG 0487 Su lement No. 1
Iead Plant Position Generic Long Term(Zimmer DAR Amendment 13) Pro ram Position Sus uehanna Position Remarks
local hydrostatic be-low vent exit (wallsand basemat) andlinear attenuation topool surface. Applyto walls up to maxi-mum pool swell eleva-tion.
3. Impact Loads
a. Small structures-(For horizontalpipes, I-beams,and other similarstructures havingone dimension < 20in.). The loadingfunction shall havethe versed sineshape:p(t)=0.5 p (1-COS
max
(a) No change from NUREG 0487.
2U-)tr
(a) Accept NUREG 0487. (a) Accept NUREG
0487.(a) Accept NUREG
0487.
b. Large structures-not applicable,no large struc-tures are impactedby pool swell.
c. Grating-The staticdrag load, F , isto be calculatedby forming theproduct of AP fromFigure 4-40 ofNED0-21060, Rev.
(b) No change from NUREG 0487.
(c) No change from NUREG 0487.
(b) Not applicable (nolarge structures).
(c) Not applicable (nograting).
(b) Not applicable(no largestructures).
(c) Accept NUREG
0487 with velo-city vs eleva-tion obtainedfrom PSAN.
(b) Not applicable(no large struc-tures).
(c) Not applicable(no grating inpool swell zone).
Rov. 9, 07/85

0
Page 4
NRC Acceptance CriteriaNUREG 0487 Su lement No. 1
TABLE 1-4
Iead Plant Position Generic Iong TermPro ram Position Sus uehanna Position Remarks
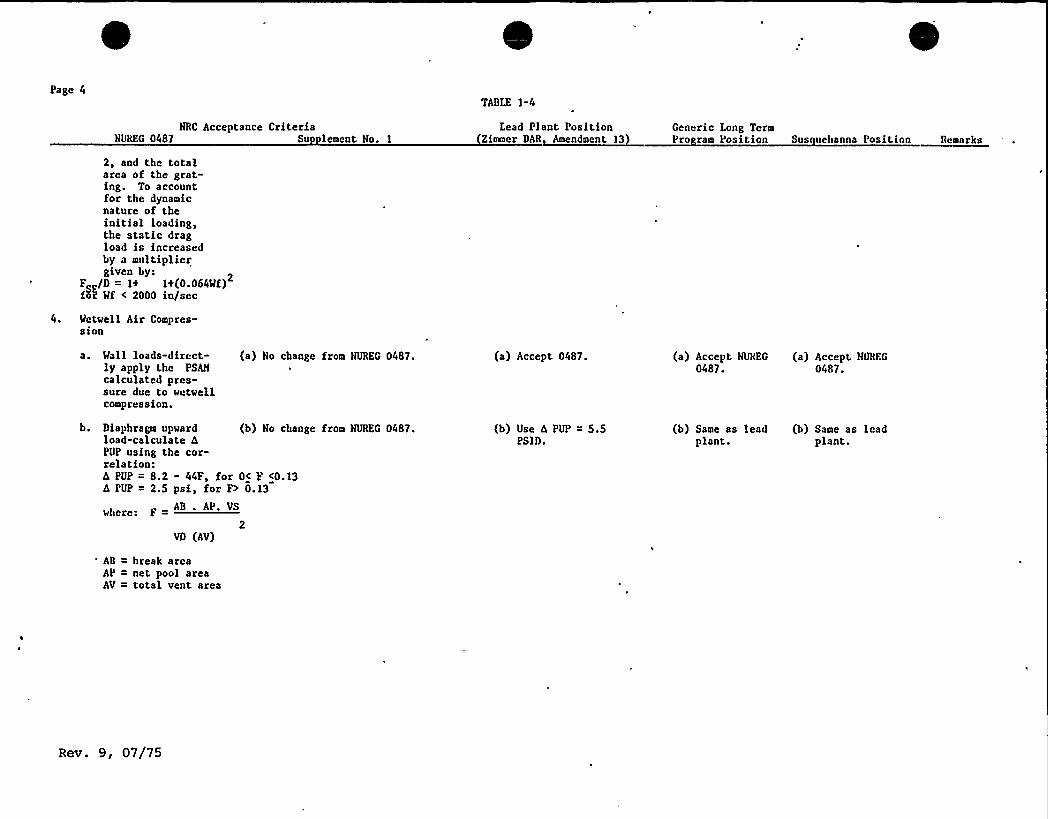
2, and the totalarea of the grat-ing. To accountfor the dynamicnature of theinitial loading,the static dragload is increasedby a multipliergiven by:
FS /D = I+ I+(0.064Wf)fok Wf < 2000 in/sec
4. Wetwell Air Compres-sion
a. Wall loads-direct-ly apply the PSALM
calculated pres-sure due to wetwellcompression.
(a) No change from NUREG 0487. (a) Accept 0487. (a) Accept NUREG (a) Accept. NORFG0487. 0487.
(b) No change from NUREG 0487.
AB . AP. VS
2VD (AV)
AB = break areaAP = net pool areaAV = total vent area
b. Diaphragm upwardload-calculate 4PUP using the cor-relation:A PUP = 8.2 - 44F, for 0< F <0.13A PUP = 2.5 psi, for F> 0.13
(b) Use 4 PUP = 5.5PSID.
(b) Same as lead (b) Same as leadplant. plant.
Rev. 9, 07/75

Page 5TABLE 1-4
NUREC 0487NRC Acceptance Criteria
Su lement No. 1
Lead Plant Position(Zimmer DAR, Amendment 13)
Generic Long TermPro rnm Position Sus »ehnnna Posicion Remarks
VS initial wetwell air spacevolume
VD ~ drywall volume
5. Asymmetric Load.Apply the maximumair bubble pressurecalculated from PSAMand a minimum airbubble pressure (zeroincrease) in a worstcase distribution tothe wetwell wall.
Use twice the 10X of maximum bubblepressure statically applied to 1/2of the submerged boundary (withhydrostatic pressure) proposed inMarch 16, 1979 letter from GE.
Accept NUREC 0487-Supple- Accept NUREG 0487- Accept NUREG 4087-ment No. l. Supplement No. 1 Supplement No. l.
C. Steam Condensation andChugging Loads.
1, Downcomer LateralLoads.
a. Single vent loads:-A static equiva-lent load of 8.8KIPs shall beused provided:
(i) the downcomer is24» in diameter.
(ii) che downcomer dom-inant natural fre-quency is < 7 Nz,submerged.
(iii) the downcomer isunbrace<l or bracedat or aboveapprox. 8'romthe exit.
(a) No change from NUREG 0487. (a) Accepc NUREC 0487. (a) Use single vent (a)dynamic lateralload developedunder Task A-13(NEDE-24106-P) ~
llowever, extra-
polnte the 30Kip and 3 msecimpulse to65 Kips and 3 msec.
Following longterm program.Confirmationthrough plantunique CKM-IlM
tesc data onlateral bracingloads.
Sce DAR,Subsec-tion 9.6.3for verifi-cation of
lnternl tipload.
Rev. 9, 07/85
Page 6TABLE 1-4
NRC Acceptance CriteriaHUREG 0487 Su lement No. 1
Iead Plant Position Generic Long TermZimmer BAR Amendment 13) Pro ram Position Sus uehanna Position Remarks
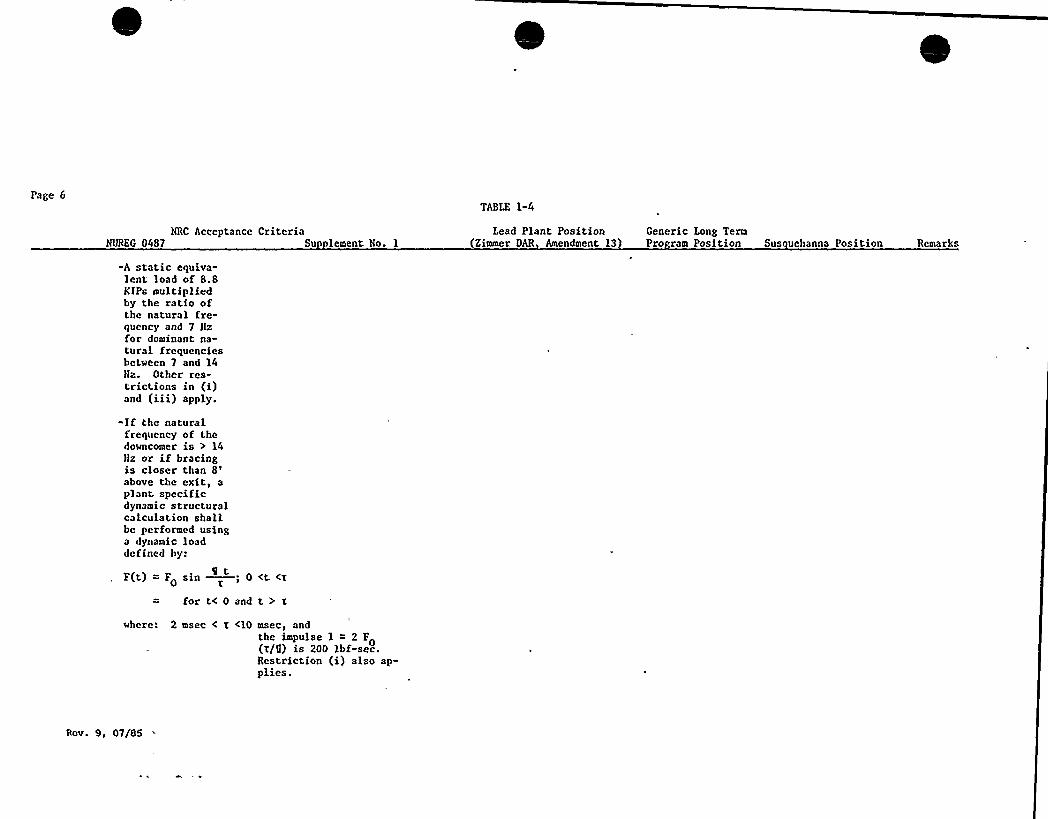
-A static equiva-lent load of 8.8Kips multipliedby the ratio ofthe natural fre«quency and 7 Hzfor dominant na-tural frequenciesbetween 7 and 14Ha. Other res-trictions in (i)and (iii) apply.
-If the naturalfrequency of thedowncomer is > 14flz or if bracingis closer than
8'bovethe exit, aplant, specificdynamic structuralcalculation shallbc performed usinga dynamic loaddefined by:
F{t) = F sin —0 <t <t1l t0
for t<0and t>twhere: 2 msec < t <10 msec, and
the impulse I = 2 FO(r/8) is 200 lbf-sec.Restriction (i) also ap-plies.
Rov. 9, 07/85
Page 7TABLE 1-4
NRC Acceptance CriteriaNUREG 0487 Su lement No. 1
Lead Plant Position Generic Iong Term(Zimmer DAR Amendment 13 Pro ram Position Sus uehanna Position Remarks
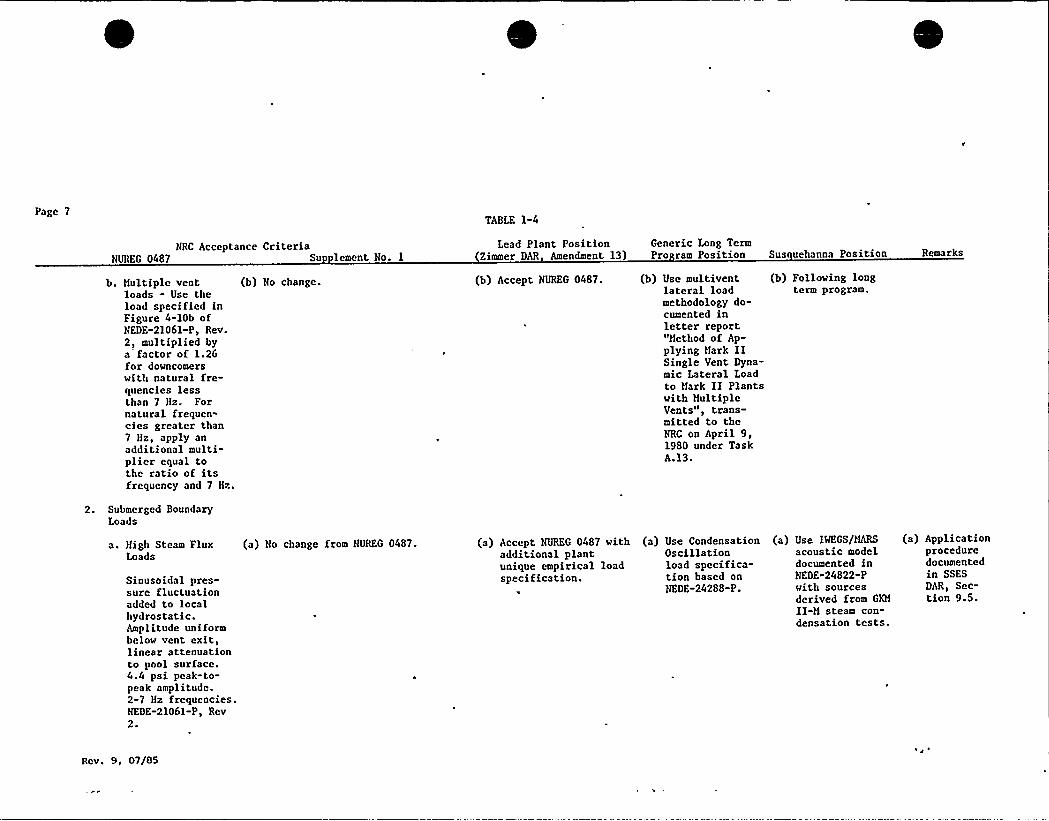
b. Multiple ventloads - Use theload specified inFigure 4-10b ofNEDE-21061-P, Rev.2, multiplied bya factor of 1.26for downcomerswith natural fre-quencies lessthan 7 Nz. Fornatural frequen-cies greater than7 Nz, apply anadditional multi-plier equal tothe ratio of itsfrequency and 7 Hz.
(b) No change. (b) Accept NUREG 0487. (b) Use multiventlateral loadmethodology do-cumented inletter report"Hethod of Ap-plying Hark IISingle Vent Dyna-mic Lateral Loadto Hark II Plantswith MultipleVents", trans-mitted to theNRC on April 9,1980 under TaskA.13.
(b) Following longterm program.
2. Submerged BoundaryI.oads
a. High Steam Flux (a) No change from NUREG 0487.Loads
Sinusoidal pres-sure fluctuationadded to localhydrostatic.Amplitude uniformbelow vent exit,linear attenuationto pool surface.4.4 psi peak-to-peak amplitude.2-7 Hz frequencies.NEDE-21061-P, Rev2.
(a) Accept NUREG 0487 withadditional plantunique empirical loadspecification.
(a) Use CondensationOscillationload specifica-tion based onNEDE-24288-P.
(a) Use IWEGS/MARSacoustic modeldocumented inNEDE-24822-Pwith sourcesderived from GKH
II-H steam con-densation tests.
(a) Applicationproceduredocumentedin SSES
DAR, Sec-tion 9.5.
Rov. 9, 07/85
Page 8TABLE 1-4
HRC Acceptance CriteriaHUREG 0487 Su lement No. 1
Iead Plant PositionZimmer DAR Amendment 13)
Generic Long TermPro ram Position Sus uehanna Position Remarks
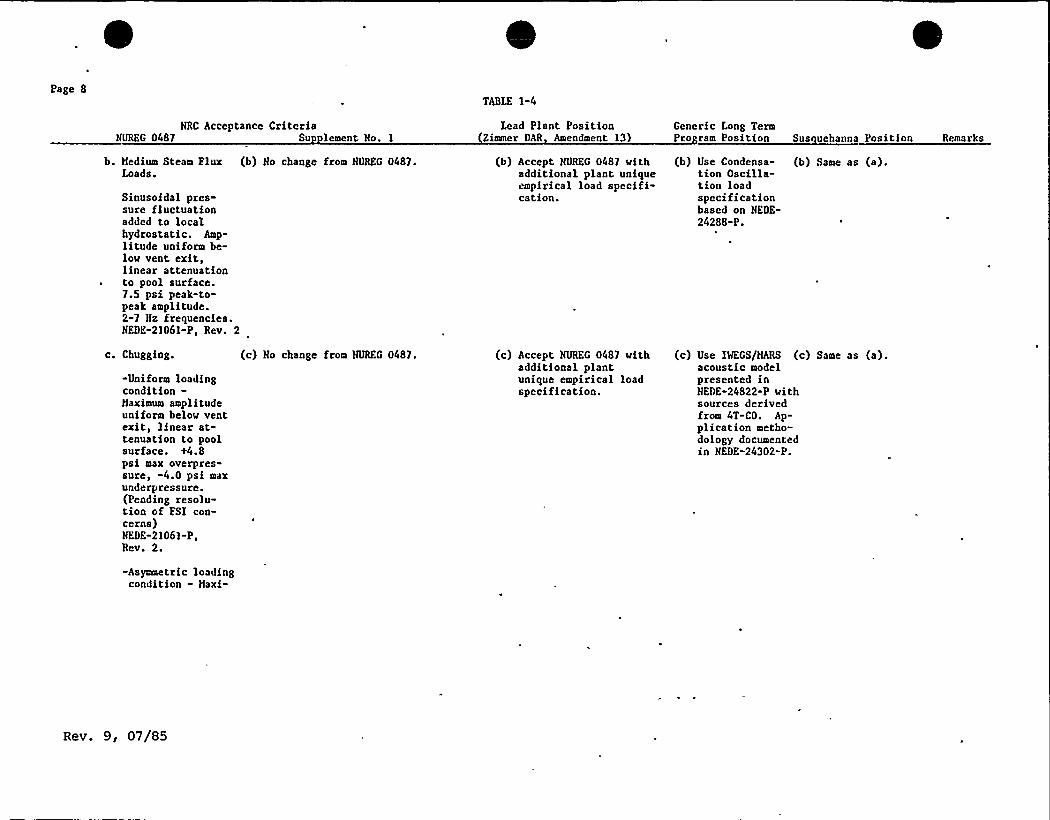
b. Hedium Steam Plux (b) No change from NUREG 0487.Loads.
Sinusoidal pres-sure fluctuationadded to localhydrostatic. Amp-litude uniform be-low vent exit,linear attenuationto pool surface.7.5 psi peak-to-peak amplitude.2-7 Hz frequencies.NEDE-21061-P, Rev. 2
(b) Accept NUREG 0487 withadditional plant uniqueempirical load specifi-cation.
(b) Use Condensa-tion Oscilla-tion loadspecificationbased on NEDE"24288-P.
(b) Same as (a).
c. Chugging.
-Uniform loadingcondition-Haximum amplitudeuniform below ventexit, linear at-tenuation to poolsurface. +4.8psi max overpres-sure, -4.0 psi maxunderpressure.(Pending resolu-tion of FSI coa-cerns)HEBE-21061-P,Rev. 2.
(c) No change from NUREG 0487. (c) Accept NUREG 0487 withadditional plantunique empirical loadspecification.
(c) Use IMEGS/HANS (c) Same as (a).acoustic modelpresented inHEBE-24822-P withsources derivedfrom 4T-CO. Ap-plication metho-dology documentedin NEDE-24302-P.
-Asymmetric loadingconditioa - Haxi-
Rev. 9, 07/85
Page 9TABLE 1-4
NRC Acceptance CriteriaNUREG 0487 Su lement No. 1
Lead Plant PositionZimmer DAR Amendment 13
Generic Long TermPro ram Position Sus uehanna Position Remarks
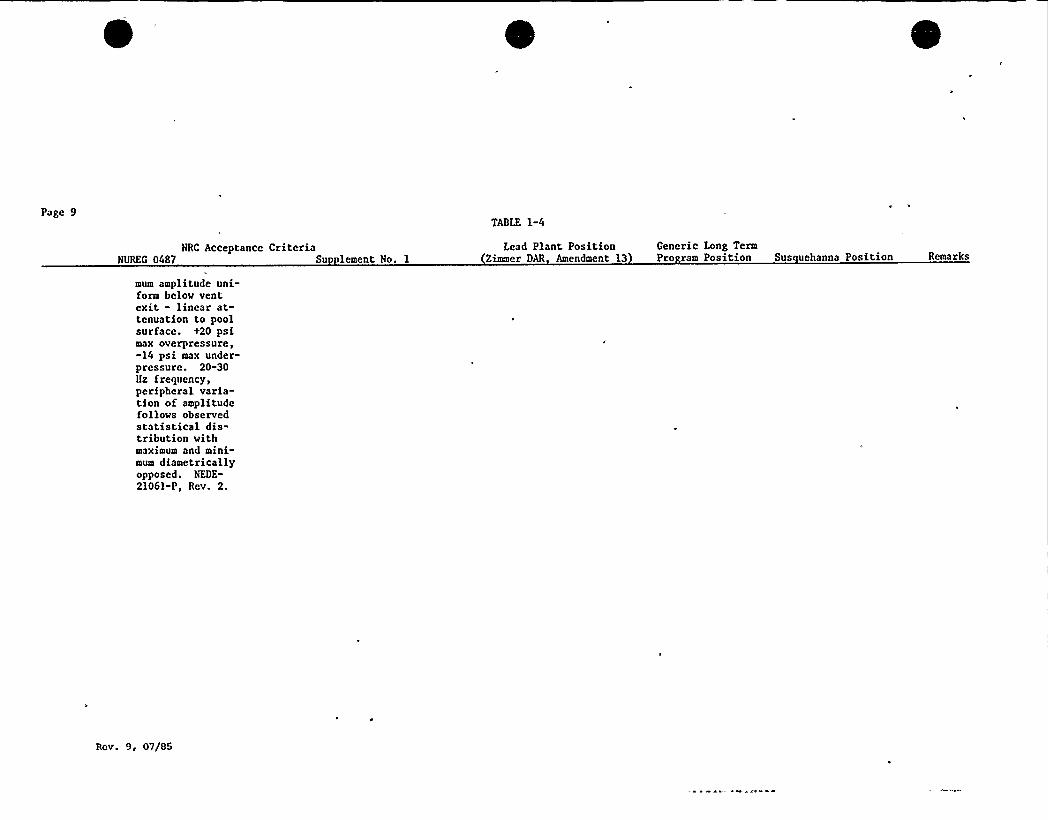
mum amplitude uni-form below ventexit - linear at-tenuation to poolsurface. +20 psimax overpressure,-14 psi max under-pressure. 20-30Nz frequency,peripheral varia-tion of amplitudefollows observedstatistical dis-tribution withmaximum and mini-mum diametricallyopposed. NEDE-21061-P, Rev. 2.
Rev. 9, 07/85
Page 10TABLE 1-4
NRC Acceptance CriteriaNUREG 0487 Su lement No. 1
II. SRV-REINED lfYDRODYNAMICiuwns
Lead Plant PositionZimmer DAR Amendment 13)
Generic Long TermPro ram Position Sus uehanna Position Remarks
A. Pool Temperature Limits
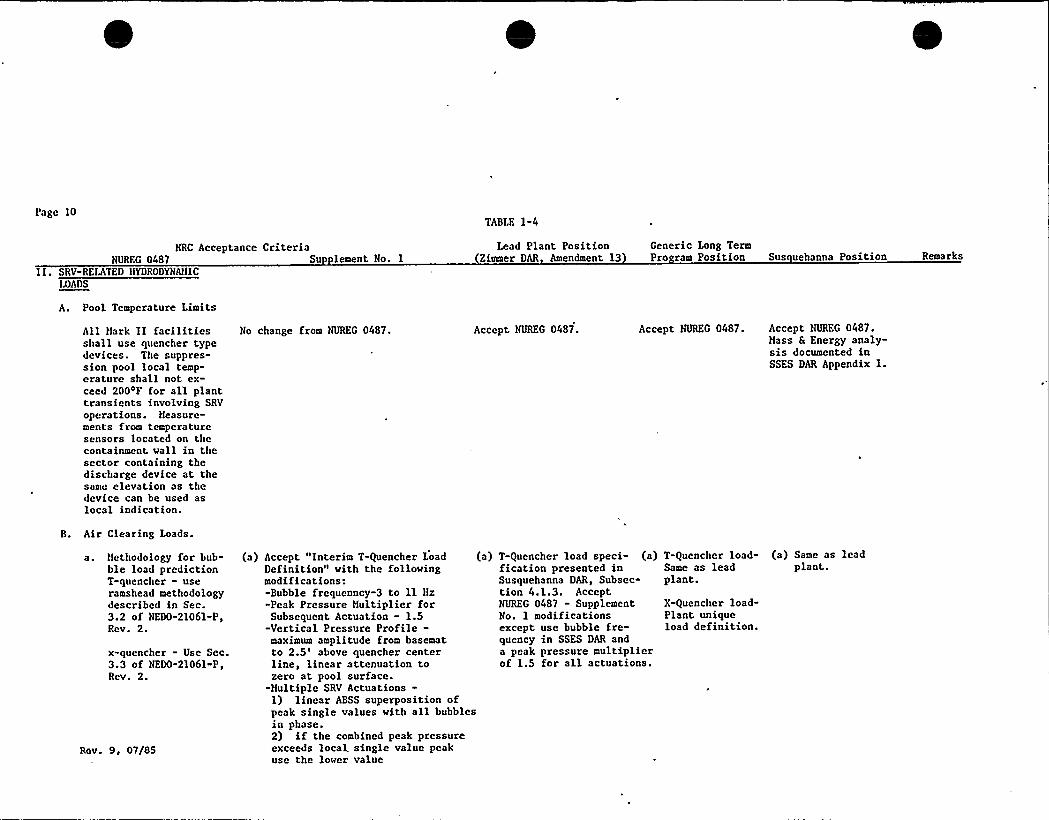
All Hark Il facilitiesshall use quencher typedevices. The suppres-sion pool local temp-erature shall not ex-ceed 200 F for all planttransients involving SRVoperations. Heasure-ments from temperaturesensors located on thecontainment. wall in thesector containing thedischarge device at thesame elevation as thedevice can be used aslocal indication.
No change from NUREG 0487. Accept NUREG 0487. Accept NUREG 0487. Accept NUREG 0487.Mass 8 Energy analy-sis documented inSSES DAR Appendix l.
B. Air Clearing Loads.
a. Methodology for bub-ble load predictionT-quencher - useramshead methodologydescribed in Sec.3.2 of NED0-21061-P,Rev. 2.
x-quencher - Use Sec.3.3 of NED0-21061-P,Rcv. 2.
Rev. 9, 07/85
(a) Accept "Interim T-Quencher Load (a)Definition" with the followingmodifications:-Bubble frequenncy-3 to 11 Hz-Peak Pressure Multiplier forSubsequent Actuation - 1.5
-Vertical Pressure Profile-maximum amplitude from basematto 2.5'bove quencher centerline, linear attenuation tozero at pool surface.
-Multiple SRV Actuations-1) linear ABSS superposition ofpeak single values with all bubblesin phase.2) if the combined peak pressureexceeds local single value peakuse the lower value
T-Quencher load speci- (a)fication presented inSusquehanna DAR, Subsec-tion 4.1.3. AcceptNUREG 0487 - SupplementNo. 1 modificationsexcept use bubble fre-quency in SSES DAR anda peak pressure multiplierof 1.5 for all actuations.
T-Quencher load- (a) Same as leadSame as lead plant.plant.
X-Quencher load-Plant uniqueload definition.
Page 11TABLE 1-4.
NRC Acceptance CriteriaNUREG 0487 Su lement No. 1
Iead Plant PositionZimmer DAR Amendment 13)
Generic Long TermPro ram Position Sus uehanna Position Remarks
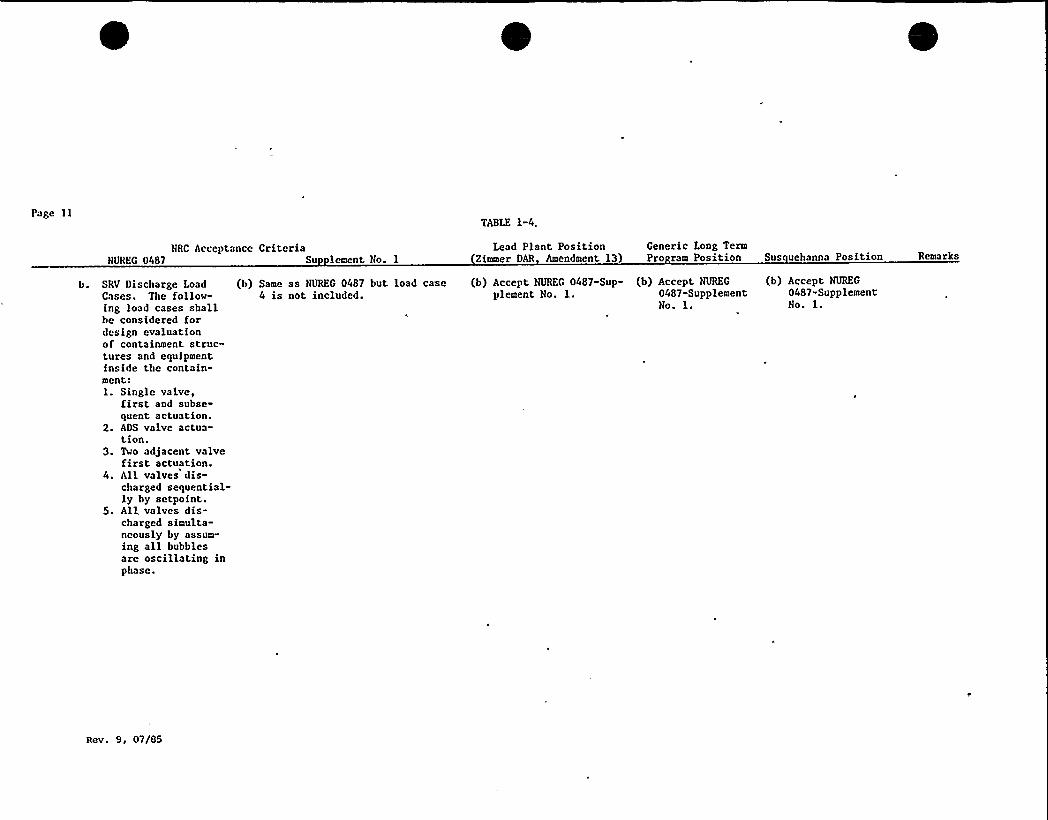
b. SRV Discharge LoadCases. The follow-ing load cases shallbe considered fordesign evaluationof containment struc-tures and equipmentinside the contain-ment:1. Single valve,
first and subse-quent actuation.
2. ADS valve actua-tion.
3. Two adjacent valvefirst actuation.
4. All valves dis-charged sequential-ly by setpoint.
5. Allvalves dis-charged simulta-neously by assum-ing all bubblesare oscillating inphase.
(b) Same as NUREG 0487 but load case4 is not included.
(b) Accept NUREG 0487-Sup- (b) Accept NUREG
plement No. l. 0487-SupplementNo. l.
(b) Accept NUREG0487-SupplementNo. l.
Rov. 9, 07/85
Page 12TABIE 1-4
NRC Acceptance CriteriaNUREG 0487 Su lement No. 1
Iead Plant PositionZimmer DAR Amendment 13
Generic Long TermPro ram Position Sus uehanna Position Remarks
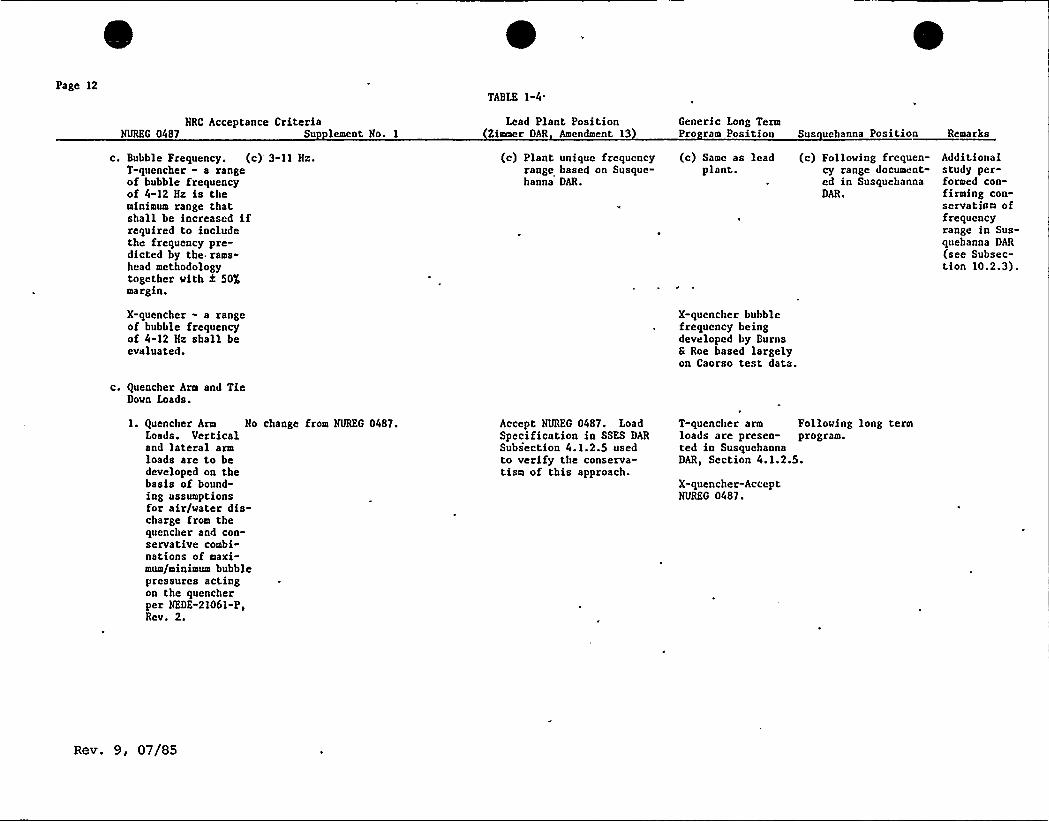
c. Bubble Frequency. (c)'-11 Hz.T-quencher - a rangeof bubble frequencyof 4-12 Hz is theminimum range thatshall be increased ifrequired to includethe frequency pre-dicted by the rams-head methodologytogether with 2 50Xmargin.
(c) Plant unique frequencyrange based on Susque-hanna DAR.
(c) Same as leadplant.
(c) Following frequen"cy range document-ed in SusquehannaDAR.
Additionalstudy per-formed con-firming con-servatism offrequencyrange in Sus-quehanna DAR(see Subsec-tion 10.2.3).
X-quencher - a rangeof bubble frequencyof 4-12 Hz shall beevaluated.
X-quencher bubblefrequency beingdeveloped by BurnsS Roe based largelyon Caorso test data.
c. Quencher Arm and TieDown Loads.
l. Quencher Arm No change from NUREG 0487.Ioads. Verticaland lateral armloads are to bedeveloped on thebasis of bound-ing assumptionsfor air/water dis-charge from thequencher and con-servative combi-nations of maxi-mum/minimum bubblepressures actingon the quencherper HEDE-21061-P,Rev. 2.
Accept NUREG 04B7. LoadSpecification in SSES DARSubsection 4.1.2.5 usedto verify the conserva-tism of this approach.
T-quencher arm Following long termloads are presen- program.ted in SusquehannaDAR, Section 4.1.2.5.
X-quencher-AcceptNUREG 0487.
Rev. 9, 07/85
Page 13TABLE 1-4
NRC Acceptance CriteriaNUREG 04g7 Su lement No. 1
Lead Plant Position(Zimmer DAR Amendment 13
Generic Long TermPro ram Position Sus uehanna Position Remarks
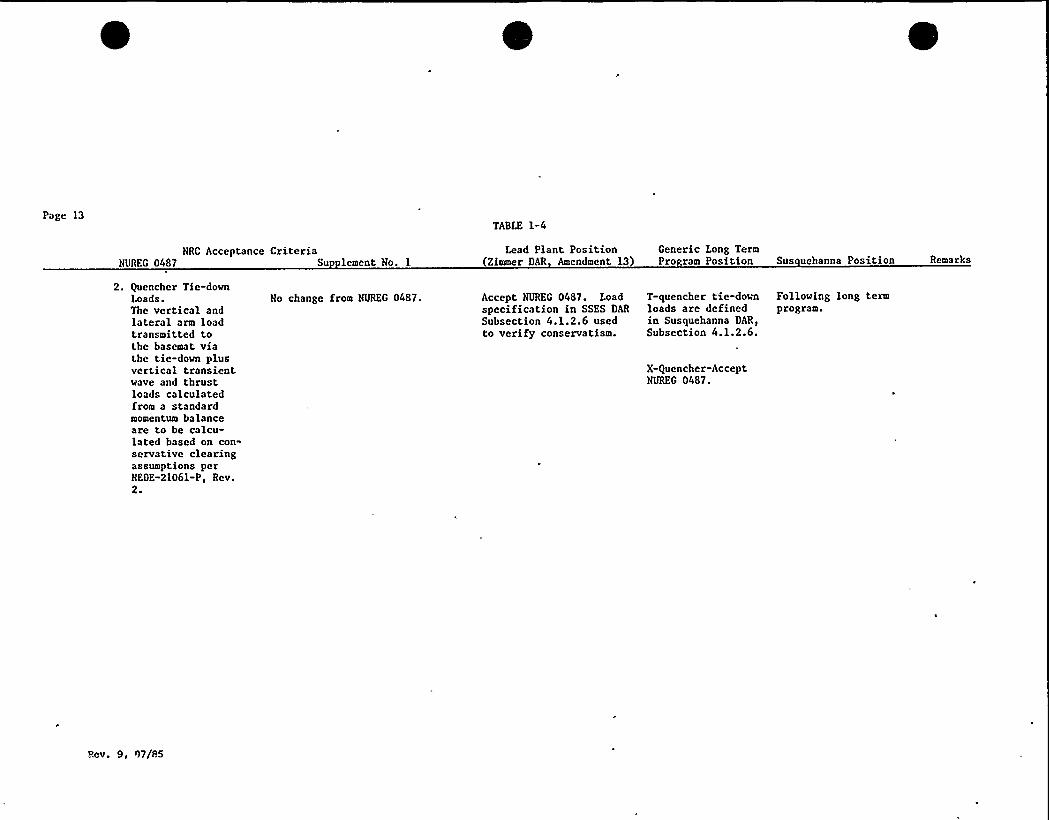
2. Quencher Tie-downLoads.The vertical andlateral arm loadtransmitted tothe basemat viathe tie-down plusvertical transientwave and thrustloads calculatedfrom a standardmomentum balanceare to be calcu-lated based on con-servative clearingassumptions perNEDE-21061-P, Rev.2.
No change from NUREG 0487. Accept NUREG 0487. Loadspecification in SSES DAR
Subsection 4.1.2.6 usedto verify conservatism.
T-quencher tie-downloads are definedin Susquehanna DAR,Subsection 4.1.2.6.
X-Quencher-AcceptNUREG 0487.
Following long termprogram.
Rev. 9, 07/85
Page 14TABLE 1-4
NRC Acceptance CriteriaNUREG 0487 Su lement No. 1
Iead Plant Position Generic Long TermZimmer DAR Amendment 13) Pro ram Position Sus uehanna Position Remarks
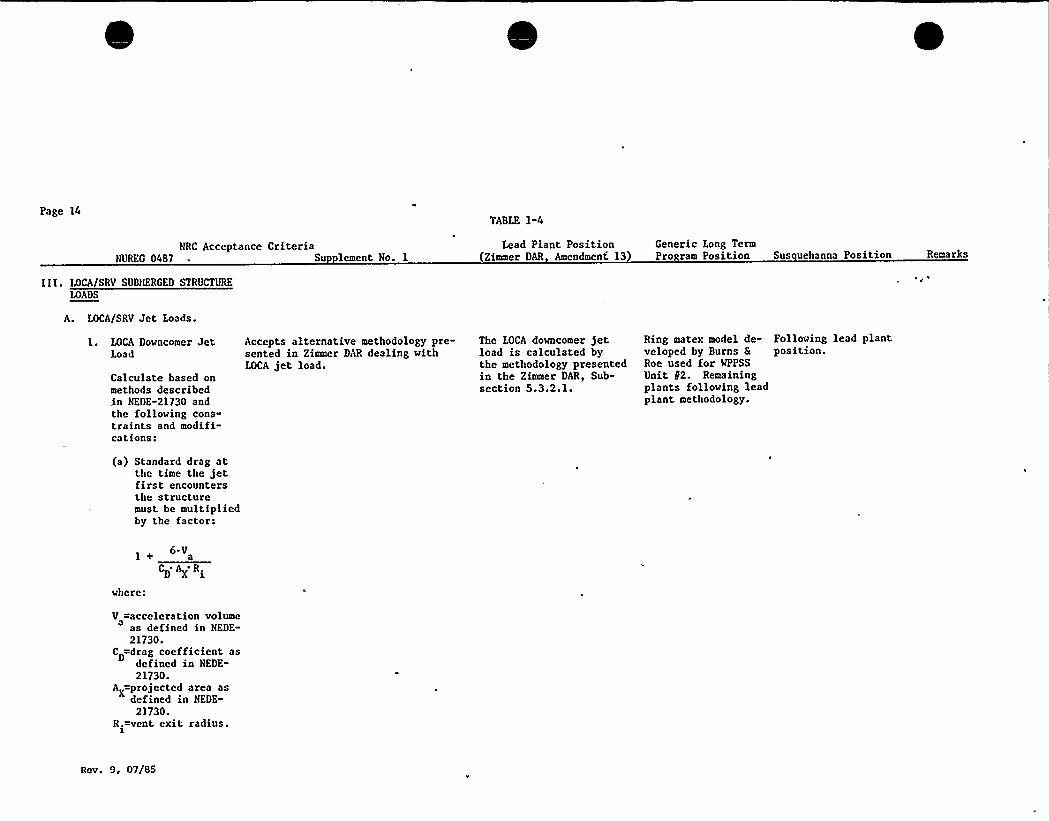
III. LOCA/SRV SUBHERGED STRUCTURE
LOADS
A. LOCA/SRV Jet Loads.
1. LOCA Downcomer JetLoad
Calculate based onmethods describedin HEBE-21730 andthe following cons-traints and modifi-cations:
Accepts alternative methodology pre-sented in Zimmer DAR dealing withLOCA jet load.
The IOCA downcomer jetload is calculated bythe methodology presentedin the Zimmer DAR, Sub-section 5.3.2.1.
Ring matex model de- Following lead plantveloped by Burns S position.Roe used for WPPSS
Unit 92. Remainingplants following leadplant methodology.
(a) Standard drag atthe time the jetfirst encountersthe structuremust be multipliedby the factor:
where:
6.V
CD AE R.
V =acceleration volumea as defined in NEDE-
21730.C =drag coefficient as
D defined in NEDE-21730.
A =projected area asX defined in HEDE-
21730.R.=vent exit radius.I
Rov. 9, 07/85
Page 15TABLE 1-4
NRC Acceptance CriteriaNDRFG 0487 Su lement No. 1
Lead Plant Position Generic Long Term(Zimmer DAR Amendment 13) Pro ram Position Sus uehanna Position Remarks
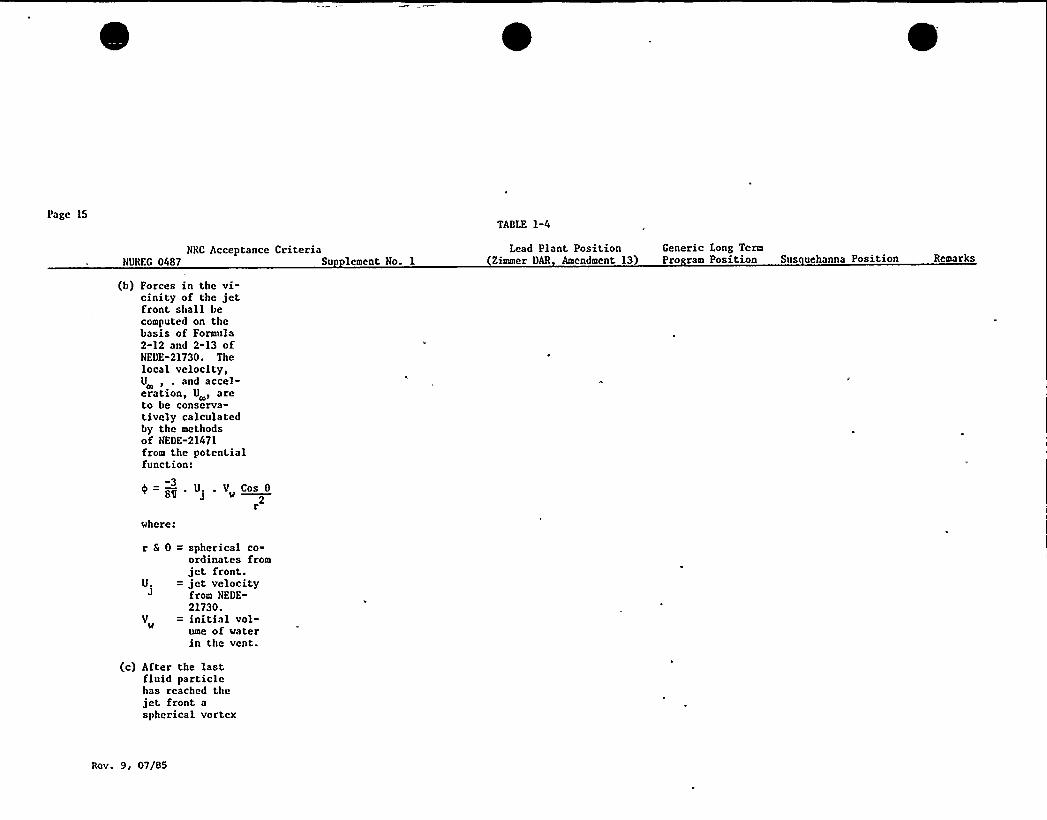
(b) Forces in the vi-cinity of the jetfront shall becomputed on thebasis of Formula2-12 and 2-13 ofNEDE-21730. Thelocal velocity,U , . and accel-eration, U , areto be conserva-tively calculatedby the methodsof NEDE-21471from the potentialfunction:
U V C 08%' w—2r
where:
U.j
spherical co-ordinates fromjet front.jet velocityfrom NEDE-21730.initial vol-ume of waterin the vent.
(c) After the lastfluid particlehas reached thejet front aspherical vortex
Rov. 9, 07/85
Page 16TABLE 1-4
NRC Acceptance CriteriaNUREG 0487 Su lement No. 1
Lead Plant Position(Zimmer DAR Amendment 13
Generic Long TermPro ram Position Sus uehanna Position Remarks
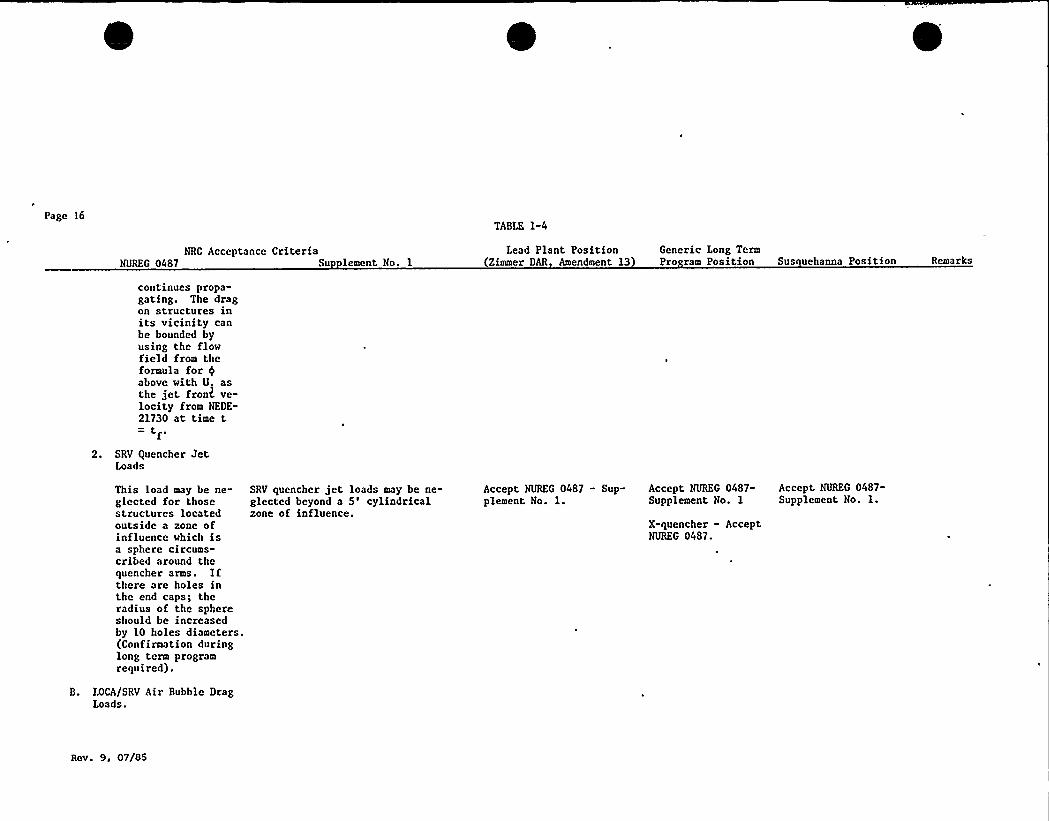
continues propa-gating. The dragon structures inits vicinity canbe bounded byusing the flowfield from theformula for gabove with U. asthe jet fronk ve-locity from NEDE-21730 at time t
tf'.
SRV Quencher JetLoads
This load may be ne-glected for thosestructures locatedoutside a zone ofinfluence which isa sphere circums-cribed around thequencher arms. Ifthere are holes inthe end caps; theradius of the sphereshould be increasedby 10 holes diameters.(Confirmation duringlong term programrequired).
SRV quencher jet loads may be ne-glected beyond a 5'ylindricalzone of influence.
Accept NUREG 0487 - Sup-plement No. l.
Accept NUREG 0487-Supplement No. 1
X-quencher - AcceptNUREG 0487.
Accept NUREG 0487-Supplement No. l.
B. D)CA/SRV Air Bubble DragLoads.
Rev. 9, 07/85
Page 17TABLE 1-4
NRC Acceptance CriteriaNUREG 0487 Su lement No. 1
I,ead Plant Position(Zimmer DAR Amendment 13)
Generic Iong TermPro ram Position Sus uehanna Position Remarks
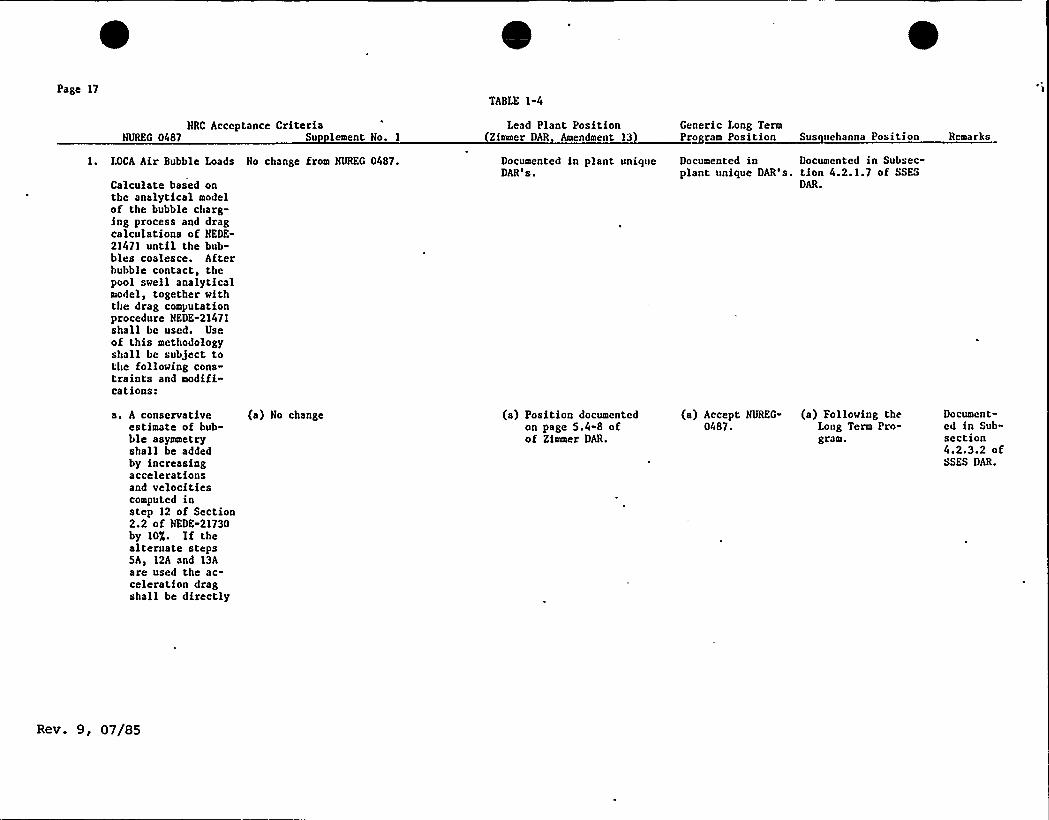
1. LOCA Air Bubble loads No change from NUREG 0487.
Calculate based onthe analytical modelof the bubble charg-ing process and dragcalculations of NEDE-21471 until the bub-bles coalesce. Afterbubble contact, thepool swell analyticalmodel, together withthe drag computationprocedure NEDE-21471shall be used. Useof this methodologyshall be subject tothe following cons-traints and modifi-cations:
Documented in plant unique Documented in Documented in Subsec-DAR's. plant unique DAR's. tion 4.2.1.7 of SSES
DAR.
a. A conservativeestimate of bub-ble asymmetryshall be addedby increasingaccelerationsand velocitiescomputed instep 12 of Section2.2 of NEDE-21730by 10'. If thealteruate steps5A, 12A and 13Aare used the ac-celeration dragshall be directly
(a) No change (a) Position documentedon page 5.4-8 ofof Zimmer DAR.
(a) Accept NUREG-0487.
(a) Following theLong Term Pro-gram.
Document-ed in Sub-section4.2.3.2 ofSSES DAR.
Rev. 9, 07/85
Page 18
TABLE 1-4
NRC Acceptance CriteriaNUREG 0487 Su lement No. 1
Lead Plant Position(Zimmer DAR Amendment 13
Generic Long TermPro ram Position Sus uehanna Position Remarks
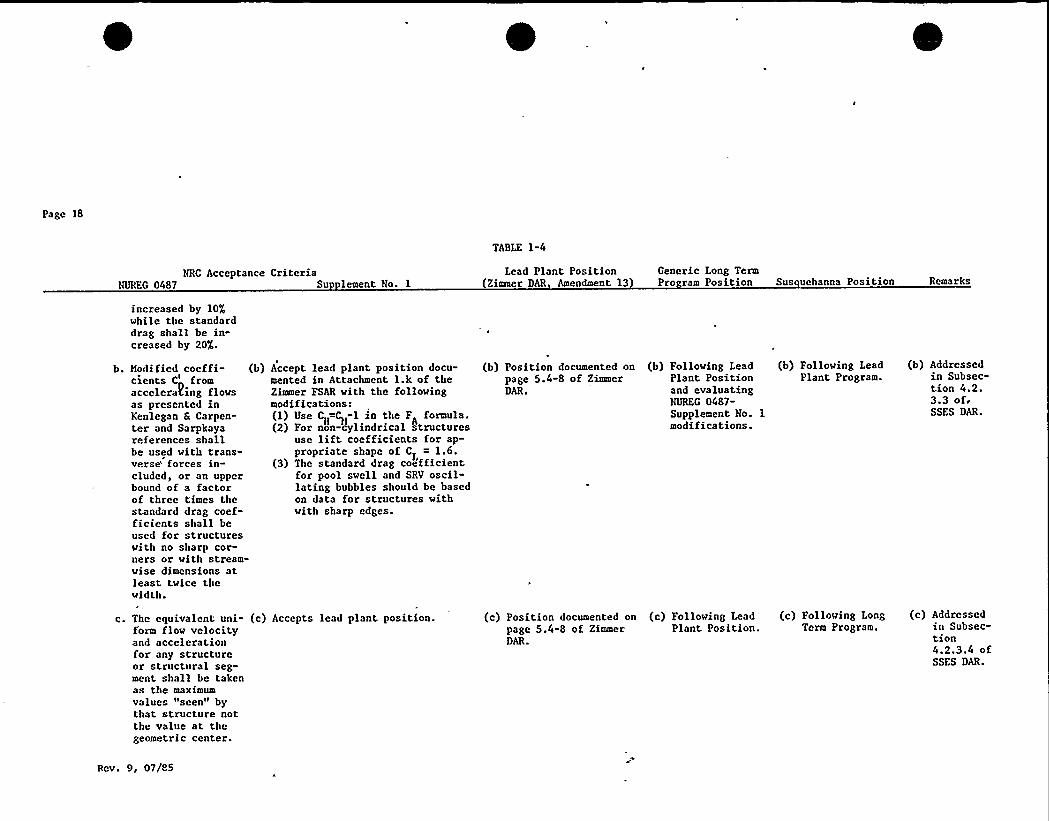
increased by 10$while the standarddrag shall be in-creased by 20X.
b. Hodified coeffi- (b)cients C'romaccelerating flowsas presented inKenlegan S Carpen-ter and Sarpkayareferences shallbe used with trans-verse'orces in-cluded, or an upperbound of a factorof three times thestandard drag coef-ficients shall beused for structureswith no sharp cor-ners or with stream-wise dimensions atLeast twice thewidth.
Accept lead plant position docu-mented in Attachment l.k of theZimmer FSAR with the followingmodifications:(1) Use C„=C -1 in the F formula.(2) For non-cylindrical structures1 .. A
use liftcoefficients for ap-propriate shape of CL = 1.6.
(3) The standard drag coefficientfor pool swell and SRV oscil-lating bubbles should be basedon data for structures withwith sharp edges.
(b) Position documented on (b) Following Leadpage 5.4-8 of Zimmer Plant PositionDAR. and evaluating
NUREG 0487-Supplement No. 1modifications.
(b) Following LeadPlant Program.
(b) Addressedin Subsec-tion 4.2.3.3 of.SSES DAR.
c. The equivalent. uni- (c)form flow velocityand accelerationfor any structureor structural seg-ment. shall be takenas the maximumvalues "seen" bythat structure notthe value at thegeometric center.
Accepts lead 'plant position. (c) Position documented on (c) Following Leadpage 5.4-8 of Zimmer Plant Position.DAR.
(c) Following LongTerm Program.
(c) Addressedin Subsec-tion4.2.3.4 ofSSES DAR.
Rev. 9, 07jo5
Page 19
TABLE 1-4
NRC Acceptance CriteriaNUREG 0487 Su lement No. 1
Lead Plant Position(Zimmer DAR Amendment 13)
Generic Long TermPro ram Position Sus uehanna Position Remarks
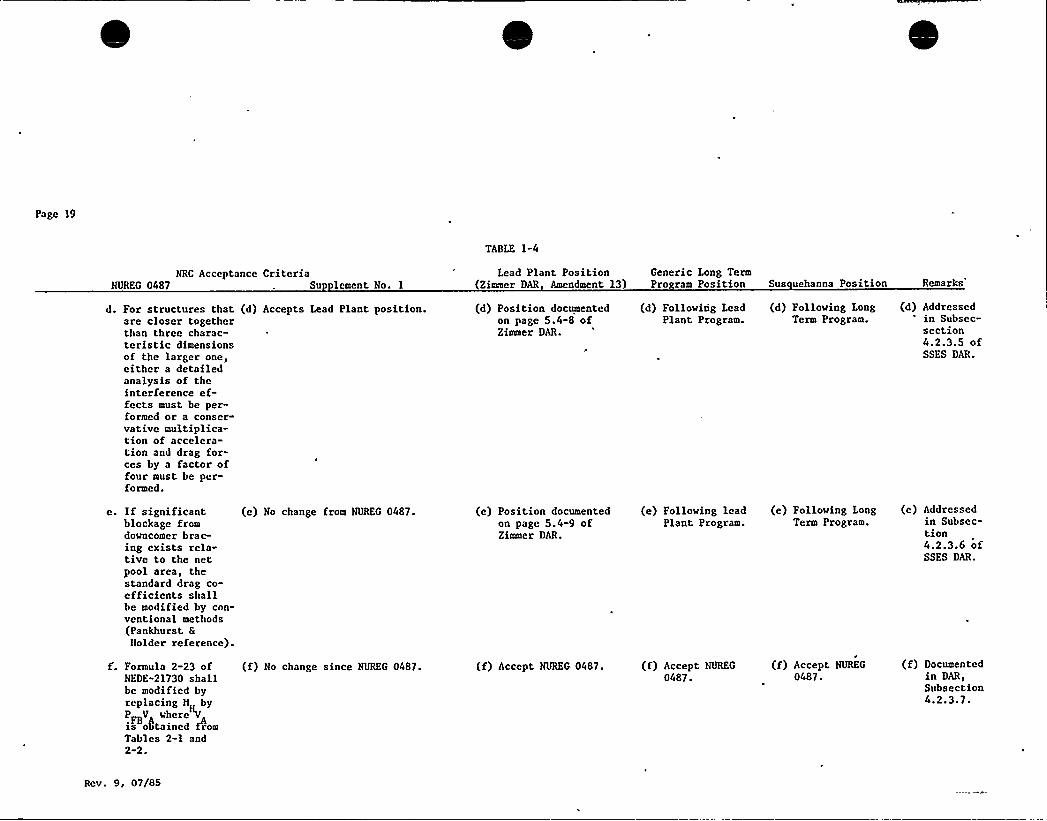
d. For structures thatare closer togetherthan three charac-teristic dimensionsof the larger one,either a detailedanalysis of theinterference ef-fects must be per-formed or a conser-vative multiplica-tion of accelera-tion and drag for-ces by a factor offour must be per-formed.
(d) Accepts Lead Plant position. (d) Position documentedon page 5.4-8 ofZimmer DAR.
(d) Following LeadPlant Program.
(d) Following LongTerm Program.
(d) Addressedin Subsec-section4.2.3.5 ofSSES DAR.
e. If significantblockage fromdowncomer brac-ing exists rela-tive to the netpool area, thestandard drag co-efficients shallbe modified by con-ventional methods(Pankhurst 8Nolder reference).
(e) No change from NUREG 0487. (e) Position documentedon page 5.4-9 ofZimmer DAR.
(e) Following leadPlant Program.
(e) Following IongTerm Program.
(e) Addressedin Subsec-tion4.2.3.6 ofSSES DAR.
f. Formula 2-23 ofNEDE-21730 shallbe modified byreplacing H byPF V„ where Vis obtained fromTables 2-1 and2-2.
(f) No change since NUREG 0487. (f) Accept NUREG 0487. (f) Accept NUREG (f) Accept NUREG (f) Documented0487. 0487. in DAR,
Subsection4.2.3.7.
Rev. 9, 07/85
Page 20TABlE 1-4
NRC Acceptance CriteriaHUREG 0487 Su lement No. 1
Lead Plant PositionZimmer DAR Amendment 13
Generic Long TermP ur Po 'ti*n nn y eh n a P s t'on he arts
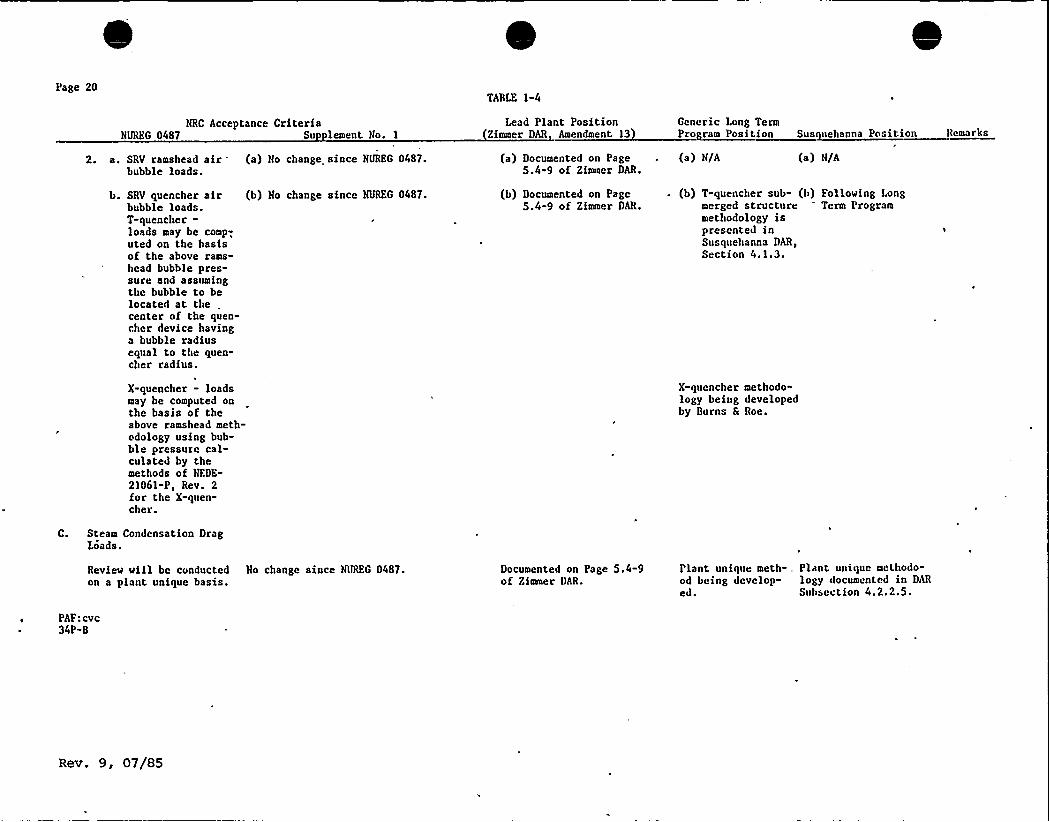
2. a. SRV ramshead air (a) Ho change since NUREG 0487.bubble loads.
(a) Documented on Page5.4-9 of Zimmer DAR.
(a) N/A (a) H/A
b. SRV quencher airbubble loads.T-quencher-loads may be comp-uted on the basisof the above rams-head bubble pres-sure and assumingtlun bubble to belocated at the .center of the quen-cher device havinga bubble radiusequal to the quen-cher radius.
(b) No change since NUREG 0487. (b) Documented on Page5.4-9 of Zimmer DAR.
(b) T-quencher sub- (b) FolloMing Longmerged structure Term Programmethodology ispresented inSusquehanna DAR,Section 4.1.3.
X-quencher - loadsmay be computed onthe basis of theabove ramshead meth-odology using bub-ble pressure cal-culated by themethods of NEDE-21061-P, Rev. 2for the X-quen-cher.
X-quencher methodo-logy being developedby Burns gi Roe.
C. Steam Condensation DragLoads.
RevieM vill be conducted No change since NUREG 0487.on a plant unique basis.
Documented on Page 5.4-9of Zimmer UAR.
Plant unique meth- . Plant unique mcthodo-od being develop- logy documented in DAR
ed. Subsection 4.2.2.5.
PAP:cvc34P-B
Rev. 9, 07/85
CHAPTER 2
SUMMARY
TABLE OP CONTENTS
2.1
2-2
LOAD DEFINITION SUMMARY
2. 1. 1 SHV Load Definition Summary
2. 1.2 LOCA Load Definition Summary
DESIGN ASSESSMENT'UMMARY
2.2.1 Containment Structure and ReactorBuilding Assessment S ummar y
2.2. 1.1 Containment Structure Assessment Summary
2 2. 1.2 Reactor Building Assessment Summary
2.2.2 Containment Submerged StructuresAssessment Summary
2.2..3 Piping Systems AssessmentSummary
2. 2. 0 Equipment Assessment Summary
2.2.5 Electrical Raceway SystemAssessment Summary
2.2.6 HVAC Duct System Assessment Summary
Re v. 9, 07/85 2-1
2 0 ~ SGiIMARY
This Desiqn Assessment Report contains the SSZS adequacyevaluation for dynamic'oads due to LOCA and SRY discharge.
Rev 9, 07/85 2-2
2. 1 - LOAD DEFINITION SOiNNARY
2 1.1 SRV Load Def inition Sum~mar
Hydrodynamic loads zesulting from SRV actuation fall into twodistinct cateqozies: loads on the SRV system itself (thedischarge line and the discharge quencher device), a~d the airclearinq loads on the suppression pool walls and submergedstructures..Loads on the SRV system during SRV actuation include loads oa theSRV piping due to effects of steady backpressure, transient waterslug clearing and SRV line tempezature. Determination of loadingon the quencher body, arms, and support is based on transientsresultinq from valve openinq (water clearing and air clearing),valve closinq and operation of an adjacent quencher.
Aiz clearinq loads are examined for four loading cases:symmetric (all valve) SRV actuation, asymmetric adjacent SRVactuation, single SRV actuation, and Automatic DepzessurizationSystem (ADS-six valves) actuation. Dynamic forcing functions forloadinq 'of the containment walls, pedestalq basemat, andsubmezged structures are developed using techniques developed inSection 4.1. 'Loads on the SRV system due to SHV actuation arediscussed in Subsection 4.1.2, and loads on suppression poolstructures due to SRV actuation are discussed in Subsection4.1.3., A full scale, unit cell test program was employed toverify SSES unique SHV loadinq as described in Chapter 8.
2.1.2 -LOCA Load Definition Summary
The spectrum of LOCA-induced loads on the SSES containmentstructure is characterized by LOCA loads associated withpoolswell, condensation oscillation, and chugging loads, as wellas long term LOCA loads.
The LOCA loads associated with poolswell result from shortduration transients and include downcomer clearing loads, waterjet loads, poolswell impact and drag loads, pool fallback dragloads,'oolswell air bubble loads, and loads due to drywell andwetwell temperature and pressure transients. Techniques used toevaluate these loads are described in Subsection 4.2.1.
Condensation oscillations result from mixed flow (aiz/steam) andpure steam flow effects in the suppression pool. Chugging loadsresult from low mass, flux puze steam condensation. The loaddefinitions for these phenomena are contained in Subsection4 2 2
Lonq term LOCA loads result from those wetwell and drywellpressure and temperature transients which are associated withdesi qn basis accidents (DBA), intermediate accidents (IBA), andsmall break accidents (SBA). Their load definitions arecontained in Subsection 4 2. 5.
Rev. 9, 07/85 2-3
Structures directly affected by LOCA loads include the drywellwalls and floor, wetwell walls, RPV pedestal, basemat, linerplate, columns, downcomers, downcomer bracing system, quenchers,and wetwell piping. Their loading conditions are described inSubsection 4 2. 6.
9ev. 9, 07/85 2-4
D1;SIGN ASSESSMENT SUMMARY
Design assessment of the SSES structures and components isachieved by analyzinq the response of the structures andcomponents to the load combinations explained in Chapter 5. InChapter 7 predicted stresses and responses (from the loadsdefined in Chapter 0 and combined as described in Chapter 5) arecompared with the apolicable code allowable values identified inChapter 6 and the SSES design will be assessed as adequate byvirtue that the design capabilities exceed the stresses orresponses resulting from SRV discharge and/or LCCA loads.
2.2 1 Containment Structure and Reactor Building AssessmentSummarv
2 2. 1 1 Containment Structure AssessmentSumma'he
primary containment walls, base slab, diaphragm slab, reactorpedestal and reactor shield are analyzed for the effects of SRVand LOCA in accordance with Table 5-1. The AthSYS finite elementpzoqzam is used foz the dynamic analysis of structuzes.
Response spectra curves are developed at various locations withinthe containment structure to assess the adequacy of components.Stress resultants due to dynamic loads are combined with otherloads in accordance with Table 5-1 to evaluate zebar and concretestresses. Design safety margins are defined by comparing theactual concrete and rebar stresses at critical sections with thecode allowable values. The assessment methodology of thecontainment structure is presented in Subsection 7.1.1.1.
The results of the structural assessment of the containmentstructure are summarized in Appendix A. The results sho w thatthe reinforcinq bar desiqn stresses and the concrete designstresses are below the allowable stresses
2 2,1.2 - reactor Building gssessmen t Summary
The reactor building is assessed for the effects of SRV and LOCAloads in accordance with Table 5-1.
Containment basemat acceleration time histories are used toinvestiqate the reactor buildinq response to the SRV and LOCAloads. Response spectra curves at various reactor buildingelevations aze used to assess the adequacy cf components in thereactor building. The assessment methodology of the reactorbuildinq is presented in Subsection 7. 1. 1. 2.
The results of the structural assessment of the reactor buildingare summarized in Appendix E. The results show that thereinforcing bars and concrete design stresses as well as thestructural steel desiqn stresses are below the allowablestresses.
Rev 9, 07/85
2. 2 2 Containment Submerged Structures Assessment Summary
Desiqn assessment of the suppression chamber columns includesnon-hydrodynamic as well as hydrodynamic loads. Subsection7.1.2.2 describes the methodology used to evaluate the columns.The results are presented in Figure A-59 and indicate a minimumdesign margin of 11.4X.
The downcomers are dynamically analyzed per Subsection 7.1.4 forthe load combinations given in Table 5-3. A summary of thestresses under various load combinations are given in Figure A-66and indicates that the minimum design margin is 14% when theloads are combined by ABS and 50% when the loads are combined bySRSS
Results from the analysis of the suppression pool liner plateindicate that no structural mod,ifications are required (seeSub sec t ion 7. 1. 3 and 7. 2. 1. 5)
The original downcomer and SRV bracinq system has been redesignedso that the downcomers and SRV discharge lines are now supportedby separate bracing systems. The SRV discharge lines aresupported hy bracing connected to the columns, while thedowncomers aze braced together by a truss system, but noconnections exist at the containment or pedestal wall.Subsections 7.1.2.1 and 7.1.2.2 document the evaluation of thedowncomer and SRV discharge line bracing systems, respectively.
Fiqure A-67 presents the SRV support system's maximum stressesand design marqins, while Figures A-60 and A-61 show the. designmarqins for the downcomer bracinq system members and connections,respectively. All stresses are acceptable.
2,2 3,-BQ2 End NSSS 2~iin~~Sstem Assessment Su~mmar
All Seismic Cateqory I BOP and NSSS piping are analyzed for ther.OCA and SPV hydrodynamic loads and non-hydrodynamic loads perSubsections 7.1.5 and 7.1.6 1 1, respectively. Appendix F givesthe stresses and design margins for selected BOP piping systems.
The stress zeports for the above evaluation are available for HRCreview.
2,2 4 .~a~and NSSS. ESuiNment Assessment Summary
All Seismic Category 'I BOP and'SSS equipment aze evaluated forthe hydrodynamic and non-hydrodynamic loads per the SSES SeismicQualification Review Team (SQRT) Progzam. For each equipmentPurchase Order, 4-page SQRT summary forms are prepareddocumentinq the qualification results.These SQRT summary forms aze available for NRC review.
Rev. 9, 07/85 2-6
2.2 5 Plectrical Bacewa~System Assessment Summary
Seismic Category X electrical raceway systems in the containment,reactor systems and control building are assessed by the methodscontained in Subsection 7.1.8. Loads are combined as shown inTable 5-6. As a result of static and dyna mic a nalysis, it wasdetermined that high stresses resulted in certain members of afew support types. These structural members were strengthened orreplaced by stronger members to reduce the stresses below theallowables.
2.2,6 -gVAC Duct ~S stem AssessmentSumma'eismic
Category I HVAC duct system in the containment, reactorbuildinq and control building are assessed by the methodscontained in Subsection 7.1.9. Loads are combined as shown inTable 5-2. As a result of structural analysis, it was found thata few structural members had high stresses but most of themembers had adequate marqin of safety. The overstressed memberswere strengthened or replaced by stronger members to ensure anadequate ma rqin of safety.
Rev. 9. 07/85 2-7
CHAPTER 3
SRV DISCHARGE AND Z.OCA TRANSIENTDESCRIPTION
TABLE OF CONTENTS
3 1 DESCRIPTION OF SAFETY REIIEF VALVEDISCHA RGE
3.1.1312
Causes of SRV DischargeDescription of the SRV DischargePhenomena and SRV Loading Cases
3 2 DESCR IPTION OF LOSS-OF-COOLANT ACCIDENT
3-2-1 .3- 2- 2.3 2 3
Small Break Accident (SBA)Intermediate Break Accident (IBA)Design Basis Accident (DBA)
Rev. 9, 07/85 3-1

3 0 SH V DISCHARGE AND LOCA TRANSIENT DESCRIPTION
The purpose of this section is to provide a description of theSRV discharqe and LOCA events.
A quantitative descriptioa of specific SRV and LOCA related, loadsfor SSES is presented in Sections 4.1 and 4.2 respectively.
Rev. 9 07/85 3-2
3 -1 DESCRIPTION OF SAFETY RFLIEF VALVE DISCHARGE
Susquehanna Unit 1 (and 2) is equipped with a safety reliefsystem which condenses reactor steam in a suppression chamberpool. By this arrangement, reactor steam is conduc ted to thewetwell via fast acting safety relief valves and quencherequipped discharqe lines. This section discusses the causes ofSRV discharqe, describes the SRV discharge process, andidentifies the resultant SRV discharge actuation cases.
3 1 1 Causes of SRV Discharge
During certain reactor operatinq transients, the SRVs may beactuated (by pressure, by electrical signal, or by operatoraction) for rapid relief of pressure in the reactor pressurevessel. The following reactor operating transients have beenidentif ied as those which may result in SRV actuation:
a. Turbine qenerator trip {with bypass or without)
b. Hain steam line isolation valve (HSIV) closure
c. Loss of condenser vacuum
d. Feedw ater controller failuree. Pressure regulator failure — closed
f. Generator load re jection (with and without bypass)
q. Loss of ac or auxiliary power
h. Loss of feedwater flow
i. Trip of two recirculation pumps
Recirculation flow control failuze — decreasing .flow
k. Inadvertent safety relief valve opening
1. Control Rod withdrawal errorm. Anticipated Transient Mithout Scram (ATMS)
A detailed descziption of these transients is provided inSection 15.2 of the FSAR.
3.1.2 Description of the SRV Discharge Phenomena and SRV- J,og,dyne Cases
Before an individual safety relief valve opens, the water levelin the discharge line is approximately equal to the water levelin the pool. As a valve opens, steam flows into the dischargeline air space between the valve and the water column and mixeswith the aiz (see detailed evaluation in. Chapter 3 of Reference
Rev. 9, 07/85 3-3
1, pages 6-12 through 6-14) . Since the downstream portion of thedischarqe line contains a water slug and does not allow. animmediate steam'ischarge into the pool, the pressure inside theline increases. The increased pressure expels the water slugfrom the SRV discharqe line and quencher. The magnitude of thewater cleari'nq pressure is primarily influenced by the steam flowrate throuqh the valve, the degree to which entering steam iscondensed along the discharge line walls, the volume of thedischarge line aizspace, and the volume of the ~ater slug to beaccelerated.
The clearing of water is followed by an expulsion of the enclosedair-steam volume. The exhausted gas fozms an oscillating systemwith the surrounding water, where the gas acts as the spring andthe water acts as the mass. This oscillatinq system is thesource of short term air clearinq loads.
As the air-steam mixture oscillates in the pool it also risesbecause of buoyancy and eventually breaks through the pool watersurface at which time air clearing loads cease. 8hen all the aizleaves the safety relief system, steam flows into the suppressionpool throuqh the quencher holes and condenses. The SSES guenchezdesiqn assures stable condensation even with elevated pool watertern pera ture.The SRV actuation cases resultinq from the transients listed inSubsection 3.1. 1 are classified, as being one of the followingcases:
a. Symmetric (all valve, or AOT) discharqe
b. Asymmetric discharge, including single valve discharge
c. Au tomatic Depressurization System (ADS) discharge
Also considered in the containment design is the effect ofsubsequent SRV actuations (second-pop), discussed in Subsection4 1 3 6
The symmetric discharge case t'otherwise termed the all-valve, orabnormal operating transient {AOT) case] is classified as thetype of SRV discharqe that would follow rapid isolation of thevessel fzom the turbine such as turbine trip, closure of allMSZVs, loss of condenser vacuum, etc. As pressure builds upfollowinq isolation of the vessel, the SRVs actuate sequentiallyaccordinq to the pressure set points of the valves., This may ormay not result in actuation of all the SRVs, but for conservatismin loading considerations all valves are assumed to actuate.Refer to Subsection 4.1.3.1 for discussion of the loads resultingfrom this all-valve case.
Asymmetzic discharge is defined as the firinq of the SRVs foz the.three adjacent quencher devices which results in the greatestasymmetric pressure loading on the containment. This situationis hypot'hesized when, followinq a reactor scram and isolation of
Rev. 9 ~ 07/85 3-4
the vessel, decay heat raises vessel pressure so that low setpoint valves actuate. If, during this time of discharge of decayheat enerqy, manual actuation of the two other adjacent SRVs thatcomprise the asymmetric case is assumed, this actuation wouldresult in the maximum asymmetric pressure load on thecontainment. Subsection 4.1.3.2 qives a discussion of the loadsresultinq from the asymmetric discharge case.
The single valve dischazqe case is classified as the firing ofthe SRV which gives the sinqle lazgest hydrodynamic load.Transients that could potentially initiate such a case are aninadvertent SRV discharge or Desiqn Basis Accident (DBA). Referto Subsection 3.2.3 for a discussion of the lattez possibility.Subsection 4.1.3.2.1 provides a discussion of the loads resultingfrom the sinqle valve c'ase.
The ADS discharge is defined as the simultaneous a'ctuation of thesix SRVs associated with the ADS. See Figure 1-4 for thelocation of the quencher devices associated with the ADS valves.The ADS is assumed to actuate during an Intermediate BreakAccident (IBA) or Small Break Accident (SBA) . If'n ADSdischarge is hypothesized coincident to an IBA cz SBA (describedin Subsections 3.2.2 and 3.2.1, respectively), the effects of anincreased suppression pool temperature (resulting from steamcondensation during the LOCA transient) and increased suppressionchamber pressure (resulting from cleazing of the drywell air intothe pool during the tzansient) are considered in the calculationof pzessure loadings for the AOS discharge case. See Subsection4.1.3 3 for further discussion of the loads resulting from theADS case.
Rev 9, 07/85 3-5
3 2 DESCRIPTION OP LOSS-OF-COOLANT ACCIDENT
This event involves the postula tion of a spectr um of pipingbzeaks inside the containment varyinq in size, type, and locationof the break. '.For the analysis of hydrodynamic loading s on thecontainment, the postulated LOCA event is identified as a SmallBreak Accident tSBA), an Intermediate Break Accident (IBA), or aDesiqn Basis Accident {DBA).
3 2 1 Small Br~ea! Accident gSBA)
This subsection discusses the containment transient associatedwith small primary system blowdowns. The primary system rupturesin this cateqory are those ruptures that will not result inreactor depzessurization from either loss of reactor coolant orautomatic operation of the ECCS equipment, i.e., those ruptureswith a break size less than 0.1 sq ft.The following sequence of events is assumed to occur. With thereactor and containment opezatinq at the maximum normalconditions, a small, break occurs that allows blowdovn of reactorsteam or water to the drywell. The resulting pressure increasein the drywell leads to a high dryvell pressure signal thatscrams the reactor and activates the containment isolationsystem. The'rywell pressure continues to increase at a ratedependent upon the size of the steam leak. The pressure increaselovers the water level in the downcomers. At this time, air andsteam enter the suppression pool at a rate dependent upon thesize of the leak Once all the drywell aiz is carried over tothe suppression chamber, pressurization of the suppressionchamber ceases and the system reaches an equilibrium condition.The drywell contains only superheated steam, and continuedblovdown of reactor steam condenses in the suppression pool. Theprincipal loading condition in this case is the graduallyincreasinq pressure in the drywell and suppression pool chamberand the loads related to the condensation of steam at the end ofthe vents.
~3.2 gntenaediate Break-dgc~dent g~BA
This subsection discusses the containment transient associatedvith intermediate primary system blovdovns. This classificationcovers breaks for which the blovdovn will result in limitedreactor depressuzization and operation of the ECCS, i.e., thebreak size is equal to or slightly qreater than 0.1 sq ft.Follovinq the break, the drywell pressure increases atapproximately 1.0 psi/sec. This dryvell pres ure transient issufficiently slow so that the dynamic effect of the water in thevents is negligible and the vents vill clear when the drywell-to-suppression chamber differential pressure is equal to thehydrostatic pressure corresponding to the vent submergence. Theresultinq pressure increase in the dryvell vill lead to a highdryvell pressure signal that vill scram the reactor and activatethe containment isolation system. Approximately S seconds after
Hev. 9, 07/85
the 0. 1 sq ft break occurs, air, steam, and water will start toflow from the drywell to the suppression pool; the steam will becondensed, a~d the air will rise to the suppression chamber freespace. The continual purging of dryvell air to the suppressionchamber vill result in a. gradual pressurization of both thewetwell and drywell. The FCCS vill be initiated by the break andwill provide emergency cooling of the coze. The operation ofthese systems is such that the reactor vill be depressurized inapproximately 600 seconds. This vill terminate the b'lowdownphase of the transient. The principal loading condition in thiscase vill be the qradually increasing pressure in the drywell andsuppression chamber and the loads related to the condensation ofsteam at the end of the vents.
3.2 3 Des~in Basis Accident QD~BA
An cccuzrence of events vhich could result in a DBA{instantaneous rupture of a main steam or recirculation line) is
a zemote possibility. Since such an accident provides an upperlimit estimate to the resultant effects for this category of pipebreaks, it is evaluated without the causes being identified. PozSusquehanna, an assumed instantaneous double-ended rupture of arecirculation line causes the maximum drywell pressure andtherefore the qoyerninq LCCA hydrodynamic loads.
The sequence of events immediately following the rupture of arecirculation line has been determined. A drywell high pressuresiqnal is almost instantaneously sensed, initiating a scram andcontainment'solation and signalinq the HPCI, CS and LPCI tostart. The flow in both sides of the break will accelerate tothe maximum allowed by the critical flow considerations. In theside adjacent to the suction nozzle, the flow vill ccrrespond tocritical flow in the pipe cross-section. In the side adjacent tothe injection nozzle, the flov vill correspond to critical flowat the 10 jet pump nozzles associated vith the ?roken loop. Inaddition, the cleanup line czoss-tie will add tc the criticalflow area. This high zate of flow out of the rupturedrecirculaticn line results in a drywell pressure rise ofapproximately 44 psiq in 14. 5 seconds (refer to TSAR Table 6.2-5and PSAR Figure 6 2-2) .
This rapid increase in dryvell pressure accelerates the waterinitially in the containment vent system out thrcugh the vents.Immediately follovinq vent water clearinq, an air/steam bubblesstart to form at the dovncomer exits. Initially, the bubblepressure is essentially equal to the current drywell pressure.As the flow of air/steam from the drywell becomes established inthe vent system, the initial vent exit bubble expands, thusaccelerating'pward the suppression pool water above the ventexits. The steam fraction of the flow is condensed, butcontinued injection of dryvell air and expansion of the airbubble results in a rapid rise in the suppression pool surfaceknov n a s pool s well.
Rev. 9, 07/85
Follcwing the pool swell and fallback, there is a period of h'igh-steam flow rate throuqh the containment vent system. For largeprimary system ruptures, reactor blowdown and, therefore, ventsteam condensation last for approximately 60 seconds.
Shortly af ter a DBA, the ECCS pumps (HPCI, CS, and LPCI)automatically start pumpinq condensate storage tank water orsuppression pool water into the reactor pressure vessel. Hithin40 seconds all the ECCS pumps are at rated flow. This floods thereactor core until water starts to cascade into the drywell fromthe break. The time at which this occurs would depend upon breaksize and location. Because the drywell would be full of steam atthe time of vessel floodinq, the sudden introduction of coldwater causes steam condensation and drywell depzessurization.Mhe'n the drywell pressure falls below the suppression chamberpressure, the dzywell vacuum relief system is actuated and airfrom the suppression chamber enters the drywell. Eventually,sufficient air returns to the drywell to equalize the pressures.Similarly, small differential pressures between the drywell andthe suppression chamber can be produced if the containment spraysystem is actuated, condensing steam in the drywell.Followinq the vessel flooding and drywell/suppression chamberpressure equalization phase of the accident, suppression poolwater will be continuously recirculated thzough the core by theECCS pumps. The energy associated with the core decay heat willresult in a slow heatup of the suppression pool. The suppressionpool temperature is controlled by the RHR heat exchangezs. Thecapacity of these heat exchangers is such that the maximumsuppression pool temperature increase is reached aftez sevezalhours. The suppression pool can experience a peak temperature ofapproximately 200~F under worst case conditions. The post LOCAcontainment heatup and pressurization transient is terminatedwhen the RHR heat exchangers reduce the pocl temperature andcontainment pressure to nominal values.
The primary loads on the containment generated by a DBA are thepressure build-ups in the drywell and suppression chamber, andthe loads resulting from the various modes of steam condensationat the vent ends. The hiqh rate of system depressurizationresulting from a DBA militates aqainst the firing of an SRV;however, for conservatism a single SRV discharge is consideredcoincident with the DBA for containment structural loadingpurposes.
Rev. 9, 07/85 3-8
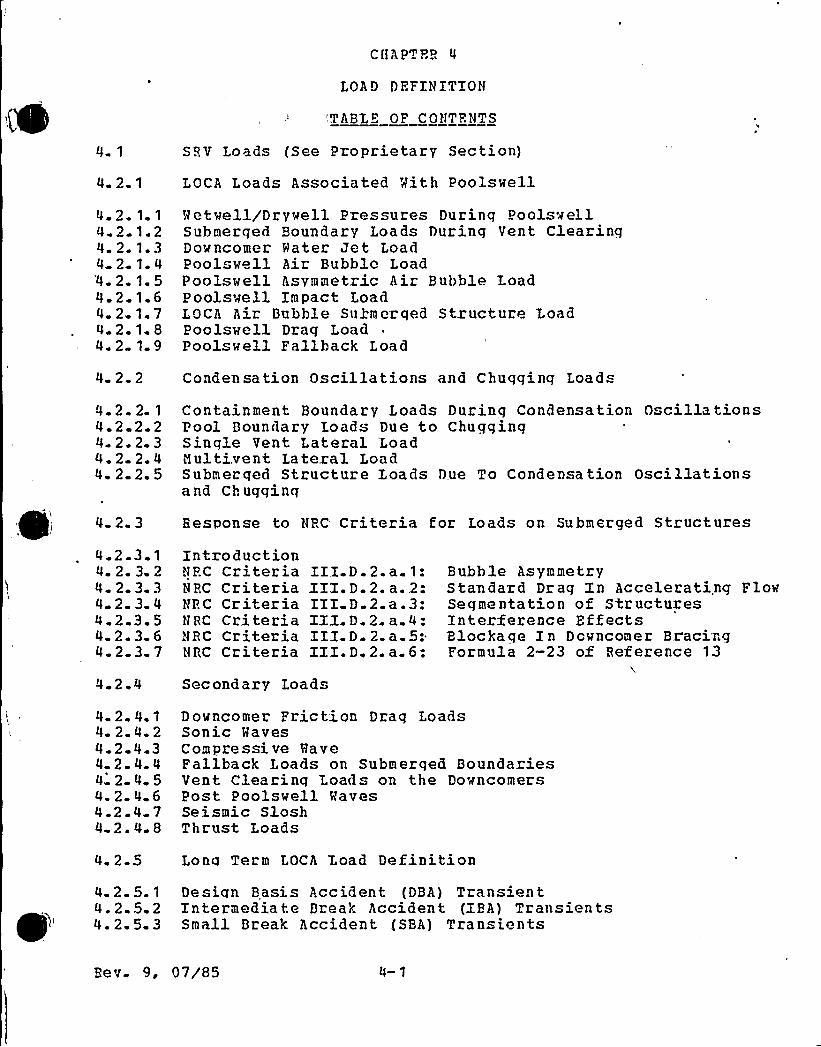
CHAPTHR
LOAD DFFINITIOH
'TABLE OF CONTENTS
4 1
4 2.1
SRV Loads (See Proprietary Section)
LOCA Loads Associated Mith Poolswell
4 2 1 1
2 1.24. 2 1.34 2.1.44.2.1.54.2.1.64 2 1.74.2.1. 84.2.1.9
Metwell/Drywell Pressures During PoolswellSubmerged Boundary Loads During Vent ClearinqDowncomer Mater Jet LoadPoolswell Air Bubblo LoadPoolswell Asymmetric Air Bubble IoadPoolswell Impact LoadLOCA Air Bubble Sulmerqed Structure LoadPoolswell Drag LoadPoolswell Fallback Load
4 2 2
2 2.14.2 2 2
2 2 34. 2.-2. 44. 2.2.5
4 2 3
Condensation Oscillations and Chuqqinq Loads
Containment Boundary Loads During Condensation OscillationsPool Boundary Loads Due to ChugqinqSingle Vent Lateral LoadNultivent Lateral LoadSubmerged Structure Loads Due To Condensation Oscillationsand Ch ugginq
Response to HRC- Criteria for Loads on Submerged Structures
4 2 3 1
4.2. 3.24 2 3 3
2 3 44.2.3. 54.2. 3 6
2 3 7
IntroductionHPC CriteriaHRC CriteriaNRC CriteriaNRC CriteriaNRC CriteriaHRC Criteria
III.D.2. a. 1:III.D. 2. a. 2:III D.2.a.3:III.D. 2. a. 4:III.D. 2. a. 5:.III.D 2 a 6:
Bubble AsymmetryStandard Drag In Accelerating FlowSeqmentation of StructuresInterference EffectsBloc ka qe In D cwnc ome r Br'aci ngFormula 2-23 of Reference 13
4 2.4
4. 2. 4.14- 2 4.2
2 4 32 4
4 2 4 54.2 4 64-2. 4- 74 2.4 8
Secondary Load
Downcomer Friction Draq LoadsSonic HavesCompressive HaveFallback Loads on Submerqed BoundariesVent Clearinq Loads on the DowncomersPost Poolswell HavesSeismic SloshThrust Loads
4. 2.5
4 2 5.14.2.5.24.2 5 3
Long Term LOCA Load DefinitionDesign Basis Accident (DBA) TransientIntermedia t e Break Acciden t (IBA) Trans ien tsSmall Break Accident {SBA) Transients
Re v. 9, 07/85 4-1
4.2.6 LOCA Loading Histories for SSES Containment Components
4 2 6.14. 2. 6.24 2 6.34.2.6.44.2.6.54 2 6 64 2. 6.7
LOCALOCALOCALOCALOCALOCALOCA
Loads o.nLoads onLoads onLoads onLoads onLoads onLoads on
the Containment Mall azd Pedestalthe Basemat and Liner Platethe Dr@well and Dryvell Floorthe Columnsthe Dovncomersthe Dovncomer BracingPetvell Piping
4. 3 Annu1 u s P re ss uri za ti on
Be v. 9, 07/'85 4-2
colum
ber
CHAPTER 4
FIGURES
Titie4-1t hru4-37
These figures are proprietary and are found in theproprietary supplement to this DAR.
4-3 8
4-3 9
4-40
4-40a
4-41
4-4 2
4-4 3
4-44
4-44a
4-45
4-46
4-47
4-4 8
4-49
4-50
4-51
4-52
4-53
4-54
SSES Short Term Suppression Pool Surface Height
SSES Short Term Wetwell Pressure
SSES Pool Surface Velocity vs Elevation
Poolswell Accel eration Time HistorySSES Vent Clearing Pressure DistributionThis Figure has been Deleted
SSES Poolswell Air Bubble Pressure
Air Bubble Pressure on Suppression Pool Walls
This figure has been deleted.
This figure has been deleted.
SSES Drywell Pressure Response to DBA LOCA
SSES Wetwell Pressure Response to DBA LOCA
SSES Suppression Pool Temperature Response to DBA LOCA
SSES Drywell Temperature Response For DBA LOCA
SSES Suppression Pool Temperature Response to IBA
SSES Plant Unique Containment 'Response to the IBA
Typical Nark II Containment Response to the SBA
SSES Component" Affected hy LOCA Loads
SSFS Components Affected by LOCA Loads
Rev. 9, 07g85 4-3
Huraher
FIGURE-S- (Con t.)Titie
4-55
4-56
LOCA Loadinq History for the SSES ContainmentWall and Pedestal
LOCA Loadinq History for the SSES Basemat andLiner Plate
4-57
4-58
4-59
4-60
LOCA Loadinq History for the SSES Drywell and Drywell Floor
LOCA Loading History for the SSES Columns
LOCA Loadinq History for the SSES Downcomers
LOCA Loading History for the SSES Downcomer BracingS ystem
4-61 LOCA Loading History for SSES Metwell Piping
!4-6 2, a- f T hese figur es have been dele ted.
4-62,qGh Dynamic Downcomer Lateral Loads Due to Chugging
4-62,i-m Typical Wave Motion Due to Seismic Slosh
4-63thru4-66
These Figures are Proprietary
Rev. 9, 07/85 4-4
CHAPTHB
TABLES
Numb' Title4-1thru4-15
These tables are proprietary and are foundin the proprietary supplement to this DllH
4-16
4-17
4-18
4-19
4-20
4-21
4-2 2
LOCA Loads Associated with Poolswell
SSES Drywell Pressure
SSPS Plant Unique Poo1swell Code Input Data
Input Data for SSES LOCA Transients
Component LOCA I.oad Chart for SSKS
Hetwell Pipinq LOCA Loading Situations
Seismic Slosh Rave Heiqht
Bev. 9, 07/85
0 'LOAD DEFINITION
Q. 1 SA1'ETY RELIEF VAIVEER VQ DISCHARGE T.CAD DEFINITION
See the Proprietary Supplement for this section.
P ev 9, 07/85 4-6
~ 4 2 LOCA I OAD DEFINITION
Subsections 4.2.1, 4.2.2 and 4.2.3. discuss the numericaldefinition of loads resultinq rom a LOCA. in the SSFScontainment. The LOCA loads are divided, into five groups.
(1) Short term LOCA loads associated with poolswell(Subsec tion 4. 2. 1) .
{2) Condensatioa oscillations and chugginq loads(S ubsect ion 4. 2. 2) .
(3) Submerqod Structures Loads (Subsection 4.2.3)
(4) Seconda ry .Loads (Subsection 4. 2. 4) .
{5) Long term LOCA loads (Subsection 4.2.5) .
The a@plication of these loads to the various components andstructures in the SSES containment is discussed inSubsection 4. 2. 6.
4 2. 1 LOCA LOADS ASSOCIATED WITH POOLSWEI L
A description o the LOCA/Poolswell transient i given inSection 3.2.3 of this Design Assessment Report. The LOCA loadsassociated with poolswell are listed in Table 4-16. A discussionof these loads and their SSES unique values follovs.
2. 1. 1. We twellgDrgwell Pre sures during Voolswell
The drywell pressure transient used for the poolswell portion ofthe LOCA transient (< 2.0 sec) is given in Table IV-D-3 ofReference 7. A portion of this table is reproduced herein asTable 4-17. This drywell pressure transient includes theblovdown effects of pipe inventory and reactor subcooling and isthe hiqhest possible drywell pressure case for poolswell. Thisdrywell pressure transient i" calculated usinq the methoddocumented in Reference 56.
I
The short term poolswel1 vetwell pressure transient resultingfrom this drywell pressure transient is calculated by applyingthe goolswell model contained in Reference 8. The equa tion" andassumptions in the poolswell model were coded into a Bechtelcomputer program and verified aqainst the Class 1, 2 and 3 testcases contained in Reference 9. This verification is documentedin Appendix D to this report. Inputs used for the calculation ofthe SSES plant unigue poolsvell transient are shown in Table 4-18. The short term vetwell pressure transient calculated withthe poolswell code is shown in Fiqure 4-39 The short termwetwell pressure peak is 56.1 psia (41.4 psig) .
Hev. 9, 07/85 4-7
Reference 46, Subsection III.B.3.d.2 formulates a methodology fordetezmininq the maximum diaphraqm uplift A,P to be used for designassessment ThisQP is based on following relation:
PUP = 8.2 — 44'F (PSI)PUP = 2.5 (PSI
AB AP VSV~D'AV)
0<F<0.13F>0.13
where: ADAPAVVSVD
break area;net pool area;total vent areainitial wetwell air space volume; anddrywell volume
For SSES (see Tables 4-18 and. 4-19):
ABAPAVVSVD
= 3.53 ft~= 5065. 03 ft2
257 52 ft~149,000 ft3239,600 ft~
Inserting into the above equation yields:F = 0 168: > 0 13
This qives a maximum upliftQP of'.5 PSEUD. However, as requiredby NUHEG 0808, a more consezvative uplift QP of 5. 5 PSID will heused for design.
4 2,1.2 Submerged Boundary Loads ~ Duri~n Vent Cleari~n
The submerqed jet formed by the expulsion of the water leg in thedcwncomers creates a vent clearing load on the hasemat and on thesubmerqed wetwell walls. This loading is defined by Reference 57as a 24 PSZ overpressure statically'pplied with hydrostaticpressure to surfaces below vent exit with a linear attentuationto zero at pool surface (see Figure 4-41) . This load is applieddurinq the vent clearing.The MHC, in Supplement Ho. 1 to NUTMEG-0487, accepts the above 24PSI overpressuze for the vent clearing load for those plantsw.here:
(mh»/r (AP /AV ) VDW 1 < 55
with: m = mass flow in vents -lb/secVDW= drywell volume — ft~h = enthalpy of air in vents — btu/lbL = submerqence — ftAp /AV= pool area to vent area ratio
For SSES, the various parameters are:
Hev. 9, 07/85 4-8
m = 17,900 lb/secVDg= 239, 850 ft~h = 194 btu/lbL = 12 ftAp /Ay= 5 065/2 57
Substitutinq into the above gives:
t'17,900) (194) {12) {257) 1/{'5065) (239,850) ] = 8 8
Thus, for SSFS, the 24 PSI overpressure specified foz the aircleazinq load is acceptable.
4 2.1 3 LOCA Jet Loads
Durinq the vent, clearinq stage induced velocity andacceleration'ields
are created in the suppression pool .producing drag forceson submerged strctures. The original methodology employed topredict the draq forces is contained in Reference 12 (oftencalled the Moody jet model) and is an analytical representationof an unsteady water jet discharging into a suppression pool.The jet is made up of constant velocity f1uid particles travelingat the speed at which they exited the discharqe pipe. The jetfront is described as the locus of points which a particleoveztakes the one exiting immediately before it. No velocitiesor accelerations are defined in the fluid external to the jet.Reference 46, subsection III.D.1.a proposed that velocity andacceleration be predicted throuqhout the pool using the potentialfunction of a sphere at the jet front. A modification of theload calculated at jet impinqement was also required. TheAcceptance Criteria was a simple method to determi'ne a boundi'ngjet load foz all structures below the downcomer exits.The Moody jet model was clearly derived for jets with constant orlinearly inc rea sing acceleration. However, the vent clearingtransients predicted for Mark II plants typically have anacceleration increase greater than lineaz. Strict applicaton ofReference 12 leads to unrealistic mathematicl res'ults. Twointezpretations of the results are possible dependinq upon thetime base employed. Examininq the jet in»real time" {t inReference 12) a jet can be seen with two independent frontstzavelinq at different speeds at different locations whichcoincide only at the point of jet dissipation. On the otherhand, if we use the "exit time.» ( q) as a. basis the jet reversesand moves backward in both space and»zeal time«beforedissipation. Clearly neither of these observations is of,muchu e in calculatinq loads on structures.
To overcome the difficulties of using this model, an alternativemethcdoloqy has been formulated. The jet front will be describedby the motion of the particle having travelled the farthest atany instant in time. This will be identical to the ~.oody jetmoticn for jets with linearly increasing acceleration but will
Bev. 9, 07/85 4-9
yield a sinqle continuous velocity and acceleration time historyeven if the acceleration increases more rapidly.A sphere is then placed at the jet front generating a potentialflow described by the following function:
= —U.V-3 cos681t j w z
where r and 6 are the spherical coordinates from the spherecenter to some position in the suppression pool with 6 measuredfrom the jet direction, Ujis the velocity of the spheredetermined hy the velocity of the particle 'having traveled thefarthest at the instant in time the drag forces are heingcomputed and V is the initial volume of water in the vent.
rThe local velocity Um, and acceleration, Uco are then calculatedfrom the above relation hy the methods of Reference 14. Once thelocal velocity and acceleration are known the drag forces arecomputed from Reference 13 as follows:
U vp
gc
F = D x ~nPCAU pS
~c
where F is the acceleration drag, U n is the local accelerationfield nAmal to the structure, v is the acceleration drag volumefor flow nozmal to the structure, p is the fluid density, F isthe standard drag, <D is the drag coefficient fcr flow,normal tothe structure, Ax is the projected structure area .normal to U n
and U is the local velocity field normal to the structure.8hen the jet is pred'cted to dissipate the sphere is traveling atthe final jet velocity at the point of maximum jet penetration.This condition is used as t'e final load calculation point. Thefinal jet velocity is that of the jet front just before the lastparticle leaving the vent reaches the jet front The velocity ofthe last particle is disreqazded.
4 2 1. 4 Boundary Loads During Poolswell
During the poolswell transient, the hiqh pressure air bubblewhich forms in the vicintiy of the vent exit creates an increasein pressure on all suppression pool boundaries below the ventexit as well as those walls which it is in direct contact.Boundaries which are above the bubble location and up to thepoint of maximum pool'levation also experience increasedpressure loads corresponding to the increased pressure in thewetwell airspace as well as the hydrostatic contribution of thewater slaq.
Rev. 9, 07/85 4-10
Reference 46, Subsection EIE.B.3.b methodology .for specificationof these loads uses the Poolswell Analytical Model to determinethe maximum values of bubble pressure and wetwell airspacepressure. The analysis takes the maximum pool elevation as 1.5times the initial submerqence. Using th' data, a static loadingis applied to the containment structure as follcws:
1. for the basemat — uniform pressure equal to the maximumbubble pressure superimposed on the hydrostatic loadcorrespondinq to a submerqence from vent exit to the basemat;
2. for the containment walls below vent exit — maximum bubb1epressure plus hydrostatic .head correspcndinq to verticaldistance from vent exit;
3. for the containment walls between vent exit and maximum poo1elevation-lineaz variation between maximum hubble pressureand maximum wetwell airspace pressure;
for the containment walls above maximum pool elevation—maximum wetwell airspace pressure.
The pressure distribution used for the SSES analysis is shown inFiqure 4-44
2 'I.5 Poolswell Asymmetric Air Bubble Load
The methodoloqy used in the proceeding subsection assumes thatthe air flow rate in each downcomer is equal leading to asymmetric loading of the containment boundary. Reference 46 hasexpressed concern that circumferential variations in thedowncomez air flow rate can occur due to dyrwell air/steammixture variation that would result in variations in the bubblepressure load on the wetwell wall.
This loading condition is calculated by statically applying themaximum air bubble 'pressure obtained, from the PSALM to 1/2 of thesubmerged boundary and statically applying 120% of the maximumhubble pre sure to the other 1/2 of the submerged boundary. Thepressure load on the basemat and wetwell walls below the ventexit is the sum of the air pzessure and the hydrostatic pressure.For the portion of the wall above the vent exit, the pressureincrease d.ue to the air bubble is linearly attenuated from thehubble pressure at the vent exit to zero at the pool surfaceThis increase is then added to the local hydrostatic pressure toobtain the total pressure. The time peziod of application of theload is fron the termination of vent clearing unti1 the maximumswell heiqht i reached.
Rev. 9, 07/85
4.2.1 6 - Poolswell~lm act - Load
Any structure located between the initial suppression poolsurface (Fl. 672') and the peak poolswell height (El. 690'-2«,see Fiqure 4-38) is subject to the pool swell impact load. Asdocumented in the response to HRC Question 020. 68, the poolswellmaximum elevation is determined by the poolswell Analytical llodelwith a polytropic exponent of 1.2 for wetwell aiz compression toa maximum swell heiqht which is the greater of 1.5 ventsubmezqence oz the elevation cozresponding to the drywell flooruplift 6 P determined .from the equation documented in Subsection4.2 1.1 (2.5 PSID) For SSES, usinq the design drywell flooruplift 4 P=2. 5 PSID leads to the qreatest poolswell .height andyields 1.51 times the initial vent submergence. Since allqratinq .is removable only»small» structures as defined inReference 10a, Subsection 4 2.5.1 aze sub ject to poolswell impactloads.
Poolswell impact loads of »small«structures aze determined asspecified in .Reference 46, Subsection III.B.3.c.1. An SSESplant-unique velocity vs. elevation curve has been generated withthe goolswell model (see Fiqure 4-40) . The velocity curve isconservatively increased by a 1. 1 multiplier and used tocalculate the impulse per unit area, pulse duration and maximumimpact pressure at the component's elevation. The peak pressureis then used to define a versed sine shaped hydrodynamic loadingfunction
p (t) P ( 1 cos2'St/T)P(t) = -max2
where: P = pressure actinq on the projected area of the structure;P = the temporal maximum of pressure acting
on the projected area of the structure;
t = time;= duration of impact
The loading function corresponds to impact on rigid structures.In actuality, the structures beinq analyzed may be more flexible,resultinq in the pressure pulses, during impact, being modifiedby the motion oX the structure. To account for this, thehydrodynamic mass of impact is added to the mass of the impactedstructure when pezforminq the structural dynamic analysis.
4.2 1 7- LOCA Air.Bubble Submerged Structure Toad
During the drywell aiz purge phase of a X.OCA, an expanding bubbleis created at the downcomer exits. These rapidly expandinghubbles eventually coalesce into a »blanket» of air which leadsto the pool swell phenomena. The bubble charging process createsfluid motion in the suppression pool which causes drag loads onthe submerqed structures
Rev. 9, 07/85 4-12
The submerqed structure drag loads due to air clearing, prior topool swell, are calculated in the same manner as the drag loadsdue to CO and chuqqinq presented in Subsection 4.2.2.5. However,the chuqqinq and CO sources are replaced with a sourcerepresentinq the bubble qrowth'rior to pool swell. This sourceis derived from the oriqinal 4T data. A3.1 sources a'e assumedin-phase (87 sources) .
4 2.1 8 -Poolswell Dr~a,Load
Subsequent to hubble contact all bubbles are assumed to coalesceinto a blanket of air and the poolswell drag loads are due therapidly acceleratinq upwazd sluq of water and acts in thevertical direction only (except .for lift forces which act in thetraverse direction to flow) . The one dimensional pool swellmodel is used to predict the vertical flow field. Once the flowfield is known the drag forces are calculated by th~ methods ofReference 13 modified by the methodology presented in Subsection4.2.3. This load applies to any structure located between theelevation of the vent exit and the peak poolswell height. Theduration of the drag load begins when the vent clears except forstructures which are originally not submerged. For structureswhich are not submerged, the drag load duration is based on thesluq transient time (Reference. 10a, page 4-78, step 3).
4. 2. 1. 9 Poolswell Fallback Load
After the termination of poolswell the slug of water falls underthe influence of gravity causing drag forces on structureslcoated between the peak poolswell height and 'the vent exit. Themotion of the water is described by the followinq equations:
H(t) = H — gt /22max
VF~ (t) = gtvF> (t) = g
where q is the acceleration constant, H(t) is the height aboveinitial water level at time t, H maz is the maximum swell height iand t is time startinq with t = 0 at maximum swell height = ff„aThe drag load is then calculated from the methods of Re.ference 13modified by Subsection 4.2.3 of the DAR. The loading stops whenH(t) has fallen below the structure or when H(t) .has returned tonormal water level — whichever is calculated to occur first.
2.2 Condensation Oscillations and Chugging Loads
Condensation oscillation and chuqqing loads follow. the poo'lswellloads. in time. There are basically three loads in this secondarytime period, i.e., from about 4 to 60 seconds after the break."Condensation oscillation» is broken down into two phenomena, amixed flow zegime and a steam flow regime. The mixed flow regimeis a relatively hiqh mass flux phenomenon which occurs during thefinal period of .air purginq from the drywell to the wetwell whenthe mixed flow throuqh the downcomer vents contains some aiz aswe11 as steam. The steam flow portion of the condensation
Ro v. 9, 07/85 4-13
oscillation phenomena occurs af ter all the air has been carriedover to the wetwell and a relatively high intermediate mass fluxof pure steam .flow is established.
»Chugging» is a pulsating condensation phenomenon which can occureither followinq the intermediate mass flux phase of a LOCA, orduring the class of smaller postulated pipe breaks that result insteam flow throuqh the vent system into the suppre sion pool. A
necessary condition for chugging to occur is that only pure steamflows .f rom the LOCA vents. Chugqinq imparts a loading conditionto the suppression pool boundary and all submerged structures..
In Revision 2 of the DAR, we stated that the DFFR CO and chuggingsteam condensation boundary load definition (see Appendix A toReference 21 and Reference 16) would be compared with the LOCAsteam condensation load definition derived from the GKM II-M testdata to evaluate the conservatism of the DFFR load. Subsections9.6. 1.1 an(3 9.6.1.2 document this comparison.
As a result of this comparison and the possible schedule delaysassociated with licensing SSES based on the DFFR load, PPGLdecided on April 1, 1982 to terminate the re-evaluation of SSESbased on the DFFR load and re-assess SSZS with the GEM II-M loaddef ignition. Subsection 9.5.3 documents the GKM II-M loaddefinition. For chuqging, both a symmetric and asymmetric loadcase are considered, while for CO, only a symmetric load case isconsidered.
For plant evaluation, PPGL does not define a separate CO andchugging load definition, as with the Mark 1I Owners. nstead,the acceleration response spectra (ARS) generated for the LOCAsteam condensation phenomena for combination with the otherdynamic loads (i.e., SRV (ADS), seismic, etc.) is the so-calledLOCA load, which represents an envelope of the ARS curvesqenerated for both the GKM-IIM CO and chugging load definition,and symmetric and asymmetric load cases (see Subsection 9.6. 1. 1).
Subsection 7.0 provides the results of the ze-evaluation of theSSES plant to the LOCA steam condensation load derived from theGK M-IIM test da ta.
4.2 2 1 Containment Boundary T.pads Due To CondensationOsci llations
This subsection has been deleted.
4,2 2,p Pool Boundary Loads- Due to Ch~uging
This subsection has been deleted.
4. 2 2. 3 Downcomer- Lateral. E.pads
The chuqqinq load imparted to the downcomer is taken fromReference 47. Thi" reference specifies two sinusoidal dynamicloads used when evaluating downcomer lateral bracinq systems.
Be v 9, 07/85
The durations and amplitudes specified are 3ms, 30 kip and 6 ms,10 kip (as shown in Figures 4-62G 6 H).
However, in response to the tfRC's ccncerns wi th the Nark IIsinqle vent lateral load, SSES is re-evalua ting the downcomerswith an extrapolated sinqle vent lateral load of 65 Kips and 3
msec time duration for faulted conditions. Subsection, 9.6.3verifies the conservatism of this load based on a statisticalanalysis of the GEN Il-N bracinq force data at 10-~ exceedanceprobability.4.2 2.4 -Multivent T,ateral Toads Due to Chugging
Nultivent lateral loads due to chuqqing aze pre ently beingevaluated by the methodology documented in letter report "Methodof Applyinq ."iark II Single Vent Dynamic Lateral Load to Nark IIPlants with Nultiple Vents,» transmitted to the HBC on April 9,1980 under Task A. 13.
4,2,2,$ . SuhLterged Structure Toads Due to CondensationOscillations and Chugging
Condensation Oscillation and chugging induce flows fields in t.iesuppression pool causing drag loads on the submerqed structures(i.e., SRV lines, downcomers, etc.) . The methodology forcalculatinq these drag loads to be combined with the other designbasis loads is presented below.
The force on a submerqed structure i.s the sum of an accelerationforce FA and an unsteady drag force FD
T A D
Under certain conditions the pressure gradient is of sufficientmagnitude so that the submerged structure force is essentiallythe acceleration drag force. In order for this to be true, theStrouqhal Humber must be sufficiently large.For the SSES submerged structures and the flow fields induced bychugqinq and CO, the Strouqhal Number is sufficiently high thatnegliqible error will be incurred by ignoring the unsteady dragforce.
The submerged structure draq force can be approximated by theintegral of the pressure field P y over the structure surface:
F = pCds K
where: Pg = determined by the equations for potential flowS
K = hydrodynamic mass factorFor a linear isentropic fluid where the ver.ocity is everywheresmall compared to the sonic speed c, the equations for potentialflow reduce to the acoustic wave equation (Reference 65) . Thus,the pressure field also satisfies the acoustic wave equation.
Rev. 9, 07/85 4-15
Thus, .for calculating the SSES submerged structure drag load dueto CO and chuqginq, the above expression is used, with thepressure P y, as a function of time and position, calculated bythe IfiEGS/HARS acoustic model of the SSES uppression pool. Thepressure P
@is calculated in an analagous manner as the
symmetric wall. loads {see Subsection 9.5. 3.4.1) for each source,except that the pressures are calculated at the submergedstructure surface locations instead of the containment boundary.
For each stmcture being analyzed. {i.e., column) a pressure timehistory {PTH) is calculated for every 60~ incrementcircumferential around the structuze at each elevationcorresponding to a nodal point of the structural model. Thus,for each node point elevation, six pressure time histories arecalculated This is repeated for each source. These sets ofPTHs, calculated for each source, are then integrated across thestructure's surface to give resultant force time histories forstructural analysis.
The force time histories are then multiplied by a hydrodynamicmass factor, K, of 2 to account for the modification of the flowfie ld due to structure ' presence.
4 2.3 Response to NRC Criteria for Loads On Submerged Structure
4 2.3 1 Introduction
In October 1978 the NRC published NUREG-0487, Hark II ContainmentLead Plant Program Load Evaluation and Acceptance Criteria. Itaddresses the load methodoloqies proposed by the Hark II LeadPlant Program for determining LOCA and SRV hydrodynamic loads.NUREG-0487 was highly critical of the lead plant position fordetermininq submerged structure loads and stipulated veryconservative alternative loading criteria. The followingsubsections will present the NRC submerged structures acceptancecriteria and the corresponding Hark II response.
4 2.3.2- NRC Criteria III D.2.a.1: Bubble A~smmetrg
A conservative estimate of asymmetry should be added byincreasing acceleration and velocities computed in Step 12 ofSection 2.2 of Reference 13 by 10%. If the alternative steps 5A,12A, and 13A are used, the acceleration drag shall be di'rectlyincreased by 10% while the standard drag shall Le increased by20Ã.
Response: These criteria are acceptable.
4.2 3.3 N'PC Criteria XII D 2.a.2:. Standard Drag InAcce le ra tina Fl o w
The drag coefficients C> foz the standard drag contribution insteps 13, oz 13A, 15 of section 2.2 and step 3 of section 2. 3 ofReference 13 may rot be taken directly from the steady statecoefficients of Table 2-3. Hodified coefficients C> from
Re v. 9, 07/85
acceleratinq flow as presented in References 49 and 50 shall beused with transverse forces included, or an upper bound oX afactcr of three times the standard draq coefficients shall beused for structures vith no sharp corners or with streamwisedimensions at least twice the vidth.
Res pcnse:
The three references shov that in oscillatinq flows the standard,draq coefficient for cylinders can exceed the steady flow value.Values of CD in excess of 2.0 vere observed vhile steady statevalues (for cylinders) never exceed 1.2. The NBC's position iinterpreted to mean that neglecting the unsteady effect onstandard draq coefficients will be nonconservative in some cases.
A method is presented in Reference 51, Appendix A to account forunsteady effects on standard and acceleration drag durinq variousphases of the LOCA and SHV transients. Also included are methodsto estimate transverse fozces due to vortex shedding.
Subsequent to revievinq the methodology contained in Appendix A
of Reference 51, the NRC in Supplement No. 1 of NUBZG-0487,required several modifications to the methodoloqy for det'erminingthe unsteady drag coe fficie n ts.
A .review of the SSFS pool svell and fallback drag loadcalculations indicates that SSHS has incorporated thesemodifications into their calculations. Drag coeff icients are notrequired for calculating the submerged stzucture drag loads dueto air bubble charging prior to pool swell, and the drag loadsdue to chuqqinq and CO, since these loads are calculated usingthe pressure time histories at the structure locations (seeSubsection 4.2. 1.7 and 4.2.2.5) .
4 2.3.4 4'.?C Criteria 211 D 2.4.3: Secementntion of Structures
The equivalent uniform flow velocity and acceleration for anystructure or structural segment shall be .taken as the maximumvalues "seen" by that structuze, not the value at the geometriccenter..
Response:
Poz structures submerged in a non-uniform flov Iield, thevelocity and acceleration vill be a function of position alongthe structure. The NBC's criterion''is interpreted to mean thatthe velocity and acceleration should be taken at the end of theseqment closest to the disturbinq source i~stead of the geometriccenter. For certain restrictions on segment length, the error inthe calculation of dzaq using the velocity and acceleration atthe'eometric center is very small. This .is demonstrated foracceleration drag in Reference 51, Appendix B and for standarddraq Reference 51, Appendix C. Appendix 8 also contains adiscussion that shows that neglecting end effects in dragcalculations is conservative.
Bev. 9, 07/85
4.2 3. 5 NRC Criteria .III.D 2 4.4: Interference Effects
The computation of draq forces on submerged structuresindependent of each other (as presented in Reference 13) isadeauate for structures sufficiently far from each other so thatinterference effects are negligible. Interference effects can beexpected to be insignificant when two structures are separated bymore than three characteristic dimensions of the larger one. Forstructures closer toqether than this separation, either detailedanalysis of interference effect" shall be performed or aconservative multiplication of both the acceleration and standarddraq forces by four shall be performed.
Response:
Interference effects can have a significant effect o'n dragforces.. A modification to the calculational procedure isproposed to account for interference. Reference 51, Appendix D
describes the proposed method .for standard drag with theexception that the Tree stream velocity used will be that at thestructures qeometric center in all cases. Reference 51, Appendix
presents the proposed method for acceleration draq.
4.2.3.6 BPC Criteria III.B.2 a.5: Blockacae In r!oencoeer Bracing
A specific example o interference which must be accounted for isthe blockage presented to the motion of the water slug duringpool swell due to the presence of downcomer bracing systems. Zfsignificant blockage zelative to the net pool area exists, thestandard draq coefficients shall be modified foz this effect byconventional methods (Reference 52).
Response:
Blockage effects on the pool swell drag loads produced on thedowncomer bracinq system were accounted for by using the methodsin Reference 87.
4 2 3 7 HPC Criteria XII D.2.a.6: Formula 2-23 of Reference 13
Formula 2-23 of Reference 13 shall he modified by replacingwith ppp V@ where Vg is obtained from Table 2-1 and 2-2. This isthen consistent with the analysis oZ Reference 14.
Response:
This criteria is acceptable.
4 g 4 secondary Load
The pzevious subsections have identified and specified loadingmethodologies that result in significant containment dynamicloads 'In addition, several pool dynamic loads can occur whichare considered secondary when compared to the previous loads orbecause the containment and related equipment response is small
Re v. 9, 07/85 4-18
when subjected to them. The following subsections identify thesecondary loads and the load criteria to be applied to the SSEScon tainment.
4. 2. 4. 1 Downcomer Friction Drag Loads
Friction Draq loads are experienced internally by the downcomersduring vent clearing and subsequent air/or steam flow. Inaddition, the downcomers experience an external drag load duringacolswell. Using standard drag force calculation proceduresthese loads are determined to be 0.6 and .3 KIPS per downcomer,respectively and are not considered in the structural eva'luationof the containment.
4.2.4 2 Sonic ~braves.
Immediately following the postulated instantaneous rupture of alarge primary system pipe, a sonic wave front is created at thebreak location and propaqates throuqh the drywell to the ventsystem. This load has been determined to be neqligible and noneis specified.
4.2 4.3 Compressive Pave
The compression of the air in the drywell and vent system causesa compressive wave to be generated in the downccmer water legs.This compressive wave then propaqates through the pool and causesa differential pressure loading on the submerged structures andon the wetwell wall. This load has been evaluated and iscons idered neqliqible.4 2.4 4. Fallback Loads on Subm'erged Boundaries
During fallback «water hammer" type loads could exist if thewater sluq remained intact during this phase However availabletest data indicates that this does not occur and the fallbackprocess consists of a relatively qradual settling of the poolwater to its initial level as the air bubble»percolates" upward.This is based on visual observations during the EPBI teststBeference 32) as well as indirect evidence provided by a carefulexamination of pool bottom pressure forces from the 4T, EPPI,foreign licensee and Mar viken tests. Thus these loads are s malland will not be considered.
4 2. 4 5 Vent Cleari~n Loads on the - Downcomers
The exoul ion of the water leq in the downcomers at vent clearingcreates a transient water jet in the suppression pool. This jetformation may occur asymmetrically leadinq to lateral reactionloads on the downcomer However, this load is. bounded by theload specification during chugging and will not be considered forco~ tainmen t analysis.
Rev. 9, 07/85
4.2.4.6 Post Poolswell Haves
Reference 46 indicates the potential for containment loading dueto post poolswell waves impiaqinq on the wetwell wall andinternal components. Per the response to Question H020. 8documented in Appendix A to Reference 10a, this load isconsidered neqliqible when compared to the other desiqn basisloads
4.2.4 7 Seism.ic Slosh
Seismic slosh loads are defined as those hydrodynamic loadsexerted on the suppression pool walls by water in the suppressionpool Qurinq a seismic event. Althouqh these loads are expectedto he small in comparison with other hydrodynamic loads such asthose associated with air/steam SRV discharqe and LOCA poolswelland steam 'condensation loads, they have been calculated for theSSES containment evaluation, as requested by the NRC in NURFG-0487.
The methodoloqy used to calculate seismic slosh loads for theSSES containment .is the SOLA-3D computer code, Qevelcped at LosAlamos Scientific Laboratory for multi-dimensional fluid flowanalyses, includinq seismic slosh (Reference 71 and 72) Thecode has been used for seismic slosh analysis previously, where atoroidal HK I BHH suppression pool was approximated by an annularqeometry, and excited by a simulated sinusoidal seismic event.Results of this analysis are reported in Reference 73. It wasdemonstrated that SOLA-3D could be used to describe suppressionpool water motion for a seismic excitation applied to thecontainment structure.The seismic slosh analysis for SSES suppression pool has beenpatterned after the annular suppression pool analysis descrihedin Reference 73, with appropriate SSES suppression pool andcontainment parameters used. The results of calculations arepressure-time histories, caused by water wave motion, to heapplied to suppression pool boundaries in manner and locationsimilar to the method used for SRV and LOCA hydrodynamic loads.
Generally, water motion above the guiescent suppression poolsurface causes "wave loads" and water motion below causes"inertial loads « The inertia loads will always appear to belarger than the wave loads because the .normal hydrostatic loadwould be included below the. water. surface. (For example, at 24ft. submerqence in cold water, the hydrostatic head would besliqhtly more than 10 psi, qivinq a 10 psi bias to the inertialoads at pool bottom.)
Some numerical results of the calculations are shown in Table 4-22 for .the selected locations in the suppression pool. As can heobserved, these pressures are small relative to those calculatedfor the other hydrodynamic loads. Fiqures 4-62 i, j, k, and m
show typical wave motion at, the four containment locations inTable 4-22.
Rev. 9, 07/85 4-20
4 2.4 8 ~ Thrust Loads
Thrust loads are associated with the rapid venting of air and/orsteam through the dcwncomers. To determine this load a momentumbalance for the control volume consistinq oZ the drywell,diaphraqm floor and vents is taken. Results of the analysisindicates that the load reduces the downward pressuredifferential on the diaphragm.
4.2.5 Long Term LOCA Load Definition
The loss-of-coolant accident causes pressure and temperaturetransients in the drywell and wetwell due to mass and enezqyreleased from the line break. The dzywell and wetwell pressureand temperature time histories are required to establish thestructural loadinq conditions in the containment because they arethe basis for other containment hydrodynamic phenomena. ~ Theresponse must be determined for a ranqe of pazazetezs such asleak size, reactor pressure and containment initial conditions.The results of this analysis are containment initial conditions.The results of this analysis are documented in Reference 7.
4.2 5 1 Design Basis Accident QDBAg Transients
The DBA LOCA for SSES is conservatively estimated to be a 3.53ft~ break oX the recirculation line (Reference 7). The SSESplant unique inputs for this analysis are shown in Table 4-19.Drywell and wetwell pressure responses are shown in Figures 4-46and 4-47 (extracted from Reference 7) .. These transientdescriptions do not, however, contain the effects of reactorsubcoolinq. Suppression pool temperature response is shown inFiqure 4-48 (Reference 7). This transient descziption also doesnot contain the effect of reactor subcooling. Drywelltemperature response is shown in Fiqure 4-49 and similarly doesnot contain the effects of pipe inventory or reactor subcoolinq.
4 2,5,2 Intermediate Break accident il~Bll Transients
The worst-case intermediate break for the Hark II plants is amain steam line break on the order of 0.05 to 0. 1 ft2.Suppression pool temperature response is shown in Figure 4-50.Drywell temperature and wetwell and. dzywell pressures foz theSSES IBA are shown in Figure 4-5 1.
4. 2.5.3 Small Break Accident Q~SBA Transients
At this time plant-unique SPA data foz SS.ES is rot available.The wetwell and drywell pressure and temperature transients for atypical Hark II containment are used to estimate SSES containmentresponse to these accidents. These curves are shown in Figure 4-17 (extracted .from Reference 10).
Rev. 9, 07/85 4-21
4. 2 6 LOCA Loading Histories For SSES Containment Components
The v'arious components directly affected by LOCA loads are shownschematically in Figures 4-53 and 4-54. These corn ponents may inturn load othez components as they respond to the LOCA loads.":or example, lateral .loads on the dovncomer vents produce minorreaction loads in the drywell floor from which the dovncomers aresupported. The reaction load in the drywell floor is an indirectload resultinq from the LOCA and is defined by the appropriatestructural model of the dovncomer/drywell floor system. Only thedirect 1oadinq situations are descri ed explicitly heze. Table4-20 is a LOCA load chart for SSES This chart shows which LOCAloads directly affect the various structures in the SSEScontainment desiqn Details of the loadinq time histories are
' iscussed in the folio winq subsect ions.
4.2.6.1 LOCA Loads on the Containment Mall and Pedestal
Fiqure 4-55 shows the I,CCA loadinq history for the SSEScontainment wall and the 3PV pedestal. The wetvel1 pressureloads apply to the unvetted elevations in the wetvell; andaddition of the appropriate hydrostatic pressure is made forloads on the wetted elevations. Condensation oscillation andchuqqinq loads are applied to the wetted elevations in thevetvell only. The poolsvell air bubble load applies to thevetwell boundaries as shown in Figure 4.44.
4 g. 6 g LOCA Loads on the Basemat and Liner Plate
Figure 4-56 shows the LOCA loading history for the SSES basematand liner plate. Uetwell pressures are applied to the wetted andunwetted poztions of the linez plate as discussed in Subsection4. 2. 6. 1 The downcomez vater jet impacts the basemat liner plateas does the poolswell air bubble load. Chugqinq and condensationoscillation loads are applied to the wetted portion of the linerplate.4 2 6.3 LOCA Loads on the Drgvell and Drywell Floor
Piqure 4-57 shovs the LOCA loadinq history for the SSES drywelland dzywell floor. The dzyvell floor, undergoes a verticallyapplied, continuously varying differential pressure, the upvardcomponent of vhich is especially prominent during poolsvell whenthe wetwell air space is hiqhly compressed.
4. 2. 6 4 J,OCQ Loads on the Columns
Piqure 4-58 shovs the LOCA loadinq history for the SSES columns.Poolswell drag and fallback loads are very minor since the columnsurface is oriented parallel to the pool s~ell and fallbackvelocities. The poolswell air bubble, condensation oscillationsand chuqainq vil1 provide loads on the submerged {wetted) portionof the columns.
Re v. 9, 07/05 4-22
4 2. 6 5 LOCA Loads on the Downcomers
Figure 4-59 shows the LOCA loading history for the SSESdowncomers. The downcomer clearing load is a lateral loadapplied at the downcomer exit (in the same manner, as the chugginglateral load) plus a vertical thrust load. Poolswell drag andfa11bac): loads are very minor since the downcomer surfaces areoriented parallel to the pool swell and fallback velocities. Thepoolswell air bubble load is applied to the submerged portion ofthe downcomer as are the chuqqinq and condensaticn oscillationloads.
4. 2. 6. 6 LOCA Loads on the Downcomer Hraci~n
Fiqure 4-60 shows the LOCA loadinq history for the SSZS downcomerbracinq system. This system is not. subject to impact loads sinceit is submerged at elevation 668'. As a submerqed structure itis subject to poolswell drag, fallback and air bubble loads.Condensation oscillations and chugging at the vent exit will alsoload the bracinq system both through dow'nccmer reaction (indirectload) and directly throuqh the hydrodynamic loading in thesuppression pool.
2 6,7 LOCA Loads on Retwell Piping
Figure 4-61 shows the LOCA loadinq history for piping in the SSESwetwell. Since the wetwell piping occurs at a variety ofelevations in the SSES wetwell, sections may be completelysubmerged, partially submerqed, or initially uncovered. Pipinqmay occur parallel to poolswell and fallback veloci ties as withthe main steam safety relief pipinq. For these reasons there area number of potential loadinq situations which arise as shown inTable 4-21. In addition, the poolswell air hubble load appliesto the submerqed portion of the wetwell piping as do thecondensation oscillation and chuqqing loads
Re v. 9, 07/85 4-23
4. 3 A NNUT.OS PAHSSUH IZATION
The BPV shield annulus has the recirculation pumps suction linespassing th ough it (for location in containment see Figure 1-1) .The mass and enerqy release rates from a postualted recirculationline break constitute the most severe transient in the reactorshield annulus. Therefore, this pipe break is selected foranalyzinq loading of the shield vali and the reactor pressurevessel support skirt for pipe breaks inside the annulus Thereactor shield annulus differential pressure analysis andanalytical techniques are presented in Appendices 6A and 63 ofthe SSES Final Safety Analysis Feport (FSAB).
Hev. 9, 07/85 4-24

Figures 4-1 through 4-37 and Figure 4-66 are proprietary and arefound in the proprietary supplement to this DAB.
Hev. 9, 07/85

Rev. 9, 07/85SUSQUEHANNA STEAM ELECTRIC STATION
UNITS 1 AND 2DESIGN ASSESSMENT REPORT
FIGURES 4-1 THRU 4-37 AREPROPRIETARY AND ARE FOUND INTHE PROPRIETARY SUPPLEMENTTO THIS DAR
FIGURE
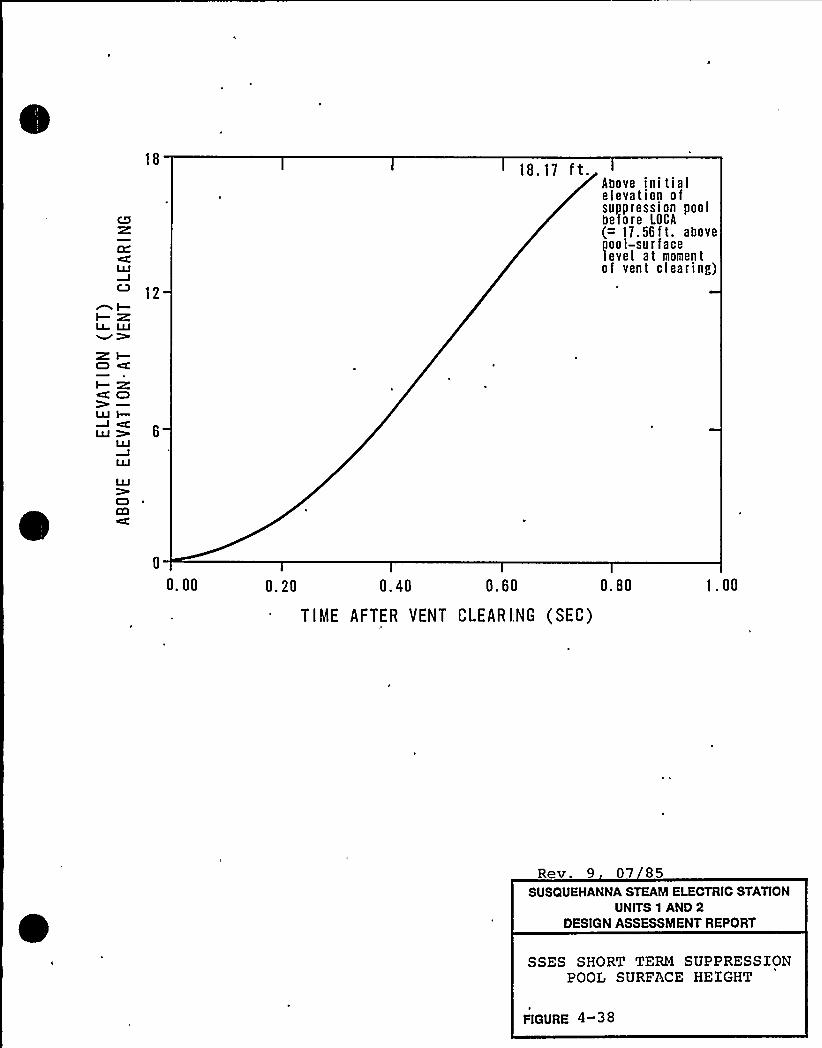
18
CQ
CC:
LU
12
I—RIJ IJJ~)R I—D «L
«C D)—UJ I—LU) 6
LU
UJ
18.17 ft.Above initialelevation ofsuppression poolbefore LOCA(= 17.56 ft. aboveool-surfaceevel at moment
of vent clearing)
)DCCI
0. 00 0. 20 0. 40 0. 60 0. 80
TIME AFTER VENT CLEARI:NG (SEC)
1. 00
Rev. 9 07 85SUSQUEHANNA STEAM ELECTRIC STATION
UNITS 1 AND 2DESIGN ASSESSMENT REPORT
SSES SHORT TERM SUPPRESSIONPOOL SURFACE HEIGHT
FIGURE 4-38
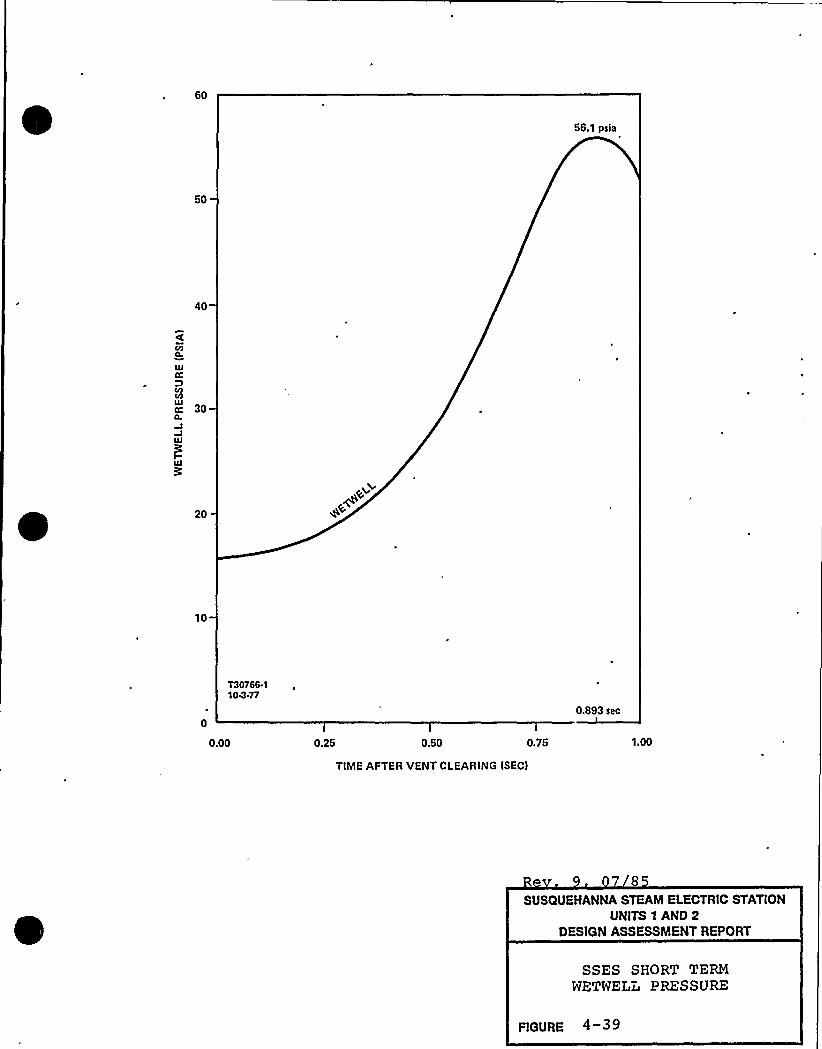
60
56.1 psia
50
40
Lll
a: 30
20
10
T30766.1104.77
0.893 sec
0.00 0.25 0.50 0.75 1.00
TIME AFTER VENT CLEARING ISEC)
SUSQUEHANNA STEAM ELECTRIC STATIONUNITS 1 AND 2
DESIGN ASSESSMENT REPORT
SSES SHORT TERMWETWELL PRESSURE
FIGURE 4
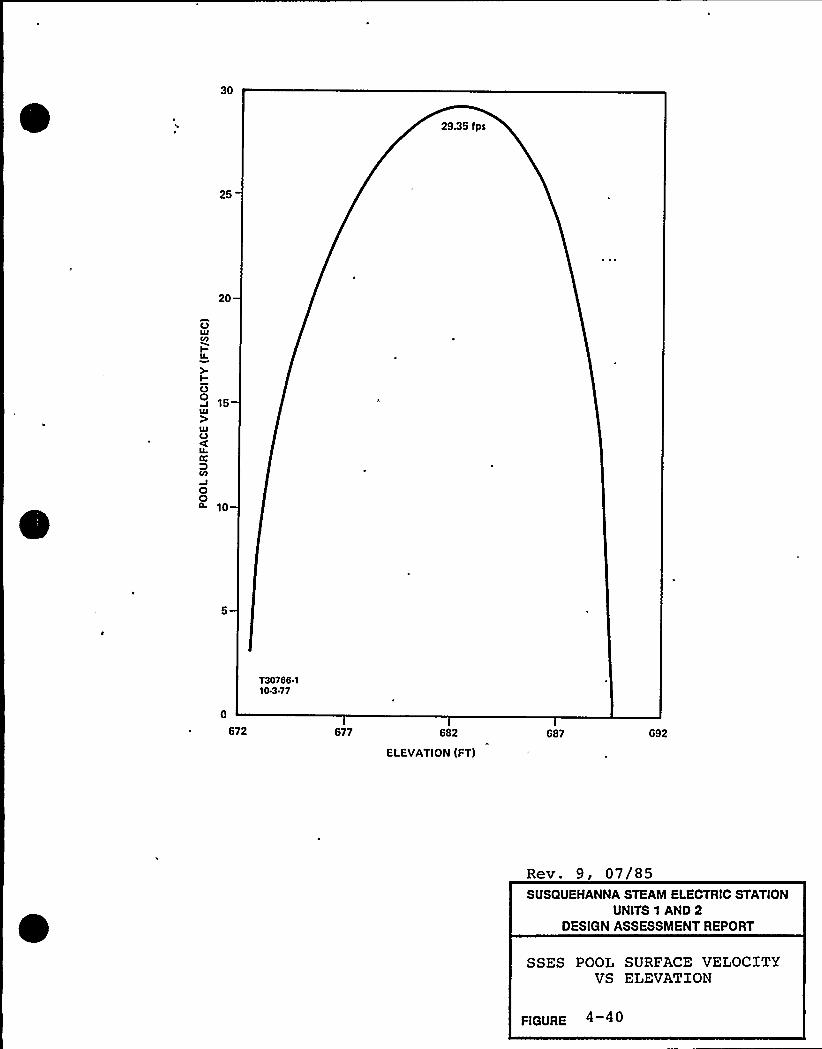
30
29.35 fpa
25
20
G
I-
I
O15
C>
LLKDCO
0010
T30766.110-3 77
672 677 682
ELEVATIONIFT)
687 692
Rev. 9, 07/85SUSQUEHANNA STEAM ELECTRIC STATION
UNITS 1 AND 2DESIGN ASSESSMENT REPORT
SSES POOL SURFACE VELOCITYVS ELEVATION
FIGURE 4 40
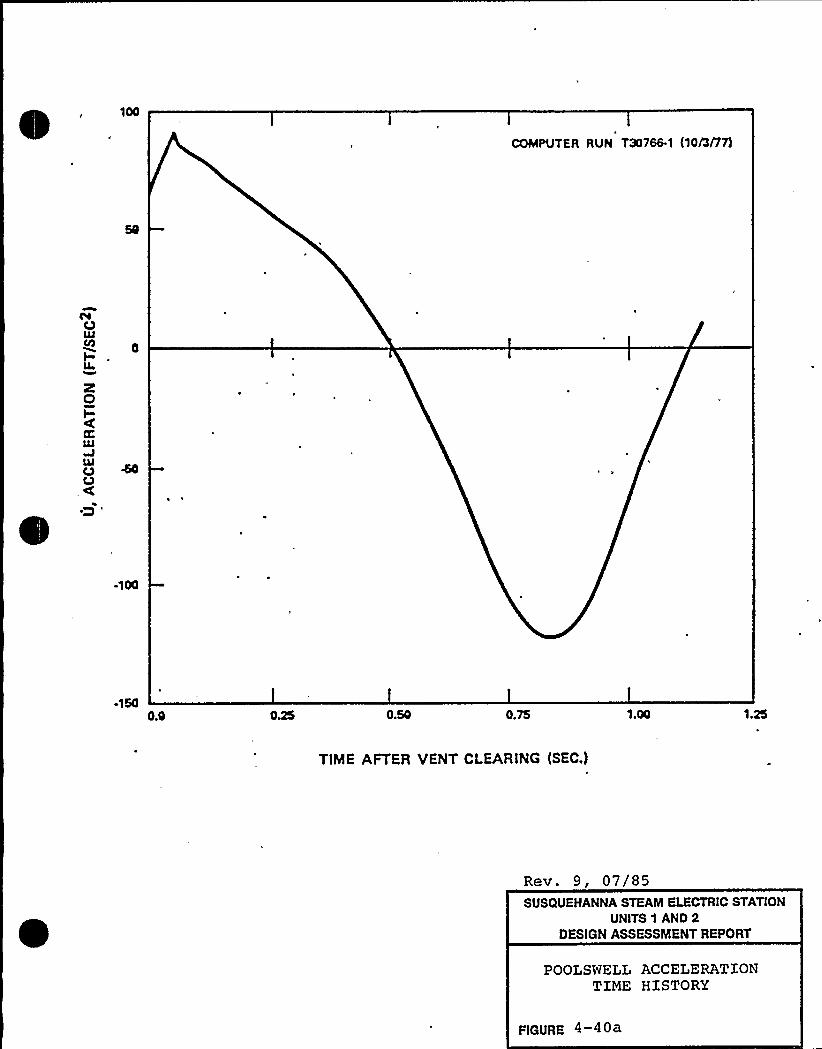
COMPUTER RUN 730766-1 (10/3/77
cvCDLLI
0CO
u
RO
KlLl
YJ
-100
-1500.1 0.25 0.50 0.75 1.25
TIME AFTER VENT CLEARING (SEC.)
Rev. 9, 07/85SUSQUEHANNA STEAM ELECTRIC STATION
UNITS 1 AND 2DESIGN ASSESSMENT REPORT
POOLSWELL ACCELERATIONTIME HISTORY
FIGURE 4-4»
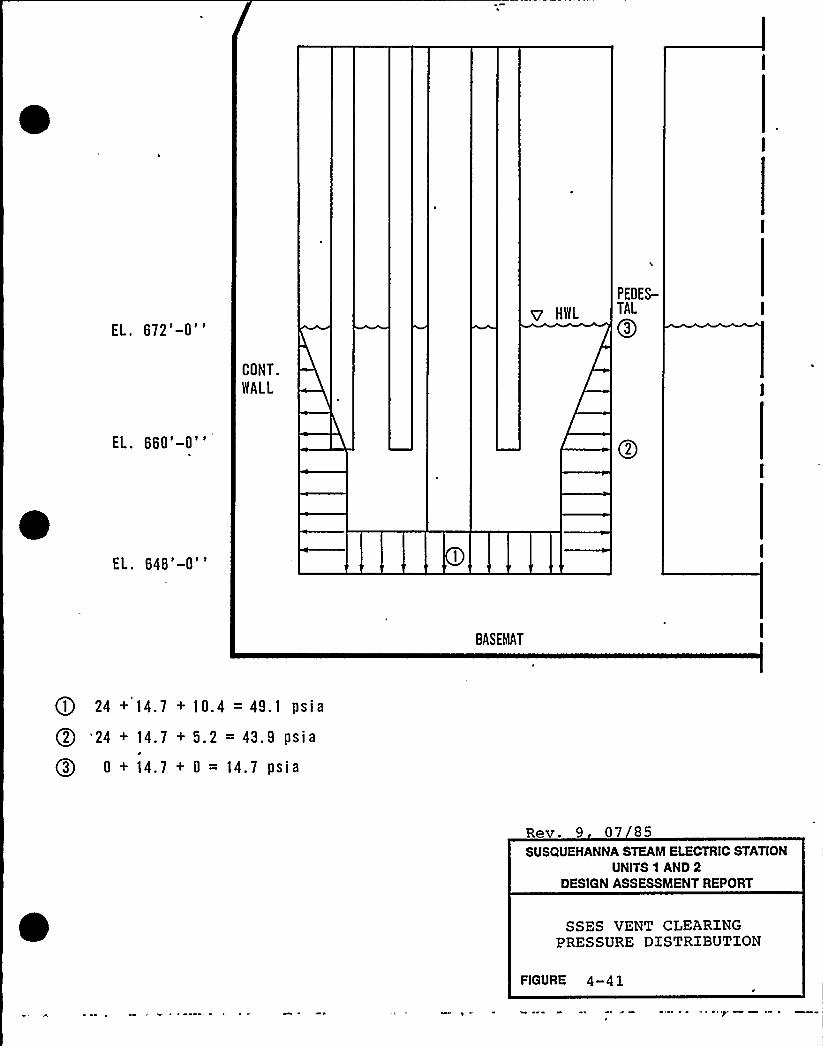
EL. 672'-0'' ~ HWL
PEDES-TAL
Q3
CONT.
WALL
EL. 660'-0''
EL. 648'-0''
BASEMAT
Ql 24 + 14. 7 + 10. 4 = 49.1 ps i a
Q2 -24 + 14.7 + 5.2 = 43.9 psia
Q3 0 + 14.7 + 0 = 14.7 psia
Rev. 9 07 85SUSQUEHANNA STEAM ELECTRIC STATION
UNITS 1 AND 2DESIGN ASSESSMENT REPORT
SSES VENT CLEARINGPRESSURE DISTRIBUTION
FIGURE 4-4 1
Rev. 9 07/85SUSQUEHANNA STEAM ELECTRIC STATION
UNITS 'I AND 2DESIGN ASSESSMENT REPORT
THIS FIGURE HAS BEENDELETED
FIGURE 4-4 2
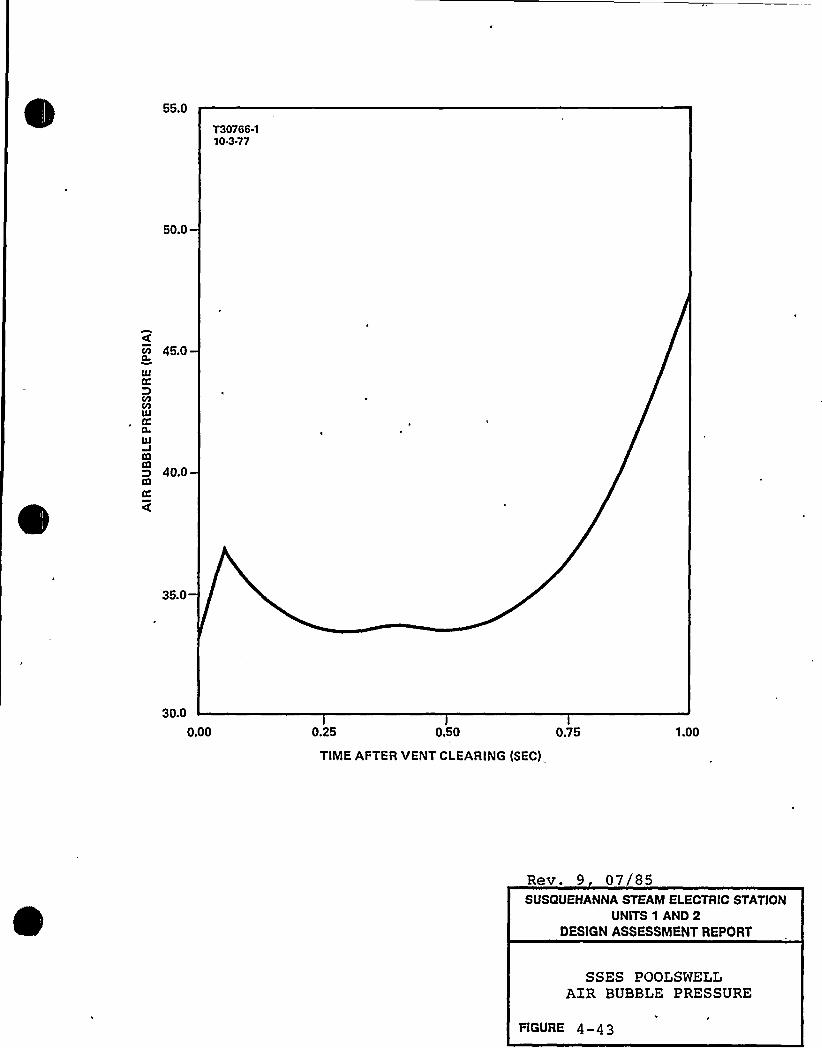
T30766-110.3-77
50.0
rn 450
KD
40.0
35.0
30.0
0.00 0.25 0.50 0.75 1.00
TIME AFTER VENT CLEARING (SEC)
Rev. 9 07/85SUSQUEHANNA STEAM ELECTRIC STATION
UNITS 1 AND 2DESIGN ASSESSMENT REPORT
SSES POOLSWELLAXR BUBBLE PRESSURE
FIGURE 4-4 3
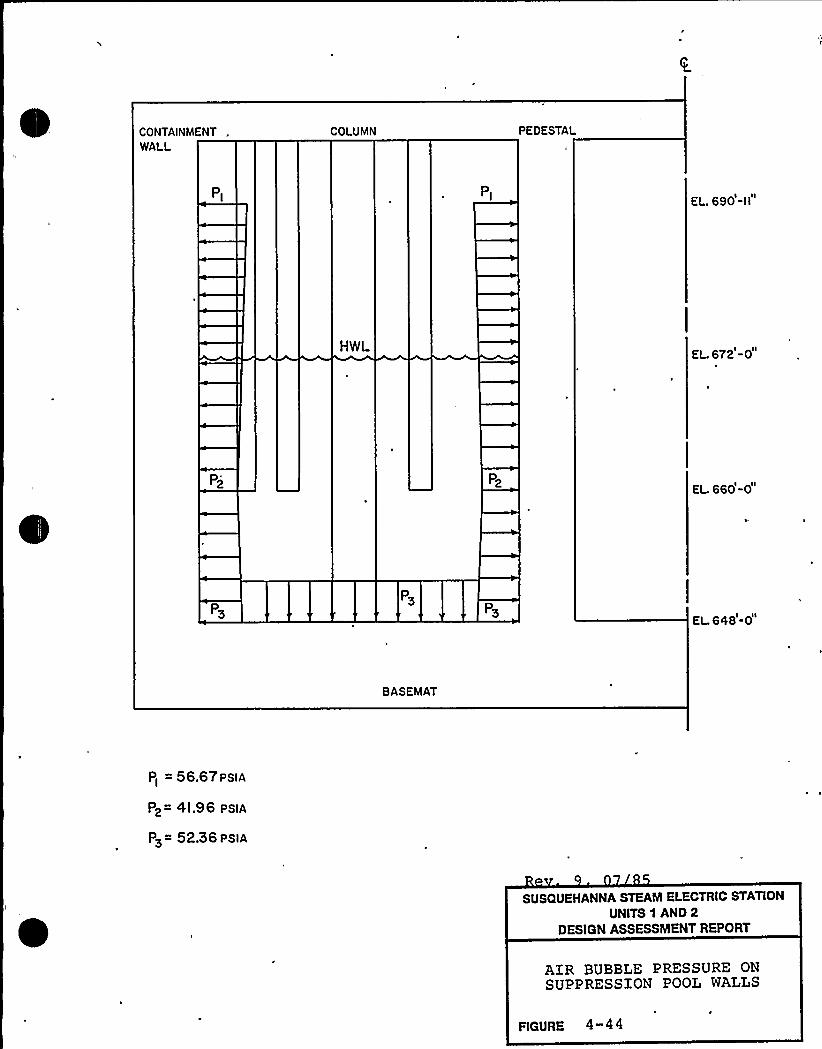
CONTAINMENTWALL
COLUMN PEDESTAL
PI PIEL. 690 -I I
HWLEL. 672 -0
P2 P2EL 660-0
PSPS
PpEL 648-0
BASEMAT
Pj 56 67PSIA
P2-" 4I.96 PSIA
P>= 52.36 < SIA
SUSQUEHANNA STEAM ELECTRIC STATION
UNITS 1 AND 2DESIGN ASSESSMENT REPORT
AIR BUBBLE PRESSURE ONSUPPRESSION POOL WALLS
FIGURE 4- 4 4
Rev. 9 07 85SUSQUEHANNA STEAM ELECTRIC STATION
UNITS 1 AND 2DESIGN ASSESSMENT REPORT
THIS FIGURE HAS BEENDELETED
FIGURE 4-4 4a
Rev. 9, 07/85SUSQUEHANNA STEAM ELECTRIC STATION
UNITS 1 AND 2DESIGN ASSESSMENT REPORT
THlS FlGURE HAS BEENDELETED
FIGURE 4 45
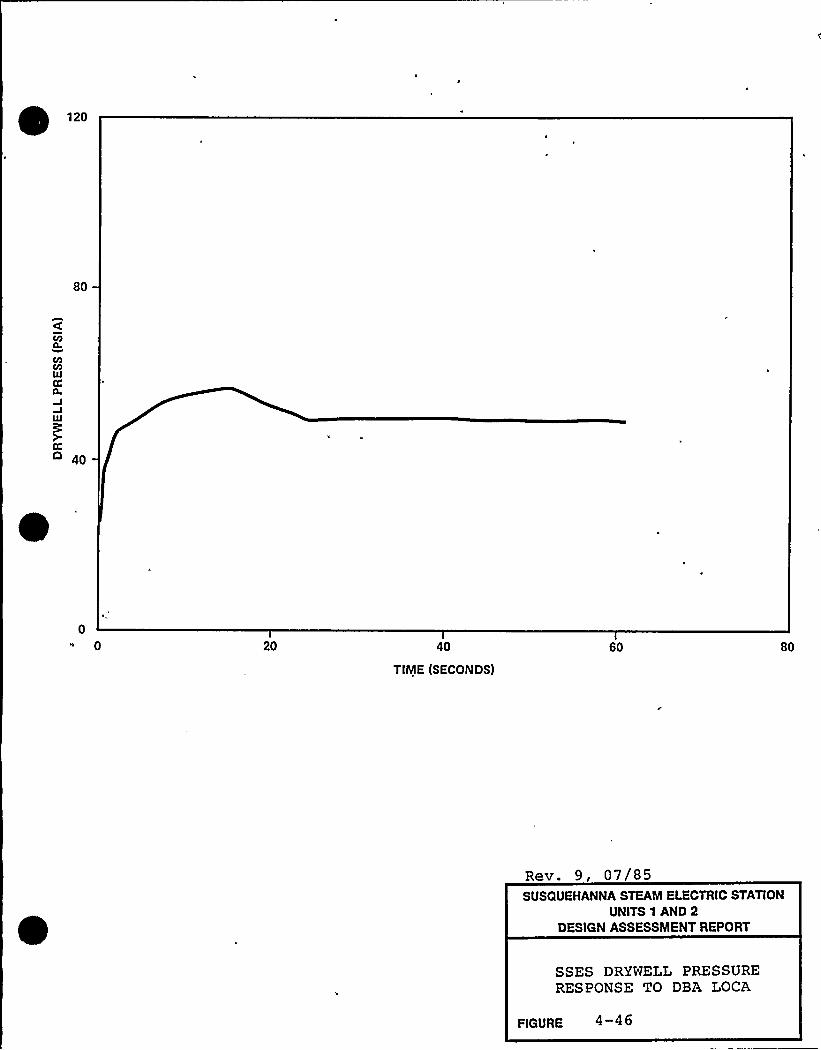
80
00 20 40
TIME (SECONDS)
60 80
Rev. 9, 07/85SUSQUEHANNA STEAM ELECTRIC STATION
UNITS 1 AND 2DESIGN ASSESSMENT REPORT
SSES DRYWELL PRESSURERESPONSE TO DBA LOCA
FIGURE 4 46
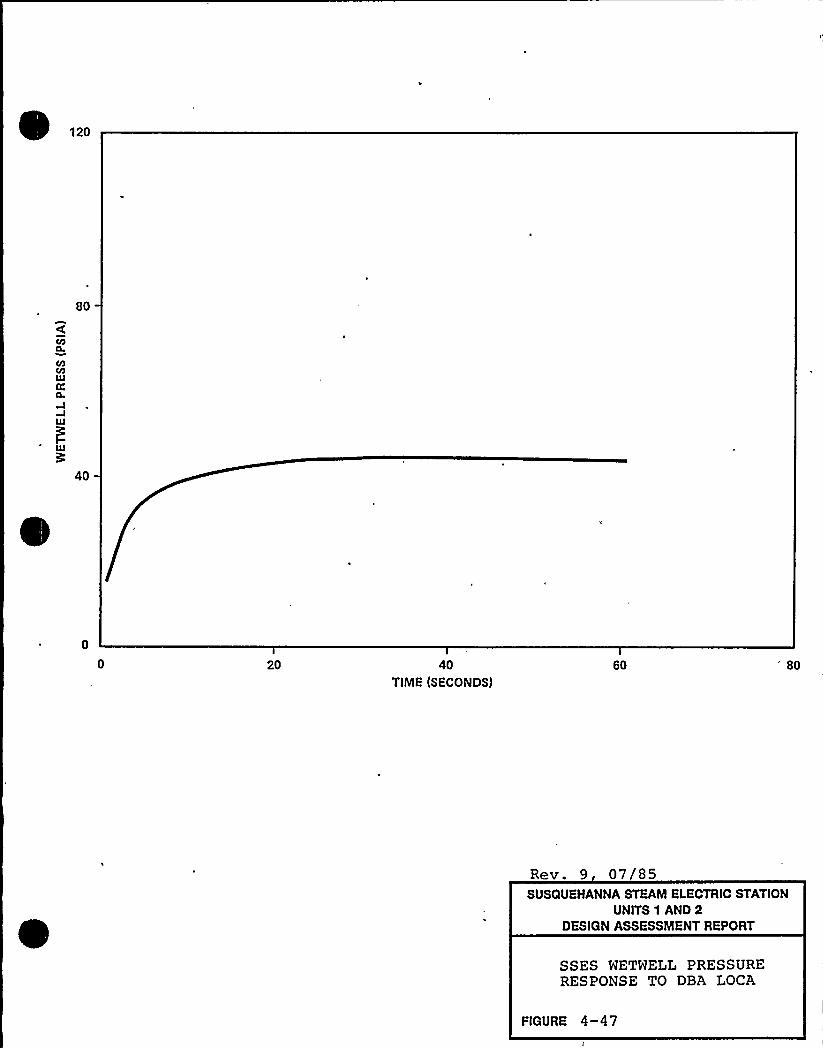
80
40
20 40TIME (SECONDS)
60 '0
Rev. 9 07 85SUSQUEHANNA STEAM ELECTRIC STATION
UNITS 1 AND 2DESIGN ASSESSMENT REPORT
SSES WETWELL PRESSURERESPONSE TO DBA LOCA
FIGURE 4-47
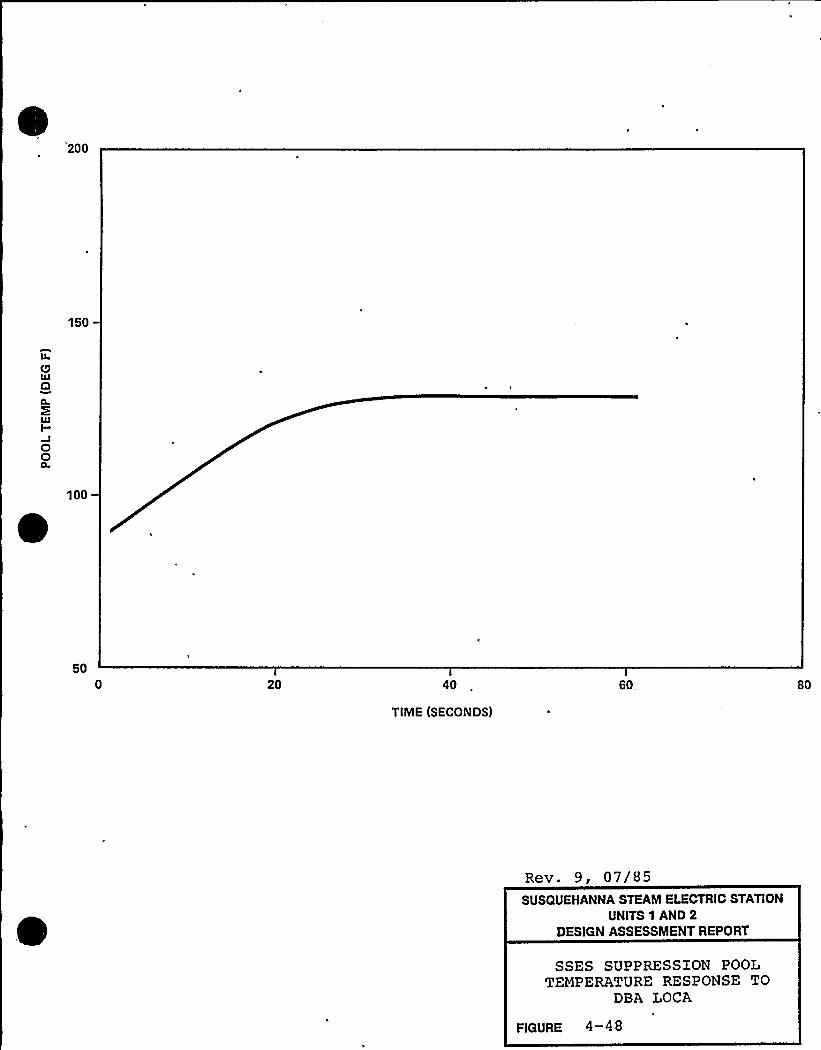
200
150
100
5020 40
TIME (SECONDS)
60, 80
Rev. 9, 07/85SUSQUEHANNA STEAM ELECTRIC STATION
UNITS 1 AND 2DESIGN ASSESSMENT REPORT
SSES SUPPRESSXON POOLTEMPERATURE RESPONSE TO
DBA LOCA
FIGURE 4-48
REFER TO FIGURE 6.2-3 OF THE FSAR (DRYWELLCURVE)
Rev. 9, 07/85SUSQUEHANNA STEAM ELECTRIC STATION
UNITS 1 AND 2DESIGN ASSESSMENT REPORT
SSES DRYNELL TEMPERATURERESPONSE FOR DBA LOCA
FIGURE 4-4 9
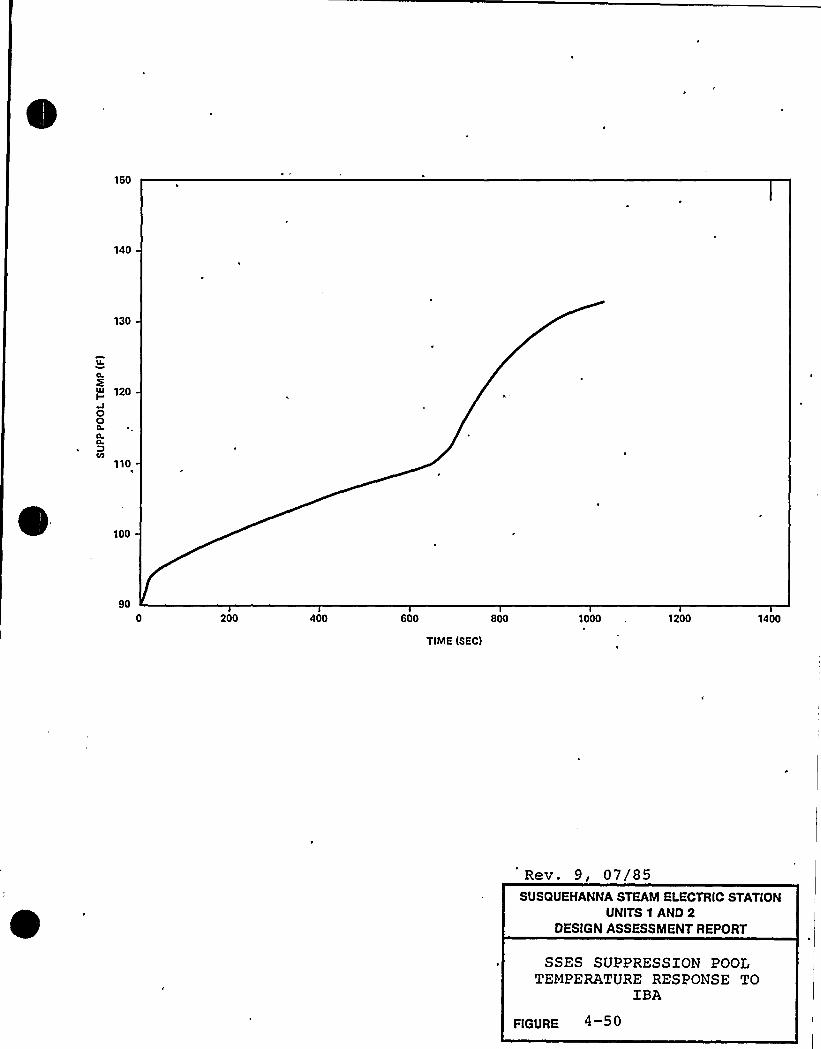
'150
140
130
120
O0
110
100
900 200 400 600
TIME (SEC)
1000 1200 1400
Rev. 9, 07/85SUSQUEHANNA STEAM ELECTRIC STATION
UNITS 1 AND 2DESIGN ASSESSMENT REPORT
SSES SUPPRESSION POOLTEMPERATURE RESPONSE TO
XBA
FIGURE 4

SEE FSAR FXGURE 6.2-14
(a) CONTAINMENTPRESSURE RESPONSE FOR INTERMEDIATEBREAK AREA
SEE FSAR FIGURE 6.2-l5
(b) DRYWELLTEMPERATURE RESPONSE FOR INTERMEDIATEBREAK AREA
Rev. 9, 07/85SUSQUEHANNA STEAM ELECTRIC STATION
UNITS 1 AND 2DESIGN ASSESSMENT REPORT
SSES PLANT UNIQUECONTAINMENT RESPONSE TO
THE XBA
FIGURE 4-5 1
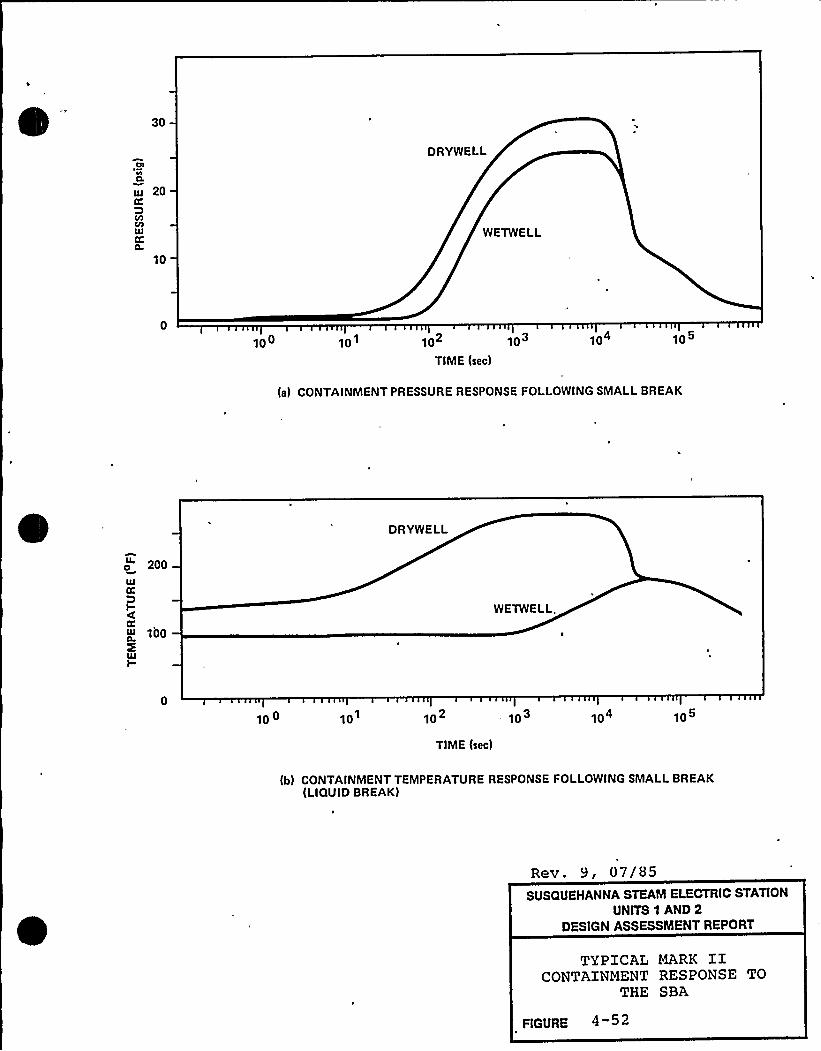
30
DRYWELL
ccrc 20
CDCDIllcs:0
10
WETWELL
1OO 101 102
TIME (sec)
103 1O4 10B
(a) CONTAINMENTPRESSURE RESPONSE FOLLOWING SMALLBREAK
DRYWELL
o 200
cs:DI
cs:
100
I~
WETWELL.
1Oo 10 10
TIME (sec)
103 1O4 1oB
(b) CONTAINMENTTEMPERATURE RESPONSE FOLLOWING SMALLBREAK(LIQUIDBREAK)
Rev. 9, 07/85SUSQUEHANNA STEAM ELECTRIC STATION
UNITS 1 AND 2DESIGN ASSESSMENT REPORT
TYPICAL MARK IICONTAINMENT RESPONSE TO
THE SBA
FIGURE 4
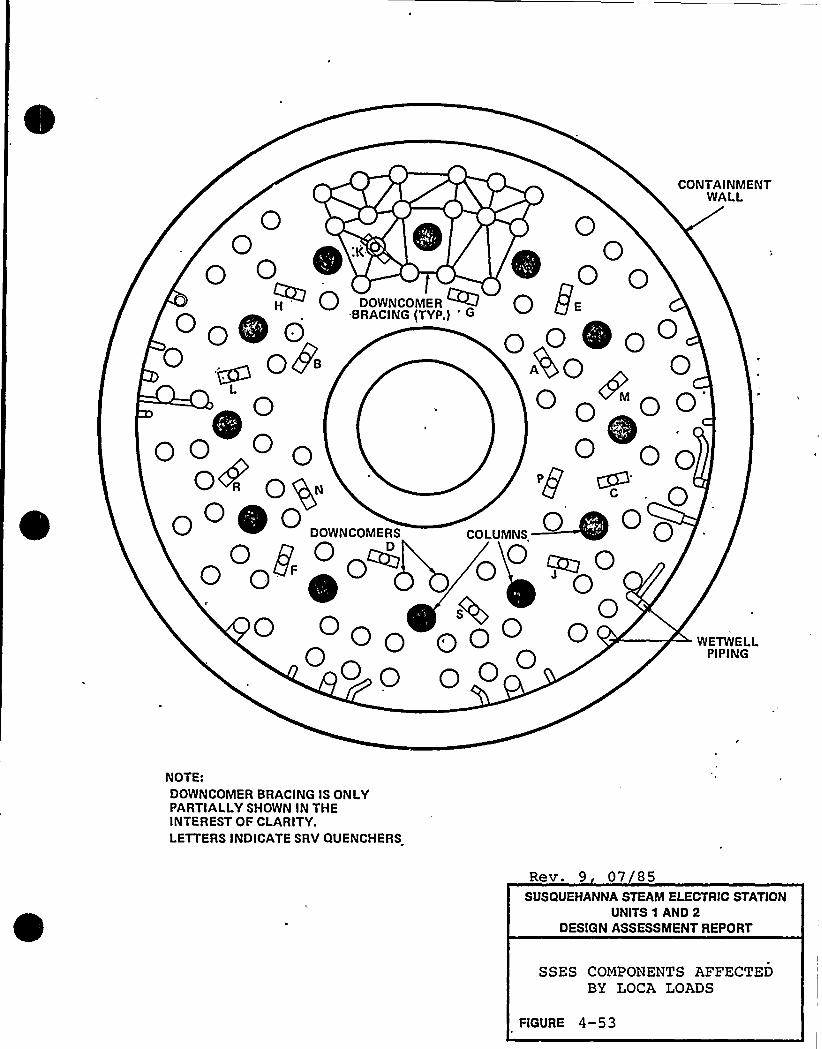
0 00
CONTAINMENTWALL
WETWELLPIPING
00 OOWNOOMER ~ Q gE000 ' 000
08~ AQ 00 0 '00'0
00 0 0004'~„ 00 0 0
DOWNCOMERS COLUMNS 0OgOQMO~O0 0'gs 00 000 GQO 0
0 00 00
NOTE:DOWNCOMER BRACING IS ONLYPARTIALLYSHOWN IN THEINTEREST OF CLARITY.LETTERS INDICATESRV QUENCHERS
Rev. 9 07 85SUSQUEHANNA STEAM ELECTRIC STATION
UNITS 1 AND 2DESIGN ASSESSMENT REPORT
SSES COMPONENTS AFFECTEDBY LOCA LOADS
FIGURE 4-53
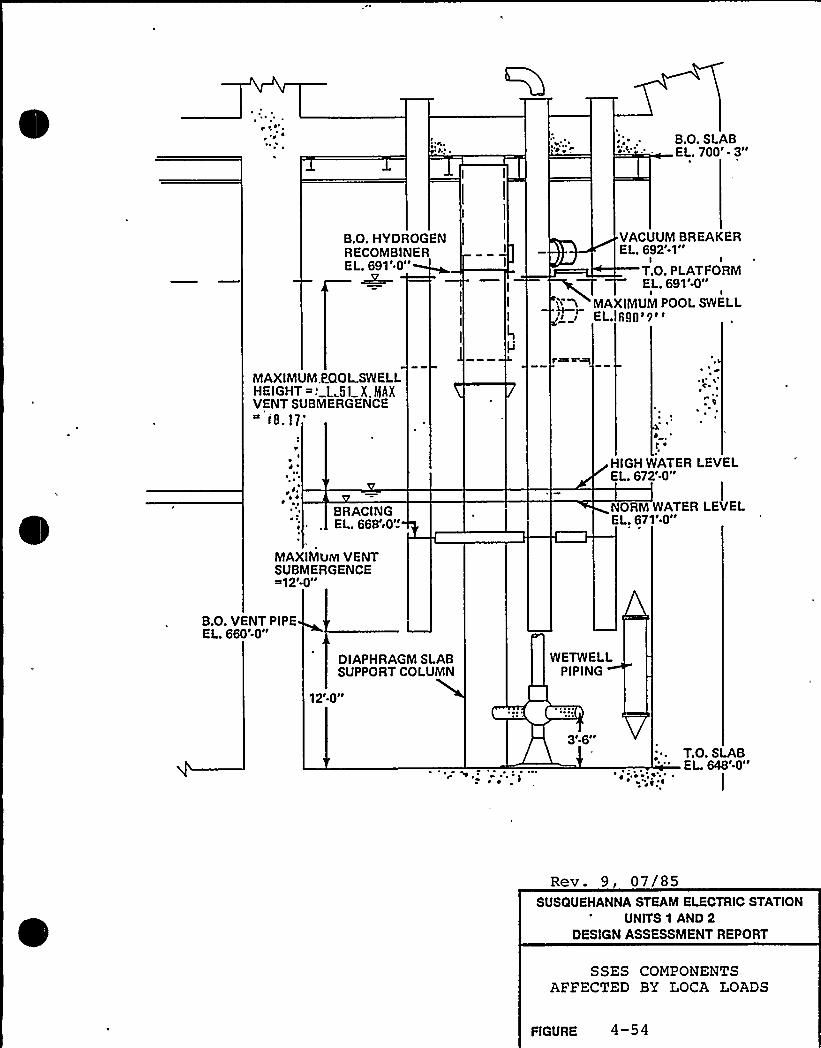
e ai'B.O. SLABEL. 700'-3"
B.O. HYDROGENRECOMBINEREL. 691'"
I
I
I„
MAXIMUMPOOEL.) AIIII~ O"
VACUUMBREAKEREL. 692'-1"
I I
T.O. PLATFORMEL. 691'-0"
L SWELL
MAXIMUM.PQOLSWELLHEIGHT .'.51 X.SAXVENT SUBMERGENCE
18.17'
C ~
HIGH WATER LEVEL
v'4
~ ~
BRACINGEL 668 c0
EL. 672'-0"
I
NORM WATER LEVELEL. 671'-0"
MAXIMuoaVENTSUBMERGENCE~12'-0"
B.O. VENT PIPEEL. 660'-0"
12-
DIAPHRAGMSLABSUPPORT COLUMN
0I~
WETWELLPIPING
3o 6I ~
T.O. SLABEL. 648'0"
Rev. 9 07/85SUSQUEHANNA STEAM ELECTRIC STATION
UNITS 1 AND 2DESIGN ASSESSMENT REPORT
SSES COMPONENTSAFFECTED BY LOCA LOADS
FIGURE 4-54

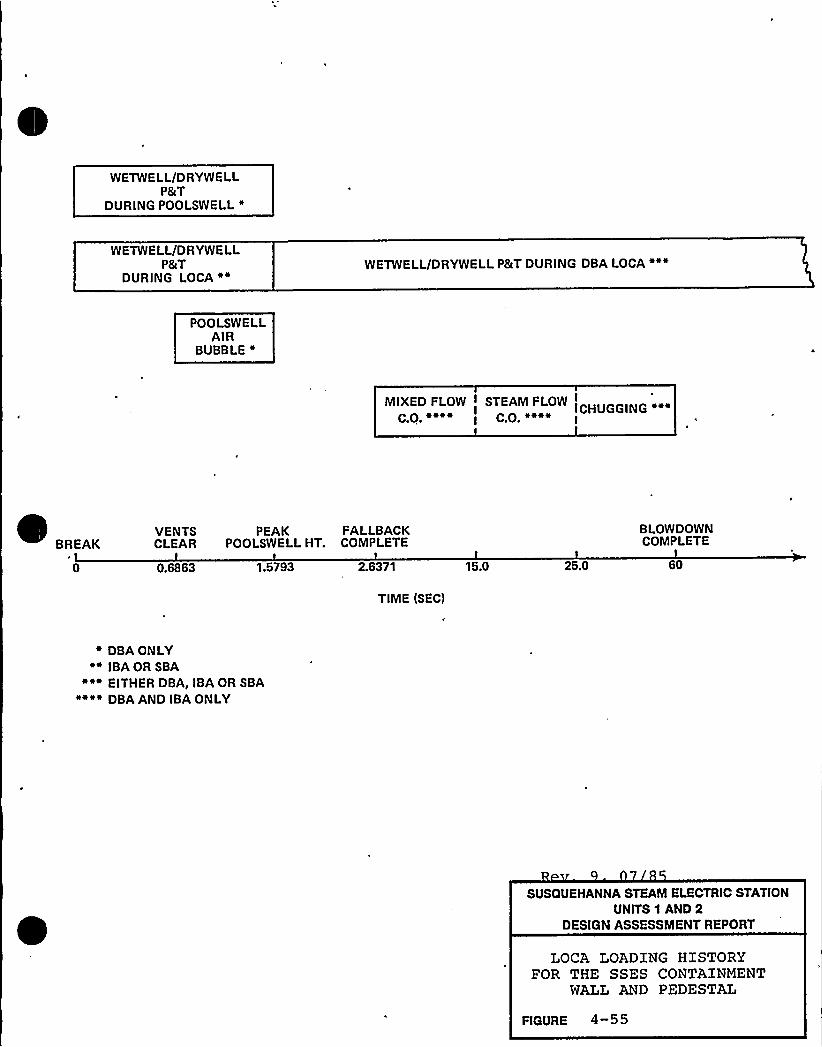
WETWELL/DRYWELLP&T
DURING POOLSWELL 4
WETWELL/DRYWELLP&T
DURING LOCA %"WETWELL/DRYWELLP&T DURING DBA LOCA """
POOLSWELLAIR
BUBBLE ~
MIXED FLOW STEAM FLOWI CHUGGING """
CP Iol1I CO %1%%I
BREAK
0
VENTS PEAK FALLBACKCLEAR POOLSWELL HT. COMPLETE
0.6863 1.5793 2.6371 15.0 25.0
8 LOWDOWNCOMPLETE
60
TIME (SEC)
% DBA ONLY"" IBAOR SBA
""" EITHER DBA, IBA OR SBA"""~ DBA AND IBAONLY
SUSQUEHANNA STEAM ELECTRIC STATIONUNITS 1 AND 2
DESIGN ASSESSMENT REPORT
LOCA LOADXNG HXSTORYFOR THE SSES CONTA|NMENT
WALL AND PEDESTAL
FIGURE 4-55
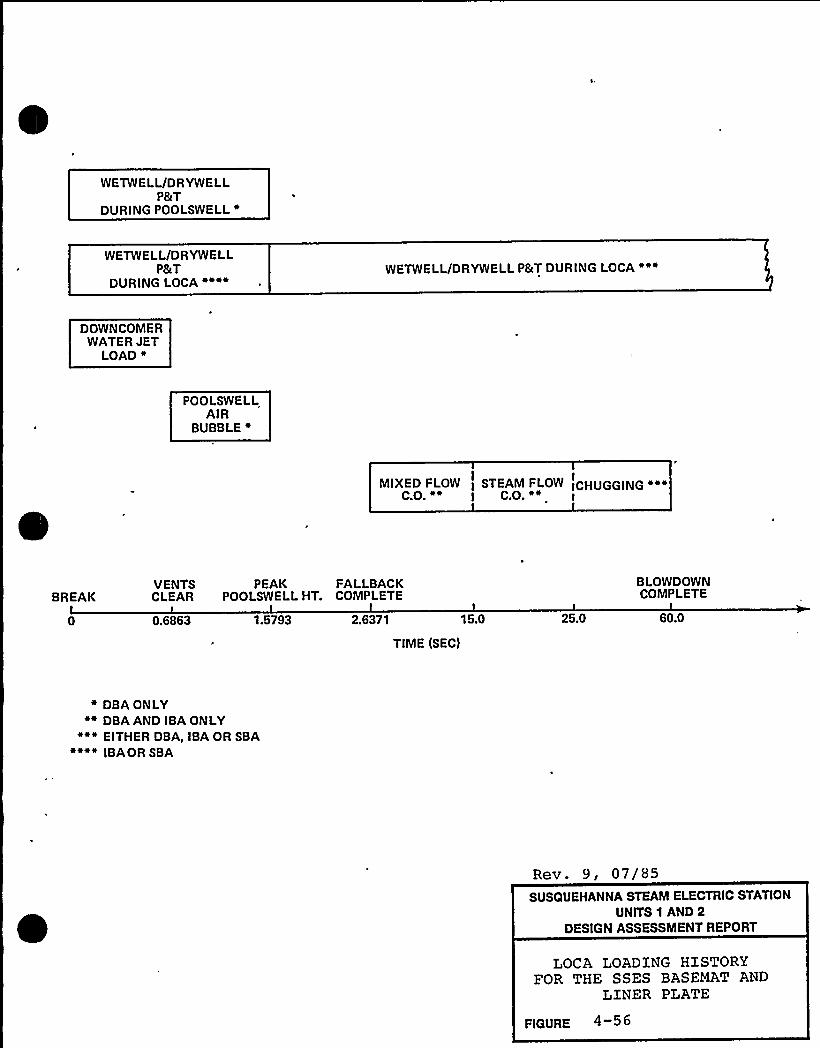
WETWELL/DRYWELLP&T
DURING POOLSWELL "
WETWELL/DRYWELLPST
DURING LOCA """~ WETWELL/DRYWELLPBcT DURING LOCA """
DOWNCOMERWATER JET
LOAD N
POOLSWELLAIR
BUBBLE 0
MIXED FLOWCO "~
STEAM FLOW ICHUGGING """I
C.O. ""
BREAKVENTS PEAK FALLBACKCLEAR POOLSWELL HT. COMPLETE
15.00.6863 1.5793 2.6371
TIME (SEC)
25.0
BLOWDOWNCOMPLETE
60.0
% DBA ONLYi" DBA AND ISA ONLY
~"i EITHER DBA, IBA OR SBA""""IBAOR SBA
Rev. 9, 07/85SUSQUEHANNA STEAM ELECTRIC STATION
UNITS 1 AND 2DESIGN ASSESSMENT REPORT
LOCA LOADXNG HXSTORYFOR THE SSES BASEMAT AND
LINER PLATE
FIGURE 4-56

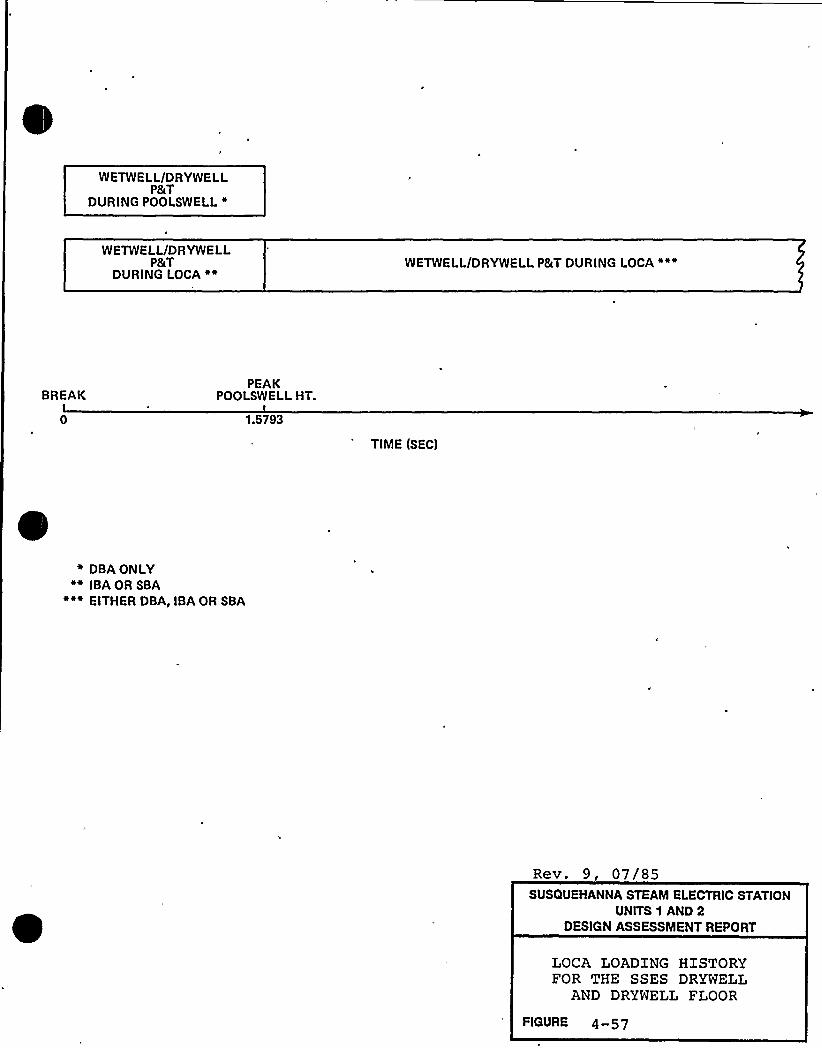
WETWELL/DRYWELLPET
DURING POOLSWELL %
WETWELL/DRYWELLP&T
DURING LOCA "~ WETWELL/DRYWELLPST DURING LOCA """
BREAKPEAK
POOLSWELL HT.
1.5793
TIME (SEC)
% DBA ONLY"" IBAOR SBA
~i" EITHER DBA, IBAOR SBA
Rev. 9, 07/85SUSQUEHANNA STEAM ELECTRIC STATION
UNITS 1 AND 2DESIGN ASSESSMENT REPORT
LOCA LOADING HISTORYFOR THE SSES DRYWELL
AND DRYWELL FLOOR
FIGURE 4-57

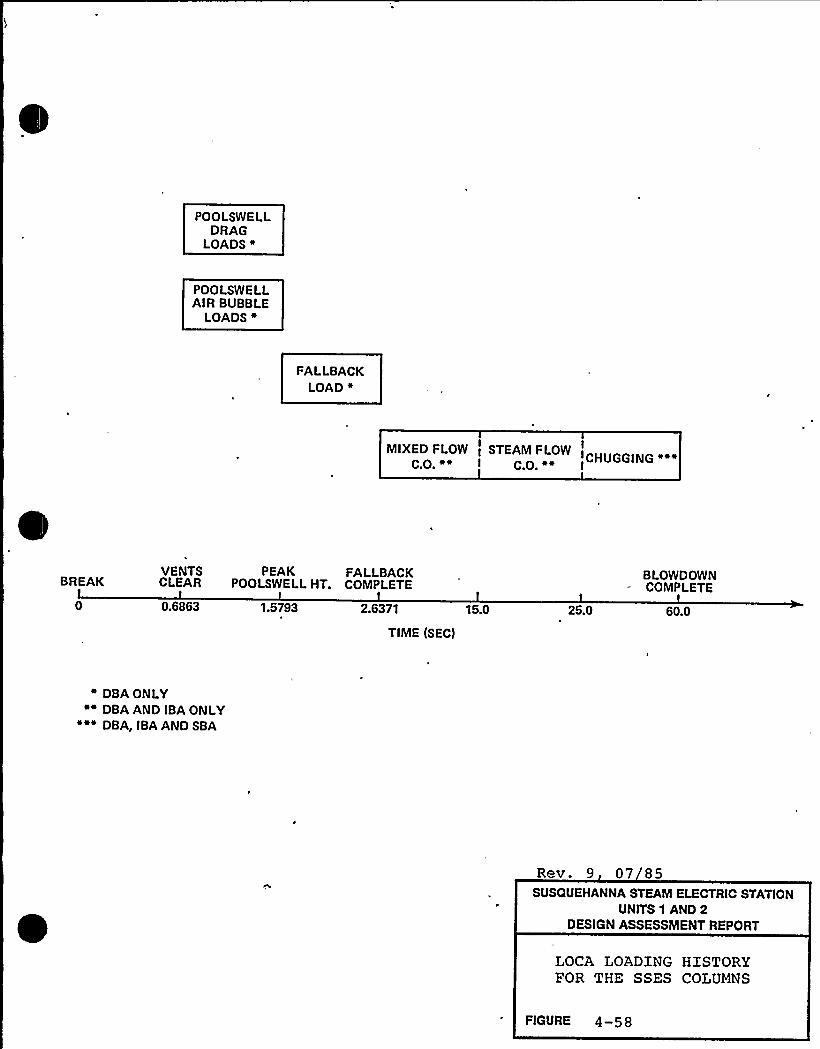
POOLSWELLDRAG
LOADS 4
POOLSWELLAIR BUBBLE
LOADS 4
FALLBACKLOAD "
MIXED FLOW I STEAM FLOWICHUGGING %%%
CO ~" I CO»"
BREAKVENTS PEAK FALLBACKCLEAR POOLSWELL HT. COMPLETE
BLOWDOWNCOMPLETE
0.6863 1.5793 2.6371
TIME (SEC)
15.0 25.0 60.0
% DBA ONLYii DBA AND IBA ONLY~~~ DBA, IBAAND SBA
Rev. 9 07 85SUSQUEHANNA STEAM ELECTRIC STATION
UNITS 1 AND 2DESIGN ASSESSMENT REPORT
LOCA LOADING HISTORYFOR THE SSES COLUMNS
FIGURE 4-58

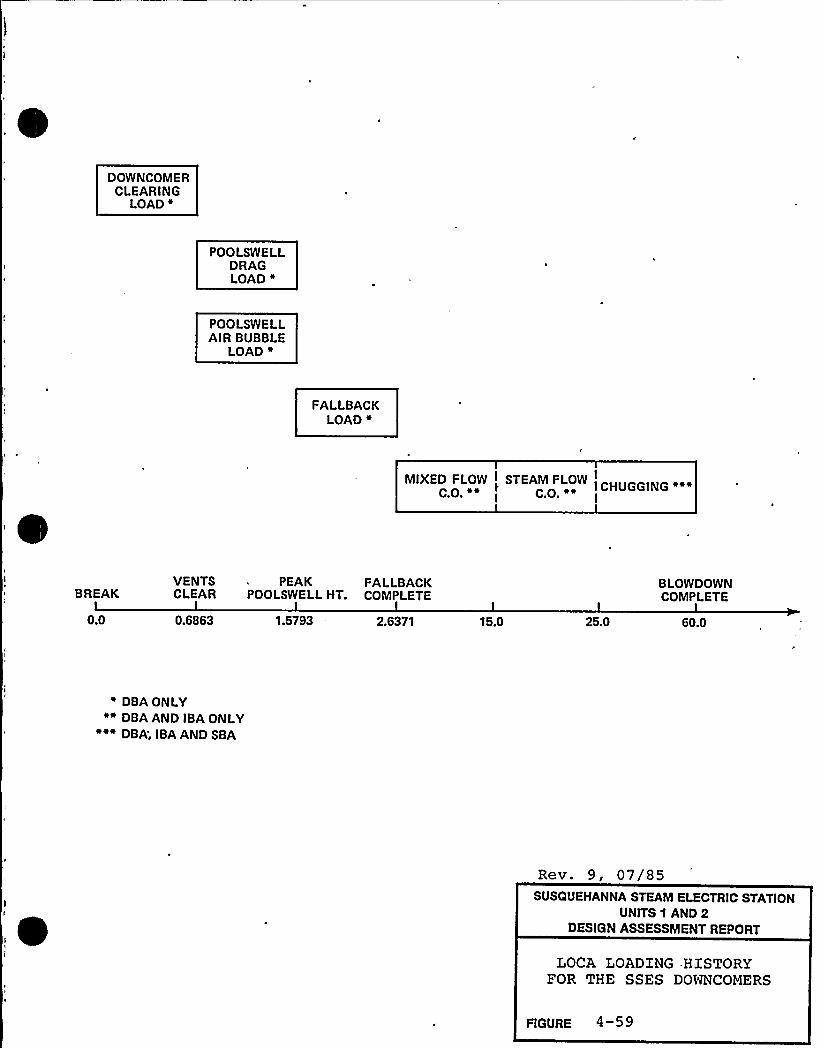
DOWNCOMERCLEARING
LOAD ~
POOLSWELLDRAGLOAD "
POOLSWELLAIR BUBBLE
LOAD "
FALLBACKLOAD 4
MIXED FLOW STEAM FLOWI CHUGGING """I I
CP s» CO ~"
BREAK
0.0
VENTS PEAK FALLBACKCLEAR POOLSWELL HT. COMPLETE
0.6863 1.5793 2.6371 15.0 25.0
BLOWDOWNCOMPLETE
60.0
" DBA ONLY"" DBA AND IBAONLY
""~ DBA; IBAAND SBA
Rev. 9, 07/85SUSQUEHANNA STEAM ELECTRIC STATION
UNITS 1 AND 2DESIGN ASSESSMENT REPORT
LOCA LOADING HISTORYFOR THE SSES DOWNCOMERS
FIGURE 4
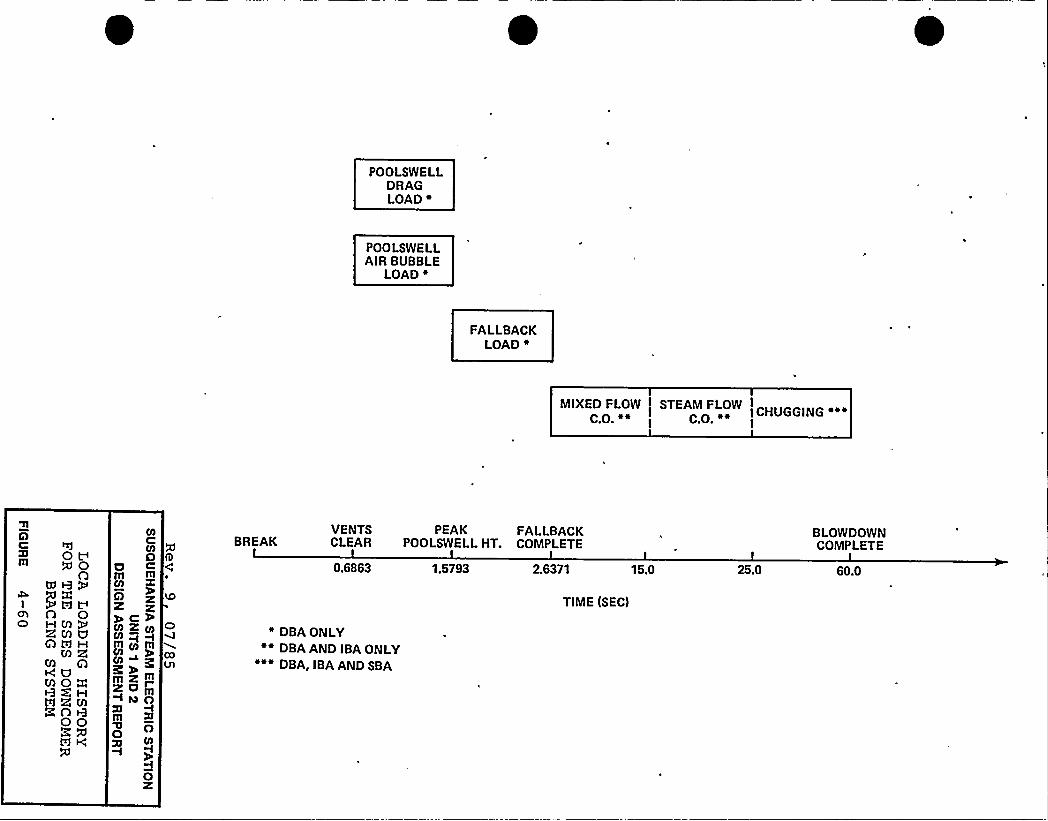
POOLSWELLDRAGLOAD 4
POOLSWELLAIR BUBBLE
LOAD i
FALLBACKLOAD %
MIXED FLOWC.O. ~~
STEAM FLOWCHUGGING «a»
CP aa
COVm
n
5tdVA 00 HMQRO)UA ta w
M 2sM QCUROW8ZHARMNOH
OOFXWK
OlC
0C
m
9 z2 zye%M z gy
mugCO
mzmZOrIM~
goLJ
lO
0z
BREAK
0.6863 1.5793 2.6371
TIME (SEC)
4 DBA ONLYDBA AND IBAONLY
" DBA, IBAAND SBA
VENTS PEAK FALLBACKCLEAR POOLSWELL HT. COMPLETE
15.0 25.0
BLOWDOWNCOMPLETE
60.0
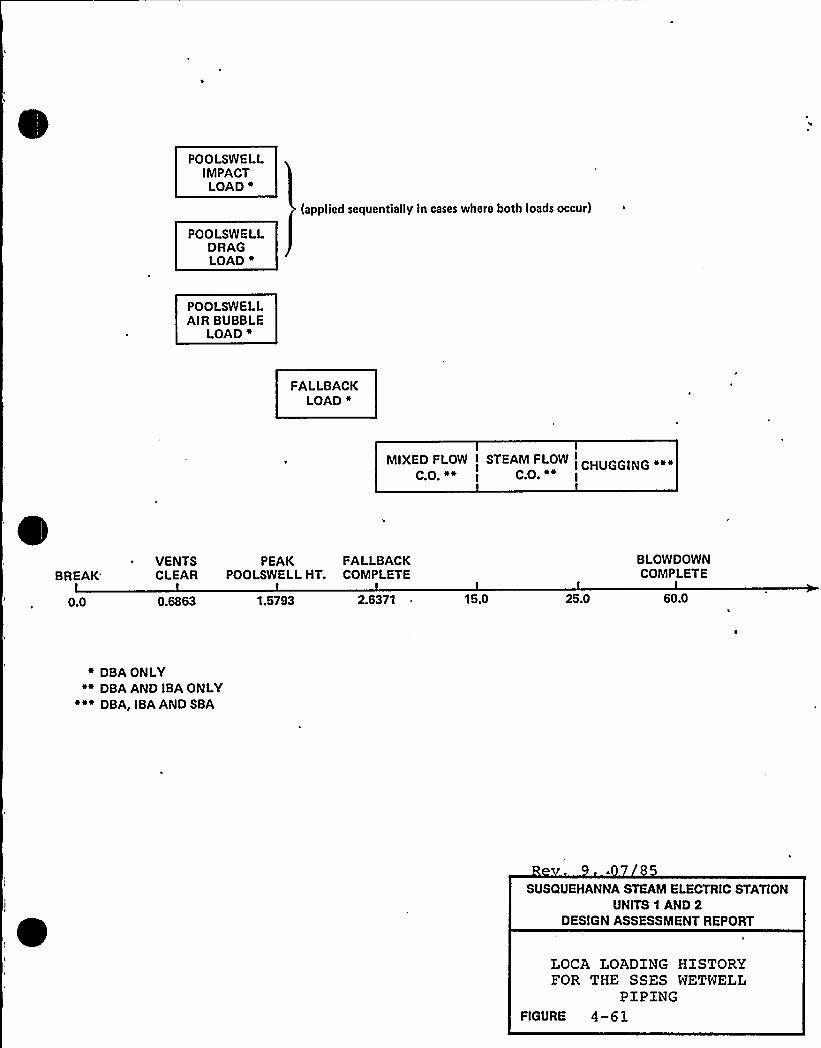
POOLSWELLIMPACTLOAD "
POD LSWE LLDRAGLOAD 0
(applied sequentially in cases where both loads occur) ~
POOLSWELLAIR BUBBLE
LOAD "
FALLBACKLOAD 4
XED FLOW I STEAM FLOWC.O. "
I C.O.
BREAK"
0.0
VENTS PEAK FALLBACKCLEAR POOLSWELL HT. COMPLETE
0.6863 1.5793 2.6371 15.0 25.0
BLOWDOWNCOMPLETE
60.0
4 DBA ONLY%% DBA AND IBA ONLY
~i" DBA, IBAAND SBA
SUSQUEHANNA STEAM ELECTRIC STATIONUNITS 1 AND 2
DESIGN ASSESSMENT REPORT
LOCA LOADING HISTORYFOR THE SSES WETWELL
PIPINGFIGURE 4- ia 1

Rev.SUSQUEHANNA STEAM ELECTRIC STATION
UNITS 1 AND 2DESIGN ASSESSMENT REPORT
FIGURES 4-62a THRUHAVE BEEN DELETED
FIGURE 4-62a thru f
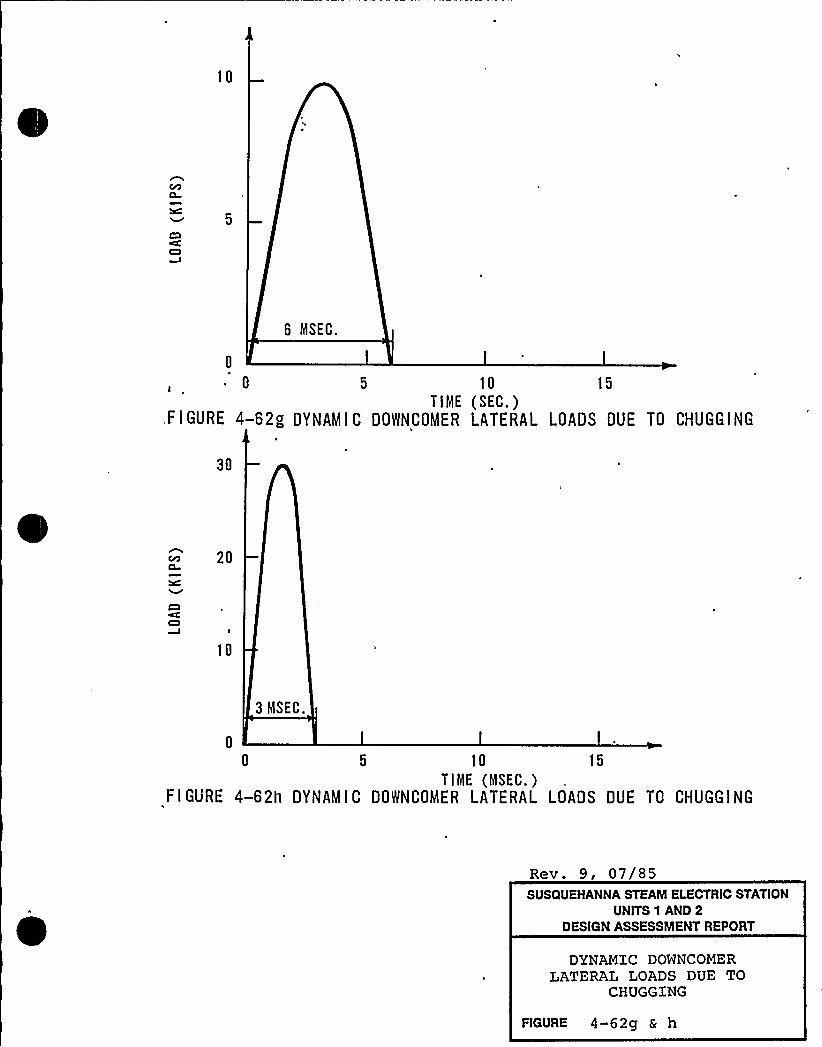
10
6 MSEC.
~ 0 5 10
TIME (SEC.)FIGURE 4-628 DYNAMIC DOWNCOMER LATERAL LOADS DUE TO CHUGGING
30
20
10
3 MSEC.
150 5 10
TIME (MSEC.)FIGURE 4-62I1 DYNAMIC DOWNCOMER LATERAL LOADS DUE TO CHUGGING
Rev. 9, 07/85SUSQUEHANNA STEAM ELECTRIC STATION
UNITS 1 AND 2DESIGN ASSESSMENT REPORT
DYNAMIC DOWNCOMERLATERAL LOADS DUE TO
CHUGGING
FIGURE 4-62c3 S( h
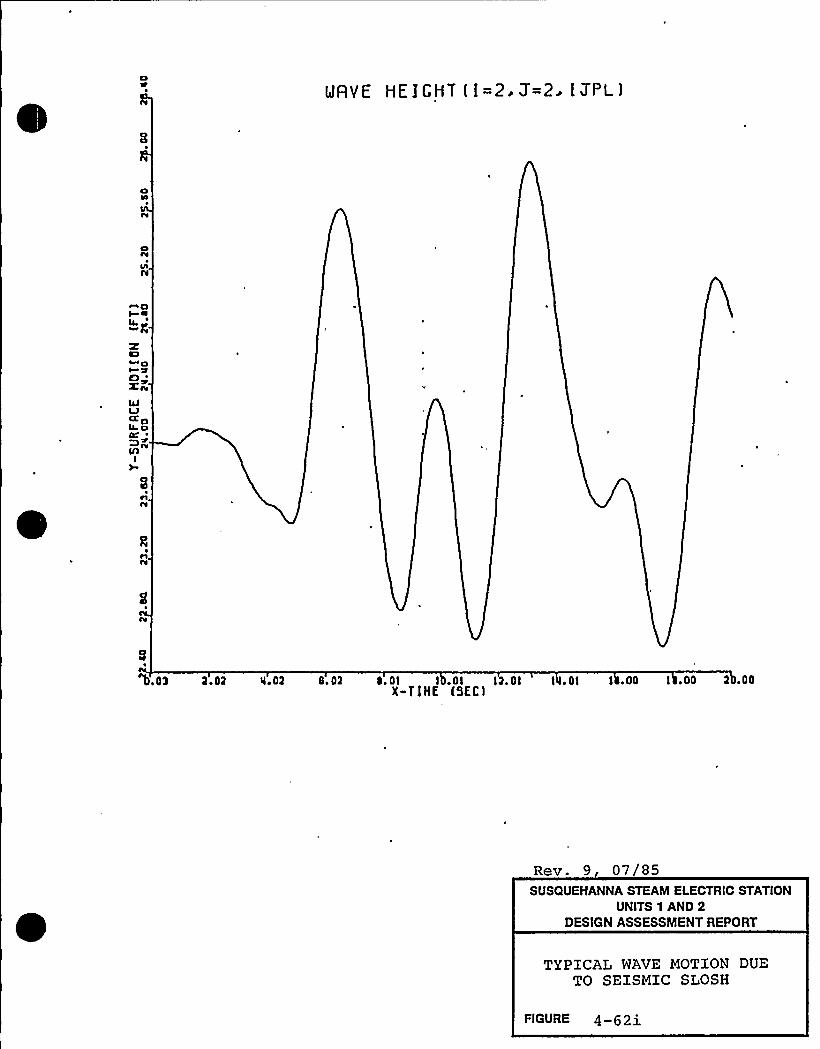
LlRVE HE I GHT ( I =2. 7=2 I ZPL)
CIee
Illn
4JLPaola agg ~
lAI
b 03 2 ~ D2 4 ~ 02 8 ~ 02 0 ~ Dl I Dl I ~ Dl I ~DI I ~ 00 I ~ 00 2 ~ 00X-T I HE (SIC I
Rev. 9 07/85SUSQUEHANNA STEAM ELECTRIC STATION
UNITS 1 AND 2DESIGN ASSESSMENT REPORT
TYPICAL WAVE MOTION DUETO SEISMIC SLOSH
FIGURE 4
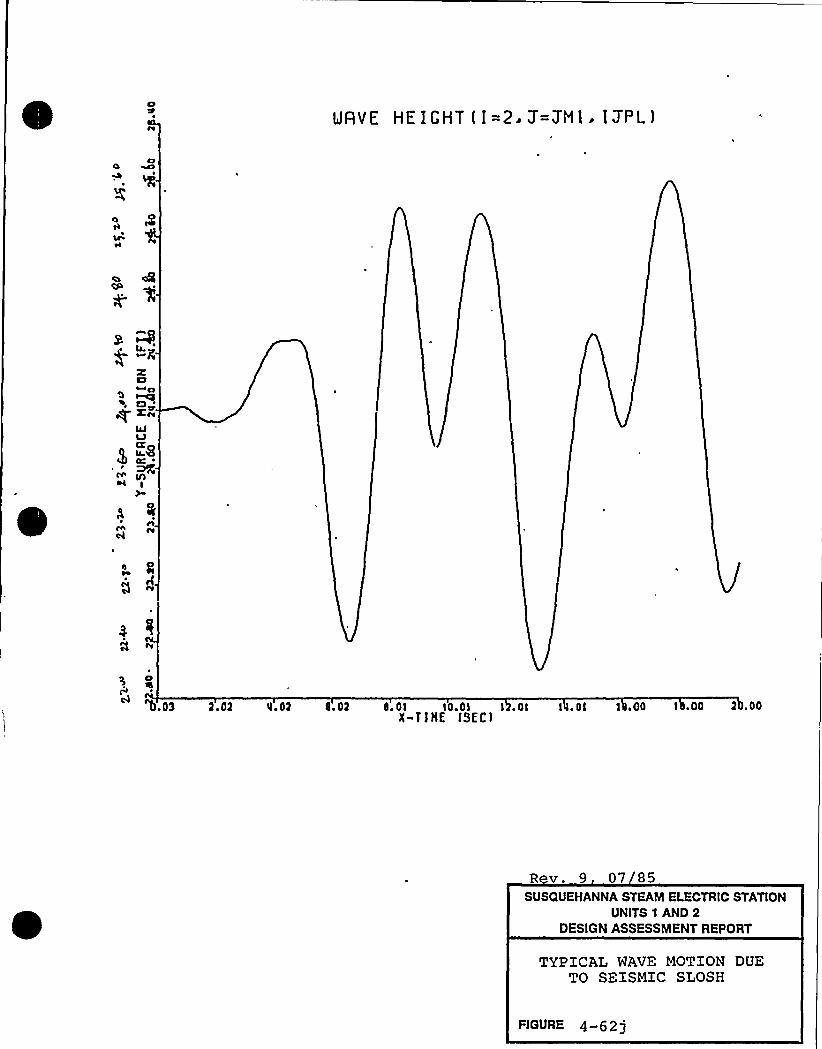
Ct
MAVEN HEIGHT ([=2. Z=ZN1 ~ IZPL)
O
g, W~h
~og
gf XnLLJIJ
g u4
c4~v
D
c4b.03 2.02 4.02 $ .02 $ .01 l0.0l I .Ol I ~ Ol 1 .00 I .00 2 .00
X-T ) IIE ISEC)
R v. 9 07 85SUSQUEHANNA STEAM ELECTRIC STATION
UNITS 1 AND 2DESIGN ASSESSMENT REPORT
TYPICAL WAVE MOTION DUETO SEISMIC SLOSH
FIGURE 4-62 j
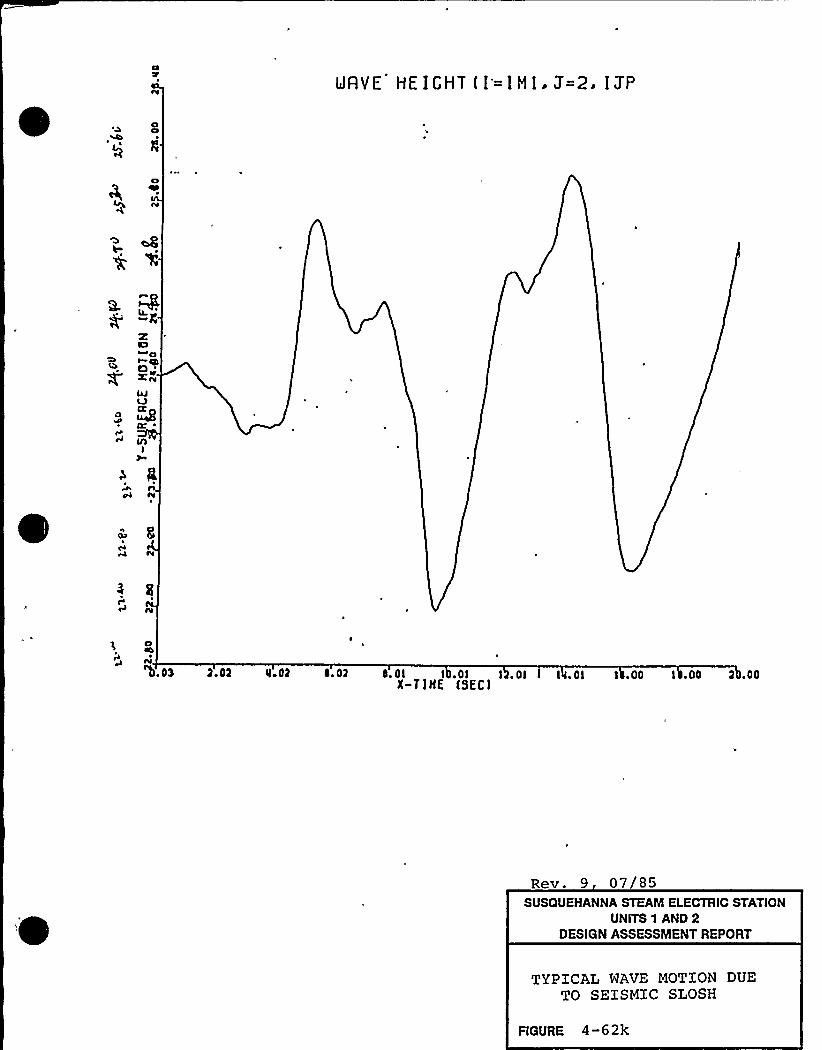
tS
IJRYE HE IGHT (I= t Nl ~ 7=2. I3'f'
C)~ao„Zn
o
lrI
gn
p4 IV
elr4 H
b.03 2.02 4 02 l.02 4. OI l .Ol I . Ol I . Ol I .00 I .00 2 .00X-TIHE ISECI
Rev. 9 07/85SUSQUEHANNA STEAM ELECTRIC STATION
UNITS 1 AND 2DESIGN ASSESSMENT REPORT
TYPICAL WAVE MOTION DUETO SEISMIC SLOSH
FIGURE 4-62k
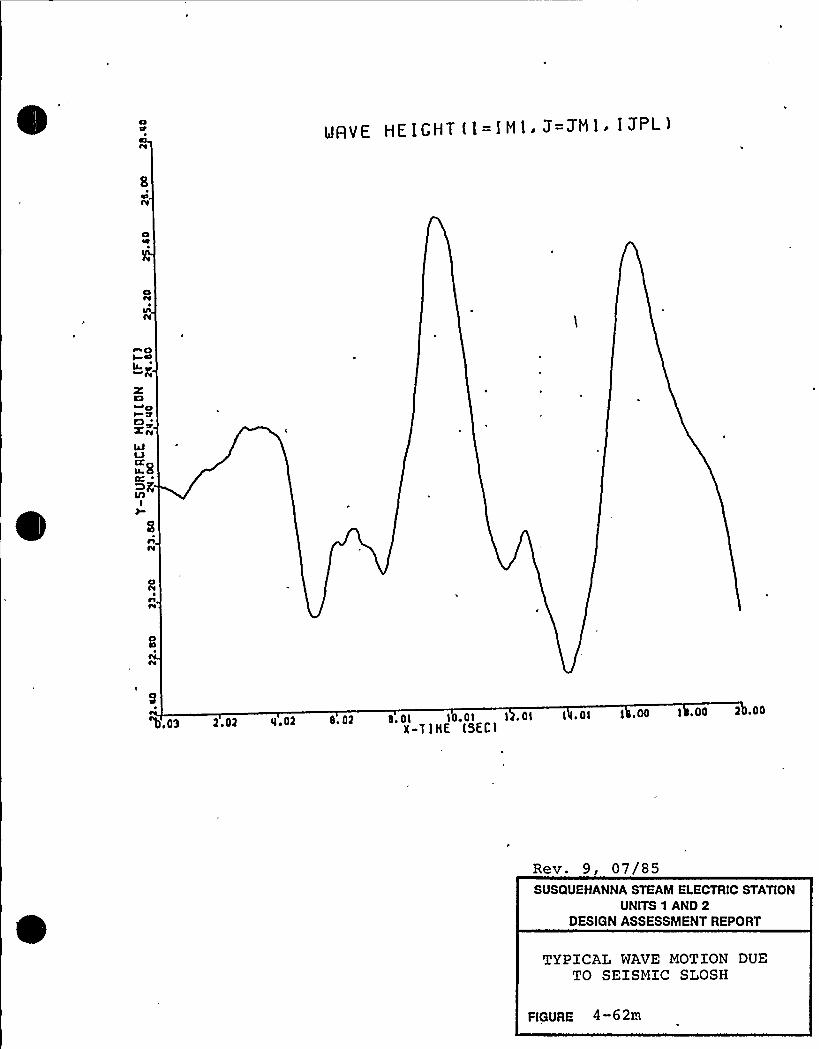
lJRVE HE IGHT (1= I Nl ~ Z=3H1 ~ I ZPL)
CI
0»XrvLILlCZg
IAI
anH
00 I .00 2 .00b 03 2.02 Q.02 S.D2 b. Ol lb.0l l ~ Ol I ~ Ol I ~
X-T IHK t5EI:I
Rev. 9, 07/85SUSQUEHANNA STEAM ELECTRIC STATION
UNITS 1 AND 2DESIGN ASSESSMENT REPORT
TYPICAL WAVE MOTION DUETO SEISMIC SLOSH
FIGURE 4-62m

85SUSdUEHANNA STEAM ELECTRIC STATION
UNITS 1 AND 2DESIGN ASSESSMENT REPORT
FIGURES 4-63 THRU 4-66 AREPROPRIETARY AND ARE FOUND INTHE PROPRIETARY SUPPLEMENTTO THIS DARFIGURE
Tables 4-1 through 4-1S are proprietary and are found in thepro prie tar y sup pie me n t to th is DAR.
Bev. 9, 07/85
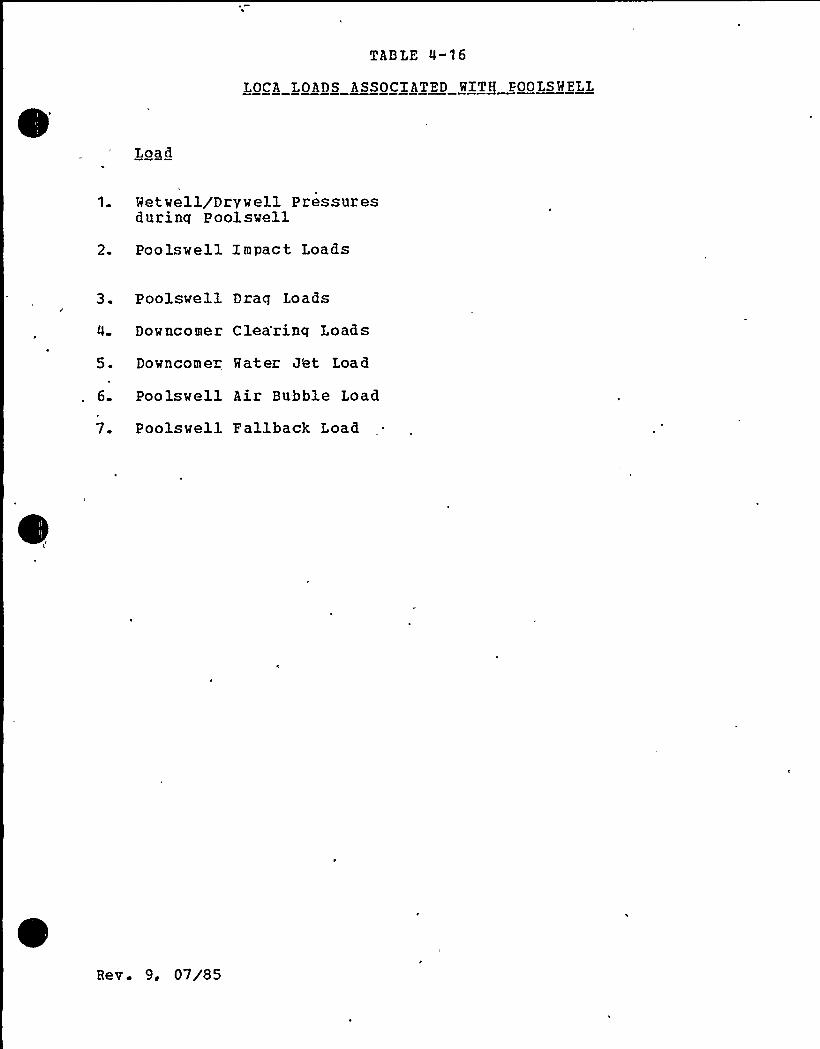
TABLE 4-16
LOCA LOADS ASSOCIATED HITH POOLS HELL
Load
1. Hetwe11/Drywell Pressuresduring Poolswell
2. Poolswell Impact Loads
3. Poolswell Drag Loads
4 Downcomer Clea'ring Loads
5. Downcomez Hater J'et Load
6. Poolswell Air Bubble Load
7. Poolswell Fallback Load
Rev. 9, 07/85

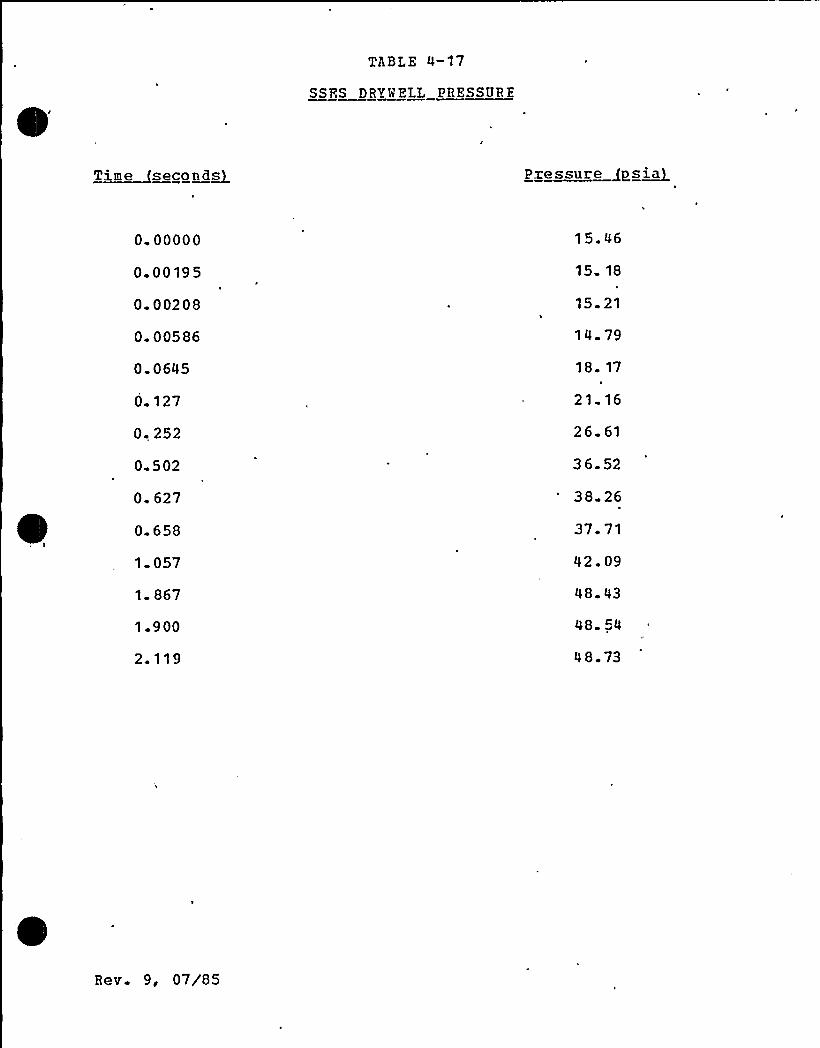
TABLE 4-17
SSES DRYMELL PRESSURE
T~ime second~s pze~ssure ps~ia
0. 00000
0. 0019 5
0 00208
0. 00586
0.0645
0. 127
0. 252
0 502
0. 627
0 658
1 057
1 867
1 900
2. 119
15. 46
15. 18
15. 21
14 79
18 17
21. 16
26 61
36.52
38. 26
37. 71
42. 09
48 43
48 54
48.73
Rev. 9, 07/85
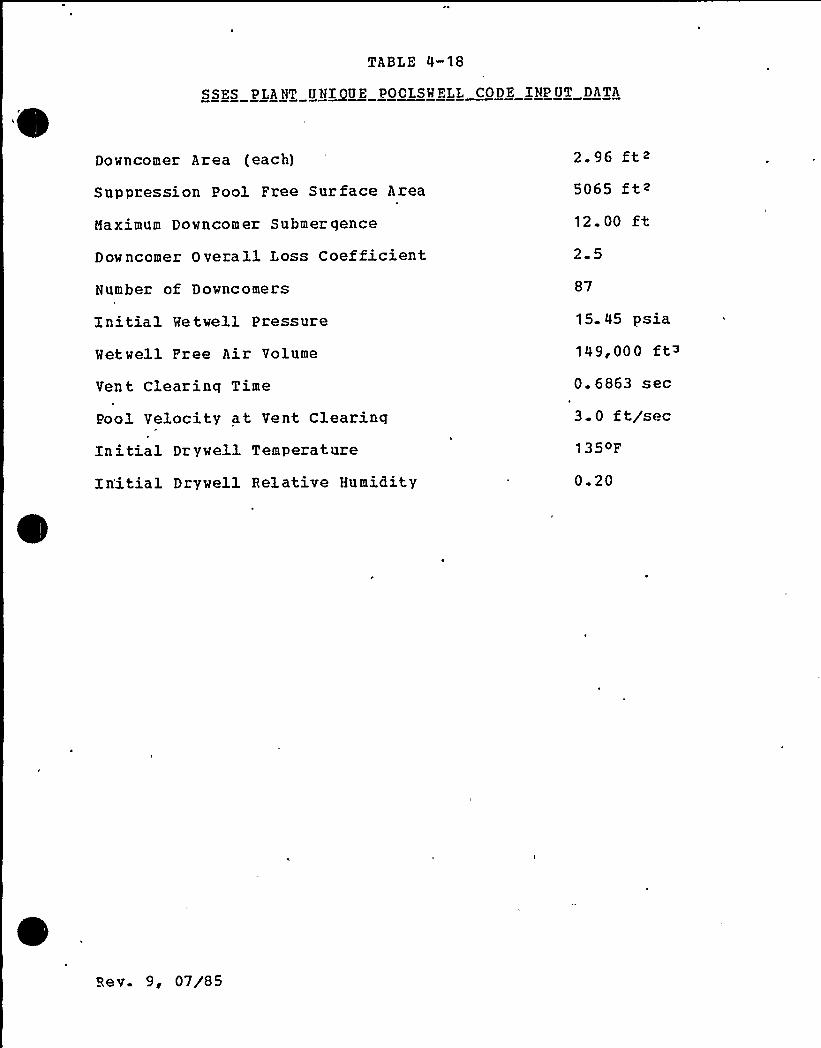
TABLE 4-18
SSES PLA NT U'N~IUE POOZSWELL CODE INP UT DATA
Downcomer Area (each)
Suppression Pool Free Sur face Area
Maximum Downcomer Submergence
Downcomer Overall Loss Coefficient
Number of Downcomers
Initial Hetwell Pressure
Hetwell Free Air Volume
Ven t Clearing Time
Pool Velocity at Vent Clearing
Initial Drywell Temperature
In'itial Drywell Helative Humidity
2.96 ft~5065 ft212. 00
2.5
87
15.45 psia
149,000 ft~
0. 6863 sec
3 0 ft/sec135~F
0.20
Be v. 9, 07/85

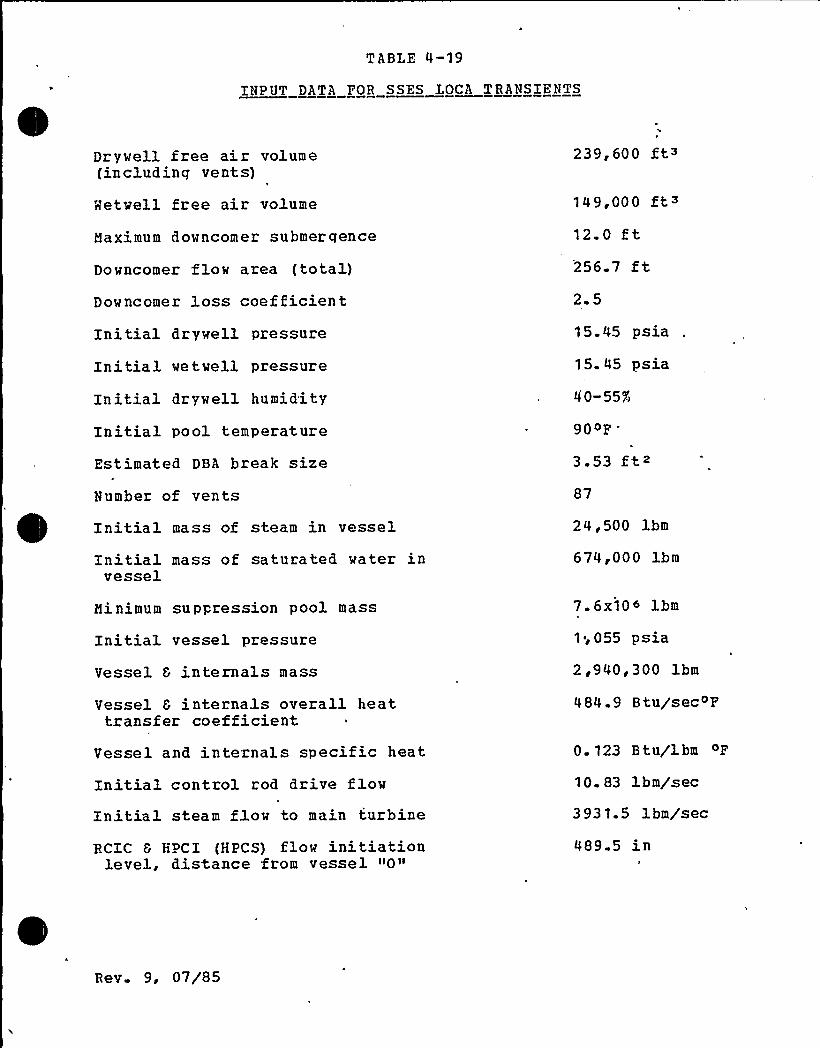
TABLE 4-19
INPUT DATA FOR SSES .LOCA TRANSIENTS
Drywell free air volume(including vents)
Retwell free air volume
Maximum downcomer submergence
Downcomer flow area (total)Downcomer loss coefficientInitial drywell pressure
Initial wetwell pressure
Initial drywell humidity
Initial pool temperature
Estimated DBA break size
Number of vents
Initial mass of steam in vessel
Initial mass of saturated water invessel
Minimum suppression pool mass
Initial vessel pressure
Vessel 6 internals mass
Vessel 6 internals overall heattrans fer coef ficient
239,600 ft~
149,000 ft~12.0 ft256.7 ft2.5
15. 45 psia
15. 45 psia
40-557)
90~F
3.53 ft~87
24,500 ibm
674,000 ibm
7. 6x10 ~ ibm
1;055 psia
2,940,300 ibm
484.9 B tu/secoF
Vessel and internals specific heat
Initial control rod drive flow
Initial steam flow to main turbine
RCIC 6 HPCI (HPCS) flow initiationlevel, distance from vessel "0»
0.123 Btu/ibm OF
10.83 ibm/sec
3931.5 ibm/sec
489.5 in
Rev. 9, 07/85
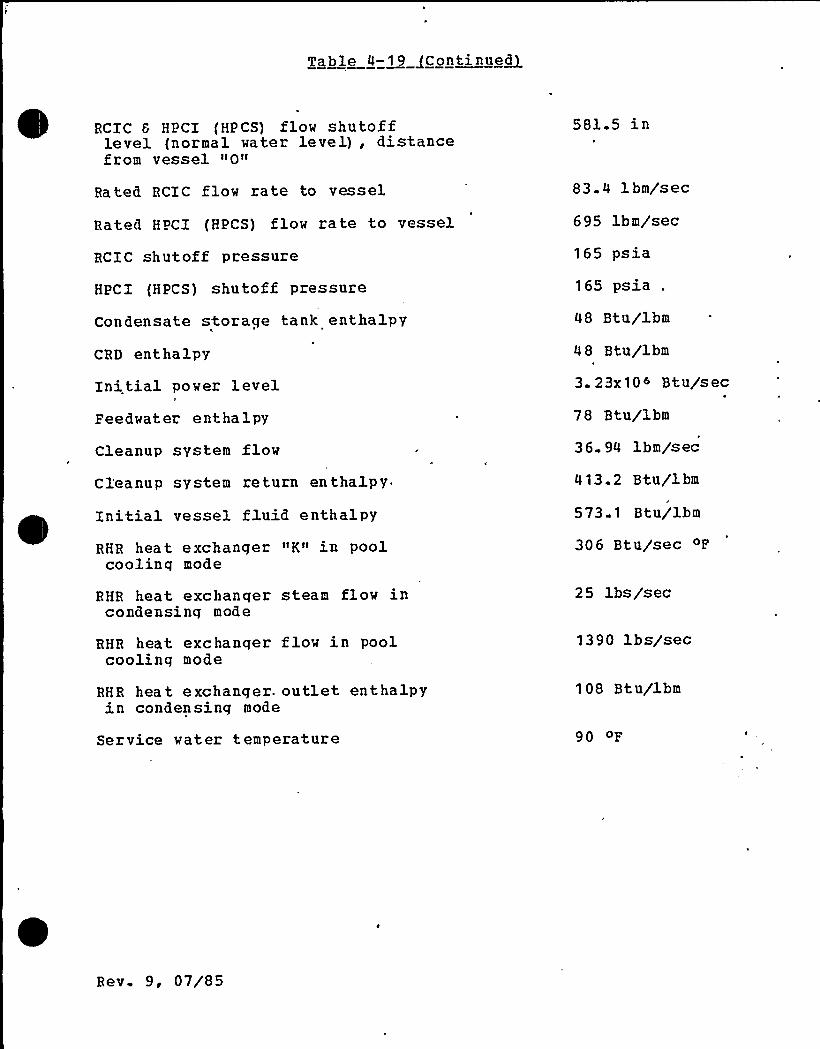
Table 4-19 QContinuedg
RCIC 6 HPCI (HPCS) flow shutof flevel (normal water level), distancefrom vessel "0"
Ra ted RCIC flow rate to vessel
Rated HPCI (HPCS) flow rate to vessel
RCIC shutoff pressure
HPCI (H PCS) shu toff pressure
Condensate storage tank enthalpy
CRD enthalpy
Initial power level
Feedwater entha 1py
Cleanup system flow
Cl'eanup system return enthalpy
Initial vessel fluid enthalpy
RHR heat exchanger "K" in poolcoolinq mode
RHR heat exchanqer steam flow incondensing mode
RHR heat exchanqer flow in poolcoolinq mode
RH R hea t e xc hang er. ou tl et en t ha lpyin condensing mode
Service water temperature
581.5 in
83.4 ibm/sec
695 ibm/sec
165 psia
165 psia .
48 Btu/ibm
4 8 Btu/ibm
3. 23x106 Btu/sec
78 Btu/ibm
36. 94 ibm/sec
413.2 Btu/ibm
573. 1 Btu/ibm
306 Btu/sec OF
25 lbs/sec
1390 lbs/sec
108 Btu/ibm
90 OF
Rev. 9, 07/85

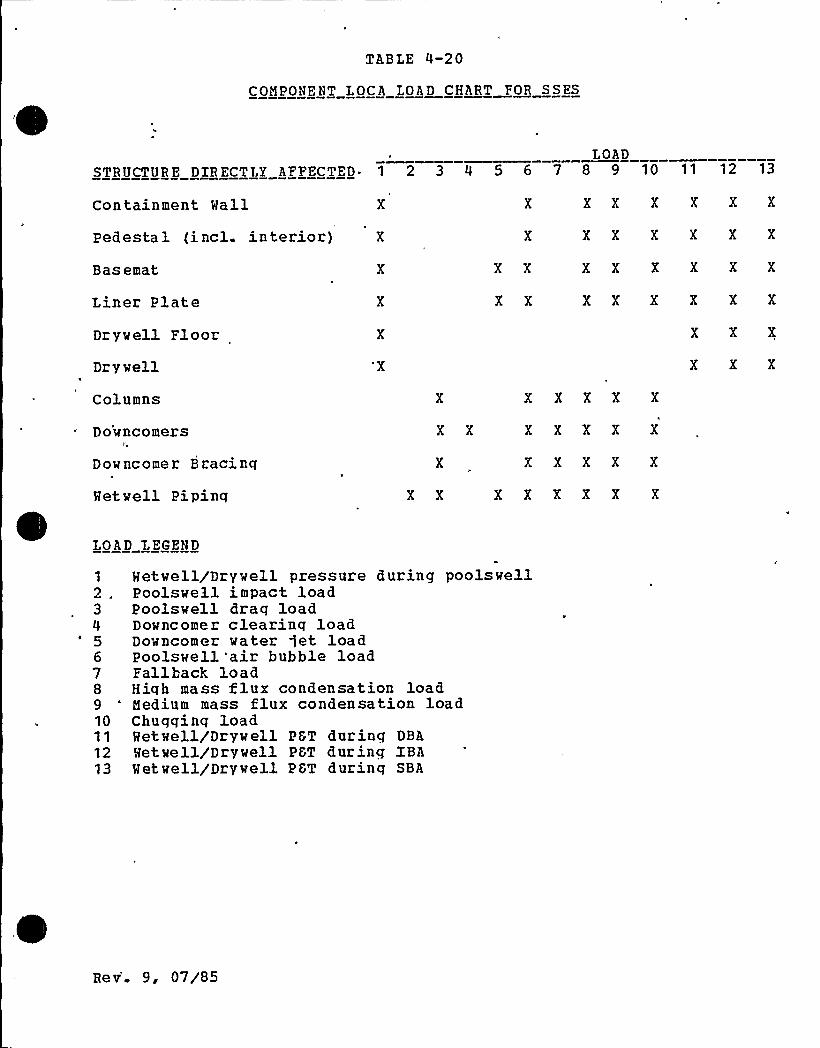
TABLE 4-20
COMPONENT LOCA LOAD CHART FOR SSES
LOADSTRUCTURE DIRECTLY AFFECTED ~ 1 2 3 4 5 6 7 8 9 10 11 12 13
Containment Mall
Ped esta 1 (incl. in te rior)Basemat
Liner Plate
Drywell Floor
Drywell
Columns
Downcomers
Downcomer Bracinq
Metwell Piping
X
X X
X X
X X X X X
X X X X X
X X X X X
X X X X X X
X X X X X X
X X X X X X
X X X X X X
X X X X X X
X X X
X X X
LOAD LEGEND
1 Metwell/Drywell pressure during poolswell2 . Poolswe3.1 impact load3 Poolswell drag load4 Downcomer clearinq load5 Downcomer water jet load6 Poolswell 'air bubble load7 Fallback load8 Hiqh mass flux condensation load9 'edium mass flux condensation load10 Chugging load11 Metwell/Drywell PGT during DBA12 Metwell/Drywell PGT during IBA13 Metwell/Drywell PGT during SBA
Re v. 9, 07/85
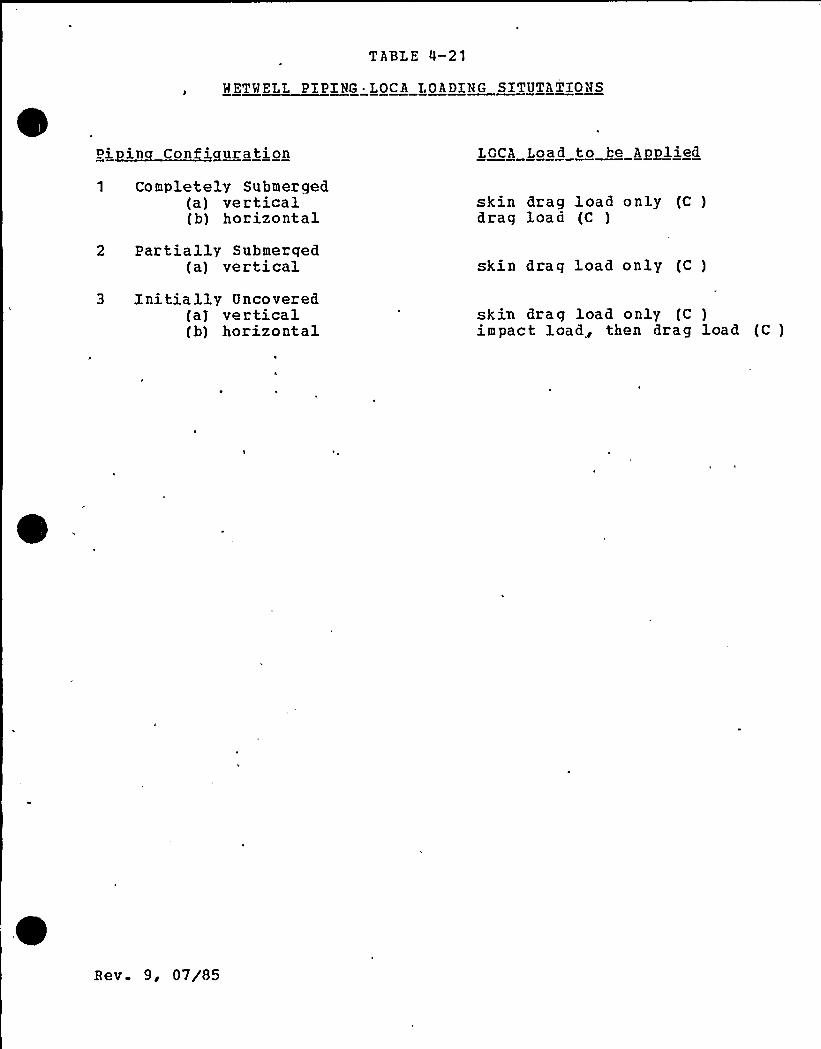
TA3LE 4-21
WETWELL PIPING ~ LOCA LOADING SITUTATIONS
1 Completely Submerged(a) vertical(b) horizontal
2 Partially Submerged(a) vertical
3 Initially Uncovered(a) vertical(h) horizontal
LOCA Load to be Applied
skin drag load only (C )drag load (C )
skin drag load only (C )
skin drag load only (C )impact load, then drag load (C )
Hev. 9, 07/85
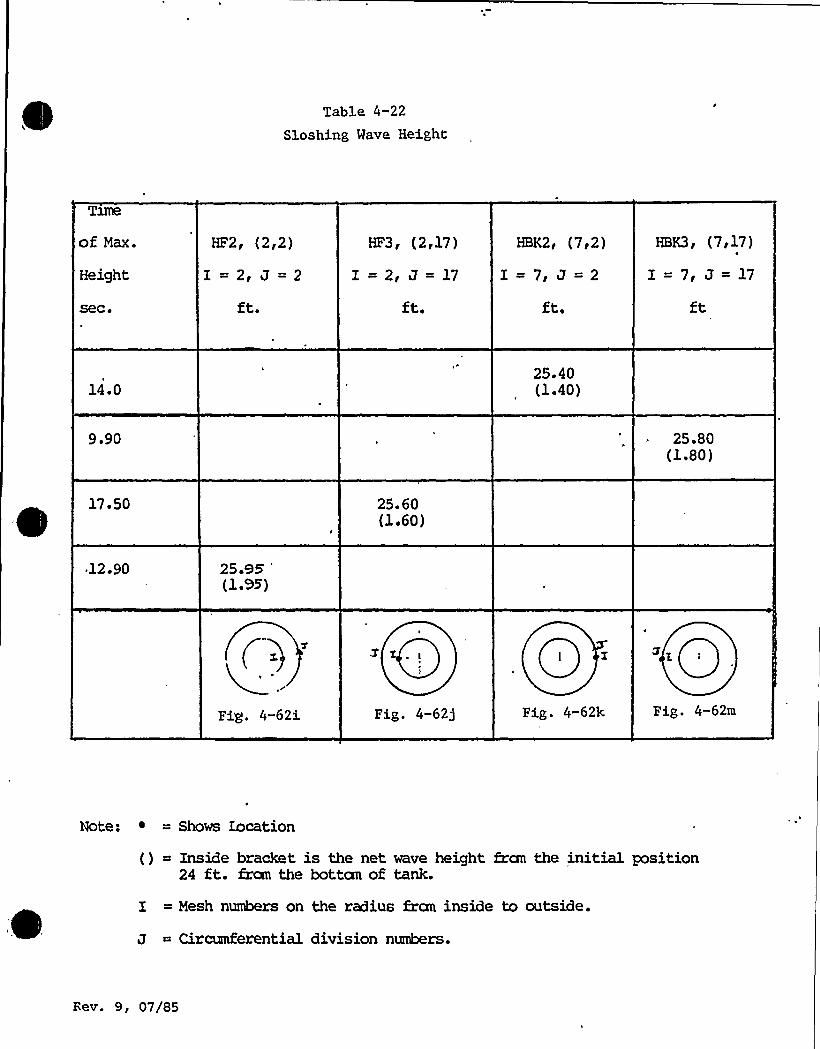
Table 4-22
Sloshing Wave Height
Of MBX~
Height
sec o
HF2, (2,2)
I=2~ J=2HF3~ (2~17)
I = 2, J = 17
HBK2g (7i2)
I-7I J —2
HBK3~ (7~17)
I=7i J=17
14.025.40(1.40)
9.90 25.80(1.80)
17.50 25.60(1.60)
*12.90 25.95'1.95)
Fig. 4-62i Fig. 4-62j Fig. 4-62k Fig. 4-62m
Note: ~ = Shows Zocation
() = Inside bracket is the net wave height fran the initial position24 ft. fran the bottan of tank.
I = Mesh numbers on the radius fran inside to outside.
J = Circumferential division numbers.
Bev. 9, 07/85
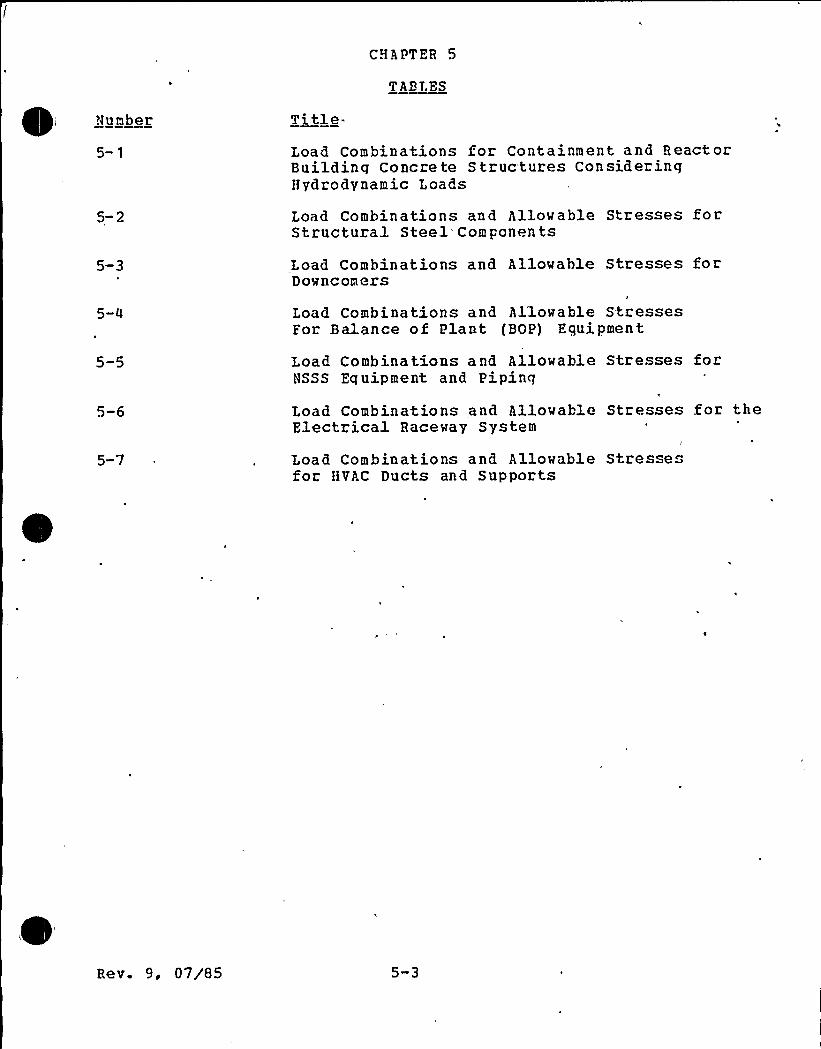
CHAPTER 5
TABLES
Title-Load Combinations for Containment and ReactorBuilding Concrete Structures ConsideringHydrodynamic Loads
5-2 Load Combinations and Allowable Stresses forStructural Steel. Components
5-3 Load Combinations and Allowable Stresses forDowncomers
5-0 Load Combinations and Allowable StressesFor Balance of Plant (BOP) Equipment
5-5
5-6
Load Combinations and Allowable Stresses forNSSS Equipment and Piping
'I
Load Combinations and Allowable Stresses for theElectrical Raceway System
5-7 Load Combinations and Allowable Stresse"for HVAC Ducts and Supports
Bev. 9, 07/85 5-3
5 0 I.OAD CONBINATIONS PON STNUCTUNES PIPING AND EQUIPNENT
To verify the adequacy of mechanical and structural desiqn, it isnecessarv first to define the load combinations to whichstructures, pipinq, and equipment may be subjected. In additionto the loads due to pressure, weight, thermal expansion, seismic,and fluid tzansients, hydrodynamic loads resulting f rom LOCA andSRV discharqe are considezed in the desiqn of structuzes, pipinq,and equipment in the drywell and suppression pool. This chapterspecifies how the LOCA and SRV discharqe hydrodynamic loads willbe combined with t;he other loadinq conditions. Zor the loadcombinations discussed in this chapter, seismic and hydrodynamiczesponses are combined by the methods specified in. Reference 10Subsection 5 2 2 and Reference t0 Section 6.3.
Bev. 9, 07/85
5 1 CONCRETE CONTAZNNZNT- AND REACTOR BlJIT.BING LOAD CON BINATION
The loads on the containment, internal azd reactor buildingconcrete structures are combined to assess the structuralinteqrity in accordance with the dosiqn load combinations givenin Table 5-1. The factored load approach is used in the designand analysis of the structural components. The load factorsadopted are based upon the deqree oX certainty and probability ofoccurrence for the individual loads as discussed in Reference 10,Subsection 5.2.2. The time sequences of occurrence of thevarious time dependent loads (as presented in Figures 4-55through 4-61, for example) are taken into account to determinethe most critical loadiaq conditions.
Rev 9, 07/85

5. 2 ~ SZH lJCTUHAL STE ~ L LOAD CGNBI NATIONS
The load combinations for structural steel in the containment andthe reactor building are given in Table 5-2. These corn.binationsapply to the suppression chamber stee1 columns, the downcomer'bracing, and the reactor bui1ding structural steel.
Rev. 9, 07/85 5-6
5. 3 LINHR PLATE LOAD COMBINATIONS
The liner plate and anchorage system are designed for the loadcombinations listed in Table 5-1 except that all load factors aretaken as unity.
Rev. 9, 07/85 5-7
5 0 DOi1NCOHFR. I.OAD COiNEENATIONS
Load combinations for the dovncomers are qi.ven in'ab1e 5-3.These load combinations are based on the 1oad combinations givenin Table 6-1 o,f Reference '10.
Be v 9, 97/85 5-8
5,5 = PIPING~ QUENCHFR~ AND QUZNCHFR SUPPORT LOAD CCHBI NATIONS
LOCA loads considered on pipinq systems include poolswell impactloads, poolswell draq loads, downcomer water jet loads, poolswellair bubble loads, fallback drag loads, condensa tion oscillationloads, chuqqinq loads, and inertial loading due to accelerationof the containment structure produced by LOCA loads. Loads due toSRV discharge on pipinq systems include water clearing loads, airclearinq loads, fluid transient loads on SRV discharge piping,reaction .forces at the quencher, and inertial loading due to theacceleration of the containment structure produced by SRVd ischarqe loads.
The load combinations and the acceptance criteria for pipingsystems are qiven in Table 6-1 of Reference 10.
5.5.1 Load Considerations for Piping Inside the ~Dr well
Pipinq systems inside the drywell aze subjected to inertialloadinq due to the acceleration of the containme'nt produced hy
.I.GCA and SBV discharge loads in the wetwell. The SRV dischargepipinq in the drywell is also subjected to fluid tzansient forcesdue to SRV discharqe.
5.5.2 Log<I Considerations for~Pi in'nside the Wet well
All pipinq .in the wetwell is subject to the inertial loading dueto IOCA and SRV discharqe.
Draq and impact loads due to LOCA and SRV discharge on individualpipes in the wetwell depend on the physical location of thepiping. Other SRV discharge and LOCA loads applicable to pipingin the wetwell are discussed in the paragraphs that follow.
Pipinq systems located below the suppression chamber water levelare shown on Fiqures 5-1 and 5-2. These lines aze locatedoutside of the jet impinqement cone of the downcomer. Inaddition to the inertial loads, these piping systems are subjec'tto air bubble loads, condensation oscillation loads, and chuggingloads due to LOCA and SBV'operation. The SRV piping, quencher,and quencher support are, also subject to fluid transient forcesdue to SRV discharge.
Pipinq systems within the poolswell volume are shown on Figures.5-2, 5-3 and 5-0 All horizontal run of these pipes are abovethe suppression chamber water level. The following loads, inaddition to inertial loads, act on these systems:
a. The horizontal runs of pipe below elevation 690~-2»,experience poolswell impact , poolswell drag, and.fallback drag loads.
b. The vertical portions of pipe in the water belowelevation 690'-2» experience poolswell drag andfallback draq loads.
Rev. 9, 07/85 5-9
5.5.3 guencher and Quencher Gu~ort Toad Considerations
ahe quen'cher and quencher supports are subjected to the followinghydrodynamic loads in addition to the pressure, weight, thermal,,and seismic loads:
a. Unbalanced loads on the quencher due to SRV waterclearing and air clearing transients, irregularcondensation, and steady state blovdown
b. Drag loads due to SRV discharge and LOCA
c. SRV piping end loads
d.. inertial loading due to the acceleration of thecontainment produced by SHV discharge and LOCA.
5. 5.4 Load Considerations for Pipinq in t'ethe Reac tor Building
The effects of the inertial loadinq due to acceleration of thecontainment produced by SHV discharqe'and LOCA loads vill beevaluated for this piping.
Rev. 9, 07/85 5-10
5 6 NSSS I.OAR CONBTNATICNS
The load combinations u ed Xor the evaluation of the NSSS pipingand equipment a.re contained in Table 5-5.
Hev. 9, 07/85 5-11
5 7 BOP ~EUIPMKNT LOAD COMBINATIONS
Load .combinations .for seismic category I equipment located withinthe Containment, reactor and control buildings are assessed forthe load combinations shown in Table 5-4.
Hev. 9, 07/85 5-12
5 8 ELECTRICAL RACEWAY SYSTEM LOAD COPBINATIOHS
The load combinations for evaluatinq the Electrical RacewaySystem are qiven in Table 5-6.
Re v. 9, 07/85 5-13
5 9 ~ H VAC DUCT S YSTL'.M LOAD COMBINATIONS
The load combination for the HVAC duct system are given in Table5-7
Rev. 9, 07/05
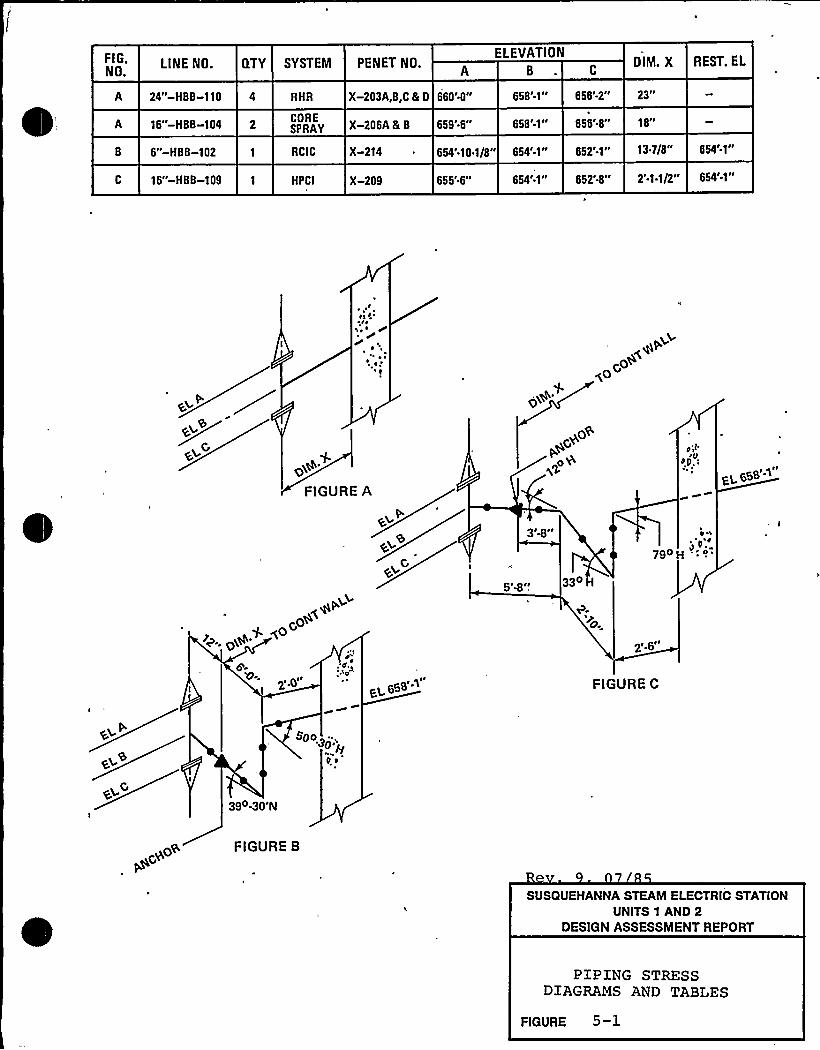
FIG.NO.
LINE NO. GTY SYSTEM PENET NO.A
ELEVATIONOIM. X REST. EL
24"-HBB-110 X-203A,B,C 5 D 660'0" 658'-1" 656'-2" 23"
A 16"-HBB-104
6"-HBB-102
CORESPRAY
RCI C
X-206A & B
X-214
659'6" 658I 1II
654'.10.1/8" 654'.1"
658'-8"
652'-1"
18"
13 7/8" 854'-1"
16"-H8 B-1 09 HPCI X-209 655'6" 654'-1" 652'.8" 2'.1.1/2" 654'1"
I
,Ili; ~
go+qo
+~0
FIGURE At
o
go+qG
>o'b
3t BIN
diP
dP
7eo H
EI.658
5iglt 330
go0= pi 2'-6"
g-0" ~ .1"5g658'IGURE C
Spa~ ",'"pgPe
39o.30 N
Ppc+
o+ FIGURE B
SUSQUEHANNA STEAM ELECTRIC STATIONUNITS 1 AND 2
DESIGN ASSESSMENT REPORT
PIPING STRESSDIAGRAMS AND TABLES
FIGURE 5
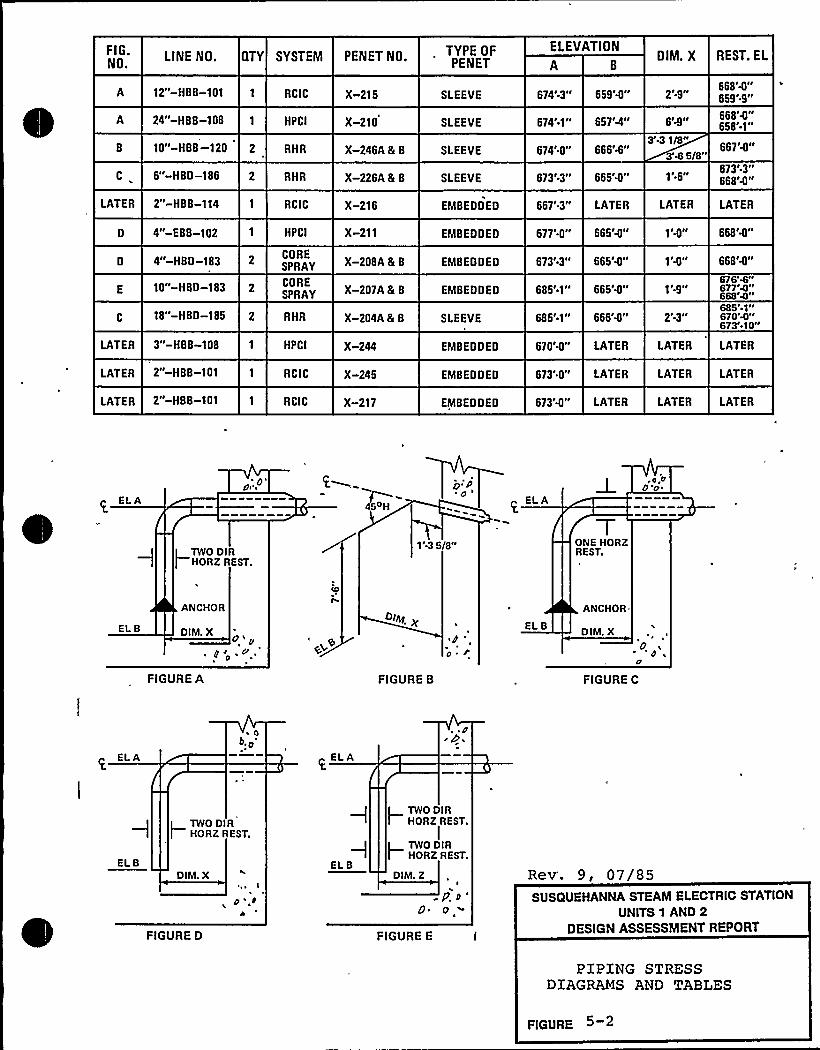
FIG.NO.
LINE NO. QTY SYSTENI PENET NO. TYPE OFPENET
ELEVATION
AOIM. X REST. EL
12"-HB B-101 1 RCIC X-215 SLEEVE 674'-3" 659'4" 2t 9tt668'4"659'9"
C
24"-HBB-108 1 HPCI
10"-HBB-120 2 RHR
6"-HBD-186 2 RHR
X-210
X-246A & B
X-226A & B
SLEEVE
SLEEVE
SLEEVE
674'1" 657'4"
673'-3" 665'4"
674'" 666'.6"
Bt glt
3'-3 1/8"3'4 5/8"
1'6"
668'4"658'.1"
667'4"
673'-3"668'4"
LATER 2"-HB8-114
4"-EBB-102
4"-H8O-183
1 RCIC
1 HPCI
CORESPRAY
X-216
X-211
X-208A & 8
EMBEDDED
EMBEDDED
EMBEDDED
677'-0" 665'4"
673'3" 665'4"
667'3" LATER LATER
1t 0tt
1 t4l~
LATER
668'4"
668'4"
10"-HBD-1 83 2CORESPRAY
LATER 3"-HBB-108
LATER 2"-HBB-101
1 HPCI
1 RCIC
18"-HBD-185 2 RHR
X-207A & B
X-204A & B
X-244
X-245
EMBEDDED
SLEEVE
EMBEDDED
EMBEDDED
685'1" 666'4"
670'4" LATER
673'.0" LATER
685'" 665'4" 1~ 9I~
2t 3lt
LATER
LATER
676'%"677'4"668t+tt685'-1"670'4"673'.10"
LATER
LATER
LATER 2"-HBB-101 RCIC X-217 EMBEDDED 673'4" LATER LATER LATER
EL A
//I
EL A
J,o,p
EST/TWODlR
1'-3 5/8tt ONE HORZREST.
EL 8
ANCHOR
DIM. Xo
P t, ttl0 ~
FIGURE A
tO
i
">x
FIGURE B
EL 8
ANCHOR
DIM. X
I7
FIGURE C
EL A
~ 0b,o
~ELA
. ~ db.
EL 8
RREST
DIM. X
ITWO Dl
EL 8
l—TWO DIRHORZ REST.
I
I—TWO DIRHORZ REST.
DIM. Z Rev. 9, 07/85
FIGURE 0
~ pD*
P. D'7o~
FIGURE E I
SUSQUEHANNA STEAM ELECTRIC STATION
UNITS 1 AND 2DESIGN ASSESSMENT REPORT
PZPZNG STRESSDZAGRAMS AND TABLES
FIGURE 5-2
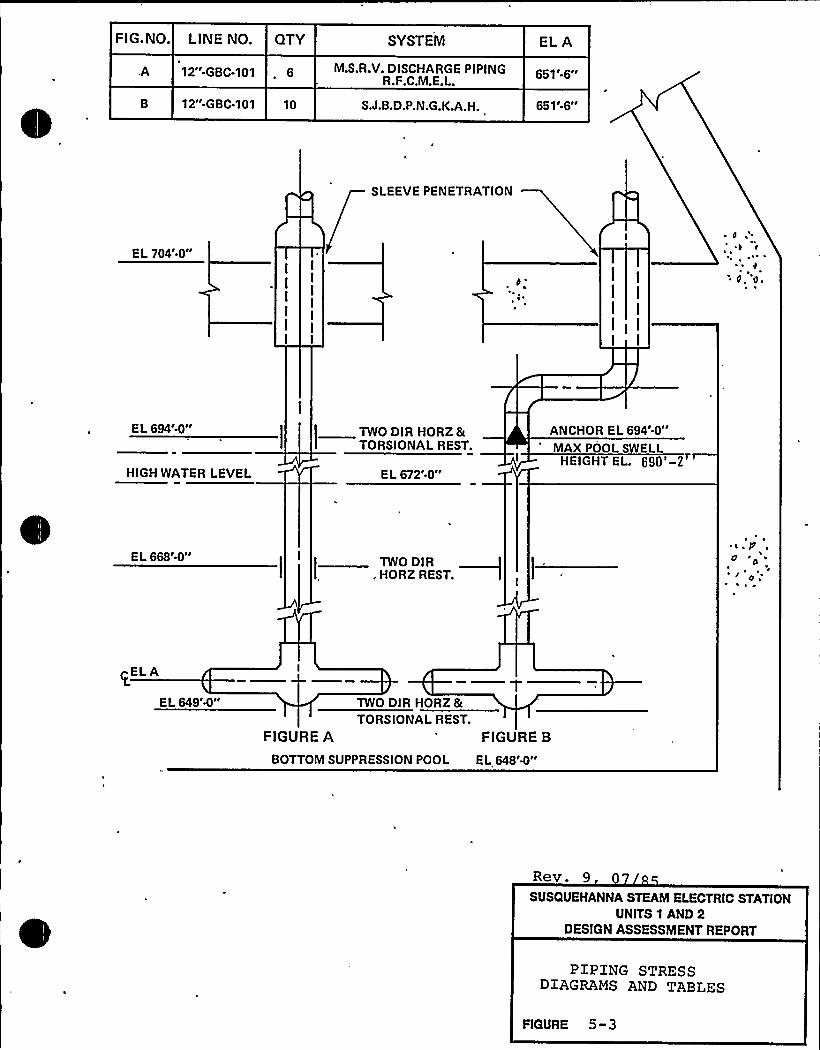
.A 12"-GBC-101 . 6
F I G. NO. LINE NO. QTY SYSTEM
M.S.R.V. DISCHARGE PIPINGR.F.C.M.E.L.
EL A
651'-6"
12"-G BC-101 10 S.J.B.D.P.N.G.K.A.H. 651'-6"
SLEEVE PENETRATION
E L 704'.0"
I
I
I
I I I
EL 694'0"
HIGH WATER LEVEL
!TWO DIR HORZ &TORSIONAL REST.
E L 672'-0"
ANCHOR EL 694'-0"
MAXPOOL SWELLHEIGHT EL. 690'-2
E L 668'-0"TWO DIR
, HORZ REST.
~ a. P4'o',
o,'AEL
A
EL 649'N"
FIGURE A
TWO DIR HORZ &TORSIONAL REST.
FIGURE B
BOTTOM SUPPRESSION POOL EL 648'4"
Rev. 9 0SUSQUEHANNA STEAM ELECTRIC STATION
UNITS 1 AND 2DESIGN ASSESSMENT REPORT
PIPING STRESSD1AGRAMS AND TABLES
FIGURE 5- 3
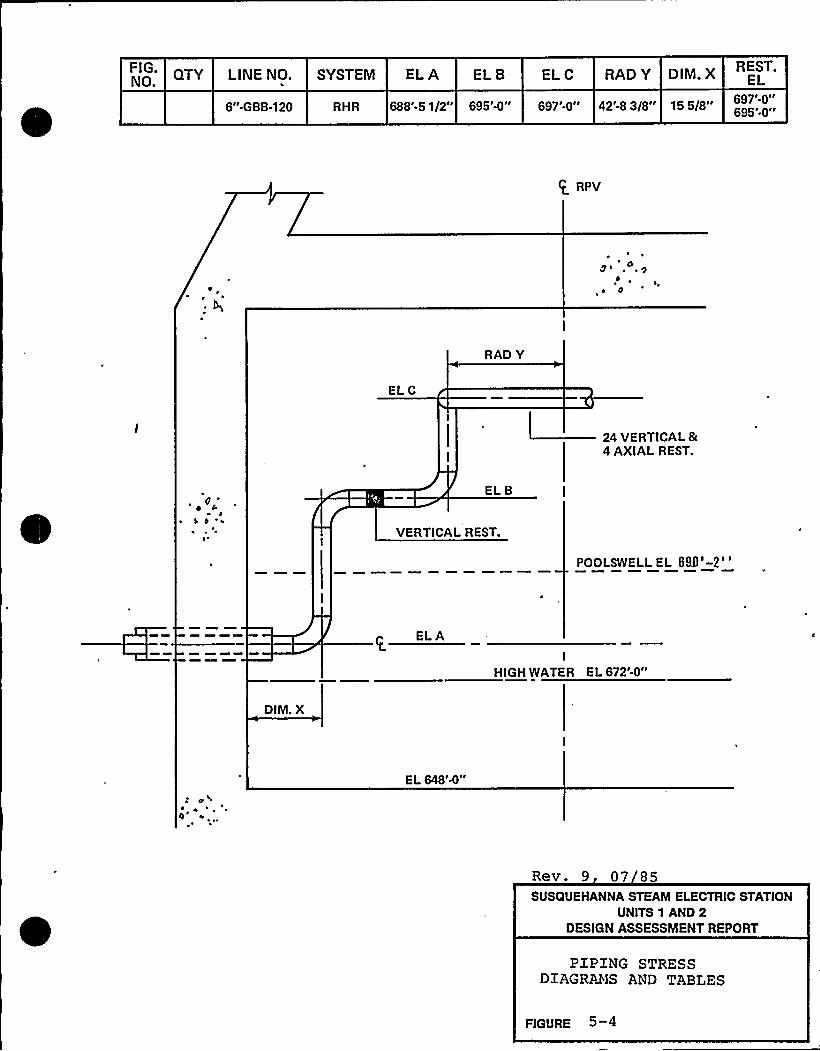
FIG QTYNO. LINE NO. SYSTEM EL A EL B EL C RAD Y DIM.X REST.EL
6".GBB-120 RHR 688'-5 1/2" 695'-0" 697'-0" 42'-83/8" 155/8" 697'-0"695'-0"
f RPV
~~
+ ~
'0 ~ ~
~~ 0
RAD Y
ELC L24 VERTICAL&4 AXIALREST.
ELB
~'ERTICALREST.
POOLSWELL EL 61P'-2'
EL A
I
HIGH WATER EL 672'-0"
DIM. X
EL 648'-0"
~4
Rev. 9 07 85SUSQUEHANNA STEAM ELECTRIC STATION
UNITS 1 AND 2DESIGN ASSESSMENT REPORT
PIPING STRESSDIAGRAMS AND TABLES
FIGURE 5 4
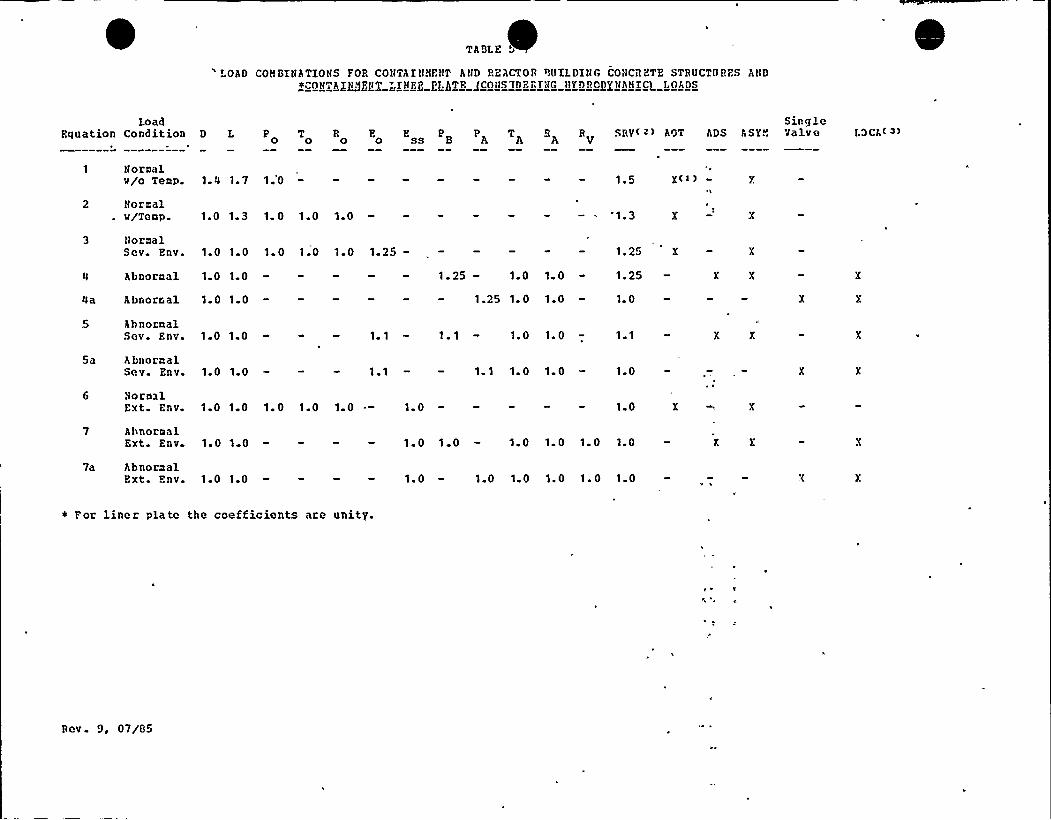
TABLE
LOAD COMBINATIONS FOR CONTAINNFNT AND REACTOR BUILDING CONCRETE STRUCTURFS AND+wON>AINNFllT INER PI,ATE QCONSYDERYNG BYDRODYHAMICQ LOADS
LoadEquation Condition D L P T0 0 F.0
E ss PA -"A SAY( z) AOT ADS hSYESingleValve LOCA~ »
Normalw/o Temp.
Normalw/Temp.
1.4 1 7 1.0
10 13 1.0 10 10
1.5
~ 1 3
XC))
NormalSev. Env. 10101010101.25 1.25 X
4a
Abnormal 1.0 1.0
Abnorf al 1.0 1 0
1. 25 1.0 1 0
1.25 1. 0 1 0
1.25
1 0
AbnormalSev. Env. 1010 1.0 1. 0
Sa AbnormalSev. Env. 1.0 10 1 1 1.0 1 0 1.0
NormalExt. Env.
AbnormalExt. Env.
1.0 10 1.0 1.0 10
1.010
1 0
1 0 1 0
1 0
1 0 1 0 1 0 1 0
7a AbnormalExt. Env. 101.0 1.0 101010101.0
* For liner plate the coefficients are unitY.
Rev 9, 07/85
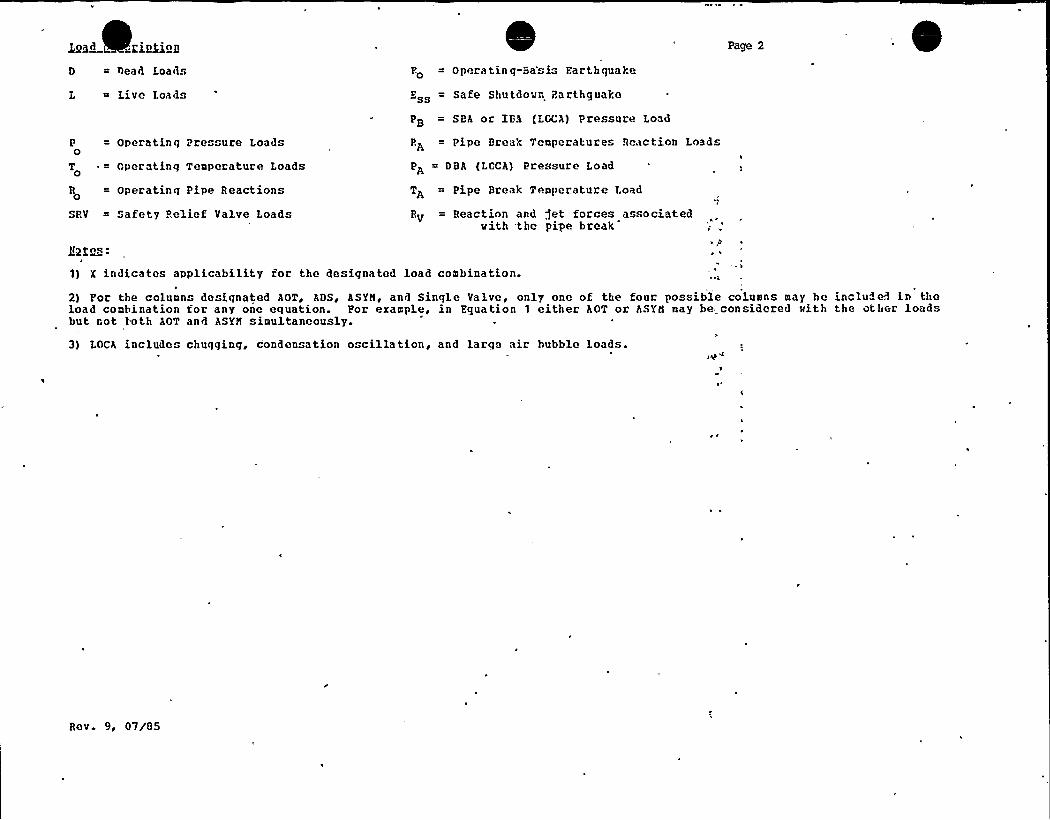
Load, rintion Page 2 eD = Dead Loads
L = Live Loads
P = Operating Pressure Loads0
T ~ = Operating Temperature Loads0
R = Operating Pipe Reactions0
SRV = Safety Relief Valve Loads
Po = Operatinq-Ba'sis Farthquake
ss = Safe Shutdown Earthquake
PB = SBA or IBA (LOCA) Pressure Load
PA = Pipe Break Temperatures Reaction Loads
PA = DBA (LCCA) Pressure Load
TA = Pipe Break Temperature Load
RV = Reaction and get forces associatedwith .tho pipe break
)lotes:
1) X indicates applicability ror the desiqnated load combination. 2
2) For the columns designated AOT, ADS, ASY!l, and Single Valve, only one of the four possible columns may he included in theload combination for any one equation. por example, in Equation 1 either AOT or ASYB may be- con idored with the other loadsbut not both AOT and ASYH simultaneously.
3) LOCA includes chugging, condensation oscillation, and larqu air hubble loads.
Rev. 9, 07/85
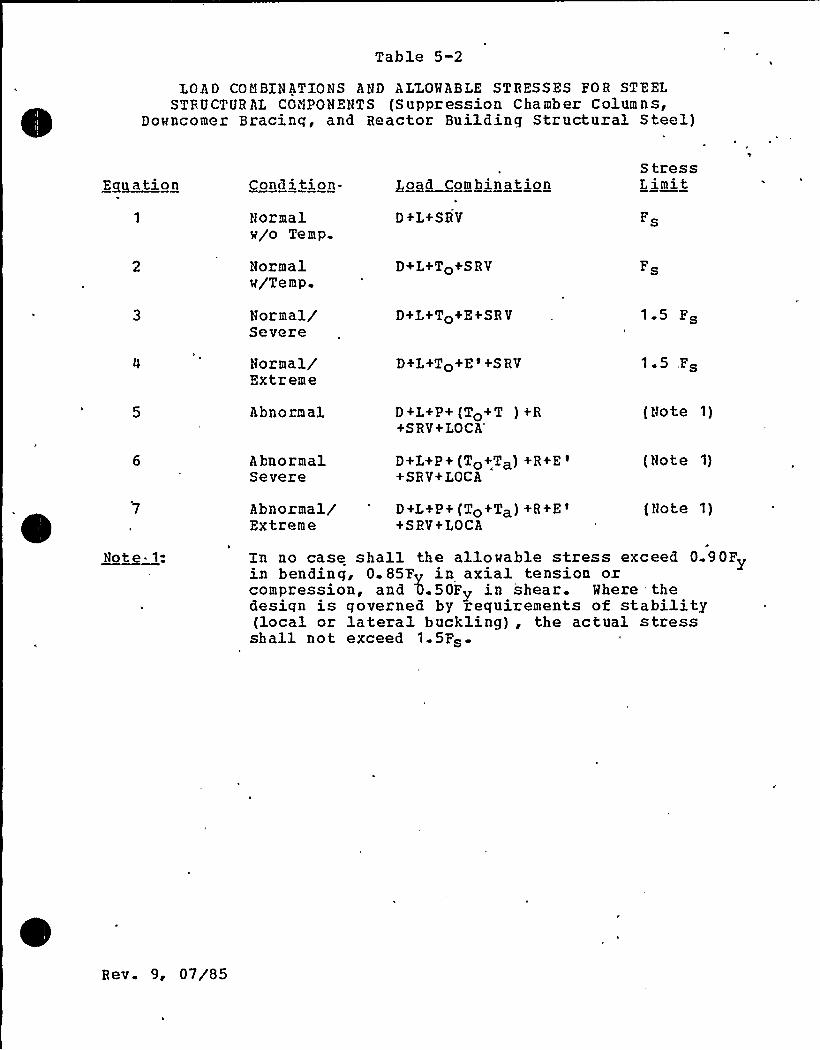
Table 5-2
I OA D COH BIN ACTIONS AND ALZOMABLE STRESSES FOR STEELSTRUCTURAL CGiiPONENTS (Suppression Chamber Columns,
Downcomer Bracing, and Reactor Building Structural Steel)
Equation Cond ition-Normalw/o Temp.
Normalw/Temp.
Normal/Severe
Normal/Extreme
Abnormal
Load Combination
D+L+SHV
D+L+To+SRV
D+L+To+E+SR V
D+L+To+E 'S HV
D+L+P+ (To+ T ) +R+SR V+LOCA'
tressLimit
Fs
Fs
15rs
1 ~ 5 Fs
(Note 1)
AbnormalSevere
D+L+P+ (To+Ta) +R+E'SRV+LOCA
(Note 1)
Abnormal/Extreme
D+L+P+ (To+Ta) +R+E+SRV+LOCA
{Note 1)
Note 1: In no case shall the allowable stress exceed 0.90F>in bending, 0. 857 in axial tension orcompression, and 5.50F> in shear. Shere thedesign is governed by requirements of stability(local or lateral buckling), the actual stressshall not exceed 1.5Fs.
R ev. 9, 07/85
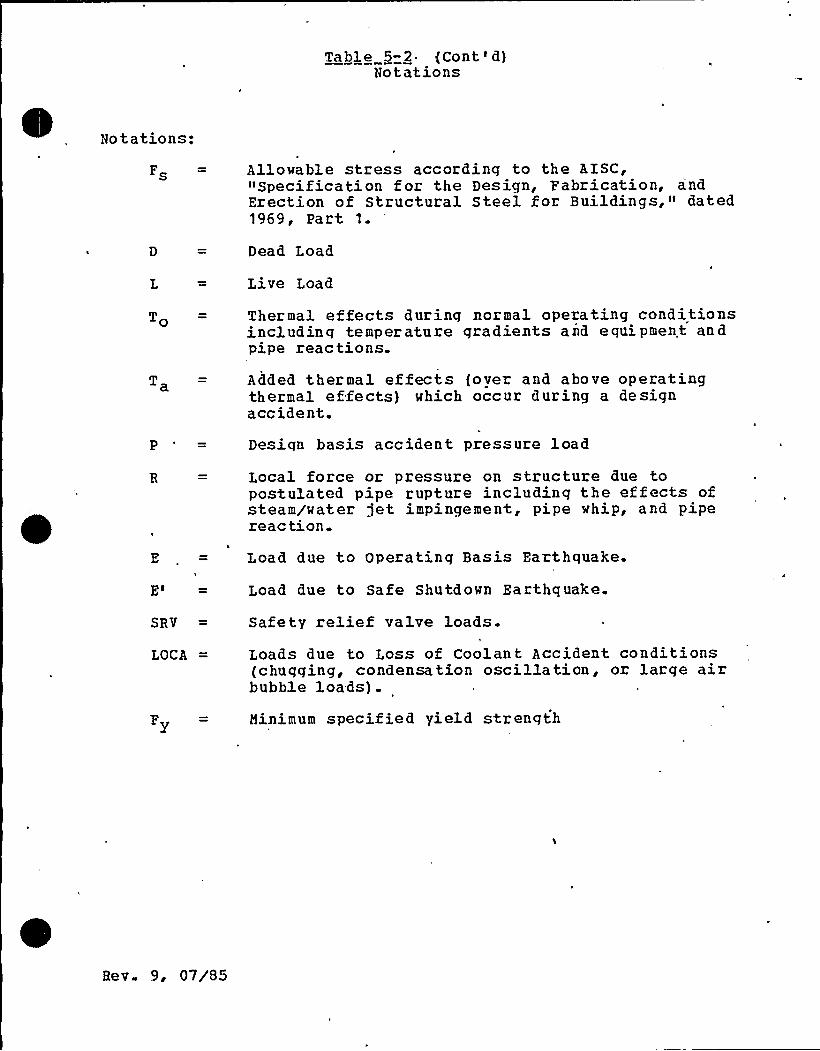
Table 5-2 (Cont ')Notations
Notations:
Fs Allowable stress according to the AISC,"Specification for the Design, Fabrication, andErection of Structural Steel for Buildings," dated1969, Part 1.
Dead Load
Live Load
TQ Thermal effects during normal operating conditionsincludinq temperature gradients and equipment andpipe reactions.
Ta Added thermal effects (oyer and above operatingthermal effects) which occur during a designaccident.
p Design basis accident pressure load
Local force or pressure on structure due topostulated pipe rupture includinq the effects ofsteam/water jet impingement, pipe whip, and pipereaction.
Load, due to Operating Basis Earthquake.
Load due to Safe Shutdown Earthquake.
SRV
LOCA
Safety relief valve loads.
Loads due to Loss of Coolant Accident conditions(chugging, condensation oscillation, or large airbubble loads).
Minimum specified yield strength
Bev. 9, 07/S5
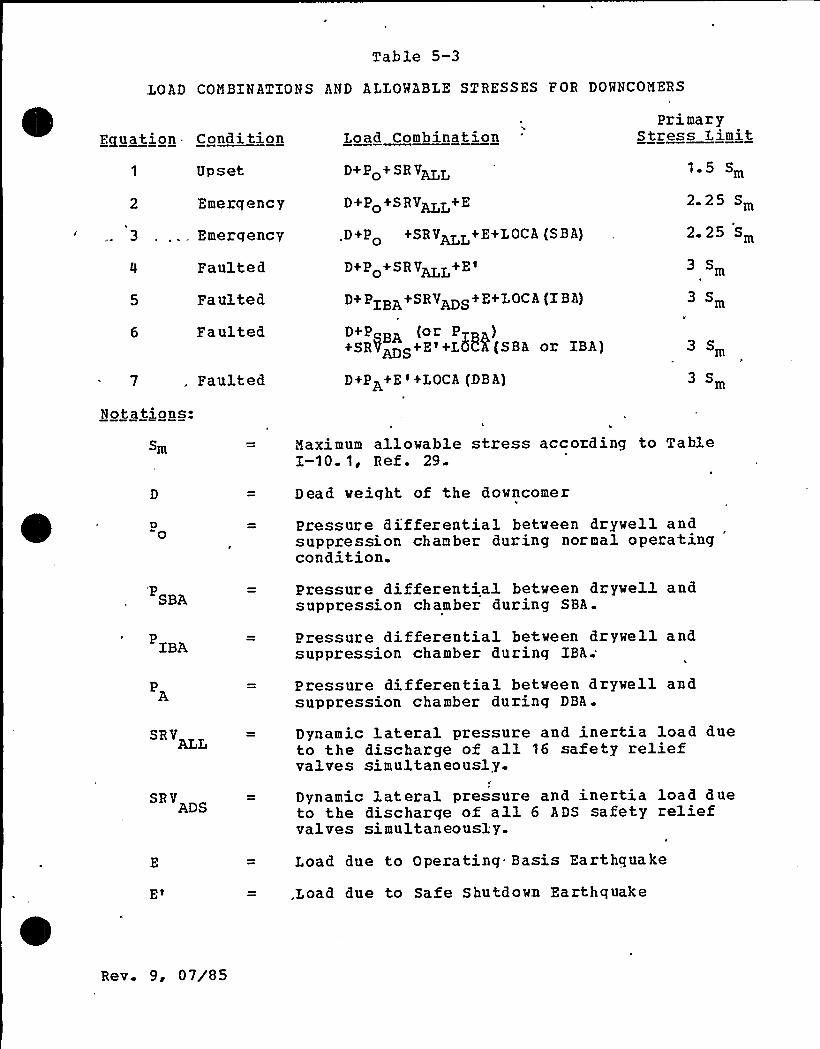
Table 5-3
LOAD COMBINATIONS AND ALLOMABLE STRESSES FOR DOMNCONERS
Eauation. Cond ition Load CombinationPrimary
Stress Limit
3
Upset
Emergency
Emergency
Faulted
Faulted
Faulted
. Faulted
D+ Po+ SR VALI
D+P SRVALL+E
.D+Po +SRVAIT+E+LOCA (SBA)
D+Po'SRVAI.Z,+E'+
PIBA+SRVADS+E+LOCA (IBA)
D+P BA (or P )+sR)~<+K ~ +IAMB(sBL or ISA)
D+PA+E '+LOCA (DB A)
1.5 Sm
2 Sm
2. 25 Sm
3 Sm
m
3 Sm
m
Notations:
Sm
P0
Maximum allowable stress according to TableI-10. 1, Ref . 29.
Dead weight of the downcomer
Pressure differential between drywell andsuppression chamber during normal operatingcondition.
SBA
IBA
SRV
ADS
Pressure differential between drywell andsuppression chamber during SBA.
Pressure differential between drywell andsuppression chamber during IBA;
Pressure differential between drywell andsuppression chamber during DBA.
Dynamic lateral pressure and inertia load dueto the discharge of all 16 safety reliefvalves simultaneously.
Dynamic lateral pressure and inertia load dueto the discharge of all 6 ADS safety reliefvalves simultaneously.
Load due to Operating Basis Earthquake
,Load due to Safe Shutdown Earthquake
Rev. 9, 07/85
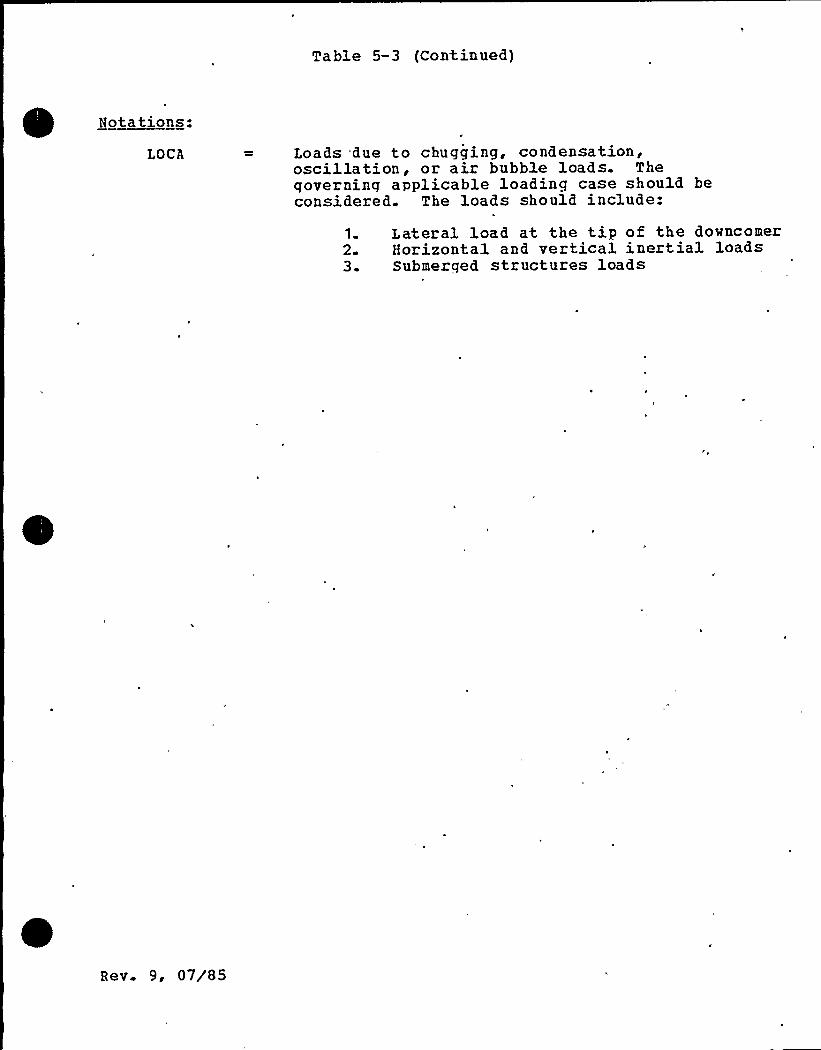
Ta ble 5-3 (Cont inued)
Notations:
LOCA Loads "due to chugging, condensation,oscillation, or air bubble loads. Thegoverning applicable loading case should beconsidered. The loads should include:
't. Lateral load at the tip of the dovncomer2. Horizontal and vertical inertial loads3. Submerged structures loads
Rev. 9, 07/S5
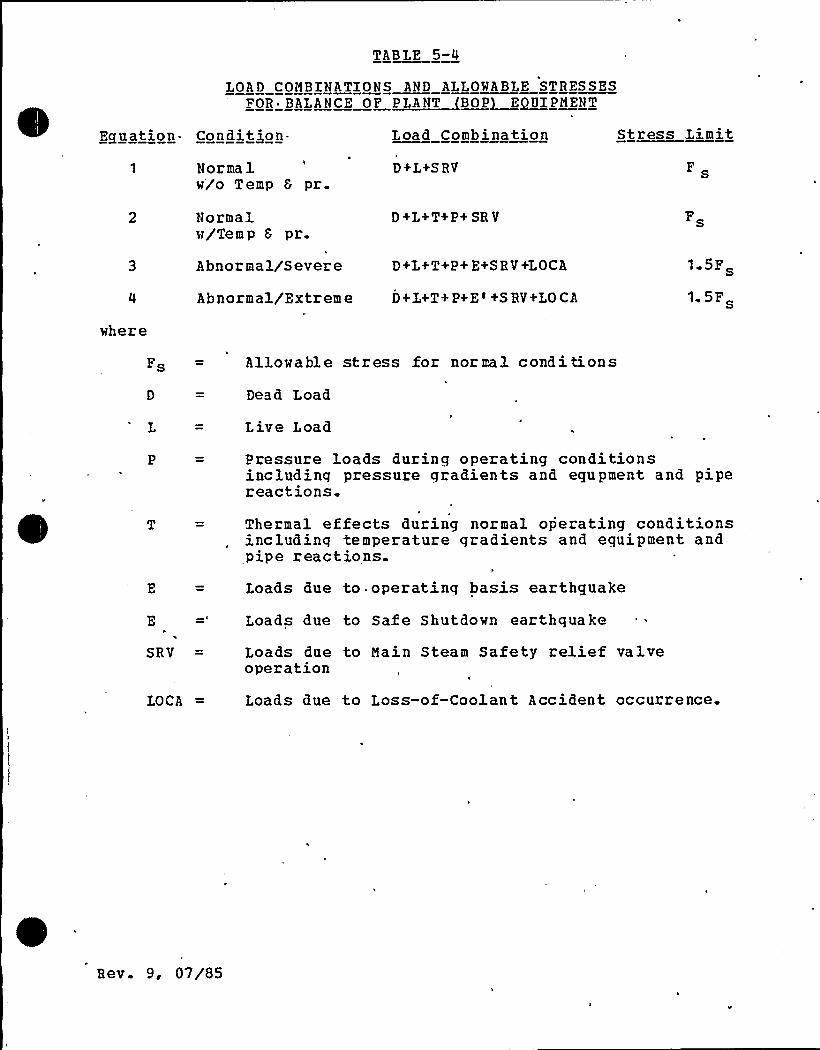
TABLE 5-4
LOAD COM BIN ATION S AND ALLOWABLE ST RES SESFOR BALANCE OF~PLANT BOP) EQUIPNENT
Eauation ~ Condition Load Combination Stress Limit
Norma lw'/o Temp 6 pr
D+L+S RV F
Normalw/Tem p 6 pr.
Abnormal/Severe
Abnormal/Extreme
D+L+T+P+ SR V
D+L+T+P+ E+S R V+LOCA
D+L+T+P+E'SRV+LO CA
Fs
1.5F
1. 5F
where
Fs
L
Allowable stress for normal conditions
Dead Load
Live Load
Pressure loads during operating conditionsincluding pressure gradients and equpment and. pipereactions.
T = Thermal effects during normal operating conditionsincluding temperature gradients and eguipment andpipe reactions.
E = Loads due to. operating basis earthquake
E =" Loads due to Safe Shutdown earthquake
SRV = Loads due to Hain Steam Safety relief valveoperation
LOCA Loads due to Loss-of-Coolant Accident occurrence.
Rev. 9, 07/85
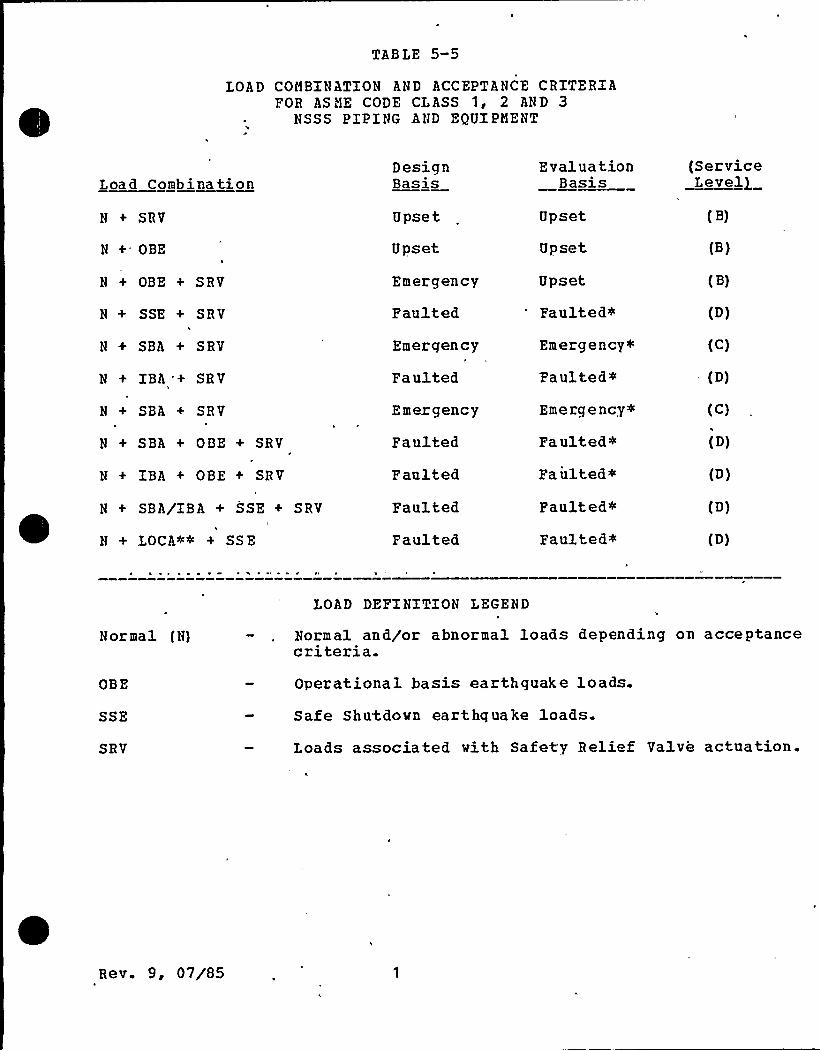
TABLE 5-5
LOAD COMBINATION AND ACCEPTANCE CRITERIAFOR ASME CODE CLASS 1, 2 AND 3
NSSS PIPING AND EQUIPMENT
Load Combination
N + SHV
N +- OBE
N + OBE + SRV
N+ SSE + SRV
N+ SBA + SRV
N+ IBA + SRV
N + SBA + SRV
N + SBA + OBE + SRV
N + IBA + OBE+ SRV
N + SBA/IBA + SSE + SRV
N + LOCA+< + SS E
DesignBasis
Upset
Upset
Emergency
Faulted
Emergency
Faulted
E mer gency
Faulted
Faulted
Paulted
Faulted
EvaluationBasis
Upset
Upset
Upset
Faulted+
Emergency+
Faulted~
Emergency~
Faulted+
Paulted+
Faulted+
Faulted'Service
Level/
(B)
(B)
(B)
(D)
(C)
(D)
(C)
(D)
(D)
(D)
(D)
Normal (N)
LOAD DEFINITION LEGEND
Normal and/or abnormal loads depending on acceptancecriteria.
OBE
SSE
SRV
Operational basis earthquake loads.
Safe Shutdown earthquake loads.
Loads associated with Safety Relief Valve actuation.
Rev. 9, 07/85
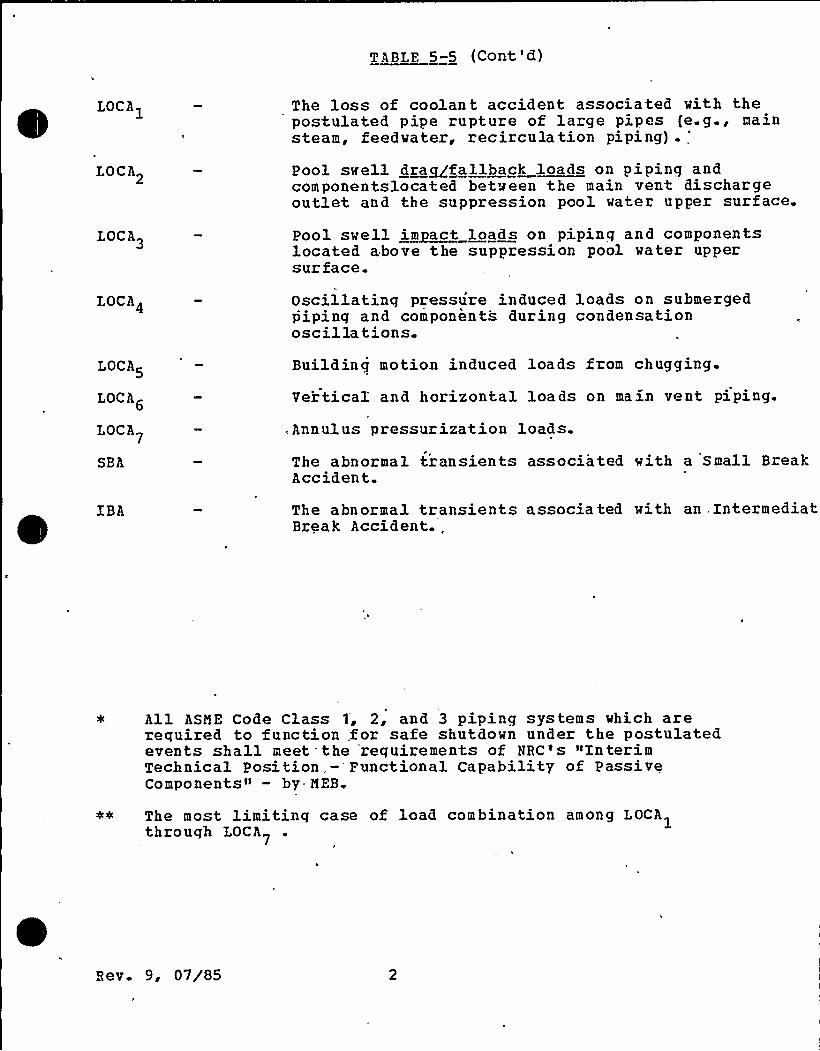
TABLF, 5-5 (Cont'd)
The loss of coolan t accident associated with thepostulated pipe rupture of large pipes {e.g., mainsteam, feed water, rec ircu la tion pipi ng) .;
LOCA2 Pool swell dra~fallback loads on piping andcomponentslocated between the main vent dischargeoutlet and. the suppression pool water upper surface.
LOCA3 Pool swell impact loads on piping and componentslocated above the suppression pool water uppersurface.
LOCA4 Oscillating pressure induced loads on submergedpiping and components during condensationoscilla tions.
LOCA5
LOCA6
LOCA
Building motion induced loads from chugging.
Ver*tical and horizontal loads on main vent piping.
, Annulus pressurization loads.
SBA The abnormal transients associated with a Small BreakAccident.
IBA The abnormal transients associated with an, IntermediatBreak Accident.,
All ASIDE Code Class 1, 2, and 3 piping systems which arerequired to function .for safe shutdown under the postulated .
events shall meet. the requirements of NRC's»InterimTechnical Position, — Functional Capability of PassiveComponents" — by MEB.
The most limitinq case of load combination among LOCAthrough LOCA
R ev. 9, 07/85
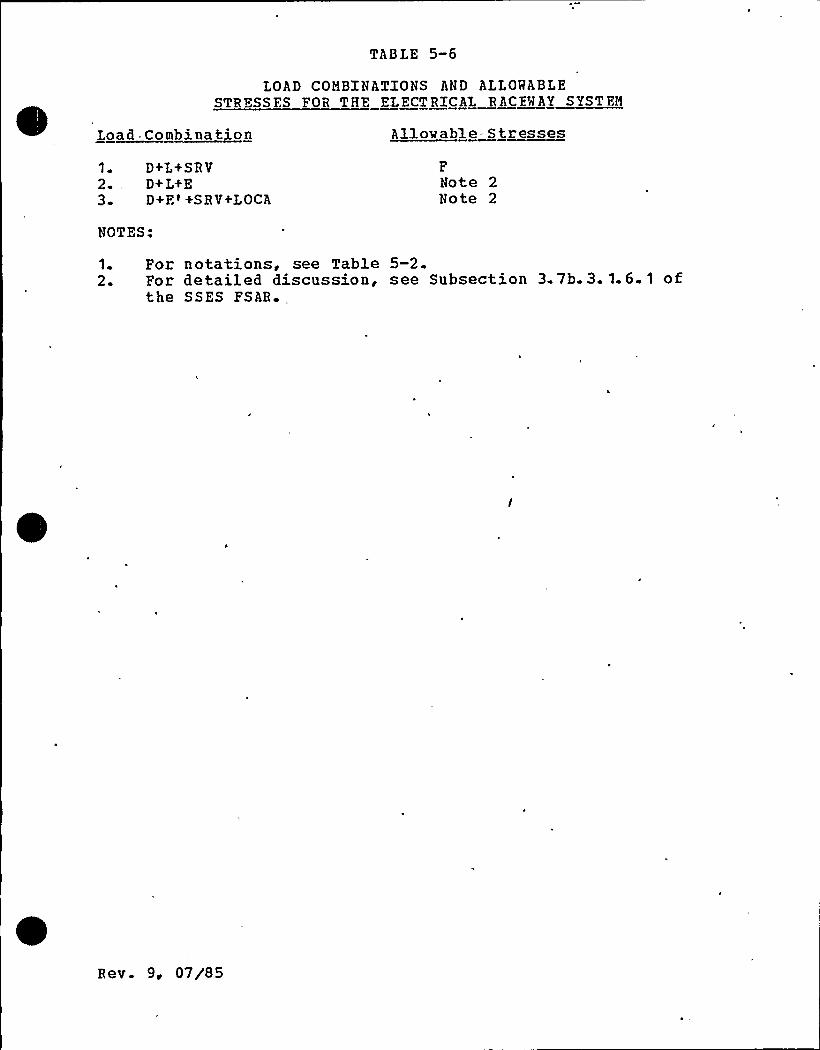
TABLE 5-6
LOAD COMBINATIONS AND ALLOWABLESTBESSFS FOR THE ZLECTRlCAL RAC'EMAY SYSTEM
Load-Combination Allowable= Stresses
1 D+L+SRV2 D+ L+E3 D+F.'S R V+LOCA
FNote 2Note 2
NOTES:
1. For notations, see Table 5-2.2. For detailed discussion, see Subsection 3.7b.3. 1.6. 1 of
the SSES FSAR.,
Rev. 9 ~ 07/85
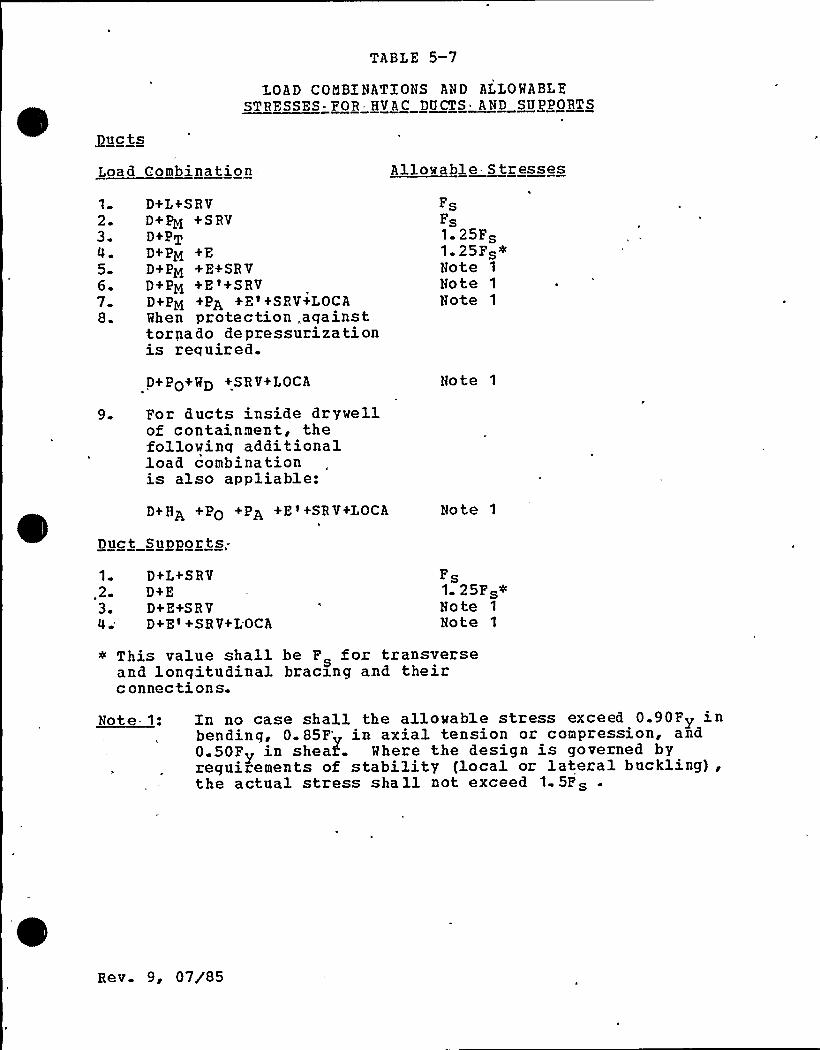
TABLE 5-7
LOAD COMBINATIONS AND ALLOWABLESTRESSES FOR HVAC DUCTS AND SUPPORTS
Ducts
Load Combination Allowable- Stresses
1
203.456.78.
9.
D+L+S R V
D+PM +SRVD+PTD+PM +ED+PM +E+SRVD+PM +E'+SRVD+PM +Pg +E +SRV+LOCAWhen protection „againsttornado depressurizationis required.
D+PO+WD +SRV+LOCA
For ducts inside drywellof containment, thefollowinq additionalload combinationis also appliable:
D+ Hg +Po +Pg +E +SR V+LOCA
FsFs
Fs1. 25Fs ~
Note 1
Note 1
Note 1
Note 1
Note 1
Duct Suooorts-
1 D+L+SRV.2 D+E3. D+E+SR V4 D+E'+SRV+LOCA
FsFs~
Note 1
Note 1
~ This value shall be F for transverseand longitudinal bracing and theirc on nec tion s.
~Not 1: In no case shall the allowable stress exceed 0.90F> inbending, 0. 85F'n axial tension or compression, and0.50F> in sheaS. Where the design is governed byrequirements of stability (local or lateral buckling),the actual stress shall not exceed 1.5Fs .
Rev. 9, 07/85
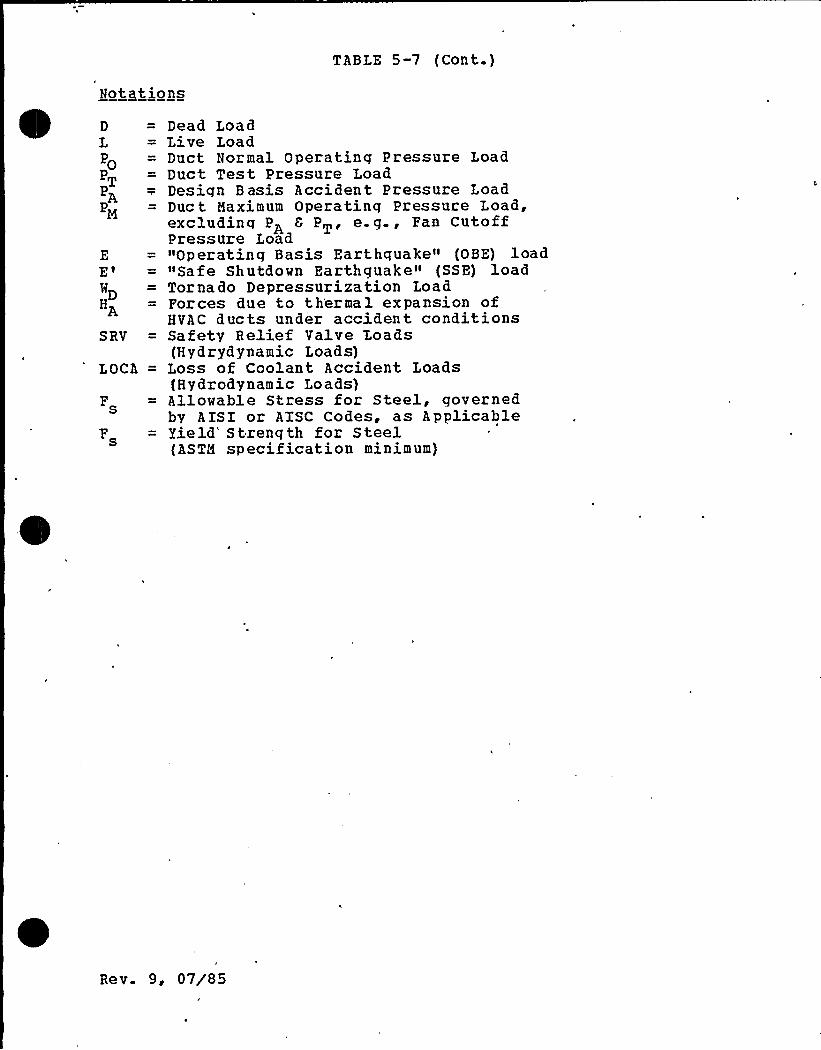
TABI.E 5-7 (Cont.)
Notations
D
IPO
PT
AM
E
E'D
H@
SRV
LOCA
F
Dead LoadLive LoadDuct Normal Operatinq Pressure LoadDuct Test Pressure I.oadDesiqn Basis Accident Pressure LoadDuc t Maximum Operatinq Pressure Load,excluding P> 6 PT, e.g., Fan CutoffPressure Load"Operating Basis Earthquake» (OBE) load"Safe Shutdown Earthquake« (SSE) loadTornado Depressurization LoadForces due to th'ermal expansion ofHVAC ducts under accident conditionsSafety Relief Valve Loads(Hydrydynamic Loads)Loss of Coolant Accident Loads{Hydrodynamic Loads)Allowable Stress for Steel, governedby AISI or A'ISC Codes, as ApplicableYield'trenqth for Steel(ASTM specif ication minimum)
Re v. 9, 07/85
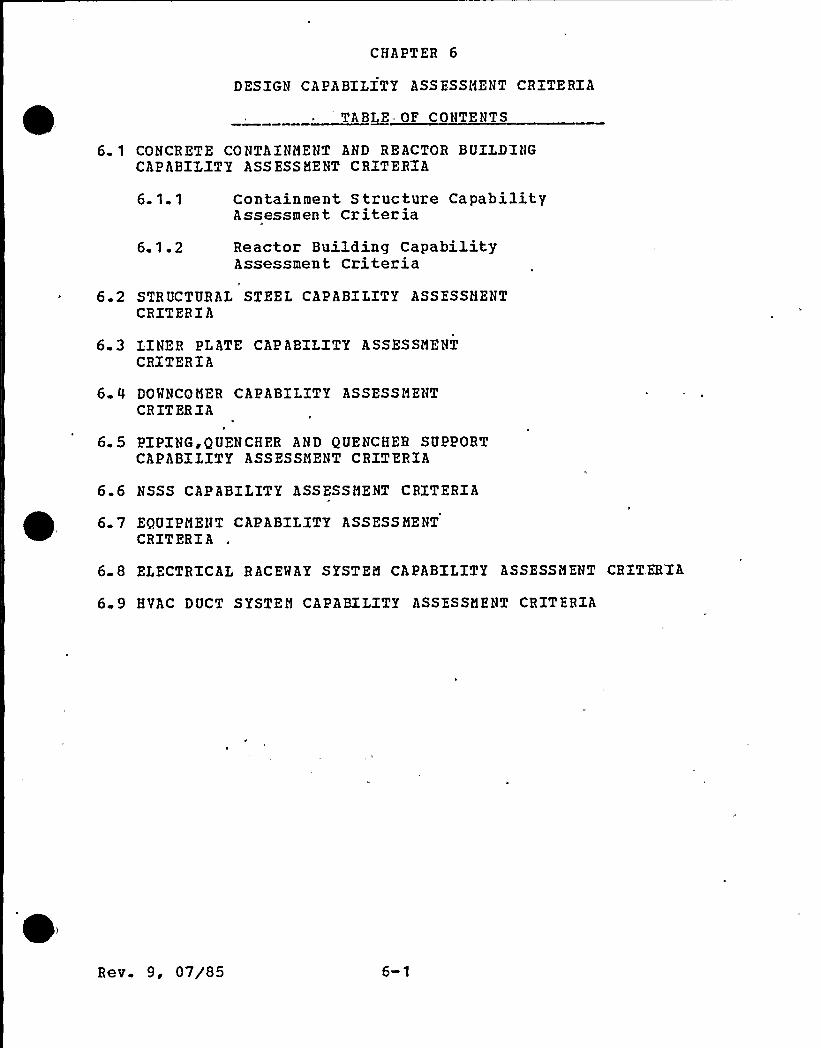
CHAPTER 6
DESIGN CAPABILITY ASSESSMENT CRITERIA
TABLE OF CONTENTS
6 1 CONCRETE CONTAINMENT AND REACTOR BUILDINGCAPABILITY ASSESSHZNT CRITERIA
6.1.1
6 1.2
Containment S tructure CapabilityAssessment CriteriaReactor Building CapabilityAssessment Criteria
6 2 STRUCTURAL STEEL CAPABILITY ASSZSSHENTCRITZR IA
6 3 LINER PLATE CAPABILITY ASSESSMENTCRITERIA
6 4 DOMNCQ HER CAPABILITY ASSESSHZNTCRITERIA
6 5 PIPINGiQUENCHPR AND QUENCHER SUPPORTCAPABILITY ASSESSHENT CRITERIA
6 6 NSSS CAPABILITY ASSESSHENT CRITERIA
6 7 EQUIPMENT CAPABILITY ASSESSHENTCRITERIA
6 8 ELECTR'ICAL RACEWAY SYSTEM CAPABILITY ASSESSMENT CRITZR'IA
6 9 HVAC DUCT SYSTEM CAPABILITY ASSZSSHZNT CRIT'ERIA
Rev. 9, 07/85
6 0 DESIGN CAPABITITY-ASSESSMENT CRITERIA
The criteria by which the design capability is determined arediscussed in this chapter Desiqn of the SSFS is assessed asadequate when the design capability of the structures, piping,and equipment is greater than the loads (including LOCA and SRVdischarge) to which the structures, pipinq, and equipment aresubjected. Loadinq combinations are discussed in Chapter 5. Themargins by which design capabilities exceed these loadings arediscussed in Chapter 7, Design Assessment.
Rev. 9, 07/85 6-2
6' CONCRETE COHTAINMEHT AND REACTOR BUILDING CAPABIL1TY~ ASSZSSMEHT- CRITERIA
. ~6'. 1 - Containment Structure Ca abiiit Assessment Criteria
The acceptance criteria detailed in the SSES FSAR Section 3.8. 1.5have been used to assess the structural integrity of thecontainment and internal structures. No changes are made inthese acceptance criteria when the effects of the dynamic SRVdischarge and LOCA loads are included.
6.1.2 Reactor Buildin<n Ca~abil~it Assessment criteriaThe acceptance criteria for Seismic Category I structurespresented in the SSES FSAR Subsection 3.8 4.5 have been used toassess the structural integrity of the reactor building and itscomponents. No change is made in these acceptance criteria whenthe effects of the dynamic SRV discharge and LOCA loads areincluded.
Rev. 9, 07/85 6-3
6 2- STRUCTURAL. STEEL CAPABILITY ASSESSifENT CRITERIA
The allowable. stresses for structural steel in the containmentand the reactor buildinq are qiven in Table 5-2. These criteriaapply to the suppression chamber steel columns, the downcomerbracinq, and the reactor building structural steel.
Rev. 9, 07/85 6-4I
6.3 LINER PLATE CAPABILITY ~ASS ESS i PNT CRITERIA
The strains in the liner plate and anchozage system (welds andanchors) from self-limiting loads such as dead load, creep,shrinkaqe, and thermal effects are limited to the allowablevalues specified in Table CC-3720-1 of Reference 30, and thedisplacements of the liner anchorage are limited to thedisplacement values of Table CC-3730-1 of Reference 30.
Primary membrane stzesses in the liner plate and anchoraqe systemfwelds and anchors) from mechanical loads such as SRV dischargeand chuqqinq aze checked according to Subsection NE-3221. 1 ofReference 29. Primary plus secondary membrane plus bendingstresses are checked accozding to Subsection NE-3222.2 of thesame code. Fatigue strength evaluation is based on SubsectionNE-3222 4 Allowable design stress intensity values, designfatique curves, and material properties used conform toSubsection NA, Appendix I of Reference 29
The capacity of the liner plate anchorage is limited by concretepull-out to the service load allowables of concrete as specifiedin Reference 31
Re v. 9, 07/85 6-5
6 O'ONNCOMER CAPABIT'ITY ASSES SMENT CRITERIA
The allowable stresses for the downcomers are given in Table 5-3.These allowable stresses are in .accordance with Reference 29;Subsection NE As permitted by Subsection NE-1120 for MCcomponents, the downcomers are analyzed in accordance withSubsection NB-3650 of Reference 29; however, the lower allowablestresses, S, from Table I-10.1 for MC coKpcnents are used whenperforming'he analysis.
Rev. 9, 07/85 6-6
6.5 PIPING,, QUENCHER, AND QUENCHER SUPPORT CAPABILITY~ - — - - ASSESSMENT ~ CRIT ER1A
Piping in the containment and reactor buildinq is analyzed inaccordance with Reference 29 Subsections NB3600, NC3600, andND3600 for the loading described in Subsection 5.5.
The quencher is designed in accordance with Reference 29,Subsection NC3200, for loading discussed in Subsection 5 5 3. Thequencher support is desiqned in accordance Mith Subsection NF3000of Reference 29.
Bev . 9 ~ 07/85 6-7
6 6 NSSS CAPABII.ITY ASSESSi1ENT CRITERIA
The capability assessment criteria used for the analysis of NSSSpipinq systems, reactor pressure vessel (RPV), RPV supports, RPVinternal components and floor structure mounted equipment areshown in Table 5-5, Load Combinations and Acceptance Criteria.Table 5-5 is in agreement with a conservative generalinterpretation of the NRC technical position, »Stress Limits forASME Class 3, 2 and 3 Components and Component .Supports of
. Safety-Related Systems and Class CS Core Support Structures UnderSpecific Service Loading Combinations. »
peaR response due to related dynamic loads postulated to occur inthe same time frame but from different events are combined by thesquare-root-of-the-sum-of-the-squares method (SESS) . A detaileddiscussion of this load combination technique is presented inReference 80.
Rev. 9, 07/85
6 7 BALANCE OF PLANT~~BOP EQBIPMENT CAPABILITY ASSESSMENT CRITERIA
671.1 Seismic Category I BOP equipment located 'within thecontainment, reactor and control building aze assessedfor load combinations shown in Table 5-4. In these loadcombinations, seismic and hydrodynamic loads 'aregenerally combined using the absolute sum method.
6712 However, for the «marginal«cases the responses of the"dynamic'! events (Seismic, SRV, LOCA) are combined bythe square zoot of the sum of the squares (SRSS) methodbefore addinq these values to the other loads by theabsolute sum .(ABS) method. The maximum loading effectsof both the horizontal and vertical directions areconsidered as arising from simultaneous excitation inall three principal directions for all combinationsinvolvinq dynamic'oads as detailed in Subsection71741.3
6'7 2
67.21Te~st in
Hhen equipment is qualified by testing, 'the test 'motionshave simulated- the combinations and damping. Theega.pment have remained operational and functional,before, during and after such tests.
(a) OBE alone(b) SSE alone(c} SR V alone(d) LOCA alone(e) ,OBE+SRV+LOCA(f) SSE+SR V+LOCA
1/2% damping1% damping2% damping2% dam pin g2% damping2% damping
6722 Cases (a) and (b) are covered in the PSAR. Cases (c)and (d) are covered in the test evaluation for (e) and{f). Test -requirements are depicted by tests responsespectrum (TRS) for a given damping value. Equipment isdeemed to be qualified if the equipment did not fail ormalfunction duz'ing the test and the TRS envelope therequired response Spectrum (RRS). The RRS for cases (e)and (f) are obtained by combining the response spectrumof the indivi'dual components of each event hy-adding thelarqer of. the horizontal responses to the verticalresponses on an absolute sum basis., However, formarqinal',cases the square root of sum of the squares(SRSS) method is allowed for the individual dynamicevents and components. *
Rev 9, 07/85 6-9
6 8 . ELECTRIC AZ RACEWAY ~ S YSTEI1'APABIX.ITY ASS FSSilZHT CRITERIA
The allowable stresses for the Electrical Raceway System arecontained in Table 5-6.
Hev. 9, 07/85 6-10

6 9 - HVAC DUCT. SYSTEM CAPABILITY ASSESSMENT CRITERIA
The allovable stresses Xoz the miscellaneous steel for the HVACduct system are given in Table '5-7.
Rev. 9,'7/85 6- 11
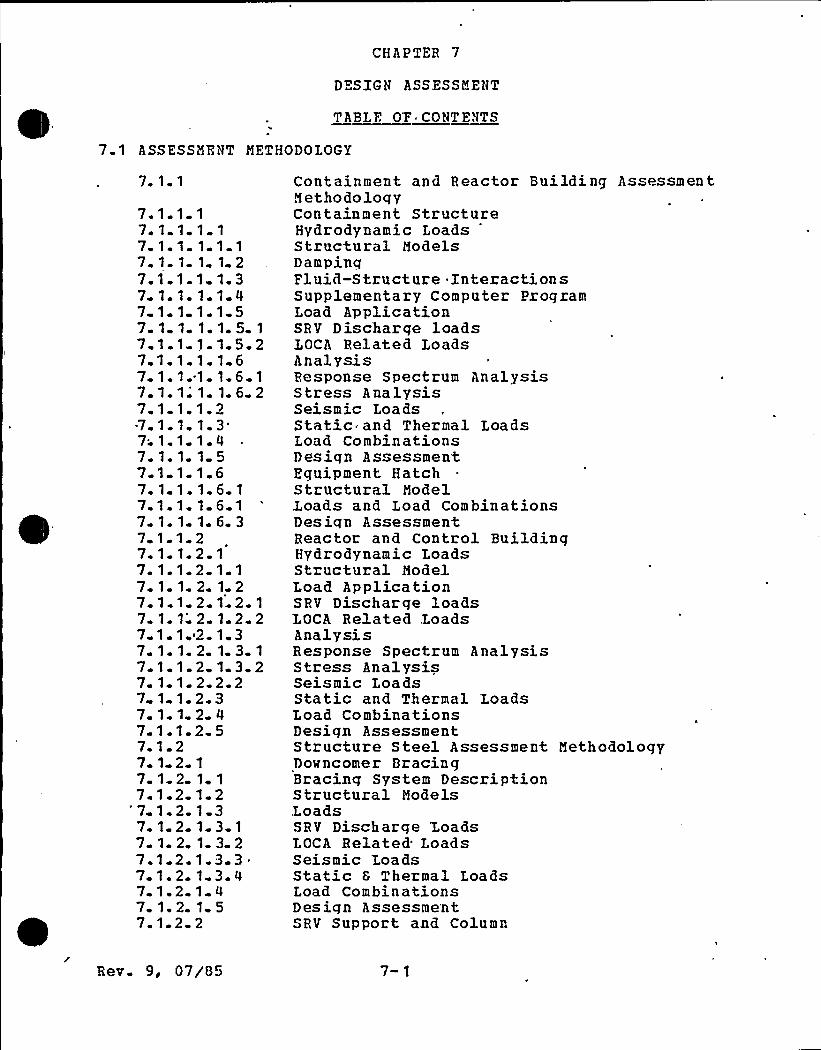
CHAPTER 7
DESZGN ASSESSMENT
TABLE OF ~ CONT ENTS
7 1 ASSESSMENT METHODOLOGY
7.1 1
7 1-17 1 1
7 1 1
7-1- 1-7.1 1.7 1 . 1.7 1 1
7-1 1
7 1.17 1 1
7 1. 1.7. 1. 1."
7 1.1.~7 1
7 1.17. 1. 1-7-1 1-7 1-17.1.17 1.17 1 1
7.1 1
7.1 1
7 1.1.7 1 1
7. 1. 1"
7 1-17 1
71 1.7 1 1.7 1 1.7 1 1
7-1 1
7 1 27 1 27 1 27 1-2
"71 27 1 27 1 27.1 2.7. 1. 2-7 1 27 1. 2.7. 1-2-
1
1 1
1 1 1
1 1 21 1.31.1 41.1 51.1.5 1
1. 1.5.21.1 61 1.61.1.6 21.21.
3'.4
1 51 61.6.11 6 1
1.6 322.12 1 1
2- 1.-22.1.2.12.1 2 2
'2~ 1~32 1 3 1
2 1-3 22-2.22 32 42 5
1
1 1
1 21 31 3 1
1 3 21.3 31 3 41 41 52
Containment and Reactor Building AssessmentMethodoloqyContainment StructureHydrodynamic LoadsStructural ModelsDampinqFluid-Structure InteractionsSupplementary Computer ProgramLoad ApplicationSRV Discharge loadsI,OCA Related I,oadsAnalysisResponse Spectrum AnalysisStress AnalysisSeismic LoadsStatic and Thermal LoadsLoad CombinationsDesign AssessmentEquipment HatchStructural ModelJ.oads and I.oad CombinationsDesiqn AssessmentReactor and Control BuildingHydrodynamic LoadsStructural ModelI.oad ApplicationSRV Discharge loadsLOCA Related .LoadsAnalysisResponse Spectrum AnalysisStress AnalysisSeismic LoadsStatic and Thermal I.oadsLoad CombinationsDesign AssessmentStructure Steel Assessment MethodologyDowncomer BracingBracing System DescriptionStructural ModelsI.oadsSRV Discharge LoadsLOCA Related LoadsSeismic LoadsStatic 6 Thermal LoadsLoad CombinationsDesign AssessmentSRV Support and Column
Rev. 9 07/05 7-1
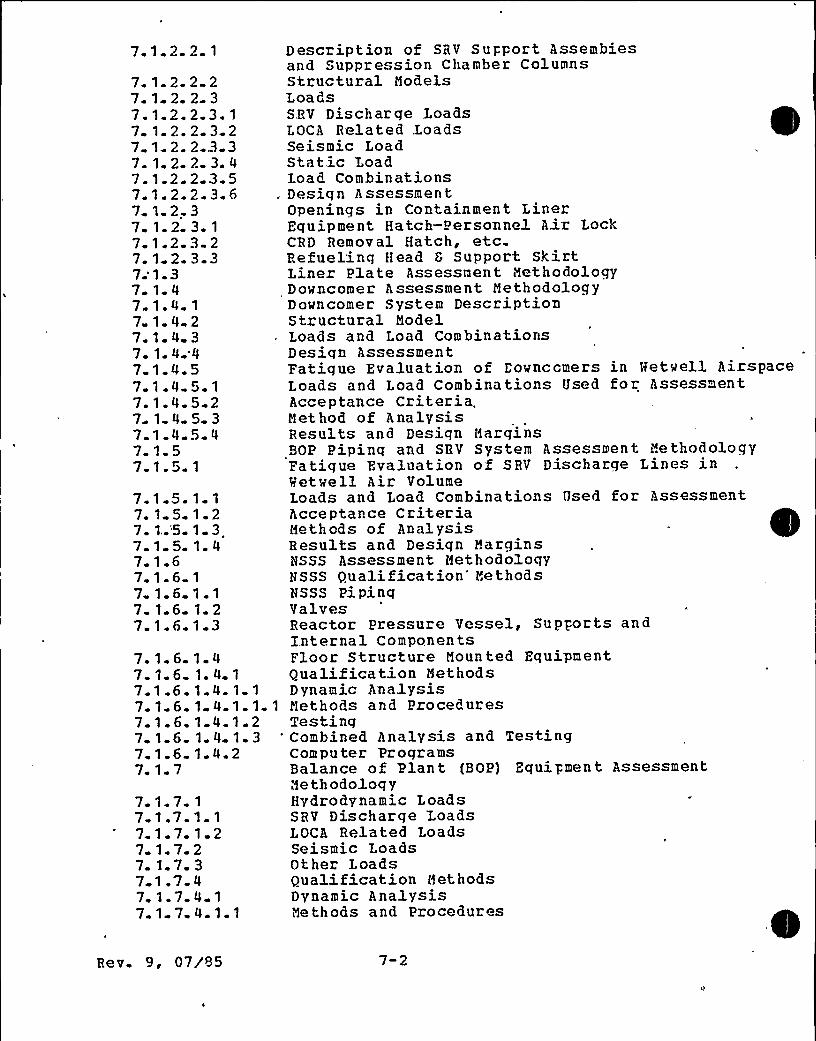
7.1 2.2 1
7.1 5.1 1
7 1 5 1 27 1..'5 1 37.1 5.1.47 1 67 1.6 1
7 1.6 1.17 1 6-1.27.1 6.1 3
7.1.67 1 67 1.6.7 1 67 1.6.7 1 6.7 1.67 1-7
41.4 1
1.4 1 1
1 4 1.11 4.1 21 4 1.31. 4.2
7 1.77- 1.7.7-1 77- 1. 7-7 1.77 1.7.7 1.7.7 1 7
1
1.11 22
44 1
4.1.1
7.1.2.2 27. 1 2. 2-37. 1.2. 2.3. 1
7 1.2.2 3 27 1 2.2-3 37.1.2.2 3.47.1.2 2 3.57 1.2.2.3.67- 1- 2.- 37. 1. 2. 3. 1
7 1 2 3 27. 1-2 3-37;1.37 1 47 1.4 1
7 1 4 27.1 4 37. 1.4 '47.1.4. 57.1 4 5 1
7.1.4.5 27 1 4 5 37.1.4.5. 47 1.57ete5» 1
ell Airspaceessmen t
hodologys inessment
Methods and ProceduresTestingCombined Analysis and TestingComputer ProgramsBalance of Plant (BOP) Equipment AssessmMethodoloqyHydrodynamic LoadsSRV Discharge LoadsLOCA Related LoadsSeismic LoadsOther LoadsQualification MethodsDynamic AnalysisMethods and Procedures
ent
Description of SRV Support Assembiesand Suppression Chamber ColumnsStructuzal ModelsLoadsSRV Discharge LoadsLOCA Related J.oadsSeismic LoadStat.ic LoadLoad Combinations
. Design AssessmentOpeninqs in Containment LinerEquipment Hatch-Personnel Ai.z LockCRD Removal Hatch, etc.Refueling Head 5 Support SkirtLiner Plate Assessment MethodologyDowncomer Assessment MethodologyDowncomer System DescriptionStructural ModelLoads and Load CombinationsDesign AssessmentFatigue Evaluation of Cownccmers in HetwLoads and Load Combinations Used for AssAcceptance Criteria,Method of AnalysisResults and Desiqn MarqinsBOP Piping and SRV System Assessment MetFatigue Evaluation of SRV Discharge Linebetwell Air VolumeLoads and Load Combinations Used for AssAcceptance CriteriaMethods of AnalysisResults and Design MarginsitSSS Assessment MethodologyHSSS Qualification'ethodsNSSS Pi pinqValvesReactor Pressure Vessel, Supports andZ.nterna 1 Componen tsFloor Structure Mounted EquipmentQualification MethodsDynamic Analysis
Re v. 9, 07/95 7-2
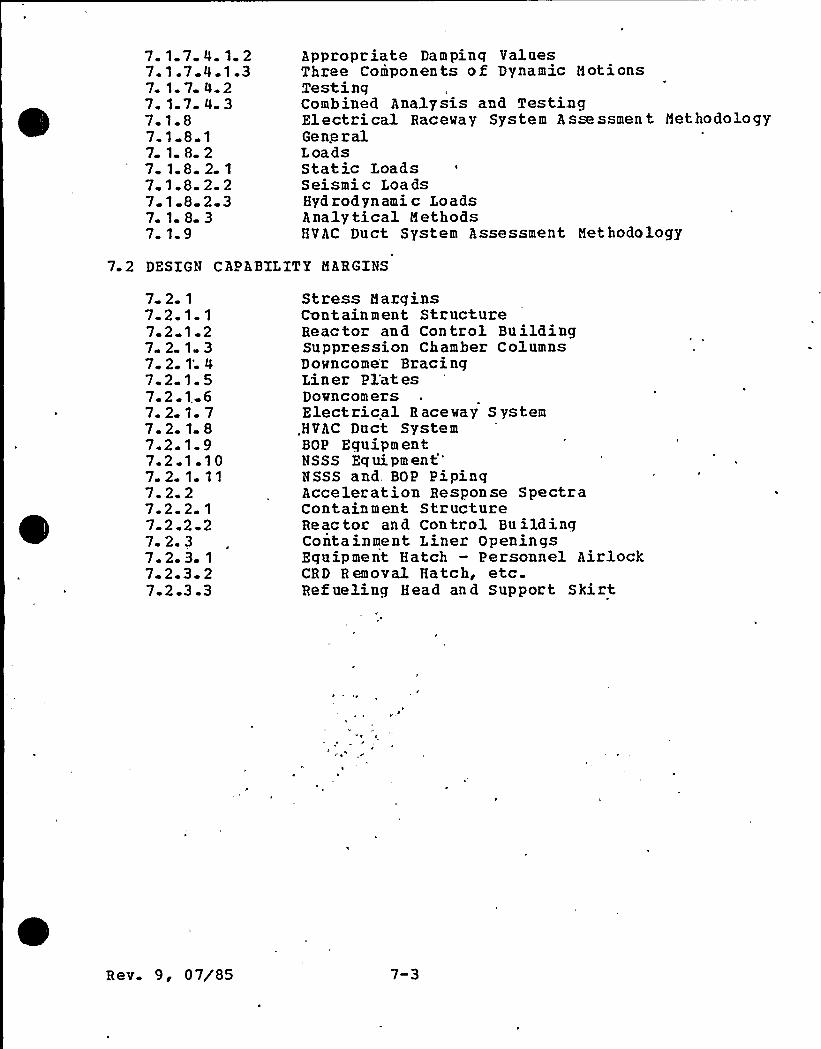
7.1 7 4 1 27. 1.7 4.1.3717427 1 7 4 37.1.87.1 8 171827 1 8 27 1.8.2 2718237.1 8 37. 1.9
Appropriate Dampinq ValuesThree Components of Dynamic MotionsTestingCombined Analysis and TestingElectrical Raceway System Assessment MethodologyGeneralLoadsStatic LoadsSeismic LoadsHydrodynamic LoadsAnalytical MethodsHVAC Duct System Assessment Methodology
7 2 DESIGN CAPABILITY MARGINS
7217-2 1. 1
72 1-27 2 1 37 2
1'21.5
721 67.2 1-7721872 1.97.2 1.107 2 1-117..2 27 2.2.17-2 2 27-2. 37.2 3 1
7 2.3 272 3.3
Stress MarginsContainment StructureReac tor an d Con trol Bu ildingSuppression Chamber ColumnsDowncomer BracingLiner Pl'atesDowncomersElectrical Raceway System
.HVAC Duct SystemBOP EquipmentNSSS
Equipment'SSS
and, BOP PipingAcceleration Response SpectraContainment StructureRe ac tor an d Con trol Bu ildingContainment Liner OpeningsEguipment Hatch — Personnel AirlockCRD Removal Hatch, etc.Ref ueling Head and Support Skirt
Rev. 9 i 07/85 7-3
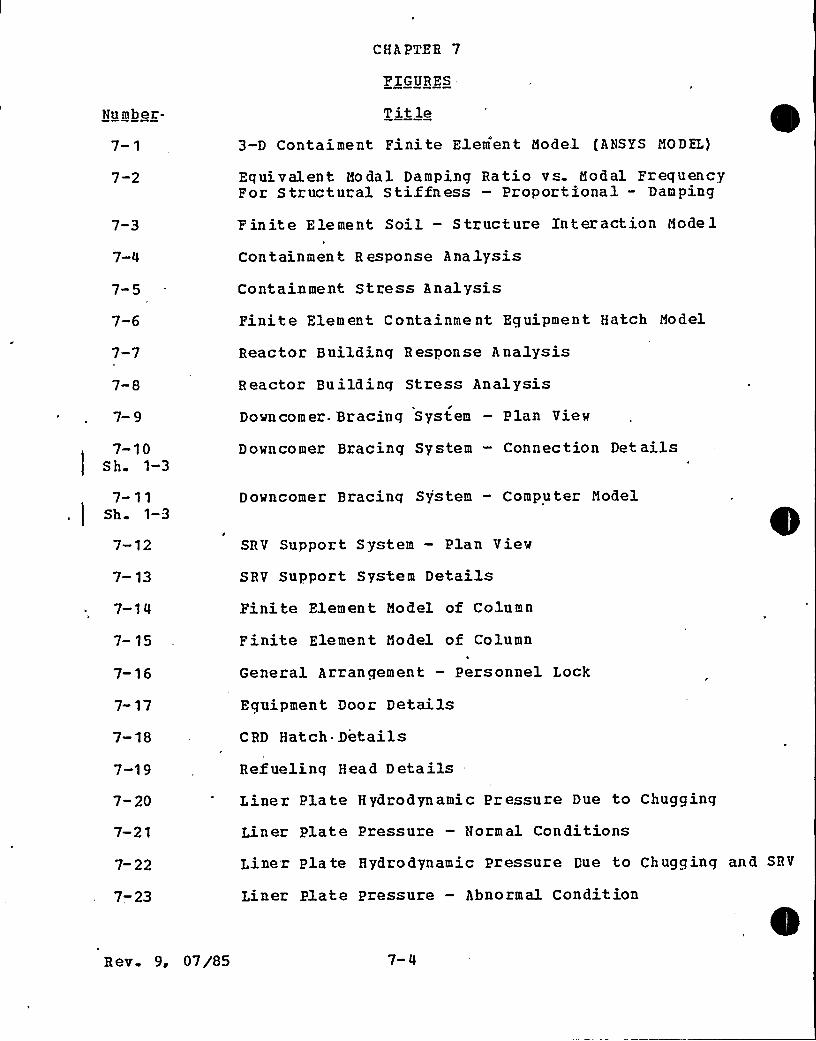
CHAPTER 7
FIGURES
Numher-
7-1
7-2
7-3
7-5
7-6
7-7
7-8
7-9
!
7-10Sh 1-3
7-11Sh 1-3
Title3-D Contaiment Finite Element Model fANSYS MODEL)
Equivalent Hodal Damping Ratio vs Hodal FrequencyFor S tructural Stiffness — Proportional — Damping
Finite Element Soil — Structure Interaction Model
Con tai n men t R esponse Ana lysisContainment Stress Analysis
Finite Element Containment Equipment Hatch Model
Reactor Buildinq Response Analysis
Reactor Bu ilding Stress .Analysis/
Downcomer. Bracing System — Plan View
Downcomer Bracing System — Connection Details
Downcomer Bracinq System - Computer Model
7-12
7- 13
~ 7-1 4
7- 15
7-16
7- 17
7-18
7-19
7-20
7-21
7- 22
7-23
SRY Support System — Plan View
SRV Support System Details
Finite Element Model of Column
Finite Element Model of Column
General Arrangement — Personnel Lock
Equipment Door Details
CRD Hatch Details
Refuelinq Head Details
Liner Plate Hydrodynamic Pressure Due to Chugging
Liner Plate Pressure — Normal Conditions
Liner Plate Hydrodynamic Pressure Due to Chugging and SRV
Liner Plate pressure — Abnormal Condition
R ev. 9, 07/85 7-4
FIGaRZS (Cont.)
Humber- Title7-20
7-25
7-26
Downcomer with Vacuu m Breaker and Detail oX Cap
Downcomer Without Vacuum Breaker
Location Hhere Downcomer Fatigue Analysis was Performed
Rev 9, 07/85 7-5
CHAPTEH 7
TABLES
Humhez Title7-1 Maximum Spectral Accelerations of Containment Due to
SHV and LOCA .Loads at 1% Damping
7-2 i1aximum Spectral Accelerations of. Reactor and ControlBui1dings Due to SHV and LOCA at 1Ã Damping
7-3
7-5
Usage Factor Summary of Downcomers
Usage Factor Summary of SHV Discharge Tines
Downcomer and Bracing System Nodal Frequencies
Hev. 9, 07/85 7-6
7.0 DESIGN ASSESSHZNT
Loads on SSFS structures, piping, and equipment are defined inChapter 0. The methods by which these loads are combined arediscussed in Chapter 5. The criteria for establishing designcapability are stated in Chapter 6.
This chapter describes the assessment of the adequacy of the SSZSdesiqn by comparinq desiqn capabilities with the loadings towhich structures, piping, and components are subjected anddemonstratinq the extent of the design margin. The first sectionof this chapter discusses the methodology by which designcapability and loads are compared. The second section summarizesthe results of these .comparisons.
Fev. 9, 07/85 7-7
7 1 ASS PSSliENT HZTHODOI.OG Y
7. 1 1 Containment and reactor Build~in Assessment Methodology
7 1 1 1 Containment Structure
7. 1. 1 1 1- Hydrodvnamic Loads
7. 1 1 1. 1 1 St ructural ModelsI
The dynamic analysis for the structural response of thecontainment and internal structures due to the SRV dischargeloads and LOCA loads is pezformed using the finite elementmethod The AHSYS (see Reference 75 and 76) finite elementcomputer proqram was chosen for the transient dynamic analysis.Figure 7-1 shows the AHSYS finite element model Beam elementsand spaz elements are used for the stabilizer truss. Lumped masselements are used for the RPV internals anQ suppression poolfluid Sprinq-,damper elements are used to mod~i the rockfoundation. The ANSYS model includes a total oX 761 elements and200 dynamic degrees of freedom.
The soil structure interaction is taken into consideration bymodelling the soil using a series of discrete springs and dampersin three directions as shown in Figure 7- 1. The properties ofthe discrete sprinqs and dampers are calculated based on theformulae for lumped parameter foundations found in Reference 33.The validity of this soil model is proven hy comparing theresults with those of an independent model which represents thesoil by finite elements.
7. 1 1 1 1. 2 Damping
a. Structural Dampinq
The equations of motion for a discretized structure mustinclude a term to account for viscous damping that islinearly proportional to the velocity. The equations ofmotion for a damped system are:
[M] {r] + [C] {r) + [K] {r} = {R(t) ]
where f C1 is the viscous damping matrix.
A viscous damping matrix of the form
[C] = a[M] + /[K] was used (Reference 53).
Rhere ~ and g aze proportionality constants which relatedampinq to the velocity of the nodes and the strain ratesrespectively. This dampinq matrix leads to the followingrelation between a and 9 and the damping ratio of the ith
Rev. 9, 07/85 7-8
mode C.:1
C. = u/2w. + gw./23. 3. i
where wi is the natural freguency of the ith mode. For theusual case of only structural damping, a= 0 and therefore
B = 2Ci/wi.
Since only a single value of 8 is permitted in the ANSYSinput, the most dominant natural frequency of the structureis selected for the computation of 8 (see Reference 54).
A value of 8 equal to 0.00063 is used in .the ANSYS modelwhich corresponds to structural modal damping ofapproximately 4 percent of critical at 20 Hz which is themost dominant natural frequency of the structure.Fiqure 7-2 shows modal dampinq zatio versus modal frequencyfoz structura'1 stiffness-proportional-damping.
b. Soil Sprinqs and Radiation Damping
The elastic half-space theory as described by Reference 33(BC-TOP-4A Rev. 3) were used to compute the values of theSpring Constarits 'and dampers in the horizontal and verticaldirections (KH, K~, CH 8 C~ ). The following parametezs areused to represent the rock foundation:
6 = Shear Nodulus of foundation medium
1..154 x 103 KSI
=Poisson's ratio of foundation medium
0 3
V = Shear wave veloci tys
6 180 ft/'sec
From which we get the following:
K = 3.37 X 10~ K/inH
C = 1. 57 X 104 K-sec/inH
K . = 3.96 X 10~ K/inV
C = 2.72 X 10~ K-sec/inV
The above lumped foundation springs and dampers were thendistributed to every node on the basemat according to thetributary area.
Rev. 9, 07/85 7-9
7 1. 1 1. 1. 3 Fluid-Structure Interaction
For the application of SRV loads described in Section 4.1, afinite element model of the containment was developed in whichthe suppression pool water was included. The water massconstitutes only one seventh of the total mass oX the reinforcedconcrete structure. The model used considers fluid-structurecoupling by lumpinq the water mass in the suppression pool ateach nodal point of the wetted surface. The weighted areaapproach is considered to determine the fluid mass at each nodeof the suppression pool.
Foz the application of the LOCA steam condensation loads, basedon the containment wall pressure time histories calculated by theacoustic methodology (see Subsection 9.5.3.4.1 and 9.5.3.4. 2),the water mass was excluded The exclusion of the water-mass isRue to the fact that fluid structure interaction was alreadyconsidered duzinq the pressure time history calculations(Reference 65) .
7. 1. 1. 1. 1. 4 Su~olementa~r Co~mu ter Pr~ozams
Supplementary computer programs were used for prepzocessing andpostprocessinq of data qenerated for or by the ANSYS computerpr cq ram.
A preprocessinq program called CHUG was developed to convert thepressure time history forcing functions into concentrated forcetime — history forcing functions acting at the associated nodesof the ANSYS model. The pzoqram writes the nodal forces onto a .
file for processing by ANSYS.
A postprocessor program was developed to calculate theacceleration time history. This program is called DISQ. Ztreads the structural response displacement time historiesqenerated from ANSYS Risplacements, scans the maximumdisplacements and generates the acceleration time histories usingthe Fast Fouzier Transformation method.
Bechtel inhouse computer program HSPEC was used to compute theacceleration response spectrum obtained from DISQ. The programal'so performs plottinq and broadeninq of the spectrum.
A computer proqram FNVLP was developed to generate envelopes of anumber of spectrum obtained from MSPFC.
Computer proqzam FORCE was developed to scan the maximum absolutestresses qencrated by ANS YS stzess pass. A .further explanationof FORCE is found in Subsection 7.1.1.1.1.6.2.
Verification of CHUG, DISQ, ENVZ,P and FORCE are available forreview.
Be v. 9, 07/85
7. 1. 1 1 1. 5 Load Application7 1.1.1.1.5.1 SRY Ris~chao e Loa6s
The SBV loads have been defined in Section 4.1 based on KWU SHVTraces N76, 82 and 35.
To obtain the maximum response of the containment due to bubbleoscillation, a wide range of frequency content of the forcingfunction i considered.
The range of frequencies specified by KMU is between 55K) and1107'f
the frequencies of the three original traces as present inSubsection 4. 1. 3. 5.
Based on the natural frequencies and the mode shapes of theprimarv containment as shown in Appendix 8-1, five differentfrequencies in the range specified are selected in order toobtain the maximum structural response. The five frequencyvalues are considered for each of the three original KWUpressure-time history traces which result in ifteen pressure-time histories to be considered.
As described in Subsection 4 1.3, four pressure distributionsdependinq upon the number of valves actuated are considered;i.e., "All valve, ADS, asymmetric, and single valve". However/the azimuth distribution on the periphery indicates that the allvalve case governs the ADS case for the symmetric loading and theasymmetric case governs the sinqle valve case for the asymmetricloadinq. Therefore, the design assessment is based on only twocases, i.e., "symmetric and asymmetric".
7 1.1.1. 1. 5 2 LOCA Belated Loads
The LOCA loads are based on LOCA steam condensation testsperformed by Kraftwek Union AG (KWU) at their GKYi-II-M testfacility. Section 9.0 describes the test facility, test matrix,test results and the GEE-II-5 LOCA load definition developed tore-evaluate SSES for chugging and condensation oscillation.7.1.1 1. 1 6~Anal ses
7. 1+. 1. 1. 6 1 ~ Time- History Ana~lsis
The structural finite element model of containment as outlined inSubsection 7.1.1 1.1. 1 is solved by "Reduced Linear TransientDynamic Analysis" of the ANSYS computer program. The descriptionof the analysis and the data input are contained in Feferences 75and 76, respectively.
For each set of pressure time histories, based on the analyticalprocedure in Fiqure 7-4, acceleration response spectra wereqenerated at 52 dynamic degrees of freedom in the containment.Nodal point response spectra generated from several load
Be v. 9, 07/85
conditions/traces were enveloped into one set of floor responsespectra curves which represent SRV and LOCA.
The response spectra were generated in two pairs of dampingvalues, the low and the hiqh dampinqs. The low damping valuesare 0.5, 1, 2 and 5 percent of critical, and the hiqh dampingvalues are 7, 10, 15 and 20 percent of critical The peakfrequencies of the spectra are broadened by 15% and 20~» for lowand high dampinq values, respectively.
Appendix 8 contains the above zesponse spectra for low dampingvalues at 9 locations.7. 1. 1. 1. 1. 6. 2 S tress Ana lysisThe AtlSYS computer proqram (stress pass) is used to compute theforce and moment resultants due to SRV and LOCA related loads. A
postprocessoz pzoqram called "FORCE" is developed and used toscan for the maximum absolute values of forces and moments in theazimuth direction.A multiplier factor for the force and moment resultants due toSRV 1oads has been estab1ished to cover for all the ranqe offrequencies as specified in Subsection 7 1.1.1.1.5.1. Thefollowinq procedure is used to establ.ish the multiplier.A statistical analysis of all the forces and moments obtainedfrom the three traces with varying frequencies in the rangespecified is performed. Trace number 82 is taken as the base toestablish a multiplier factor to cover the other 2 traces and thevariation of frequencies'ince it is observed to develop thehighest stresses at most, cross-sections. A multiplication factorof 1.7 is established to be applied to the resultant forces andmoments from Tzace 082 SRV discharqe loading.
The fozces and moments due to Chugging and CondensationOscillation (CO) loads aze considered. Fzcm the zesponse spectraplots of Chuqqinq and CO loads, it was found that KHU Sources 306and 303 were the contzollinq cases. Therefore, these two 1oadcases have been analyzed for stresses in containment. Tgedisplacement-time histories obtained from the GKH-ZI-H loaddefinition (see Subsection 9. 5.3) are inputted to ANSYS computer
'odel.A post processor program called SCALE was used to scanfor the maximum values of forces and moments in the azimuthdirection for each load case. For the containment sections shownin Fiquze A-2,'he envelope of force resultants foz all the loadcases was inputted to the CFCAP computer analysis (Refer to FlowChart, Fiq. 7-5, for further infozmation) .
7. 1. 1 1. 2 Seismic Loads
Seismic loads constitute a significant loading i~ the strucutzalassessment. The same seismic loads as those used in the initialbuilding desiqn are used. In that design, a dynamic analysis wasmade usinq discrete mathematical idealization of the entire
Pev. 9, 07/85 7- 12
structure usinq lumped masses. The resulting axial forces,moments, and shear at various levels due to the Operating BasisEarthquake and the Safe Shutdown Earthquake are used '(see section3.7 of FSAB) . The effects of the seismic overturning moment andvertical accelerations are converted into forces at the elements.
As required by NUREG 0487, the effect of sloshing on thecontainment due to horizontal and vertical SSE is invetigated byperforminq a time-history analysis. As described in Subsection4.2.4.7, pressure time histories due to seismic slosh wereqenerated for input to the AHSYS model shown in Figure 7-1.
The response spectra qenerated from the seismic slosh load arepresented in Figures B-51 to B-58. By inspection, the peaks aresma ll.7.1.1.1 3 Static and Thermal Loads
The loads under consideration are the static loads {dead load andaccident pressure) and temperature loads (operating and accidenttemperature) which are all axisymmetrical.
a. To analyze the above static loads, an inhouse computerproqram FINEL is used. Moments, axial and sheaz forces arecomputed by FINEL in an uncracked axisymmetric finite elementco'ntainment model.
b. The operatinq and accident temperature gradients are computedusing NE 620 computer program (Bechtel program) . Thisprocedure is discussed in Subsection 3.8. 4. 1 of the FSAH.
c. The results from a, b and the dynamic/seismic analysis arecombined and applied to a containment element. The elementcontains data relative to rebar location, direction andquantity and concrete properties. within that wall elementan equilibrium of forces and strains compatibility isestablished by allowing the concrete to crack in tension Inthis way the stresses in the rebar and concrete aredetermined. The program used for this analysis is calledCECAP. For further explanation, see Figure 7-5.
7.1 1.1 4 Load. Combinations
All load combinations from 1 through 7a as presented on .Table 5-1have been analyzed This was done under step c of Subsection7.1. 1. 1.3 above. If all the SRV actuation cases and chugqinq-symmetric and asymmetric-loading along with other loads are to beconsidered, 41 loading combinations would have to be assessed.
Some of these load combinations have been eliminated hyinspection since they are not governing. The five basic loadcombinations which have been assessed and presented in thisreport are 1, 4, 4a, 5a and 7a
Rev. 9, 07/'85 7- 13
The reversible nature o.f the structural responses duedynamic loads and seismic loads is taken into accountconsiderinq the peak positive and negative magnitudesresponse forces and maximizing the total positive andforces and moments qoverninq the design.
to the poolbyof thenegative
Seismic and pool dynamic load effects are combined by summinq thepeak responses of each load by the absolute sum (ABS) method.This is conservative and the square root sum of squares (SRSS)methcd, is more appropriate since the peak effects of all loadsmay not occur simultaneously. However, the conservative ABSmethod is used in the desiqn assessment of the containment andinternal concrete structures in order to expedite licensinq.7. 1 1. 1 5 Desian. Assessmen tMaterial stresses at the critical sections in the pzimarycontainment anQ internal concrete structure are analyzed usingthe CECAP computer proqzam. Critical sections for bendingmoment, axial fozce and shear in thzee directions are locatedthzouqhout the containment structure. The liner plate is notconsidered as a structural element. The CFCAP pzogram considersconcrete crackinq in the analysis of reinforced concretesections. CZCAP uses an iterative technique to obtain stressesconsiderinq the redistribution of forces due to cracking and inthe process it reduces the thermal stresses due to the relievingeffect of concrete cracking. The proqram is also. capable ofdescribinq the spiral and transverse reinforcement stressesdirectly. The input data for the program consists of theuncracked forces, moments and shears calculated by PINEJ., ANSYS,and se'ismic analysis. The loads are then combined in accordancewith Table 5-1 with appropriate loaQ factors.7.1.1 1.6 Equipment- Hatch
There are two equipment hatch openinqs in the containment dr Ywellwall at approximately El. 723 ft. The openings are 1800 apartand have a diameter of approximately 12 ft. Concrete a'nd rebarstresses around the local hatch area were assesseQ.
7.1 1 1 6 1 Structural Model
'igure 7-6 shows the STARDYNE finite element model that wasdeveloped for analysis of the dryvell wall around the hatchopening. The mode1 consists of a section of the dzywell wall,diaphragm slab, and wetvell wall with all boundaries at least twohole diameters away from the edge of the opening. All loads canbe considered as symmetric about the openinq centerline, thusonly one half of the opening was modeled. The model usesquadrilateral plate elements with both membrane and bendingstiffnesse s. Unczack ed sections with concrete materialproperties were used. Loads were applied statically and boundaryconditions vere chosen to be consistent with the type of loadingapplied (Ref. BC Topical Report 45) .
Rev. 9, 07/85 7-14
7-1-1-1-6. 2 - T.pads- and T.oad Combinations
load combinations are as per Table 5-1. Hydrodynamic loadsapplied to the model boundaries were taken from the force andmoment results of the ANSYS containment model described inSection 7.1. 1. 1 1. Seismic loads were taken from force andmoment results of the containment model as given in Section7. 1. 1. 1. 2. Temperature was considered for the worst case wallgradien t.
Pour critical sections around the hatch opening vere used forassessment.,Noment and force resultants from the STAT?DYNE modelwere input to computer program CECAP (CE987) to determinestresses in the concrete and.rebar.
7. 1.1.2 Reactor and Control. Buildincis.
7. 1. 1. 2. 1. 1 Structural Hodel-
The construction of the SSFS reactor buildinq. is such that nodirect coupling vith the containment occuzs. A 2 in. separationjoint is kept betveen the containment structure and the reactorbuildinq at all levels where the tvo structures abut, except atthe base slab vhere a cold joint exists. This arrangementminimizes the transfer of any direct dynamic respon e to'hereactor buildinq from the containment, where the SRV dischargeand LOCA related hydrodynamic loads originate.
~ 0a
The horizontal motions of the containment are considered to befully transferred to the reactor building throuqh the cold jointat base slab; but the vertical motions aze attenuated to accountfor the transfer through the rock under the two structures. Theattenuation has been 'accounted for by using the weighted averageacceleration time histories at different points away from thecontainment and to the end of the reactor building boundary. Theveiqhted average acceleration is defined as:
nZ A.a. n.z=l i C.a.Z C.
A.i=1 iin which a is the individual acceleration. Ai is the free,'field area on vhich the acceleration acts and Ci is the weightedavezaqe coefficient.This averaqe time history is applied as an input motion to thereactor buildinq dynamic model. The finite element soil-structuze interaction. model used .for the attenuation study ishovn in Piqure 7-3. "
Hev 9 ~ 07/05 7- 15
The mathematical models of the reactor and control buld,ingsconsist of lumped masses connected by the linear elastic members.Usinq the elastic properties of the structural members, therepresentative stiffness values for the models are determined.The models used for design and hydrodynamic load assessmentproqrams prior to January 1, 1983; forNorth-South, East-Hest, andVertical directions are shown in Fiqures C-1, C-2, and C-3respectively in Appendix 'C'. (These moQels aze the same asthose used for the seismic analysis prior to January 1, 1983.)Subsequently, revised reactor and control building dynamic modelsfor the North-South, East-best and Vertical directions have beenu tilizec. in des igns, qua lifica t ions and a ssessmen t programs. I nthe months pzeceedinq January 1, 1983, the models were revised asa result of discrepancies in some of the original modelingassumptions and representations. Using the revised models, a newset of response spectra was generated. Safety relatedstructuzes, systems and components that were designed/gualifiedto response spectra from the previous models were assessed to therevised response spectra. Appendix L provides a discussion ofthe modelinq changes, revised response spectra and a de cziptionof the assessment program.
7.1.1.2.1 2 lo~ad A plication7 1 1 2. 1. 2 1 SBV Disch arge. Loads
The axisymmetzic and asymmetric SRV discharge loadinqs used inthe reactor buildinq assessment are described in the chapter 4.1of this report. During the axisymmetzic .loadinq, only the 'grossvertical motion of the base slab is transferred to the reactorbuildinq. Therefore, the broadened response spectra curves foraxisymmetric loading qiven in Appendices 'C'nd 'L're fozvertical direction, only. However, during the asymmetric loading,qross vertical motion as well as the gross .horizontal motion ofthe base slab are considered in Qevelopinq the vertical andhorizontal response spectra curves foz the reactor building. Thevertical mctions are attenuated and the horizontal motions aredirectly transmitted to the Reactor/Control Buildinq foundation,.refer to 7'.1.2.1.1. The broadened response spectra curves forasymmetric loadizq given in the Appendices 'C'nd 'L', aze forboth vertical and horizontal directions.Three different pressure-time history traces (Figures 4-28through 4-30 of Chapter 4) are used for generating responsespectra curves at the„base of reactor building over a wide rangeof frequencies, i.e., 55Ã to 110% of the original.7. 1 1. 2. 1. 2. 2 . LOCA ~ Belated Toads-
Toadinqs associated with Loss of Coolant Accident (LOCA) azebriefly described in 7.1 1.1.1 5.2. The gross vertical andhorizontal motions of the Containment base slab due to symmetricand asymmetric load conditions are transferred to theReactor/Control Buildinq. The vertical motions aze attenuated
Rev 9, 07/85 7-16
and the horizontal motions are directly transmitted to theReactor/Control Building foundation, refer to 7. 1. 1. 2.1. 1.
7 1 1 2. 1. 3 Analyses
7.1.1 2.1. 3 1 Time History. A~nal sis.
To develop floor response spectra, a time history analysis ofReactor/Control Buildinq was performed using three separatelumped mass models which simulate the E-H, N-S, and verticalresponses. The models are shown on Figures C-1/L-1, C-2/L-2, andC-3/L-3. The analytical procedure i presented in the flow chaztin Fiqure 7-7
The structural or modal damping used in the transient analysis ofthe Reactor/Control Building for hydrodynamic loads due to SRVand LOCA is 4 percent of critical damping. Based on RegulatoryGuide 1.61, this is the dampinq value recommended for reinforcedconcrete structures for OBE condition. As this value is used forboth Upset condition (load combina'tions including OBE) andFaulted condition (load combinations including SSE) it isconsidered to be conservative.
Like in the containment, nodal point response spectra generatedfrom several load conditions/traces were enveloped into one setof floor response spectra curves which represented SRV and LOCA.
For analyses utilizinq the models presented in Appendix C, thedampinq values included in generatinq the'loor response spectraand broadening of the peak frequencies of the spectra are thesame as in the containment structure.
Appendix C contains the floor response spectra based on originalmodels for low dampinq values for SRV and LOCA. Appendix Lcontains the floor response spectra based on the revised modelsfor low damaging values for SRV and LOCA.
7 1 1. 2 1 3 2 - Stress Analysis
The larqest responses at the reactor building base due to all thehydrodynamic loadinqs are used to obtain forces and moments inthe members of the reactor building. The damping values are 2Fand 5% for load combinations involvinq OBE,and SSE/LCCArespectively. For the first part of the analysis, the Bechtel.Program CE 917 is used to do the modal analysis for the vertical,the East-West and the North-South directions. The results ofthese analyses are used for input to the Bechtel Program CE 918.Another input to program CE 918, is the envelope of theacceleration response spectra of the gross motion time-historiesdue to KWU Souzces 303, 305, 306, 309 and 314, symmetric andasymmetric load cases. These are obtained fzom steps 12 and 15of Figure 7-4. The analysis determines member axial forces,shear forces, and bendinq moments. The analytical procedure ispresented in the flow chart in Figure 7-8. The following loadcases are considered.
Rev. 9, 07/85
1. Conden sa tion-Oscilla t ion vez tical foz 25 and 5% dam pings.
2a. SRV vertical symmetric and asymmetric for 2'5 and 5",o dampings.
2b. SRV North-South asymmetric for 2K and 5',t dampings.
2c. SRV Fast-Hest asymmetzic for 2< and 5% dampings, Case 2cinvolved four separate conditions depending on the positionsof the Reactor Building crane.
3a. LOCA vertical symmetric and asymmetric for 2% and SKdampings.
3b. LOCA North-South symmetric and asymmetric for 2% and 5%da m pinq s.
3c. LOCA Fast-Hest symmetric and asymmetric for 2% and 5%dam pin qs.
The combined forces and moments in the members of the modelspresented in Appendix 'C'ue to LOCA, S3V, and seismic loads. forboth 2% and 57'amping values in each of the veztical, East-Hest,and North-South directions vere determined (see Figures E-23 thruE-32) The stress analysis for the revised models is discussedin Appendix L.
The reactor building superstructure steel was analyzed separatelyusinq a 3-D finite element lumped mass model. The model is shownin Figure F,-21. The bridqe crane and crane girders were alsomodeled. The dynamic analysis was done usinq the time-historymethcd for seismic loads and response spectrum method forhydzodynamic loads with Bechtel computer program BSAP. Elemberforces and moments were generated for several different crane andtzolley positions. In general, the members experienced theirhighest stresses when the bridge cranes vere positioned such thatthe maximum possible tributary load is distributed to thecolumns. The critical case is vhen bridqe crane bumper strikeson one side of the superstructure during SSZ or OBE. The resultsare described in Subsection 7. 2. 1. 2.
I
The refuelinq pool" and qirders were analyzed separately using a3-D .finite element model." The structure contains the surge tanksvault, fuel shippinq cask storaqe pool, spent fuel storage pool,reactor veil, and the steam dryer and separator stora'ge pool.For refuelling conditions, all compartments are considered fullof vater vith the exception of the surqe tanks vault, which isempty. For operating condition, only the spent fuel storage pooland the fuel shipping cask storaqe pool aze full of water whilethe remaininq compartments are empty. Hater mass was lumped atthe compartment floors for the dynamic analysis.The dynamic analysis was done using the response spectrum methodvith the computer program STARDYNE. Static and thermal analysesvere also me@formed on STARDYNE program.
'Rev 9, 07/85 7-18
The analysi vas performed for critical load combinations whichwere established by inspection. The results are described insubsection 7. 2. 1.2.
The box section columns supporting the refueling pool girderswere included in the finite element model of the refueling poolanalyzed above. The displacements and reactions obtained fromthe above model were used to assess the structural strength andstability of the columns.
7 1 1 2. 2- . Seismic Loads-
The seismic analysis methodology is discussed in the subsection3.7b.2.1 of the FSAB.
7 1 1 2 3 - Static- and Thermal Loads.
The static loads are discussed in the subsection 3.8.4.4 of theFS AR
7 1.1.2.4 . Load Combinations
All individual loads are combined with the appropriate loadfactors as shown in Table 5-1.
Steel structures are checked for the load combination listed inTable, 5-2.
7. 1. 1. 2 5 Des~in Assessment
Critical sections for bending moment, axial force and shear inall three directions are located throughout the reactor building.Design capability at the critical sections is determined and thenthe design capability is compared with the actual forces andmoments acting on the sections under all the load combinations.This comparison yields design margins. The design margins arediscussed in Section 7.2 1.2
Rev. 9, 07/85 7-19
7..1. 2 Structural Steel Assessment ilethodol~og
7 1. 2. 1 Downcomer Braci~n
7. 1. 2. -1. 1 Bracing System Description
There are 87 downcomers which extend vertically from thediaphzaqm slab to El. 660 '-0» in the wetwell, wh ich isapproximately 12 feet bej.ow normal water level. The five vacuumbreaker downcomezs have been capped (see Figuze 7-25), however,with reqard to the bracing system, these five downcomers stil1provide vertical and lateral suppozt, since they were capped atthe downcomer exits. Downcomers are 24» 0 E. yipes with 3/8 inchwall thickness, and are embedded in the diaphragm slab.Downcomezs are separated into four independent quadrants. At El668'-0» all downcomers within a quadrant are tied togetherlaterally with a bracing system consisting of 6 inch 0. D- XX-strong pipes. The bracing members are not connected to eitherthe wetwell wall or pedestal, thus eliminating stresses due tothermal expansion and, wetwell wall displacement duzinqhydrodynamic loads. The downcomezs support the bracingvertically. The bzacinq connections consist of 1/2» ring platesand vertical stiffeners. The SHVD lines are not connected to the.bracinq Figures 7-9 and 7-10 Sheets 1-3 show a plan view of thebracinq system and the bracinq connection details, respectively.7. 1 2. 1. 2 Structural Nodels
A 3-D STARDYNE finite element model of both the bracing anddowncomezs was developed for analysis of both the downcomers andbracinq. The. worst case quadrant of the four was chosen formodeling (3 ADS lines in the vicinity of the quadrant) . Thechosen quadrant extends from containment radial of 345~ to radialof 66.7~. This quadrant consists of 23 downcomezs modeled aspipes and havinq fixed boundary conditions at the diaphragm slab.Bracing members are modeled as pipe elements between downcomersusing the actual brace member lengths Beam connector elementsextend from the node at the center line of each downcomer to theend of the bzace member. Connector elements ha ve equivalentsection properties chosen so as to match stiffnesses determinedanalytically from the .finite element model of the bracingconnections described later. A lumped water mass consisting oftwo times the downcomer or bracing pipe volume (one time for thevirtual mass ef feet and one time for the contained fluid) is usedfor nodes below- the water level to account for the effect due tofluid-structure interaction The model consists of 323 nodes,251 pipe elements, 88 beam elements, and 276 dynamic degrees offreedom for reduced eigenvalue solution (STARDYNE HQR). Totalweiqht considered in the model is 214.5 kips. Figure 7-11(Sheets 1 8 2) shows the model.
A separate BSAP finite element model was developed for assessmentof the bzacinq connection and downcomer in the vicinity of theconnection. Figure 7-11, Sheet 3 shows the model. A section ofthe downcomer at the brace level is modelled with plate elements.
Hev. 9, 07/85 7-20
Boundaries of the downcomer were taken sufficiently,far away fromthe connection to eliminate their influence. The connectorplates, top partial plates, main ring plates, verticalstiffeners, and top ring plates were modeled with plate elements.(see Figure 7-11, Sheet 3) . Brace member forces from theSTARDYNE downcomer and bracing analysis were used as input leadsfor the assessment of the connection shown in Figure 7-10, Sheet3. The BSAP finite element model was also used to determine thestiffnesses of the connector elements used in STARDYHE.
7 1.2 1 3 Loads
The basis for all hydrodynamic loads considered, is given inSec tions 4 and 9.
7 1.2 1.3 1 SBV-Di'scharcCe Loads.
SRV actuation results in fluid pressure loads acting on thecontainment, downcomers, and bracing. All loads are based on EMUTraces 76, 82, and 35. Qith respect to the downcomers andbracinq, two different types of loads can he defined. One typeconsists of inertia loading. This is movement of the containmentstructure due to SRV fluid pressures acting directly on thecontainment. The response spectrum method is used for analysisof this loadinq by applying the diaphragm slab spectra (El. 702'-3", see Appendix B) due to SHV to the STARDYNE model.
The second type of loads are described as submezged stzuctureloads. These loads are due to the direct fluid pressures actingon the downcomezs and bracinq. As described in Subsection4.1.3.7 3, potential flow theory and the method-of-imaqes wezeused to calculate the load time histories for each downcomer inthe model. These were applied to the STAHDYNE model and a lineartransient dynamic analysis was performed.
7 .1 2. 1. 3 2- LOCA Belated Loads.
During a I,OCA several types of loads act on the downcomers andbracinq. Two of these are inertia and submerged stzucture loads.These have the same definition as for the SRV case and theanalysis is performed in the same manner. This consists of theresponse spectra method for inertia load analysis and lineartransient dynamic analysis for submerged structure loads.
Subsection 4.2.2.5 describe the methodoloqy for determining thedowncomez draq loads due to CO and chugging.
The containment zesponse spectra generated for CO and chuggingwere determined by the methodology documented in Subsection9 5.3
In addition to the above loads, a dynamic lateral load due tochugging at the downcomer tip also occurs. 7oz analyzingmultiple downcomers in a quadrant, the generic multi-vent lateralload definition documented in Subsection 4.2.2.4 is used.
Bev. 9, 07/85
Xn additio'n, as zeguired by t e NRC, a sinqle vent impulse with a65 kip amplitude .and 3 m ec duration is applied one time per LOCAevent to any single ddwncomer. This is a low probability eventand is only used to show that the downcomer would not fail forone such loadinq.
For loth types of tip loads, several linear transient dynamicanalyses were performed. Loads were applied in directions, so asto maximize forces and moments in the downcomers and braces.
Air clearinq in the downcomers during a LOCA also producespoolswell drag and fallback loads on the bracinq. This loadoccurs before Chugging and CO and need not Le considered incombination with those LOCA loads. Bechtel Nuclear Staff definedthe pressure time histor7 loads on the braces and they wereanalysed locally for these loads (see Subsection 4. 2 1. 7) . Anoverall 'equivalent static load on the bracinq system was appliedto the STARDYNE model.
7 1.2.1 3 3 Seismic Loads
The diaphraqm slab response spectra. developed foz OBE and SSE asdescribed in Subsection 3.8.1.4.1 of the FSAR were used as inputto the STAHDYNE model to obtain resultant forces in thedowncomers and hracing.
Xn addition to the inertia loadinq, seismic sloshinq in thesuppression pool imparts .loads on tho downcomers and hraciag (seeSubsection 4.2. 4.7) . The sloshing frequency is very low andstatic loads based on the sloshinq fluid pressures were appliedto the STAP.DYNE model.
7. 1 2. 1.3 4 Static and Thermal Loads
The dead load of the downcomers and bracinq is considered. TheLOCA condition results in the worst temperature loading (Ref.Figure 4-52, Section 4) . A maximum temperature of 180~F is usedwith ~ 65~ beinq taken as the stress free condition.7. 1 2. 1. 4 - Load Combinations
Load combinations and allowable stresses are in accordance withSubsection 5.2. The stochastic loads, i.e., seismic inertia, andthe inertia and submerged pressure loads of SRV and chugging arecombined by SRSS method. The chugging lateral load is defined asa single impulse and is added by absolute sum method. Theseismic sloshing loads are added by absolute sum method due totheir low frequency wave. All the static loads aze combined byabsolute sum method. Poolswell is not combined with other LOCAloads since it preceeds them {see Subsection 4.2.1)
7. 1.2. 1 5 - Design Assessment
The results from the three dimensional STARDYNE model of thebracinq and downcomers are combined to determine the total stzess
Bev. 9, 07/85 7-22
due to both axial forces and moments. A comparison between thecalculated 'combined stresses and allowables is made and'hestress margins are qiven in Appendix A.
7 1 2 2= SR V ~Su Dort and Column
7. 1.2.2 1 . Desc~zi tion ~ of SRV- S~uort Assemblies anQ~Su zession Chamber Columns.
ln the suppression pool, there are three types cf supportconfiqurations to laterally brace the SRV discharge lines; twoare at El 666 'nd the third is at El. 667'. Each type ofsupport assembly consists of two horizontal bracing members andat least one knee brace member. The support assemblies areconnected from the SRV discharge lines to the adjacent column (orcolumns) with 4-inch diametez double extra tzong pipes.
The support assemblies restrain the SRV discharge lines in ahorizontal direction but not in vertical direction. The generalplan of these support assemblies is 'shown in Figure 7-12 andmember connection and the details are shown in Figure 7-13.
The suppression chamber columns are 42 inch diameter pipes vith1-1f'4 inch wall" thickness. The columns are attached at thediaphraqm slab at El 700'nQ at the basemat at El. 648'.
7.. 1 2 2. 2 S true tural Models
a. The columns were independently analyzed for static anddynamic loads. The analytical methods used for non-hydrodynamic loads such as dead, live, pressure, temperature,seismic and pipe rupture loads are described in the PSAR,Section 3.8.3 .4. 5.
programNASTRANis showndivided
Annsidered.n at thend moments
For the hydrodynamic SRV loads, the AHSYS computerwas used.'or the hydrodynamic LOCA related loadscomputer program was used. A typicaj. column modelin Piquze 7-14. The total length of the column isinto beam elements vhich a re joined at node poin ts.effective water mass due to submergence was als'o coDynamic .horizontal forces vere applieQ to the columnode points below the water. Time-varyinq forces ain the column were calculated for each element."
c. Another finite element model was developed in vhich the SRV- lines, the SRV support assembly and the column were included.
SRV and LOCA related submerqed structure loads as well as theinertia effects from the dynamic loads were considered. Promthis analysis, the SRV discharge pipe's reactions at thesupport locations vere obtained.
The assessment of the columns is based on the combination ofloads obtained .from a, b, and c above. The assessment of the SRVsupport assembly is based on loads obtained in para'graph c above.Each of the suppozt types is analyzed separately.
Rev. 9, 07/85 7-23
In order to determine the local stresses in the vicinity of thesupport assembly on the column wall, the column was modeledwiththe PASTRAMI computer pzoqzam using plate finite elements.The model i" shown in Piquze 7-15
7. 1. 2 2. 3 LoadsE
The support assemblies of the SRV discharge lines are submergedstructures. They are subjected to direct pressure loads fzom airbubble etc, the reactions from the SHV lines due to SRVdischazqe loads, and the inertia loads due to the buildingresponse from dynamic loads. Thermal loads are due to increasein pool temperature durinq LOCA.
7 1. 2 2. 3. 1 SRV Discharge- Loads
The horizontal SRV discharge pressure-time histories areconsidered as actinq on the columns, the SRV discharge pipe andthe support assemblies. The vertical SRV discharge pressures areconsidered as acting on the support assemblies alone.
The reactions from the SRV lines obtained from Subsection7.1.2.2.2 c are applied to the end of the SRV support members forcomputation of lonqitudinal member forces. The directhydrodynamic pressures due to SRV,actuations are appliedstatically pezpendicular to the SRV support members, with adynamic magnification factors. . The SHV hydrodynamic pressuresare determined as defined in Subsection 4 1.3.7. This is donefor the computation of moments and shear .forces in the membezs.
The inertia forces from buildinq responses due to SHV d.ischargeload are also included by usinq the response spectra resultsshown in Appendix B.
Member forces and moments obtained fzom dizect application of SRVdischarqe pressures, reaction forces of SBV pipe line,.and theinertia buildinq responses are combined by absolute sum'.
The SRV submezqed structure load definition is based onSubsection 4. 1. 3. 7.
7 1.2.2 3.2 LOCA Helated Loads
Durinq a LOCA, several phenomena cause hydrodynamic loads on theSHV support assemblies. The manner in which the LOCA relatedloads are applied to the SRV support assemblies is exactly thesame as described 'for the SRV loads in Subsection 7. 1. 2. 2.3. 1.The LOCA related loads used for the bracinq are used for the SBVsupport assemblies, except the lateral tip load due to chuggingis eliminated.
Amonq the LOCA related loads, poolswell 1oad and fallback loadoccur before Chugging and CO and need not Le considezed incombination with those LOCA loads. The pressure time historyloads, due to pool swell, for the SRV assembly supports, were
Be v. 9, 07/05 7-24
determined by linearly reducinq the pressuze time history, due topoolswe11, for the downcomer bracinq, by the ratio of thedia meters.
7 1.2.2.3.3 Seismic Ioad=-
The seismic loads on the coupled structure o+ SRV lines, supportassemblies, and columns -were obtained by dynamic analysis usingthe response spectra developed for OBE and SSE as described inSubsection 3.8.1.4.1 of the FSAR. '.
7 1.2. 2.3. 4 Static Load
The dead load, thermal load and bouyarcy of the supportassemblies were considered.
7.1.2 2 3 5 Load Combinations
The load, combinations,and allowable stresses are in accordancewith Subsection 5.2. Althouqh the loads on the bracing systemunder consideration act in a random horizontal directions, eachindividual load is applied to the system in the worst possibledirection to find the maximum resultant forces.7. 1 2,2 3 6 De sign Assessment
The combined stresses due to axial forces and bendinq momentswere determined for all bracing members. Ccmparison between theresultinq calculated stresses and the allowable stresses has beenmade. Resultinq stress margins for the bracinq members and theirconnections are tabulated in Appendix A.
7 1 2 3 Openings In Containment Liner
7.1.2 3.1 Equipment- Hatch-Personnel Air Lock
The portion of the equipment hatch-personnel aiz lock not backedby concrete was reevaluated for additional loads due tohydrodynamic ef fects (SRV and lOCA) . This reeval ua tion wasperformed by Chicago Bridqe and Iron Company (CBI) undersubcontract fzom Bechtel. The general arrangement of thepersonnel lock is shown in Figure 7-16.
The personnel air lock. doors are designed to withstand a pressure'of 55 psiq in the containment vessel. The door mechanism isdesiqned to seal the door against an internal pzessure of 5 psig.For reevaluation, CBI used their computer program E781 for staticanalysis of shells. The program is based on Reference 77.Equivalent static loads were considered for seismic andhydrodynamic cases usinq peak spectral accelerations. CBI usedthe hydrodynamic spectra as given ir. Appendix C. Design Loadcombinations qiven in Table 5-2 weze used with modifications forforces on the structure due to thermal expansion of pipes under
Re v. 9, 07/85 7-25
accident conditions. Stress limits specified in the ASIDE codewere useR.
I
CBI's model was divided into 2 parts:
The first model comprised the 1" thick cylinder and the 3'' thickflanqe extendinq to the parting joint. An axissymmetricalconfiquration was used since the shape of the ccntainment vesselat its intersection with the equipment hatch is conical. Norestraints at the junction with the containment vessel wereconside red.
The second model included the 3" thick flanqe beyond the partingjoint, the conical head and a portion of the personnel lockextendinq from the interior bulk head to an appropriate distancebeyond.
At the flange interface, the seismic, SRV, LOCA, jet and pressureloads have a tendency of pryinq open the door. A meridionalforce is, therefore, reguired to permit relatively small radialdeflections and rotations at the interface. This force wasapplied as a restoring force at the parting joint in the form ofa'meridional force and a transverse shear. Relativedisplacements were evaluated to assure leaktightness.
The major dead load contribution is in the airlock. Therefore,dead loads and loads from seismic accelerations were applied tothe second model as discontinuous loads at the center of gravityof the air lock.
Loads due to SBV, Seismic and LOCA cases were combined by SHSS.
7.1.2.3 2* CRD Removal flatch» Suppression Chamber AccessHatch And Fauioment Hatch.
These batches were subcontracted to CBI for design and analysisfor additional SRV and LOCA loads. Designs were performedmanually in accordance with Bechtel specifications andappropriate design codes Details of the CRD removal hatch andequipment .hatch are given in Figures 7-17 and 7-18.
7,1,2. 3,3 He fuelling Head and Support SkirtReevaluation of the refuelling head and support skirt wasperformed'y CBI under subcontract from Bechtel. Figure 7-19shows the refuellinq head.
CBI's program F. 781 was used for the static analysis. Fordynamic analysis, equivalent pressures from the peak responsespectra at Zl. 778. 8 ft were used. The static and dynamicstresses were then combined as per Table 5-2 of this report.Leal'ightness of the flanqed joint was investigated for thevarious loads and suitable pre-stress was recommended to preventseparation of the flange joint components.
Rev. 9, 07/85 7-26
7. 1 3 'Liner Pl a te Assessme n t iset ho dollyFSAR Subsection 3.8.1 provides 'a description of the liner plateand anchorage system for the containment.
The analysis of the liner plate and anchorages fornonhydrodynamic loads is in accordance with Reference 18.
For the analysis of the linez plate and anchorage forhydrodynamic suction loads, the contributing load on the liner isthat due to the net "negative" pressure.
The. loads considered for this assessment are KHU Chugging, KWU
SRV, hydrostatic pressure and we%well air pressure.
Figure 7-20 presents the maximum neqative pressure due to KHUchuqqing which. were scanned from the symmetric and,asymmetricload conditions of Sources 303, 305, 306 and 309. As can benoted from Fiqure 7-20, Trace 306 gives the maximum negativepressure on all locations.
The maximum negative pressure 'due to th'e actuation of allSRV's
-7.8 psi.The hydrosta tic pressure of 24'ater gives 10.4 psi pressure onthe base'lab liner plate.
The wetwell aiz pressure is 25 psi due to a small break LOCA.
For normal condition the combination of hydrostatic pressure andthe actuation of all the SRV s is considered. The distributionof this pressure is shown in Figure 7-21
Foz abnormal condition, the combination of KMU chugging, SRV,hydrostatic pressure and wetwell air pressure is considered. Thephasinq of SRV and chugging events is obtained by aligning themaximum suction peaks. These events are combined by directaddition of pressures as demonstrated in Figure 7-22. The totalnet peak pzessuzes for the abnormal condition are tabulated inFigure 7-23. Point 1 in this fiqure does not lie on pressureboundary and thus, is not critical.The assessment of liner plate is found in Subsection 7. 2. 1. 5.
7 1.4 -Downcomer Assessment Nethodologg
In the wetwell, there are 87 downcomers, 82 of which function asdry well vents during a LOCA. The other 5 provide wetwell todrywell pressure relief through the two vacuum breakers in seriesmounted on each of them. These five downcomers are capped at thebottom end to protect the vacuum breakers from the cycling due tochuqqinq. Appendix K provides the assessment of capping five of
Rev. 9 ~ 07/85 7-27
the eiqhty-seven downcomers as a fix foz VB cycling duringchuqqinq.
Downcomer layout, location of vacuum breakers and the caparrangement are shown on Figures 7-9, 7-24 and 7-25,respectively.7. 1 4 2- Structural Model
The downcomezs are modeled with the bracinq system as describedin Subsection 7 1.2.1.2.
I
The downcomezs with the vacuum breakers are. included in theST A RDY H E m od el.An additional 3-D model was developed in which not, only thebzacinq system and downcomezs as described in subsection7. 1. 2. 1. 1 were included, but also the vacuum breaker, the vacuumbreaker support and a column. This was done in the same quadrantas described in Subsection 7.1.2.1. 1.
7. 1.4.3 Loads and LoadCombinations'oads
affecting the downcomers are the same as those described inSubsection 7. 1. 2. 1. 3. Load combinations aze given in Table 5-3.The SRSS sum is used for the dynamic loads, except for thechuqqing lateral and seismic sloshing loads which aze added byabsolute sums as described in Subsection 7. 1.2. 1.4.
7. 1. 4. 4 De ign Assessment
Reference 30 is used for checking the downcomer stresses due tothe load combinations qiven in Table 5-.3.
7 1 4 5- Fatigue Evaluation of Downcomers In Hetwell Air Volume
Xn an e'ffozt to evaluate the steam bypass potential arising froma failure of the downcomers in the wetwell air space, a completefatigue analysis of the same has been performed. Specifically,the analysis was performed where the downcomers penetrate thediaphzam slab as shown in Figure 7-26 This. analysis consideredall the cyclic loadinq acting on the downcomers and is inaccordance with the applicable portions -of ASIDE Code. Thisevaluation is considered supplemental'.and does not displace theoriqinal desiqn basis for these lines as set forth in theappropriate ESTAB/DAB sections
7 1.4.5 1 Loads= and Load Combinations used for Assessment
The downcomers are subject to numerous dynamic a'nd hydrodynamicloads from nozmal, upset, and LOCA-related plant operatingconditions. For purposes of fatigue evaluation, the followingloads are include: {1) All significant thermal and pressuretransients. {2) All cyclic effects due to the hydrodynamicloads includinq SRV actuations, CO and chugging. (3} Seismic
Hev. 9, 07/85 7-28

effect". A description of each of these loads is provided ia theappropriate DAH sections. The determinatioa of load combinationsas veil as number and duractioa of each event is obtained fromthe applicable sections of DFFR, and FSAH.
7.1.0.5.2 Acceptance CriteriaThe desiqn rules, as set fort'h in the ASME Boiler and PressureVessel Code, Section III, Subsection NB vere utilized for thefat ique assessment. Rhea reguired, allovables for fa tig ue stressevaluation were based on Mill certification reports fordowncomers.
7.-1.0 5.3 Methods of Analysis
The SRV discharqe lines and dov.ncomers in the vetwell air volume,were analyzed for the appropriate load combinations aad theirassociated number of cycles. The combined stresses andcorrespondinq eguivalent stress cycles were computed to obtainthe fatigue usaqe factors in accordaace with the equations ofSubsection NB-3600 of the ASMZ Code. c
7.1. 4. 5. 4 Eesults and DesicCnsargins
The cumulative usage factors for the various loading conditionsfor the downcomez {see Fiquze 7-26) are summarized ia Table 7-3.
7 1 5 - BOP Piping and SRV Systems Assessment Methodology
The BOP pipinq and SRV systems were analyzed for the loadsdiscussed in Section 5e5 using Bechtel computer programs ME101and ME632ce These programs are described in FSAH Section 3. 9.Static and dynamic analysis of the piping and SRV systems areperformed as described in the paragraphs below.
Static analysis techniques aze used to.determine the stresses dueto steady state loads and/oz dynamic loads haviag eguivalentstatic loads. The dzaq and impact loads are applied asequi valen t stat ic loads.
Response spectra at the pipinq anchors are obtained from thedynamic analysis of the containmeat subjected to LOCA and SHVloading. Pipinq systems are then analyzed for these responsespectra followinq the method described in Reference 19.
Time history dynamic analysis of the SHV discharge pipingsubjected to fluid transient forces in the pipe due to reliefvalve openinq is performed using Bechtel computer code M8632ce
7 1.5.1 Parti ue Evaluation of SEV Disch~rche Lines in EetvellAir Volume
In an effort to evaluate the steam bypass potential azisinq froma failure of the SHV discharqe liae in the vetwell air space, acomplete fatigue analysis of the same has been performed.
Hev. 9, 07/85 7 "29
Specifically, structural analyses of all the SRV discharge linesfzom the diaphraqm slab penetration to the guenchez wasperformed. Fatigue evaluation of fluedhead penetration, elbowsand 3-way restrainst attachmeat to pipe was done. This analysisconsidered all the cyclic loadinq actinq on the SP V dischargelines and is in accordance with the applicable portions of ASHECode. This evaluation is considered supplemental and does notdisplace the original design basis for these lines as set forthin the appropriate FSAR/DAR sections.
7,-1,5,1,1 - Loads and T.oad Combinations Used for Assessment
The SBV discharqe lines are subject to numezous dynamic and.hydrodynamic loads from normal, upset, aad LOCA-related. plantoperatiaq conditions. For purposes of fatigue evaluation, thefollowing loads are included: (1) All signif icant thermal andpressure transients. (2) All cyclic efforts due to thehydrodynamic loads:including SRV actuations, CO and chugging and(3) Seismic effects. A description of each of these loads isprovided ia the appropriate DAR sections. The determination ofload combinations as well as number and duration of each event isobtained from the applicable sections of DFER aad FSAP,.
The design rules, as set forth in the ASM'oiler aad PressureVessel Code, Section XIX, Subsection NB vere utilized for thefatique assessmeat. Hhen required, allowables for fatigue stressevaluation were based on Mill cer'tification reports for SPVdischarge lines.7.1.5.1 3 Methods of An~al sis.
The SRU discharge lines, in the wetwell air volume, vere analyzed.for the appzopziate load combinatioas and their associated aumberof cycles. The combined stresses and corresponding equivalentstzess cycles were computed to obtain the fatigue usage factorsin accordance with the equations of Subsection NB-3600 oX theASIDE Code.
7.1.5 1 4 Results and Design Margins
The cumulative usage factors for fluedhead, 3-way restraintattachment to pipe and.elbov are summarized in Table 7-4.
7 1.6 NSSS Assessment Methodology
»Safety related." General Electric Company supplied NSSS pipingand equipment located within the containmeat and the reactor andcontrol buildings are subjecteQ to hydrodynamic loads due to SRVand LOCA discharqe effects principally origiaatinq in thesuppression pool of the containment structure. Section 4.1 and4.2 describe the methodoloqies used to define these SRV aad LOCA
loads, respectively. The VASSS pipinq and equipment are assessedto verify their adequacy to withstand these hydrodyn'amic loads ia
Rev. 9, 07/85 7-3 0
combinatiou with seismic and all other applicable loads inaccozdance with the load combinations given in Table 5-5.
The structural system responses for the SRV and LOCA suppressionpool hydrodynamic phenomena are qenerated by Bechtel PowerCorporation usinq defined forcinq functions. These structural.system responses are transmitted to Genezal Electric in the formof (1) broadened response spectra and (2) acceleration time-histories at the pedestal to diaphram flooz intersection and thestabilizer elevation.
The response spectra for pipinq attachment points on the reactorpressure vessel, shield wall and pedestal complex (above the poolarea) are generated by General Electric, based upon theacceleration time-histories supplied by Bechtel PowerCorporation, using a detailed lumped mass Ream model for thereactor pressure vessel inteznals, including a representation ofthe structure. For the asseB'ment of the NSSS primary pipinq(main steam and recirculation) a combination of General Electricand Bechtel developed response spectra are used as inputresponses for all attachment points oX eac'h piping system. Forthe assessment oX the NSSS floor mounted equipment, except thereactor pressure vessel, the broadened response spectra supplieddirectly by Bechtel are used.
The acceleration time-histories and the detailed reactor pressurevessel and structure lumped mass beam model are used to generatethe forces and moments acting on the reactor pressure vesselsupports and internal components. These forces and moments areused for the GP. assessment of reactor pressure vessel supportsand i'nterna.ls.
The structural system response for the LOCA induced annuluspressurization tzansient asymmetric pressure build up in theannular reqion between the biological. shield wall and the reactorpressure vessel is based on pressure time-histories supplied byBechtel. These pressure time-histories are combined with jetreaction, jet impinqement and pipe whip restraint loads for the.assessment. A time-history analysis is performed resulting inaccelezations, forces and moment time-histories as well asresponse spectra at the piping attachment points on the zeactorpressure vessel, shield wall, pedestal, pressure vessel supportsand external components (see FSAH Appendices 6A and 6B).
7 1.6 1- -NSS~Sualificat~on methods.
7 1.6.1.1 NSSSPi~i'he
NSSS piping stress analyses are conducted to consider thesecondary dynamic responses fzom: (1) the original design-basisloads includinq seismic vibratory motions, (2) the structuralsystem .feedback loads from the'uppression pool hydrodynamicevents, a.nd (3) the structural system loads from the LOCA inducedannulus pressurization from postulated feedwater, recirculationand main steam pipe breaJ s.
He v. 9, 07/85 7-31
Lumped mass models are developed by General Electric for the HSSSprimary pipinq systems, main steam and recizculation lines.These lumned mass models include the snubbers, hanqers and pipemounted valves, and represent the major balance of the plantbranch piping connected to 'the main steam and recirculationsystems. Amplified response spectrum for all attachment pointswithin the piping system are applied; i.e., Distinct accelerationexcitations are specified at each piping support and anchorpoint. The Detailed models are analyzed independently todetermine the pipinq system resultinq loads (shears and moments)for:
2)
each Design-basis load which includes pressure,temperature, weiqht, seismic events, etc.,
a
the boundinq suppression pool hydrodynamic event; and
3) the annulus pressurization dynamic effects on theunbroken piping system.
Additionally, the end reaction forces and/or accelezations forthe pipe mounteQ/connected equipment (valves and nozzles) aresimultaniously calculated.
The piping stresses from the resultinq loads (shears and moments)for each loaQ event are determined and combined in accordan'cewith the load combinations delineated in Table 5-5. Thesestresses are calculated at geometrical discontinuities and,compared to ASIDE code allowable determined stresses (ASME Boilerand Pressure Vessel Code, Section ZIT.-NB-3650) for theappropriate loading condition in order to assure design adeguacy.Computer codes used to perform the HSSS piping stress analysisare described in FSAH Section 3 9 1.2.
7.1.6.1 2- - Valves
The reaction forces and/or accelerations acting on the pipemounted equipment when combined in accordance with the requiredload combinations aze compared to the valve allowables to assuzeResign adequacy. The reactor core pressure boundary valves arequalified for operability durinq seismic and hydzodynamic loadingevents by both analysis and test. This qualification is uniquefor each valve.
7.1.6.1.3 Reactor Pressure Vessel~su orts an6Internal Components
The boundinq load combinations for seismic, hydrod.ynamic andannulus pressurization forces are established within eachacceptance criteria range (upset, emergency and faulted). .At theinitial analysis step, the loads aze conservatively combinedusinq the maximum vertical forces with the maximum horizontalshears and moments fzom all combinations within each acceptancecriteria ranqe. These conservative maximum loads are thencompared to qeneric bounding forces originally used to establish
Rev. 9, 07/85 7-32
the component desiqn. Hhen the combined calculated forces areless than the design forces, then the component is deemedadequate. Rhen the calculated forces are qreater than the designforces, then the increased stresses are compared to the materialallowables. When the calculated stresses are below the materialallowables, then the desiqn is deemed adequate. If the increasedstresses are above the material allowables, then the specificload combination is,identify'.ed and another stress analysis isconducted usinq refined methods, if. required, to demonstrate thecomponent adequacy.
'In certain cases, component test results are combined withanalyses to assess. component adequacy. Fatigue evaluations ofthe Reactor pressure Vessel, supports and internal components arealso conducted for SRV cyclic duty loads. The equipment isanalyzed for fatigue usage due to SRV load cycles based upon theloading during- the SRV events. SRV fatigue usage factors arecalculated and combined with all other upset condition usagefactors to obtain a cumulative fatigue usage factor.Computer programs used to conduct RPV component analyses aredescribed in FSAR Section 3.9. 1. 2.
7. 1.6 1.4 ~ Floor Structure Mounted Egu~i me~t
7. 1. 6. 1. 4 1 guali fication- Methods
The adequacy of the design of the equipment is assessed by one ofthe followinq:a. Dynamic analysisb. Testingc. Combination of testinq and analysis
The choice is based on the practicality of the method dependingupon function, type, size shape, and complexity of the eguipmentand the reliability of the qualification method.
In qeneral, the requirements outlined in IREE-344-75, Reference55, are followed. for the qualification of equipment.
7.1.6.1 n~l.1 D naaic analysis
7 .1.6.1.4 1. 1 1 Methods and Procedures
The dynamic analysis of various equipment is classified intothree qroups according to the relative .rigidity of the equipmentbased'on the magnitude of the fundamental natural frequencydescribed below.
(a) Stzuctuzally simple equipment — comp'rises that equipmentwhich can be adeguately represented by a one degree offreedom system
Rev. 9, 07/85 7-33
(b) Structurally rigid equipment — Comprises that equipment whosefundamental frequency is:fi) greater than 33 Hz zor the consideration of seismic
loads, and,
(ii) grater than the hiqh frequency asymptate (ZPA) of therequired response spectra (BHS) for the consideration ofhydrodynamic loads
(c) Structurally Complex equipment — Comprises that equipmentwhich cannot be classified as structurally simple orstruct ural 1 v riqid.
The appropziate response spectra .for specific equipment areobtained, from the response spectra for the floor at which theequipment is located in a building for OBE, SSE and hydrodynamicloads. This includes the vertical as well as both the 8-S and E-H horizontal directions. For equipment which is structurallysimple, the dvnamic loading (either seismic or hydrodynamic)consists of a static load, corresponsing to the equipment weighttimes. the acceleration selected from the appropriate responsespectrum. The acceleration selected corresponds to theequipment's natural frequency, if the equipment's naturalfrequency is known. If the equipment's natural frequency is notknown, the acceleration elected corresponds to the maximum valueof the response spectra
For equipment which is structurally rigid, the seismic loadconsists of a static load corresponding to the equipment weighttimes the acceleration at 33 Hz, selected from the appropriateresponse spectrum and the hydrodynamic loadinq consist of astatic load corresponding to the equipment weight times theaccelerations at t'e ZPA, selected from the appropriate responsespectrum.
For the analysis of structurally complex equipment, the equipmentis idealized by a mathematical model which adequately predictsthe dynamic properties of the equipment and a dynamic analysis isperformed usinq any standard analysis procedure. An acceptablealternative method of analysis is by static coefficient analysisfor verifvinq structuzal inteqrity of frame type structures thatcan be represented by a simple model. No determination ofnatural frequencies is made and the response of the equipment is,assumed to be the peak of the response spectrum. This responseis then multiplied by a static coefficient of 1.5 to take intoaccount the effects of both multifzequency excitation andmultimode response.
7 1.6.1 4 1.2 Testing
In lieu of performinq dynamic analysis, dynamic adequacy isestablished by providinq dynamic test data. Such data mustconform to one of the followinq:
Pev. 9, 07/85
Performance data of equipment which has been subjected toequal or qreater dynamic loads (considering appropriate
~ frequency ranqe) than those to .be experienced under thespecified dynamic loadinq conditions.
Test data from comparable equipment previously tested undersimilar conditions, which has been subjected to equal orgreater dynamic;loads than those specified.
3. Actual testing of equipment in operating conditionssimulatinq, as closely as possible, the actual, installation,the required loadinqs and load combinations.
continuous sinusoidal test, sine beat test, or decayingsinusoidal test is used when the applicable floor accelerationspectrum is a narrow band response spectrum. Otherwise, randommotion test (or equivalent) with broad frequency content is used.
The equipment to be tested is mounted in a manner that simulatesthe actual service mounting. Sufficient monitoring devices areused to evaluate the performance of the equipment. With theappropriate test method selected, the equipment is considered tobe qualififed when the test response spectra (TRS) envelopes therequired response spectra (RES) and the equipment did not
'alfunctionor fail. A new test does not need to be conducted ifequipment requires only a very minor modification such asadditional bracings or chanqe in switch model, etc., and properjustification is qiven to show that the modifications do notjeopardize the strength and function of the equipment.
7. 1.6. 1. 4. 1. 3. Combined Analysis and
Testiest
There are several instances where the qualification of equipmentby analysis alone or testing alone is not practical or adequatebecause of its size, or .its complexity, oz large number ofsimilar confiqurations. In these instances a combination ofanalysis and testing is the most practical. The following areqeneral approaches:
(a) An analysis is conducted on the overall assembly to determineits stress level and the transmissibility of motion from thebase of the equipment to the critical components. Thecritical components are removed from the assembly andsubjected to a simulation of the environment on a test table.
(b) Experimental methods are used to aid ia the formulation ofthe mathematical model for any piece of equipment. <lodeshapes and frequencies are determined experimentally andincorporat,ed into a mathematical model of the equipmeat
7 1.6.1.4 2 Commuter Proarams
Computer proqrams used to conduct equipment analyses aredescribed ia FSAR Section 3.9 1.2.
P.ev 9. 07/85 7-35
7.1.7 Balance of pl~ant Bor) Foui~ment Assessmert methodology
Seismic Category I BOP equipment located within the containmentand the reactor and control buildings are subjected tohydrodynamic loads due to SRV LOCA discharge affects principallyoriqinatinq in the suppression pool of the containment s'tructure.The equipment and equipment support are assessed to veri "y theiradequacy to withstand these hydrodynamic loads in combinationwith seismic and all other applicable loads in accordance withthe load combinations given in Section 5.7.
7 1 7.1 Hydrodynamic loads
7.1 7 1.1 SHV Discharge Loads
'Loadinqs associated with the axisymmetric and asymmetric SHVdischarqes are described in Chapter 3 and 4 of this report.Acceleration response spectza at the various elevations where theequipment are located have been generated for all appropriatepressure history traces (Figures 4-28 thru 4-30 of Chap ter 4) fordamping values of 1/2,, 1'R, 2%, and 5'X. These have beenenveloped into a sinqle curve for each of the above dampingvalues. Such enveloped curves are generated for each of the N-S,H-W and vertical directions. These curves form the basis foz the .
SRV loads for equipment assessment.
7 1. 7 1 2- I OCA:Related Loads
Loadings associated with loss-of-coolant accident (SCCA) azedescribed in Section 4. 2. Accelezation response spectra at.various elevations where the equipment are located have beengenerated .for the LOCA loads for dampinq values of 1/27', 1%, 2%and 5A. These have been enveloped into a single curve .for eachof the above damping values. Such enveloped curves are genezatedfor each of the N-S, E-W and vertical directions.These curves form the basis for the LOCA loads for equipmentassessmen t.7.1 7.2 . Seismic. Loads
The details of seismic input and seismic loads are discussed inSection 3.7 of FSAR. The effects of both operating basisearthquake (OBH) and safe shutdown earthquake {SSZ) areconsidered These loads are provided in the form of Accelerationresponse spectra at each floor for damping values of 1/2%, 1%, 2Ãand 5% for each of N-S, 8-W and vertical directions7 1.7 3 Other Loads
In addition to hydrodynamic and seismic loads, other .loads suchas dead loads, live loads, operatinq loads, pressure loads,thermal loads, nozzle loads and equipment piping interactionloads, as applicable, are also considered.
'Rev. 9, 07/85
7 1.7 4 -@uglification 'tethods
The adequacy of the desiqn of the equipment is assessed hy one ofthe folowinq:
a. Dynamic analysis
b. Testing under simulated conditions
c. Combination of testing and analysis.
The choice is based on the practical'.ty of the method dependingupon function, type, size, shape, and complexity of the equipmentand the reliability of the qualification method.
En general the requirements outlined in ZEEE-344-75, Heference55, are followed for the qualification of equipment
7. 1 7.4 1 ~nnaaic An~al aia
7.1 7.4 1.-1 Methods and Procedures
The dynamic analysis of various equipment is classified intothree qroups according to the relative rigidity of the equipmentbased on the magnitude of the fundamental natural frequencydescribed below.
(a) Structurally simple equipment — comprises of that equipmentwhich can be adequately represented by one degree of freedomsystem.
(b) Structurally rigid equipment — Comprises of that equipmentwhose fundamental frequency is:(i) greater than 33 Hz for the consideration of seismic
loads, and,
(ii) greater than 80 Hz for the consideration of hydrodynamicloads.
(c) Structurally Complex equipment — Comprises of that equipmentwhich cannot be classified as structurally simple orstructurally rigid.
Hhen the equipment is structurally simple or rigid in onedirection but complex'n the other, each direction may beclassified separately to determine the dynamic loads.
The appropriate .response spectra for specific equipment areobtained from the response spectra for the floor at which theequipment is located in a building for OBE, SSE and hydrodynamicloads. This includes the vertical as well as both the N-S and E-8 horizontal directions.
3ev 9, 07/85 7-37
For equipment which is structurally simple, the dynamic loadinq(either seismic or hydrodynamic) consists of a static loadcorresponding to the equipment weiqht times the accelerationselected from the appropriate response spectrum. Theacceleration selected corresponds to the eguipment's naturalfrequency, if the equipment's natural frequency is known. IX theequipment's natural frequency is not known, the accelerationselected corzesponds to the maximum value of the responsespectra.
For equipment which is structurally riqid the seismic loadconsists of a static load corresponding to the equipment, weighttimes the acceleration at 33 Hz, selected from the appropriateresponse spectrum and the hydrodynamic loading consist of astatic load corresponding to the equipment weight times theacceleration -at 80 Hz., selected from the appropriate responsespectrum. 4
For the analysis of structurally complex equipment, the equipmentis idealized by a mathematical model which adequately
predicts'he
dynamic properties of the equipment and a dynamic analysis isperformed usinq any standard analysis procedure. An acceptablealternative method of analysis is by static coefficient analysisfor verifying structural integrity of frame type structures suchas membezs physically similar to beams and columns that can berepresented by a simple model. No determination of naturalfrequencies is made and the response of the equipment is assumedto be the peak of the response spectrum at damping values as perSection 7.1.7.4.1.2. This response i's then multiplied hy astatic coefficient of 1.5 to take into account the effects ofboth multifrequency excitation and multimcde response.
7. 1 7 4. 1 2 Appropriate Damping Values
The followinq damping values are used for the design assessment:
1) I,oad Combinations involving OBE but nothydrodynamic loads 1/2%
2) Load Combinatiosn .involving SSE but nothydrodynamic loads
3) I.oad Combinations involving hydrodynamicloads, or seismic and hydrodynamic loads 2'K
Xf the actual damping value of the equipment is different (fromtest results) then these actual values are used..
7 1 7.4.1 3 Three Components of Dynamic Notions
The responses such as internal forces, stresses and defozmationsat any point from the three principal orthoqonal directions ofthe dynamic loads are combined as follows:
Bev. 9, 07/85 7-38
The response value used is the maximum value obtained by addingthe response due to vertical dynamic load with the larger valueof the responses due to one of the horizontal correspondingdynamic 1oad by the absolute sum method.
7 1 7. 4.2- Test~in
In lieu of performing, dynamic analysis, dynamic adequacy isestablished by providinq dynamic test data. Such data mustconform to one of the followinq:
1. Performance data of equipment which has been subjected toequal or greater dynamic loads (considering appropriatefrequency ranqe) than those to be experienced under thespecified dynamic loading conditions.
2. Test da ta from comparable equipment previously tested undersimilar conditions, which has been subjected to equal orqzater dynamic loads than those specified.
3. Actual testinq of equipment to the required load combinationswhile simula.ting the actual field installation.
A continuous sinusoi,dal test,'ine beat test, oz decayingsinusoidal test is used when the applicable floor acceleration
„spectrum is a narrow band response spectrum. Otherwise, ra'ndommotion test (or equivalent) with broad frequency content is used.
The equipment to be tested is mounted in a manner that simulatesthe actual service mounting. Sufficient monitoring devices areused to evaluate the performance of the eguipment. 'ith theappropriate test method selected, the equipment is considered tobe qualified when the test response spectza (TBS) envelopes therequired response spectra (RRS) and the equipment did notmalfunction or fail. A new test does not need to be conducted ifequipment requires only a very minor modif ications such asadditional bracinqs or change in switch model etc. and properJustification is qiven to show that the modifications do notjeopardize the strenqth and function of the equipment.
7.1 7.4.3 Combined Analysis and Testi~n
There are several instances where the qualification of equipment-by analysis alone or. testing alone is not practical or adequatebecause of its size, .or its complexity, or la.rge number ofsimilar configurations., Xn these instances a combination ofanalysis and testing is the most practical. The following areqenezal approaches:
(a) An analysis is conducted on the overall assemb1y to determineits stress level and the transmissibility of motion fzom thebase of the equipment to the critical components. Thecritical components are removed from the assembly andsub jec ted to a simulation of the envircnment on a test table.
Rev. 9, 07/85 7-39
(b) Experimental methods are used to aid in the formulation ofthe mathematical model for any piece of equipment. Nodeshapes and .frequencies are determined experimentally andincorporated into a mathematical model of the equipment.
7. 1.8 .Electrical Raceway System Asses ment Yethodology
7 1. 8. 1 general
The PSAR Subsection 3 7b. 3.1 6 provides a detailed descr'tion ofthe electrical raceway system design methodoloqy. The analysisand design of supports or Electrical Raceway Systems for non-hydrcdynamic loads are in accordance with Reference 3.7b-7 of theFSAR. SRV discharge and LOCA loads are considered similar toseismic loads by usinq appropriate floor response spectra for thehydrodynamic loads. A damping value of 7,: of critical .is usedfor all raceway systems for abnormal/extreme load conQi tion and adampinq value of 3Ã of critical is used for normal load conditioninvolvinq SRV discharge loading only.
7 1. 8 2 Loads
7. 1. 8. 2. 1 S t a t ic T. o a Q s
The static loads are the dead loads and live loads. Por cabletrays, the weiqht of the cable is considered to he 45 lbs/f t anda concentrated live load of 200 lb. applicable at any point orcable tray span is used
7. 1.8.2..2Seismic-.Loads'he
details of the seismic motion input are discussed in Section3 7 of the FSAR. The effects of the operating basis earthquake(OBE) and the Safe Shutdown earthquake (SSE) are considered.
7.1.8.2.3 Hyd~rd nasic Loads
The details of the axisymmetric and asymmetric SHV dischargeloads, as well as LOCA loads including condensation-oscillationand chuqqinq are discussed Section 4.0
The enveloped accelerati'on response spectra at each floor for N-S, E-W, and vertical directions have been generated and widened.These curves form the .basis for the hydrodynamic load assessmentof the electrical raceway system. Examples of the, responsespectrum curves for the containment and Reactor and Controlbuildinqs are presented in Appendices 8, C and
7. 1. 8 3 Analytical Methods
Cable tray systems are modeled as three dimensional dynamicsystem consistinq of several consecutive supports complete withcable trays and longitudinal and transverse bracing. The cabletray properties are determined from the broad deflection tests.
Re v. 9, 07/85 7-4 0
Member joints are modeled as sprinq elements havinq rotationalstiffness with known spring values as determined from the testresults.
Composite spectra are developed by envelopinq the broadened floorresponse spectra for critical floors for seismic, SBV and LOCAloadinq conditions. The design spectrum is obtained by addingthese response spectra curves by the square root sum of thesquares method. The composite response spectra curves areobtained for vertical and two horizontal directions.
'cceleration values utilized in the design are determined fremthe composite response spectra with the consideration of. a + 20"-.
frequency variation at the fundamental frequency of the cabletray system.
Modal and response spectrum analyses are performed utilizinq"Bechtel Structural Analysis Proqram" (ESAP) which is a generalpurpose finite-element computer program. The seismic andhydrodynamic responses are combined by the square root sum of thesquares method. The total response due to the dynamic loads iscalculated by Qetermininq absolute sum of vertical response andonly the larqer response of the two horizontal responses.
Dead and live load stresses are determined from a static analysisof a plane frame model usinq 13SAP computer proqram and theseresults are combined with those from the response spectrumanalysis. F or normal load condition, SBV discharge stresses areproportioned from the response spectrum analysis of SSE plus SHVdischarqe plus L'OCA loads according to their spectralacceleration ratios at. the fundamental frequencies. Several
. different support types which are widely used have been analyzedby these me th od s.
An alternative method for analyzing other support types whichoccur less frequently, uses long hand calculations by a responsespectru'm analysis technique. The support may be idealized as asinqle degree of freedom system. In general, the maximum peakspectral accelerations were used. in the analysis. In some caseswhere the stresses are critical, a more refined value for theacceleration response was used corresponding to the computedsystem fundamental frequency and considering a frequencyvariation as explained earlier in this section. The vertical andhorizontal seismic responses are combined according to Subsection3.7b.2. 6 of the 7SAB. The member stresses are kept within theelastic limit.7. 1 9 ~ MVAC Duct Systole Assessment Methodology
The SHV discharge and LOCA are considered similar to seismicloads by usinq appropriate floor response spectra generated forthe CO,,chuqqinq, and SRV loads described in Section 4. 0.
A damping value of 5% of critical is used for load combinationsinvolvinq SSK, SHV discharge and LOCA loads. While a dampingvalue of 3% of critical is used for load combinations involving
Rev. 9, 07/85 7- 41
OBH and/or SHV discharge loads. For a discussion of the seismicand hydrodynamic 1oads input for HVAC duct system assessment,refer to Subsectio'ns 7. 1.8.2.2 and 7. 1.8.2.3, respectively. TheHVAC duct system had been analyzed by the alternative method.described in the Subsection 7. 1.8.3 by determining thefundamental frequencies of the system in three directions. Theinertia forces are determined from the composite spectradescribed in Subsection 7.1.8 3 to establish member forces andmoments due to hydrodynamic as well as seismic loads.
Hev. 9, 07/85 7-Q2
7. 2 DESIGN CAPABILTY MARGINS
7. 2. 1 Stress Ma runsStresses at the critical sections for all of the structuresdescribed in Section 7.1, piping and equipment are evaluated forall the loadinq combinations presented .in Section 5.0. Thestress margin is defined as
(1 — stress ratio) x 100
stress ratio =Fn
Where, fn = Actual Stressf = Allowa ble Stress
Cn = Amplification Coefficient
7.2 1.1 Containment, Structure
The results f rom the structural assessment of tive containmentstructure are summarized in Appendix A. Figure A-2 shows thedesiqn sections in the basemat, containment walls, reactorpedestal, and the diaphragm slab which were considezed in thestructural assessment. The tables in Appendix A give thecalculated desiqn stresses and margins for load combinationEquations 1, 4, 4a, 5, 5a, and 7 (as listed in Table 5-1) .
The fcllowinq obsezvations are made from a review of thestructural stresses. The calculated stress level is very low forload combination equation No. 1 (an upset condition) i. e.,reinforcinq bar stresses are less than 20 ksi. In qeneral, amongall the applicable load combinations, the m'ost critical loadcombination is No. 7a. The maximum reinforcing bar design stressis predicted as 47.24 ksi, which occurs in a wetwell section onthe outside face helical bars when using the absolute sum (ABS)method. This qiven a minimum 'stress margin of 12.5% (see FiqureA-29) .
However, the calculated maximum reinforcing bar design stressesare relatively low in the reactor pressure vessel pedestal,diaphragm slab, and the base slab, as they are less than 18 ksi,34 ksi, and 45 ksi respectively. The maximum principal concretecompzessive stress occurs at the base slab and is calculated as4280 psi. Thus, all the reinforcinq bar design stresses arebelow the allowble stresses. It should be noted that theallowable stresses on which the margins are based, are related tothe minimum specified strenqth. The actual quality control testresults for the reinforcing bars and concrete show the materialstrenqths to be hiqher than the minimum specified a~d therefore,the mazqins are actually greater than calculated.
Rev. 9, 07/85 7- 43
In qeneral, the concrete stresses vere found to be j.ow except atsection 27 in the containment basemat„{see Figure A-2), where theconcrete stress in compression exceeded the maximum al1ovablestress in five load combinations out of six that vere consideredin this report. However, under each load combination theconcrete is in triaxial compression at Section 27. Under theworst load case, the "hydrostatic" component of the stress is2830 psi and the "deviatoric" component is only 1392 psi.Because of this large .hydrostatic component, the concretecorn pressive strain is much smaller than the value of 0. 003 in/inpermitted by the codes. The concrete, therefore, has a verylarge strain margin before failure vill commence. It must alsobe emphasized that not- only the actual strength of the placedconcrete is higher than the minimum specified, a indicated inthe paraqraph above, but that the concrete continues to gainstrength af ter placement. The increase in strength at the end offive years could be as much as 20% over the 90 days strength.Therefore, the locally high compressive stresses in the concreteat Section 27 are deemed acceptable.
7 2 1 2 Reactor and Control Building
The results of the structural assessment of the Reactor andControl Building are summarized in Appendices E and 2'. Theanalytical results presented herein and .in Appendix ""=" are basedon analyses performeQ using the structural models shovn inAppendix "C". The assessment results based on analyses performedusinq the zevised structural models (as discussed in Subsection7.1.1 2.1.1.) are presented in Appendix "L~'. Figures E-1 throughE-22 shov the Qesiqn sections in the basemat and the concretestructure composed of floor slabs, shear valls, Llockvalls,refueling pool qirders, as veil as floor structural steel andsuperstructure steel, which were considered in the structuralassessment. The sections selected .for assessment were consideredto be most critical based on previous seismic calculations. Thetables in Appendix E give the calculated de ign stresses andmarqins for the critical load combinations equations 1 and 7a ofTable 5-1 and equations 1 and 7 Table 5-2. The other, loadcombinat.ions do not govern.
In the case of floor slabs, the calculated stress levels, inqeneral, are very low for slabs above El. 683.0 ft Theqoverninq load combination is equation 1 of Table 5-1 (normalcondition) anQ the reinforcinq steel stresses aze significantlyless than 20 ksi. For slabs below El. 683.0 ft. also, theqoverninq load combination is equation 1 of Table 5-1. Themaximum reinforcinq steel stzess vas 49.79 ksi, vhich occurs inthe reactor building slab at El. 645.0 ft (see 'Figure E-33) .The selected floor sections for the reviev and assessment areqiven in Fiqures E-1 through E-6.
In the case of shear walls, the maximum rebar stress vas 43. 25.ksi, and the minimum 'stress margin is 20'K (see Figure E-34). Theassessed elements are given in Figures E-1, E-3, E-4, E-7, and E-8-
Pev. 9, 07/85 7-44
Zn the blockwalls the calculated maximum reinforcing bar designstress i" 30.6 ksi for load combination equation 7a (see FiqureE-35). The minimum stress margin for compressive stress in theconcrete is 22%. The blockwall elements reviewed for a sessmentare shown in Figures E-9 through E-16.
Xn the case of Reactor Building structural steel {see Figure E-36), load combination Eq. 7 of Table 5-2 generally governs. Themaximum bendinq stress was found to be 31.9 ksi which is lessthan the allowable value. This stress occurs in a Leam at Fl.719.1 ft. ln the other cases the stress margins are 29% or more.The structural steel elements selected for assessment are givenin F iqu res E-17 th ro uqh E-20.
A three-dimentsional lumped mass model was generated fordetermininq the dynamic response of the Feactor Building CraneSupport Structure. This model is shown in Fiqure E-21- Equation7, Table 5-2 serves as the governing loadinq combination.Selected members as qiven in the model were assessed forstructural integrity and stability. The design margins forstructure and crane qirder are 0% (see Fiqure E-37) . Thiscondition's reached by letting the rails deform in such a waythat the crane bumper strikes against 'one of the rail girders.
The assessment of the Refueling Pool Gizder shows that themaximum rebar stress was 51.7 ksi and the design margin is 4'R
{see Fiqure E-38). The elements selected for assessment areshown in Figure E-22.
As shown in Figure E-38a, the .box section columns supporting therefuelinq poo3. were Sound to have adequate strength for resistingdead, live, and dynamic loads, including seismic (OBE, SSF), SRV,and T.OCA loads imposed by the refuelinq girders. Equation 6 wasfound to be 'the qoverninq euqation for columns. The strength ofthe box section columns is summarized under .elements 41 and 42.The minimum desiqn marqin is 38Ã.
7. 2. 1. 3= SB V Support Assemblies and Suppression Chamber Columns
The stresses at-critical sections of the SRV support assembliesand the suppression chamber columns were calculated separatelyfor the load combinations in Table 5.2. The maximum stresses areqoverned by load combination 7a for both the SRV supportassemblies and. columns. The results of the SHV support assemblyanalysis aze shown in Figure A-67. The lowest stress margin ofSRV support system which includes all bracing members andconnections is 21.7X. On the other hand, the maximum stresses incolumn (42 inch diameter pipe), at the top and bottom boltanchoraqes are shown in Figure A-59. The lowest stress margin inthe column structure is 11.4K.
7,2 1. 4 Downcomer Bracing
Stresses in the bracing members and c'onnections were checkedusinq the load combinations and allowable stresses as given in
Rev. 9, 07/85 7-4 5
Table 5-2 Dynamic loads were combined on the basis of the SBSSmethod. Combined axial and bending stresses were investigatedfor the most hiqhly loaded members. Equations 1, 3, 4 and 7qovern for the brace members with the design margins as indicatedin Figure A-60. For the connections, equations 2 and 7. arecritical and the resultinq desiqn margins are shown in figure A-61. All bracinq members and connections are adequate.
7 2 1 5 Liner Plate
For the normal load condition, the liner plates do not experienceany net negative pressure as can .be observed frcm Figure 7-21.
For the abnormal load condition, the maximum net negativepressure on the pressure boundary portion of the liner platesoccurs on the containment wall, at point 8 of Figure 7-23, and is-6. 39 psi. Since this, is an impulse load of .004 secondsduration and the liner plate is supported every 2 feet, thestress in the liner plate is 12.5 ksi, well below the allowable'.There is a marqin of 51% for pullout of the,embedded T steelsections that support the liner plate.
The liner plates on the base slab are supported by embedded H4x13structural steel membezs every 10 feet. The maximum negative netpressure on the hase slab occurs at the corner The magnitude is-5 12 psi. However, due to liner plate connection on the cornerbetween hase slab and containment wall, the negative net pressuredoes not cause a bendinq problem in the liver p1ate and nopullout problem on H4x13 sections. The liner plate located awayfzom the corner described above, do not experience negativepressure.
7 2.1 6 Downcomers
A list of downcomer and bracinq system modal frequencies andparticipation factors is given in Table 7-5 The fundamentalsystem mode is at a frequency of 1. 8 Hz, which is a cantilievertype of mode for all downcomers moving toqether'. Downcomerstresses were checked according to ASNE Code Section NB3652 usingload combinations in Table 5-3. Stresses and design marqins areqiven in Fiqure A-66.
7. 2,.1 7 Electrical Raceway System
Et is apparent from the analysis that high stresses are a resultof responses due to horizontal inertia loads. Duzing the normalload condition, stresses under SBV discharqe are generally low.However, for the abnormal/extreme load condition, certain membersrequired strenqtheninq to relieve high stresses Afterimplementinq these modifications, the resultant stresses do notexceed the allowable stresses in any member of the electricalraceway system supports. The modifications to electrical racewaysystems are a result of t'e assessments performed using thestructural models shown in Appendix»C». The assessment resultsbased on analyses performed using the revised structural models
Rev 9, 07/85 7-46
(as discussed in Subsection 7.1.1.2.1.1) are presented inAppendix »L».
7 2 1 8 HVAC Duct Svstem
Similar to the analysis of the electrical raceway system, theanalysis of the HVAC duct system, demon trated that most of .thesupport members have actual stresses lower than the allowablestresses. Howevez, certain structural members requiredstrenqtheninq to relieve hiq'h stresses under the abnormal/extremeload conditions. The strengthening of HVAC duct supports are aresult of the assessments pezfozmed using the structural modelsshown in Appendix »C». ,The assessment results based on theanalyses performed usinq the revised structural models (asdiscussed in Subsection 7 1.1.2.1.1) are presented in Appendix»I»
7.2 I 9 BOP Ecp~ai ment.
All Seismic Category I BOP equipment are re-evaluated for thehydrodynamic and non-hydrodynamic loads (see Subsection'.1.7)via the SSES Seismic Qualif ication Review Team (SQRT) program.For each BOP equipment, 4-paqe SQHT summary forms have been"prepared documentinq the re-evaluation of that equij:ment. Insome cases,'odificati ons were required to reduce the tresses,below the allowables. The modifications to BOP eguipment are aresult of the assessments performed using the structural modelsshown in Appendix»C». The assessment zesults based on analysesperformed usinq the revised, structural models (as discussed inSubsection 7.1. 1. 2.1.1) are presented in Appendix»I».
I,n response to SER Open Item 411, the BOP SQRT summary formsrequested by the NRC were formally submitted on February 25, 1982(Reference: PEA-1024). The remaining BOP SQHT summary forms areavailable for review
7.2 1 10 NSSS.~F, u~iment
All Seismic Category I NSSS equipment are re-evaluated for theload combinations given in Table 5-5 via the SSFS SQRT program.For each NSSS equipment, SQRT summary forms are prepareddocumentinq the re-evaluation of that particular equipment. Theassessment results based on analyses performed using the'evisedstructural models (as discussed in Subsection 7.1. 1.2.1.1) arepresented in Appendix
The NSSS SQRT summary forms requested by the NRC have beenformally submitted to the NHC under the SSZS SQRT program. AllNSSS SQHT summary forms are available for review.
7,2 1.11 . IISSS nnB BOP~Pi inS
As documented in Subsection 7.1.5 and 7.1.6.1.1, all SeismicCategory I BOP and NSSS piping have been analyzed forhydrodynamic and non-hydrodynamic loads per the load- combinations
Rev. 9, 07/85 7- 47
given in Subsections 5.5 and 5.6, respectively. As a result ofthis evaluation. many modif ications were required to maintain thestresses below the allowable values. A ppendix Z provides asummary of the stresses and design margins for selected BOPpiping systems based on analysis results for the structuralmodels shown in Appendix «C«. The above reguired modificationsare a result of analyses performed using the Appendix «C«structural models. The assessment re ults based on analysesper formed usinq the revised structural models (as discussed inSubsection 7.1.1.2 1.1) are presented in Appendix «L«.
The results of the above evaluation are documented in stressreports, which are available for NHC review.
7 2 2 Acceleration Fesponse Spectra
7 2.2. 1 -Containment Structure
The method of analysis and load description for the accelerationresponse spectra qeneration are outlined in Subsection7.1.1.1.1.6.1. Appendix B contains example acceleration responsespectra for SHV, condensation oscilation and chugqing, andseismic sloshinq load cases. From a review of the SHV and LOCAacceleration response spectra curves the maximum spectralaccelerations are tabulated in Table 7-1 for 1% oX criticaldampinq.
7,2 2 2 (@actor and Control Boilding
The methods of analysis and load application for the computationof the acceleration response spectrum in the reactor and controlbuildinq are described in Subsections 7.1. 1.2. 1. 1 and7. 1. 1. 2. 1. 2. Appendix «C« contains the acceleration responsespectra .for low damping value for SHV and LOCA load cases basedon analyses performed using the structural models shown inFiqures C-1, C-2 and C-3. Appendix «L«contains example responsespectra qenerated usinq the revised structural models, asdiscussed in Subsection 7.1.1.2.1.1. From a review of the SFVand LOCA acceleration response spectra curves based on the modelspresented in Appendix «C«', the maximum spectral accelerations aretabulated in Table 7-2 for 4% of critical damping.
7 2.3 Containment. Liner- 02eni~ns
7.2.3 1 Rguiament. Hatch-Personnel Air Lock
Stresses in the equipment hatch-personnel air lock were allwithin allowable limits. However, as a result of the new loads,bolt pre-load had to be increased from 65 to 72 kips to maintainacceptable levels of displacement at the flang'ed joint. The.resultant equivalent radial load applied at the hearing on thehinqe support results in a minimum safety factor of 3 at ultimatefor the roller,and race.
Hev. 9, 07/85 7-48
7. 2 3.2 CBD Beeoual Hatcha ~Ru reeeioa Chaeher acce a Hatchan~dF. u~iment Hatch-
CBI's analysis indicated no stresses in excess of the specifiedallowable limits for the additional loadinqs considered.
7. 2 3.3 P.efuel in@ Head and Support Skirt
The refuelinq head and flange were found to have no stressesexceedinq allowable limits. The only effect of the new loadsapplied was to increase holt pre-stress from 161 to 200 kips tomaintain leaktiqhtness at the flanqed joint. Figure A-33.1 givesthe stress marqin" in the refueling head and the flange.
Rev. 9, 07/85
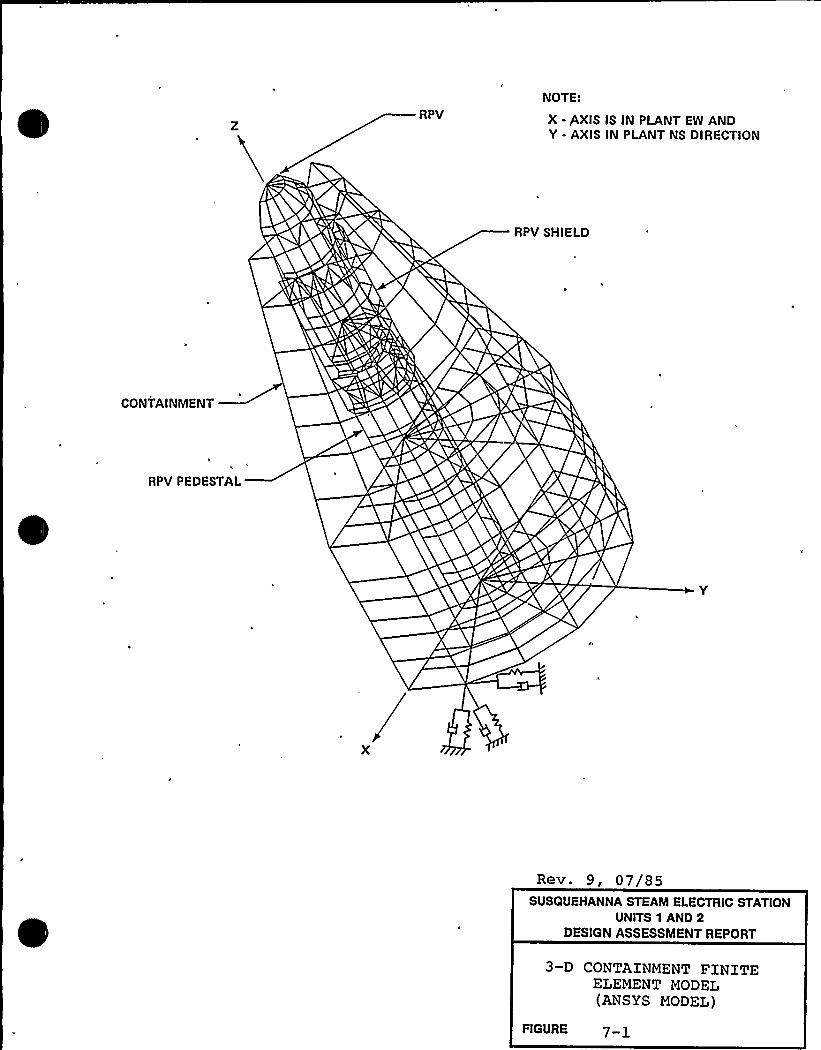
RPVNOTE:
X - AXIS IS IN PLANT EW ANDY - AXIS IN PLANT NS DIRECTION
RPV SHIELD
CONTAINMENT
RPV PEDESTAL
Rev. 9, 07/85SUSQUEHANNA STEAM ELECTRIC STATION
UNITS 1 AND 2DESIGN ASSESSMENT REPORT
3-D CONTAINMENT FINITEELEMENT MODEL(ANSYS MODEL)
FIGURE
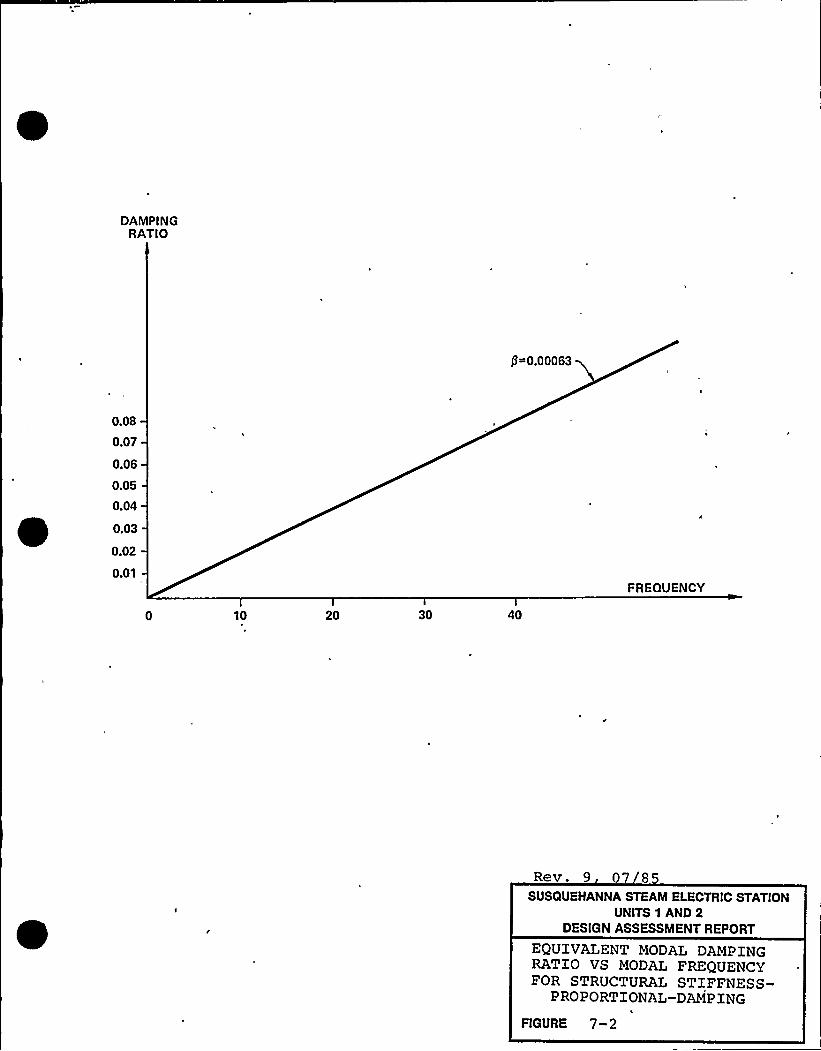
DAMPINGRATIO
P~0.00063
0.08
0.07
0.06
0.05
0.04
0.03
0.02
0.01
10 20 30 40
FREQUENCY
Rev. 9 07 8
SUSQUEHANNA STEAM ELECTRIC STATIONUNITS 1 AND 2
DESIGN ASSESSMENT REPORT
EQUIVALENT MODAL DAMPINGRATIO VS MODAL FREQUENCYFOR STRUCTURAL STIFFNESS-
PROPORTIONAL-DAMPING
FIGURE 7-2
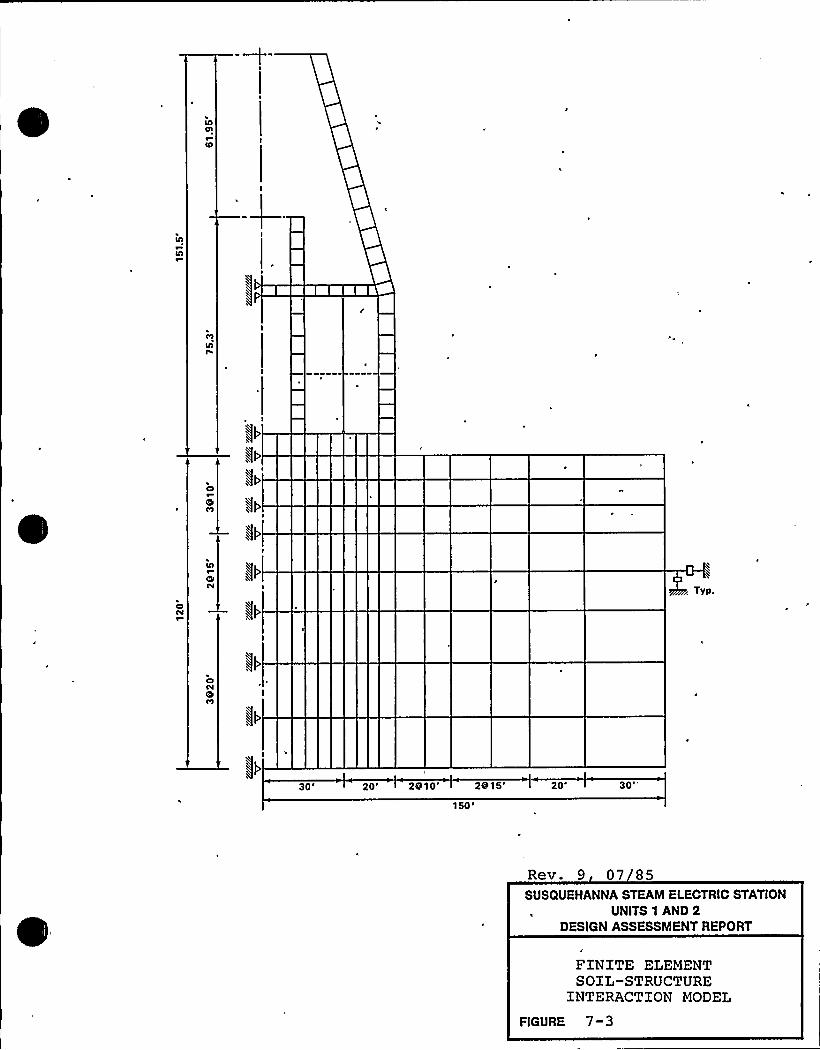
ICI
ICI
C0l
lllr
o
)Igl>
5t
ClC2I
ICI0
CPC1I i TYP
OC0I
30'0'010'010'20'0'50'ev.
9 07 85SUSQUEHANNA STEAM ELECTRIC STATION
UNITS 1 AND 2DESIGN ASSESSMENT REPORT
2
FZNITE ELEMENTSOXL-STRUCTURE
XNTERACTION MODEL
FIGURE 7-3
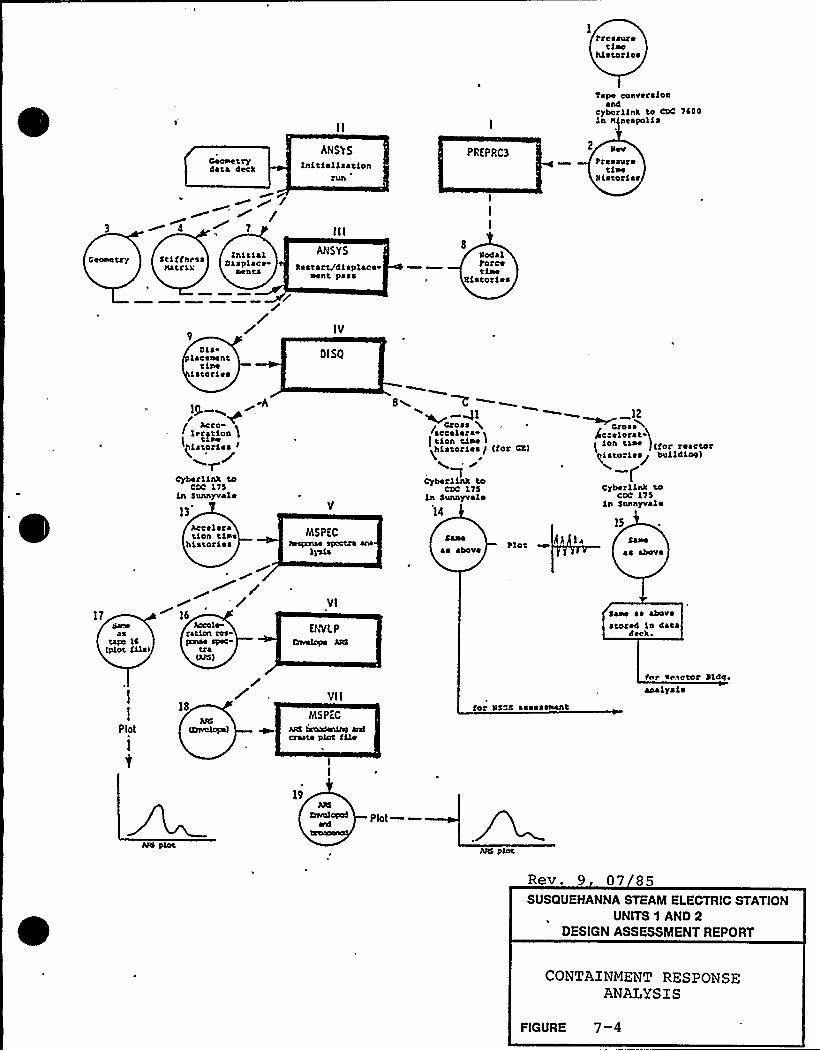
prcssureciahistorios
Tape conversion~ nd
cybcrlink to CDC yCOOLn K neapoli ~
Cause trydata deck
ANSYS
lnitisiltationPRPRC3
pressuretine
klstories
Stiffnessnatrtn
initialDisplace
sents
ANSYS
Aestart/displacesent pass
pedalye roetine
SLstories
IV
Dislacenent
ciseistories
I)ISQ
~ A
Acrei )aration Ittsei(tstories >
TCyberllnk to
CDC 175Ln Sunnyvale
13
Acceleration tine
historiesMSPEC
ns)ttrlse s)cctrs analysis
SxQ]
Cross icarte)era- iI cion eLse )histories/ tfor CE)
'ICyberl ink to
CDC 115ln Sunnyvale
14
Sassas above p)ot
12
CaCross>
caelorat i~ j(for reactor(istorlesi buildino)
Cyberlink toCDC LyS
in Sunnyvale
Sane
~ s above
asta)s LC
tpioc file)
Accclerat)en xos-
tra)A)5)
VI
Dvvt.pEnvelope Ani
Sane as above~ tored ln data
deck
Plot
18Vl I
MSP2CARS )smden)ns art)create ploc file
for pSSS assessnent
mr sl actor Ride.analysi ~
19
Plot ——
Rev 9 07 85SUSQUEHANNA STEAM ELECTRIC STATION
UNITS 1 AND 2DESIGN ASSESSMENT REPORT
CONTAXNMENT RESPONSEANALYSXS
FIGURE 7-4
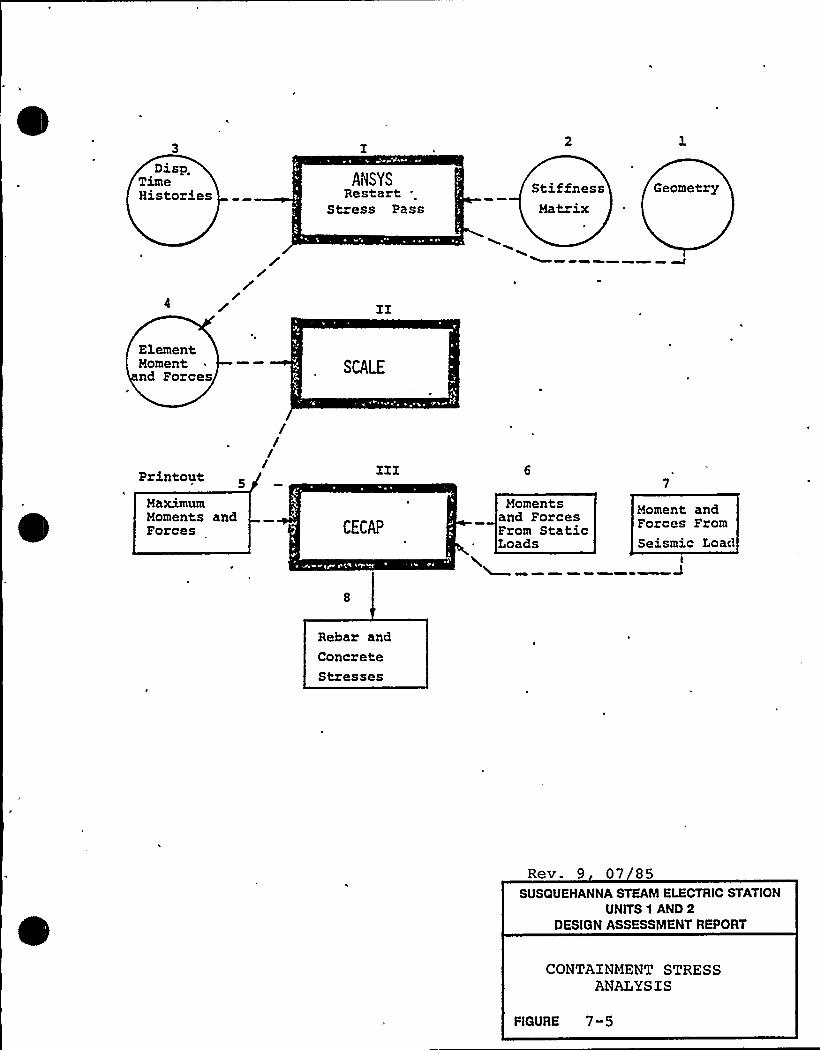
Disp.TimeHistories
ANISYSRestart "
Stress PassStiffnessMatrix
Geometry
ZZ
ElementMomentnd Forces
////Printout
MaximumMoments andForces
ZZZ
CECAP
Momentsand ForcesFrom StaticLoads
Moment andForces FromSeismic Load
Rebaz andConcreteStresses
Rev. 9 07 85SUSQUEHANNA STEAM ELECTRIC STATION
UNITS 1 AND 2DESIGN ASSESSMENT REPORT
CONTAINMENT STRESSANALYSIS
FIGURE 7-5
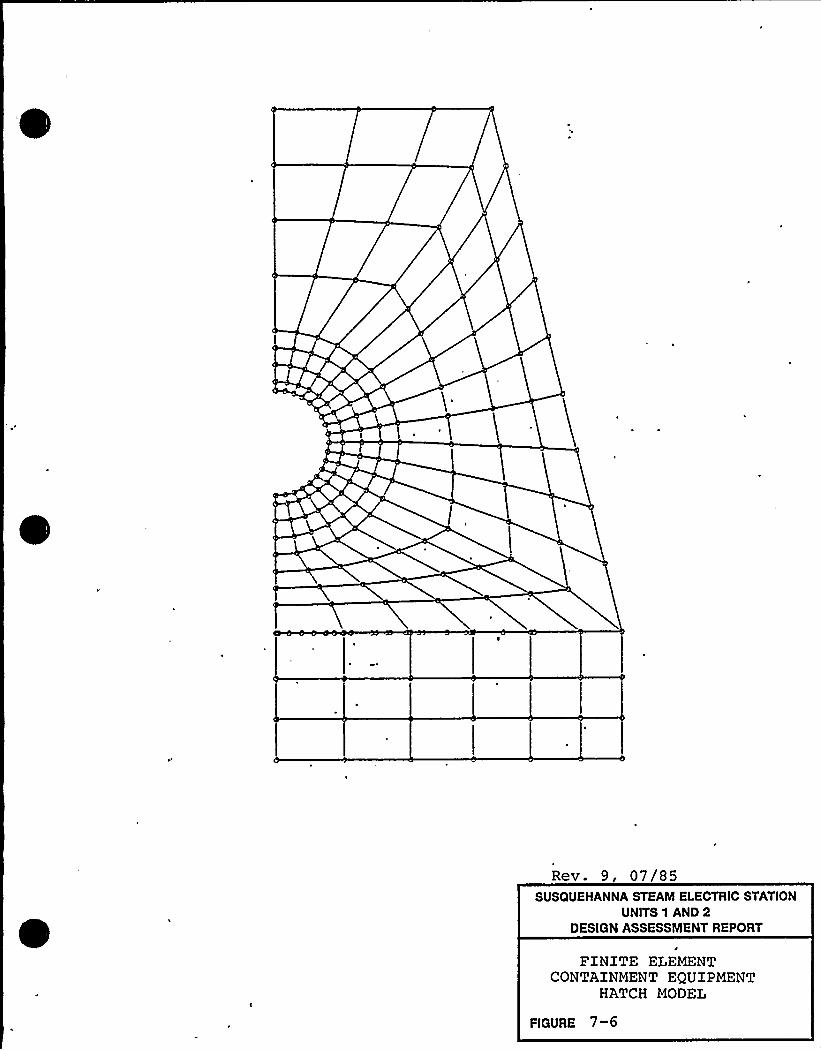
Rev. 9, 07/85SUSQUEHANNA STEAM ELECTRIC STATION
UNITS 1 AND 2DESIGN ASSESSMENT REPORT
FINITE ELEMENTCONTAINMENT EQUIPMENT
HATCH MODEL
FIGURE 7-6
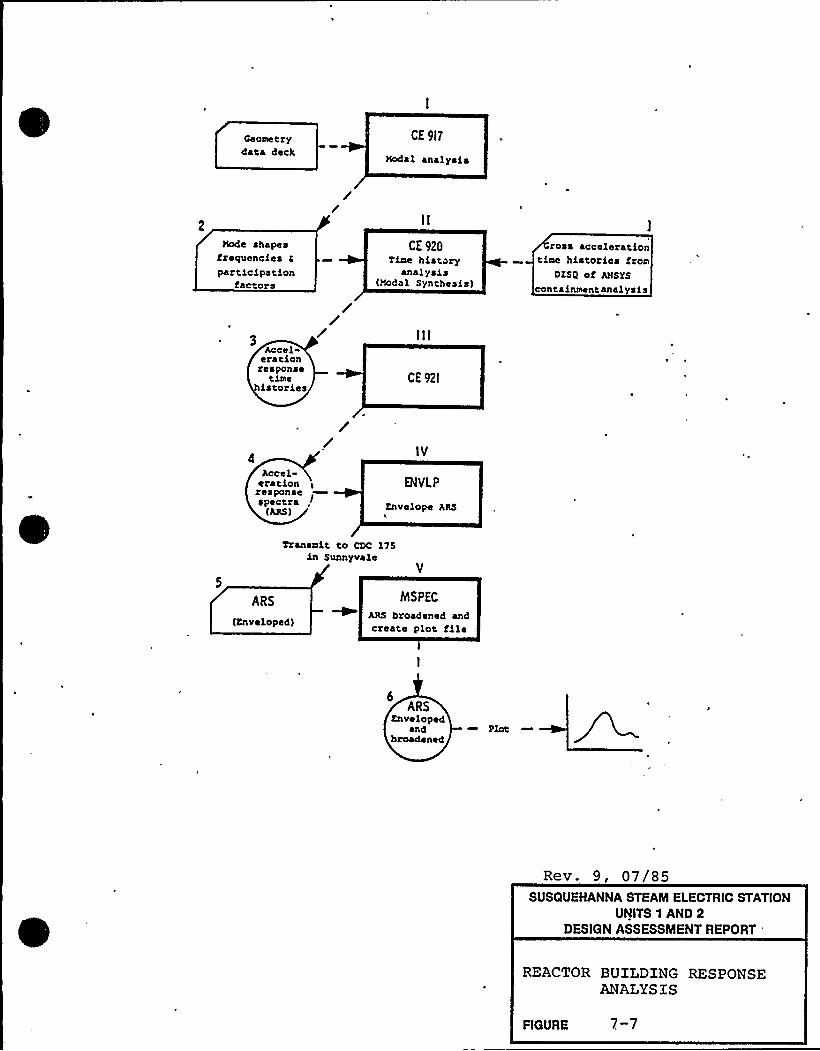
Geometrydata deck
CE 9I7
Nodal analyst
Node shapesfrequencies a
particLpationfactors
CE 920Time history
analysistNodal Synthesis)
ross accelerationtime histories from
DZSQ of ANSYS
containment analysis
Accelaration
responsetime
LstoriesCE 92I
IV
Accel-eratLonresponseSpectra
(ARS)
ENVLP
Envelope ARS
Transmit to CDC 17$in Sunnyvale
V
ARS
(Enveloped)
MSPEC
ARS broadened andcreate plot tile
ARSEnveloped
andbroadened
Rev. 9, 07/85SUSQUEHANNA STEAM ELECTRIC STATION
UNITS 1 AND 2DESIGN ASSESSMENT REPORT
'EACTORBUILDING RESPONSEANALYSIS
FIGURE 7
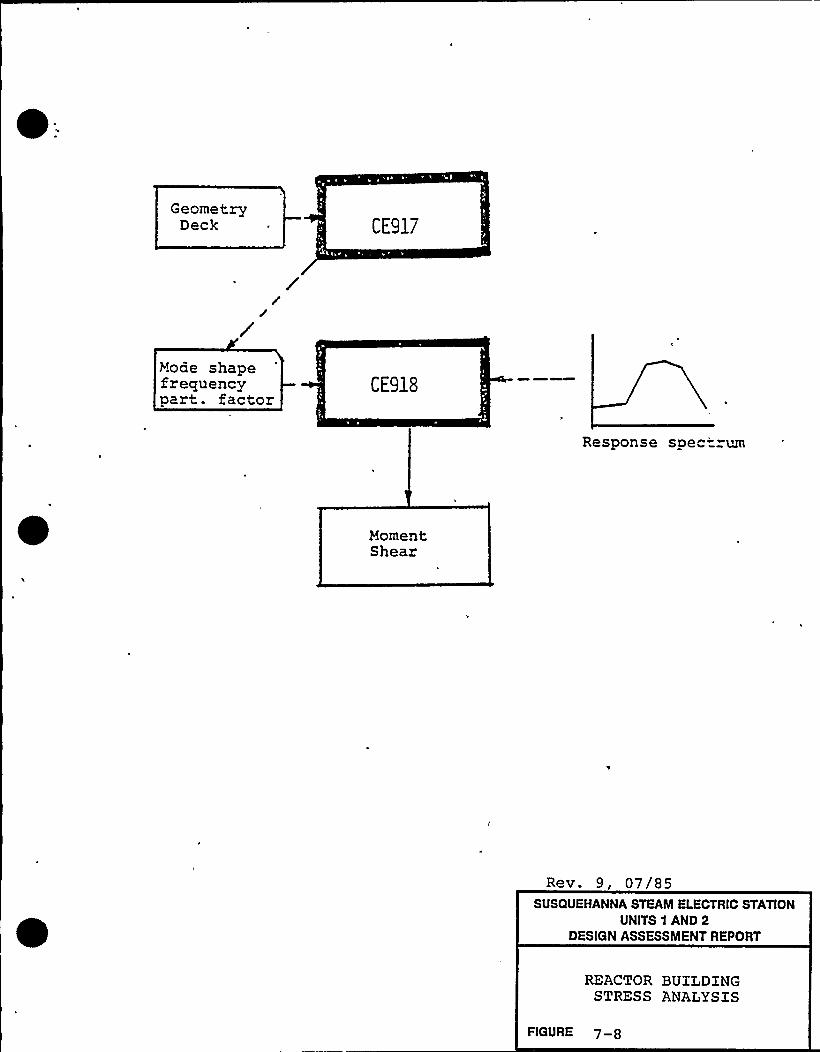
GeometryDeck CE917
Noae shapefrequencypart. factor CE918
Response spec-rum
MomentShear
Rev. 9, 07/8SSUSQUEHANNA STEAM ELECTRIC STATION
UNITS 1 AND 2DESIGN ASSESSMENT REPORT
REACTOR BUILDINGSTRESS ANALYSIS
FlGURE 7-8
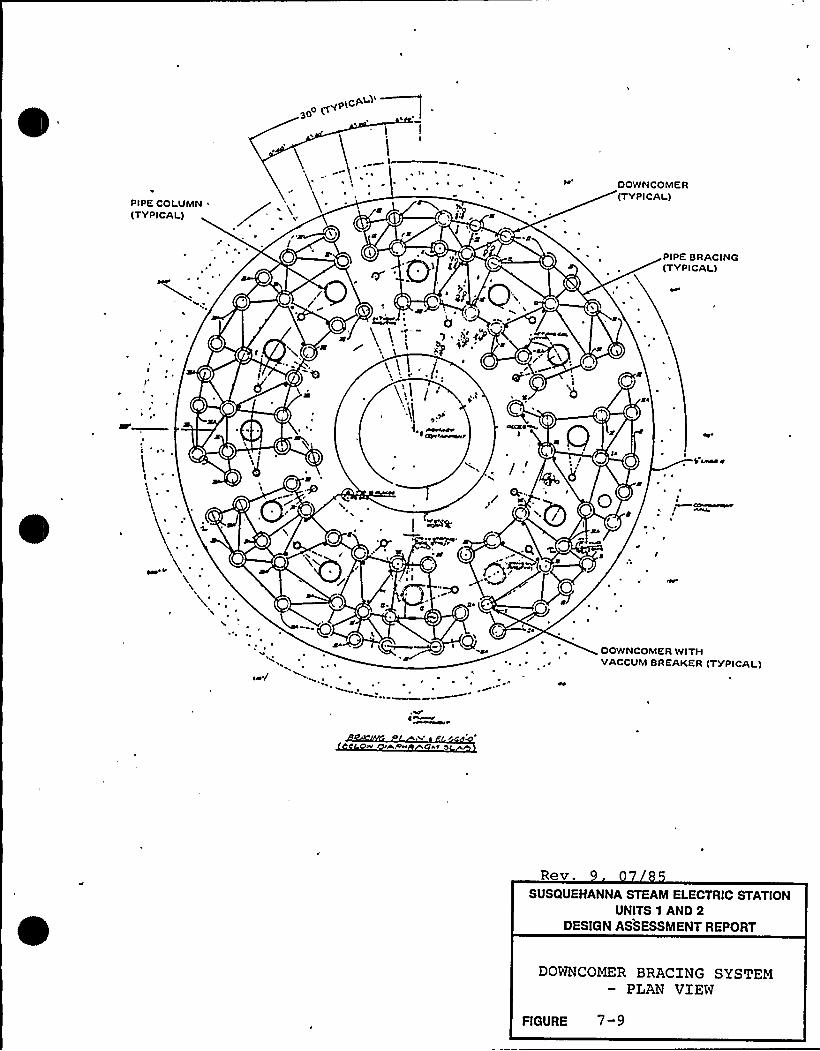
g0ypIC t
I
PIPE COLUMN(TYPICAL)
OOWNCOMER(TYPICAL)
PIPE BRACING(TYPICAL)
I
(rr)w
~ ~t~r -Q/
0
IAaae r
.-X ~ .
4 ~
X; ~ .'
~
,I
d)
OL
.Q t.Q~
+4~ dZ OOWNCOMER WITH
VACCUM BREAKER (TYPICAL)
.VOw r+W *r 5
Rev.SUSQUEHANNA STEAM ELECTRIC STATION
UNITS 1 AND 2DESIGN ASSESSMENT REPORT
DOWNCOMER BRACING SYSTEMPLAN VIEN
FIGURE 7-9

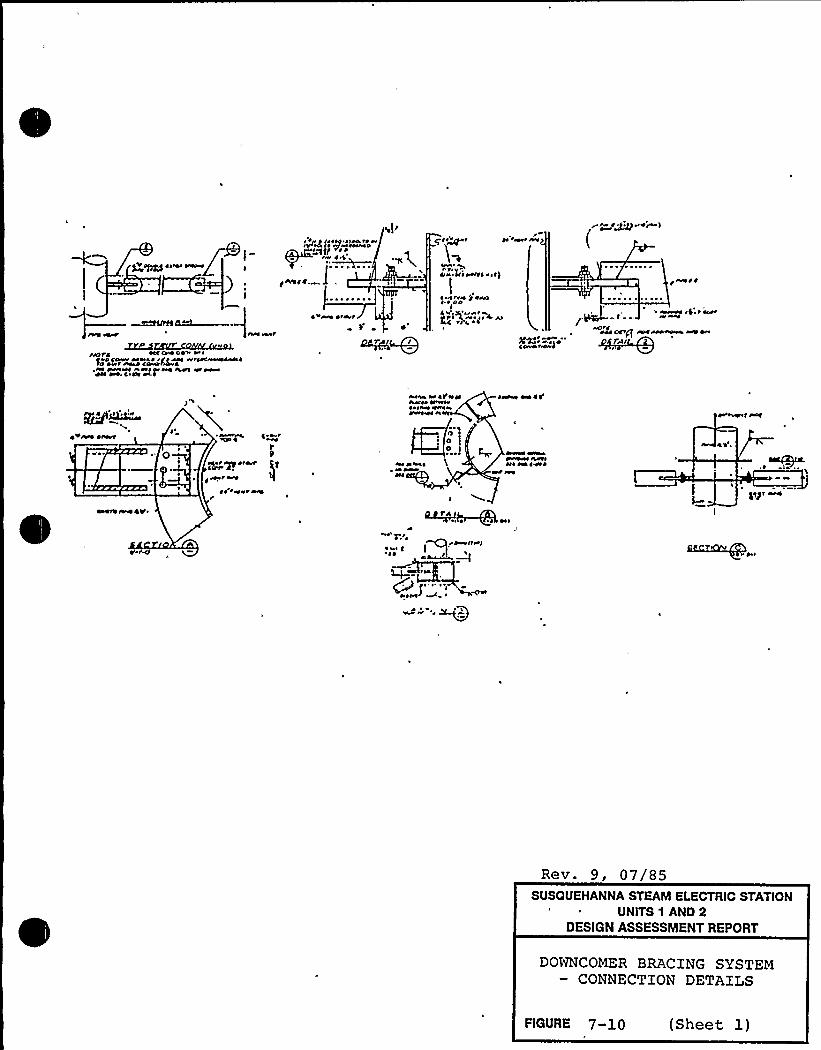
~i!&%5~~ltart ver
I+~g lett( agatato er
tm~til'orcOO
~ Vtaaa otort
a
q t t++ et tt ever tare
~ao Ittwtrc ~ a l)
I~ «rr» $ Otral' oo
ICar 5, a ra ~
f,O ~ aa re a a ~ 4. taaC elc ~ C
,rr'ara )
(
r taV O O
aaaovt l$lr«tt/', w VoOtj
~oo carr too too raoaaaa «v oar
TaaaO TO ~CC aaaO OOaa O ~
~ «0 caaarl oea eo ~ (t ooa rrtoocoaaatoeoaoOo tart laoao coaaotaoro, aao ateaaatt aa &tor w tarte aat toot~aa OaO C Oaa OC ~
~T/{{/} COro''
aotva ot CVvgtaatto toaaae
~ eOaO OaOOV
oVtvv otorr C e™w'
9
sWP."~
«4 t eet
~t t ver avv
aat ra ace a tla ~Coot
~COtO ave CV
Vt ~ tWarItrel~ aa g sar»su.cQ~W'aa
Rev. 9, 07/85SUSQUEHANNA STEAM ELECTRIC STATION
UNITS 1 AND 2DESIGN ASSESSMENT REPORT
DONNCOMER BRACING SYSTEMCONNECTION DETAILS
FlGURE 7-10 (Sheet, 1)
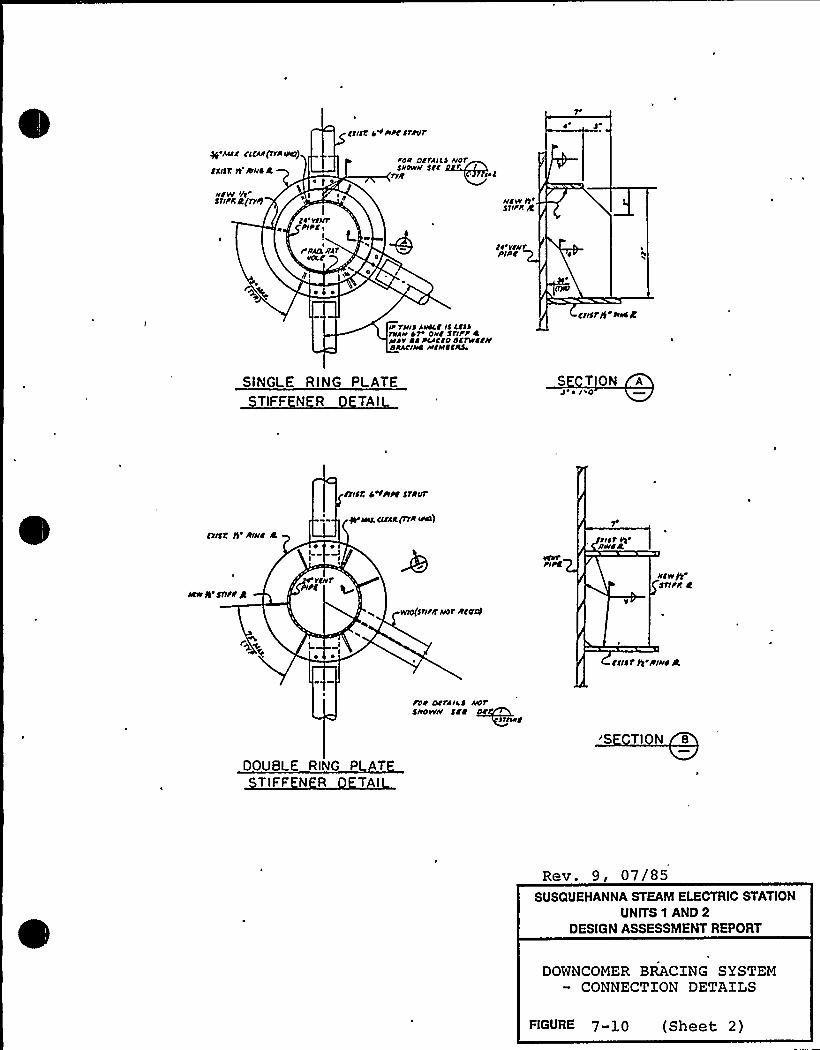
tsIIT. O<HPt trtllr
Q~ACIX C'Itrt(rrd IPr2)
tXIST. Ir AIHO 4
«tw ~/e5rlf'R l5(lrI5 C I
ident dtrAICS HOT5HOwH 5tt
Trit mt
Htw r5~5rIPP. g
tr'VfHTPIPX I
II PACL A'Ar tr rtHT
PIPt
ce
ce THIS AHOCt Ir Ct$ $rNA» Ore Oat 5rlfP 4AIAT dt AActddtrrrttNSAAOIHd HtMtttL
trltr55 PIHtk
SINGLE R IN G PLATESTIFFEN R TAI
S TON a5' Ied
tXIXT. 5V dIHt 4I ~II
~ I
I
drill,' ttrtt 5rtllr
+Aelr. trtAk(rrdIPC2)
PIK
Aee g~ g1IPt grtHT
PIPt
wro(5rlflrHor dto'0
«twgdtlrt 4
tritT I} IIIHt4
/Ot OtlAIC5 HOT5HOWH Stt
~a~n t'S Tl N B
DOUBLE RING P ATTIFF N R T I
Rev. 9, 07/85SUSQUEHANNA STEAM ELECTRIC STATION
UNITS 1 AND 2DESIGN ASSESSMENT REPORT
DOWNCOMER BRACING SYSTEMCONNECTION DETAILS
7-10 (Sheet 2)
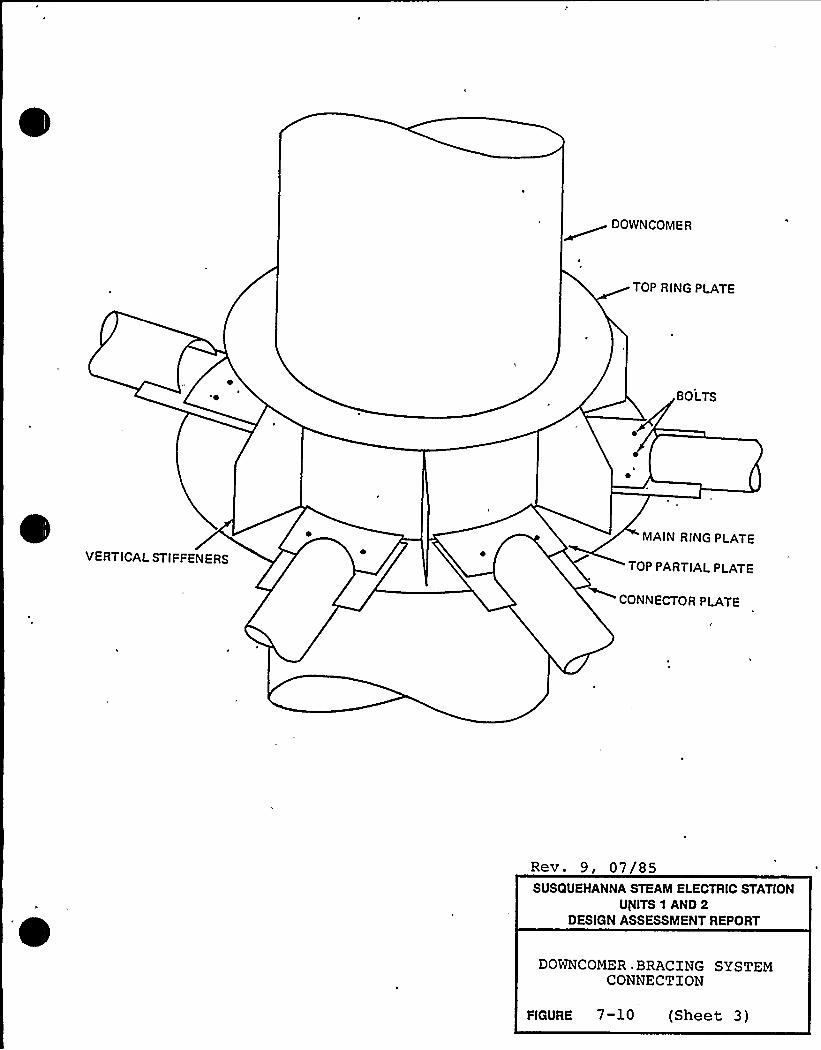
OOWNCOMRR
TOP RING PLATE
BOLTS
VERTICALSTIFFENERS
MAIN RING PLATE
TOP PARTIALPLATE
CONNECTOR PLATE
Rev. 9, 07/85SUSQUEHANNA STEAM ELECTRIC STATION
V/ITS 1 AND 2DESIGN ASSESSMENT REPORT
DOWNCOMER BRACING SYSTEMCONNECTION
FIGURE 7-l0 (Sheet 3)
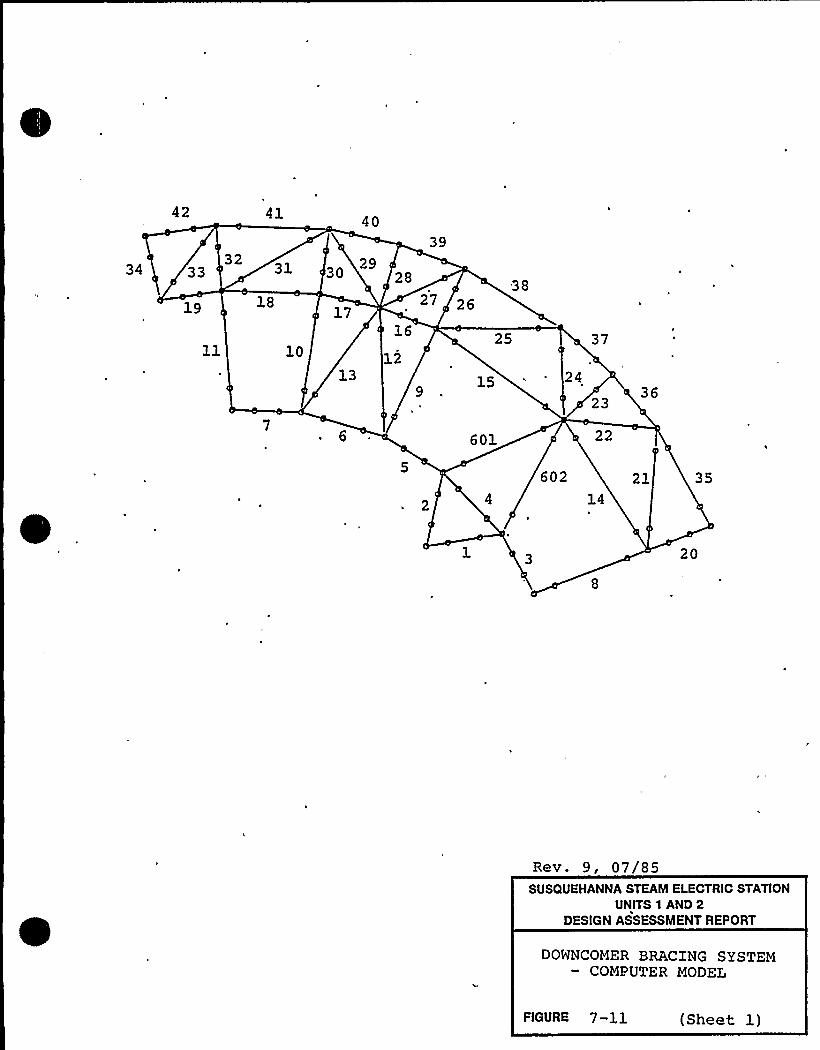
42 41 4039
34 33"
31 30 28 38
19 18
10
17
13
16
12
9
26
25
15 24
37
2336
6 601 22
2
60214
35
20
Rev. 9, 07/85SUSQUEHANNA STEAM ELECTRIC STATION
UNITS 1 AND 2DESIGN ASSESSMENT REPORT
DOWNCOMER BRACING SYSTEMCOMPUTER MODEL
FIGURE 7-11 (Sheet 1)
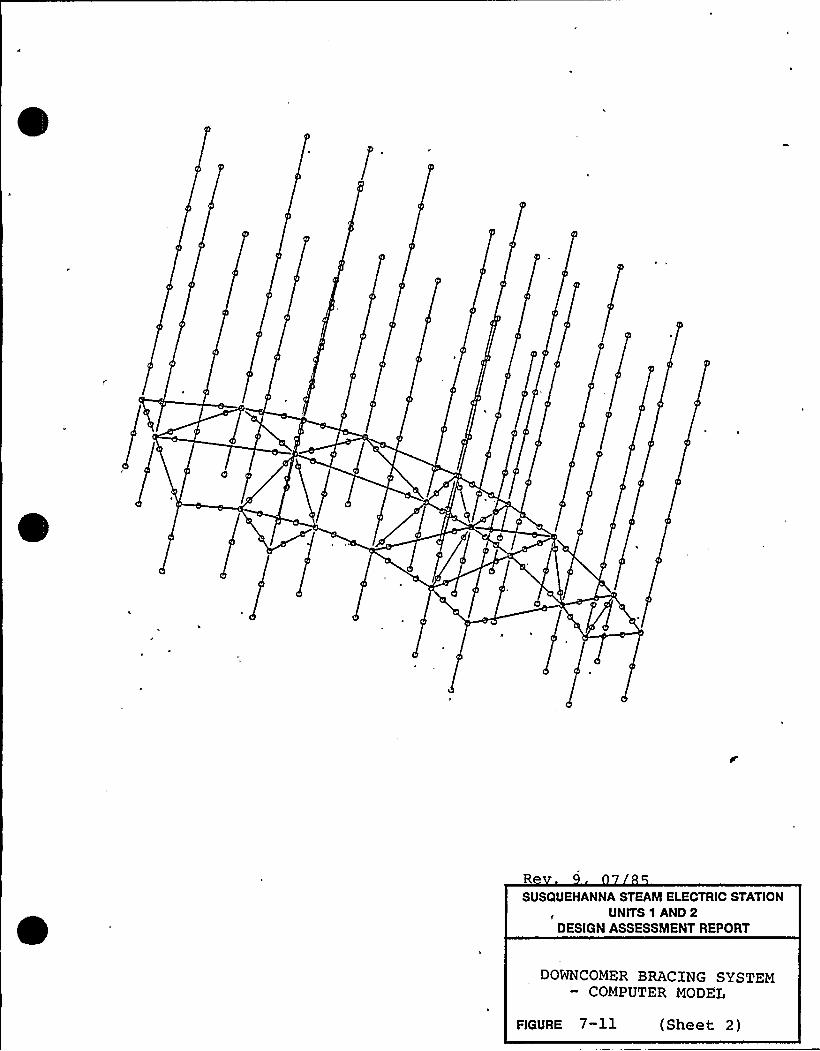
SUSQUEHANNA STEAM ELECTRIC STATIONUNITS 1 AND 2
DESIGN ASSESSMENT REPORT
DOWNCOMER BRACING SYSTEMCOMPUTER MODEL
FIGURE 7-11 (Sheet 2)
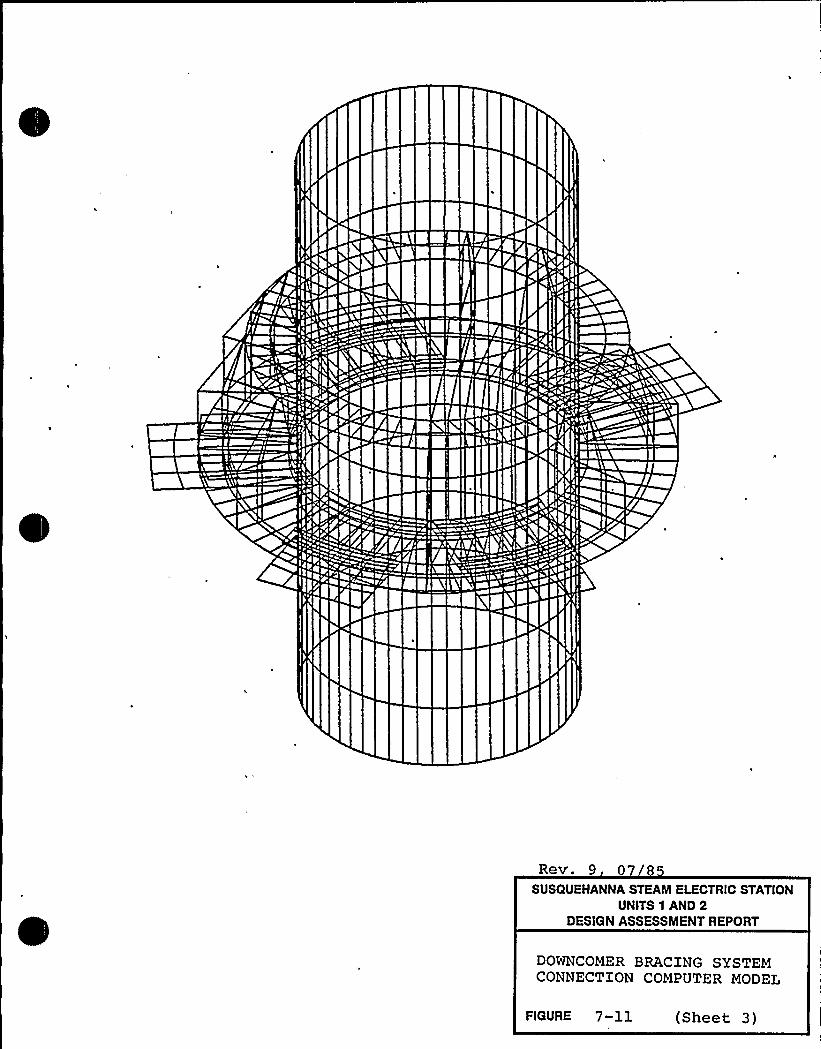
Rev. 9 07 8
SUSQUEHANNA STEAM ELECTRIC STATIONUNITS 1 AND 2
DESIGN ASSESSMENT REPORT
DOWNCOMER BRACING SYSTEMCONNECTION COMPUTER MODEL
FIGURE 7-ll (Sheet 3)
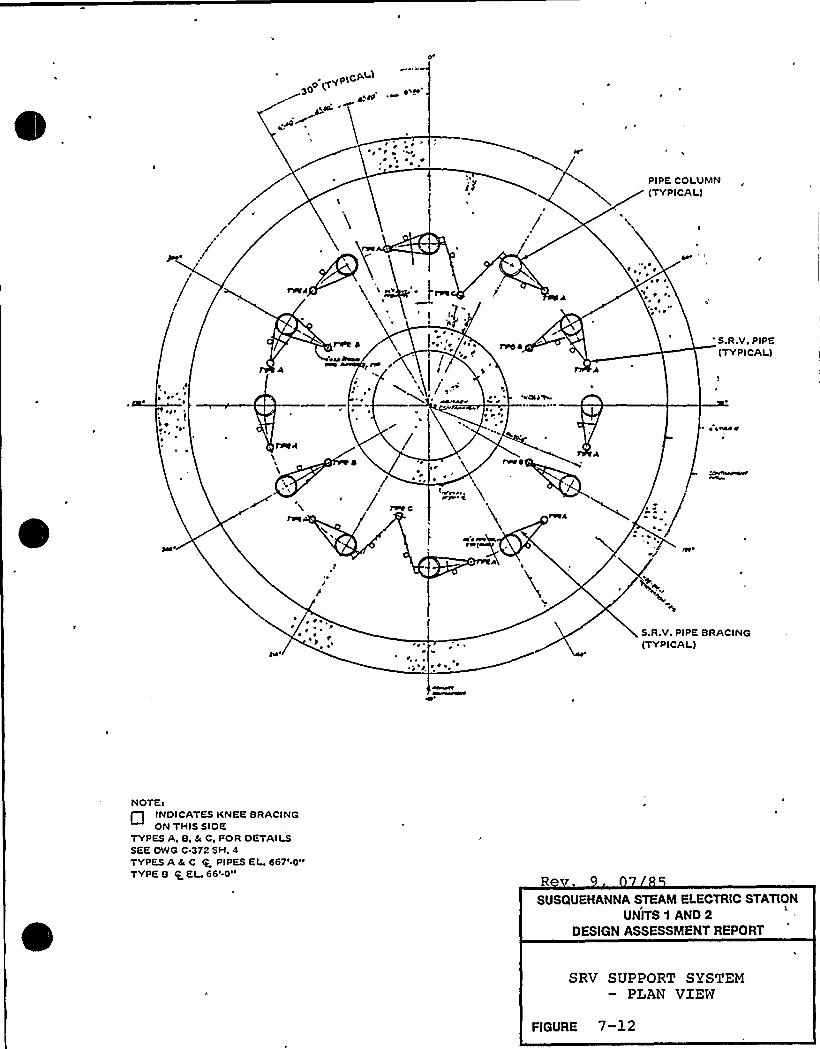
oj
Oiu
~ ~
~ ~ ~ rr ~ r ~
~rj
PIPE COLUMN(TYPICAL)
//
~ ~
~ J ~ I ~
~ ~ r,
~ j ~
. I~
'rubeola ( rjr
,'-~
~ ~
' ' j~ ~I
I jr
/ s
«««rrr ~ ~ elk W
~ r jj
'.R.V. PIPE(TYPICAL)
~ 4«rr 4
//
~ r ~r ~
~ ~ r
r ~
r
S.R.V. PIPE BRACING(TYPICAL)
NOTE:
Q INOICATES KNEE BRACINGON THIS SIOE
TYPES A, 8, da C, FOR OETAILSSEE OWG C.372 SH. 4TYPES A 6j C Q PIPES EL 667'-0"TYPE B QEI 66'-0"
SUSQUEHANNA STEAM ELECTRIC STATIONUNITS 1 AND 2
DESIGN ASSESSMENT REPORT
SRV SUPPORT SYSTEMPLAN VIEW
FlGURE 7-12
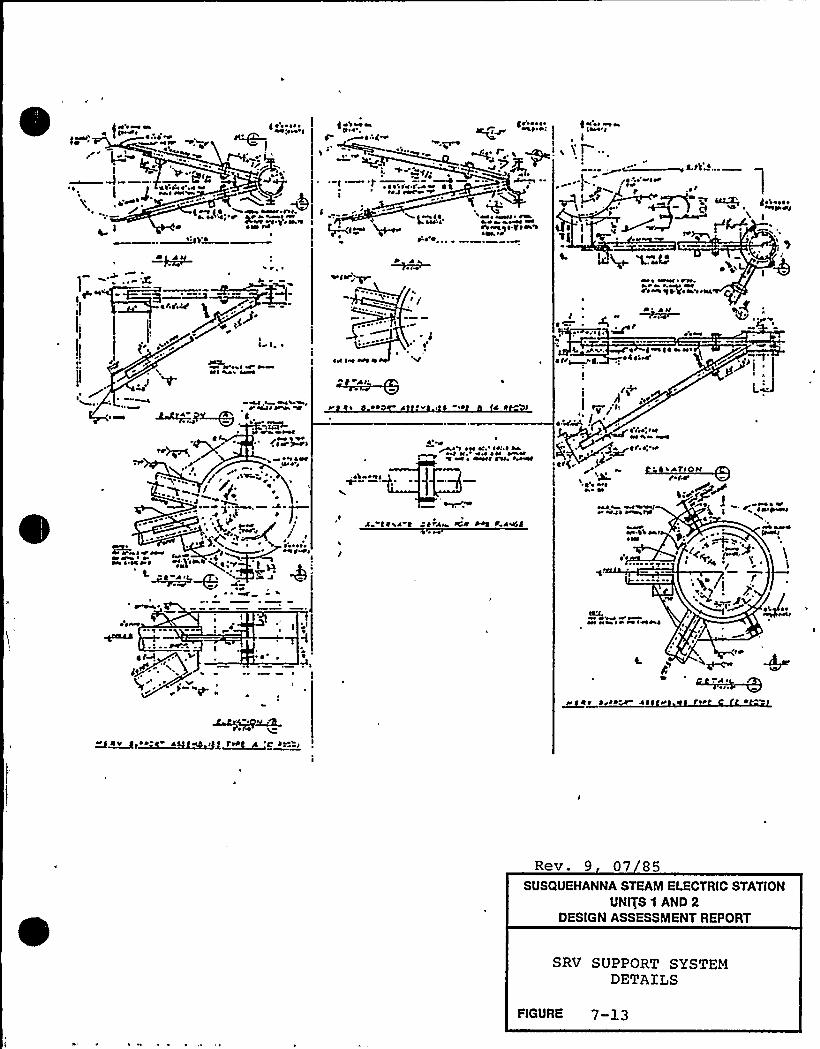
~e'r«f ~ g ~ ~ e ~ ~Ceo'«I 44 lofol
e a>leo ~ >4 V ~ I
8'jl~
i Qfe'eve rw
j~ (4. 4 ~vvrr.ne.~Ar ~ e«vt OVraff «4 ')'rel oe
I ~ eg roe
~ ', )'
1g4 44
I
Ii
gr aoe ~
~Kg'~ 4%)orejr'eaf roee o ~
~ .'ooo
~ e Vve r~ ~ 4>or ror««v'-'~~
.~ %.a~e eever ~ ~
4 ~arel ~ ra >eave ooe~el>rage to~'4
err...~ Ne. >r
4 ~
L. t'>~i<
va o oor>N~ ave ooe
~'roof >If'>af>Ne
r'ee«C
~ a '>4 faA ~ e
tvoo~~«44 ~
i )Te'
~ r
F'~je'oooo>
I
/
ve ee'eae v ~Nl >4s Wm4
~ roof1
I~ F>
. ~
jpQ' ~ ~) 'a%r a
o I
-'I
' ' '
~ ~ . ~ I
Cg .e o>V4'lra>
l~ ~AQ~ j . ~
ee «a aoove~ av ~ fe
r. ~ e« ~laa ooo aN,rI
~ el
~ r>
o
«r tae Oo>4 rl oor
4 ' 'I « I or FA
«oa, ~ ~ lel N lae ~ 44~oe ar v ~ ~ lea ~'o fve~ efr ~
.4) ofl
A ttoor t teA> re r ~ < A4S44
«4 aaef
iF'
rro
'r «o
4.
cKL~rl echo I ~ af eaf eae
~r> Ar Area«r 44» rrr
aa v. 4 ~ oro 4 ~ ea NI~ r/~ag, ~ ~ o
yg I ~~ ")"
t'+
L'-FII
~,~." j4'F,o', roe~v oow avfer.e:«
r grAr(«~
' A7'I 0 r«For»'ee«e
Re
«o ~FH o 'e
Rev. 9 07 85SUSQUEHANNA STEAM ELECTRIC STATION
UNITS 1 AND 2DESIGN ASSESSMENT REPORT
SRV SUPPORT SYSTEMDETAILS
FIGURE 7- 1 3
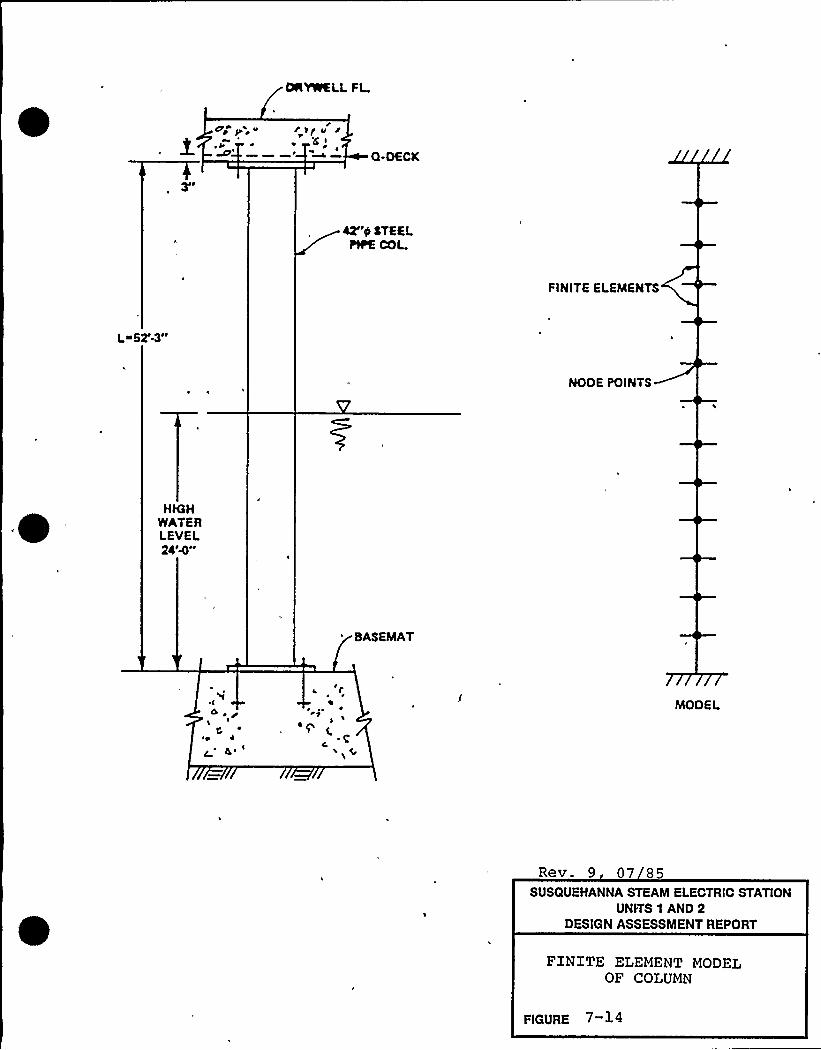
OAYW%LLFL
Ae~ Jt ~
ri)f u'P'6.i
O-DEC@
M'P STEE,Lfit% COL
FINITE ELEMENTS
L~52'-3"
NODE POINTS
HIGHWATERLEVEL
BASEMAT
I
~ o 4
4 ~
r4
~ ~rI'p
c
MODEL
Rev. 9 07 85SUSQUEHANNA STEAM ELECTRIC STATION
UNITS 1 AND 2DESIGN ASSESSMENT REPORT
FINITE ELEMENT MODELOF COLUMN
FIGURE 7 i4
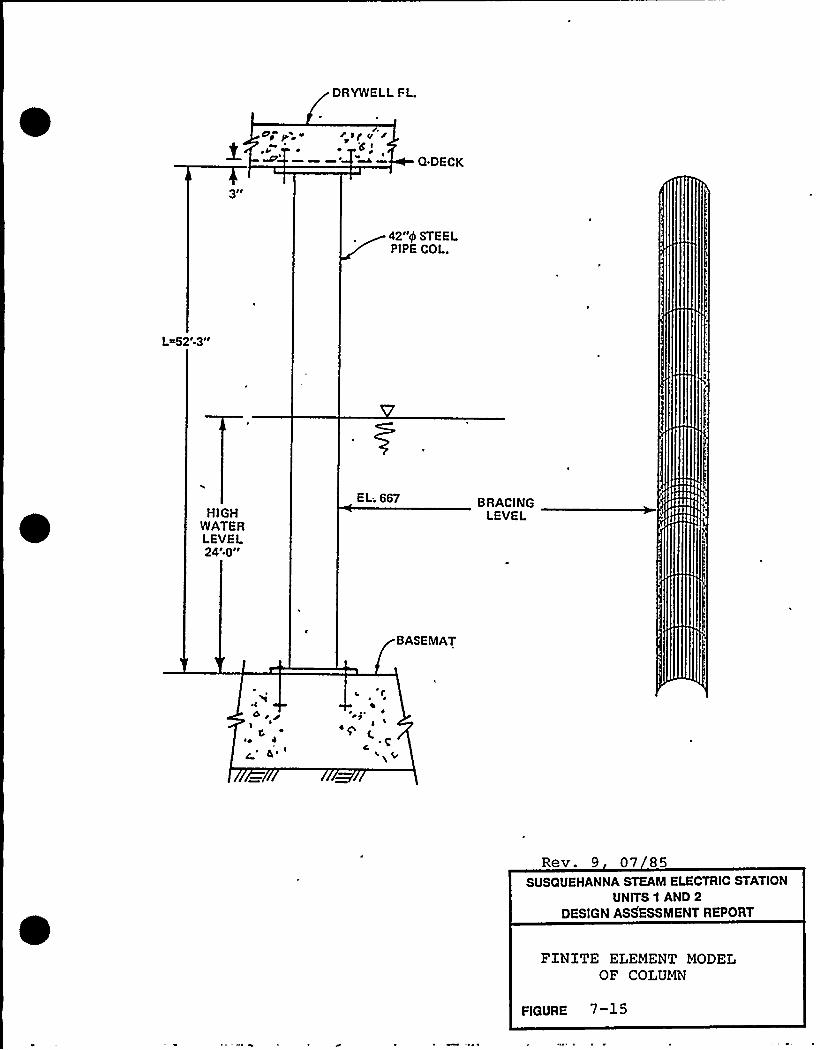
DRYWELLFL.
~ 4
r.r ~ p vT~ 'g t
0 DECK
3M
42"Q STEELPIPE COL.
I 3I~L~52
HIGHWATERLEVEL24J Plt
EL; 667 B RACINGLEVEL
BASEMAT
~ g 4
4'
~, 4rj l~ p
.C
Rev. 9 07 85SUSQUEHANNA STEAM ELECTRIC STATION
UNITS 1 AND 2DESIGN ASSESSMENT REPORT
FINITE ELEMENT MODELOF COLUMN
FIGURE
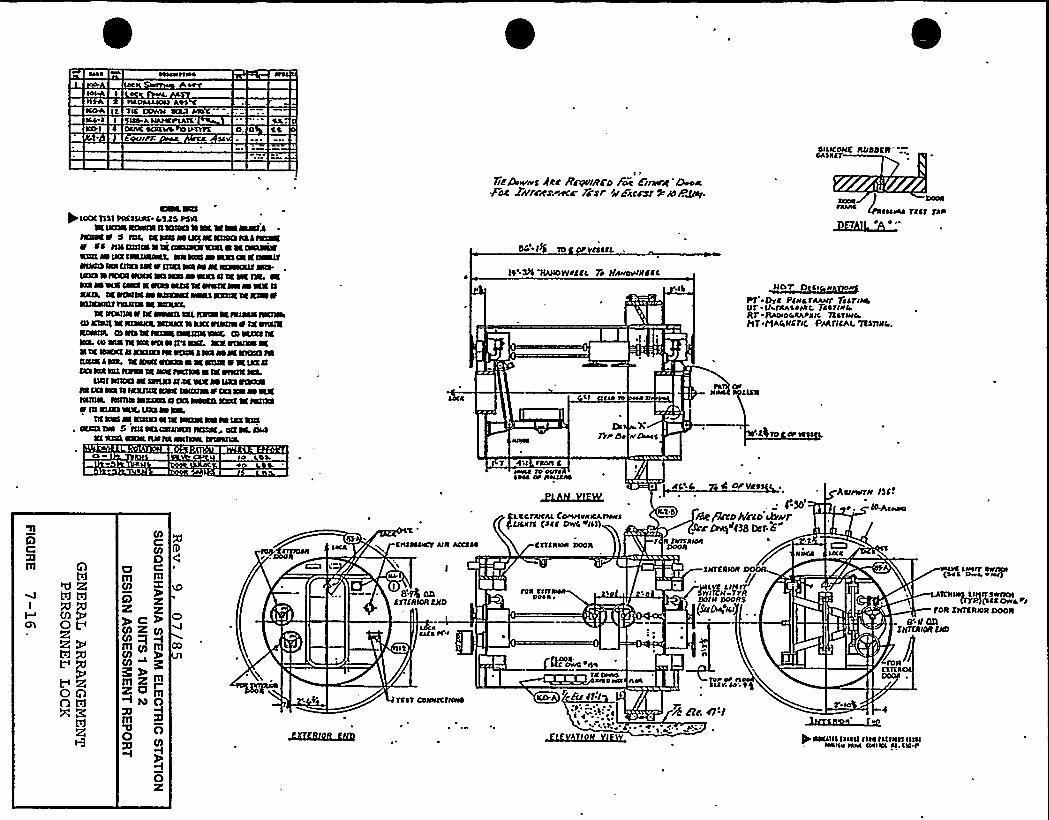
~rl~
~Ol
ICO 4
ICOI
C. TIC DCIWNI AO AIIAIQPIATK'.
O
OAICOHE Rtliiilt:,OAShtf
P uxsc nst SAECIIAE-asks ps+% IRZ% RCWt% Q RQas IISK % MWats ~
IQuar o IQI. assewIRCWRIRQIRss~r RS IIIIIQQa SI IRIWQstaeae a cwuweQQQ w Qcc IMJIRIIRto QR Rsss w axs Qs Ic~raRs IRREIsa r QIRs QQ w% scwRT «tsQQo ct IRscht raa as IIRIwwxs a a NKTxo %~hs wSIR cwN Ic rcw SQC IQ RIALsw wax 0KRQ IQ ROCa W WCSRAE~ XÃQRIR QIWrKURIQQJ 1lCIQa a RARE
IQ QQQQI r DE~ SSC ICHOR a IRIWQlatalIQ IIDQC a IQwRR. MAREN LRE RIQQQ S DE RRsl%
CD HIS IQ~~ SRa ID WISS IRIICS IQ Ssa IQ SSR rN IS Q'I RKC %X RIMXWWIIIQ ACRE IIÃRQKS INRQa lRCS W RC RIQRS Mossa ISSS, SE RRSC RaRS ss SE $$% r% IREEcss Rcs QL RRQR IR Rsc IssQW ss IR RIQQE IOL
QQI RQcxs w IRRRIasR wxw lsas rasal% css Dhs ts IRRJQJI ERR accQRS r cxs sa wwxASQIR. WQQS WRISss a IRS~ RACE a IQJISRa IQ RUss %L lhss w RR.
QcswIMRIQRssslR ~RRIQIÃERQSaQKS QN 5 IQI IRS QSQMSI IRSRar Oa W Qks
RE RQCC QRW RN IIR WQSW. ISIRSJLL
7jzgbor+5 ARE Rsyezro Foc Fi~e Faro<.Fe Ar+Srmc Fiir O'F~far W lb'.
ed-PC To or cssn.
lt'3JC RuewrEEc, Fo Jl~ortiiic
II IO
DIJlr br
DOOR
EPAIII~ rsst FAR
~1kB
NOT 0 Cl
PF Dfh Psihfuwf tiSFIHAUr -VifAAS4HII.7isrlocRr -Itho OAAArrls nstHICPIT MAIOHEFIE PALJICAI.'JESIINI,.
EtoeIO %IS
7 AII fhOII Clrecs Io oofrIOOC Or IIOIIAM
~ gg'4 IC csr vct AtlrhffH ISEF
Q
OQO tdX
3'S
DlVlm
9yet82 CD
mmmmCII~ gmamzap
EN 0lll
O0yOX
0IOCA CAIOSaCt AHt ACCS44
I
IBl@ OQ
E JTCRIOR END
llCICO II'I
TCST COWICJINN
ECTSROHI DOOR
fth slitOOI 4 ~
IKCrrrslal44 OAI
ICD jsf EF:I
AOI
~25?lSLYlQL,
Lsc fhlchc Ecrtrloo AAnarsCIAOJC <SIC CAOS <Ia)
,„4'SO'ie~b
JVCCD'a@A FJOA ~i438 brt. E'
. JO.AsrooI
f 4 JIIICAHOIDOOlt
JHJERIOR /PiylkH tfR
Rs$01H DOO
(Su~'ICI
NAOS ~Olh
(NI Qws, olr~r
IIII~II)$5&ACR
FOR ZHJERIOR DOOR
OJIIOR EAD
IF. IJINIKS
for or IIISA IO'
IOAESIIAQCDOO
4 Hb A'I~aaaEID C "e
P RAQRI ISISQ IISO IIIIHSI QIIIINllitIsllh AOIIOL Sl. CIS I'
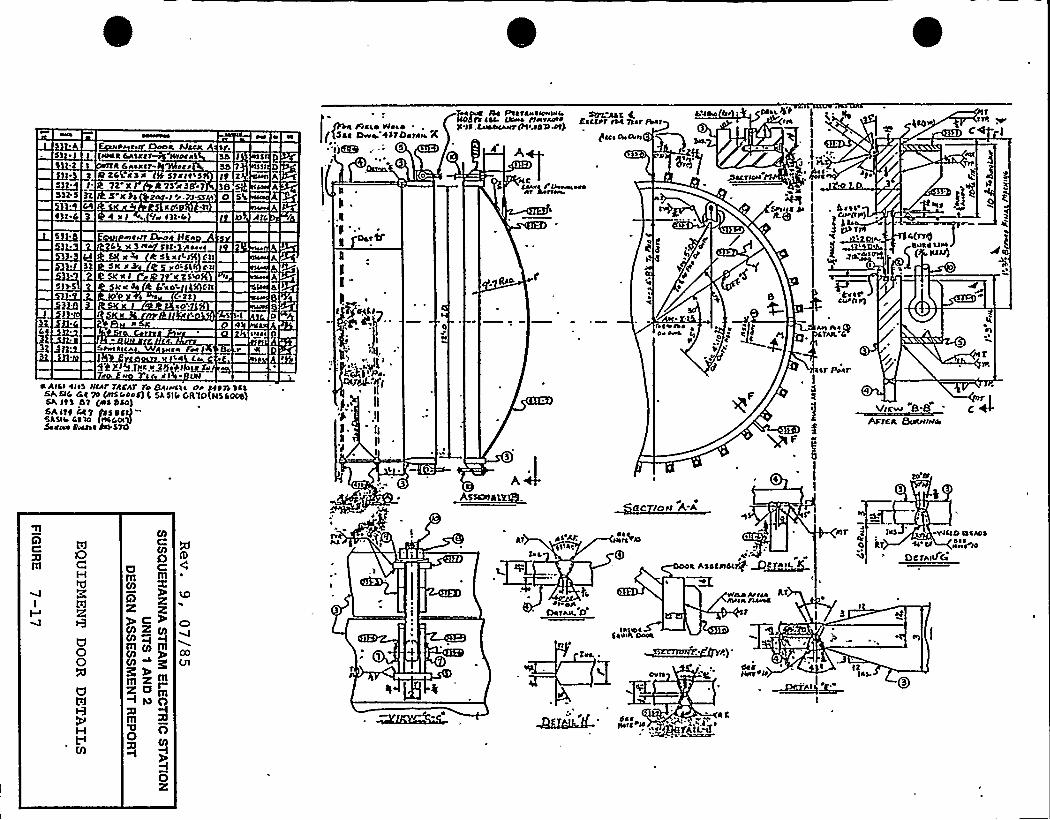
53>roric»T &ooa AlccK
)rl>ct CASccr >rrocrt D
~ Ficta Ir>ror . ~(gcc purg hSTOrlrra r(~'IIE&
43yuc Itc Pctrcrrcrr»roc3lc ccc. Ito c rlrorrrrrr doctor rot ttrr~3>->c.toot>>A»c Ittr.ustly>
Clo A>Aro
4 A
Cr>L» Crr 'rro
II
I '/
Ir t>I
C I
>I Courier ociZ R ZC cSrl If Src>CCS
36IS Z
I't R 7Z'X R'ISKS 75 X 2 .I or.TJ.SS/rl
38 +0 Sto
4 x ~ c/» C3t.li
rrcC 5> 3 ir Slt. fluoro
SK C3'4 Skor>C>33 Ctl4553(ox'ilZS%
Kec >I uco'ltrr
Q rV
Srrroa A W ia I'rugt9RZI4Tpc v35 ICIICLt&.
1 ii C I I»I4 A>N h>IS >>crf TREAT lo Scr»cta clr ccsrr SCt<hs>c Ct 74 &cooocI l SA silo GR10(N5600slSh lt3 Ot (4C Sto)SA Ith Ct I AS SCIISAC>li Ctlo I>ICCO+ISear>or succor ~S
55> DA
~iiii0
a
IOar%'i
II"I
gll.p
ilpP II
I)
I ~ tiI IIII
4
ICAL/>Or»oooo»
o
rotor>or ooo o»o
„ II
Sr>got So III
3>otto
~nQSdto Vrr(
'CC ~S'rrrllIrl
AOI AO ettr>L 6
tCT Pocl
v as"Arrsa 8>ccrc>A>ro
AsmeatA uj
aC >o>t A-A
II
"IA
I0m C
H3,'tdZ
U00
UW
03
0mm
AR K>c203 2 O3V3~+03m O3 m03~ g~~mmzmm»m~ SS 0lllO O
SO
OR
C)
COVt
KRGR 'i
AI
Iso.
riDCCA>l. D
r> o
Trc.
Asctr>self ~CT<t4 Q
w~r r~rrrlO C>root
IE 6)'.SCC ' t Itoro ~ »»r olr I co.
CS"
~rii-'8'utOS
-WCIC> ICCAOC
rooir>O
Dcrp >Ifla
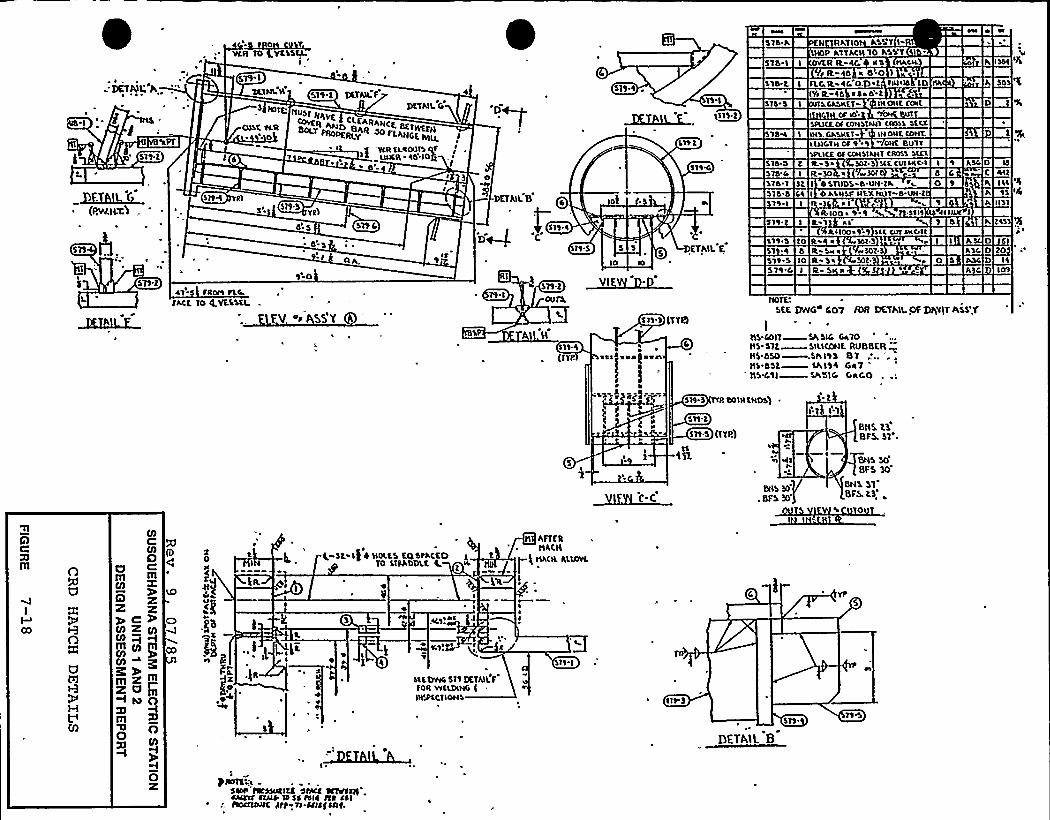
-'1KTAll h.
$11 I
0WII ID YESSQ-
I
5a-ISl'S.t DETAILf 4
DETAILGOS
COLT, TCRSh 4
Is
|sin~ ia)S)S.S5 YR)
bL5
bss
CLEARAIICEI IIAVE
BOLT ~~D BAR b0 BET)YETI)ERLY LAHGE AIIL I
5 YERCLeOOTSILf
~ ~LINER ~ CO'IOg
~ ~
)/
D
DETh)L B
Sil 4
Cns
sls 4 ~
STS t
511<
'C
ETAIL F.
'Slb A
515 I
5lb t51S 5
515%
5 TO.S516'feSTO 1
STO b
511.
ST'I 5STT 4
N RATIO ALLT ISTOP ATTACN10 hSS'T
R R. 44, Ns ITAL/ R 4O aOO)
TLG,Rr40 ODAC TNIIIS ID Nk
(YIR. Cb TSAO'I LCALNCT IN ONC CETIC
NOT IO VT
STLICLOf CONSTANT CROSS SLCX
I INS. GASKCT IN OIIL CONY.
LENGTH Of 1 1 ONC BUTTSOLICC Of COHSIANT CROSS SECT
IL SA 3OT.S SIC, CUI IIIC.I IR-34 a VwWIOI ™. b
ASC 0C r C
C4 I 0ALNSf NL)LNUT b UN.I
~ IOO ~ 1I k13 AI
STET a 4IIIINri1 CI
TO
AIIOO.1-1 SIC CIIT SNC II~ IOT 3
R 'Le( r 3OHI I A D
A'SC D
3t I OSTUDS O UN'TA ra. 0 1
SO
IN15
I I'Sl
L45
20$
~III/I
I ~
5TS 241 5 fROCT fLO.
TACf. 14 4,VESLtl
1 0
V, ~ 5S'Y
ah
> Sll.tOUTh
H11 1
(ITR
IO
VI
TTS 3
~ ~
rrr)arrI
511 5 IO IL Sa SOT:3
I R 5 r 50 5 ASC D
LEE DwG co7 foR IKTh)LoF DAYITAss".T
IIls COIT Sh SIG CATOlls Slt SILICOIIL RUBBER ~NS b50 .'LAI13 BTlls'O'St shl14 G47 =
lls C ll—SA'5IG C AGO
IOT
'5
sn 5 TYR TOINCNDS$
sn.tsn5 (TTR)
, BFS
50't
IL)k i'BNS. EXBF3. 51'.
BNS 50BFS
50'NS
Sl'FS.
ts, ~
0
0a cm
El)
X 2'.ycP0) rE.'Tfl
~~mI hs O
XIIll
0
OK
ID
4
O p'z—Q
g
IN
)IL
E St IfTHOL'CS COSTA(tDTO STIADDLt E,
PL
LCCDWO511 DETAlLFFOR WCLDIMG IINAPCCTIONS
QWIE„'I .$SN'ICE STTTEC
MTTTDI'fkffffTILS Tf 5'5 TBI4 ffffllTOCTTONC SfflTT.sflfjfOT,
QHhFTERIIACII
CN. ALIOVL
Sll I
DETAIL B
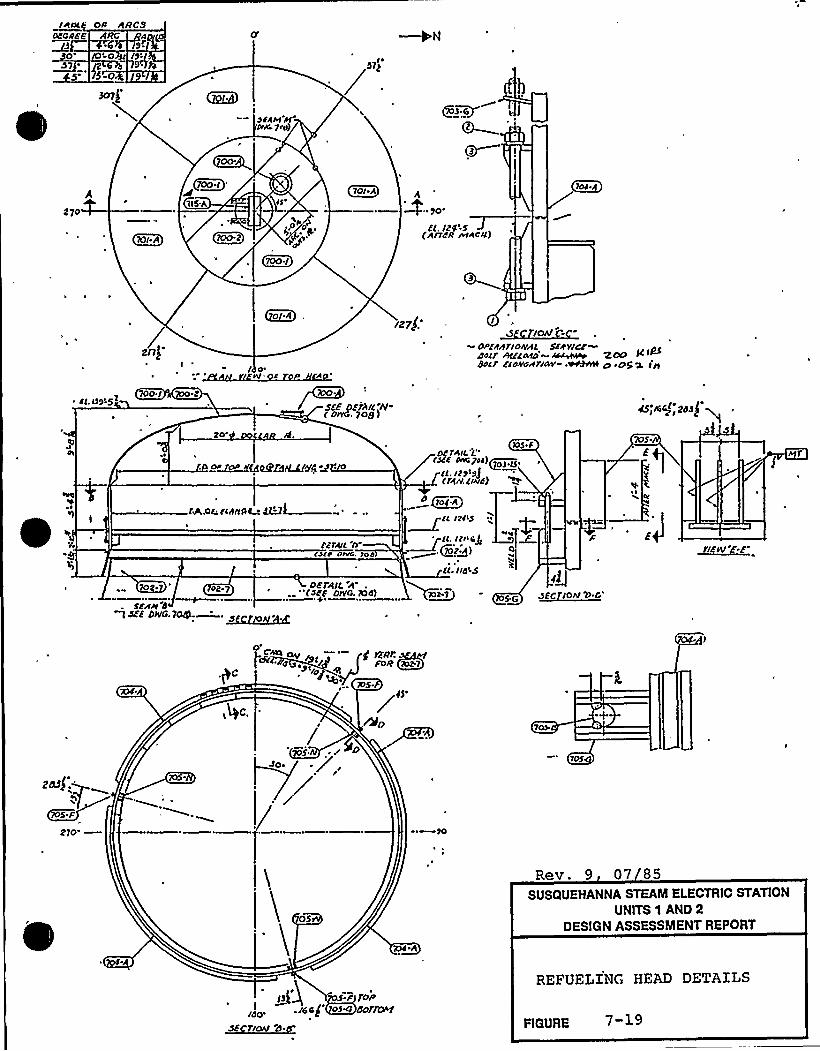
/auld os ARCS
0'7
S
ARC
! 0
NO
A/9"-
/9$
OI.
ga~6 I
(2i(aa
270
lOI A
70I A A
+-9o'l./24'S
(ArrdR MAo/I)
«. /99957
/ o'.F / CAD
700./ 'bX7 ~
st Dfr/Ill'll"I /Iwe. 7og)
I/O
» DPf/I/Irlo/IAl SfPVICf»/Idrr ///Ifto/Ir/»~ '2OOdoer fro/ro/rlcw wBVAI/9 A+5 ~ j/)
igql/ 2db
20'O
Od~&P NE~~+g~/gC~~b
D5 FDfrAIC
I.'iff~gdl)~5<,ll. IZ9'9)(rb//. I/A/b)
4$ .
702
t&aa fCAIIII~ d.U)-
od 7
c'fry ncore o~~lod
DE')A/l A"(off DI20. )Ob)+
~lof«4~rt /2Ã5
'/ ll, lr/'6$-—l. /702:/))
ll~ IId9S
J~EC ION D f
~1IEIII E''Sfa/I b
)sfb D'+ 7'+—'—~s).~i~
,Qc.
2)0'ev. 9 0 '7 8 5
SUSQUEHANNA STEAM ELECTRIC STATION
UNITS 1 AND 2DESIGN ASSESSMENT REPORT
Qp) ~//c,i.-/6+j'>~
~sE 7/o//~
REFUELING HEAD DETAILS
FIGURE
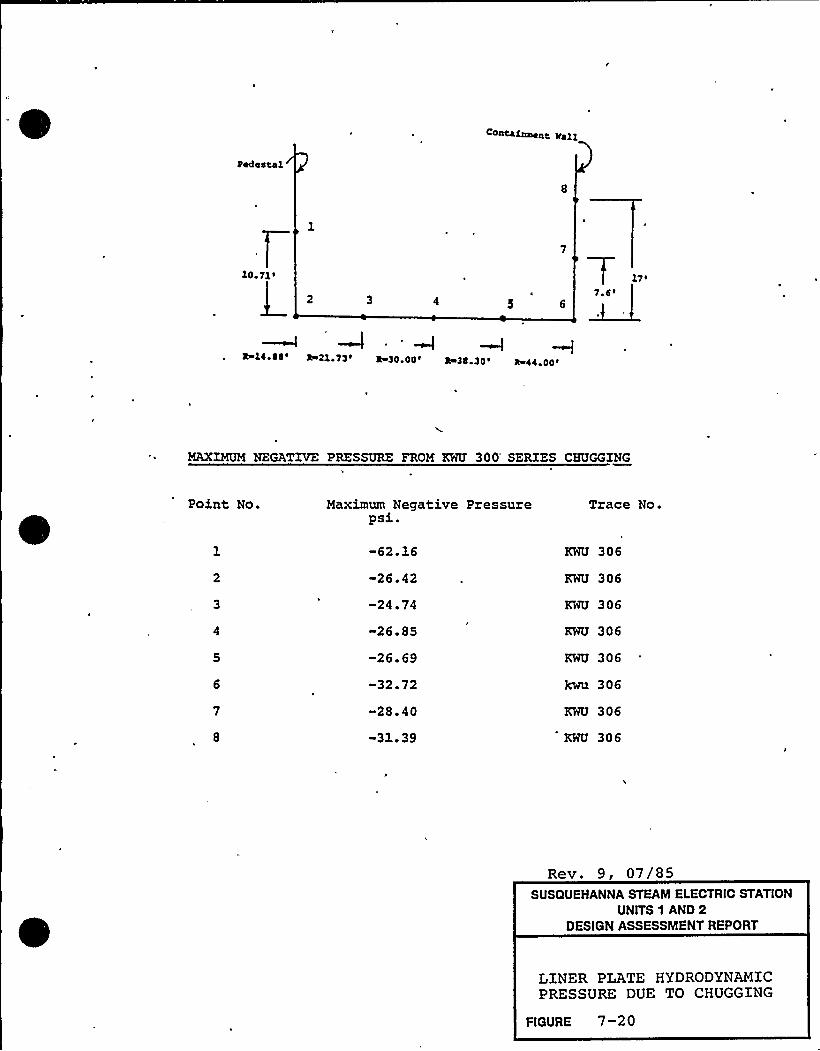
Pedestal
10.Pl ~
L&l4~ 44 b+4lo7) &)0~ 00 &l4 SO Ri+44 ~ 00
MAXIMUMNEGATIVE PBESSURE FROM KWU 300'ERIES CHUGGING
Point No. Maximum Negative Pressurepsi.
Trace No.
-62.16
-26.42
-24.74
-26.85
-26.69
32 ~ 72
«28.40
-31.39
KWU 306
KWU 306
KWU 306
KWU 306
KWU 306
kwu 306
KWU 306
KWU 306
Rev. 9, 07/85SUSQUEHANNA STEAM ELECTRIC STATION
UNITS 1 AND 2DESIGN ASSESSMENT REPORT
LINER PLATE HYDRODYNAMICPRESSURE DUE TO CHUGGING
FIGURE 7-20
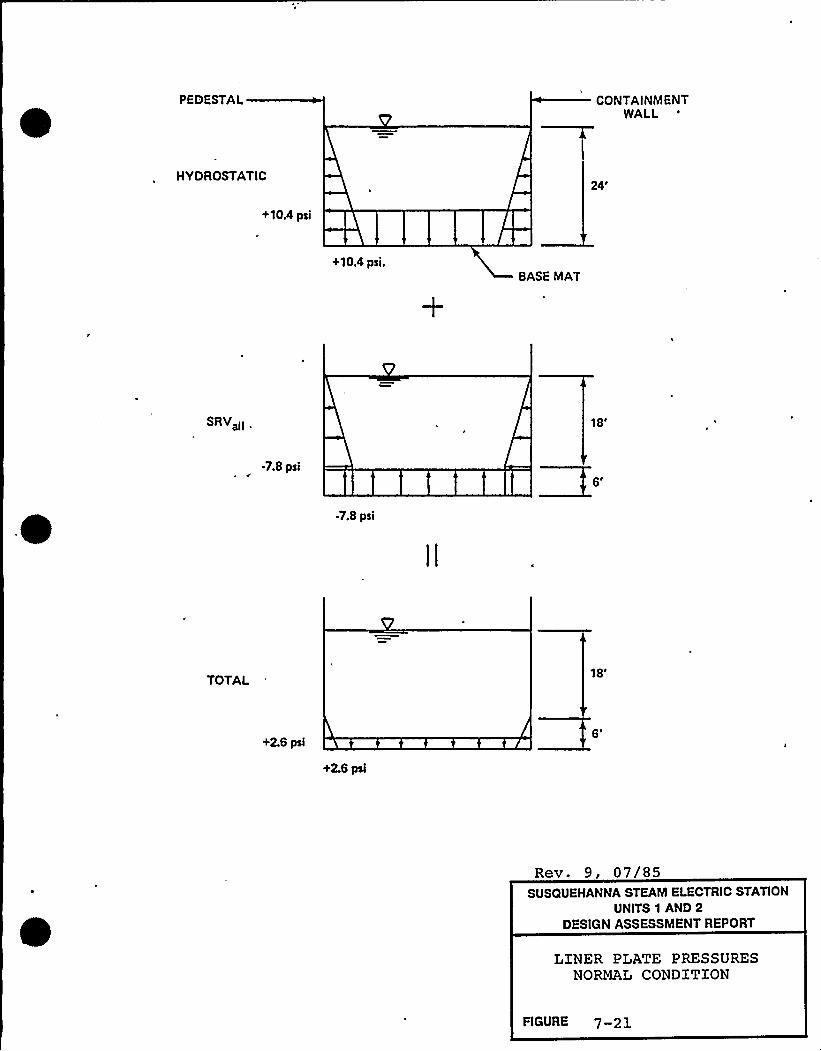
PEDESTAL CONTAINMENTWALL
HYDROSTATIC
24'10.4
psi
+10.4 psi.BASE MAT
SRV II „ 18'
7.8 psi
6'7.8
psi
TOTAL
18'2.6
psi
+2.6 psi
Rev. 9, 07/85SUSQUEHANNA STEAM ELECTRIC STATION
UNITS 1 AND 2DESIGN ASSESSMENT REPORT
LINER PLATE PRESSURESNORMAL CONDITION
FIGURE 7-21
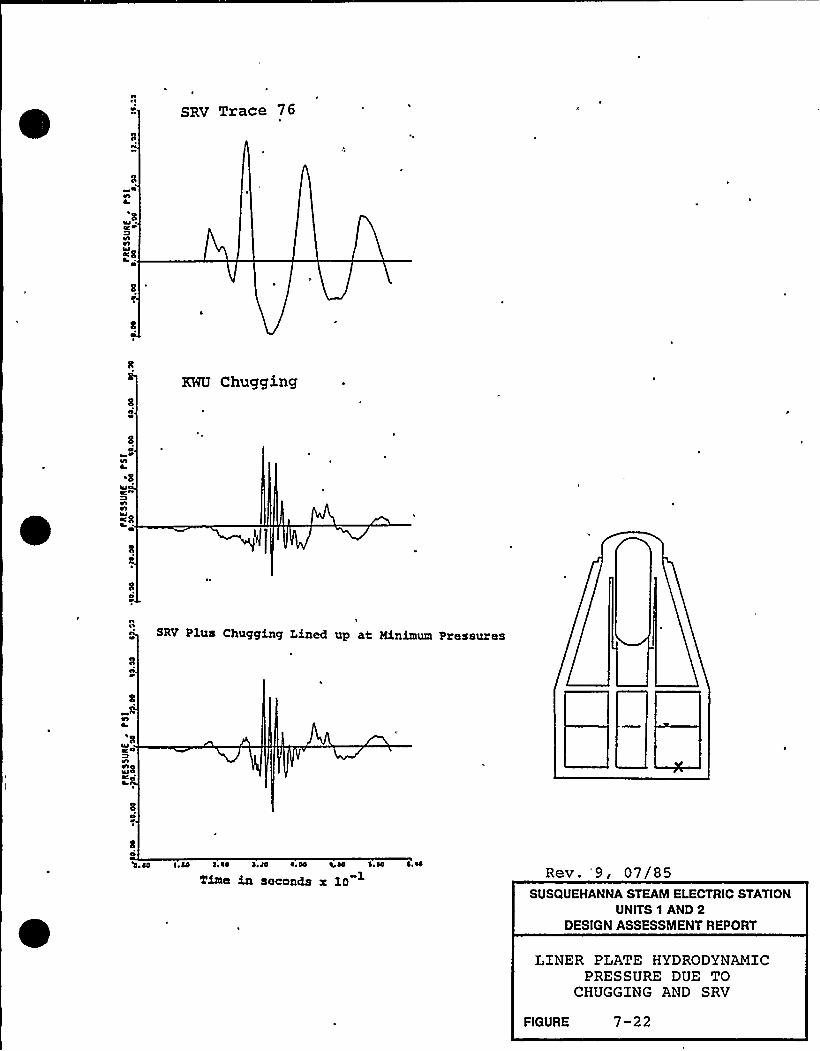
SRV Trace 76
~ OOI
IO O
~OOI4JI4 CI
KWU Chuggj.~g
Or4
~ II
OIn~S
OI'ISRV P1us Chugging Lined up at Minimum Pressures
OOIOOIOIUO4:e4
'0.00 !.00 0.40 0.& ~ .04 +00 0.00 0.40
Time in seconds x 10Rev. '9, 07/85
SUSQUEHANNA STEAM ELECTRIC STATIONUNITS 1 AND 2
DESIGN ASSESSMENT REPORT
LINER PLATE HYDRODYNAMICPRESSURE DUE TO
CHUGGING AND SRV
FIGURE 7-22
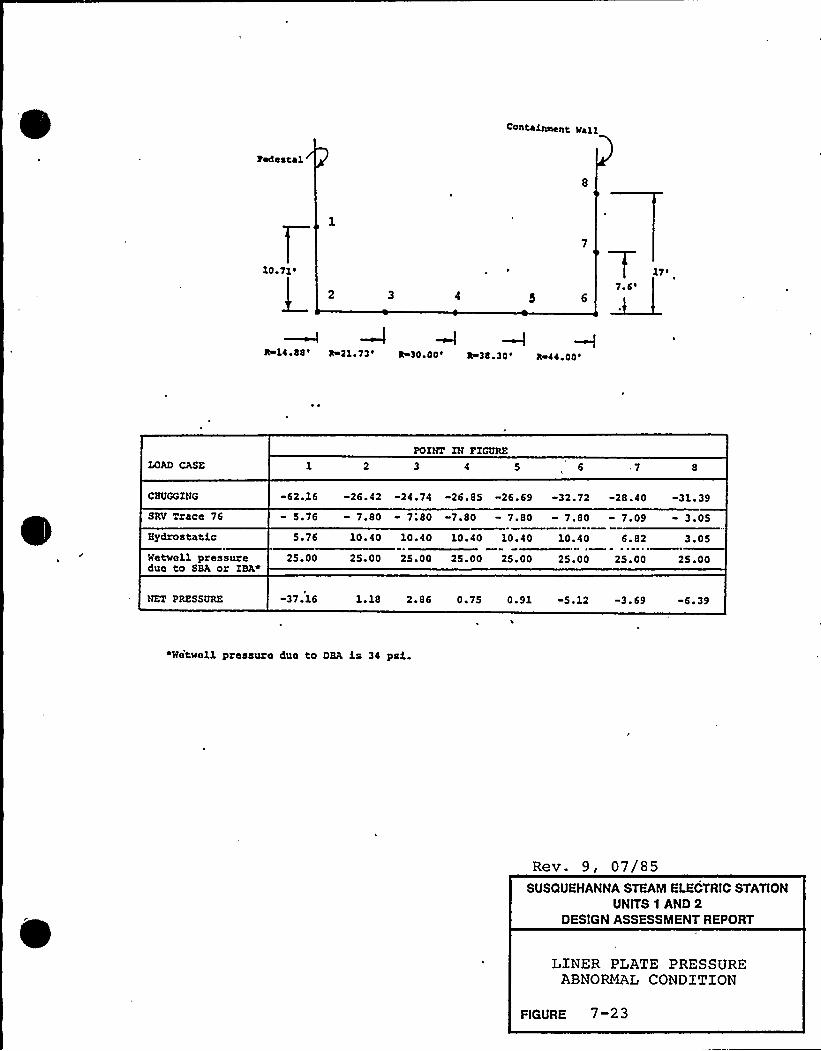
Contaimseat wail
Pedestal
LR 14.88' 21.73 ~ a 30.00'-38.30 ~ a 44.OO
POINT IN FIGURE
1 2 3 7
CHUGGING
SRV Trace 76
Hydrostatic 5.76 10 40 10.40 10.40 10.40 10.40 6 '2
-62.16 -26 42 -24.74 -26.85 -26.69 32.72 "28.40- 5.76 - 7.80 7'80 -7.80 - 7.80 - 7.80 - 7 '9
31 ~ 39
F 05
F 05
Wetwell pressuredue to SBA or IBAs
25 ~ 00 25.00 25.00 25 ~ 00 25.00 25.00 25 ~ 00 25 ~ 00
NET PRESSURE 37.16 1.18 2.86 0 75 0.91 -Se12 -3 ~ 69 6 ~ 39
sWetwell pressure due to DBA is 34 psi.
Rev. 9, 07/85SUSQUEHANNA STEAM ELECTRIC STATION
UNITS 1 AND 2DESIGN ASSESSMENT REPORT
LINER PLATE PRESSUREABNORMAL CONDITION
FIGURE 7-2 3
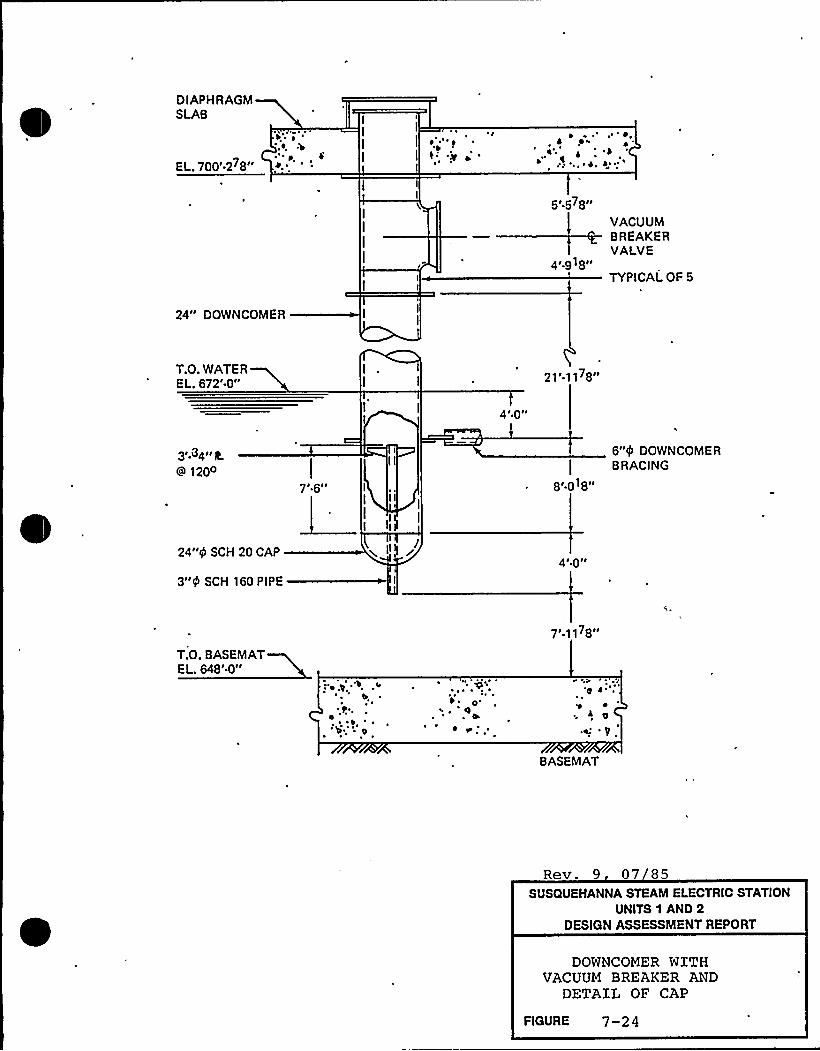
DIAPHRAGMSLAB
', ~~" ~ p
EL. 700'-278"
I
I i.'" t ''
5t 578II
VACUUMBREAKERVALVE
4 .918"TYPICALOF 5
24" DOWNCOMER
T.O. WATERE L. 672'-0" 21'-1178"
4I pl ~
3I 64tt gy 120o
24"IP SCH 20 CAP
3"0 SCH 160 PIPE
I
I II
I
I 4
II/
8.0'8"
4t pit
6"4 DOWNCOMER
BRACING
T.O. BASEMATEL. 648'-0"
p''
'.t'."b 'p
7'-1178"
4'
l g~w 'P
BASEMAT
Rev. 9 07 85SUSQUEHANNA STEAM ELECTRIC STATION
UNITS 1 AND 2DESIGN ASSESSMENT REPORT
DOWNCOMER WITHVACUUM BREAKER AND
DETAIL OF CAP
FIGURE 7-2 4
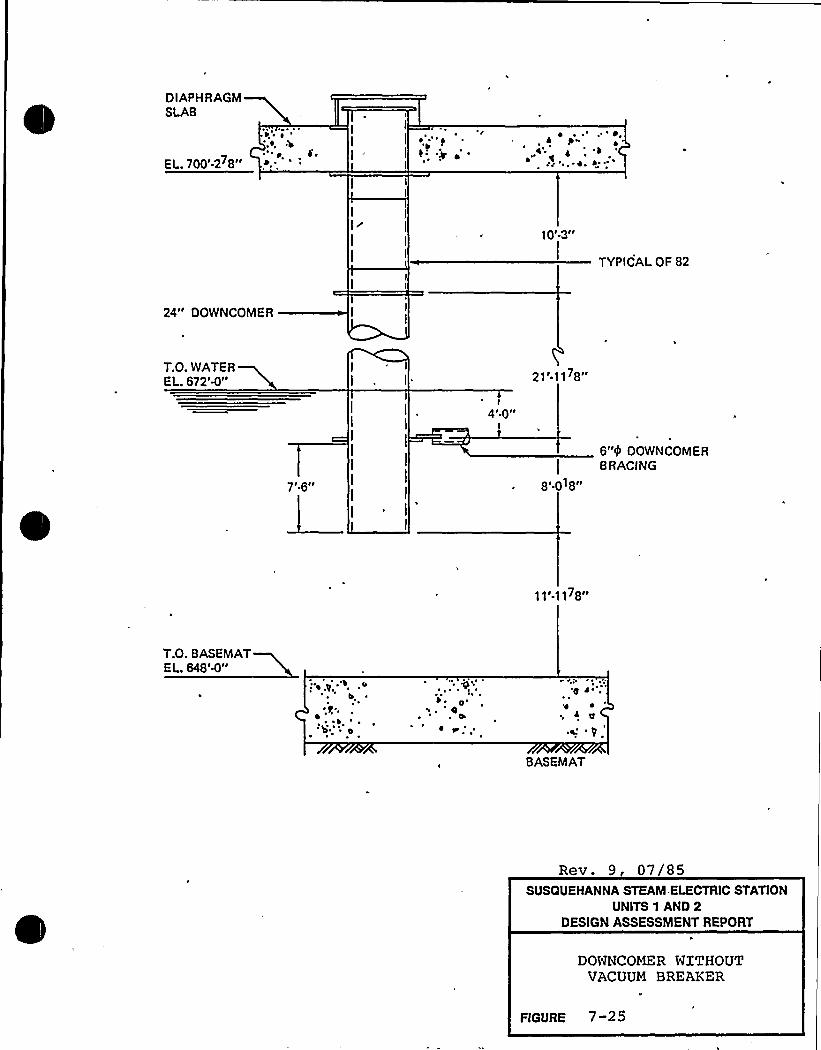
DIAPHRAGMSLAB
',0,
EL. 700'-278"
I
I
I
I
J pia'
~"
IIrI
I
3lt10'.
TYPICALOF 82
24" DOWNCOMER
T.O. WATEREL. 672'-0"
I
I . I.
I
I
I
I
I
II'
I4I 0tl
21'-1178"
8'.018"
6"0 DOWNCOMERBRACING
178"
T.O. BASEMATE L. 648'-0"
J
'g .o
~,
.e ~ ""J g
~s.'P
BASEMAT
Rev. 9, 07/85SUSQUEHANNA STEAM ELECTRIC STATION
UNITS 1 AND 2DESIGN ASSESSMENT REPORT
DOWNCOMER WITHOUTVACUUM BREAKER
RGURE 7-25
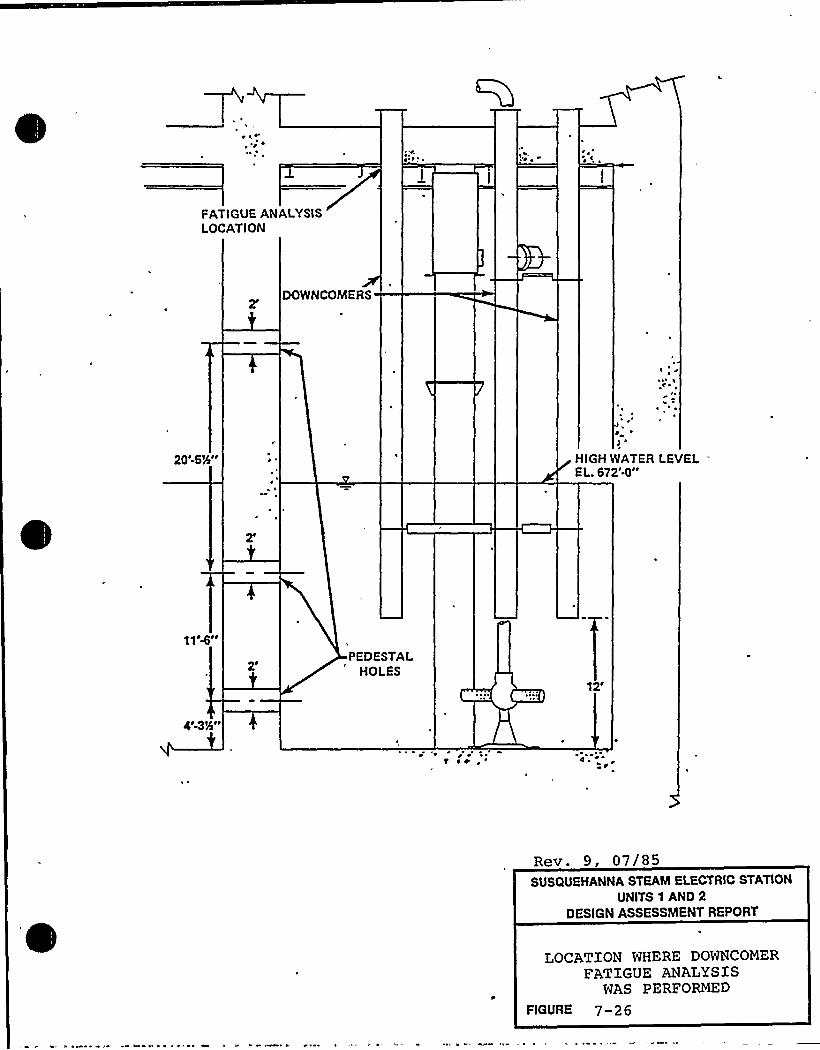
q ~ P
FATIGUE ANALYSISLOCATION
DOWNCOMERS
20'-SN HIGH WATER LEVELEL. 6?2'4
gg'+I ~
2'EDESTALHOLES
12''4N"
t ~ e' ~
Rev. 9, 07/85SUSQUEHANNA STEAM ELECTRIC STATION
UNITS 1 AND 2DESIGN ASSESSMENT REPORT
LOCATION WHERE DOWNCOMERFATIGUE ANALYSIS
WAS PERFORMED
FIGURE 7-26
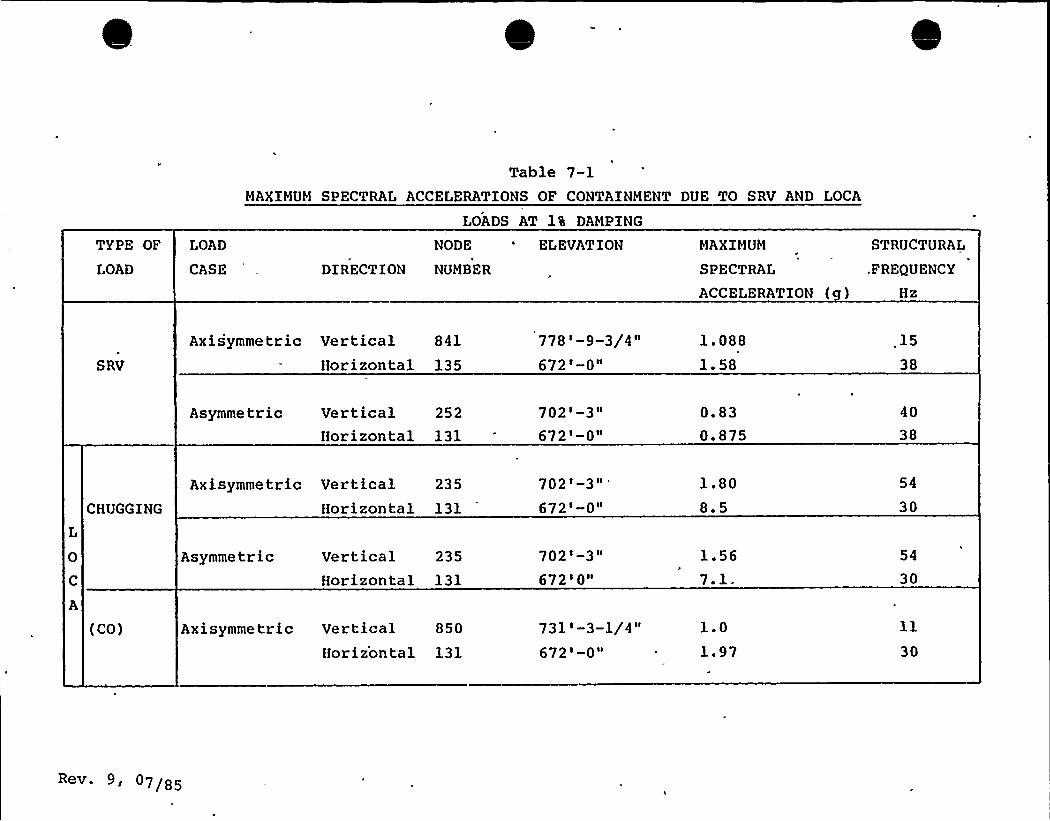
Table 7-1MAXIMUM SPECTRAL ACCELERATIONS OF CONTAINMENT DUE TO SRV AND LOCA
LOADS AT 1% DAMPING
TYPE OF
LOAD
LOAD
CASE
NODE ~ ELEVATION
DIRECTION NUMBER
MAXIMUM
SPECTRAL
ACCELERATION ( )
STRUCTURAL
FREQUENCY
Hz
SRV
Axisymmetric Vertical 841
Horizontal 135
778'-9-3/4672'-0
1 '881 ~ 58
15
38
Asymmetric Vertical 252 702'-3Horizontal 131 672'-0
0 ~ 83
0 '7540
38
CHUGGING
Axisymmetric Vertical 235
Horizontal 131
702'-3672'-0
1 ~ 80
8 ~ 5
54
30
Asymmetric Vertical 235
Horizontal 131
7020-367210
1 ~ 56
7 '54
30
(CO) Axisymmetric Vertical 850
Horizontal 131
731'-3-1/4672'-0
1 ~ 0
1 ~ 97 30
07/85
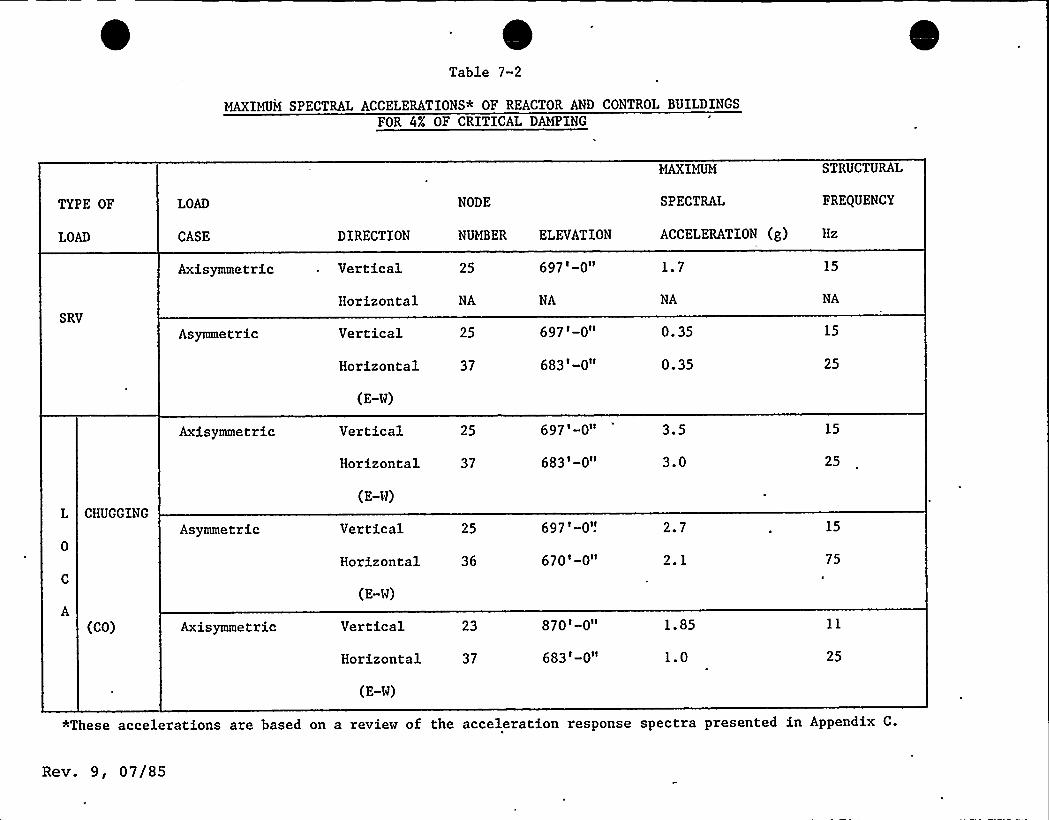
Table 7-2
MAXIMUMSPECTRAL ACCELERATIONS* OF REACTOR AND CONTROL BUILDINGSFOR 4% OF CRITICAL DAMPING
TYPE OF LOAD NODE
MAXIMUM
SPECTRAL
STRUCTURAL
FREQUENCY
LOAD CASE DIRECTION NUMBER ELEVATION ACCELERATION (g) Hz
Axisymmetric Vertical 25 697'-0" 1.7 15
SRV
Horizontal NA NA NA NA
Asymmetric Vertical
Horizontal
(E-W)
25
37
697'-0"
683'-0"
0. 35
0.35
15
25
Axisymmetric Vertical 25
Horizontal 37
697 '-0"
683'-0"
3.5
3.0
15
25
A
CHUGGING
(CO)
Asymmetric
Axisymmetric
(E-W)
Vertical 25
Vertical 23
Horizontal 37
Horizontal 36
(E-W)
697'-0"
670'-0"
870'«0"
683'-0"
2.7
2.1
1.85
1.0
15
75
25
(E-W)
*These accelerations are based on a review of the acceleration response spectra presented in Appendix C.
Rev. 9, 07/85
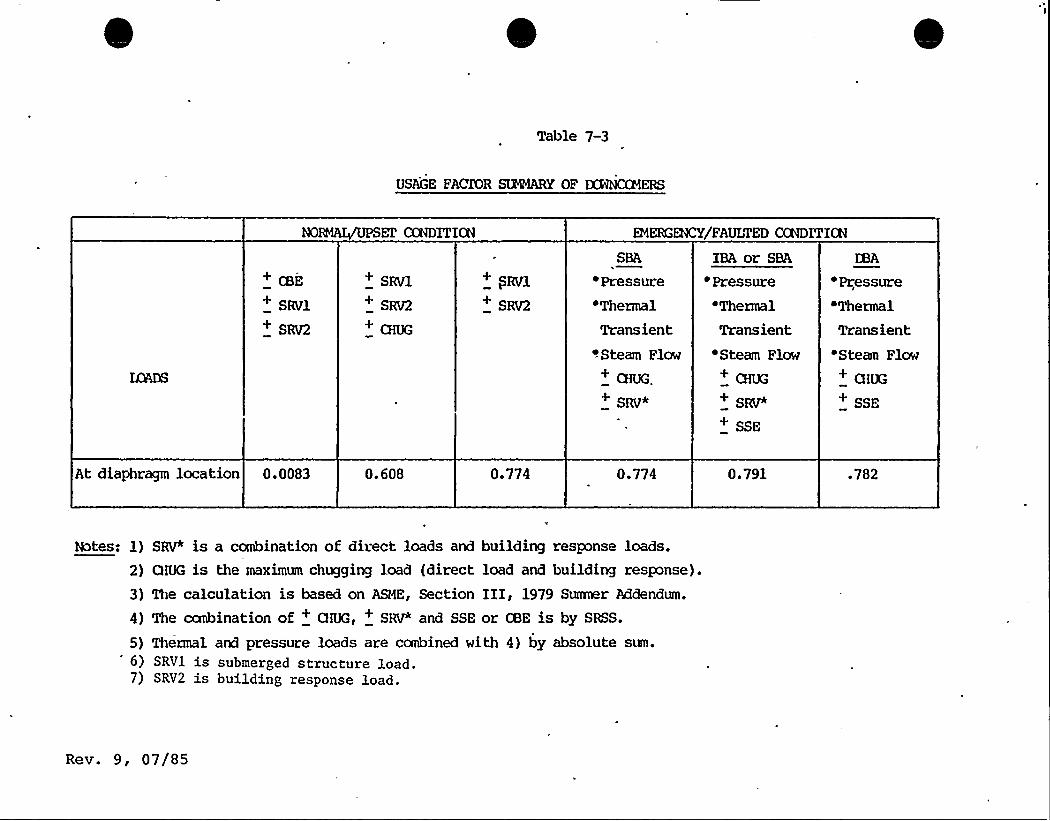
Table 7-3
USAGE FACIOR St%MARY OF DCNNKHERS
EMERGENCY/FAULTED CCNDITICN
+ CBE
SRVl+ SRV2
+ SRVl
SRV2
+ ama
SEA
Pressure
Thermal
Transient-Steam Flow+ CHUG,
+ SRV*
IEA or SEA
'ressure'Thermal
Transient'Steam Flow
+ CHUG
SRV
SSE
KBA
'Pressure~Thermal
Transient'Steam Flow
+ Q<UG
SSE
At diaphragm location 0.0083 0.608 0.774 0.774 0.791 .782
Notes: 1) SRV is a combination of direct loads and building response loads.
2) QEG is the maximum chugging load (direct load and building response).
3) The calculation is based on ASME, Section III, 1979 Swaer Addendum.
4) The canbination of + QIUG, + SRV and SSE or CBE is by SRSS.
5) Thermal and pressure loads are combined with 4) by absolute sum.6) SRV1 is submerged structure load.7) SRV2 is building response load.
Rev. 9, 07/85
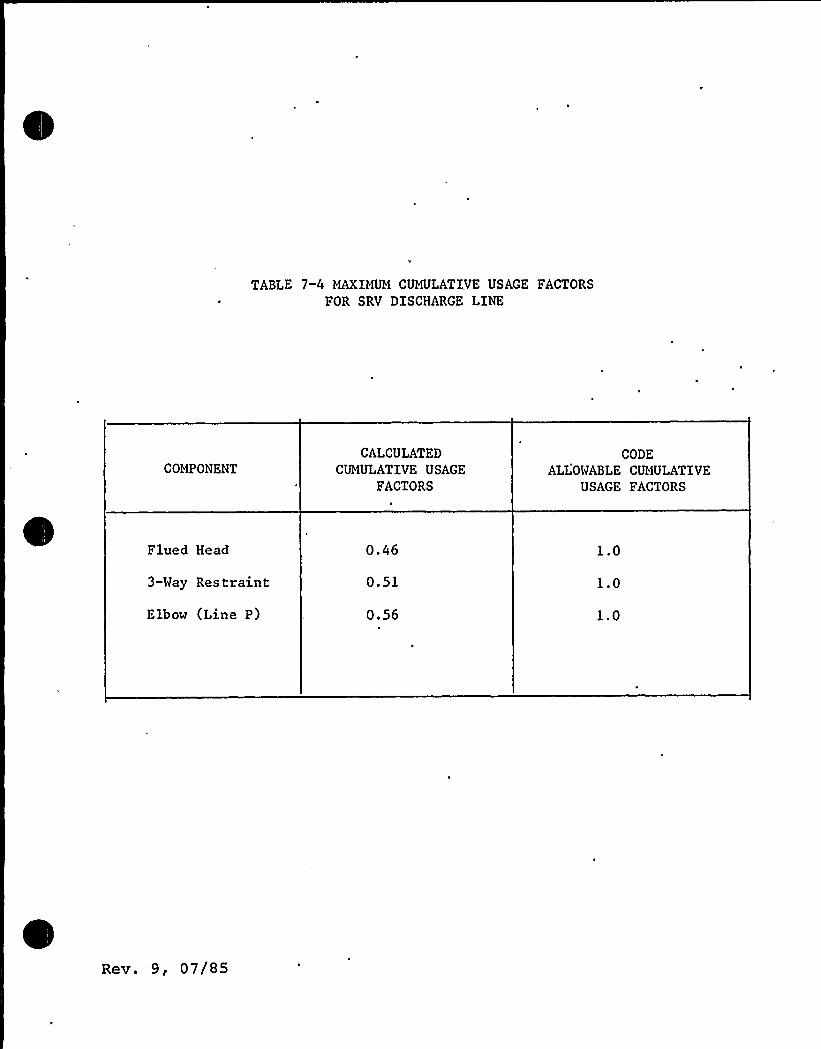
TABLE 7-4 MAXIMUM CUMULATIVE USAGE FACTORS
FOR SRV DISCHARGE LINE
COMPONENTCALCULATED
CUMULATIVE USAGEFACTORS
CODE
ALLOWABLE CUMULATIVEUSAGE FACTORS
Flued Head
3-Way Restraint
Elbow (Line P)
0.46
0.51
0.56
1.0
1.0
1.0
Rev. 9, 07/85
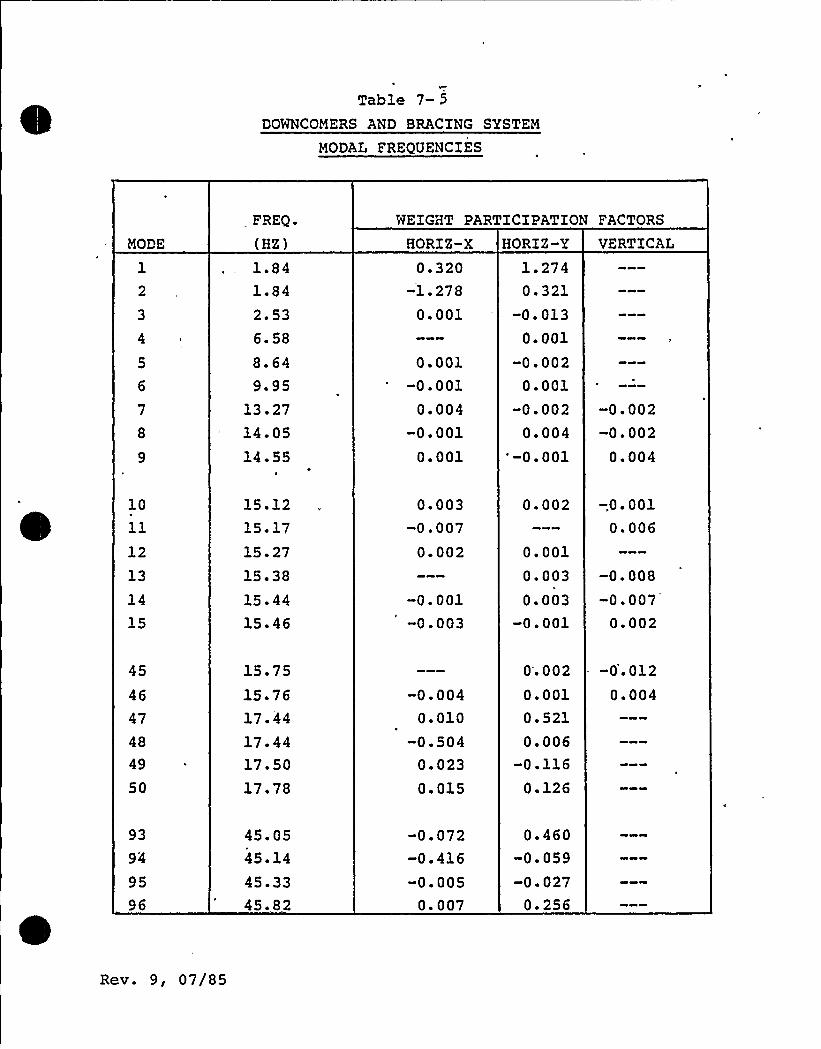
Table 7- 5
DOWNCOMERS AND BRACING SYSTEM
MODAL FREQUENCIES
MODE
FREQ.
(HZ) HORIZ-X HORIZ-Y VERTICAL
WEIGHT PARTICIPATION FACTORS
4
1 ~ 84
1 ~ 84
2. 53
6. 58
8 '49.95
13. 27
14-0514.55
0.320-1.278
0.001
0.001-0.001
0.004-0.001
0 F 001
1.2740.321
-0.0130 F 001
-0.0020.001
-0.0020.004
'-0.001
-0.002-0.002
0.004
10
ll12
13
14
15
15.1215.1715.2715.3815.4415 '6
0 003-0.007
0.002
-0. 001-0.003
0.002
0.0010 '030.003
-0.001
—,0.001
0.006
-0.008-0.007
0.002
45
46
47
48
49
50
15 '515.7617.4417.4417.5017.78
-0.0040.010
-0.5040 '230.015
0.0020.0010.5210.006
-0.1160.126
- -0.0120.004
93
94
95
96
45 '545.1445.3345 '2
-0 '72-0.416-0.005
0.007
0.460-0-059-0.027
0.256
Rev. 9, 07/85

CHAP'XZR 8
SSES~UEHCHER VFRXFiCATICN TFST
See Proprietary Section 8 0.
Re v. 9, 07/85 8-1
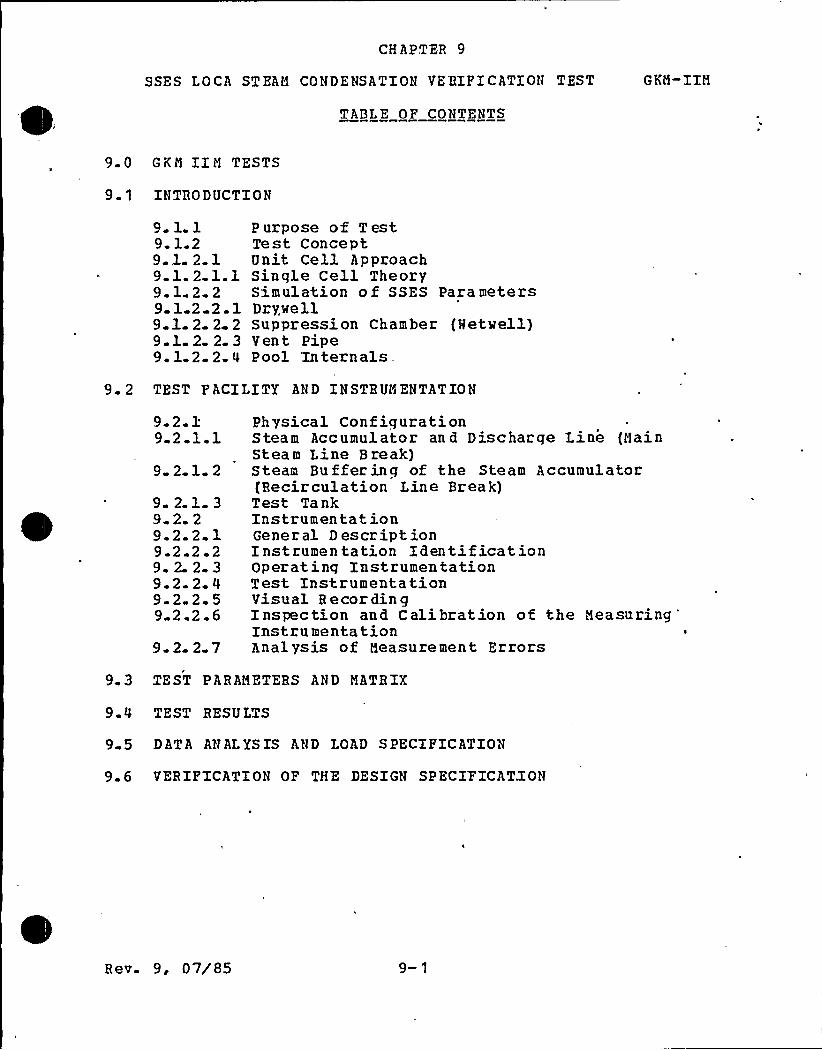
CH APTER 9
SSES LOCA STEAM CONDENSATION VERIFICATION TEST GKH-IIM
TABLE OF CONTFNTS
9-0 GKH IIH TESTS
9. 1 INTRODUCTION
9 1.19.1 29-.1. 2 19.1.2 1.19. 1.2 29 1 2 2.191 2.2 29 1 2 2 39.1 2 2 4
Purpose of TestTest ConceptUnit Cell ApproachSingle Cell TheorySimulation of SSES ParametersDrywellSuppression Chamber (Metvel1)Vent PipeP oo1 In tern als
9 2 TEST FACILITY AND INSTRUMENTATION
9.2.3:92 119-2-1-2
9 2.1. 39 2.29.2. 2 19-2 2 29. 2 2.39.2. 2 49.2 2 592269 2 2 7
Physical Conf igurationSteam Accumulator and Discharge Line (HainSteam Line Break)Steam Buffering of the Steam Accumulator(Recir culation Line Brea k)Test TankInstrumen tat ionGeneral DescriptionInstrumentation IdentificationOperat ing Instrumen tationTest InstrumentationVisual R ecor din gInspection and Calibration of the Measuring
'nstrumentation
Analysis of Measurement Errors
9 3 TEST PARAMFTERS AND MATRIX
9 4 TEST RESU LTS
9 5 DATA ANALYSIS AND LOAD SPECIFICATION
9 6 VERIFICATION OF THE DESIGN SPECIFICATION
Rev. 9, 07/85 9-1
CH APT ER 9
FIGURES
lou mber- Title9-1 T est Stand Sche ma tic Diag ram
9-2 Test Tank
9-3
9-4
9-6
9-6
9-7
9-7 a
9-8
9-9
9-10
9-11
9-12
Coordinate System and Test Instrumentation
Test Instrumentation
G KM-III Condensation Tests Instr umentation
GKM-IIM Condensation Tests Bracing Configuration
DATA Recording: S chemat ic Bloc R Diag ram
Bracing Design
Quencher Dummy
I-Beam Design
Data Recording: SchematicBlock Diagr am
Calibration of the Sensors and Registration Instruments
Time Intervals for Calibrations, Checks and Adjustments
9-13 'alibration System
9-14 Physical Calibration of the Pressure TransducersP6.1...P6.8 by Lowering of the Rater Level in the Pool
9-14a Calculated SSES Vent Steam Mass Flux vs.Time — RCL Break.
9-14b Calculated SSFS Vent Mass Flux vs. Time — FullMSL Break
Figures 9-15 thru 9-291 are contained i.n the ProprietarySupplement.
Rev 9 ~ 07/85 9-2
C'fl A PTHH 9
TABT,F,S
Number
9-1
9-2
9-3
TitleCompa rison of FixecL Par am eters
Opera t in@ Instr umenta tion
Test Instrumentation
GKH II-i0 Test Natrix
Test Parameter
Tables 9-.6 thru 9-14 are contained in the Proprietary Supplement.
Rev. 9, 07185
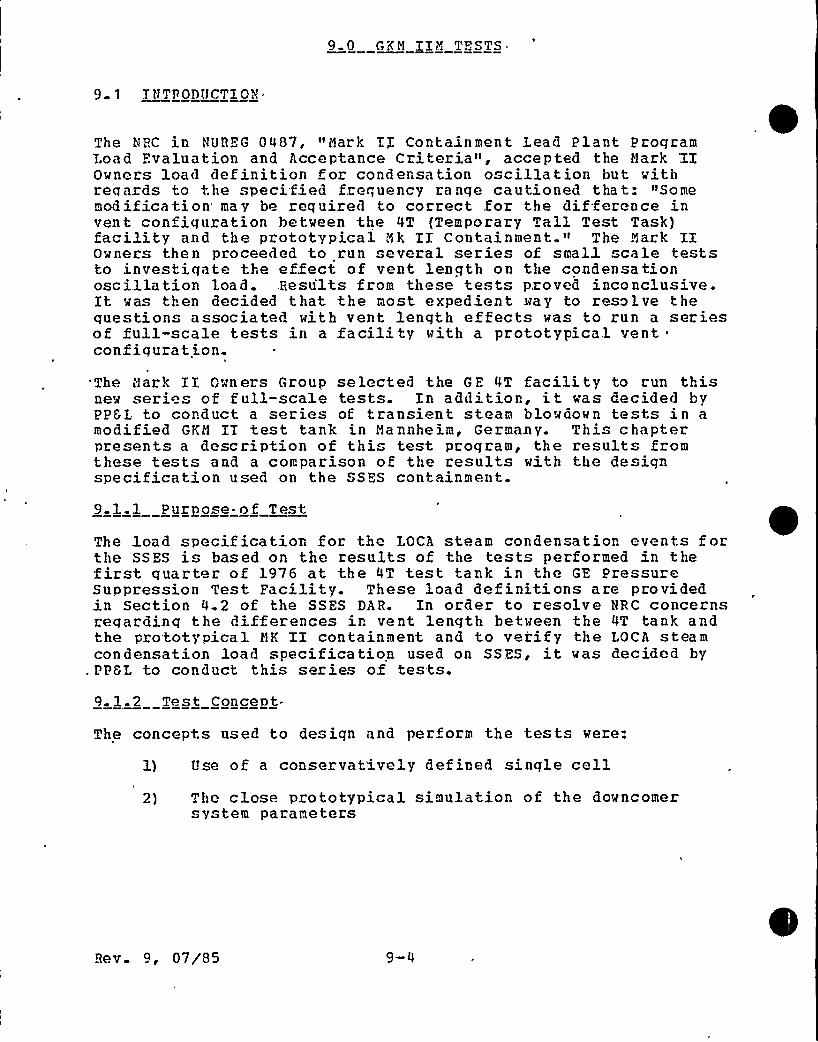
9 0 GÃN JIM TESTS
9 1 TNTPODUCYIOÃ.
The HHC in NUBEG 0487, "Mark XX Containment Lead Plant ProgramLoad Evaluation and Acceptance Criteria", accepted the Nark 'IIOwners load definition for condensation oscillation but withreqazds to the . pecified frequency range cautioned that: »Somemodification may be required to correct for the difference invent configuration between the 4T (Temporary Tall Test Task)facility and the prototypical Mk II Containment." The Nark IIOwners then proceeded to run everal series of small scale teststo investigate the effect of vent length on the condensationoscillation load.,Results from these tests proved inconclusive.It was then decided that the most expedient cay to resolve thequestion associated with vent lenqth effects was to run a seriesof full-scale tests in a facility with a prototypical ventconf iqurat ion.
The Mark II Owners Group selected the GE 4T facility to run thisnew series of full-scale tests. In addition, it was decided byPPGL to conduct a series of transient steam blowdown tests in amodified GKM IT test tank in Mannheim, Germany. Thi" chapterpresents a description of thi test program, the result fromthese tests and a comparison of the results with the de ignspecification used on the SSES containment.
The load specification for the LOCA steam condensation events forthe SSES is based on the results of the tests performed in thefirst quarter of 1976 at the 4T test tank in the GE PressureSuppression Test Facility. These load def initions are providedin Section 4.2 of the SSES DAR. In order to resolve HBC concernsreqardinq the differences in vent length between the 4T tank andthe prototypical MK II containment and to verify the LOCA steamcondensation load specification used on SSES, it was decided by
. PPGL to conduct this series of tests.9. 1.2 Test Conceot-
The concepts used to de" ign and perform the tests were:
1) Use of a conservatively defined single cell2) Tho close prototypical simulation of the downcomer
system parameters
Hev. 9, 07/85
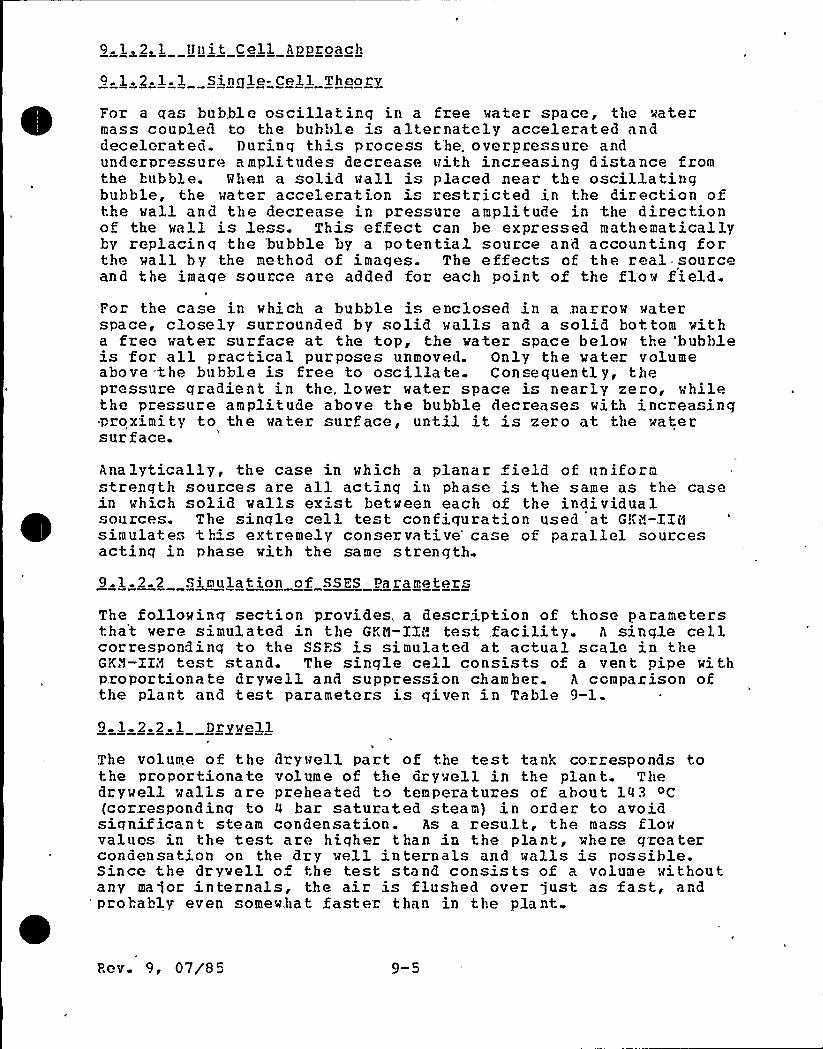
9. 1. 2. 1 Urr it Cell Approach
9.1.2.1 1 Single-Cell Theory
For a qas bubble oscillatinq in a free water space, the watermass coupled to the bubble is alternately accelerated anddecelerated. Durinq this process the. overpcessure andunderpcessuce amplitudes decrease with increasing distance fzomthe hubble. When a solid wall i placed near the oscillatingbubble, the water acceleration is restricted in the direction ofthe wall and the deczease in pressure amplitude in the directionof the wall is less. This effect can be expressed mathematicallybv replacinq the 'bubble by a potential soucce and accounting focthe wall by the method of imaqes. The effects of the real sourceand the imaqe source are added for each point of the flow field.For the case in which a bubble is enclosed in a marrow waterspace, closely surrounded by solid walls and a solid bottom witha free water surface at the top, the water space below the 'hubbleis for all practical purposes unmoved. Only the water volumeabo ve t he bu bbl e is free to osc illate C on se quen tly, t hepressure gradient in the. lower water space is nearly zero, whilethe pressure amplitude above the bubble decreases with increasingproximity to the water surface, until it is zero at the watersur face.
Analytically, the case in which a planar field of uniformstrength sources are all acting in phase is the same as the casein which solid walls exist between each of the individualsources. The single cell test configuration used at GKH-IIHsimulate". this extremely conservative'ase of pazallel sourcesactinq 'in phase with the same strength.9.1.2 2 Simulation of SSES Parameters
The followinq section provides, a description of those parametersthat were simulated in the GKH-IIP. test .facility. A single cellcorrespondinq to the SSFS is simulated at actual scale in theGK,'f-IIA test stand. The single cell consists of a vent pipe withproportionate drywell and suppression chamber. A comparison ofthe plant and test parameters is qiven in Table 9-1.
9 1 2.2.1 Drywell
The volume of the drywell part of the test tank corzesponds tothe proportionate volume of the dzywell in the plan t. Thedrywell walls are preheated to temperatures of about 143 OC
(corresponding to 4 bar saturated steam) in order to avoidsiqnificant steam condensation. As a resu.lt, the mass flowvalues in the test are hiqher than in the plant, where greatercondensation on the dry well internals and walls is possible.Since the drywell o the test stand consists of a volume withoutany major internals, the aic is flushed over just as fast, andprobably even somewhat faster than in the plant.
P.ev. 9, 07/'8 5
9.1.$ . 2.2 Suppression Chamber ~Metwell)
Iike the drywell volume, the free air volume of the suppres ionchamber also corresponds to the proportionate value in the plant.As a result, the pressure build-ups in the tost tank and in theSSHS containment are equal.
The ratio of surrounding water surface to the cross-sectionalarea of the vont pipe varies in the plant as a function of thepipe s position. Theoretical and expel.mental investigationsshow that the condensation loads decrea e with increasing arearatio. Therefore, the sinqle cell with the smallest area ratioat the containment wall was simulated in the test stand. Itsarea of 3. 77 m~ (40 7 ft.~) is clearly less than the mean valuein the SSES (5. 64 m~); 60.7 ft. ~. This adds considerableconservatism to loads measured in the test stand.
Due to the decreased volume of water relative to the mean valuein the plant, there is a greater heatinq of the water in thesuppression chamber duri.ng the testy than would be expected inthe pla n t.The volume flexibility of the suppression chambe.r walls is lessthan or equal to the plant value of 0.6 x 10 ~ m>/bar (37.2in~/bar) relative to the single cell.9.1.2 2.3 Vent Pipe
The vent pipe has practically the same Qimen ions and the samedistanco from the bottom as in the p1ant. Previous test seriesand also theoretical considerations have shown that thecondensation loads vary somewhat with t'e subme'rgence depth ofthe pipe.
For small submergence depths,'he loads first increase rapidlywi'th increasing depth and then approach a limiting valueasymptotically. Therefore, the tests are performed at. thehighest value of submerqence depth, 3.66 m (12 f t), occurring inthe pla.n t.The vent pipe braces have a stiffness greater than or equal tothe maximum value of 770 x 3.0~ H/m (4386 kips/in) occurring inthe pla'nt and are located at the same position as in the plant.
9.1. 2. 2. 4 - Pool- Internals
To be able to determine the load on a perforated-pipe quencher othe depressurization system located near the vent pipe in thesuppression chamber during the condensation processes, a quencherarm having the actual dimensions is installed in the test tank.The quencher arm wi th central member is welded to the innercylinder in the pool at a distance of l.l m from the bottom.
Pev. 9, 07/85 9-6
To determine the vertical loads produced by the condensation onsteel structures in the water reqion, an I-beam (ASCI ! 10 x Q5)is arranqed horizontally between the vent pipe outlet and thepool surface (6.3' from the bottom).
Bev- 9, 07/85
9-2 ~ Tt".. T FACILITy AND .I NSTRJJ.":FN ATION
9 2.1 Physical Configuration
The test configuration as constructed .is typically illustrateddiaqcammatically in Figuce 9-1. The entire test system consistsof:
The steam accumulator (GKN Designation: CondensateAccumulator S 6),
The arranqement for steam buffering of the steamaccumulator (GKH Designation: Feedwater Tank 3202),and
The actual .Test Tank (GKtl Designation: CondensateAccumulator S 3).
The test set-up simulates the pzessure suppression sy tern of thereactor plant in a so-called single cell (one vent pipe withproportionate drywell and suppression chamber) at actual scale.
r corn a tank (S 6) which is filled partially with satuzated steam(simulatinq the reactor pressure vessel), steam flows via 'a
discharqe line and flow orifice into the actual test tank (S 3)which is subdivided into a drywell and a suppression chamber.
9.2 1.1 - Steam Accumulator and Discharge Line ~Hain Steam LineBrea kl
The Condensate Accumulator S 6 in Shop I of GKH, with a capacityof. about 120 m~, is used to simulate the reactor pressure vesselin the test stand; see Figures 9-1 to 9-5. Bef ore test start,this accumulator is filled with water and steam in a saturatedcondition. The pressure is 20 'bac or less, depending on therequirement of the relevant tests.Between the accumulator S 6 and the actual test tank there ismounted an ND 400 pipe as a discharge line; cf. Figures 9.19.5. Located in this line is an isolating slide valve, quick-openinq valve and a standard orifice for flow-rate limitation inaccordance with the simulated break size. By using ocifices ofdifferent diameter and by specifyinq the pressure and waterfillinq of the condensate accumulator, the blowdown transient isset. Besides flow-rate limitation, the tandazd orifice is alsoused for flow-rate measurements.
Before test. start, the discharge line is sealed at the entranceinto the te t tank (S 3) by a rupture disk combination ND 400with support pressure (nitrogen) . The rupture disks expose theflow cross-section .in a few milliseconds at test stact.
He v. 9, 07/0 5
9.2.1.2 Steam Buffering of the Steam Accumulator ~RecirculationLine Break)
The blovdown from an assumed pipe break inside the containmenttBCI, break) results in a relatively hiqh level, short termconstant mass flow rate. However, using the test stand as set-upin Subsection 9.2.1.1 leads to a steadily decreasing mass flowrate.In'rder to simulate this situation under the given conditions ofthe test stand, the assignments of the individual tanks vaschanged so that tank B 202 vas used as the actual accumulator.The tank S 6 vas then used as a buf fer tank which is continuallyconnected to the GKN superheated-steam network. At the beginningof the test, this tank is connected directly to the dischargeline to the test tank. Within 10 to 20 seconds after test start,this connection is bcoken by means of a quick-closing valve inaccordance vith the prescribed mass flow rate variation and thetest proceeds as desczibed previously until pressure equalizationis achieved in tank B 202 and test tank S 3.
9.2.1.3 Test Tank
The condensate accumulator S 3 is used to simulate the SSHScontainment and i" constructed as shown in Figures 9-1 to 9-5.The uppec portion of the tank is the dryvell and the loverportion is a partiallv waterfilled suppression chamber. Thefollowinq volume subdivisions result:
Dcywell 'S 3 (with pipe portion of the suppressionchambec at high water level in the inner tank)Suppression chamber air space with completely filledannular qap and high water level in the inner tankt<atec filling of the inner tank in the S 3 athiqh wa tec le ve1
75. 6 m~
07 m3
26 m3
This subdivi ion conservatively simulates the SSES "single cell. «
The bottom of the drywell serves as the diaphcaqm .floor whece thevent pipe is attached. The vent pipe is identical in lenqth,diameter and wall thickness to the plant version.
In the lower part of the test tank, the simulated suppressionpool, a thick-walled inner cylinder made of steel, was installed.The installation of this inner cylinder satisfies tworequirements resultinq from the specified similarity to theplant. First, the water volume is reduced to simulate thesmallest plant single cell and second, the wall thicknes of 100mm re ults in a stiffne s which corzesponds to that of theconcrete walls in the plant. The vent pipe bracing stiffnes andlocation is very closely prototypical of the actual SSES as builtarrangement.
The partition vali between dcywell and suppcession chambez isprovided with swinq-check valves for protection of the test
Fev. 9, 07/85 9-9
stand. The "team inflow at the upper end o. the vent pipe issimulated in a representative manner by the installation of thecorrec't vent riser and jet deflector plate.
The drywell region of the test tank is provided. with anelectrical heatinq system on the outside wall. The initialtemperature of the wall and thus the condensation of steam insidethe drywell can thereby be controlled.Beside" comprehensive instrumontation, viewing ports are mountedon the test tank in the air reqion and water region of thesuppression pool, making it possible to observe the processeswith a television camera and high-speed cameras. To permit goodfilm quality, demineralized water is used to fill the suppressionpool
9.2.2 Instrunentation
Instrumentation is provided for controlling the test seguerrce,determininq the prescribed measurement quantities, and recordingthe m.
9.2.2.1 General Description
The instrumontation used in the GK ~-IIH test facility consists ofoperatinq instrumentation and, test instrumentation. The purposeof the operating instrumentation is to control the test sequenceand monitor the test stand. The test instrumentation ensures therecording ot all data of siqnifica'nce for evaluation of thephenomena which occur durinq steam condensation.
Details on the operatinq instrumentation are given in Subsection9.2.2.3. A detailed description of the test instrumentation canbe found in Subsection 9..2.2.4.
9. 2 2.2 Instrumentation IdentificationThe measurement transducers are identified by a system of lettersand numbers. Each identification starts with a letter or lettersdes crib inq t he type of tran sducer:
PTLDGSGILPLCAFOR
for Pressure Transducerfor Temperature Sensor (Thermocouple)for Water Level measurementfor T)i spla cemen t Gagefor Strain Gaqe.for Electrical Impulse Signalfor T.evel Probefor Load Cellfor Air Fractionfor Oxyqen Rate
Followinq these letters is a number which characterizes themountinq location or measurement location in the test stand. For
Be v. 9, 07/8 5 9-10

that purpose, the test stand is divided into different SystemGroups as follows (see Fig. 9-1):
System Group 1 steam lines to the accumulator 56 and to thefeedwater tank 8 202 anQ in the feedwatertank B 203
System Group 2
System Group 3
System Group 4
System Group 5
feedwater tank B 202
steam accumulator S6
steam supply to the test stand
instrumentation of the proportionate dr'ywellwith the vent pipe
System Group 6 suppression chamber
The System Groups 1-4 contain the operating instrumentatiorr,while qroups 5 and 6 designate the test instrumentation.
After this identification number there is a decimal point whichseparates this number from the running numbers of thetransducers
9.2 2.3 Operating Instrumentation
The purpose of the operatinq instrumentation (see Table 9-2,Figures 9-1, 9-3, and 9-4) is to monitor the steam accumulator,feedwater tank and steam lines. The signals from the. measurementtransducezs are read by a proces control computer and recorded.This computer is a part of the operatinq instrumentation. Alldata are stored on magnetic tape and can be printed out ozplotted af ter each test. Before test start, the process controlcomputer compares the recorded measurement signals withprescribed setpoint valves and prints them out. If themeasurement value Qiffers from the setpoint value by a prescribedpercentaqe, that measured value .is identified in the printout.The operat'nq instrumentation concentrates on the measurement ofpressures, temperatures and water 3evels in the steamaccumulator, steam lines and feedwater tanks.
9.2.2.4. Te t Instrumentation
The test instrumentation (see Table 9-3 and Figures 9-3 to 9-8)records all the data needed to evaluate the phercmena occurringdurinq steam condensation and the resulting loads in the pool,and also the data needed to determine the steam flow rate in thedischarqe line. The dynamic pressure loads and accelerations aremeasured at -several points in the pool. The forces occurring at.the vent pipe bracinq and on submerged structures in thesuppression pool are recorded by strain qauqes. The pressurebuild-up in the vent pipe is measured at several points Inaddition, .level probes are- insta11ed on the vent pipe so as to be
Rev. 9, 07/85 9-11
able to record the dynamic behavior of the water surface. Thestrains on the pipe are measured at two 'places on the vent pipe:100 mm below the bracinq (see Figure 9-5) and approximately 100mm below the qus et plate bracinq arrangement simulating thediaphragm slab (see Figure 9-3) . Pressure and temperaturemeasuzinq points in the air space of the suppression chamber andin the proportionate accumulator provide information about t)~evariation of pressure and temperature during the tests. Twodifferential-pressure measurinq points in the water reqion of thesup>ression chamber record the air bubble fzaction in the pool.At the upper end of the vent pipe there was a measuring point forthe continuou sampling of the steam to determine the aircontent The measurement system for continuous sampling isprovided by SBI Inteznational.The data is recorded on magnetic tape in analog form by mean" ofcarrier-frequency amplifiers and dc amplifiers. This ensuresthat hiqh-frequency measurement signals are recorded with properfrequency and amplitude. The data is reduced 1ater by acomputer. Simultaneously with the recordinq on magnetic tape,most of the measurement points are also recorded on Visicorders.That type of recordinq makes it possible to qet a quick look at'important measurement variables hortly after each test. At thesame time, a few selected transducer chaanels of the testinstrumentation aze recorded additionally at the process controlcomputer. This procedure makes i.t possible tc perform a guickand simple summary evaluation of that data after each test.Fach measurement chain consists of a transducer, connectioncable, amplifier (carrier-freguency oz dc amplifier)., balancingunit and rocordinq unit (see Figure 9-10)
The utilized pressure transducers have a measuzing diaphragm anda foil train qaqe system which is directly connected to thediaphragm. All pressure transducezs in the water region of thesuppression chamber have an exposed measurizg diaphragm withdirect contact to the surrounding watez. Earlier studies by KllUhave shown that this type of transducer is best suited forrecordinq higher-frequency pressuze oscillations with cozrectfrequency and amplitude.
The measurinq diaphragm for pressure transducers P4.1, P5.1, P5.5and P6.9 reguired protection from the hot steam. This wasaccomplished by means of a short watez-filled pipe which connectsthe transducers to the measurement site. The remaining pressuretransducers did,not require protection.
9 2. 2. 5 Visua l Recording-
The processes in the water zeqicn of the suppression chamber arerecorded optically on film by a hiqh-speed camera and on videotape by a television camera.
Hev. 9, 07/85
The cameras are mounted outside the tank and observe theprocesse by means of 'bull's eyes. Several undervatersearchliqhts are installed in order'o ensure satisfactoryliqhtinq of the end of the vent pipe.
A uniform electrical reference siqnal ensures time correlationbetween all the data acquisition ystems.
9.2.2.6 Inspection and Calibration of the MeasuringInstrumentation
.he calibration and the electrical and physical checking of allsensors before, during and a.ftez the tests were performed inaccordance with the Test and Calibration Specifications.
Fiqure 9-11 shows diagrammatically the physical calibration ofthe transducers, the setting and calibration of the amplifiersand recorders, and the quality inspection of the transducers.The time intervals stipul'ated for these inspections andcalibrations per the Inspection and Calibra ion procedures aregiven in Figure 9-12. Fiqure 9-13 shows the chain of thecalibration system from the National Standards of the
, Vhysikalisch Technische Bundesanstalt= (PTB) to the measuringinstruments
An additional physica1 inspection of the pressure transducers inthe water region vas performed by incrementally lowering thewater leve.l and comparing the measured pressure to the known
"hydrostatic pressure at the transducer location.Rith a fev exceptions, the 88 sensors used in the tests 'erefully operational for the duration of the tests. On December 10,1979, the pressure transducer P 5.4 failed. It vas replaced. by anew transducer for the subsequent tests. After initialdifficulties with the continuous 0 measurinq device, amodification of the sampling arrangement .resulted in satisfactoryperfcrmance. At a few level probe, the insulators were damagedby parts of the rupture-disk diaphragms being carried along bythe steam flov. Those level probes were replaced. The strainqauqes of measurinq point SG 5.1 had to be replaced on November14, 1979 due to too low insulation resista.nce.
The final inspection of the sensors af ter the completion of thetest project shoved a fully operable instrumentation system.
9 2 2.7 Analysis of Neasurement errors
Based on the information from the manufacturers of themeasurement instruments, KHlJ s ovn inve. tiqations, and takinginto consideration the experience qathered in similar testpro jects, the maximum measurement. errors for the individualtransducers are as follows:
Hev 9, 07/85
Pressure txansducexs P 6 1 . P 6.8
T.irearity error and hysteresis error of the transducer0.5F of 10 1 ar = 1.254 of 3 bar
Sensitivity error relative to 40 K temperaturewaiffere nce 0 75'8
Error of the measuzinq ampl ifier
Error of the balancing unit and the recorder
0» 51
0. 5%
maximum total error + 3~> of the measured value
Pressure transducer P 4 1
Linearity error of the transducer0.3'X of 50 bar = 075'. of 20 bar 0.75""
Reproduction error of the transducer0.1% of 50 bar 0.05 bax
Sensitivity error relative to 10 K temperaturedifference 0.1 ID
Zrxoz of the measuring amplifierError of the balancinq unit and the recorder
0. 5%
0. 55
Maximum total error +. 0 05 bar + 1.853 of the measured value
Pressure Vransducers P 5.1 P 5.5~ P 6.9
I.inearity error of the transducer0. 3$ of 20 bar = 1.5",> of 4 bar 1. 5'X
Reproduction error of the transducer0.1~ of 20 bar 0.02 bar
Sensitivity error re'lative to 40 K tempexaturedifference
Error of the measurinq amplifierError of the halancinq uni.t and the- recorder
0. 4%
0 ~ 5 ($
0. 5%
Haximum total error +0.02 bar + 2.9% of the measured value
Rev. 9, 07/85 9-14
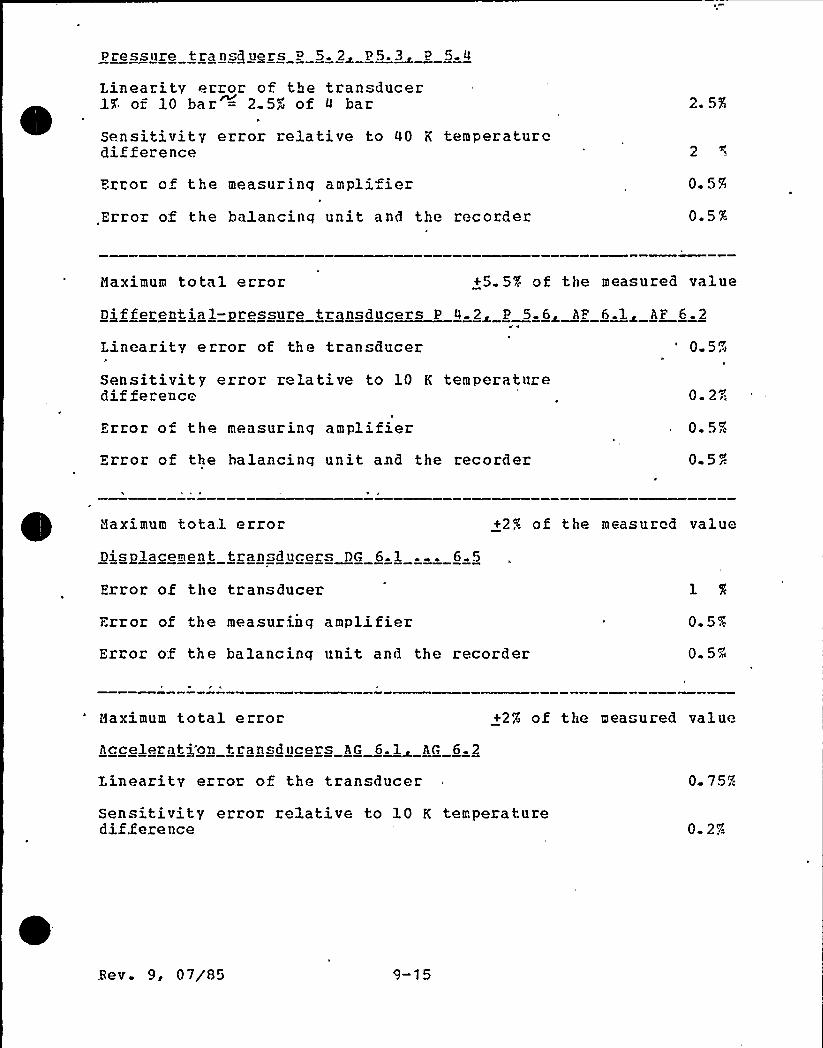
Pressure transduers P 5. 2~ P5.~3 P 5
Linearity error of the transducerof 10 bar = 2.5™~ of 4 bar
Sensitivity error relative to 40 K temperaturodifference
Error of the measuring ampli ierError of the balancing unit and the recorder
2. 5%
2
0.5A
0.5X
Maximum total error +5.57< of the measured value
Differential-pressure transducers P 4 2 P 5 6~ AF 6.1~ AF 6.2
Linearity error ot the transducer 0. 5~)
Sensitivity error relative to 10 K temperaturedifference
Error of the measuring amplifierError of the balancing unit and the recorder
0 5%
0. 5 ~r.
Maximum total ezzor +2% of the measured value
Displacement tran ducers DG 6.1 .. 6.5
Error of the transducer
Frror of the measuring amplifierError of the balancing unit and the recorder
0 5
0. 5~i
Maximum total error +2% of the mea ured value
Acceleration transducers AG 6.1~ AG 6.2
Linearity error of the transducer 0 75",:
Sensitivity error relative to 10 K temperatured.if.feze nce 0. 2%
3ev. 9, 07/85 9-15
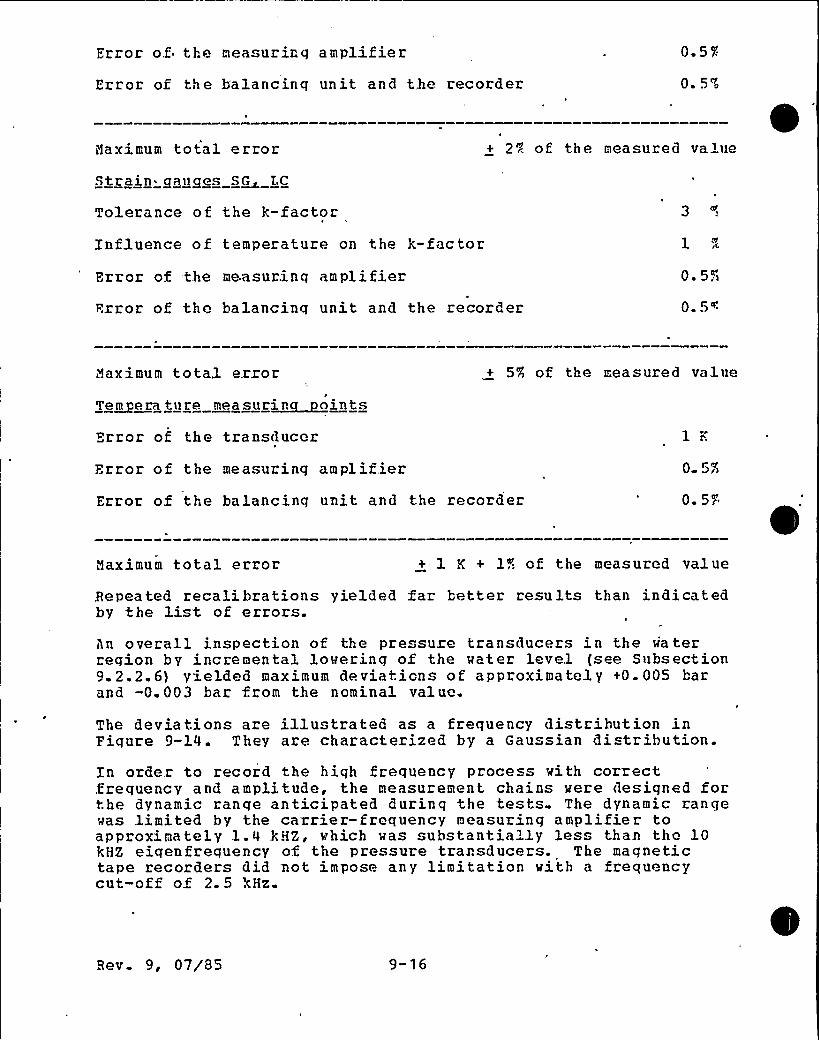
Error of the measurinq amplifierError of the balancinq unit and the recorder
0 5'K
0. 5%
Maximum total error + 2'2 of the measured value
Strain=- ganges S~G LC
Tolerance of the k-factorInfluence of temperature on the k-factor
Error of the measurinq amplifierFrror of the balancinq unit and the recorder
0. 5~»
0. 5~
Maximum total error7
T~em ena tune measutincCoints
+ 5% of the measured value
Error of the transducor ~e
Frror of the measurinq amplifierError of the balancing unit and the recorder
0 57)
0. 5F
Maximum total error + 1 K + 15 of the measured value
Bepeated recalihrations yielded far better results than indicatedby the list of errors.An overall inspection of the pre sure transducers in the wa terregion by incremental lowering of the water level (see Subsection9. 2. 2. 6) y'ielded maximum deviations o f approximately +0. 005 barand -0.003 bar from the nominal value.
The deviations are illustrated as a frequency distribution inFigure 9-14. They are characterized by a Gaussian distribution.In order to record the high frequency process with correctfrequency and amplitude, the measurement chains were designed forthe dynamic ranqe anticipated durinq the tests. The dynamic rangewas .limited by the carrier- frequency measuring amp lifier toapproximately .1.4 kHZ, which was substantially les than the 10kHZ eiqenfrequency of the pressure trarsducers. The magnetictape recorders did not impose any limitation with a frequencycut-off of 2. 5 kHz.
Bev. 9, 07/85 9-16
The frequency cut-off of theutilized ga.lvanometers. Theyfrequency measurinq,'points.individual qalvanometers was
Uisicorders ~as determined hy thevere at l kHz for all the high-The frequency characteristics of theinspected before the tests.
Bev. 9, 07/85
9.3 TFS P ARAH FTRRS AND MATRIX
The test matrix provided for twenty-tvo tests with elevendifferent parameter combinations (see Table 9-4) . Earlier test.series indicate that the strength of the condensation events isverv hiqhly stochastic and can differ for tests with identicalboundary conditions. Zn order to largely rule out any erzoneouscorrelation of measurement values with the parameter"-, each testis zepeated once.
Four different line breaks were investigated:
. the complete break-off of a recirculation loop (RCL break)
the complete break-off of a main-steam line (fu.ll HSL break)
two other steam-line breaks correspondinq to 1/'3 and 1/6 ofthe fu11 HSL bzeak area.
For the PCI. break, the break flow consists of both liquid andsteam flow. A portion of the liquid flashes into steam andtoqether with the steam from the break gives the total steam flovinto the suppression pool. FSAR Table 6.2-9 presents the breaksteam flov and break liquid flow, together with their associatedenthalpies at various times duzing the BCL break. FSAR Figure6.2-2 shows the dzyvell pressuze response for the RCI break.This data. vas used to calculate the fracticn of liquid break flowthat:flashes into steam (assuminq thezmodynamic equilibrium), andthe corresponding total vent steam flow. Fiqure 9-14a shows theSSES calculated vent steam ma s flux vs. time for the RCL break.The RCL tests were run to match this curve a closely as possible( ee Subsection 9.4.1 1.1).For the full MSL break, the break flow is also comprised of bothliquid and steam f ow. Again, a portion of the liquid flashesirto steam and combines with the steam from the break to give thetotal vent steam flow. FSAR Table 6. 2-10 qives the break steamflow and break liquid flow, as well as the' associatedenthalpies at various times durinq the .full HSL break. FSARFiqure 6.2-11 shows the drywell pressure response foz the fullHSL break. This data was used to calculate the fraction ofliquid break flow that flashes into steam (assuming thermodynamicequilibrium), and the corresponding total vent steam flov.Fiqure 9-14b plots the SSES calculated vent steam mass flux vs.time for the full HSL bzeak. The full HSI. tests vere run tomatch this curve as accurately as possible (see Subsecton9.4 1.1)
For these 1arqer break transients the ranqe of lov mass, flowdensities is passed through vezy rapidly. I: n the event ofsmaller break the blowdown times are distinctly longer. The 1/3and 1/6 HSL breaks vere chosen to investiqate longer blowdowntransients. Their break sizes were selected so that, 'ifrequired, it is possible to compare the results with data knownfrom earlier tests series.
Re v 9, 07/85 9-18
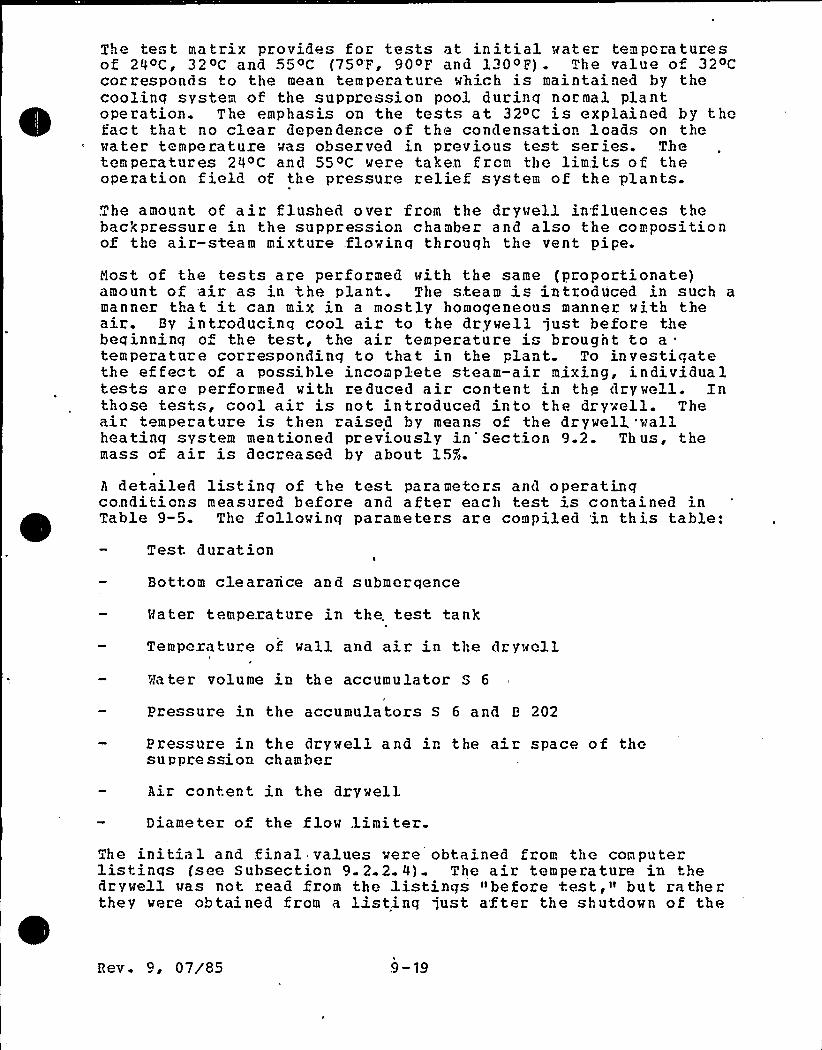
The te t matrix provide" for tests at initial water temporaturesof 24oC, 320C and 55~C (75oF, 90oF and 1300P) . The value of 320Ccorresponds to the mean temperature which is maintained by thecoolinq system of the suppression pool durinq normal plantoperation. The emphasis on the tests at 320C is explained by thefact that no clear dependence of the condensation loads on thewater temperatuze was obsezved in previous test series. Thetemperatures 24oC and 55oC vere taken from the limits of theoperation field of the pressure relief system of the plants.
The amount of air flushed over from the dzywell influences thebackpressure in the suppression chamber and also the compositionof the air-steam mixture flowinq through the vent pipe.
Host of the tests are performed with the same (proportionate)amount of air as in the plant. The steam is introduced in such amanner that it can mix in a mostly homogeneous manner with theair. By intzoducinq cool aiz to the drywell just before thebeqinninq o the test, the air temperature i" brought to atemperature corresponding to that in the plant. To investigatethe effect of a possible incomplete steam-air mixing, individualtests are performed with reduced air content iz the drywell. Inthose tests, cool air is not introduced into the drywell. Theair temperature is then raised by means of the drywell, wallheatinq system mentioned previously in'Section 9.2. Thus, themass of air is decreased by about 15%.
A detailed listing of the test parameters and operatinqconditions measured before and after each test is contained inTable 9-5. The Xollowinq parameters are compiled in this table:
Test duration
Bottom clearance and submerqence
Mater temperature in the. test tank
Temperature of wall and air in the drywall
Mater volume in the accumulator S 6
Pressure in the accumulators S 6 and B 202
Pressure in the drywell and in the air space of thesuppression chamber
Air content in the dzywell
Diameter of the flow limiter.The initial and final values were obtained from the computerlistinqs (see Subsection 9. 2.2. 4). The air temperature in thedrywell was not. zead from the listings "before test," but ratherthey were obtained from a listinq just after the shutdown of the
Hev. 9, 07/85

ventilator connected to the drywell some time before thebeginning of the test.For the water temperature and the air temperature in the drywell,the mean value was formed from the corresponding measuringpoi nts.
At the end of the test, the water temperature a fter the mixing ofthe pool was indicated
Pev. 9, 07/85 9-20

9 4 TFS = B FSHLTS*
See the 'Proprietary Supplement for this secti'on.
Pe v. 9, 07/85 9-21
9.5 DATA ANALYSIS~ AND LOAD SPrCIPICAT ION
See the Proprietary Supplement for this Section.
Be v. 9, 0 7/85 9-22
5 V;.F;Z~Z.C.'A=:D>! 0= </!R D":.S3',",ll SP"-Cl>T.CATION.
See the Prorrietary Supplement for thi" Section.
9-23

(
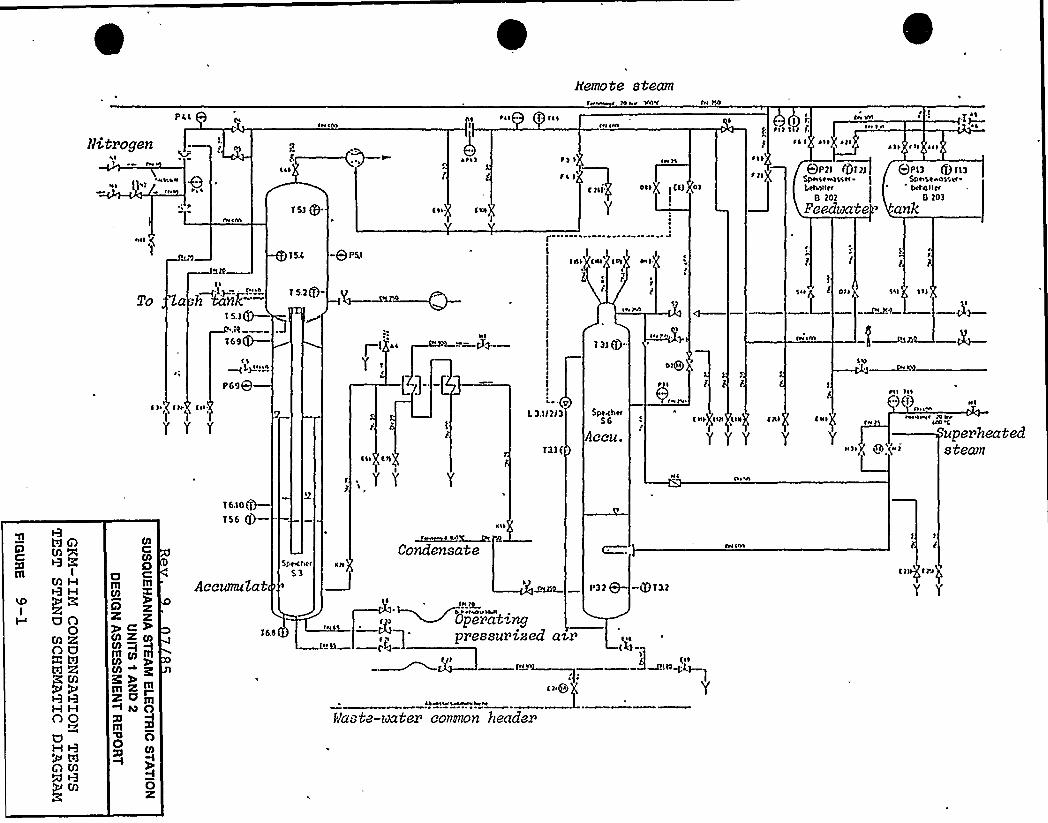
h'emote steamIO pr PSI t IN 14
PLC
NitrogenSlI IN ~
~NIIPNl IN
I nr
IN ~
sll
iSI Q.
OII
~ 1 ~ I
csl Ce»
I I
~II $ II~
INIttl
INI\
ol I)( )CO
I
tlrE
I ~ I
tl I Jl ~
IN I n
P2I ~If)rr>Spetsernsset-I,ehrr tet
II 202
Feedmte
gIS
tll I'l ~ II
QNPI3 Q IOSpe sernsset-beenrret
0 203
ank
laC ~
h kasHK"'-T S.IQ—
2S.C -e VS.I
i 5.2O-
er I
Ip pvl
I,i. I1 »1 C»Ig C ttt
I SI> E 01 SII$ SICIA
SI
I r> Cr> CIII
Y Y Y
vssg
fi P ~
Y
PI
i. 3.II2I3
233
133 Qj-
5petch 11
S6
Accu.
01I~ y
or)',
t21
IN
II»'I
YYY
INlnl
C 1st CNI
Y Y
IN I'I
II)l 6 (Nr
Nl
& Iw< reprltn C
upend heatedsteam
td AMXQ e3:
t3 H
UO0MROUX h3
H HOOUH 9Q M
03
0D C
mIII9z zyet03
mmmm
EI3~ g<~mmZIZam+ ls3 Qm'C3
O O
~SCO
0z
i6.10
iss@—
Accumulat
26.8
Spe4hetS3
;YY
Crt
Condensate
IN I
g ~dpei'a'tingp2 essu2 ised aw'
C
~ ~
erisIIMI%vI.N tiller&
f1aste-mte2 coIIImon heade2
V32
NI
-+ t32
<V2-,C le~IIS~~
Y
Cr C r>)
Y Y
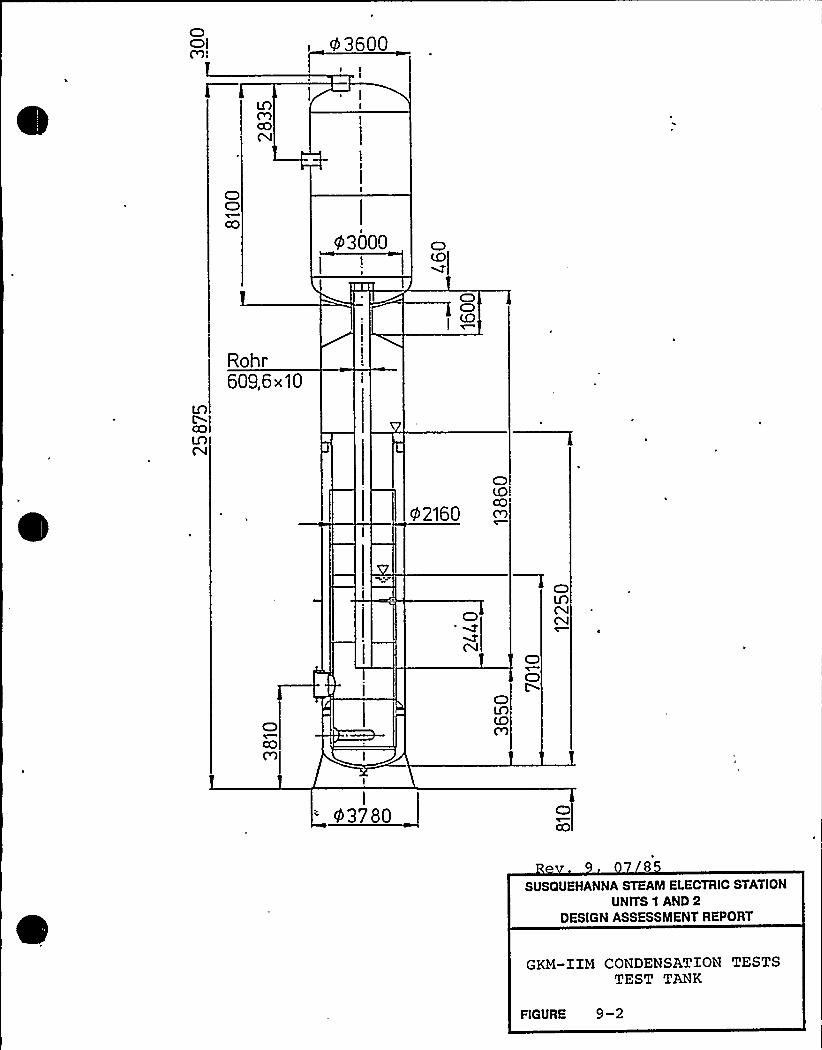
CDCDI 4 3600
CDC)CQ I
43000
CDCDCD
Rohr609,6x10
CD
4 2160
CD
CV
CDlACDPl
I
43780
8
SUSQUEHANNA STEAM ELECTRIC STATIONUNITS 1 AND 2
DESIGN ASSESSMENT REPORT
GKM-IIM CONDENSATION TESTSTEST TANK
FIGURE 9-2

0
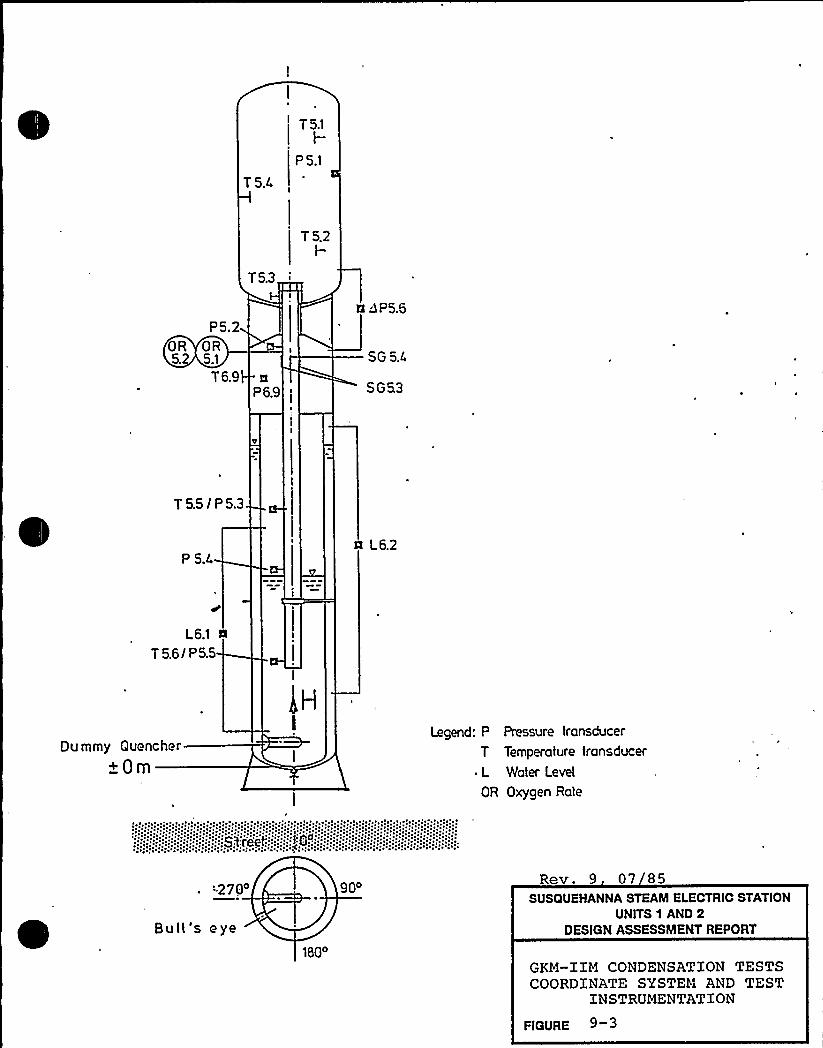
T S.L
T 5.1L-
P 5.1
P5.2OR OR5.2 5.1
T6.9
T5.3
P 6.9
T 5.2I-
a DP5.6
SG S.L
SGS3
T5.5/P5.3
P S.La L62
L6.1 IIT 5.6/ P5.5
Dummy Quencher
+Om
I
.I,: I,: Stre'et!,:ii.,
Legend: P Pressure transducer
T Temperature transducer~ L Water Level
OR Oxygen Rate
276o
Bull's eye180o
900 Rev. 9 07 85SUSQUEHANNA STEAM ELECTRIC STATION
UNITS 1 AND 2DESIGN ASSESSMENT REPORT
GKM-IIM CONDENSATION TESTSCOORDINATE SYSTEM AND TEST
INSTRUMENTATION
F(GURE 9-3
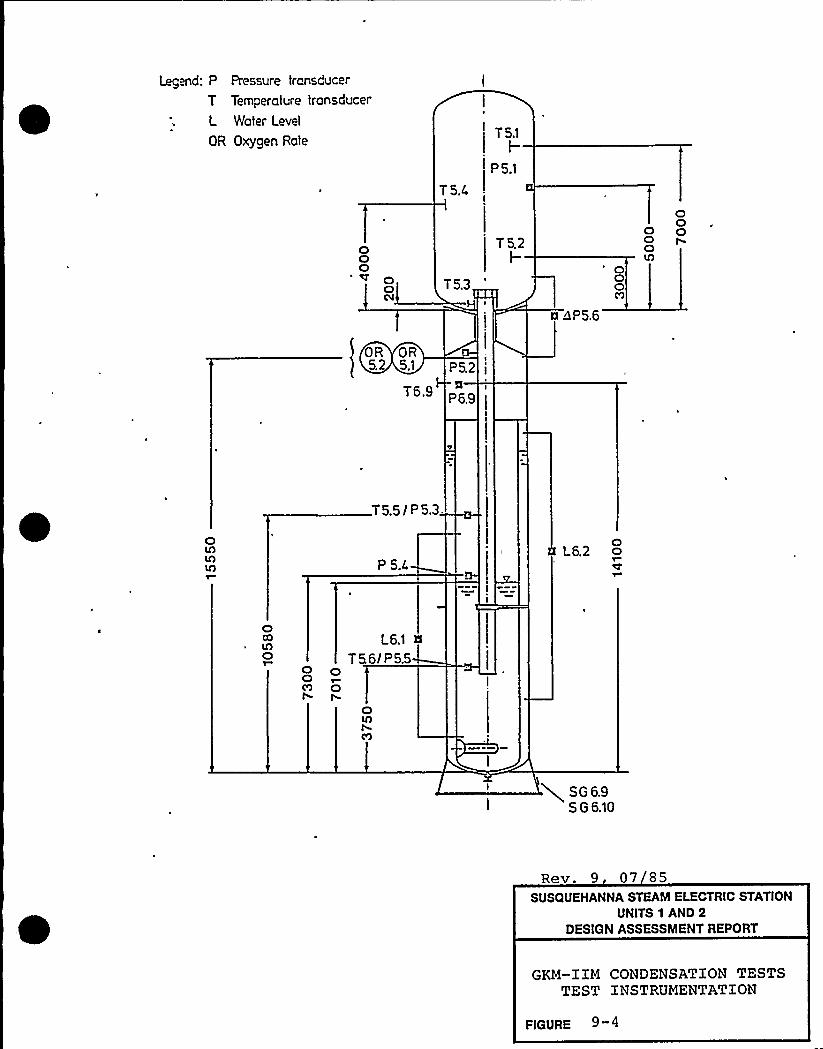
Legend: P Pressure transducer
T Temperature transducer
L Water Level
OR Oxygen Role
OOO
OOC4
T 5.4
T5.3
T 5.1I-
P 5.1
T 5.2I-
a aP5.6
000
OOO00
OR OR5.2 5.1
T6.9
P 5.2
P6.9
OtAtAlA
T 5.5 / P 5.3.
P 5./L6.2
OCatAO
O0n
L6.1 aT56/P5.5
Q SG6.9S G 6.10
Rev. 9 07 85SUSQUEHANNA STEAM ELECTRIC STATION
UNITS 1 AND 2DESIGN ASSESSMENT REPORT
GKM-IIM CONDENSATION TESTSTEST INSTRUMENTATION
FIGURE 9 4
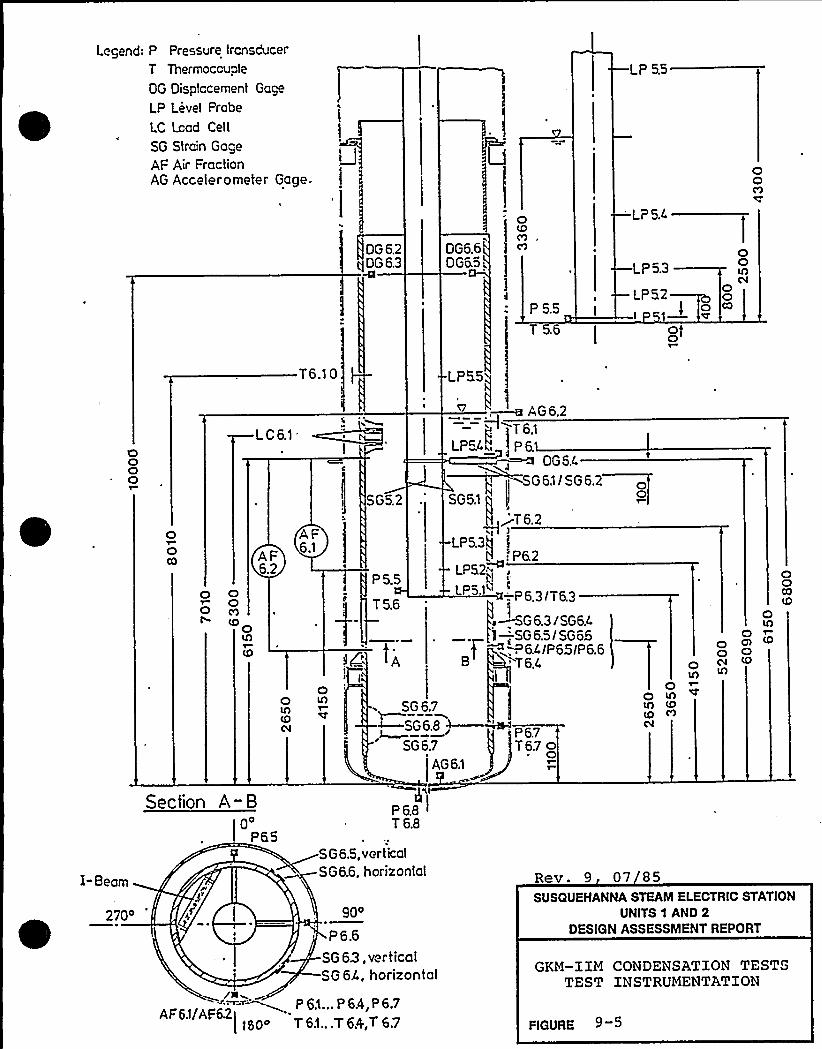
Legend: P Pressure transducer
T Thermoccuple
OG Oisptccement Gage
LP Level Probe
LC Load Cell
SG Strain GageAF Air FractionAG Accelerometer Gage.
LP 55
OO
OG 6.2qDG6.3
OG6.6DG6.5.
OCO
C9
P 5.5
'P54
LP5.3
LP52O
OOC4
OOCO
T 5'6I
Ot
0000
LC6.1
T6.10
SG5.2 SG5.1
SG6.1/SG6.2 oO1
LP55
".—a AG6.2T 6.1
LPW~ lP6'G6.4
O1
OCD
O OOn(g O
AFAF6.2
OOlA
Ol
P 5.5
T 5.6
IA
SG 6.7
~SG6.8 ~~j
SG 6.7
AG 6.1
P 6.7T6.7 o
~ O
!P6.2LP52
I PQ.I ~ P6 3/T63
~~G 6.3/SG6.4.—;SG6.5/ SG65~ 6.4/P65/P 6.6
'- T6.4l
OO n
OLA
OOO 0cu
OOC)|o
~-Eteam
Section A-B
I'PaS
S G6.5, verticalSG6.6, horizonlal
90
P 6.6
SG 63, ver ticalSG 6l, horizontal
Rev. 9 07 85SUSQUEHANNA STEAM ELECTRIC STATION
UNITS 1 AND 2DESIGN ASSESSMENT REPORT
GKM-IIM CONDENSATION TESTSTEST INSTRUMENTATION
FIGURE
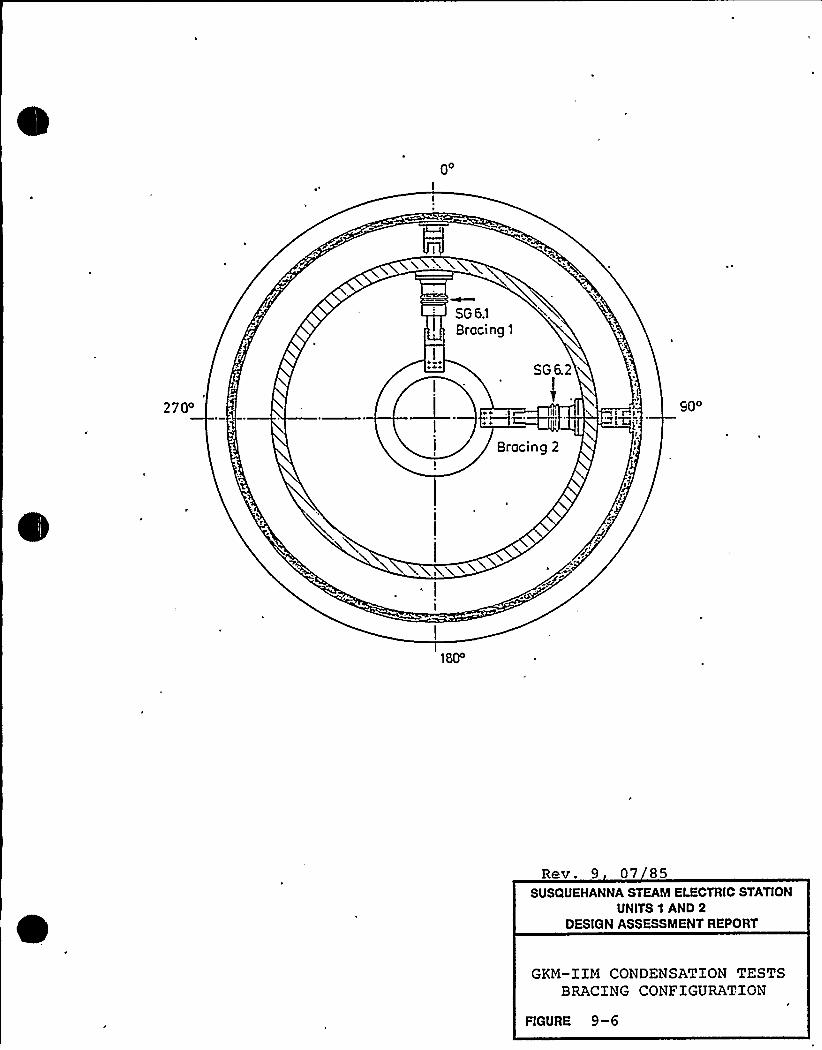
00
SG 6.1
Bracing 1
I~ 4 SG 6.2
2700 '~ ~ir.~ 900
Bracing 2
I
180
Rev. 9 07 85SUSQUEHANNA STEAM ELECTRIC STATION
UNITS 1 AND 2DESIGN ASSESSMENT REPORT
GKM-IIM CONDENSATION TESTSBRACING CONFIGURATION
FIGURE 9-6
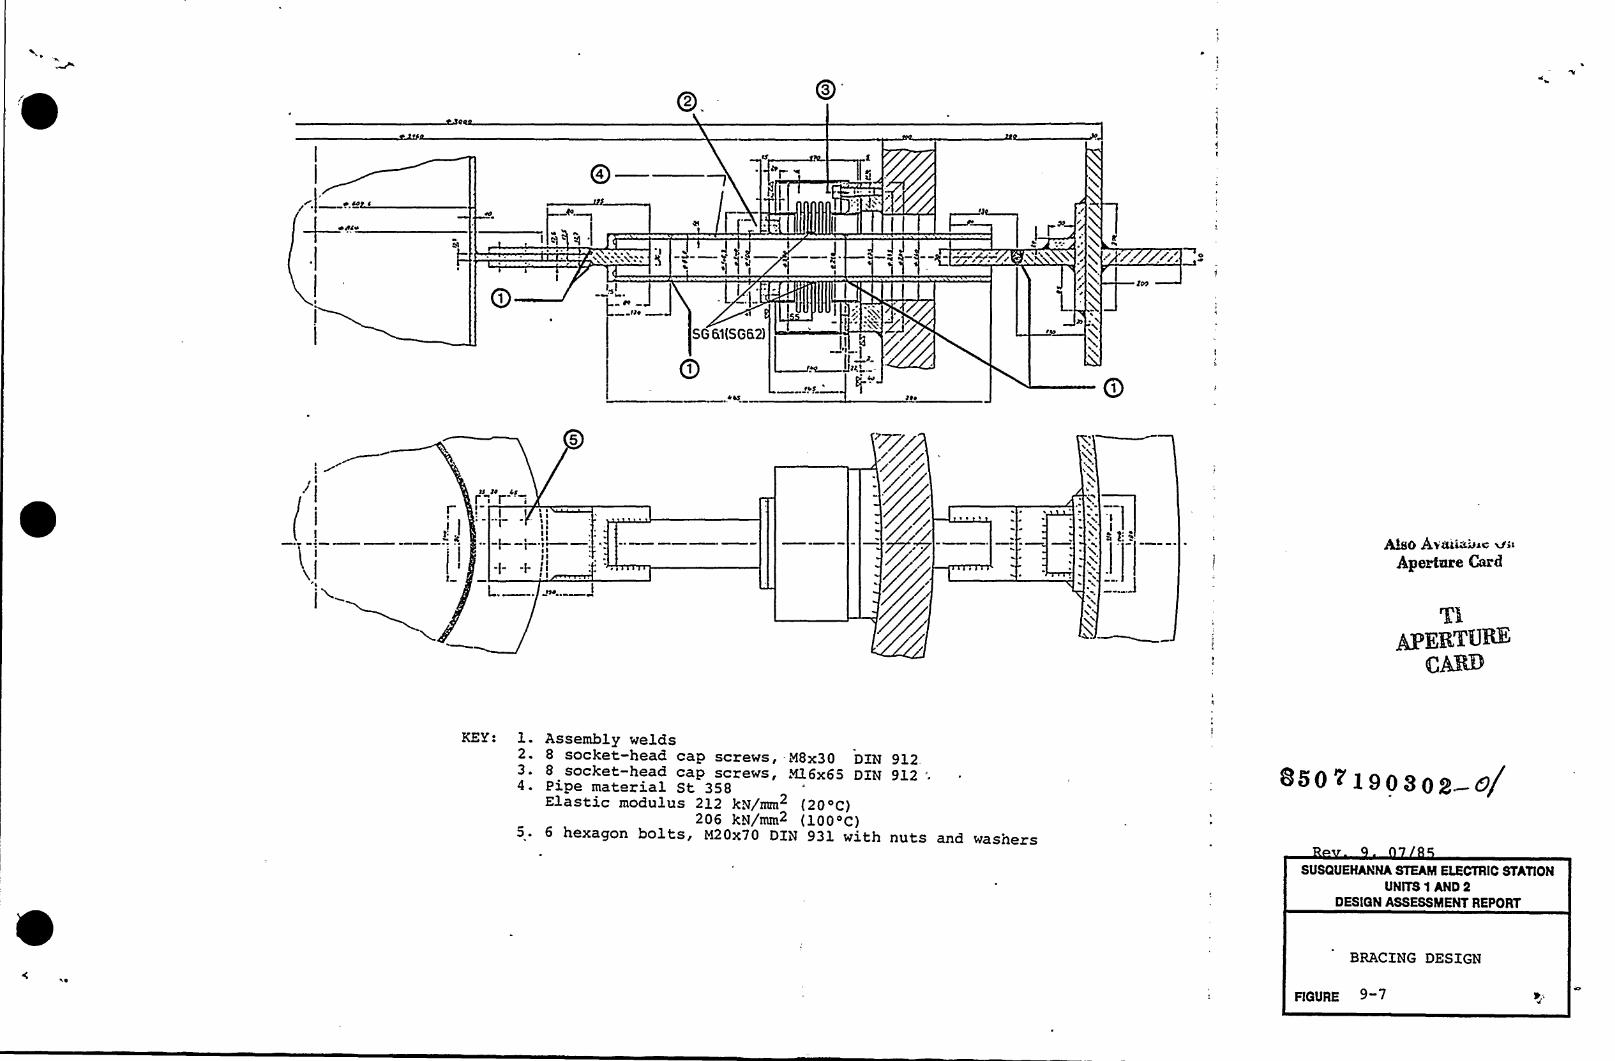
0z03
04—
~ II
01
SG 61(SG62)
IIII
I ~-f--r .~II
f I
II
II1
IIII
Also Av44adse viaApertme Card
L tlat
KEY: Assembly welds2. 8 socket-head cap screws,-M8x30 DEN 9123. 8 socket-head cap screws, M16x65 DEN 912-4. Pipe material St 358
Elastic modulus 212 kN/mm (20'C)206 kN/mm (100'C)
5. 6 hexagon bolts, M20x70 DIN 931 with nuts and washers
850 ~ l903gg a/
SUSQUEHANNA STEAM ELECTRIC STATIONUNITS 1 AND 2
DESIGN ASSESSMENT REPORT
BRACING DESIGN
FIOURE

'
k +I~
rI
h
r'
l
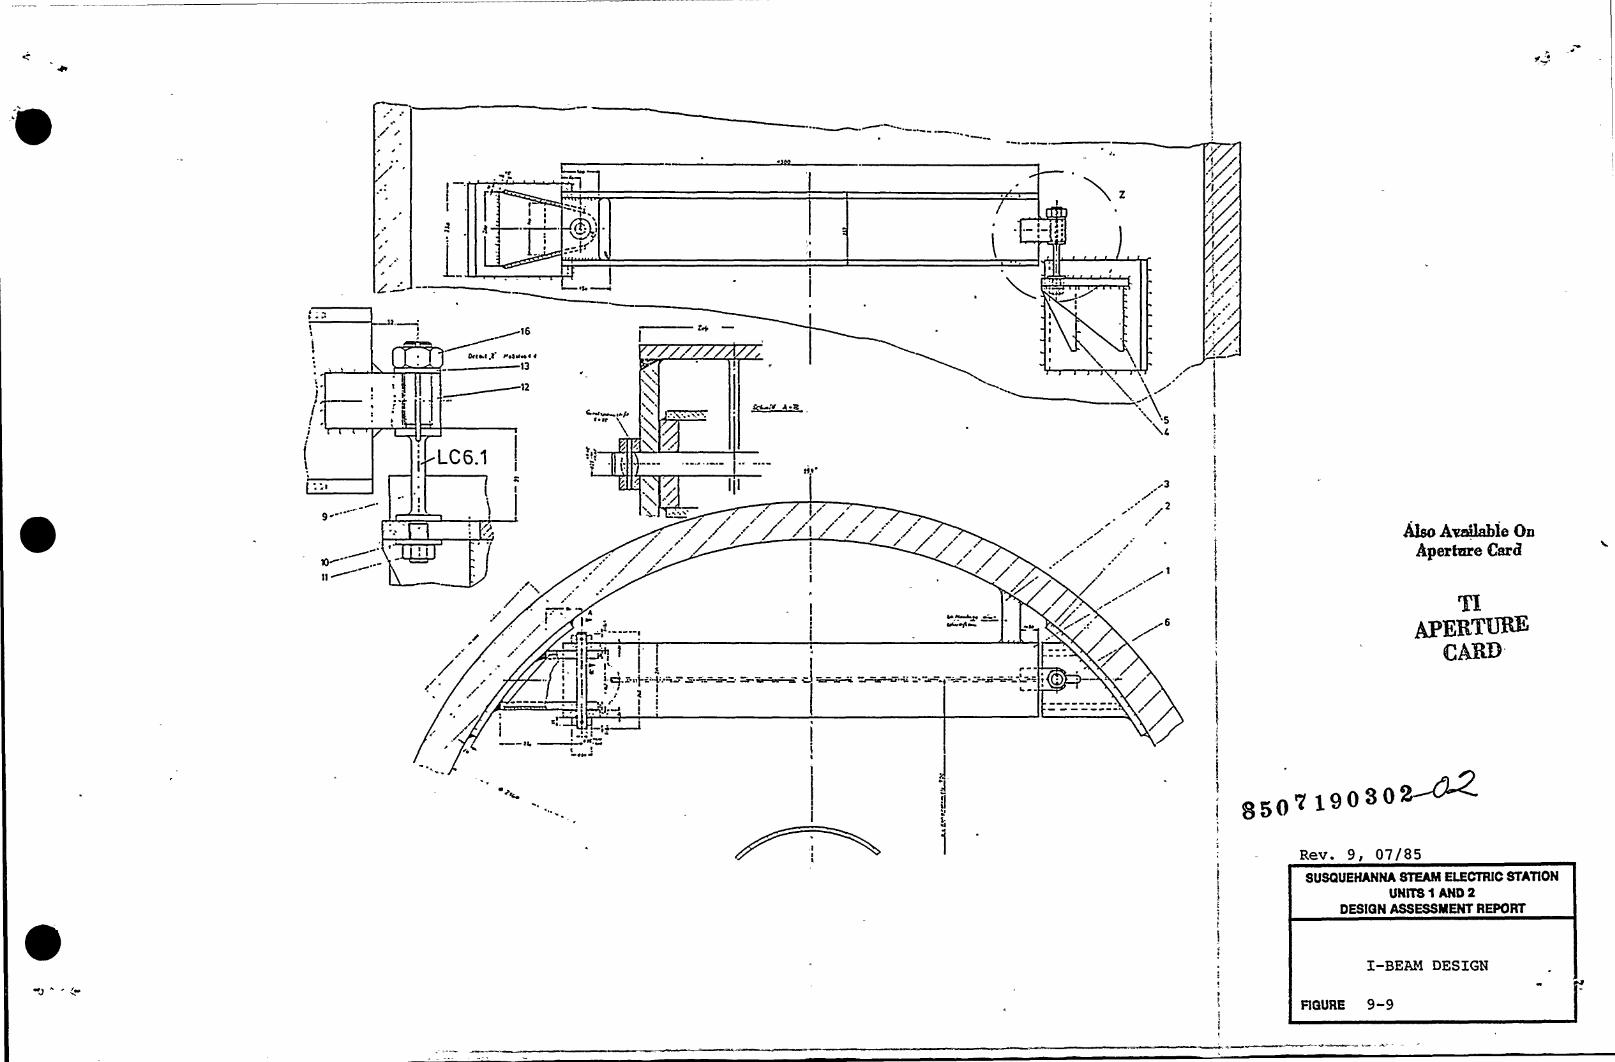
13
3
OVCO.C.t r3033»3 3
13
12
LC6.'t
+m3» 3*/r
'3
1'3v xlXc
/3
2
/
r,'
Ahe Avsihhle OnApertare Card
, 343'./ 3
TIAPERTUI@'ARD
3+I
32 ~9030/~Rev. 9, 07/85SUSOUEHANNA STEAM ELECTRIC STATlON
UNlT81 AND2DESlQN ASSESSMENT REPORT
I-BEAM DESIGN
FlGURE 9-9

g/0 0
,x
(vN
P"I
as
4i
gl
fi)
E,I*$
''U„'
~ t
4
I'
i
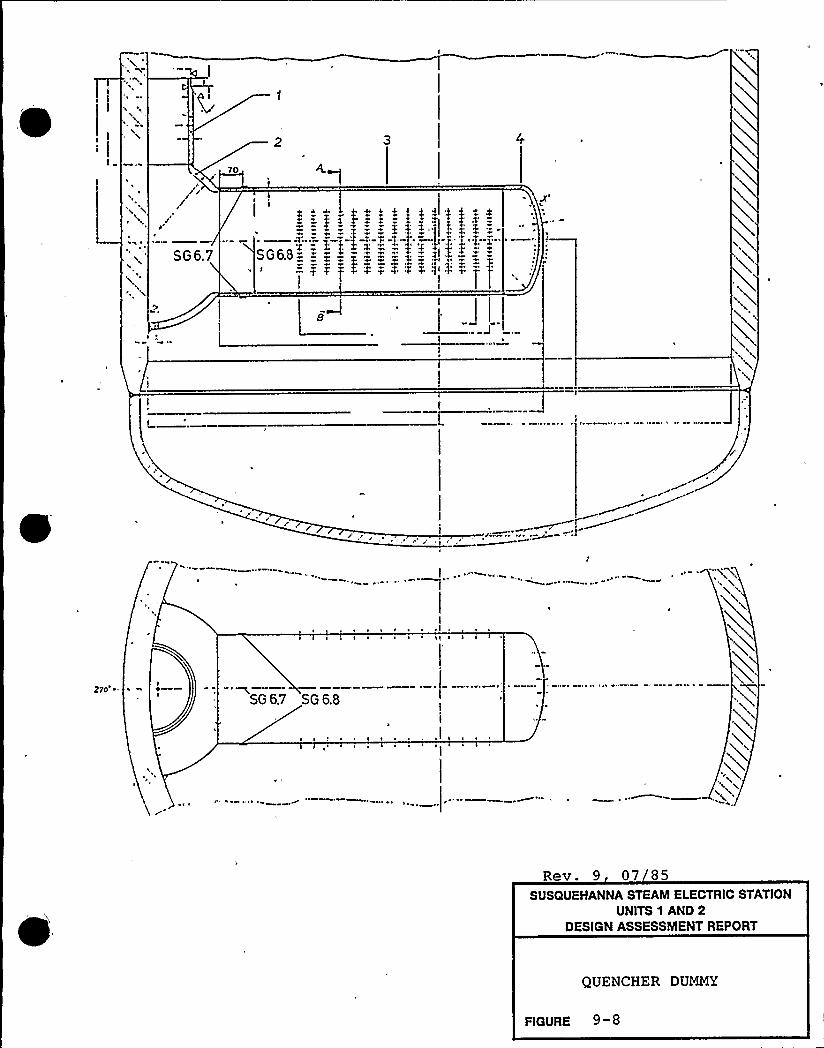
p
70
2
SG6.8 =
t J)
- 'lj'
~ ~ ( ~
v ~, .II I I I < I( I I I
270'G6.7 SG 6.8
~ - ~
Rev. 9 07 85SUSQUEHANNA STEAM ELECTRIC STATION
UNITS 1 AND 2DESIGN ASSESSMENT REPORT
QUENCHER DUMMY
FIGURE 9-8
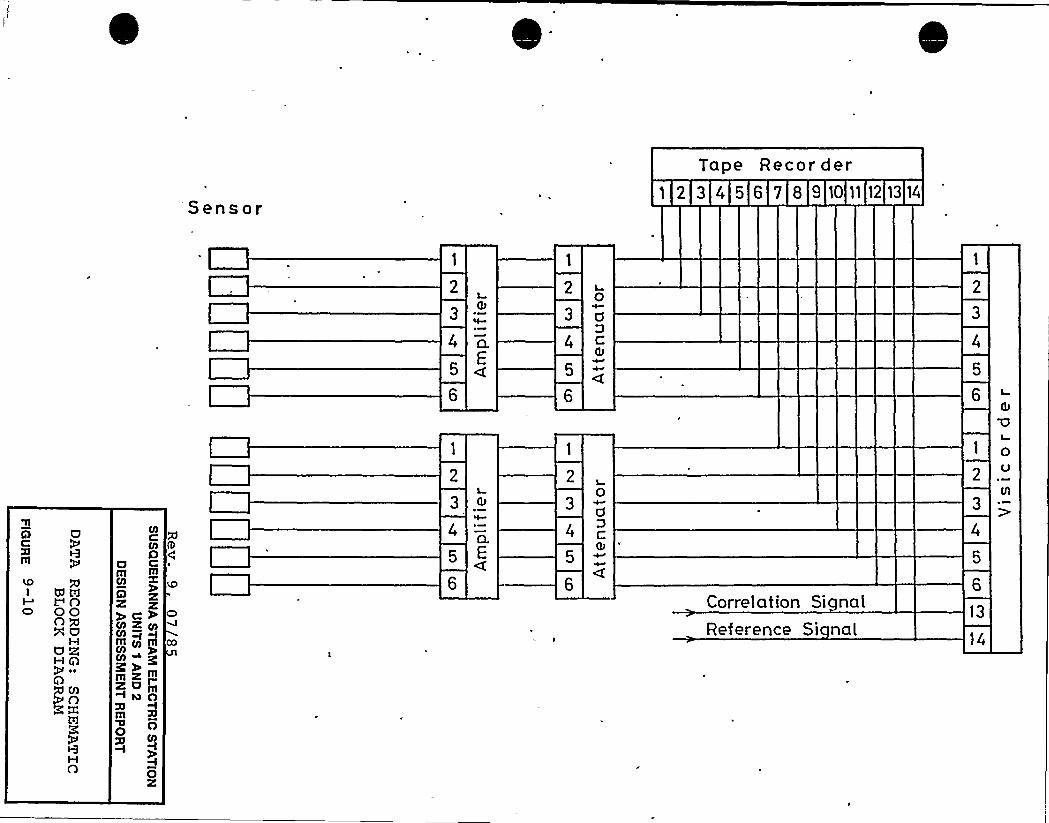
Sensor
Tape Recor der1 2 3 4 5 6 7 8 9 10 11 12 13 14
2
3
4
5
6
1
2
3
4
5
6
6DCS
1
2
3
4
5
6
m aClll
l t5 PfVOo OOOQxaURHQ
~ 0
Q
3'
0
Ol
tOD0
9 g
CO Z Ol
m~mzor~~0fll go
0X
1
2
3 .
5
6
2
3
4
5
6
L
0
Correlation SignalReference Si nal
3
4
5
6
13
14
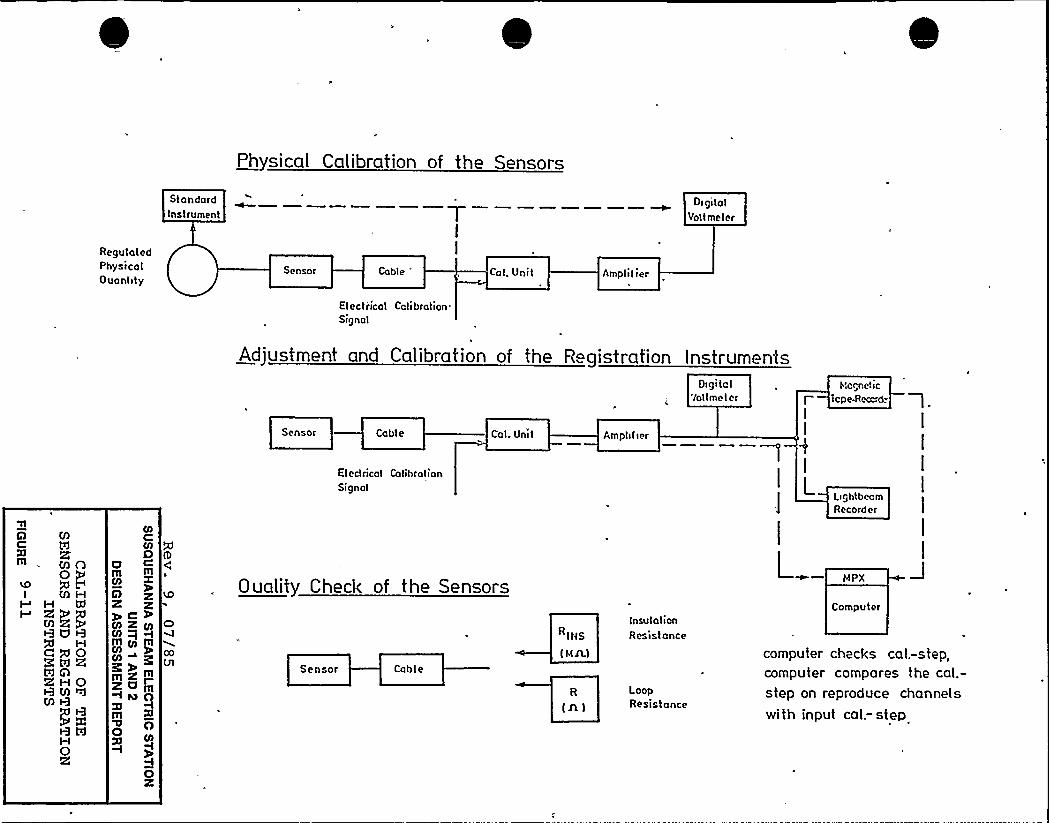
Physical Calibration of the Sensors
Standard D>gitatInstrument Vo!I meter
RegulatedPhysicalOuantity
Sensor Cable
'lectiicalCalibration.Signal
Cal. Unit Amplitier
Adjustment and Calibration of the R gistration Instruments
Sensor Cable
Electrical CalibrationSignal
Cal. Unil Amplilier
Oigitclyoltme ter
L
hlagnelictope-Recc.d-
I
I
I
ILightbeomRecorder
CÃ Km, I
gPI MH
H 5RNgRUB
HCXO3l td R8 HOHMMQ) Q
t-3 tdH0R
Ol
Og CmOl9 gye%'o K to
mmmm
oo
COcn~g~~mmzmr2'~m~ ea Om
Oo)
OX
coVl Sensor Cable
Quality Check of the Sensors
RINs
(ht JL)
R
in I
InsulationResistance
LoopResistance
htPX
Computer
computer checks cal.-step,computer compares the cal.-step on reproduce channelswith input cal.- step
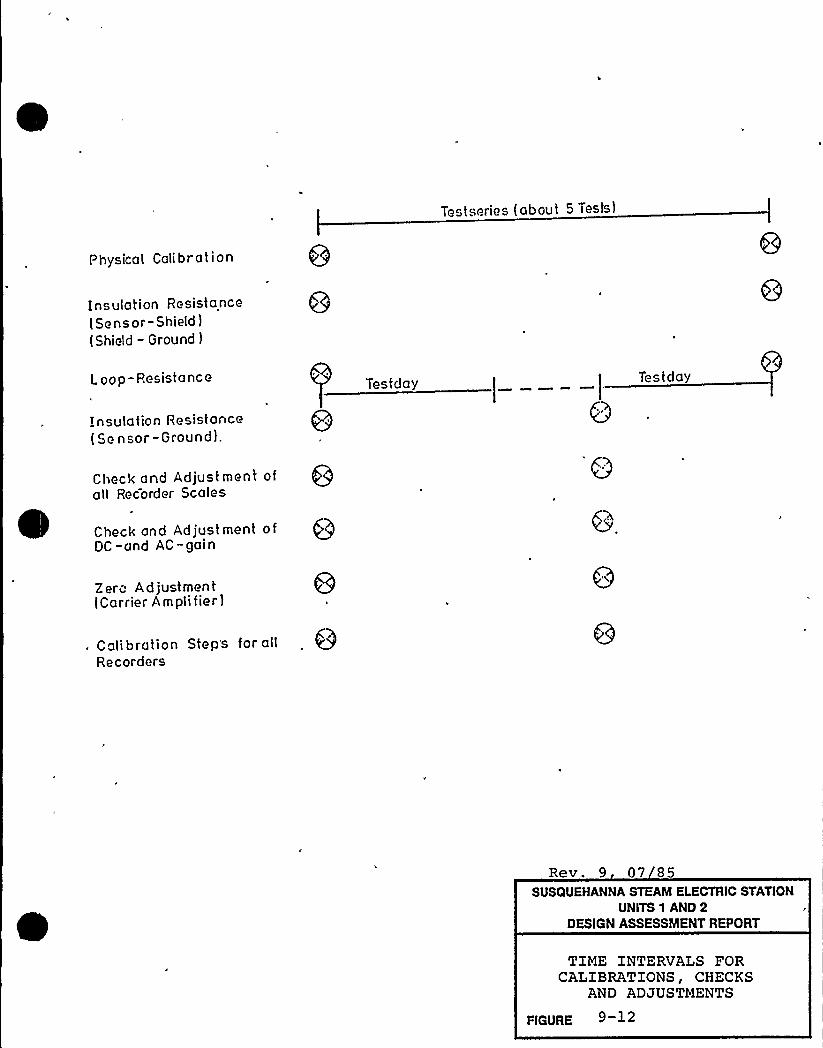
Testseries (about 5 Tests)
Physical Calibration
Insulation Resistance(Sensor-Shield)(Shield - Ground )
Loop-Pesistance
Insulation Resistance(Se nsor-Ground).
Testday
Ctnck ond Adjustment ot taall Recorder Scales
Check and Ad just ment o fDC-and AC-gain
Zero Adjustment(Carrier A m pli fie r )
Calibration Step's for allRecorders
Rev. 9 07 85SUSQUEHANNA STEAM ELECTRIC STATION
UNITS 1 AND 2DESIGN ASSESSMENT REPORT
TIME INTERVALS FORCALIBRATIONS, CHECKS
AND ADJUSTMENTS
FIGURE
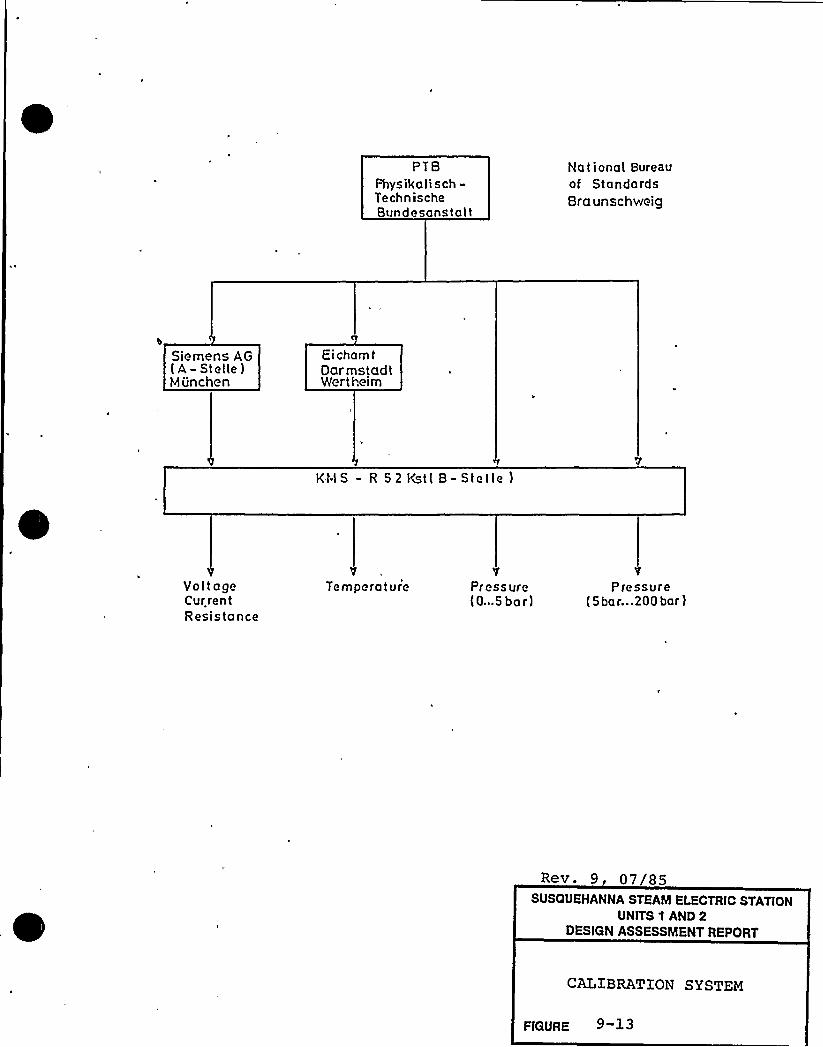
PTBFhysikali sch-TechnischeBundesanstait
National Bureauof StandardsBra unschweig
Siemens AG( A - S t e lie )Munchen
Ei cham t
Oar mstadtWert heim
KM S - R 5 2 )<st( B- Stelle )
Yol tageCurrentResistance
Temperature Pressure(0."5 bar)
Pressure( 5 ba r...200 bar )
Rev. 9 07/85SUSQUEHANNA STEAM ELECTRIC STATION
UNITS 'I AND 2DESIGN ASSESSMENT REPORT
CALIBRATION SYSTEM
FIGURE
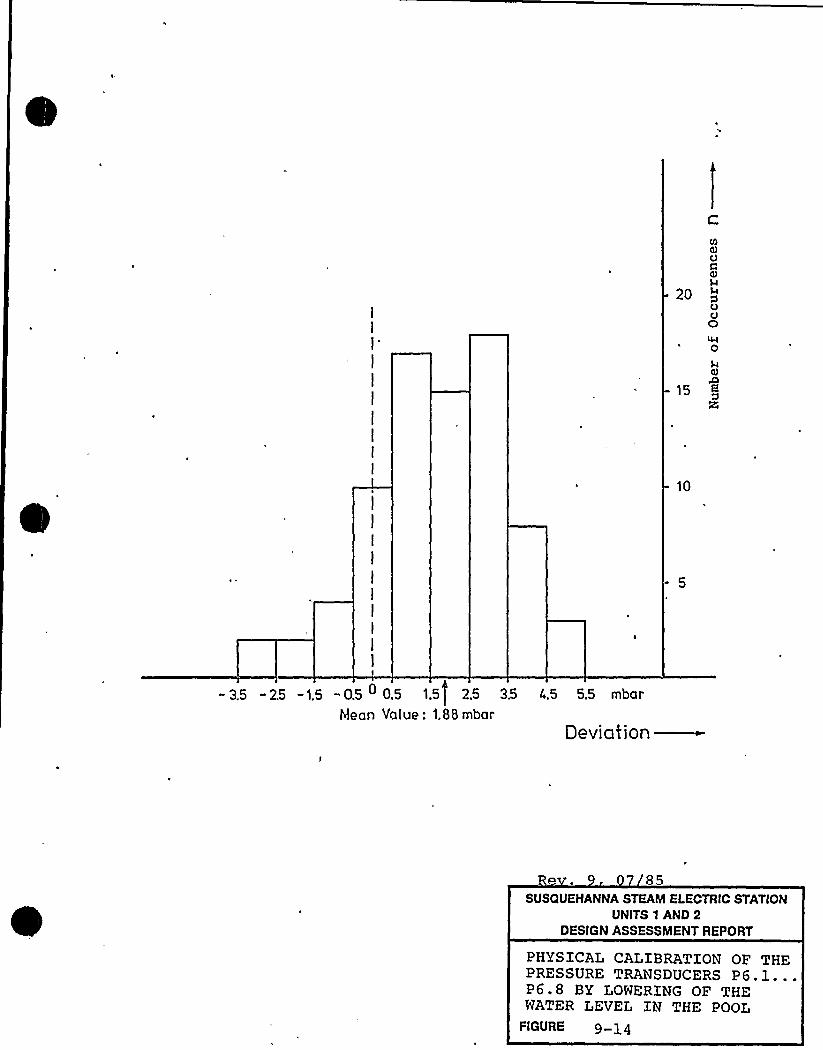
20
OW0
15 gg
10
- 5
o 0.5 1.5
Deviation
"3.5 -2.5 -1.5 -0.5 2.5 35 4.5 5.5 mba r
Mean Yalue: 1.88 mbar
R 85SUSQUEHANNA STEAM ELECTRIC STAT(ON
UNITS 1 AND 2DESIGN ASSESSMENT REPORT
PHYSICAL CALIBRATION OF THEPRESSURE TRANSDUCERS P6.1...P6.8 BY LOWERING OF THEWATER LEVEL IN THE POOL
FIGURE 9-14

0
0
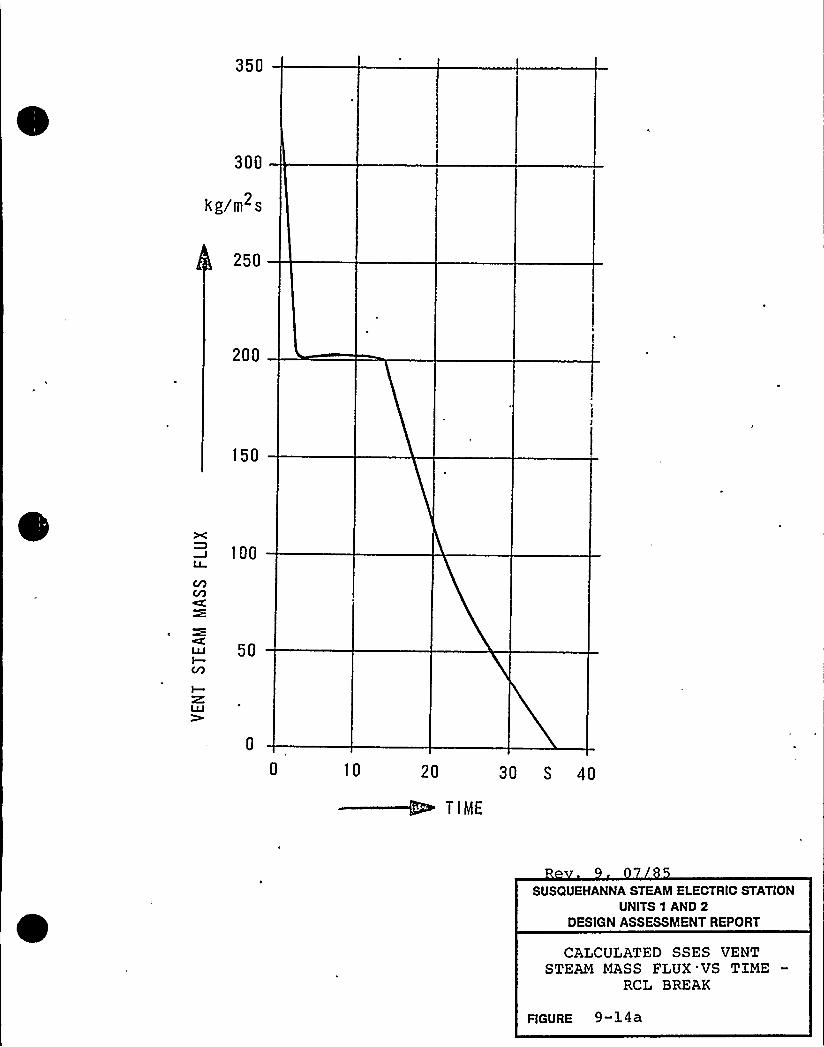
350
300
kg/m2s
250
200
150
OC
100
50
0 10 20 30 S 40
TIME
SUSQUEHANNA STEAM ELECTRIC STATIONUNITS 1 AND 2
DESIGN ASSESSMENT REPORT
CALCULATED SSES VENTSTEAM MASS FLUX'VS TIME
RCL BREAK
FIGURE 9-l4a
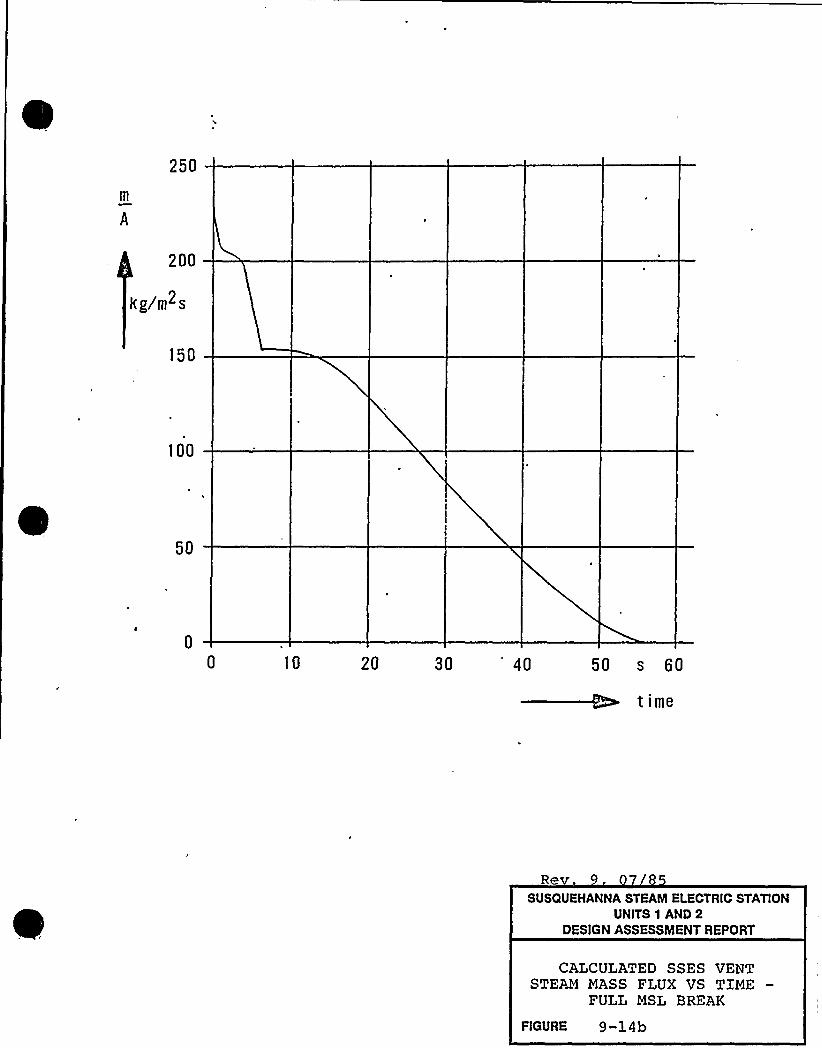
250
200
kg/m2s
150
100
50
10 20 30 40 50 s 60
time
Rev.SUSQUEHANNA STEAM ELECTRIC STATION
UNITS 1 AND 2DESIGN ASSESSMENT REPORT
CALCULATED SSES VENTSTEAM MASS FLUX VS TINE
FULL MSL BREAK
FIGURE 9-14b
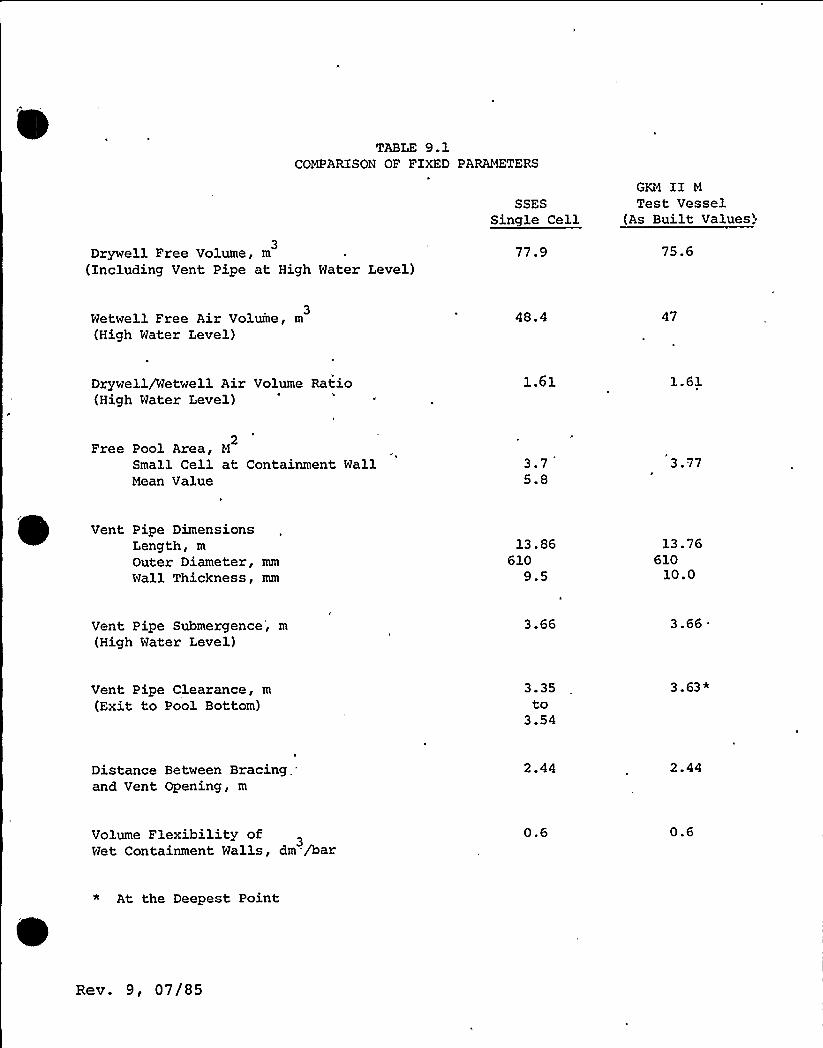
TABLE 9.1COMPARISON OF FIXED PARAMETERS
SSESSingle Cell
GKM II M
Test Vessel(As Built Values'.
Drywell Free Volume, m3
(Including Vent Pipe at High Water Level)77.9 75.6
3Wetwell Free Air Volume, m
(High Water Level)48.4 47
Drywell/Wetwell Air Volume Ratio(High Water Level)
1.61 1.61
Free Pool Area, M2
Small Cell at Containment WallMean Value
3.75.8
3.77
Vent Pipe DimensionsLength, m
Outer Diameter, mm
Wall Thickness, mm
13. 86610
9.5
13.76610
10.0
Vent Pipe Submergence', m
(High Water Level)3.66 3.66
Vent Pipe Clearance, m
(Exit to Pool Bottom)3.35to
3.54
3. 63*
Distance Between Bracing'ndVent Opening, m
2.44 2.44
Volume Flexibility ofWet Containment Walls, dm /bar
0.6 0.6
* At the Deepest Point
Rev. 9, 07/85
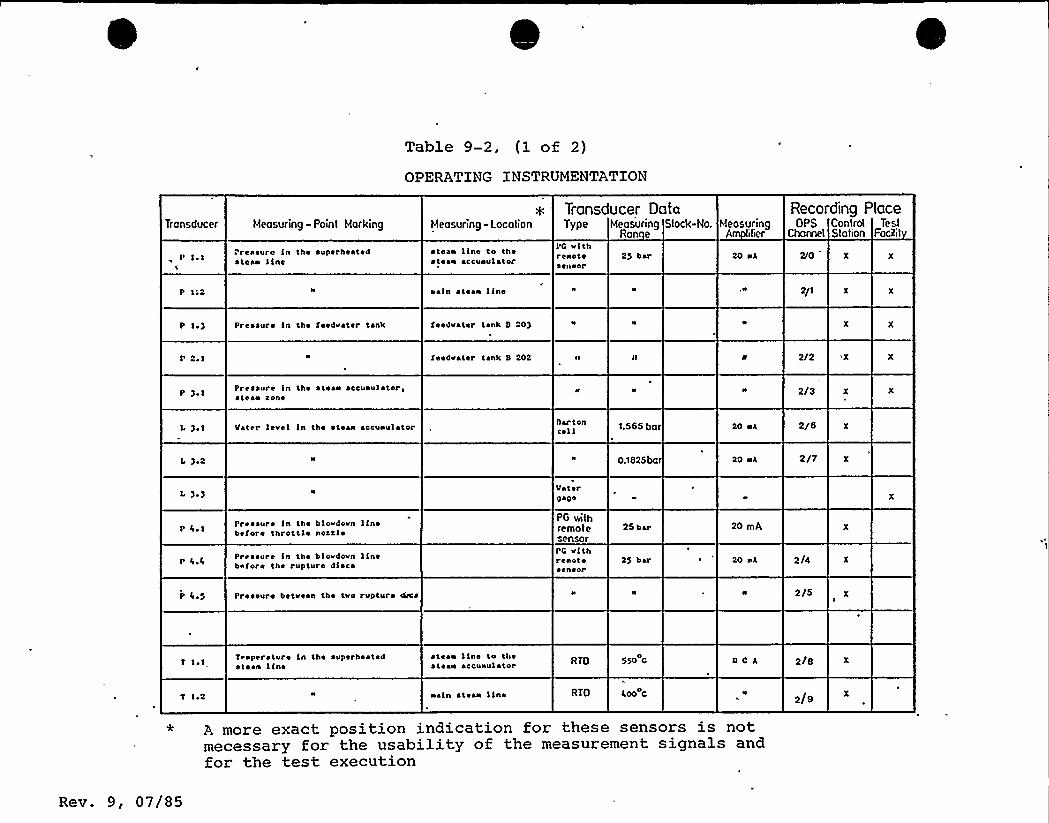
Table 9-2, (1 of 2)
OPERATING INSTRUMENTATION
Transducer Measuring - Point Marking Measuring - LocationTransducer DataType Meosuring Stock-No.
Ran eMeasuring
A ilier. OPS ControlCharnel Station
TestFockit
Recording Place
Pressure ln the superheatedstean line
stean line to the~ tean acc«« ~ E«later
PG vlthrenotese«lsor
25 bar 20 nA 2/0
P 112 ~aln steaa line 2/I
P I~ ) Pressure ln the feedvater tank feedvater tank B "0)
feedvater tank B 202 2/2
P ) ~ IPressure ln the stean accuoulator,stean tone 2/3
L ) ~ I Voter level ln the stean accuaulator Bartoncell 1.565 bar 20 nA 2/6
I ) ~ 2 0.1825bar 20 nA 2/7
< ) ~ )
p I« ~ I Pressure In the blovdovn linebefore throttle nozzle
Prrssure In the blovdovn linebefore the rupture discs
Va'terGage
PG withremotesensorPG vlthreaotesensor
25 bar
25 bar
20 mA
TO nA 2/4
p I« ~ 5 Pressure betveen the tvo rupture «&cs 2/5 X
T 'I ~ I Taapersture In the superheatedstean line
stean line to thestean accunulator RTO 550 C BC A 2/6
T I ~ 2 nein stean line RTO 400 C 2/6
* A more exact position indication for these sensors is notmecessary for the usability of the measurement signals andfor the test execution
Rev. 9, 07/85

0
0
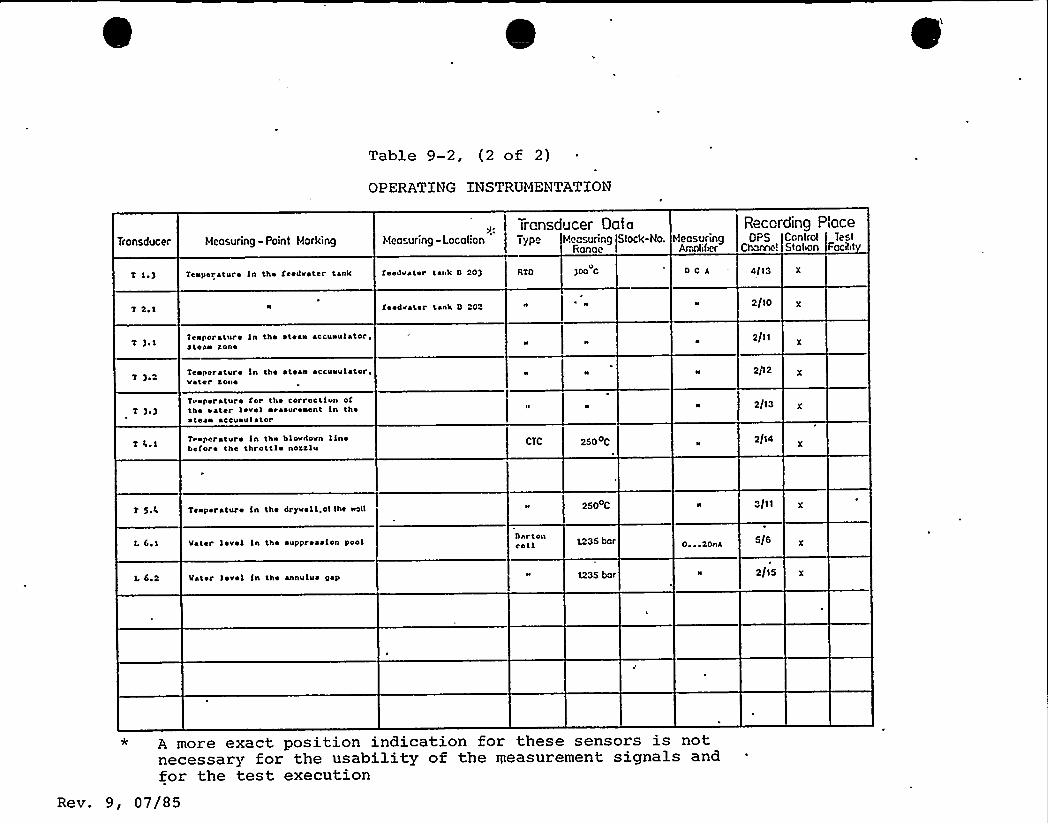
Table 9-2, (2 of 2)
OPERATING INSTRUMENTATION
Transducer Datct Reccrding PtaceTronsducer
T 1 ~ )
Meosuring - Point Marking
Tcsperaturo ln the feadvater tank
hteo uring - Location
feedvater tank D 00)
Qpn
RTO
Meosuring !Stock-hto.Ronoe I
hteosuringAlrBlifcl'CA
OPS ConlrotClone! Stolion
4/13
TestFociilit
T 2 ~ 1 feedvater tank D 203 2/10
Teaporature ln tha stean accuuulator,stean sane
2/11
) ~ 2Teeperature ln the stean accuuulator,vater sano
2/1 2
T ) ~ )Taeperature for the corracttun oftho eater level ocasurenent In thostean accuaulator
2/13
T 6 ~ 1Tveperature ln the hlovdovn linebefore the throttle norsle CTC 250 0C 2/1 4
Tenperature ln tho dryvelt.ct the wall 250oC 3/11
L 6,1 Vater lovel ln tho suppression poolDartoncoll 1235 bor 0. ~ ~ 20na 5/5
h 6.2 Vater level ln the annulus pap 1235 bor 2/15 X
* A more exact position indication for these sensors is notnecessary for the usability of the measurement signals andfor the test execution
Rev. 9, 07/85
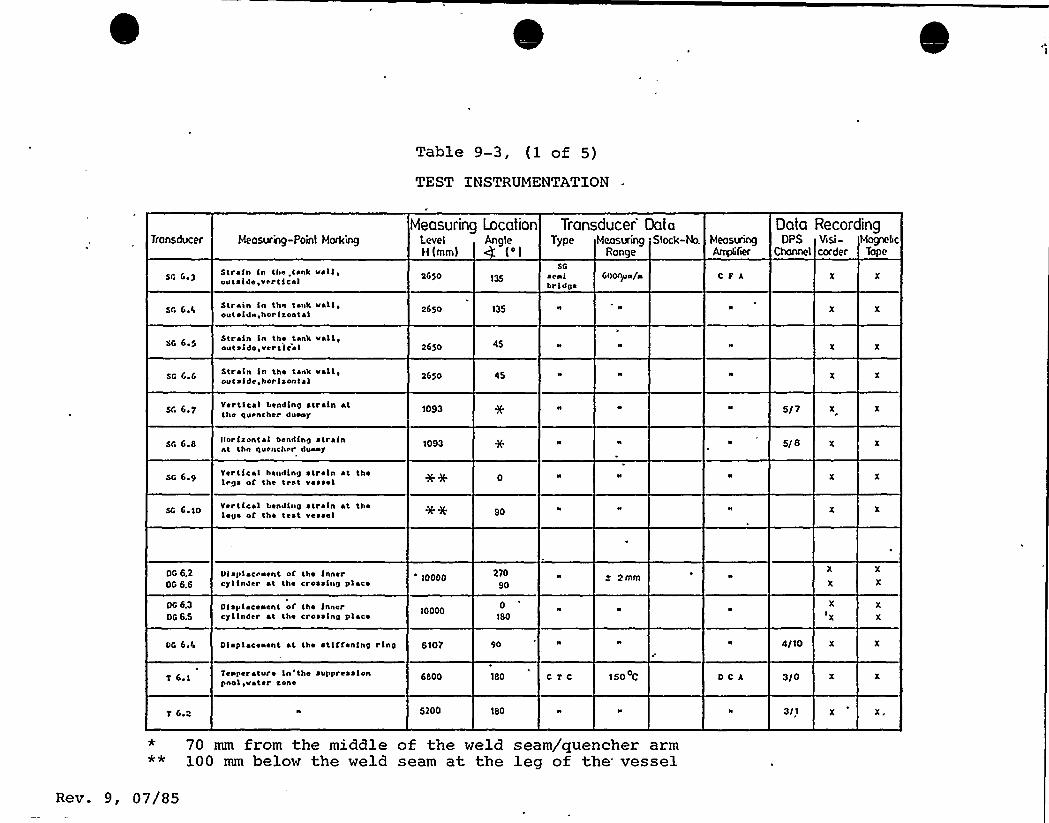
Table 9-3, (1 of 5)
TEST INSTRUMENTATION
Transducer Meosuring-Poinl Morking4 (')9
H (mm)
Measuring LocationLevel An Ie
Transducer'ataeosurlngRonge
apeT M Slock-Na MeosuringAay4fief
ViSi-corder
MognebcTope
OPSData Recording
SG 6.)
sr, G.G
Strain in Che.tank vali ~
outside,verCIcai
Strain In the tank vali ~
outside,horlsontal
2650
2690 135
SGsealbridge
600npo/n
e
C F A
SG G.SStrain ln the tank vail ~
outside, vortical 2680
SC 6.6 Strain in the tankvali'utside,horisont~ I 2650 qs
st 6,7 Vertical bending strain atChe quencher dueoy 1093 5/7
SG G.a Ilorisontal bending ~ trainat the quench r duaay 1093 5/8
SC 6 9Vertical handing strain at thelegs or the test vessel
SC6 10Vertical bending strain at thelegs of the Cast vessel 90
OG 6.2OG 6.6
Uispiacraent of the innercylinder at Che crossing place 10000 210
902mm
OG 6.3OG 6.6
Dlsplaceaent of Che innercylinder at the crossing place 10000
0180
X
X
UG 6.6 Dlsplaceaent at the stiffening ring 61or 90 4/10
V 6.1 Teaperature In the suppressionpool,vater cone 6800 180 CTC 150 C DCA 3/0
7 6.2 5200 180 3/1 X
* 70 mm from the middle of the weld seam/quencher arm** 10 0 mm below the weld seam at the leg of the'essel
Rev . 9, 0 7 / 8 5
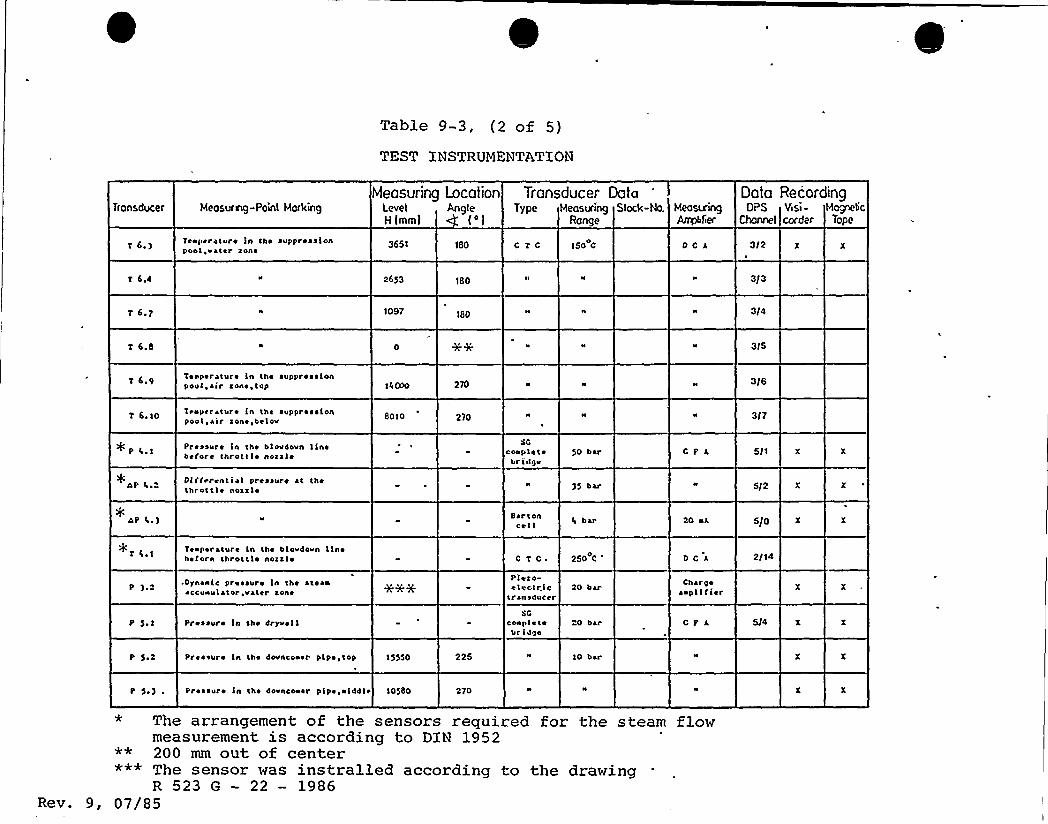
Table 9-3, (2 of 5)
TEST INSTRUMENTATION
Transducer Measuring-Painl MorkingMeasuring Location
Level AngleH {mm)
T MeosuiingRange
Ype
Transducer DataSlack Meosuing
AmphfierMagnebc
TapeVISI-carder
OPSChannel
Data Recording
t 6.) teeperacure in che suppressionpool,vater cone
3651 180 C t C 150 C 0 C A 3 I2
t 6.4 2653 180 3/3
t 6.7 1097 180 3/4
t 6.8 3(5
t 6.g Teoperature In the supprosalonpool ~ air sone ~ Cop 16000 270 3I6
T 6,10 troperature in the suppressionpool ~ alf soneybetov 8010 270 3/7
+P A ~ 1
np C
Pressure in the blovdovn lineberore chrot\I ~ nocti ~
Dirrrrencial pressure at thethrottle noesis
40couplet'r
idgv50 bar
)5 bar
CFA 5 I1
5/2
np A.) Bartoncell C bar 20 nA 5/0
teoporature In the blovdovn lineholore chI'eccl ~ nocsl ~ CTC. 250 C DC A 2/14
p ) h
P 5 ~ I
.Dynanlc pressure In the steanaccuIIul ~ 'tor Ivatel soil~
Pressure In tho dryvol I
Pleco-electr.ic
transducer
$ 0couplet ~bridge
20 bar
0 bar
Chargesop I I f I sr
CFA
P 5et Pressure In the dovncooer pipe,top 15550 225 10 bar
P 5 ~ ) Pressure in Che dovncouer pipe, ~ Iddle 10580 270
The arrangement of the sensors required for the steam flowmeasurement is according to DIN 1952** 200 mm out of center***The sensor was instralled according to the drawingR 523 G — 22 — 1986
Rev. 9, 07/85
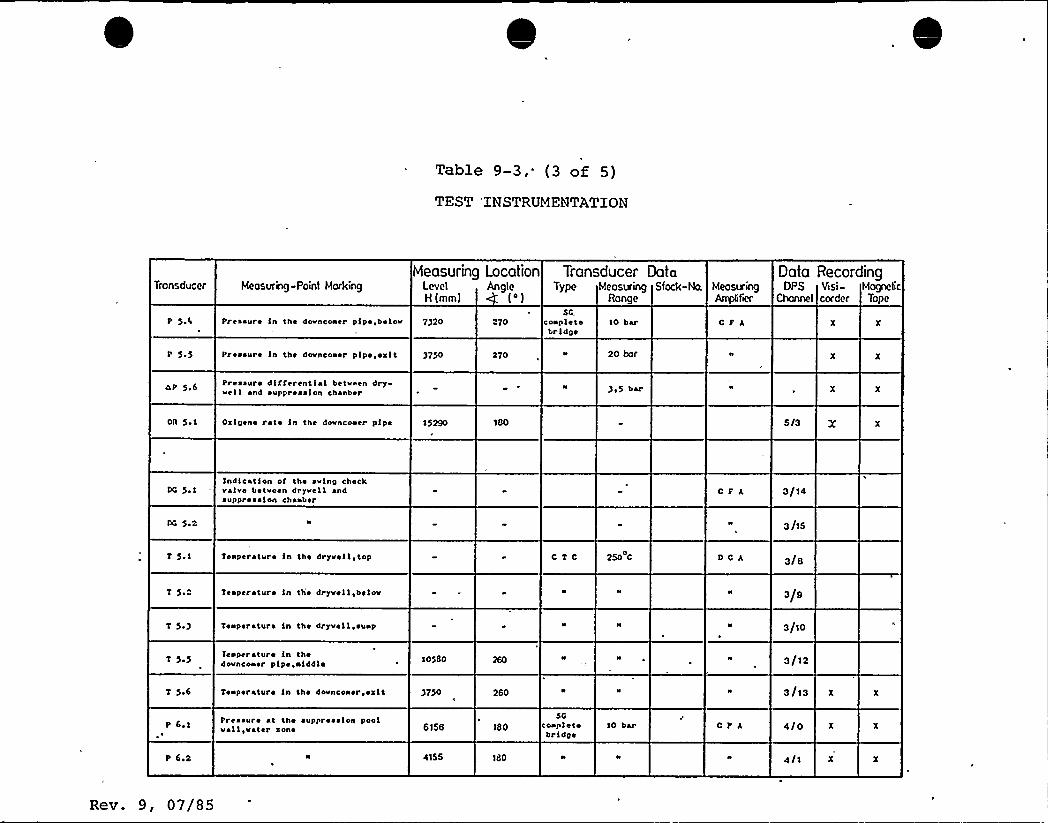
Table 9-3,. (3 of 5)
TEST 'INSTRUMENTATION
Transducer Meosuring -Poinl MarkingMeasuring Location
Level AngleH (mm)
Transducer DataT Nype Meosuring Slock- a
RongeMeosuingAmplifier
OPS ViSI-corder
MognebcTope
Data Recording
P 54 Pressure In the dovnconer pipe,belov 7320 l70SG.
coapletebridge
10 bar C F A
p s.s Pressure in the dovncoser pipe,exit 3750 270 2O bgr
OP 5,6 Pressure differential betvaen dryNell and suppression chasber 3ls bar
OII 5NI Oxlgene rate ln the dovncooer pipe 15290 180 6/3
DG 5 ~ 1
Indication of the svlng checkvalve betvesn dryveII andsuppression chasber
CPA 3/14
DG 5 2 3/IS
T 5 ' Tssperature in the dryvell,top CTC 250 C DC A 3/8
T 5 Tespcrature In the dryvell,belov 3/8
T 5 ' Tesperaturs in the dryvell,susp 3/lo
T 5 ~ 5Iesperature in thedovncooer pipe, ~ Iddle 10580 N 3/12
T 5.6 Teogeraturo In tho dovncoser,exit 3750 260 3/13 X
I 6.1 Pressure at the suppression poolvail lva'ter xone 6156 '180
SGcospletebridge
10 bar CPA 4/o
I'.2 4155 180 4/1
Rev. 9, 07/85
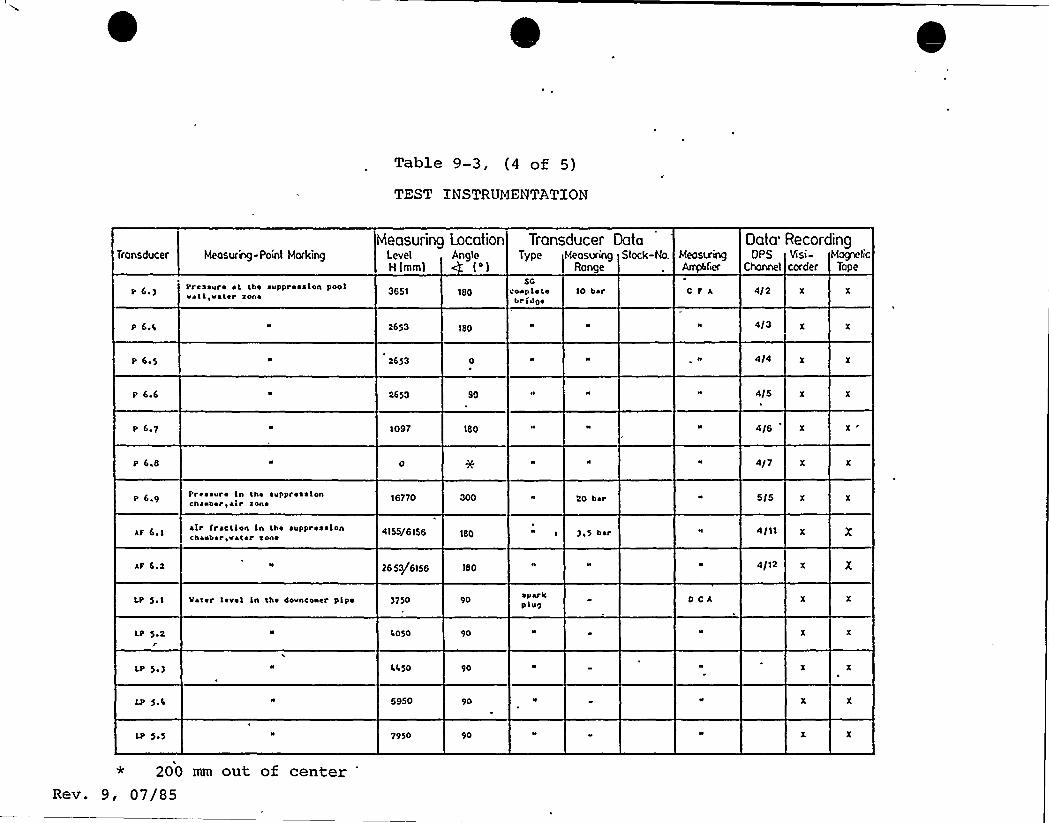
Table 9-3, (4 of 5)
TEST INSTRUMENTATION
Transducer Measuring-Point Markinghieasuring ication
Level AngleH (mm)
Transducer DataT M Slack-NaVpe eosuring
RangeMeasuringAmpbfier
MagneticTape
OPS Vist-cardefChannel
Data'ecording
p C.) Pressure at the suppression poolvail,vater tone 3651 180
sccuspatebrfcge
IO bar cta 4/2
p 6.6 2653 180 4/3
'P 6 ~ 5 2653 4/4
p 6.6 2653 90 4/5
P 6.7 1097 180 4/6
p 6.8 4/7
P 6,9 Pressure ln the suppressionchaabel' alr sons 16770 300 20 bar 5/5
at 6.1 air fraction ln the suppressionchaeberivater cone 4155/6156 180 ) ~ 5 bar 4111
at 6.2 j6 53/6156 '180 4/12
Lp 5 ~ 1 Vater level ln the dovnconer pipe )750 90~parkplug 0 CA
LP 5 ~ 2r
%050 90
LP 5 ~ ) 6650 90
LPS6 5950 90
LP AS 795> 90
200 mm out of centerRev . 9 , 0 7 / 8 5
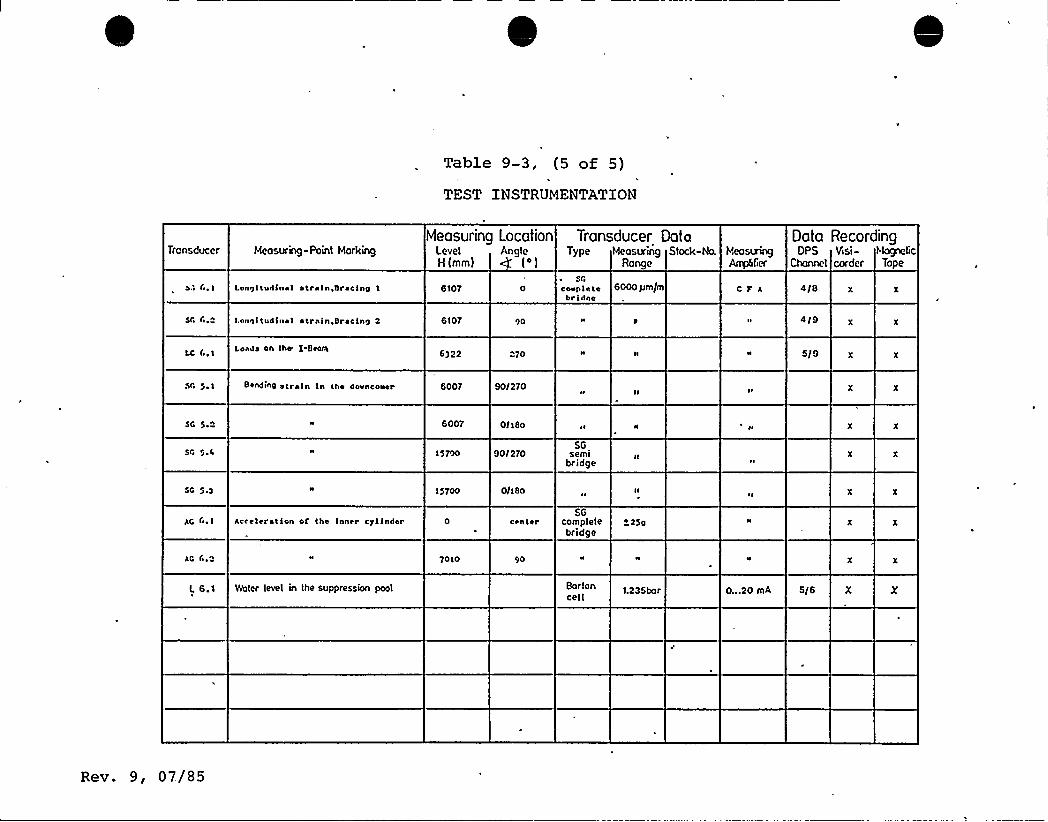
Table 9-3, (5 of 5)
TEST INSTRUMENTATION
Transducer Measuring-Paint MorkingMeasuring Location
Level AngleH tmm)
T M StockeasingRange
Ype
Transducer Data-Ha Measuring
AmplifiertogneticTope
DPS Vi51-corderChannel
Data Recording
SG (a,a
Lonoltudlnal atraln,Brac/ne
Lonqltudlnal atrain,oractna 2
6107
6107 50
sr,coonletebr idee
6000 pm/m CFA 4/6
4/9
LC ri ~ 1Loada on Ihe I Becct
6322 o70 5/9
SG 5,1 8end«Q atraln ln the dovnconer 6007 90/270
so 5 '
SG
6007
15750
0/180
90/270SG
semibridge
SG 5.s
ao ri ~ 1 Acre!aration of tho Inner cylinder
15'700 0/18o
centerSG
completebridge
+ 250
AG 6,0 7010 90
I. 6.1 Water level in the suppression pool Bartoncell
1.235bar 0...20 mA 5/6
Rev. 9, 07/85
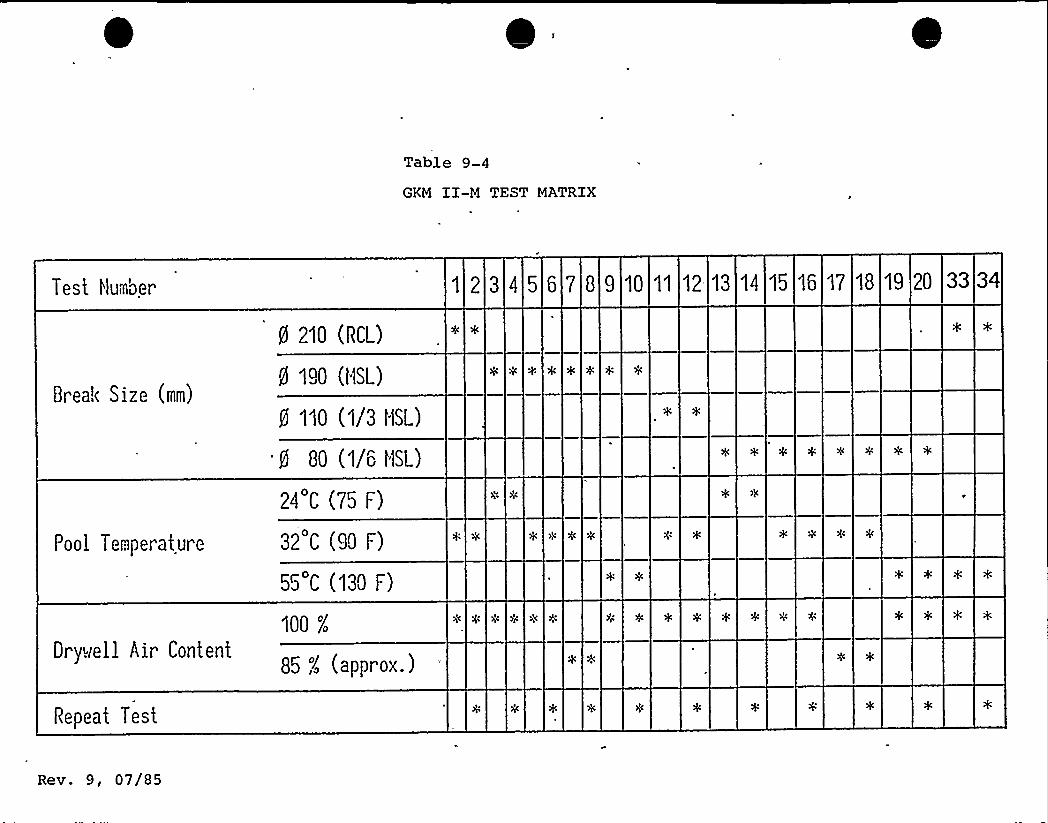
Table 9-4
GKM II-M TEST MATRIX
Test Number
8real< Size (an)
Pool Tenperature
Dry~rell Air Content
Repeat Test
8 210 (RCL)
8 190 (HSL)
0 110 (1/3 llSL)
'0 80 (1/6 HSL)
24 C (75 F)
32'C (90 F)
55'C (130 t-)
100 %
85 ! (approx.)
34
gC
910 1112 13 14 '15 16 'l7 18 19 20 3334
Rev. 9, 07/85
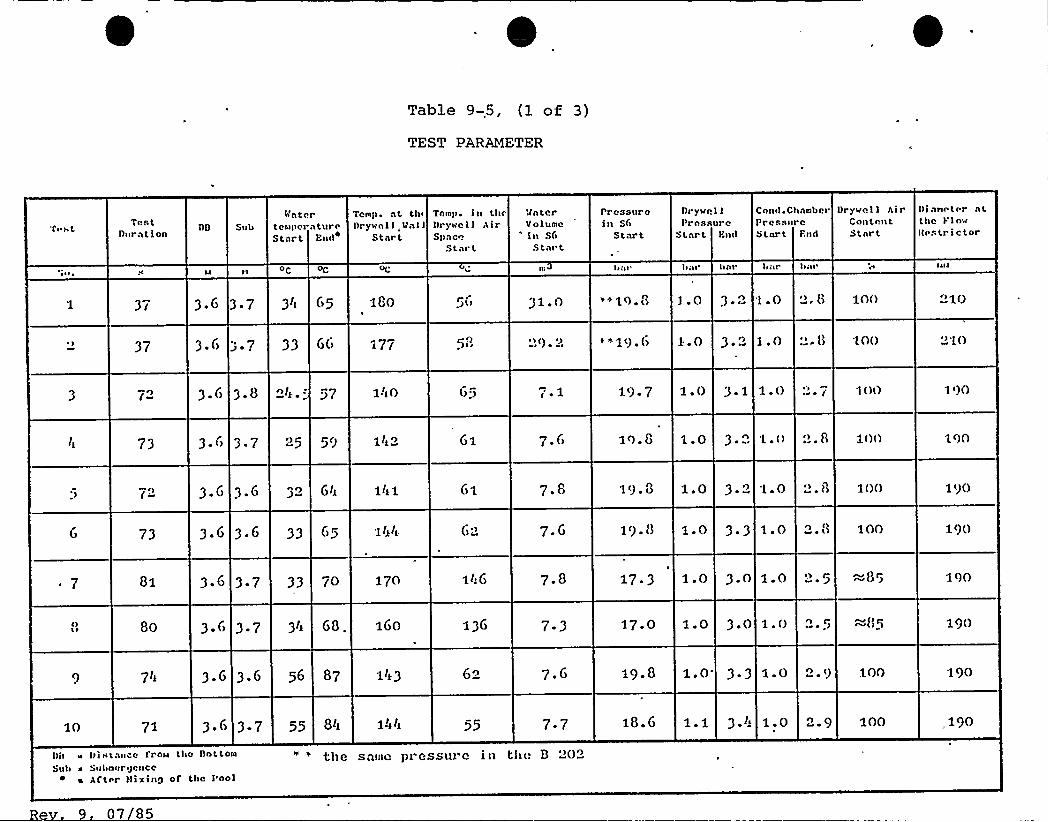
Table 9-5, (1 of 3)
TEST PARAMETER
TestDur«tion DD Sub
l(atr.rteuper
«turc't«rt
Encl
Tc>>>p «I. thl Tc>lll> inthc'rywall,(k«II Ih ylccll Air
Start Sp«ccSl«r t
(<«terV o iu»>cin Sf>
St«rt
Prcssur cin Sf>
St«rt
Drywc,l IPressure
Start Ind
Cond.cha»>herPres«ccrcStart End
Drywc.l I AirCnn t c.n tSt«i t
Di«r>c lrr atthc V I nwIlrstr i c tor
~ ~ ~'c 0<'>«l >el.l
3.6 3.7 3'I C) 5 180 5(> 31.0 '~ 19. 8 1.0 3. 'i .0 1OO n10
3.6 ~ 7 33 GC) 177 C<))ii ' I) ~'P ) s1<). () 1.0 3 2 1 ~ 0 10() "lO
3.C) 3.8 ntk 27 1l(O C)5 19~ 7 1 ' 3 1 1-0 ~ ~ .i (IO 1<)O
73 3. C) 3.7 n 59 G1 7. C) 1 ' 3-n 1 'I-n 3.C) 3.6 Glk 61 7.8 .l<).G 1 ' 3 t 1.0 >) I
~ I) 100 1<)0
C) 3.6 3.6 33 C)5 C)') 7.6 1<) 0L3 1.0 F 3 1.0 100 190
81 3.G 3.7 33 70 170 1l:6 7.8 17 ' 1 ' 3-0 1 ' >) Ci ~ g 190
I)l ~ 80 3.C) 3.7 3ik 160 136 7 3 17 ' 1 0 3 0 1 ' n c-~a ~ ) 190
71k 3.6 3.6 56 87 1ik 3 7.6 19.8 1 0 3 3 1 0 9 100 190
10 71 3 ' 3-7 55 55 7 ~ 7 18.6 1.0 ~ 9 100 190
Dil w I)i»t«nce frow thc Dntto>I>
Sub a SubnclrigcneeAftc r klixing of the l'nol
the sf(hie pvessuk e in til<l 9"0'7
85
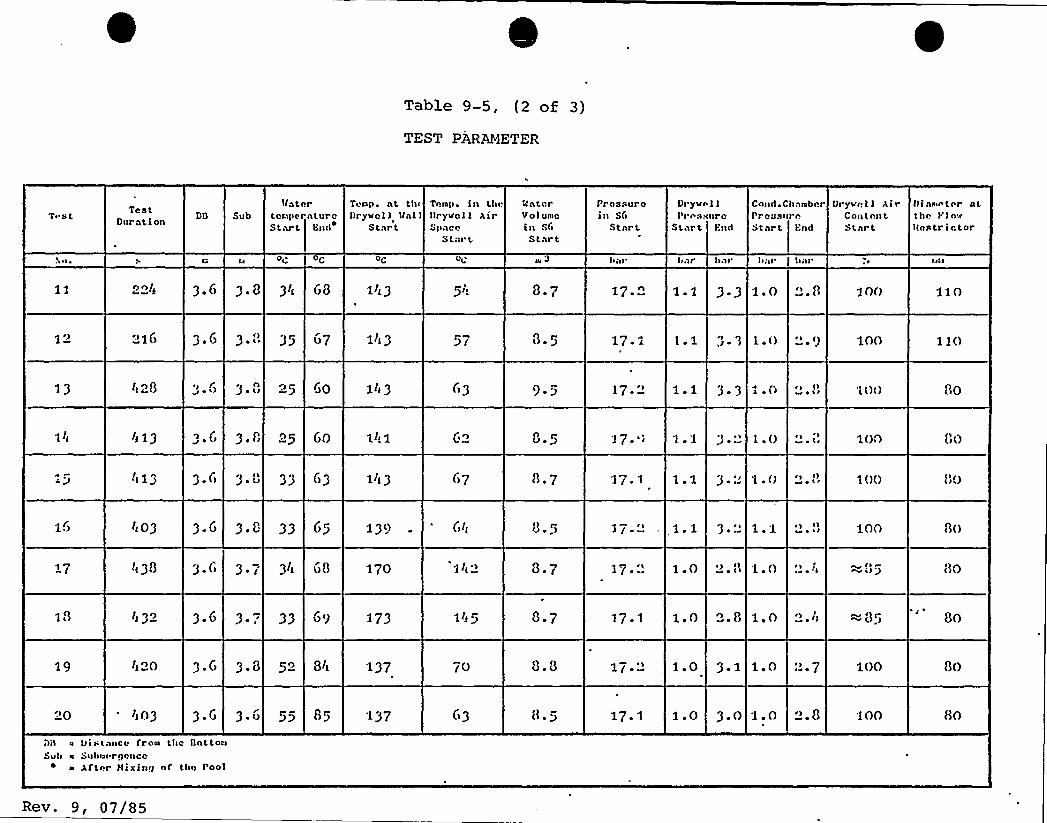
Table 9-5, {2 of 3)
TEST PARAMETER
T< st TestDuration Sub
Matr.rtccq>eratureStart End
od
Tenp. at, tl«Drywc 1 l Val l
Star{.
o{
Towp. in tl«.>l>rywc l l A irSl>acr.
Star{.
lfatcrVol uwcin S(IStar t
Prcssure.in S6
Startb><I'rywcll
Prc swnrr.Start End
b,)r
Cnnd<ChawbrrPress»rr.Start End
b 'I
I'rywol1 Ai rCont>.nt,Start,
l>is>I>rtrr atthn Plowllrstrictor
IQLI
3. C) 3. 8 3ll C)8 1ll3 5>, 8Q7 17- -" 3 ~ 3 '1 ~ 0 '1 00 '110
>1C) 3.G 3 ~ I ~I> 35 C)7 1ll 3 57 A 5 17Q 1 3- '3 ~ I {) 1AA 110
l>28 ~I~ Q)
<>5 Go 1!l 3 C)3 9-5 17." 3Q3 1 ' ~ ~ {>~ ~ ~ I AO
a ~ G 3 ' 8 5 ~ l 'I ~ I~ w 1 Q() ~ I 100 8>0
3. C> 33 G3 1ll 3 C) 7 A ~ 7 17.1 <I< ~ I< i3!)
l>03 3 8 33 G5 139 C>ll 3 ~~ > I>4 ~ QI 100 A()
17 ll 38 3. CI 3 ~ 7 3/l C)8 170 8<7 1.0 ,) I>Q Il 1.0 ~ I
~ ~ IQ C ~QQ< {>g AO
1A ll 3 3. '3 6{) 173 8.7 17-1 1.0 '). AI 1 ' m 8r 80
19 il20 3QG 3Q8 5 ~ 8 l 137. '1/ Q" 1.0 3.1 1 0 ~ ~ 7 '100 80
<I0 ll03 3 ~ v 53 137 C>3 A.5 17-1 1.0 3.0 1.0 ".8Di'> s l>i S>anCI. frOW the llnttcnSu'i> a S»buc rc)ence
w Al'trr Hi xi n<> of thc Pool
Rev. 9, 07/85
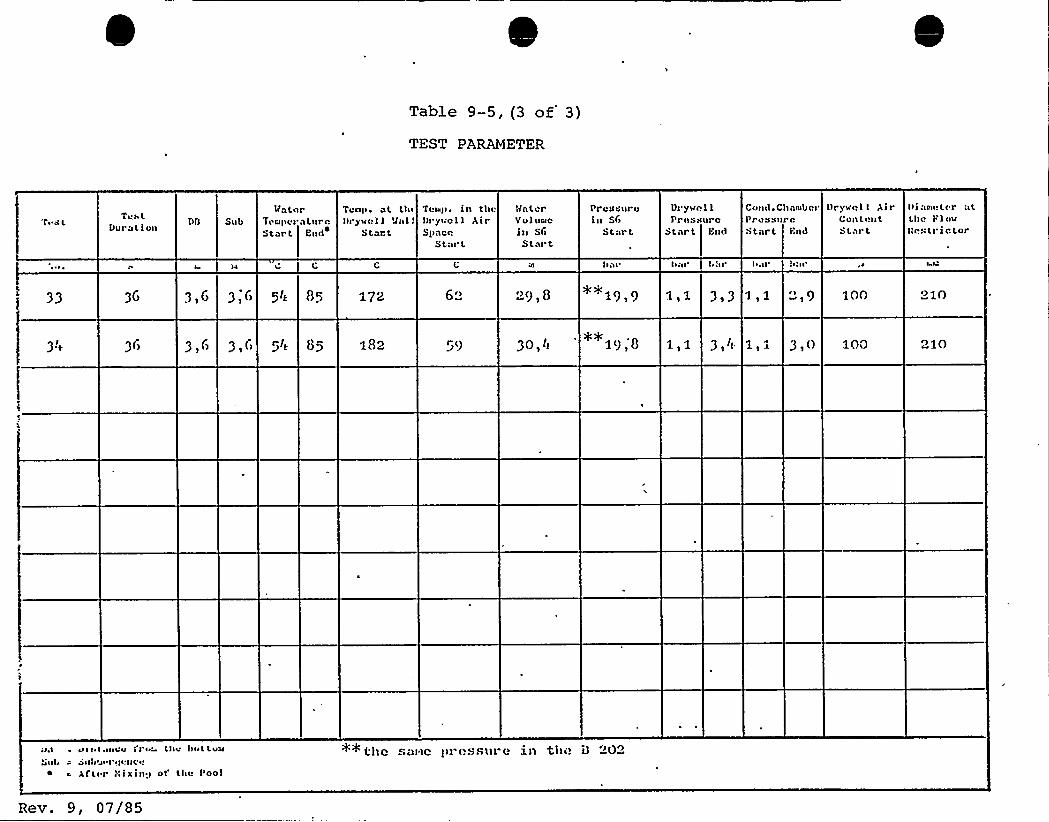
Table 9-5,(3 of 3)
TEST PARAMETER
r. st T<(s L
DU('a L I unSub
Iiatr.rTr(4p«I'a Lurr.Sta('t B»d
Tcn)l. at LI»1)rywc.l I
M»I.'tact
Tc(((<)I in the1)vyl(el I AirSilacc)
Star).
)InterVolus!oi» Sf(Start
Prcssurein Sf(
St.;n t
Dryw(. I IPr»ssurc
Start E»d
Cc»lcl ~ Cha(xb(»Press»rcStart End
1)rywc!11 AirCunt ~!ntSl.ar t
I)i(»((<(trr )ltLhr. I'low)l( st)' etc!
h(<r )>l»' ~ .1)' II 4
33 3G 3,6 172 6" )9,8 2)9 100 210
3 It 3() 3 ) () 3 () yi}. 85 182 30, lI 19,0 1,1 3,II 3,0 100 210
~ <((( ~ I.l(~ l.u "r< lhu hut t<(x(
bu)< " Sl(ha<'I' ,'~:»C ~ .'
a Aftc r I)ixin.) of th« I'ool
*+tlIC SQI'IC l)l (ISRIII C 3.)1 till! D '02
Rev. 9, 07/85
CHAPTER 10
RESPONSES TO NRC QUESTIONS
TABLE 07 CONTENTS
10. 1
10.1 1
10. 1-2
'!0. 1 3
10 2
10-2 1
1022
NRC QUESTIONS
IDENTIFICATION OF QUESTIONS UNIQUE TO SSES
IDENTIFICATION OF QUESTIONS PERTAINING TO THE NRC'REVIEW OF THE DAR
QUESTIONS RECEIVED DURING THE PREPARATION OF THESAFETY EVALUATION REPORT tSER)
R ESPONSES
QUESTIONS UNIQUE TO SSES AND BESPON SES THERETO
QUESTIONS PERTAINING TO THE NRCi S REVIEW OF THE DARAND RESPONSE THERETO
1023 QUESTIONS INFORMALIY RECEIVED DURING THZPREPARATION OF 'THE SAFETY EVAIUATION REPORT (SER)AND RESPONSE THERETO
Rev. 9, 07/85 10- 1
CHAPTER 10
FEGURES
Numbe r- Tit le
10- 1
10-2
10-3
This figure has been deleted.
This figure has been deleted.
Spatial relationship of downcomers a nd pedestalholes
10-4 Transducer locations for the ten vent pipeconf ig uration
10-5 Transducer locations for the six vent pipeconfiguration
10-6 Transducer locations for the two ven t pipeconf iqu.ra tion
1 0-7 Typical pressure time histories from pressuretransducers P20, P25 ... 29 and P134
10-8 Typical pressure time histories from pressuretransducers P20, P25 ... 29 and P 134
10-9 Frequency distribution of measured normalized wallpressures
10-10 pool wall pressures at three circumferential ventexit locations — 1/6 scale 3 vent geometry
10- 11 pool wall pressures at three circumferential ventexit locations — 1/10 scale 19 vent geometry
10-12
10- 13
10-14
Plan locations of transducers for wetwell
Locations of pressure transducers for wetwell
vent exit elevation pool wall pressures for a chugfrom JAERZ test 0002
10-:I 5 Comparison of probability density of the normalizedpressure amplitudes from GKM ZI-M tests 3 ... 10and JAZR E
10- 16 Comparison of probability density of the normalizedpressure amplitudes from GEM IX-M tests 11 6 12 andJAER I
Rev. 9, 07/85 10- 2
FIGURES (Cont.)
Num her Tit-le.
10-17 Comparison of probability density of the normalizedpressure amplitudes from GKH II-M tests 13 ... 20and JAERI
10-18 Comparison of pressure response spectra o f test21 2 — all valve case — and the SSES leaddef inition
10-19 Comparison of pressure response spectra o f test.21.2 — all valve case and one valve case — and theSSES load definition
10-20 SSES containment response spectra — KHU SRVC76-Asymmetric dire ct ion '.horizontal
10- 21 SSES containment response spectra — KHU SRV476-Asymmetric direction vertical
10- 22 SSES containment response specttra — KHU SRV076-Asymmetric direction horizontal
1 0-23 SSES containment response spectra — KHU SBV076Asymmetric direction vertical
10- 24 SSES containment response spectra — KHU SRV076Asymmetric direction horizontal
10- 25 SSES containment response spectra — KHU SRV076Asymmetric direction vertical
10-26
10-17
SSES containment response spectraAsymme tric direction hor izontalSSES containment response spectraAs ym me tric dir ect ion ver t ica l
KHU SRVC76
KHU SRVC76
10-28 SSES containment response spectra — KHU SRV576Asymmetric direction horizontal
1 0-29 SSES containment response spectra — KHU SRV076Asymme tric direction vertical
10-30 SSES containment response spectra — KHU SRVC76Asymmetric direction horizontal
10-31 SSES containment response spectra — KHU SRV076Asymmetric direction vertical
10-32 SSES containment response spectra — KHU SR V476Asymme tric direction horizontal
Rev 9 ~ 07/85 1 0-3
PIGUBZS (Cont )
Number Title-10-33. SSES containment response spectra — KWU SBV¹76-
Asymmetric direction vertical10-34 SSES containment response spectra — KWU SBV¹76-
Asymmetric direction horizontal
10-35 SSES containment response spectra — KWU S RV¹76-Asymmetric direction vertical
10-36 SSES containment response spectra — KWU SRV¹76-Asymmetric direction h oriz on tal
10-37 SSES containment response spectra — KWU SRV¹76-Asymmetric direction vertical
10-38 SSES containment response spectra — KWU SRV¹76-A symme tric direction horizontal
10-39 SSES containment response spectra. — KWU SRV¹76-A s ymm etr ic direct ion ve rtica1
10-40 SSES containment response spectra — KWU SRV¹76-Asymmetric direction horizontal
10-41 SSES containment response spectra — KWU SRV¹76-Asymmetric direction vertical
10-42 LGS containment response spectra — KWU SRV¹76-Asymmetric — direction horiz on tal
10- 43 LGS containment response spectra — KWU SRV¹76Asymmetric — direction vertical
10-44 LGS containment response spectra — KWU SHV¹76-Asymmetric - direction horizontal
10-45 LGS containment response spectra — KWU SRV¹76-Asymmetric — direction vertical
10- 46 LGS containment response spectra — KWU SBV¹76-Asymmetric — direction horizontal
10-47 LGS containment response spectra — KWU SBV¹76Asymmetric — direction vertical
10-48 LGS containment response spectra — KWU SRV¹76-Asymmetric - direction horizontal
10-49 LGS containment response spectra — KWU SRV¹76-Asymmetric - direction vertical
Rev. 9, 07/85 10-4
PXGQRES- (Cont )
Hnmber- Title]0-50 LGS containment response, spectra — KWU SRV076
A symmetric — direction h orizontal10- 51 LGS "ontainment response spectra — KWU SRVt76
Asymmetric — direc tion vertical10-52 LGS containmeat response spectra — KWU SRVN76
Asymmetric — direction horizontal
10-53 LGS containment response spectra — KWU SRY076Asymmetric — direction vertical
10- 54 LGS containment response spectra — KWU SR V076Asymmetric — direction horizontal
10-55 LGS containment response spectra — KWU SRV076Asymmetric - direction vertical
10-56 LGS containment response spectra - KWU SRV076A s ymm etr ic — dire ction horiz on ta 1
10- 57 LGS containment response spectra — KWU SRVN76Asymmetric — direction vertical
10-58 LGS containment response spectra — KWU SR V476Asymme tric — direction hor izo nta l
10-59 LGS containmeat response spectra — KWU SRY576Asymmetric - direction vertical
10-60 LGS containment response spectra — KWU SRV$ 76Asymmetric — direction horizontal
10-61 LGS containment response spectra — KWU SRVN76Asymmetric — direction vertical
10-62
10- 63 .
LGS containmeat response spectra — KWU SRV076Asymmetric — direction horizontal
LGS containment response spectra — KWU SRV076Asymmetric — direction verticalReactor Pressure Transient — Case 2. a WithoutShutdown Cooling
10-65 Suppression Pool Temperature Transient — Case 2.aWithout Shutdown Cooling
Re v. 9, 0 7/'85 10-5
CHAPTER 10
TABLES
gumber-
10- 1
Title'ormalized
RHS vent staticpressure and variance — JAZRZ data
10-2 Comparison of JAERI/GKM II-N,normalized mean variance
Rev. 9, 07/85 1 0-6
10 0 . RESPONSES-'ZO NBC-gUESTZONS
This chapter will provide responses to those Nuclear RegulatoryCommission (NRC) questions which have been designated byReference 10 (as amended) to be -found in the plant-unique DesignAssessment Report, to those questions for which the response inReference 10 is inapplicable, to those questions generated fromprevious NRC reviews of the plant unique DAR, and those questionsreceived durinq preparation of the SER. The NRC questions forwhich responses wi11 be provided are identified in Subsections10.1.1, 10.1.2, and 10.1.3, and detailed resposes to thesequestions are found in Subsections 10. 2. 1, 10.2.2 and 40.2.3.
Re v. 9, 07/85 10-7
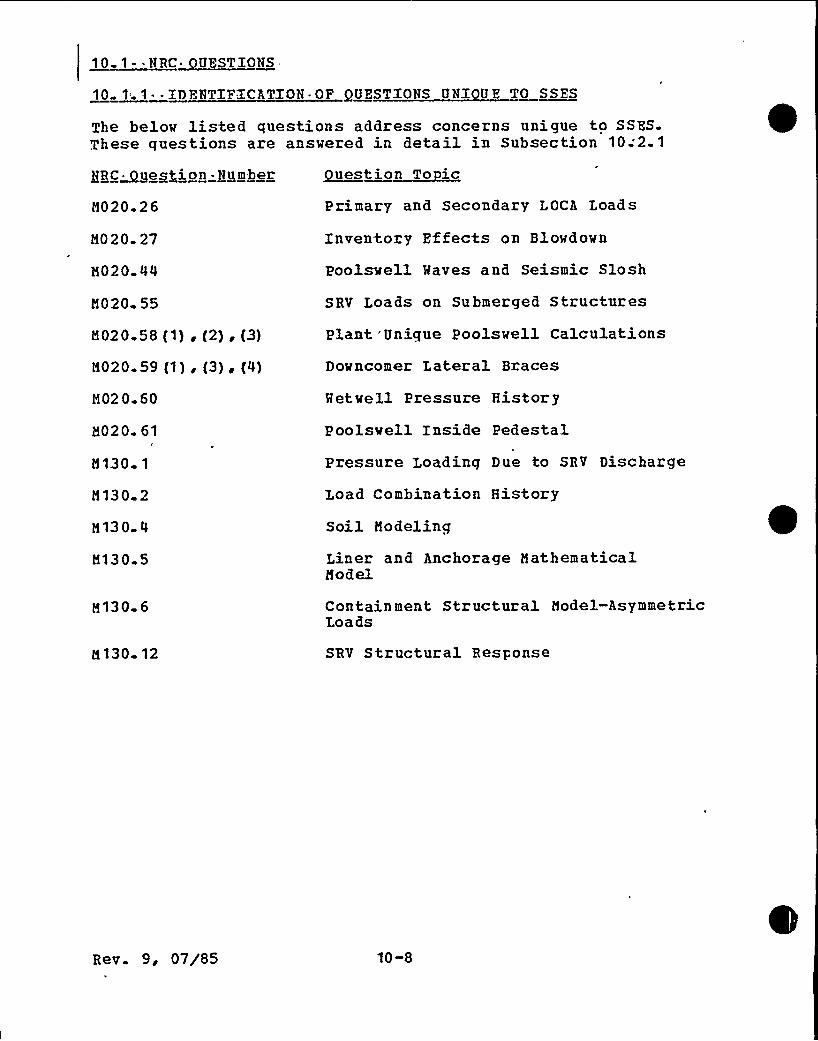
10-1 - ~ RRC~URSTIOUS
10 1 1- - IDENTIFICATION~ OF QUESTIONS UNI UE TO SSES
The below listed questions address concerns unigue to SSES.These questions are answered in detail in Subsection 10;2.1
+BC~ueggion -Number
M020 26
M020. 27
M020.44
M020 55
M020 58 (1), (2), (3)
M020-59 (1) i (3) e (4)
M02 0-60
M020 61
guestio~nTo icPrimary and Secondary LOCA Loads
Inventory Effects on Blovdown
Poolsvell Maves and Seismic Slosh
SRV Loads on Submerged Structures
Plant Unique Poolsvell Calculations
Dovncomer Lateral Braces
Metvell Pressure History
Poolsvell Inside Pedestal
M130 1
M130 2
M130. 4
M130 5
M130 6
Pressure Loading Due to SRV Discharge
Load Combination History
Soil Modeling
Liner and Anchorage MathematicalModel
Containment Structural Model-AsymmetricLoads
M 130- 12 SRV Structural Response
Rev. 9, 07/85 10-8
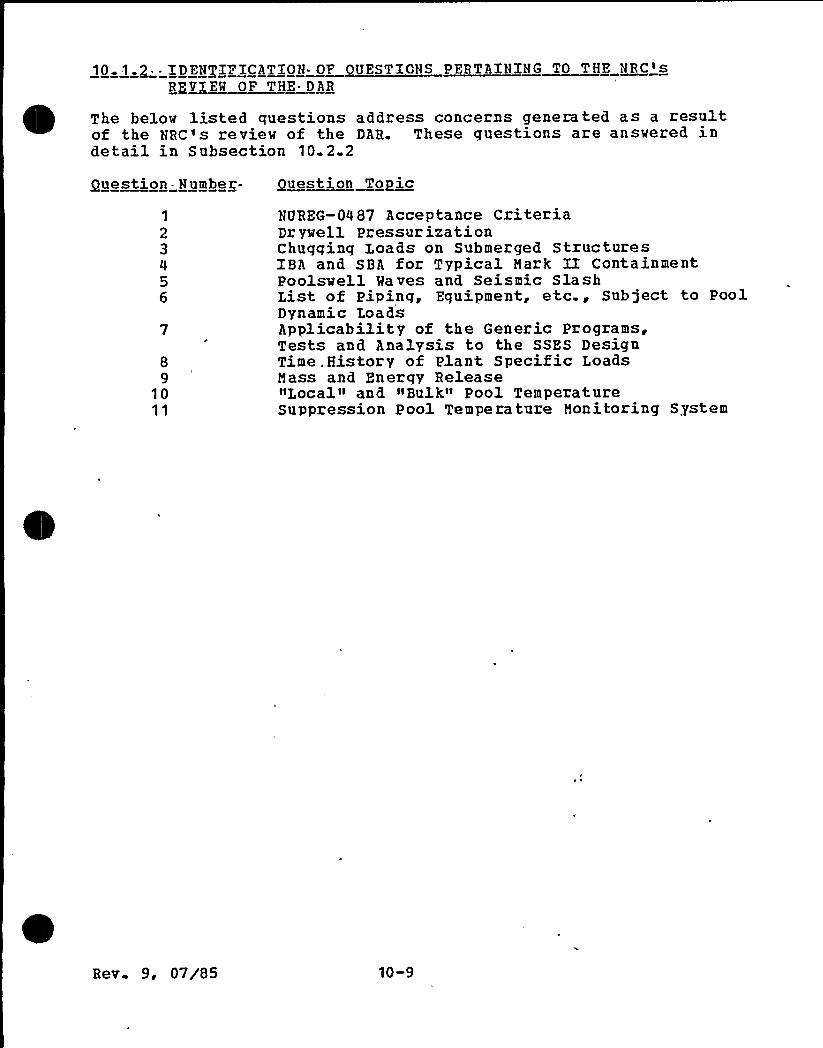
=l.2 = =- * " it"—"REVIEW OP THE. DAR
O The below listed questions address concerns generated as a resultof the NRC's review of the DAR. These questions are answered indetail in Subsection 10.2.2
Ouestion-Number- Question Topic
89
1011
NUREG-0487 Acceptance CriteriaDrywell PressurizationChugging Loads on Submerged StructuresIBA and SBA for Typical Mark II ContainmentPoolsvell Waves and Seismic SlashList of Piping, Equipment, etc., Sub ject to PoolDynamic LoadsApplicability of the Generic Programs,Tests and Analysis to the SSES DesignTime. History of Plant Specific LoadsMass and Energy Release»Local" and "Bulk'~ Pool TemperatureSuppression Pool Temperature Monitoring System
Rev 9, 07/85 10-9
~10. 1- ~DESTTONS ~ RECEIVED ~ DURING- THE PREP AR ATION OF T HESAFETY-EVAT.UATION-REPORT SERi
The belov listed questions vere informally received during theNRC's preparation of the SER. These questions are answered indetail in Subsection 10.2.3..
~estion ~Hmber-
23
5
ILSSES LOCA Steam Condensation Load Definition{SER Item 027)T-Quencher Frequency Range (SFR Item 428)SSES ADS Load Case (SZR Item $ 28)Quencher Bottom Support at Karlstein (SER Item 028)Bending Moment in the Quencher Arm Recordedat Karlstein (SER Item 428)Suppression Pool Temperature Response (SER Item 830)Local to Bulk Temperature Difference for SSES(SER Item 430)Quencher Steam Mass Flux (SER Item 030)
Rev. 9, 07/85 10-10
10 g ~ RESPONSES-
1~0. 1 - QUESTIONS UNIQUE TO. SSES llNO RESPONSES THERETO
QUESTION MO 20 2 6
The DFFR presents a description of a number of LOCA relatedhydrodynamic loads without differentiating between. primary andsecondary loads. Provide this differentiation between theprimary and secondary LOCA-related hydrodynamic loads. We
recognize that this differentiation may vary from plant to plant..We would designate as a primary load any load that has or willresult in a desiqn modification in any Mark II containment sincethe pool dynamic concerns were identified in our April 1975generic letters.JESPONS'8 MO20- 26
The table below shows the LOCA-related hydrodynamic loads on theSSES containment. Those loads which have resulted in containmentdesign modifications are designated as»Primary Loads. «Theseprimary loads result from the poolswell transient.
Drywell floor uplift pressures during the wetwell compressionphase of poolswell lead to the decision to increase the SSESdrywell'floor design safety margin for uplift pressures byrelocating drywell floor shear ties.Poolswell impact, drag, and fallback loads resulted in therelocation of equipment in the SSES wetwell to a position abovethe peak poolswell height. Furthermore, the downcomer bracingsystem was redesigned
All other LOCA-related hydrodynamic loads are designated as"Secondary Loadstt since no design modification has resulted fromtheir presence.
LOCA Qggd-
1. Wet well/Drywell Pressures(During Poolswell)
2. Poolswell Impact Load
3. Poolswell Drag Load
4. Downcomer Clearinq Load
5. Downcomer Jet Load
6. Poolswell Air Bubble Load
7. Poolswell Fallback Load
X(1)
X(2)
X(3)
x(~)
~~ S econ da~r J,o ad'~
Rev. 9, 07/85 10-11
LOCA- Load- » Primar~Load « »Secondary Load»
8. Mixed Flow CondensationOscillation Load
9. Pure Steam CondensationOscilla tion Load
10. Chugging
11. Metwell/Drywell Pressure andTemperature during DBA LOCA(Long Term)
12..Metwell/Drywell Pressure andTemperature during IBA LOCA(Long Term)
13. Metwell/Drywell Pressure andTemperature during SBA LOCA{Long Term)
Footnotes.-',(1) Shear ties chanqed in drywe 1 floor.(2) Equipment moved in wetwell.
(3) Equipment moved in wetwell. Bracing system redesign.
{4) Equipment moved in wetwell.
gQZ~SXM- N ops,g7
The calculated drywell pressure transient typically assumes thatthe mass flow rate from the recirculation system or steamline isequal to the steady-state critical flow rate based on thecritical flow area of the'et pump nozzle or steamline orificeHowever, for approximately the first second after the breakopening, the rate of mass flow from the break will he greaterthan the steady-state value. It has been estimated that for aNark I containment this effect results in a temporary increase inthe drywell pressurization rate of about 20 percent above thevalue based solely on the steady-state critical flow rate. Thedrywell pressure transient used for the LOCA pool dynamic loadevaluation, for each Mark II plant, should include this initiallyhigher blowdown rate due to the additional fluid inventory in therecirculation line.~SQOQSQ- $~00 27-
The drywell pressure transients have been recalculated by GE(Reference 7) with the additional blowdown flow rate produced by
Rev. 9, 07/85 10-12
the inventory effects included in the analysis. The LOCA loadspresented in Section 4. 2 have been calculated using theserecalculated drywell pressure transients. Specifically, thedrywell pressure transient resulting from the DBA LOCA includingthe effects of pipe inventory has been used as input to thepoolswell model.
OFSTION 020-44 ~
Table 5-1 and Figures 5-1 through 5-16 in the DFFR provide alistinq of the loads and the load combinations to be included inthe assessment of specific Mark II plants. This table and thesefigures do not include loads resulting from pool swell wavesfollowinq the pool swell process or seismic slosh. He requirethat an evaluation of these loads he provided for the Mark IIcontainment desiqn.
RESPONSE M020 44
Subsections 4.2 4.6 and 4.2 4.7 provide our response.
UESTION M020 55
The computational method described in DPPR Section 3.4 forcalculating SRV loads on submerged structures is not acceptable.It is our position that the Mark II containment applicationsshould commit to one of the followinq two approaches:
(1) Design the submerged structures for the full SRVpressure loads acting on one side cf the structures; thepressure attenuation law described in Section 3.4. 1 ofNEDO-21061 for the ramshead and Section A10.3.1 of NEDO-11314-08 for the guencher can -he applied for calculatingthe pressure loads.
(2) Follow the resolute.on of GESSAR-238 HI on this issue.The applicant for GESSAR-238 NI has proposed a methodpresented in the GE report, ~~unsteady Drag on SubmergedStructures,~~ which is attached to the letter dated March24, 1976 from G.L.„Gyorey to R.I.. Tedesco. This reportis actively under review.
MGZQHSg-d020,55.
Ioads on submerged structures due to SRV actuation are discussedin Subsection 4 1.3.7.
0 ST ~ 0 0 58.
Relatinq to the pool swell calculations, we require the followinginformation for each Mark II 'plant:
f1) Provide a description of and justify all deviations fromthe DPPR pool swel3. model. Identify the party
Rev. 9, 07/85 10-13
responsible for conductinq the pool swell calculations(i. e., GE oz the AGE) . Provide the program input andresults of bench mark calculations to qualify the poolswell computer proqram.
(2) Provide the pool swell model input includ.ing all initialand boundary conditions. Shov that the model inputrepresents conservative values with respect to obtainingmaximum pool swell loads. In the case of calculatedinput, (i.e , drywell pressure response, vent clearingtime), the calculational methods should he described andjustified. In addition, the party responsible for thecalculation (i.e , GE or the AGE) should be identified.
(3) Pool svell calculations should be conducted foz eachMark II plant. The following pool swell results shouldbe provided in graphic form for each plant:
(a) Pool surface position versus time
(h) Pool surface velocity versus time
(c) Pool surface velocity versus position
(d) P zessure of the suppression pool air slug and thevetvell air versus time.
JiE~KLH=-A specific response to this question can he found inSubsection 4.2.1.1. Vezification of the SSES poolswellmodel is provided in Appendix Section D.l.
(2) Input and discussion of the poolswell model input can befound in Tables 4-17, 4-18, and Section 4.2.1.1.
(3) The requested graphic results of the SSES poolsvellcalculation can he found in Figures 4-38, 4-39, 4-40,and 4-43.
UE STION M 020 59-
In the 4T test report NEDE-13442P-01 Section 3 3 the statement ismade that for the various Mark II plants a vide diversity existsin the type and location of lateral bracing between dovncomersand that the bracing in the 4T tests vas designed to minimize theinterference with upward flow. Provide the folloving informationfor each Mark IX plant:
A description of the dovncomer lateral bracing system.This description should include the bracing dimensions,method of attachment to the downccmezs and walls,elevation and location relative to the pool surface. Asketch of the bracing system should be provided.
Re v 9, 07/85 10-14
(2) The basis for calculatinq the impact or drag load on thebracing system or downcomer flanges. The magnitude and,duration of impact or drag forces on the bracing systemor downcomer flanqes should also be provided.
(3) 'n assessment of the,.effect of downcomer flanges on ventlateral loads.
RESPONSE- M020 59.
(1) Subsection 7. 1 2. 1 describes the SSES bracing system andthe methodology for assessing the adequacy of bracingsystem
(2) The basis for calculating the impact or drag loads onthe downcomer bracing system (El 668') and downcomerstiffener rings (El. 668'nd El 682') is given inSection 4. 2. The maqnitude and duration of impact ordrag forces on the bracing system and downcomezstiffener rings is also given in Section 4.2 .
(3) This item is not applicable to the SSES design.
~OMSTIOH M020,60-
In the 4T test report NEDE-13442P-01 Section 5.4.3 2 thestatement is made that an underpressure does occur with respectto the hydrostatic pressure prior to the chug. However, thepressurization of the aiz space above the pool is such that theoverall pressure is still positive at all times during the chug.Me require that each Mark IX plant provide sufficient informationregarding the boundary underpressure, the hydrostatic pressure,the air space and the SRV load pressure to conf irm this statementor alternatively provide a bounding calculation applicable to allMark II plants.Q~S~ONSP ~ M020.60
This information is provided in Subsection '7 1 3 of the DAR.
QUESTION $ 0 20 6.1-
Significant variations exist in the Mark II plants with regard tothe desiqn of the wetwell structures in the region enclosed bythe reactor pedestal These variations occur in the areas of (1)concrete backfill of the pedestal, (2) placement of downcomers,
= (3) 'wetwell air. space volumes, and (4) location of the diaphragm. relative to the pool surface. Xn addition to variation
between'lants,for a given'lant, variations exist in some of theseareas within a given plant As a result, for a given plant,significant differences in the pool swell phenomena can occur inthese two zeqions. He will require that each plant, provide asepazate evaluation of pool swell phenomena and loads inside ofthe reactor pedestal.
j
Rev 9, 07/85 10-15
RES PONS Z. Ã 0 20. 6-1-
The SSES pedestal and wetvell area is shown on Figures 1-1 and10.3. Due to the absence of downcomers in the pedestal interior,no pool swell would he expected in this region. There are 12holes in the pedestal, hovever, eight of which would allov theflov of water from the suppression pool to the pedestal during aI.OCA Some downcomers are near the pedestal flow holes, leadingto the possibility that air could be blown through the pedestalholes, which vould lead to a greater pedestal pool swell thanvould be experienced by incompressible water flow alone. Onevould expect the pedestal pool swell to he much zeduced from thesuppression pool swell due to its relative sepazation from thesuppression pool and the lack of direct charging from downcomervents. Indeed, 1/13.3 scale model tests of the SSES pedestaldesign conducted at the Stanford Research Institute under thesponsorship of EPRI show that the pedestal pool swell is lessthan 20 percent of the pool swell in the suppression pool(Reference 32) . There is no piping or equipment inside the SSESpedestal and, since the pedestal pool svell is very small, theonly load involved due to pedestal pool svell would he a small ipacross the pedestal due to different vater levels between thesuppression pool and. the pedestal interior. This load isconsidered in the design of the SSES pedestal.
~UESQQOQ N 130 1-
Provide in Section 5 a description of the pressure loadings onthe containment -wall, pedestal wall, base mat, and otherstructural elements in the suppression pool, due to the variouscombinations of SRV discharges, including the time function andprofile for each combination. If this information is notgeneric, each affected utility should submit the information asdescribed above.
ggS+OQSE $ 130 1-
Chapter 4 describes the pressure loadings and time histories dueto SBV discharge and other hydrodynamic loads.
U ST 0 8130 2-
In DFFR Section 5.2 it is stated that the load combinationhistories are presented in the form of bar charts as shown onFigures 5-1 through 5-16. It is not indicated how these loadcombination histories are used. In particular, it is not clearwhether only loads represented hy concurrent bars vill becombined, and it should be noted that depending on the dynamicproperties of the structures and the rise time and duration ofthe loads, a structure may respond to tvo or more given loads atthe same time even though these loads occur at different times.Also, although condensation oscillations are depicted as bars onthe bar charts, the procedure foz the analysis of structures dueto these loads has not been presented Accordingly., the
Rev. 9, 07/85 10-16
description of the method should include consideration of such~ conditions. Also, for condensation oscillation loads and for SRV
oscillatory loads, include low cycle fatigue analysis.
RESPONSE H 130 2-
The loads will be combined according to Section 5.0. Section 7.0describes the assessment methodology and. results for the re-assessment of SSES for the hydrodynamic and non-hydrodynamicloads.
QUESTION~I30 4-
Through the use of figures, describe in detail the soil modellingas indicated in DFFR Subsection 5.4.3 and describe the solidfinite elements which you intend to use for the soil-RESPONSE- 8130 4-
Soil modelling is explained in Subsection 7.1. 1.1.
U STION - M130 5-
Describe the mathematical model which you will use for the linerand the anchorage system in the analysis as described in DFFRSubsection 5.6.3.
m"'he
mathematical model which will be used for analysis of theliner and the anchorage .fox hydrodynamic suction pressures isdescribed in Subsection 7 1.3.
UF STION - 1 30 6.
In DFFR Subsection 5 1.1 1 it was stated that the SRV. dischargecould cause axisymmetric or asymmetric loads on the containmentIn Subsection 5. 4. 1 an axisymmetric finite element computerprogram is recommended for dynamic analysis of structures due toSRV loads, and no mention is made of the analysis for asymmetricloads. Describe the structural analysis procedure used toconsider asymmetric pool dynamic loads on structures and throughthe use of figures, describe in more detail the structural modelwhich you intend to use.
ggS pggSg - g13O,6-
The dynamic analyses and models used are explained in Chapter 7'.
Re v. 9, 07/85 10-17
QUESTION ~ N130 12-
Reference is made in DFFR Subsection 5.4.3 to studies ofstructural response to SRV load. Provide citations for thisreference and where such studies are not readily available,copies are requested
RESPONSE-N-130 1-2
Studies mentioned in DFFR Subsection 5.4.3 are the results ofanalysis completed for a specific plant at the time of writing ofthe DFFR. Reference to the studies was intended to indicate theneed for considerinq strain dependent soil properties For theSSES analysis, Reference 33 is used to determine the soilconstants in the analysis.
Rev. 9, 07/85 10-18
RZSPONSE THEHETO-
The LOCA and SHV related, pool dynamic loads that are currentlyacceptable to us are discussed in NUREG-0487. Table IV-1 ofNUHZG-0487 summarizes these Mark II pool dynamic loads. Byletter, dated February 2, 1979, you indicated on Table IV-1 theLOCA related dynamic loads acceptable to the staff that will beadopted for SSES. Revise the DAR to incorporate this informationand provide the same information for the SRV related pool dynamicloads. For both the SHV and LOCA loads indicate the alternativecriteria that will be used for each item for which an exemptionis proposed and provide references that discuss these alternativecriteria.RESPONSE.
See response to Question 021.69 contained in Volume 16 of theSSZS FSAR and Table 1-4 of the DAR.
Subsecti.on 4.2.1.1 of the DAR state that the drywell pressuretransient used for the pool swell portion of LOCA is based on themethodol'oqy described in NEDO-21061. Subsection III-B-3.a.6 ofNUREG-0487 requires that a comparison similar to those presentedin reference 1~ be made if the model used is different from themodel described in NEDM-10320. Me require the model prior tocompletion of r eview of the pool swell calcula tions.
+Reference (1) Letter "Response to NRC Request for AdditionalInformation (Round 3 Questions," to J. F. Stolz (NHC-DPM) from L.J. Sobon (GE), dated June 30, 1978.
RESPONSE
See response to Question 021.70 contained in the SSES FSAH.
Q~FSTTON- 3-
Subsection 4. 2. 2 2 of the DAR states that the chugging loads onsubmerged structures and imparted on the downcomers will beevaluated later. Provide the present status of these evaluationsand. the schedule for your submission of the completed evaluation
RESPONSE
See response to Question 021.71 in the SSES FSAR.
~BEST 0 N . 4-
Hev. 9, 07/85 1 0-19
Statements are made in Subsections 4.2.3.2 and 4.2.3.3 of the DAR
that plant unique data of the Susquehanna SES intermediate breakaccident (IBA) and small break accident (SBA) are estimated fromcurves for a typical Mark II containment. Discuss theapplicability of these analyses (e. g., power level, initialconditions, downcomer configuration, etc.) to Susquehanna SES.
RESPONSE ~
See response to Question 021.72 contained in the SSES FSAR.
~IJESTION-5-
Provide the information previously requested in 020.44 regardingloads resultinq from pool swell waves following the pool swellprocess or seismic slosh..Discuss the analytical model andassumptions used to perf orm these analyses
RESPONSE.
See response to Question 021.73 contained in the SSES FSAR.
gll?'.STION= 6-
Provide a list and drawing to identify all piping, equipmentinstrumentation and structures in containment. that may besubjected to pool dynamic loads. In addition, provide 'drawingsto show the location of access galleys in the wetwell, the ventvacuum breaker configuration, wetwell grating, vent bracingconfiguration, vent configuration in the pedestal region ofwetwell and large horizontal structures in the pool swell zone.
RESPONSE
See response to Question 021.74 contained in the SSES FSAR.,
g Ug ST/ON ~ 7-
Discuss the applicability of the generic supporting programs,tests and analyses to Susquehanna SES design (i.e., FSI concerns,downcomer stiffners, downcomer diameter, etc.).RESPONS E ~
See response to Question 021.75 contained in the SSES FSAR.
OOESTIPN- 8 ~
Provide the time history of plant specific loads and assessmentof responses of plant structures, piping, equipment andcomponents to pool dynamic loads. Identify any significant plantmodifications resultinq from pool dynamic loads considerations.
Rev. 9, 07/8 5 1 0-20
RESPONSE
See response to Question 021.76 contained in the SSES FSAB.
QHESTXON 9"
Provide figures showing reactor pressure, quencher mass flux andsuppression pool temperature versus time for the followingevents:
(1) a stuck-open SRV during power operation assuming reactorscram at 10 minutes after pool temperature reaches 110<F andall RHR systems operable;
(2) same as event (1) above except that only one RHB trainavailable;
(3) a stuck-open SRV during hot standby condition assuming 120~Fpool temperature initially and only one BHR train available;
(4) the Automatic Depressurization System {ADS) activatedfollowing a small line break assu'ming an initial pooltemperature of 1200F and only one RHB train available; and
(5) the primary system is isolated and depressurizing at a rateof 100<F per hour with an initial pool temperture of 120~Fand only one RHR train available.
Provide parameters such as service water temperature, RHR heatexchanqer capability, and initial pool mass for the analysis.
RESPONSE-
See response to Question 021.77 contained in the SSES FSAR.
g)~US~T+0- 1 0-
With regard to the pool temperature limit, provide the followingadditional information:
(1) Definition of the»local» and "hulk" pool- temperature andtheir application to the actual containment and to the scaledtest facilities, if any: and
(2) The data base that support any assumed difference between thelocal and the bulk temperatures.
/~SPONSOR
See response to Question 021.78 contained in the SSES FSAR.
Bev. 9, 07/85 10- 21
QUESTION 11.
Por the suppression pool temperature monitoring system, providethe following additional information:
(1) Type, number and location of temperature instrumentation thatwill be installed in the pool; and
{2) Discussion and justification of the sampling or averagingtechnique that will be applied to arrive at a 'definitive pooltemperature..
R ESPON SE-
See response to Question 02-1.79 contained in the SSZS PSAR.
Bev. 9, 07/85 10-22
10. 2.3 Questions Received During the Preparation of the SafetyEvalna tj,on a~eort an~dRes ense Thereto
'UESTION1.
Mith regard to the SSES LOCA steam condensation load definition,provide the following additional information:
(1) Justification for the interchangeability of the GKM II-Mtemporal chug strength probability distribution with thespacial variation of chug strengths at SSES.
(2) Justif ication for not considering CO 6 SRV (ADS) .
(3) Comparison of the CO measured at 4T-CO with the CO absezvedat GKM II-M.
\
RESPONSE 1.
(1) The SSES LOCA steam condensation load definition assumes thatthe chuqs occurrinq. simultaneously at different vent pipes ofSSES have different intensities and follow the samedistribution of chuq amplitudes in time as in the GKM II-Msingle vent facility. This assumption forms the basis foztwo key elements of the LOCA load definition.The first element assumes that the average of simultaneouslyoccurring chuqs at different vents in SSES is eguivalent tothe averaqe of consecutive GKM II-M chugs. Thus, asdocumented in Subsection 9.5 3.1.2, the random amplitudechuqs at SSES were replaced with the same chug at every ventwhich repzesents the average of consecutive GKM II-M chugs or» mean va 1 ue" ch uq.
The second element assumes that the chug amplitude orstrength at the individual SSES vents aze random variableswhich have the same probability distribution as thedistribution of chug amplitudes at GKM II-M. The GKM ZI-Mprobability distribution was then applied statistically to ananalytical model of the SSES suppression pool to calculatethe symmetric and asymmetric amplitude factors. Thesefactors were then applied to the selected mean value chugs toachieve the desired exceedance probability prior totransportation to SSES for containment analysis (seeSubsections 9.5.3.4.1 and 9.5.3.4.2) .
These two elements infer that the multi-vent facility iscomposed of many»single cells» whose chug strengths varystochastically and independently of each other. The randomnature of chugqinq is explained qualitatively by looking atthe actual bubble collapsinq mechanism. The most plausiblemechanism for bubble collapse at the individual vents appearsto be the convection in the pool. This means that bubblecollapses at indivdual vents aze triqgered by the local
Rev'. 9, 07/85 10-23
tur hule nt convection at each vent. Thus due to thestochastic nature of turbulence, the time at which rapidcondensation and hence bubble collapse is triggered variesfrom vent to vent. This implies that the size of the hubbleformed before collapse starts, will also vary from vent tovent. Therefore, the chug strength will vary from vent tovent. Since, the GKM II-M tests were designed to beprototypical of SSES (i e., same initial pool temperature,same steam flow, etc.), this random variation is expected tobe similar for both the GKM II-M single vent facility and theSSES plantAdditional qualitative data verifying the random nature ofchugging is provided hy numerous multi-vent test programs.Specifically, the KRU multi-vent concrete cell tests inKarlstein, Creare suhscale multi-vent tests and JAERI fullscale multi-vent tests provide multi-vent data of thechugging ph enomena.
The Karlstein facility investigated the chugging phenomenafor 2, 6, and 10 vents at subscale Each vent in theconcrete cell was instrumented with a pressure transducer insuch a way that it was indicative of the chug strength forits respective vent Figures 10-4, 10-5, and 10-6 illustratethese vent transducers and the remaining transducers foz the10, 6, and 2 vent facilities, respectively.
Figures 10-7 and 10-8 show typical pressure time historiesfor the pressure transducers mounted near the vent pipes forthe six vent confiquration. These pressure transducers wezeall exposed to a steam environment and clearly indicate thatthe chuq strenqths differ by up to a factor of 10.
In addition, Figure 10-9 shows that the distzibution'frelative frequencies of the measured wall pressures becomesnarrower as the number of vent pipes increases from 2 to 6 to10. Again, the variation in chug strengths results in alower qlobal pressure amplitude with increasing number ofven ts.This variation in chug strengths was also observed in theCreare subscale multi-vent test program. This observationwas obtained by examining the pool wall pressures measured atthe three different circumferential locations at the ventexit. All test qeometries had three transducers located 120oapart circumferentially at the vent exit elevation In themulti-vent qeometrics, each of these pressure transducers waslocated close to a particulaz vent. Therefore, the amplitudeof the POP measured at each circumferential location reflectsto a large extent the chug strength at the vent closest to it(since pressure amplitude varies inversely with the distancebetween the vent and wall pressure measurement location) .For example, only if the chug strengths at all vents were
Rev. 9 ~ 07/85 1 0-24
identical, would the peak over-pzessuze (POP) measured ateach of these three circumferential locations be identical.
Fiqure 10-10 shows the pool wall pressures at the threecircumferential vent exit locations in the 1/6 scale 3 ventqeometry. The steam mass flux was 8 ibm/sec ft2 and asdetermined from the vent static pressures over 80% of thechugs shown had all three vents participating. This figureshows that the POP's at the three locations are different forindividual chuqs. Therefore, it can be concluded that thechug strength varies from vent to vent.
Similar data from the 1/10 scale 19 vent geometry at a steammass flux of 8 ibm/sec ft~ are shown in Figure 10-1 1.Aqain, from vent static pressure data for vents closest toeach circumferential wall pressure measurement location, itwas determined that all three vents participated in the chugsshown. The POP's at the three different circumferentiallocations are seen as being different for individual chugs.Note that the variation of chuq strength from vent to vent isexpected to be stochastic to a large extent. Therefore, itis expected that for some chuqs, the chug strength at thethree vents would be similar.Additional proof that the chug strengths in a multi-ventfacility behave stochastically is qiven by the JAERI multi-vent test d.ata. There are several pool wall pressuretransducers that are located near the exits of differentvents in the JAERI facility. Specifically, tzansudcers WMPF-
202, 302, 602, and 702 are located at the vent exit elevationnext to vents 2, 3, 4, and 7, respectively (see Figure 10-12and 10-13). The pressure amplitudes measured by thesetransducers reflect the chug strengths at vents closest tothem.
The variation of chug strengths at individual vents is shownin Figure 10-14. The pool wall pressures at the vent exitelevation for a chug occur at 62. 5 seconds in JAERI test0002. In this chug event, a high amplitude chug occurred atvent 7 as indicated by the large pressure spike at HWPF702-The other vents had relatively smaller chugs. Keep in mindthat the variation of chug strengths from vent to vent isstochastic in nature and that not all pool chugs will exhibitthe larqe variation seen in Figure 10-14. Nonetheless,varying degrees of variation in chug strengths from vent tovent were found in all the chugs from Tests 0002, 2101, and3102 for which expanded time traces are available.
So far, we have stated that chugging is stochastic in nature,and as such the chug strengths are expected to vary, eventhough the same thermodynamic conditions exist at each ventti.e., steam air content, mass flux, bulk pool term perature,etc.). As presented above, this phenomena has been observedin numerous multi-vent test facilities. However, we have not
Rev. 9, 07/85 10-25
quantitatively verified our assumption of theinterchangeability of the tempozal chug streng th variationsat GKM ZI-M with the spacially varying chug strengths a4SSES. Again, the Creare subscale multi-vent test data andJAERI test data provide information vezifying theconservatism of this assumption Each will be presentedbelow
As. previously stated, one element of ouz LOCA load definitionreplaces the random amplitude chugs at SSES with the samechug at every vent, which is representative of the mean valuedata at GKM II-M. The Creare test data coupled with theaccepted acoustic methodology provides verification of thisassumption.,Creare has acoustically modeled the 1/10-scalesinqle and multi-vent geometries and they have derived asource which represents the mean value chug in the 1/10-scale
'inqle vent geometry
They then placed this mean value chug source at each ventlocation of their acoustic model for the 1/10-scale 3, 7, and19 vent qeometries. For each of the three multi-ventgeometries, the pressure time histroy at the pool bottomelevation (same as the transducer location at this elevationin the test qeometries) was computed for 20 chuq events.Each chug event involved selecting start times for individualvents randomly vithin a 20 msec time vindov. The multi-ventmultiplier vas then computed based on the mean POP at thepool bottom elevation for the 20 computed chugs. Thepzedicted multi-vent multipliers compared quite favorablywith the measured values. Subsection A 5.2.2 of Reference 66qives a detailed description of the analysis and results.Thus, for subscale multi-vent qeometries, the first elementof our LOCA load definition is verified.Final quantitative justification for our key assumption isprovided by comparinq the available JAERI full-scale multi-vent data vith the GKM ZZ-M sinqle vent data.
There are'vo sets of JAERI data available that can be usedto infer chug strengths at individual vents in a given mul'ti-vent chug event. The first set is the pool wall pressuredata from the pool wall transducers located at the vent exitelevation. Zn the JAERI test geometry, there vere four poolvali pressure transducers-MRPF 202, 302, 602, and 702-locatedsuch that each of these transducers is very near the exits offour individual vents. Therefore, the pressure data from agiven transducer reflects the chug strength at the ventclosest to that transducer
As previously stated, the data from these wall pressuretransducers vere used to qualitatively show that the chugstrengths vary siqnificantly from vent to vent in a JAERZmulti-vent chug event. Unfortunately, since a pooltransducer»sees» pressures due to chugs at all vents to
Rev. 9, 07/85 10-26
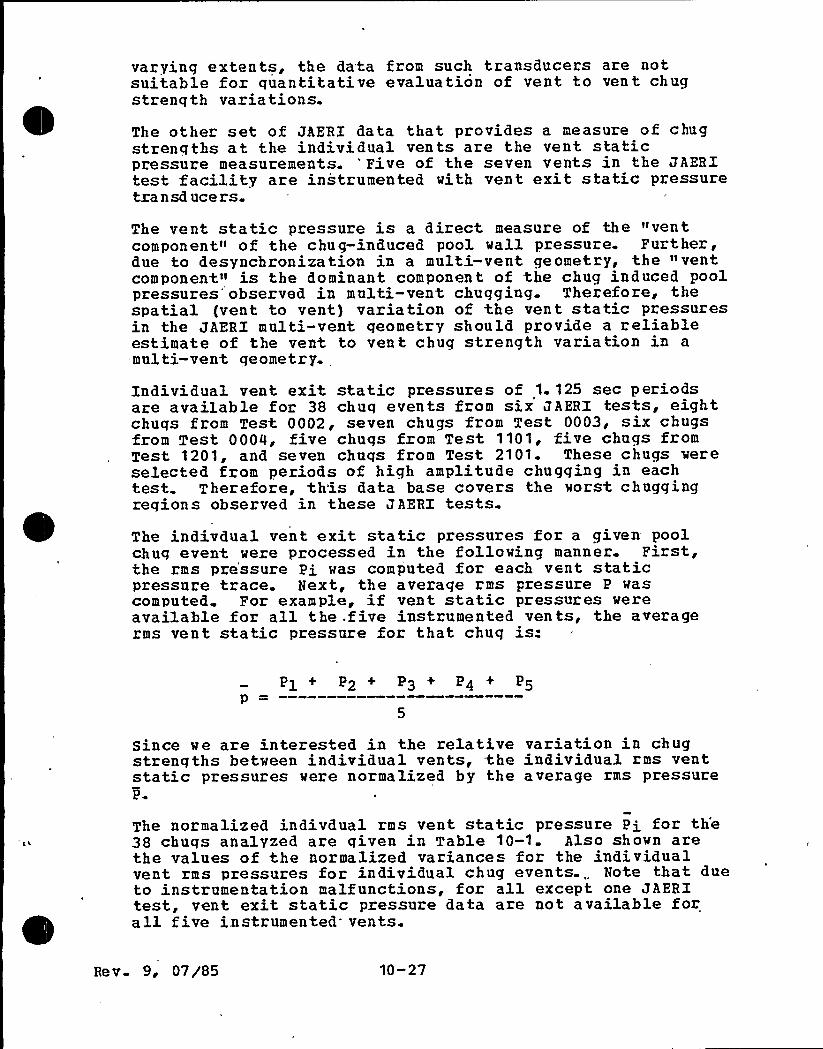
varying extents, the data from such transducers are notsuitable for quantitative evaluation of vent to vent chugstrenqth variations.
The other set of JAERI data that provides a measure of chugstrengths at the individual vents are the vent staticpressure measurements. 'ive of the seven vents in the JAEBItest facility are instrumented with vent exit static pressuretransd ucers.
The vent static pressure is a direct measure of the "ventcomponent" of the chug-ind,uced pool wall pressure. Further,due to desynchronization in a multi-vent geometry, the <>ventcomponential is the dominant component of the chug induced poolpressures'observed in multi-vent chugging. Therefore, thespatial (vent to vent) variation of the vent static pressuresin the JAERI multi-vent geometry should provide a reliableestimate of the vent to vent chug strength variation in amulti-vent geometry.
Individual vent exit static pressures of 1. 125 sec periodsare available for 38 chuq events from six JAERI tests, eightchuqs from Test 0002, seven chugs from Test 0003, six chugsfrom Test 0004, five chuqs from Test 1101, five chuqs fromTest 1201, and seven chuqs from Test 2101. These chugs wereselected from periods of high amplitude chugging in eachtest. Therefore, th'is data base covers the worst chuggingregion s observed in these J AERX tests.The indivdual vent exit static pressures for a given poolchug event were processed in the following manner. First,the rms pressure Pi was computed for each vent staticpressure trace. Next, the average rms pressure P wascomputed For example, if vent static pressures wereavailable for all the .five instrumented vents, the averagerms vent static pressure for that chug is:
Pl + P2 + P3 + P4 + P5p
since we are interested in the relative variation in chugstrenqths between individual vents, the individual rms ventstatic pressures were normalized by the average rms pressureP
The normalized indivdual rms vent static pressure Pi for th'38 chuqs analyzed are given in Table 10-1. Also shown arethe values of the normalized variance s for the individualvent rms pressures for individual chug events., Note that dueto instrumentation malfunctions, for all except one JAERItest, vent exit static pressure data are not available forall five instrumented vents.
Rev 9 ~ 07/85 10-27
Due to small number of vents (at most five) for which ventstatic pressure data are available, it is difficult to drawmeaningful statistical inferences for vent to vent chugstrength variations from any one individual pool chug event.Therefore, .it is necessary to make an assumption that allowsthe use of the data from all 38 chug events such thatmeaninqful statistical inferences can be drawn. Thisassumption is that the normalized statistical distribution ofchug strengths from vent to vent is independent of blowdown .
conditions. That is, the normalized. vent to vent chugstrenqth for all 38 chuq events are samples selected from thesame statistical population. Note that this is precisely thesame assumption made in analyzing the temporal statisticalproperties of the GKM II-M single vent data (see Subsection9.53 2 1)
The GKM II-M data that, provides a direct measure of the ventcomponent of the chug strength are the pool wall pressuredata band pass filtered between 0.5- 13 Hz. In this frequencyrange, the pool wall pressures measured are due to the ventpressure oscillations produced by the chug (see Subsection9 4 2. 1 2)
As described in Subsection 9 5. 3. 2. 1, the pressure amplitudesof individual chugs were normalized by the sliding mean valueover a given time interval. In this way, a normalized database reflecting the temporal variations of chug strengths wasobtained for all the GKM II-M tests. Note that againimplicit in this procedure is the assumption that .thestatistics of the variation of the normalized chug strengthsis independent of system conditions. As previouslymentioned, this assumption was also, used for combining theJAERI data for 38 pool chug events into a single statisticaldata base.
The histograms of the normalized chug strengths for,thevarious GKM II-M tests are given in Figures 9-181, 9-182, and9-1 83
At this point, we now have a normalized vent to vent chugstrength variation data base from the JAERI multi-vent testsand a corresponding normalized chug to chug strengthvariation data base from the GKM II-M single vent tests.
3e v. 9, 07/85 10-28
Table 10-2 shows the variance for the JAERI and GKN II-M databases. The variance for the JAERI data base is the averagevalue of the individual variances shown in Table 10-1 foreach of the 38 chug events. The variance of the GKN II-Mdata was calculated for the 0 5-13 Hz band passed dataplotted in Figures 9-181, 9-182, and 9-183. It is seen thatthe average variance from the JAERI tests is virtuallyidentical to the variance from the GKM II-M Pull MSL tests¹and is somewhat greater than the variances. from the 1/3 and1/6 MSL GKN II-M tests. This implies that the variation ofvent to vent chug strengths in the JAKRI multi-vent tests isequal to or greater than the chug to chug strength variationobserved in the GKM II-M single vent tests.Figures 10-15 through 10-17 show the comparison of theprobability density histograms of the JAERI data and the lowband passed GKN ZI-M Full MSL, 1/3 MSL and 1/6 MSL data,respectively. Again, the JAERI and GKM II-M data histogramsare quite similar.Prom the above comparisons it can be again concluded that theassumption that the vent to vent variation in chug strengthsin a sinqle vent geometry is equivalent to the vent to ventchug strength variation in a multi-vent geometry, used indevelopinq the SSES chugging load definition from the GKM II-N single vent test data is quite reasonable.
Additional verification of the conservatism of the SSES LOCAload definition is provided by comparing the wall loads atJAERI calculated with the SSES LOCA load definition with theavailable JAERI wall load data (see Subsection 9.5.3.5. 1).Piqures 9-268 and 9-269 show that the SSES LOCA loaddefinition bounds the available JAERI data by a substantialmazqin. Please note that the wall loads calculated by theSSES LOCA load definition do not include the symmetricamplitude factor and thus represent »mean value» chugs.
(2) The Mark II Owners have specified two different CO loads forcontainment analysis- The first CO load (CO 1) correspondsto the CO occurring at the beginning of a postulated LOCA andthe second CO load (CO 2) corresponds to the reduced CO loadcccurrinq later in the blowdown. For containment analysis,the Owners combine the reduced CO 2 load with loads due toSRV (ADS), on the basis that ADS occurs later in a LOCAjustifying a reduced CO 'load for the combination CO 6 SRV(ADS)
¹Thethe
full MSL break chuq strength statistics were used to developSSES probabilistic amplitude factors.
Rev. 9, 07/85 10-29
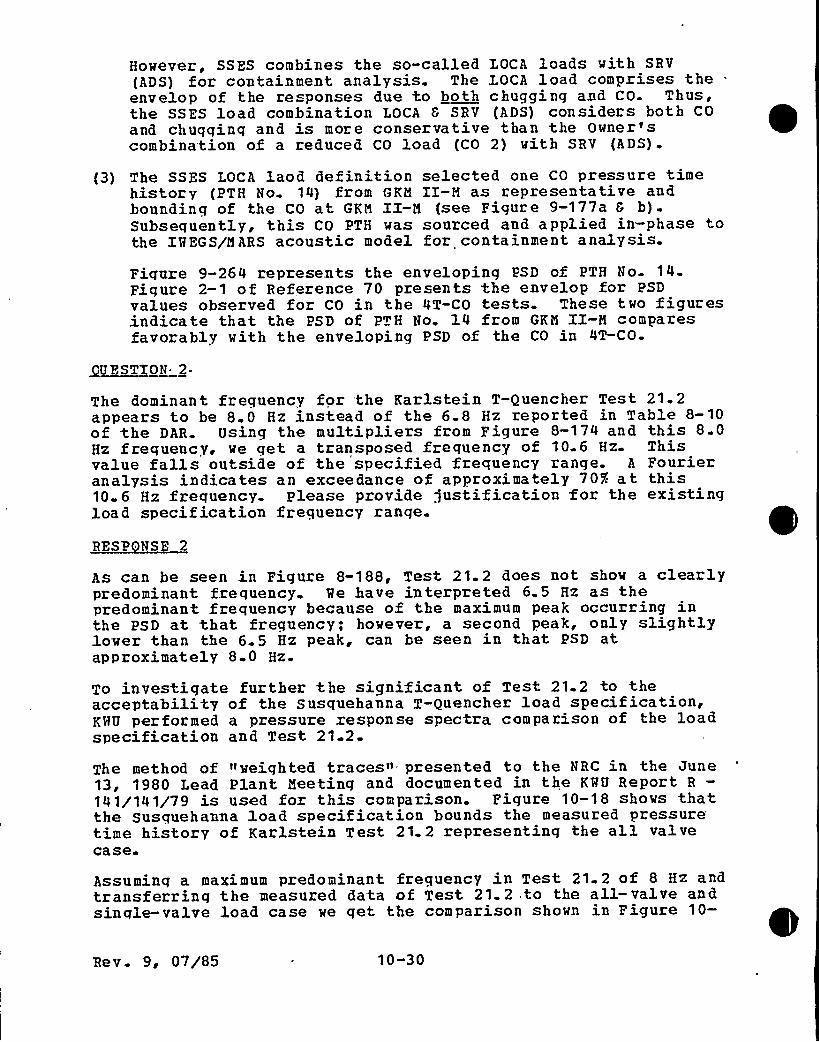
However, SSES combines the so-called LOCA loads with SRV
{ADS) for containment analysis. The LOCA load comprises theenvelop of the responses due to both chugging and CO. Thus,the SSES load combination LOCA 8 SRV (ADS) considers both CO
and chugging and is more conservative than the Owner'scombination of a reduced CO load (CO 2) with SRV (ADS) .
{3) The SSES LOCA laod definition selected one CO pressure timehistory (PTH No. 14) from GKH II-H as representative andboundinq of the CO at GKM II-5 (see Figure 9-177a 6 b).Subsequently, this CO PTH was sourced and applied in-phase tothe IQEGS/BARS acoustic model for containment analysis.
Figure 9-264 represents the enveloping PSD of PTH No. 14.Figure 2-1 of Reference 70 presents the envelop for PSDvalues observed for CO in the 4T-CO tests. These two figuresindicate that the PSD of PTH No. 14 from GKN II-M comparesfavorably with the enveloping PSD of the CO in 4T-CO.
~URS1ION 2-
The dominant freguency for the Karlstein T-Quencher Test 21.2appears to be 8.0 Hz instead of the 6 8 Hz reported in Table 8-10of the DAR. Usinq the multipliers from Figure 8-174 and this 8.0Hz frequency, we qet a transposed frequency of 10.6 Hz. Thisvalue falls outside of the specified frequency range. A Fourieranalysis indicates an exceedance of approximately 70% at this10 6 Hz frequency. Please provide justification for the existingload specification frequency range.
As can be seen in Figure 8-188, Test 21.2 does not show a clearlypredominant frequency. %e have interpreted 6.5 Hz as thepredominant frequency because of the maximum peak occurring inthe PSD at that frequency; however, a second peak, only slightlylover than the 6. 5 Hz peak, can be seen in that PSD atapproximately 8 0 Hz.
To investigate further the significant of Test 2].2 to theacceptability of the Susquehanna T-Quencher load specif ication,KMU performed a pressure response spectra comparison of the loadspecification and Test 21.2.
The method of »weighted traces» presented to the NRC in the June13, 1980 Lead Plant meeting and documented in the KWU Report R—141/141/79 is used for this comparison. Figure ]0-]8 shows thatthe Susquehanna load specification bounds the measured pressuretime history of Karlstein Test 21 2 representing the all valvecase.
Assuming a maximum predominant frequency in Test 21. 2 of 8 Hz and.transferrinq the measured data of Test 21.2.to the all-valve andsingle-valve load case we qet the comparison shown in Figure 10-
Re v. 9, 07/85 10-30
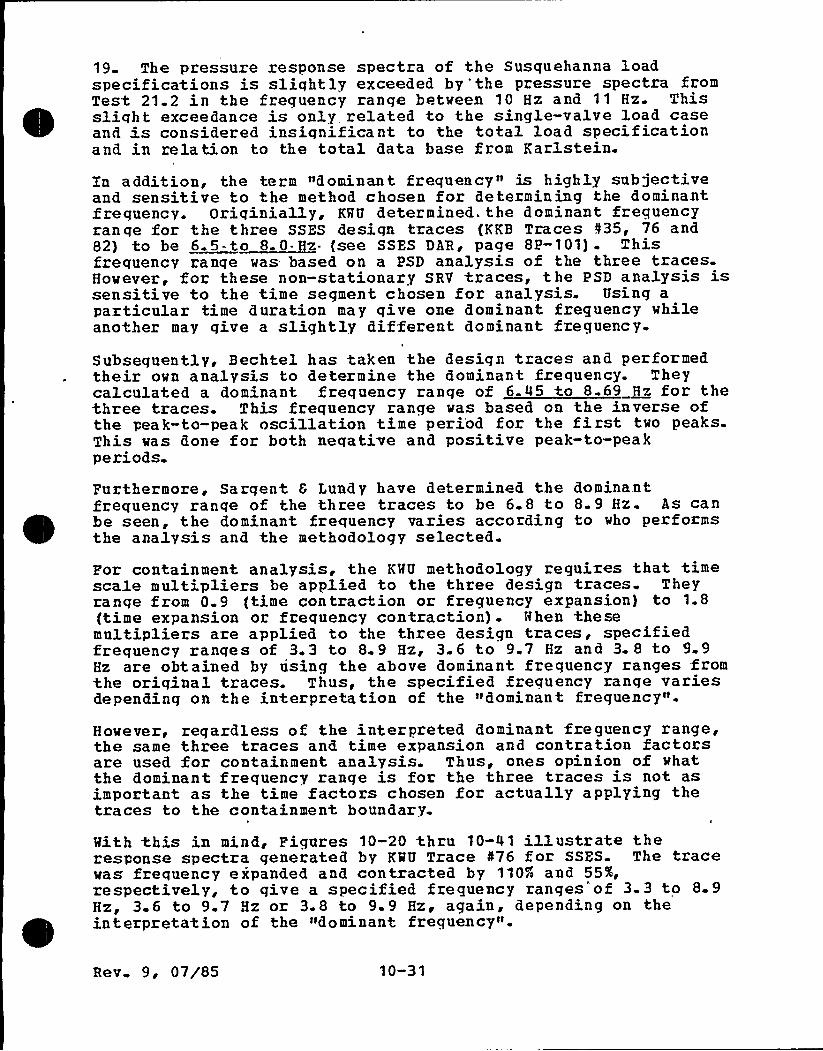
19 The pressure response spectra of the Susquehanna loadspecifications is slightly exceeded by'the pressure spectra fromTest 21.2 in the freguency range between 10 Hz and 1 1 Hz. Thissliqht exceedance is only related to the single-valve load caseand i.s considered insignificant to the total load specificationand, in relation to the total data base from Karlstein.
In addition, the term»dominant frequency" is highly subjectiveand sensitive to the method chosen for determining the dominantfrequency. Oriqinially, KRU determined. the dominant frequencyrange for the three SSES design traces (KKB Traces 035, 76 and82) to be 6.5-to 8. 0-Hz. (see SSES DA'R, page 8P-101) . Thisfrequency ranqe was based on a PSD analysis of the three traces.However, for these non-stationary SRV traces, the PSD analysis issensitive to the time segment chosen for aaalysis. Using aparticular time duration may give one dominant frequency whileanother may give a slightly different dominant frequency.
Subsequently, Bechtel has taken the desiga traces and performedtheir own aaalysis to determine the dominant frequency. Theycalculated a dominant frequency range of 6.45 to 8.69 Hz for thethree traces. This frequency range was based on the inverse ofthe peak-to-peak oscillation time peri'od for the first two peaks.This was done for both neqative and positive peak-to-peakperiods.
Furthermore, Sargent 8 Lundy have determined the dominantfrequency ranqe of the three traces to be 6.8 to 8.9 Hz. As canbe seen, the dominant frequency varies according to who performsthe analysis and the methodology selected.
For containment analysis, the KMU methodology reguires that timescale multipliers be applied to the three design traces. Theyrange from 0.9 (time contraction or fregueacy expansion} to 1.8(time expansion or frequency contraction). Nhen thesemultipliers are applied to the three design traces, specifiedfrequency ranqes of 3.3 to 8.9 Hz, 3.6 to 9.7 Hz and 3. 8 to 9.9Hz are obtaiaed by ising the above dominant frequency ranges fromthe oriqiaal traces. Thus, the specified frequency range variesdepending on the interpretation of the »dominant frequency».
However, regardless of the interpreted dominant frequency range,the same three traces and time expansion and contration factorsare used for containment analysis. Thus, ones opinion of whatthe dominant frequency range is for the three traces is not asimportant as the time factors chosea for actually applying thetraces to the containment boundary.
Mith this ia mind, Figures 10-20 thru 10-41 illustrate theresponse spectra generated by KQU Trace 476 for SSES. The tracewas frequency expanded and contracted by 110% aad 55%,respectively, to give a specified frequency ranges'of 3.3 to 8.9Hz, 3.6 to 9.7 Hz or 3.8 to 9.9 Hz, again, depending on theinterpretatioa of the «dominant frequency».
Rev 9, 07/85 10-31
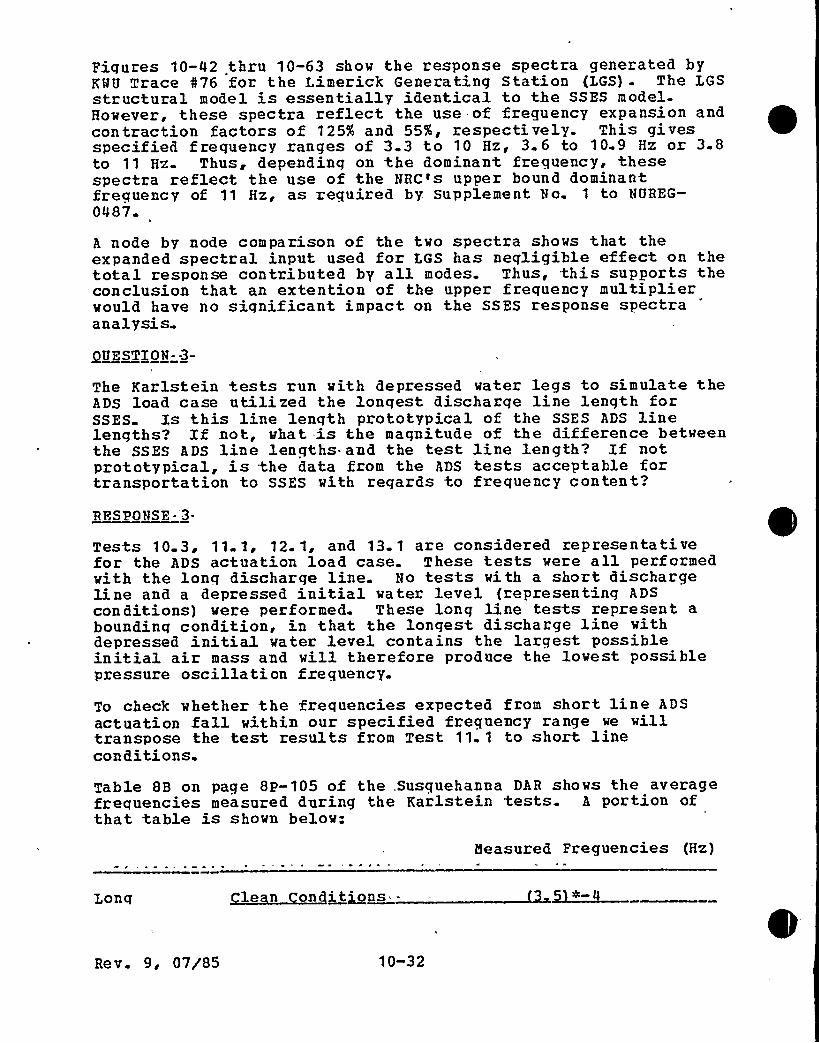
Figures 10-42 thru 10-63 show the response spectra generated byKQU Trace 476 for the Limerick Generating Station {LGS) . The LGSstructural model is essentially identical to the SSES model.However, these spectra reflect the use of frequency expansion andcontraction factors of 125% and 55%, respectively. This givesspecified frequency ranges of 3 3 to 10 Hz, 3.6 to 10.9 Hz or 3.8to 11 Hz Thus, depending on the dominant frequency, thesespectra reflect the use of the NRC's upper bound dominantfrequency of 11 Hz, as required by. Supplement No. 1 to NUREG-0487
A node by node comparison of the two spectra shows that theexpanded spectral input used for LGS has negligible effect, on thetotal response contributed, by all modes. Thus, this supports theconclusion that an extention of the upper frequency multiplierwould have no significant impact on the SSES response spectraanalysis.OUESTION- 3-
The Karlstein tests run with depressed water legs to simulate theADS load case utilized the longest discharqe line length forSSES. Is this line length prototypical of the SSES ADS linelengths? If not, what =is the magnitude of the difference betweenthe SSES ADS line lengths and the test line length? If notprototypical, is the data from the ADS tests acceptable fortransportation to SSES with regards to frequency con ten t?
1l'PS PONS E '3.
Tests 10 3, 11.1, 12.1, and 13.1 are considered representativefor the ADS actuation load case. These tests were all perf ozmedwith the long discharge line. No tests with a short dischargeline and a depressed initial water level (representing ADSconditions) were performed. These long line tests represent aboundinq condition, in that the longest discharge line withdepressed initial water level contains the largest possibleinitial air mass and will therefore produce the lowest possiblepressure oscilla tion fre quency.
To check whether the frequencies expected from short line ADSactuation fall within our specified frequency range we willtranspose the test results from Test 11. 1 to short lineconditions.
Table 8B on page 8P-105 of the, Susquehanna DAR shows the averagefrequencies measured during the Karlstein tests. A portion ofthat table is shown below:
measured Frequencies (Hz)
Long
Re v. 9, 07/85 10-32
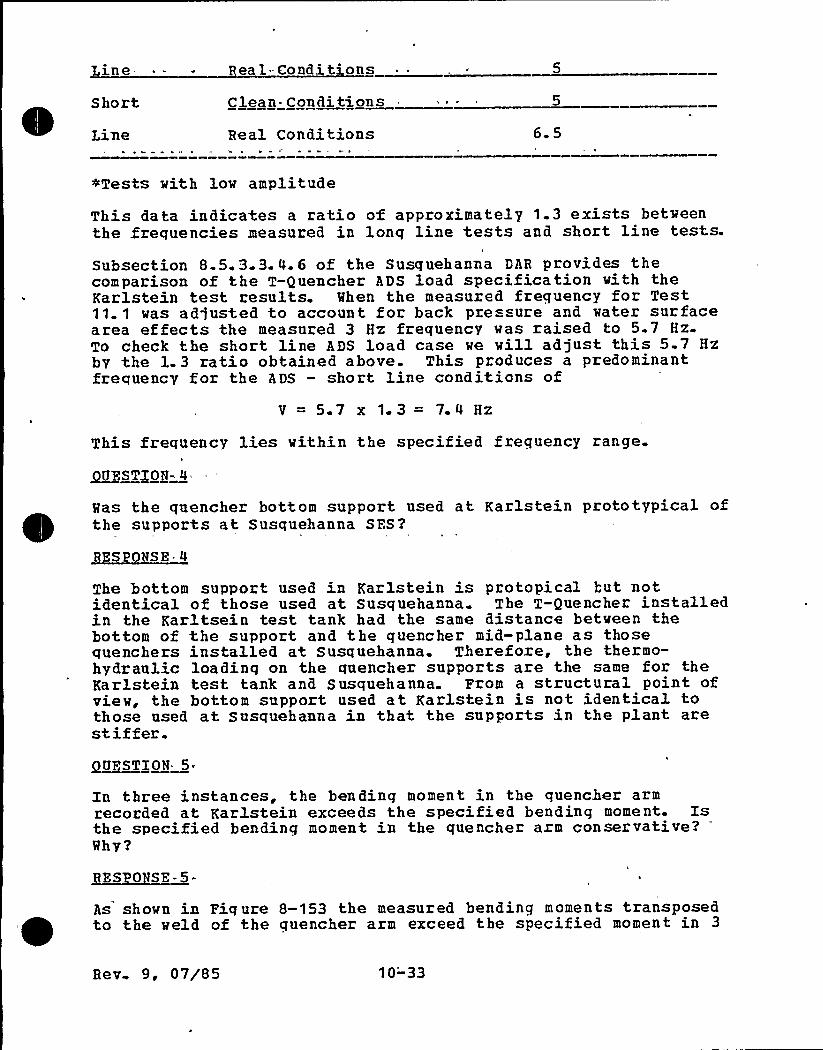
T.inc ea 1'ondi tions
Short Clean- Conditions
Line Real Conditions 6.5
>Tests with lov amplitude
This data indicates a ratio of approximately 1.3 exists betweenthe frequencies measured in lonq line tests and short line tests.
Subsection 8.5.3.3.4.6 of the Susquehanna DAR provides thecomparison of the T-Quencher ADS load specification with theKarlstein test results. Shen the measured frequency for Test11. 1 was adjusted to account for back pressure and water sur facearea effects the measured 3 Hz frequency vas raised to 5.7 Hz.To check the short line ADS load case we vill adjust this 5.7 Hzby the 1.3 ratio obtained above. This produces a predominantfrequency for the ADS — short line conditions of
V = 5.7 x 1. 3 = 7.4 Hz
This frequency lies within the specified frequency range.P
5)07STQOH- 4
Has the quencher bottom support used at Karlstein prototypical ofthe supports at Susquehanna SFS?
The bottom support used in Karlstein is protopical hut notidentical of those used at Susquehanna The T-Quencher installedin the Karltsein test tank had the same distance betveen thebottom of the support and the quencher mid-plane as thosequenchers installed at Susquehanna. Therefore, the thermo-hydraulic loading on the quencher supports are the same for theKarlstein test tank and Susquehanna. Prom a structural point ofview, the bottom support used at Karlstein is not identical tothose used at Susquehanna in that the supports in the plant arestiffer.
In three instances, the bending moment in the quencher armrecorded at Karlstein exceeds the specified bending moment. Isthe specified bending moment in the quencher arm conservative?Why?
~RES 0 SE 5-
As shovn in Pig ure 8-153 the measured bending moments transposedto the veld of the quencher arm exceed the specified moment in 3
Rev 9, 07/85 1 0-"33
out of a total of 99 cases during vent cleaning. The total loadspecification for the quencher arm is made up of threecomponents:
a) in ternal pressure
h) bendinq moment
c) temperature qradient
The following table lists the specified avid maximum measuredvalues for each of the load. components.
Condition-Maximum
Measured Value
Steady StatePressure 22 bars 13 bars
Intern alTempera ture 219> C 191 6~ C
BendingMoment 65 kHm 85 kNm
As can be seen, the specified values exceed the measured maximumvalues except for the referenced bending moments noted above.
As a result of this exceedance, a stress analysis, iden tical tothe one performed for the specified values, was completed usingthe above maximum measured values. This analysis shows that thetotal stress due to the specified loads bounds the total stressdue to the maximum measured loads In addition, a fatigueevaluation of the arm weld was performed using the maximummeasured data The results indicate the weld has a usage factorless than unity, and thus is acceptable.
Q~U ST I 0 N."6-
Explain why a single failure will not disable both the RHRshutdown cooling function and one RHR loop in the suppressionpool cooling mode.
E PS~PO S E ~ 6
A single failure can indeed disable the RHR shutdown coolingfunction and one RHR loop in the suppression pool cooling modeunder the followinq assumptions. Both units are operating atfull power when a complete long-term loss of offsite power (LOOP)occurs This leads to main steam line isolation and reactorscram. Following the LOOP all four (4) diesel generators shouldstart" to supply power to the ESS busses, however, it is assumedthat the diesel qenerator OG501C does not start (single failure).
Rev. 9, 07/85 10-34
OG501C supplies power to the ESS busses 1A203 and 2A203~, to theRHR pumps 1C and 2C+, and to the RHR service water pump 'IA. Lossof OG501C means that the inboard shutdown cooling isolationvalves on both units, 1F009 and 2F009+, loose power to theiroperators, thus disabling the RHR shutdown =cooling mode. Sincethese valves are located inside the primary containment, it isconservatively assumed that they will not be manually reopened.Only the ~~B» loop and the corresponding RHRSH loop of the RHR
system {in both units) would be readily available for suppressionpool cooling, using e.g., RHR pumps 1B and 2D*. The "A" loop ofone unit could be made a'vailable by manually operating four {4)valves {close F048A, open F024A, HV-1210A and HV-1215A) and usingRHRSQ pump 2A~ and either RHR pump 1A or 2A+. However, asimultaneous operation of RHR pumps 1A and 2A+ is prohibited byelectrical interlocks. Thus one of the units would have only oneRHR loop available in the suppression pool cooling mode withoutthe possibility to switch to shutdown cooling.
This case has not been considered in the transients submitted aspart of Appendix I of the DAR and may be more limiting. However,a similar but more conservative case was analyzed as part of asensitivity study and resulted in a maximum pool temperature of203~F. The assumptions for. this case are indentical to case 2.a{Appendix I, DAR) except that shutdown cooling is not initiated.For this case, the curves for reactor pressure vs time andsuppression pool temperature vs. time are found in Figures 10-64and 10-65, respectively.As mentioned above, this case is similar, hut more conservativethan the case under consideration. The ma jor difference is thatreactor water make-up would not be from the feedwater/condensatesystem but from HPCI {at reactor. pressures above approximately300 psia) and core spray {at reactor pressures belowapproximately 300 psia), which both take suction from thecondensate storage tank a~d/or the suppression pool. Thus, watermuch colder than feedwater would be used for make-up.
This contributes to the reactor depressurization and leads toless steam being dumped into the suppression pool. The peaksuppression pool temperature for this case will therefore belower than that shown in Figures 10-65.
To confirm a temperature of less than 2030F we have initiated anadditional analysis case, whose results are contained in AppendixI {Figures I-14 and I-15)
4Indicates Unit C2 component
Rev. 9 ~ 07/85 10-35
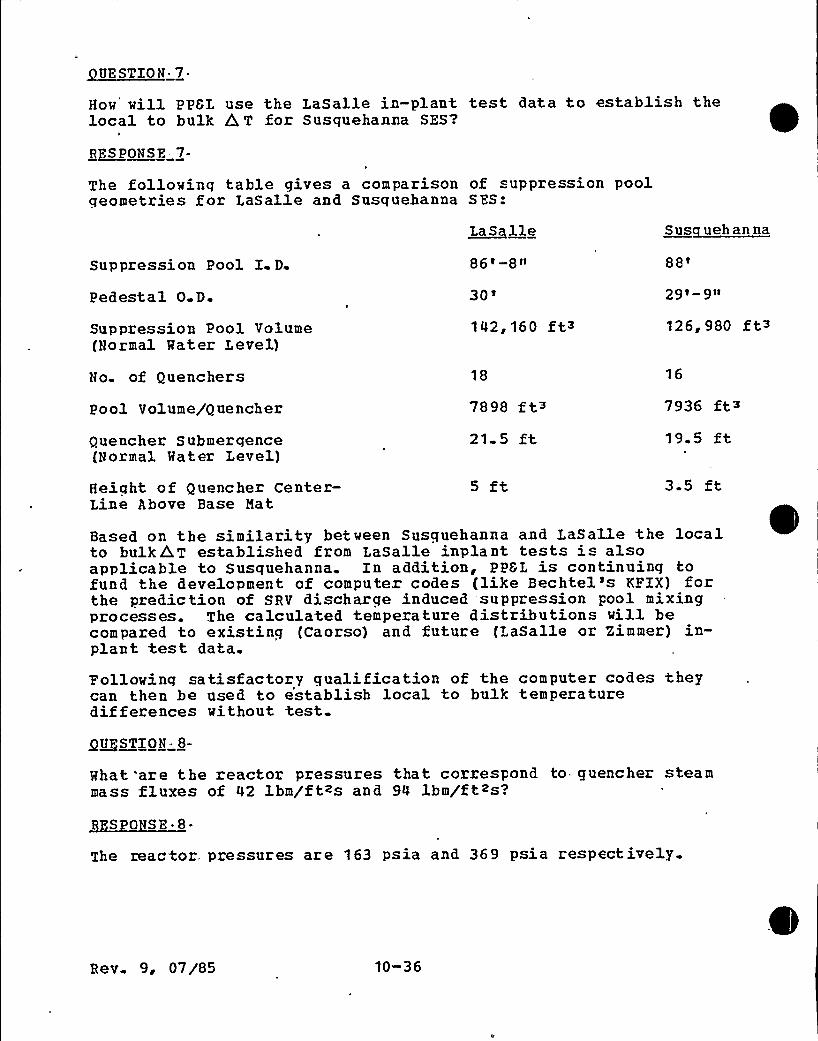
QO'S ST X0 N 7 .
How'ill PPGL use the LaSalle in-plant test data to establish thelocal to bulk 4T for Susquehanna SES'?
~SPON S E 7-
The following table gives a comparison of suppression poolgeometries for LaSalle and Susquehanna SZS:
Suppression Pool I D.
Pedestal 0 D.
Suppression Pool Volume(Normal Water Level)
~LaS lie86'-8"
30'42,160 ft>
SusS ueh an na
88'9'-9"
126t 980 ft>
No. of Quenchers
Pool Volume/Quencher
Quencher Submergence(Nozmal Water Level)
Height of Quencher Center-Line Above Base Hat
18
7898 ft~
215 ft
5
16
7936 ft~
19 5 ft
35 ft
Based on the similarity between Susquehanna and LaSalle the localto bulkET established from LaSalle inplant tests is alsoapplicable to Susquehanna. In addition, PPGL is continuing tofund the development of computer codes {like Bechtel's KPIX) forthe prediction of SRV discharqe induced suppression Fool mixingprocesses. The calculated temperature distributions will becompared to existing (Caorso) and future (LaSalle or Zimmer) in-plant test data.
Followinq satisfactory qualification of the computer codes theycan then be used to establish local to bulk temperaturedifferences without test
g+USTION - 8-
What 'are the reactor pressures that correspond to quencher steammass fluxes of 42 ibm/ft~s and 94 ibm/ft2s'?
The reactor, pressures are 163 psia and 369 psia respectively
Rev. 9, 07/85 10-36
SUSOUEHANNA STEAM ELECTRIC STAllONUNITS 1 AND 2
DESIGN ASSESSMENT REPORT
THIS FIGURE HAS BEENDELETED
FIGURE 10-1
Rev. 9 07 85SUSQUEHANNA STEAM ELECTRIC STATION
UNITS 1 AND 2DESIGN ASSESSMENT REPORT
THIS FIGURE HAS BEENDELETED
FIGURE

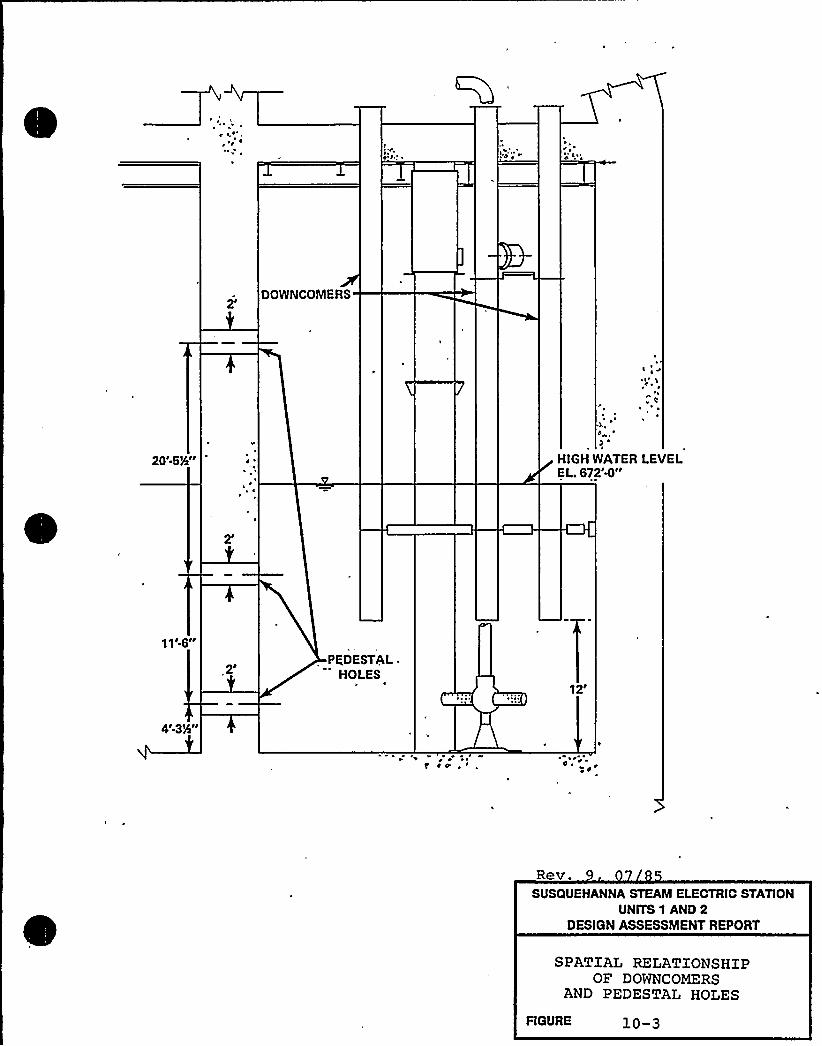
~
Co'OWNCOMERS
~~
~
~ ~
HIGH WATER LEVELEL. 672'W"
PEDESTAL .
HOLES12'
a
Rev.SUSQUEHANNA STEAM ELECTRIC STATION
UNITS 1 AND 2DESIGN ASSESSMENT REPORT
SPATIAL RELATIONSHIPOF DOWNCOMERS
AND PEDESTAL HOLES
FIGURE 1 p -3
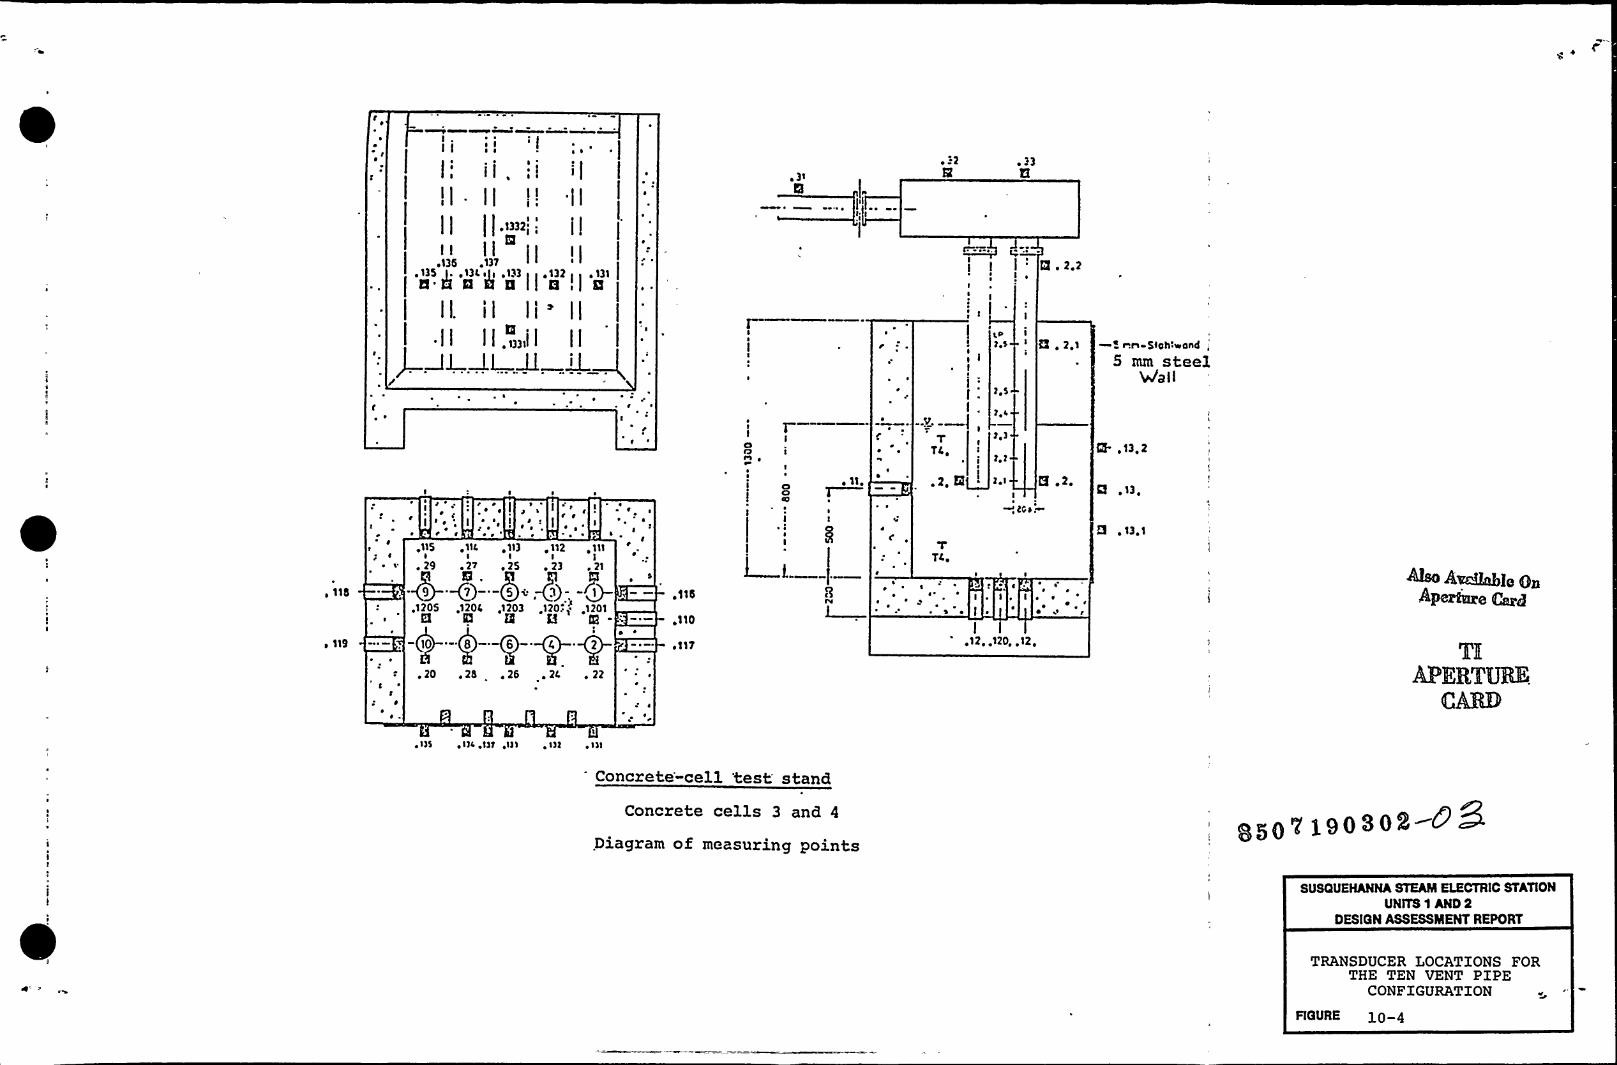
1 C
'gpl
~I
I
~ 32 ~ 33
g . 2.2
~ I
I ~ ~ r ~r~ ~ I ~ ~
r ~ ~ ~ ~~ ~ r ~ ~ ~ ~
~ ~
l '~ ~
~~
II
CInrrr ~
~ 11 ~
~ ~
~ ~
l'
.2,H
2,5
2 ~ S
2 ~ i2 ~ )
2,2
2 ~ I
Q . 2.1
g .2.
5 nn 5Ioh:wand,5 mm steel
Wail
Q-,13. 2
Q,13 ~
9 ~ 13 ~ 1
~ 115
~ 1IS
~ \
lt
2 ~
~115 e llC ~ 113 ~ 112 ~ 111I l I l
~ 29 ~ 27 ~ 25 ~ 23 ~ 21
-IO — 8 — 6-. C 2
~ 20 ~ 26 ~ 26 ~ 24 ~ 22
~ 115
~ 110
~ 117
cR
r~ ~
~ ~
TC,
~ ~
~ r ~ ~
I ~ I r I ~
~'
~ 12 ~,120, ~ 12 ~
4
~~
45'~g ~ 0@wring egg
~ERTUmCAlRD
~ 'l)S ~ I)4 ~ 1)1 rl)I ~ I)2 ~ l)I
Concrete-cell 'test'tandConcrete cells 3 and 4
Diagram of measuring points0rt 39030/
89'USQUEHANNA
STEAM ELECTRIC STATIONUNITS 1 AND 2
DESIGN ASSESSMENT REPORT
TRANSDUCER LOCATIONS FORTHE TEN VENT PIPE
CONFIGURATION
FIGURE go-4

~1
I +I
1I
51
Alt
'4
~lII t
4
I
h
4~vs
Cd>at
e„
PE
0
,~
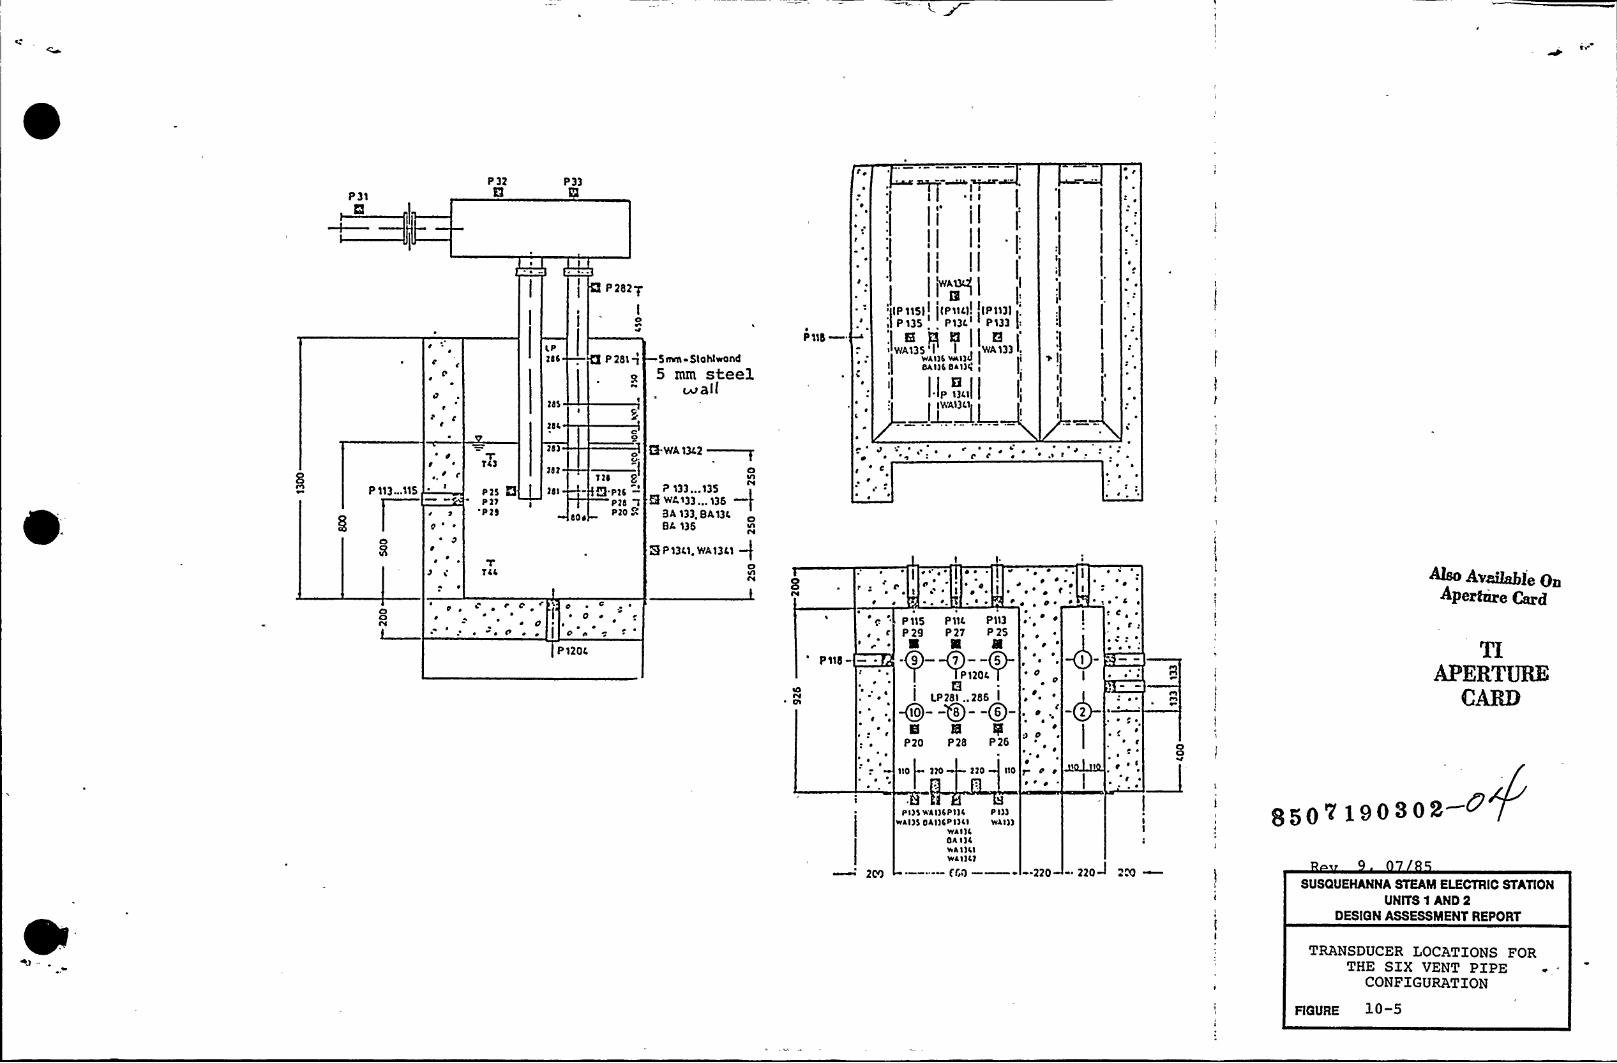
C's
P31P326
P331 ~
CP166
lb5
246
P 2827
Io
P 281 q Smm-Slohlwond
5 mm steelmall
P'ib
Iw4 lI(
IP 115!! (P IICl! tP))3!)P 135 P13C I P133
2 WA135'!' 'A133 I,WAI)6 WAI)4! l
I OAI)6 OAI)22 I
I,
l~ fL.
P 113...115
O4)N
g ~
r2
y r ~
P)5 6P2)P15
~ ~
r ~
TZCC
P C ~~ ~
~ ~
lb)
lbl
141
60 ~
r 2 p ~ P
I ~ O ~CI ~
~ . I o.P 1206
CO
) lb P
Q P16 —')b
Plo v
~ ~
O WA2242~Cl
P 133 ...135g WA133 ... 136
BA 133. BA13IBA 136
Q P 1361, WA134)
~ ~
2~ c
~ r~ ~
~ ~ 0 ~ ~~ ~t ~ ~
~!
r ~ ~~ ~
~ I ar
~ ~ ~ ~ ~
~ ~
~ ~ !~ ~
v ~
~ r ~
~ ~ ~ t~ ~ ~ P ~ ~
~ ~0
~ 6
r ~
Pllb- —.
~ r
~~
I
P115 PllC PIOP29 P22 P25
-92- -92- -(SS-
6LP281 ..286 !
-oo- -'08- -06-g II
P20 P28 P26
~ ~~ ~
~ ~
~ ~
~ P
~ ~~ ~
2~ P~ ~
P
0 C2 ~
P
2 ~
110 110 210 110
r ~
~ ~
~ g ~
~ ~
I~ ~ A ~
2 C~
~
~ t .
~ ~ ~
~~~ r ~
~ Cr~ I
2
~ Avaaabie 0Apertiire C8Lrg
TIAPERTURE
CAm
Pl)5 WAI)6PI)C PI))WAI)5 OAI)6>l)CI WAI))
WAINOA I)CWA I)CIWAI)C)
~—--- fI;0 ——v -220 220~ 2."0 ~
8507390302-<
SUSQUEHANNA STEAM ELECTRIC STATlONUNlTS 1 AND 2
DESIGN ASSESSMENT REPORT
TRANSDUCER LOCATIONS FORTHE SIX VENT PIPE
CONFIGURATION
RGURE 10-5

A
'I
C:->
S
J
q'i
~ a)
a':~
g»
~ 4
h
1
1p
,F
I
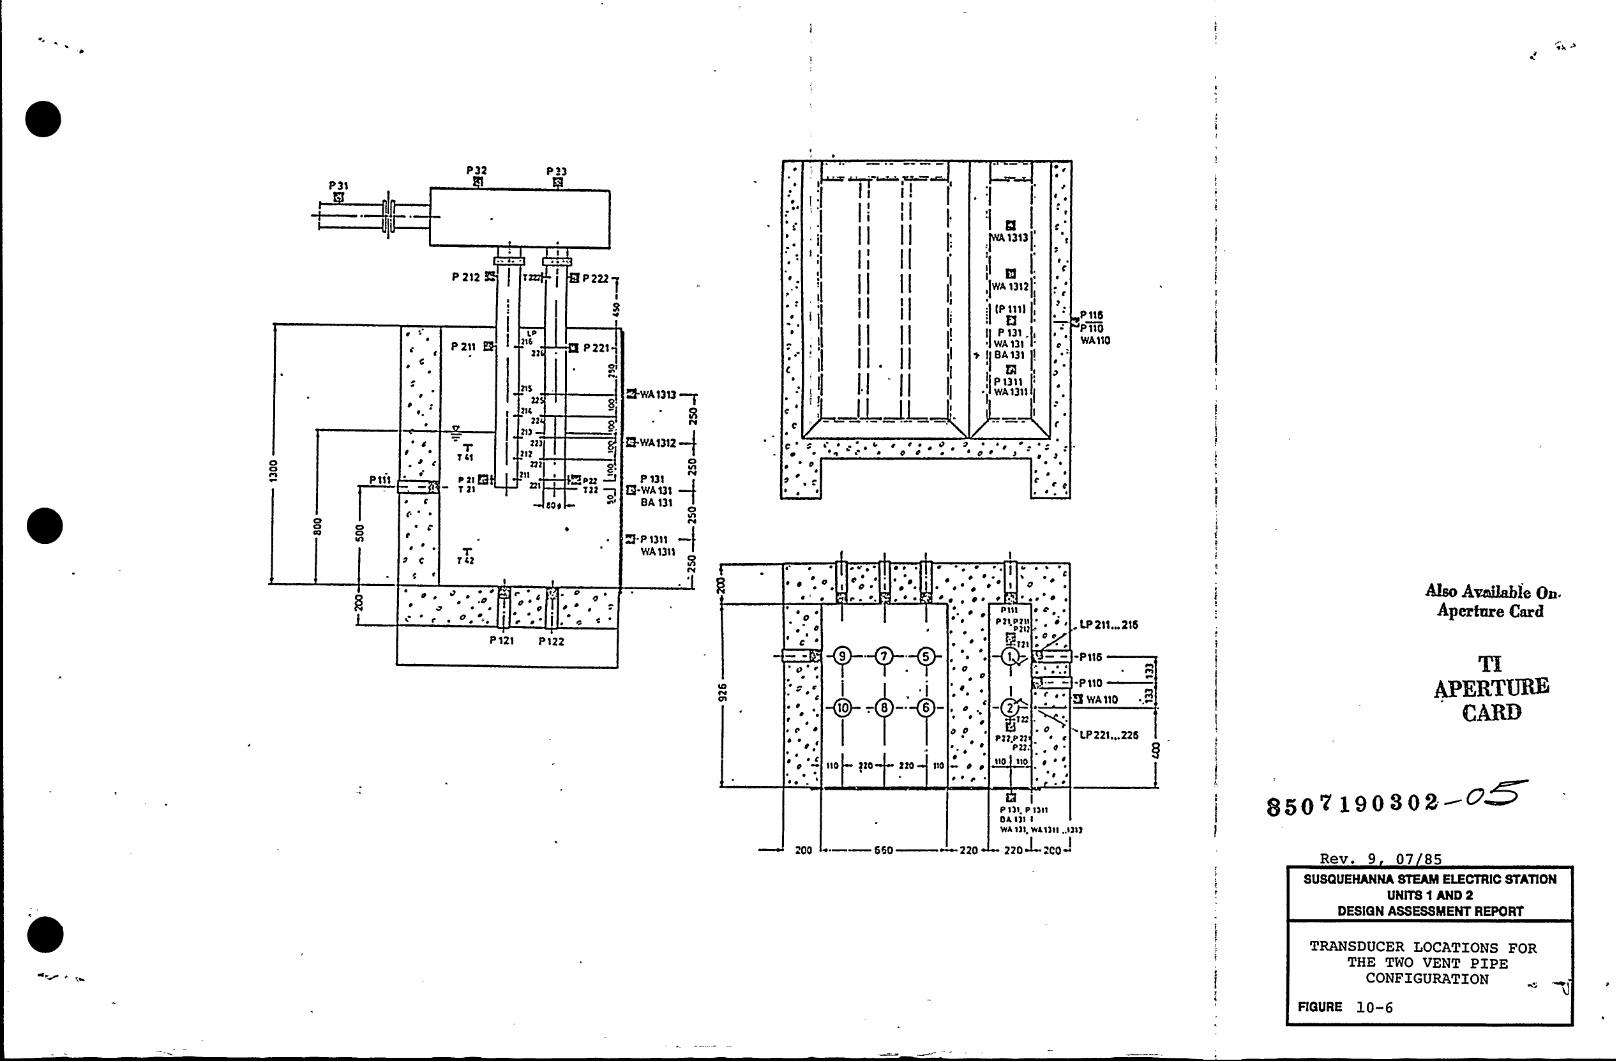
7
P32 P33
C7
~0
P 212
c I~
O
P 211
60)(6
22
t0
~,
g ~
C
~ C
0 ~
~ c'
v'61
P 21 QT 21
TT 62
21$
22
2(622
21)
22)212
222211
221
600
r0 ~
0~ ~
r r
P 121 P 122
40
~ ~
o\ ~ ~ ~
P222q
P 221'
~n~%
o,C'(02
P22T)2 ~O
0
9 WA1313 ~Rrv
H.WA1312
Cl
P 131I)I-WA131 QBA 131
CI
Q P 1311
WA1311
CI
~ ~
~ ~
~ ~ Il(!
II
QfhN,1313
i[ ~,IWA 13'I2 '
IP 1111
D !
P131. (
'A131y I 8A131 l
K(I (! P1311
~ WA1311I
~ ~
0
C
)
~ ~
0
~ r0 ~
~ 0
~ ~ ~
~ ~ ~ ~
~ )~ 0
~ ~
C~ ~
~' ~
~ ~ 0~ ~
~ "~
r 0 ~
0 ~
( ~ ~
~ ~ ~
~ ~I ~ ~
~ ~
~ ~ ~ ~
~ > ~
~ ~ ~
~ ~ ~
~ ~ ~ ~
0' ~ 00 ~
~. ' ~ ~ ~
~ ~0
~ 0~
~
0
o~ ~
c
~ ~~ ~
~ 0 ~
~ ~ (~
~~ ~
0
~ ~
Q9 +7 +5
, .I~IO —. 8 — 6-
110 PO 220 IIO
0 ~~~
~ ~
~ ~~ ~
~ 0~ 0
~ ~~ ~
C~ 0~ ~
00 0 e
~ ~
0 0
0 111
P 21 0 21(
P)).P 22P 22.
IIO 110
~ 0 ~ ~
~ ~ ~
.Oe
r ~ ~ ~~ ~ ~ ~
I~ 0 ~ ~
~ g
~ 0 '~
P 'I ) 1. 0 1)11OA I')I I
~ ~'
C t ~ 0~ ~~ 0 a o 0 0 ~
P 115
P 1'IO
WA110
.LP211. 215
-P116
.P((0—9 WA110
LP 221...225
@ho AvmQah1e On.Apex'tare Card~EEYORE
jr AR9
8607 190303-+~200 0——650 220
WA I)'I, W61)11 ..I)I)
220 ~2CO~I
Rev. 9 07 85SUSQUEHANNA STEAM ELECTRIC STATION
UNITS 1 AND 2DESIGN ASSESSMENT REPORT
TRANSDUCER LOCATIONS FORTHE TWO VENT PIPE
CONFIGURATION
FIGURE 10-6

t, ~:
~
'4
I'Vr%
,l
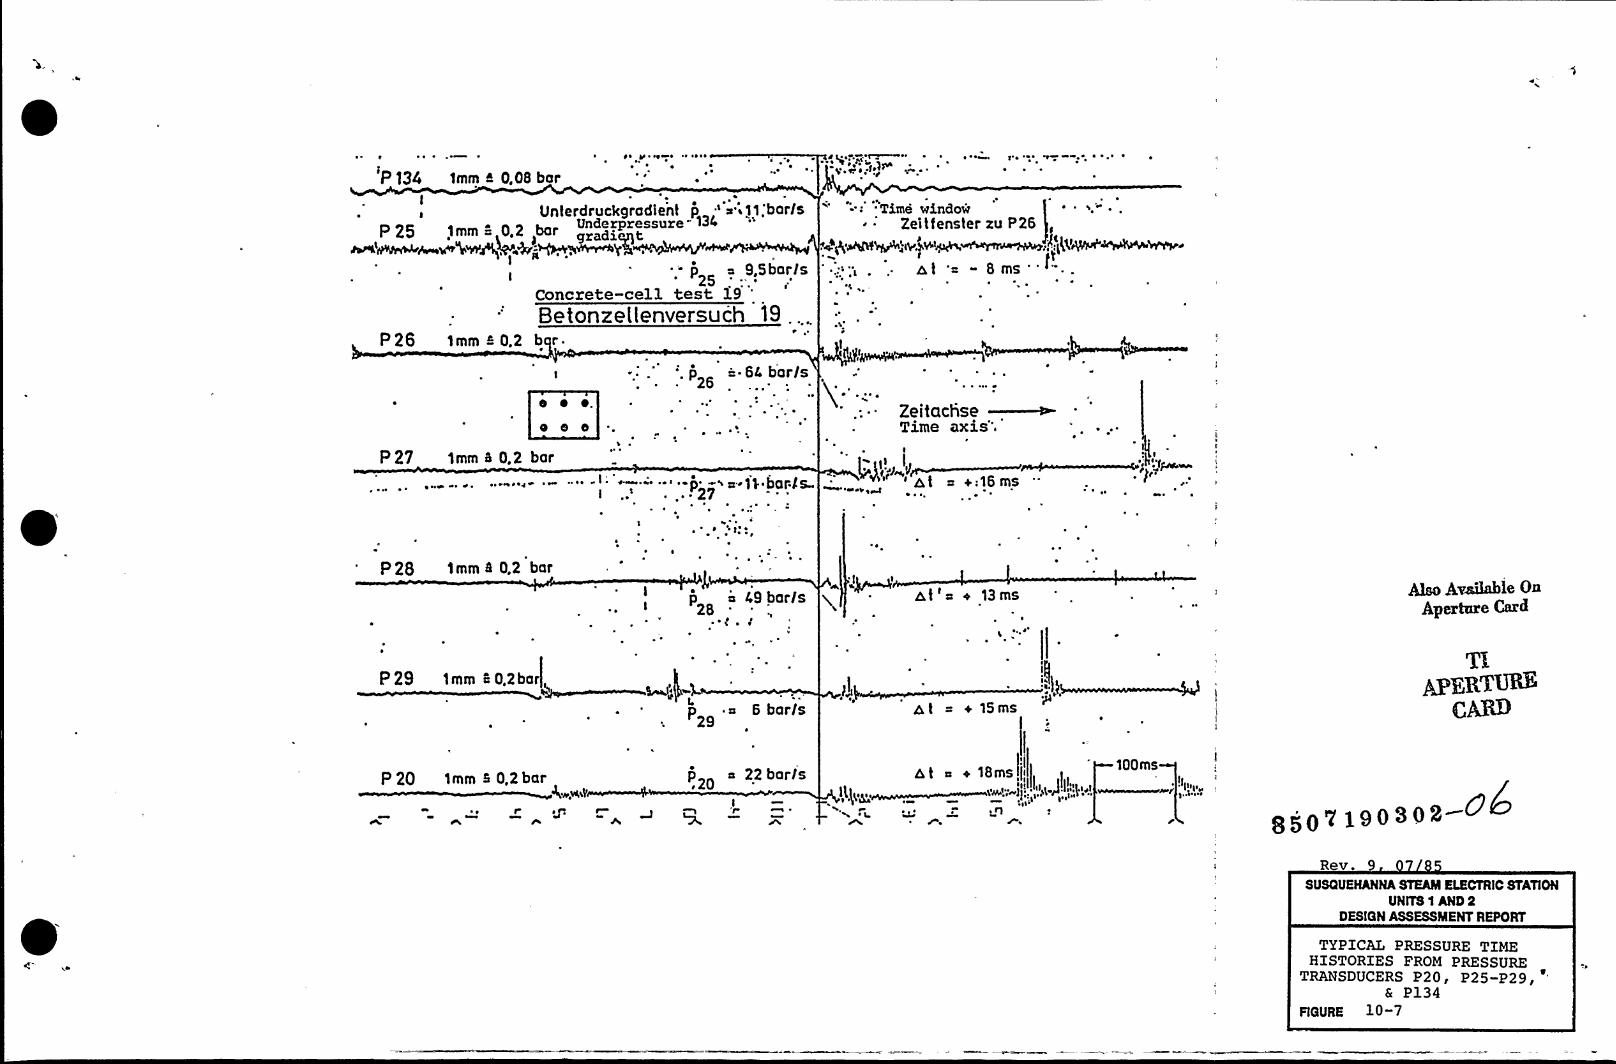
~ ~
P )34 1mm ~ O.Oe barI
Unterdruckgradient p ' '11:bar/sP 25 1mm =,0 2 bar UnderPressure- 134
~ L' gradient
Jl-
p ~ 9,Sbar/s
Concrete-cell test 19'etonzetlenversuch
'l9
P26 1mm ~ 0.2 b r.
26'. p ~- 64 bar/s
ri,~ .t - ~
~ ~ ~
g, p ~ 1>~+ ~~ ~ ~
~ ~ ~ l~ g ~ 0 ~ g% ~ ~ ~
~ ~
~ 'L
'Time windowZeitfenster zu P26
Y .'mi '. PlF
~t .= - 8ms
I ~ ~ .
0 Cl 0
P27 1mm 6 0,2 bar
~ ~
I.' —-."'p -~8'11 barls27
Zeitachse ~Time axis".I
~ ~
~ ~
~' ~ l'
~ ~ y
P 28 1mm 5 0,2 bar
p a 49 bar/s28
~ 'fo e
~t'= + 13ms
~, ~
Also AvaHahle OnAyertare Card
P 2S 1mm 6 0,2bar,
p a 6 bar/s29
+ 1Sms
P 2O 1mm 5 0,2bar Q',wllf~ .20I
1 'f~ \ ~ ~ ~
a t8ms ([
„nJ ~
100ms
Rev. 9
SUSQUEHANNA STEAM ELECTRIC STATIONUNITS 1 AND 2
DESIGN ASSESSMENT REPORT
TYPICAL PRESSURE TIMEHISTORIES FROM PRESSURE
TRANSDUCERS P20g P25 P29~a P134
RGURE 10-7

. ~
$
h
5 ~ (
t I('E
K
', '4I
l r ~4'i
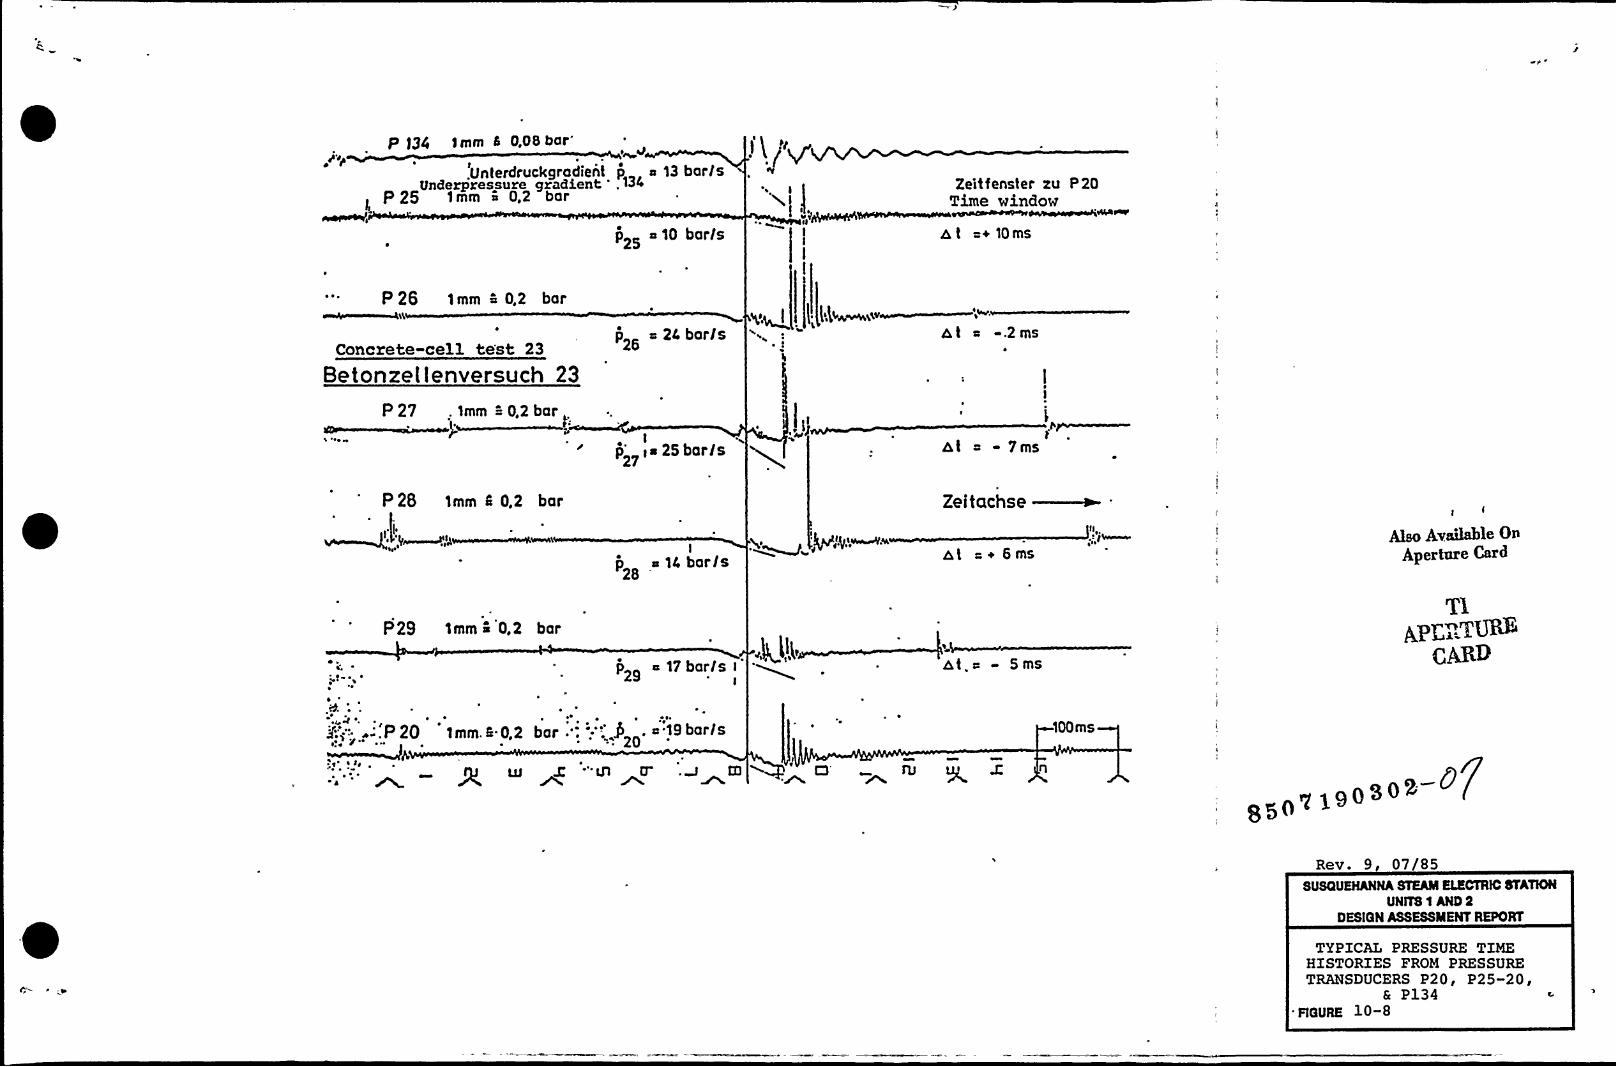
p Q4 )mm S0,08bar''tp
t.Unterdruckgradient
Underpressure gradientP 25 1mm ~ 0,2 bar
~Wg
t~4p a 13 barls134
p2> +10 bar/s
i(/+Zeit fenster zu P 20
Time windowH~~Pj's%
at =+ 10ms
P26 1mm ~ 0,2 bar
Concrete-ce11 test 23
Betonzet lenversuch 23
p e 24 bar/sQ.~l I N!iA~bv
Ih~
~ ~
W
b t "« -.2ms
P 27 . 1mm -= 0,2 bar
~ Ip'a 25 bar/s - 7ms
P28 lmm 0 02 bar Zeitachse ~
~ ~ ~
P29 1mm 4 0.2 bar
I
p e 14 barls28
p29 17 bar/s I
I
b,t =+ 6ms
>t.-"- 5 ms
Also Ava6able OnAperture Card
TlApr."'YURs
t..AR9
~ ~
~ i::: ..--.'P 20 '1mm.s.0,2~ ~
bar .". -".' . a 19 bar/s20
X "'Ul D
100ms
Vi90~0~850
Rev. 9 07/85SUSQUEHANNA STEAM ELECTRIC STATION
UNITS 1 AND 2DESIGN ASSESSMENT REPORT
TYPICAL PRESSURE TIMEHISTORIES FROM PRESSURETRANSDUCERS P20g P25 20'
P134.RQURE 10-8

4
~ 1
a
R
Je
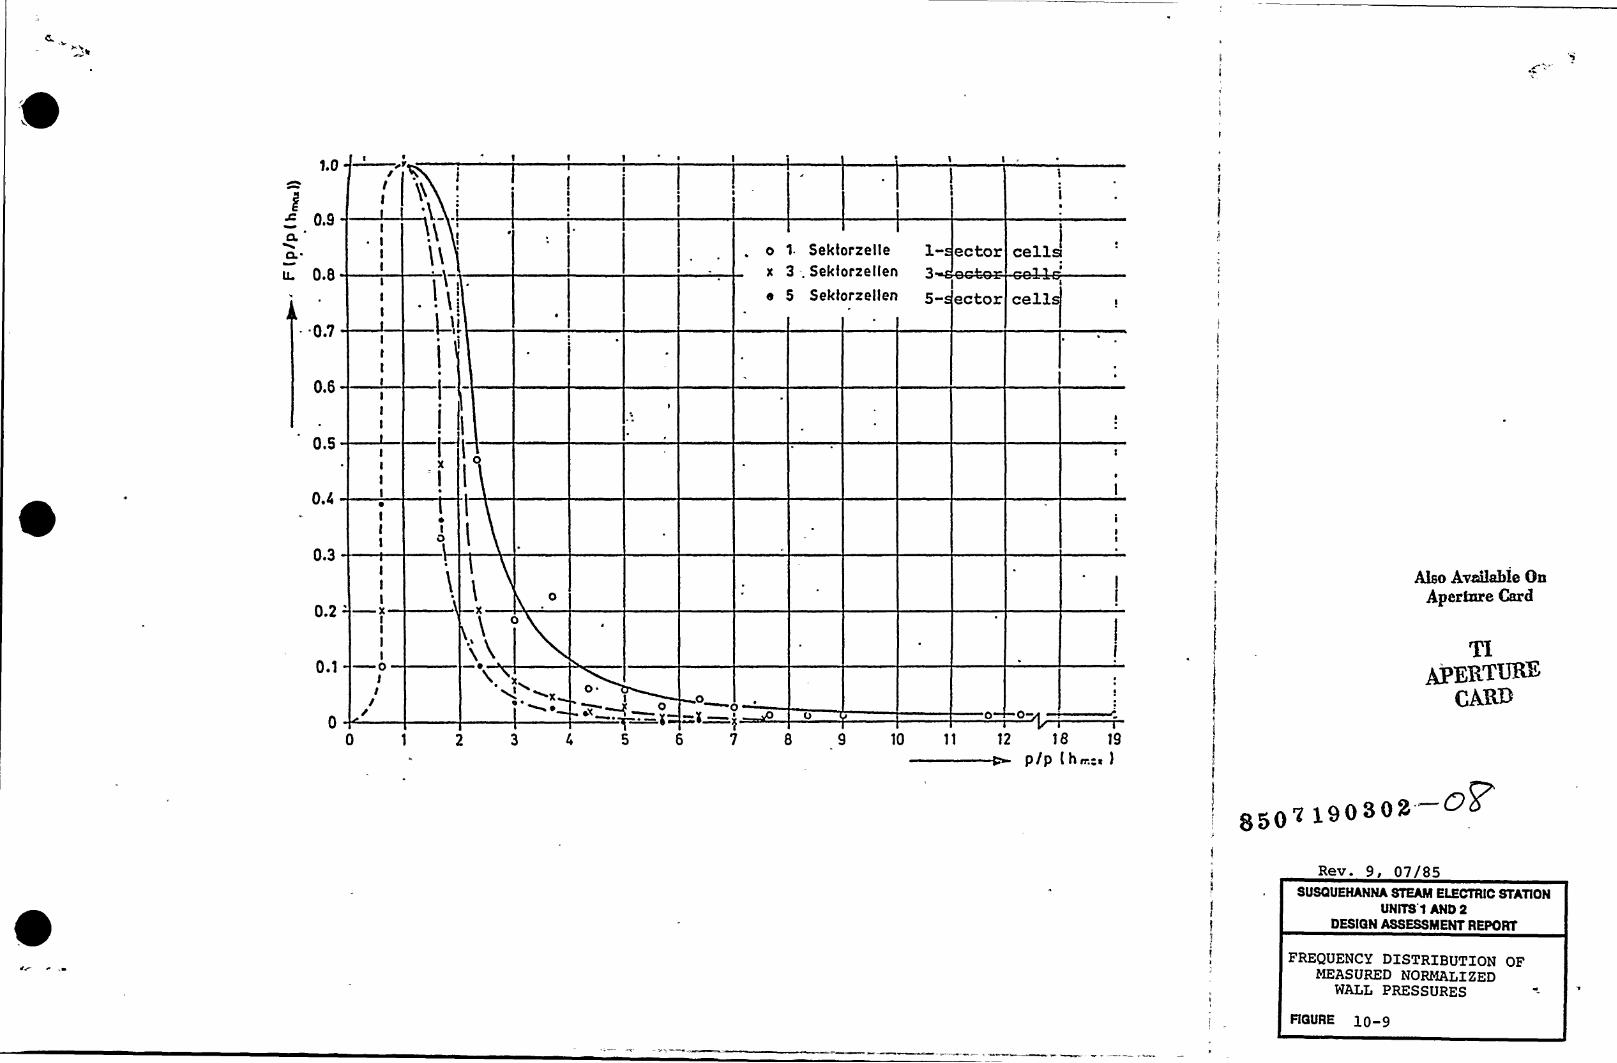
1.0~ I
0.9
u 0.8
. 0.7
0.6
I
I
I
o 1. Sektorzelle l-x 3 —. Sektorze Iten 3
e 5 Sektorzellen
ector
I
ector
cellaI
cell
O.Sp
0.4
0.3
0.2
'.1
0
IIII~pIII
J<x
Wo0
I 0~p 0-
Also Av+Hable OnApertare Card
0 4 5 6 7 8 9 10 11 12 18 19
p/p th~=. )
Rev 9 07/85SUSQUEHANNA STEAM ELECTRIC STATION
UNITS 1 AND 2DESIGN ASSESSMENT REPORT
FREQUENCY DISTRIBUTION OFMEASURED NORMALIZED
WALL PRESSURES
FIGURE l0-9

~,I
1~)
l~e
~"
V
psr
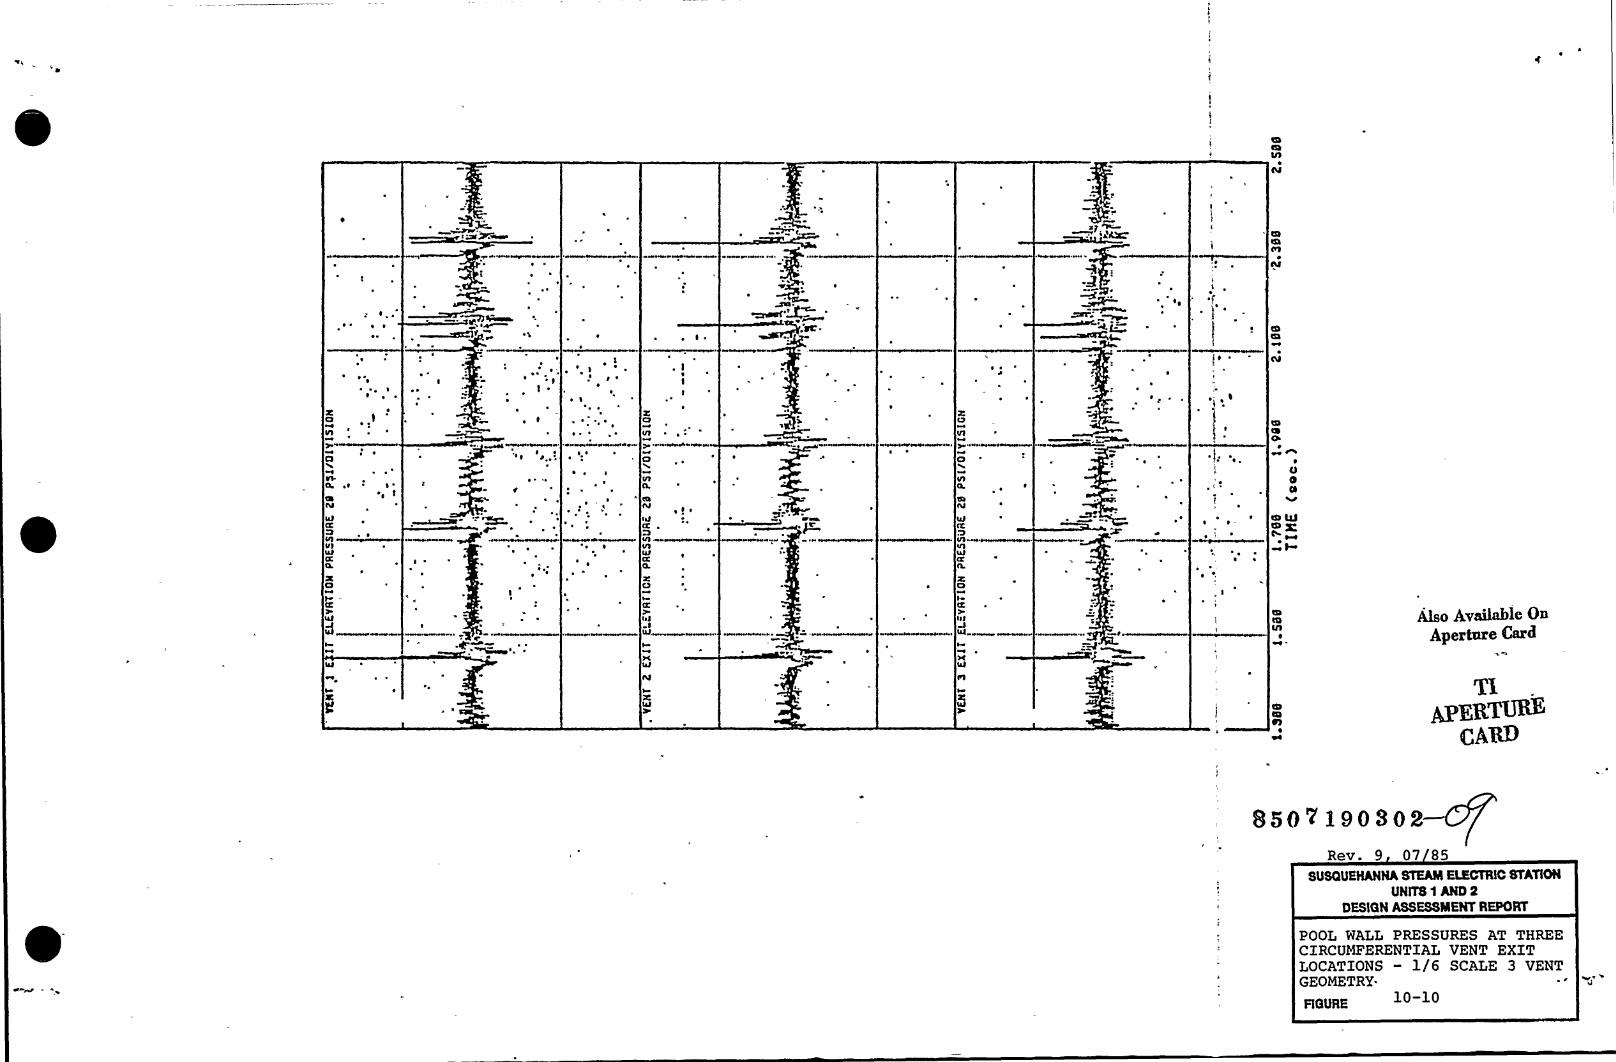
wf p s
~ LI
Al
~~
~ ~ ~
~ ~
~ ~ ~
~ ~~ ~ ~ ~ l
~ s ~
~ ~
~ I
~ ~
sc ~ ~'I
CDCD
CCl
Xa .IVl
~ ~
A
~ ~
IalCL
IVlIalCKO.
~ 'f
~ r~
'
l
~~
~ ~
~ ~
~ ~ ~
~~
s
~ ~
Xo
y «««««s w
CI
VlCl
ccaCal
IalCK ~
~sl .
XCl s
CK
Ia llCal.« ~
I
tal
~ ~
X
VI
0VlCL
Ial
sllIalCXCL
X
ItK
Ial
I
'xIal
~.v ~
~ j ~
~~
~ ~
~ ~
~ I ~
CD
EL
o0o
CD WIQ ~«I
CDCClCll
Also Availab>«>Ayertare Card
IXIal CD
CQ07
w
8507190802Rev. 9 07 85
SUSQUEHANNA STEAM ELECTRlC STATIONUNlTS 1 AND 2
DESlGN ASSESSIIENT REPORT
POOL HALL PRESSURES AT THREECIRCUMFERENTIAL VENT EXITLOCATIONS — 1I6 SCALE 3 VENTGEOMETRY.
RaURE

l
'
D
4
4lg(
~'I 8
c"L
F
I' '
1
1
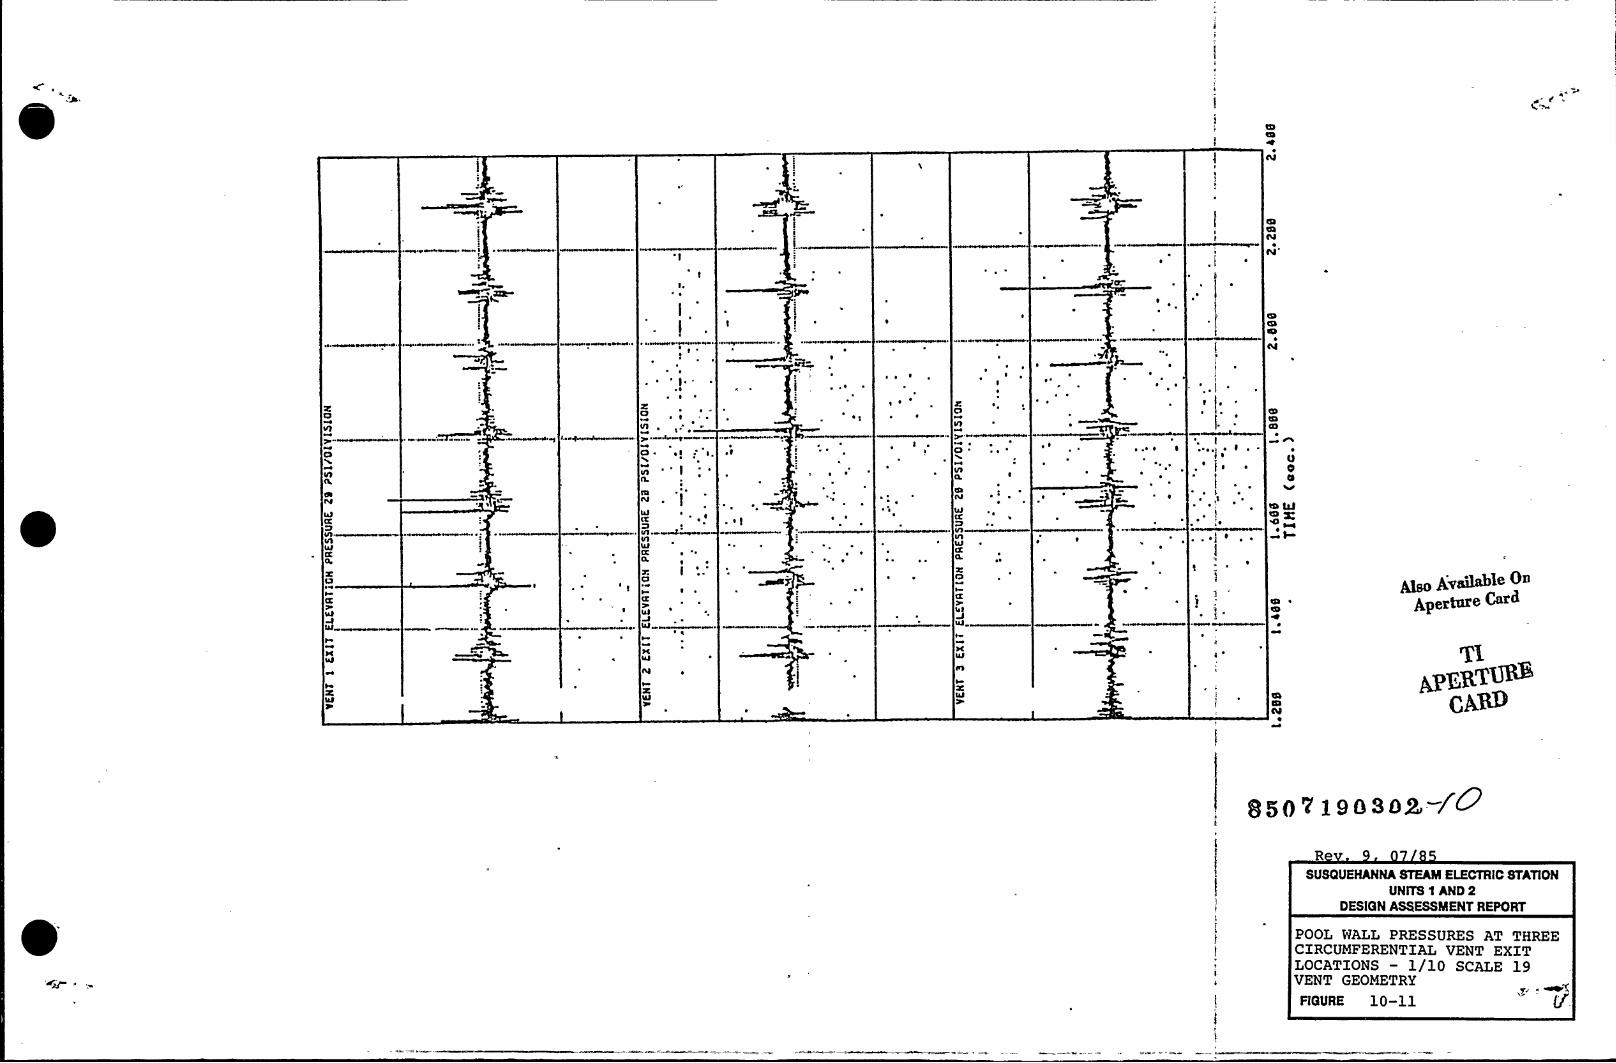
CDIDICI
~ ~0 &0 ~ 0 OW l~t» l ON ~ WI WW %HEI
~~
CDCDID
EV
cC7
CCI
0
CD
CCICL
QICt
4IWCCQ,
X'I
~ %I
WWI
ICW
~ ~
C7~ Ii'
a-'I
tV
4IaCCI.
4ICLQ.
x IIP
~ ~
W,
~ I
~ f
~ ~
~ ~
~ ~
~ ~ ~
l ~~
0 ~
lI
0 '~
CIIQ
IDf44ICL'J
CXCL
XPJ
ICX
4IW
~ l
~ ~
~ ~ ~ . ~ ~, ~ I, ~
) ~.'o
tfg ~
~~ ~
CD
CD
0Oa
~ p~gggQe 08Apertare Csrd
W
IÃ4I
lW
SUSQUEHANNA STEAM ELECTRIC STATIONUNITS 1 AND 2
DESIGN ASSESSMENT REPORT
POOL WALL PRESSURES AT THREECIRCUMFERENTIAL VENT EXITLOCATIONS — 1/10 SCALE 19VENT GEOMETRY
FIGURE 10-11 u'

~ „
qa
r-
a)- ',I
4,aa at
t
~ '
C'
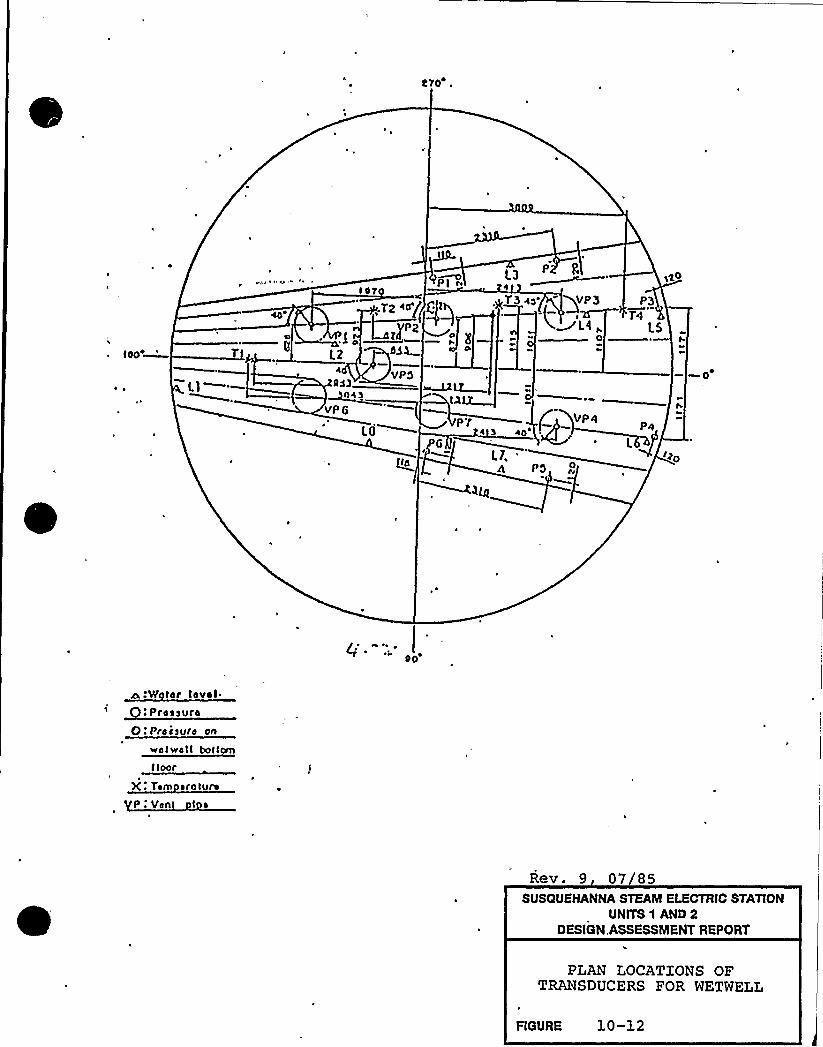
tOpG
L1
~G
L2
VP5RA3
n<$VPG
LO
Pl r
GG
PT
L3 g
gT3 «'P3
p@Vp4
P3T4
LS
itp
h
«p
P5
A Vf ler level ~
: Pressure
0 ~ Pre t surd on
wet welt bottom
t loor
X: Tem orotund
P:Ven l e
Rev. 9 07/85SUSQUEHANNA STEAM ELECTRIC STATION
UNITS 1 AND 2DESIGN,ASSESSMENT REPORT
PLAN LOCATIONS OFTRANSDUCERS FOR WETWELL
FIGURE 10-12

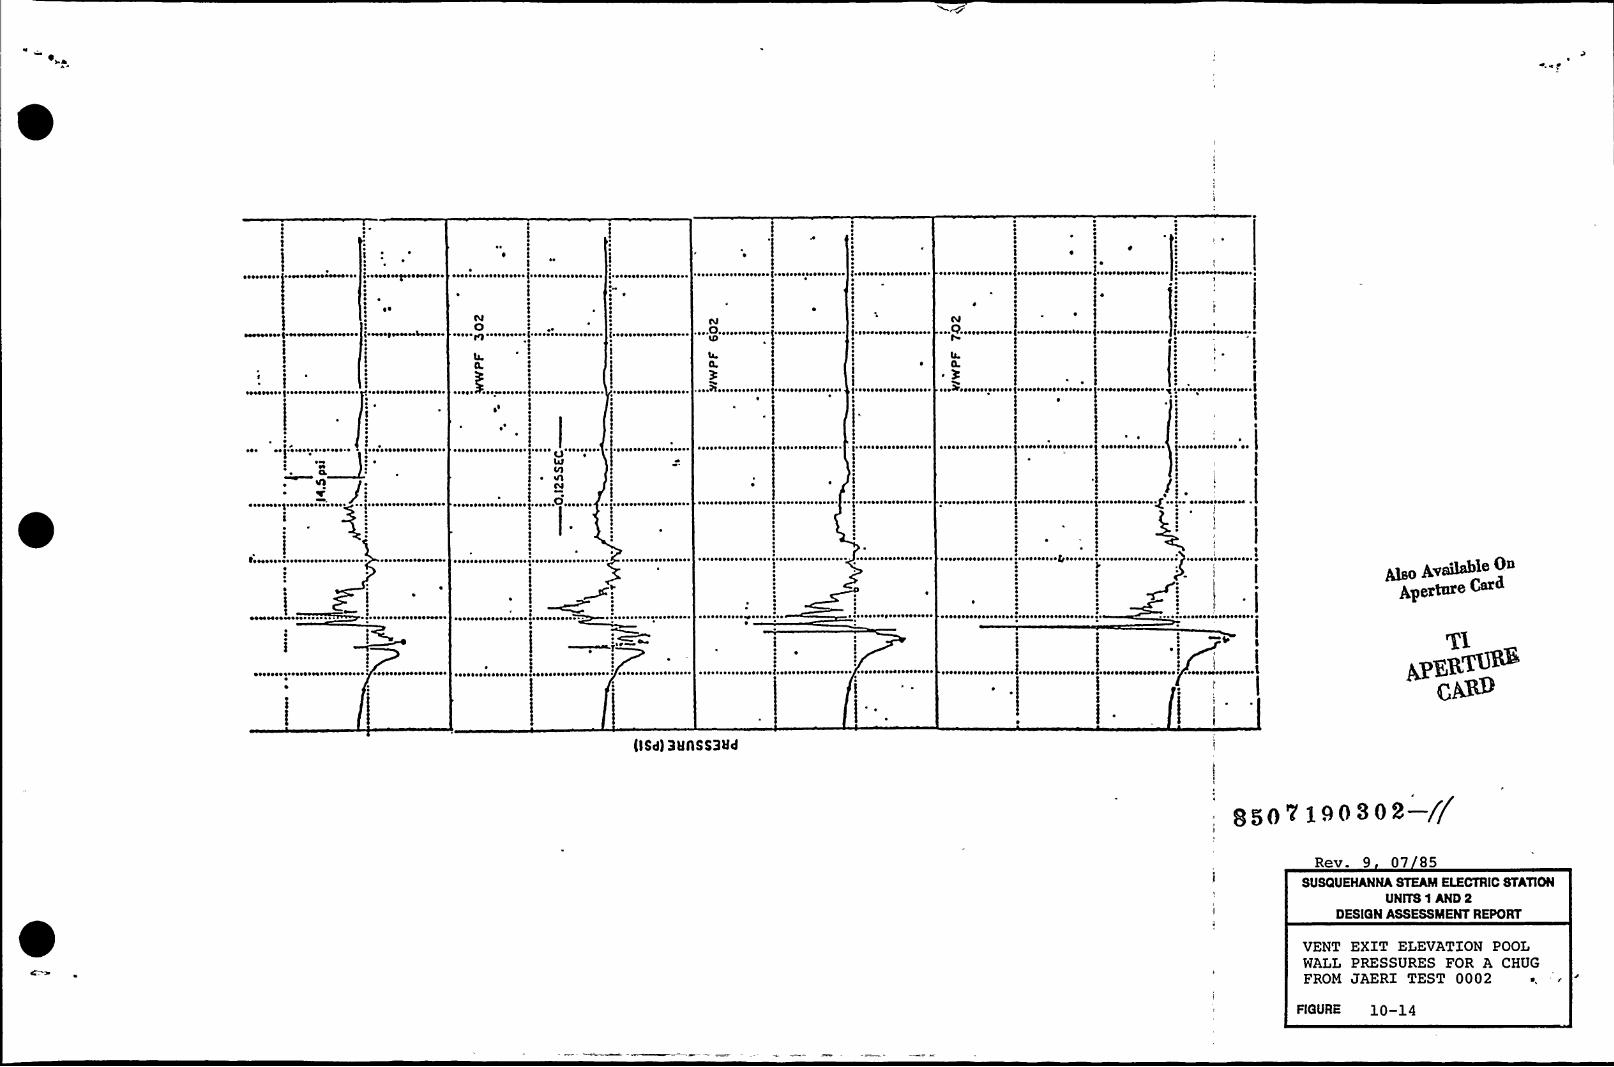
HettootI ~ OOHHOHOOIttHO
~ ttOHtt~ ~ tH0 ttIttIHH\\ 0
~ ~
~ ~
400000000VOIHOOOO ~
~ ~
~ ~ ~
~ttHtfHHH4HOOO
~ tttts ~ I ~ 0 ~ I~ Ottts
ONOH 49 ~ 0 ~ 0 ~I~ 00 ~
~ 0
~ ~ 0 ~ 0 ~ I~ 0 ~ 0 ~ 0 ~ I~ 0
~I~ 1 ~I~ ~ 0 ~ 0 ~ 0 ~ 1 ~ 0 '
~ I~ ~ ~ 0 ~ ~ ~ IHO~ 0 ~
-.0-..--00.0.ID
~ ~ 00000 ~ 00 ~ to ~ 0 ~ I~
~ ~
( ~ Ootoooeoototots ~
~ tto ~ Ootttto ~ 0 ~ ~
~ ttt~ I~ Ottt ~ 0 ~ 00 ~
4
4 F 10 '1tottottIO ~ 0
!
I I~ 0 ~ OOHOI ~ 0 ~ 000 ~ 0
~ ~
~ \ ~ Otttt\tttosttt ~ Sttotoeoot01t111tt ~ 101tHOO\tttott ~ 0
CN4
~ ~ Qs ~ 0 ~ 0000000004
~ OOOIHOHIOOHOOO OOHOIOOOHHOHO ~
~ \tt\0ttH0HH01\ ~
IfN
N I410000HH000000HI ~ ~
~tHHO~ \ ~ ~ 010 ~ 00 ~ OOHI~ 0 ~ , 0 ~ 01 ~ 101001 ~ OH H 0 ~
4O.
~ I~ 0 ~ ~ OIHO ~ 0 ~ 0 ~ ~ 00 ~ It ~ 0 ~ I ~ 0 ~ 0' 1 ~ 0\ ~ 0 ~ 00 ~ 0 ~ 10 F 0 ' ~ 00440000 '0010000 ~ ttoo ~ 0 ~ 0001 ~ 0 ~I~ 4'00000000000000000 ~ 00%0000 ~ 0 ~ 000 ~ 0 ~ ~ 000 ~ 110 ~I~ 0 ~ 10101 ~ ~ 0 H 0ttHI0 tt0 ~ ~ ~ 00HH01 ~ IIOOOH
~00 ~II 0 ~ 00 ~ ~ 0 ~ 00 ~ ~ $ 00 ~ oteooHI ~ 0 ~ tttto~ ~ ~ ~
~OH%11 ~ 00100 ~ 01@HO ~ I~ I~ 0 ~ ~ 0 ~ 001000001000
j::~ 000HOO) oottootssoto ~ ~ ~ gstooteoeo ~ ooootooo ~
~ too ~ 0 ~ 0 ~ Ootto ~ ~ ~
~ Oto ~ 0 ~ I~ 0 ~ 0 ~ 0 ~ 0 ~ 0
i~ ~ ~ ~ ~ I~ I~ I~
LIJI/)
CN4
,.000.0„...„
I
~ to ~ ~ Itttootootts ~ 0 ~ I~ Ooteettttotte
~ 0 ~ I~ 0 ~I~ 1 ~ 0 ~ 0 ~ 0 ~ 0 ~ I~ I~ I~ 0 ~ IOI~ 00 ~
~ ~ ~ ~ ~ I~ 00 ~ I ~ ~ ~ ~ Oott ~ ~ ~~ 0 ~ 0 ~ 0 ~ 1 ~ OOHO ~ I~ 0 ~ ~ 0 ~ 0 ~ I ~ I~ I~ I~ 0 ~ 0 ~
~ 0 ~ 0 ~ Itt~ 1000 ~ 0 ~
~ 0 ~ OS ~I~ ~ 0 ~ 0 ~ 0 ~
~ 0
~ ~ ~ I ~ I~ Ottte ~ 00 ~ 0 ~
~ I~ 0 ~ ttttott~ Ott ~
~ ~ 0 ~ I~ Ittot~ OttO ~ te
~ 0 ~ 0 ~ I ~ 0 ~ 0 ~ ~ 010 ~ 0 otHtt ~ ~ 1 ~ OHHI~ 0 ~ 0001001 ~ 0 ~ 1st ~ I~ 0 ~ItttIt~ 0 ~ ~ I
~ 0 ~ 00000 ~ 1 ~ \ ~ 000 ~ ~
~ OHt011100 ~ I~ 0 ~ 0 ~
~ otttoootoootooooosg 000000000010 f ~ ~ ~ oooototooooooo ~
I
~ tottoo ~ otfgtoostoto eooootItteso tooer ooootoooooot 00 0
HHHOOHOIO~ ~
~ ~ 0000000000W000 ~ toIIOHOO~ Ottts ~ I ~ \~ \~ \000 Q ~ ~ \ ~ ~ 0 ~ 00 ~ 0 ~ 1 ~ ~ 10 ~ 0 ~ 000 ~ 0 ~ 0 ~ ~ oto ~ 0000 ~ 00 ~ oo ~ I ~ 00 ~ 0 ~ 0 ~ 000000000 ~ 0 ~ ~ttO ~ Oostotoo ~ 0 ~I~
~ gyggg51e 0+
Aper~e Carrd
~ 0 ~ OtttootooOIOOOH101001 ~I 0 ~I~ 0001HOHtttH ~ tt00001 ~ ~ ttte ~ 01 ~ ~tt ~ 0 ~ 0 ~ 100 ~ 0 ~ 11 F 0 ' 1 ~ 0 ~ 1 ~ 10 ~ I~ 0 ~ ~ 0 0 ~ ~ ss ~ ~ 0 ~ tots ~ I~ 40 ~ ototott ~ ottttotos ~ I~ 0 ~ oot000 ~ 000001 ~ ~ 0000000000000000oj ~ 00 ~ 0 ~ 0 ~ 000000 ~ 0 ~ 004 ~ 11 ~ OOHH0000000 ~ ~ HOIIHIIIHI~ 00
tiS~l 3UASS3Ija
85' 1. 404302 —ffRev. 9 07 85
SUSQUEHANNA STEAM ELECTRIC STATIONUNITS 1 AND 2
DESIGN ASSESSMENT REPORT
FIGURE 10 14
VENT EXIT ELEVATION POOLMALL PRESSURES FOR A CHUGFROM JAERI TEST 0002 ~

0 ~ .
t'i',4J
t i'I
;q(w'
~*I,„1.I
F'h
g
Z5ge
i<~'J
~4
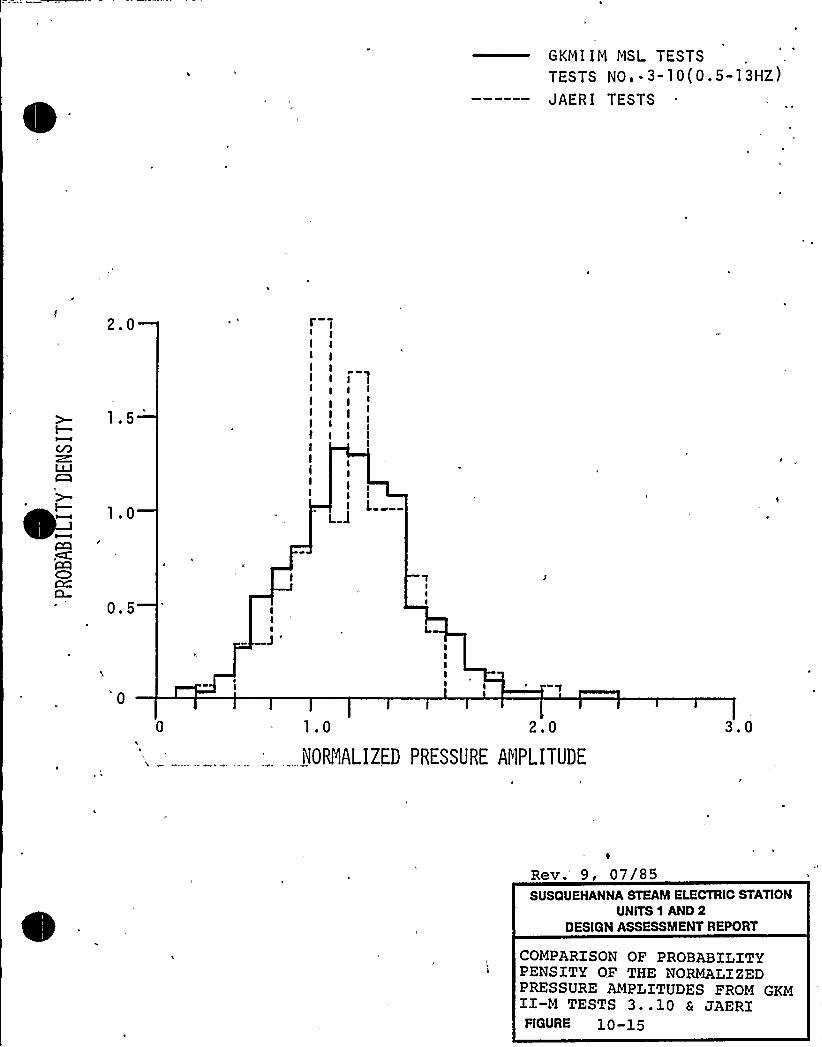
GKMI IM MSL TESTS
TESTS NOI -3-10(0.5-13HZ)JAERI TESTS
2.0
1.5
r-II
III III
I I III I
1.0
IIIIILl
0.5
0
0 1.0 2.0
iHORNALIZED PRESSURE AflPLITUDE
3.0
Rev. 9, 07/85SUSQUEHANNA STEAM ELECTRIC STATION
UNITS 1 AND 2DESIGN ASSESSMENT REPORT
COMPARISON OF PROBABILITYPENSITY OF THE NORMALIZEDPRESSURE AMPLITUDES FROM GKMII-M TESTS 3..10 6 JAERIFIGURE 1 0- 1 5

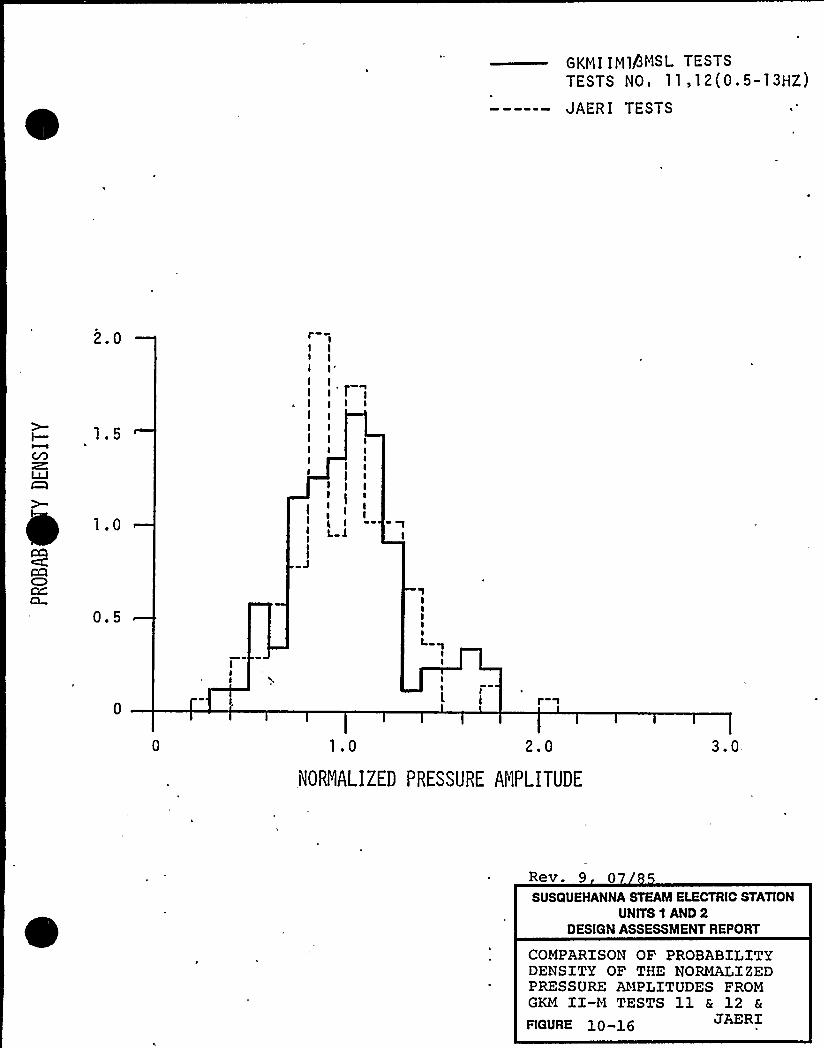
GKMIIM1!3MSL TESTSTESTS NO 11 12(0 5-13HZ)
JAERI TESTS
2.0
1.5
1.0
r-II
I
IIIIIIIII
III
J
IIII'
I
IIII
II
0.5IIIIIL
II
1.0 2.0
NORNALIZED PRESSURE ANPLITUDE
3.0
Rev. 9 0SUSQUEHANNA STEAM ELECTRIC STATION
UNITS 1 AND 2DESIGN ASSESSMENT REPORT
COMPARISON OF PROBABILITYDENSITY OF THE NORMALIZEDPRESSURE AMPLITUDES FROMGKM II-M TESTS 11 6 12 &
FlGURE 10-16 JAERI
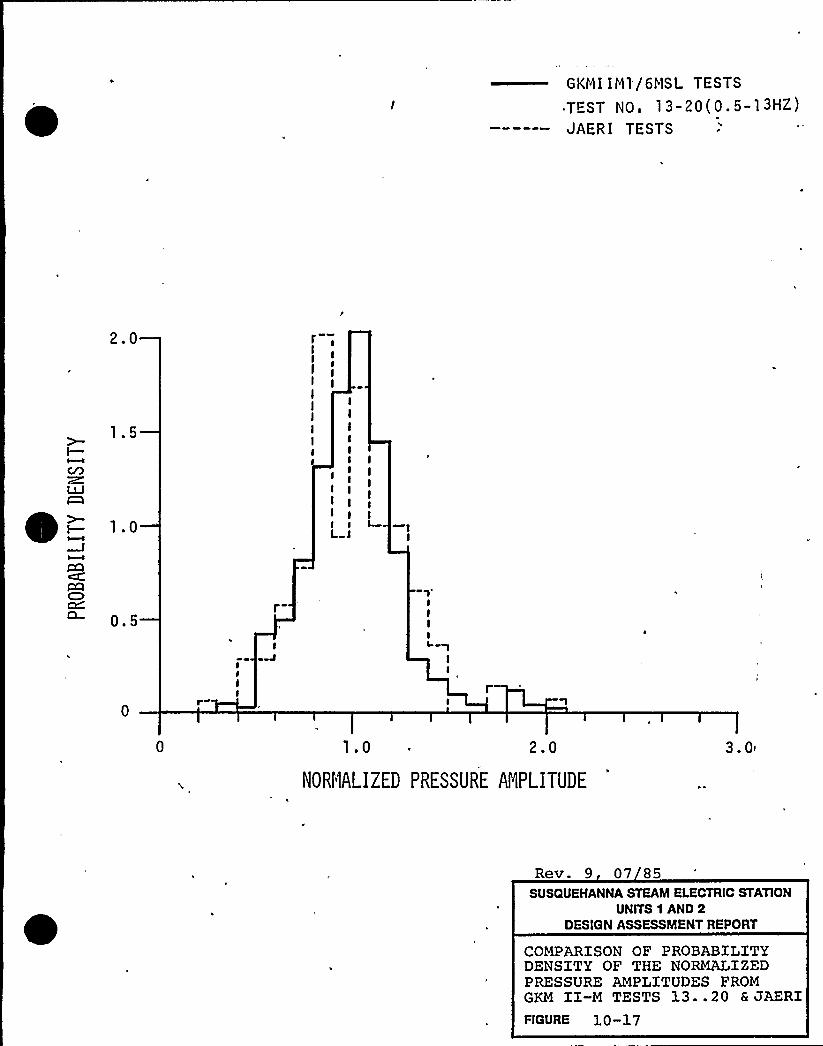
GKNI IN1/6IISL TESTS
EST NO 13-20(0.5-13HZ)JAERI TESTS
2.0
~ o-
1.5
1.0
II
III) IL
IIIIIIL-
0.5
1IIIII ~
II
1.0 2.0
NORI"lALIZED PRESSURE ANPLITUDE
3. 01
Rev. 9 07 85SUSQUEHANNA STEAM ELECTRIC STATION
UNITS 1 AND 2DESIGN ASSESSMENT REPORT
COMPARISON OF PROBABILITYDENSITY OF THE NORMALIZEDPRESSURE AMPLITUDES FROMGKM II-M TESTS 13..20 6 JAERIRGURE 10-17

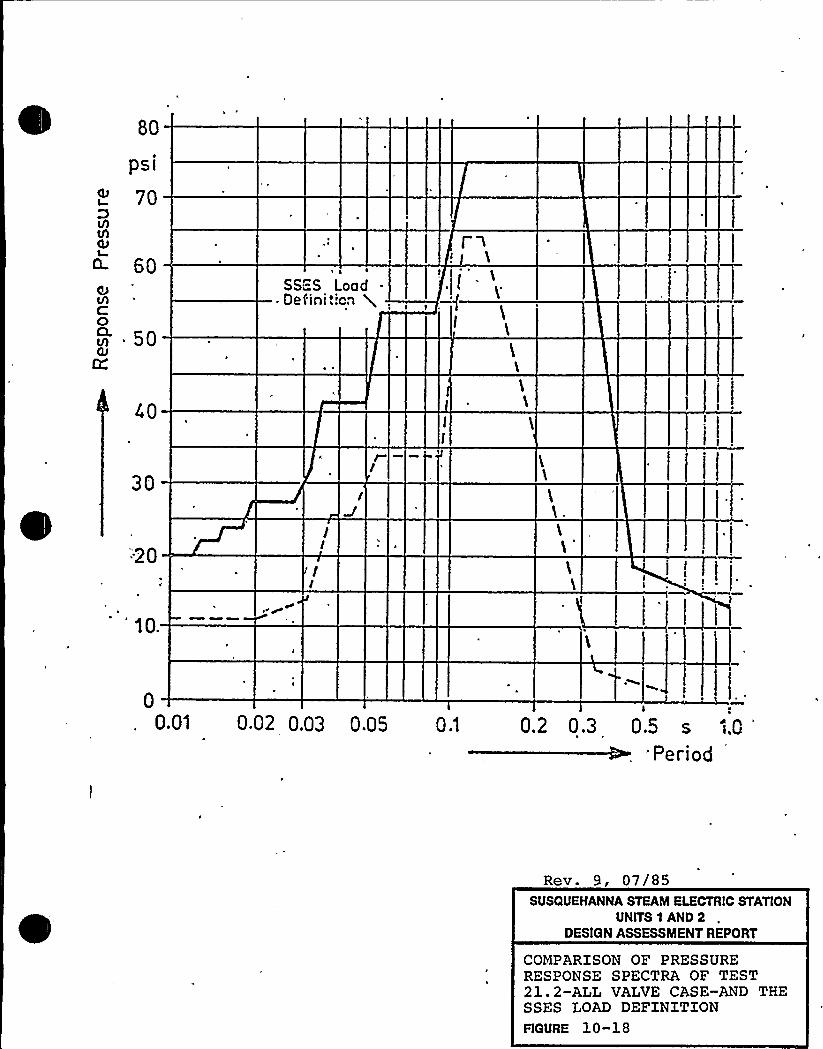
80
PSI
70
CL 60
v) 50
SS=S LoadDefinition i
40
30
~ II
00.01 0.02 0.03 0.05 0.'t 02 03 05 s IQ
Period
Rev. 9, 07/85SUSQUEHANNA STEAM ELECTRIC STATION
UNITS 1 AND 2DESIGN ASSESSMENT REPORT
COMPARISON OF PRESSURERESPONSE SPECTRA OF TEST21.2-ALL VALVE CASE-AND THESSES LOAD DEFINITIONFIGURE 1 0- 1 8
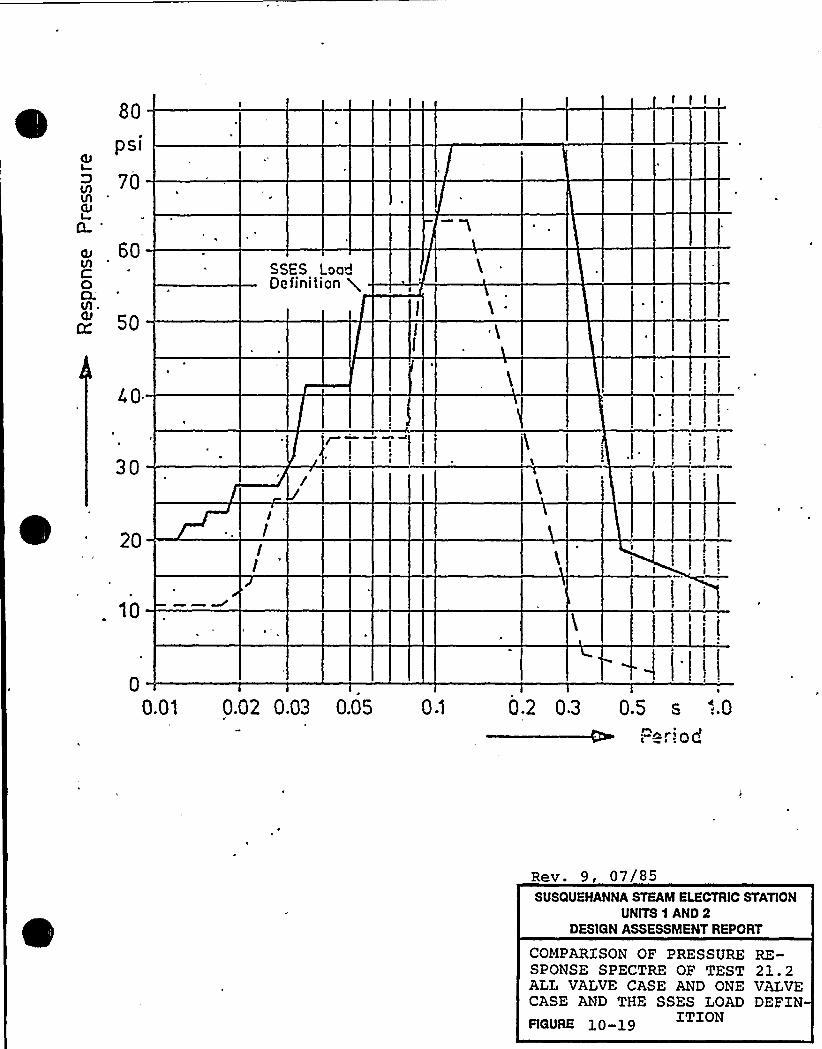
80
PSI
D 70
CL'
60
O
CJ 50
SSES LoadDefinition g
40
30
2O
I ~
I ~
00.01 0.02 0.03 0.05 0.2 0.3 O.S s '..0
'"'od
Rev. 9, 07/85SUSQUEHANNA STEAM ELECTRIC STATION
UNITS 1 AND 2DESIGN ASSESSMENT REPORT
COMPARISON OF PRESSURE RE-SPONSE SPECTRE OF TEST 21.2ALL VALVE CASE AND ONE VALVECASE AND THE SSES LOAD DEFINFIGURE g 0 -3. 9
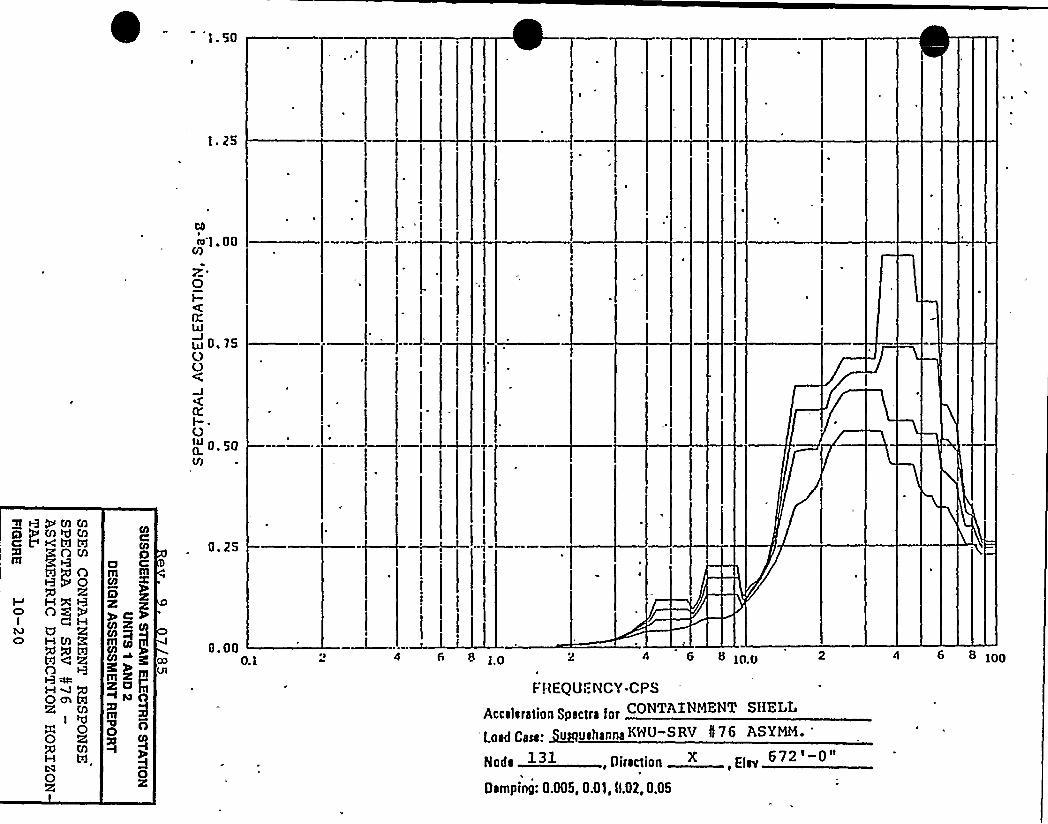
cD
m l. 00Mz'
OLAJ
w 0.75C.)O
ol- ~
Idj 0 50Vl
Q RQMM
I Inm
wean
aO HM
3.'ory%
RnHM gOahR M
I '0O0M
hl0R
D0 Cm m
g)
m Pj N~~m
5O
0.25
0.000.1
~ s 4 6 8 1P 2 4 «1O.OF!FREQUENCY-CPS
Acce)aration Spectra d'orCONTAINMENT SHELL
'Load Cas!'ooehannaKWU-SRV I76 ASYMM.
672'-0"Nods ~3~,Direction ",Eisv 672'
Damping: 0.005, 0.0), ll,02, 0.05
4 6 8 lpp
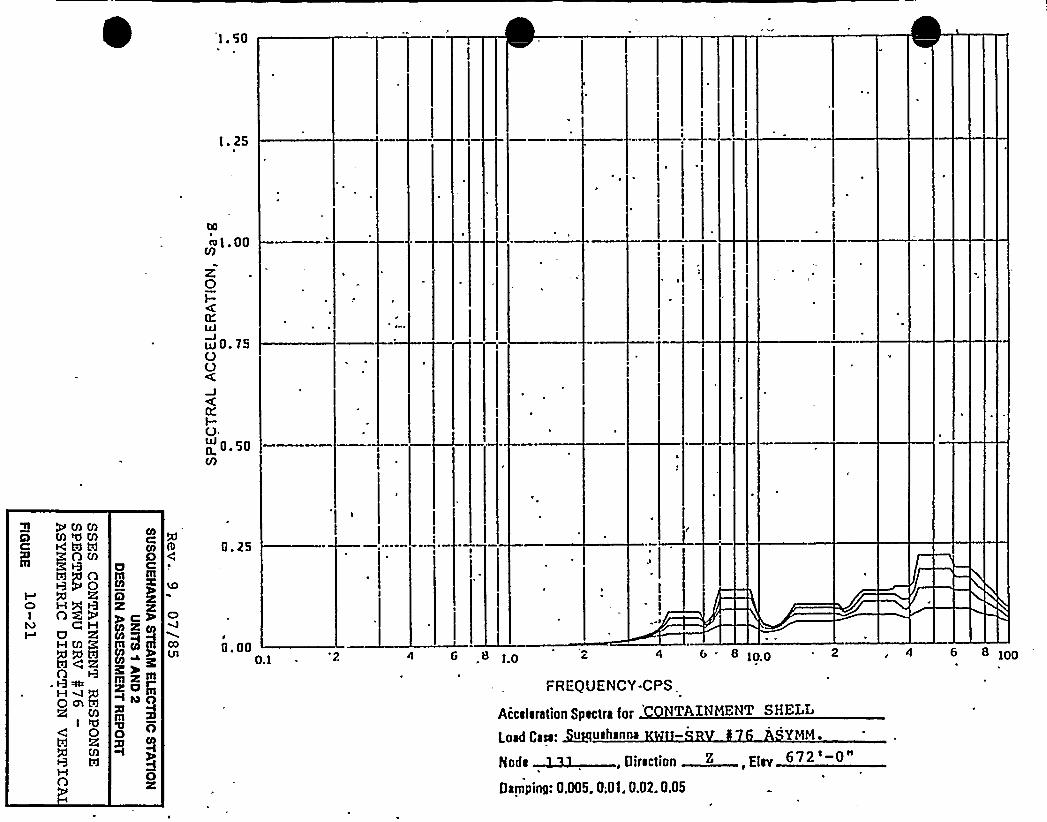
1. 50
t. 25
b0
4>.aa(0
Z0I-
0'g
0.15OC3
KI-O.
p 0.50M
QMMN td XgOMta y n
RHXRncvQ H
UHM ggQWO P3t3 MHMgOaW2g M
I 0RM
HO
OamCO
ClR Kye>Ig]+~m
0
0.25
0.00p.l 4 6 8 4 6' ]pp
FREQUENCY-CPS
AQQIji~fjpg$plcfyg fpp TAINMENT SHELL
oid Case: ~uulhanna YMM.Ml~. i i,EIDamping: 0.005. 0.01.0.02.0.05
4 6 8 happ

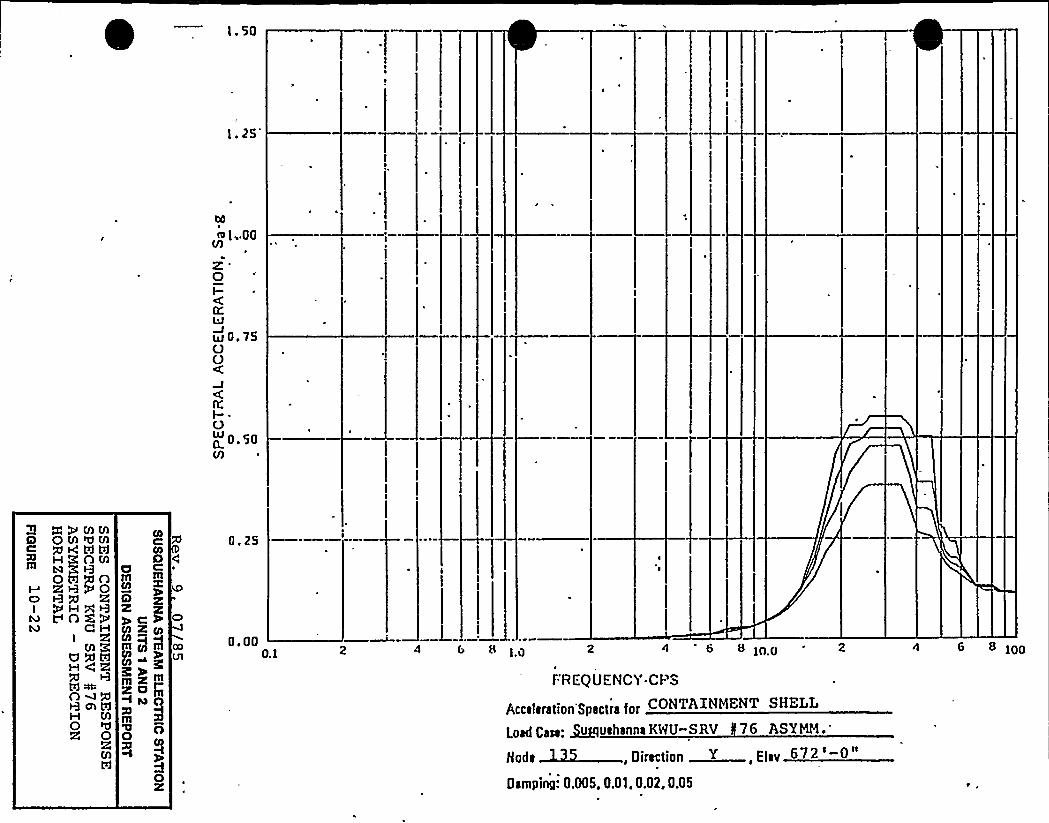
— i.so
l. 25
bp
41..0aUl
z'I-0~e
w0.75OO
nI- ~
O0 0.50Ul
NPMMQ QUl<Ma XCWtag H OM
RRPQQW 0c) 9 '5 8I /HER
I VnCVD C H
I RUl 3lUQW
OwQ
%chal
H UlQ
QR
CtlC
COO
D Cm m
ClR Kye%g ~ CO
m Py $3l
O
0.25
a.ao0.1
L4 6 8 100
FREQUENCY-CPS
Accgjg~ljpn Spgclcg fpI'ONTAINMENT SHELL
Lp~f Q~: ~UUlhannaKWU-SRV 76 ASXMM.'~, i .E
Oamping: 0.005, 0.01, 0.02, 0.05
100

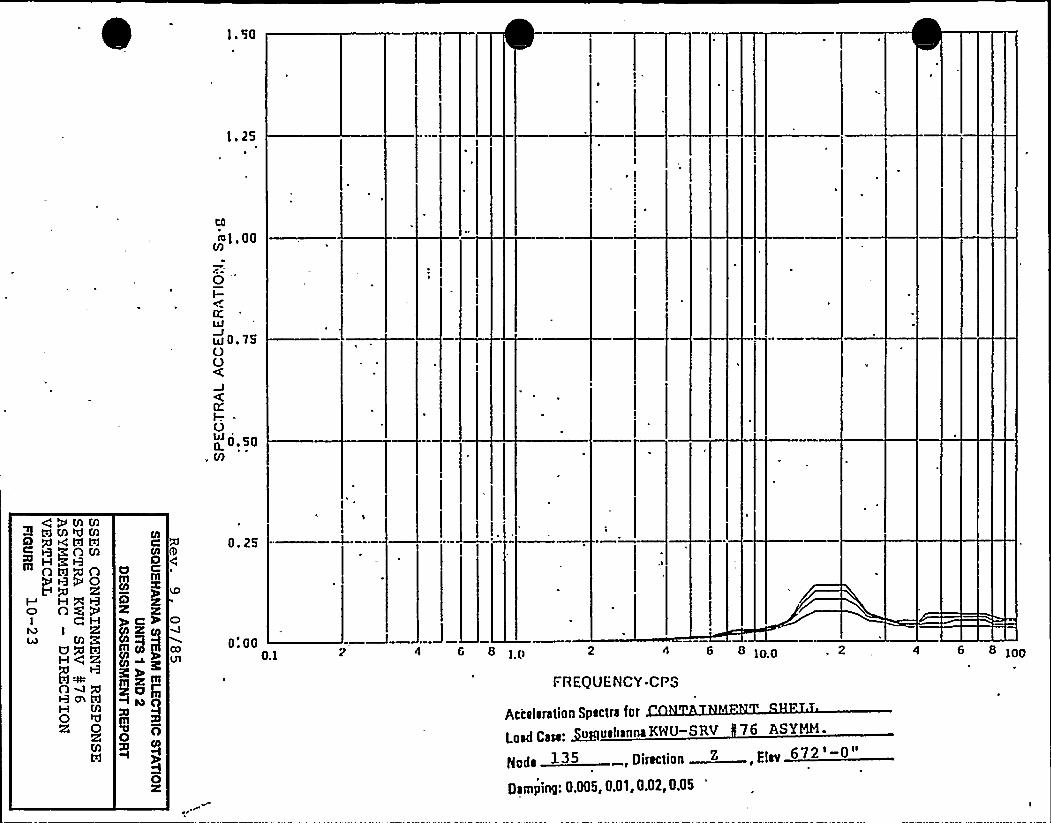
t0~1. 00
U)
0'-
KuJ
LLI 0. 75OO
KI-.UW
'I0.50„M
g~MMWMWMQp4%td
OW)O0I HAHo nayI CpH
MM
3,'QW
n~w0P 0
0g C
IOz z~CAIPy)mam
0
0. 25
0'. 000.1 1.0 2 8 1oo
FREQUENCY-CPS
2
AcceleratIon Spectra for
Log Case: ~uuehanna KNU-SRV 76 ASYMM.
672s-0ttptt~ >>5, Ditpptipp ~, Elsv D7~
Damping: 0.005, 0.0l,0.02,0,05'
6 8 100

0
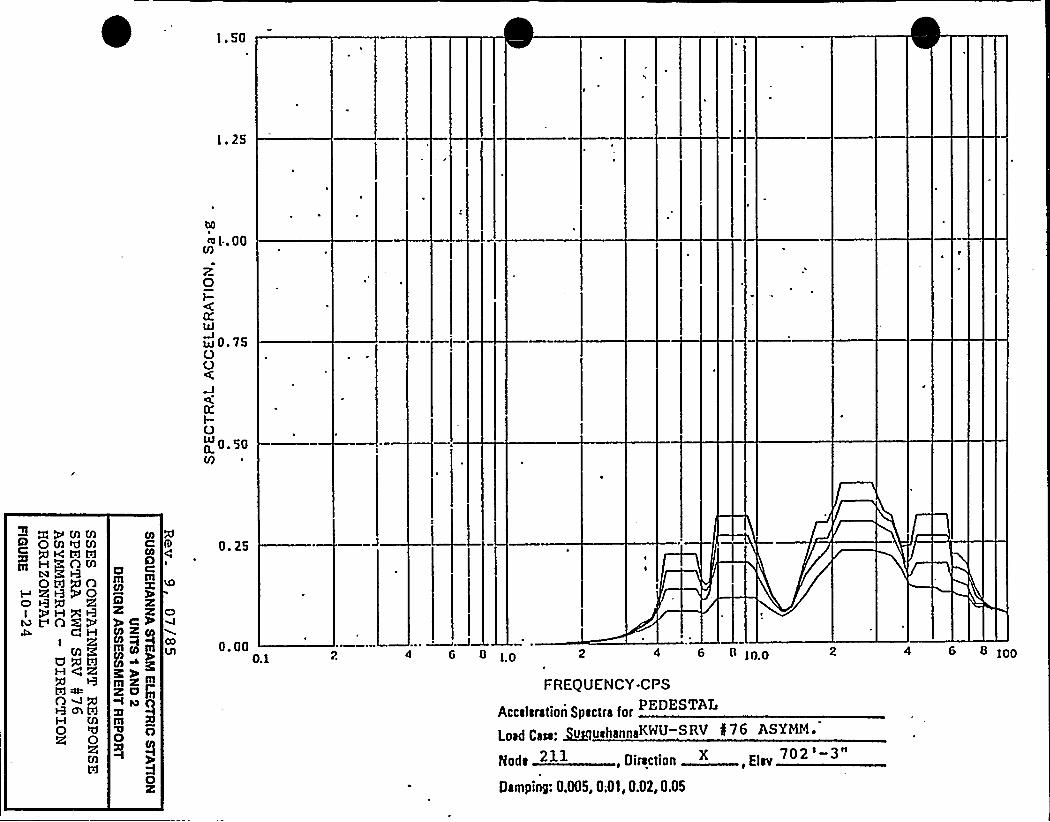
I.50
t. 25
b0
4 I..00M
0I-0LIJ
w 0.75OO
O:I-O0 0.50V)
NQMMOMeMQ N<tocoor Mg re re
W Ri-3500 GATI 0c) 9g 8+HER~ VOCP
Q HI Pi
M 3lUQKH4ROMQH M0 0
R
0ill
Cll
2ye%rll ro3l~~m
0
00Vl
D. 25
0. 000.1 4 6 0 t0 4 6 O Ioo
FREQUENCY-CPS
Accalaration Spactra for
Load Caaa. ~uuahannaKWU-S RV 4 76 ASXMM.
Node 2~~,Direction,ElevDamping: 0.005, 0.01, 0,02, 0,05
4 6 8 100

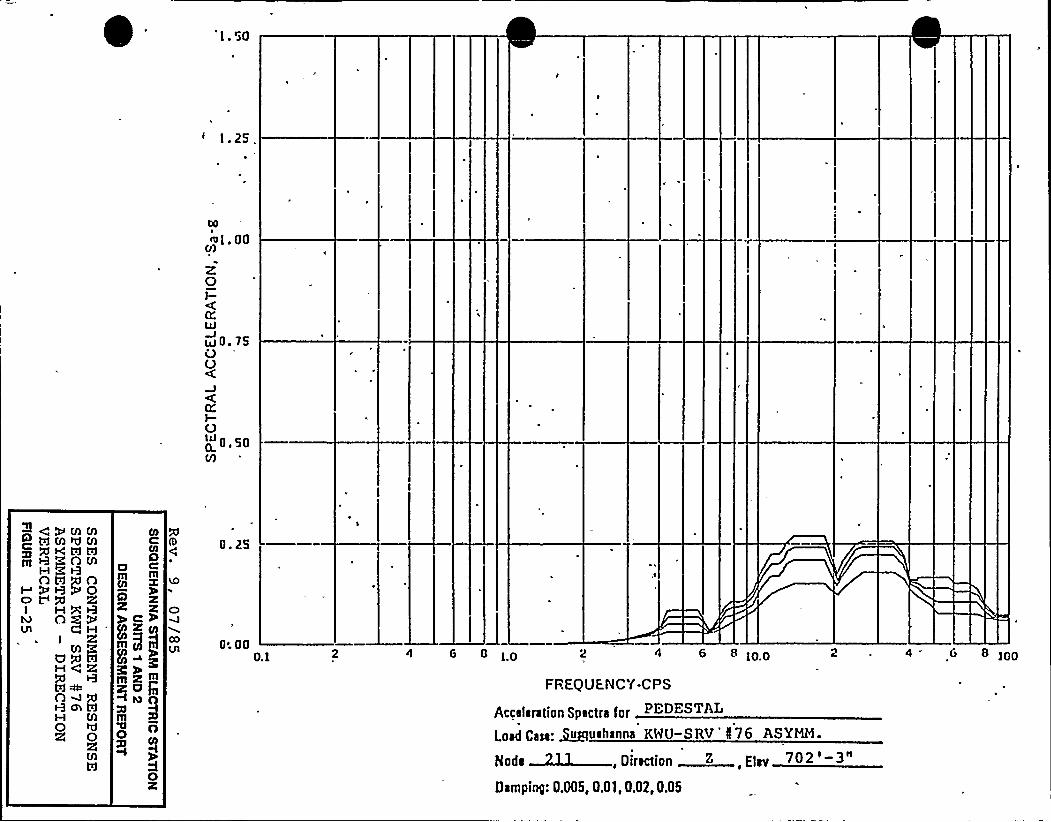
b0
~l.00ri)
GI-pLLI
w0.15VO
KI-OILIp 0.50V)
+ QQMQ)g ITIMMMQ Acro%
I PRlO8I HgR
AI Raw5HCRg~n~wH M0R 0a
td
Dg C
adam~~m
O
CO
COVl
0. 25
0'. 000.1 6 8 Ip 2 4 6 8 1pp
FREQUENCY-CPS
Acceleration Spectra for PEDESTAL
Load Caee ~uuehanna KNU-SRV '76 ASXMM.
II ~, '»'BDamping: 0.005, 0.01, 0.02, 0.05
4 G 8 1PP
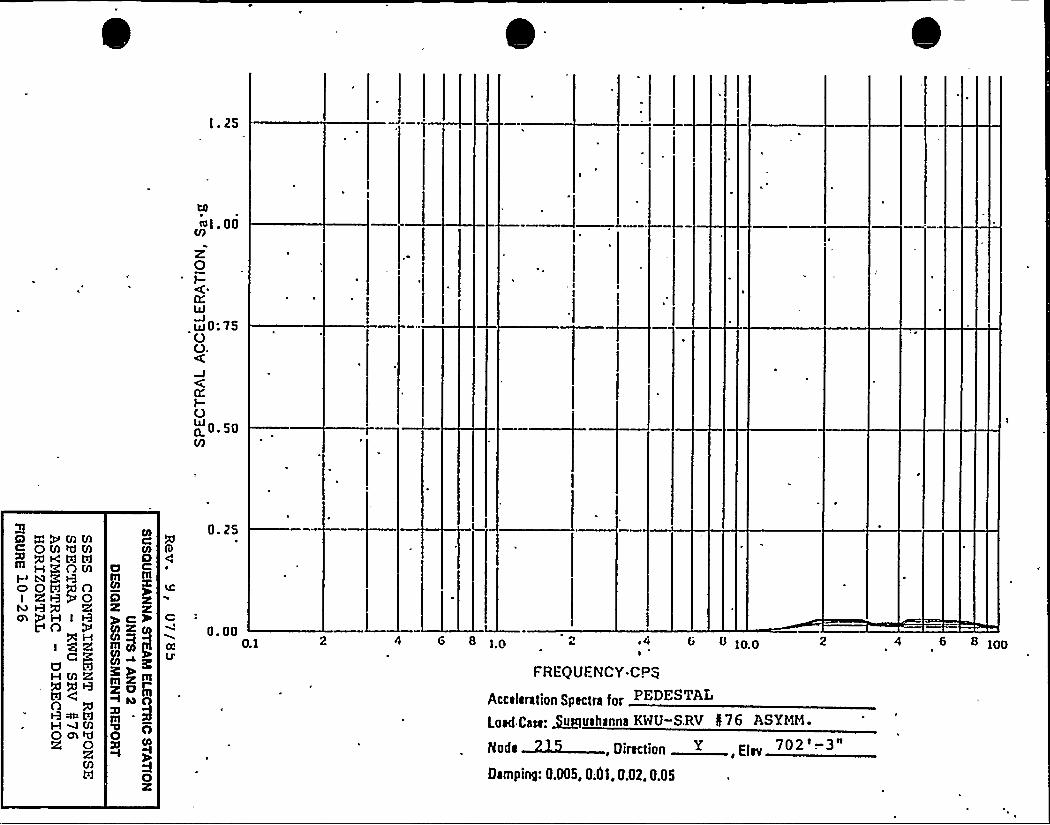
t4-EEE l. 00
V)
z0I-KIEJ
IEIO:75OO.
KI-O0 0.50Uj
2A X~MM
Q M ECI Mg QH fEICEI
H(OM
hJ t3+ RCh+H IVO g HI $ 2)
Q ÃHM 8
nR ~ tdHAMQ DECI
QR
COC
CO0omCO
C)
~C-P
Igfel
Igm
O OCO
C g0X
0.25
C0. 00
CO 0.1V'
6 8 ~ O " "10.0I
FREQUFNCY-CPp
Apgaiacaf jpn Spapfca tpI'EDESTALLpad.Caaa; ~UUahanna KWU-S.RV I76 ASYMN.
7020-3"II ~,' ",EtDamping'. 0.005, 0.0$ , 0.02.0.05
4 6 8 100
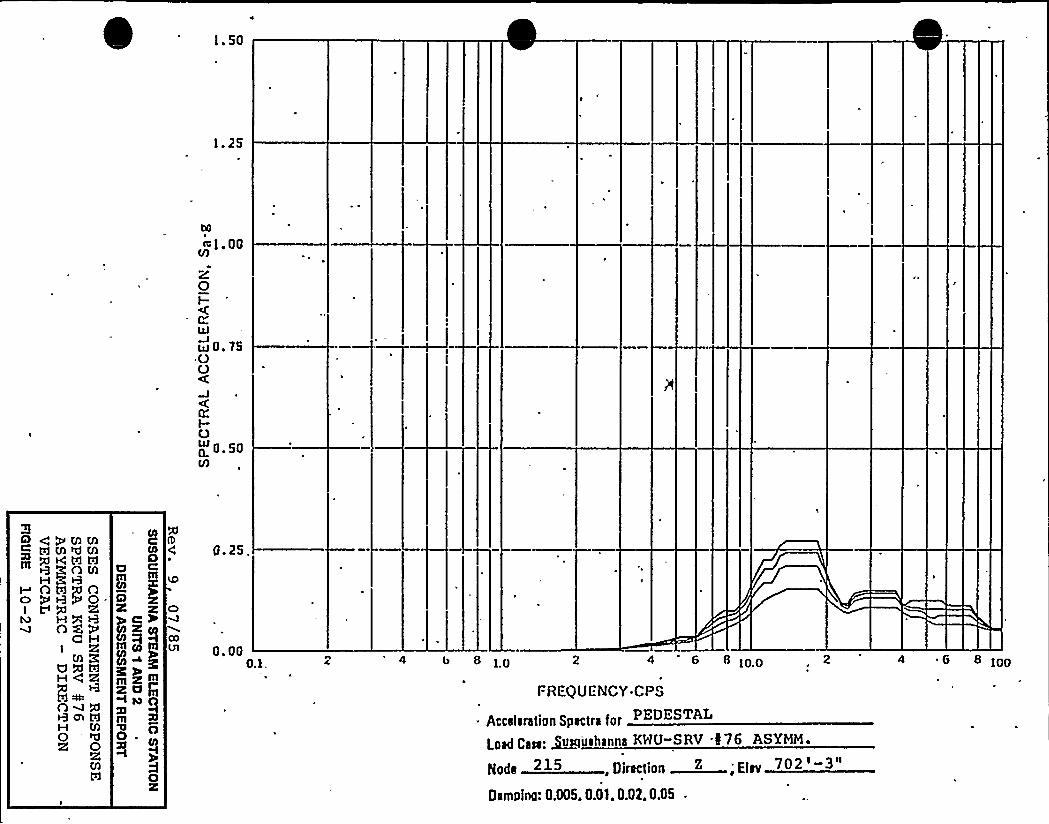
t. 50
Le 25
b0
~ l. 00
0I-K
w0.75OO
KI-O0 0.50U)
2Io CVrncnc= ta Iw cn
g Q c td co
IhJ HXROCR
C HI
M 3lUN%H48pn~wQ ch NH U)Q 0
R
I oI )
5OX
COVl
0.25.
0. 000.). t.p 2 4 6 8 IPP
FREQUENCY.CPS
Acceleration Spectra for
Load Ca~: ~u'uehanna KNU-SRV '076 ABYSM.
702'-3NNode >>>,Direoeion E,'ElevOampina: 0.005. 0.01.0.02.0.05
4 G 8 tpp
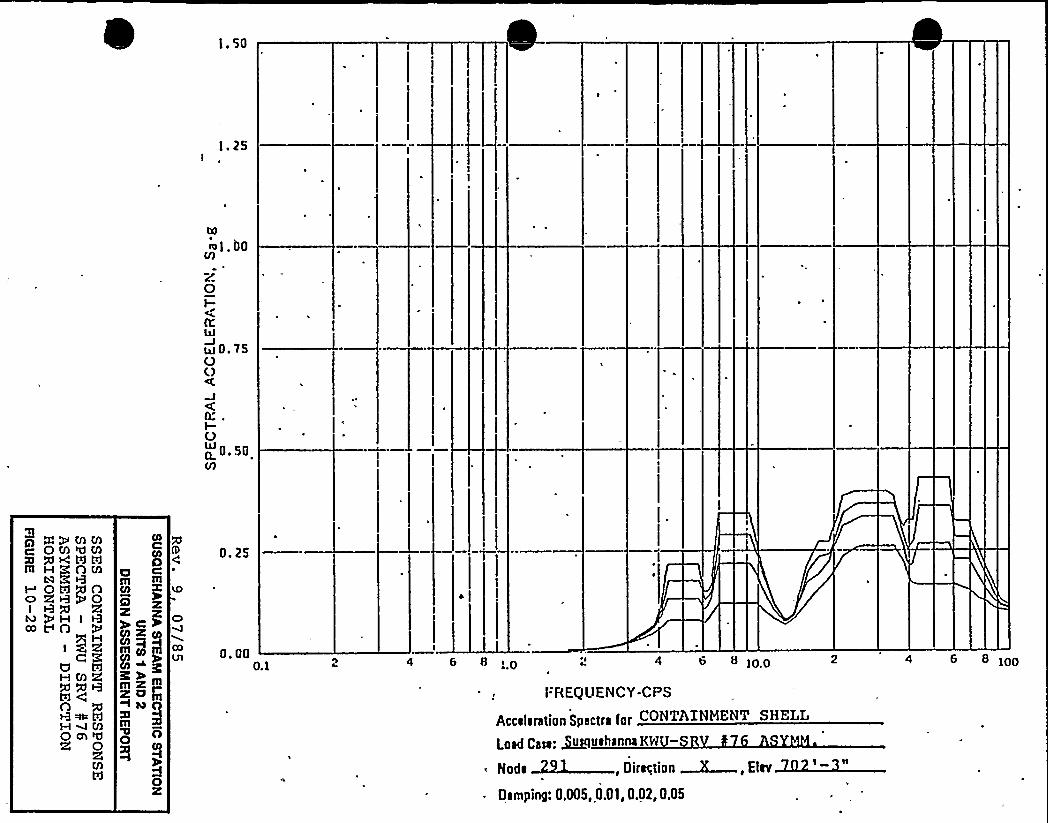
l. SO
CO
i' . b0V)
0I-KLLI
ILI 0. 75OC)
0:.I-Oo 0.50VI
P) QQMUlg OMrlIM5 QMWXnl HgOM
I RA RPH I00 VO g H
t 3'WHMg
OQ m hjHMCQOn%0
RW
8ill
CO
3l
nl ~ fll
O
0. 25
0. 000.1
a)
f-REQUENCY-CPS
Aggelenl<ion Spep)ga foI CONTAINMENT SHELL
Load Case: ~uIIehanna KW—
Node , Qirrctirrn~, Elsv
Oamping: 0.005, 0,01, 0.02, 0.05
4 6 8 1O 4 6 8 IOO
n
4 6 8 100

l. 50
a)e l. 00
V)
Z0
0:LJJ
<Jj 0.75OO
0I-.O0 0..'50M
2C COMM
td M % Mrn %<tdtdI MRtBo Onion
RH I t3n g HI
C 'ZaHM 8
HAMQ ch 40
rn
ag)
O~ O
5OX
0.25
0. 0001 4 G 8 2 8 >Op
FRf;.QUENCY-CPS
. Accafaralion Spaolra for CONTAINMENT SHELL
Load f;aaa. ~uuahannaKNU-SRV 76 ASYMM.
Il ~ tti i,E '-3"Oamping: 0.005. 0.01, 0.02.0.05
4 ' 8 lpp

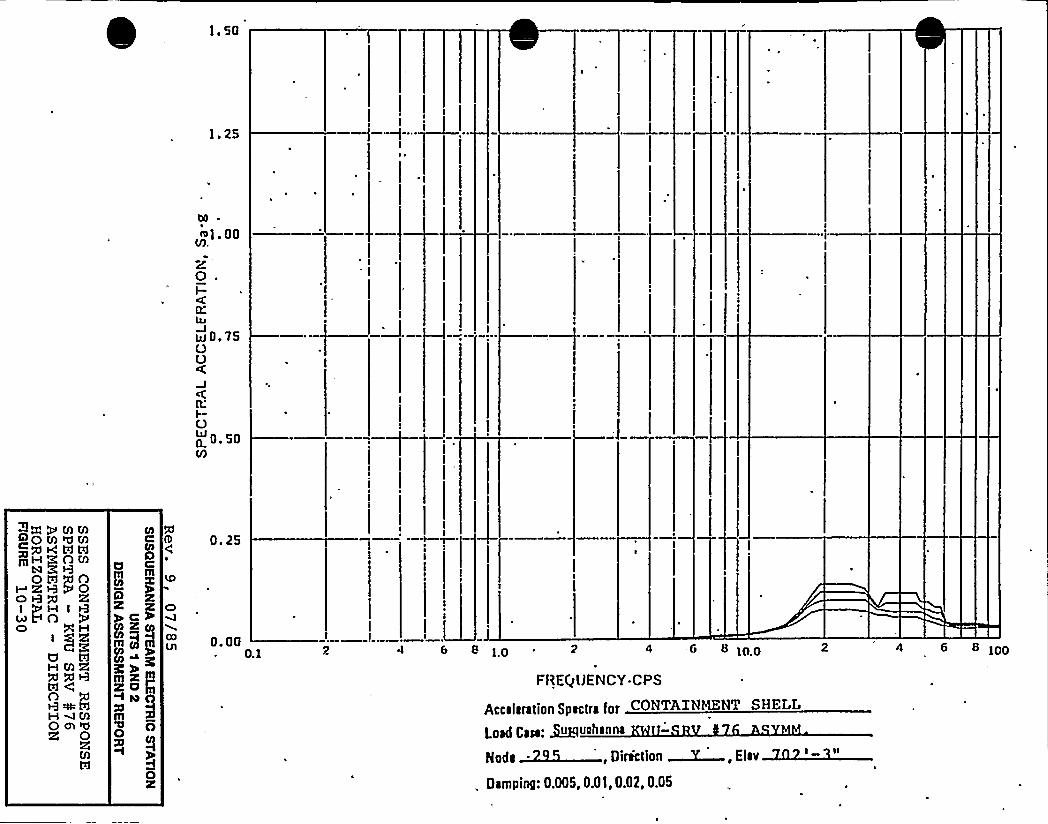
DO
~l. aaV).
0'.I-CC
w0,75UO
KI-00 0.50M
~X+ MMgOMWMQQKWRIH'g nM
I RRNOow nCDQg g~InO 5H
I
U ITIHMgW4
HAMo ChQ0Rtd
O
eg)~~m
5O
C)
COVl
0. 25
0. aa0.1
I
I
6 8 1O ~ 4 -e 8 in.o
Node , Direction ~, Etsv
. Damping: 0.005, 0.01,0.02, 0.05
FfkEQUENCY-CPS
Aggele~)jpn SpeI:IIe fpI CONTAINMENT SHELL
Loed Ce~ ~uuahennel » ll
4 e S 1OO
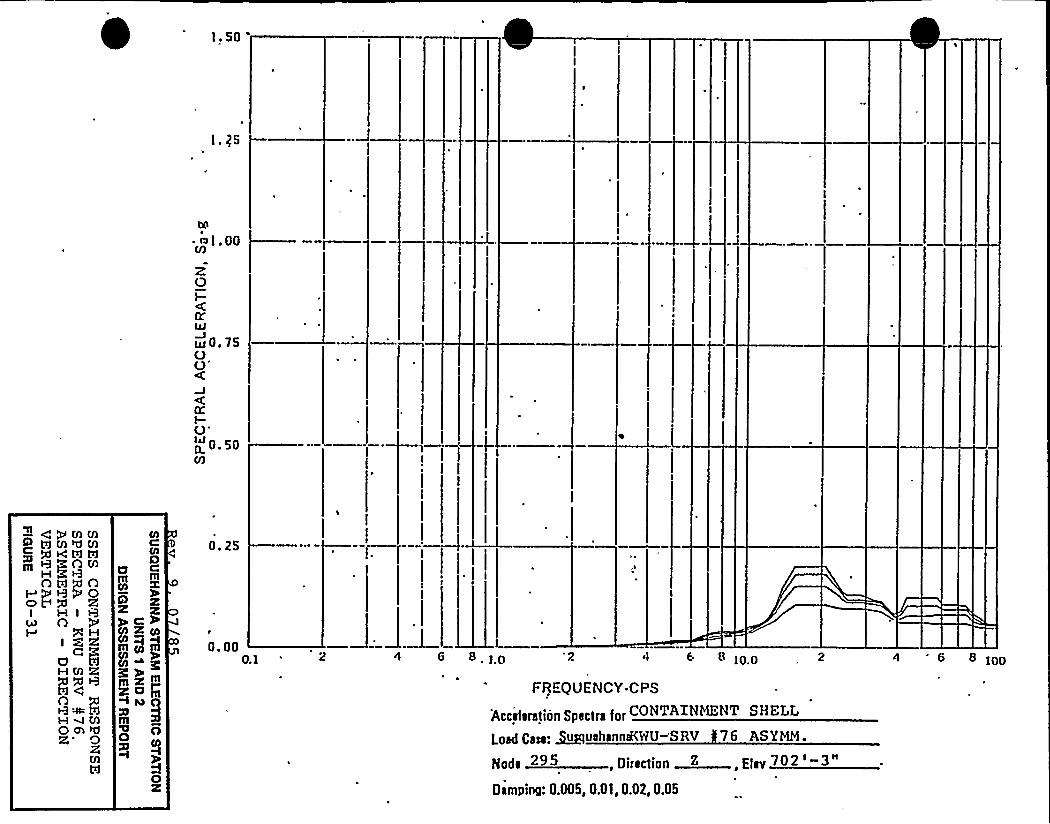
I. 50
Q(l
. al.00M
Z0I-IZILJ
Idj 0.15OO'
I-
o 0.50V)
gQMMg mmmmQ NCtdWm QgnMI P i-3 5 O
ow nC)~gI H In
à HI JRU ÃHM8
nHAMQ a%R 0
tOC
COOIVlm
ye%Ij)<~m
O O
5O
0. 25
0. 00O.l 4 6 8.)o e 8)oo
FREQUENCY-CPS
Aggjapan)mijn Spa~)~ ioI'ONTAINMENT SHELL
Load Caaa: ~uuahannd<NU-'SRV 76 ASYMM.
Nods 295, Direction ~, Etav 702
'amping:0.005, 0.0 t, 0.02, 0.05
4 6 8 100

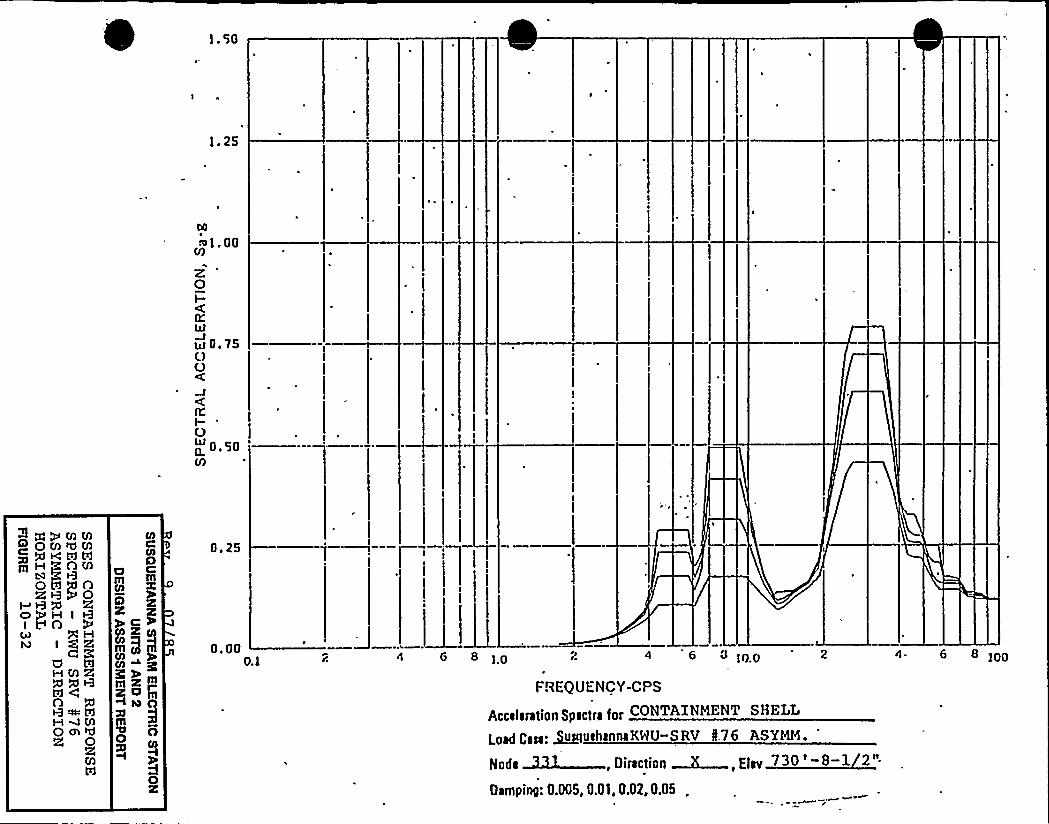
1. 25
00
~1. 00
0I-ptdw 0.75UU
nI-Vo 0.50M
~ QQMMg QCAWM~ XKWXa I-I IA M
RRgok H XOgH I 13
4l 5HC ga ca
M CA R
OH < UlQcn<
Qml
MC
0g CIll
lOpaz zye%ag)
5OX
0. 25
0. 000.1 4 G 8 io 4 G "'n.o
FREQUENCY-CPS
Accalara)tpn Spac)pa fpi CONTAINMENT SHELL
LpadCaaa ~uuehannaKWU-SRV 1.76 ASYMM.
Ih ~. ' ~,EIDamping: 0.005, 0.0l,0.02,0.05 „
0 ioo
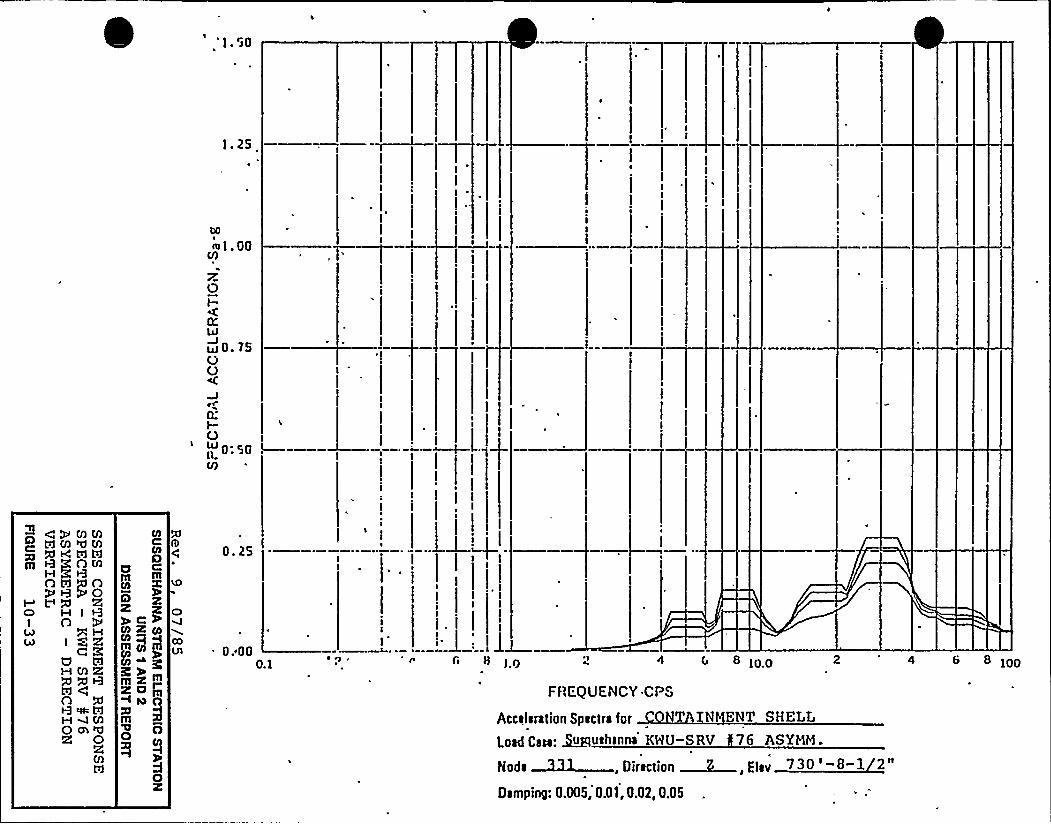
'. SO
l. 2S
IIII1. 00
M
z0I-IX4J
u) 0- YS00cC
~r
I-O
0:S0 I—ILU)
CP MMg tdMII)MI +gnM
RO H In4) gH
C 3'WHMR
n
Ammed
Qm<0
td
0mm
OlC)
yetCO% CO
Ill Ol3l~~m
5O
III0. 25
C)
. 0.000.1
I
I
I
JI
0 8 )0 8 lo.o
FREQUENCY CPS
AccalerationSpactra for N ENT SHELL
Load Casa: ~«ahanna KNU-SRV 76 ASYMM.
M ~.Di i ~, „~1Oarnping: 0.005, 0.01, 0.02, 0.05
4 6 8 1PP
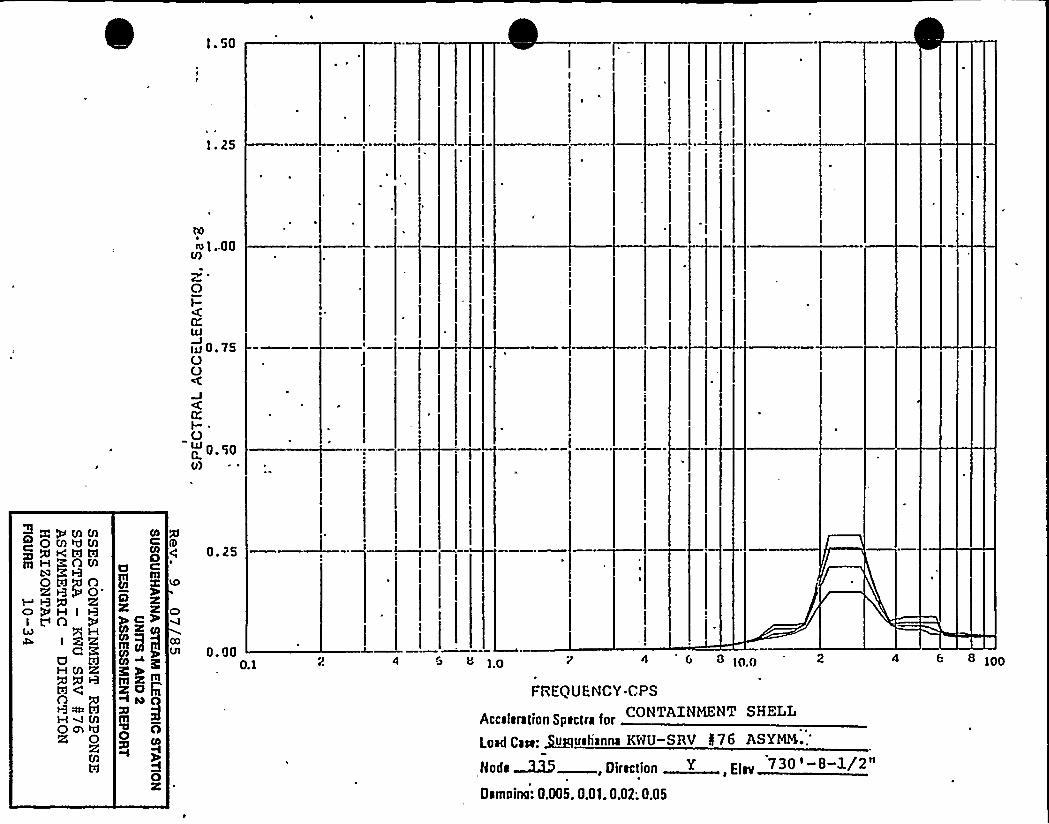
rja
dill..00U)
O
pLaj
Iu 0.75OO
KI- ~
p 0 50U)
T
gXQMUlgOMjCIM~QNtdWPg H)OM
I j-3 Q ROPH I 13I D 0
4J 5HI CR
C gUHM2>
HAMOe dCI
O
COC
0c)rnCO
9 gR K~ C= P
Ill g J
OX
90. 25
0. 90O.l
J4 v 8 tp 8 Ipp
FREQUENCY-CPSCONTAINMENT SHELL
Acceleration Spectra for
Load Caaa. ~uuahanna KWU-SRV I76ASXMS..'jjjdI~B,Dijggjjpnjj Ejdjj 730 8-1/2"
Darnoino: 0.005. 0.01.0.02; 0.05
4 6 8 tpp
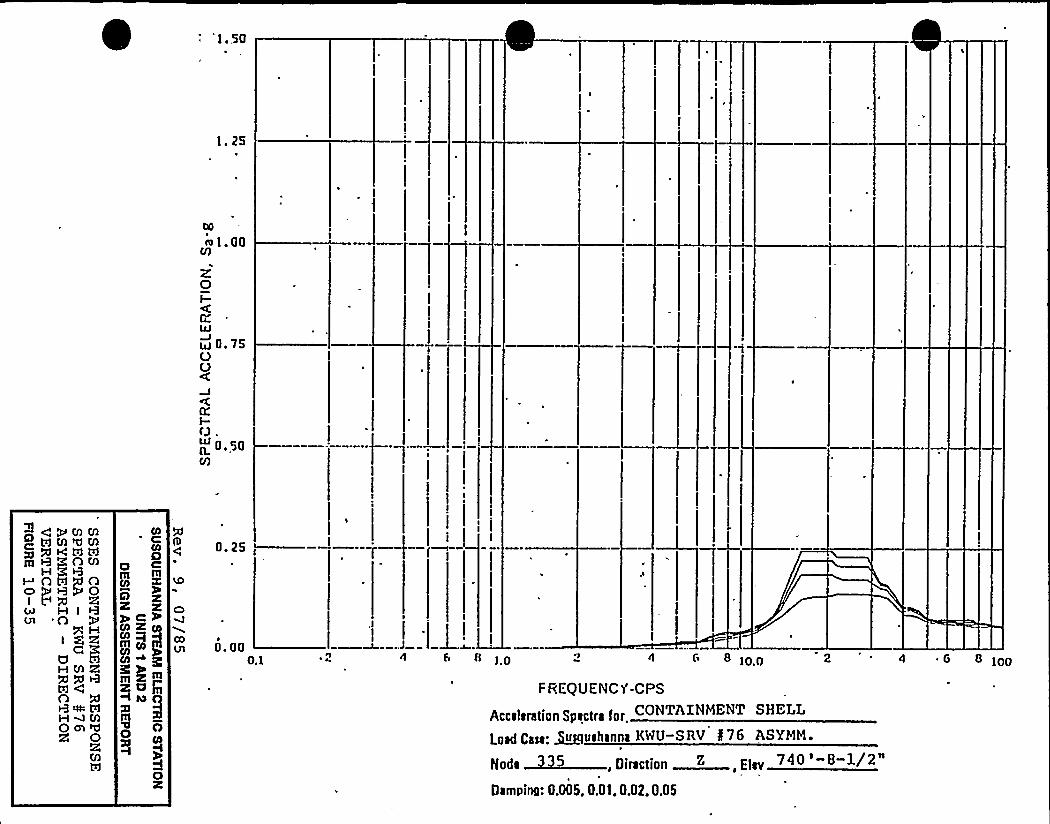
IO
2|2 l. 00II1
Z0I-I1
w 0.'lSOO
KI-Q.
0. 50U)
—QQMMQNM<Mm HynMr
neman
oft Q4) H IEB 'O
H MR
td 4nHAMOn<0a
OlC
Dp C
>caI OI I/pl
5O
C)
COVl
0. 25
0. 000.1 f. 8 Ip 8 1O.O
F REQUENC 1'-CPS
aIa<jgII Spaglpa ~ggCONTAINMENT SHELL
oad Caaa ~uuehanIIa KWU-SRV I76 ASXMM.
II ~5. ' .e 4
OampiIIQ: 0.005, 0.01.0.02.0.0S
2 4 ~ G 8 1PP
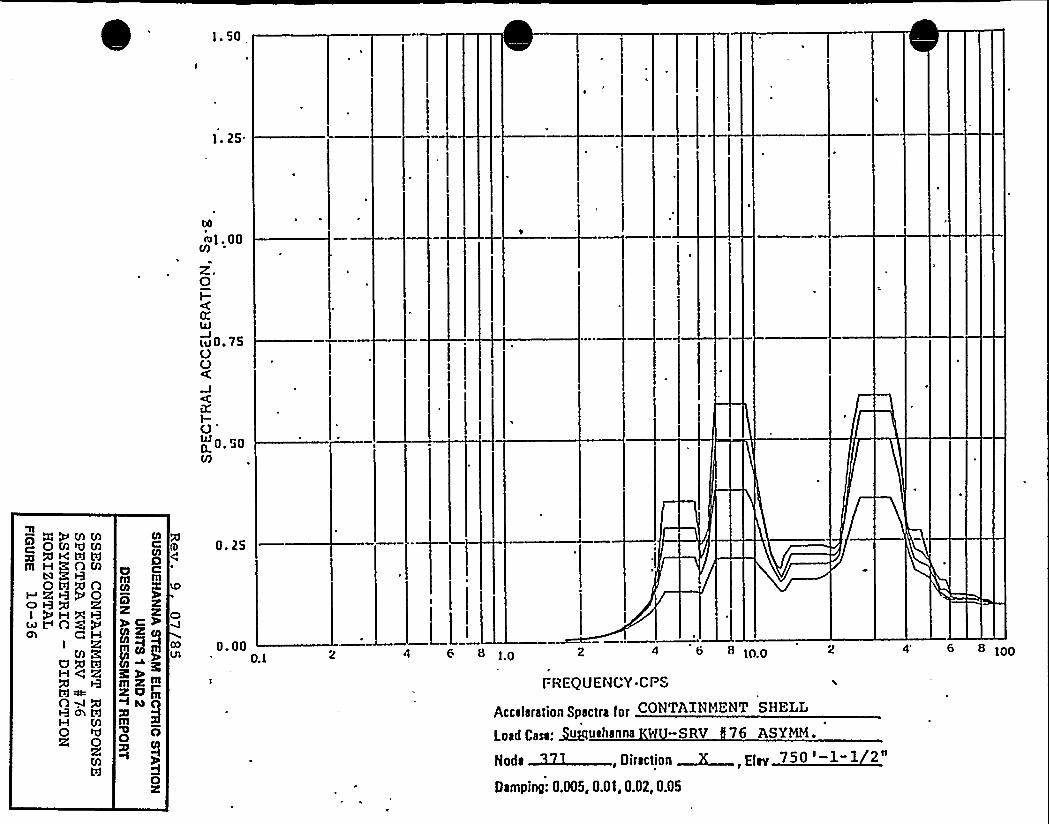
1. 50
M~l. 00N
z.0I-KLxJ
lu 0. 75OO
K1-O'
0.50VJ
XWMMI QMMMm QKtdWm H n M
wRRgQow n2e
I ~HX9~L nayCh QM
I RM
3,'QW
egg
0R 0
R
0a cm mCO
ZyetslIll PQ
I
0
0. 25
0. 000.1
LI.4 8 81O 2 4 8 8 1OO
I. REQUENCY-CP
At:gala~aljpn Spay)1a fpp CONTAINMENT SHELL
Lpad f;aaa ~uuehanna W -SRV 76 ASYMM.N,,~;,;„,~ Et 7 '-l-lDamping: 0,005, 0.01, 0.02, 0.05
4' 8 100
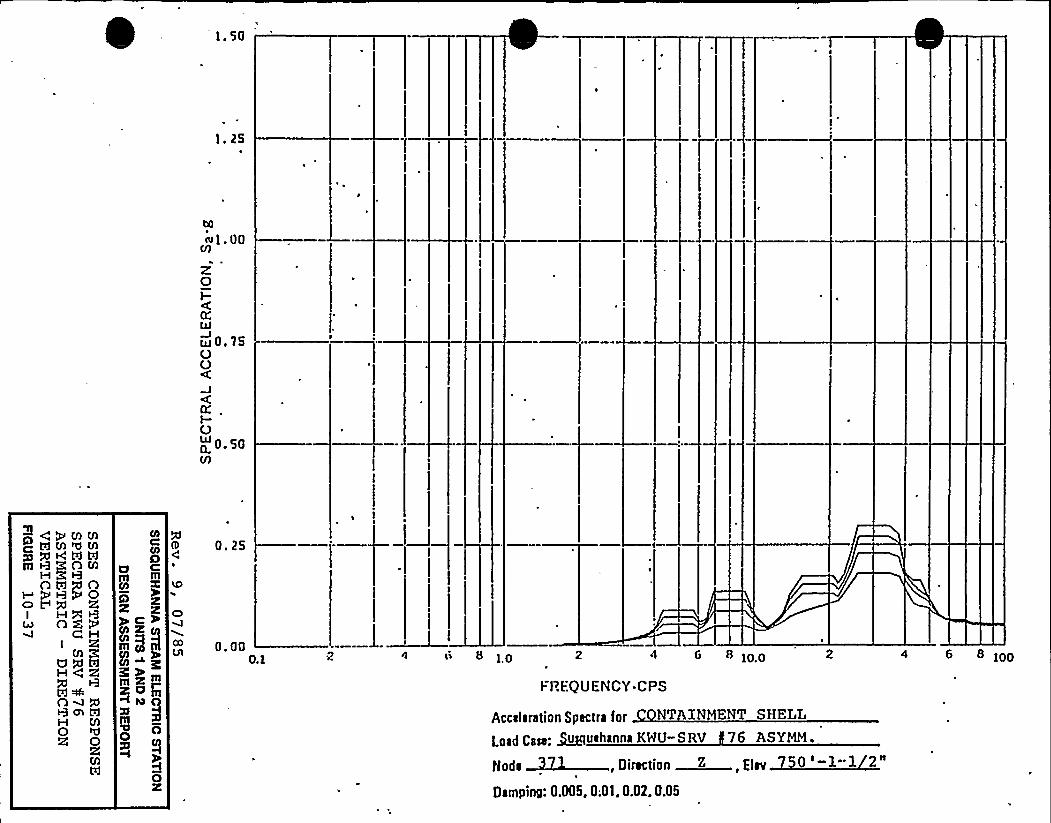
1. 50
b0
41. 00V)
z0I-K
w0.75OO
K,I-OIL0. 50V)
+ 4 P fn VIg 1TIMMM~+CAR
I HXROg@Q H
I R
OwQH M0 0
R
COlOm
9 g
my Ill
CO
Oz
C)
COUl
0. 25
0. 000.1 6 8 1P
FBF.QUENCY-CPS
10.0
Oalnping: 0.005, 0.01. 0.02. 0.05
Accalara1ipn Spacfra fpr NT INMENT SHELL
Lpad gaga; ~uuahanna KWU-SRV 76 ASYNM~
~ ~.' ' ~
4 6 8 1OO
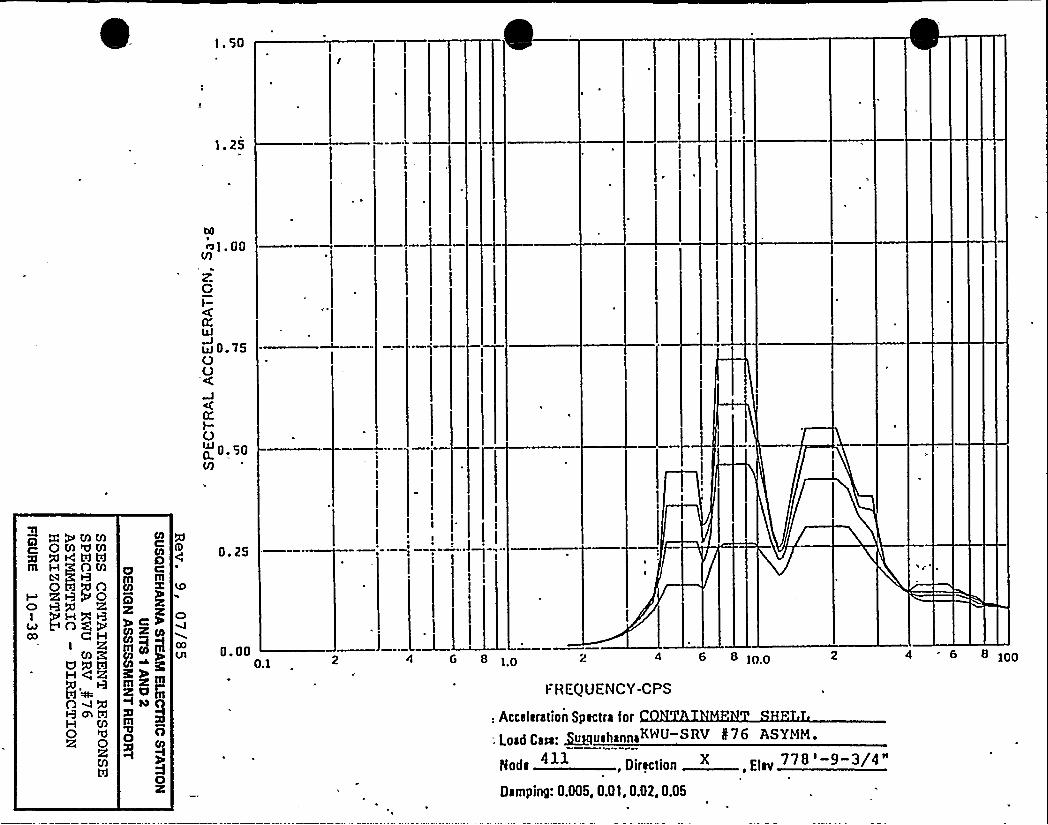
co
nl. 00V)
zGk-
0:
m 0.'lSOO
KI-
0050V)
P) AQMMg OMVMX<tdtdIII H A M
I RRgOc) g g 2sI PHRSVAR>
CO CHI Pi
M QUQW
n~w0
O
0Om mCO
I/I~M
$O O
OX
CO
CoLA
0.25
0. 000.1 1.0 4 6 8 tn.p
FREQUENCY-CPS
: Acceleration Spectra for
'Load Ceca'uuehannaKWU-SRV I76 ASXMM.
Nodi ",Dlrectlan Ehv
Damping: 0.005, 0.01, 0.02, 0.05
4 6 8 1PP
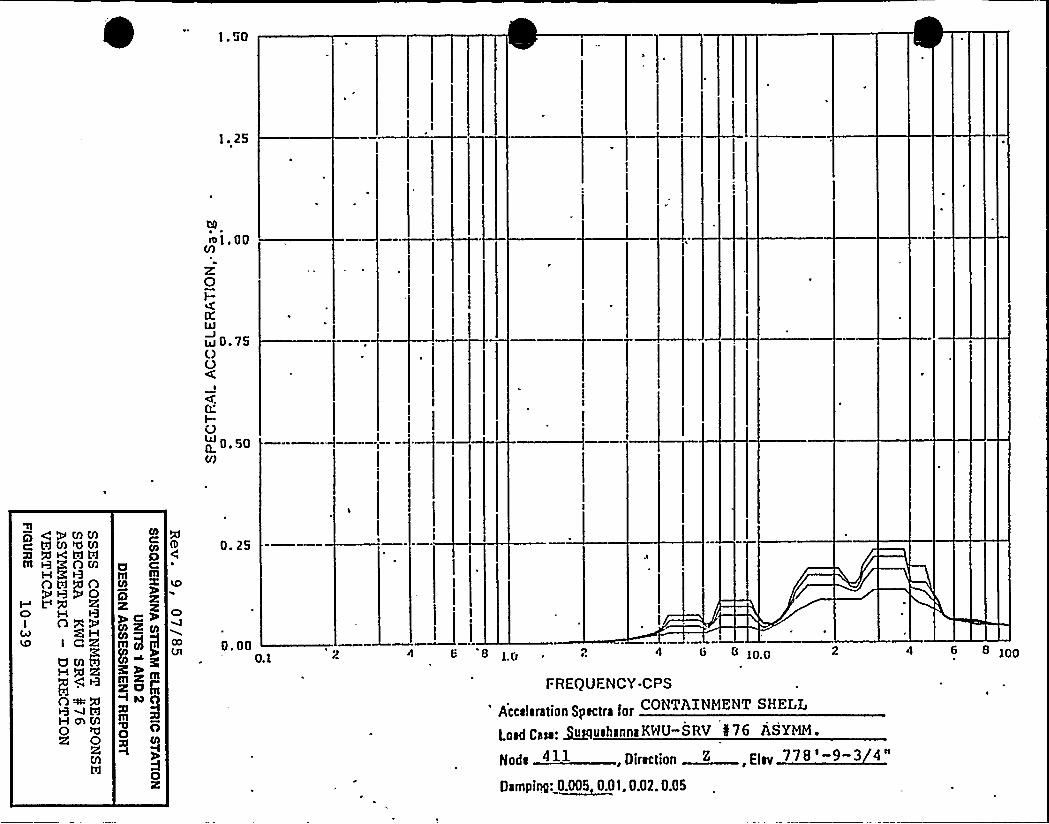
Hl~l. 00
V)
0I-pLJj
w 0.7S(.)O
a
0:
O0 0.50V)
g +gtoU)g (0jM AMS xcxwAM
O HnetI C RU(pw
Pc%OmQH (h(p0 0
Og7 C
mCO
ARye%
5O
0. 25
C)
0.000.1 6 8 10 4 (2 8 100
FREQUFNCY-CPS
A(gg~ipgltpn Sptgll) fp1CONTAINMENT SHELL
Lpid Cg~'uuthtnnaKWU-SRV 576 ASYMM~
rrorra 422,0iracrioo 0,5iaa220'aropire:
0.005. 0.01. 0.02. 0.05
4 6 8 lpp
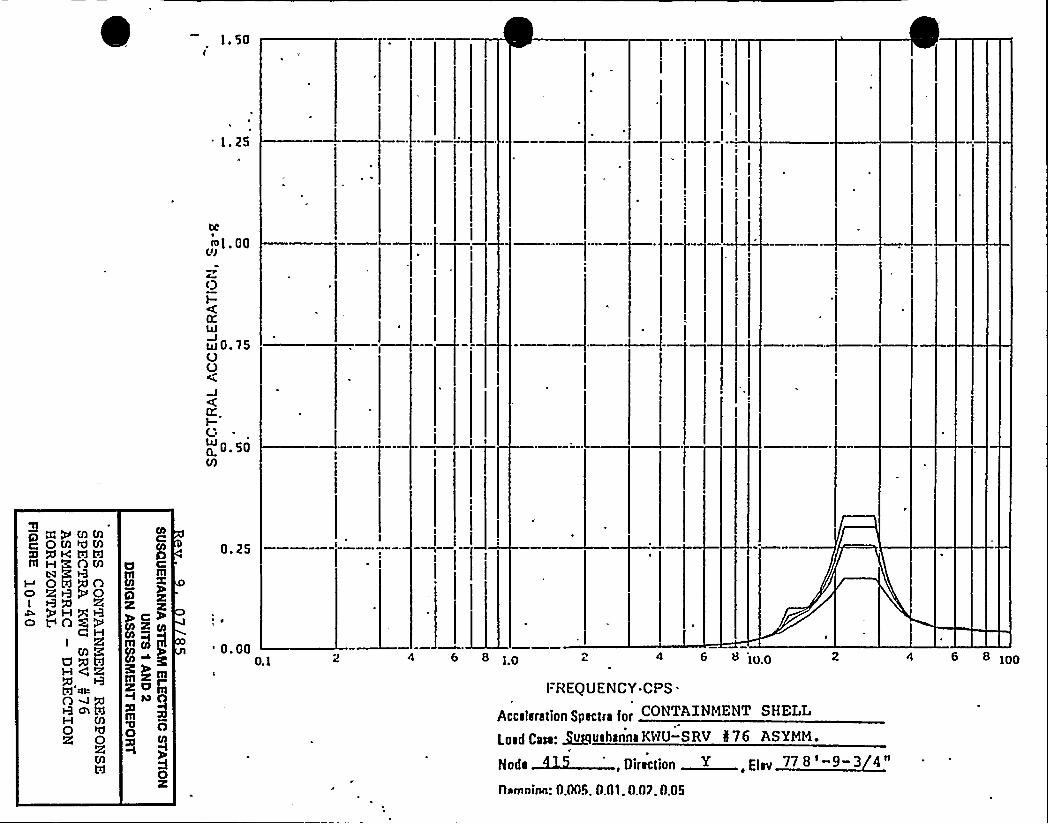
1. 50
b0
~l. 00UJ
OI-pLIJ
w0.75OO
o.I-Vo 0.50M
P) NQMMc„-0M<M
I RQ RQHNRo VO g'PC H
RM gUQRH48
pj MOwQH M0 0
Om
g9 gX Kye%aj)ggmR~R+ I4 0m gO O
p)'I
O
0. 25
'.00O.l 4 6 8 IP 4 6 8 'IMP
FREQUENCY-CPS.
Aggajgpa)jpII Spay)ga fpI CONTAINMENT SHELL
Lpad Caaa. ~uuahaIIIIa KWU-SRV I76 ASXMM.~.ra l'E>namninn: 0.005. 0.01. 0.07. 0.05
lOO
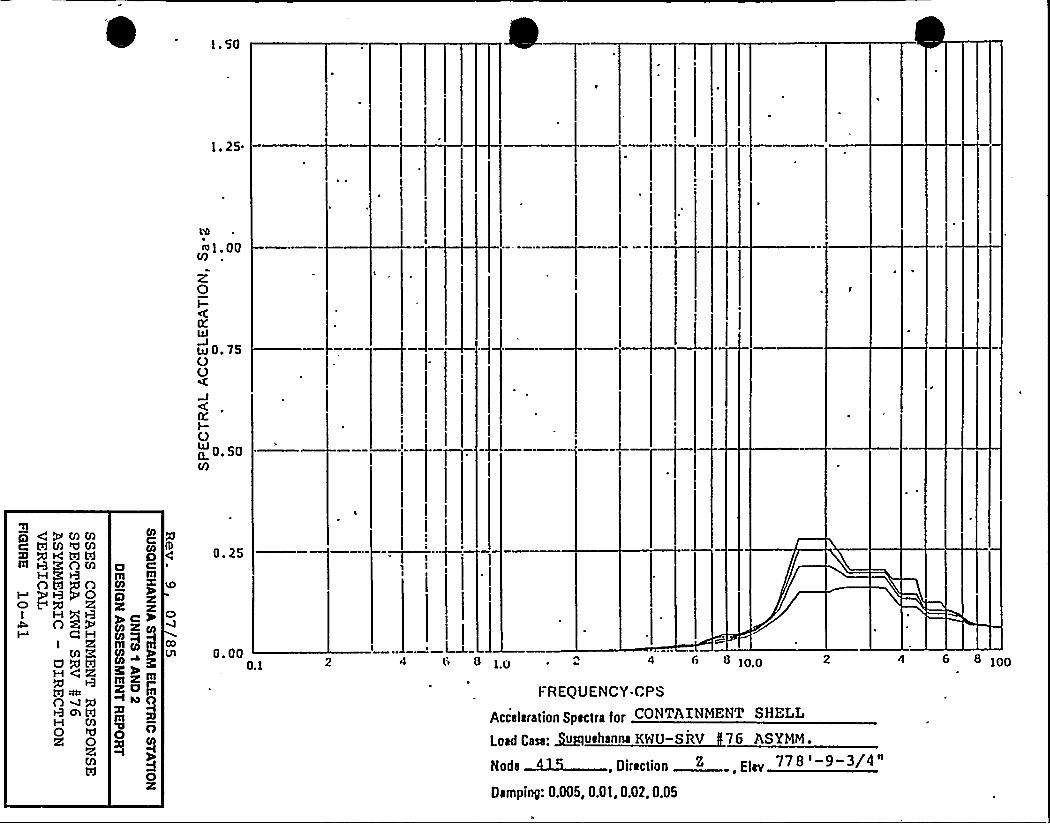
1 ~ 50
L'a
~ l. 00U)
Z0I-o'l
w0.75OO
o"I-C.)
p 0.50M
4PMMg tdMMMS QKRtd
I HXROCPC H
I RM 3:UQX
O~QR mt'
M0 0R
M
0om
Xye%
ag)g+ ~ nI
5OX
0. 25
0. 000.1
~ L6 0 10 4 Ci 8 IPP
FREQUENCY-CPS
Acceleration Spectra for CONTAINMENT SHELL
L I:~~7lid~, i, i„.E( 77 --/4Damping: 0.005, 0.01, 0.02.0.05
6 8 1PP
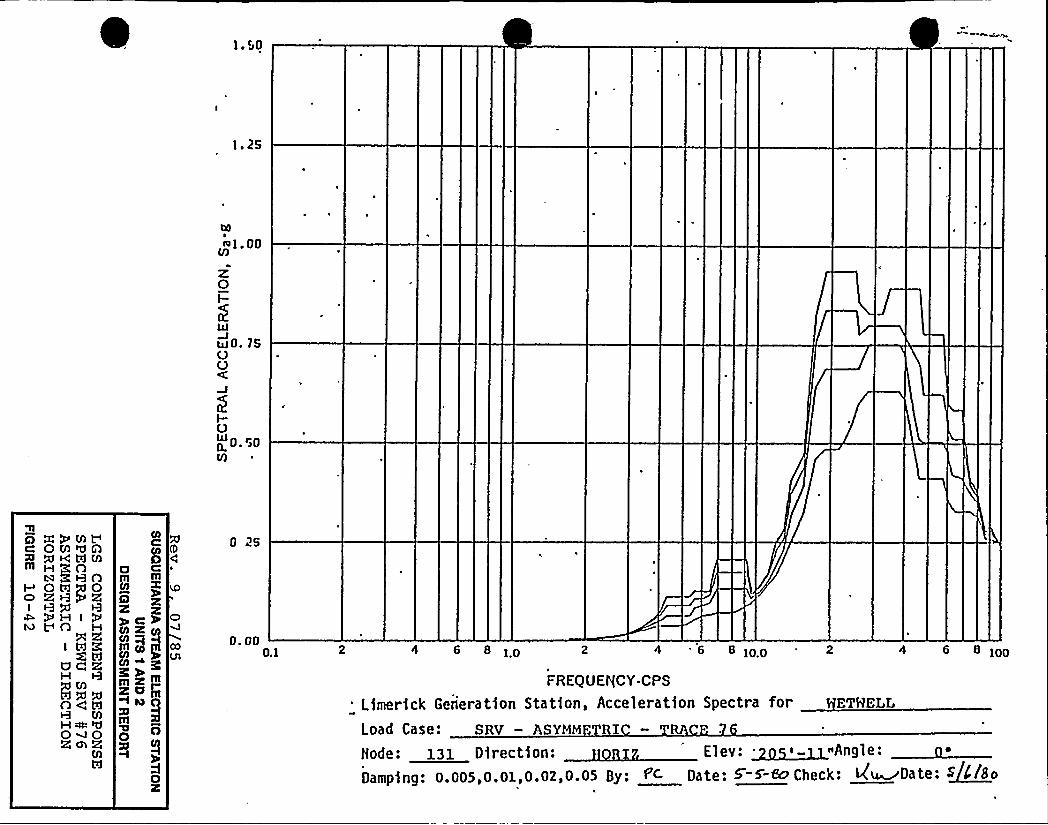
1 ~ 25
to1. 00
z0I-
Iaj0. 75OO
~L0.,0C0
5 XPMVO M eCI QQNWM
I Ow)OI
aDa H IbJ
X RI W3lgwa C" 2,'
newMH< eCI
0 ~0
COCCOOa c
COm
~ C= P
mg)m~ IllZa Ill
5O
0 25
0. 000.1 4 6 8 10 2 4 .6 8 1o.o 4 6 8 1PP
FREQUENCY-CPS
'fmerfck Gerieratfon Station, Acceleration Spectra for ETHELL
Load Case: SRV — ASYMME RIN d: Dl o:~ i1 '. aaa~"ADamp]og: o.oo5.o.ol,o.o2,0.05 By: <c Date: <-a'-|ao Check: M~oate: s~CISo
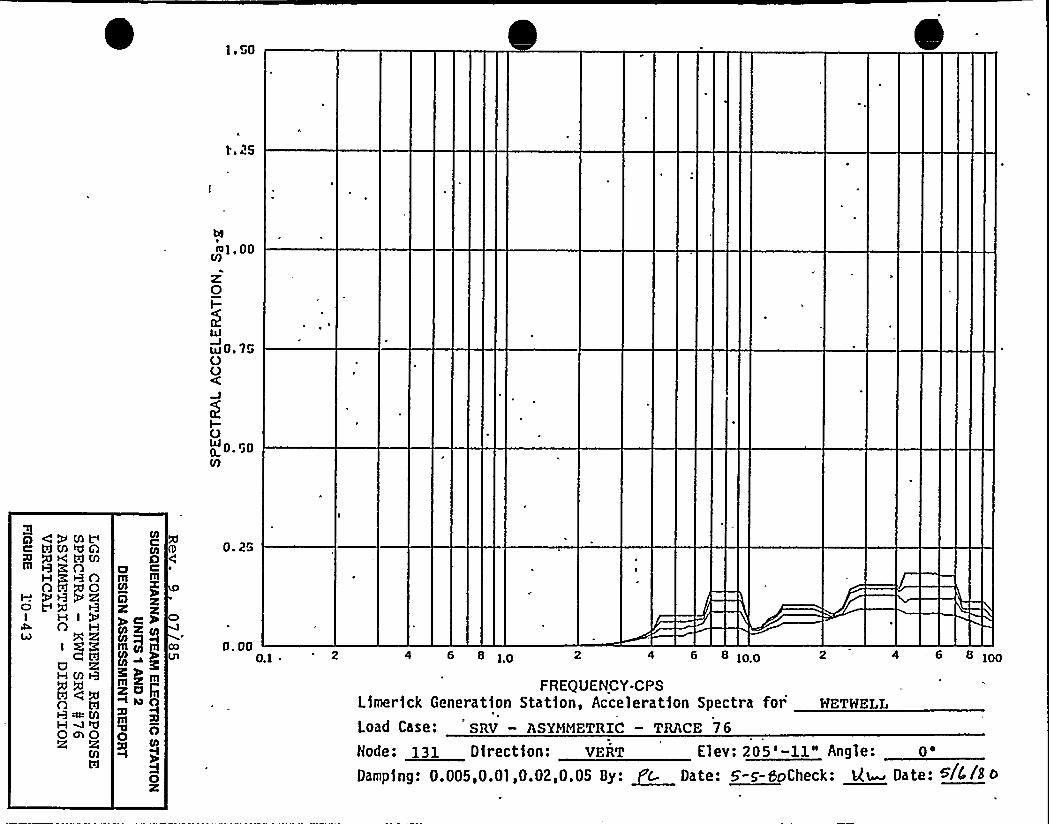
1.50
1'. 25
Isl
sts1,00Io
0I-
w 0. '750O
OW a00 ~0U)
Q CWISIV2e meeCIA
alI ha; III M
I
I H IA
lay X RI 83'
RUHMQtdgNnQ~ MH WslIOCS 0
R
OFlIll
CO
9 g
m aI iiil
O
O. 2S
0. 000.1 ~ 4 6 8 )p 2 4 6 8 IPP 4 6 8 goo
FREQUENCY-CPSLamer)ck Generation Stat)on, Acceleration Spectra for wETWEI,I,
Load Case: SRV — ASYMMETRIC — TRACE 76
Node: 131 Direction: VERT El ev: 205 '-ll" Angle:0'amping:0.005,0.01,0.02,0.05 By: ~C. Date: 5'-5-00Check: 12~ Date: /5/S b
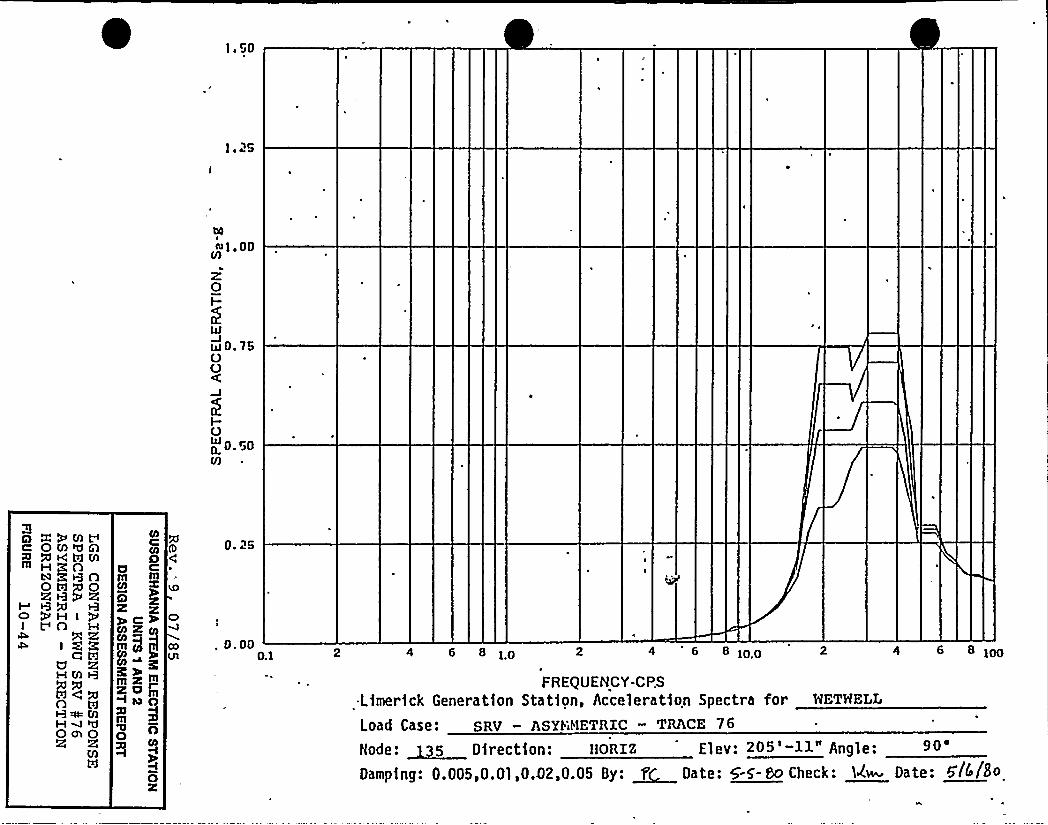
l 26
bO
ttt l. 00
Z0l-
w0.75OO
~<O. r~o
vj
XWMQOM OQ~ A54tdMm Hgo
5
O agd H 5
I VO) Q gaHM9
nt3~ MHMgQePR R
Oo cm m05C)z zych
co ~ g~~m
g CO
yO
A84
0. 000.1 4 6 8 10 2 4 '6 8100 4 6 8 100
FREQUENCY-CP.SLamer)ck Generat)on Stat)on, Accelerat)on Spectra for WETNELL
Load Case: SRV — ASYMMETRIC - TRACE 76
Bode: ~55 Dtrectton: BORIZ Eley: 205'-ll" Angle:90'amping:0.005,0.01,0.02,0.05 By: ~f Date: 5-5-5o Check: 'le Date: 5/5/So
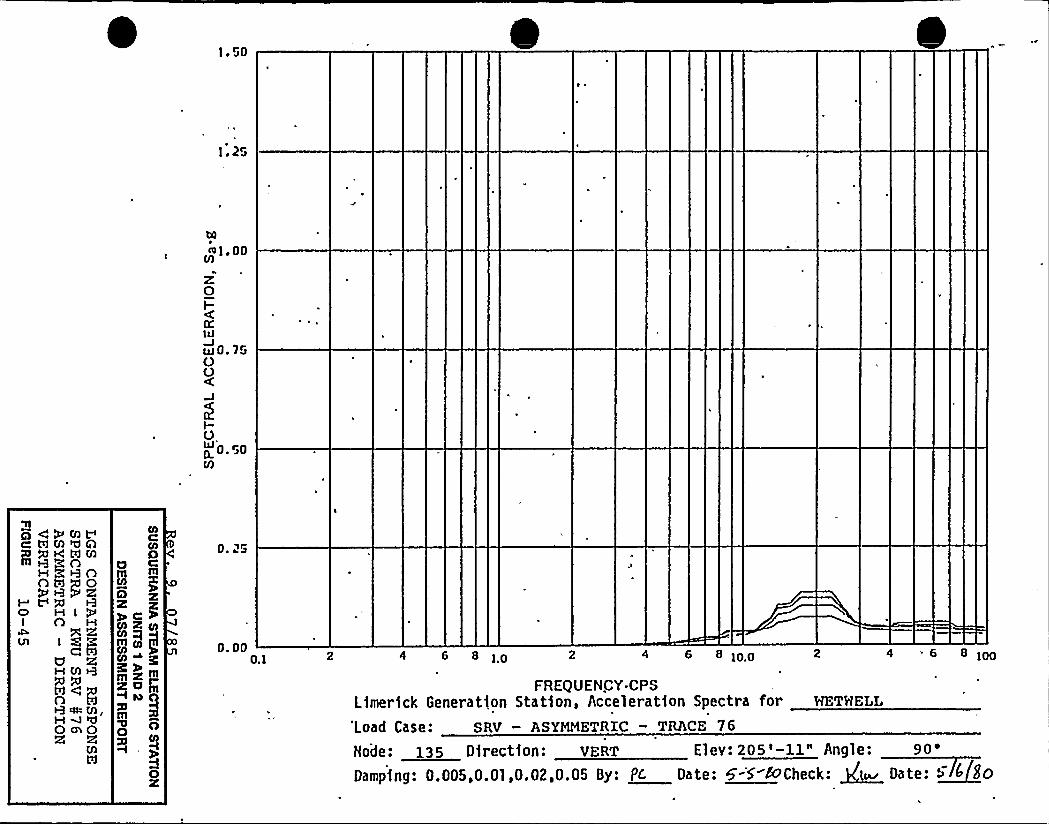
1.25
b0
~1.00
z0I-KItIw0.700O
L 0.50Il)
4 P PI V2 RMWAg Qh4XM
H I ta caO ta y Q
IO H II O
I ~gU RH tQ 1-3
OQ~CQrH M r5IQcnQ
Rtd
0a cCO
3l+~mIll M
g~m)
O
0 i5
0. 00O.l 4 6 8 )p 2 4 6 8 1pp 4 "6 8 1pp
FREQUENCY-CPSL)mer1ck Generation Station, Acceleration Spectra for HETWELL
Load Case: SRV — ASYMMETRIC — TRACE 76
Bode: 135 Direction: VERT Elev: 205'-ll" Angle:90'amping:0.005,0.01,0.02,0.05 By: pc Date: 5'-'5-poCheck: ~n Date: 5~So
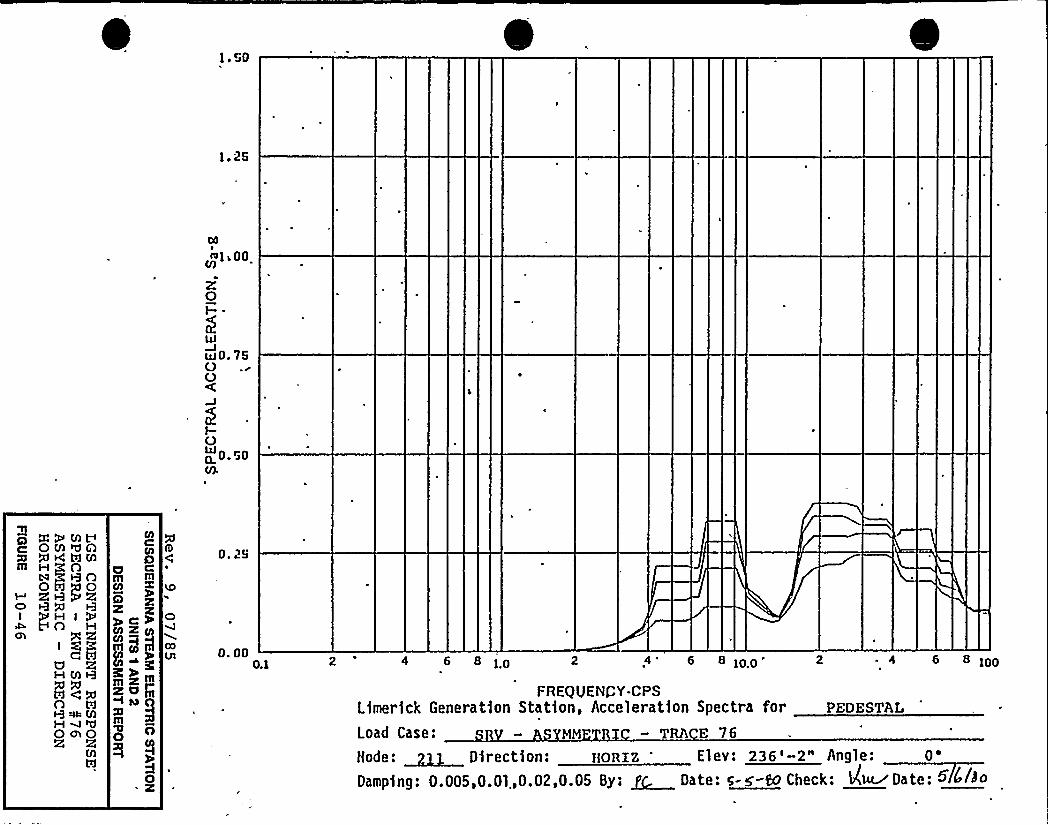
b0
atg1 a 00
z0I--
wo. 7ay0 .r0
OIBJ 0 r~o
XWMtg OMtCIQFl Q h4 tyIMm
BIOI 2eRJRC)I P H IVO
ChI Z3l
C tdU RHMR%4'
ttIt3 ~ MHMW0 ceoR
ttI
IIICOl0o
mOg
C)
ye%VI
g I
O
0. 2S
0. 000.1 2 4 6 8 10 2 4' 8 100 8 1OO
FREQLJ ENCY-CPSL)mer)ck Generat]on Stat)on, Accelerat)on Spectra for PEDESTAL
Load Case: MM — TRA E 76
Node: ~~ D|rection: 110RIz 'lev: 236'-2" Angle:0'ampteg:0.005 ~ 0.01,0.02,0.05 By: ~ Date: e-a'-20 Check: A~Date: <~/ae

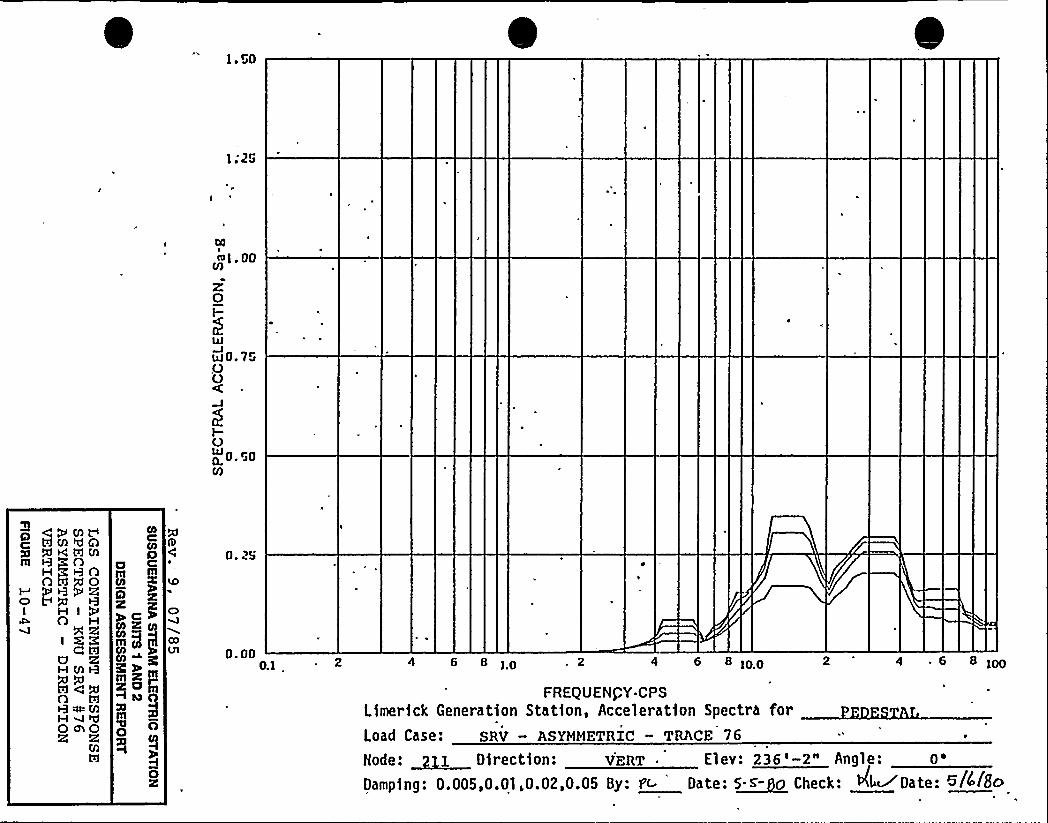
1 ~ 50
) gr
CO
41. 00Ul
2:0I-
ww 0. 7r0V0
I-Of0.,0U)
p) CPM'Q h4 X M
Hg~t3OIoI H I0 H
A RI Z3'
ITIU RH M t3
0QMMH WtEI0 CylOml R
0C
B
5OR
CD
00Vl
0. Qta
0.000.1 4 6 8 10 4 6 8 1o.o 4 ~ 6 8 100
FREQUENPY-CPSLimerick Generation Stat)on, Accelerat)on Spectra forLoad Case: SRV — ASYMMETRIC - TRACE 76
Bode: ~1 Direction: vERT . Elev: 236'-2" Angle:o'amping:0.00s,0.01,0.02,0.05 By: rc Date: s~c- o check: 4~gate: l /8o
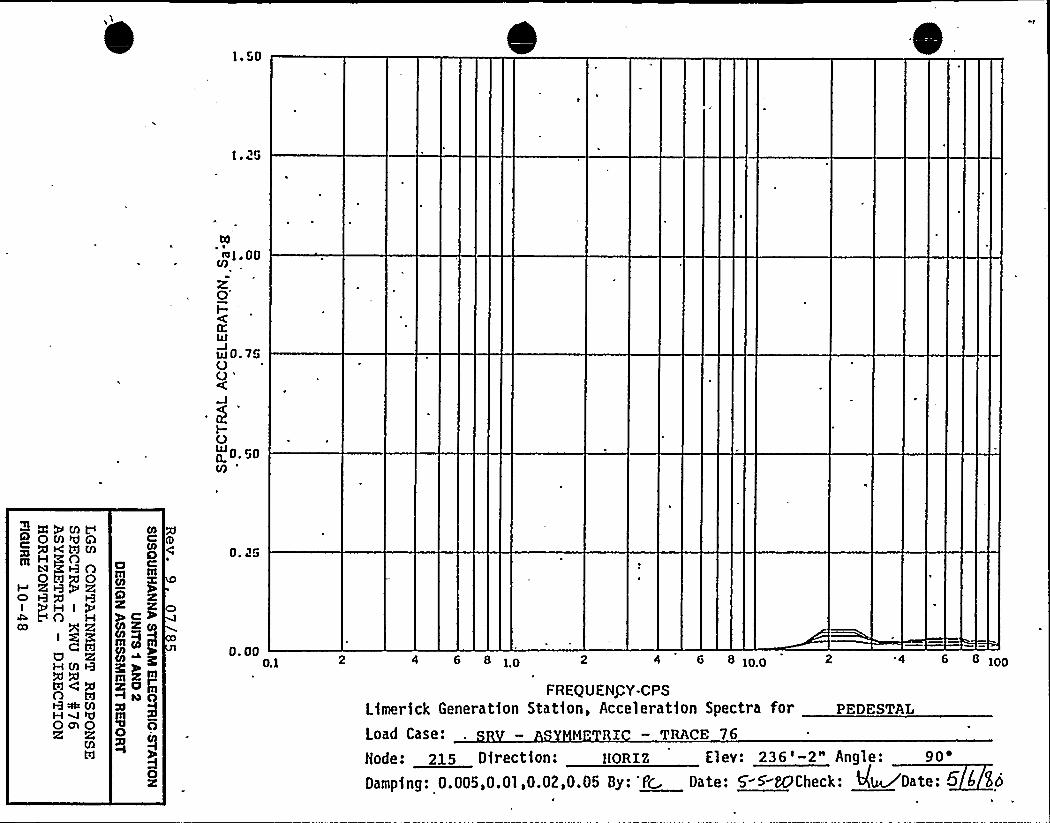
1,25
bO
tag 1 a 00
K.OI-
w0.750O'
5'r
0 O.ipf/7
X 'agee M QOMea+ QKWM
2g+g+C)I aiba H I
d VOC30 X R
U RHM t3
Q~MHM eCI
OcnQR
ta1
0om m
A
Ij)mmmmRag
O
0. 000.1 4 6 8 lp 4 6 8 lpp '4 6 8 100
FREQUENCY-CPSLfmel ick Generation Station, Acceleration Spectra for pEDESTAL
Load Case: . — M RI — TRACE 76
Node: 215 Direct>on: RoRzz Elev: 236'-2" Angle:90'amping:0.005,0.01,0.02,0.05 By: 'P Date: 5-6-ttPCheck: A~Date: 5 4 'Id
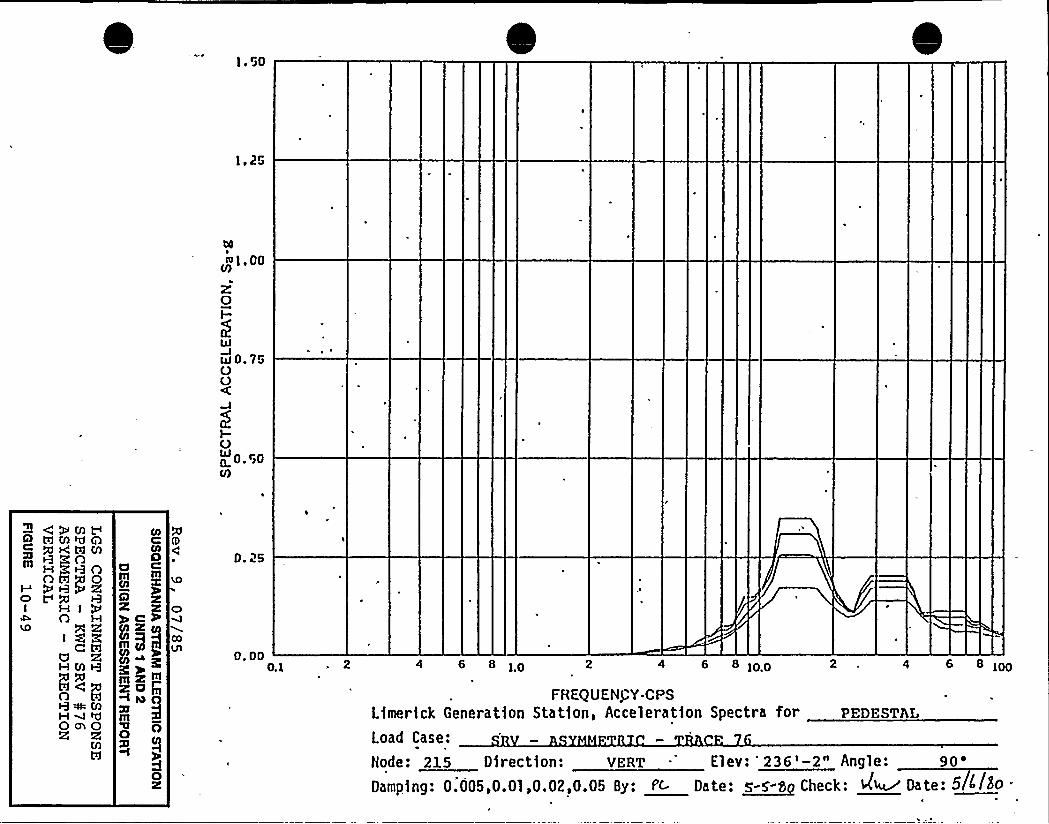
gr
CO
I0't, QQ
2.'
I-
w0.75OO
OIJJooroU)
- CPmL> tamwaQ wwwm
I ~P3$ QtI M In H
i 43,'tda -a
HM I-3
W4QnQ~MHMQOeQR
Om
rn g J
O O
O
Q
CX3
Ul
0. 25
0. 000.1 4 6 8 10 2 4 6 8 10.0 4 6 8 100
FHEQUENg Y-CPSLiner)ck Generat)on Stat]on, Accelerat)on Spectra for PEDEsTAL
Load Case:
Node: 215 Dlrectlon: VERT Elev: '236'-2" Angle:90'amping:0.005,0.01,0.02,0.05 gy: nc. Date: ~s-s-8 check: l~ Date: 5 /So
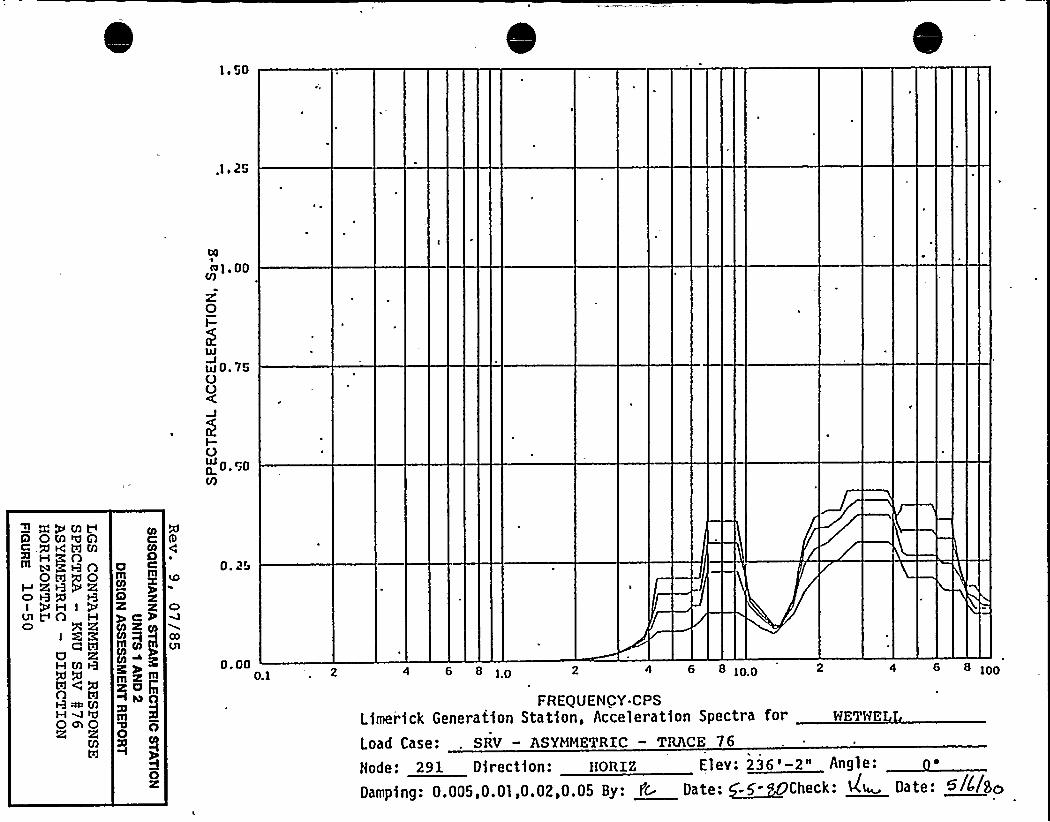
b0
ttl],00V)
0I-
ul 0. '750O
OIJj0 o.~oV)
l C~MVQ OM%Q<.QKtdM~ ~Reo
R R g 2gOW 0
OI ageH IUter
O g giCRC 1'
RHMt3
n Pa%~MHM4QWQ
td
0Vill
ye%gmm
O
O
COlJl
0 2yJ
0. 000.1 4 6 8 1p 6 81pp 4 6 8 1pp
FREQUENCY-CPSLimerick Generat)on Station, Acceleration Spectra for wETwE
Load Case: . SRV — ASYMMETRIC — TRACE 76
II I; » I I : 11 : » ' ' 91
Dampteg: 0.005,0.0],0.02,0.05 By: I'C Date: ~5~<gCheck: lie Date: 5//IBo
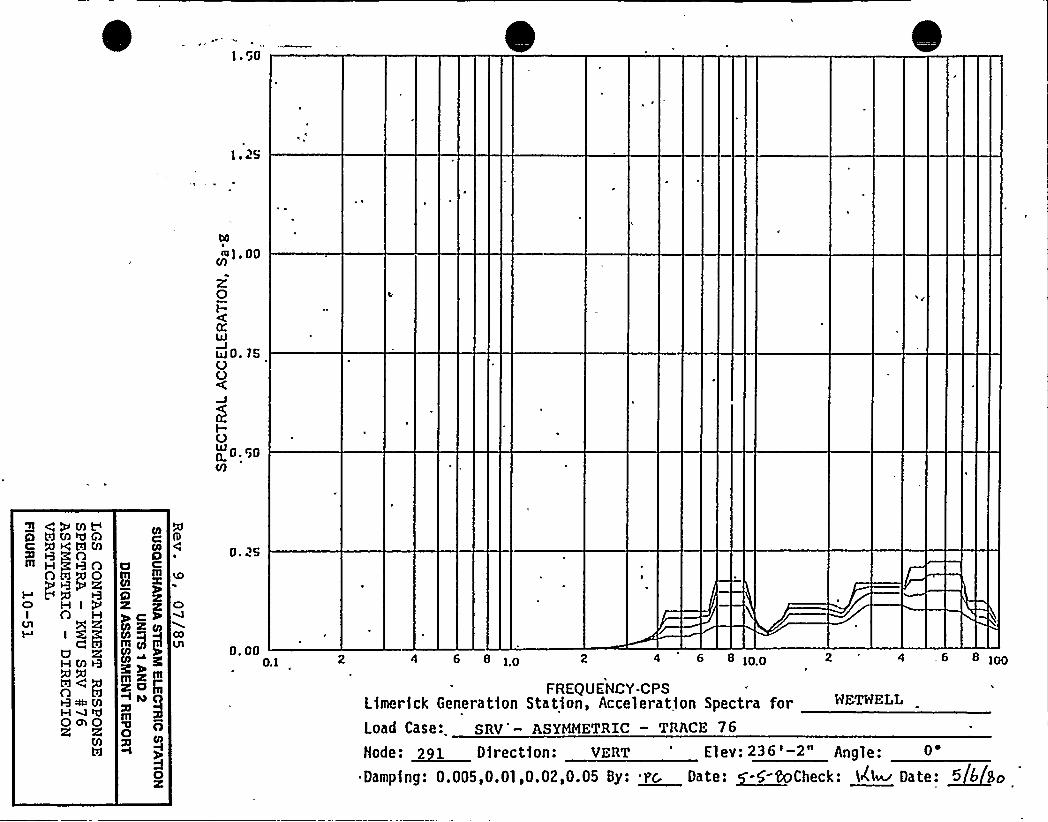
b0
021. 00CII
z0I-K
caj 0. 762
OO
0 0.120CO
2 CPCIILA tdtn<AC Q ta; W Nm H0 CTI ) 0
D H II A H
Ul Q 2g'~RUHMR
+~MH M eCI
0 C210R
I21
COC
CO
Og CIll
D
COVl
0. 25
0. 000.1 4 6 8 10 4 6 8 10p 4 6 8 100
FREQUENCY-CPSL)mer)ck Generat1on Stat)on, Accelerat)on Spectra forLoad Case: SRV - ASYMMETRIC — TRACE 76
Bode: ~21 Dtrectton: vERT 'levI 236'-2" Angle:0'amptng:0.005,0.01,0.02,0.05 By: rr Date: ~5-CoCheck: I/M Date: ~56 Bo

,

b0
to 1. 00
2'
I-
w0.75OO
0 Q. ioV)
R~MQ~ OMWQ8 Qh4tdMm ~Reo
OITI)OI QQ t3O age H I PVOUlhJ I gg
U RHM8
tdQ~MH M eCIQnQR R
COC
0Ill
yahIfl g J~~mm~g~ aa
QO O
50X
0 it„.
0. 000.1 4 6 8 10 2 4 6 8 100 4 .6 8 100
FREQUENCY-CPSLamer)ck Generat10n Stat)on, Accelerat)on Spectra forLoad Case: SR — ASYMMETRIC — TRACE 76
NETWELL
Node: ~DL D]rect)on: ttORIZ Elev: 236'-2" Angle:DamPtng: 0.005,0.01,0.02,0.05 By: 2c. Date: e~~ Check: ~ Date: 5JIISo
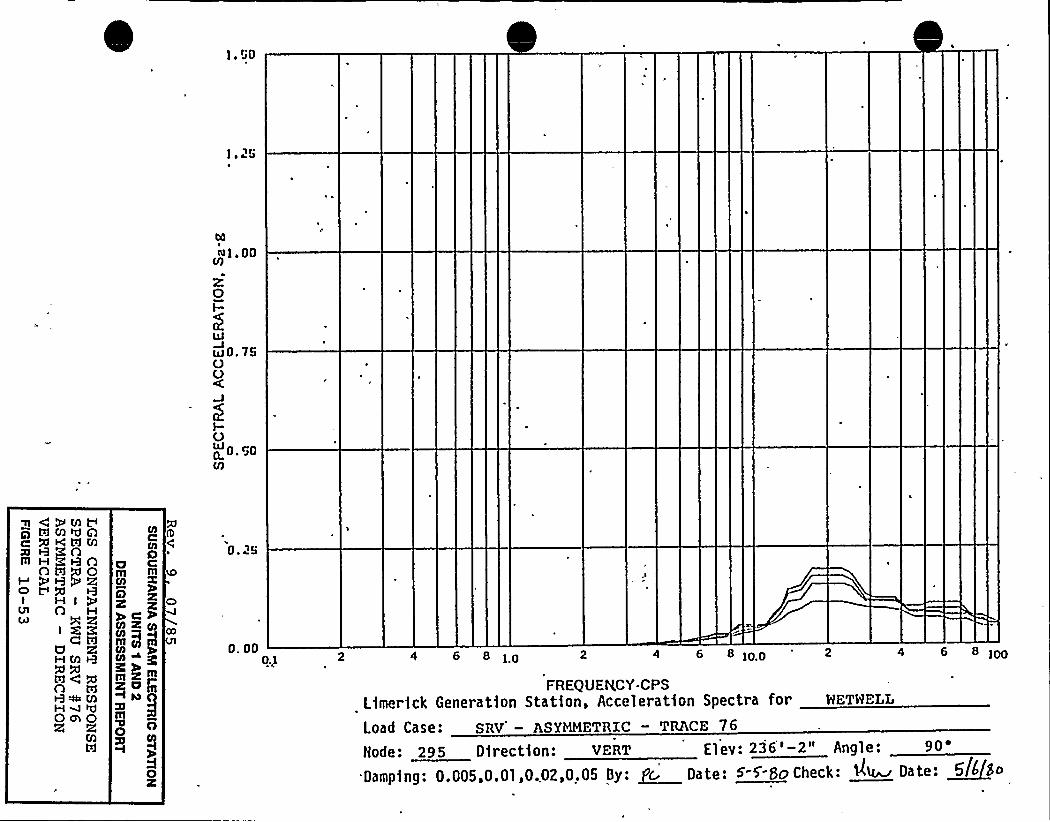
130
Bl l. 00
z0I-
IAI0. 75OO
0 r~0
CO
~ CPMtITI M tCI Q
C X<KM
V aD QggDI H
A HI Z3,'
tdUHM Q
O WR~ MHM aCIOngR
OIll
COm
Cml2 2y C- h
I pm
m 2 Ill
O
0 25
0. 000,1 4 6 8 io 2 4 6 8 IPO 8 loo
FREQUENCY-CPSL)mer)ck Generat1on Station, Accelerat)on Spectra for'ETNELLLoad Case: sRv — AsYMMETRIc — TRAcE 76
Bode: 295 Dtrectton: VERT Elev: 236'-2" Angle:90'amptng:0.005,0.01,0.02,0,05 By: gc Date: 5-5-Bo Check: 'Il~ Date: ~5/4 So

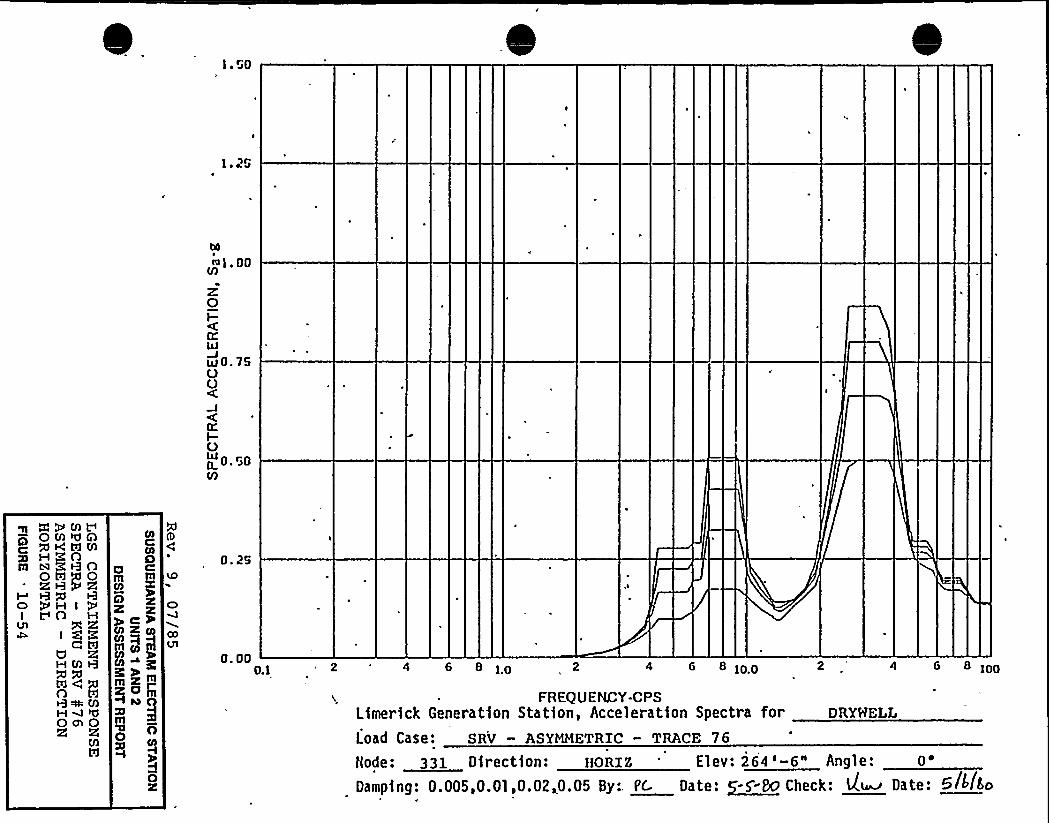
I a 50
] 15
bO
401. 00
0I-KWw0.75OO
KI-0WL 0.50V)
OM%QCPMLc ><AMm ~RP3O
2aR)2aO 12I 013 Q
C) Q H I aDa
I ~OUl
4 I2IaHM9
nQmMHM eEI
0 a 02l
W
Og Cle
CO
ye%sly"I-l~pm
Og co
O
0.000.1 4 6 8 10 4 6 81PO 4 6 8 100
FREQUENCY-CPSLamer)ck Generat)on Stat)on, Accelerat1on Spectra forLoad Case: SRV — ASYMMETRIC - TRACE 76
DRYHELL
Node: 331 Dlrectlon: DORIS Elevl 264 '-6" Angle:0'amptng:0.005,0.01,0.02,0.05 8y:. K. Date: ~SBo Che'-ck: tl~ Date: 5/ /Ko
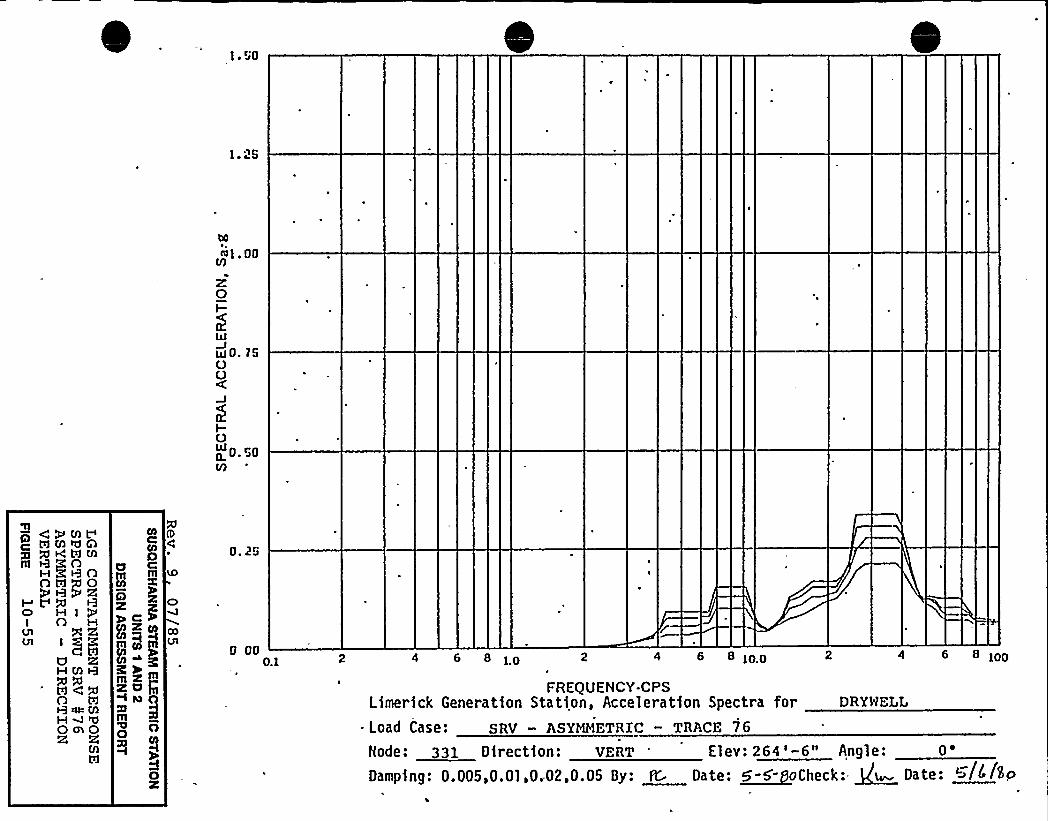
F 00
1.2S
031. 00
0I-
LtIO. 7SOO
OW 0 00
p) CVNC'MMQ
QKWMm RgO
O H II O H
Ul vyv 2sI agU RHM9XA
H W eCI
On 0
OlCOlDg r~m
QR K~r%Ill m3l+~mm~g
O O
0. 20
0 000.1 4 6 8 10 2 4 6 8 lo.o 4 6 8 loo
FREQUENCY-CPSLimerick Generation Stat)on, Accelerat)on Spectra for DRYHELL
~ Load Case; SRV — ASXMNETRlC — TRACE 76
Node: 331 Direction: VERT 'lev: 264'-6" Angle:0'amping:D.005,0.01,0.02,0.05 By: it. Date: ~5-5'- oCheck: ~~ Date: ~/4/gm
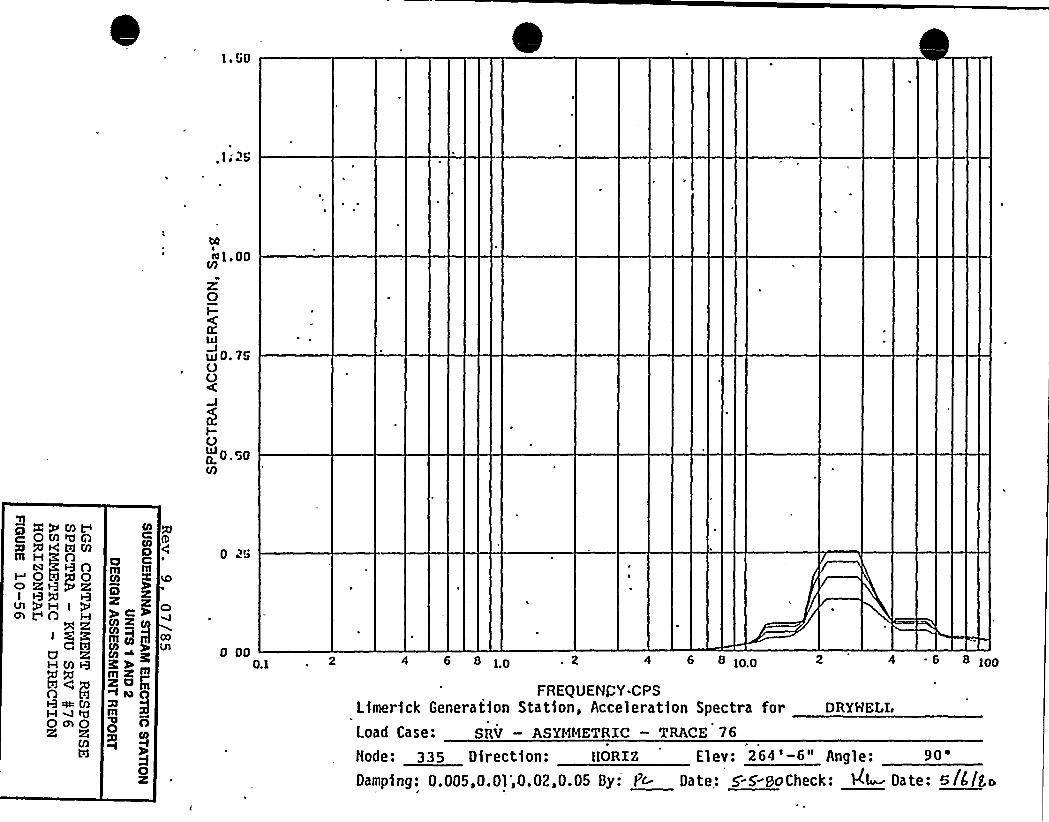
CO
051,00M
K0I-
hip 750O
I-0
0. JO
M
XWM~g OMtCIQS Xta'ITIM
OW)QI 1-3 Q F3
Vt aDa H In VAXRI C3:
C IeIa aHMQ
%~MH M aCIOnOR R
COC
OC
m mCO
z> C=%
III Pg
C%m~m
5OX
0 ia~
0 000.1 4 6 8 1p 2 4 6 8 1po 4 6 8 1pp
FREQUENCY-CPSL)merfck Generation Station, Acceleratton Spectra for DRYHELr,
Load Case: SRV — ASYMMETRIC — TRACE 76
Node: 33S Direct)on: ttoRXz Elev: 264 '-6" Angle:90'amptng:0.005,0.01;0.02,0.05 By: pc- Date,''-5-DoCheckI ill Date: 0/C/Ba
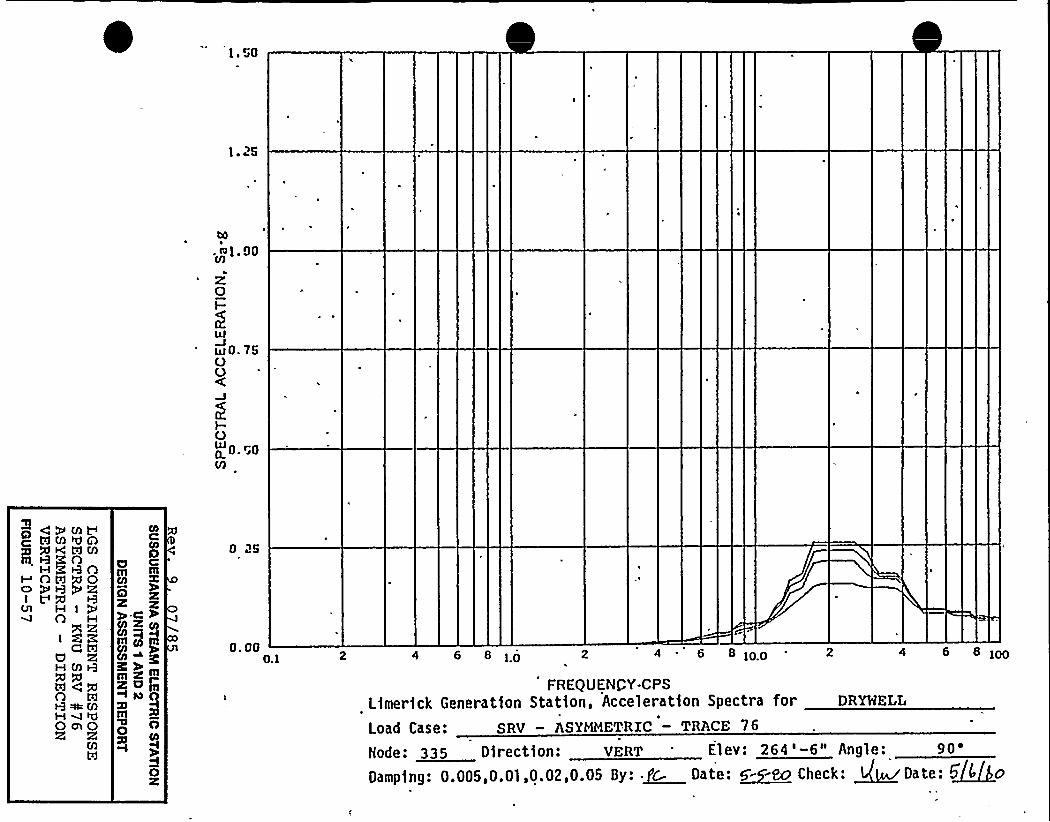
1 50
25
CO
. 601. 00
z0I-
wo. 75OO
o 0.50M
p) CPMtC+ >+tCI@
Qle" WMHERO
I OITI)OI DQ P9
Vl H IO
X RI ZR
C RU RH III 9
OQ ~ Ci)
0 Cll0R R
W
COCOgOa cm
CO
5X K
mg)Enm
0X
0 25
o. oo0.1 4 6 8 ]o 2 4 ' 8 ioo 8 Ioo
FREQUENCY-CPSLamer)ck Generation Stat)on, Accelerat)on Spectra for DRYHELL
Load Case: SRV — ASYMMETRIC — TRACE 76
Node: 335 Direction: vERT 'lev: 264'-6" Angle:90'amping:0.005 '.01,0.02,0.05 By: ~r Date: 5~8o Check: ~ Date: 5~5 o
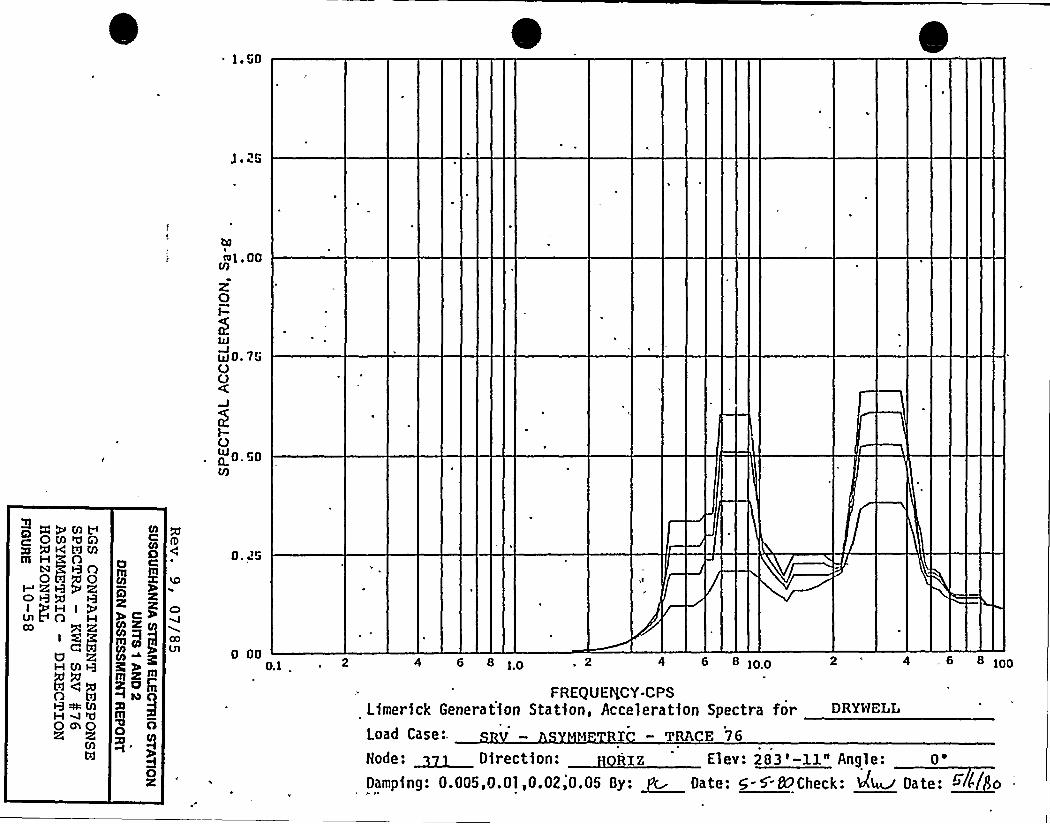
00
b0
tta), 00vj
ROf
LU
hf 0. 7GOO
0 0.50V)
P) xwMVQO) NAXKWM
t Rt3'g4c) Q QU1NO HCO
i a3.'W
U RH CQ gtd4QO td&3~%HAMQ cytQ
R
0fll
tOA
QC%VlK CO
III
5O
0. ~25
0 000.1 4 6 8 10 2 4 6 81oo 4 .6 8 100
FREQUENCY-CPSLlmertck Generat)on Station, Acceleration Spectra for DR~~E~L
Load Case:. TRACE 76
Node: ~l~ 0<rection: Rzz Elev: 283'-ll" Angle: 0
Dampteg: 0.005,0.01,0.02;0.05 By: ~( Date: 5-5'DpCheek: aa~ Date: ~>(/ o
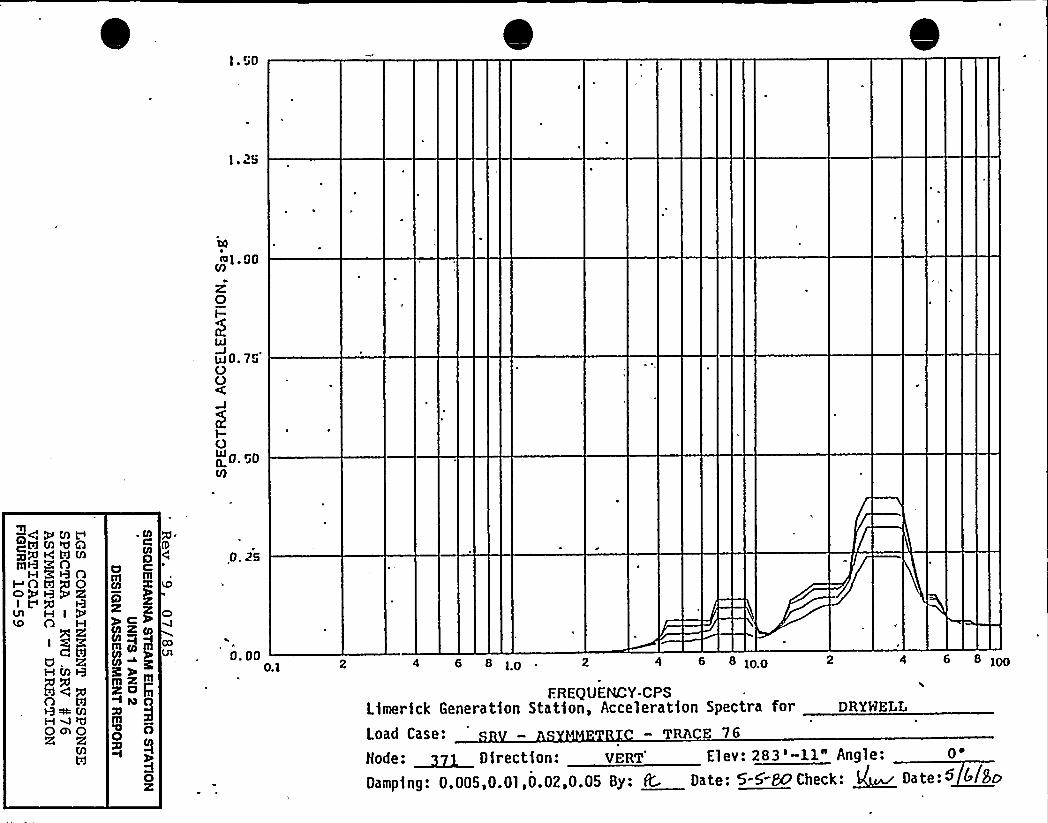
b0
031. 00
K0I-
wo. 75'
0
I-OW r0 0.50V)
~CPMCCW M e«I QP)Q h4 ITI M
rOtay0I VQ
Vt H IO H,
aRa. aHM9td 4 QO1-3~ MH W t«I0 «4 0R ml
td
Dp Clh gz zye>3lm ol
0
0. 25
0. 000.1 4 6 8 lp 4 6 8 lpp 4 6 8 1pp
EREQUENCY-CPSLlmerlck Generation Station, Acceleration Spectra forLoad Case: RA E 76
DRYHELL
Node: ~g D)rect) on: VERT El ev: 283 '-ll" Angle: 0
Damptng: 0.005,0.01,0.02,0.05 By: 1C, Date: 5-5-Na Check: ~ Date:5 B1Sm
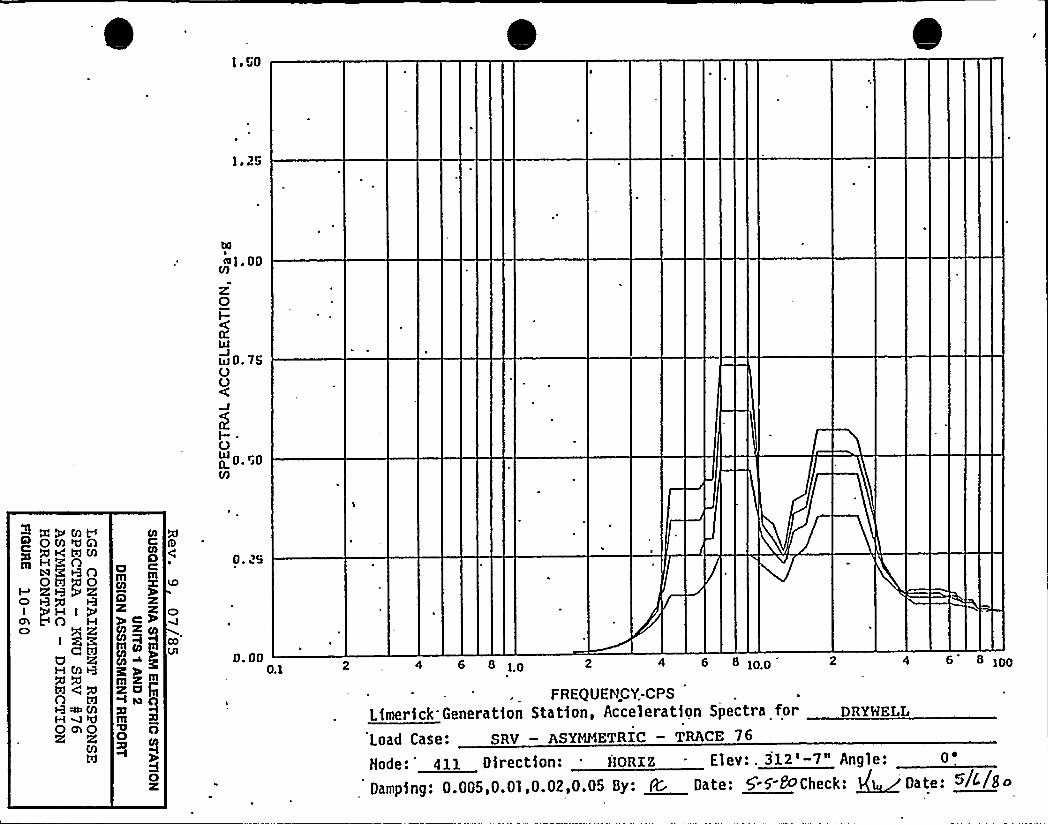
b0
4]. ooIo
2'.0I-KbJ
Ltj 0. 7SOO
]- ~
OL O.reoISJ
AMMAOM<ag ewtaM
wIQnRRgR
a PnO
g gC ITI
U RHM9hjgQnQ~MH WtCI0 4310R R
OclllOl
yetm (~ J+~m
Oz
0 28
0. 000.1 4 6 8 ]P 4 6 8 ]OO 4 6 8 100
FR EQ UE H.CY.-CPS
Lamer)ck Generat)on Stat)on, Acceleration Spectra for DRYHEI,].
Load Case: SRV — ASXMMETRIC - TRACE 76
Bode:'lt Dlrectlon: DDRxz . Elev:. 312'-7" Angle:0'amping:0.005,0.01,0.02,0.05 By: 4C Date: 5'-5-SDChect: ~ Date: >/4/So
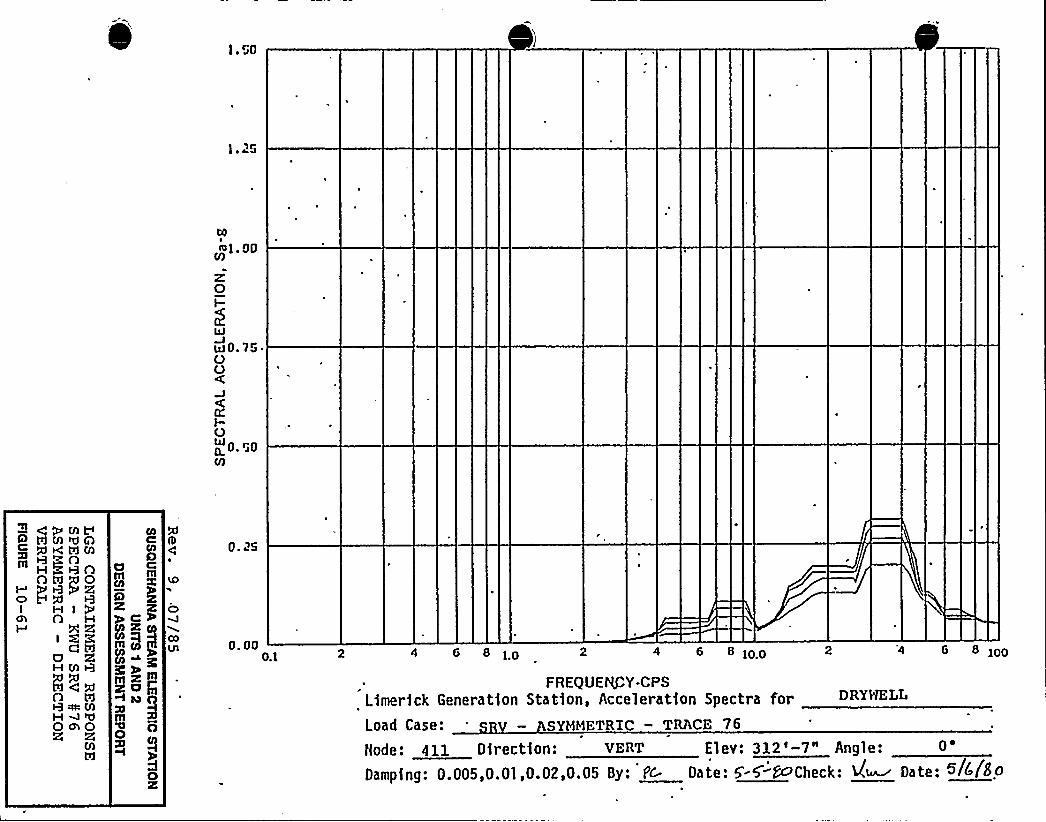
I4ttt 1. 00
2.'
w0.150O
0.I-OWL 0. r30
V)
CPM'ta I/I ~ a
c= gctam
I IDa R 5 RI H In H
X RI Z3.'
tdUH UI 9
n caQ~MHAM0 CIAORIT1
Ifl IIIsl
CO
OK
CO
00Lit
0 25
0. 000.1 4 6 8 1O 4 6 8 1OO 4 6 8 100
FREQUENCY-CPSL)mer)ck Generation Station, Accelerat)on Spectra forLoad Case: — SYMMETRIC - TRACE 76
r
Bode: 411 Directton: VERT Elev: 312I-7" Angle:0'amping:0.005,0.01,0.02,0.05 By: pc Date: 5 -5'-DIheck tI/~ Date: DIA/8o
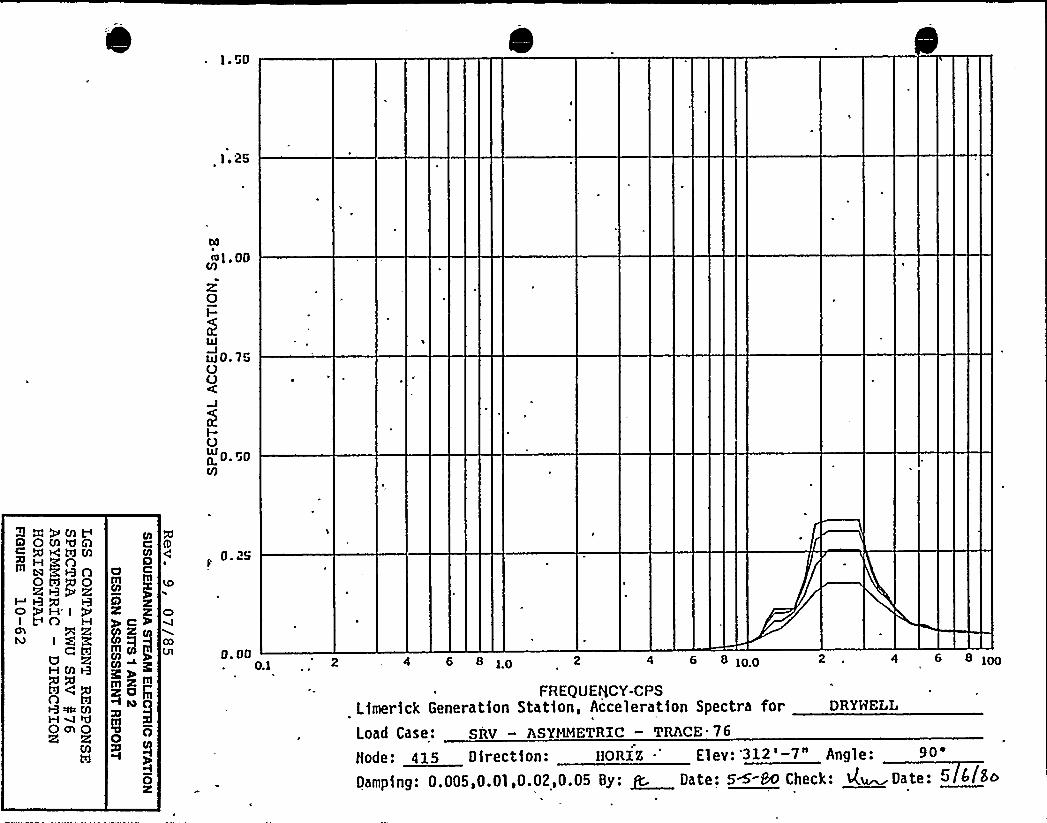
~1 a26
24
~l. 00
0
IBJ 0 7600
I-OIBI<O."0VJ
RWMvQ Omaac Xctam
eoOW)O
C) gH'IM I g ga aMM+
OcnOR
Oa c
IllCO
C)
pc%3l5~m mcn ~ g+~m
f' 25
0. 000.1 4 6 8 10 2 4 6 8 1OO 4 6 8 1OO
FREQUENCY-CPSLamer)ck Generat)on Stat)on, Acceleratton Spectra for DRYWELL
Load Case: SRV — ASYMMETRIC - TRACE 76
Node: 415 D1rect)on: HORIK .'lev: '312'- I" Angle:90'amp1ng:0.005,0.01,0.02 ~ 0.05 By: ~ Date: 5<-80 Check: Qn Date: 6 5/Bn
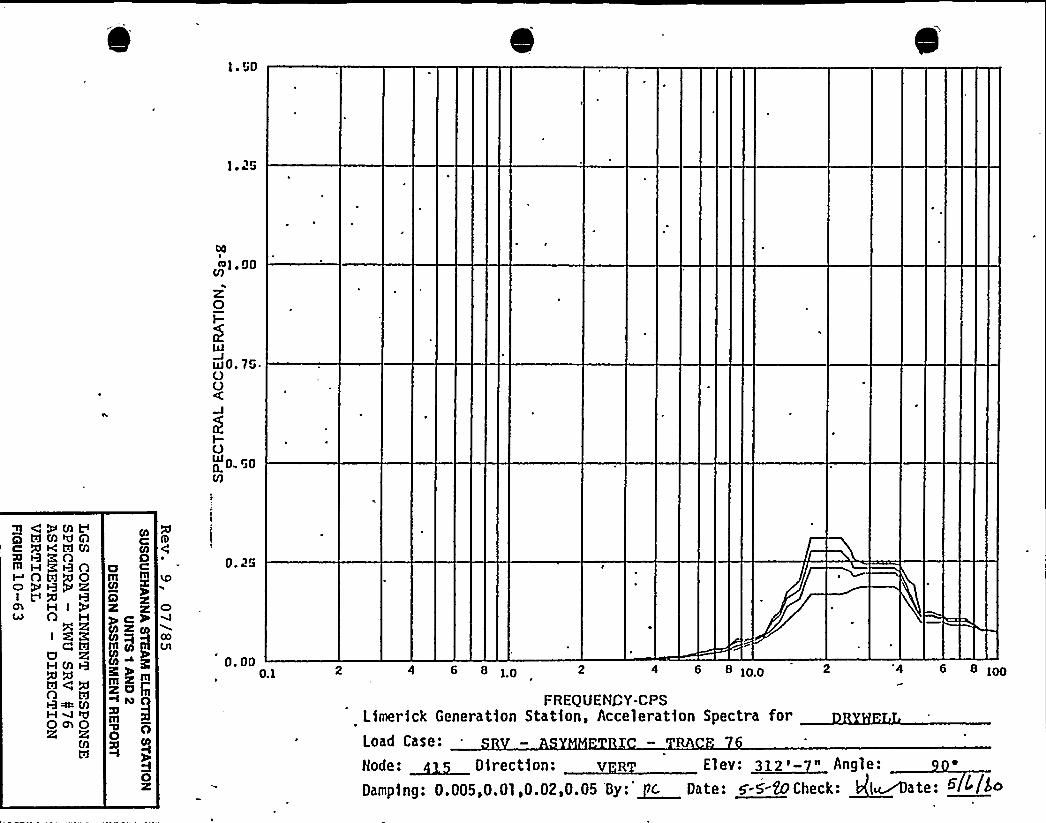
1 ~ 50
04
ttt1 QP
K0I-
wo. 76.00
I-OIAI00 ~Q
U)
CVMt~ td M aEI Ag<hfM
H)ROI OR)OI VA
H IO H
cKU RHMt3
O td+~ 9)
0 Egt 0R R
0oOI
I aI )m~mZa tlI
50z
C)
00Vl
o,an0.1 4 6 8 1O 4 6 8 Io.o '4 6 8 1OO
FREQUENCY-CPSLfmerfck Generatfon Statfon, Acceleratfon Spectra forLoad Case: IBode: ~~Directinn: v R Elev: ~812'- " Angle:
Damping: 0.005,0.01,0.02,0.05 By: ~c. Date: e"-5-EDCheck: ~lMate: ~ I /In
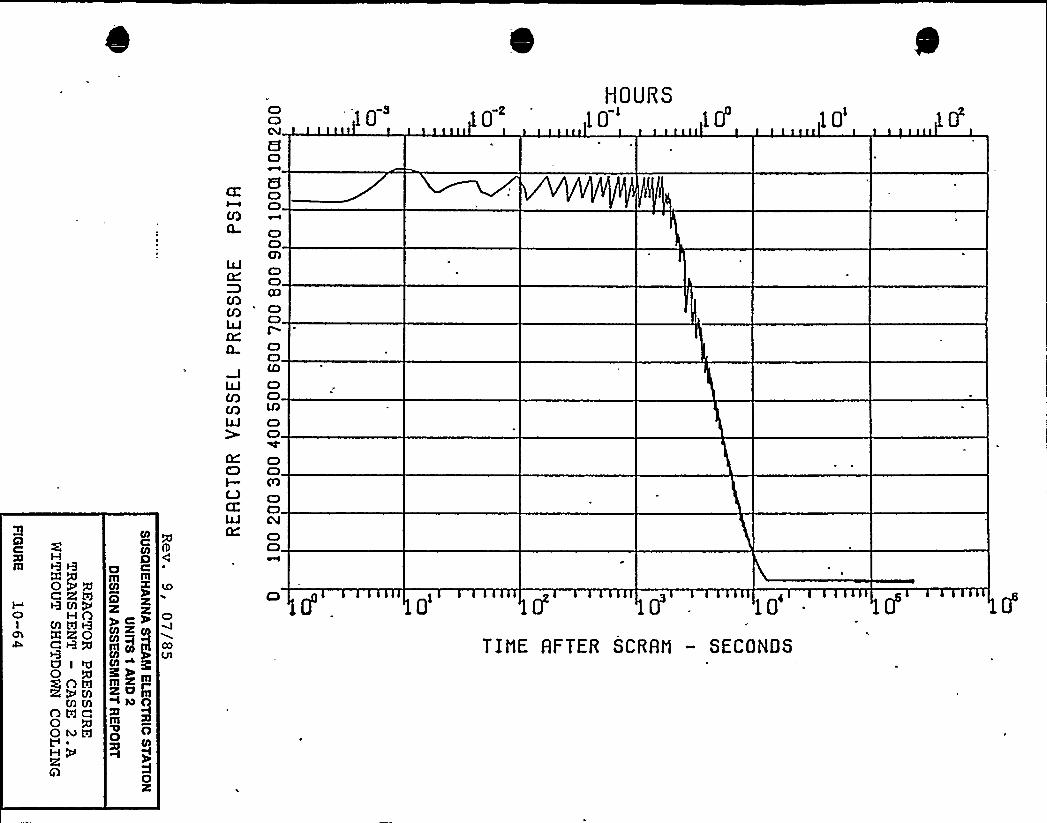
H
05%RMQHnMARXR0U I0
n Pa c0O~RH PRA
0g CCO
C)
yet
0
COUl
Q
MlQWLY0
LLI(QCQUJ
C3C)CV
8C)
6C)C)
C3C)Ch
C)CIIDC)CIfC)C)CO
C)C)LA
C)C)
C3C)F)CIC)CV
C)C)lpga
p"3
Ol
O2
HOURS
10'0
T?t1E RFTER SCRRN — SECONDS
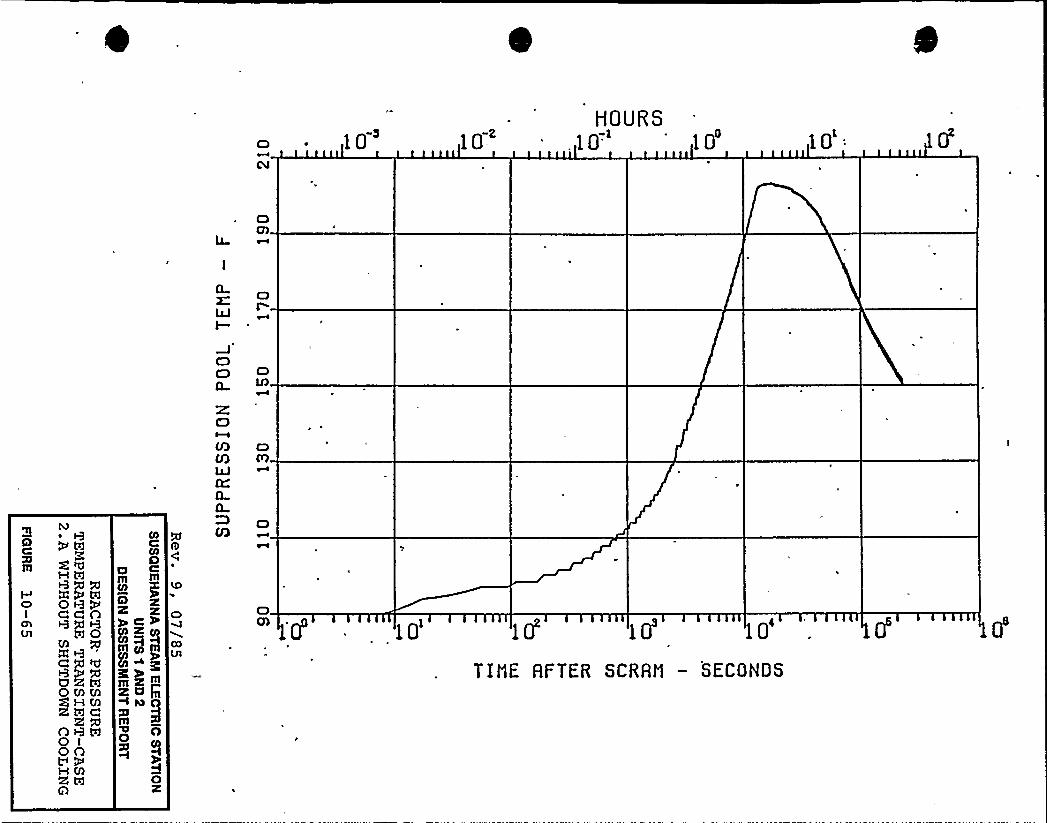
10'OURS10- '10'
I—
3 ~
c +3
H td
x 5 P5cD OggI CCA
ChWO
OMMIHMml g
A R h10 IOOH M
A
COCOlD
Ig)%~4
5OX
CD
COUl
C3O
G
C3
R oCQ P)QJ
fL0
lO 10'4Tlt1E RFTER SCRRt1 — SECONDS
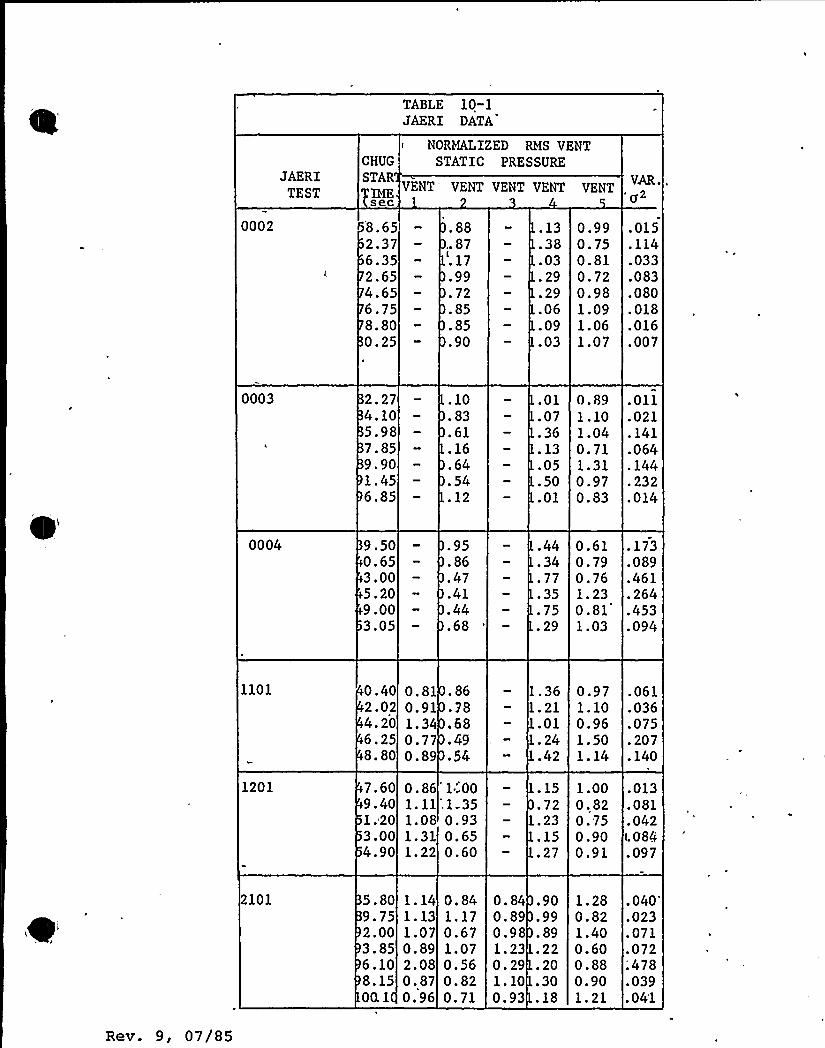
TABLEJAERI
10-1DATA
JAERITEST
CHUG
STARIMEsec
VENT'ENT VENT VENT VENT
NORMALIZED RMS VENTSTATIC PRESSURE
VAR..g2
0002 8.652.376.352.654.656.758.800.25
.88..87.17.99.72.85~ 85.90
.13
.38
.03
.29
.29
.06
.09
.03
0.990. 750.810.720.981.091 ~ 061.07
~ 015.114.033~ 083.080.018.016.007
0003 2.274.105.987.859.901.456.85
.10
.83
.61
.16
.64
.54
.12
.01
.07
.36~ 13.05.50.01
0.891.101.040.711.310.970.83
.011
.021
.141
.064
.144
.232
.014
0004 9.500.653.005.209.003.05
.95
.86
.47~ 41. 44..68
.44
.34
.77
.35
.75
.29
0 ~ 610.790.761. 230. 811.03
.173
.089
.461
.264
.453
.094
1101
1201
0.402.024. 206.258.80
7.609.401.203.004.90
0.810.911.30.770.89
0. 86l. 111. 081.311.22
.86
.78
.68
.49
.54
1.'001 350.930.650.60
1.361.211.01
.24
.42
.15
.72
.23
.15
.27
0.971.100.961.501.14
1.000.820.750.900.91
.061
.036
.075
.207
.140
.013
.081
.042i. 084.097
101 5.809.752.003.856.108.15OQ1
1. 141. 131.070. 892.080.870.96
0.841.170.671.070.560.820.71
0. 840.890.98l. 230. 291.100.93
.90
.99
.89
.22
.20~ 30.18
1.280 '21.400.600.880.901.21
.040'023
.071
.072;478.039. 04'1
Rev. 9, 07/85
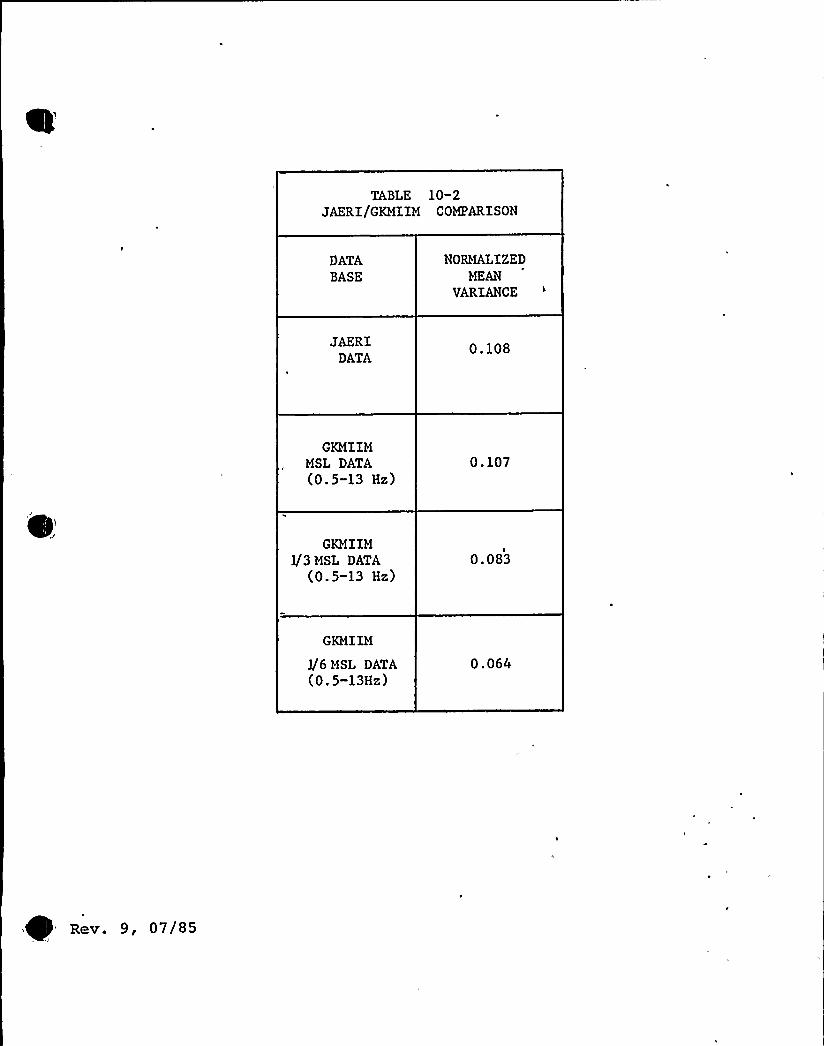
TABLE 10-2JAERI/GKMIIM COMPARISON
DATABASE
NOÃfALIZEDMEAN
VARIANCE
JAERIDATA
0.108
GKMIIMMSL DATA(O.S-13 H~)
0.107
'KMIIM3/3 MSL DATA
(0.5-13 H~)0. 083
GKMIIM
]/6 MSL DATA(O.S-13Hi)
0.064
Rev. 9, 07/85J
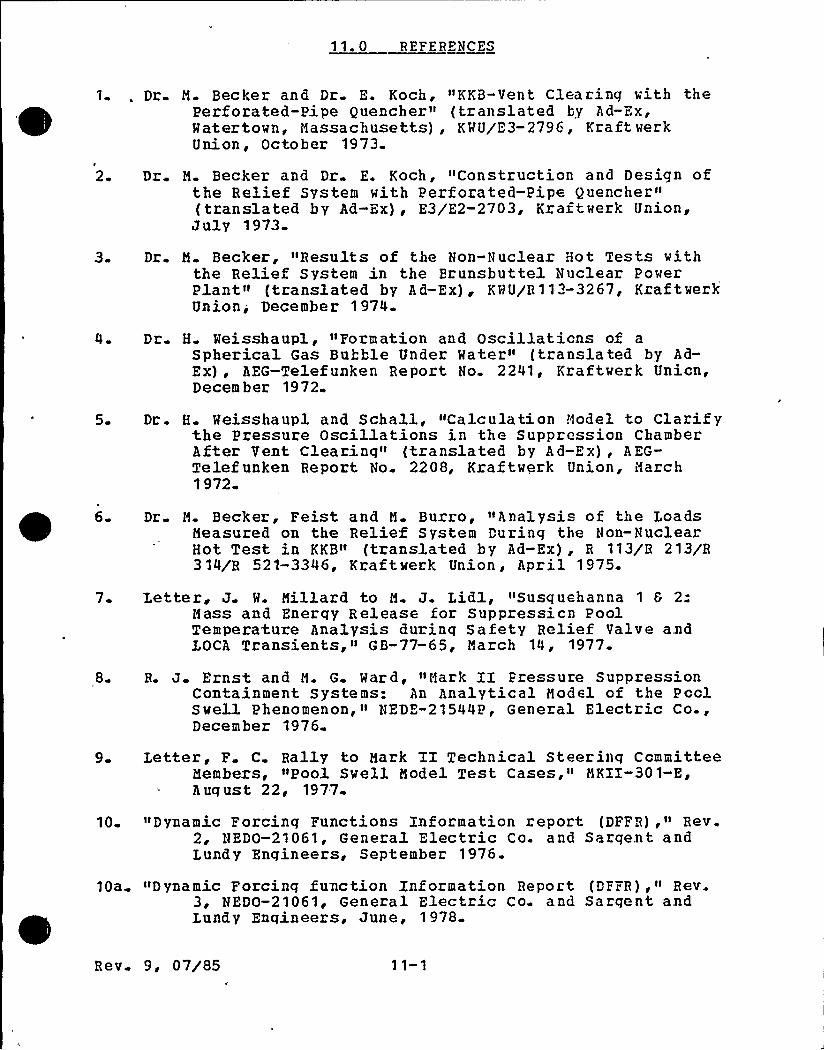
11. 0 REFERENCES
1 . Dr. M. Becker and Dr. E. Koch, »KKB-Vent Clearing with thePerforated-Pipe Quencher«(translated by Ad-Ex,Watertown, Massachusetts), KWU/E3-2796, Kraft werkUnion, October 1973.
2 0 Dz. M. Becker and Dr. Z. Koch, "Construction and Design ofthe Relief System with Perforated-Pipe Quencher»(translated by Ad-Ex), E3/E2-2703, Kzaftwerk Union,
J uly 1973
3- Dr. M Becker, »Results of the Non-Nuclear Hot Tests withthe Relief System in the Erunsbuttel Nuclear PowerPlant» (translated by Ad-Ex), KWU/R113-3267, KraftwerkUnion, December 1974.
Dr. H Weisshaupl, »Fozmation and Oscillaticns of aSpherical Gas Bubble Under Mater" (translated by Ad-Ex), AEG-Telefunken Report No. 2241, Kraftwerk Union,December 1972.
5. Dr. H. Weisshaupl and Schall, "Calculation Model to Clarifythe Pressure Oscillations in the Suppression ChamberAfter Vent Clearinq« (tzanslated by Ad-Ex), AEG-Telefunken Report No. 2208, Kraftwerk Union, March1972
6 Dr. M. Becker, Feist and M. Burro, "Analysis of the LoadsMeasured on the Relief System During the Non-NuclearHot Test in KKB«(translated by Ad-Ex), R 113/R 213/R314/R 521-3346, Kraftwerk Union, April 1975-
7 Letter, J W. Millard to M. J. Lidl, »Susquehanna 1 6 2.Mass and Enerqy Release for Suppressicn PoolTemperature Analysis durinq Safety Relief Valve andLOCA Transients," GB-77-65, March 14, 1977
8 R. J. Ernst and M. G. Ward, »Mark II Pressure SuppressionContainment Systems: An Analytical Model of the PoolSwell Phenomenon,« NEDE-21544P, General Electric Co.,December 1976.
9 Letter, F. C. Rally to Mark II Technical Steering CommitteeMembers, »Pool Swell Model Test Cases," MKII-301-E,August 22, 1977
10 »Dynamic Forcinq Functions Information report (DFFR),» Rev.2, NEDO-21061, General Electric Co. and Sargent andLundy Engineers, September 1976.
10a»Dynamic Forcinq function Information Report (DFFR),«Rev.3, NED0-21061, General Electric Co. and Sargent andLundy Engineers, June, 1978.
Rev 9, 07/85 1 1-1
11. T. Y. Fukushima, et al., "Test Results Employed by GE forBRR Containment and Vertical Vent Loads,» NEDE-21078-P,Table 3-4, General Electric Co., October 1975
12 F. J.. Moody, Analytical Model for Liquid Jet Properties forPredicting Forces on Riqid Submerqed Structures, NFDE-21472, General Electric Co., September 1977
13
14
R. J. Ernst, et al., Hark II Pressure SuppressionContainment Systems: Loads on Submerged Structures-An Application Memorandum, NEDF-21730, General ElectricCo., September 1977.
F. J. Hoody, Analytical Model for Es tira ting Drag Forces onRiqid Submerged Structures Caused by LOCA and SafetyRelief Valve Ramshead Air Dischazqes, NFDE-21471,General Electric Co., (to be published)
15. Hark II — Phase I, 4T Tests Applications Memorandum, Letterand Report to H. R. Butler (NRC) from J. F. Quirk (GE),June 14, 1976
16. N J Bilanin, et al., Hark II Lead Plant, Topical Report:Pool Boundary and Hain Vent Chuqqing LoadsJustification, NEDE-23617P, July 1977.
17. Harmeatlas (Heat Transfer Data), VDX (Society of GermanEngineers), Dusseldoz f, 1974.
18. T. E. Johnson, et al., "Containment Building Liner PlateDesign Report," BC-TOP-1, Bechtel Corporation, SanFrancisco, December 1972.
19. "Seismic Analysis of Piping Systems," BP-TOF-1, Rev. 2,Bechtel Power Corporation, San Francisco, January 1975.
20. Letter, F C. Rally to Hark II Technical Stearing CommitteeHembers, August 22, 1977, MK ZI-301-E, Sub ject: PoolSwell Mode Test Cases
21. Letter, J B. Hartin to Mark II Owners Group and TSC, HK II-250-E, Subject: Condensation Oscilla tion Excerpts toA p plica tion s Hemo ran dum, July 1, 1977.
22 D Hoffman and E Schmid, »Brunsbuttel Nuclear Power PlantI,ist of Test Parameters and Host Important HeasurementResults of the Non-Nuclear Hot Tests with the PressureBelief System» (translated by Ad-Ex), R 521/40/77,Kraftwerk Union, August 1977.
23 D. Gobel, »Results of the Non-Nuclear Hot Tests with theRelief System in the Philippsburq Nuclear Power plant"(translated by Ad-Ex), R 142-38/77, Kra+twerk Union,Harch 1977.
Re v 9, 07/85 1 1-2
24
25
26
27.
D. Hof fman and E. Schmid, »Philippsburg I Nuclear PowerPlant List cf Test Parameters and Most ImportantMeasurement Results of the Non-Nuclear Hot Tests withthe Pzessuze Relief System" (translated by Ad-Ex), R
521/41/77, Kraftwerk Union, August 1977.
Klans-D. Hezner, "Experimental Studies of Vent Clearing inthe Model Test Stand» (translated by AQ-Ex), KHU/R 521- ~
3129, Kraft wer k U nion, July 1975.
D. Gobel, «KKB — Nuclear Start-Up Results cf the Tests withthe Pressure Relief System» (translated by Ad-Ex), R
142-136/76, Kraftwerk Unicn, September 1976.
D Hoffman and Dr. K. Melchior, »Condensation and VentClearing Tests in GKM with Perforated Pipes"(translated by Ad-Ex), KHU/E3-2594, Kraftwezk Union,May 1973.
28. GE Drawing 761E579, Bechtel No. 8856-M1-B11-89
29 ASME Boiler and Pressure Vessel Code, Section III, Division1, 1974-
30 ASME Boiler and Pressure Vessel Code, Section IXI, Division2, 1974-
31 AZI 318-71
e 32
33.
34
R.L.Kianq and B.J. Grossi, "Dynamic Modelling of. a Mark IIPressure Suppression System," EPRI-NP-441, Palo Alto,Apzil 1977.
«Seismic Analyses of Structures and Equipment for NuclearPower Plants," BC-TOP-4A, Bechtel Power Corporation,November 1974
MARC-CDC User Information Manual Control Data Corporation,1975
35
36
37
38
Morse, P.M. and H. Teshbach Methods of theozetical physics IMcGraw Hill, New York, Toronto, London, 1953.
E. Kamcke Diffezentialqleichunqen Losungsmethoden undLosunqen (Differential Equations Solution Methods andSolutions) Volume I Akademische Vezlagsgesellschaf t,Leipzig, 1967
Properties of Hater and Steam .in SI-UnitsSpringer-Verlag,'erlin,
1969.
Gobel, KKB hot test results Loads on internals in the poolof he suppression chamber, during pressure zeliefprocesses 13 Nov. 1974; KHU-R 113/203.
Rev. 9, 07/85 1 1-3

39. Prandtl Stromunqslehre (Hydrodynamics) Vieweg 8 Sohn,B ra unsch we iq, 196 5.
40. Werner Tests of mixed condensation with model quenchers KNU-B 3-2593, Hay 1973.
41. T Potna Dehnunqsmessstreifentechnik (Foil Stzain GuageTechnology) Philipps-Taschenbucher T 11, 1968.
42
43
McCandlers Methods Guide for Reactor Internal StructureVibrations Analysis GE Memo SAR -2A July 1966.
Dubbels Taschenbuch fur den Maschinenbau (Cubbels Pocketbookfor Machine Construction) Springer, Berlin 1963.
J. M. Biqgs Introduction to Structural Dynamics, HcGrawHill, 1964
45. Becker, Gobel, et al. Analysis of the loads measured on therelief system durinq the KKB non-nuclear hot test KNU-R11-R31-3346, April 1975
46»Mark II Containment Lead Plant Load Evaluation andAcceptance Criteria», Rev 0 NUREG-0487, U.S ~ NuclearRegulatory Commission, October 1978.
47»Dynamic Lateral Loads on a Hain Vent Downccmer-Mark I'IContainment, » NEDE-24106-P, General Electric Co., Larch1978
48 Davis, M. M., MK II Hain Vent Lateral Loads Summary Report,NEDE-23806-P, General Electric Co., October 1978.
49 Kenleqn, G H. and Carpenter, L. H. «Forces on Cylinders andPlates in an Oscillating Fluid," NBS J of Research@Vol. 60, pp. 423 44D, 1958.
50. Sarpkaya, T., »Forces on Cylinders and Spheres in aSinusoidally Oscillatinq Fluid, » Tzans. ASHE, J. ofA pplied Mech, pp. 32-37, 1975.
51. Chandra, V, Donashovetz, I and Hsieh, J. 5., "Response toNUREG-0487 Criteria for Computing Loads cn SubmergedStructures,» 1980.
52 Pankhurst, R. C and Holder, D. H., »Hind Tunnel Technique,"Chapter 8, Pitman and Sons, Ltd., London, 1952.
53 Hilson, E L, "A Computer Proqram for the Dynamic StressAnalysis of Underground Structures, » USAEMES, ControlReport No. 1-.175, January 1968
54 Desai and Abel, »Introduction to the Finite Element Method,"Van Nostroid Reinold Cc, 1972.
Rev. 9, 07/85 1 1-4
55. »IEEE Recommended Practices for Seismic Qualification ofClass 1F, Equipment For Nuclear Power GeneratingStations,» IEEE Std. 344-1975.
56 A. J. James, "The General Electric Pressure S uppressionContainment Analytical Model,» GE, July 1971.
57. Le tter HF N-080-79, L. J Sobon (GE) to J. F. S tolz (NRC),Subject: Vent Clearing Pcol Boundary Loads for Mark ZIPlants, 3/20/79
58 P. W. Huber, A. A. Sonin, W. G. Anderson, "Considerations inSmall-scale Modelinq of Poolswell in EWR Cont ainments, »
NUREG-CR-1143, July 1979, Contract No. NRC-04-77-011.
59. C. K., Chun, »Suppression Pool Dynamics,» NUREG-0264,Contract No. AT (49-24) -0342
60. R. L. Kiang and P. R Jeuck, »A Study of Pcol Swell DynamicsIn a Mark II Single Cell Model,» EPRI, Dzaft Report.
61. Conrant, R. and Hilbert, D., »Nethoden der MathematischenPhysik I (Methods of Mathematical Physics I),»Spzinqer-Verlag, Berlin, Heidelberq, New York, 1968.
62. Antony-Spies, P, »Theory of the Excitation of Kiqenmodes ofa Water-Filled Tank by a Callapsing Steam Bubble»(translated by Ad-Ex), Technical Report KWU/R14/77,September, 1977
63. MARC-CDC, User Information Manual, Control Data Corporation,1 976
64. Koch, E. and Sobottka, H., »KKP 1/KKI — Estimate of theHiting Values of the Dynamic Loads on the PressureSuppression System During Air-Free Condensation at theVent Pipes«, Technical Report KKU/R113/3593, December1 975.
65. »Mark II Improved Chugging Methodology", NKDE-24822-P,General Electric Company, May 1980.
66. «Single and Multivent Chuqginq Final Repozt«, NEDE-24300-P,General Electric Company, May 1980.
67. Hark II Owners Group, »Assumptions for use in Analyzing MarkII BWR Suppression Pool Temperature TransientsInvolving Safety/Relief Valve Discharge," Revision 1,December 1980.
68 Everstine, G. C., "A Nastzan Implementation of the DoublyAsymptotic Approximation for Underwater SchockResponse», Nastzan Users's Experiences, NASA TMX 3428,pp 207-228, October 1976.
Rev. 9, 07/85 11-5

69 HacNeal, R. H., Citerley, R, and Chaiqin, M., «A New Methodfor Analyzing Fluid-Structure Interaction usingM.S C/Nastran«, Trans 5th Int Ccnf. on StructuralMechanics in Reactor Technoloqy, paper B4/9, August1979
70. Mach II Generic Condensation Oscillation Load DefinitionReport, NEDE-24288-P, General Electric Com pany,November 1980.
71 C. W. Hirt, B. D. Nichols, N.C. Romero, «SOLA: A NumericalSolution Alqorithm for Transient Fluid Flows, «LA-5852,April 1975.
72. B. D. Nichols, C. H. H irt, R. S. Ho tchkiss, »SOLA-VOF: A
Solution Algorithm for Transient Fluid Flew withMultiple Free Boundaries," LA-83 5, Auqust 1980.
73 C. M. Hirt, B. D. N ichols, L. R. S tein, «N ultidimensionalAnalysis for P ressu r e S up press ion S ys tern s, «LA-UR-79-1305, April 1979.
74
75
Zimmer Nuclear Power Station — Unit, Attachment 1. k,Amendment 99, Submittal of Revision 61 to the FSAR,September 28, 1979.
»ANSYS Enqineerinq Analysis System Theoretical Manual, «
November 1, 1977 by Swanson Analysis Systems, Inc.
76 «ANSYS Enqineerinq Analysis Systems Users Manual» August 1,1978 by Swanson Analysis Systems, Inc.
77 A. Kalmins «Analysis of Shells of Revoluticn Subjected toSymmetrical and Non-Symmetrical loads", Journal ofApplied Mechanics, September 1964.
78 Abrahamson, G. R., and Hashemi, A., »SSES In-Plant Tests toMeasure Submerged Structure Loads and poolFrequencies, «SRI Report to PPGL, April 1980,
79 «Hark II Containment Lead Plant Program Load Evaluation andAcceptance Criteria,» NUREG-0487 Supplement No. 1,USNRC, September 1980
80 General Electric report NED0-24310, »Technical Bases for theUse of the Square Boot of the Sum of the Squares (SRSS)Hethod of Combining Dynamic Loads for Nark II Plants,"July 1977
81 Letter from Roger J. Mateson, Office of Nuclear ReactorRequlations, to Dr H. Chau, Chairman cf the Mark IIOwners Group, dated February 25, 1982.
82. Letter from G. D. Bouchey to A. Schwencer,«Desynchronization Methodology in the Chugginq Load
Rev 9, 07/85 1 1-6
Specification,"dated March 15, 1982, Letter No. G02-82-324.
83. Letter from G. D. Bouchey to A. Schwencer," Comparison ofStructural Response to Symmetric and A'symmetricChuqqinq and Seismic Loads," dated April 5, 1982,Letter No. G02-82-362.
84 G. K Ashley I'I and N. M. Howard, «Understanding Poolswellin a Hark II Type BHR,» ANS Topical Meetinq on ThermalReactor Safety, July 31-Auqust 4, 1977, Sun Valley,Idaho
85. B R. Patel, P. X Dolan and J. A. Block, Creare TN-307Report (NEDE-24781-1-P), January, 1980.
Rev. 9, 07/8 5 11-7
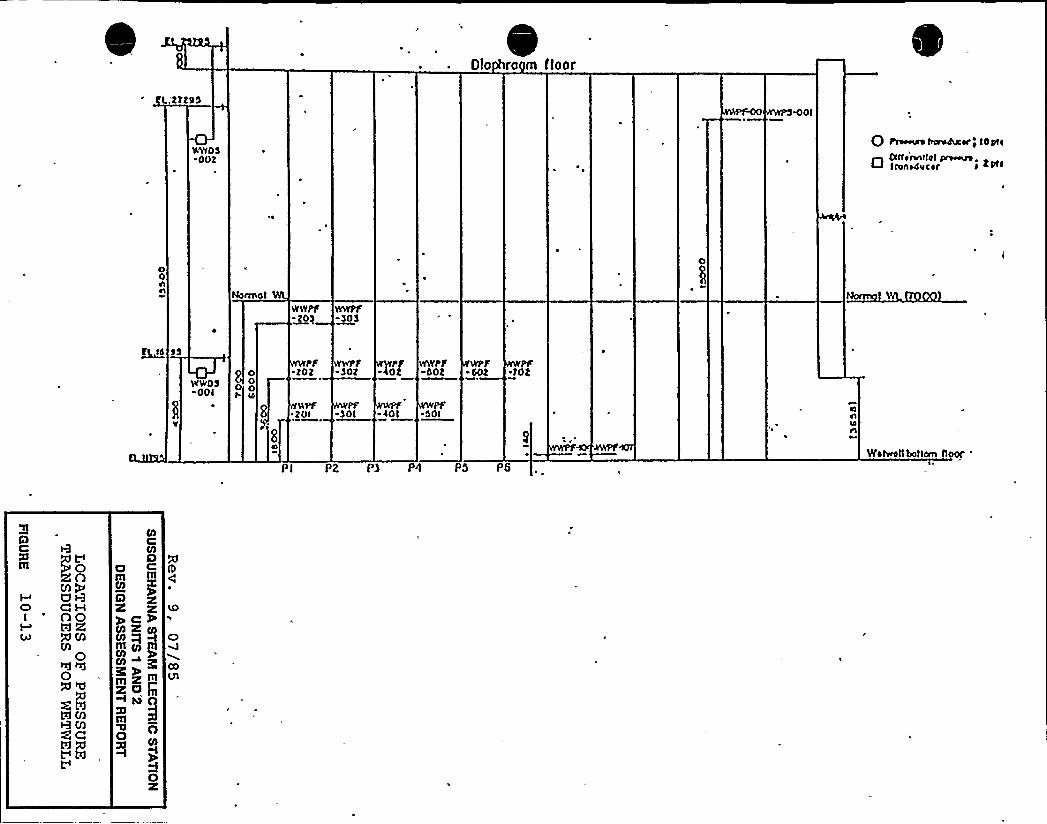
Dlo ro m floor
tl..MltSSWOt
V'WOS-Oot
Q tnwwrs bawhceri 14pll
~ OItfennltcl~~ tIohsdvcor i <PI ~
00nn NaIIIIot Vll
WWPf324
WWPf-SOS
JC Id SS
WWOS001
Pf20Z
hi%Sf20I
Wff-SOZ
Pf-$ 01
-1'
401
WWPf-Dot
Pf-501
Pf.101
ClnlO
O
ez es en n e6V/chnIttbottom oer
~ ~
AC
PoanMQV UR0 CHno
IXM
0le Ict0
RMZa
Oillm
y C SIOt à tO
m Pg
~~m
0
C)
OO
Vl

0
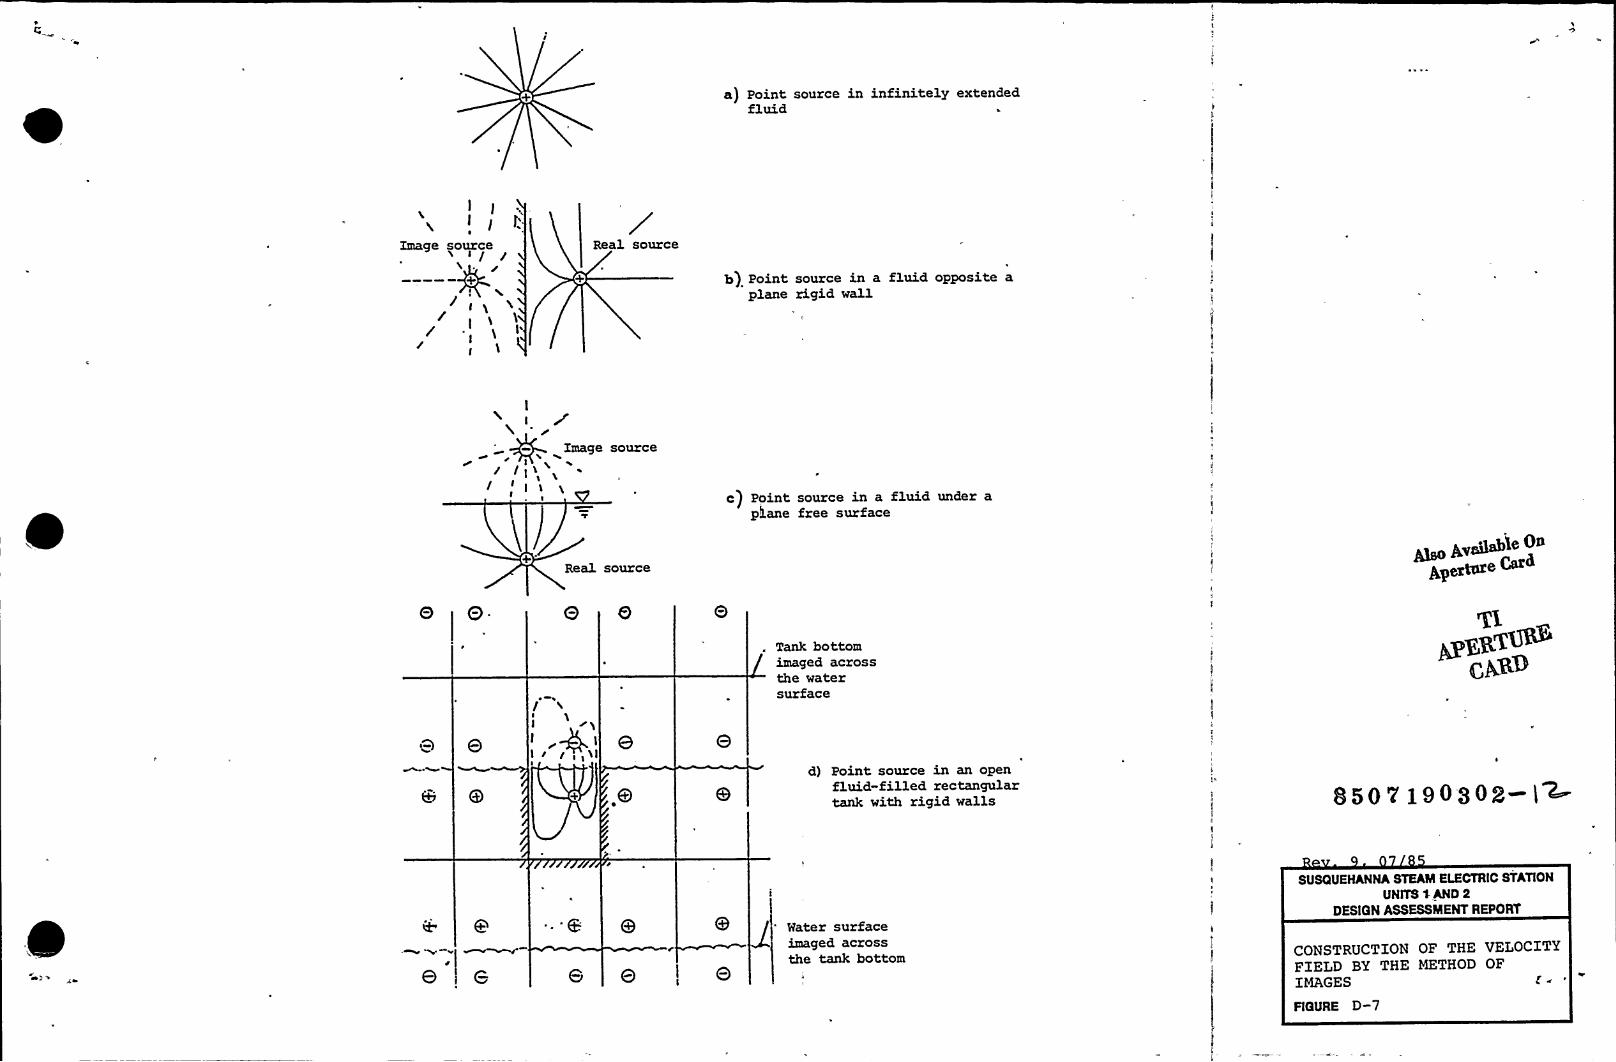
a) Point source in infinitely extendedfluid
!
!
Image sourceI
+
~ig/I
Real source
b) Point source in a fluid opposite aplane rigid wall
I
Image source
I c) Point source in a fluid under aphane free surface
0 0
+Real source
0 8
le On
gpevtore C a
Tank bottomimaged acrossthe watersurface
rI1 I l,,xl
d) Point source in an openfluid-filled rectangulartank with rigid walls 850 v 190303- l~
v
Water surfaceimaged acrossthe tank bottom
SUSQUEHANNA STEAM ELECTRIC STATIONUNITS %AND 2
DESIGN ASSESSMENT REPORT
CONSTRUCTION OF THE VELOCITYFIELD BY THE METHOD OFIMAGES
FIGURE D-7

yv
fw1
I '~F y h
ILJ
t
~ 'l
'e>I"lpi
;
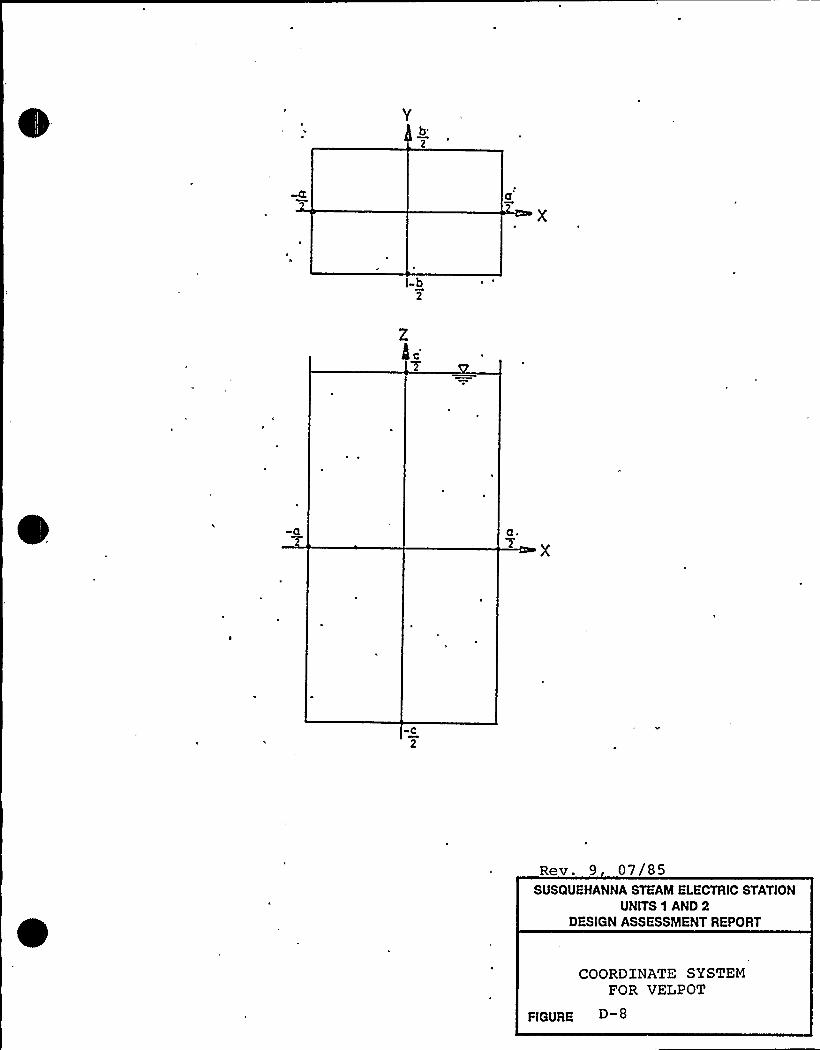
-b2
C2
C
Rev. 9 07/85SUSQUEHANNA STEAM ELECTRIC STATION
UNITS 1 AND 2DESIGN ASSESSMENT REPORT
COORDINATE SYSTEMFOR VELPOT
FIGURE D 8
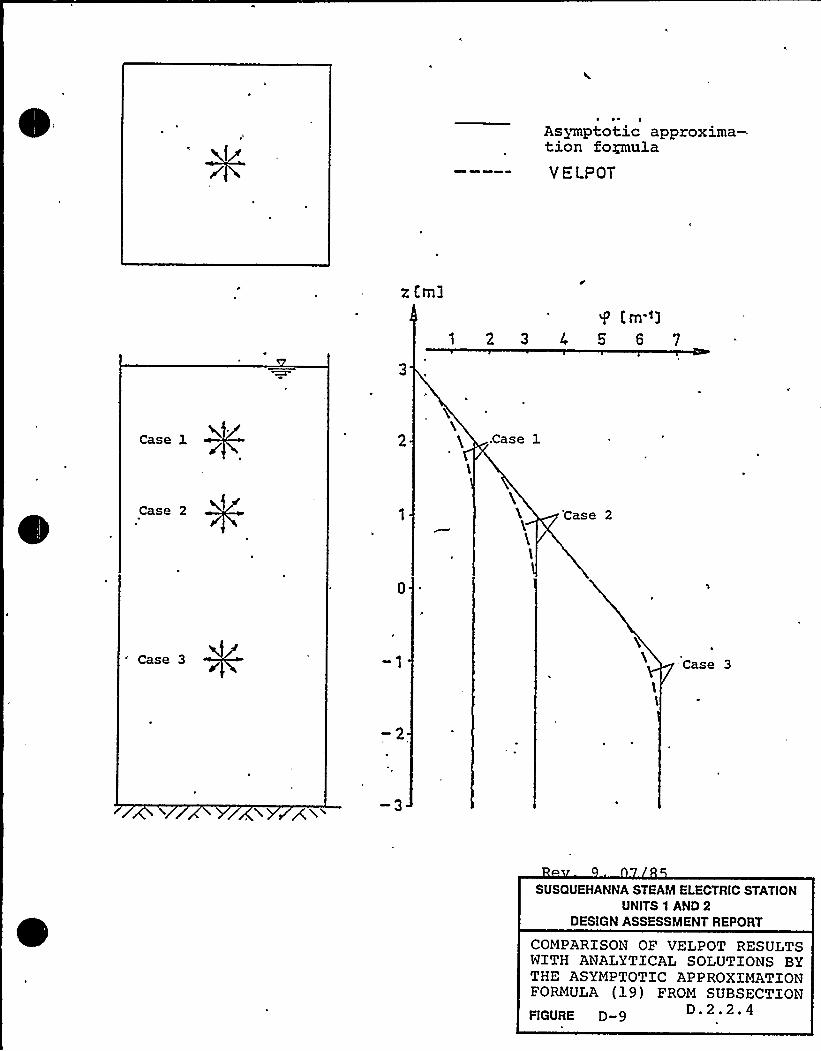
~ ~ ~
Asynptotic approxima-tion formulaVELPOT
z(m3g [m')
2 3 4 5 S 7
Case 1 .Case 1
Case 2 'Case 2
'ase 3 Case 3
SUSQUEHANNA STEAM ELECTRIC STATIONUNITS 1 AND 2
DESIGN ASSESSMENT REPORT
COMPARISON OF VELPOT RESULTSWITH ANALYTICALSOLUTIONS BYTHE ASYMPTOTIC APPROXIMATIONFORMULA (19) FROM SUBSECTIONFIGURE D-9 D.2.2.4
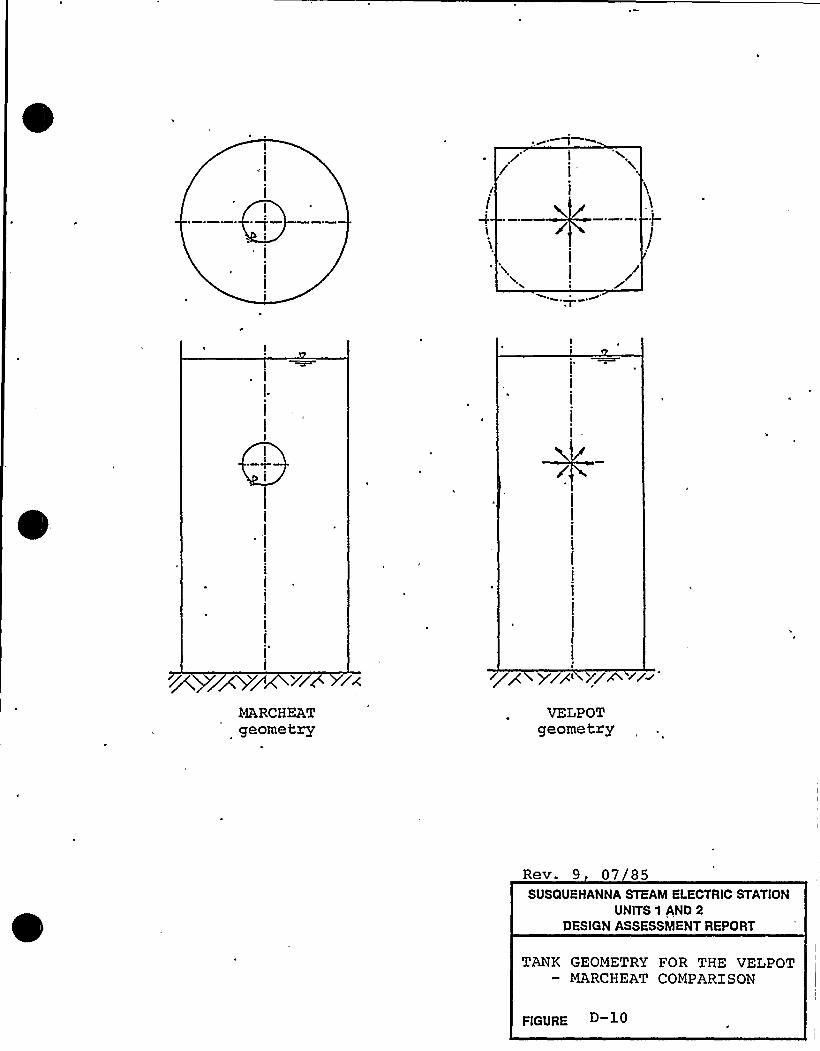
yyP Vga
MARCHEATgeometry
VELPOTgeometry
Rev. 9 07 85SUSQUEHANNA STEAM ELECTRIC STATION
UNITS 1 AND 2DESIGN ASSESSMENT REPORT
TANK GEOMETRY FOR THE VELPOTMARCHEAT COMPARXSON
FIGURE
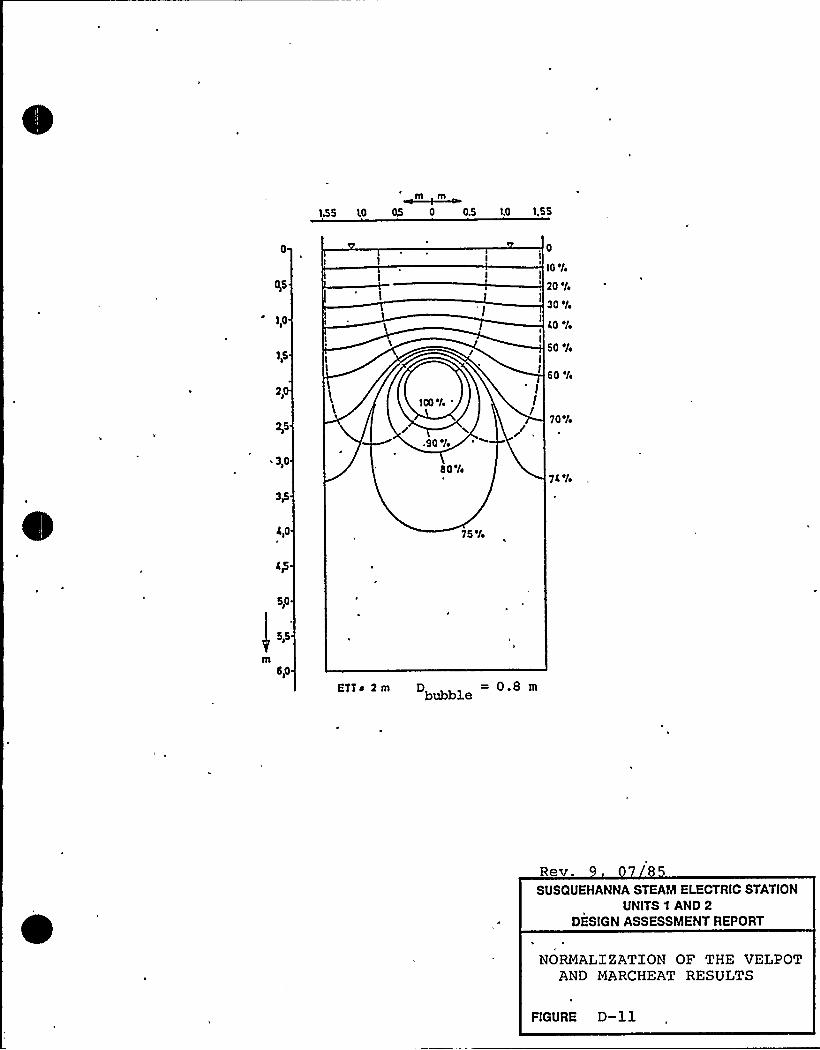
m ~m155 1.0 050 0.5 1.0 1,55
1,0
1,5
2l
~ 3,0
100%
90%
80%
'
I/
10%
20 0/
30%
C0%
50%
60%
70%
7C%
Cio 75%
5,0
m5,0
KTT 2m D bl =08mbubble
Rev.SUSQUEHANNA STEAM ELECTRIC STATION
UNITS 1 AND 2DESIGN ASSESSMENT REPORT
NORMALIZATION OF THE VELPOTAND MARCHEAT RESULTS
FIGURE D-ll
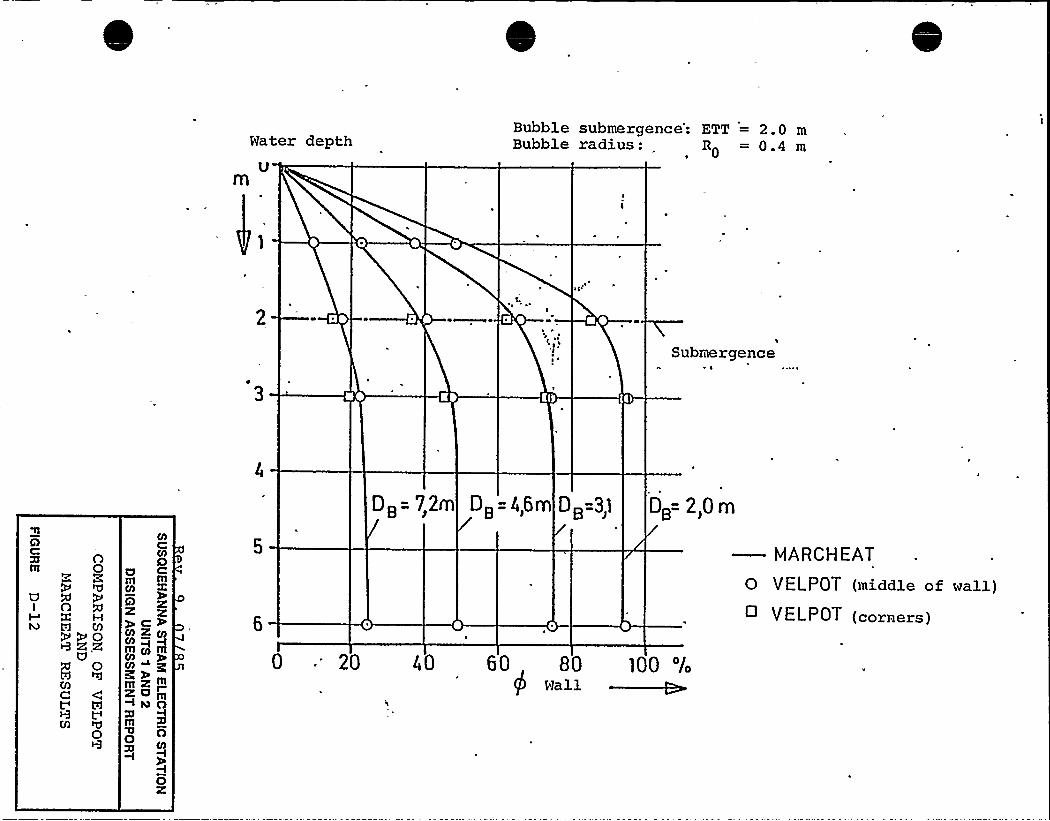
Water depthU
fA
Bubble submergence: ETT = 2.0 mBubble radius: R0 = 0.4 m
o~e\
Submergence
3
0,=72m D =468, Al DB=3,1 Dg 2,0m
Om 0
R FUI O
MPPOa'
td
W
0
CO
8a c
9
Cll Z CO
ill CO IllS
Ill ZC»m~ IO 0
ZlIll0 0
CO
OZ
0 '20 40 60 80 l00 'l0
Wall
—MARCHEAT
0 VELPOT (middle of wall)< VELPOT (corners)
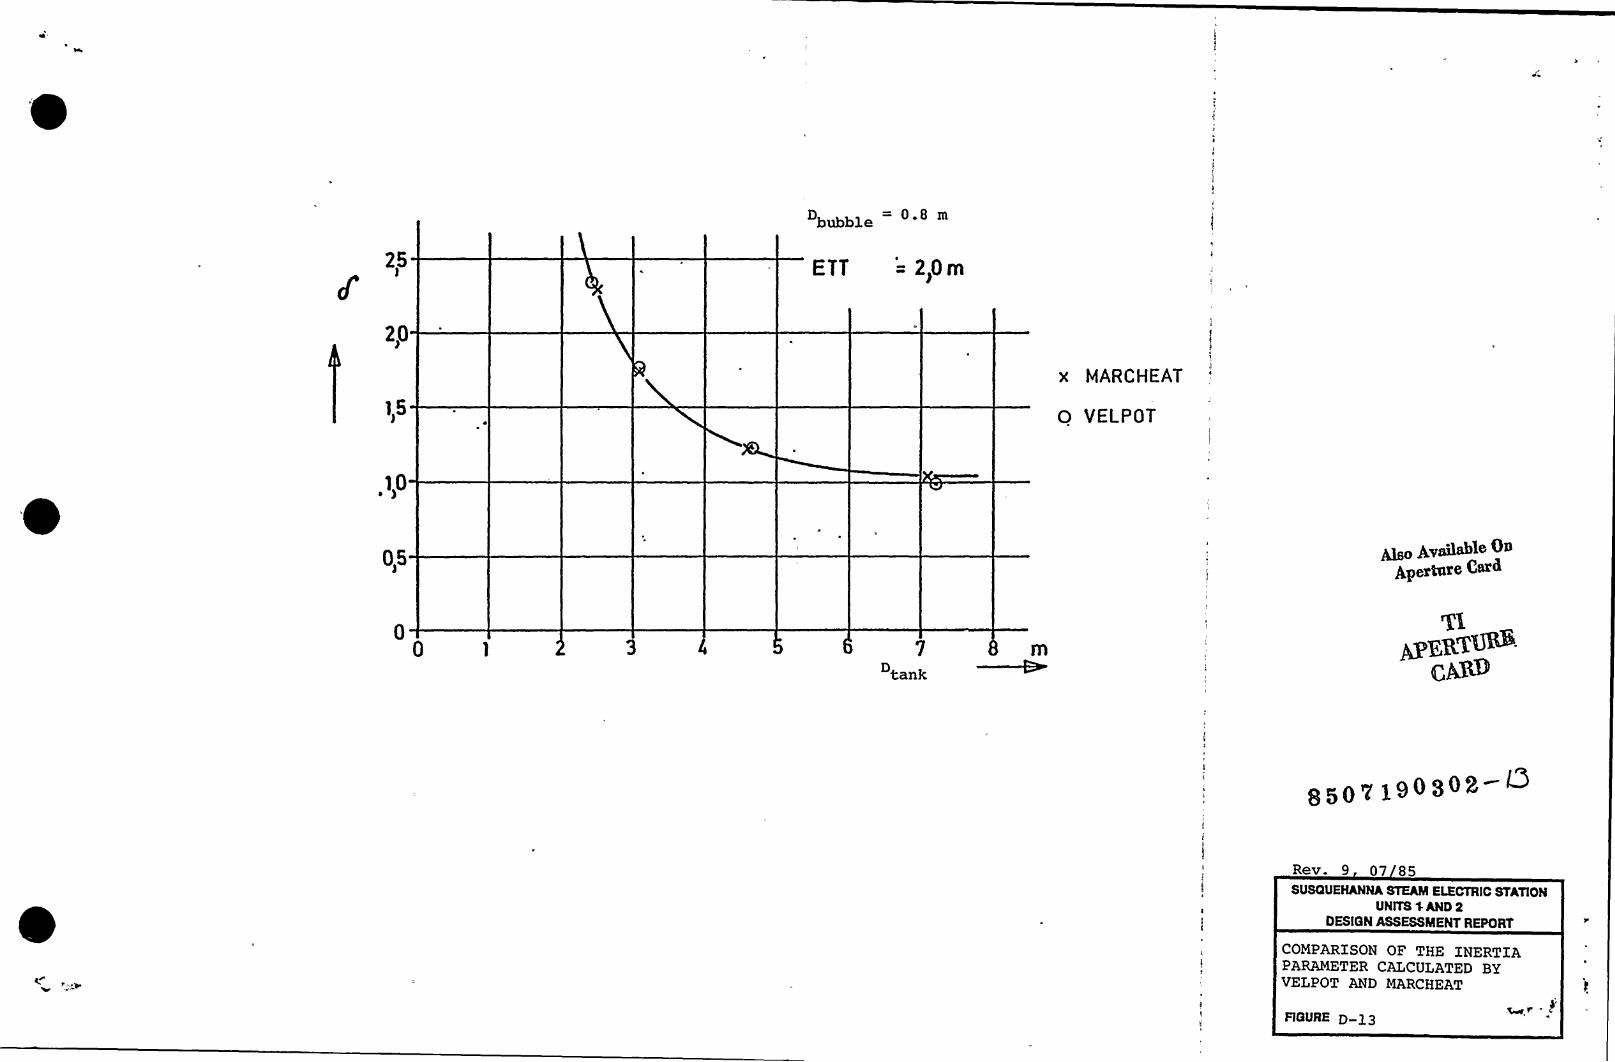
DbWble 0.8 m
2,5 = 2]0m
2,0
x MARCHEAT
0 VELPOT
0,5 ~o Av~Apegt Te Cma
0tank
850yj90308--Q
Rev. 9 07 85SUSOUEHANNA STEAM ELECTRIC STATION
UNITS 4 AND 2DESIGN ASSESSMENT REPORT
COMPARISON OF THE INERTIAPARAMETER CALCULATED BYVELPOT AND MARCHEAT
FIGURE D-y3

I
~ 51
W
I I'y
~yy gpp~p
'C
Sy
iI~ a
*
4,~j
h 'I
4l
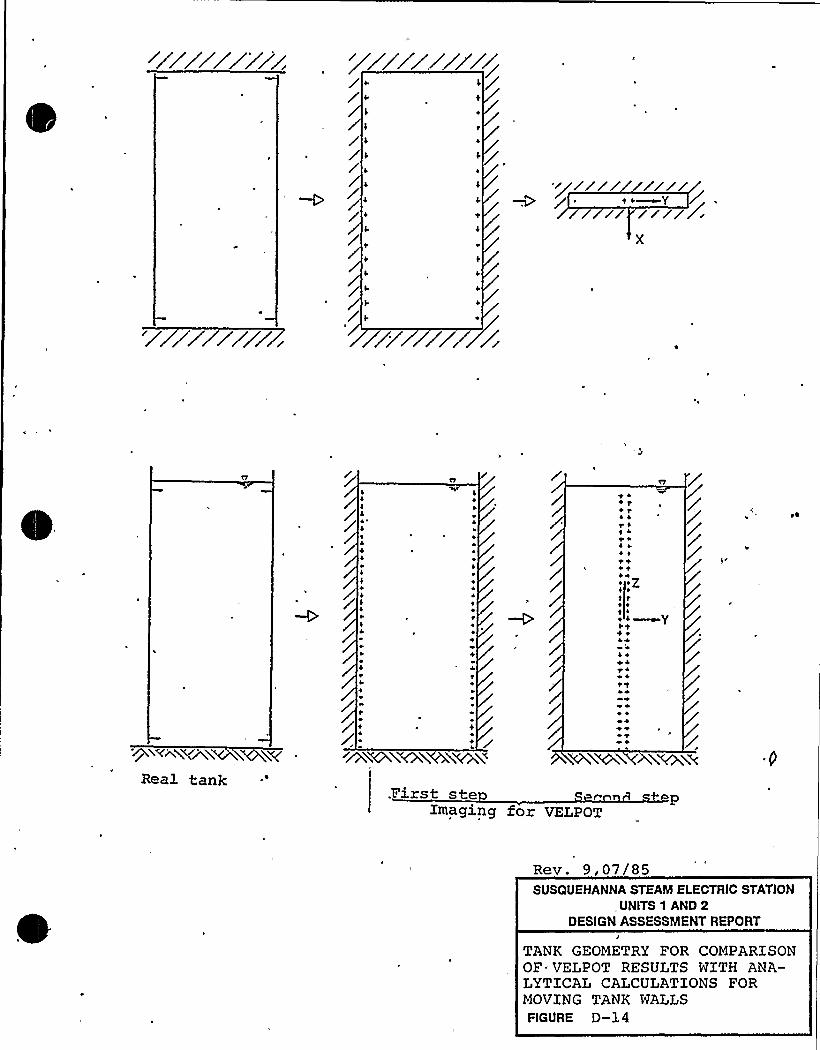
Qi~~XYPÃ~i XvC
W
I
WX&h~iWiY&hv
y j+ t+ t
J
4 t4 foo7t ~
t t\ t
tt44y4t 4
tW44a 4o+e4e +a+
Real tank .First steImaging for VELPOT
Rev. 9, 07/85SUSQUEHANNA STEAM ELECTRIC STATION
.UNITS 1 AND 2DESIGN ASSESSMENT REPORT
tTANK GEOMETRY FOR COMPARISONOF" UELPOT RESULTS WITH ANA-LYTICAL CALCULATIONS FORMOVING TANK WALLSFIGURE D-1 4
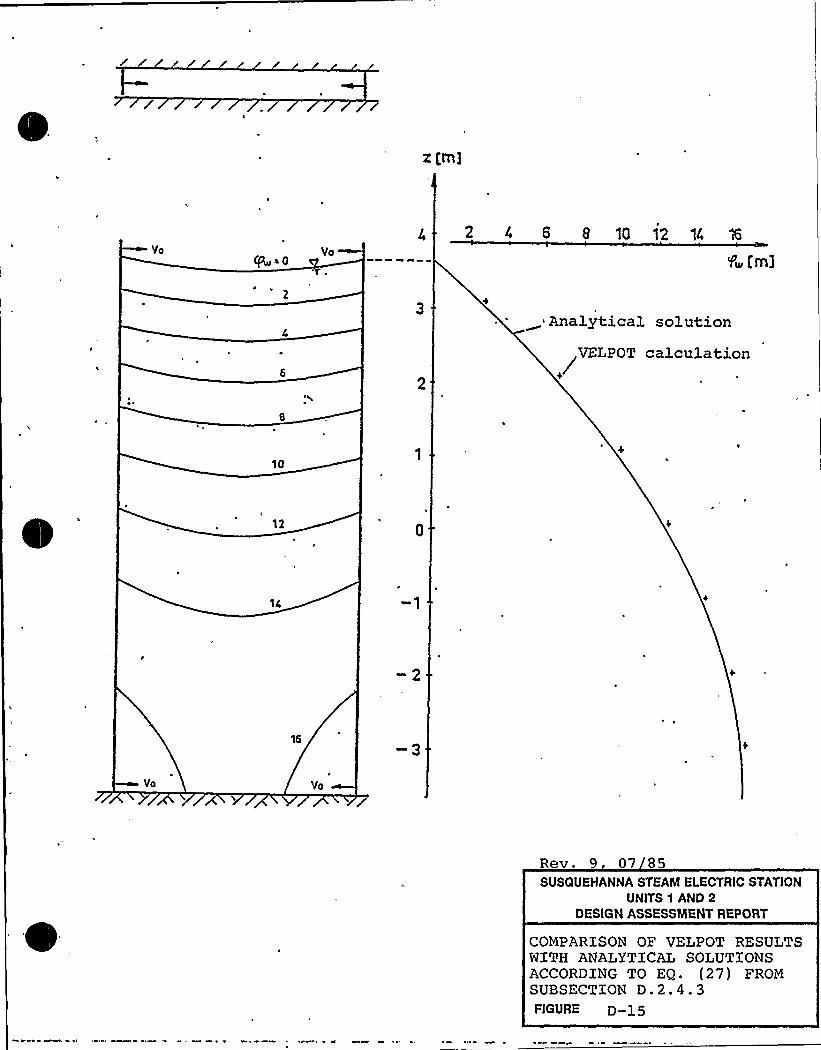
Z [lTl3
VoQa0
2 4 6 8 't0 l2 14
t~ [ml
Analytical solutionVELPOT calculation
10
0
Yo Vo
Rev. 9 07 85SUSQUEHANNA STEAM ELECTRIC STATION
UNITS 1 AND 2DESIGN ASSESSMENT REPORT
COMPARXSON OF VELPOT RESULTSWX'ZH ANALYTlCAL SOLUTXONSACCORDING TO EQ. (27) FROMSUBSECTION D.2.4.3FIGURE D-l5
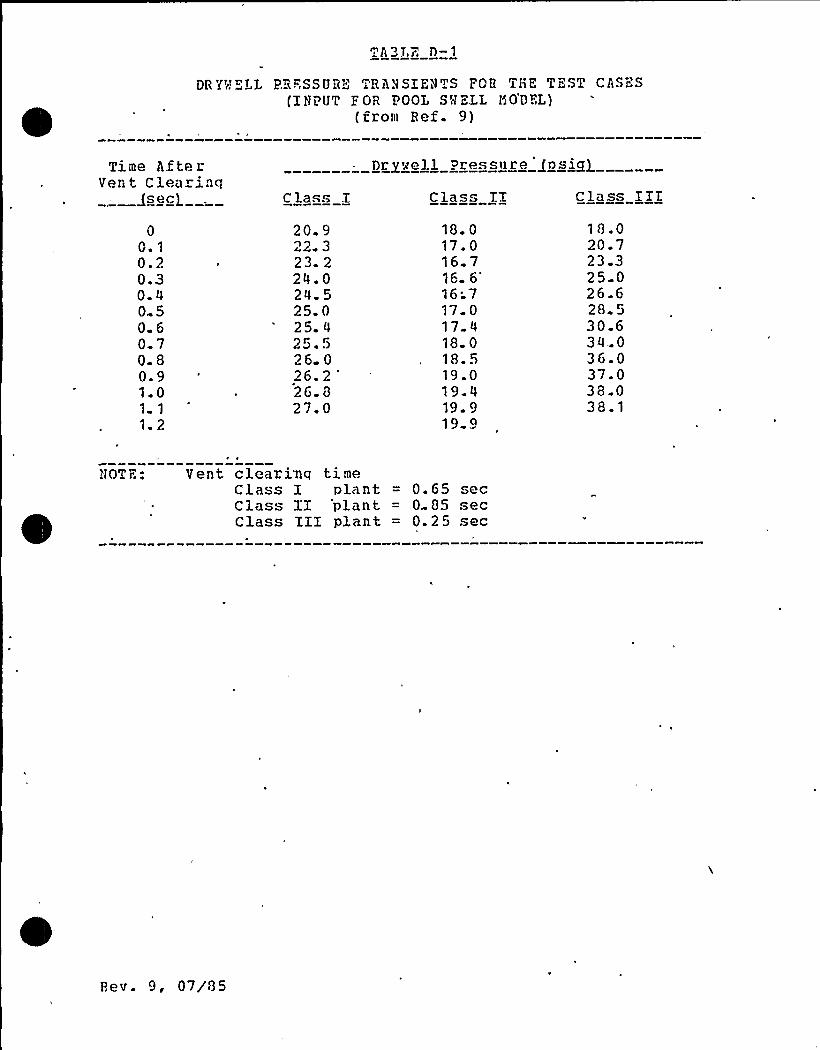
~ A3LE D-1
DR Y~r! ELL PB~SSUB'" ' BV SIEVE TS FOB ThK TEST CASHS(IHAUT P OR POOL SM ZLL HO'OEL)
(irom Ref. 9)
Time A,ft. rVent Clearinq
(sec) C las..E Class TI Class IIIDrgvell Pressure posing
00.10.20.30 40 50.60.70.80.91.01 1
1.2
20. 922. 323. 224. 024. 525. 025. 425.526 0
26.2'6.
827. 0
18. 017. 016. 716.
6'6;7
17 017 418- 018. 519.019.419. 919 9
18.020.723.325 026.628 530.634.036.037.038.038~ 1
~)OT H Vent clearinq timeClass I plant = 0. 65 secClass II plant = 0.05 secClass TII plant = 0. 2 5 sec
Pev. 9, 07/85
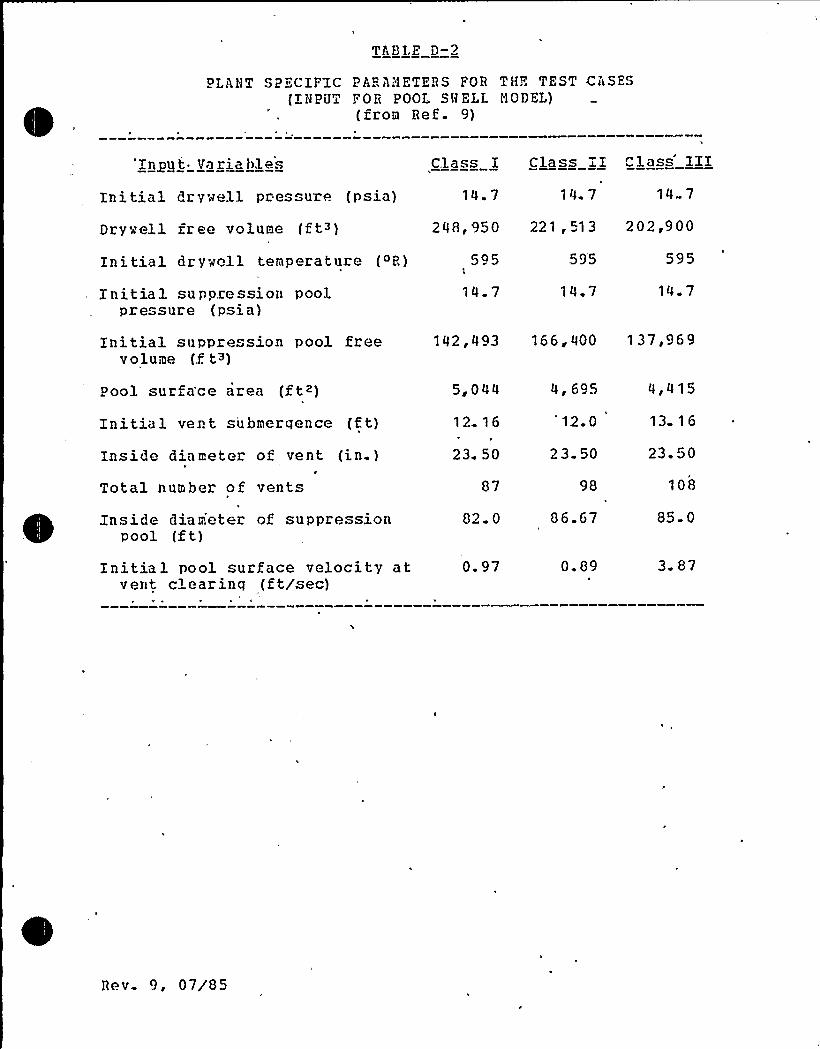
TABLE 0-2
PLAHT SPECIFIC PAHAHE'EEHS FOH THE TEST CASES(INPUT FOB POOL SH ELL MODEL)
(from Hef. 9)
'Ingu t Va rig bles Class I Class II C 1 ass IIIInitial dryvell pressure (psia)
Dryvell free volume (ft~)
Initial drywoll temperature (~H)
14. 7 14. 7 14 7
5Q5 595
248, 950 221, 513 202,900
Initial suppression poolpressure {psi a)
14. 7 14.7
Initial suppres -ion pool freevolume (.f t~)
142,493 166,400 137,969
Pool surfa'ce area (ft~)
Initial vent submergence (tt)Inside diameter of vent (in.)
P
Total number of vents
Inside diameter of suppressionpool (ft)
Initial pool surface velocity atvent clearinq (ft/sec)
5~044
12 16
23. 50
82. 0
0. 97
4, 695
'12.0
23 50
98
06.67
0. 89
4,415
13 16
23. 50
108
85 0
3. 87
Hev. 9, 07/85
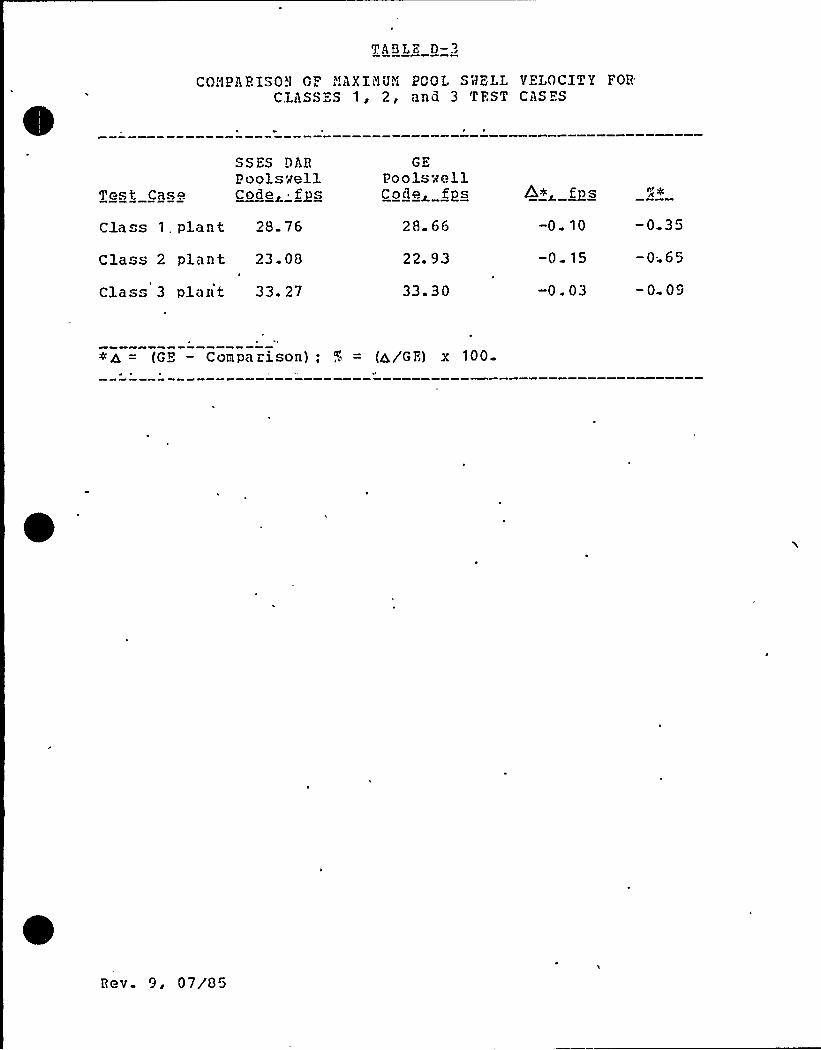
TABLE D-3
COl'1PA P. ISO."1 GF l1AXINUN POOL S'rlELL VELOCITYFOH'LASSES1, 2, and 3 TFST CASES
Test Case
SSES DAHPools'sellCode fps
GEPools:dwell
Code ZDs=C. ~as
C1ass 1, plant 28 76
Class 2 plant 23.08
Class 3 plant 33. 27
28. 66
22. 93
33. 30
-0 10
-0 15
-0. 03
-0 35
-Q. 65
-0 09
[GE — Comparison); '5 = (~/GF) x 100
Bev. 9, 07/05
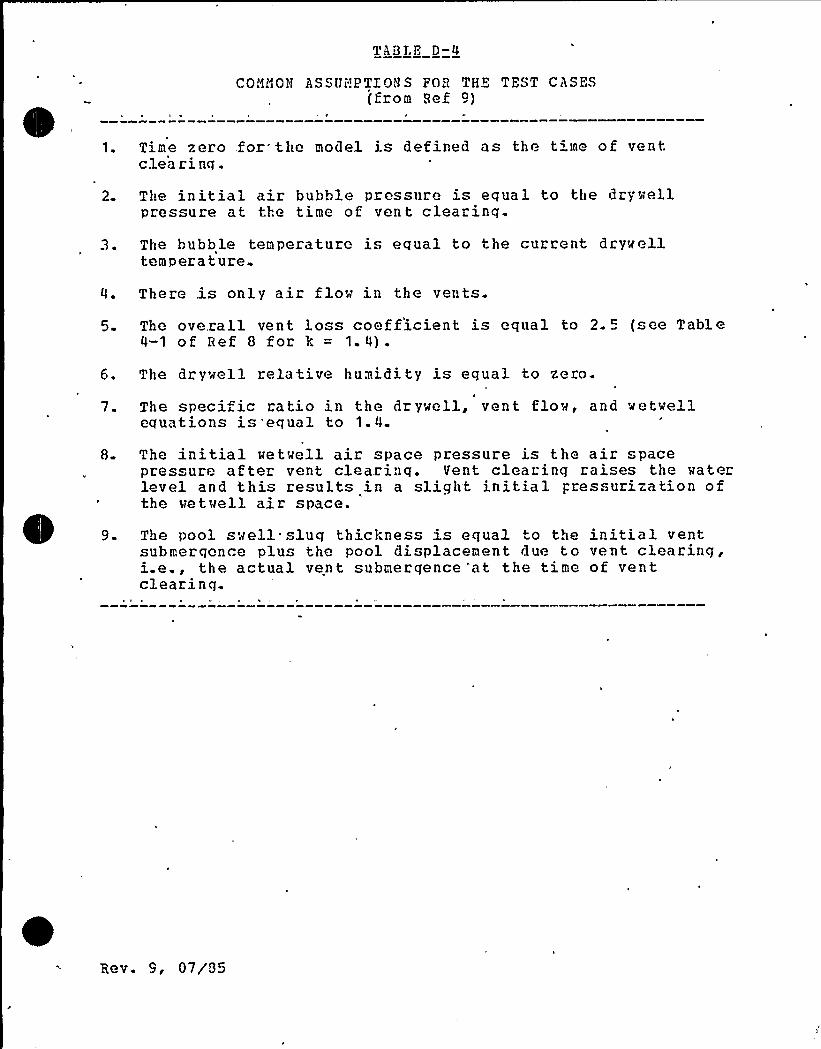
CO.'!>~ON AS Ski!PTT OH S FOB THE TEST CASES(from Bef 9)
1. Time zero .for- the model is defined as the t me of ventclea ring.
2. The initial air bubble pressure is equal to the drywellpressure at the time of ven t clearinq.
3. The bubble temperature is equal to the current drywelltemperature
4. There .is only air flow in the vents.
5. The ove.rail vent loss coefficient is equal to 2. 5 (see Table4-1 of Ref 0 for k = 1.4).
6. The drywell relative humidity is equal to zero.
7. The specific ratio in the drywell, vent flow, and wetwellequations i" 'equal to 1.4.
8. The initial wetwell air space pressure is the air spacepres ure af ter vent clearinq. Vent clearing raises the waterlevel and this results in a slight initial pressurization ofthe we t well ai r space.
9. The pool swell slug thic):ness is equal to the initial ventsubmergonce plus the pool displacement due to vent clearing,i.e., the actual vent submerqence "at the time of ventclearing
Rev. 9, 07/95
APPENDIX E
REACTOR 6 CONTROL BUZLDZNG DESj:GN ASSESSMENT
TABLE GF CONTFNTS
E 1 BEACTOB AND CONTROL BUZLDXNG STBUCTUHAL DFSEGN ASSHSSNENT
Hev. 9, 07/85
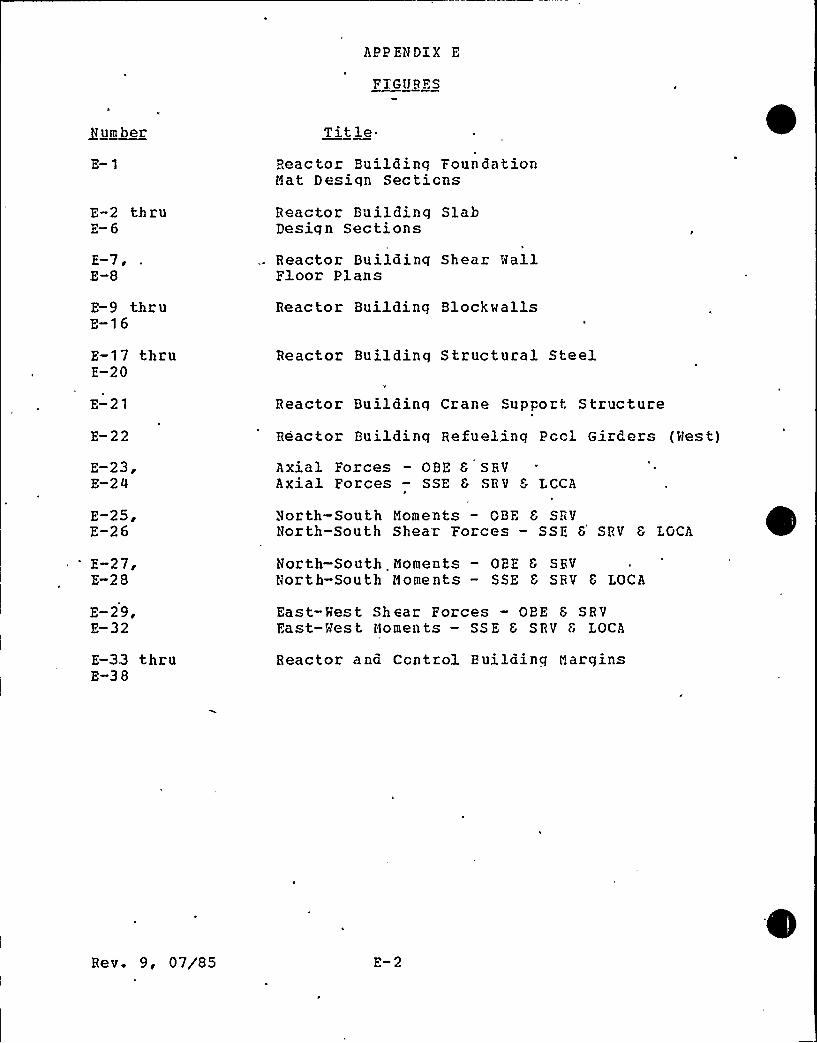
APP ENDiX E
FIGURES
Number
E-2 thruE-6
E-7,E-8
E-9 thr uE-16
TitleReactor Buildinq FoundationMat Desiqn Secticns
Reactor Building SlahDesign Sections
Reactor Buildinq Shear (<allFloor Plans
Reactor Building Blockwalls
E-17 thruF-20
Reactor Buildinq Structural Steel
E-21
E-22
E-23,E-2 4
Reactor Buildinq Crane Support Structure
Reactor Buildinq Refuelinq Pccl Girders (>lest)
Axial Forces — OBE 6*
SRVAxial Forces — SSE 6 SRV 6 LCCA
E-25,E-26
Vorth-South Moments — GBE 6 SRVNorth-South Shear Forces — SSE 6 SRV 6 LOCA
E-27,E-28
North-South Moments — OBE 6 SRVNorth-South Moments — SSE 6 SRV 6 LOCA
E-29,E-32
East-Viest Shear Forces — OBE 6 SRVFast-Nest Moments — SSE 6 SRV 6 LOCA
E-33 thruE-3 8
Reactor and Ccntrol Buildinq Margins
Rev. 9, 07/85 E-2
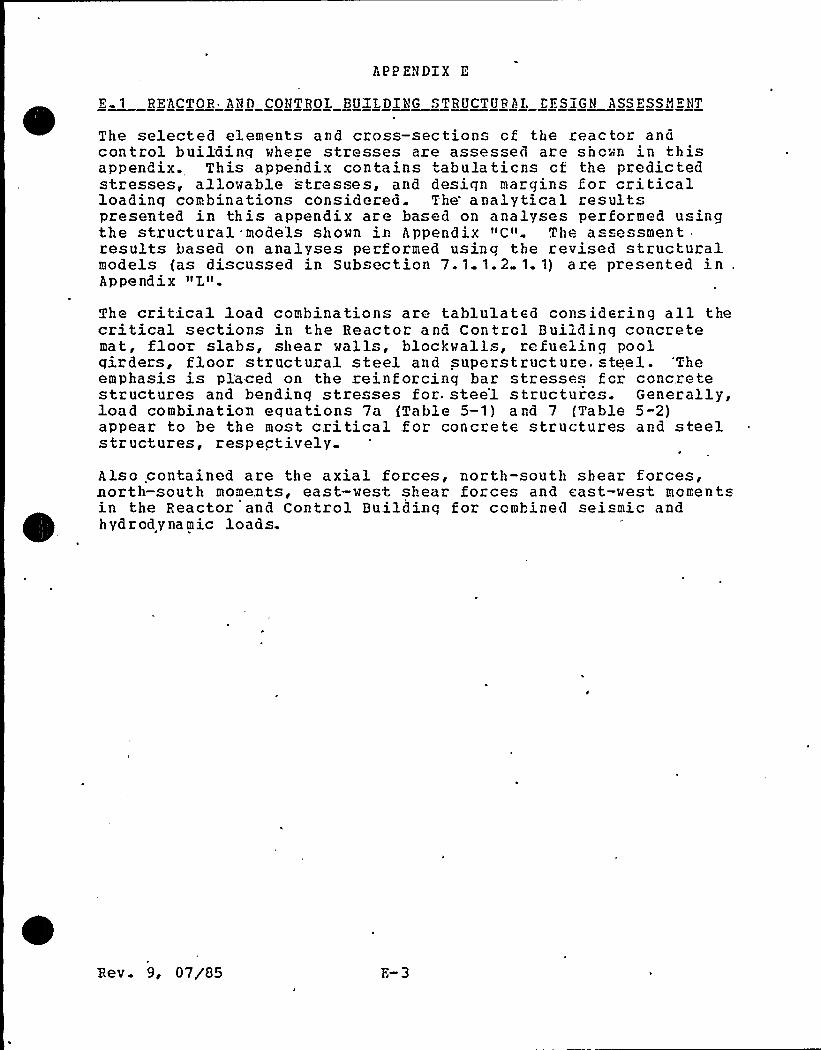
APP ENDIX E
E 1 RE'ACTOR Ahull CONTROI; BUILDING STRUCTURAL CESiGN ASSESSMENT
The selected element~ and cross-sections cf the reactor andcontrol buildinq where stresses aze assessed are shcwn in thisappendix. This appendix contains tabulaticns cf the predictedstresses, allowable stresses, and design margins for criticalloadinq combinations considered. The analytical resultspzesented in this appendix are based on analyses pezformed usingthe structural models shown in Appendix "C". The assessmentresults based on analyses performed usinq the revised structuralmodels {as discussed in Subsection 7. 1 1. 2 1. 1) aze presented inAppe nd ix "I.".
The critical load combinations are tablulated considering all thecritical sections in the Reactor and Control Building concretemat, floor slabs, shear walls, blockwalls, refuelinq poolqirders, floor structural steel and superstructure. steel. 'Theemphasis is placed on the reinforcinq bar stresses for concretestructures and bendinq stresses for. stee'1 structures. Generally,load combination equations 7a {Table 5-1) and 7 (Table 5-2)appear to be the most critical for concrete structures and steelstructures, respectively
Also contained are the axial forces, north-south shear forces,north-south moments, east-west shear forces and cast-vest momentsin the Reactor and Control Buildinq for combined seismic andh ydr od y na mic loads.
Eev 9, 07/85 E-3
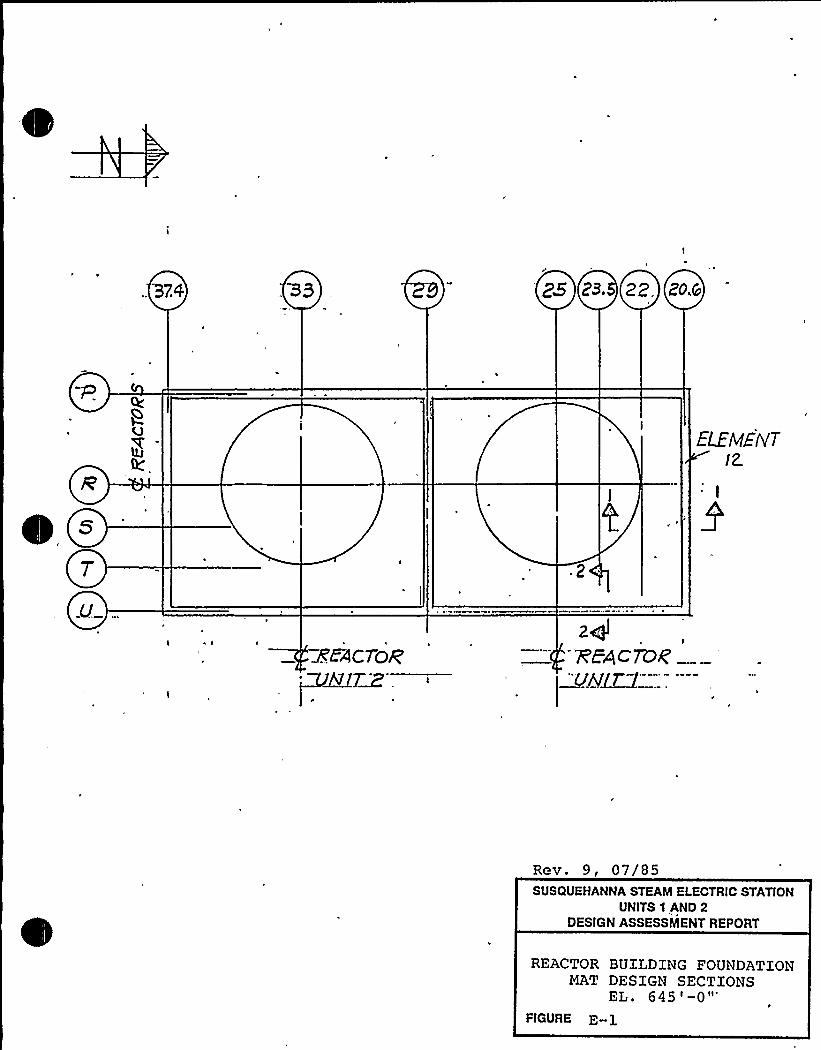
ZS Z9. 22. ZO.&
ELEMENTIZ.
jvN
zQ9+C7DQF7
Rev. 9, 07/85SUSQUEHANNA STEAM ELECTRIC STATION
UNITS 0 AND 2DESIGN ASSESSMENT REPORT
REACTOR BUILDING FOUNDATIONMAT DESIGN SECTIONS
EL.645I-0"'IGURE
E-l
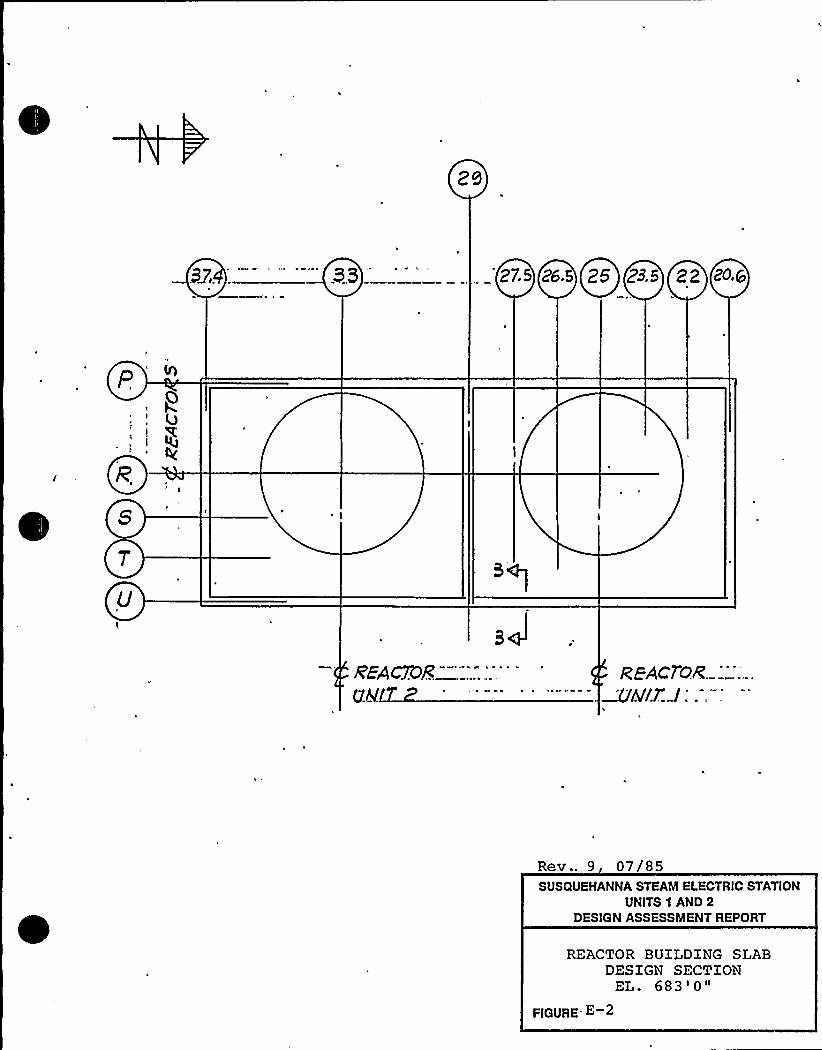
93 ' '27.5 Zg.S 25 Z9.5 22 ZO.@
Rev .. 9 07/85SUSQUEHANNA STEAM ELECTRIC STATION
UNITS 1 AND 2DESIGN ASSESSMENT REPORT
REACTOR BUILDING SLABDESIGN SECTION
EL. 683'0"FIGURE- E-2
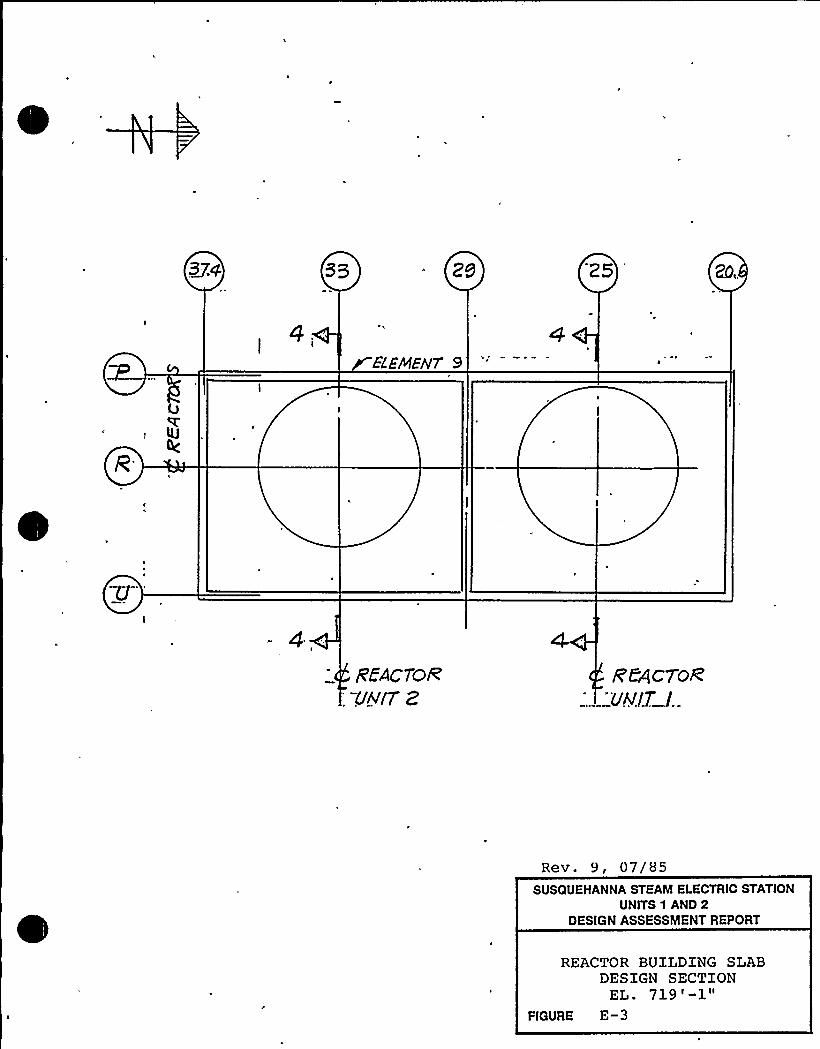
c$
r BREMEN'
4REACTOR
: O'@f7 2RCAc7oR'uat2
l..
Rev. 9, 07/85SUSQUEHANNA STEAM ELECTRIC STATION
UNITS 1 AND 2DESIGN ASSESSMENT REPORT
REACTOR BUILDING SLABDESIGN SECTION
EL. 719I-1"FIGURE E-3
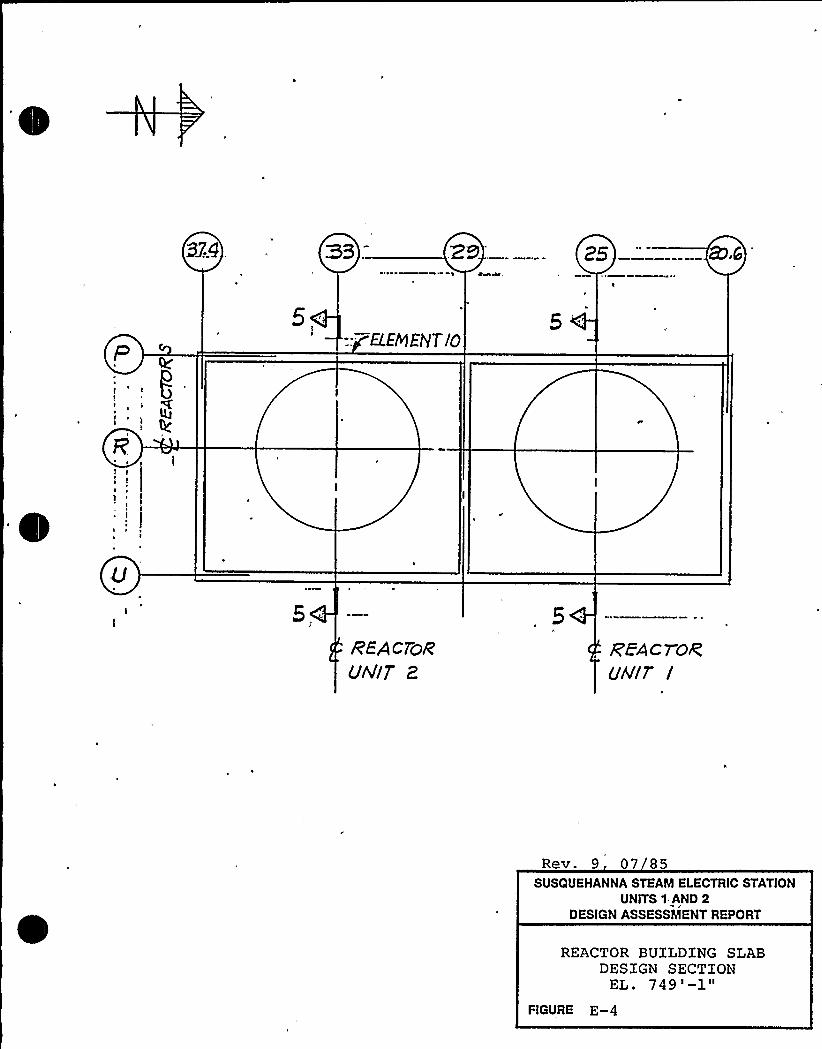
5!R'ZACrOCVrt//T /
Rev. 9 07 85SUSQUEHANNA STEAM ELECTRIC STATION
UNITS 1 AND 2DESIGN ASSESSMENT REPORT
REACTOR BUILDING SLABDESIGN SECTION
EL. 749'-1"FIGURE E-4
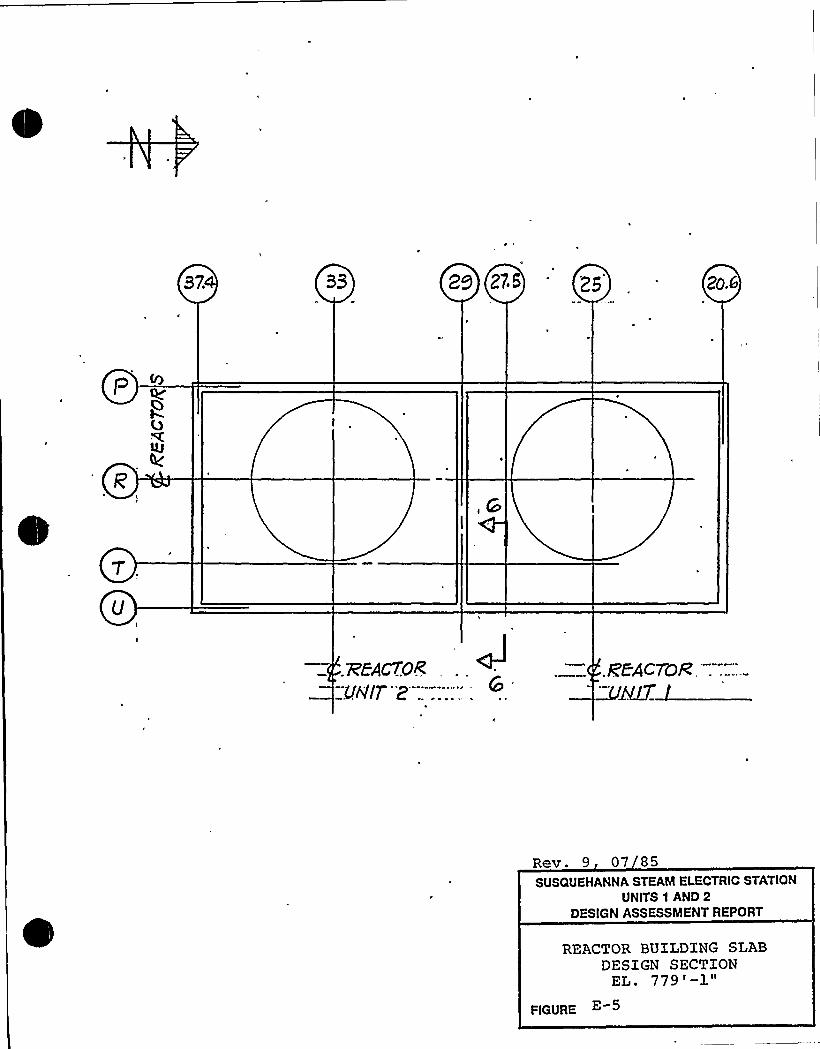
Rev. 9 07/85SUSQUEHANNA STEAM ELECTRIC STATION
UNITS 1 AND 2DESIGN ASSESSMENT REPORT
REACTOR BUXLDXNG SLABDESIGN SECTXON
EL. 779'-1"
FIGURE E
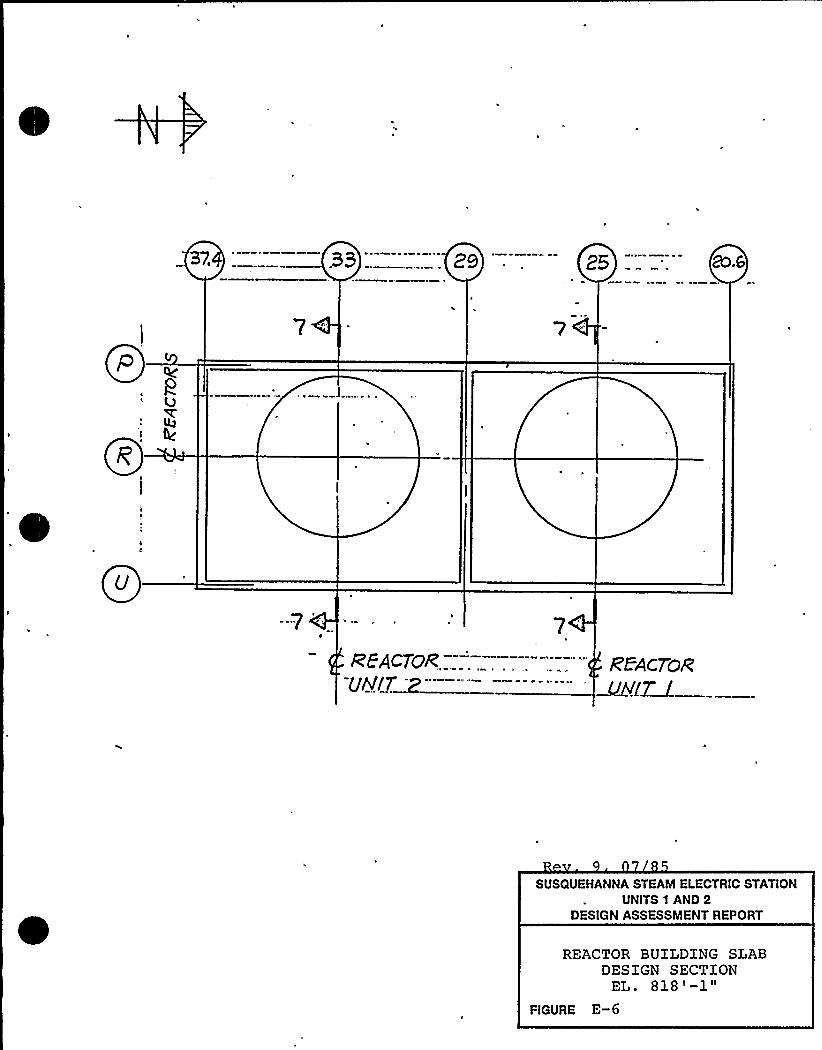
29 . 25 R).6
REAGToR~le
SUSQUEHANNA STEAM ELECTRIC STATIONUNITS 1 AND 2
DESIGN ASSESSMENT REPORT
REACTOR BUILDING SLABDESIGN SECTION
EL. 818'-1"FIGURE E-6
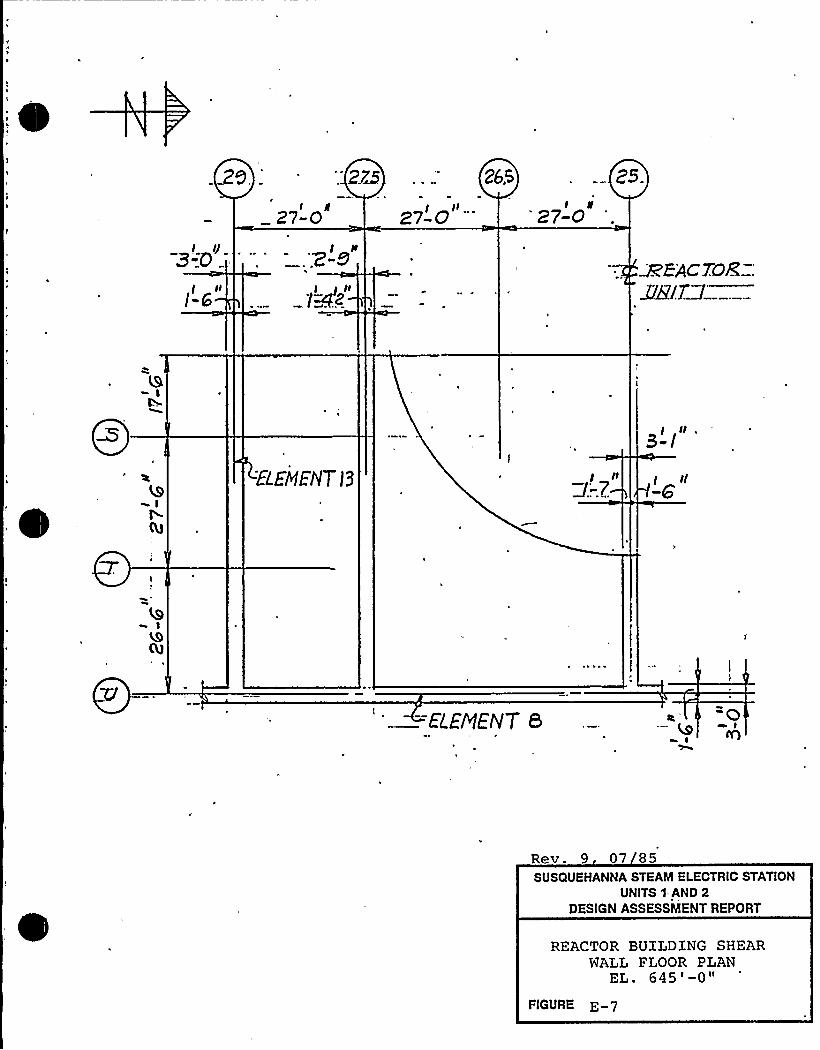
27-0
Rev. 9 07 85SUSQUEHANNA STEAM ELECTRIC STATION
UNITS 1 AND 2DESIGN ASSESSMENT REPORT
REACTOR BUXLDXNG SHEARWALL FLOOR PLAN
EL. 645'-0"FIGURE E-7

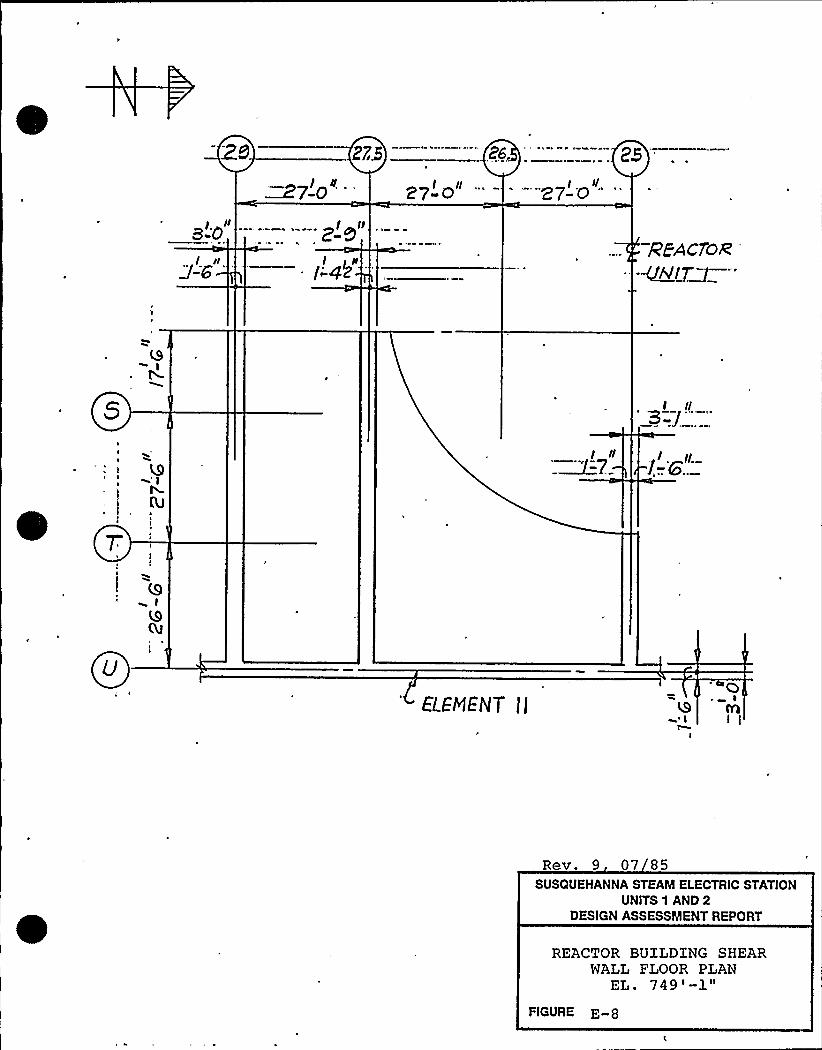
Z7$'" ""
86,"" '""
2g
7-0 27-o '-Z7-0 " "
lt25REAcloR
- -~iv/7~
.@III
ELEMENT lf
Rev. 9 07 85SUSQUEHANNA STEAM ELECTRIC STATION
UNITS 1 AND 2DESIGN ASSESSMENT REPORT
REACTOR BUILDING SHEARWALL FLOOR PLAN
EL. 749 I -1"FIGURE E-8
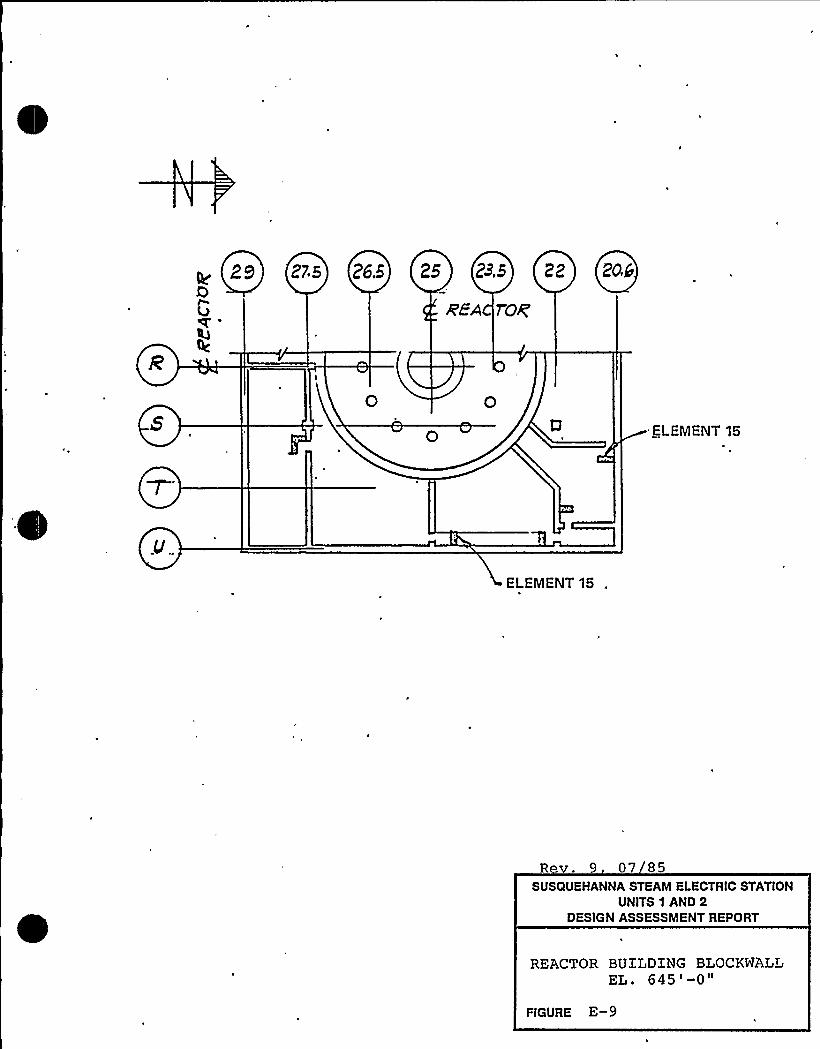
704
ELEMENT 15
ELEMENT 15
R v. 9 07 85SUSQUEHANNA STEAM ELECTRIC STATION
UNITS 1 AND 2DESIGN ASSESSMENT REPORT
REACTOR BUILDING BLOCKWALLEL. 645'-0"
FIGURE E- 9
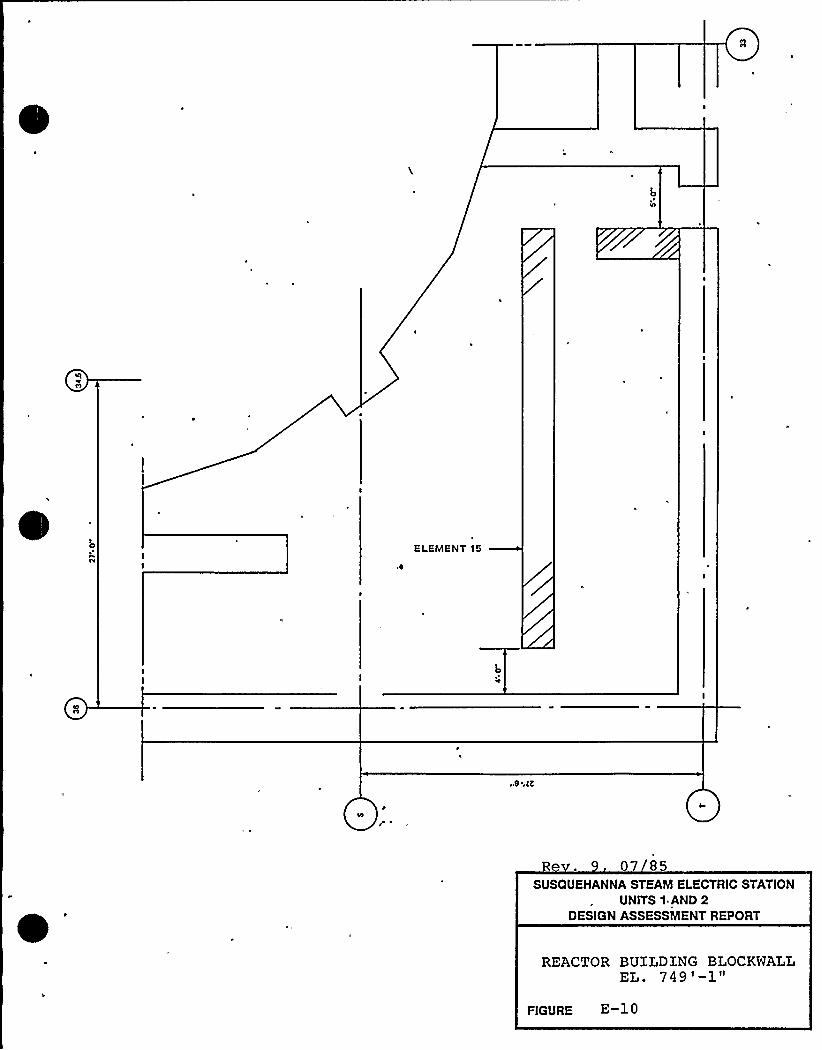
ELEMENT 15
R . 07 85SUSQUEHANNA STEAM ELECTRIC STATION
UNITS 1 AND 2DESIGN ASSESSMENT REPORT
REACTOR BUILDING BLOCKWALLEL. 749'-1"
FIGURE E- 1 0
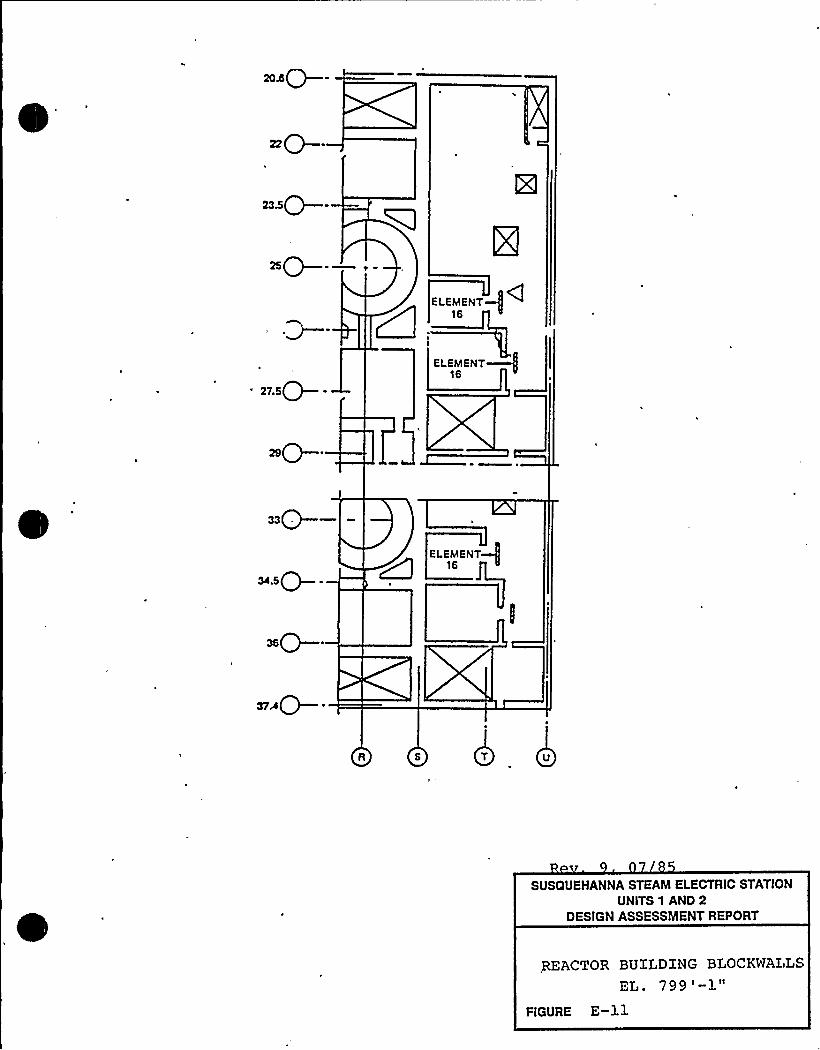
235
ssQ —.—ELEMENT/~
16
27.5
ELEMENT16
ssQ—
sc.sQ —.ELEMENT
16
b
SUSQUEHANNA STEAM ELECTRIC STATIONUNITS 1 AND 2
DESIGN ASSESSMENT REPORT
REACTOR BUILDING BLOCKWALLS
EL. 799'-1"FIGURE E-ll
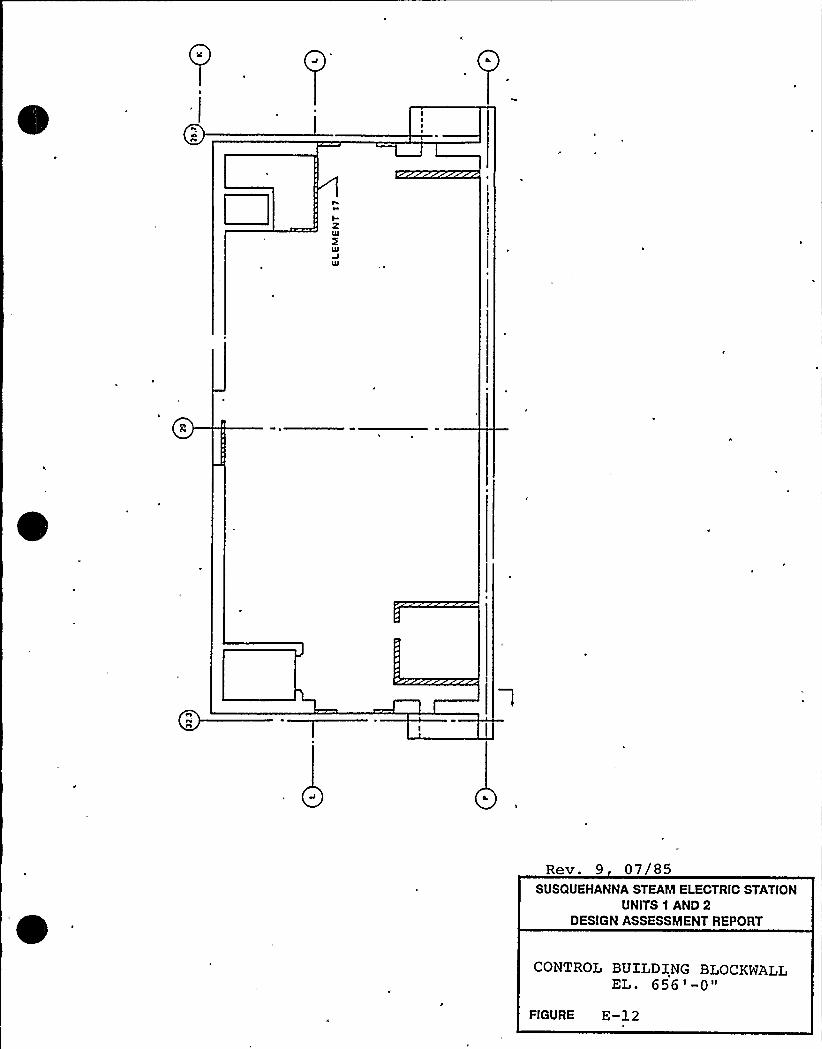
Rev. 9 07/85SUSQUEHANNA STEAM ELECTRIC STATION
UNITS 1 AND 2DESIGN ASSESSMENT REPORT
CONTROL BUILDING BLOCKWALLEL. 656I-O"
FIGURE E-12
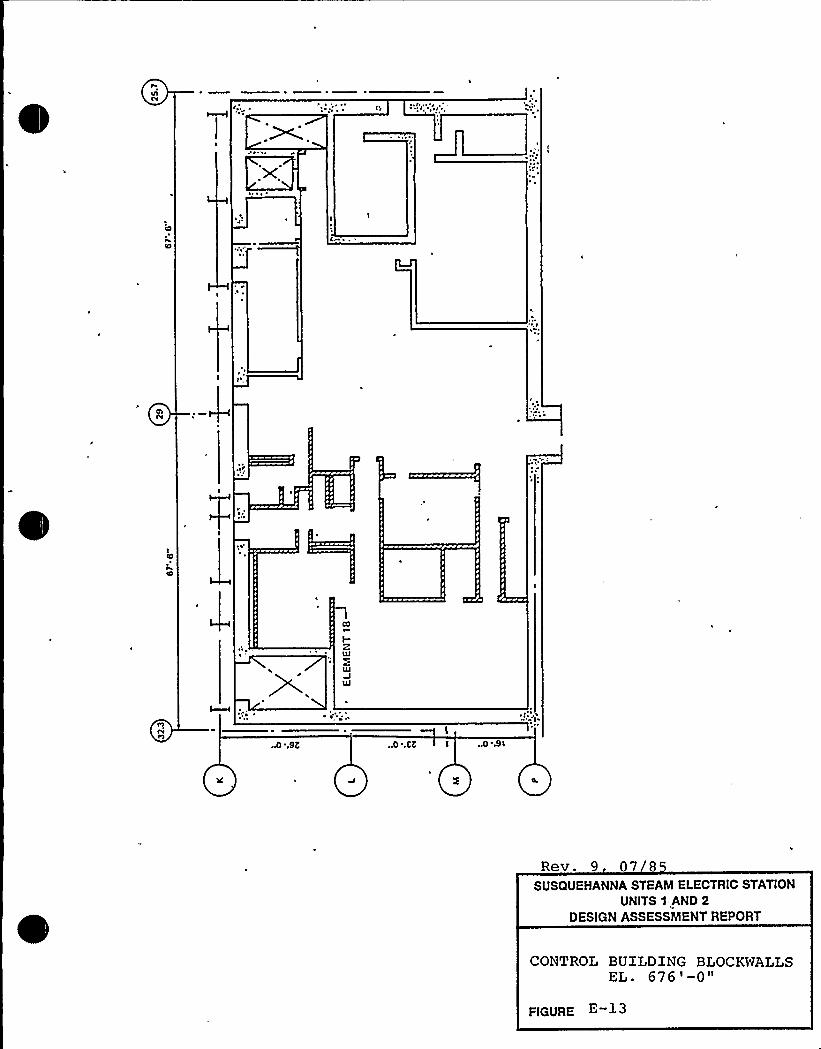
Rev. 9 0 8
SUSQUEHANNA STEAM ELECTRIC STATIONUNITS 1 AND 2
DESIGN ASSESSMENT REPORT
CONTROL BUILDING BLOCKWALLSEL. 676I-0"
FIGURE
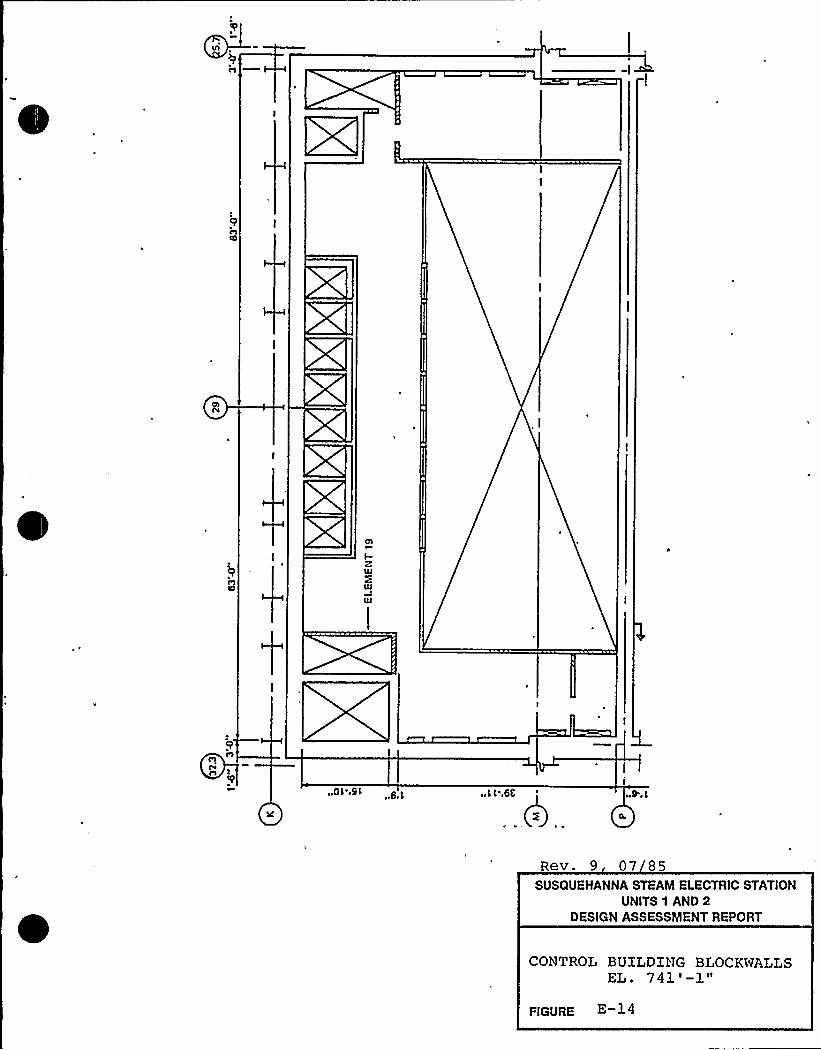
Rev. 9 07 SS
SUSQUEHANNA STEAM ELECTRIC STATIONUNITS 1 AND 2
DESIGN ASSESSMENT REPORT
CONTROL BUILDING BLOCKWALLSEL. 741'-1"
P[GURE E-14
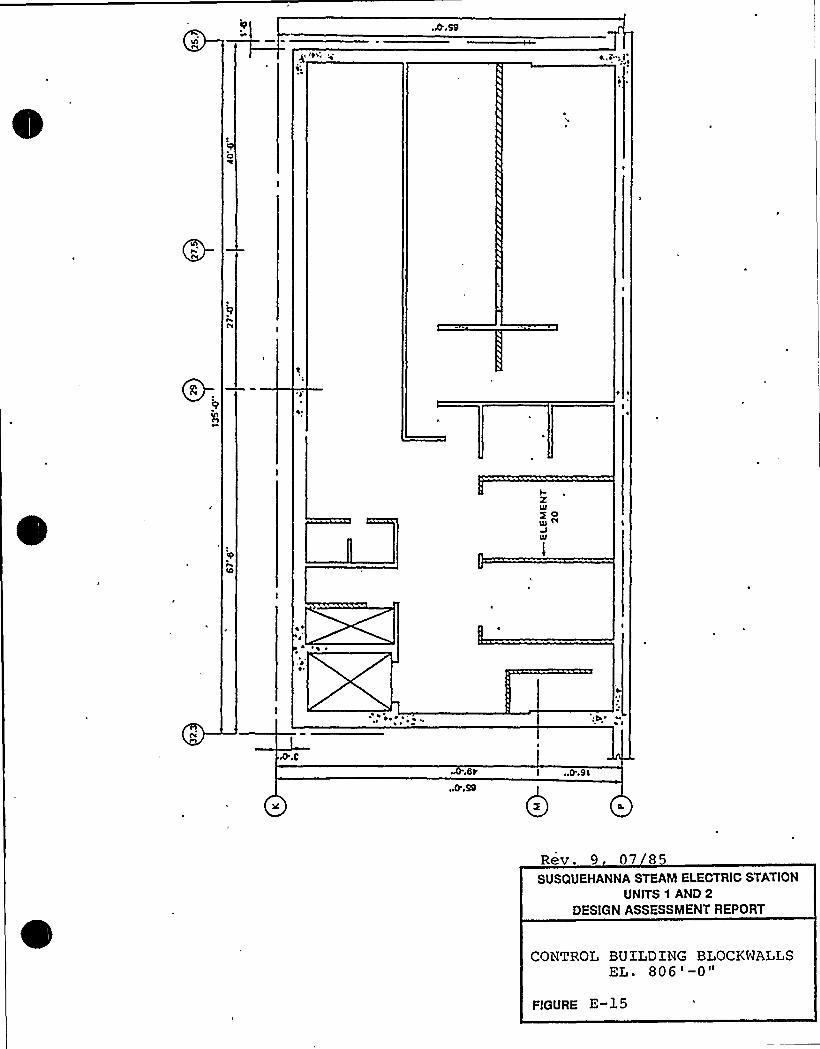
Rev. 9 07 8
SUSQUEHANNA STEAM ELECTRIC STATIONUNITS 1 AND 2
DESIGN ASSESSMENT REPORT
CONTROL BU ILDING BLOCKWALLSEL. 806'-0"
FIGURE E-15
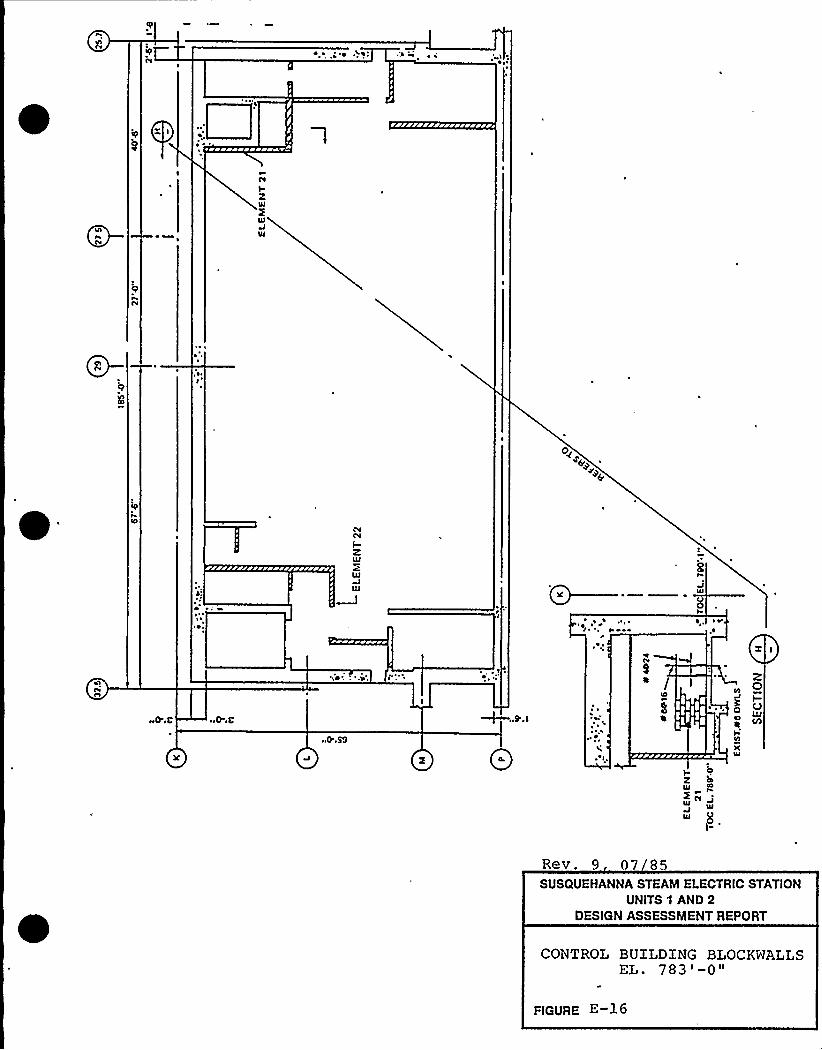
cv
0
g
, ~
t
CV
I-Z
0—~ ~ ~
~ ~
4
.J~,, ~ V
eeO'CoaI
X
z0I-OM
2gg CO
NIU
I-
Rev. 9 07 85SUSQUEHANNA STEAM ELECTRIC STATION
UNITS 1 AND 2DESIGN ASSESSMENT REPORT
CONTROL BUILDING BLOCKY1ALLSEL. 783'-0"
FIGURE E-16
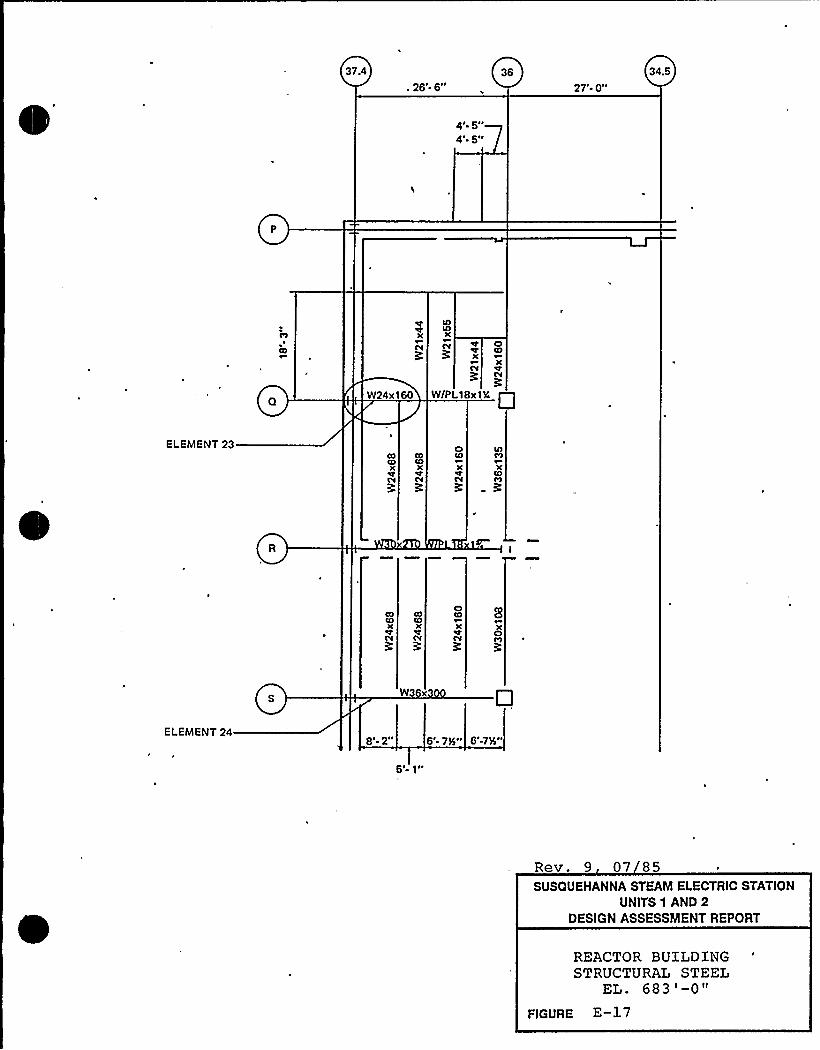
37.4
. 26'- 6"36
27'- 0"34.5
4t 5lt40 5it
COX
OCO
X
W24x160
EV
W/PL18 x1Y Q
ELEMENT 23COCPX
IN
COCOX
cv
oCD
XCV
lA
XEOt9
R
XO
p
W3 x
ELEMENT 2421 ~ 6'- 7'" 6'-7S"
5t 1it
Rev. 9 07 85SUSQUEHANNA STEAM ELECTRIC STATION
UNITS 1 AND 2DESIGN ASSESSMENT REPORT
REACTOR BUILDINGSTRUCTURAL STEEL
EL. 683'-0"FIGURE E-17

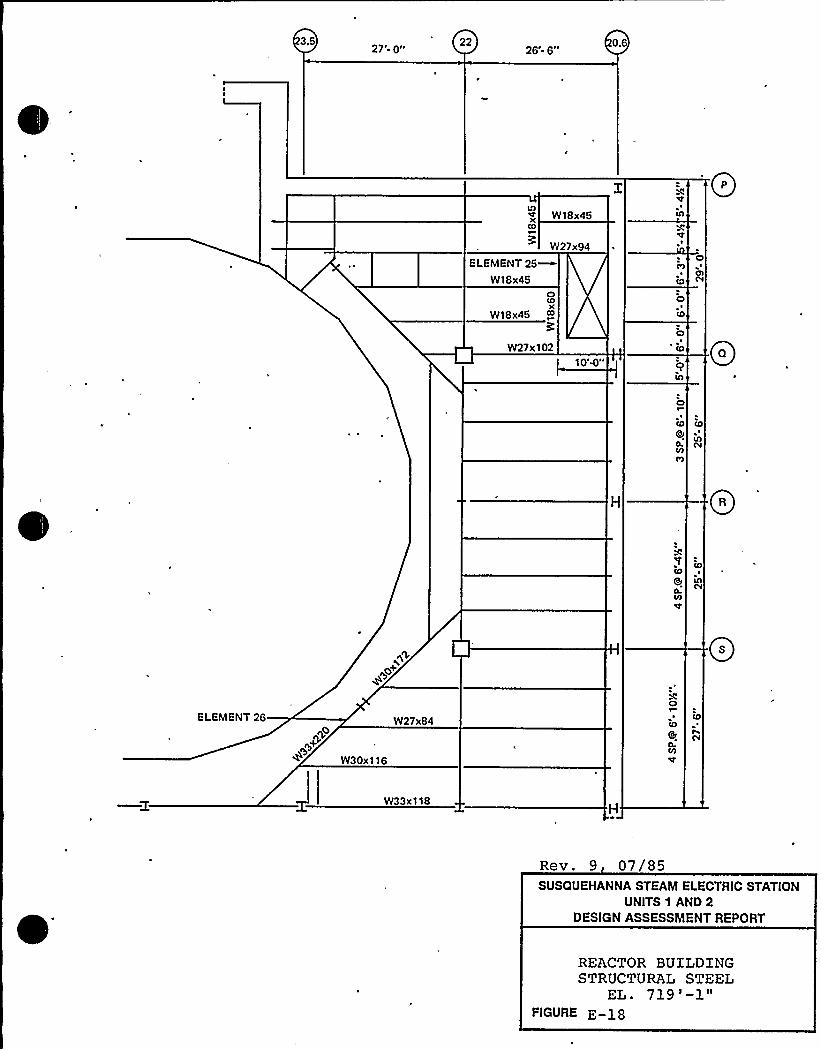
3.5 27'18 2226r 61 ~
0.6
CO
XCO
W18x45
W27x94
CO
ELEMENT 25~W18x45
oX
W18x45 co
W27x10210'4"
CO
CO
oCO
o
h
0oCO
QpO.CO
C9
CO
CO
0CO
O-CO
CO
CON
ELEMENT 260
gb+W30x116
W27x84
oCO
OCO
CO
W33x118
Rev. 9 07/85SUSQUEHANNA STEAM ELECTRIC STATION
UNITS 1 AND 2DESIGN ASSESSMENT REPORT
REACTOR BUILDINGSTRUCTURAL STEEL
EL. 719'-l"FIGURE E-l8
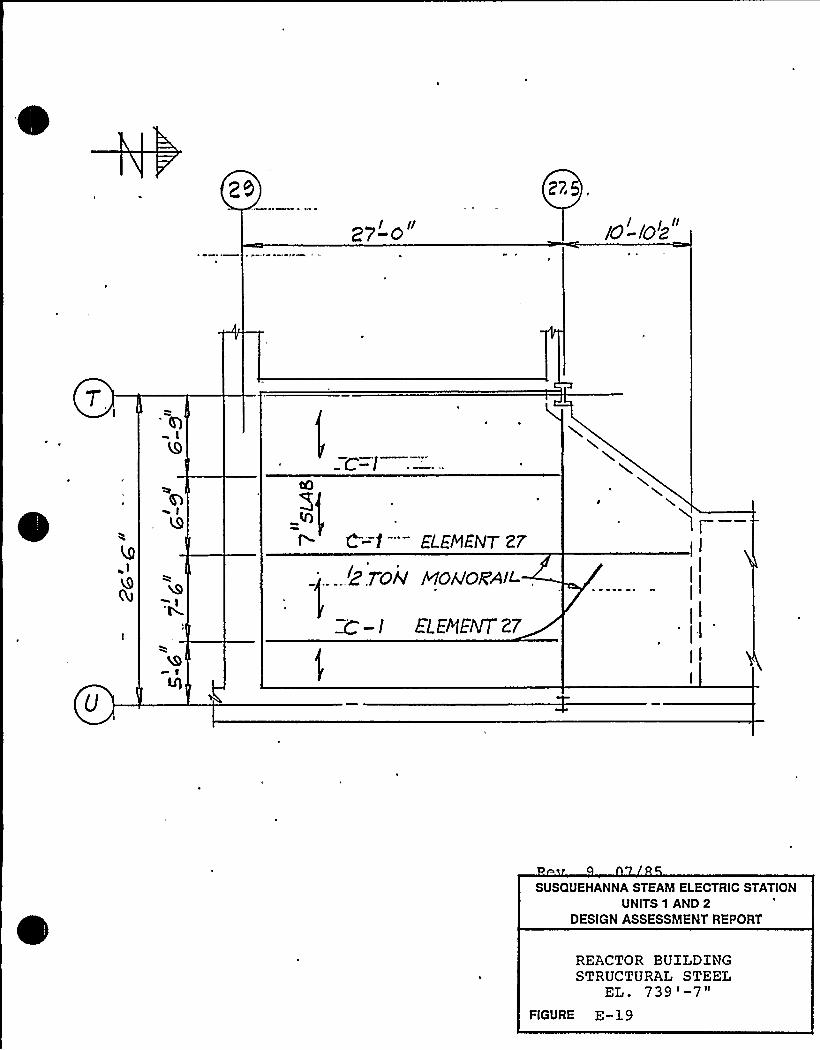
Z9 27-0'7. tO'-lO'z"
:c=l
C=f — ELEMENT zT
......iZ.raiV Moo'oVAa-
M-t ELEREAIT27
il
iI
ilI
I
SUSQUEHANNA STEAM ELECTRIC STATIONUNITS 1 AND 2
DESIGN ASSESSMENT REPORT
REACTOR BUILDINGSTRUCTURAL STEEL
EL. 739'-7"FIGURE E-19
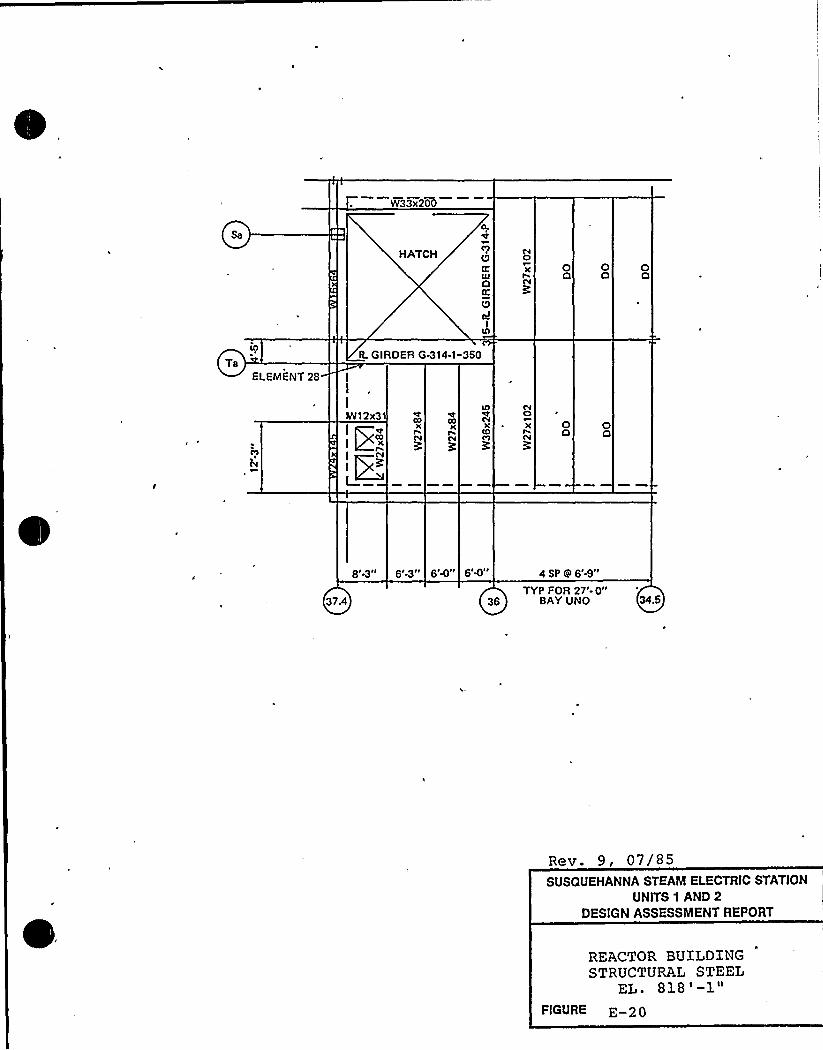
W33x200
HATCH UK0KUcd
I
00 00 00
TaELEMENT 28
IL GIRDER G-314-1-350
I
I
I
Lhfl2x31COX
rCV
COlC
CY
LA
XCDCl
EVClX
CY
00 00
Bi 3lt Bt 3ii 6I+lt BI+I~
4 SP CI 6'-9"
37.4TYP FOR 27'-0"
36 BAY UNO
Rev. 9, 07/85SUSQUEHANNA STEAM ELECTRIC STATION
UNITS 1 AND 2DESIGN ASSESSMENT REPORT
REACTOR BUILDINGSTRUCTURAL STEEL
EL.FIGURE E-20
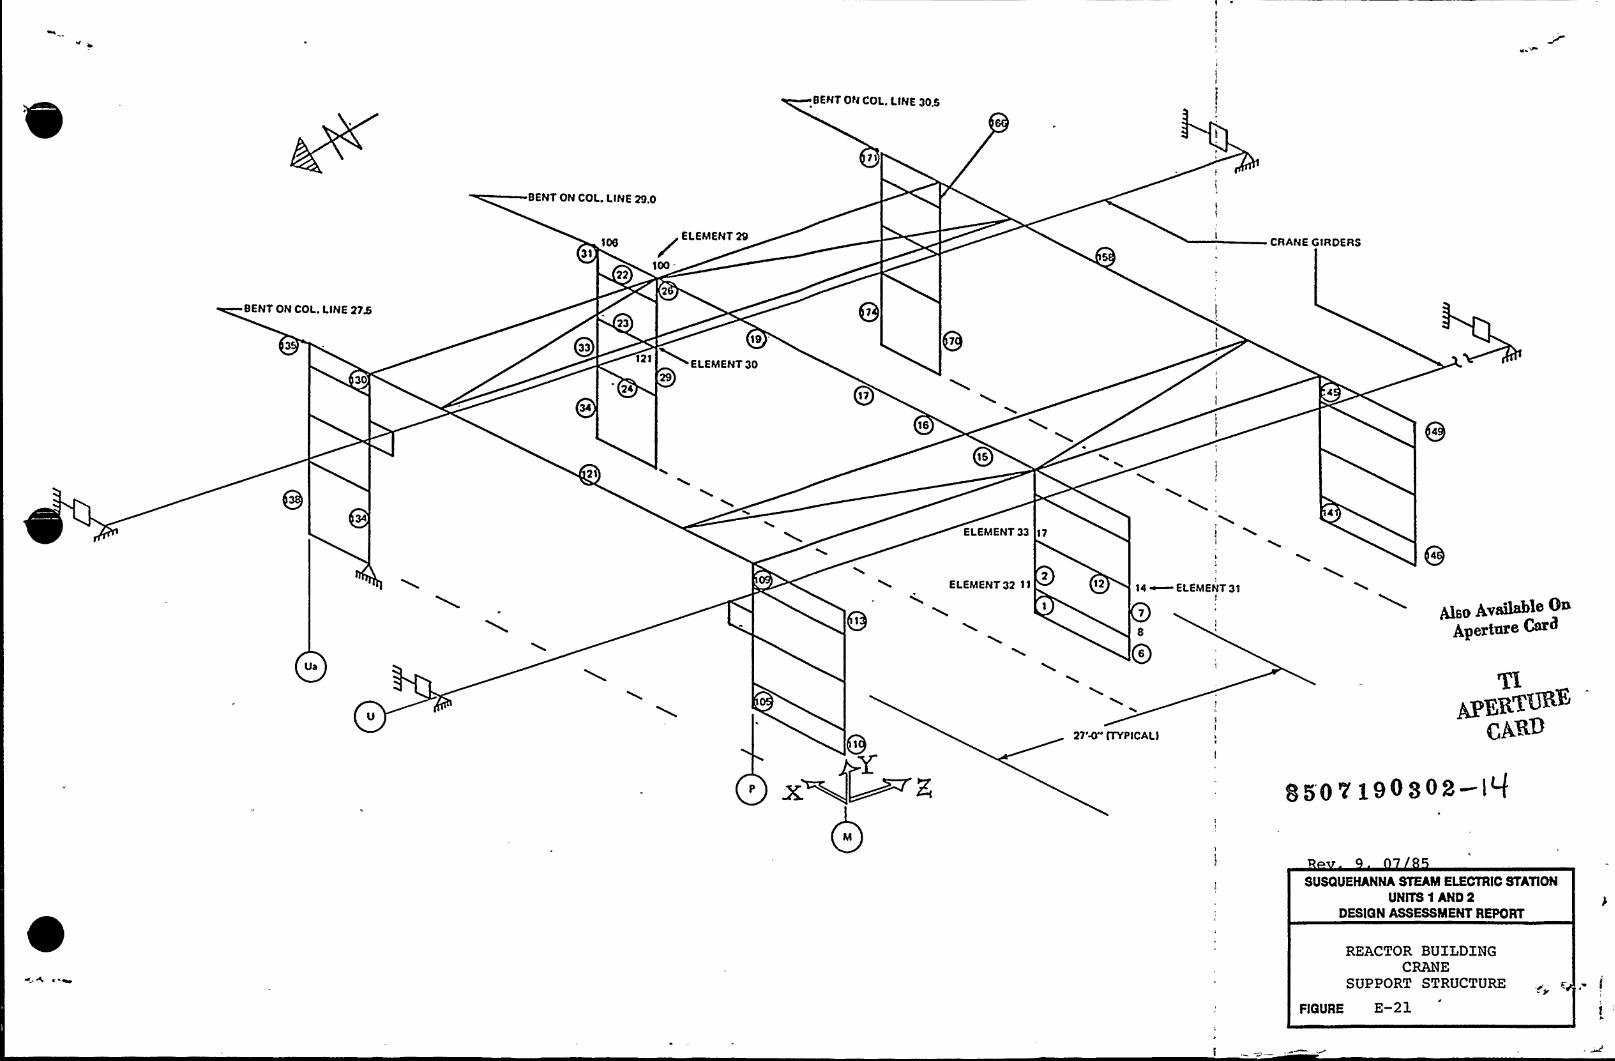
BENT ON COL. I.INE 305
71
BENT ON COL. LINE 29.0
31
22
ELEMENT 29
IM
CRANE GIRDERS
BENT ON COL. LINE 27$
30
23
24
121
19 '
ELEMENT3029
011
16
ELEMENT 33 17
ELEMENT32 11 12 14 ~ ELEMENT 31t
@q0 p~gghhle On
Aperture C
Ua
27'N- tTYPICAL)
850Vy90808-l f
SUSQUEHANNA STEAM ELECTRIC STATIONUNITS 1 AND 2
DESIGN ASSESSMENT REPORT
REACTOR BUILDINGCRANE
SUPPORT STRUCTURE
FIGURE E-2l

0 0
rigy
l
IE
f5 4
p ~11
F p
I ~
jM
~op
J'$
1
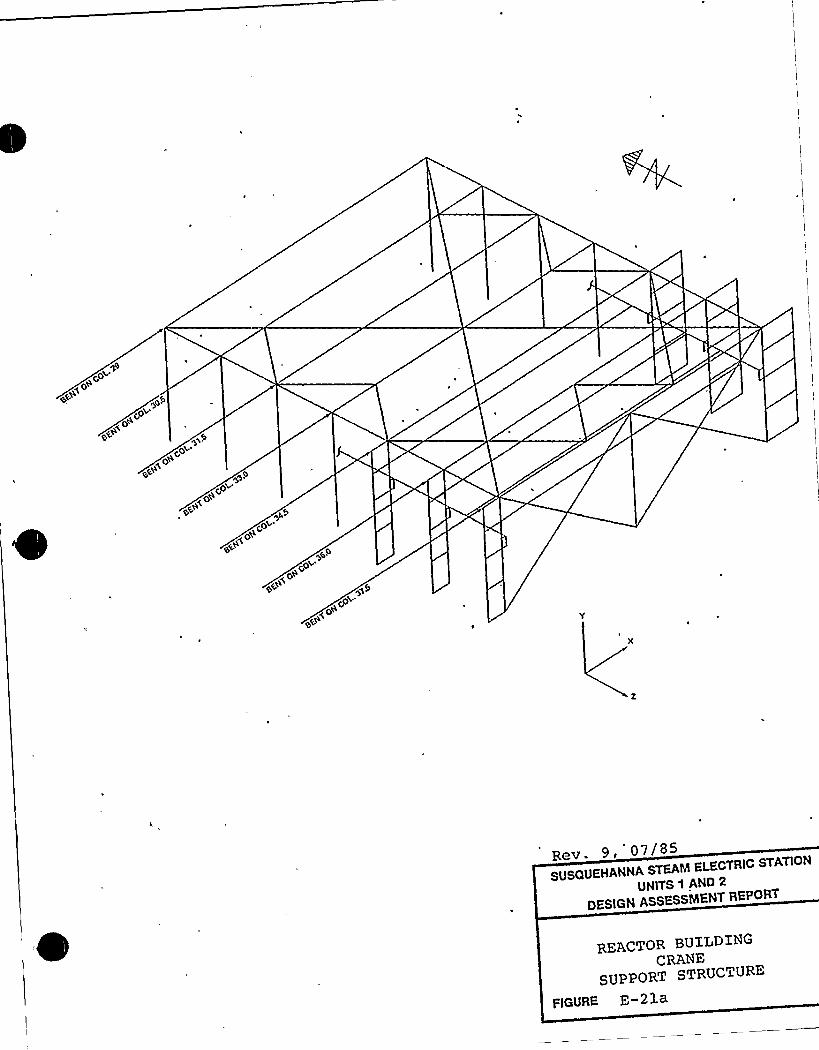
pov~o+
yV~o+
pVo+
el%ed&
o"'pvpQ
Rev. 9,"07/85SUSQUEHANNA STEAM ELECTRIC STATION
UNITS 1 AND 2
DESIGN ASSESSMENT REPORT
REACTOR BUXLDXHGCRANE
SUPPORT STRUCTURE
FIGURE E-21a
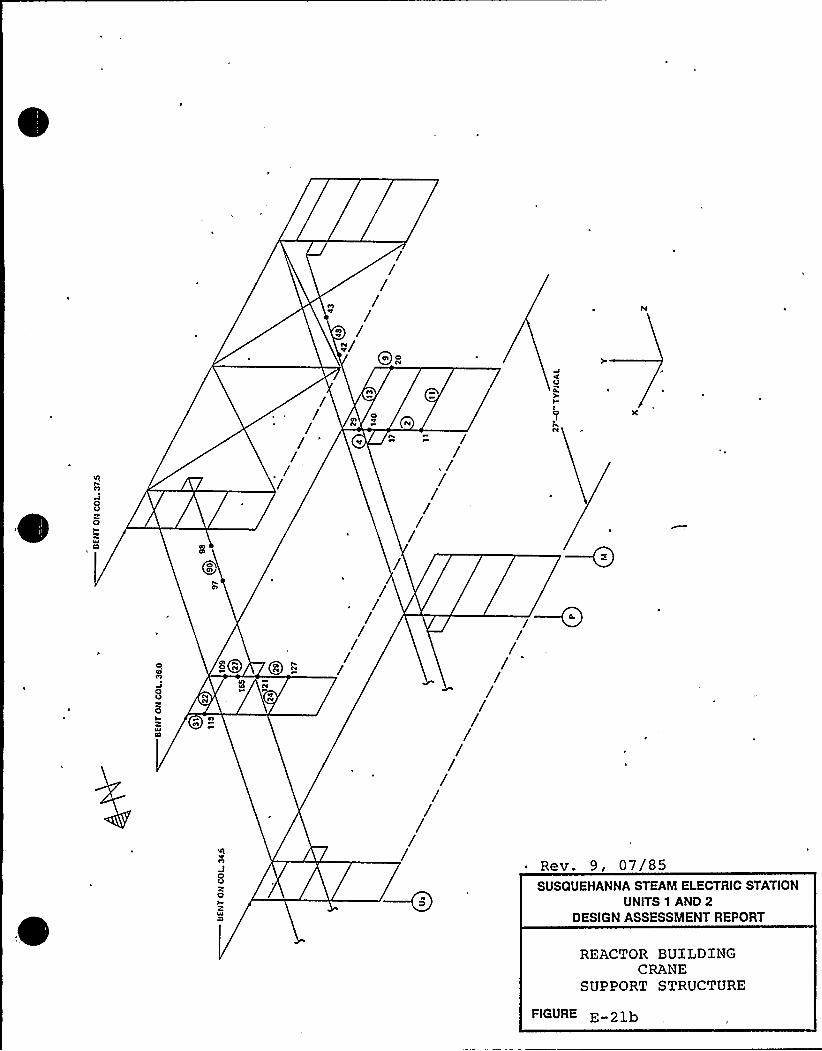
///////
////////
//////// Rev. 9, 07/85
SUSQUEHANNA STEAM ELECTRIC STATIONUNITS 1 AND 2
DESIGN ASSESSMENT REPORT
REACTOR BUXLDXNGCRANE
SUPPORT STRUCTURE
FIGURE E-21b
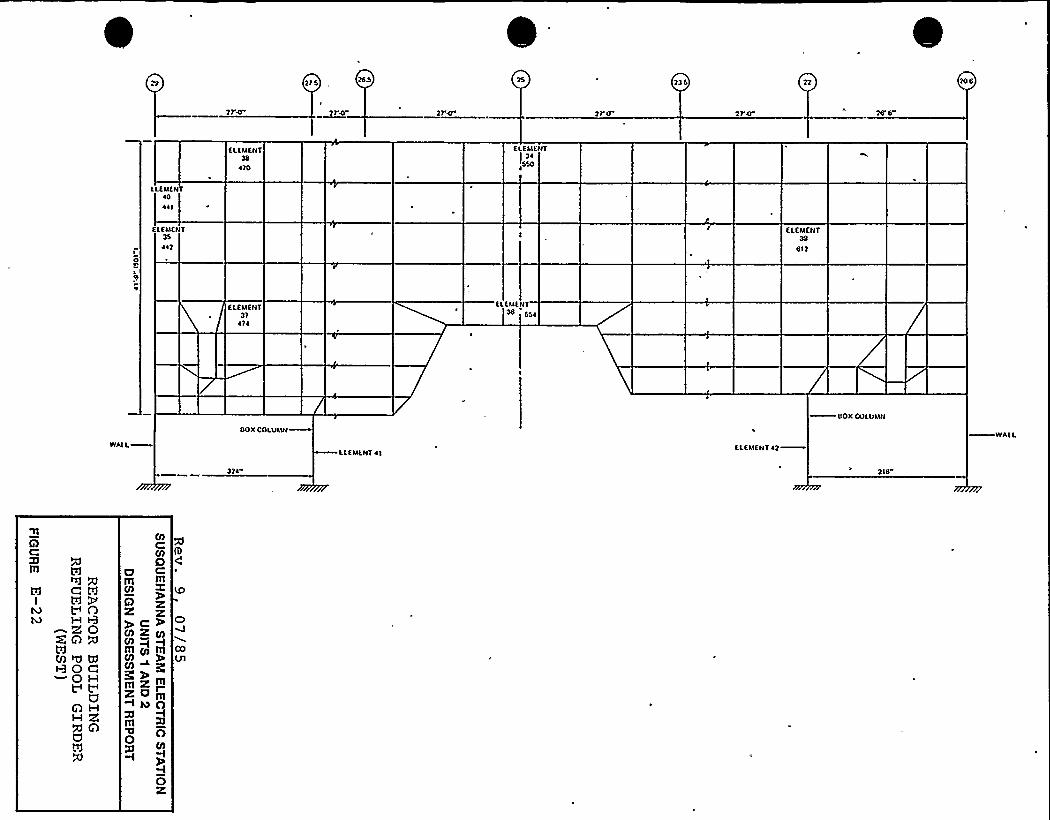
215 235
2r4" 21'0 2r4r 2ra 2r4 26'
ELEMENT38
410
ELELIENT
550
LEMENT40
441
LELIEN
442
ELEMENT39
612
ELEMENT32
414
ELEMEN36
T
554
WAIL
8OX COLVLIN
ELEMENT ~ IELEMENT 42
8OX COLULIN
WALL
324" 218
A
Ill
C tdI VO
~4 QgApMrCI RRQC
Q H
a9 H
> QU
03
0)0om m
A2'e>COD glm g Ill03
03
IllmK I2'<mISOpm
O02
I0X
C)
CX3
Ul
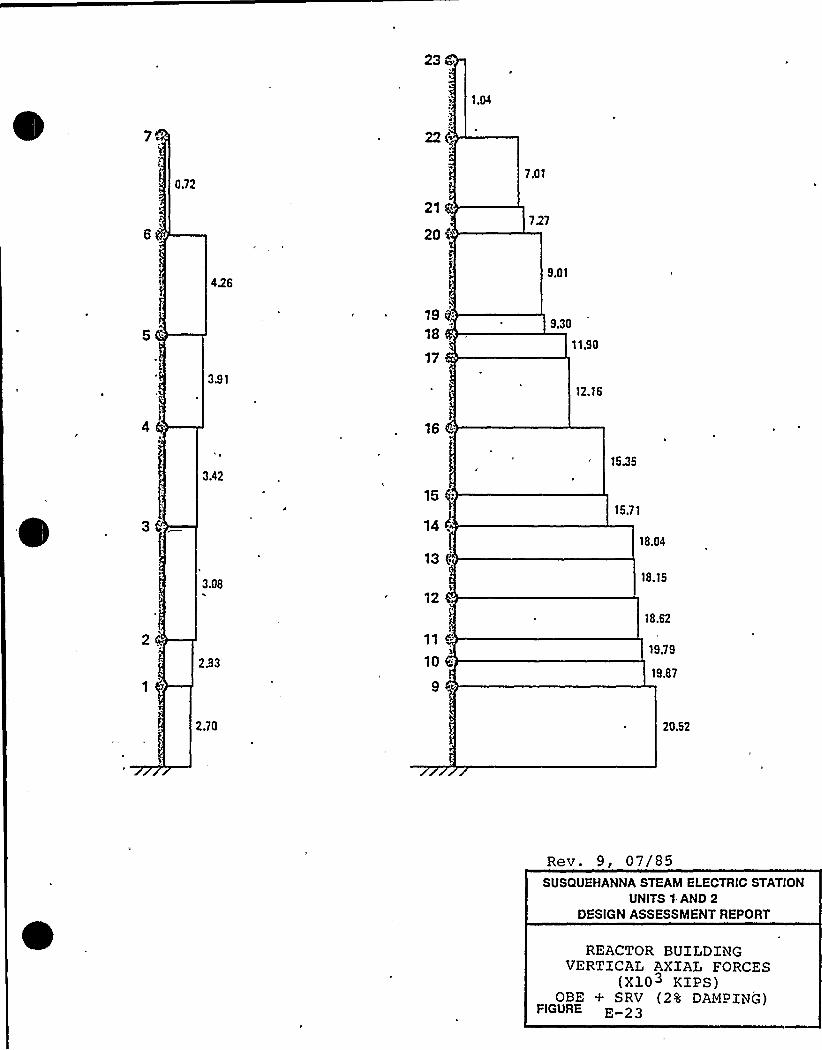
23
w'.72
21
20
7.01
727
4269.01
3.91
19
18
17
9.30
11.90
12.I6
16
3.42
3.08
15
14
13
15.35
15.71
18.04
18.15
18.62
233 1019.79
19.87
2.70
Rev. 9, 07/85SUSQUEHANNA STEAM ELECTRIC STATION
UNITS 1 AND 2DESIGN ASSESSMENT REPORT
REACTOR BUILDINGVERTICAL AXIAL FORCES
(X103 KIPS)OBE + SRV (2% DAMPING)
FIGURE E-2 3
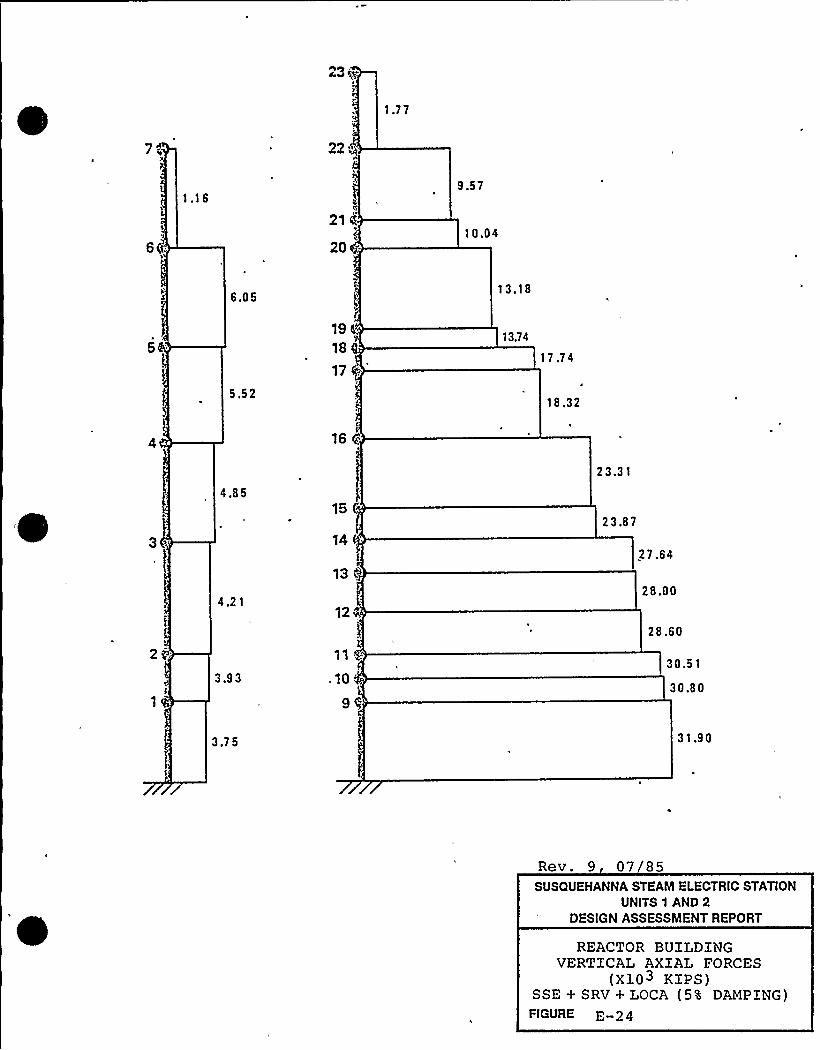
23 ~
1.77
9.57
21<
2010.04
13.18
19'8
17
13.74
17.74
18.32
16
23.31
1523.87
13 i~
12.
11
.10
9g
27.64
28.00
28.60
30.51
30.80
31.90
Rev. 9 07 85SUSQUEHANNA STEAM ELECTRIC STATION
UNITS 1 AND 2DESIGN ASSESSMENT REPORT
REACTOR BUILDINGVERTICAL AXIAL FORCES
(X103 KIPS)SSE + SRV+ LOCA (5% DAMPING)
FlGURE E 24
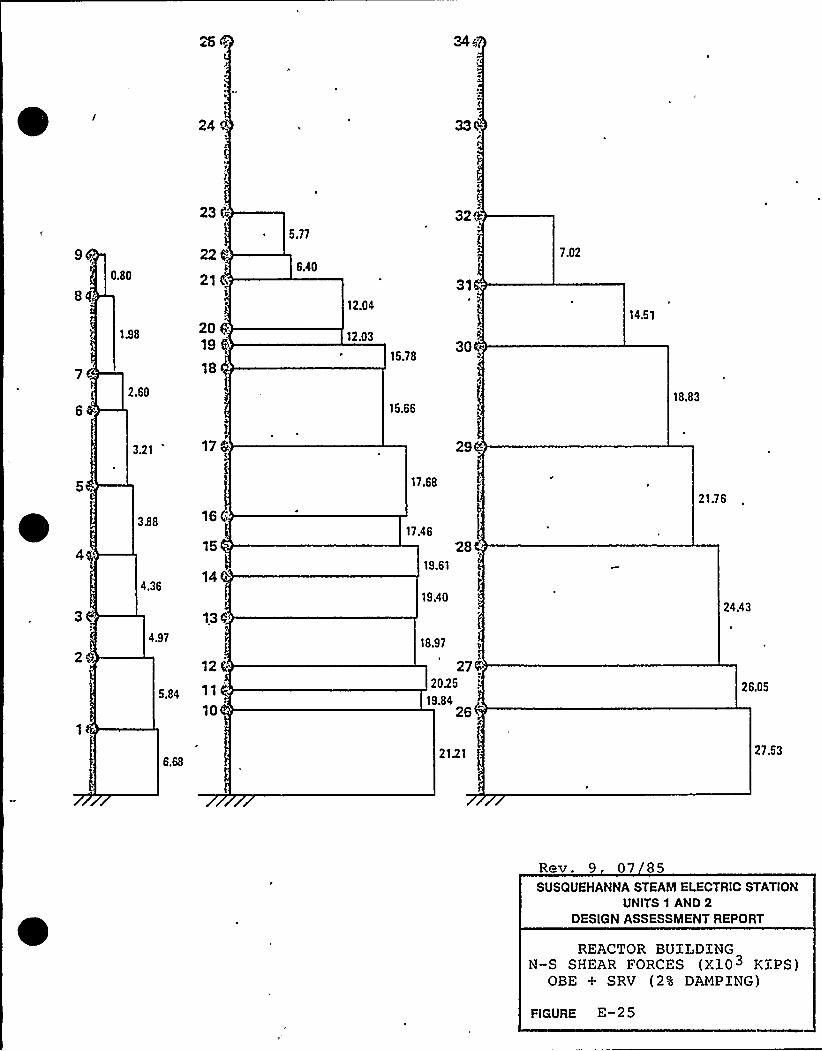
24
0.80
1.98
2.60
220
21,
20 f19
18
5.77
6.40
12.04
12.03
15.78
15.66
32~
31.
7.02
14.51
18.83
3.21 17 29 .:
338
4.36
16
1.3
17.68
17.46
19.61
19.40
28
'1.7624.43
4.97
12(;
5.84 11
10
18.97'7.2025
19.8426
26.05
2121 27.53
Rev. 9 07 85SUSQUEHANNA STEAM ELECTRIC STATiON
UNITS 1 AND 2DESIGN ASSESSMENT REPORT
REACTOR BUXLDXNGN-S SHEAR FORCES (Xl0 KEEPS)
OBE + SRV (2% DAMPING)
FIGURE E-2 5
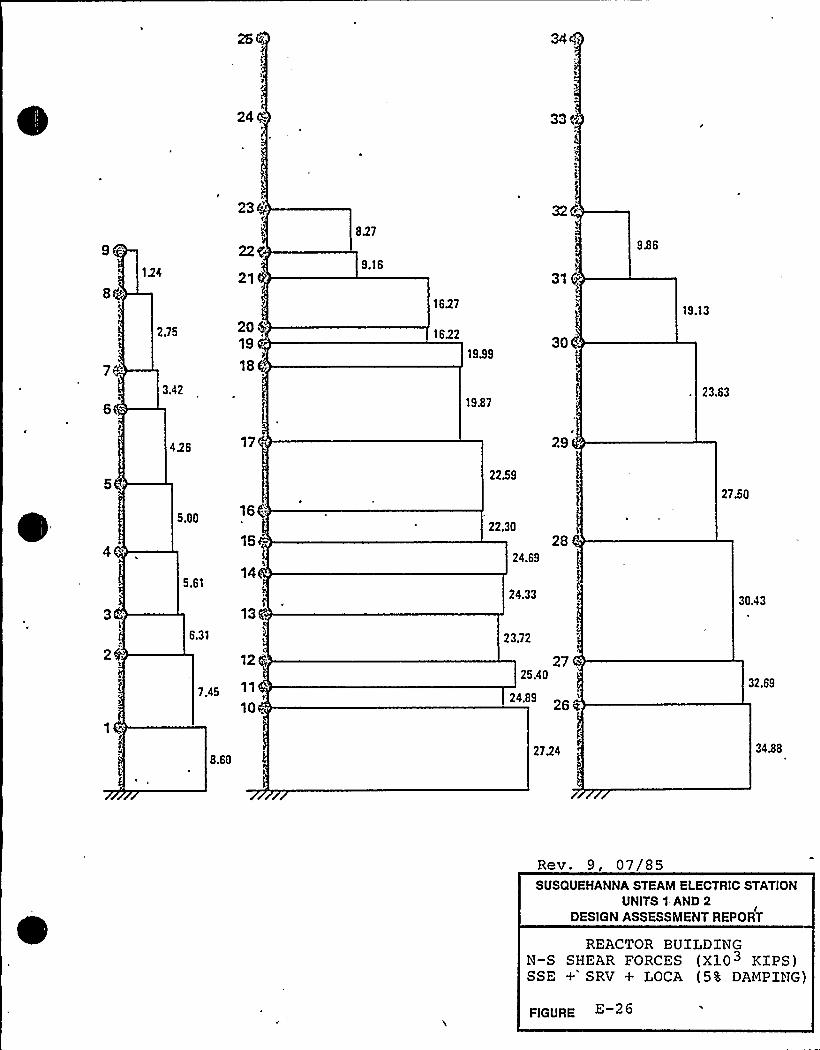
33(
124
2.75
3.42
23k
21
20 4r
19
18
827
9.16
1627
1622
1939
19.87
31
30
936
19.13
23.63
426
5.00
17.
16 ~
22.59
22.30
24.69
29
28 C
27.50
6.31
13
12
7.45
10
5.6114
24.33
23.72
2725.40
24.89
30A3
32.69
8.602724 3438
Rev. 9, 07/85SUSQUEHANNA STEAM ELECTRIC STATION
UNITS 1- AND 2DESIGN ASSESSMENT REPORT
REACTOR BUILDINGN-S SHEAR FORCES (X10 KIPS)SSE + SRV + LOCA (5% DAMPING)
PIGURE E-26
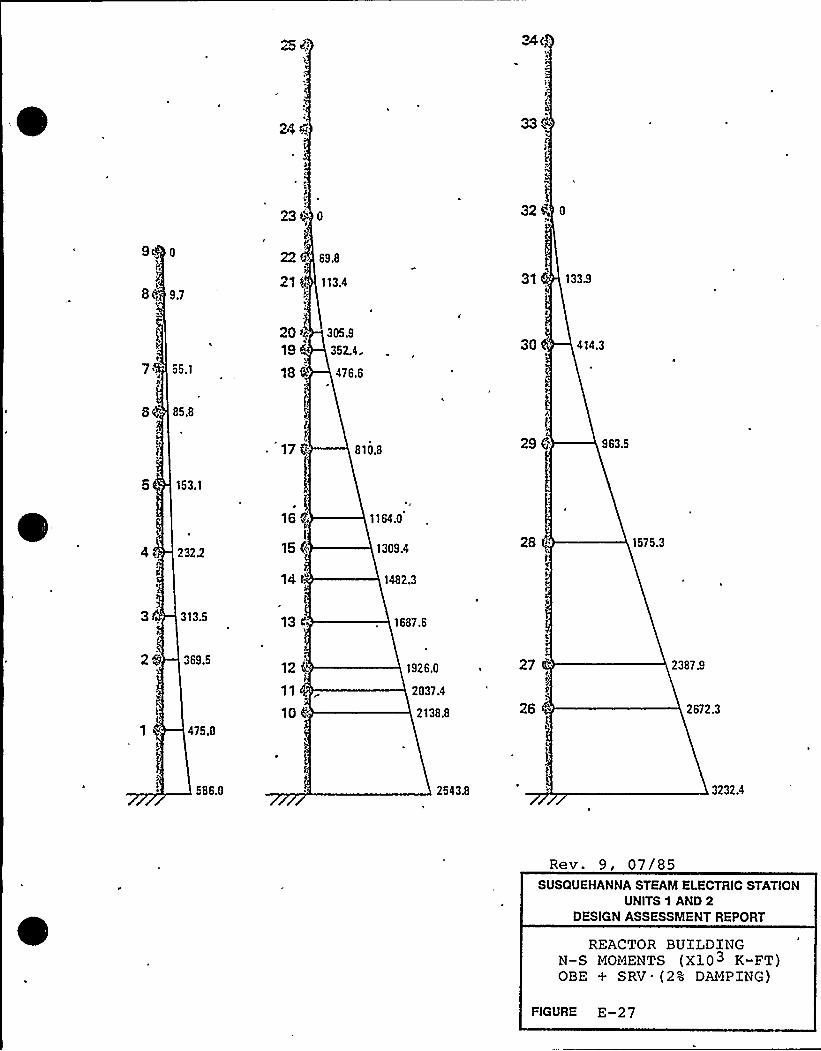
23~0 32@ 0
Skag 9.7
h
22 69.8
21 f, 113.4 31 1333
t7 lg 55.1
20 >4 305.9
19 352.4.
18 " 476.6
30 14.3
8; 85.8
153.1
17 0i'10.8 29 963.5
2322
160
15,
1164.0
1309.4
1482.3
1575.3
3 313.5 13 1687.6
369.5
1 w 475.0
12 4
11
10 '138.8 26
t
1926.0, 27
2037.4
2387.9
2672.3
586 0 2543.8 3232.4
Rev. 9, 07/85SUSQUEHANNA STEAM ELECTRIC STATION
UNITS 1 AND 2DESIGN ASSESSMENT REPORT
REACTOR BUILDINGN-S MOMENTS (X103 K-FT)OBE + SRV.(2% DAMPING)
FIGURE E-27
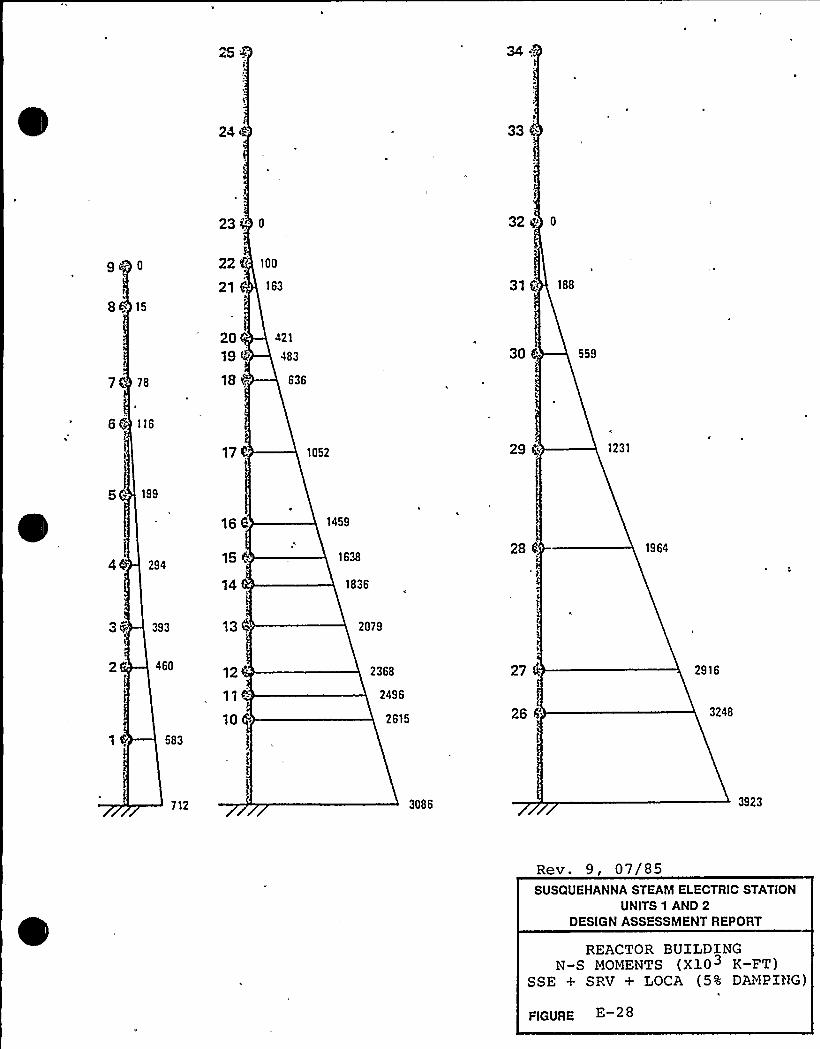
33
23, 0 32 0
9 0
8 „'5
22 4 100
163 31 C
I20 421
19 4 483 30 559
7 78 18, 636
6 116
17 1052 29 p1231
199
294
1459
1638
1836
28 0 1964
3@ 393 13 2079
2 460
583
10
2368
2496
2615
27
26
2916
3248
712 3086 3923
Rev. 9, 07/85SUSQUEHANNA STEAM ELECTRIC STATION
UNITS 1 AND 2DESIGN ASSESSMENT REPORT
REACTOR BUXLDINGN-S MOMENTS (Xl0 K-FT)
SSE + SRV + LOCA (5% DAi41PING)
FIGURE E-28
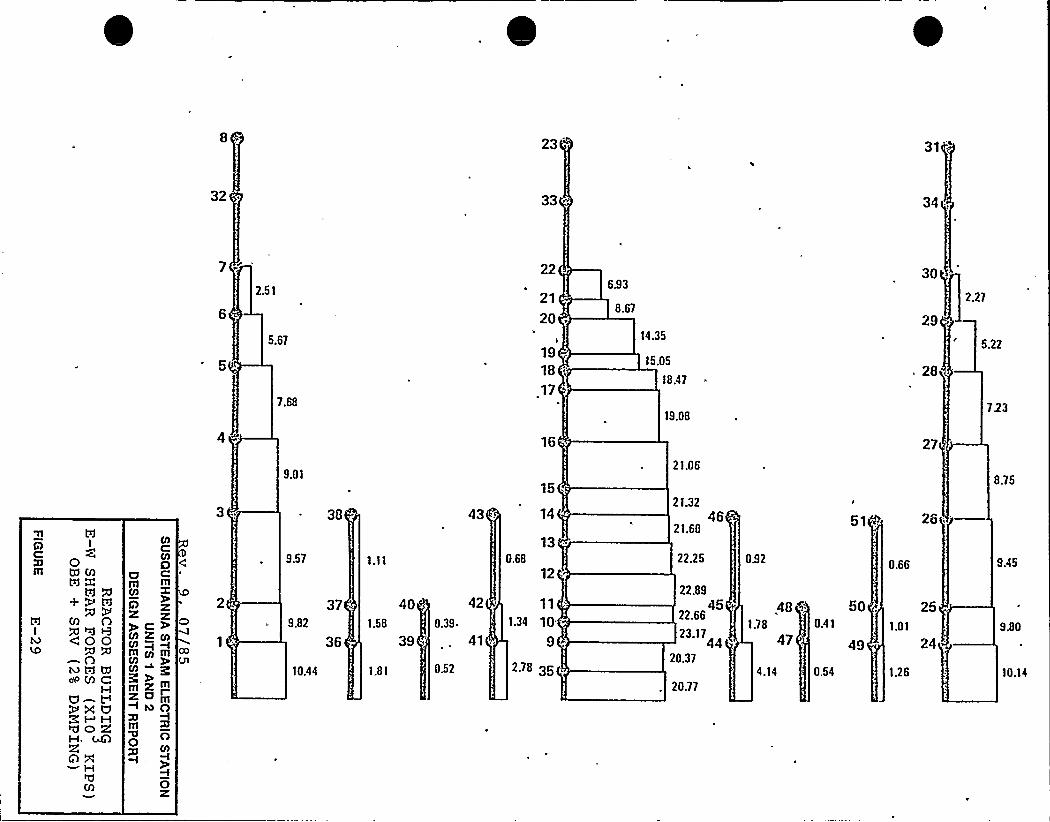
23
32 33 34
IZ0
tg M
h9 X+PA0) O
COO
MWb0@PM~
Ha-tNXUdOg
H- 4QRA 'A~H
CO
COOg Cm
AK Ky c- 2CO Z ~Sg+m~mN~~mm z ~m~~m+Nng7m0 n
Vl
0X
3
2.51
5.67
9.01
9.57
9.82
10.44
37-
361.58
1.81
40
390.39-
0.52
43
42
41
22
21
20 ~
I
19 .
18 r
.17
'6
0.68
14
13
12
11
1.34 10"
9.2.78 35
6.93
8.67
14.35
15.05
18.47
19.08
21.06
21.3246
21.60
22.25
22.89
4522.66
23.1744
20.37
20.77
032
1.78
47
4.14
0.41
0.54
51
50
0.66
1.01
1.26
30
27
26
24
'.27
5.22
723
8.75
9A5
9.80
10.14
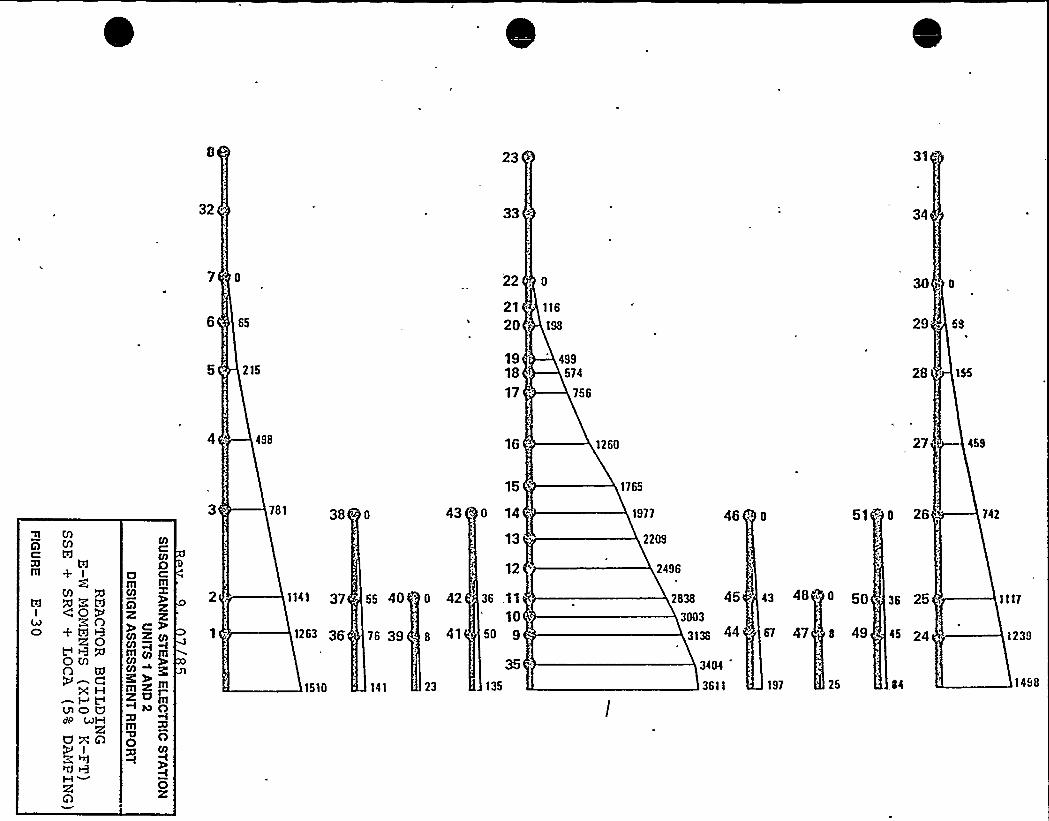
23
32 ~ 33 34
7 o
6 65
22
2120
0
116
198 29 59
151918
17
499574
756
28
498 1260,
27 459
3 781 38 o 43
15
o 14
1765
1977 46 o 0 26 742
tTItd
+ I
M A40%g O+ tTI R
R 00 MO
g HVlO U
RUXA:r3 HRA
COC:
8g Cm(D9a c=5CO% COCO ~ ~mmmm
m z m><r~ M 0maO O
CO
O2!
1141 37 55 40
15'10 141
1263 36 76 39
o 42
41
23
13
12
36 .11
1050 9
35
135
2209
2496
28 as 453003
siss 44
3404
3611 197
48 ~ 50
e 49
25
36 25
45
'1117
1239
1498

0
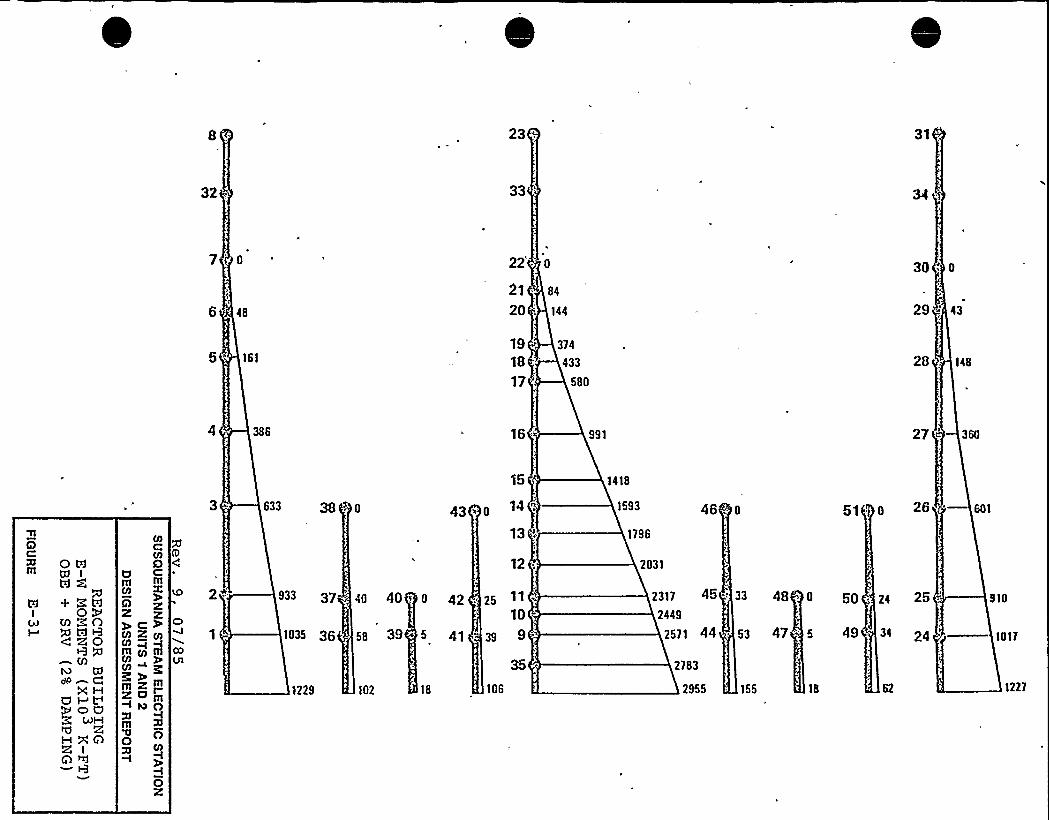
23: 31
32:. 33
22 30 0
48
21
2084
144 '329-
161
374
433
580
28
16 991 27
633 38 0 43 ~ 0
1418
1593 . 0 51 0
ORI
A+ ZWOPMQO+WR<ZO
tOdP ~ C
g HUl L
P oURHXA
IQ M
IO
0mm m
C)
>eFCOD IOCO~+lll TO lllTOCO~ g~~mITI XP>~m
I lO 0g7ITI
~O 0Ol
I
0'R
933 37 .
1035 36
1229
40 40
s8 39
102
0 42
5
18
13'2
25 11
10
39
106
1796
2031
2317 45
2449
2s» 44
2783
2955
33 48
s3 47
155
50
s 49
18
24 25-
34 24
910
1017
1227
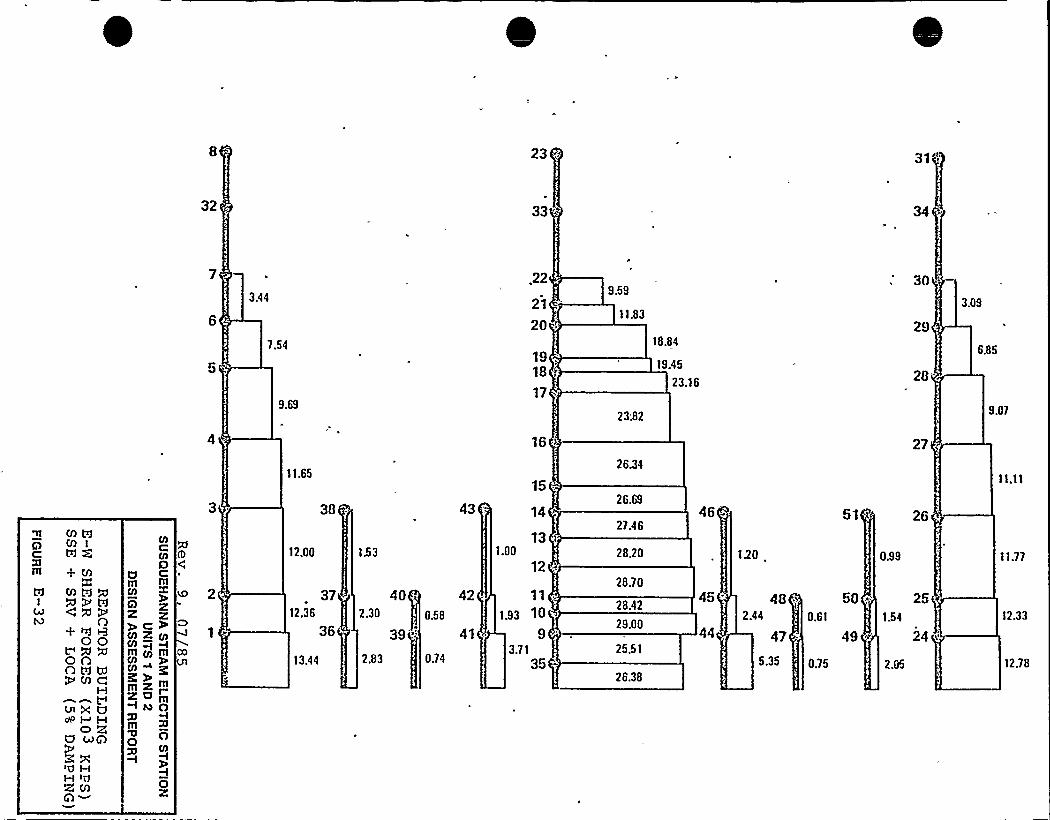
23 31
32, 33
+ M
AtdaO+MR
OOOAARg~MC
vms'e
I HO ga ~n
t-I idQ)
Q ~
Ol
CO
Oom m
9z>c2Ch R ~M~~Vlmmmm
mzP>~mI NO
mOe
I
0X
3.44
7.54
11.65
12.00
3712.36
36
13.44
1.53
2.30
2.83
40
39'.0.58
0.74
43
42
41
.22
21
20
19 .
18,17
1.00
12
11
1.93 10
93.71
35
9.59
11.83
23:82
26.34
26.69
27.46
28.20
28.70
28.42
29.00
25.51
26.38
18.84
19.45
23.16
45
44
120
482.44
5.35
0.61
0.75
51
60 ~
09$
30
29
27
3.09
635
9.07
11.77
12.33
12.78
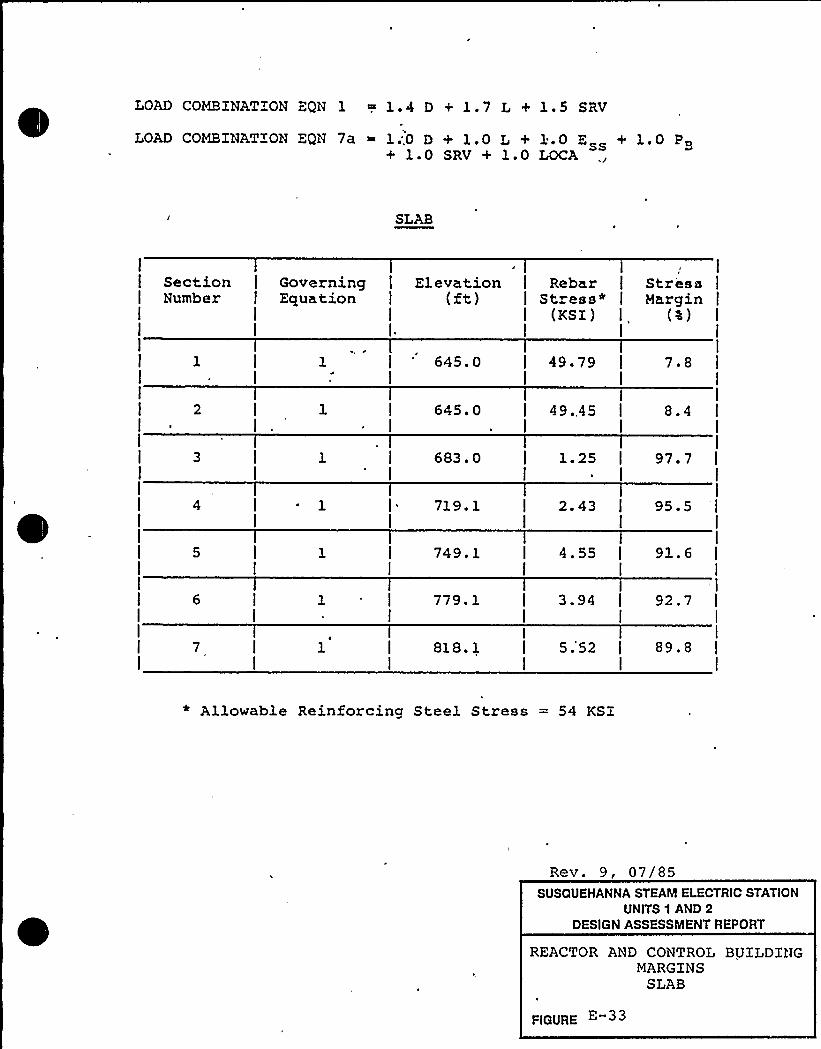
LOAD COMBINATION ZQN 1 ~ 1.4 D + 1.7 L + 1.5 SRV
LoAD OMB NAT ON EQN a ~ 1;.0 D + 1 ~ 0 L + 3:.0 E + 1.0 PB+ 1.0 SRV + 1.0 LOCA
SLAB
SectionNumber
GoverningEquation
Elevation(ft)
RebarStress*
(KSI)
StressMargin
(4)
645. 0 49.79 7 '
645. 0 49.,45 8.4
683.0 1.25 97.7
719. 1 2. 43 95 '
749.1 4.55 91.6
779.1 3.94 92.7
7 818. 1 5. 52 89.8
* Allowable Reinforcing Steel Stress = 54 KSI
Rev. 9, 07/85SUSQUEHANNA STEAM ELECTRIC STATION
UNITS 1 AND 2DESIGN ASSESSMENT REPORT
REACTOR AND CONTROL BUILDINGMARGINS
SLAB
FIGURE
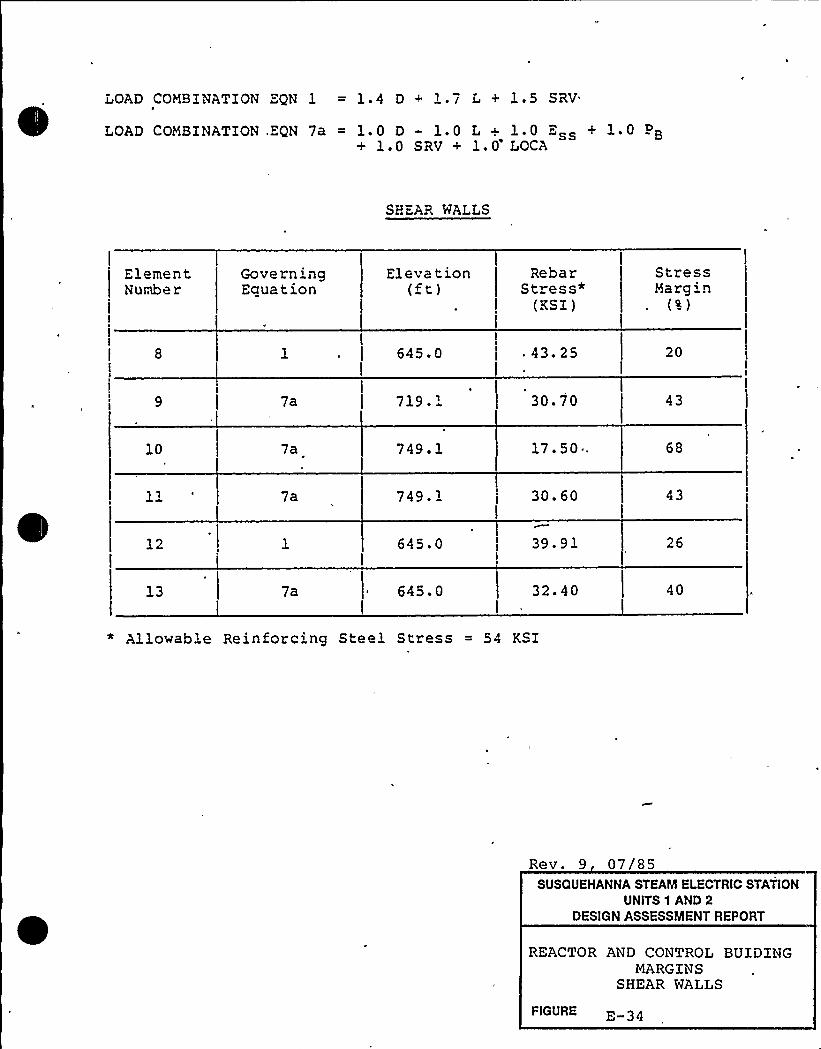
LOAD COMBINATION QN 1 = 1-4 D + 1.7 L + 1.5 SRV
LOAD COMBZNATZON .-QN 7a = 1 ~ 0 D 1 ~ 0 L . 1 ~ 0 " + 1. 0+ 1 ~ 0 SRV + 1 ~ O'OCA
SHEAR WALLS
ElementNumber
GoverningEquation
Eleva t ion(ft)
RebarStress*
(KSZ )
StressMargin
(g)
645 ' . 43.25 20
7a 719. '0.70 43
10 7a. 749.1 17. 50 . 68
ja 749.1 30.60 43
12 645.0 39. 91 26
13 ja 645. 0 32. 40 40
* Allowable Reinforcing Steel Stress = 54 KSZ
Rev. 9 07/85SUSQUEHANNA STEAM ELECTRIC STATION
UNITS 1 AND 2DESIGN ASSESSMENT REPORT
REACTOR AND CONTROL BUIDINGMARGINS
SHEAR WALLS
FIGURE E 34
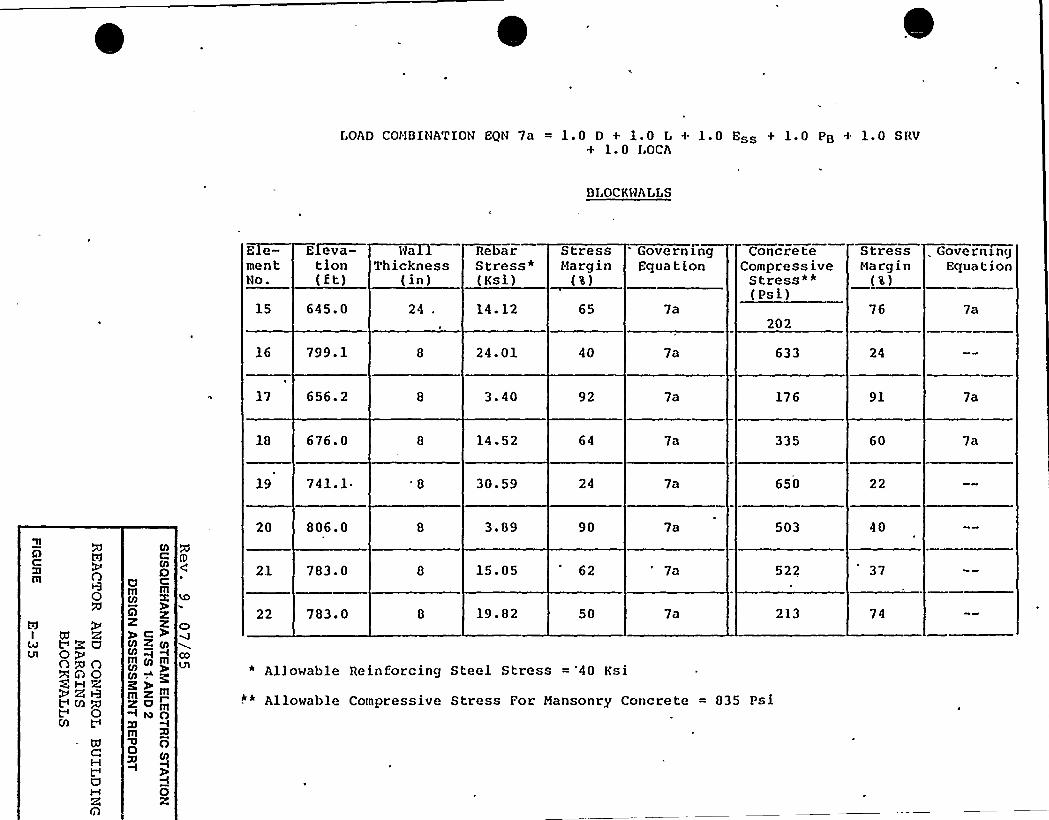
LOAD COHBINATIOH EQN 7a = 1.0 D + 1.0 L + 1.0 Ess + 1.0 PB + 1.0 SRV+ 1.0 LOCA
BLOCKHALLS
E e-mentHo.
15
Eleva-tion(ft)
645.0
NaThickness
(in)
Re arStress*(Ksi)
14.12
StressMargin
(4)
Gove rn l.ngEquation
ConcreteCompressiveStress'*(Psi)
202
StressMargin
(%)
76
GoverningEquation
7a
16 799.1 24.01 40 7a 633
17 656. 2 3.40 92 7a 176 91 7a
676.0 14.52 335 60
19 741. l. 30.59 24 7a 650 22
20 806.0 3 ~ 89 90 503 40
AITI
m
0
WI 2',
L ZUQPOQOXQ0QM RWRRVM+0M
t"aRQ
thCOOg C
9 2
ye%CII 2: CIICII ~ ~Ill CII lllVI
Ill Z I>0ml4 0
llloCIl
0
0X
C>
COlSI
21 783.0 15.05 62 7a
783. 0 19. 82 50 7a
* Allowable Reinforcing Steel Stress = '40 Ksi
~~ Allowable Compressive Stress For Mansonry Concrete = 835 Psi
522
213
37
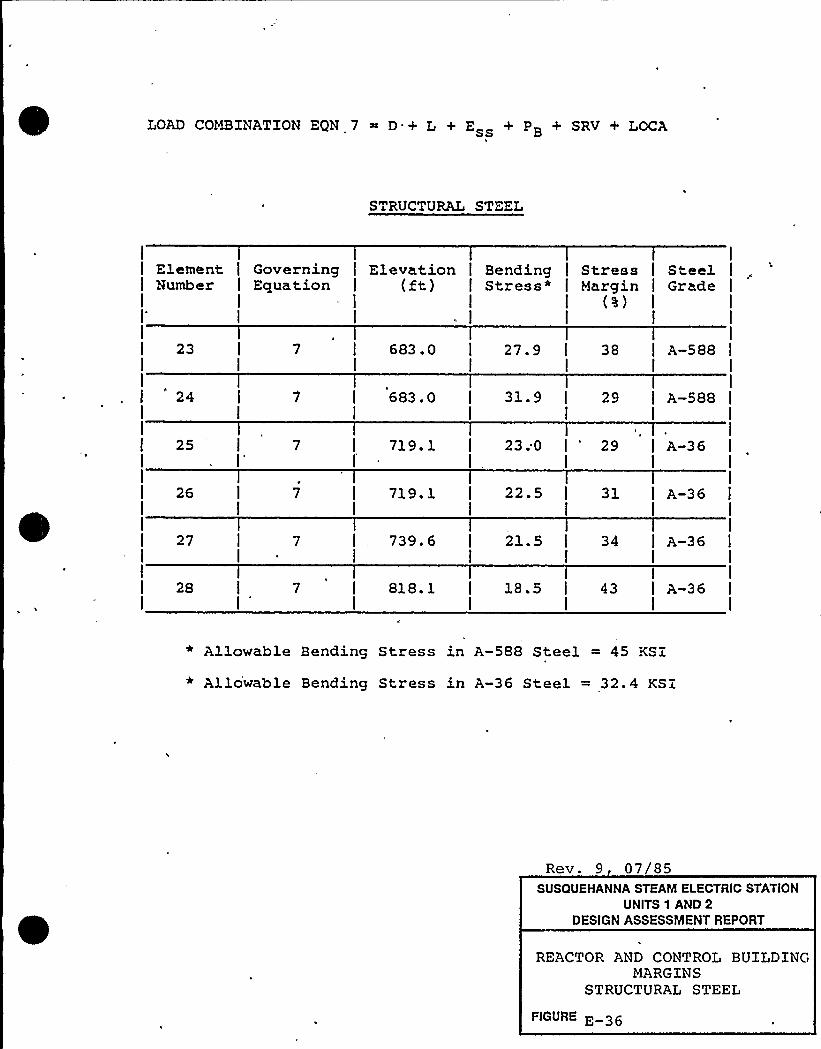
LOAD COl&INATION EQN 7 ~ D. + L + Ess + PB + SRV + LOCA
STRUCTURAL STEEL
ElementNumber
GoverningEquation
Elevation(st)
BendingStress*
StressMargin
(~)
SteelGrade
23 683.0 27.9 38 A-588
24 683.0 31.9 29 A-588
25 719. 1 23.0 29 A-36
26 719 ~ 1 22.5 A-36
27 739.6 21.5 34
28 7 818. 1 18.5 43 A-36
* Allowable Bending Stress in A-588 Steel = 45 KSI
* Allo'wable Bending Stress in A-36 Steel = 32.4 KSI
Rev. 9 07/85SUSQUEHANNA STEAM ELECTRIC STATION
UNITS 1 AND 2DESIGN ASSESSMENT REPORT
REACTOR AND CONTROL BUILDINGMARGINS
STRUCTURAL STEEL
FIGURE E
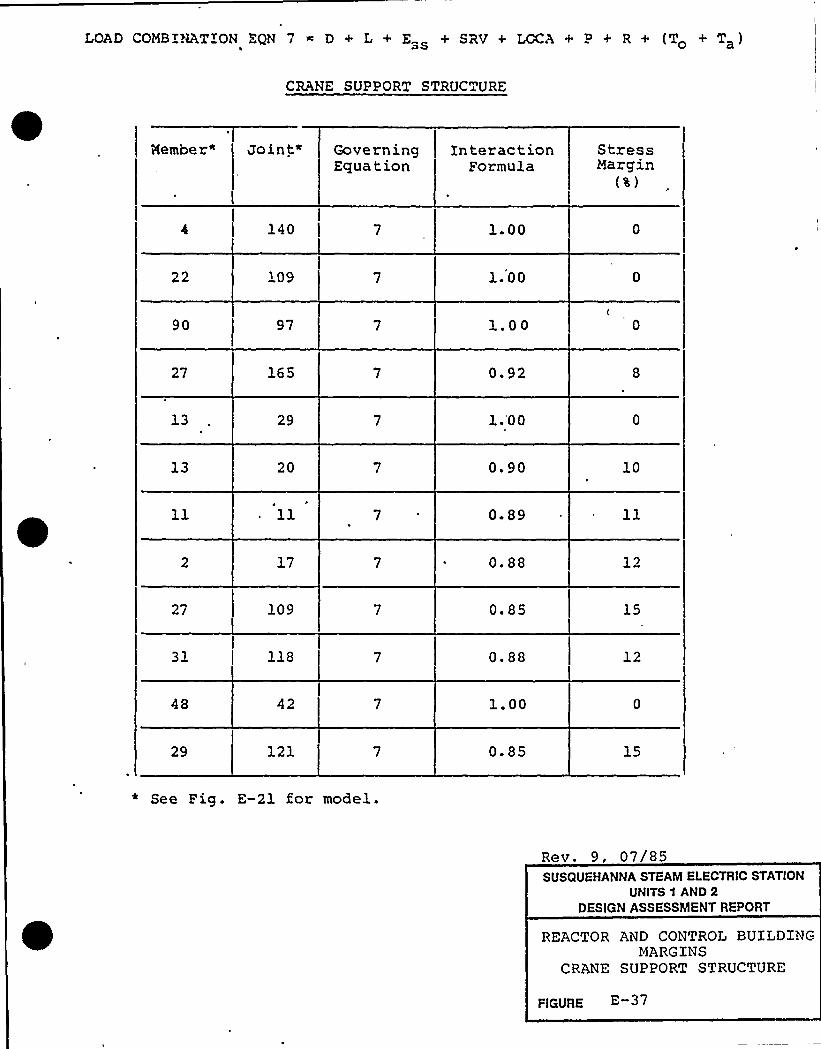
LOAD COMBI>ATION ZQN 7 ~ D + L + E + SRV + LOCA + P + R + (To + Ta)
CRANE SUPPORT STRUCTURE
member~ Joint" GoverningEquation
In terac t ionFormula
StressMargin
(~L)
140 l. 00
22 109 1. 00
90 97 1.00
27 0. 92
13 29 1.'00
13 20 0. 90 10
0. 89
17 0. 88 12
27 109 0 ~ 85 15
118 0.88 12
48 42 1.00
29 121 0 '5* See F ig . E-21 for mode 3..
Rev. 9, 07/85SUSQUEHANNA STEAM ELECTRIC STATION
UNITS 1 AND 2DESIGN ASSESSMENT REPORT
REACTOR AND CONTROL BUILDINGMARGINS
CRANE SUPPORT STRUCTURE
FIGURE E
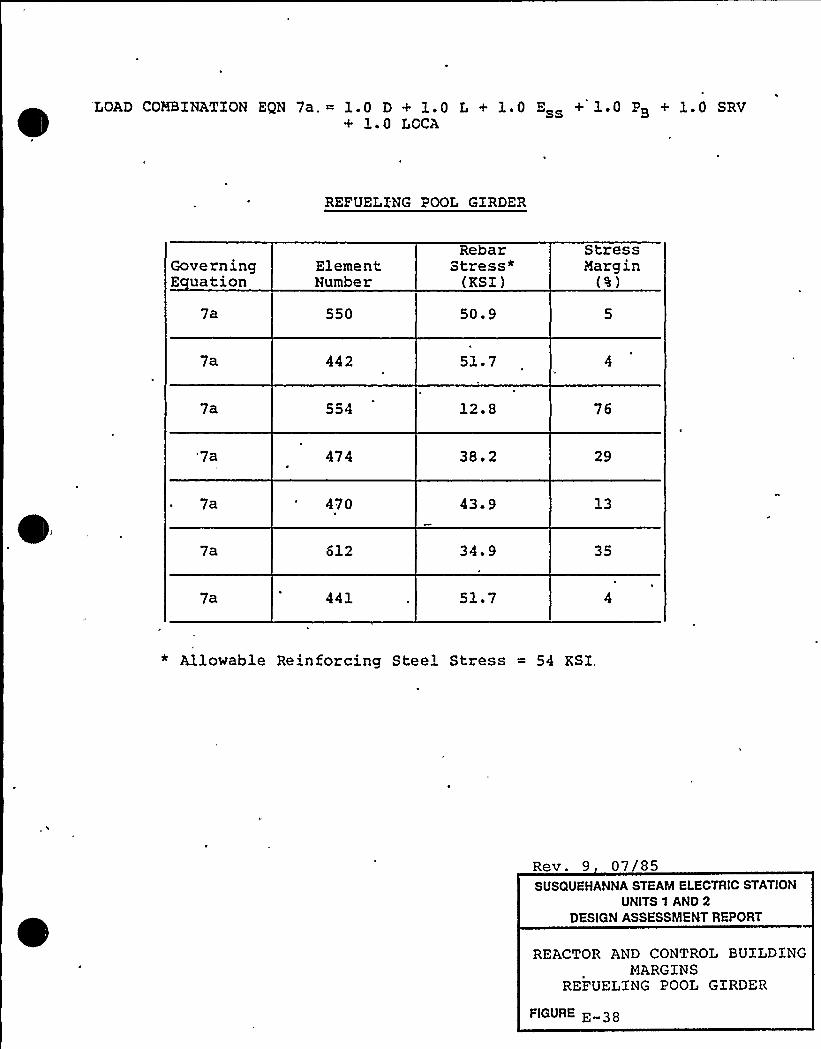
LOAD CONBINATION EQN 7a. = 1.0 D + 1.0 L + 1.0 Ess + 1 ~ 0 PB + 1.0 SRV+ 1 ~ 0 LOCA
REFUELING POOL GIRDER
GoverningE uation
ja
ElementNumber
RebarStress*
(KSI)
50.9
Stressmargin
(4)
ja 442 51.7
7a 554 12 ' 76
'ja 474 38 ' 29
ja 470 43-9
ja 612 34.9 35
ja 441 51 '
* Allowable Reinforcing Steel Stress = 54 KSI.
Rev. 9 07/85SUSQUEHANNA STEAM ELECTRIC STATION
UNITS 1 AND 2DESIGN ASSESSMENT REPORT
REACTOR AND CONTROL BUILDINGMARGINS
REFUELING POOL GIRDER
FIGURE E 38
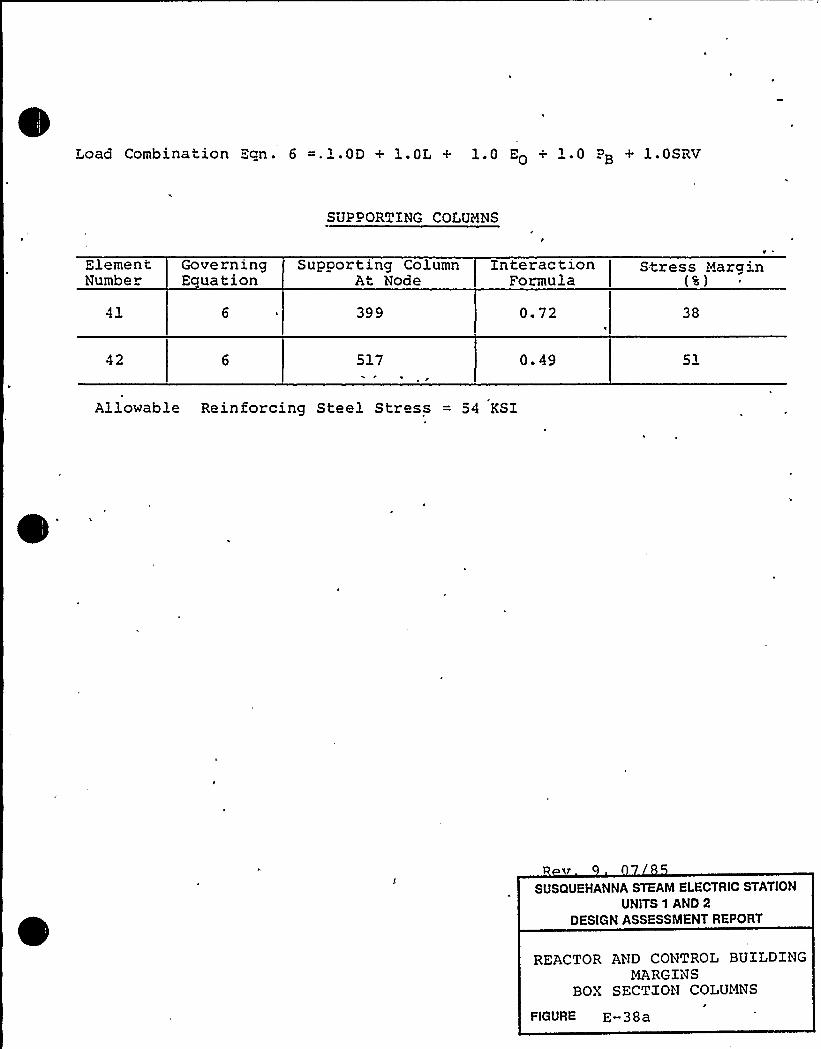
Load Combination Eqn. 6 =.'.OD + 1.0L + 1.0 EO + 1.0 PB + 1.0SRV
SUPPORTING COLUMNS
ElementNumber
GoverningEquation
Suppor t ing ColumnAt Node
399
Interac t ionFormula
0.72
Stress Margin(%)
38
517 0.49 51
Allowable Reinforcing Steel Stress = 54 KSI
SUSQUEHANNA STEAM ELECTRIC STATION
UNITS 1 AND 2DESIGN ASSESSMENT REPORT
REACTOR AND CONTROL BUILDINGMARGINS
BOX SECTION COLUMNS
FIGURE E-38a

A ='E'iNDiX r
BGP AN 0 NSSS P!. P T HG DRSX6~ii ASS.",SS ~i"'.iT
All Seismic Cateqory J. 'alance of plant {:.Cn) «nd HSSS pipingsystems inside the containment and Peactor building are analyzedfor seismic arid hydrodyriamic loads per ti:e load coimi.in«ticnsgiven in Suk:section 5.'nd 5.C.
.'or seiccte'ab3e
«l modelson analyses
sc ussed 1nII
Tab le F-1 summa ri res the stcesses an<i stress r'«coinsBOP pipirq systems. The aralytical results oresente1 are based on analyses peczocmed usinq the struc+u"shorn in Appendix uC'~. Tho asses mient results t;:sedperfocmed using the cevised structural z:odels (a" QiSubsection 7.1.1..2.1.1) ace presented in Appendix "L
The stress repocts for the evaluat i or, of t e i G."" «nd NSSS p'ingace available for i<BC reviev,,
Bev. 9, 07/95
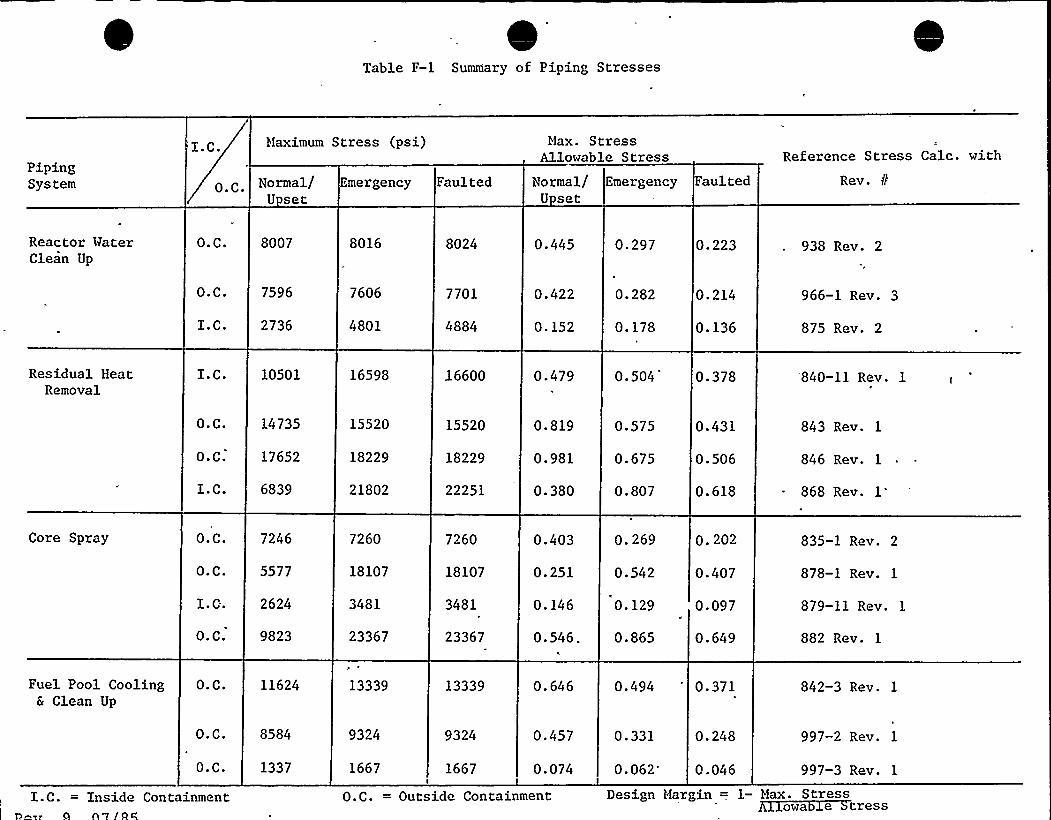
~ ~
I ~ ~ ~ ~
~ I ~ ~ ~
~ ~~ ~ I ~
1~
~~
~ ~~ ~
~ ~ II I ~
~ ~
I I ~
~ ~ I ~ I I ~ ~~ ~ ~~ ~ ~
~ ~ el ~ I ~~
~ ~~ ~
I ~
~ ~ I ~ I ~~ ~~ ~
~ ~ ~ ~ I 4 ~
~ ~~ ~ I ~ ~ ~
~ ~ ~ ~ ~ ~
~ ~
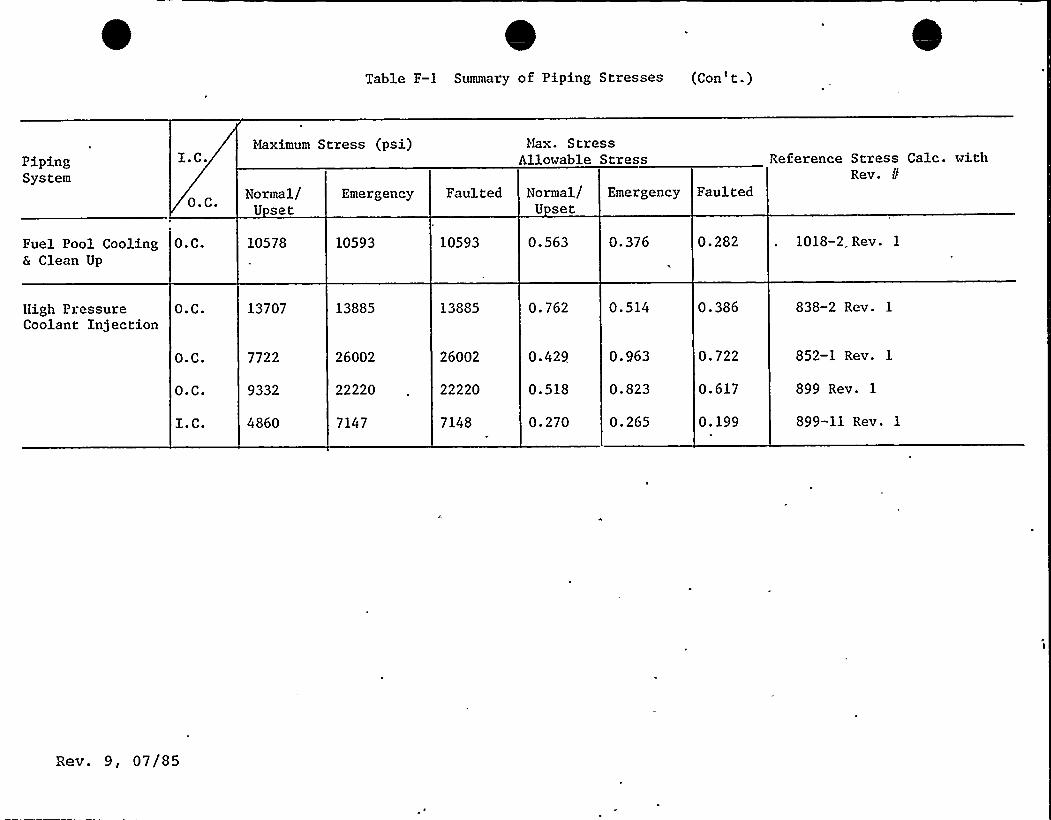
Table F-1 Summary of Piping Stresses (Con't.)
PipingSystem
I.C.Maximum Stress (psi) Max. Stress
Allowable Stress Reference Stress Calc. withRev. i!
0. C.
Fuel Pool Cooling O.C.& Clean Up
Normal/U set
10578
Emergency
10593
Faulted
10593
Normal/U set
0.563
Emergency
0.376
Faulted
0.282 1018-2, Rev. 1
High PressureCoolant Injection
O.C.
O.C.
O.C.
I. C.
13707
7722
9332
4860
13885
26002
22220
7147
13885
26002
22220
7148
0. 762
0.429
0 '18
0.270
0. 514
0.963
0.823
0.265
0.386
0.722
0.617
0.199
838-2 Rev. 1
852-1 Rev. 1
899 Rev. 1
899-.11 Rev. 1
Rev. 9, 07/85

APP HNDIX G
VASSS DHSIGb ASSFSS ";
This Appendix has been deleted.
Rev. 9, 07/85 G-1
APPENDIX H
ZQUIPNZNT DES IG}l A SSES c.lENT
This Appendix has been aele teal.
Rev. 9, 07/05 H 1
APPEhDXX ISUPP'.".SSIOÃ POOL TEHPEPATUP.." RESPONSE 0 SRV DISCHABGF.
TABLE OF CCHTEiJTS
I.2I 3
Introduction
Analyzed Scenarios
Assumptions
,I. 3. 1 Gen eral
Z.3 2
I.3 3
Availablo Equipment
Operator Actions
I.5Analysis,.'le thod
Analysi Results 8 Conclusions
Bev. 9, 07/85
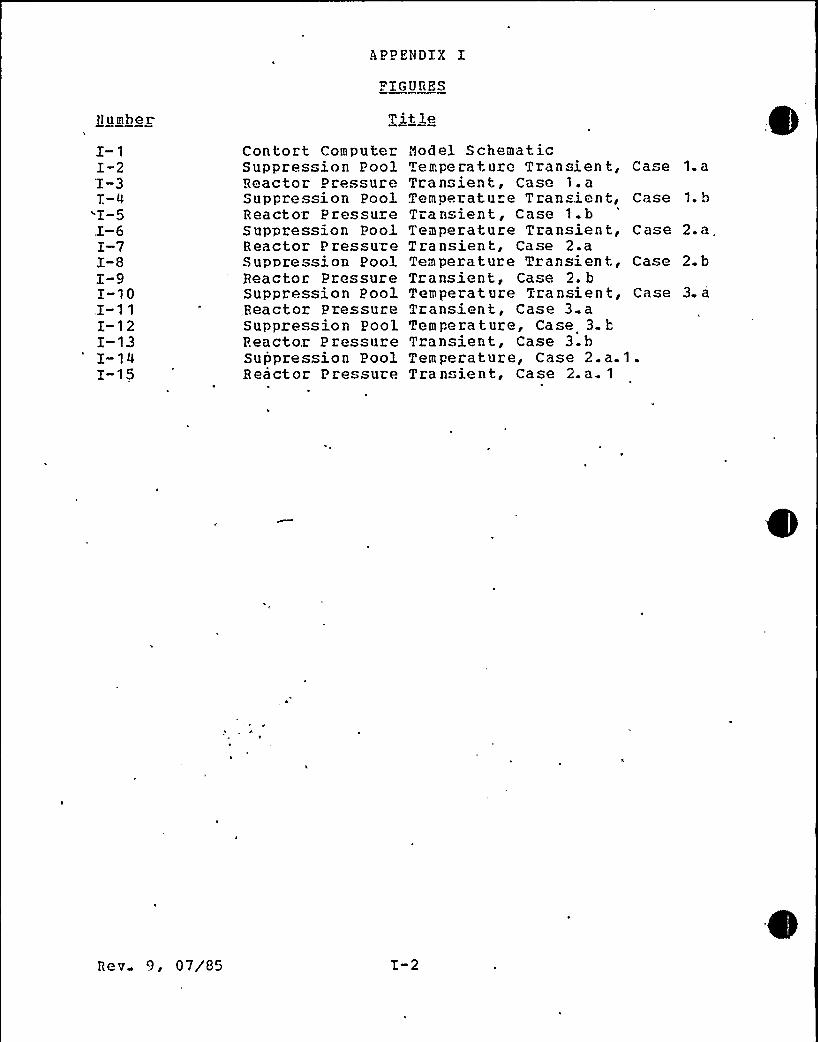
A PP ENDIX I'FIGURES
Number Tit le
I-1I-2'I-37-4I-5.I-6I-7I-8I-9I-10I-1 1
I-12I-13I-14I-1 5
Contort ComputerSuppression PoolReactor PressureSuppression PoolReactor PressureSuppression PoolReactor PressureSuppression PoolReactor PressureSuppression PoolReactor PressureSuppression poolReactor PressureSuppression PoolReactor Pressure
Aodel SchematicTempe rat uzo Transien t,Transient, Case 1.aTemperatu e Transient,Tran ient, Case 1.bTemperature Transient,Transient, Case 2.aTemperature Transient,Transient, Case 2. bTemperature Transien t,Transient, Case 3.aTem pe ra t ure, Case 3. bTransient, Case 3.bTemperature, Case 2.a.Tra nsie n t, Case 2. a. 1
Ca e 1.a
Case 1. b
Case 2.a„
Case 2. b
Case 3. a
Rev 9, 07/85
APPF.'.lDXX
TABLF.S
itle
Input Parameter,Pea'~ SuppressioI. Pool Temperatures
P.ev 9, 07/95 I-3
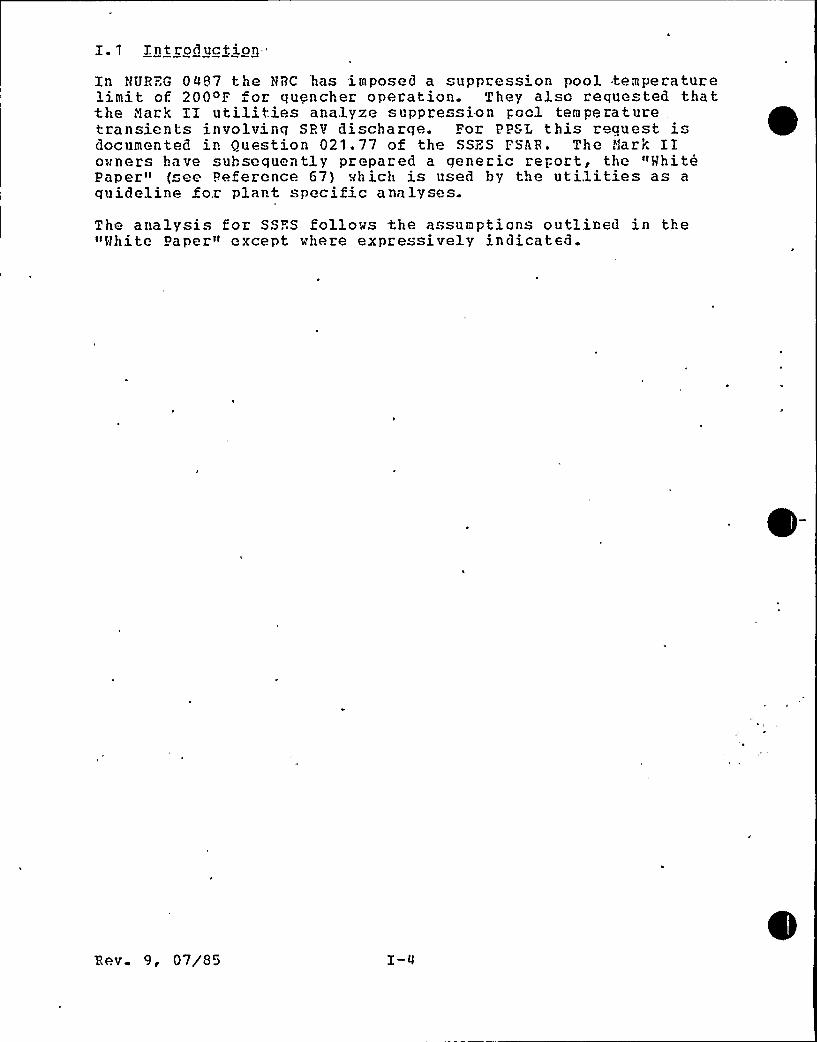
I. 1 Introd uction.
In PUP.":.G 0497 the HRC has imposed a uppress'on pool .temperaturelimit of 200oF for quencher operation. They also requested thatthe i1ark II utilities analyze suppression pool temperaturetransients involvinq SRV discharqe. For PPSL this r quest i"documented in Question 021.77 of the SSZS I'SAR. The liar's IIowners have subsequently prepared a qeneric report, the "MhitePaper" (see Referonce 67) which is used by the utilities as aquideline for plant specific analyses.
The analysis for SSRS follows the assumptions outlined in the"white Paper" except where expressively indicated.
Bev 9, 07/85 I-4
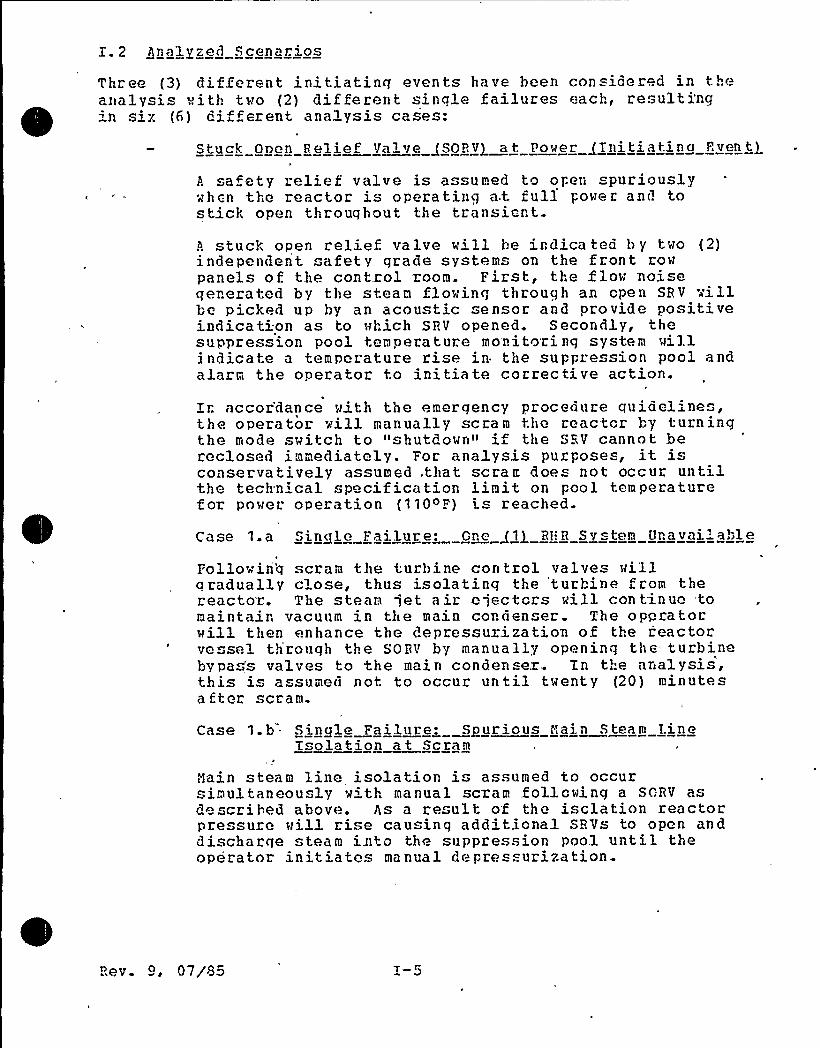
Z. 2 Ar alyzed Scenarios
Thcee (3) different initiatinq events have been considered in ..heanalysis with two (2) different si nqle failures each, cesult i'ng
n siz (6) different analysis cases:
Stuck Oven Relief Valve QSOBV} at Vower /Initiating Pvent}
A safety relief valve is assumed to open spuciouslychen the reactor is operating at. full power and tostick open throuqhout the transier.t.
A stuck open relief valve will be irdica ted b y two (2)i.ndependent afety grade systems on the front rowpanels of the contcol room. First, the flow noiseqererated by the steam fiowing throuqh an open SBV villbe picked up by an acoustic sensor and provide posi.tiveindication as to which SRV opened. Secondly, thesuppression pool temperature monitocing system»illindicate a temperature rise in the suppression pool andalarm the operator to initiate corrective action.
Zr. accor'dance wi th the emerqency procedure guidelines,the operator will manually scram the ceactor by turningthe mode switch to " hutdown" if the SBV cannot bececlosed immediately. Foc ana1ysis puzposes, it. isconservatively assumed .that scram does not occuc untilthe techn'cal specification limit on pool temperaturefor power: operation (1100F) is reached.
Case 1.a Sing<le Failuce: Gne ~1} Bt! R System Uravai'bleFollowin'q scram the turbine con tzol valves villq radually close, thus isolatinq the 'tucbine f rom thereactor. The steam jet a ir e jectcrs vill con tinued tomaintair. vacuum in the main condenser. The operator.will then enhance the depressurization of the reactorvessel th'rouqh the SOBV by manually openinq the. turbinebypass valves to the main condensez. Tn the analysis,this is assumed not to occur un til twenty (20) minutesafter scram.
Case 1.b Single Failure: Spurious Nain Steam LineIsolation at Scram
Hain steam line iso1ation i" assumed to occursimultaneously v'th manual scram following a SGRV asdescribed above. As a result of the isclation zeactocpressuze will rise causing additiona1 SBVs to oper; anddischarge team into the suppression pool until theoperator initiates manual depressurization
Bev 9, 07/85 1-5
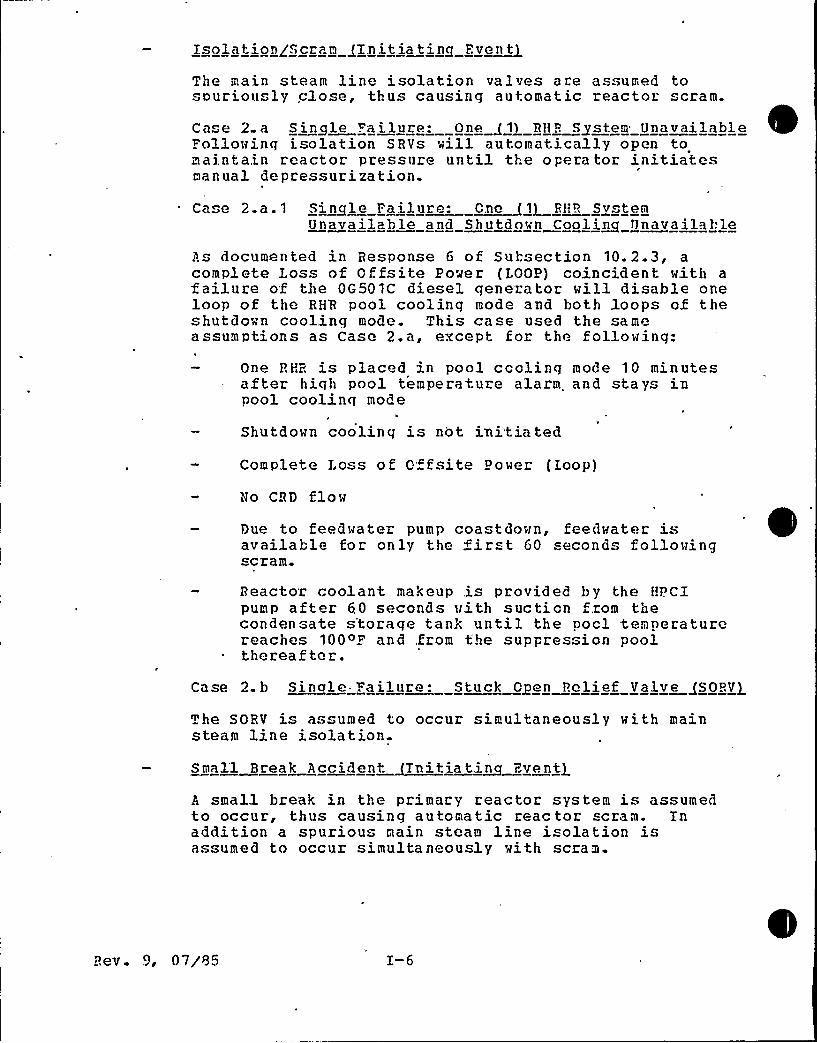
Isolation/Scram /Initiating Fventg
The main steam line isolation valves are assumed toouriou ly close, thus causing automatic reactor scram.
Case 2.a S~in le Failure: One~11 HHR System UnavailableFollowinq isolation SRVs will automatically open tomaintain reactor pressure until the operator initiatesmanual depressurization.
Cane 2.a.1 Single Failure: ~Cno 1) BHB Sy teeUnavailable and Shutdown Cooling Unavailable
As documented in Response 6 of Subsection 10.2.3, acomplete Loss of Offsite Power (LOOP) coincident with afailure of the OG501C diesel qenezator will disable oneloop of the RH'R pool cooling mode and both loops of theshutdown cooling mode. This case used the sameassumptions as Case 2.a, except foz the following:
One RHR is placed in pool ccolinq mode 10 minutesaf ter hiqh pool temperatuze alarm and stays inpool coolinq mode
1
Shutdown cooling is not initiatedComplete Loss of O"fsite Power (loop)
No CRD flow
Due to feedwatez pump coastdown, feedwater isavailable for only the +ir t 60 seconds followingscram.
Reactor coolant makeup .is provided by the HPCIpump after 60 seconds with suction from thecondensate storage tank until the pool temperaturereaches 100~8 and from the suppression poolthereaf ter.
Case 2.b Single-Failure: Stuck Open Relief Valve QSORVQ
The SORV is assumed to occur simultaneously with mainsteam line isolationSeal'1 Break Accident~ynit~iatin Eventi
A small break in the primary reactor system is assumedto occur, thus causing automatic reac tor scram. Inaddition a spurious main steam line isolation isassumed to occur simultaneously with scram.
Rev. 9, 07/85 I-6
Case 3. a Single Failure: One ~1} RHR System UnavailableCase 3..b Single Failure: Shutdown Cooling Unavailable
Thi single failure does not have an immediate impacton poach,suppression pool tempe'rature since the operatorvill not,'attempt to switch xrom R!lB pcol cooling toshutdown .cooling before the peak is reached. Theoperator „will ultimately reach cold shutdown byestablishing the, alternate shutdown cooling path asoutlined. in Subsection 15.2.9 of the SSES .FSAR.
Pev..9, 07/85 T.-7
I. 3 Assumntions
I. 3. 1 General
The suppre sion pool temperature response to SRV discharge is a.function of the following parameters:
t
heat irout into the suppression pool represented mainlyby reactor power, decay heat and SBV flow rate,
heat caoacitg of the suppressicn pool representedmainly by its water mass,
heat removal from the suppression pool representedmainly hy RHR service water temperature and RHR heatexchanger effectiveness.
Table I-1 gives an overview of the parameters used in thisanalysis.
I. 3.2 Available Fguipment
Only safety grade equipment is assumed to be available except forthe followinq:
feedeatecgcoadeasate~s ates
The feedwater/condensate system, rather than HPCI, isassumed to provide make-up water to the reactor. Thisassumption is conservative since the hot feedwater hasa much higher enthalpy than water supplied by HPCI fromthe condensate storage tank and/or the suppressionpool. However, this assumption is „non-mechanistic forall analysis cases, except Case 1. a, since the turbine-driven feedwater pumps are not available following NSIVclosure.
NOTE: Thi assumption is more conservative than theassumptions made in the "Rhite Paper" (seeReference 67) .
o ff-site~owerThe foreqoing assumption specif ically requires theavailability of off-site power as a power source forthe condensate pumps. Therefore, off-site power isassumed to be available for all analysis cases.
Control Rod Drive JCBDQ flow
CPD flow is assumed to continue throughout thetransient. This assumption is based on theavailability of off-site power.
Rev. 9, 07/95
main condenser
This assumption applies to Case 1.a only and. is based.on the f,oliowing:
o "'o HSTV closure 's mechanistically expected at scram.
o the steam jet air ejectors maintain condenser., vacuum'sing steam from the reactor and/or
the auxiliary boiler.o 'he turbine bypass valves are operable since
off-site power is available.
,I.3.3 Opera tor Action
manual scram
Thi assumption applies to Cases 1.a and 1.b only. A
detailed discussion i" provided in Subsection X.2 underCase 1. a.,
manual deoresurization t hrou~rh SF Vs1
manual Qepres urization will be initiated at theapplicable technical specification limit on suppressionpool temperature {120OF). The depressurization rate is100~7/hr unless the event itself causes a more rapiddepressur izat ion.
reestablish main condenser
Thi assumption applies to Case 1.a only. 'A detaileddescription is provided in Subsection Z. 2 under Case1 ~ a ~
initint ion of 8 flB noo 1 c oolinaC
The suppression pool temperature monitoring system willalarm the operator if the technical specification limiton suppression pool temperature for continuousoperation (90 "F) is reacheQ. The analysis assumes thatthe available HHR loops will be manually placed inoperation within ten (10) minutes following this alarmand be operating from thereon until the initiation ofPUB shutdown cooling.
returni~n into EHR pool cooling atter LPCI ini tiationTh i" a pplies to Cases 3. a anQ 3. b (SEA case ) only.Automatic LPCT initiation occurs cn beth "high Qrywellpre "sure" and "low reactor pressure" and willtemporarily interrupt the BHR y tern discharge to thesuppression pool. The analysis takes this interruptioninto acrount and does not assume the availability cf
Re v. 9, 07/05
suppression pool cooling «ithin ton (10) minutesfollowing T.PCI initiation.'$07 P ~ No LPCI discharqe into the reactor vill
actually occur since the «1c» reactorpressure" setpoi'nt is higher than the RHRpump shutof f head.
Ca t swi tchover from $ f! P. Dool cooling to shutdown cooling
This applies to Case., 1. a, 2. a and 3. a only (1 RII 8train available) . As soon as the reac tor pre suredrops below the permissive pressure f cr I?HKi shutdo»ncooling, the operator is assumed to perform a fastswitchover {without flush) Crom I:ool coolinq toshutdown cooling. 'It is assumed that the I?H."c system isunavailable for the duration of the switchover(approximately sixteen (16) minutes).
?IOTA No switchover is assumed to be j:erformed forcases 1.b, 2. b and 3. b (2 RHR trainsavailable) .
I. 4 A na 1 v si.'s <I e th o d
The analysi" uses the Stone 8 ?webster computer code CCHTGET whichca lcula te s both reac tor pre sure and suppression pooltemperature.
The reactor coolant is represented by volumes of steam and liquidin thermal equilibrium. The total volume of the coolant (steamand liquid) in the reactor system is assured constant. Thereactor water level is maintaind by feedwater ard C!?D flowthrouqhout the transient. Iieat is added to the reactor coolantfrom thermal mixinq with feedwater/CPD flow, decay 0:eat, fuelsensible heat, fission energy and the reactor ves.el andinternals metal mass. At the beginninq of the transient, reactorvessel, internal and coolant are assumed to he in thermalequilibrium. Pith the depressurization of the reactor vessel thecoolant temperature decreases. This establishes a heat flow fromthe reactor vessel and internals to the coolan ..
Steam can flow from the reactor coolant steam volume to the maincondenser or through SR'/s into the suppression pool «hich,is
!
modeled as a homoqeneously mixed water volume. >or the SBAcases, steam is directly added to the suppression drool. SRV andSBA flows are calculated u inq the !Ioody frictionless low model.
The computer model assumes that tho reactor vessel, feedwatersystem and suppres ion pool are surrounded by adiabatic '«all notallowinq any enthalpy flow from the e .' tern. other than to thomain condenser or the RHE service water. '.Ehe model, asdiscussed, is schematically outlined in 'Figure I-1.
I?ev. 9, 07/85
5 Anal@ is Result and Conclusions
'Table I-2 lists. the peak suppression pool temperatures that werecalculated usinq the COHT08.. computer code or the scenariosdoscribed in Subsection I.2. These temperatures are "bulk"tern peratures, i. e., they were calcula ted assumi.ng a homogeneouslymixed suppze "sion pool. In reality pool mixing will not beper feet and differences will exist between the "local"temperatuze of the water in the immediate neighborhcod of thequencher and the calculated»bulk» temperature. Ho'ever, becauseo tho special desiqn features of guenchezs and their orientationin the suppres ion pool (as discussed in Subsection 6.5.5) thesediffcrencos are expected to be small and not exceed the valuewhich was previously derived for ramshead discharge <'.evices in'<ark I plants {10~F). It is intended to verify this number usingdata from in-plant .tests which are presently under preparationfor the lead plants LaSalle and Zimrer.
Figures I-2 through I-15 show plots of the suppressicn pooltemperature and the respective reactor pressuze vs time. ForCase 1. a and 1. b only the portion of the transient followingmanual scram (assumed at 110~7 suppzessicn pool temperature) i,hown.
The sha rp pressure fluctuations at full reactor pressure inFiquzes I-7, I-11, I-13 and I-15 are due to the opening andreclosinq o SRVs before the operator manually initiatesdepzessuriza tion.Fluctuations in pool tempe ature and reactor pressure towards t heend cf the tra'nsient in Figures Z-4, I-5, I-0 and I-9 {i di
cate<'v
a slightly heavier line) are due to numerical instabilitiesand are insignificant for the analysis results.
Alsc insignificant is the step-like appearance of thedepressurization portion in the reactor pressure vs. time plotswhich is a result of the model used for adding feedwater.
Rev. 9, 07/05
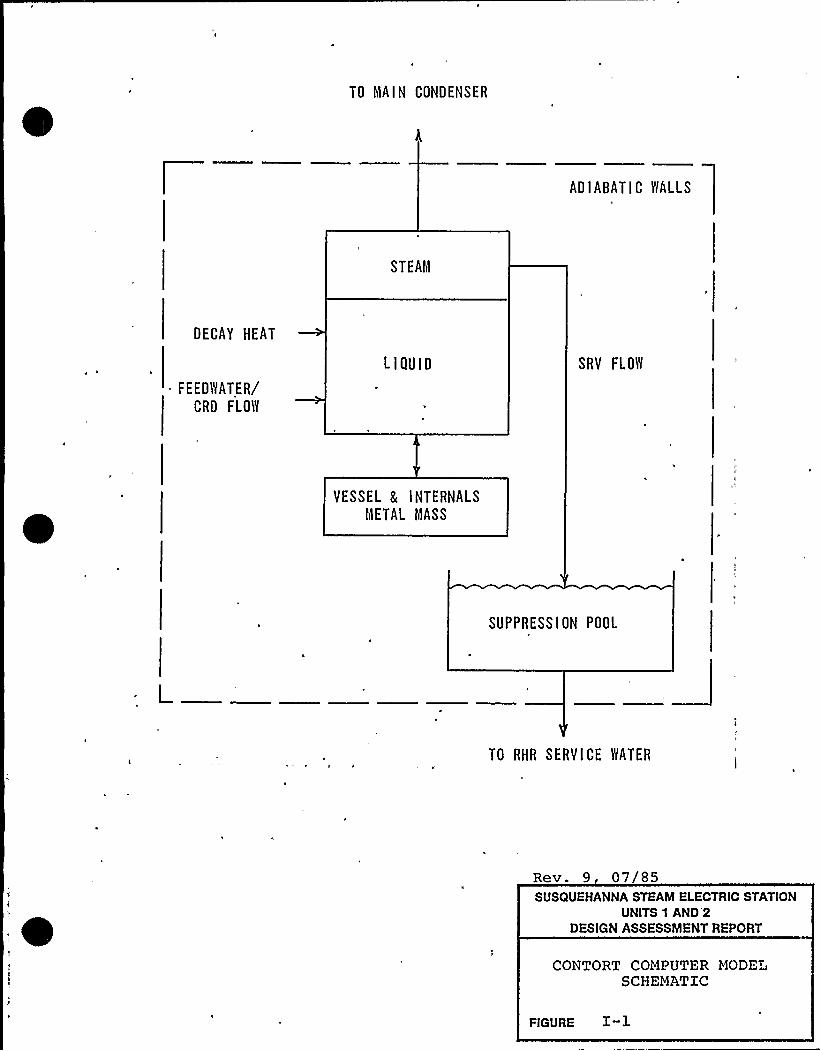
TO MAIN CONDENSER
ADIABATIC WALLS
STEAhl
DECAY HEAT
. FEEDWATER/
CRD FLOW
LlaUIO SRV FLOW
VESSEL 8 INTERNALSMETAL MASS
SUPPRESSION POOL
TO RHR SERVICE WATER
Rev. 9 07/85SUSQUEHANNA STEAM ELECTRIC STATION
UNITS 1 AND 2DESIGN ASSESSMENT REPORT
CONTORT COMPUTER MODELSCHEMATIC
FIGURE I-1
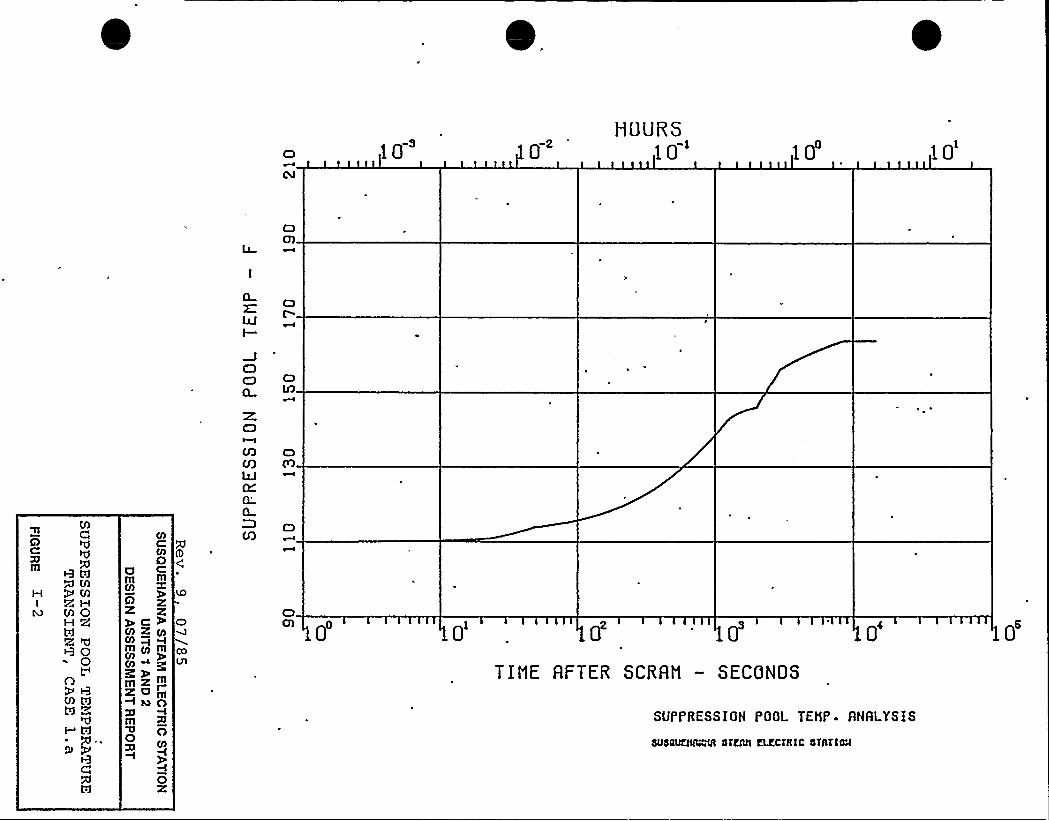
10 02
HOURS10
MC
N MQ MR HM 0
R N600t"O
M lTltd
'Cll
CXIW
CO
CO0g Cm mCO
9Z Zpc 2CO Z COCO qCOill CO mCO~ y,~~mm'Z mZ<m
CM 0g7 lm
0 0C
0Z
C)
CoUl
CO OCO FlQJ
Q'L
O03
o 01 0
TINE AFTER SCRRN — SECONDS
SUPPRESSION POOL TEtiP- ANALYSIS
504QUCNQsN OTClUl GXCMIC OTAHCA
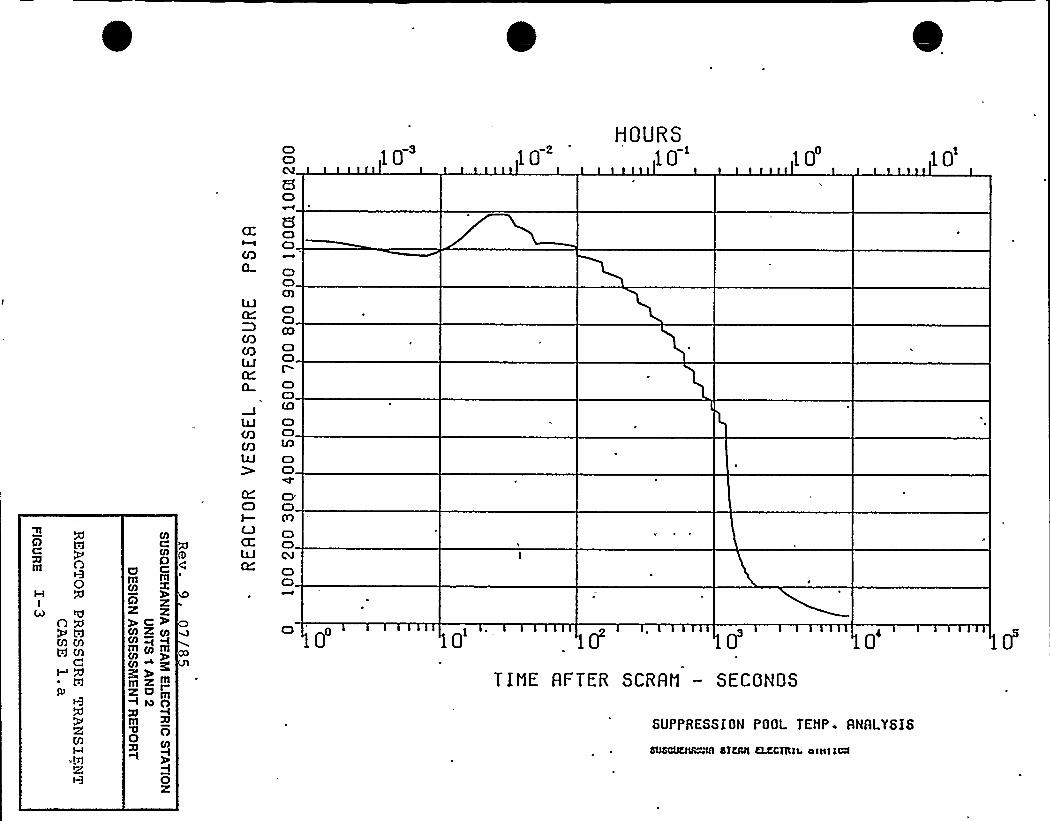
OC)04
HO
6DO
O
10 10HOURS
10
COm
0HI
O NN ITIM Mtd M
C
RM
l4
OI
OIOmm m
92'ye%OI 2: IIIm+mQI
0) ~
<~mITI 2'»m
I IO +m
0Ol
OX
CDCDwo
03 oDW
Q DDS
W 0DLQ
W ooo.
c) oI— P)
ooW
oD
0 10 0
TIt1E AFTER SCRRt1 — SECONDS
SUPPRESSIOH POOL TEtiP ANALYSlS
4USCUCI~ 4ICAII CLCCHIII. oinl tel
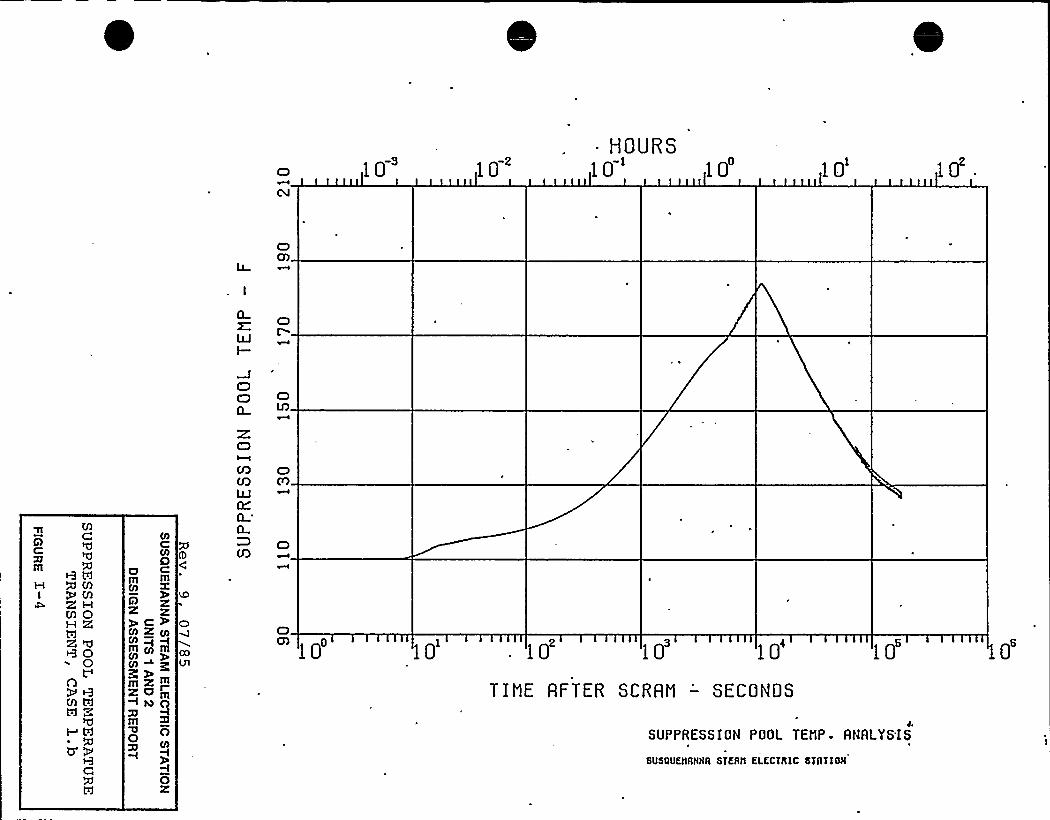
oCU
10 10~ HOURS10 10
oUJI—
C3 D0
MCQ
CIll
Q MI Q M
M PM 2a
RRppt"O
M XX ZI W
O'
CA
Ol
0C
mOlQ z~COCh K Ol
mmmmO)
O)cn ~ gmamZUm
I lO Qg7Illa 0
Ol
50X
C)
R o(f) P)QJ
0 '
o(Q
10 10 10 10 10
4SUPPRESSION POOL TEMP- AHALYS'IS
SUSQUEIIAIUIA STERII ELECTIIIC STRTIOII
TIt1E AFTER SCRRt1 — SECONDS

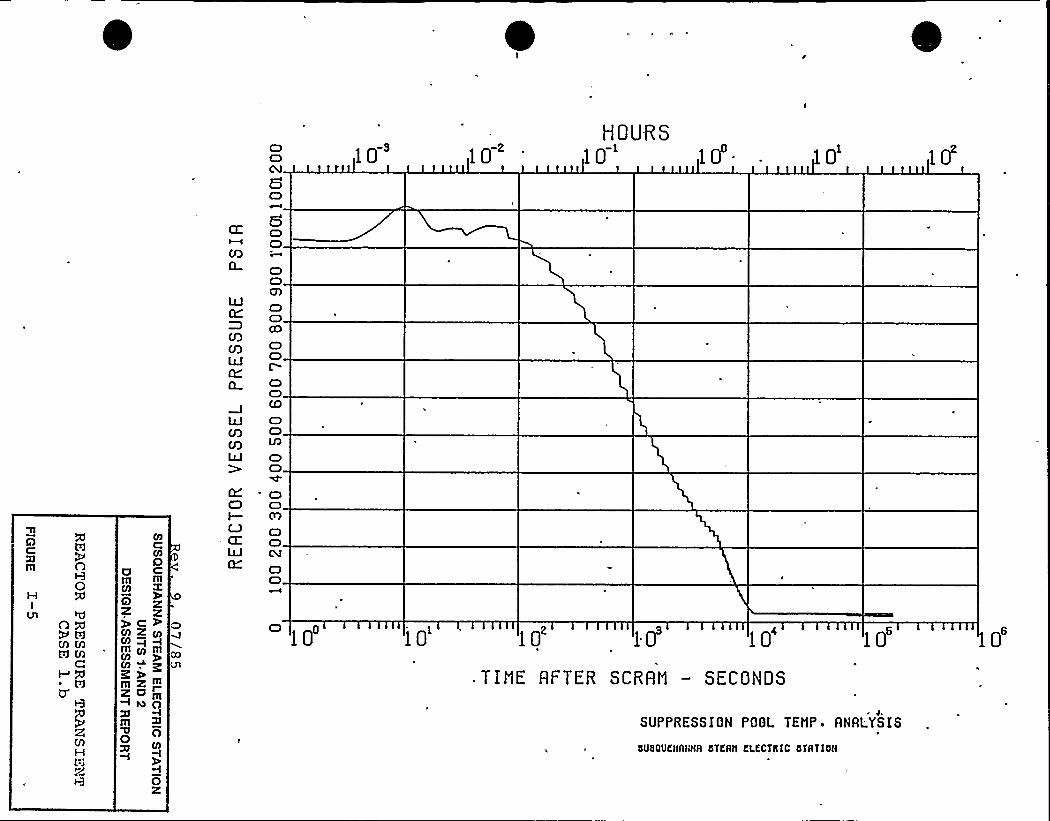
C)CI
SC)
8CIC)
10 10MOURS
10 10'. 01
c WA
O
0HI
VlO 4U) IK M
CI
0
CQI-I
R
Ch
CO
D0m m
C)
cFCO Z Ch
Mcn ~
mzPZClm~MOm
00Ol
-I
0z
UJ
(0COUJ
Q
QJCQ(QLLJ)C)I—
CC
C)CIO)C)C)(DC)IDC
CIC)CO
C)CIIDCDCD
CDC3
CIC)CU
CIC)
0 10 10 10 10 10
SUPPRESSION POOL TEMP. ANALYSIS
5U5QUCHAHHA 5TEAII CI.KCTltlC 5TAT10H
.TINE FIFTER SCRRt1 — SECONDS
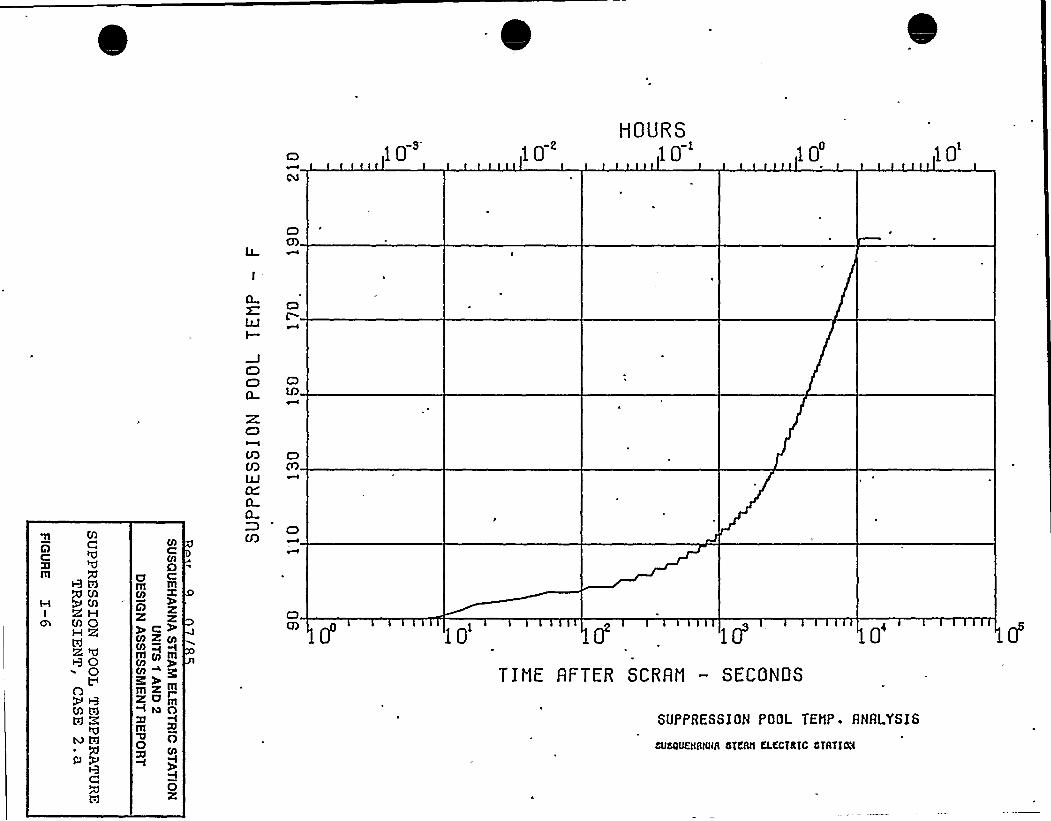
10 10HOURS
10 10 10'
CC)
IIIR tdQ MQ M
I 2'Hch MQ
H 8R %g Q
Q
OM Xtd
3'v
III
CI
CP3
Ih
MOITIm
C)2 2ye%QI 2 QlOI ~ ~0)ill (p mIII~ y,+~mlll 2 P2 cl mI Io Om
nII(II
I
02
CD
CQ ID(0QJCLCLCL
OCO 10'4
TINE FIFTER SCRRN — SECONDS
SUPPRESSTOH POOL TEMP. RNRLYSLS
IINIUQIIIINAIITfIIII KLECTIITC IITIITTI%4
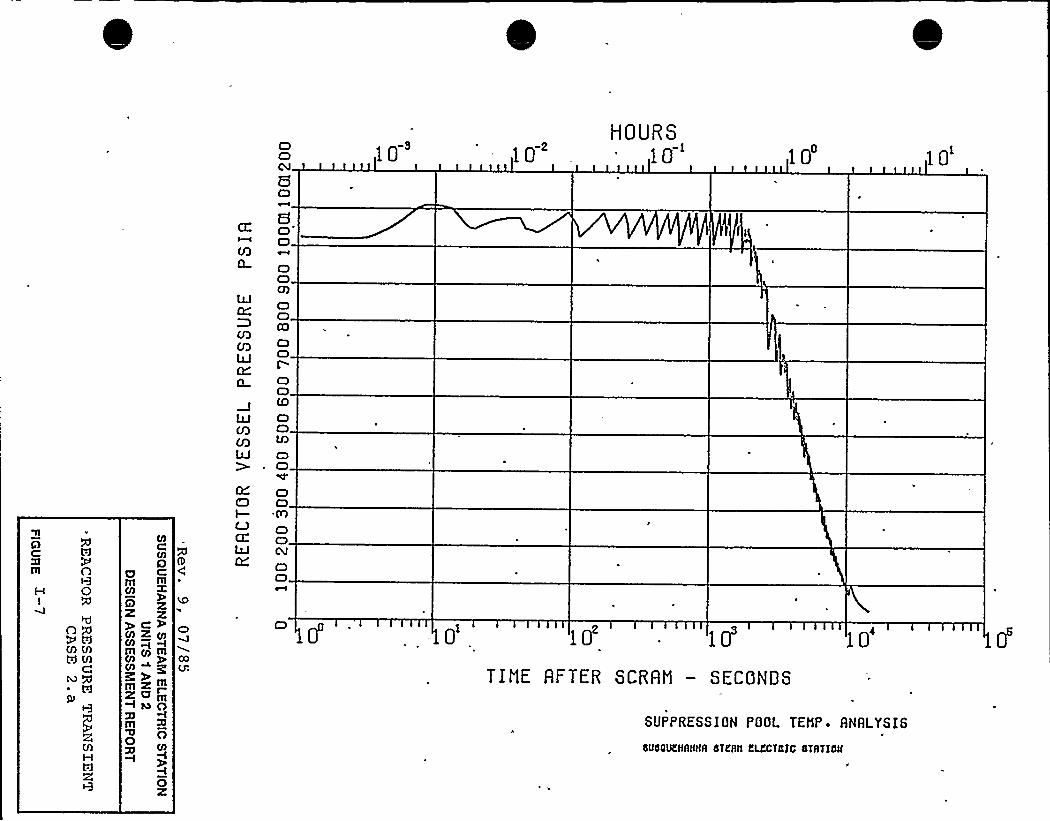
n
m
0I
OAMMW M
CM Q~ CdIU
M
Ol
og Cm mCO
9 ZZ>c2
S Z OlOl ~ +lll Ol lll
Z mZ<r+NOm
0'aOl
I
OZ
C)
00Ui
IX
(0CL
ILI
CQ(QbJ
CL
ILICOCQUJO
QC)I—
G:ILI
C3C)
6C)
s.C)C)
ClC)0)C)C)
C)C)IC3Cl(0C)C)IDC)
~ C)
C)C)'PlC)C)
C)C)
10
0l
10HOURS
10 10
10 l0
SUPPRESSIOH POOL TEMP. RHRLYSIS
dU4QLRIIAlIIIAdTKAII KLlCTEIC dTATIOU
TIf1E AFTER SCRRl1 — SECONDS
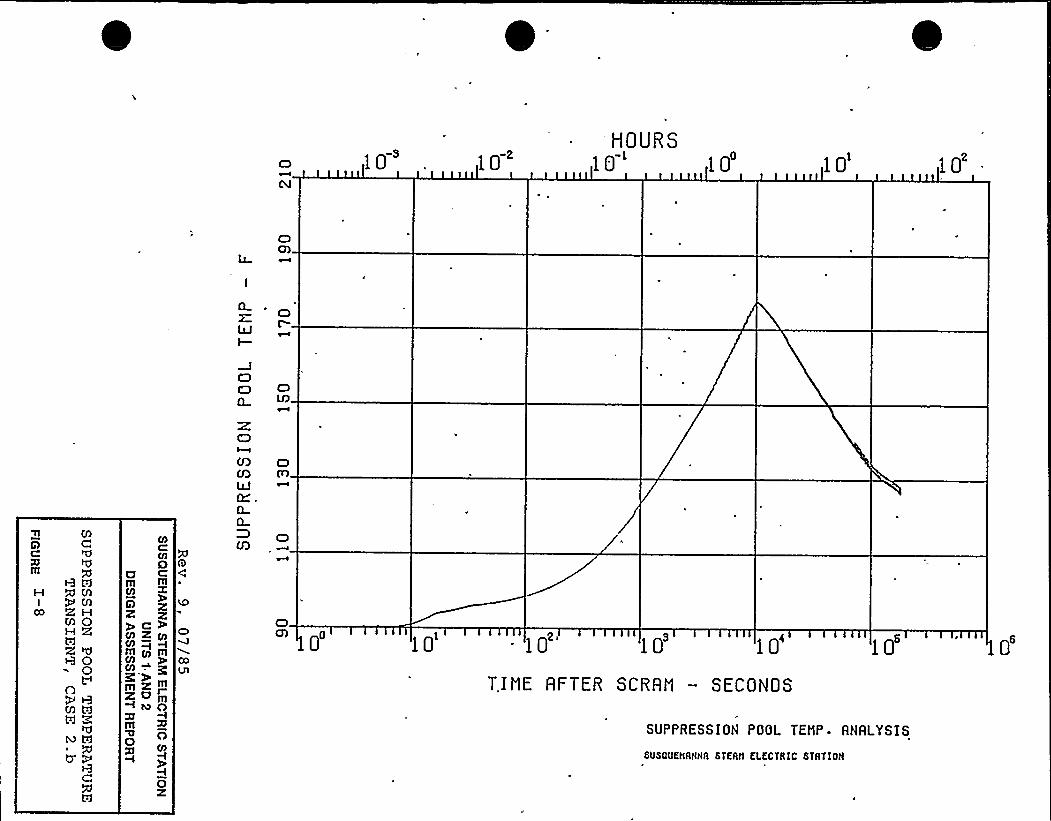
oCU
10 10HOURS1Q'0 10
C3 olO
'll MCc
mR td
H A MI ~ M
00 RHM Q
ROQt
O
M tgX Z
C
Ol
OIOITIm
9 zz>c>co z (pm+m0)
~ lD0~'~
mlTI Z ~zom~ M 0m
0'0OI
0z
C)
COVl
C7
R o03 F)QJ
0CI
U3
10 10 10
SUPPRESS?ON POOL TEMP. RNALYSIS
SUSQUEIIAHIIA S'TERII EI.ECTIIIC STATTOII
T.IME RFTER SCRRM — SECONDS
06
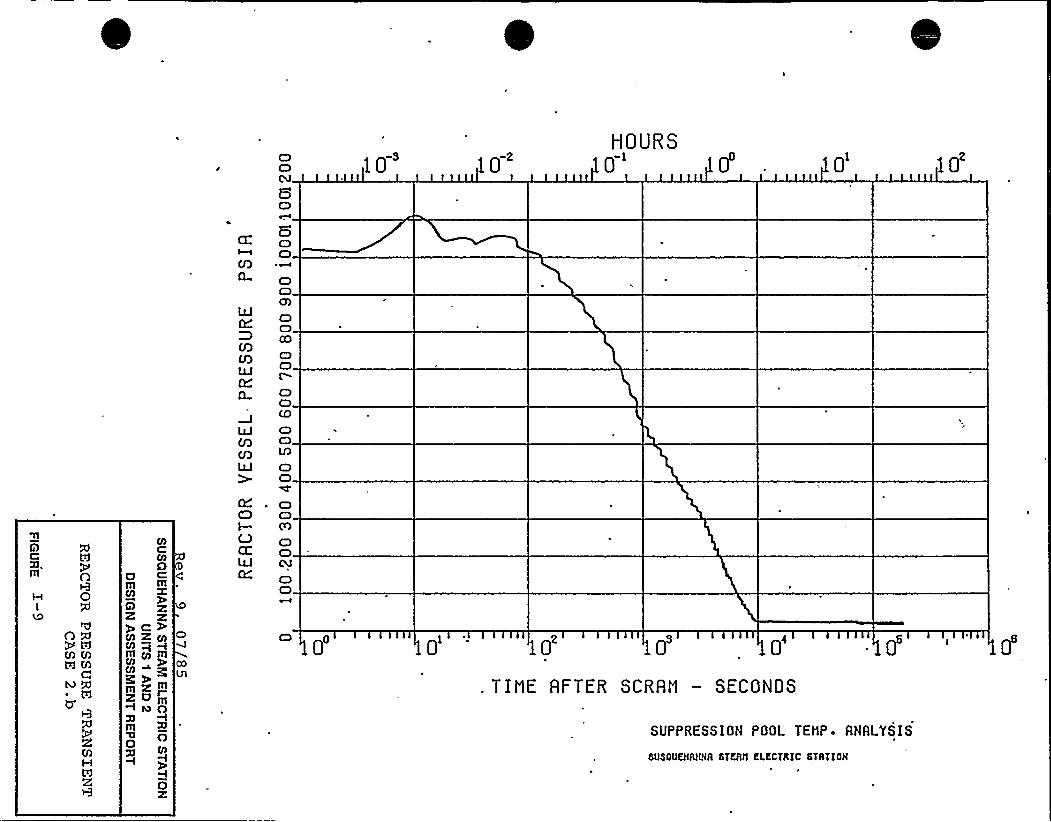
C)C)M
10 10HOURS
p-l pl
(Q0
UJCL
CQ(QUJ
CL
UJCQCQUJ
6CIC)
C)C)CD
CIC3CO
C)C)C
CICICO
C)C)LD
C)C)
QCdPill
0I
O AM MCd M
C
0A
M
Cd2
CO
COO
om m
Cl2yc>CO 2 CO
m~ lllCO
ChCn ~ ~m2m2gc~ M 0m
nCO
y02
CU
C)C)
0 0 02 pS 04
SUPPRESSlOH POOL TEl1P. RHRL'YSIS
6USQUQIAIIUA 6TCAII CLECTICIC 6TATIOII
. TINE AFTER SCRRM — SECONOS
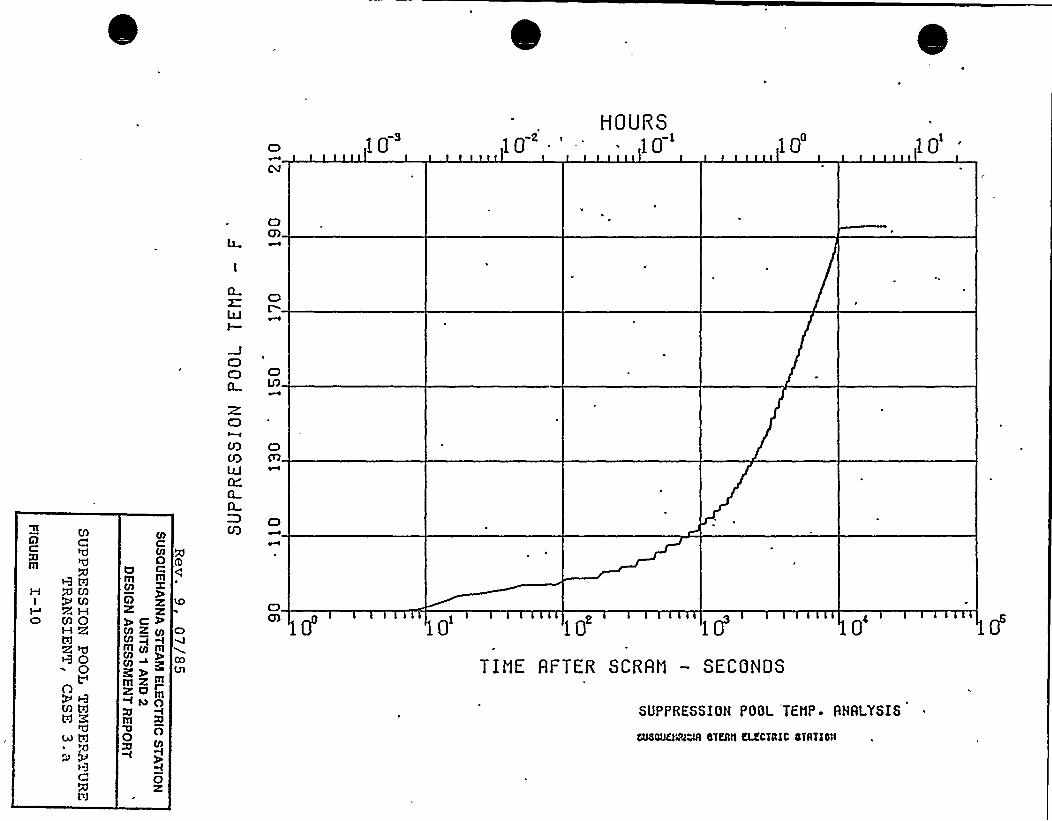
10 10HOURS
10 10
oCD
o
Mcm
H gVJRi H
Q V) C3
ROQ
O
U) tdtd ZtA N
>3
PJ
Ul
O
m mV)Q z2 c2ol z (yVl ~ ~
+~mm z rmZ C'~MO1Jm
Og u
Oz
COVl
C3
o03 KJQJQCL0
o(0
01 0
TIt1E FIFTER SCRRI1 — SfCONOS
SUPPRESSION POOL TEt1P- ANALYSIS
eueouoaam anon excm1c arano11

A
oH QI
ONM MW M
C4P +
RMHR
0l
D0m m
9R X>c>m~Ol X Ol
m OI lllOl
C~
mzP2' mI lO 0m
0 O07
I0K
C)
COVl
CC
4J
(QMhJ
Q
llJ
V7
lKCDI—L3
LU
C)CDCV
HCI
6')
C)
C)'C)G)IDC)
CDCl
C)C)
CIC)IDC)C)
C)'C)F)
C)
IDC)
10
pl
10 .
HOURS10
04
SUPPRESSION POOL TEl1P ANALYSIS
CUOQVQQNQ OTTJIII ELECTRIC OT4TISl
TII1E AFTER SCRRl1 — SECONOS
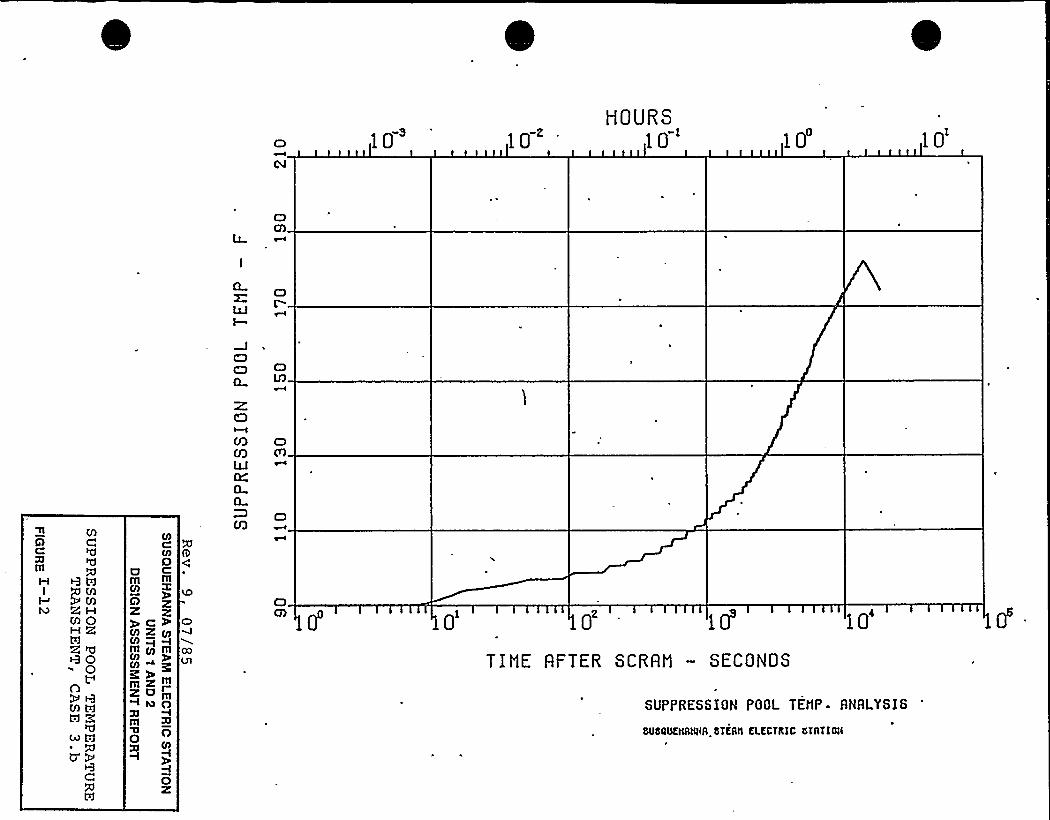
10 10HOURS
10 10
C)CD
ohlI—
CDO
Q
MQ CClll
R tTI
0 M
M 0H g
RO0O
M WtTI ZM td
Ctd
0)
DC=
m m0IGl
KCII 2.'OI0I ~ ~COIll CIl Ill
m z ~m»mI lO +
m0VI
I
O
CO
Vl
C3
(0 CD(0 F)QJQQQ
QM
pl 10
TIl1E AFTER SCRAH — SECONDS
SUPPRESSION POOL TEMP- RHRLYSlS
SUSIIUEIIAIIIIA.IITEAIIELECTIIIC 5TATTCI
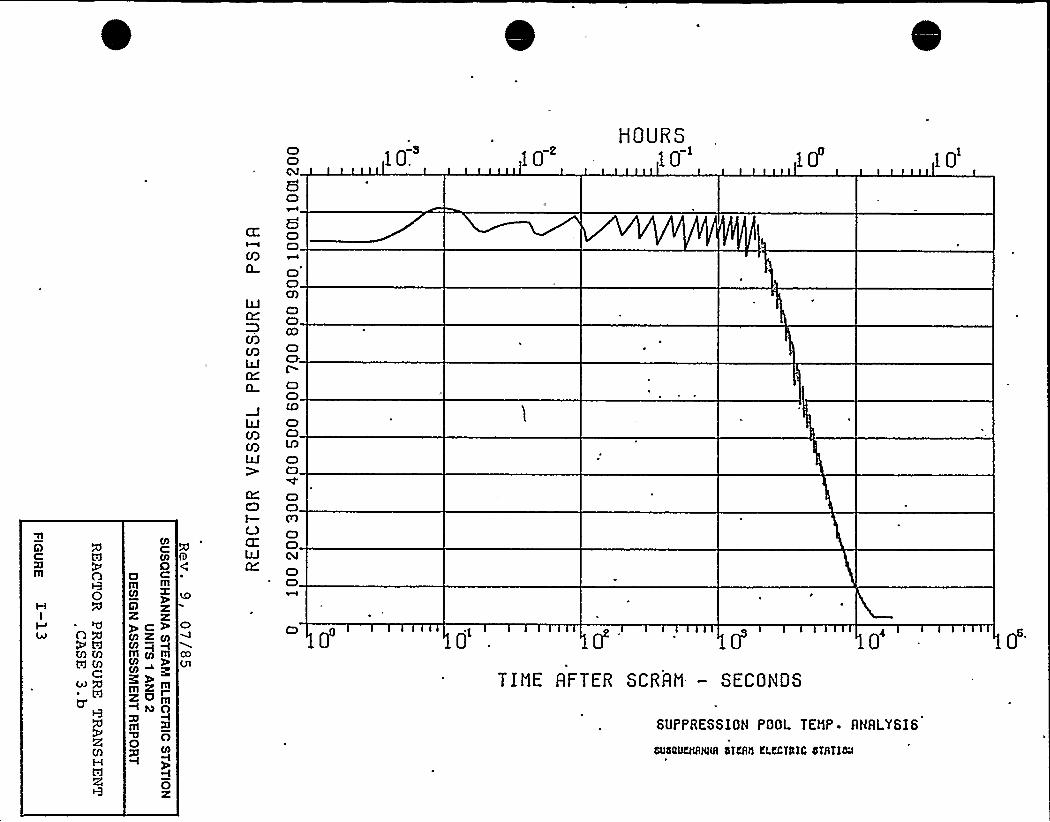
C3C)
6Cl
8C)O
Co
o'0.10
"lA
mWJyn0
I
nxW U)
C4P Q
0
aV)
ÃR
Ol
0om m
'DQ
> c2'2gM~+
mmmm
CO
~~mm2PomlMQlllU0 0I
O2
LlJ(QCQUJ)
C7CD
C)C)CD
ClCDC
C)C)CD
C)C)lDC)C3
C)C)p)C3C)C4
C3C)
pl p4
TIt1E FIFTER SCRFIN- — SECONDS
SUPPRESSION POOL TEMP. AHRLYSIS
IUOOtjQNRO 5TGltl KLCCTRTC OTRTTM
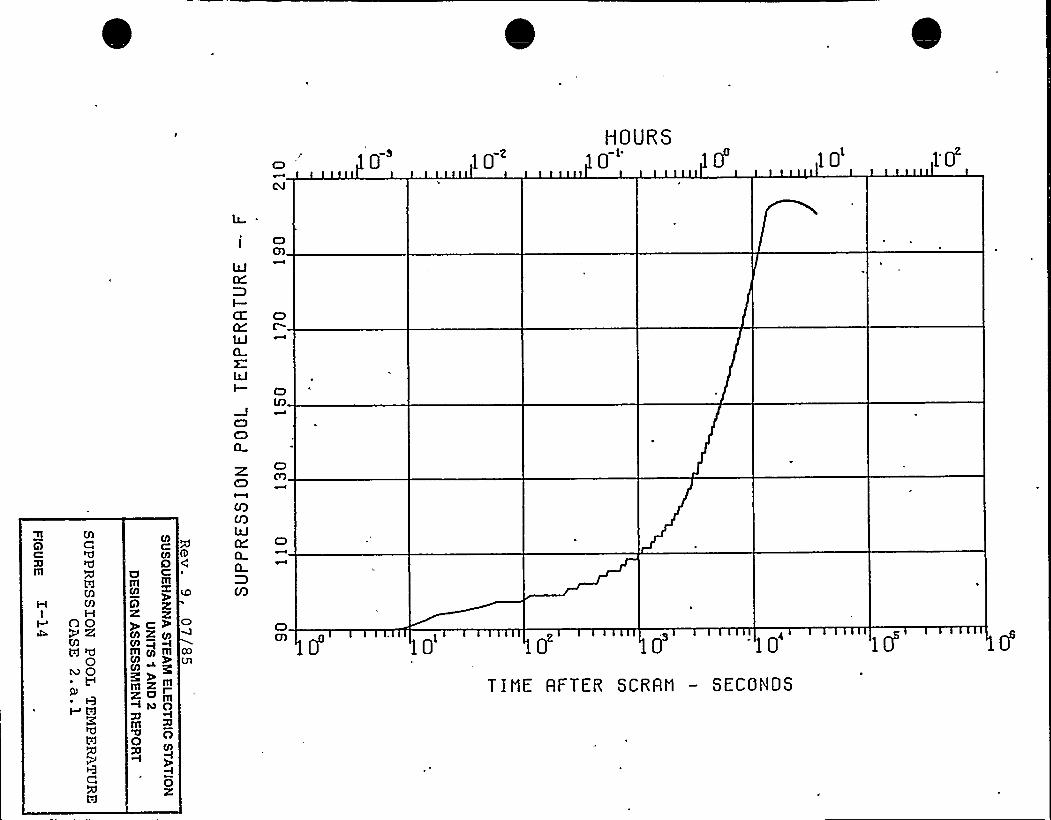
DCU
0 02
HOURSp-l
II Q)C
C d
m At6U)
I-I U)
00Q 2cU)W 'd
0rv 0
r tazd
W
DIllCO
2!'p CCO
2'll
CO
CO
COCn ~
m 2'.2'. O
I N
m
0
CO
CO
DIII
2:X
CO
m
mmO
OCO
2~
02:
00Ul
I DCA
ILI
I—CC D
C
WCL
ILIDtD
C3C3Q
z D
CQCOILI D
CL
(Q
pl 0 0
TIt1E RFTER SCRRN — SECONOS
ooCV
10 10HOURS
0' 0'
Do0
tLj OoCO
(Q(QM
oo
ILJU3
4JCO
D
QC Wm O
0
OMP AN WW M
MN Q
P td
AaMH
CO
OIDm
9 z~ I= KVI Z CII
m Co m
mzmI
I to OgJITI
OCO
0z
D
4J
p1 10 0 0
TIt1E AFTER SCRRt1 — SECONDS
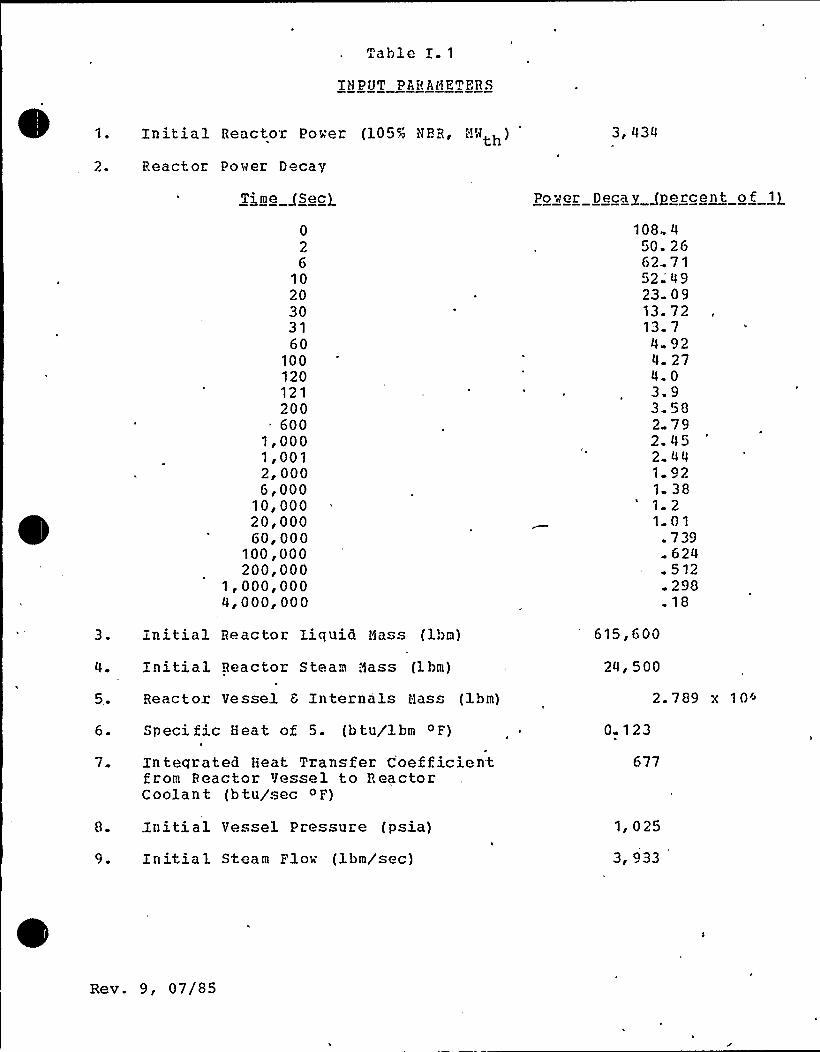
Table I. 1
I>1 PUT PAR AHETERS
Initial Reactor Po'er (105% HBB L'!'<th)
React or Power Decav
3, 434
Power Decay /percent of 1}
026
1020303160
100120121200600
1,0001,0012, 0006,000
10, 00020,00060, 000
100, 000200,000
1,000,0004, 000, 000
108506252.'3-
13.13.
4
4.3,3.22.2.1
1 0
1
1
42671490972792270958794544923820173962451229818
3.
5.
7.
9.
Initial Reactor Iiquid t]ass (ibm)
Initial Reactor Steam !4ass (ibm)
Reactor Vessel 6 Internals t1as (ibm)
Speci fic Heat, of 5. (b tu/ibm 0 F)
Inteqrated Heat Transfer Coefficientfrom Reactor Vessel to ReactorCoolant (b tu/sec o F)
Initial Vessel Pressure (psia)
Initial Steam FIow (ibm/sec)
615,600
24, 500
2. 789 x 10'
123
677
1, 025
3, 933
Rev. 9, 07/85

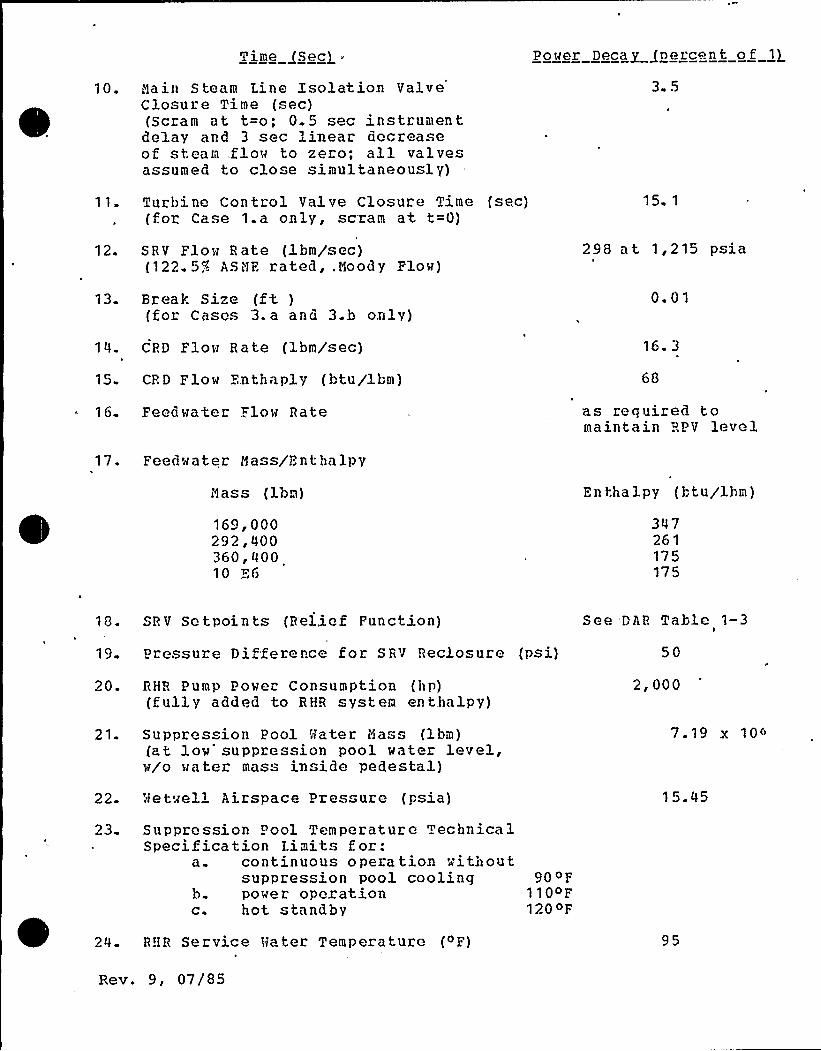
Time (Sec) ~
10. lain Steam Line Isolation ValveClosure Time (sec)(Scram at t=o; 0.5 sec instrumentdelay and 3 sec linear decreaseof steam .flow to zero; all valvesassumed to close simultaneously)
Power Deca~gnercent of 1}
3. 5
11 Turbine Control Valve Closure Time (sec)(for Case 1.a only, scram at t=0)
15. 1
12. SHV Flow Bate (ibm/sec)(122. 55 AS YF. rated, . Hood y Plow)
298 at 1,215 p. ia
13. Break Size (ft )(for Cases 3.a and 3.b only)
0. 01
14. CHD Plow Rate (ibm/sec) 16. 3
15- CHD Flow Enthaply (btu/ibm)
16. Feed water Flow Hate as requized tomaintain HPV level
17. Feed w a ter N ass/L n t ha lpy
(1 as s (ibm) Zn tha lpy (b tu/ibm )
169,000292,400360,400,10 K6
347261175175
18. SBV Sctpoints (Bel,icf Function)
19. Prcssure Di ference for SHV Heclosure (psi)
See DAP. Table 1-3I
50
20. BHH Pump Power Consumption (hp)(fully added to RHH system enthalpy)
2, 000
21. Suppression Pool Pater i~sass (1bm)(at low suppression pool water level,w/o wa ter mass in"ide pedestal)
7. 19 .x 10<>
22. '8etwell Airspace Pres" ure (psia) 15.45
23 Suppression Pool Temperature TechnicalSpecification Limits f: or:
a continuous operation withoutsuppression pool cooling
b. power operationc. hot standby
900F110oF1200F
24. HHH Service hater Temperature (OF) 95
Rev. 9, 07/85
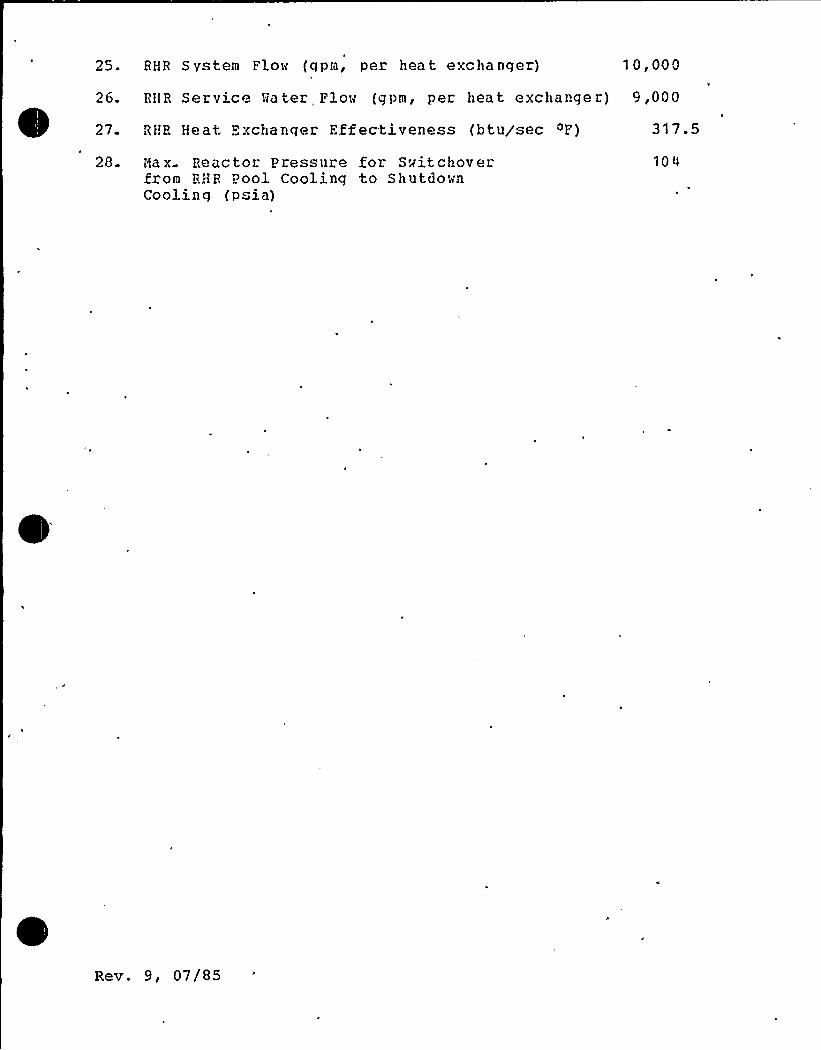
25. RHR System Flow (gpm, per heat exchanger) 1 0,000
26. BHR Service !ia ter Flow (gpm, per heat exchange r) 9,000
27. RHR Heat Exchanger Effectiveness (btu/sec ~F) 317.5
28. Hax Reactor Pressure for Switchoverfrom BHR Pool Cooling to ShutdovnCooling (p ia)
104
Rev. 9, 07/85
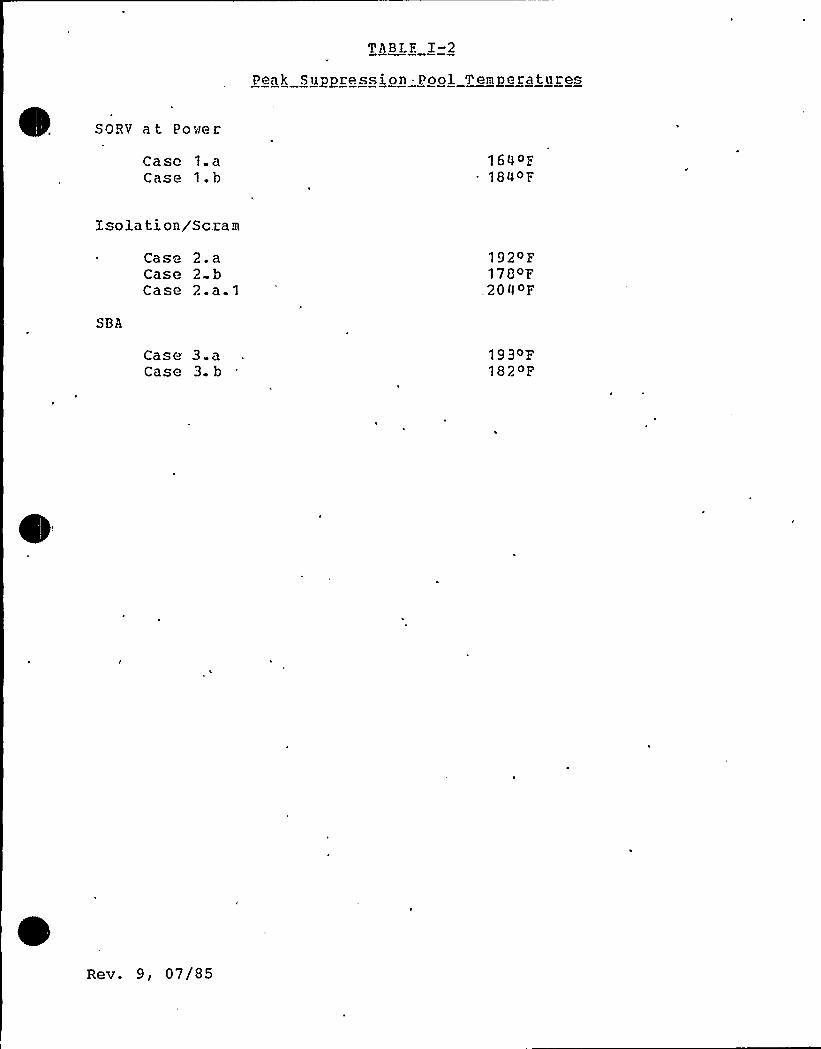
Peak Suppression Pool Temperatnres
SOBV a tPointer
Caso 1. aCase 1.h
164oF184~F
Isolation/Scram
Cas. 2. aCase 2 bCase 2. a. 1
192~F178~F
,204 ~F
SBA
Case 3.aCase 3. b
19 3~'E182oF
Rev. 9, 07/85
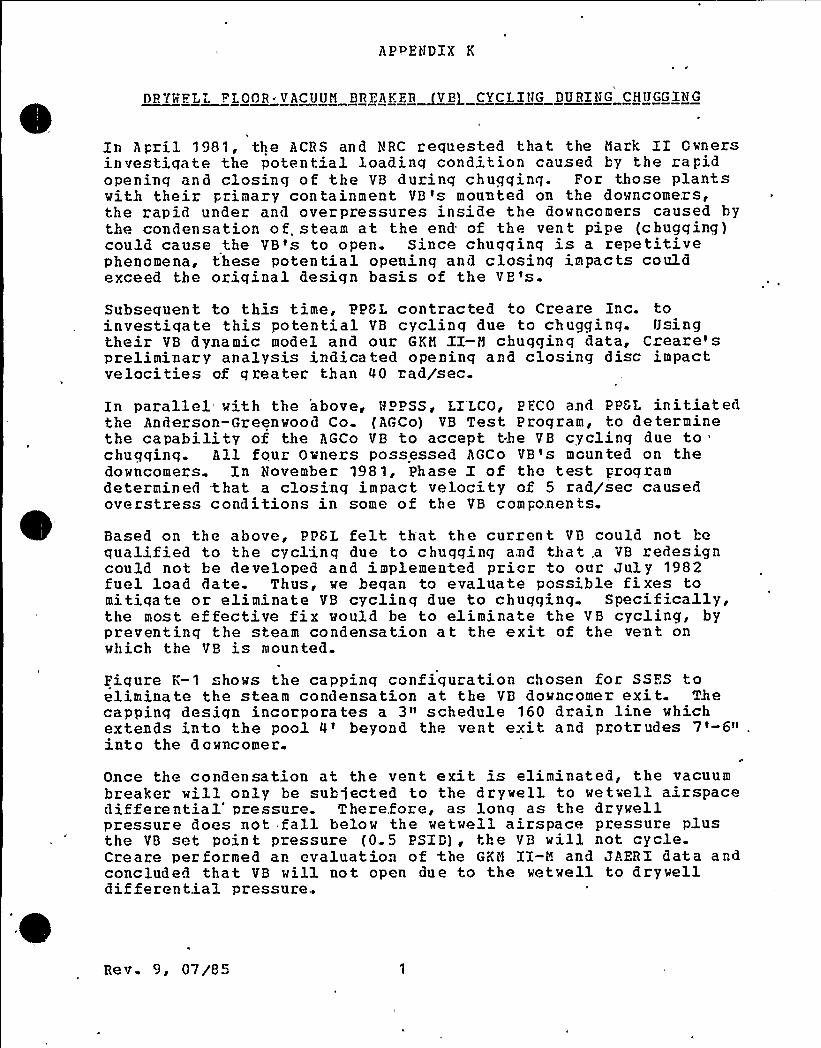
APPENDIX K
DF VViFLL FLOOR- VACUUM BRL'AKFR ~VB} CyCLING DURING CHUGGING
In April 1981, the ACRS and NRC requested that the Nark II Ownersinvestiqate the potential loadinq condition caused by the rapidopening and closinq of the VB during chuqqinq. For those plantswith their primary con tainment VB 's mounted on the downcomezs,the rapid under and overpressures inside the downcomers caused bythe condensation of. steam at the end of the vent pipe (chugging)could cause the VB's to open. Since chugginq is a repetitivephenomena, these potential opening and closing impacts couldexceed the original design basis of the VB's.
Subsequent to this time, PPGL contracted to Creaze Inc. toinvestigate this potential VB cycling due to chugging. Usingtheir VB dynamic model and our GKM II-N chugging data, Czeare'spreliminary analysis indicated opening and closing disc impactvelocities of greater than QO radar'sec.
En parallel with the above, HPPSS, LI'LCO, P FCO azd PPSL initiatedthe Anderson-Greenwood Co. (AGCo) VB Test Program, to determinethe capability of the AGCo VB to accept the VB cyclinq due tochuqqinq. All four Owners possessed AGCo VB's mounted on thedowncomers. In November 1981, Phase I of the test Progzamdetermined that a closing impact velocity of 5 rad/sec causedove rstres" cond itions in some o f the VB corn ponen ts.
Based on the above, PPGL felt that the current VB could not hequalified to the cyclinq due to chugging and that,a VB zedesigncould not be developed and implemented prior to our July 1982fuel load date. Thus, we began to evaluate possible fixes tomitigate or eliminate VB cycling due to chugging. Specifically,the most effective fix would be to eliminate the VB cycling, bypreventinq the steam condensation at the exit of the vent onwhich the VB is mounted.
Fiqure K-1 hows the cappinq configuration chosen for SSFS toeliminate the steam condensation at the VB downcomer exit. Thecapping design incorporates a 3» schedule 160 drain line whichextends into the pool 0'eyond the vent exit and pzotrudes 7'-6»into the downcomer.
Once the condensation at the vent exit is eliminated, the vacuumbreaker will only be subjected to the drywell to wetwell airspacedifferential'ressure. Therefore, as lonq as the drywellpressure does not fall below the wetwell airspace pressure plusthe VB set poin t pressure (0 5 PSID), the VB will not cycleCreare per formed an evaluation of the GKN II-N and JAZRI data andconcluded that VB will not open due to the wetwell to drywelldifferential pressure.
Re v. 9, 07/8 5
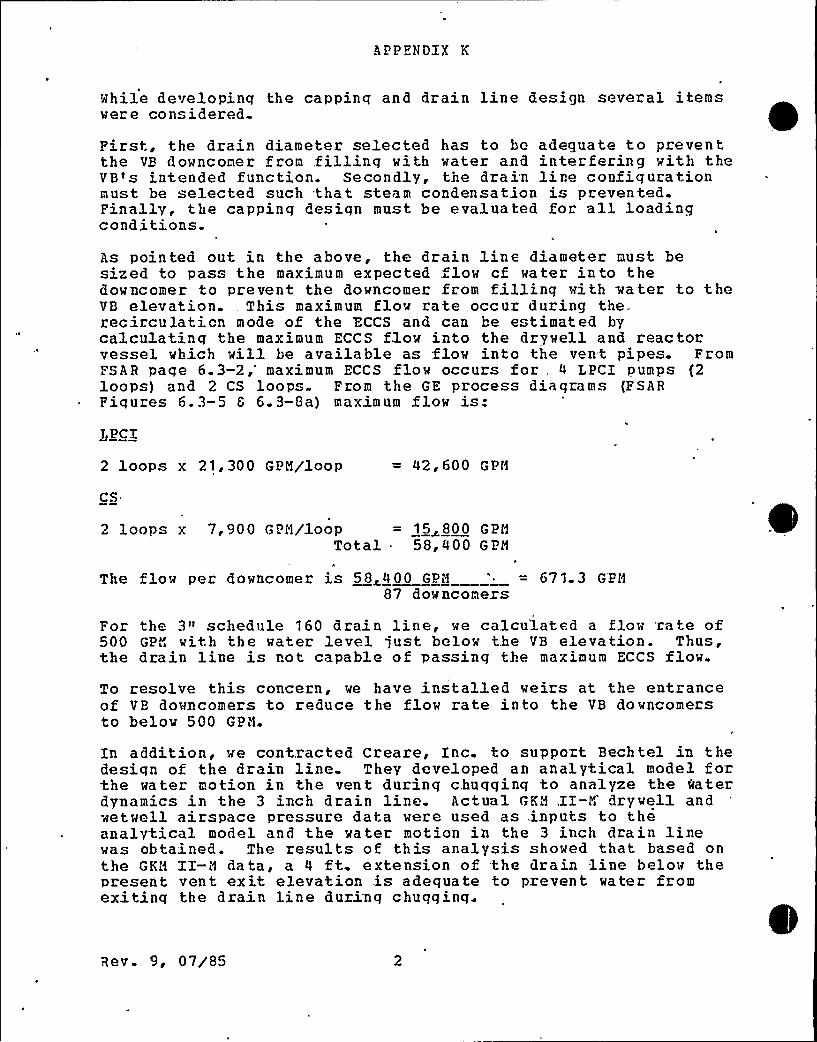
APPENDIX K
while developing the cappinq and drain line design several itemsvere considered.
First, the drain diameter selected has to bo adequate to preventthe VB downcomer from fillinq with water and interfering vith theVB s intended function. Secondly, the drain line configurationmust be selected such that steam condensation is prevented.Finally, the capping Qesiqn must be evaluated for all loadingconQitions.
As pointed out in the above, the drain line diameter must besized to pass the maximum expected .flow cf water into theQowncomer to prevent the Qovncomer from filling with water to theVB elevation. This maximum flow rate occur during therecirculation mode of the ECCS and can be e timated bycalculatinq the maximum ECCS flow into the dryvell and reactorvessel which will be available as flow into the vent pipes. FromFSAR page 6.3-2,'aximum ECCS flow occurs for, 4 LPCI pumps (2loops) and 2 CS loops. From the GE process diaqrams (PSARFiqures 6. 3-5 6 6. 3-Oa) maximum flow is:LPCI
2 loops x 21, 300 GPM/loop 42, 600 GPH
CS
2 loops x 7,900 GPM/loop = 15 800 GPMTotal 58,400 GPM
The flow per dovncomer is 58~400 GPM' 671 3 GPM
87 dovncomers
For the 3'~ schedule 160 drain line, we calcu'lated a flow rate of500 GPM with the water level just below the VB elevation. Thus,the drain line is not capable of passing the maximum ECCS flow.
To resolve this concern, we have installed weirs at the entzanceof VB dovncomers to reduce the flow rate into the VB downcomersto below 500 GPM.
In addition, ve cont.racted Creare, Inc. to support Bechtel in thedesiqn of the drain line. They developed an analytical model forthe water motion in the vent during chuqqinq to analyze the waterdynamics ia the 3 inch drain line. Actual GEM,II-M'rywell andwetvell airspace pressure data were used as, inputs to theanalytical model and the water motion in the 3 inch drain linevas obtained. The results of this analysis shoved that based onthe GKH ZI-M data, a 4 ft extension of the drain line belov thepresent vent exit elevation is adequate to prevent water fromexitinq the drain line duri'nq chuqqinq.
Re v. 9, 07/85

A PPZNDIX
Further, the analy'sis showed 'that a 7-1/2 ft extension of thedrain line into the vent should be aQequate to prevent the waterfrom ",fountaininq!': into the vent during the rapid drywelldepressurization caused by the gross chugginq at the downcomerexits. Again, this conclusion is obtained using the GEM II-Mdata.
In addition, capping 'five of the eiqhty-seven downcomers requiresevaluating the effects on the folloving:
00000
peak drywell pressurepool swellLOCA steam condensation load definitionvent clearinq loadasymmetric effects
Our evaluation of the above indicates the following:Peak ~Dr well Pressure
GE re-calculated our peak drywell pressure based on 82downcomers and the same inputs as were used for theoriginal calculation. Their results indicated a peakdr ywell pressure of 44. 2 psig ( vs. 43. 8 psig foreiqhty-seven vents). This is less than the containmentdesign pressure of 53 psiq and less than the Pa = 45psiq used for the Type A Integrated Leak gate Test.
Pool Swell
To,determine the effect of capping five of the eighty-seven downcomers on the pool swell loads, the BechtelPool Swell Model (R ef erence 84) instead of the Mark IIgeneric pool sve11 model PSAM (Reference 8) vas used.This choice was made because the realistic estimate o fthe effects of cappinq was desired. This could not bedone usinq a pool swell model developed for highlyconservative estimates (PSAM), rather, a model whichcontains sufficient physics to make an adeguate
-comparison vith both tull and subscale experimentaldata vas required. Using the Bechtel Pool Swell Model,two pool swell transients vere calculated and theresults compared. The SSES plant parameters (dryvellvolume, .submerqences, etc ) vere obtained from the SSESDAB. The first transient calculated vas for eighty-tvoactive (uncapped) downcomers, and thus used thepressure-. temperature transient recalculated by GZ foreiqhty-tvo downcomers. The second transient was .foreighty-seven downcomers and used the pressure-temperature transient for eighty-seven dovncomers.
Eev. 9 07/85
APPENDIX K
Pool swell can be characterized by the maximum value ofthe swell heighth HM and the maximum well velocityU . Table 1 compared these values «ith and withouttPe five dour comers capped. The results verify theconsezvatism of our original pool swell calculations.
o T,OCA Steam. Condensation Load Def initicnBesides containment geometry, the chugging/CO pressuretransient i s a function of chug souzce strength and thenumber of sources. The capping of five downcomezswill, thus, potentially have offsetting ef fects. Sincethe number of active vents passing steam from thedrywell to the wetwell is zeduced and the mass andenergy release into the drywell is about the same, thevent mass flux could rise which would increase the chugsource strength. However, because there are five fewersources in the same conta'inment volume, the pressuresmay not increase. Subscale experimental investigationof the chugqinq pnenomenon by Creare (Deference 85)indicated that chug source strength increasedmonotomically with steam 'mass
flux.'xamination
of the vent steam flow rates calculated byGF. reveals a 0.5% difference between the 82 and 87 ventcases.'hus, according to the Creaze results to a veryqood approximation, the chug source is the same for 82and 87 vents. To determine t;he effect of the downconerca ppinq on the LOCA load def inition, a calculation wasmade usinq 82 design chug sources. Althouqh pzessureextrema were larger at various locations on thecontainment boundary foz 82 active vents than for 87vents, the mean-square pressure, which is the bettermeasure of the chuqqing load, is everywhere less aswould be expected. =Table 2 gives the variation of themean-square pressure around the containment at theouter wall and basemat junction.Vent Cleari~n
The submerqed structure drag load due to bubblec,'harqinq prior to pool swell was calculated using theIHEGS acoustic methdoloqy (see DAP. Subsection 4. 2. 1.7) .For containment desiqn, an empirical source wasdeveloped from the 4TCO test data. Examination cf thevent air flow rates given in the General Electric mass-emerqy release analysis for 82 and 87 vents shows. thereis very little difference between them. The air-clearinq source strength is intimately connected withair flow rate, thus, the 82-vent SOURCE will be thesame as the 87 vent source. The air-clearing sourceis, however, of very low frequency. Therefore, based
Rev. 9, 07/85
APPENDIX K
L
on the previous results, the same trend .in the mean-sguare pressure can be inferred.
o Asymmetric Effects-
The VB downcomers are located symmetrically around thecontainment every 600. Thus, we expect no'increasedasymmetric ef fects as a result of capping the five VBdo wn co mers.
Based on the above discussion, we believe that capping the fiveVB downcomers eliminates the VB cycling due to chugging, with ~oadverse effects on the SSES design.
Rev. 9, 07/85
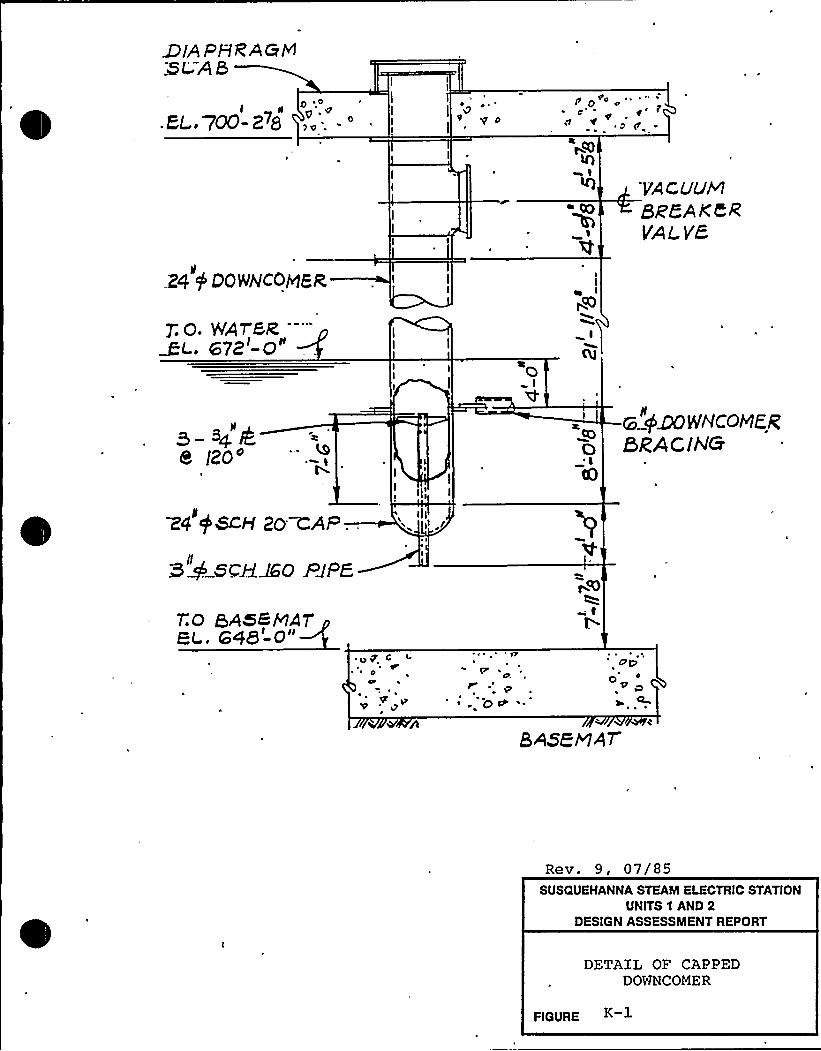
NIP PR R'4 G Yl4L AS
~ 0
. Et, 700- 278 p
P g " od~ c'q1 V
VAG UUMBRPA KE'RVAzYz
ZP $ DOWNCOMGR
7 o. @ArszML. 672 - 0
I
~OQ
I
col
3g8 120'-
a y~NWcoMERBRAC IM&
74 f~H 20 CA'P ..
8 +mcA.Mo RdF E
ro 6<~8 MArec. 648 -0"
.oF0
~tv'0 '
a~"O 'P
R
SASH MA,7
Rev. 9, 07/SSSUSQUEHANNA STEAM ELECTRIC STATION
UNITS 'I AND 2DESIGN ASSESSMENT REPORT
DETAIL OF CAPPEDDOWNCOMER
RGURE K-j-
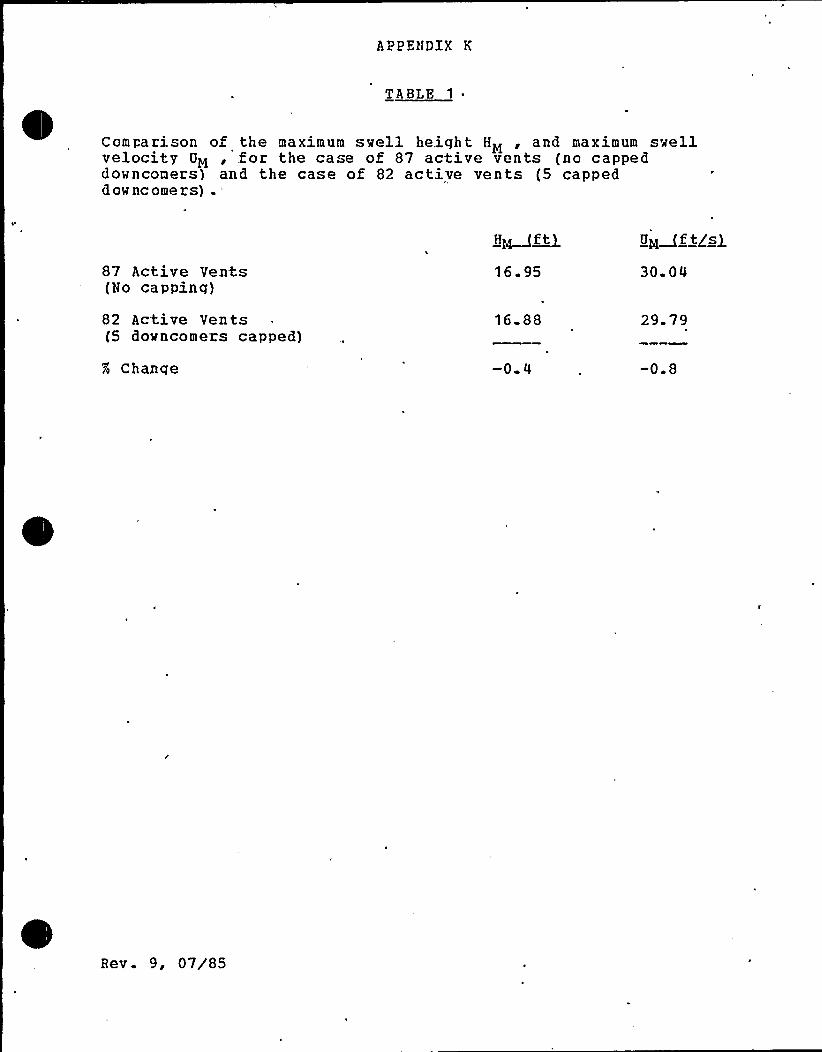
APPEHDXX K
TABLE 1 ~
Comparison of the maximum swell height 'HM, and maximum swellvelocity U~, for the case of 87 active vents (no cappeddowncomers) and the case of 82 active vents (5 cappeddowncomers)
.'7
Active Vents(No capping)
82 Active Ven ts(5 downcomezs capped)
7o Change
H~~ft16.95
16 88
-0 4
Up~ ftgsg
30 04
29 79
-0.8
Rev. 9, 07/85
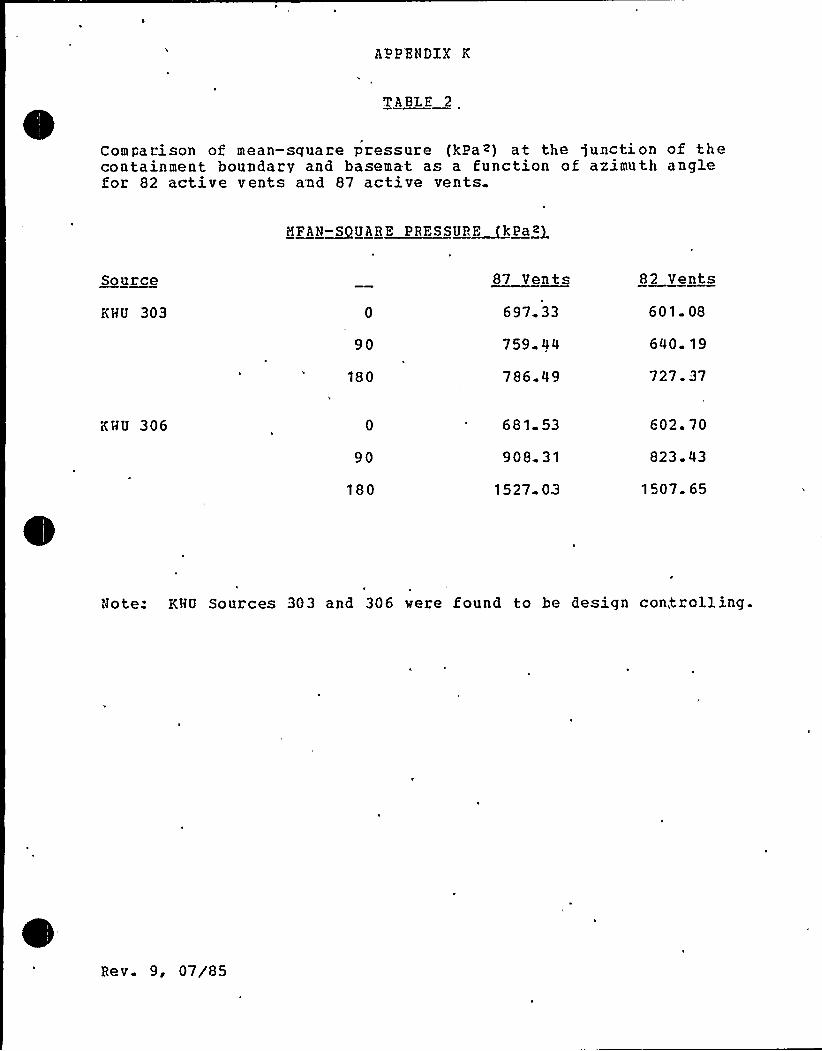
APPENDIX K
TABT.E 2,
Comparison of mean-sguare pressure (}>Pa~) at the junction of thecontainment boundary and basemat as a function of azimuth anglefor 82 active vents azd 87 active vents.
KPAN~SUARE PRESSUFE~kPa~)
Source 87 Vents 82 Vents
KHU 303
90
180
697 33
759.04
786 09
601. 08
640. 19
727. 37
KHU 306
90
180
681 53
908 31
1527-03
602.70
823.43
1507 65
Note: KHU Sources 303 and 306 were found to he design controlling.
Be v. 9, 07/85
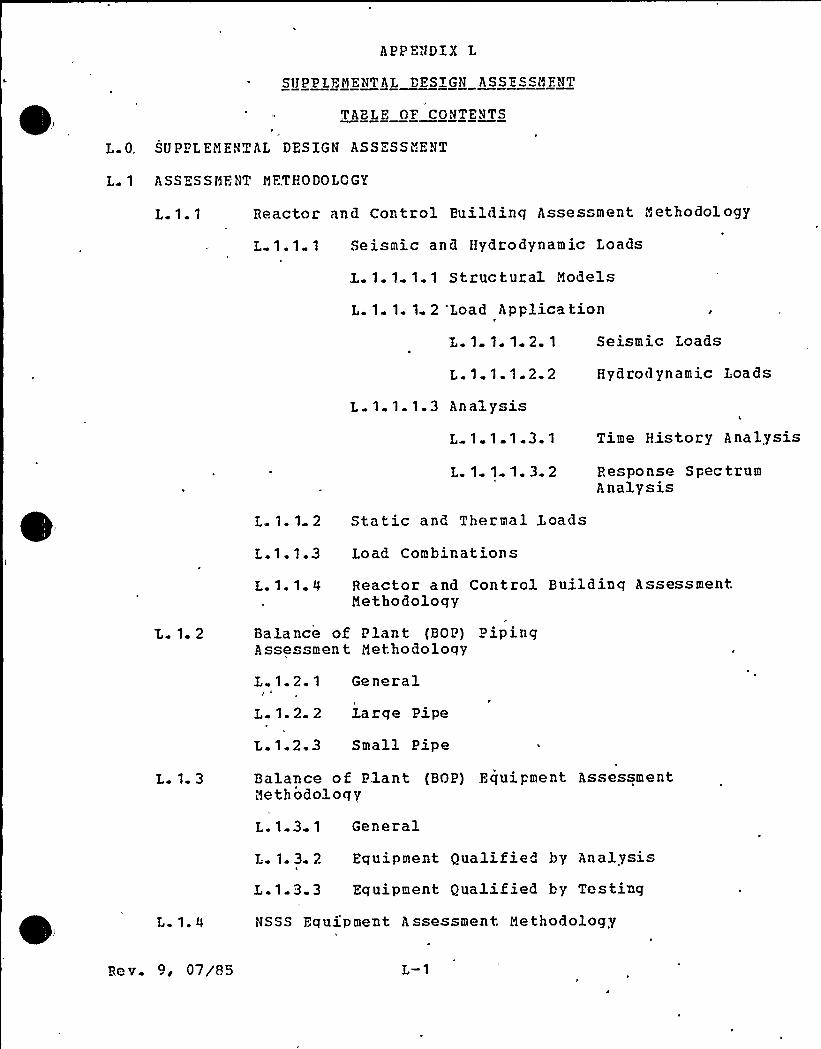
APPENDIX L
SIJ PPLE MENTAL DESIGN ASSR S SM FNT
TABLE O7 CONTENTS
L 0, SUPPLEMENTAL DESIGN ASSESSMENT
L 1 ASSESSMENT MFTHODOLCGY
L 1.1 Reactor and Control Building Assessment Methodology
L 1.1 1 Seismic and Hydrodynamic Loads
I..1.1.1.1 Structural Models
L. 1. 1. 1. 2 'Load Applica tionV
I 'I 1.1 2.1
L.1 1.1 2.2
L. 1. 1. l. 3 Analysis
L 1-1.1-3-1
Seismic I.oads
Hydrodynamic Loads
Time History Analysis
L.1 1 1.3 2
L. 1. 1. 2 Static and Thermal I oads
L.1.1.3 Load Combinations
Response SpectrumAnalysis
1. 2
L. 1. 1. 0 Reactor and Control Buildinq AssessmentMethodology
Balance of Plant (BOP) PipinqAssessment Methodology
I, 1 2 1
L 1 2 2
General
Large Pipe
L 1 3
L.1.2.3 Small Pipe
Balance of Plant (BOP) Equipment AssessmentMethodology
L.1 3.1 General
L 1.4
L. 1. 3. 2 Equipment Qualified by Analysis
I,.1.3 3 Equipment Qualified by Testing
NSSS Fquipment Assessment Methodology
Re v. 9, 07/85 L-1
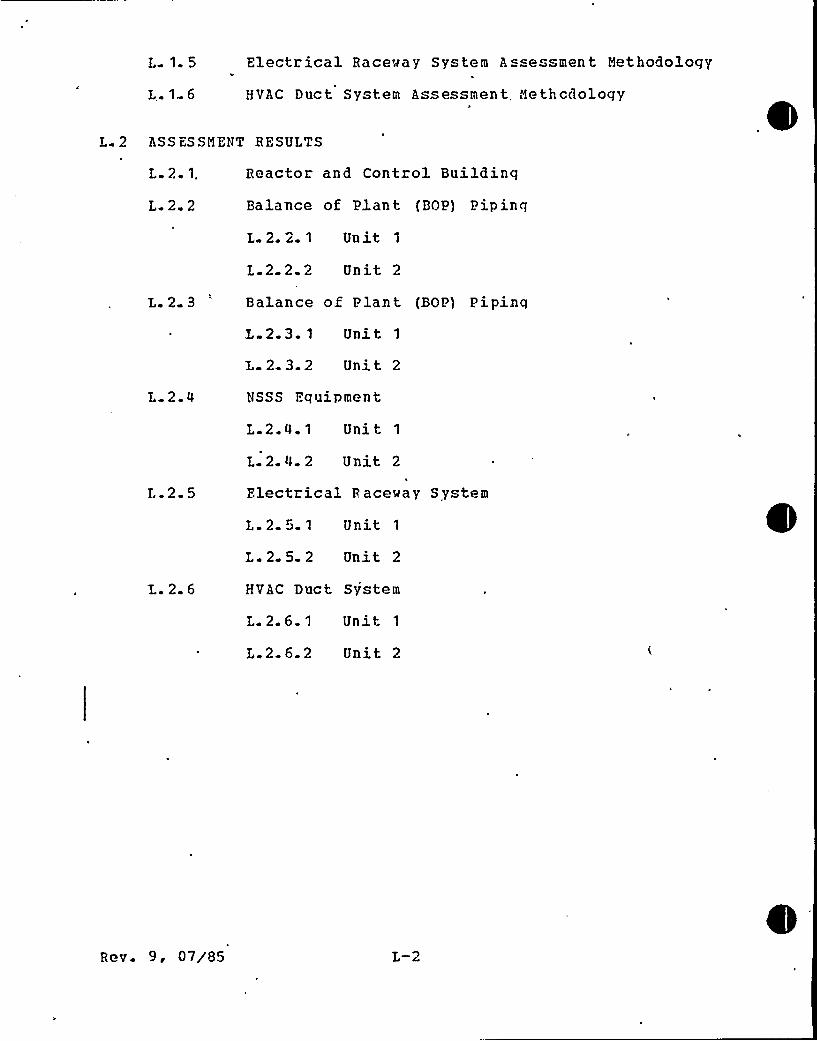
L 1.5
L.1 6
Electrical Raceway Sys tem As essmen t thet hoQology
HVAC Duct. System Assessment. Hethc<lology
L- 2 ASS ES SNENT RESULTS
L 2 1.
L 2 2
L 2 3
L 2.4
L.2. 5
L. 2.6
Reactor and Control Buildinq
Balance of 'Plant {BOP) Piping
L. 2. 2. 1 Un it 1
L.2.2.2 Unit 2
Balance of Plant (BOP) Piping
L 2.3. 1 Unit 1
L.2.3.2 Unit 2
NSSS Equipment
L.2.4.1 Unit 1
L. 2. 4. 2 Unit 2
Electrical Raceway System
L. 2. 5. 1 Unit 1
L.2.5 2 Unit 2
HVAC Duct System
L. 2. 6. 1 Unit 1
L.2.6.2 Unit 2
Rev. 9, 07gS5 L-2
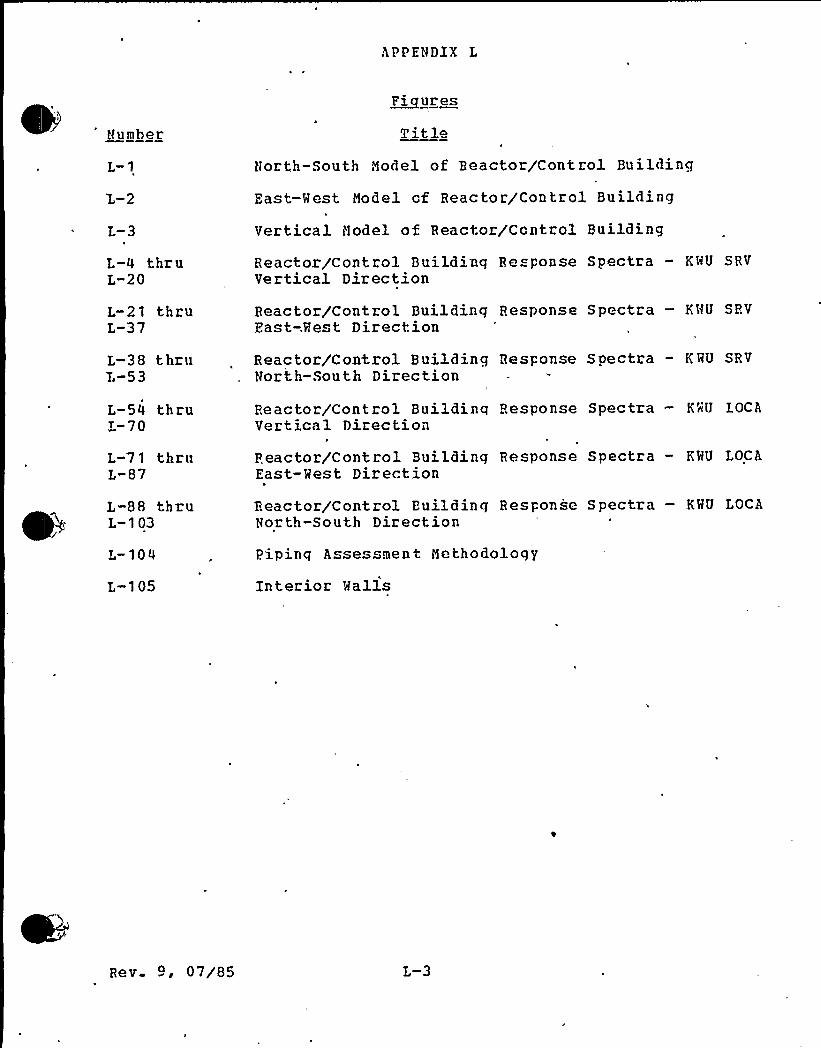
APPENDIX L
Number
~Pi ur es
Title
L-4 thruL-20
North-South Model of Reactor/Control Building
East-West Model cf Reactor/Control Building
Vertical Model of Reactor/Control Building
Reactor/Control Buildinq Re ponse Spectra — KWU SRV
Vertical Direction
L-21 thruL-37
Reactor/Control Building Response Spectra — KHU SFVFast-.Hest Direction
L-38 thruL-53
~Reactor/Control Building Response Spectra - KHU SRVNorth-South Direction
L-54 thruL-70
Reactor/Control Building Response Spectra — KHU LOCAVertical Direction
L-71 thruL-87
Feactor/Control Buildinq Response Spectra — KHU LOCAEast-Hest Direction
L-88 thruL-1 03
Feactor/Control Building Response Spectra — KHU LOCANorth-South Direction
L-104
L-105
Pipinq Assessment Methodology
Interior Walls
Rev 9, 07/85 L-3
(APPENDIX L
T ABLES
Number Ti tie
L-2
Equipment Selected .for Heassessment
Stress Marqins for Interior halls
Design Marqins for Selected Piping Systems
8 ev. 9, 07/85 L-4
I .0 ."SUPPLEMENT AL EES IGH ASS ESSM ENT
Durinq the second and third quarters of 1982, the Reactor/ControlBuildinq dynamic models for the Fast-Me t, North-South andVeritcal directions were reviewed and rechecked. The thoroughinve tiqation into the formulation of the original dynamic modelsidentified various discrepancies in modeling assumptions andrepresentations which warrented model revi ions to determinetheir impact, if any, on the safe operation of the plant. Themodel revisions, revised response spectra and assessment programsare briefly presented .in this appendix and extensively discussedin the followinq reports»YCAR 1-79 Final Report on VerticalDynamic Analysis" '(transmitted in PLA-1122), «Summary Text ofHorizontal Dynamic Analysis Reassessment» (transmitted in PLA-1184) ~ »Summary. Report of Reactor/Control Euilding VerticalDynamic Analysis Recheck/Review,« and »Summary Report ofReactor/Control Building Evaluation of Hydrodynamic ResponseSpectra Hxceedances of 'Revised Design Basis"..
The first section of this appendix discussed the methodologyutilized to. assess the'dequacy of safety related structures,systems and components. The second section summarizes theresults of the assessmen t program.
Hev. 9, 07/85 L-5
I.. 1 ASS ESSl<EHT i1ETHOCOI.OGY
1. 1 - - Reactor and Control Building Assessment Methodology
L..1. 1. 1. Seismic and- Hydrodynamic Loads
L. 1. 1. 1. 1 Structural Models./
For each direction, the reactor and control building isrepresented by a single model because of the monolithicconstruction The reactor/control building vertical andhorizontal models are lumped-mass-beam stick models havingmultiple sticks which are supported on a 'common rigid basemat.The detailed description of the revised mathematical models,which are used in both seismic and .hydrodynamic analysis, isqiven in Subsection 3.7.b.2.1 of the FSAR. The originalstructural models for the north-south, east-west, and verticaldirections are shown in Figures C-1, C-2 and C-3 respectively;.
'while, the revised models are shown in Figures 7.-1, L-2 and l-3.T.- 1- 1. 1 2 Loarl~hplication ~
L 1. 1.'1. 2. 1 . Seismic Loads
The seismic .loads/analysis techniques are discussed in Subsection3.7.5.2 1 of the FSAB.
L. 1. 1. 1. 2 2 Hydrodynamic Loads
Hydrodynamic loads are discussed in Subsection 7.1 1.2.1 of theDAR
T~. 1. 1. 1. 3 Analysis
L. 1 1..1 3 1 ~ Time History Analysis
A time history analysis, as discussed in Subsection7.1.1.2.1.3.1, was performed using the revised models shown inPiqures L-1, L-2 and L-3. As'n previous time history analyses,nodal point response spectra generated from several loadconditions/traces were enveloped into one set of floor responsespectra curves which represent OBE, SSE, SBV and LOCA. Theresponse spectra were generated in two sets of damping values,the low and hiqh dampinqs. The low damping values are 1/2, 1 and2 percent of critical, and the high dampinq values are 3, 5 and 7percent of critical The peak freguencies of the spectra arebroadened by +]5 percent for both low and hiqh damping values.
The acceleration response spectra for low dampinq values for SBVand I.OCA are shown in .Fiqures J.-4 to L-103
B ev. 9 < 07/85 L-6
L 1 1.1 3. 2 Response ~Sectrum Analysis
A response spectrum analysis for seismic 'loads was performedusinq the revised structuzal models to determine forces andmoments wi thin the structural members. The analytical procedureis presented on the flow chart shown in Piqure 7-8. The dampingvalues are 2/~ and 51~ for load combinations involving OBF. and SSZrespectively. For ~ seismic loads the OBZ and SSK design responsespectra, as discussed in Subsection 3.7b.1.1 of the FSAR weredirectly applied. For hydrodynamic loads the responses of thereactor/control building are generally lower than thosedetermined from pzevious analyses. Therefor'e, it is concludedtha't the resultinq forces and moments wi11 be lcwez. The resultsfrom previous analyses were used in the structural assessment.
L. 1-1.2 Static and Thermal Load
, The static and thermal loads used in the supplemental'designassesshent discussed within this appendix aze unchanqed fromth ose used in other anal yses.
L. 1. 1. 3 Load Combinations
Siqnificant load combinations for the supplemental desiqna sessment discussed within this appendix are determined based onprevious assessment results in conjunction with an examination ofthe revised response spectra.
L. 1 1.4 Reactor and Control Building Asse sment Methodology
Major shear walls, interior walls, floor slabs, steel beams,block walls, refuelinq pool qirders, and the steel superstructuzewere considered in the structural assessment of thereactor/control building. The results of the response spectrumanalysis, as described in Subsection L. 1 1. 1.3. 2, are used todetermine the forces and moments in the ma jor shear walls,interior walls, floor slabs and steel beams. The significantload combinations and critical sections in all three directionsare determined based on the assessment results contained inAppendix E.
Blockwalls serve as local partitions and as such are not aninteqral part of the .buildinq's structuzal system. Theassessment is performed according to the methodology presented inPSAR Subsection 3.7b.3.1.5 The accelerations taken from thefloor response spectra were used in the blockwall design process.As part of the assessment, floor accelerations from the revisedrespon e spectra are compared to those values used in design.Blockwalls aze qualified by inspection wherever the .revisedaccelerations are less than the desiqn values. If this was notthe case, the blockwalls were evaluated based on the methodologypresented in PSAR Subsec tion 3. 8. 4. 5. Load combinationidentified as equation 7A (refer to Table 5-1) vas used in theevaluation as it is the governing load condition The evaluation
Rev. 9. 07/85
involves calculating new masonry and steel stresses forcorn parison to allowable values.
The previous assessments of the zefuelinq pool girders and steelsuperstructure vere pezformed by separate respon e spectrum andtime history analyses for these portions of the reactor/controlbuildinq. These separate analyses were reviewed in light of therevised response spectra.
1.2 Balance of Plant Q~BO'P Pining Assessmer t Hethodologg
L.1 2 1- . General
Piping systems in the reactor/control building have beenevaluated for changes in response spectra. The piping systemevaluation included large and small pipe, pipe supports, valveaccelerations, and equipment nozzle loads.
T..1. 2.1 2 T.arae Pine
The review procedure used to assess large piping systems ispresented in Figure L-104. The nodal point re ponse spectra usedto develop t'e desiqn response spectra were identified. If thesespectra bound the correspondinq revised nodal point spectra, thepipinq system is acceptable. For those piping systems havi.nqnodal point spectza exceedances, the design envelope responsespectra was compared to a revised envelope response spectra.Piping systems having design envelope response spectra whichbound the revised envelope response spectra are acceptable. Whenever piping systems had exceedances at the envelope levels, theenveloped spectra comparisons were reviewed to determine if,theexceedances occur at the piping systems natural frequencies.Piping systems having natural frequencies outside the frequencyrange where exceedances occur are acceptable. Piping systems forwhich the preceding does not apply are candidates foz zeanalysis.These pipinq systems aze further reviewed to determine if thepininq system is critical from pipe stress, valve acceleration orequipment nozzle loads. Only those piping systems havirgfrequencies where the revised envelope response spectra is higherthan the design envelope response spectra and t.hose that arecritical are reanalyzed for all applicable loading combinations.
L..1.2.1 3 Small Pipe
The enveloped response spectra used in the design of small pipeare compared to the revised response spectra..If no exceedancesoccur, the small pipe is acceptable.
For those in tances wheze exceedances aze present, thefundamental frequencies of stzaiqht spans for various pipe sizesaze considered. The small pipe's accep ta b le if the na turalfrequencies do not fall within the frequency range whereexceedances occur. I.f this is not the case, the combinedre ponse spectra for the siqnificant load conditions are
Bev. 9, 07/85 L-8
compared. No additional step, such as detailed reanalysis, arerequired to determine small pipe adequacy since the exeedancesoccur at frequencies which are beyond. the range of pipingfundamental frequencies.
Bala'nce of Plant /HOPOFF. uipment Assessment Hethodology
L..1.3. 1 . reneral
A discus ion of the methodology used in qualifying Category I BOP
equipment, which is attached to or supported direct.ly f.rom wallsand floors of the reactor/control building, is pzesented in FSARSubsection 3.7b.3 1. 1. In addition, the methodology used toassess Cateqory I BOP equipment for combined seismic andhydrodynamic loads is pzesen ted in DAB Subsection 7. 1.7.
Equipment, located in regions where the revised response spectraexceed the desiqn floor envelope spectra, was supplied under 36purchase orders Table L-1 presents the purchase ozders involvedin the asse sments. Qualification oi this equipment isdocumented on Seismi'c Qualification Review Team (SQRT) forms.Each form represents a qroup of similar items covered under aspecif ic purchase order. The e SQRT forms were reviewed todetermine equipment description, location, methcd ofqualification, and first mode frequency. This review determinedthe specific selection of equipment that would be reassessed.
L 1.3.2 Equal,@ment Qualified ~hAnalysis
Equipment qualified by analysis is assessed by comparing. therevised response spectra with the original design responsespectra. These revised response spectra are the envelope ofspectza for all node points located at specific elevations withinthe buildinq. If there are no revised response spectraaccelerations that eXceed design zesponse spectra accelerations(frequently referred to as «exceedances«hereafter foz brevity)at the natural .frequencies of the equ,ipment, the equipmentremains quali.fied by inspection. If exceedances occur, theequipment remains qualified if any one of the followinq threeconditions is met:
a) The equipment has no zesonant frequencies in the range whereexceedances occur. This condition is distinct from theinitial screeninq in. that the equipment had frequenciesclose to areas where exceedances exist; thus, warrantingmoze detailed investiqation
b) Although the equipment does not meet (a) above, the revisedresponse, conside'rinq all modes and their participa tionfactors, does not exceed the original design response.
c) Although the equipment does not m'eet (a) and (b) above,tresses zesultinq from the revised combined horizontal and
veztical response considering all modes and theirpa rticipation factors, does not exceed allowable limits.
Rev 9. 07/05 L-9
Hhen the equipment does not meet one.-of the t9|ree conditionsabove, using the enveloped spectra described abcve, the responsespectra at the specific equipment location is developed. Thespecific equipment is then assessed and found to be qualified ifone cf the above three conditions is met using this specificspectra.
The process described above is used to assess both the equipmentand its attachment to the building structure.
L.1 3 3 Equipment Qualified ~b Testing
Equipment qualified hy testing is assessed by separate evaluati'onof, first, the equipment itself and, second, the equipmentattachments to the building structure.. Separate assessment ofthe attachments is made since the equipment is gualified to testresponse spectra, whereas attachments may be designed towithstand required response spectra.
Equipment qualified by testinq 'is assessed by corn paring testresponse spectra (THS) with revised required response spectra(revised RRS) . IX the TRS envelopes the revised HHS, theequipment is qualified If the revised RHS exceed the TRS, andif the equipment has no resonant frequencies in the range whereexceedances occur, the equipment is qualified.Equipment attachments to the building structure are assessed asdescribed in Subsection L 1.3. 2. In addition, whe're attachmentsare simulated in the testinq procedure, the attachments areassessed by comparinq TRS with revised HRS; if the TRS envelopesthe revised PRS the attachments are qualified.L 1 4 NSSS~ui~ment Assessment Methodology
General Electric (GE) furnished some of the safety relatedequipment utilized in the reactor/control building. Accozdingl y,the necessary revised zeactor/control building response spectrawere transmitted to G.E. so that an assessment could heperformed. The methodology used in assessing the NSSS equipmentwas similar to that utilized in the BOP equipment assessmentpzoqram, refer to Subsection L.1 3.
I,.3.5 Electtical aacew~as~stem Assessment Methoaolo~
A detailed description of t.he electrical raceway system designmethodology is provided in FSA'.? Subsection 3.7b.3.1.6; Theassessment methodology for the revised response spectra is asdescribed in DAB Subsection 7.1.8.1. In general, the design ofsupports for Category IF. Flectrical raceways was performed usingthe peak accelerat.ion of the composite floor envelope responsespectra Specific supports for unique conditions were designedaccordinq to the alternate method as discussed in Subsection7.1.8.3 The qoverninq load condition was SSE + SRV + LOCA,combined by SHSS method. For reassessment, the revised spectra
Hev. 9, 07/85
accelerations have been compared with the original designacceleration values at. the qoverning load combination level. Inthose instances where exceedances exist, the supportingelectrical raceway system design calculations for that area werereviewed to determine structural adequacy.
svnc De~et s tern Assessment methcdlcDg
The methodoloqy used to design and assess BVAC Duct Systems isdiscussed in FSAR Subsection 3.7b.3 . 1.4 and DAR Subsection 7. 1. 9,respectively. In general the design of supports for HVAC Ductswas performed using the pea)c acceleration of the composite floorenvelope response spectra. Supports for unique conditions weredesiqned according to the alternate method discussed inSubsection 7. 1.8.4. The qoverning load condition for design andassessment of Category 1 HVAC duct supports in thereactor/control building is Dead Load + OBE. For reassessment,,the revi ed spectra accelerations have been compared with theoriginal design acceleration values for the governing loadcondition. For those instances where exceedances exist, analyseswere performed to determine structural adequacy.
Rev. 9, 07/85
L 2 ASS F.SSY~'RNT RESUI.'IS
L 2 1 Reactor and Control Building
The structural assessment results for the reactor/controlbuildinq's major shear walls, interior walls, floor slabs, steelbeams, block walls, zefuelinq pool girders, and teelsuperstructure are presented below.
The ma jor shear walls experience a minimal in'crease (less than 10percent) in shear forces and moments, and a negligible increasein axial forces due to seismic loads The change in forces .andmoments due to SRV and LOCA are also neqliqible. It is apparentfrom Fiqure E-34 that these negligible increases will not result.in an exceedance of the design capability The stress marginassociated- with element 13 (shown in Figure E-7) is reduced to33~c as a result of the significant contribution of seismic loadto the total stress.
The interior walls experience a 40% increase in shears andmoments due to seismic .load. Changes resulting from hydrodynamicloadinqs are neqliqible. The resultinq stress margins foz theqoverninq load condition are presented in Table L-2. (The walllocations are presented in Fiqure L-105 ) Since substantialstress margins remain, the interior walls aze acceptable.
In the case of floor slabs, t'e peak vertical structural responseacceleration for all loadinq events was determined to haverelative'ly small changes in q levels. It is apparent from FigureE-33 that the revised acceleration from dynamic loads will notreduce the stress margin significantly. Therefore it i™concluded that the floor slabs are acceptable.
In general, the peak vertical structural response accelerationsare unchanged from the pzevious analysis. At those elevationswhere the response increased, the adequacy of the structuralsteel beams were determined by performing assessmentcalculations. The governinq element is at elevation 749'. Theseismic zero period accelerations increased from 0.174 q to0. 382q due to OBF. and 'from .209 to . 461q due to SSZ. Thecorresponding accelerations due to hydrodynamic loads areessentially unchanged The greatest bending stress in thestructural steel beams due to the qovernirg load condition is22. 2ksi, which is well below the allowable value. Thecorrespond iraq stress margin is 31 percent.
Foz blockwalls the revised peak response accelerations werecompared with the oriqinal design response accelerations. It wasqenerally found that the revised response accelerations do notexceed the de iqn values. For those instances where exceedancesexist, the masonry and steel stresses were shown to be less thanallowable stresses. Thus, the blockwalls have been sho wn to bestructurally adequate.
Rev. 9, 07/85 L-12
The previou assessment of the refueling pccl qizders wasperformed by response spectra analysis as discussed in Subsection7. 1.1.2.1. 3.2. The revised acceleration response spectra at thesupport points are enveloped by the response spectra used in theprevious assessment. Therefore, tho refuelinq .pool girder isstructurally acceptable by inspection.
The revised zesponse spectra of the steel superstructure supportmotion are enveloped by the response spectra of the supportmotion used. in previous analyses for both seismic andhydrodynamic loads. Therefore, the steel superstructure isstructurally acceptable by inspection.
P
Balance of Plan t~B~OP Piping
L 2. 2. 1- Unit 1
All large pipinq systems are determined to be. acceptable for therevised response spectra. Table L-3 provides design margins forselected piping systems. The piping reanalysis showed thatpiping stress, nozzle loads and valve accelerations areessentially the same as in the desiqn ca1culations and are within-the code allowables. The reevaluation of the piping supportsthat adequate margins exist to accommodate the new .loads.
The. small piping system assessment. program also concluded thatthe revised response spectra are acceptable and that no hardwaremodifications are required.
L 2 2 2 Unit 2
(To be provided at a later date)
L 2.3 Ba1ance of Plant (HOP) Equipment AssessmentResults
L.2.3.1. Unit 1
Assessment results of equipment originally qualified by analysisand/oz test indicate that sufficient conservatism exists suchthat the equipment remains qualified for the revised zesponsespectra. Thus, no requalification efforts or hardware changesare required.
Also, the equipment supports have been determined to be adequatefor the revised response spectra.
L. 2. 3. 2 Unit 2-
(To be provided at a later date)
Re v. 9, 07/85 I -13
L.2.4 NSSS Fauivment
L.2.4.1- Unit 1
It has been concluded that the revised reactor/coritrol .buildingresponse pectra are acceptable and do not adversely affectexistinq NSSS Seismic Qualification Review Team evaluations andnew loads adeguacy evaluations.
L.2 4.2 - Unit 2
At the time of the modeling revisions, Unit-2 NSSS equipment hadnot yet been qualified. As a result the revised response spectravill be used in the'initial qua lification process. Thus, noassessment program is required for Unit 2 NSSS equipment.
L. 2. 5 - mlectcical aaceeay System.
L 2 5.1 Unit 1 ~
Peak accelerations, associa ted with the composite floor responsespectra used in design, exceed the revised peaks for SHSScombination of SSF. + SBV + LOCA. Thus, the qeneric racewaysupports aze qualified by inspection.
The revised peak floor responses, vhich are used in the. design ofspecific supports, were compared floor-by-floor with the oriqinaldesiqn responses. For several floors the new combined responseexceeded the original design zespon e. Specific supports werelocated on only two of the floors having exceedances. Atelevation 728 the combined acceleration level for the governinqload condition increased an insignificant .01g, thus all supportson this floor are acceptable. At elevation 749 the peak. floorvertical acceleration increased from '1.0q to 2.45g for theqoverninq load condition. The natural frequencies of thespecific supports located on this flooz vere determined. Thecorrespondinq design and revised acceleration values at thesystem's natural frequency vere compared. If the zevisedacceleration value was less than the design acceleration, thesystem vas determined to be acceptable. f<henevez the preceedingdid not occuz, the system was reanalyzed usinq the revisedacceleration value corresponding to the natural frequency of thesystem. The maximum ratio of actual stress to allowable stresswas determined to be 0. 99. All specific supports were found tobe structurally adequate; therefore, no hardware modificationswere required
L 2.5 2 -Unit 2
tTo 'be provided at a later date)
Bev. 9, 07/85
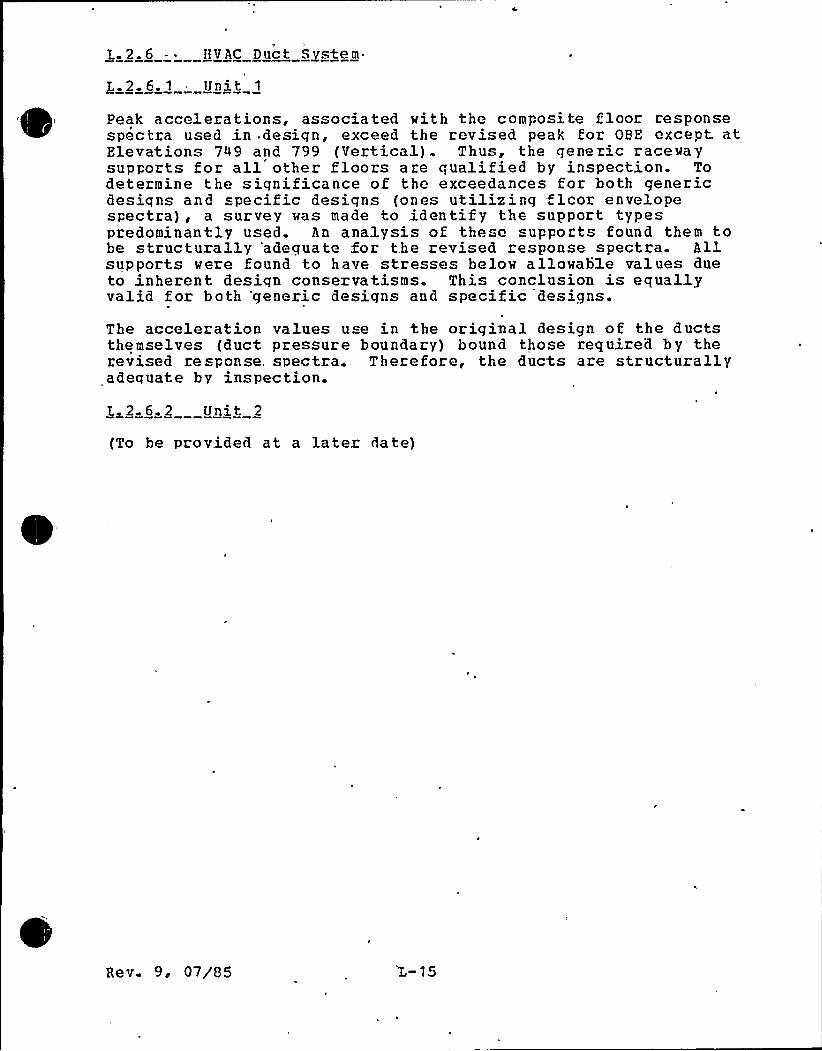
T..2.6 HVAC Duct System
$ .2.6.1 Unit 1
Peak accelerations, associated with the composite floor responsespectra used in desiqn, exceed the revised peak for OBE except atElevations 749 and 799 (Vertical). Thus, the generic racewaysupports for all other floors are qualified by inspection. Todetermine the significance of the exceedances for both genericdesiqns and specific designs (ones utilizing flcor envelopespectra), a survey was made to identify the support typespredominantly used. An analysis of these supports found, them tobe structurally 'adequate for the revised response spectra. Allsupports were found to have stresses below allowable values dueto inherent design conservatisms. This conclusion is equallyvalid for both 'qeneric designs and specific designs.
The acceleration values u e in the original design of the ductsthemselves {duct pressure boundary) bound those required by therevised response. spectra. Therefore, the ducts are structurallyadequate by inspection.
L. 2. 6. 2 Unit 2
(To be provided at a later date)
Re v. 9, 07/'85

0
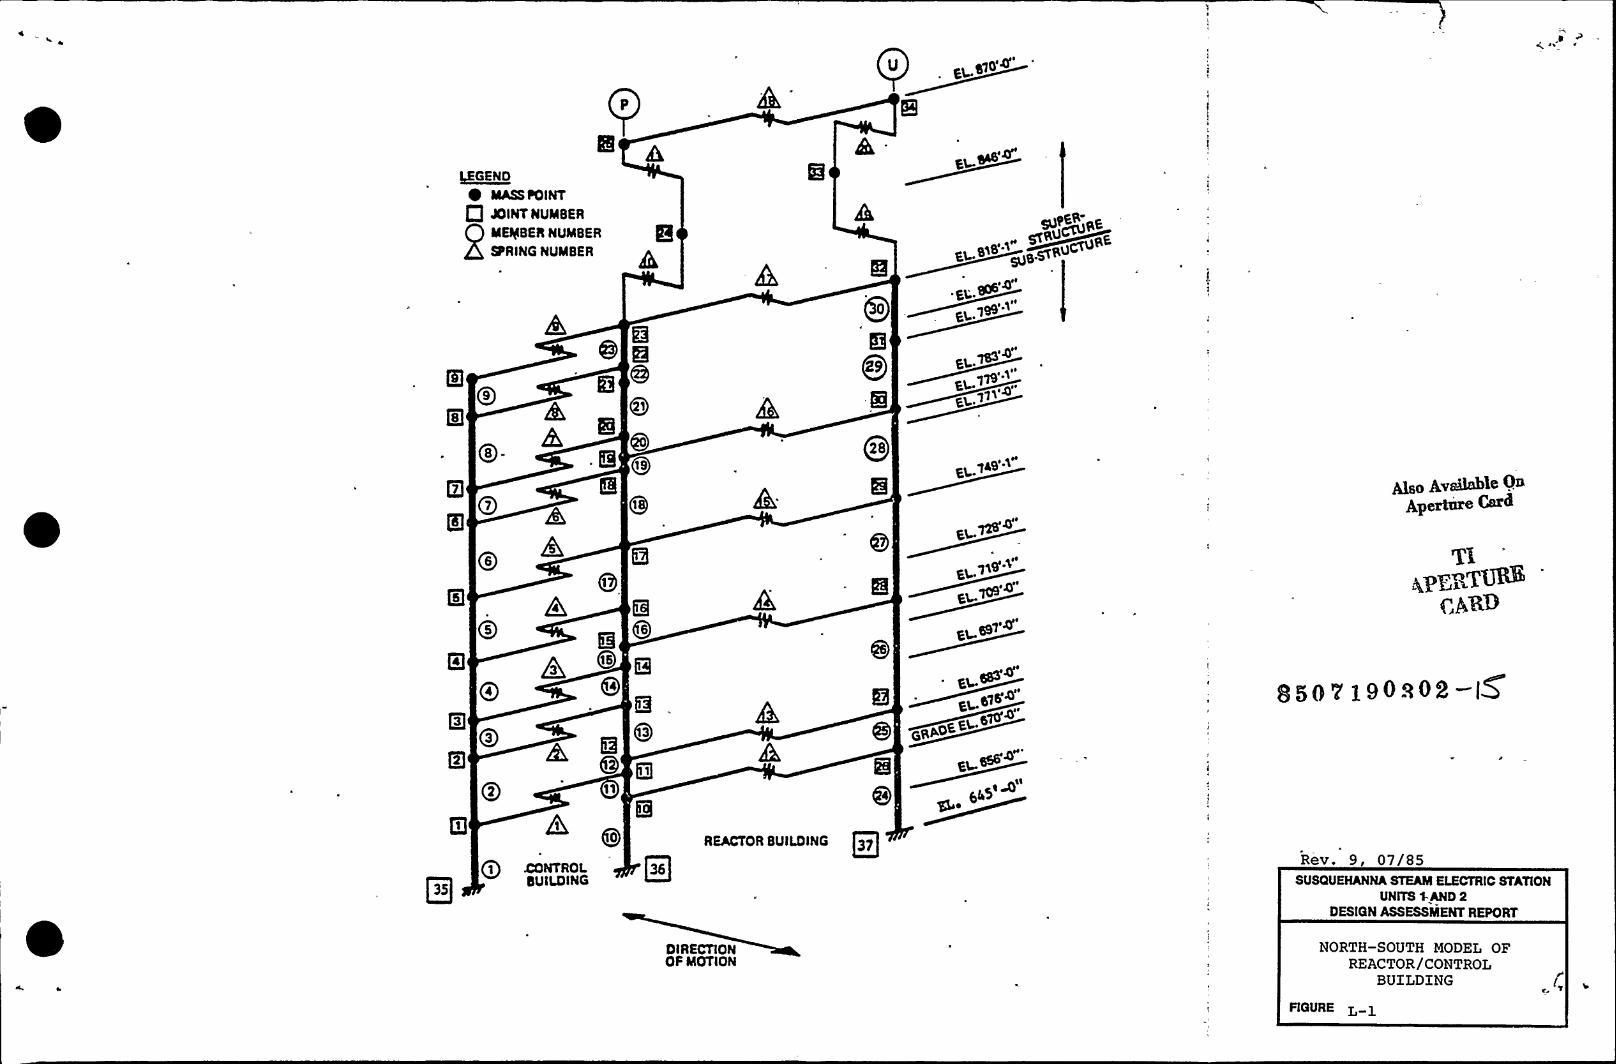
lgGEND0 MASS POINT
Q JOINT NQMBER
MEMBER NUMBER
SPRING NUMBER
QP~EpEgfS~ gE
E~ 918'gVC
09
Qs
01
gg
o
g~
@i
rh g.QQ
s 906
l19~
~< 111
E~1'lso Avs8nble OaApertere Carh
OB
03
01
CONTROL
O buIU)ING35
D4 gIs
Qs gQi 8
REACTOR Bulg)ING
DIRECTIONOF MOTION
g~ 119'.~ get
7'91
~ g~ 5PQ
~4~II
gate
850 V190q02-Ig
Rev. 9, p7/85
NORTH-SOUTH MODEL OFREACTOR/CONTROL
BUILDING
FIGURE L—l
SUSQUEHANNA STEAM ELECTRIC STATIONUNITS 1-AND 2
DESIGN ASSESSMENT REPORT

i.,7
Jt
u
p
C f$ lN
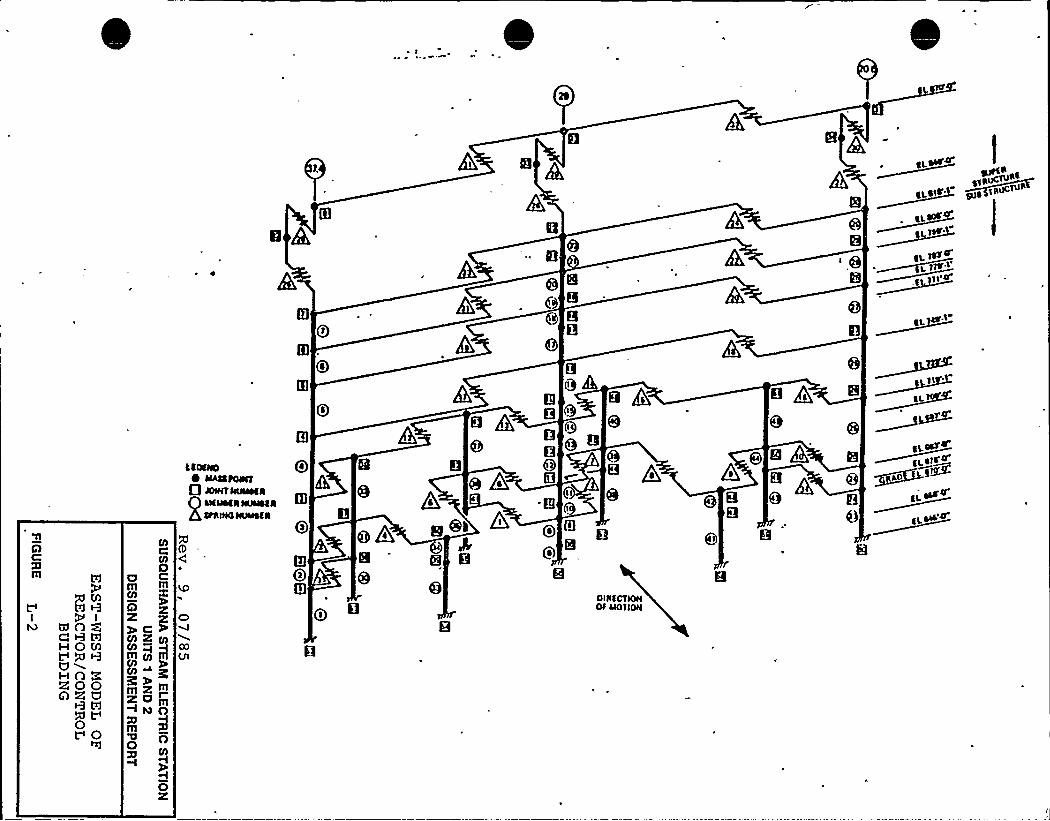
~~TUhah
lhuCTuhalala" 9Ia
la~ Tgg4f'.
Tlh'r
QT
Oa
Q
p aL
lll
A M
I enzCAWHQMQwHn p8QQQ2lU
0X L
V 0
Og cm mOlA2 2ychVl 2 Ol
III Pf)
N~gmzm2am~ISOill g
O2
laoale~ alhaaxusTT
0 J0IHT lhIgyaiaI41Iaah lhhlaaICtllIIIONJQgfI
Qe
Qs
IQT
Q]
sk,Qa
hei Qa
Oa
8
Qa
g 6
DI
ha
CTICKSOT +OTIOII
al.aalI+Iral. ala'O
~/I
ai aaa'~
al ~'4
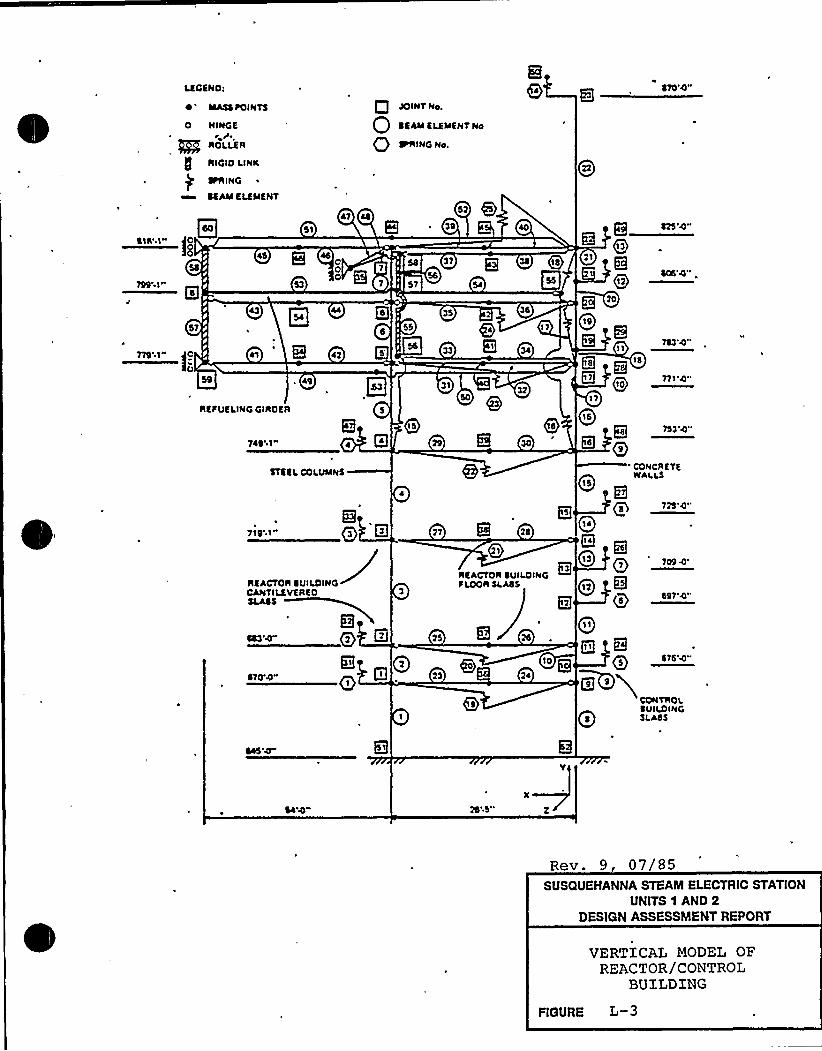
LEQENO:
~ " MASS FO IN TS
O NINQE
ROLLER
g RIQIO LINR
~ ING ~
SCAM ELKMKNT
919'.1 0
Q JO IN T No.
Q SEAM ELEMENT No
Q ~ING No,
47
8 ld57
799'1—Qir
45 Q 45
g 70 Q
57 g Sd ~Id
57
41
Ke
8 .7 C~l
55 4 17
ll El 04
REFUELING GIROER
749'1"
p~5
QE
01
50 gQd
STEEL COLVMNS
719'16,~S
'IZQs
77 Q ld
hEACTOR EUILOINCFLOOII Sl AES
'0g
hEACTOR EVILOINGCANTILEVKR5 0SLAES
QQ7
53 Qz970'4"
970'4"
g 925'4-
Q71 g
gs
Q 70
8g 7tl'4-
e17
84
'ONCRETE
8 WALLS
Q~s
0"Q4 g@ o8 sss ss
Qs
Q11
QI
~ssss'st-
gQsiCONTROL
0 9UI LO INC
9 SLAdS
%4'4
Rev. 9, 07/85SUSQUEHANNA STEAM ELECTRIC STATION
UNITS 1 AND 2DESIGN ASSESSMENT REPORT
VERTICAL MODEL OFREACTOR/CONTROL
BUILDING
FIGURE L-3
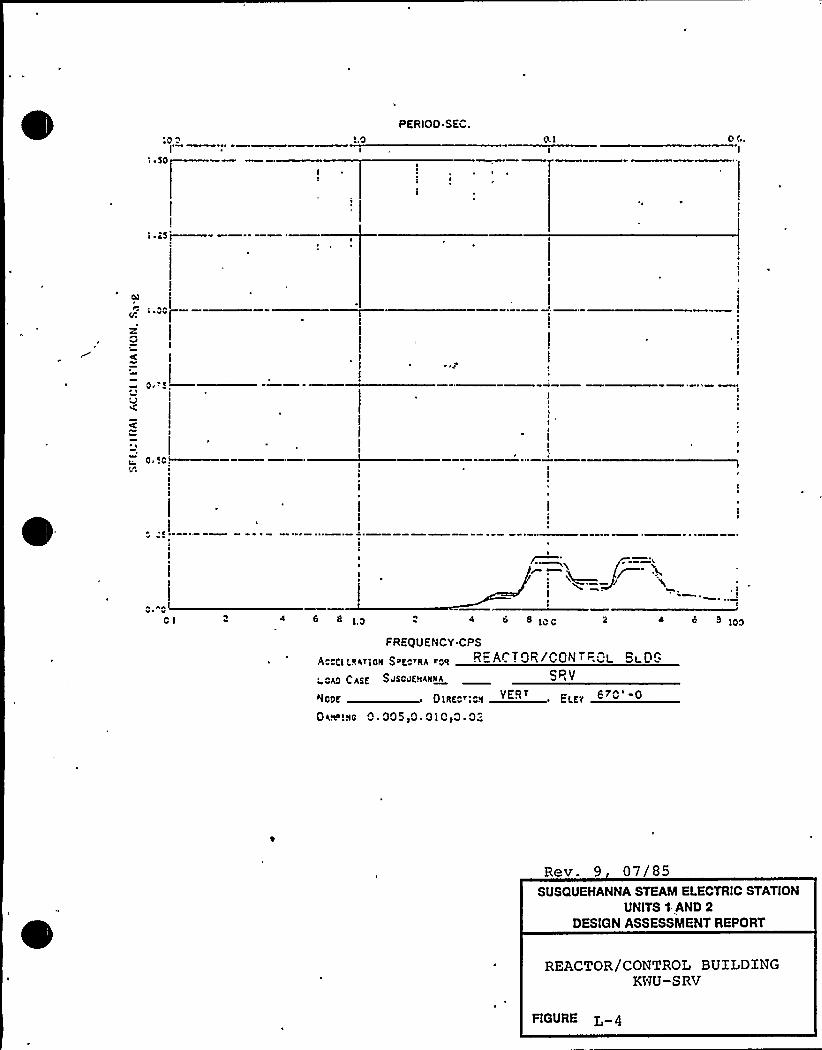
500
: F 50
PERIOD.SEC.O.i
i ~ c5'
DCp
ZI
Carr
+r
r
0 ~ !0~It
iI
I
II
I
/.l/
~ —J'~ ~
01 e e 6 8 iCC 4 e > i00
FREQUENCY CPS
$ 0 pi'Rhr?OR $ ~E rRA rDR REA TOR/CON ' "L i-0 ~
~ChD Ch5g $ 45OVKRhRNA SRV
ABODE D,Re"r .„YEA . Ei.~V 6 C'-0
O~iRc O ~ OOS,O OIC O ~O".
Rev. 9 07/85SUSQUEHANNA STEAM ELECTRIC STATION
UNITS 1 AND 2DESIGN ASSESSMENT REPORT
REACTOR/CONTROL BUILDINGKNU-SRV
FIGURE L 4
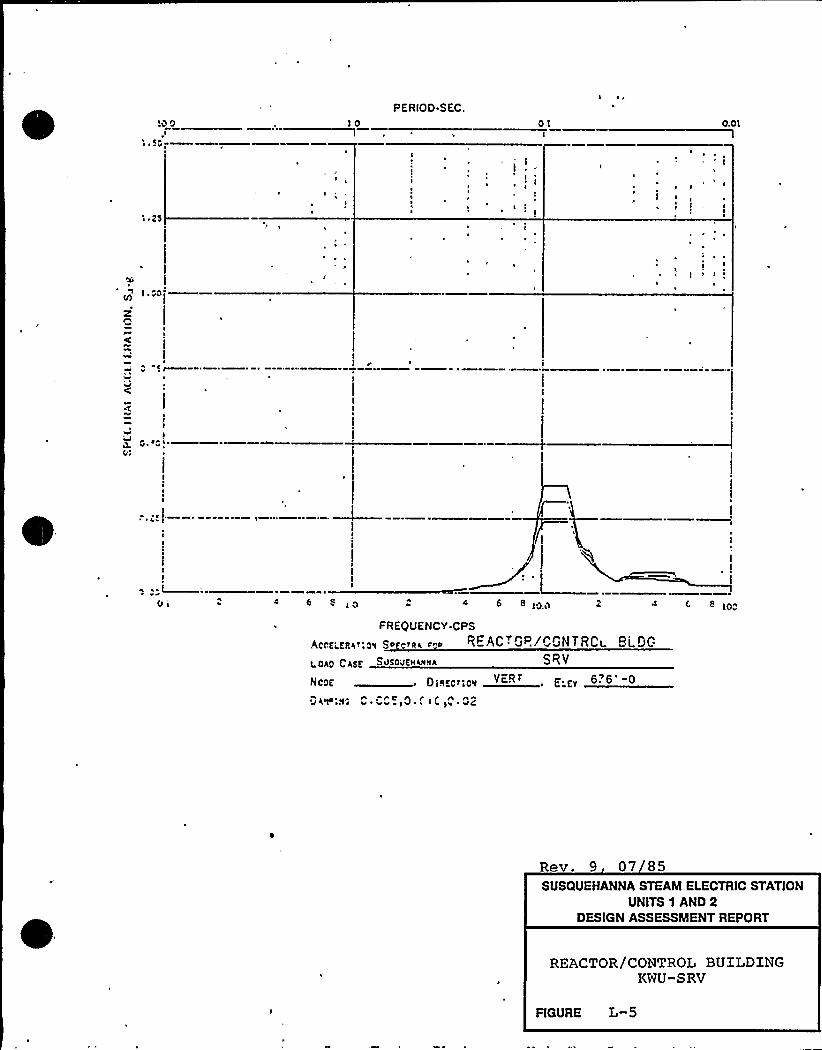
~,5 0I
14, 10
10I,PERIOD.SEC.
I I
0.01
4
I ~ 25
I~ I
I
II
4
II
I
I
I
(
r44 V
V1
c e c 6 e»0 c e»-FREQUENCY CPS
,(eee~eeht ~ 5N $ 0 >Nh cv'>I RE AC ~ GR/CGN T RCI BLDG
I 0g0 Ch5j SI>5005HhNNA
Mvvv 6'1.4"44 "6 . 6; 4 6 6 0
'f h+aN5 44 4444 >0 4 > 4 >4
Rev. 9 07 85SUSQUEHANNA STEAM ELECTRIC STATION
UNITS 1 AND 2DESIGN ASSESSMENT REPORT
REACTOR/CONTROL BUXLDTNGKWU-SRV
FIGURE L-5
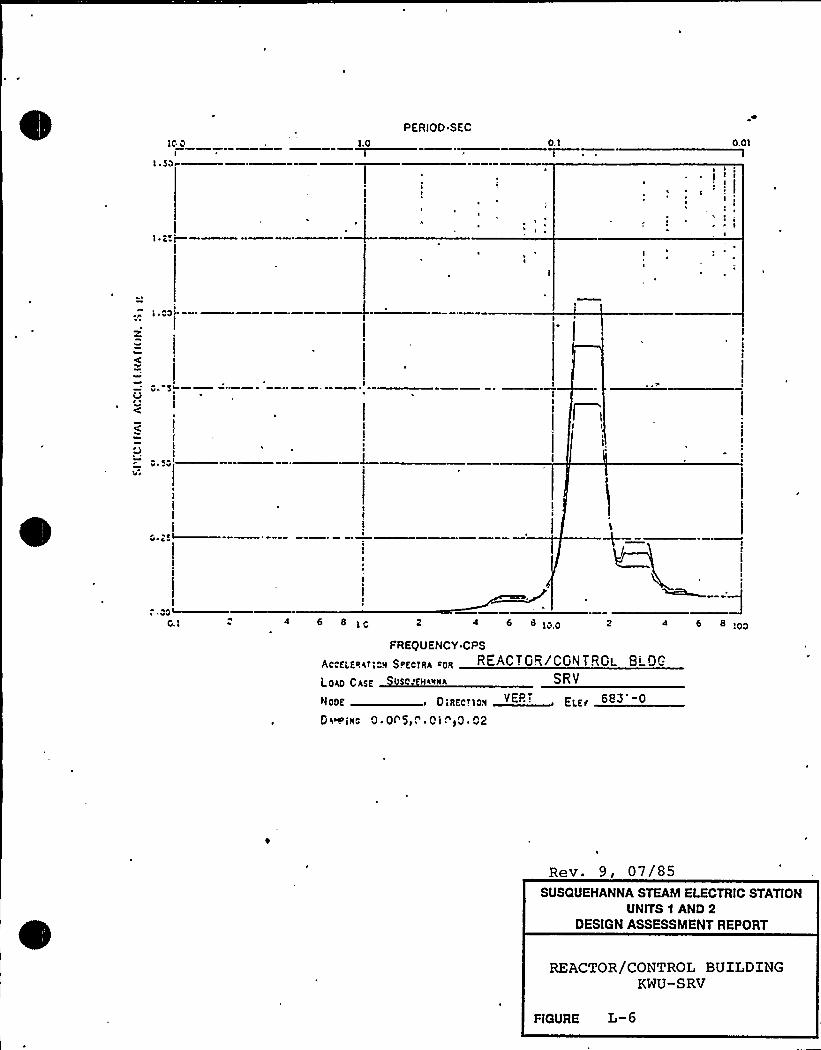
100I
I ~ $ 0
PERIOD SEC
1.0 0.1 0.01
1 ~ ZTg
1 ~ oo
I
0 ~ 5~
C
IV V
Vt
:.aD0.1 6 8 4 « IOO 4 « IOO
FREQUENCY CPS
A .„6„,..0H S,,„„, „REACTGR/CGNTRGL B'' OC
Log) Chyle VSC 'lIHA SRV
liOOE 0;REC.ilas ELE<
Da~isc P. Pr g I, P1~1P. P2
Rev. 9, 07/85SUSQUEHANNA STEAM ELECTRIC STATION
UNITS 1 AND 2DESIGN ASSESSMENT REPORT
REACTOR/CONTROL BUlLDINGKWU-SRV
FIGURE L-6
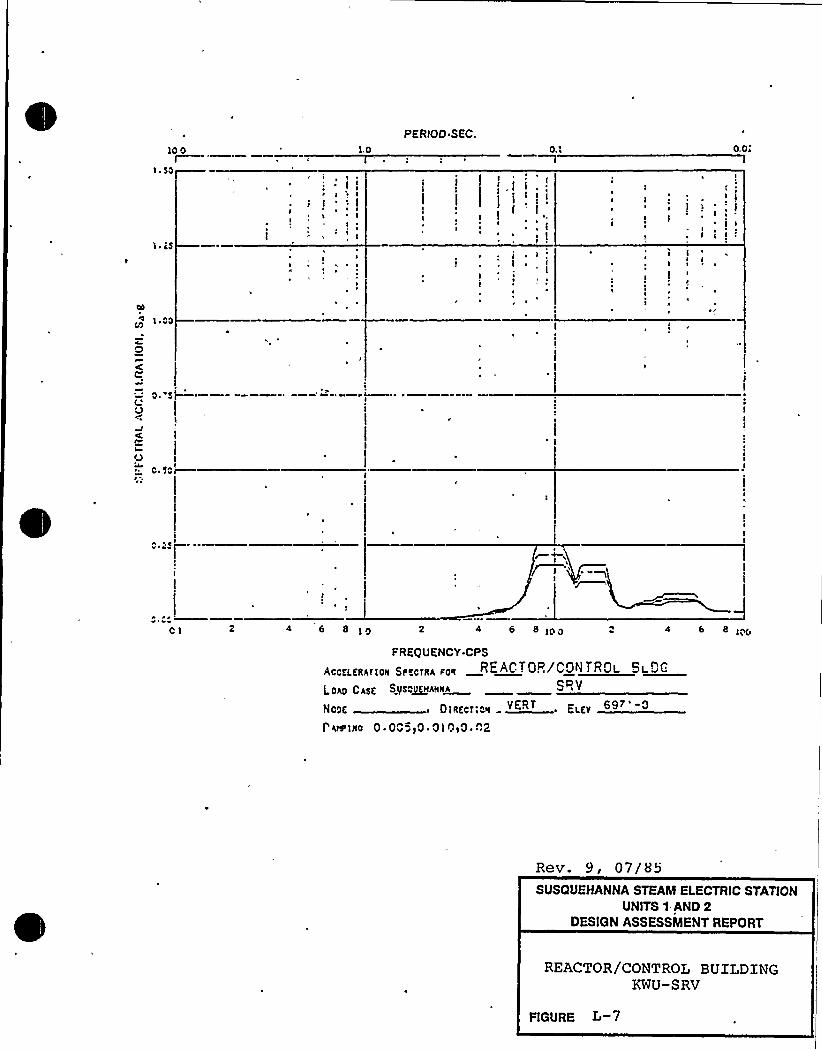
10 0IsnI—
1 ~ cS
00
>.Co
C
n Sp( ~
tQI
1.0
II
~ I 0 II ': I
II
~ g
PERIOD SEC.0 ~
II
I'
I ~ „I
y ~ ~, I
I1 ~, I
I
I
0.01
I
'g II
II
I I
0 ~ 2Sp
~ ~V
01 4 6 8 10 2 4 6 8 100 4 6 e,nn
FREQUENCY.CPS
ACCELNAyinN SPr Cfear Pnq REACTOR/CON TROL 91.DC
Lnhn 0hsg SIJsC~NANNA SR V
NCN ~ 01NSCS 0N VER E<gy 69 '
hN INc 0 00'5)0 010IO 02
Rev. 9, 07/85SUSQUEHANNA STEAM ELECTRIC STATION
UNITS 1 AND 2DESIGN ASSESSMENT REPORT
REACTOR/CONTROL BUILDINGKWU-SRV
RGURE
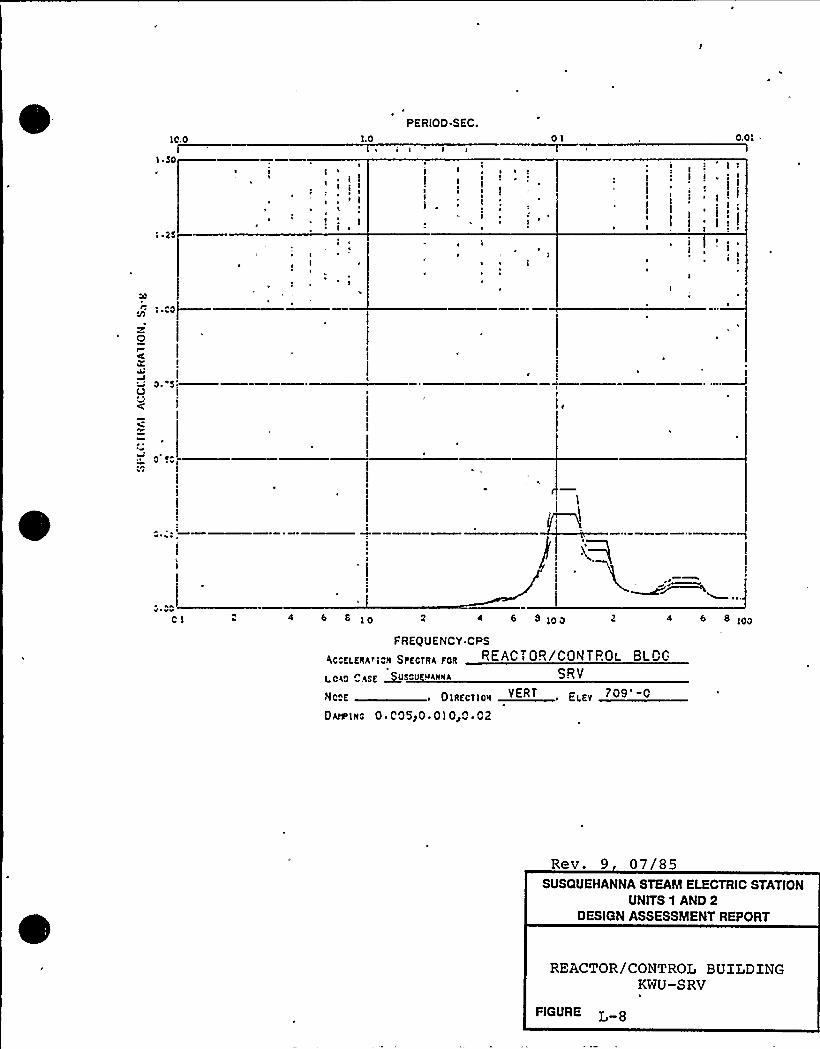
IC.O
I ~ 50
: ~ 25
1.0
II
I
't
t~ ! '- I
1
I
~ iI
PERIOD.SEC.
I I
IIi!
I IIII
I
OI 0.0!
I
I II ~
O
0 ~ 5VI
I
0 c
vvC 'I 4 6 S 2 5 IOO 4 < 8 IOO
FREQUENCY CPS
ACCK!ERAr!CN SIECIRA FCR REACTOR/CONTPOL BLDG
I CA0 0A5$ ~USCU NANIIA SRV
NCCE DIRECT!dN VERT EI.ZV 709'0OAI5'INc 0 ~ C05p0 ~ 01 0 ~ 02
Rev. 9 07/85SUSQUEHANNA STEAM ELECTRIC STATION
UNITS 1 AND 2DESIGN ASSESSMENT REPORT
REACTOR/CONTROL BUILDINGKWU-SRV
FIGURE L
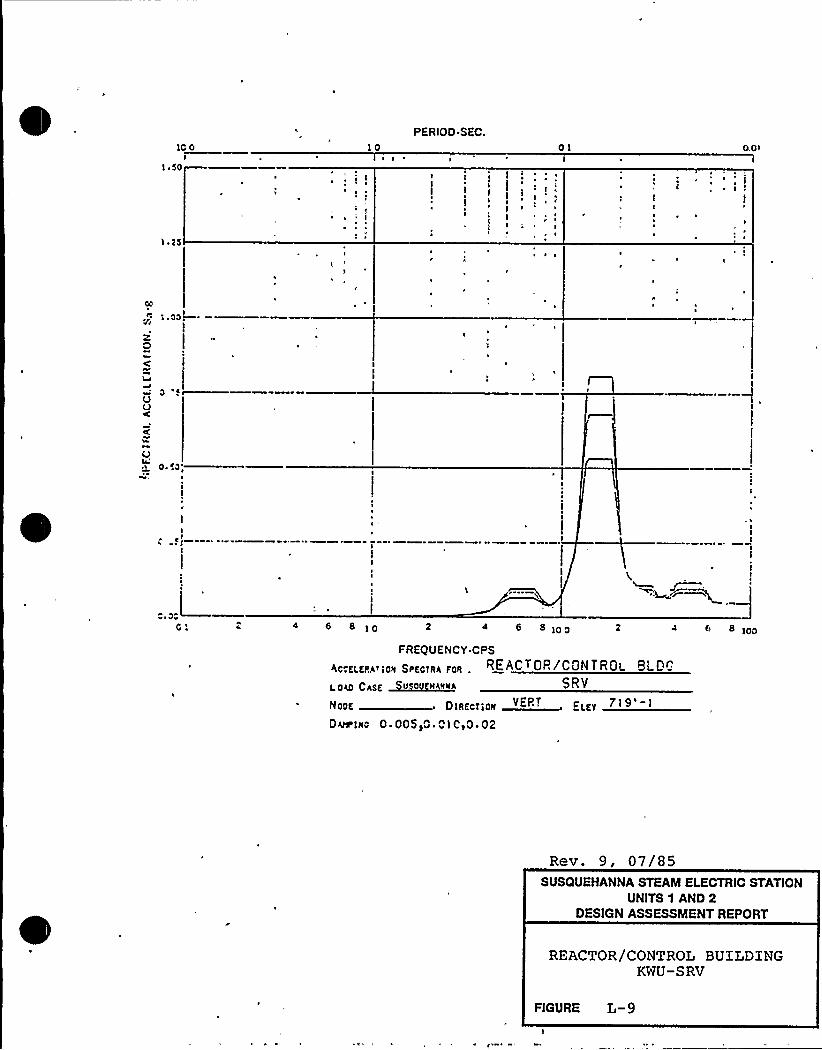
io oI
I ~ sp
ioo o
PERIOD-SEC.
II
~ i Iic ~
~ ~
I
o
v
oi
v o
o
0.0>I
ov
~ ~ ppgioZoC
~ ~o
V
Op. cp
II
Ic'
p ~ 4 6 8 2 4 6 6IOO 8 ioo
FREQUENCY.CPS
Rp EI.fIIgripg Siofpfiig foe REACTOR/CONTROL Bi D
I p~ CAvig ~UP(~HNNA SRV
Nooc Dvoccvioc '' EeocVERT 719'-IDveiiip 0 F 005>0 ~ 1C>0 '2
Rev. 9, 07/85SUSQUEHANNA STEAM ELECTRIC STATION
UNITS 1 AND 2DESIGN ASSESSMENT REPORT
REACTOR/CONTROL BUILDINGKWU-SRV
FlGURE L-9
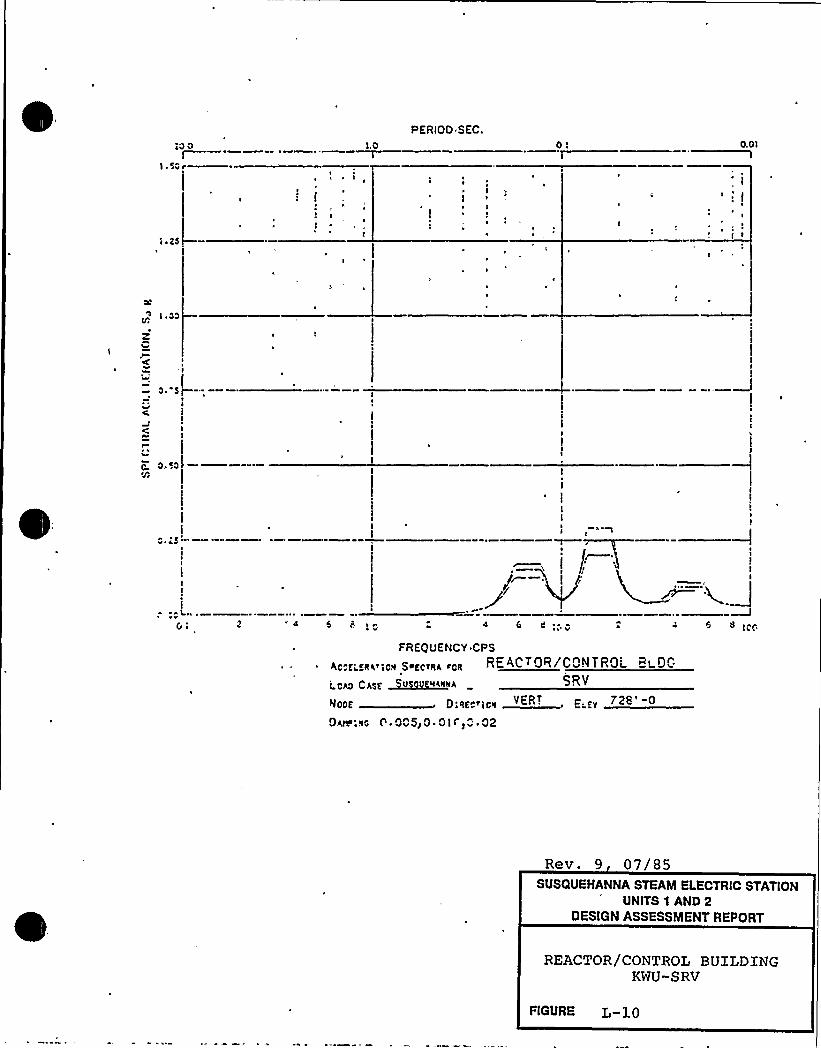
10 01
1 ~ SQrI~ 1
1.0
PERIOD $ EC.
0 ~
I0.0'I
~ I
I I
I ~ 00
z
I
0 ~ 51
Ivv( II
Q 0 ~ 0'A
Ev"4»
II
II
I
GI 4 6 I:.
I »I I
100~
FREQUENCY CPS
f cPPE10$ $ Pf{ f)PcQQRE
ACT
OR�/CONTR»OLBLOC
LQAQ Csee ~0 'SRV
NODE D:»I'o» D-''.vVERT , 728'-0
0.<w:|0 (' 00$ p0 ~ 011 1"' 02
Rev. 9 07/85SUSQUEHANNA STEAM ELECTRIC STATION
UNITS 1 AND 2DESIGN ASSESSMENT REPORT
REACTOR/CONTROL BU|:LDlNGKWU-SRV
FtGURE L-10
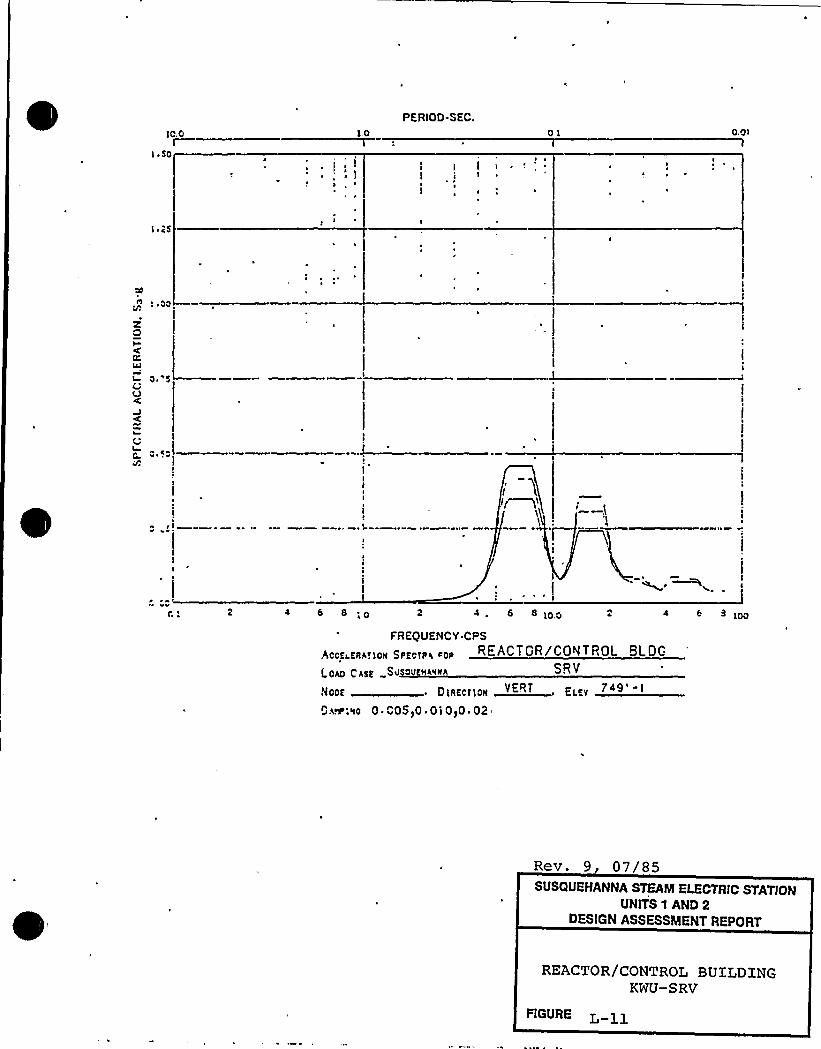
PERIOD SEC.0.0'i0 I1,010.0
I
I
II
~ ~
i c5
zQ
0 ~ 5
$I
~ +0 v
vv v
v vv
Ir Vi
\
4 6 ~ ioo2 4 ~ 6 8 IOG4 6 8;0FREQUENCY CPS
REACTOR/COAI T ROL BLDGSRV
N005 ~ D IAECTIGA ER ' Ei.rv
D.iw;wc 0- 005>0 ~ 0i 0>0 ~ 02
Rev. 9, 07/85SUSQUEHANNA STEAM ELECTRIC STATION
UNITS 1 AND 2DESIGN ASSESSMENT REPORT
REACTOR/CONTROL BUXLDXNGKWU-SRV
FlGURE L-y j.
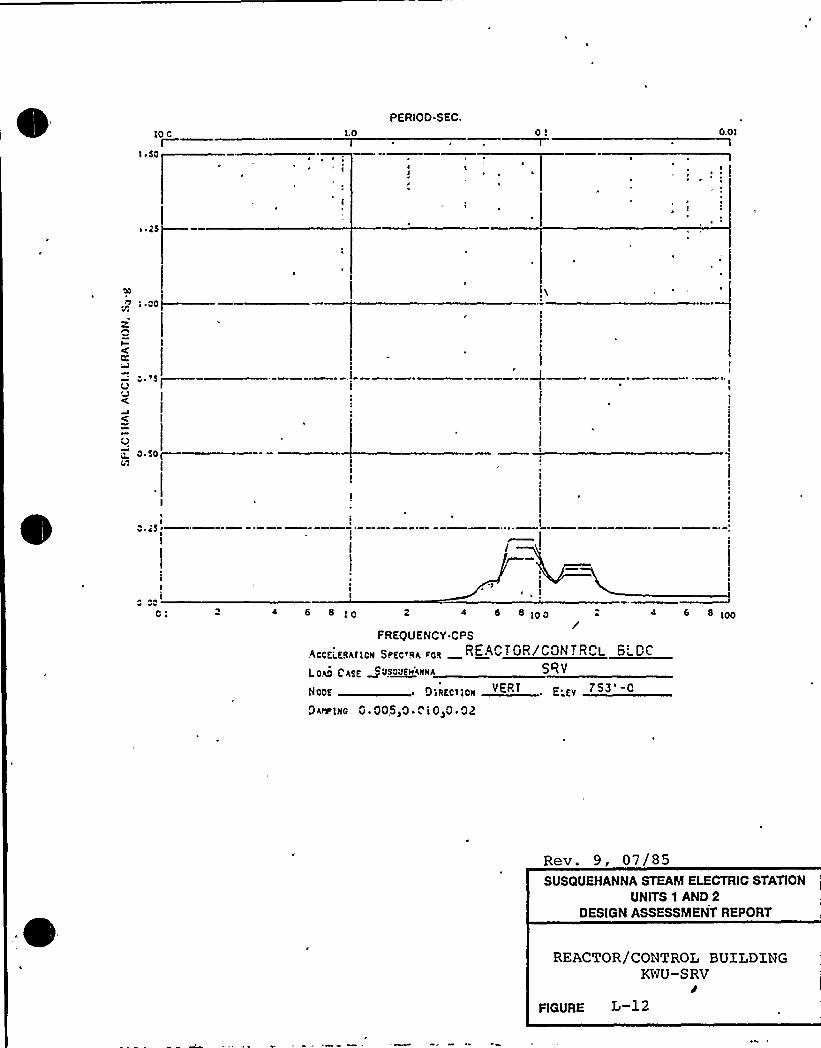
10 G
I
I ~ SO
1.0
PERiOD.SEC.O I 0.01
l
I ~ ZS
P 'ttYz
(9
6 ~ 'sI-Ig
C
Vo ~ 501—
EVI
I~ cS ~
I
II
hvGi 4 6 8 8 ioo 8 ioo
FREQUENCY CPS
AGG~&xg11ox siIgovqg vox REACTOR/CONTR L BLOC
Lote f456 +45QUEAxxA S ~V
IVVV tY ttVct'Vtt VERY I~ E't 333'
9iwixc O. 005~0 ~ "IO~O ~ O2
Rev. 9, 07/85SUSQUEHANNA STEAM ELECTRIC STATION
UNITS 1 AND 2DESIGN ASSESSMENT REPORT
REACTOR/CONTROL BUILDINGKWU-SRV
FIGURE L-12

0

I0 0
i.vvp
I.O
PERIOD SEC.01T
0.0>
I ~ 2S
I ~ 00.
E
0I
Iv
I
QR
0 ~ !0'
II
E
V VV
OI 2 ~ 6 8 2 4 6 8 l0.0 4 "- 8 I00
FREQUENCY CPS
REACTOP/CI NT t L 8'cE 0~ Cygne SUSCEIERARNA SRV
looE DiRE" i "v O~ E . E;:vCaWI80 O. "QS,D ~ Ol C!0 ".2
Rev. 9, 07/85SUSQUEHANNA STEAM ELECTRIC STATION
UNITS 1 AND 2DESIGN ASSESSME NT REPORT
REACTOR/CONTROL BUILDINGKWU-SRV
FIGURE L-13

lO Q
I ~ Sa
)
PERIOD SEC
~ I
I
O.L 0.0:
C~ C
isQQ')
a
l
j
a
II
sl
Qa 4 6 8 6 8 ivQ
I
I
I
FREQUENCY.CPS
QQQf I 8ghf )QTE $ PgQ)q„qQ8 R E AC T 0 R /C 0 0 T R 0 L 9 0 C
CIITgg USQ VVRITIIA QT'R V
'laDE Iles'cr aa E.arVERT , IVI'-IOvelwc 0 ~ OOSpO ~ 0) Oq
Rev. 9 07/85SUSQUEHANNA STEAM ELECTRIC STATION
UNITS 1 AND 2DESIGN ASSESSMENT REPORT
REACTOR/CONTROL BUILDINGKWU-SRV
FIGURE L j 4

) 0
PERIOD.SEC.OI O,OI
I
I ~ 2$
II
I ~ CCr ~
I
ZI
j~
5
IJ
(I
O.cc'
I"~I
II
| I
v ~
O.I 4 6 s ~ 2 4 6 8i00 6 S IOO
FREQUENCY CPS
Ace['pIIglcII Sogcggh rcR REACTOR/CONTROL BLDG
(0 C(gg SV CV RA8IIA SRV
NDOE " DLAEctlall "I~ I'EY
Oareisc 0 ~ 005I0 ~ 0i 0(0.02
Rev. J, U'//US
SUSQUEHANNA STEAM ELECTRIC STATIONUNITS 1 AND 2
DESIGN ASSESSMENT REPORT
REACTOR/CONTROL BUILDINGKWU-SRV
FIGURE
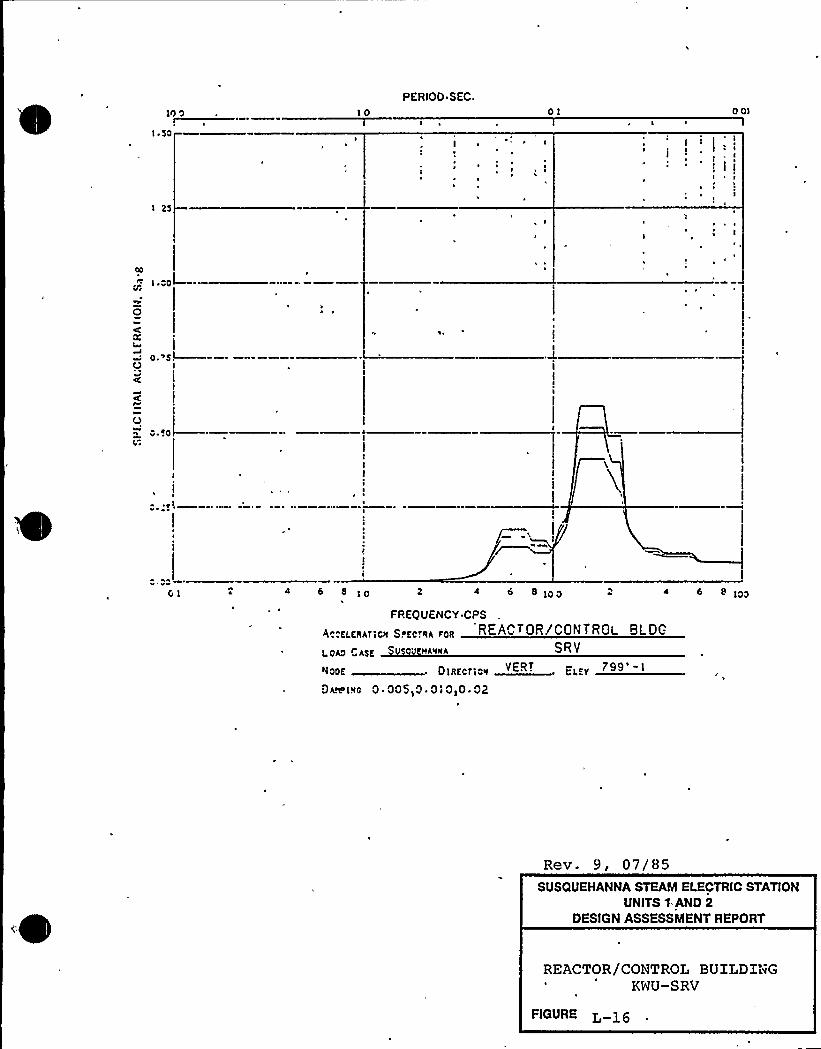
ID '0 10PERIOD SEC.
01 001
25
cO
th I.OOL-
O
C
- o..sI—O
0- 0c.
I
eI~ ~
h ~'
GI 6 8 10 4 6 8100 6 8 IOa
FREQUENCY CPS
)I ()A1 cII Sy(cevA Aoq RE AC OR/CON T ROI BLOC
I. OA0 CASE O'AvvA SRV
~~>E DtSECnae 'EL'.VVERT Tgg'-I
Dm Ivc 0 ~ 00510 ~ OI 010 ~ 02
Rev. 9, 07/85SUSQUEHANNA STEAM ELECTRIC STATlON
UNITS 0 AND 2DESIGN ASSESSMENT REPORT
REACTOR/CONTROL BUILDINGKWU-SRV
FIGURE
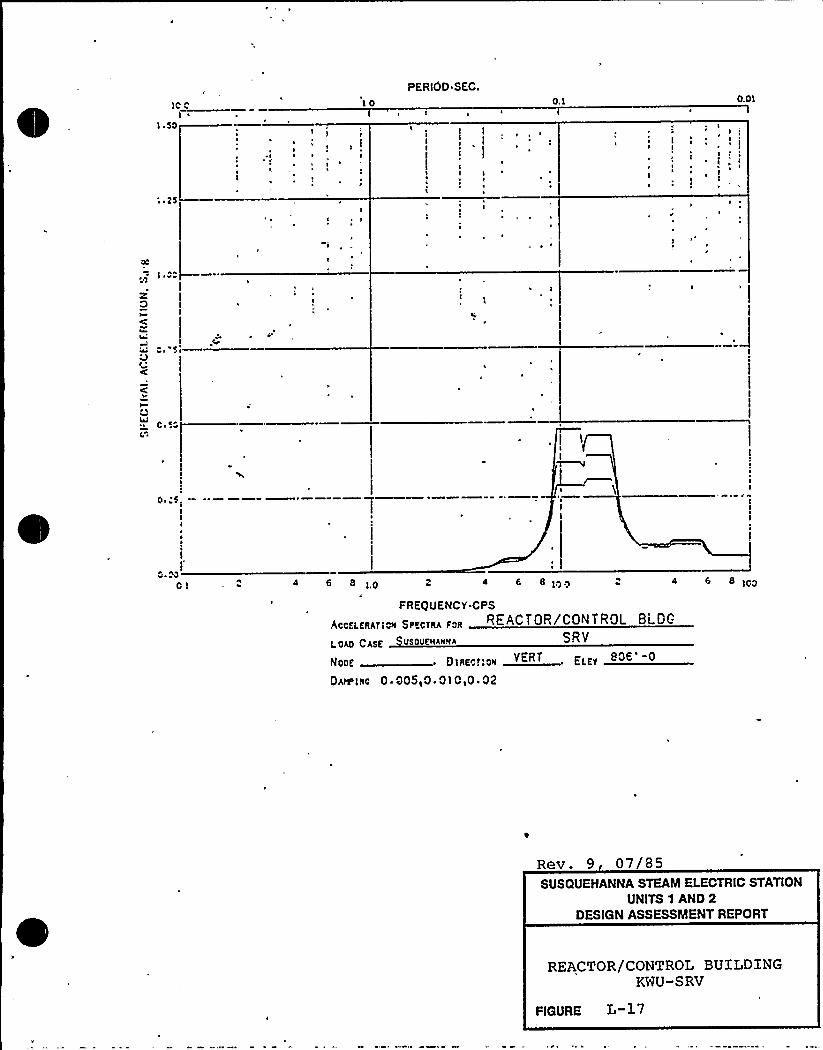
1C 0I
1 ~ 50
: F 25
10
I1
~ I I
II ~ g
PERIOD SEC.
~ <~
0.1
I~ 1i
0.01
C
I~ I
I
I
Z0
C
I '
0 ~ 000 I 4 6 8 2 4 6 8100 4 6 8 100
FREQUENCY CPSREACTOR/CONTROL Bl OC
L OAO CASE VSOUSHAIIMA SRV
NOOf ~ 0186 f Oll, Pl gy 80E 0
OAwlÃc 0 F 005,0.010,0.02
Rev. 9 07/85SUSQUEHANNA STEAM ELECTRIC STATION
UNITS 1 AND 2DESIGN ASSESSMENT REPORT
REACTOR/CONTROL BUXLDXNGKWU-SRV
FIGURE L-17
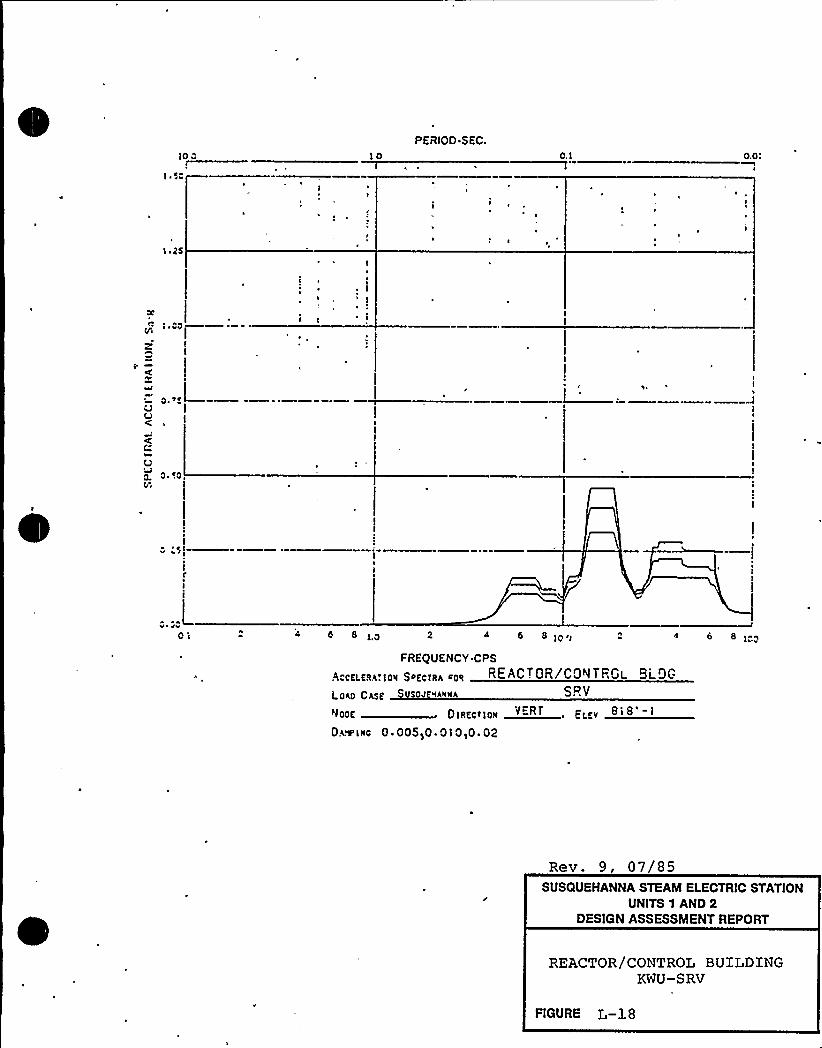
10 0fI ~ 5C
10PERIOD SEC.
0.1 0.0:
I ~ 25
l ~
I
R
4'
~aJ
C
0 ~ 0
V
I
II
oi 4 6 6 2 6 IOO o 8
FREQUENCY CPS
AccELEAa110'I SoEctIIA ios REACTOR/CQ ITROL BLDG
Logo Chyle S soJ IANNA SRV
90DE 0IREcf loll ~ ELEv
0.«misc 0 ~ 00510 ~ 0 I 0,0 ~ 02
Rev. 9, 07/85SUSQUEHANNA STEAM ELECTRIC STATION
UNITS 1 AND 2DESIGN ASSESSMENT REPORT
REACTOR/CONTROL BUILDINGKNU-SRV
FIGURE L-18
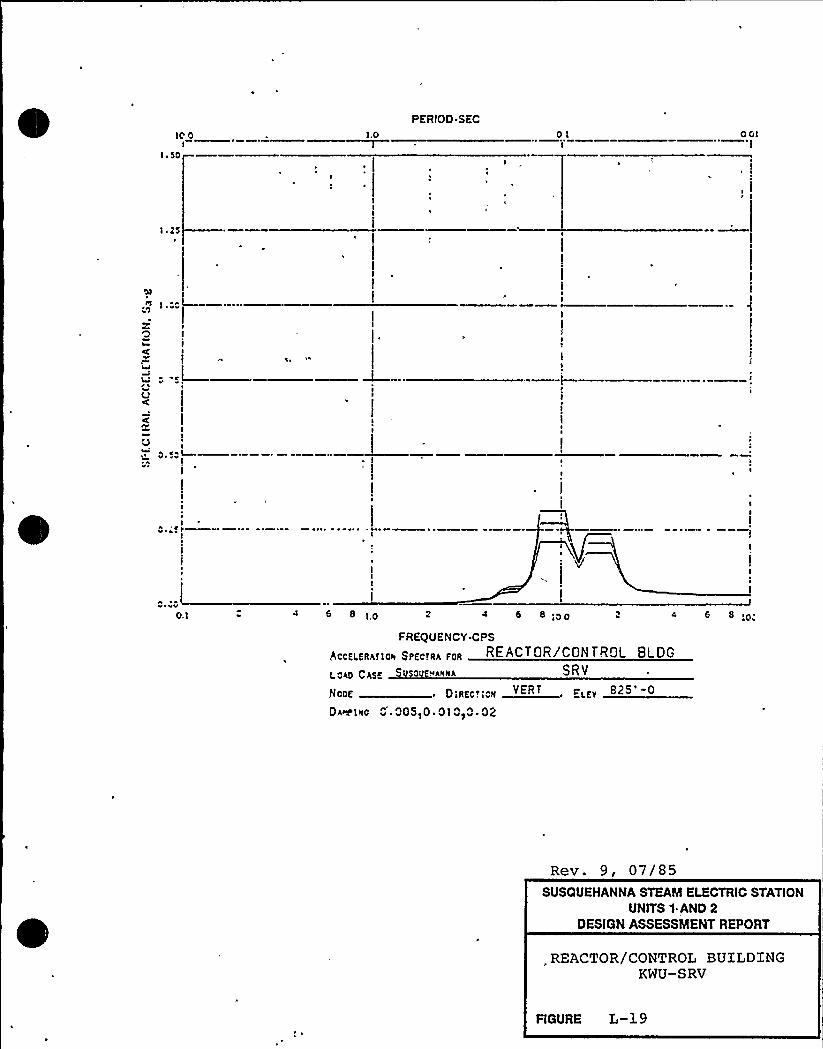
100I
I ~ SOI—
1.0
PERIOD.SEC0 '1 0 01'I
;.1yj—
V
22I
X= : -SI
y
I
~ I
I
Cv v
~yv vv0.1 I,O 2 8 8;oo 6 8
FREQUENCY.CPS
IEIccEl ERASIQII SPEC)RA EQR REACTOR/CONTROL 8L DG
1 Qho CASE VSQ NANNA SRV
HQDE PiREC. If VyyyVERT ETE -P
DM!'INC 0 ~ 005,0 01010 02
Rev. 9, 07/85SUSQUEHANNA STEAM ELECTRIC STATION
UNITS 1.AND 2DESIGN ASSESSMENT REPORT
REACTOR/CONTROL BUXLDINGKWU-SRV
FIGURE L-19
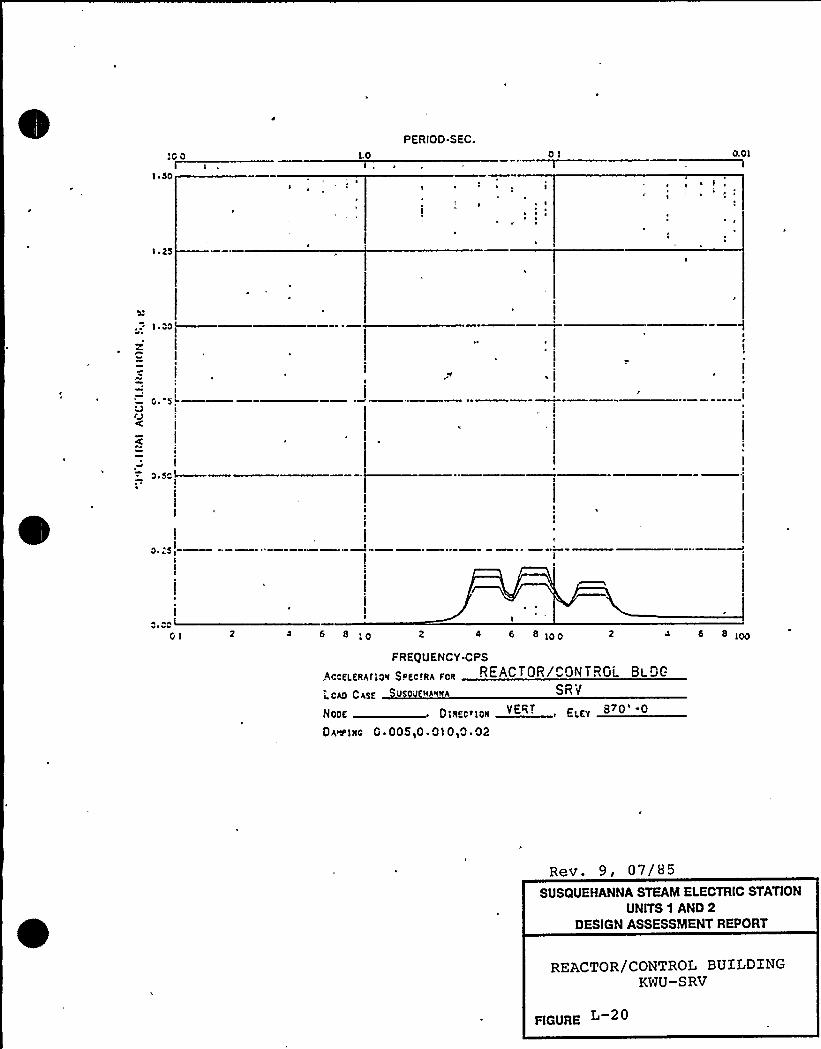
'op
1 ~ 50
1.0
PERlOD.SEC.01 0.01
I~
I~ I
I ~
F 25
II
I
G. 5LJ/J
5.5O I—
AQv vaOl 6 8;0 E 4 6 51OO 5 loo
FREQUENCY CPS
pccEl ERAf'o% $ pEclRA F0R
REACT
QR�/"ON T ROL BLDG
OAD CA5E 0 O'A%MA SRV
NODE 015ECtlOH ' ELEY
OAwlllc 0 '05,0 '10,0 '2
Rev. 9, 07/85SUSQUEHANNA STEAM ELECTRIC STATION
UNITS 1 AND 2DESIGN ASSESSMENT REPORT
REACTOR/CONTROL BUILDINGKWU-SRV
FIGURE
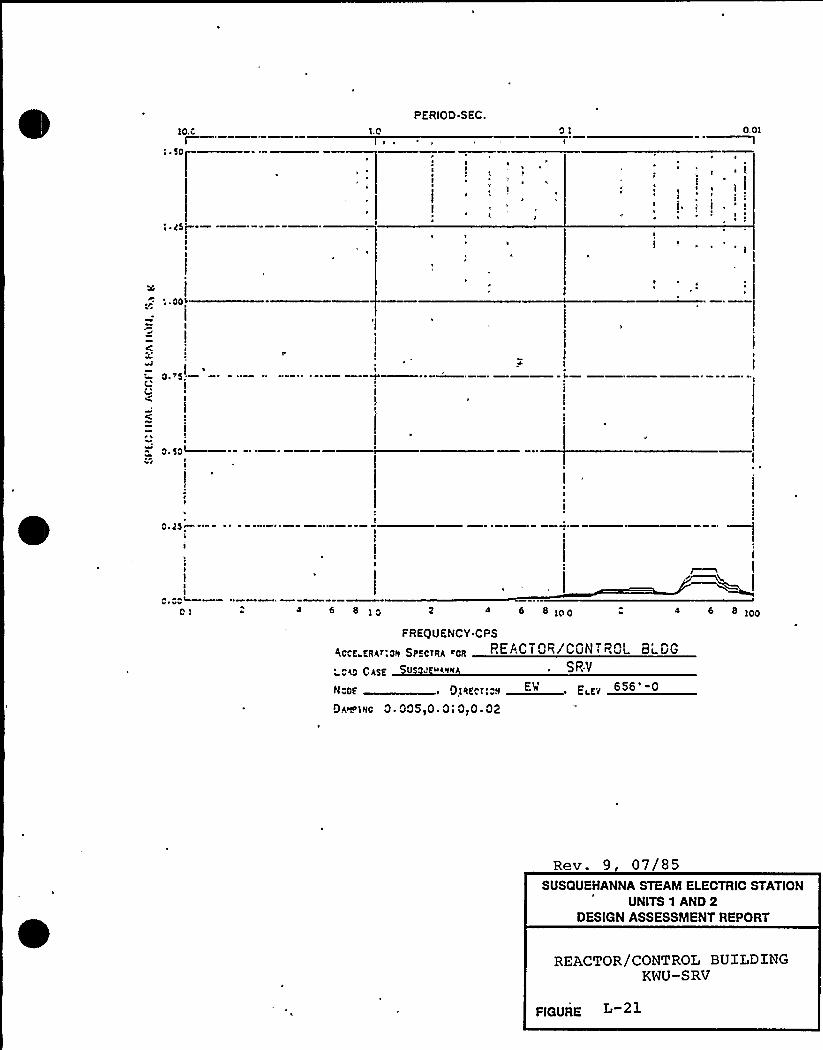
lo.cI
1.0
PERIOD.SEC.
II
I
I I
0.01
~ <
I '
I
I
I
l
4 6 8 ioo 4 6 8 ioo
FREQUENCY CPS
(ccc.v~i:o~ Serc~v ~oa
'hio Chsp UsodE"4'I<h Sp;V
NSOE ~ QLREcl'"N E~~ EsD 6S6'0
Qa~>ec 0 ~ 005,0 ~ 0 I 0~0 ~ 02
Rev. 9, 07/85SUSQUEHANNA STEAM ELECTRIC STATION
UNITS 1 AND 2DESIGN ASSESSMENT REPORT
REACTOR/CONTROL BUILDINGKWU-SRV
FIGURE L-21
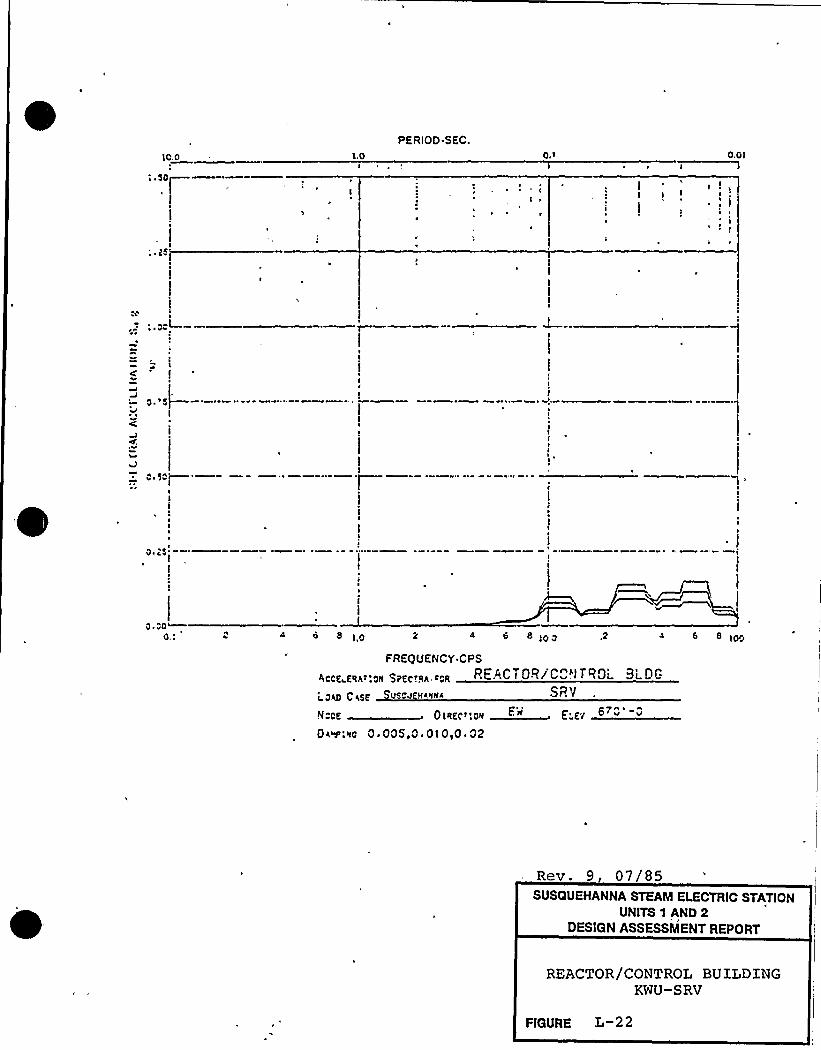
10.0
1 ~ 50~1.0
PERIOD.SECOi> 0.01
I
gC
1
II1
II
I0 ~ a5
cl0,: S 8 10 4 S S S >00
FREQUENCY CPS
4ccE ERA'cN SPEc'RA rcR PROCTOR/C~"ITR01- BLDG
i 0RD C<5E u5cv raRNi
N""E OI~Ec"as E:erF.'4, . 6~0'-0
Oiw:Rc 0.005,0 ~ 010,0 02
Rev. 9 07/85SUSQUEHANNA STEAM ELECTRIC STATION
UNITS 0 AND 2DESIGN ASSESSMENT REPORT
REACTOR/CONTROL BUILDINGKWU-SRV
FIGURE L-22

'QQI
I ~ 50.
1.0
PERIOD SEC.
Q 1 0.01
~ s5
~ II
Z I
t
I
CIt
I
o. 5GIVl
C c5c
l
I
01 6 8 ~ 0 8 100 6 8 100
E'I, E. 5q676'0
e 0 IRKCTION
Pm '1vo 0 ~ 005,0 ~ Ol 0,0. 02
FREQUENCY CPS
Acct'eir:o~ S~ecrai ~GII
PO/) C$ 5$ VSO 'ANHA SRV
NODE
Rev. 9, 07/85SUSQUEHANNA STEAM ELECTAIC STATION
UNITS 1 AND 2DESIGN ASSESSMENT AEPOAT
REACTOR/CONTROL BUILDINGKWU-SRV
PIGUAE L-2 3
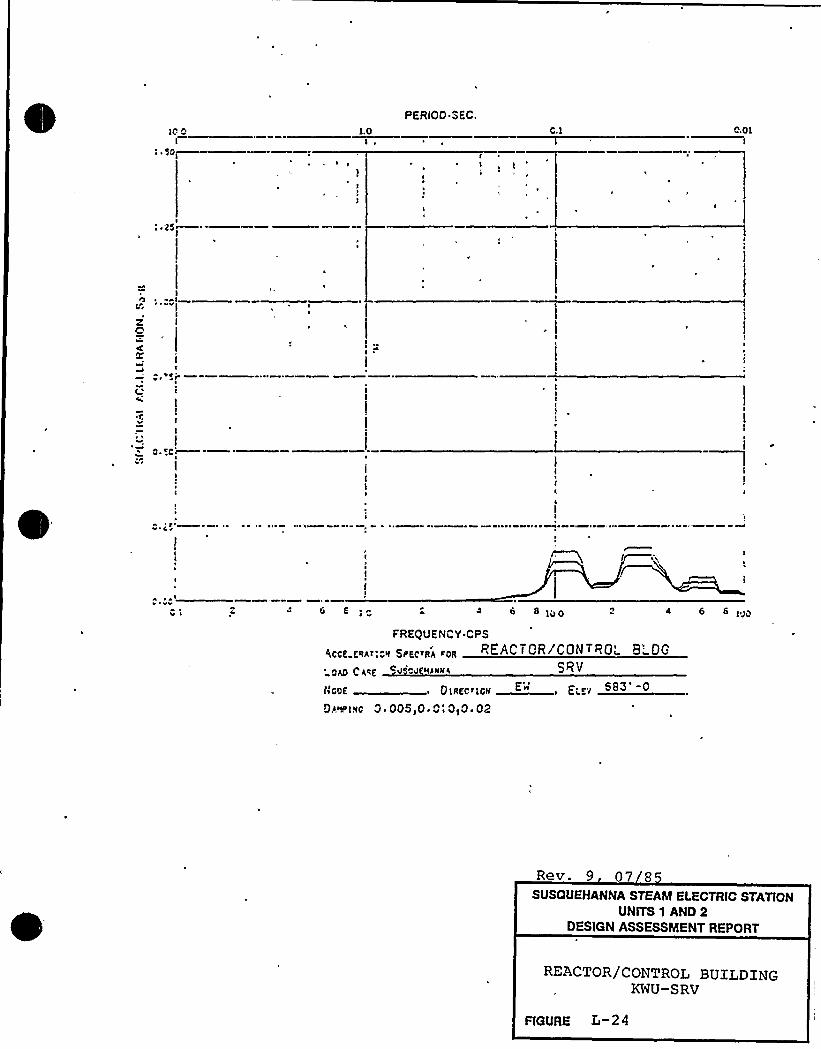
IOOI
I'01.0
PERIOD SEC.C.l O.Ol
: F 25
P4 ~V
2I
I'
rlVCI
(
I~ C I
I
IG.~CD
II
II
1
I
V CW
VV
V I 6 lOO 4 6 6
FREQUENCY CPS
~RA ~GR REAC TORICON ROL 8 OG
kPHME SRV
tIGGE ~ OlREC~lGN I EvKI
OR~lRC O.OOS,O.O;O,O.O2
Rev. 9 07 8SUSQUEHANNA STEAM ELECTRIC STAT(ON
UNITS 1 AND 2DESIGN ASSESSMENT REPORT
REACTOR/CONTROL BUILDINGKWU-SRV
RGURE L-24
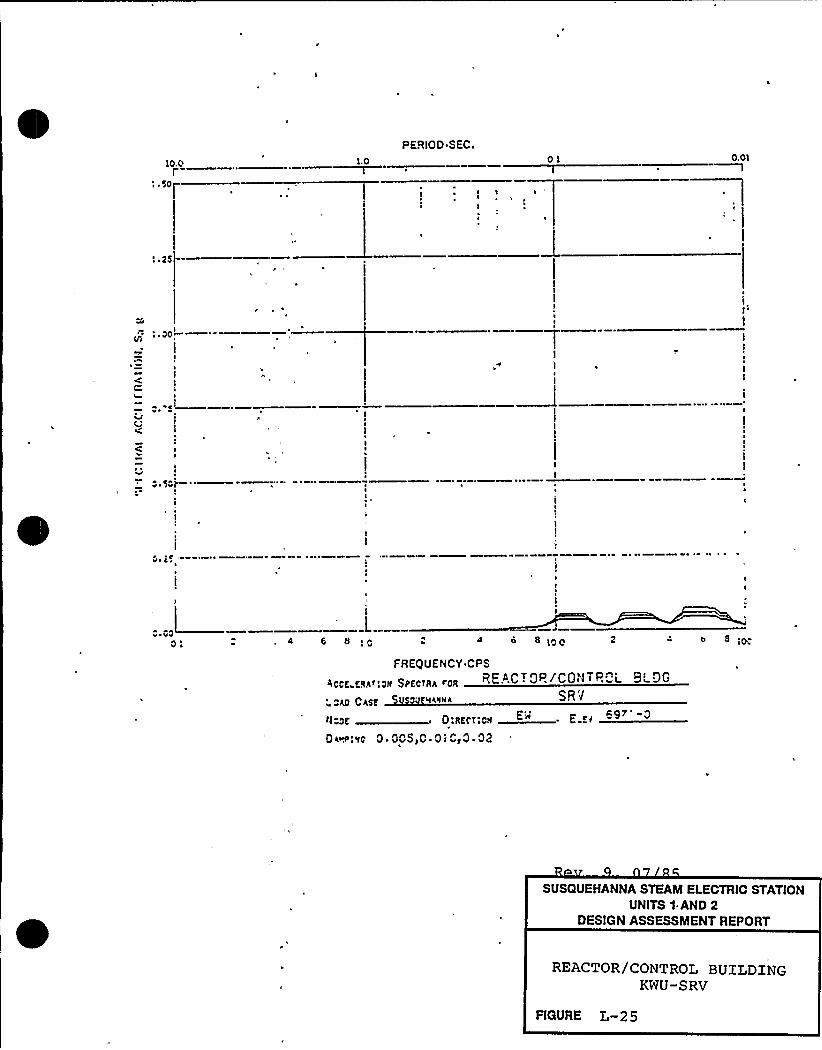
LO
PERIOD SEC.01 0.01
I I II
4 8 8 i 0 488@0 b 8
FREQUENCY CPS
4cc8.884"108 Sp8crrrp rag RE..C ~ QP /CON TP, i BLDG
040 C488 LrtRH4 SRVE97
'Icaa~ 0:AEcr'08 Err . E 8g 9'
Di~:~8 0 CCS,C.Cr Cr0 02
SUSQUEHANNA STEAM ELECTRIC STATIONUNITS 1 AND 2
DESIGN ASSESSMENT REPORT
REACTOR/CONTROL BUILDINGKWU-SRV
FIGURE L-25

P
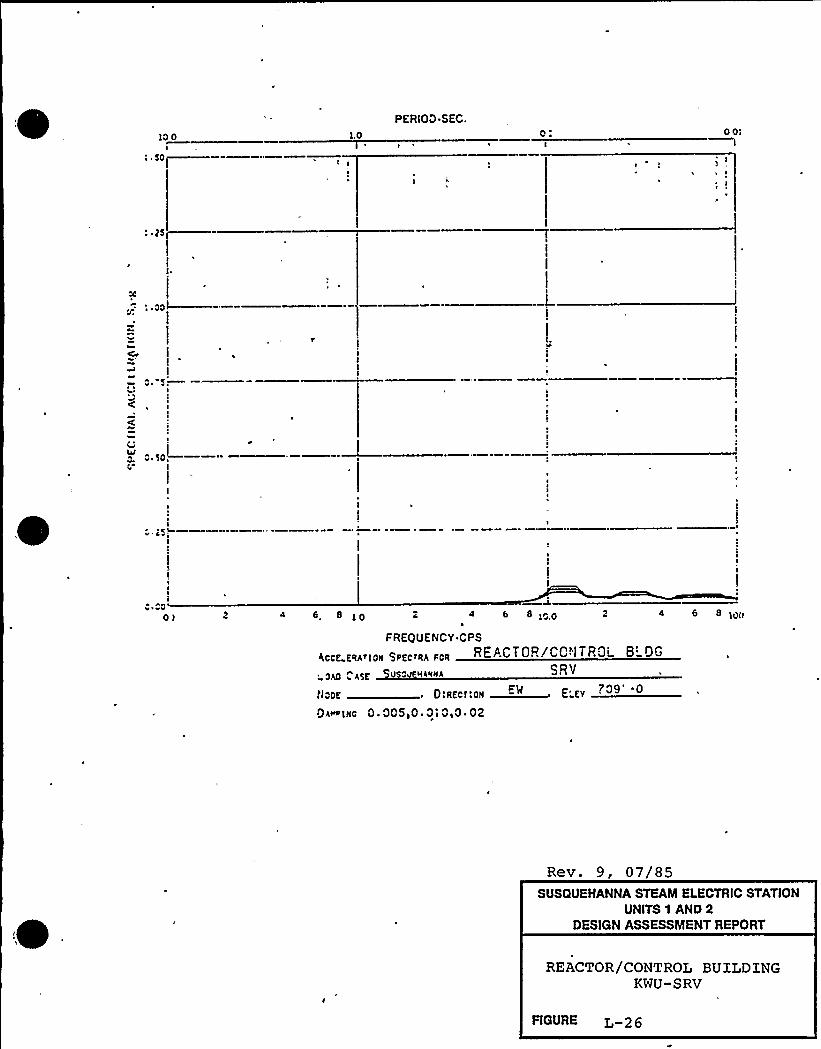
10 05
: ~ 5ltiC
1.0
PERIOD SEC.0 Ol
55@
:.55(—
5
55
55
5
O„II
5
Cl
I
iI5
55
i0 00
OI 4 8. 8 |0 8 8..00 4 8 8 illFREQUENCY CPS
/ccrc ERArlOR SFfc~RA F0R REACTO../CC "ITROL 8'Gae "isa SRV
NOOSE OiR80r:OR W~ E;CV . 09'0
DA~LRC 0 ~ 005i0 0'50 0'02
Rev. 9, 07/85SUSQUEHANNA STEAM ELECTRIC STATION
UNITS 1 AND 2DESIGN ASSESSMENT REPORT
REACTOR/CONTROL BUILDINGKWU-SRV
FIGURE L-26

lo 3
: ~ 5tlp10
PERIOD SEC
I ~ rl
ooiI
Cv
II
)( I
0 ~ SrII
0 ~ 50,iI
0 'S,
A AV VV4 6 8 lo O loo 4 «)oo
FREQUENCY CPS
(COE BAiiON $ PSC)RA FOR REACTOR/CONTROL BLDG
LOGIC CASE vSOO kAHHA SRV
NOOE ~ D)RSer;OII E", E «Tl9'IDi~:llo 0.005,0 Qi0,0.02
Rev. 9
SUSauEHANNA STEAM ELECTRIC STATIONUNITS 1 AND 2
DESIGN ASSESSMENT REPORT
REACTOR/CONTROL BUXLDINGKWU-SRV
FIGURE L-27
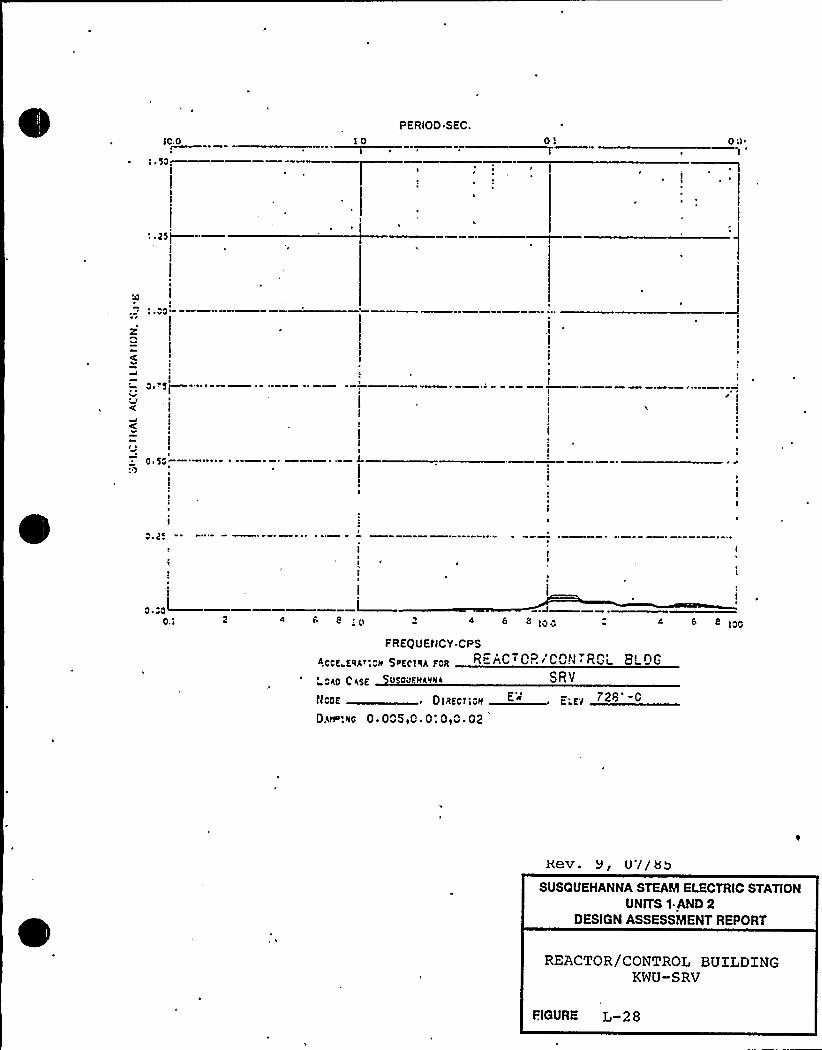
IC.O
o ~ 5D,I
PERIOD SEC
10 OI 00 ~
1
~ D
z
DE 5
I.I
I
Ii0 ~ 50
h gE ~
O.a
Ii E IO 4 6 8 IO0 IOO
FREQUENCY-CPS
Eqgg H SyECIqg E II R wC CP CD.I RCI 8L DG
LChD ChSE SRV
tiCDE ~ D IRECl IDHE'»
~ e;Ev 728'0O.ha:Hc 0 005q0 ~ 0: QqQ ~ 02
Kev. 9, U'//88SUSQUEHANNA STEAM ELECTRIC STATiON
UNITS 1 AND 2DESIGN ASSESSMENT REPORT
REACTOR/CONTROL BUILDINGKWU-SRV
FIGURE L-2 8
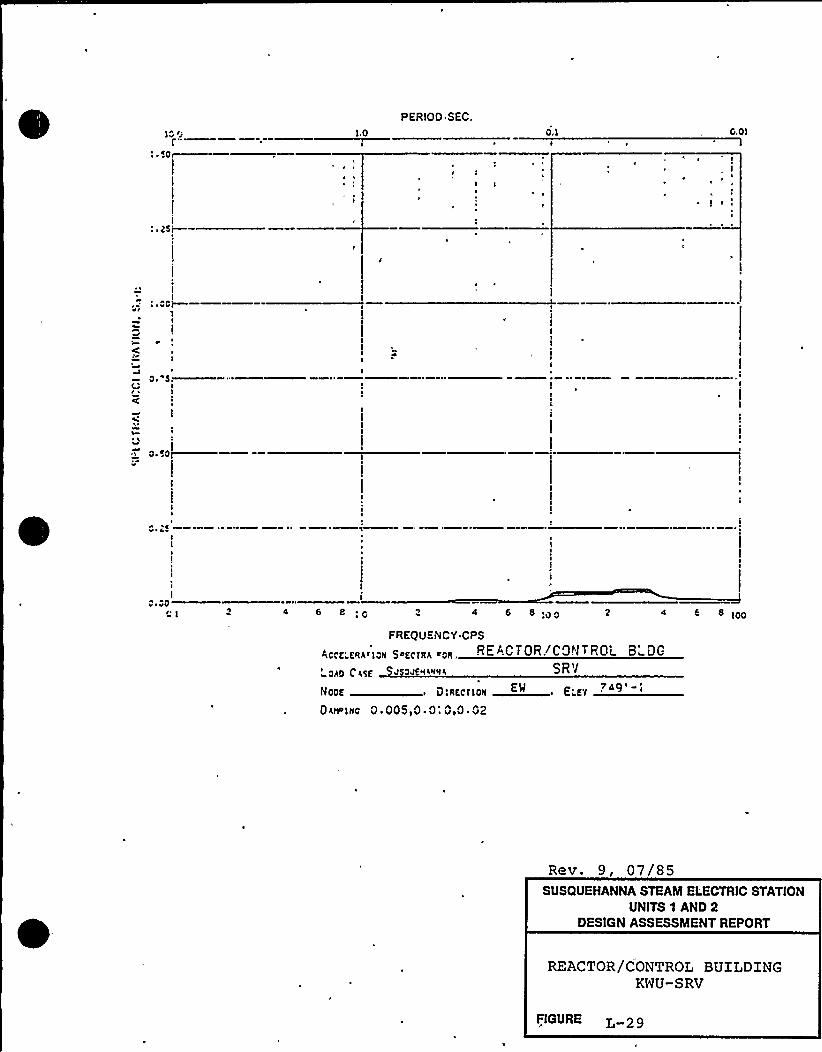
IG 0 1,0
PERIOO SFC.O.j G.O)
~ I
I
~ 25i—
II
II
Cii
0 ~ 5.i
.: aioI—
I0 ~ OO
OI 4 6 8 4 6 6 ~ OO 4 6 8 IOO
FREQU iVCY CPS
(COE'qhrION SoEgggP, ~OII REACTOR!CQ>l i RCI- B~OGC IO lI
LOAD CASE 4 OJ Kliikk
MODE ~ 0 liIECTIOiI EW E'YOAwINo 0 '05i0 ~ 0i 0 0 '2
Rev. 9, 07/85SUSQUEHANNA STEAM ELECTRIC STATION
UNITS 1 AND 2DESIGN ASSESSMENT REPORT
REACTOR/CONTROL BUILDINGKWU-SRV
FIGURE L 2 9

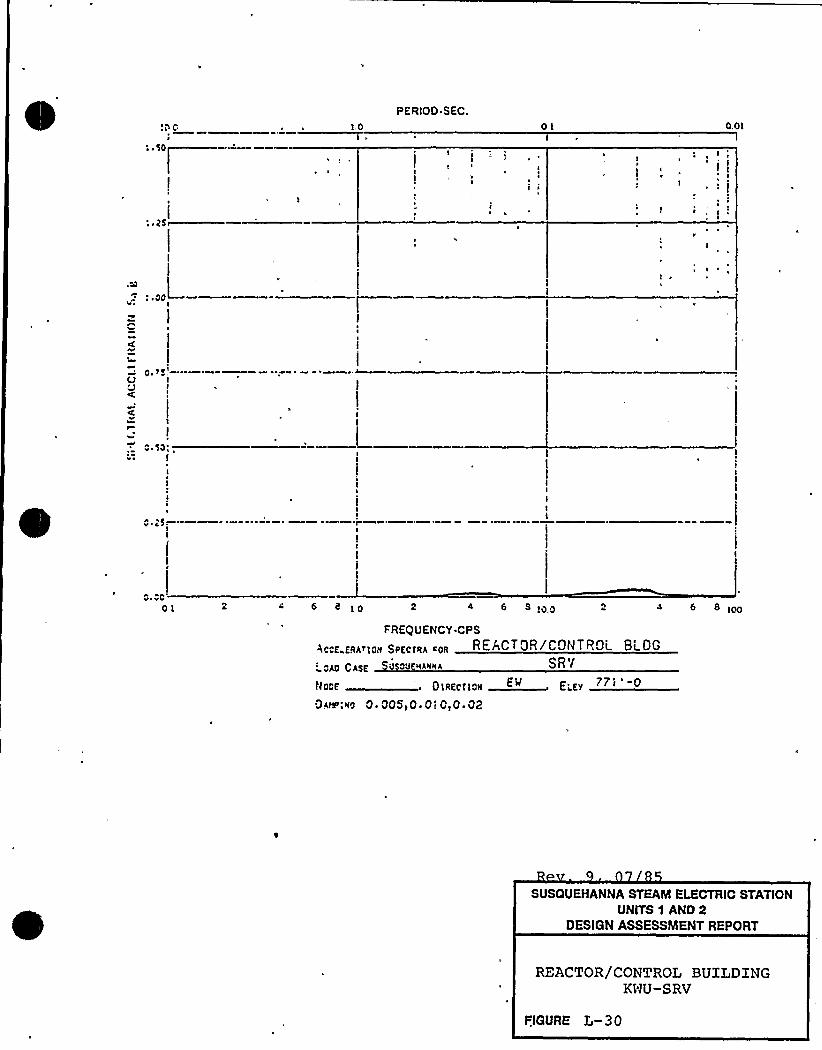
:00 L,or.
PERIOD.SEC.OL 0.0L
: dec
j
;: I
~, cI
4 I
ycO
" '50'
~ 25
0 DO
OL 4 6 S LP 2 4 6 S Lop S Loo
FREQUENCY CPS
ACCE ERAELOIE SPECTRA EOR REACT QR/CON T ROC BL OG~ ~ IE
AO CAEE 0 DU cEAMIIA
NODE 0vccc'.vLcv E;EvEll . 77iI'-0
OA+P:~O 0 005>0. 0 v 0,0. 02
SUSQUEHANNA STEAM ELECTRIC STATIONUNITS 1 AND 2
DESIGN ASSESSMENT REPORT
REACTOR/CONTROL BUILDINGKNU-SRV
FIGURE L-3 0

10. 0I
i ~ 50(
1 ~ 25
~ 0
PERIOO-SEC.
I ~
i1
h
0,1
III1
I
t I
0.01
zOI
0 ~ ~5'
P gA1
0,25<
C ~ OC
01 6 8 ~ 0 2 4 6 O 10'0 4 E 8
FREQUENCY CPS
ACCEsERAT1OR SPECTRA FCR
~DAD CASE JSCJEHaHMA SRV~ ~
HODE Dl!IKcvQII ELpy 7 9
OA~'.RC 0. 005,0. 01 0,0 ~ 02
Rev. 9, 07/85SUSQUEHANNA STEAM ELECTRIC STATION
UNITS 1.AND 2DESIGN ASSESSMENT REPORT
REACTOR/CONTROL BUILDjNGKWU-SRV
FIGURE L-31

lo 0
E.SO
: ~ 2$
1.0
I
I
E
PERIOD.SEC.
IE
O.l 0.0 I
~ I ~
E ~
E
E
E
~ .00
0 F 50
~E C ~
h
oa 4 o 8lO 2 4 < 8 lOO 8 lOC
FREQUENCY CPSREACTOP./CQI'ITRG''G
I oho Chsf S'v HANNA SRV
NEEE 0 lRECl IEH ~~ E'EDhw'lNO 0 ~ 005)0 ~ 0 I OIO ~ 02
SUSaUEHANNA STEAM ELECTRIC STATION
UNITS 1 AND 2DESIGN ASSESSMENT REPORT
REACTOR/CONTROL BUILDINGKWU-SRV
FIGURE L-32
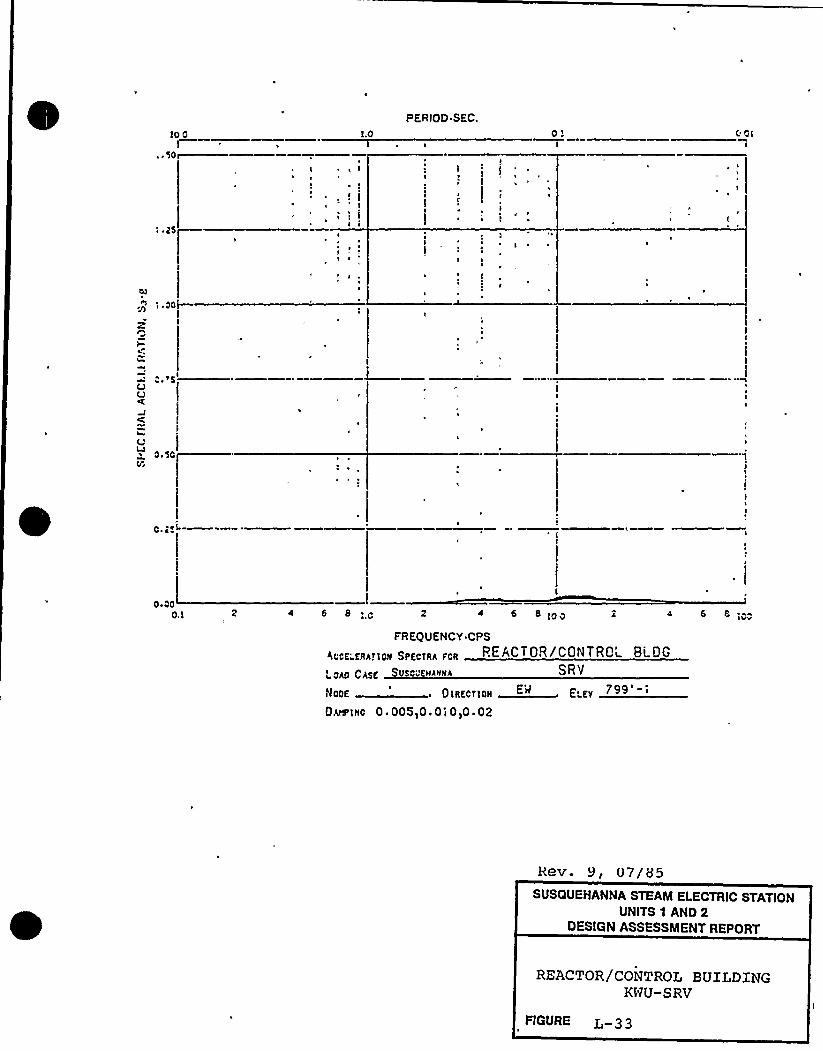
10 C LO
PERIOD.SEC.
C
00
J1'.coIzt
I
cd 5OU
iI
I 'i
1
~ ~
it
I
Ii
L
CD SC
C,2f L
O.cc0.1 2 4 6 8 2 4 6 8 lcc
FREQUENCY CPS
$ ccf'/''IIc11 SpfcfIIQ Fcf RE ACT CR /CON TRODI BLDG
USCJ HANMI
7 IHoof 01RECtlON ~ E~Kv
O.w Inc 0 ~ OOS,O ~ Oi 0,0 ~ 02
ReU ~ 9 ~ U7/85SUSQUEHANNA STEAM ELECTRIC STATION
UNITS 1 AND 2DESIGN ASSESSMENT REPORT
REACTOR/CONTROL BUlLDINGKWU-SRU
FIGURE L-3 3
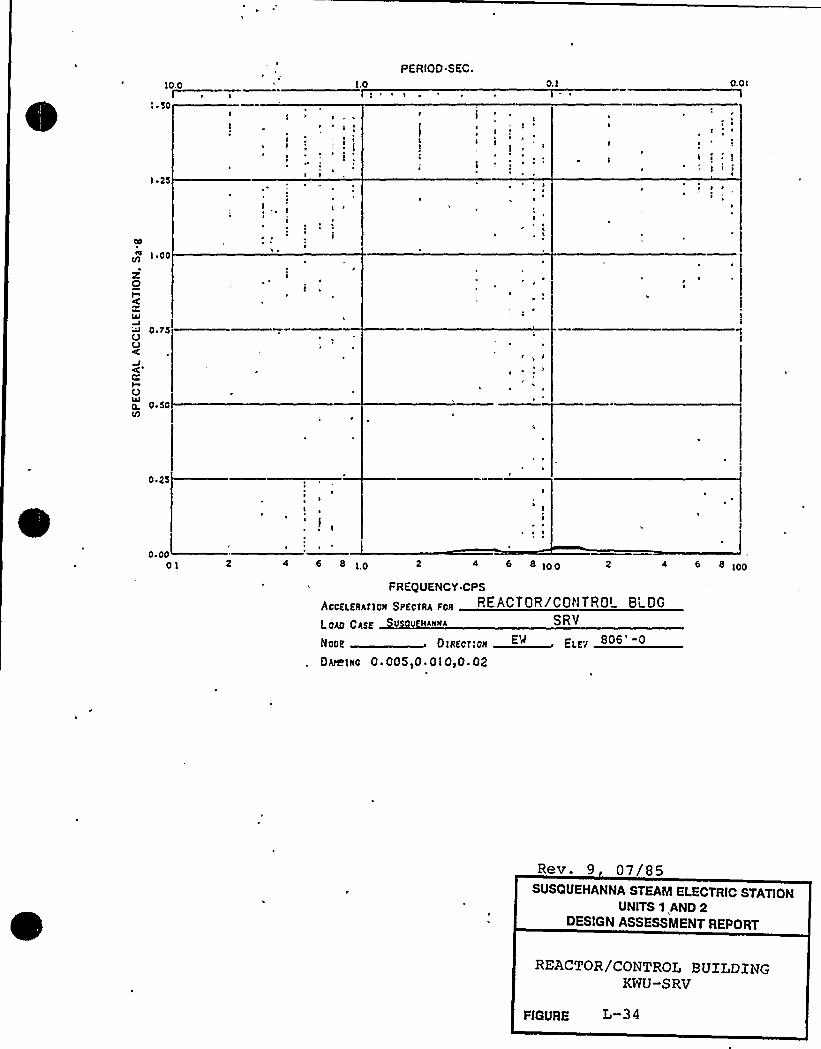
10.0I
'k ~ 50
1 '5
1.0
~ ~
k I
PERIOD SEC.
k
~ I
i
0,1 0.0I
I
1
Ik
~ ~
g 100
ZOI
0 F 75OO
I00. 0. 50
k
Ik
0.25
k.kk~',12
k~ lI ~
k
I
4 «10~ k
2 4 6 8100 6 1OO
FREQUENCY CPS
AgoeI,e11411011 SpeofIIi pop REACTOR ICON 7 R0'LDGL040 Cise SRV
ttkkk OtkfctlIkk ElktEtt . 806'0Oiie111o 0 ~ 005,0 0I0,0.02
Rev 9 07/85SUSQUEHANNA STEAM ELECTRIC STATION
UNITS 1 AND 2DESIGN ASSESSMENT REPORT
REACTOR/CONTROL BUILD|:NGKWU-SRV
FIGURE L 34
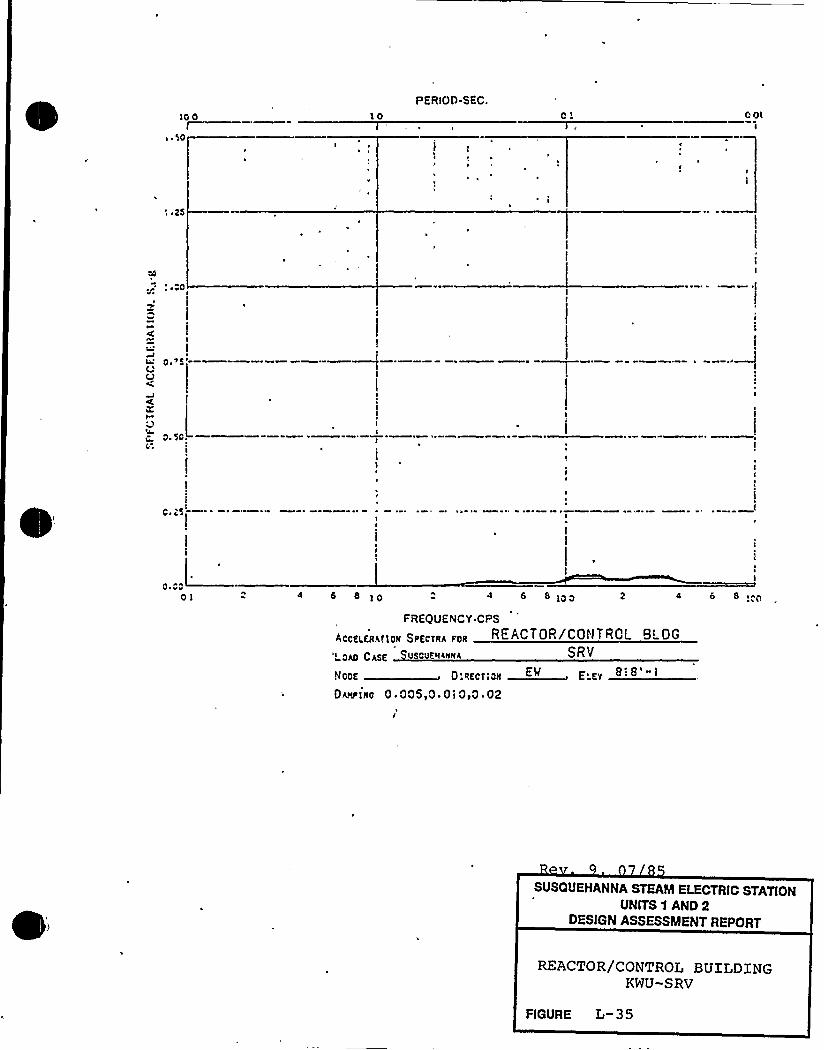
10 0
s ~ 50
10
I ~
PERIOO-SEC.0 ~ 001
I
: ~ 25
I
,15'j
4 6 8 6 8,00 4 6 8
FREQUENCY CPS
AggKgKgAr108 $ pKcrgA p08 REACTOR/CONTROL O'G~0AO CAsf sOUERttltrA SRV
"~4~ 0:~acr;a~ E,E„E'ri ~ 8! 8'-!DAp>180 0 005r0 Qi0,0 02
SUSQUEHANNA STEAM ELECTRIC STATIONUNITS 0 AND 2
DESIGN ASSESSMENT REPORT
REACTOR/CONTROL BUILDINGKWU-SRV
FIGURE L-35
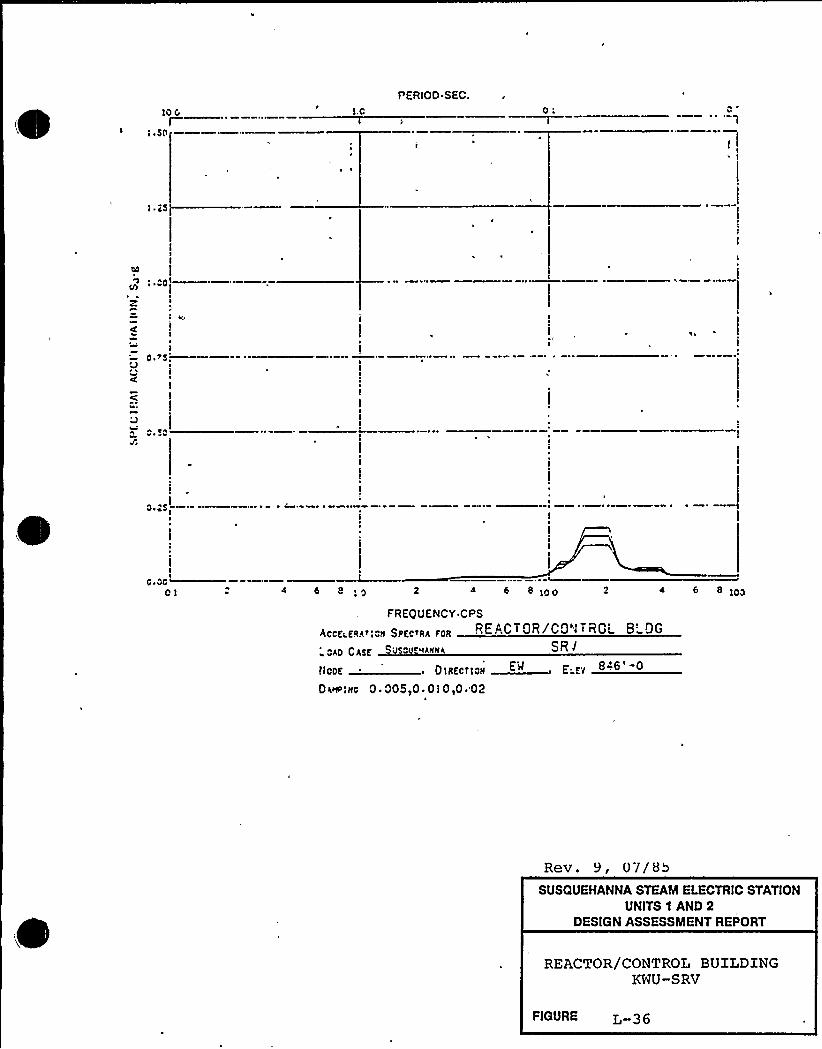
10 6I
;.sn
PERIOD SEC.
I.C 0'
4
0.>s,I
5aa
I
8.8$ ;. I
Ia.aa~nI 4 6 8 4 6 8 Inn 4 6 8
FREQUENCY CPS
4CCKLKRhf '8N SPKCTRh FOR R 6 ACT QR /CQ I 7 RC''G"
nhn ChsK 8 n ~'thNHh SR I
llaaa 'laaaalaa E.aaEM ., 846'0Dhw:xc 0.005,0 OI0,0 02
Rev. 9, 0 I/BbSUSQUEHANNA STEAM ELECTRIC STATION
UNITS 1 AND 2DESIGN ASSESSMENT REPORT
REACTOR/CONTROL BUXLDINGKWU-SRV
FIGURE L
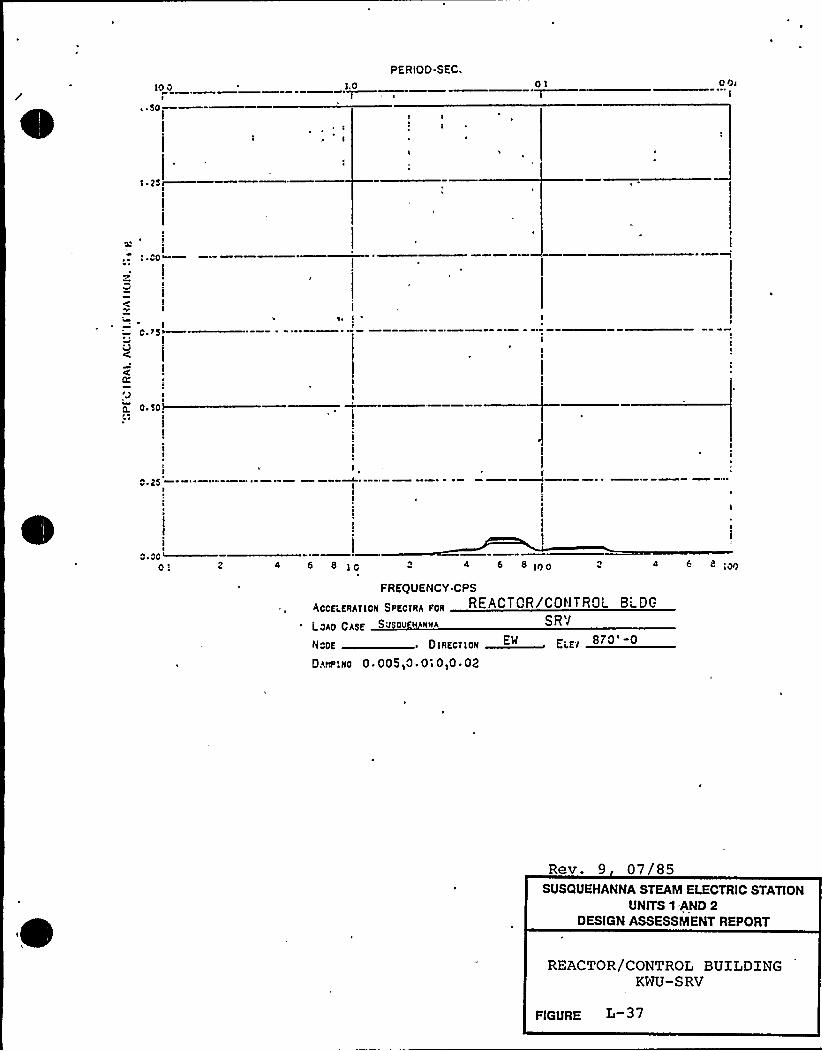
10 0t
,.50
PERIOD.SEC.1.0 01 00>
I
~ I
I ~ 25
"0
0 ~ 15
U(
0. 50
"~ 25
"X01 2 4 6 B
'I
4 6 8100 ;on
FREQUENCY CPS
A00B.~„A„B„S,BB,„A~0„REACTCR/CONTRQL B~DGC IO > I
I oA0 CAB' OU HAM>A
NBDE DIREcTI0II E'7E'M .. 870'-0
OAwlIIC 0. 005,0. 0 0,0. 02
Rev. 9 07/85SUSQUEHANNA STEAM ELECTRIC STATION
UNITS 1.AND 2DESIGN ASSESSMENT REPORT
REACTOR/CONTROL BUILDINGKWU-SRV
FlGVRE
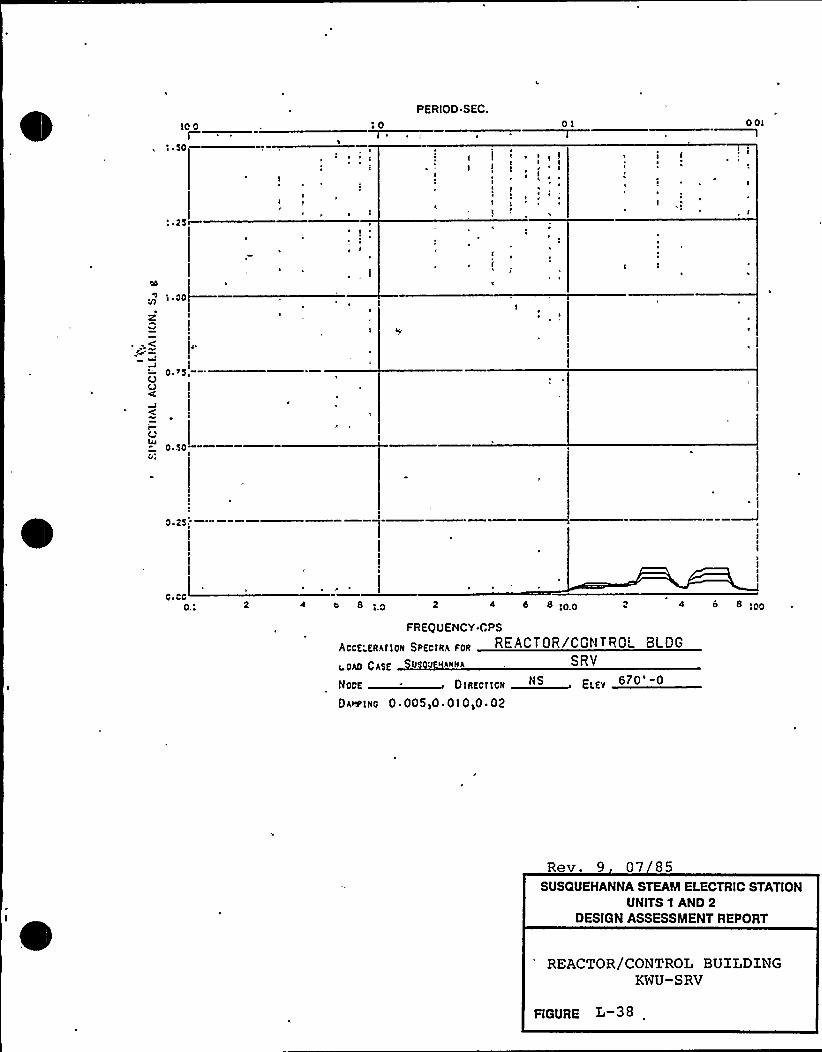
Ã0I
ED 50
PERIOD.SEC.10
I
E
E
I~ E
E
II I~ E
I~
01 O.OII
E
~ I
I~ I
~ E
0 ~ 75,
I
0 '0
0 25-
C.CCO.G
4 II 8 2 4 «:00 4 8 8 Goo
FREQUENCY CPS
ACc5'KRET108 SPEctRA FOR REACTOR/CONTROL 8LOG
040 C 455 05005E|AIIIIA SRV
IIGGE DEEEGE<GII EEEVNS 670'-0
OAIIP1NC 0 ~ 005IO 010y0 ~ 02
Rev. 9 07 85SUSQUEHANNA STEAM ELECTRIC STATION
UNITS 1 AND 2DESIGN ASSESSMENT REPORT
REACTOR/CONTROL BUILDINGKWU-SRV
PIGURE L-38
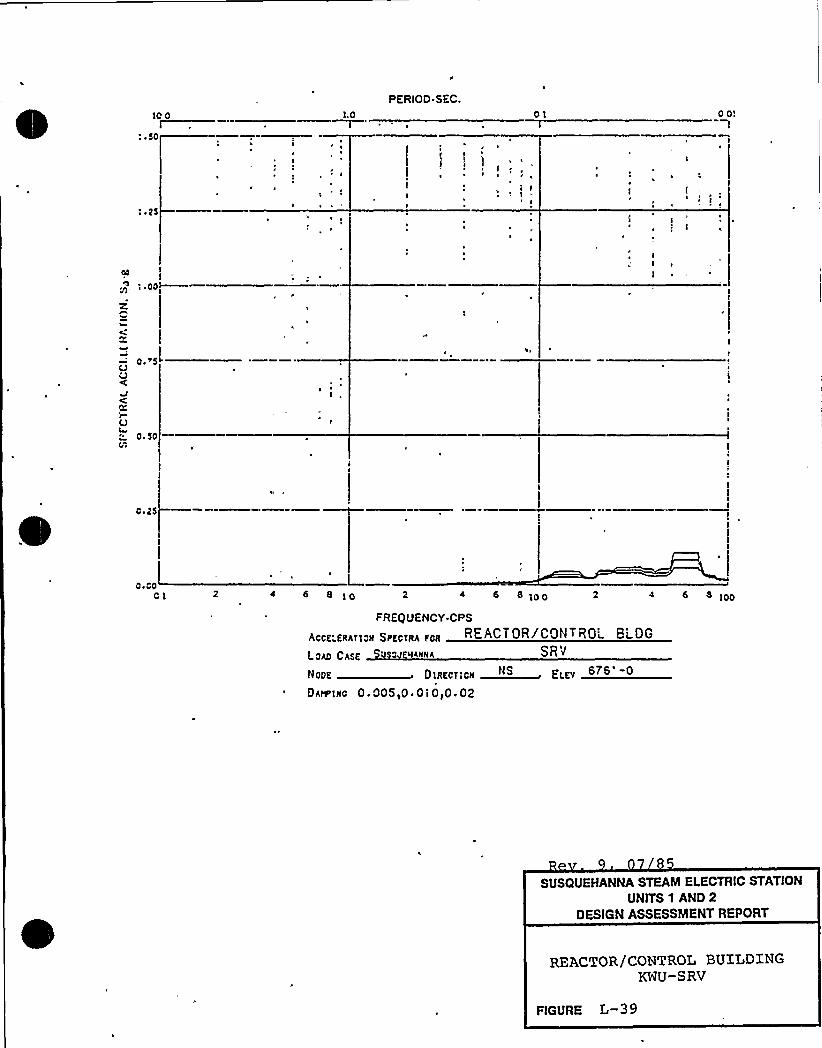
10 0
so
PERIOD.SEC.1.0 01 0 0'
I ~ 2S
iJ
1 (I
I
00
I ~ OOI
'Z
I
A
I— O.~SiOCD
~ ~
I
0 ~ So
e.as)
OOOO
01 4 6 8 K 4 6 8100 8 IOO
FREQUENCY CPS
Poof KIIA'fIOII $ 1 KO11IA 808 REACT OR /CON T ROL 8 ~ OG
LOAD CASK 4 O SABHA SRV
0 GREC. laN ~ ELEy 6TS'
OAR l8C 0 ~ 005,0 ~ Oi Oi0 ~ 02
SUSQUEHANNA STEAM ELECTRIC STATION
UNITS 1 AND 2
DESIGN ASSESSMENT REPORT
REACTOR/CONTROL BUILDINGKWU-SRV
FIGURE L-39
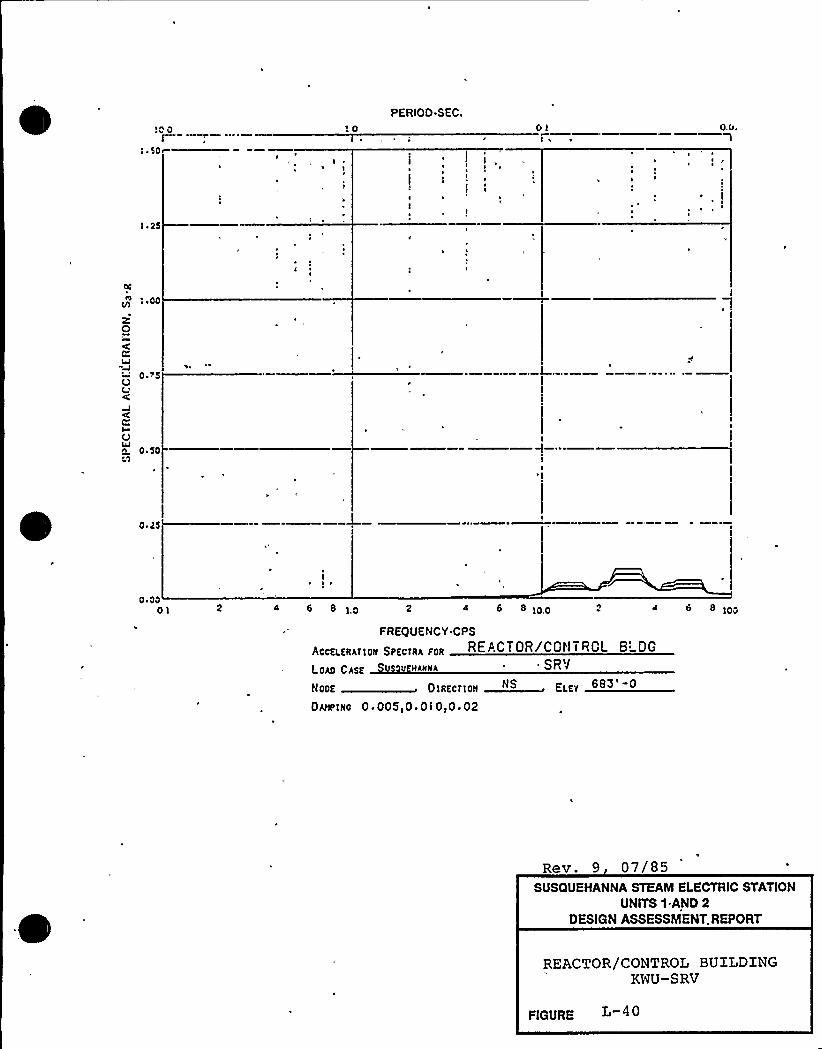
ttt 0
~ ~ $ 0
3 ~ 25
Lo
I ~
'I
PERIOD.SEC.
I
tI
I
tI
0.0,
OC
g t ~ 00
ZQ
0.75t
I0
01 4 6 8 4 0 0 F00 4 + 0 loo
FREQUENCY CPS
ACCELERAT\OR SPECtRA FOR REACTOR/CGI'ITRCL 8'GLOAO CA5f U V MAMMA ~ SRV
N0DE Dlttttttll ~ EtstO~iRc 0. 005,0. 0 I 0,0 ~ 02
Rev. 9 07/85SUSQUEHANNA STEAM ELECTRIC STATION
UNITS 1-AND 2DESIGN ASSESSMENT. REPORT
REACTOR/CONTROL BUILDINGKWU-SRV
FIGURE L 4 0

0
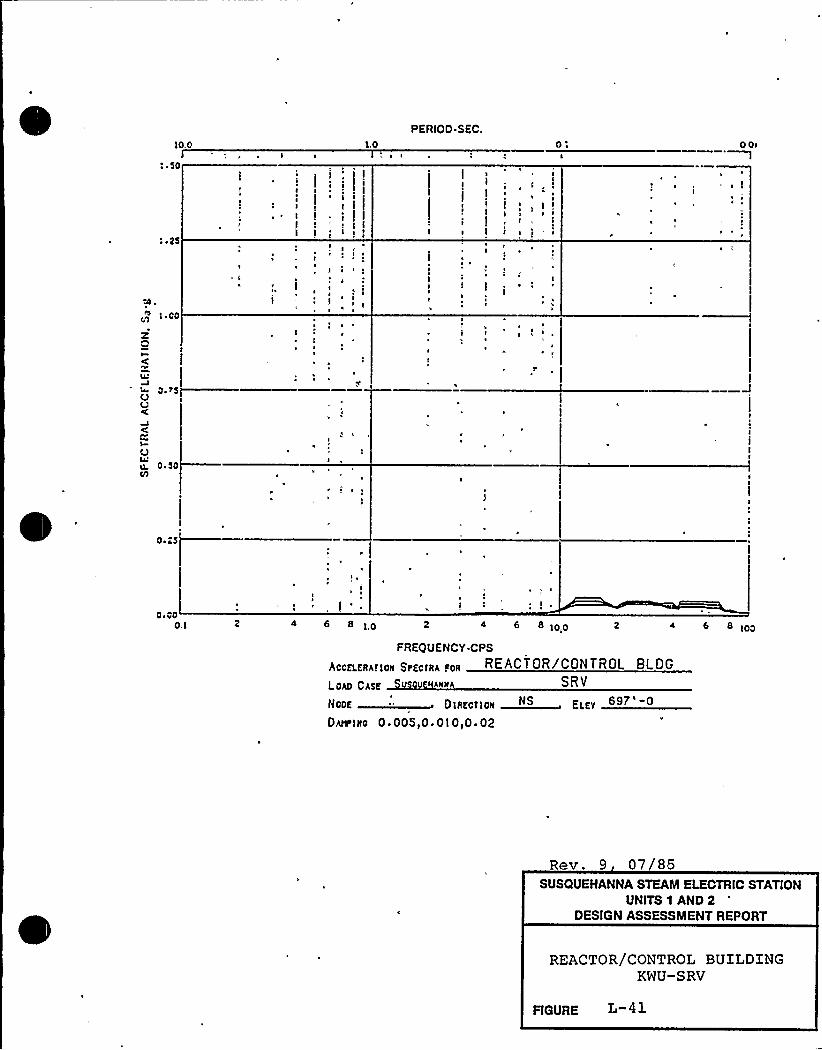
10.0
AI ~ 00
zv~
5
Oa. EI
( '5
0 ~ $0V)
I
III
II
10
5
5
5
I
I
I I I
II 5
5 5 5
I ~
I
5I
5
~ 5
PERIOD-SEC.
I
5
I5
f 5
Oa
Ig
~
~ ~
I I I55 5
I I '
s
Ops1
I
I
III
5 5~
0 F 000.1 4 6 8 10 4 6 8 100 8 100
FREQUENCY.CPS
AccELKRArlOR $ PEclRA foR REACTOR/CONTROL BLDG
LOAO CASf 0 CUEHARNA SRV
OOE - Dlststlaa rstt OIE Q
O~IRc 0. 005,0 ~ 010,0. 02
Rev. 9 07/85SUSQUEHANNA STEAM ELECTRIC STATION
UNITS 1 AND 2DESIGN ASSESSMENT REPORT
REACTOR/CONTROL BUXLDINGKWU-SRV
FIGURE L-41

10.0I
s ~ 50
10PERIOD SEC.
( ~ I
0,1I
00.
00
g 1.00
RQI
0 ~ 75OO
CCiU0. 0.50CA
0 ~ 25
0 F 0001 4 6 8 2 6 IO.O 4 6 6 1OO
FREQUENCY.CPS
p 005I 511 A1 I 011 5 1(qo qIIA ~011 R E AC 7 0 R /C 0 N T R 0 L B L D G
L0A0 CA55 U OUE(iANiiA SRV
NDD( D(II(((((( EL((NS 709'-0
DAI5)110 0.005)0.0i0,0 '2
Rev. 9, 07/85SUSQUEHANNA STEAM ELECTRIC STAT(ON
UNITS 1 AND 2DESIGN ASSESSMENT REPORT
REACTOR/CONTROL BUILDINGKWU-SRV
FIGURE L 4 >
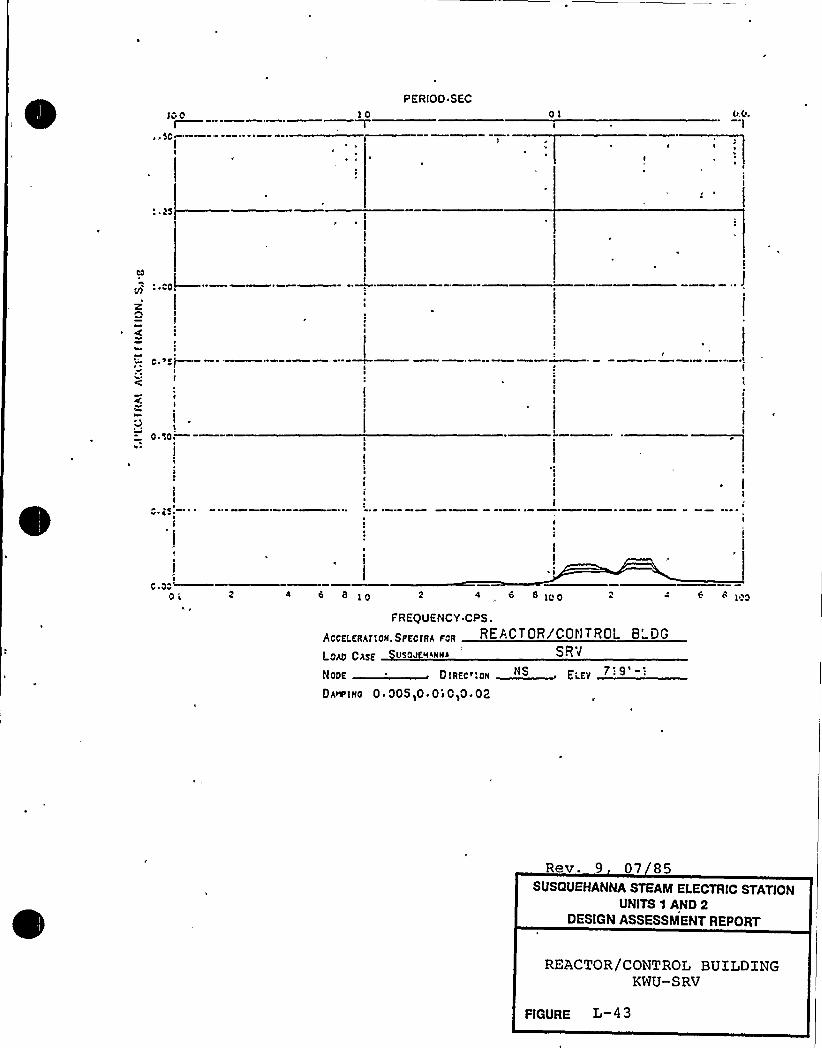
10PERIOO SEC
01
:l
4 O 8 Io 4 „O 0 ICO 6 8 IOO
FREQUENCY CPS.
AcCEO ERhT'OR. SFECfRh FOR REACTOR/COIITROL O'GLoho ChgE USOJ IEIIIIN SRV
NoaE DlREC"aOII NS ~ 7! 9''.e EiEY
DhNIF>RO 0. 005)0 ~ Oi 0~0 ~ 02
Rev. 9 07 85SUSQUEHANNA STEAM ELECTRIC STATION
UNITS I AND 2DESIGN ASSESSMENT REPORT
REACTOR/CONTROL BUILDINGKWU-SRV
FIGURE L 4 3
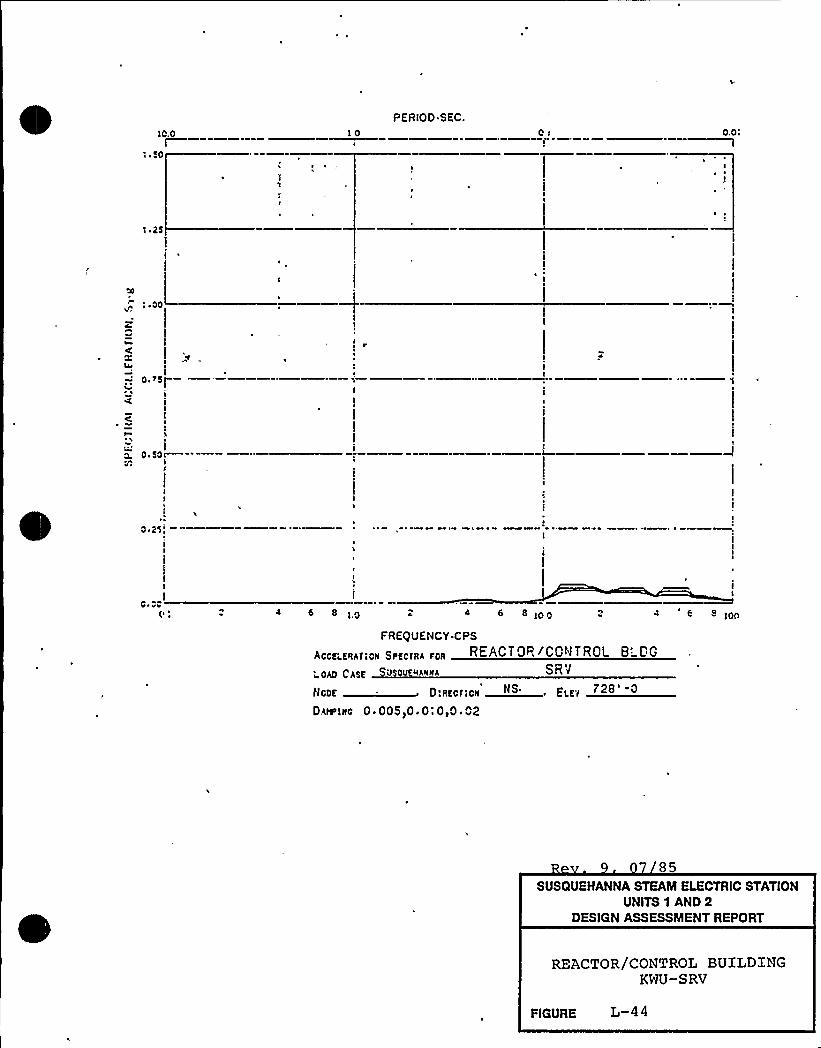
IO.OI
Eo
10PERIOD SEC.
O. OI
o
xo.~sI-
I
io.A
I
IIIk
I
I0 ~ 5OI-
I
eC ~ ~
II
I
II
Ichoo
o 4 6 8 IO 4 «IOO O IOn
FREQUENCY.CPS
A . „„;o„S,„„„REACTOR/CCIJTRQL B'G~o~ Cygne v OU RARHA
N0DE 0 ~ REciION 'I.EvDvt'I~o 0 005)0.0: 0,0 ~ 02
85SUSQUEHANNA STEAM ELECTRIC STATION
UNITS 1 AND 2DESIGN ASSESSMENT REPORT
REACTOR/CONTROL BUXLDINGKWU-SRV
FIGURE L-44
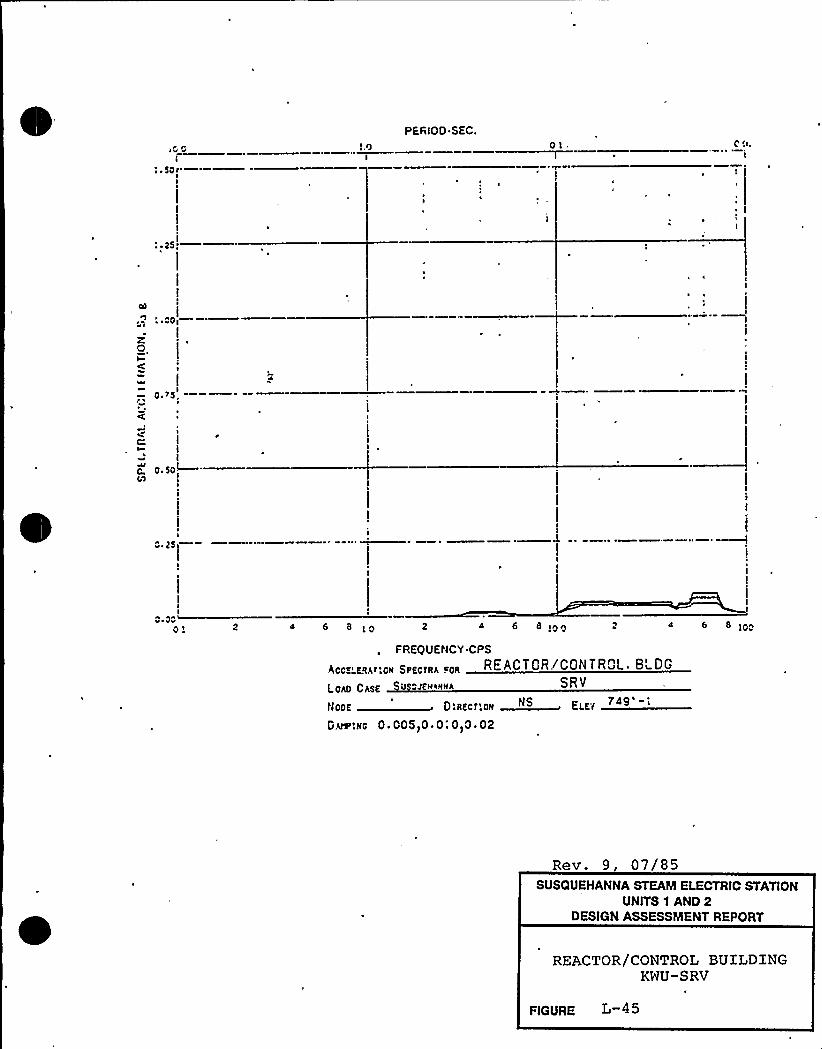
IO 0I
I ~ 50''l
PERIOD.SEC.OI
"Oi
ZQ,1
I
0 t5I ~
jc- I
f. 0.50~(~n
I
j0.25i
0 vv0 1 465~0 4 6 8 500 4 « IOO
FREQUENCY CPS
RECCE'IIA<:CN SPECIRA !OR REACTOR! CON TR~L. B~ DG
LOAO CPIEE 0 «JEklHHA SRV
IjooE DiRECPOH S ELE1
D.ve:No 0 ~ 005>0 ~ 0: 0>0 ~ 02
Rev. 9, 07/85SUSQUEHANNA STEAM ELECTRIC STATION
UNITS 1 AND 2DESIGN ASSESSMENT REPORT
REACTOR/CONTROL BUILDINGKWU-SRV
FIGURE L-45
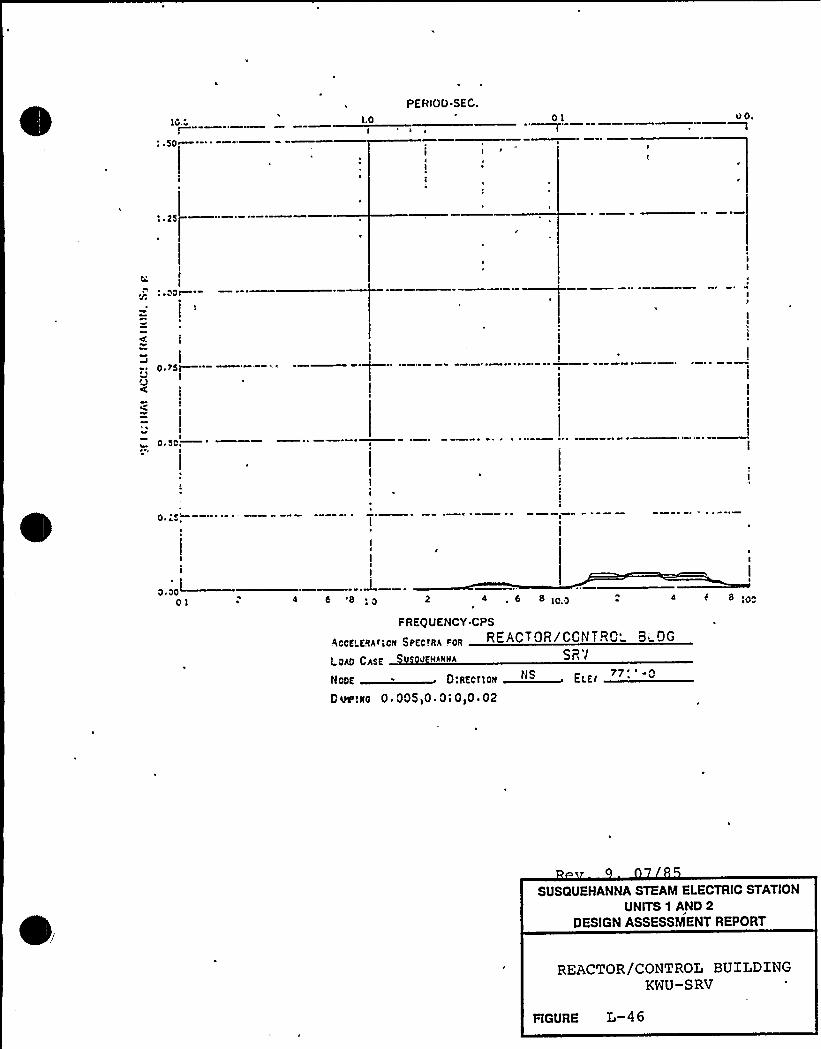
: ~ 50
PEBIOO.SEC.
l.o Ol
00 E
-, ~ 0 ~ 25
OJ
" '
0.5C
0 '5,
Ol 4 8 '8 2 4 ~ 8 8 l00 8
FREQUENCY CPS
,4ICCEIERAElCN SPECERR PCRREACTOR/CCNTR~'i 'DG
~ E
o Cg) CP58 V U HANNA farl i
IIOOE D:IIECIIOII " E'IHS 77 ~
C vPlNO 0 ~ 005,0 ~ 0 I Oi0 ~ 02
SUSQUEHANNA STEAM ELECTRIC STATIONUNITS 1 AND 2
DESIGN ASSESSMENT REPORT
REACTOR/CONTROL BUILDINGKWU-SRV
FIGURE L-4 6

10
;,Spr
2SI—
PERIOD.SEC.
I
I I q yl
I
01
I
II
II
pp>
IlI I
II
II I'I
I
I ~ OOII
Z0I
0 'SItJ ItJ
I
IO.SO,
I
I
III
GI 10 2 4 6 0 10. 4 i 8 IP ~
FREQUENCY CPS
QCCK'RAtICR SPKC?RA FOR REACTOR/CCII IROL B DG
«OAO CASK OSOV IIAIIIIA SRV
D!RECt:OH Eg~y 779
OA.'PIRO Q. QQ5~Q. Q', Q Q. Q2
SUSQUEHANNA STEAM ELECTRIC STATIONUNITS 1 AND 2
DESIGN ASSESSMENT REPORT
REACTOR/CONTROL BUILDINGKWU-SRV
FIGURE L-47
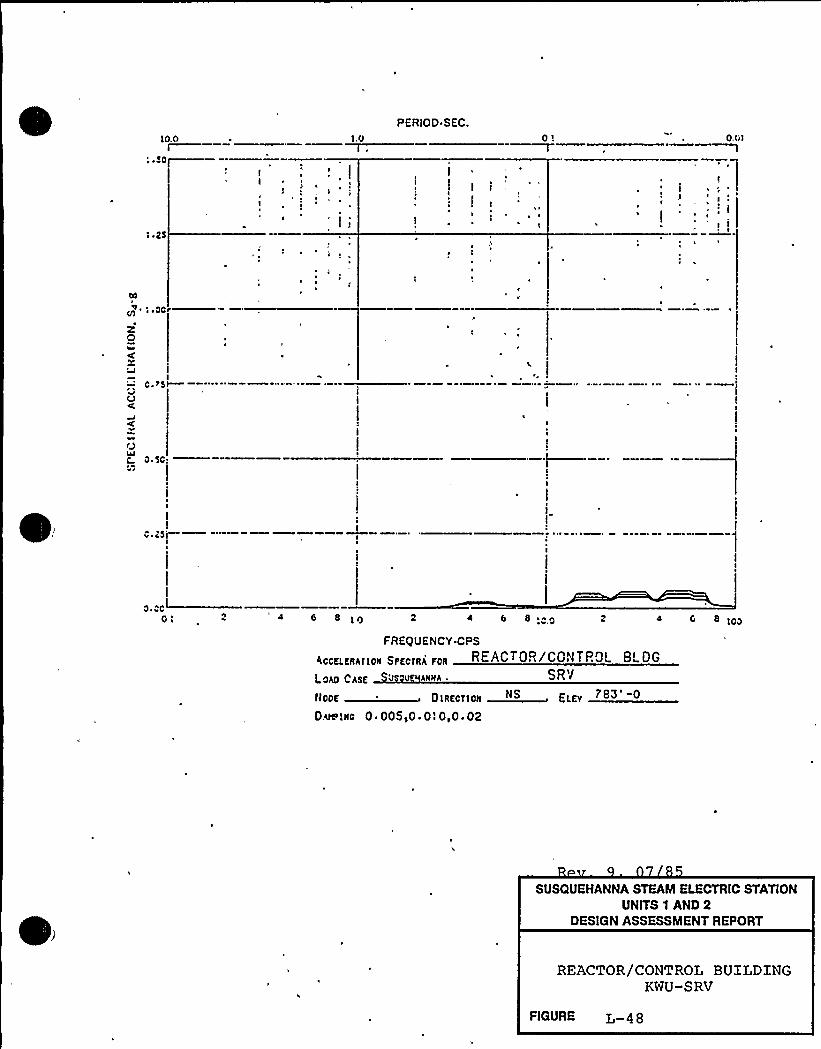
10. PI
PERiOD SEC.1.0 P. 81
~ I
l
1 ZS
~a'.CO
z0I
XI
C ~ >51
O
!J4JC C.SC
II
II
CD JStII
O.CCI—G1 4 6 8 4 6 8 CP 4 6 8 tpp
FREQUENCY.CPS
ACCKI.EIIAIION SPECtRA FOR REACTOR/CONTROL BLDG
LOAD CASE 8 U AMMA ~ SRV
DIRECTION ~ /gay 7 380OAts Ittc 0 F 005,0.0I0,0.02
SUSQUEHANNA STEAM ELECTRIC STATIONUNITS 1 AND 2
DESIGN ASSESSMENT REPORT
REACTOR/CONTROL BUXLDINGKWU-SRV
FIGURE L-4 8
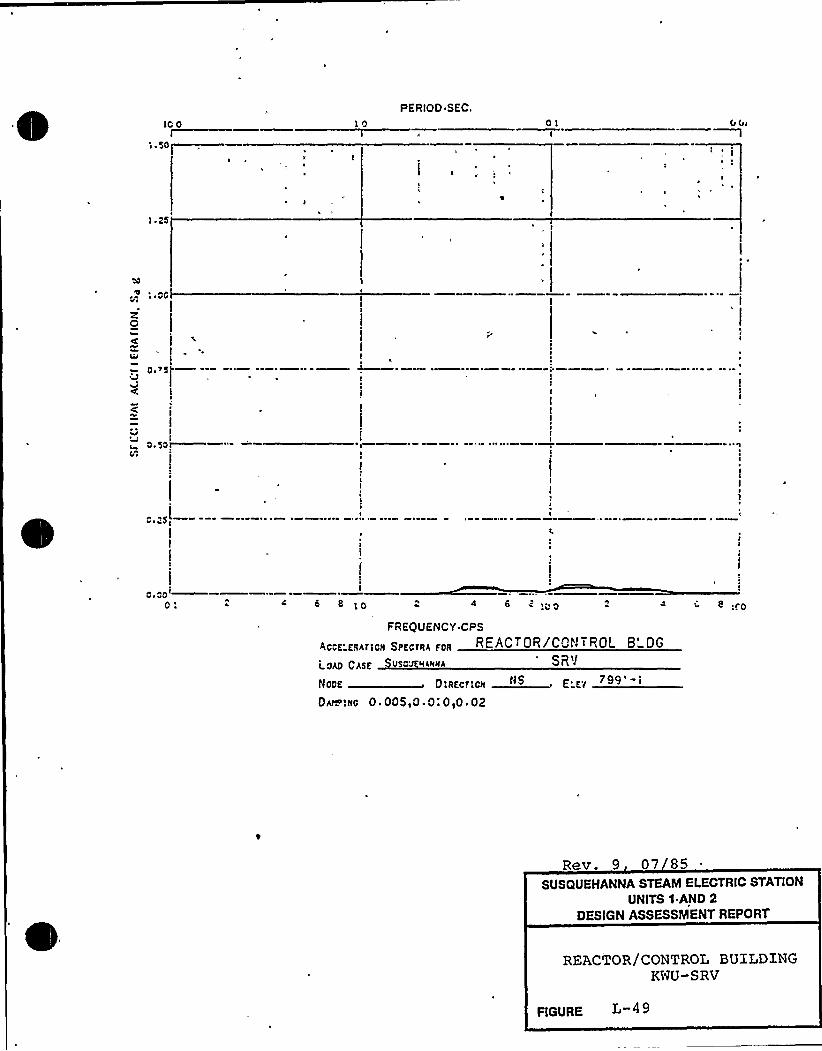
1O 0 IOPERIOD SEC.
01 649
k
1 ~ ZS
:.OC
ZG
0 '5
(
O ~ SO)cr
1SI.
kk kkO
0 '.
FREQUENCY.CPS
AOCE'591AfiON SPECTRA FOR REACTOR/COIlTROL B'GLOAD CASK USOU 99999HA SR'l
9:kEC'.lkk 9 9 >99'-lOu5'.aC 0.00590.0:0,0.02
8 .rO
Rev. 9 07 85SUSQUEHANNA STEAM ELECTRIC STATION
UNITS 1.AND 2DESIGN ASSESSMENT REPORT
REACTOR/CONTROL BUILDINGKWU-SRV
FIGURE L 4 9
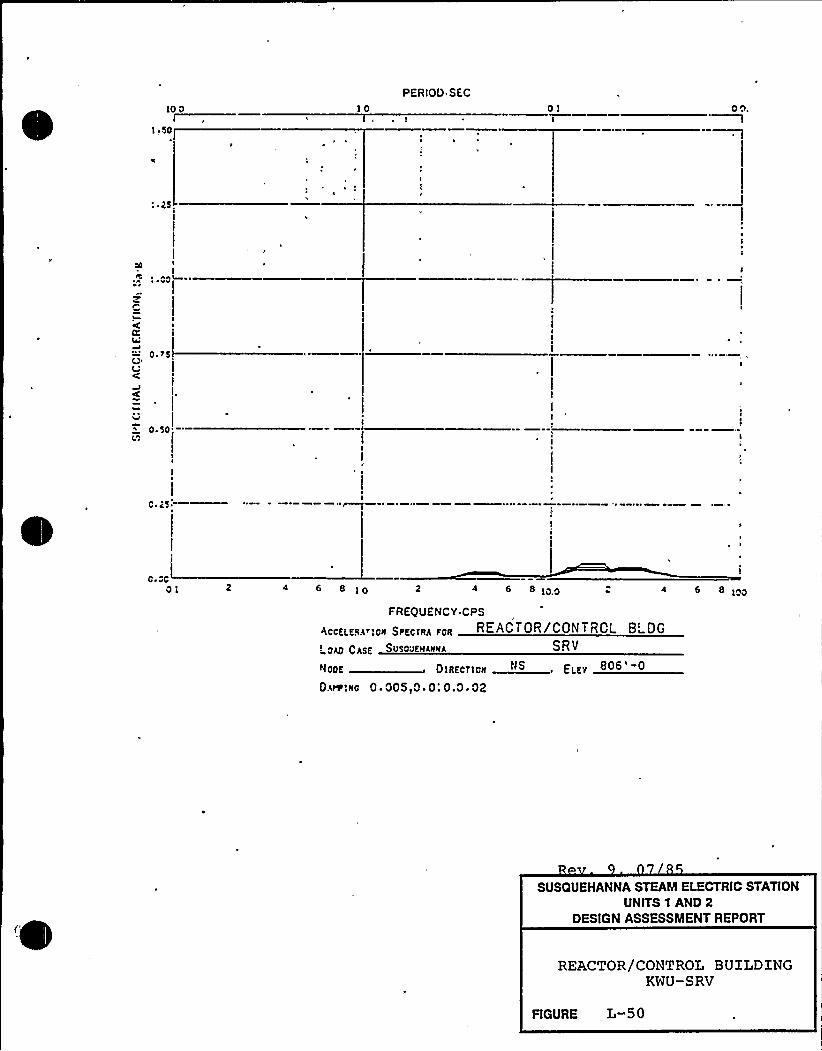
lo o 10PERlOD SEC
0! o o
: ~ 25
I
CC
O.SOC
I
II
C 25
C ~ OC
0! 4 «!o E 4 6 R!oo 4 « ioo
FREQUENCY CPS
AccEEERRiloR SPEc!RA F0R REACT OR/CON T RCL BI-DG
LON) CP5E SVSO'JEMAHMA SRV
MooE 0IIIECtjoH ~~ ELKS
DRm'.Ro 0. 005,0 0: 0.0 ~ 02
SUSQUEHANNA STEAM ELECTRIC STATIONUNITS 1 AND 2
DESIGN ASSESSMENT AEPOAT
REACTOR/CONTROL BUILDINGKWU-SRV
FIGURE L-50
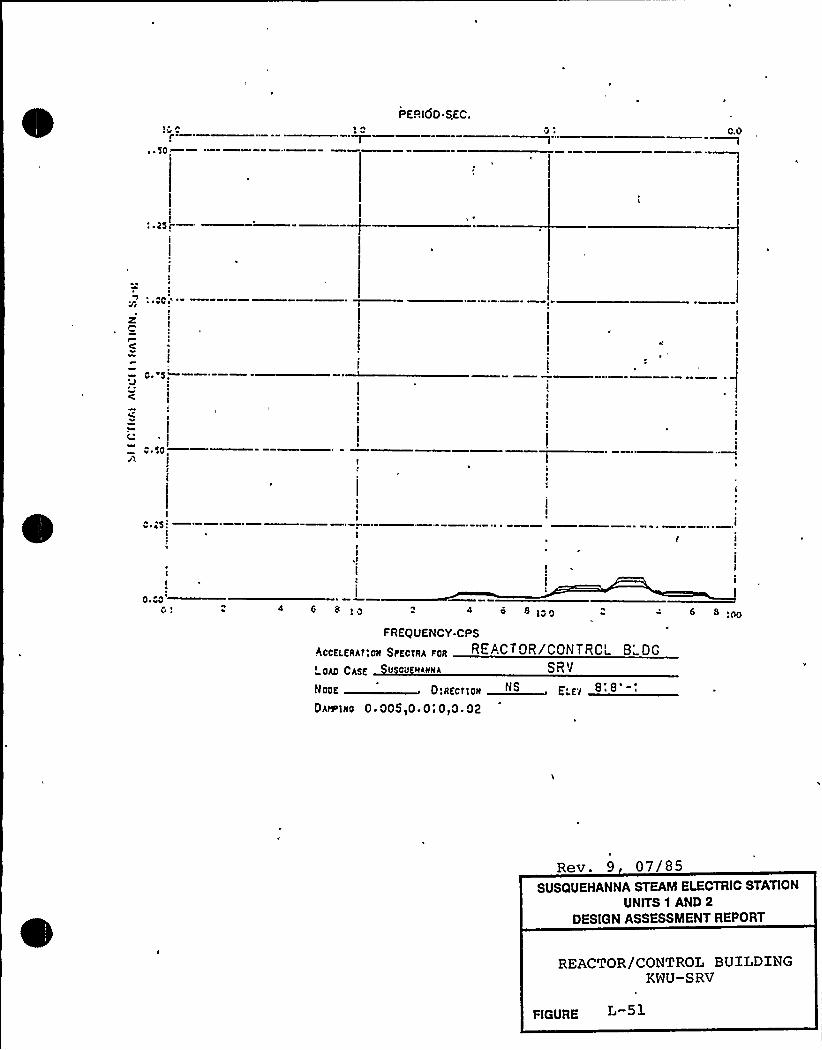
~ '«r.~ ~ SC.
PERIOD.SEC.
C ~ SC
I
C ~ 65:
4 6 8
FREQUENCY.CPS
AccfffRA7'ON $ PfctRA F0R REACTOR/CONTROL B~OG'AC CAEE V Cil RiNMA SRV
NooE 0 a RECf I Cll ~ 6 ifI
OAe i)to 0.00$ ,0.0'0,0.02
6 8 '00
Rev. 9 07/85SUSQUEHANNA STEAM ELECTRIC STATION
UNITS 1 AND 2DESIGN ASSESSMENT REPOAT
REACTOR/CONTROL BUILDINGKWU-SRV
FIGURE
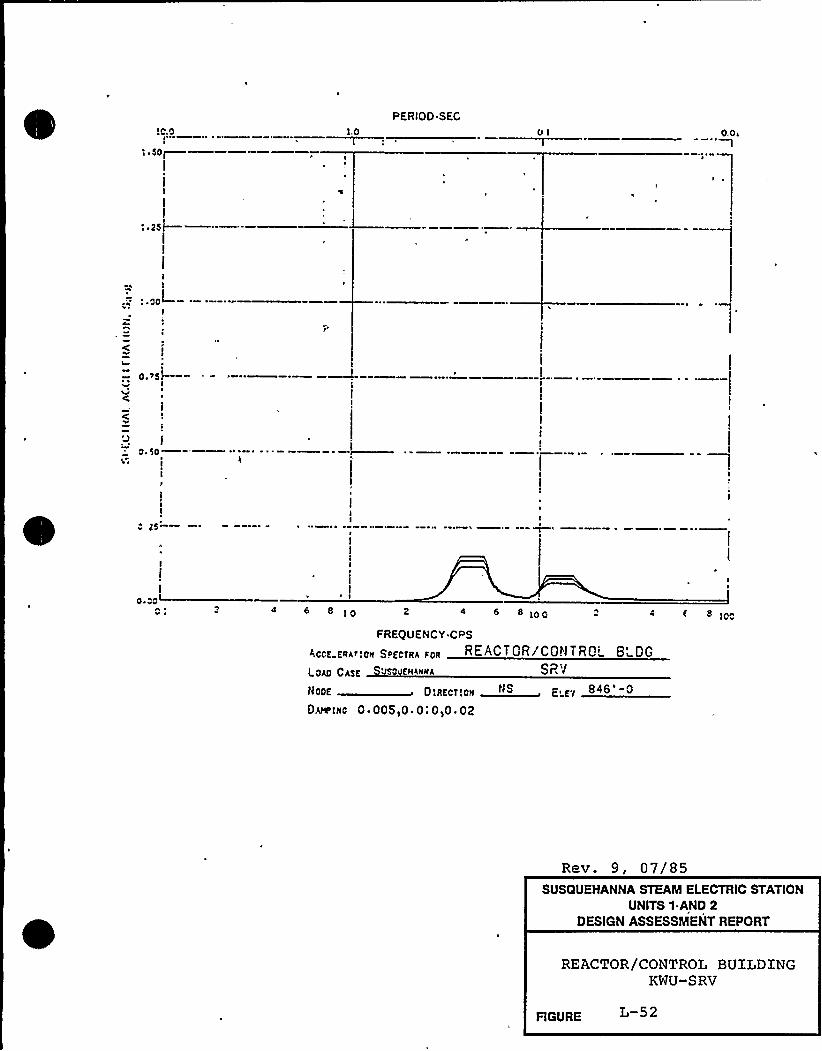
'cpI'I ~ 5OI—
1.0
PERIOD SEC
0,0aI
: ~ 25I—
I~h
I: ~ co
I
.—, 0.~5'.—--I
CI
C
O 50I
I
II
'I5 ~
4 6 8 2 5 100 4 $ 5 )pz
FREQUENCY CPS
Accf-fRhrlOR $ ofcyRA ROR REACTCR/CON TRO'~DGLOAO 0A5f JS fIIAIIIIA SP.'l
HOOE DiRECIICN E'TOAIR IRC 0. 005,0 ~ 0',0 ~ 02
Rev. 9, 07/85SUSQUEHANNA STEAM ELECTRIC STATION
UNITS 1.AND 2DESIGN ASSESSMENT REPORT
REACTOR/CONTROL BUILDINGKWU-SRV
FIGURE L-52
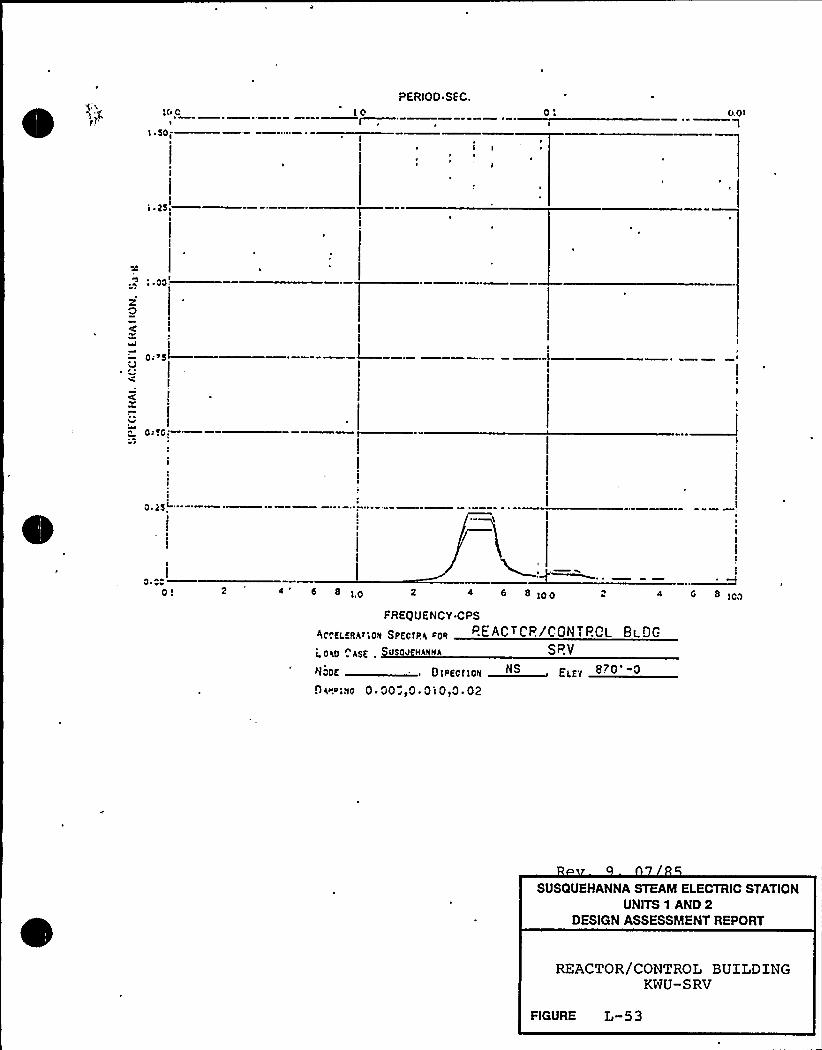
10 0I
I ~ 50;
10PERIOD SEC. 0'.0>
1
i'5
:.oo.'
0
~sJ
— 0"5I—
X
o~ 5c,'
2siIII
I
II
0 4' 8 6 8100 G 8 100
FREQUENCY CPS
gqgfI go8r;oq spgogpg sop ".EACTCP/CON TPQL BI 9G
L 0%0 . ASE . Su500 HANNA SP V
NCOE DLPECEiOII ELKY 0
DE~~i80 0 00rt0 O'I 0)0 02
SUSQUEHANNA STEAM ELECTRIC STATIONUNITS 1 AND 2
DESIGN ASSESSMENT REPORT
REACTOR/CONTROL BUILDINGKWU-SRV
FIGURE L-53
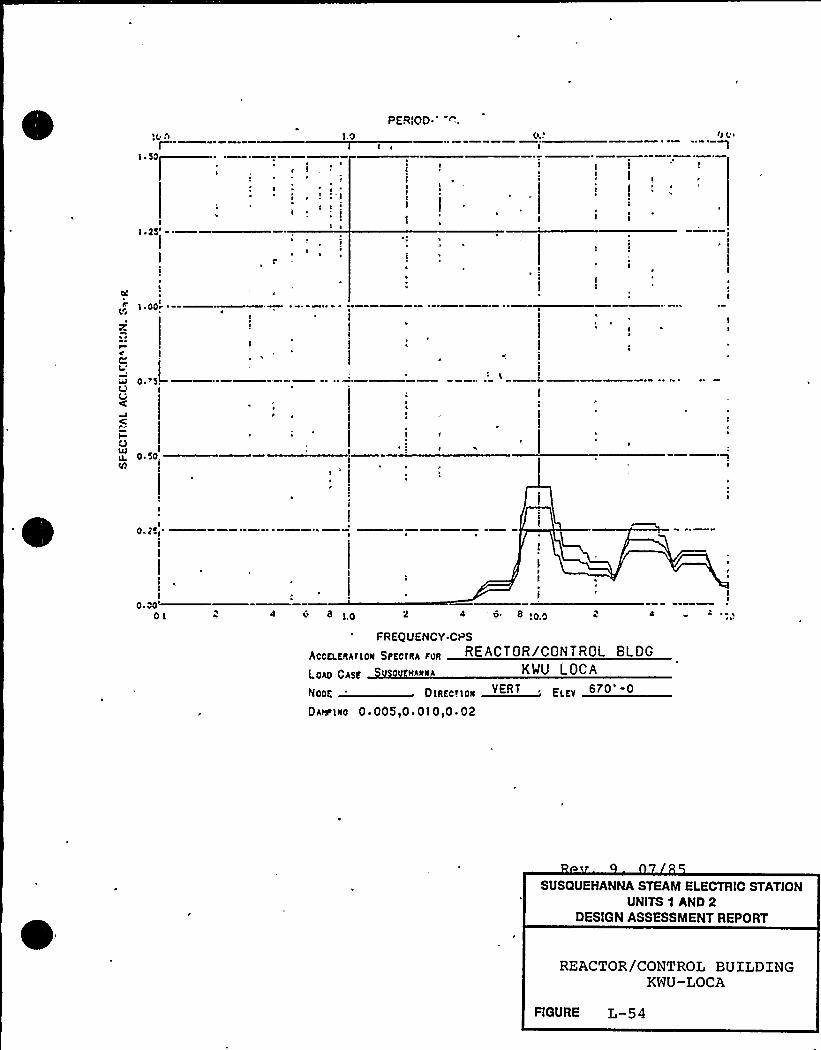
1
50
I.250
I
II
0
II(
I ~ 00»
PERROO
I.O
I
I ~
II
0 '
I
I I I
IJ 00
' 0
(.IO
EE
I
0 ~ 50
I
I0 ~ 4
I0 00
Ol 4 0 a lO o 4 0 8 ion
FREQUENCY CI S
QCCEI.ERAtlor 5PECtRA FCR REACTOR/CONTROL 8LDG
LOan CA5E IIarra KWU LOCA
EERRE DIRER.ERR 'REEVERT . 670'0DARPlro 0.005I0.010IO 02
SUSQUEHANNA STEAM ELECTRIC STATIONUNITS 1 AND 2
DESIGN ASSESSMENT REPORT
REACTOR/CONTROL BUILDINGKWU-LOCA
FIGURE L-54
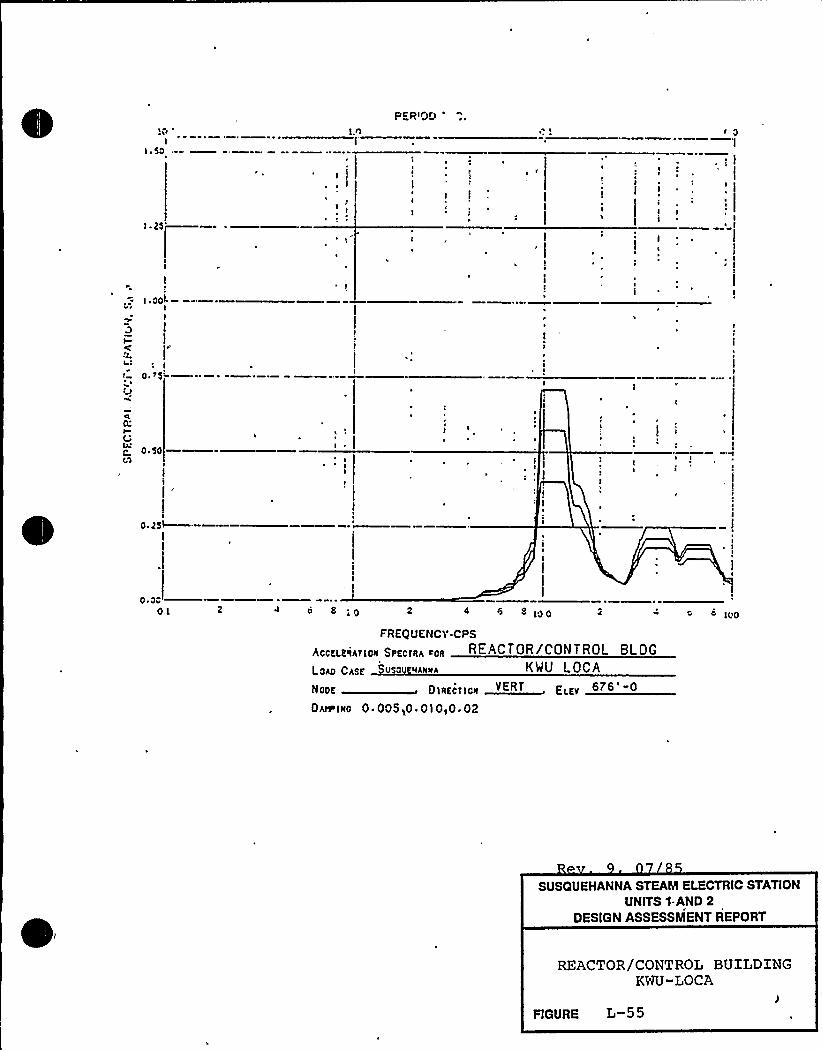
I ~ 50
PERIOD
R
IE R
II
I
O'
IR
.-: I.OOI.
I
I(0 ~ 656
0:IV
0 ~ '500)
IE
0. ZSt—
C.acO,I 2 4 II 8;0 2 4 '5 0 Ian 4 66 II IOO
FREQUENCY CPS
QccELERAfloR $ PEcIRA ~CR REACTOR/CONTROL BLOG
Lain CASE V 0 I" IIA KWU LOCA
NODE DEREOEIOR "NEER 6 6 -0
OAIs IRO 0 005~0 ~ 010,0.02
SUSQUEHANNA STEAM ELECTRIC STATIONUNITS 1-AND 2
DESIGN ASSESSMENT REPORT
REACTOR/CONTROL BUILDINGKWU-LOCA
FIGURE L-55
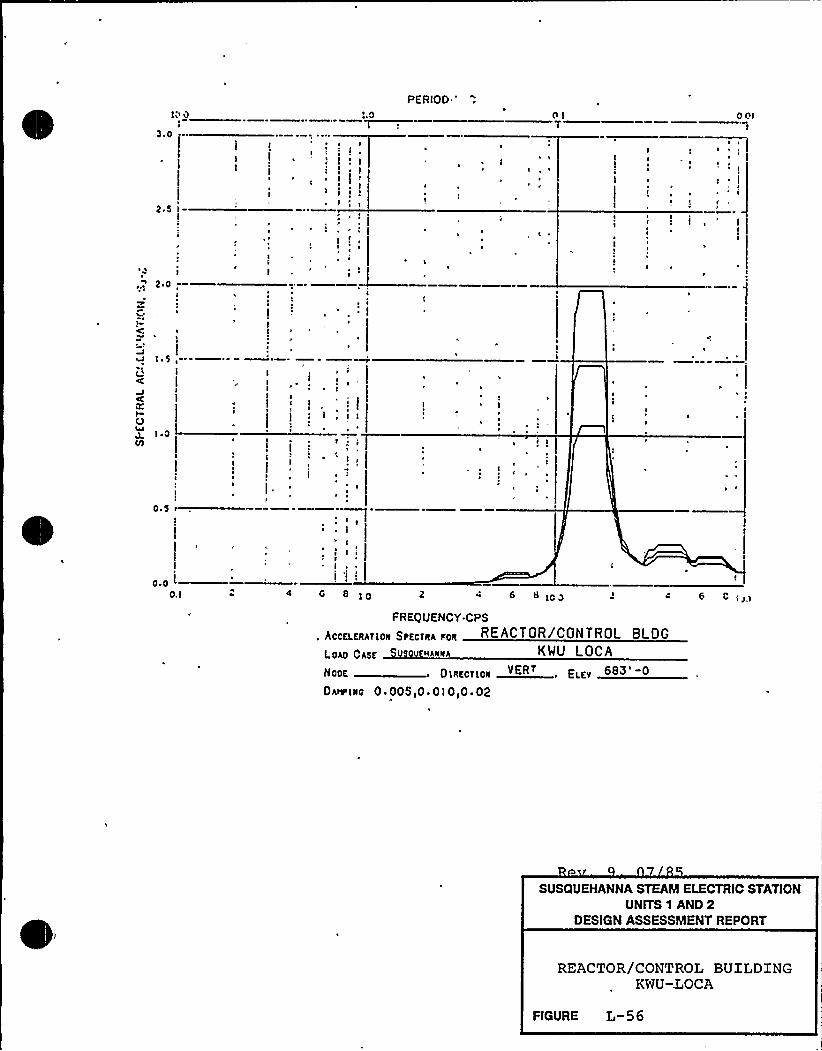
PERIOD '
Q nI 0 QI
2 ~ S I-I
~ 'I
2 '
I I o~ ~l
I ~ S
IKI0
1.0
I II r
I
~I
P
IP
0 AS i
I0.0 i
Q. I 4 «TQ 2 0 TQO 0 O I>q
FREQUENCY.CPS
, AccKI.KRATTQN SRKcTRA RQR REACTOR/CONTROL BLDG
LQAQ CASK HANNA KWU LOCA
NOOK OTRKCT TON VER~ EI Kv 683 0
DAIL INC 0.005IO 010,0 ~ 02
SUSQUEHANNA STEAM ELECTRIC STATIONUNITS 1 AND 2
DESIGN ASSESSMENT REPORT
REACTOR/CONTROL BUILDINGKWU-IOCA
FIGURE L-56
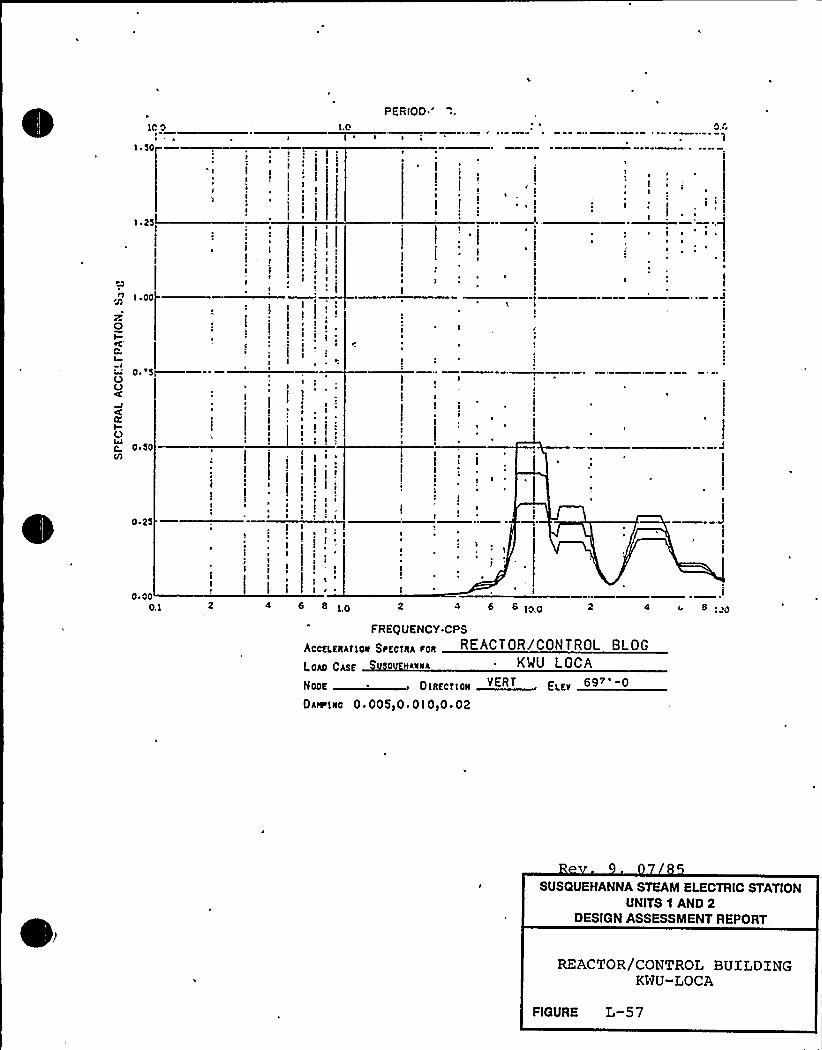
10 0
1 ~ 50l-
PER100'.0
lI
II ~
0
1 25
1
I
II
I~
'1
I ~
~ II
g 100
zQI
I0 ~ '5j-
OO
NV:
ccI(.)
0 '001
0 '5
I ~
I VI
1 I ~
II 1
I
I ~
1
II I
: I i1
I IV
I~ ~ I
I
I~ IIII I
I
V
I C II I
I
II
I
VI
I
0 F 000.1 4 6 8 1P 2 6 jao 4 E. 8
FREQUENCY.CPS
REACTOR/CONTROL BLOG
LOAO CASK 0 HARA ~ KWU LOCA
IICIE DIRECTION EEETVERT 69T'-D
OAwtjjc 0 '0510 F 010,0.02
SUSQUEHANNA STEAM ELECTRIC STATIONUNITS 1 AND 2
DESIGN ASSESSMENT REPOAT
REACTOR/CONTROL BUILDINGKWU-LOCA
FIGURE L-57
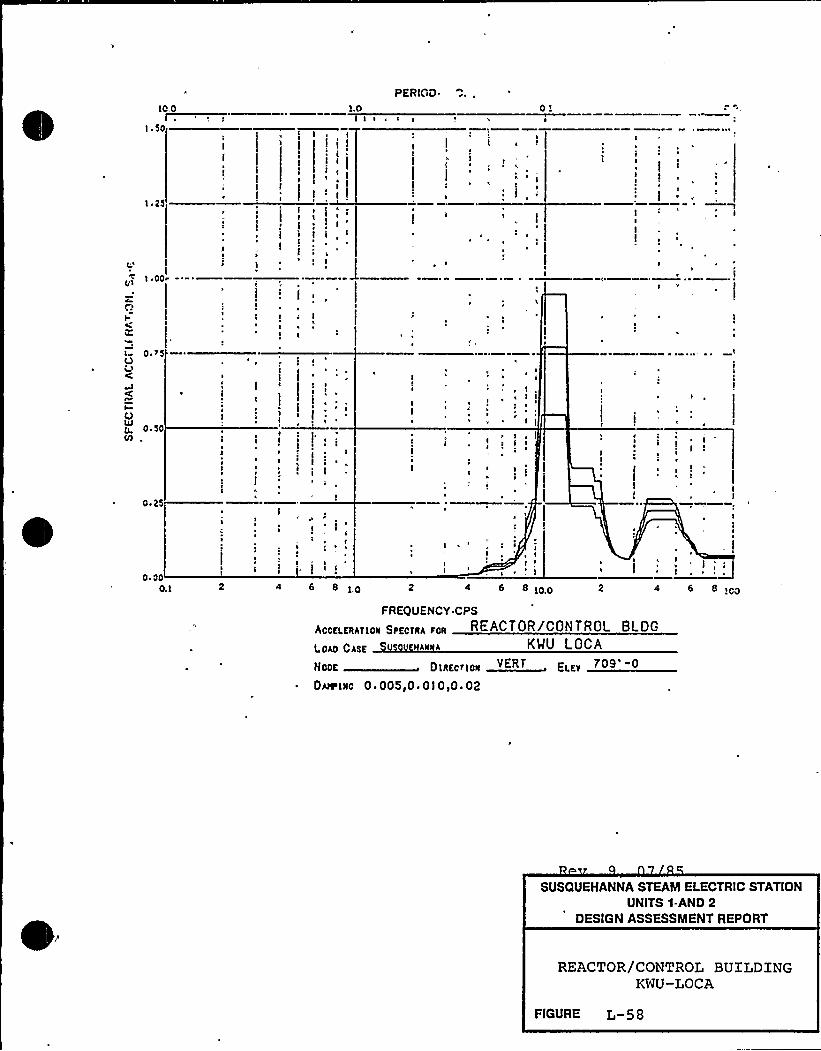
PERIOO.IO.O
I ~ 50
I ~ 25
i.p
I
II
II
I e
I I
I i
e I
I Ii!e
! I
I ~ II
: I!
I e e e
I I
Ie
e I
0 ~
Ie
II
v7 I .00~
I
0 ~ >5O(I
00 ~ 50
VI
0 '5
~ e
I e e e
e e
e e
I
ie
e(
I
e
e
e e
e
e
I I
e
I
Ie I ~
e
e
e
e
ee I e
I
Ie
e
I
Ie
0 F 00O.i
e'
e
4 6 8 ip
II
Ie
e
I
2 4 « ioo
e ~ II
2 4 6 8 ~ 00
FREQUENCY.CPS
AccggIIAgIOII Spgc(IIA pcg REACTOR/CONTROL BLDG
I.OAO CASE KWU LOCA
NoDE Dlllee lllk E ELEe
Due Iiic 0.005,0.0I0,O 02
SUSQUEHANNA STEAM ELECTRIC STATIONUNITS 1-AND 2
DESIGN ASSESSMENT REPORT
REACTOR/CONTROL BUILDINGKWU-LOCA
FlGURE L-58
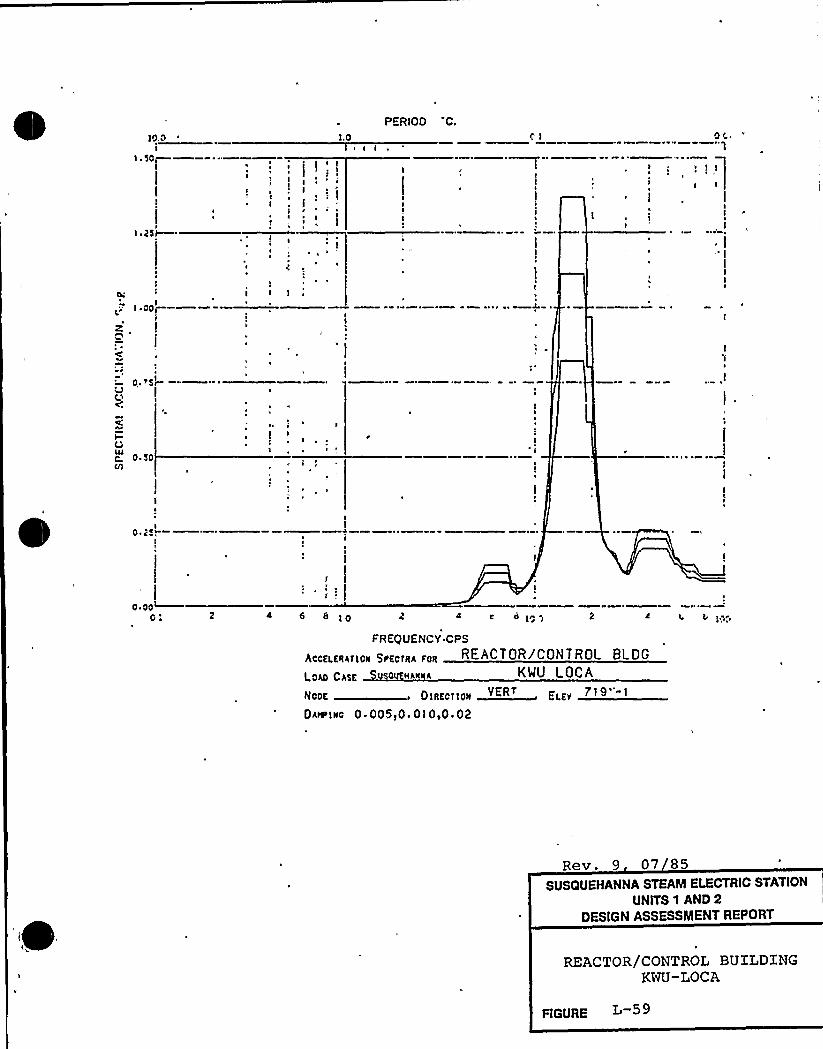
PERIOD C.
10. 0R
1
l ~ Sop—I
1.0
I f
~
~ II
I
GI
~ 'I I
l ~ 00I-II
I
I 4
I
l I I I
0,'sI-(\c.'
00 ~ So
fl)
0, jRIII
0 ~ 00~GR 4 < 010
FREQUENCY CPS
Aooff fffAf10ff 5flfofffAfoff REACTOR ICON T ROL BLDG
l.oAo CAsf 0 ffAfflfA KWU LOCA
ERIE DIRECIIRR VERI ERIE VII"-IOAIPlffo 0.00590.0l090.02
I, fr I.qrl
Rf v. 9 07 85SUSQUEHANNA STEAM ELECTRIC STATION
UNITS 1 AND 2DESIGN ASSESSMENT REPORT
REACTOR/CONTROL BUXLDINGKNU-LOCA
FIGURE L 59
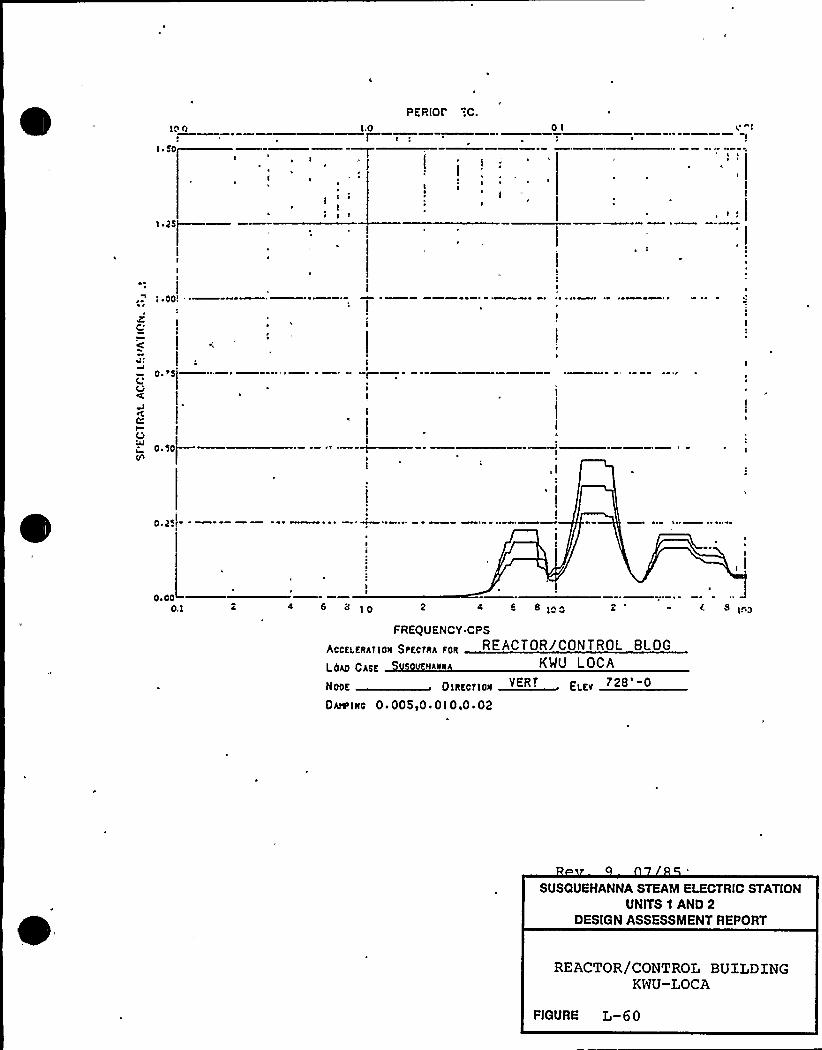
10 0
) ~ 50
l.oI
PERIOD':C.Ol
as~~ a a
II
II
Is ~ 00l
~ ~
C'
0 ~ as
Ci
I
V
0. 2!I-I
I
~ I
I
O.l 4 6 o l0 6 e, 0 6 py
FREQUENCY.CPS
AccsLERAflON SPEcTRA Fcq REACTOR/CONTROL BLOG
LOA0 CaSE KWU LOCA
Hsss Dlssstssll . EEEIVERT 728'-0
DIW'LNC 0. 00510 ~ 01 0,0 ~ 02
SUSQUEHANNA STEAM ELECTRIC STATIONUNITS 1 AND 2
DESIGN ASSESSMENT REPORT
REACTOR/CONTROL BUTLDINGKWU-LOCA
PIGURE L-60
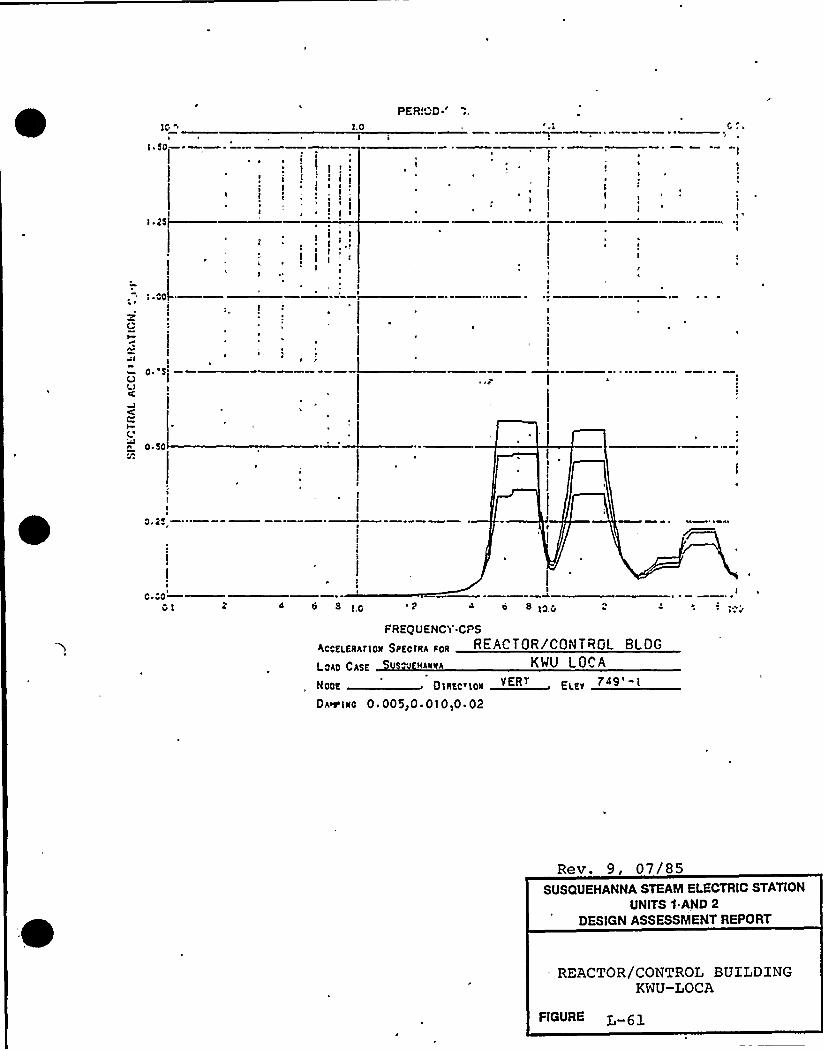
I ~ 50
I ~ j5
iII
I
I.O
I I!II I
~1 I
II
I
I
I
PER!OD
'.CO!-
ZQI
Al
0 5OI)
( '
0 ~ 50
I I I
III
II
I
I
0. j5,
I
C 00Ol 4 II 5 l o O I0.0
FREQuENCY CPS
hccEIEIIArloll SPEcll!A Po!I REACTOR/CONTROL BLOG
LCAo CA5E II " IIA~~A KMU LOCA
MoCK OIAEC |DII ><<" pit, 749'-iOAMIIIC 0 ~ 005pO OIOyO 02
Rev. 9, 07/SSSUSQUEHANNA STEAM ELECTRIC STATION
UNITS 1 AND 2DESIGN ASSESSMENT REPORT
REACTOR/CONTROL BUILDINGKWU-LOCA
FIGURE

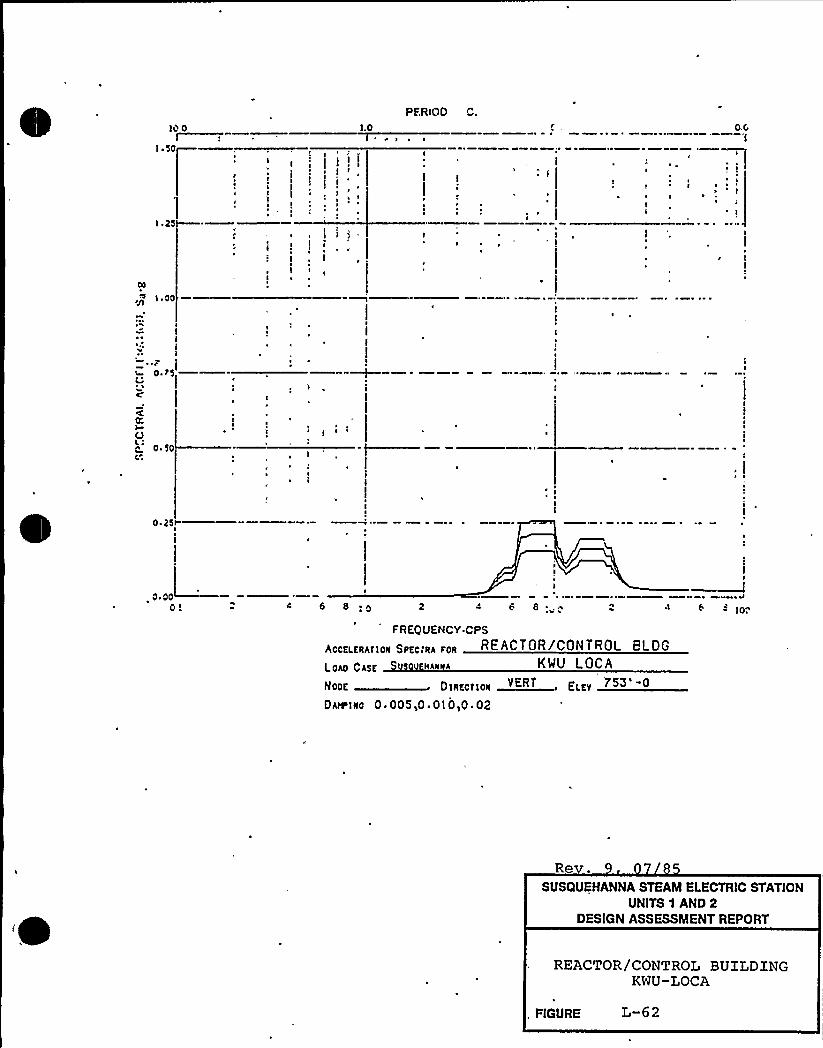
lo 0
I ~ 50I
(E
I
iI
~ -. I
1.0
E
!
~ ! II I
I~ ~
I
PERIOD C.
I ~
o.o
~ I
I II ~ ~
'I
~ III
I . I
I I
!.00
0 ~ 75('IC
I00 ~ 50
0 ~ 25PI
Ol 6 8 6 8
FREQUENCY CPS
REACTOR/CONTROL BLDG
LoAO CASE MA««A KWU LOCA
IIE DlllEIIIIII EERE (LEV 753 0
DA(e»l«c 0.005,0 010,0 02
ReSUSQUEHANNA STEAM ELECTRIC STATION
UNITS 1 AND 2DESIGN ASSESSMENT REPORT
REACTOR/CONTROL BUILDINGKWU-LOCA
. FlGURE L-62

IC.C(
SO
II
I
!~ I ~
I I:I
PECIlppnl
i.00'I
IR
C~,I
0. SCJ
C
0 ~ SOC/:
v ES4
I
I
v OvCI 4 0 0 ~ 0 0 IOO 4 00
'C
FREQUENCY CPS
QOOEI.ERATIOR $ PEOIRA FOR REACTOR/CONTROL BL OG
LOAO CASE S HARRA KWU LOCA
NRDE DERED.!4II VERT~ El.Ev
77I'-Q
OuS I«0 Q.QQ5 Q.QIP P
Rev. 9, 07/85SUSQUEHANNA STEAM ELECTRIC STATION
UNITS 0 AND 2DESIGN ASSESSMENT REPORT
REACTOR/CONTROL BUILDINGKWU-LOCA
FIGURE L-63
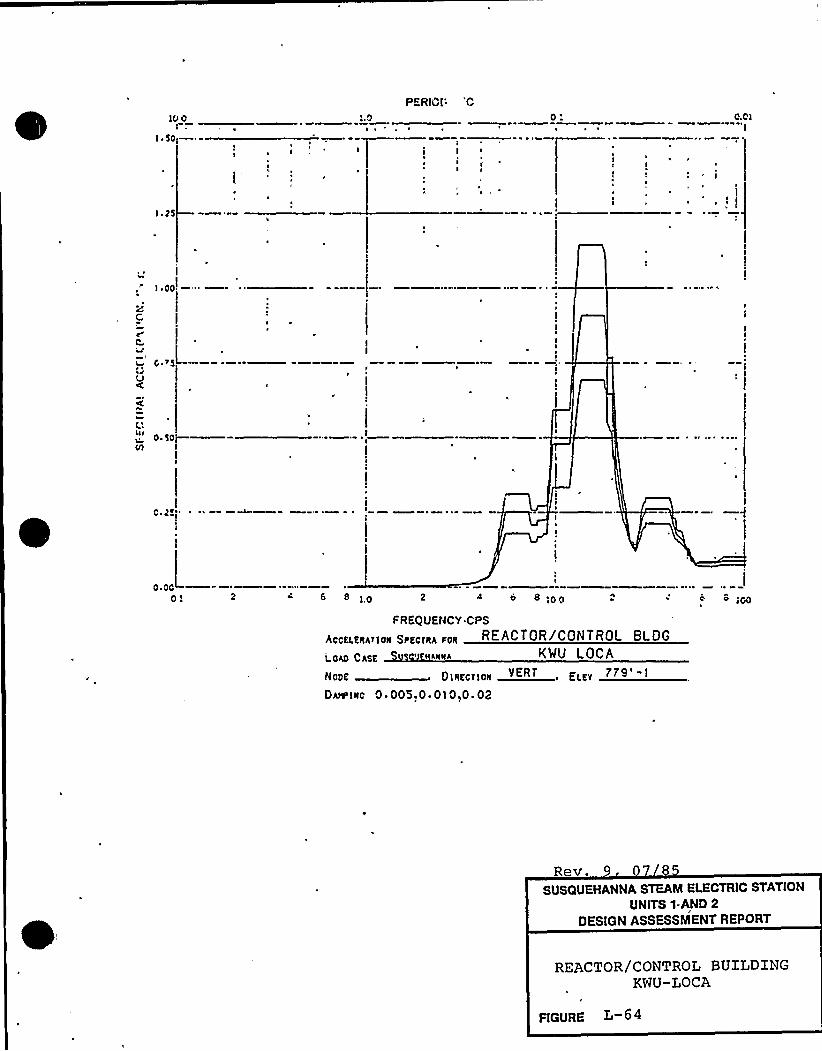
PeRICI: 'C
Q ~ Q.CII
I ~ 2$
I 00
0 ~ SOI—VI
>c ~ ~ ~...a .
O.OCLP I I,p 2 8 C O QQ
FREQUENCY CPS
AccKI.KRATIQN SFKOMA F0R REACTOR/CON TROL BLDG
I OAO CASK KMU LOCA
McoE OIRECIIIIN VERT E „779'-IDAw INO 0 ~ OOS.O. 010,0. 02
Rev. 9 8
SUSQUEHANNA STEAM ELECTRIC STATION
UNITS 1-AND 2
DESIGN ASSESSMENT REPORT
REACTOR/CONTROL BUILDINGKWU-LOCA
FIGURE L-64

a00I
'I ~ So
PERIOD.:"lrO
II
I I 2
I
I ~ ~
I
ar OlI
I ~
2EJ~
~
'. I
II
I 00
a
0 ~ Sr0UC',
~ .
~ a
.'.soI
I0 ~ ZS
I
III
I
E.EEI—'
8;0 2 4 6 8 ~ OO
I
c 6 E h
FREQUENCY CPS
AccQERAfloII $ PEc1RA F08 REACTOR/CONTROL BLDG
LOAO CASE KWU LOCA
22aaa DIEEEIIEII EIEI
DAMLIIO 0 ~ 00540 01 OIO ~ 02
Rev. 9 07 85SUSQUEHANNA STEAN ELECTRIC STATION
UNITS 1 AND 2DESIGN ASSESSMENT REPORT
REACTOR/CONTROL BUILDINGKWU-LOCA
FIGURE L-65

t ~ 50I— Ig
II
TOl.PERiOD F
I ~ 25
,P 1 00)~i
I(4 O S ~5U
'
C.TC
00 ~ 50
CO
0 25
0. 00OT 4 6 6 6 8
FREQUET'TCY.CPS
hccELERAtloN SPEcTRA F0R REACTOR/CONTROL BLDG
I. PAO CASg VSO HANNA KWU LOCA
NODE DIREC laN ~ ELiv
D~T~O 0.005>0 OIO.O 02
Rev. 9, 07/85SUSQUEHANNA STEAM ELECTRIC STATION
UNITS 1 AND 2DESIGN ASSESSMENT REPORT
REACTOR/CONTROL BUILDINGKWU-LOCA
FIGURE L-6 6
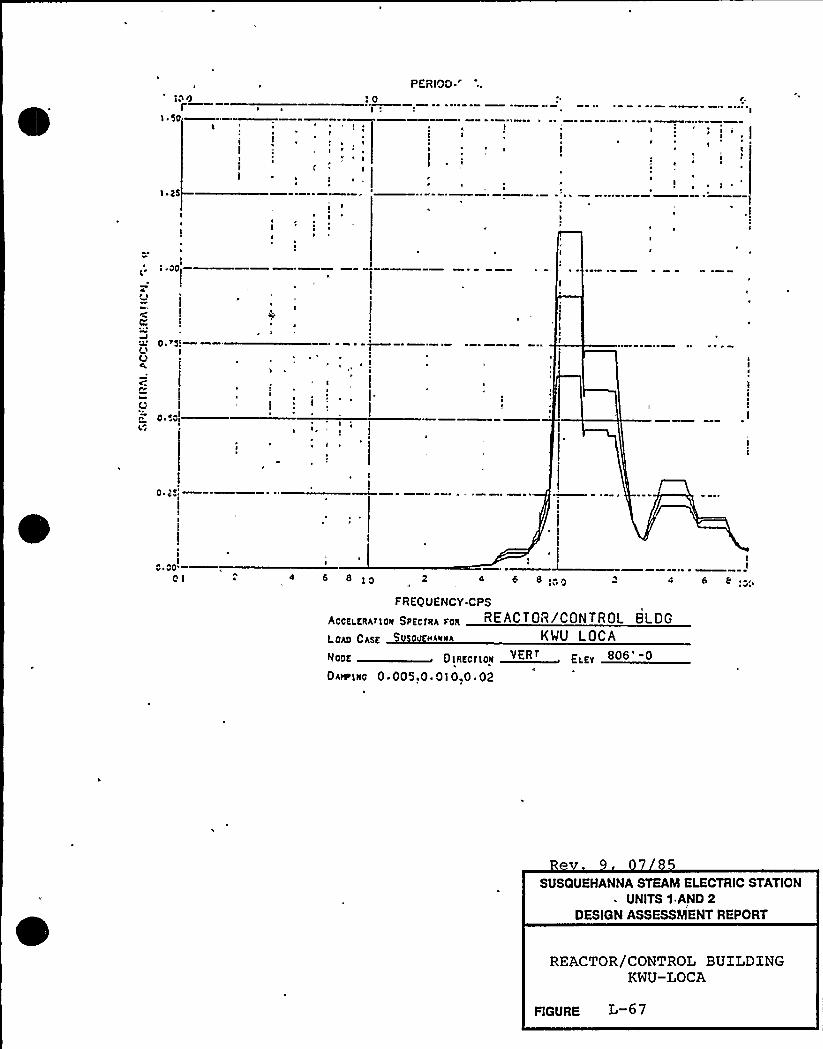
!On ~ 0
PERIOO '
I
IC
I
I
II
I
I ~y
C
I
I
I ~ 2S
CI ~
I ~
OO(
0 ~ '5!QlO
c
VC OOi
t I
II
O 2pl
II
O ~ OO'I6 a IO
J—4 6 8 ~ CO
I
6 8 e„-.,
FREQUENCY.CPS
AOCEI.ERhIICN SPEc'IRh Foh REACTOR/CONTROL BLDG
LChO 0hgg Ou iihNNh KWU LOCA
~llDE 0 IIIECtlalf EI.EV
Ohio'INO 0. 005.0. 01 0.0 ~ 02
V ~
SUSQUEHANNA STEAM ELECTRIC STATIONUNITS 0 AND 2
DESIGN ASSESSMENT REPORT
REACTOR/CONTROL BUILDINGKWU-LOCA
FIGURE L-67
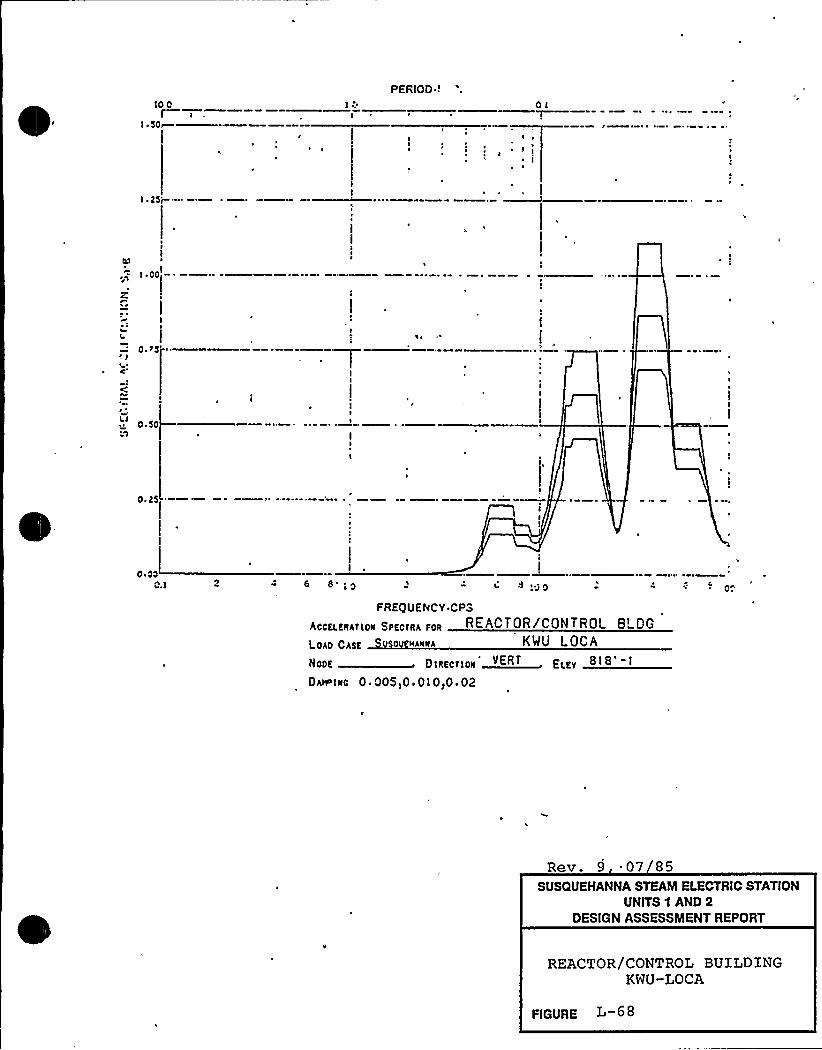
10 0I
I ~ 50m
PERIOD '
~ E
OI
I ~ 25g
IE
ICCI
lI
0 '5I
C
E
0 '0»1
EE E
I E
I
I I
0 ~ 25
C. I 4 6 8';0 lI EC0 0 EE
FREQUENCY CPS
Acct.ERATICII $ PKcTRA F0R RE'ACTOR/CONTROL 8'GLOAO 0A55 0 HANIIA KWU LOCA
IICOa DEEECEEEE EEEE
OAIP IIIC 0 005 IO ~ 010,0. 02
Rev. 9 07 85SUSQUEHANNA STEAM ELECTRIC STATION
UNITS 'I AND 2DESIGN ASSESSMENT REPORT
REACTOR/CONTROL BUILDINGKWU-LOCA
FIGURE L 6 8
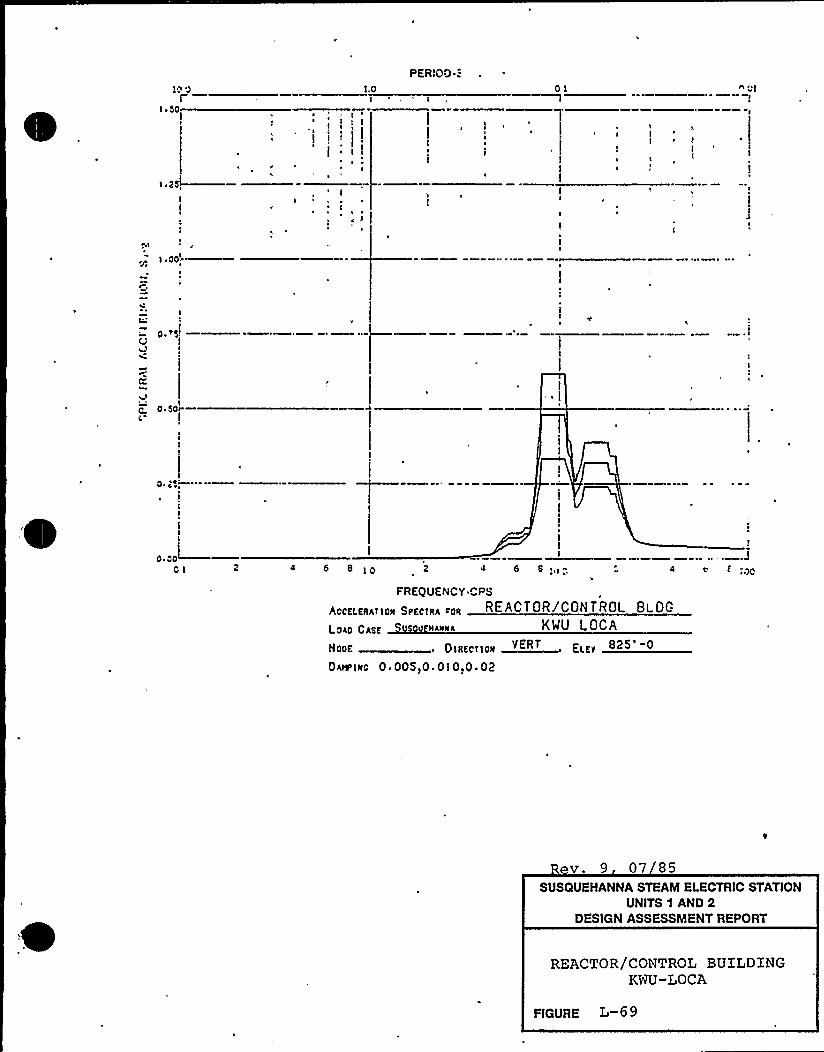
1.0
PERlOO.:-Oi
iI
i~
4 6 8 6 8 .I> . 4 . E;00
FREQUENCY CPS
AccELERATloN SPEcIRA roR REACTOR/CONTROL BLOG
LCA0 0AEE 5 HAHHA KWU LOCA
II00E 2IIICIIOI EIEI 2
OAN'1RC 0 F 005)0 F 010)0 '2
R v. 9 07 85SUSQUEHANNA STEAM ELECTRIC STATION
UNITS 0 AND 2DESIGN ASSE SSMENT REPORT
REACTOR/CONTROL BUILDINGKNU-LOCA
FIGURE L-69

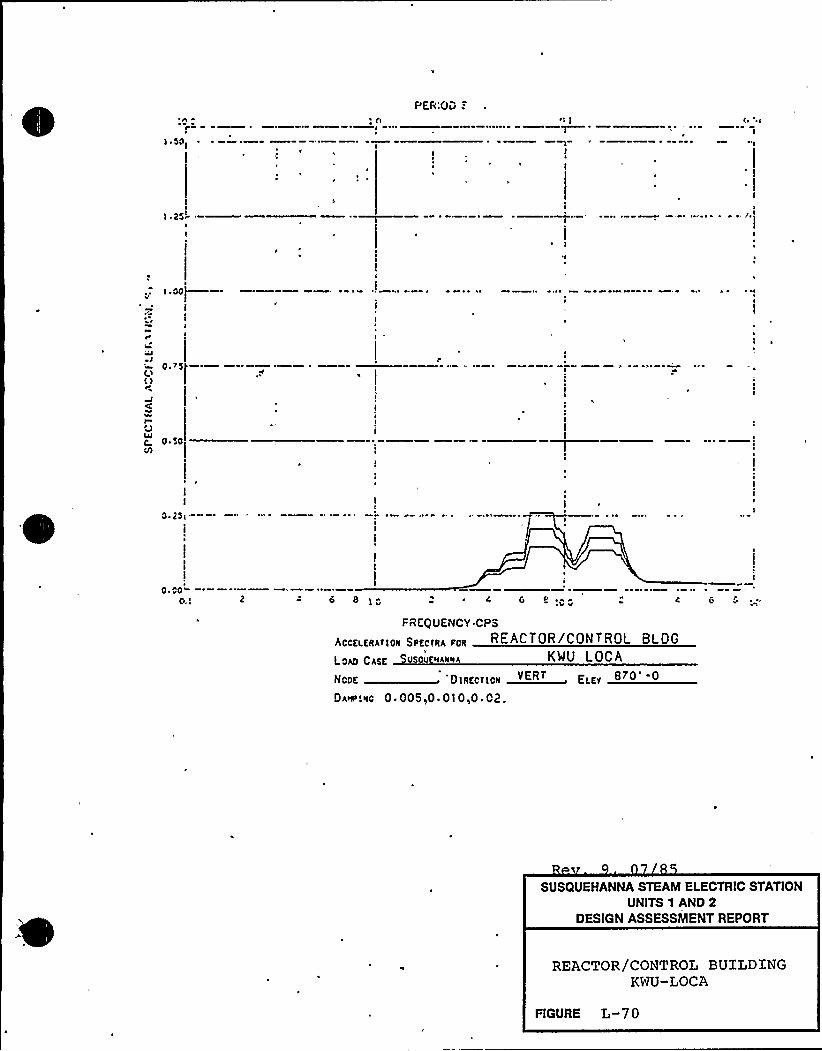
I ~ 50I
VER:Ou ."
I ~'II
I
I 25~II
I.aoI—-i
I II
0 ~ R5(1I )
iU
0 ~ 50Vl
0 '5II
h hhW ~ ~ ~0 vo6 8 h ~ C 0 II
~ Io V
FRCQUEi4CY CPS
pcc5I58A>toII sncreA ioII RFACTOR/CONTROL BLDG
Loho 0PSE USOU IIAIITTA KWU LOCA
ROOT 0IRIOTIOE ELIVVERT RTO'-0
0~+:~0 0 005,0 0 I 0,0. 02.
SUSQUEHANNA STEAM ELECTRIC STATIONUNITS 1 AND 2
DESIGN ASSESSMENT REPORT
REACTOR/CONTROL BUXLDINGKWU-LOCA
FIGURE L-70
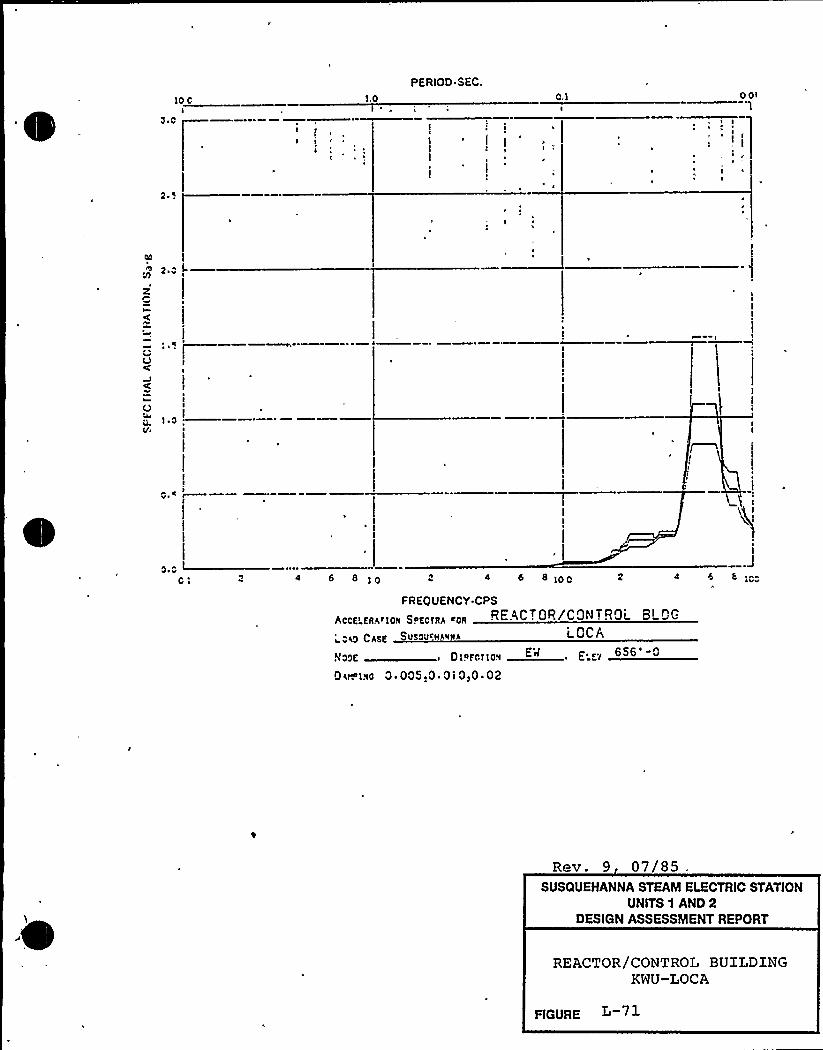
10 CI
o ~ 0
1.0
PERIOD SEC.0.1 0 0 I
'1
g.o L
0 4 I
o 001 4 6 8 4 «1OO 100
FREQUENCY.CPS
Aoop pggriog sogoigp sop RE.WC . OR/CON . ROi 8 ~G
ohio C*gg SvsoU~IIANIIA 1 C C A
NIooc 01orcr to~ E<, p ., 656'00 v. 1~c 0. 005.0 ~ 0i 0,0 02
Rev. 9 07/85SUSQUEHANNA STEAM ELECTRIC STATION
UNITS 1 AND 2DESIGN ASSESSMENT REPORT
REACTOR/CONTROL BUILDINGKWU-LOCA
FIGURE
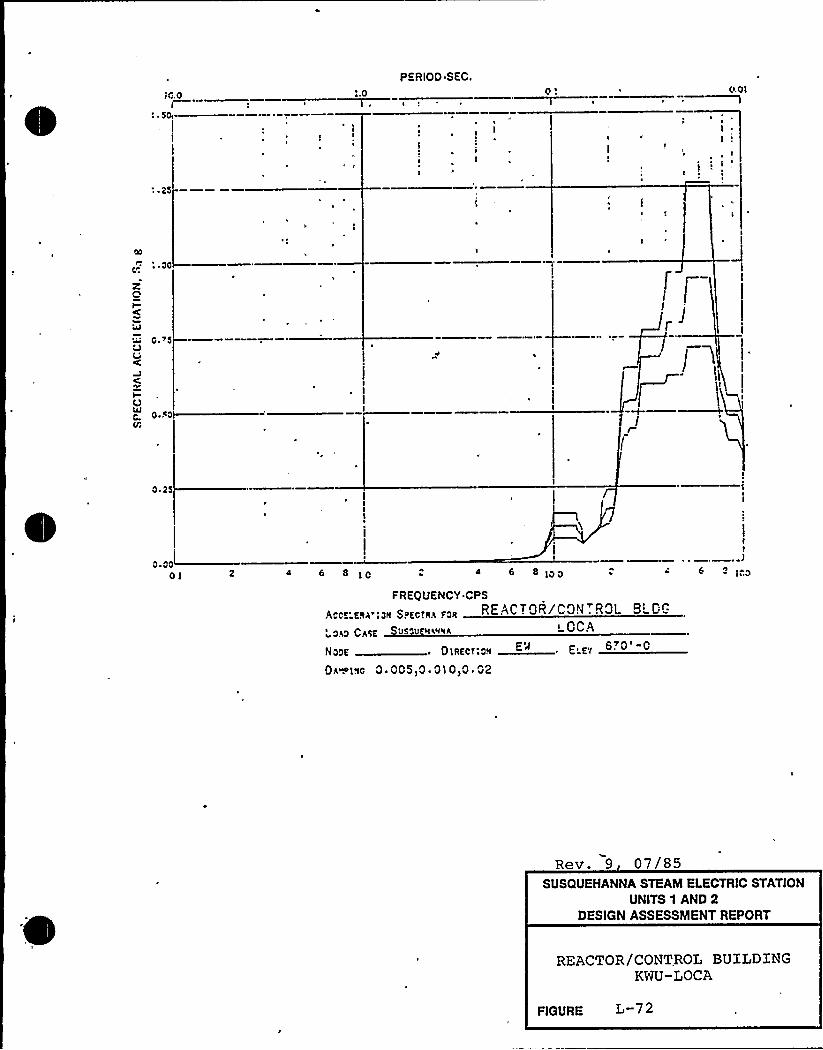
IO.PI
SI4
~ 0
PERIOD SEC.0 ~ V.OI
I
I
I
t
00
: ace
zC'
0 ~ ~S0
(o:IU
0 ~ Rc4/i
0 ~ 2S
OI 2 4 6 8 4 6 8 IOO - ICO
FREQUENCY CPS
ACCT'ALIOII $ ?80?RA fORg PP'h
Loso Cast vuA
Nooe DIREcl aoII E E gp 6 0 0
Dawl80 0 ~ 005,0 ~ 0 I 0,0 ~ 02
Rev. 9 07/85SUSQUEHANNA STEAM ELECTRIC STATION
UNITS 1 AND 2DESIGN ASSESSMENT REPORT
REACTOR/CONTROL BUXLDXNGKWU-LOCA
FIGURE L 72

'
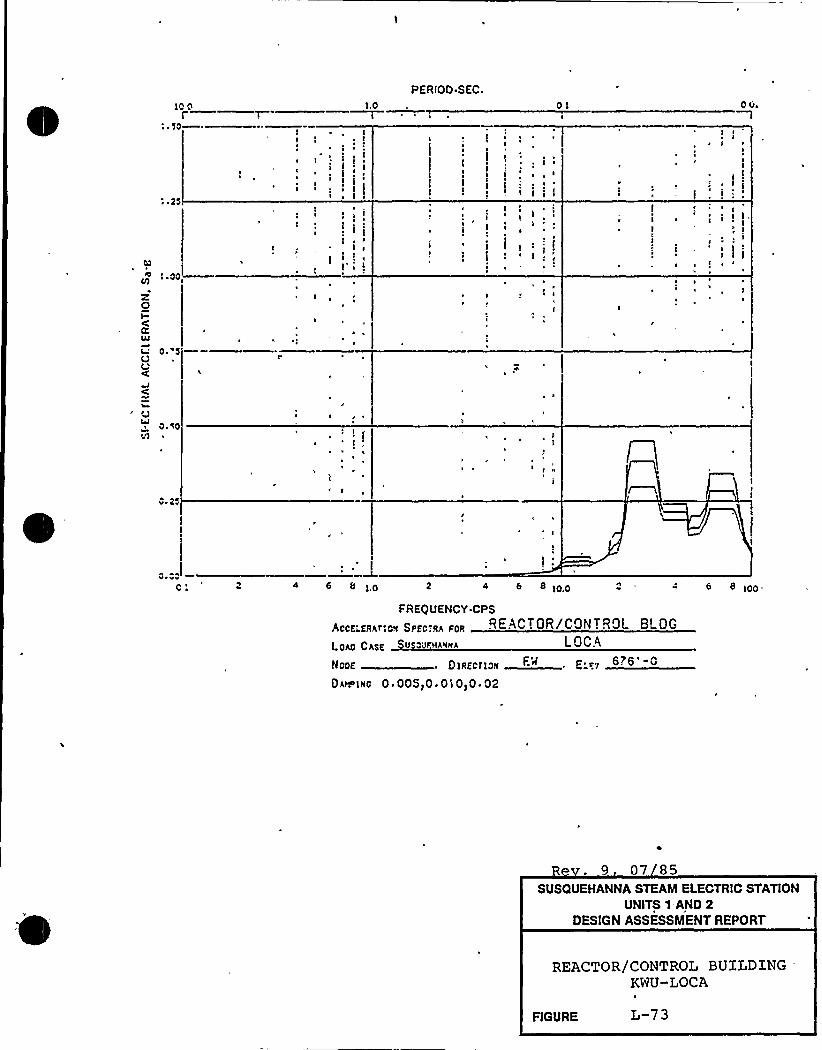
IP 0r'~ 50
: ~ 25
g :.00
zOIC
( 0v5O
i Q0. '(0
(1
PERIOD.SEC.1.0
I I
I" ~
i iiI ~
~ ~ (~ I
~ ~
I
~'
II
I'
'I1
01
~P~ ~
I
I!( I III
I 'I
~
I
~ I
0 (iaI
II
II
~ I ~(
I ~ ! ( I,I
I I
I ~ . I
~ I
v. 25
0 vv0: 4 6 8 1,0
I ~
4 6 8 8 100.
FREQUENCY CPS
AccfEERAEIO'.I SIIEcrRA foR
LOAD CASE U JFH '(((A LOCA
NODE DIRECrIDR F.'l . E. Ev676'0
DAIS INO 0 ~ 005,0 ~ Oi 0)0 ~ 02
R . 9 07 85SUSQUEHANNA STEAM ELECTRIC STATION
UNITS 1 AND 2DESIGN ASSESSMENT REPORT
REACTOR/CONTROL BUILDINGKWU-LOCA
L-7 3FIGURE
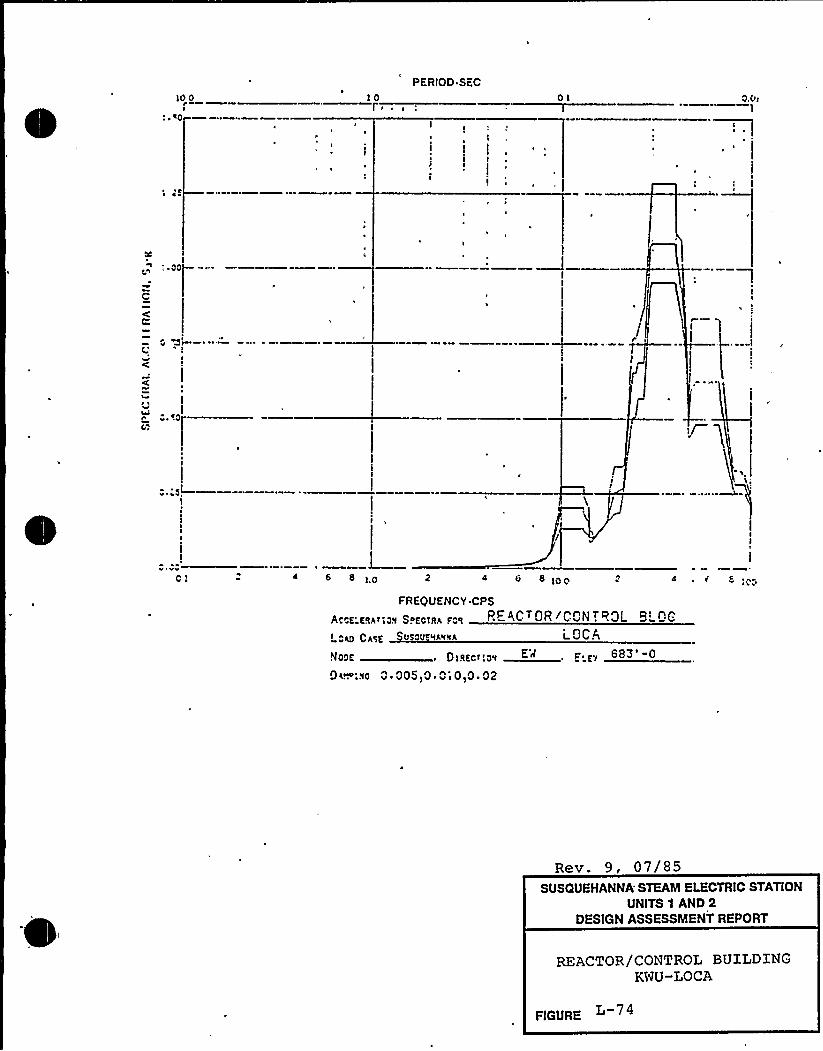
10 0
: ~ 40
PERIOD SEC01 o.os
I
1 25
: aop--.
C
I1 ~
v'25,
V VV
o 1.O 2 4 O 8 1OO 4 ~ C E~ '4
FREQUENCY CPS
A".cf cai Ia~ S.oac1s~ ~o~
L«4o Cygne Usov RARMA i OCA
NOQE D1'IB'<' E~ F P., 683'09(~:~c 0 00510 0's0 0 02
Rev. 9, 07/85SUSQUEHANNA'TEAMELECTRIC STATION
UNITS 1 AND 2DESIGN ASSESSMENT REPORT
REACTOR/CONTROL BUILDINGKWU-LOCA
FIGURE
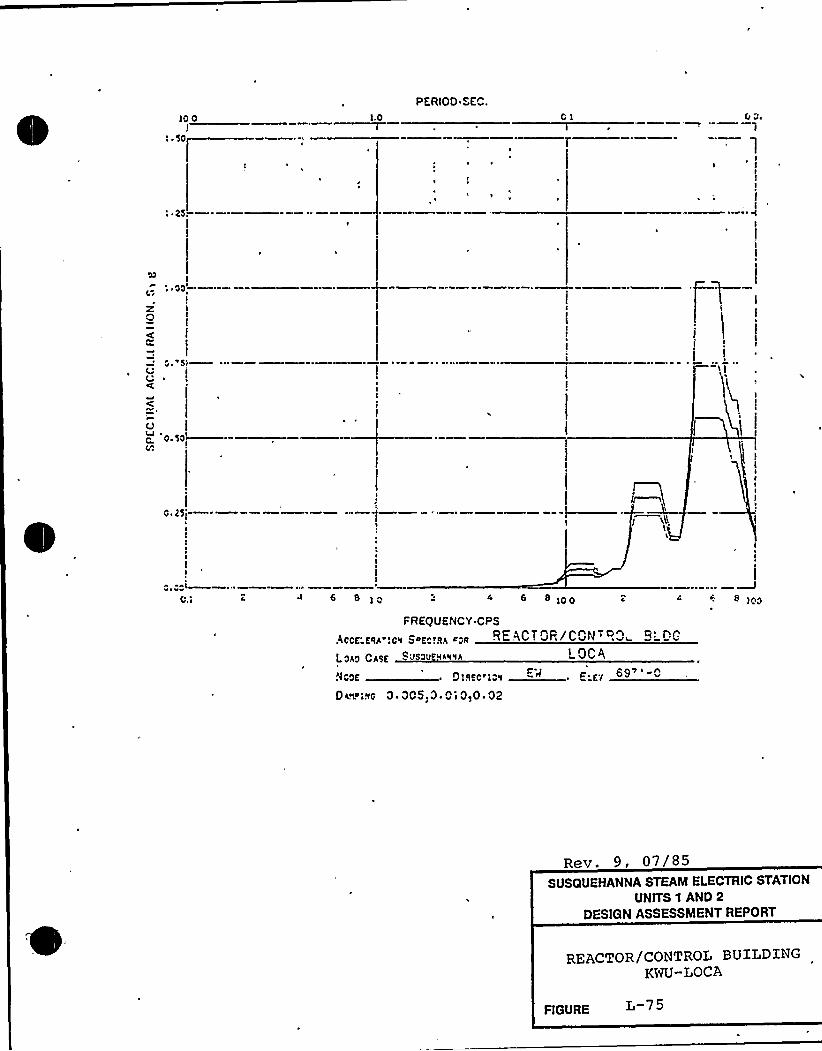
500I
: ~ 50
L.O
PERIOD SEC.01 0 0.
~ f0005
u0 ~ 50~
Cl'.
0 25'"
O.a 6 8 6 8 8 100
FREQUENCY CPS
(006 gqA- O„So6058A r,g REACTOR/CON '3~ 9'CLoAo CAsE Jsov RA%'lA LOCA,
."ICO8 Ol'I80'lax E~ . P. 6Y69~ '0
DA~~:80 3 ~ OCS,O. 0i 0,0. 02
Rev. 9, 07/85SUSQUEHANNA STEAM ELECTRIC STATION
UNITS 1 AND 2
DESIGN ASSESSMENT REPORT
REACTOR/CONTROL BUXLDlNGKWU-LOCA
FIGURE
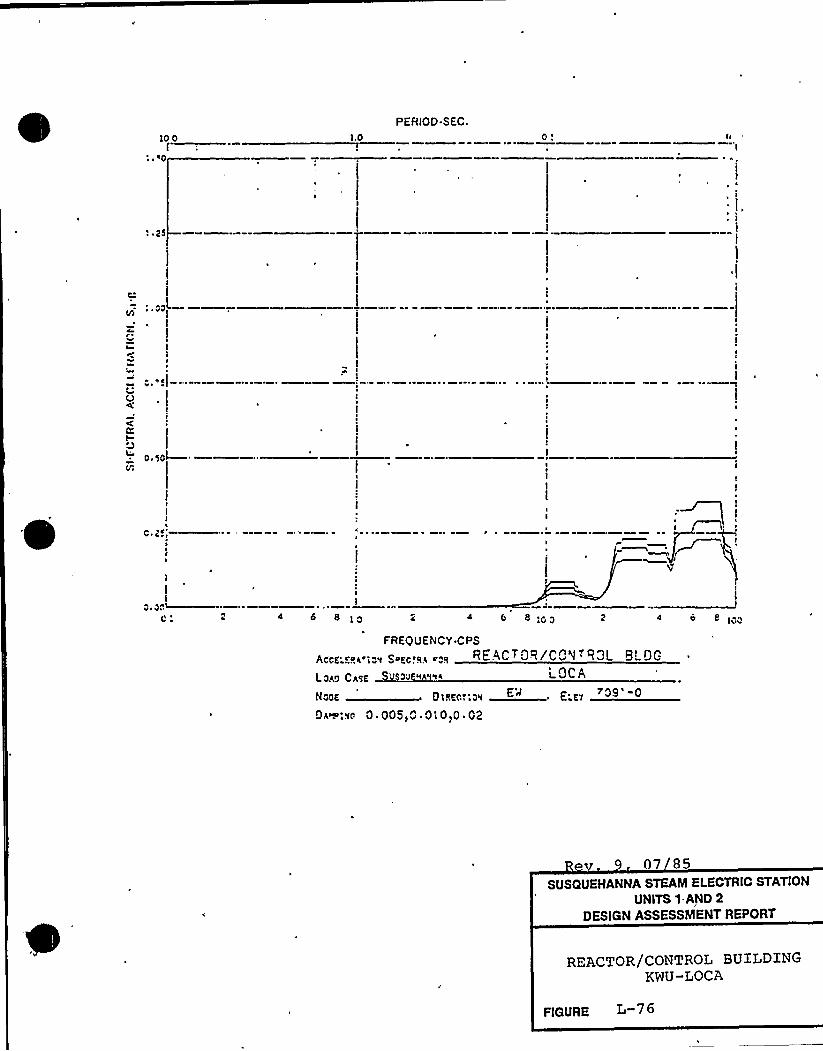
PERIOD.SEC.1.0 0 ~
~ $ 5
r ~
III
o. Sol—
III
I
1
I1
0 ~o."'
4 0 11
10'REQUENCYCPS
porc ao(.1ov SocoIIq, roy REAG OR/CO(I ~ oIOL O'GLO(O CpSC Sosoo k(vv( i OCA
Nooc 5 isco..av E"~ E.c1
5A'p'vo 0 005i0 0'l0)0'02
j~PC 100
07 85SUSQUEHANNA STEAM ELECTRIC STATION
UNITS 1.AND 2DESIGN ASSESSMENT REPORT
REACTOR/CONTROL BUILDINGKWU-LOCA
FIGURE L-7 6
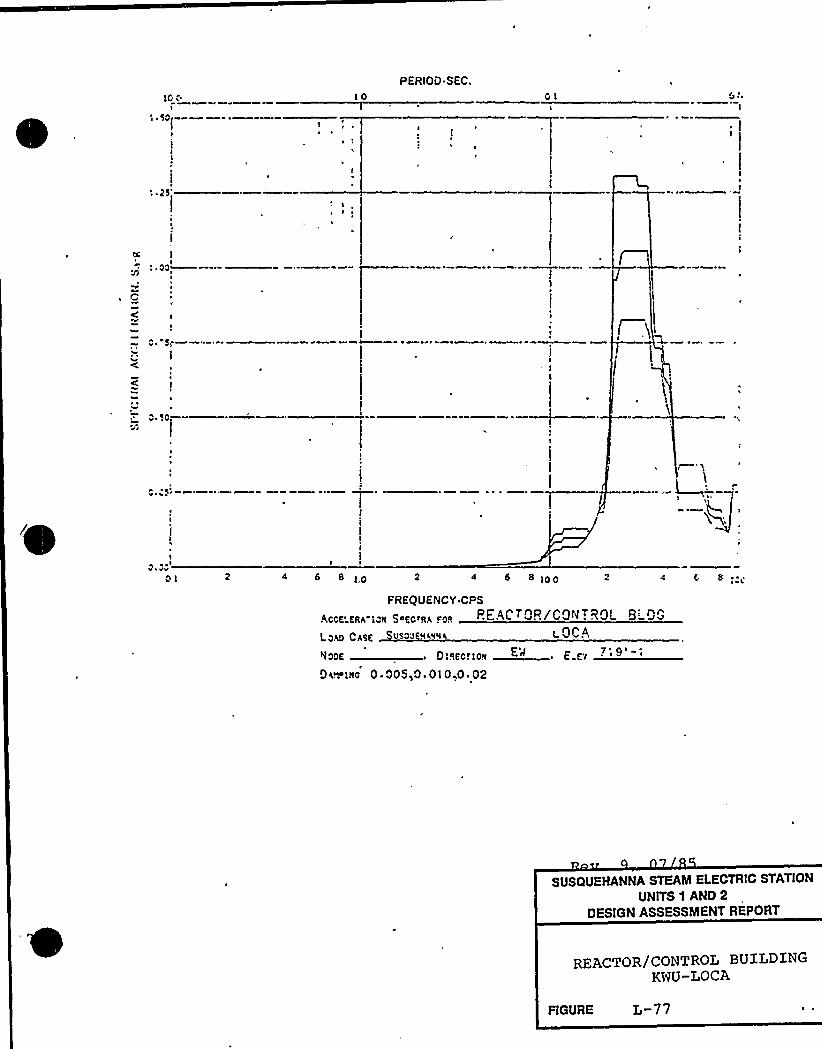
'> ~ 50I
l
10PERIOO SEC.
ol 0I
: 00'.
0 ~ 'Sp
I
0 ~ 50.
I
.LI
~ ItVOl 6 8 !,0 2 8 loo 4 8 8 0
FREQUENCY CPS
log Sdgcfgg c08 PEAC T QRlGQN 7 RQ. 8'0"ig~ CA5g 500 savwa cOCA
~ 0!8ECTl08 E" . E''I ~ >
Oa~!!lc 0 '05,0.010,0.02
SUSQUEHANNA STEAM ELECTRIC STATION
UNITS 1 AND 2
DESIGN ASSESSMENT REPORT
REACTOR/CONTROL BUXLDXNGKWU-LOCA
FIGURE L-77
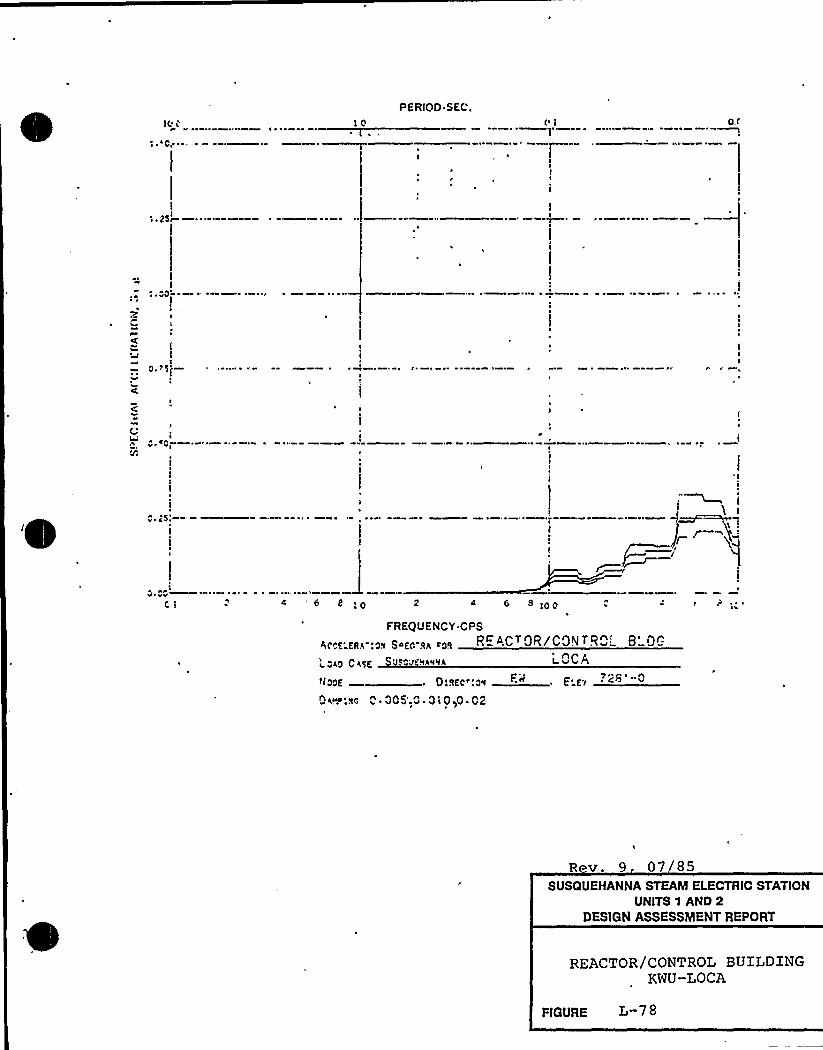
PERIOD.SEC.O,r
II
~ ~
I
)~ I
e 4 6 ~ joe t Il
FREQUENCY CPS
(g~g gg",gq Sogr.-jr'gjj R ~C OR/CON T q~: B'=nr ~.
gg /gag 4< 4 NARRA L VCA
tiaDE D'.!IEC".0 ."E'.E'w~:sa
C. QCS'.Q. Qi 0>O.C2
R v. 9 07 85SUSQUEHANNA STEAM ELECTRIC STATION
UNITS 1 AND 2DESIGN ASSESSMENT REPORT
REACTOR/CONTROL BUILDINGKWU-LOCA
FIGURE L-78
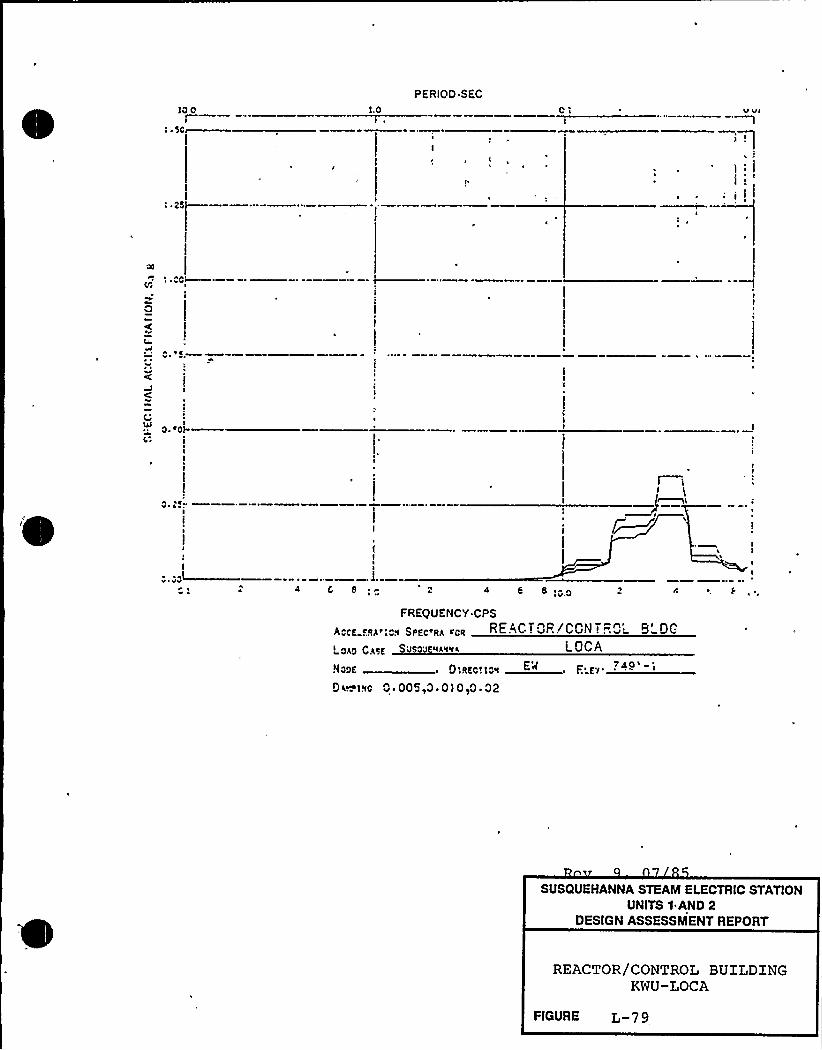
Ic0' 'IC
25I—
I.O
PERIOD SECC' VIl
I:II <I
I I
iI
C ~ ~CI-
AV ~,
J,c e 4 6 8 'v.c
FREQUENCY.CPS
Sppc~g* ~cq REACTOR/CON! R~: O'Ccgg C gyp Svsc'J RA%'ll LOCA
Noae O.sec. Ic~ " . F. ev740 ~
Oi~l~c 0 005,0 ~ 0) 0>0 ~ 02
SUSQUEHANNA STEAM ELECTRIC STATIONUNITS 1 AND 2
DESIGN ASSESSMENT REPORT
REACTOR/CONTROL BUILDINGKWU-LOCA
FIGURE L-7 9
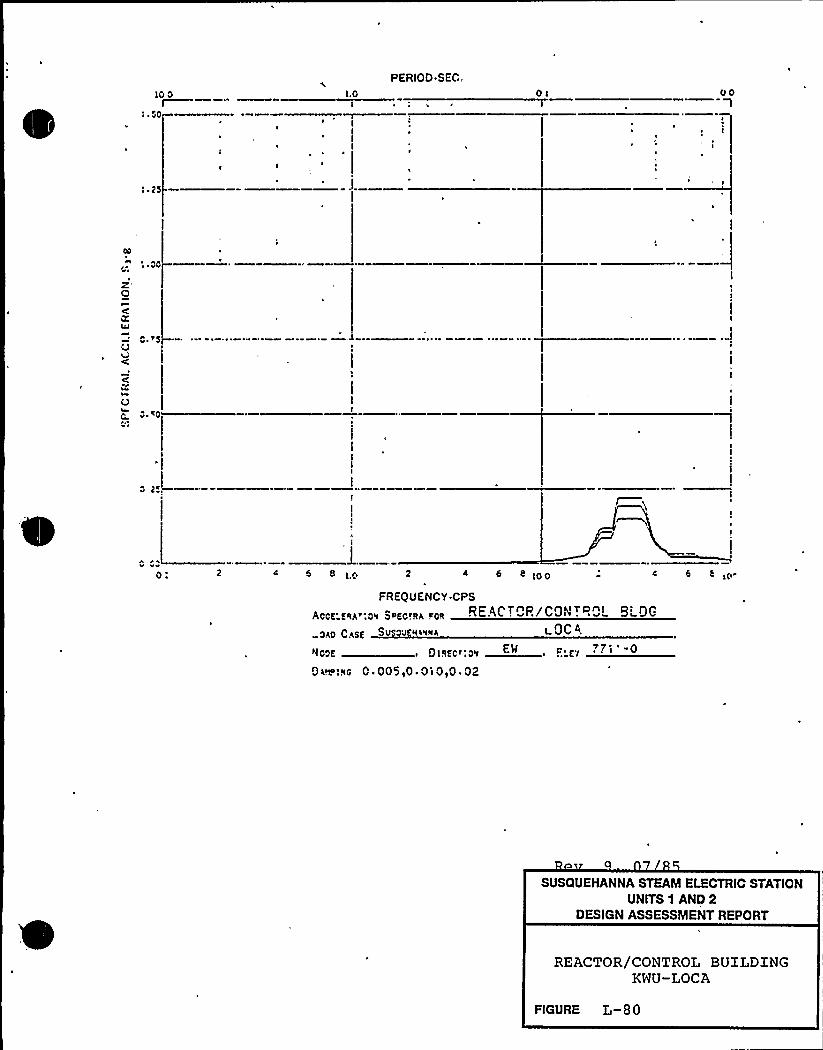
lc cI
L.G
PERIOD SEC„
ciT
ocI
~ I
I
0(c4J
c ~ >SI0
c ccc: 4 < ~icec 2
FREQUENCY.CPS
Ace+ fRA~icv SoKcrqg rcR REACTQP/CON ..O'~OGc<c C.(sf SVS J'ER%'INA ROCAC'
IOM ~ Dnzc~:o~ E" . ~ zY'~i '
94M!!Ic 0 ~ 005>0.0i 0>0. 02
6
SUSQUEHANNA STEAM ELECTRIC STATIONUNITS 1 AND 2
DESIGN ASSESSMENT REPORT
REACTOR/CONTROL BUILDINGKWU-LOCA
FIGURE L-80

'
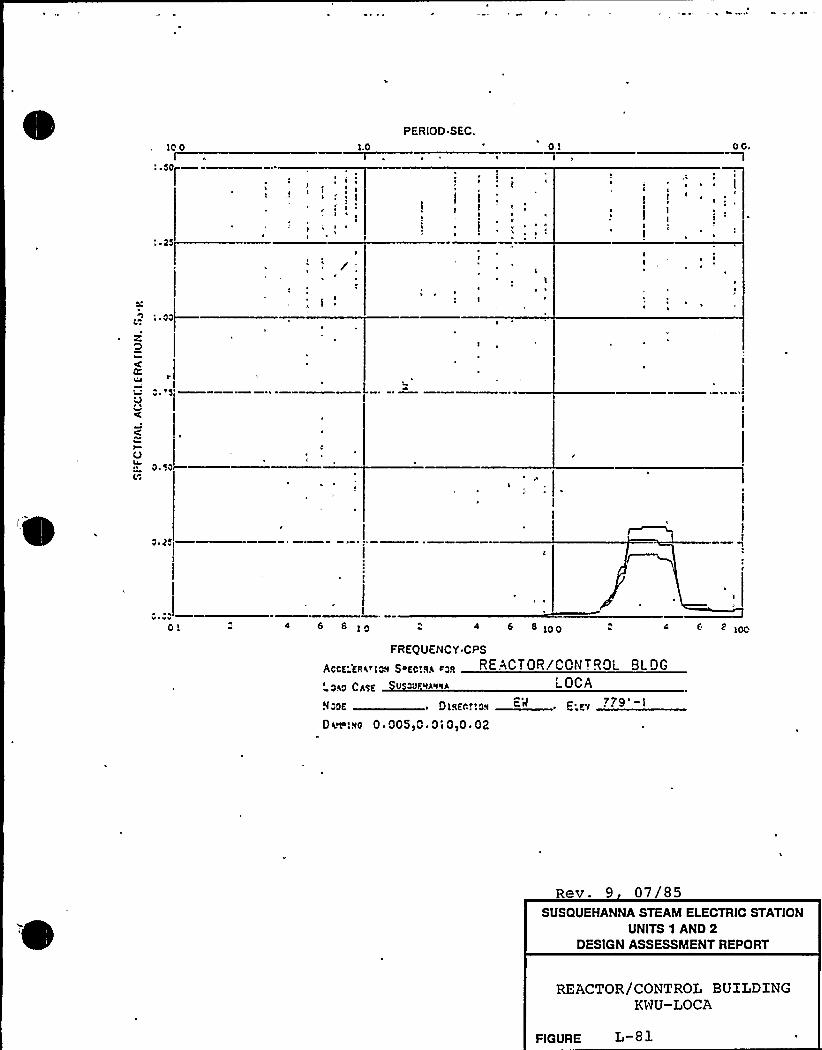
PERIOD SEC.1.0 o. l 0 G.
I
I~ > e
II
I~I
g 1
1
l i
I
g~
I
L
4 6 S 4 6 8 ioo (' loo
FREQUENCY CPS
ACCT'ERErlog SoKCtlh rgq REACTOR!CCNTRQL BLOG
oho ChsE o Fvhvvh AVOCA
oN ~ Olsrrr:av E'". E iY ??9'I
O~~.vo 0. 005,0. Ol 0,0. 02
Rev. 9 07/85SUSQUEHANNA STEAM ELECTRIC STATION
UNITS 1 AND 2DESIGN ASSESSMENT REPORT
REACTOR/CONTROL BUILDINGKWU-LOCA
FIGURE L-8 1

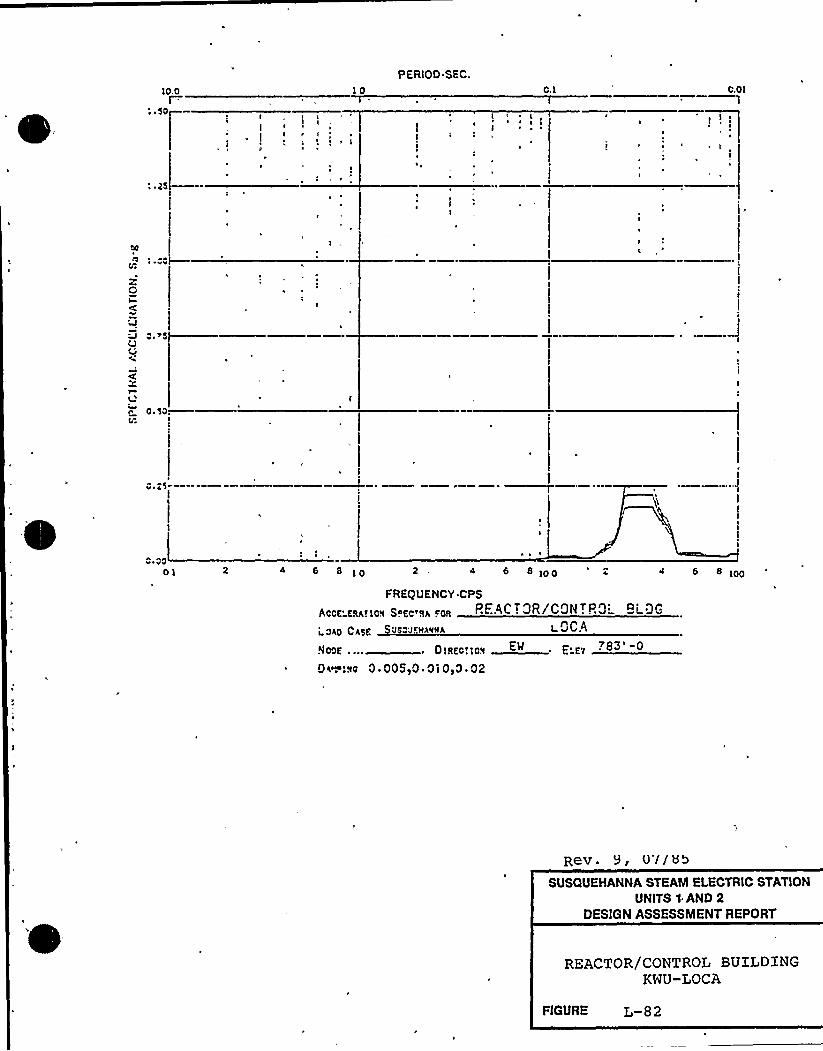
I I II
III
I
10PERIOD.SEC.
0. I 0.0I1
4 6 8 4 6 8 jo0 8 ioo
FREQUENCY CPS
f8dgIov Ssggt8g roy PEAC ~ 3R/GQN .. O'L'3Cohio C488 0 'J~lfhvvd L dO.dhO d
AJOM .... 0
0 a~!8c 0 ~ OOS,O. Oi O,O ~ 02
Rev. 9, U'llew>
SUSaUEHANNA STEAM ELECTRIC STATIONUNITS 1-ANO 2
OESIGN ASSESSMENT REPORT
REACTOR/CONTROL BUILDINGKWU-LOCA
FIGURE L-82
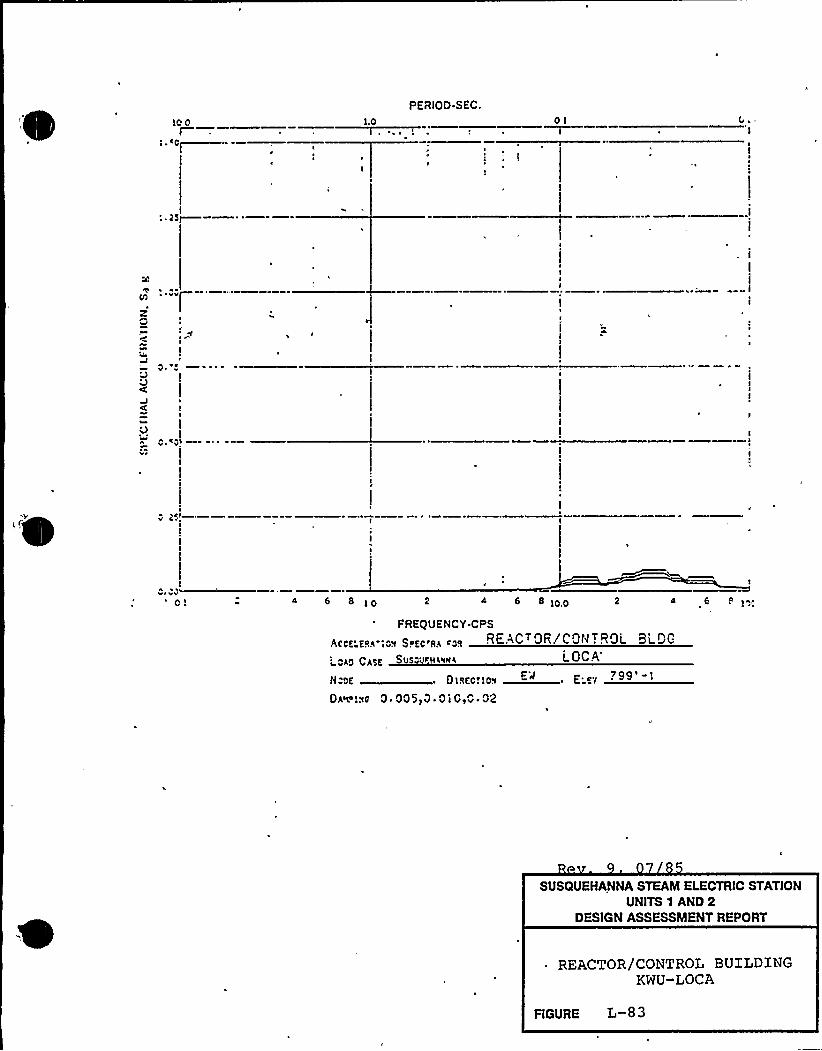
' 'Gp
PERIOD.SEC
1.0 OI
II
~ fV
II
gII
~ obA
V V\6 8 4 6 8 4 6 8
FREQUENCY CPS
Aoo,.8„-,o„S.8o,„(.o8 REAC OFI/CON . ROLBi-Oj-'opo
Cygne SUs ' ('gM( L OCA'
ooE 0I8rc'.Io~ E" . E 8v
Oaw'.wc 0 ~ 005,0 ~ 0 i G,G ~ 02
SUSQUEHANNA STEAM ELECTRIC STATIONUNITS 1 AND 2
DESIGN ASSESSMENT REPORT
REACTOR/CONTROL BUILDINGKWU-LOCA
FIGURE L-83

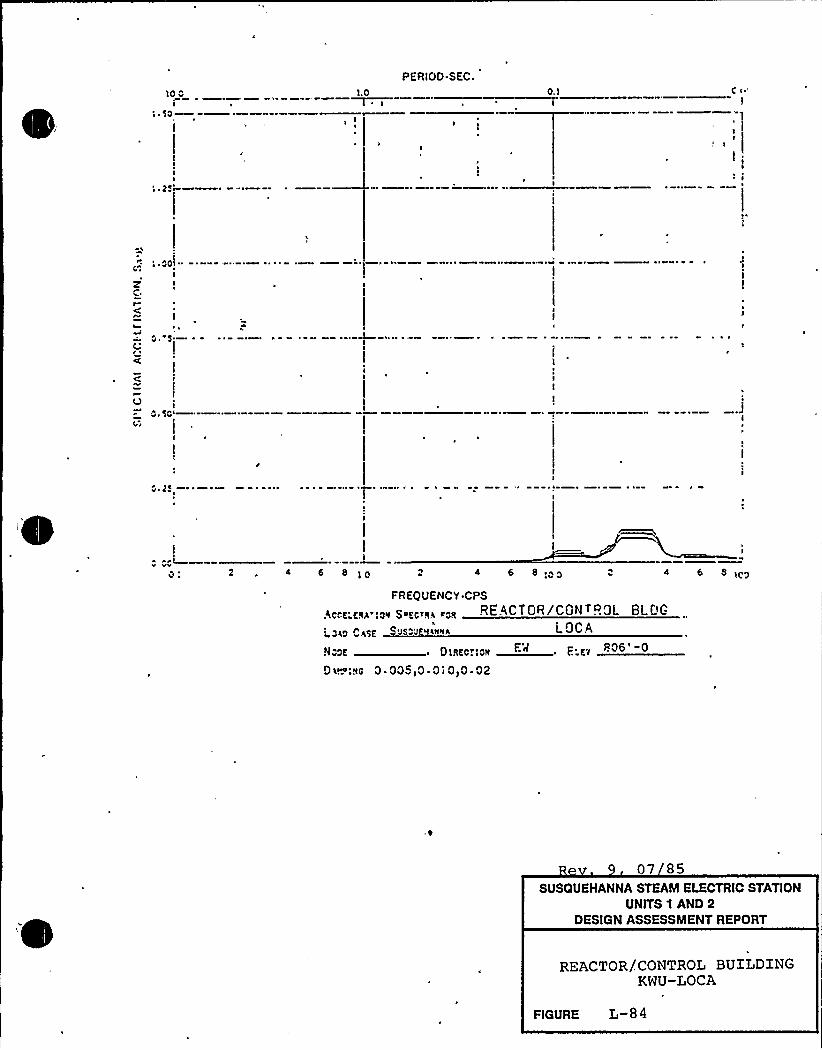
IO CI
: use
1.0I
PERIOD.SEC.0.1r
II
'I ~ 25
.'„';.Coi--Z
I
I
I
Vc ~
sc'C
|i
r t~—I
plVV
4 6 8 4 6 8 ICC 4 6 S,CC
FREQUENCY CPSREACTOR/CONTROL BLDG
I
LCEc 04SE SvscJ 'tlNMA L OCA
NCZ ~ PIII~C,IC„F.'l F. E.( 806'0Pa~:sc 0 '05>0 'i0~0 ~ 02
07 85SUSQUEHANNA STEAM ELECTRIC STATION
UNITS 1 AND 2DESIGN ASSESSMENT REPORT
REACTOR/CONTROL BUILDINGKWU-LOCA
FIGURE L-84
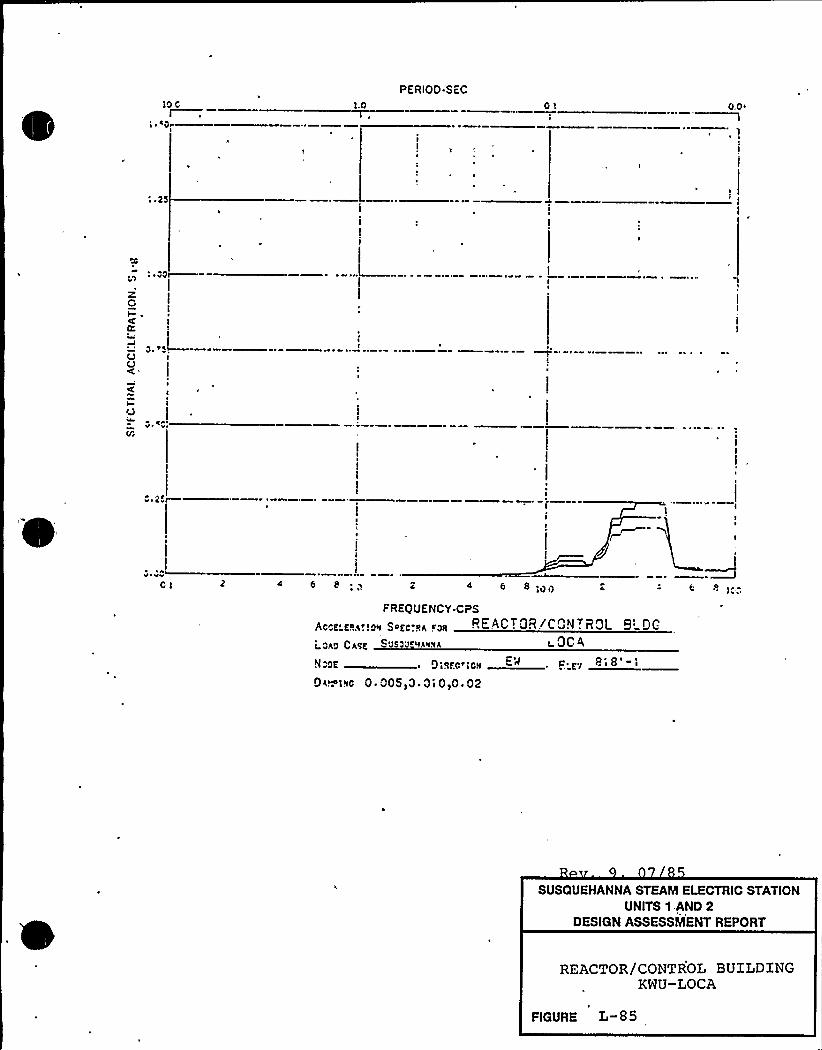
In 0I
s.n
PERIOD.SEC
0 1 0,0t
Z0
~ ~ Ccl
v ~ 25l
AV Vv
CI 4 6 8 2 4 6 8;00FREQUENCY CPS
pccf fo,q,cq Sofc- „ fq„REACTOR!C .I . ROL 9'CL,egg Cgqf ~ If0 i fA'IAA I-OC !IL
8 ~ ~N:cf O'I'..c'laI "" F.'V.Qi~I~c 0. 005,0. Oi 0,0. 02
SUSQUEHANNA STEAM ELECTRIC STATIONUNITS 1 AND 2
DESIGN ASSESSMENT REPORT
REACTOR/CONTROL BUILDINGKWU-LOCA
FIGURE L-85
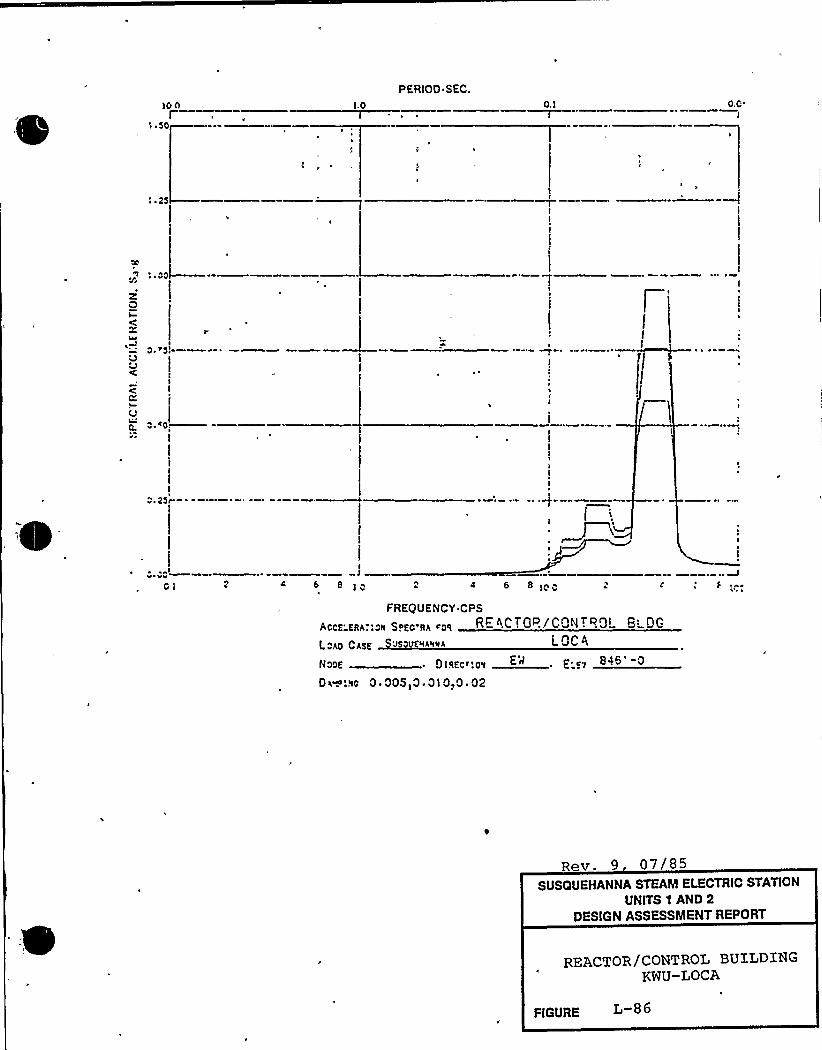
10 O
II ~ $0
I.O
PERIOD SEC.O.C'
z'Q
C
~AUIJ
I
I I
\ 400 ~
I
0 ~ 2$ r
4 6 8 6 8 100
FREQUEiVCY CPS
ACCE'ERh.;011 S. EC Rh 08
Oh0 ChSE 'JS Evhvllh LOC4
NOOE Olefc<'Ov Erl E ~, 846 0
0 a~'.80 0 ~ 00510 ~ 0 I 0>0 ~ 02
Rev. 9 07/85SUSQUEHANNA STEAM ELECTRIC STATION
UNITS 1 AND 2DESIGN ASSESSMENT REPORT
REACTOR/CONTROL BUILDIHGKWU-LOCA
FIGURE L 86
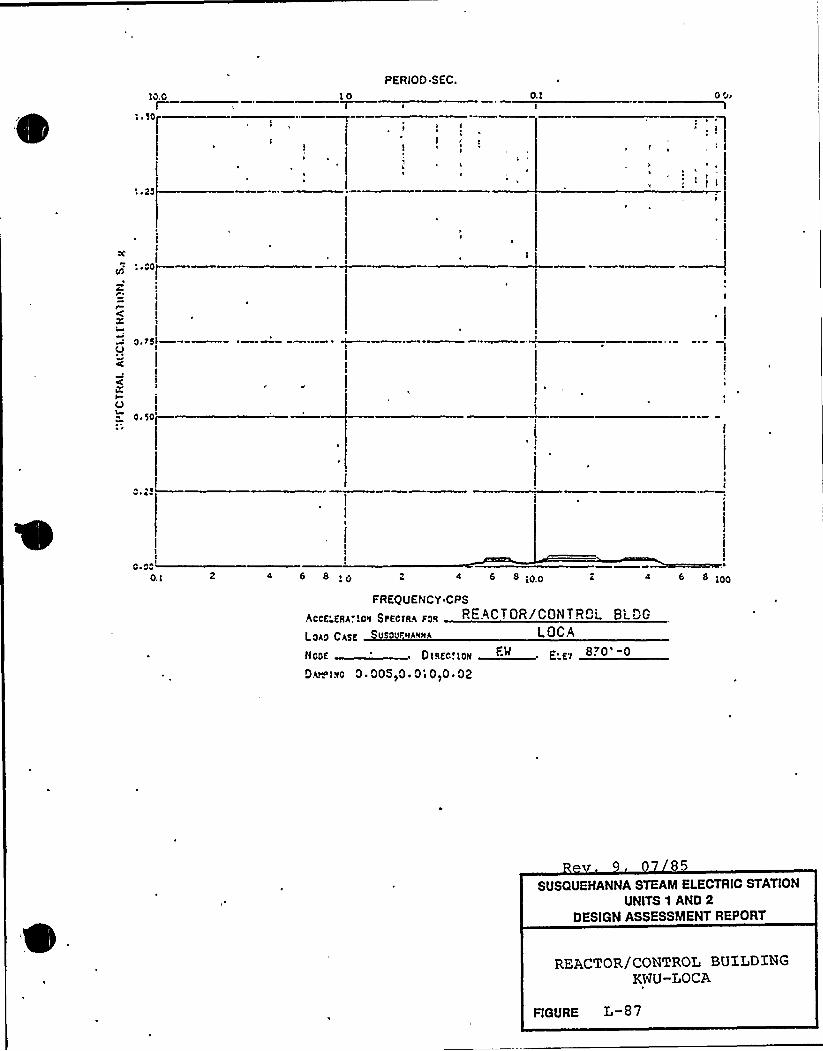
10.0
PERIOD.SEC.10
I0.1 0 or
l
I
v a
O,l 4 6 8 4 6 8 oo 4 6 6:oo
FREQUENCY CPS
hoof'g4.',09 SFfofRA Fo's REACTOR/CON
CAROL
BLOG
LOAO CASg SUS00F(( ((((A LOCA
NaOE' DlREc'.lrr E'.E'I
Der. iso 0 ~ 005~0. 0'(0~0 02
85SUSQUEHANNA STEAM ELECTRIC STATION
UNITS 1 AND 2DESIGN ASSESSMENT REPORT
REACTOR/CONTROL BUXLDXNGKWU-LOCA
FIGURE L-87

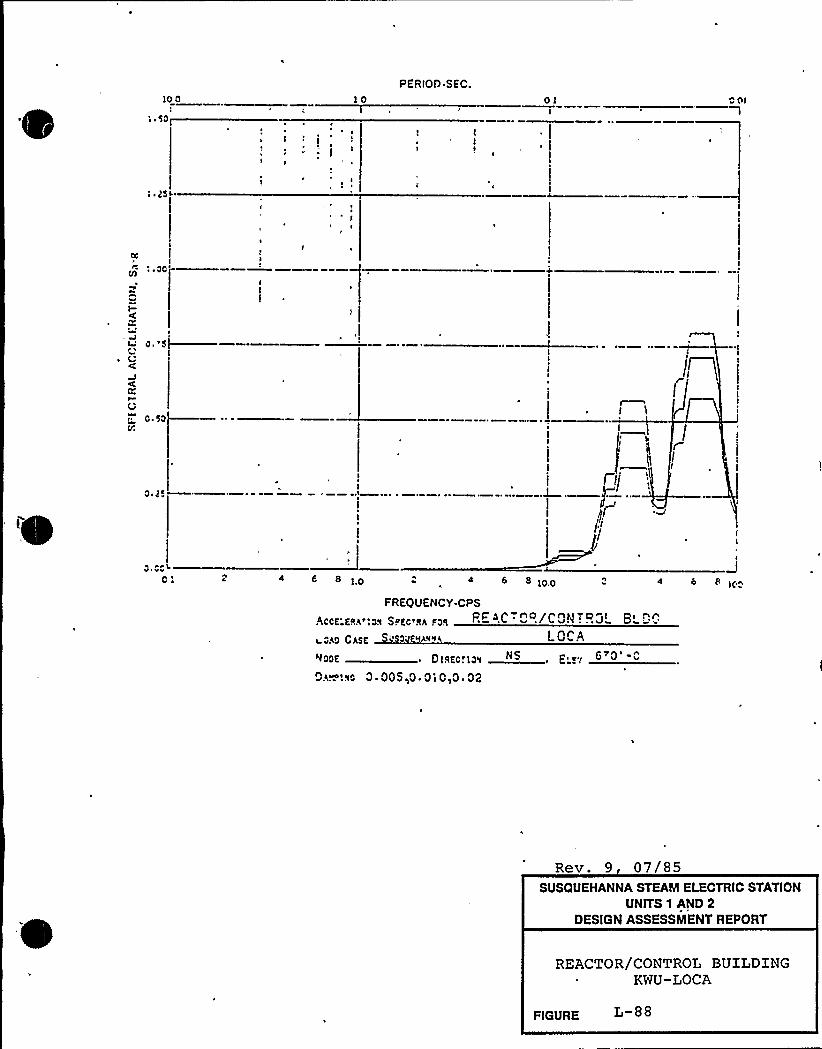
lo 0 10PERIOO SEC.
01
1 ~ 25
I-
,";a sl—C'
Vo ~ 50 J
V veOl
Il
I
I
2 4 6 8 10 4 8 loo 4 6
FREQUENCY-CPS
AccE'RA'.55 SPEc'8A !58
acAO CA5E ' RANI%
'locE ~ 01RECE1gV
QA~'.Rc 0 OOS,O.Oi O,0.02
LCCA
E. e.( 6'O'0
Rev. 9 07/85SUSQUEHANNA STEAM ELECTRIC STATION
UNITS 1 AND 2DESIGN ASSESSMENT REPORT
REACTOR/CONTROL BUILDINGKWU-LOCA
FiGURE L 88
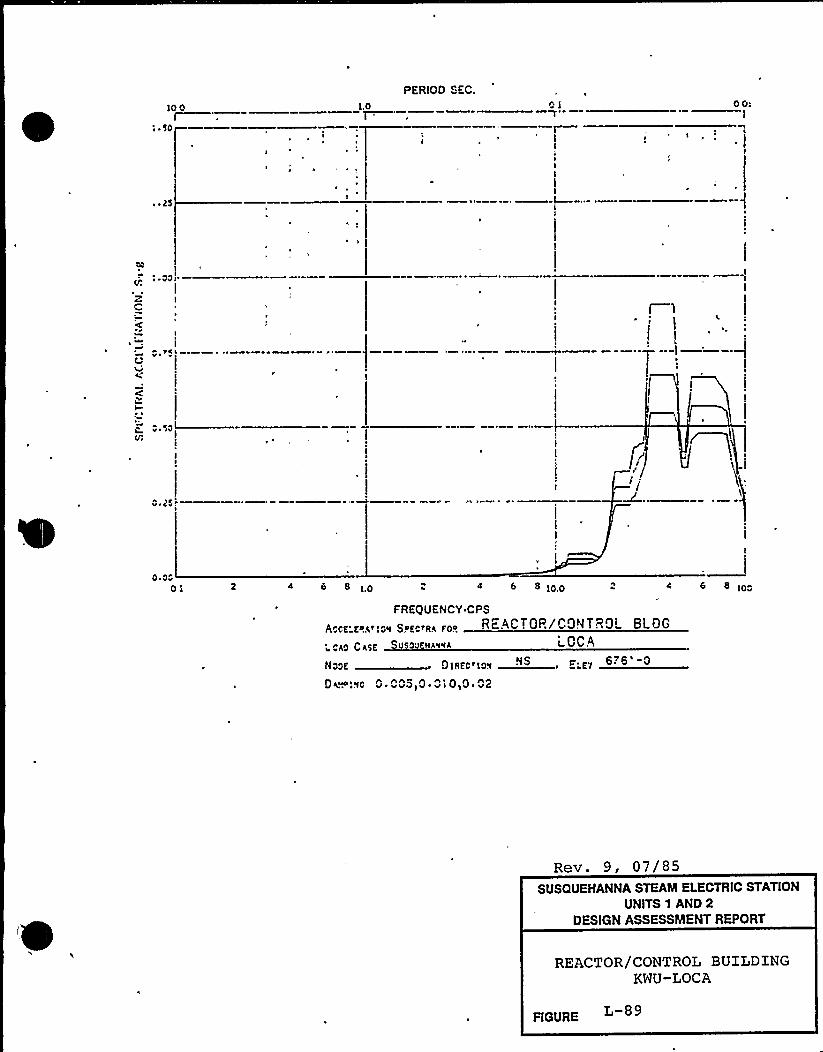
10 0I
's ~ SO
1.0l.PERIOD GEC.
01T
00>
~ ~ 15
Qh
~ 00
I
7%h
()hh
II
I
I
~VI
C/
o,js
I
p
I/
0 ~ oo01 4 e 8 10 8 1O.O 8 1OO
FREQUENCY CPS
p ocK'oRr roy SREotRR Foo Rc.ACTOR/GgN T RO'LDGCysts Svsoo AMMA i OCA
Noae DIREC ro~ "Is r El 6v6 p
Dguooqo p nn$ p n p
Rev. 9, 07/85SUSQUEHANNA STEAM ELECTRIC STATION
UNITS 1 AND 2DESIGN ASSESSMENT REPORT
REACTOR/CONTROL BUILDINGKWU-LOCA
FIGURE
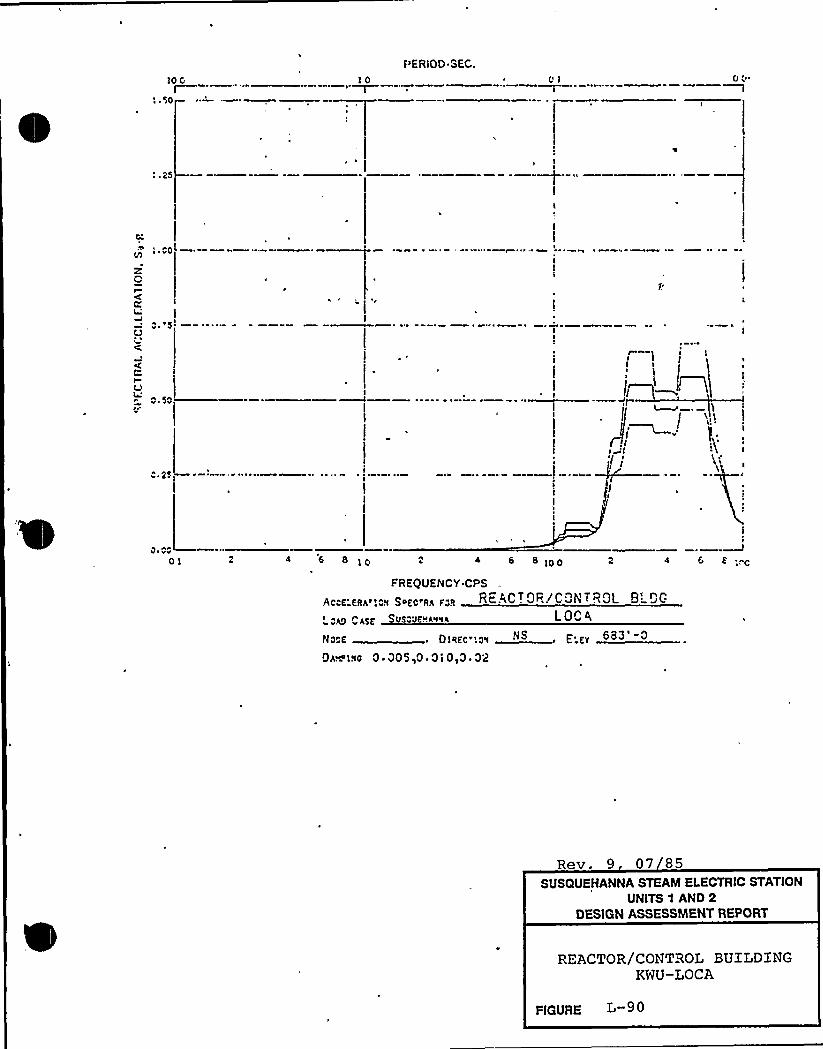
10 GI
'I ~ 50
10I
PERiOD SEC.01 01
ZCI
I
V
0 ~ 50
0 '5
01 4 6 8 10 2 8 1OO 4 6 fFREQUENCY CPS
II SDfctgg fgO ReACT OR! CONTROL O'GASf VS 'JfHA%'fA LOCA
Mcof ~ Oiefc".a~ NS~ E'v 683'0
D*w!~c 0 005,0.0i0,0 02
Rev. 9 07 85SUSQUEHANNA STEAM ELECTRIC STATION
UNITS 1 AND 2DESIGN ASSESSMENT REPORT
REACTOR/CONTROL BUILDINGKWU-LOCA
FIGURE L-90
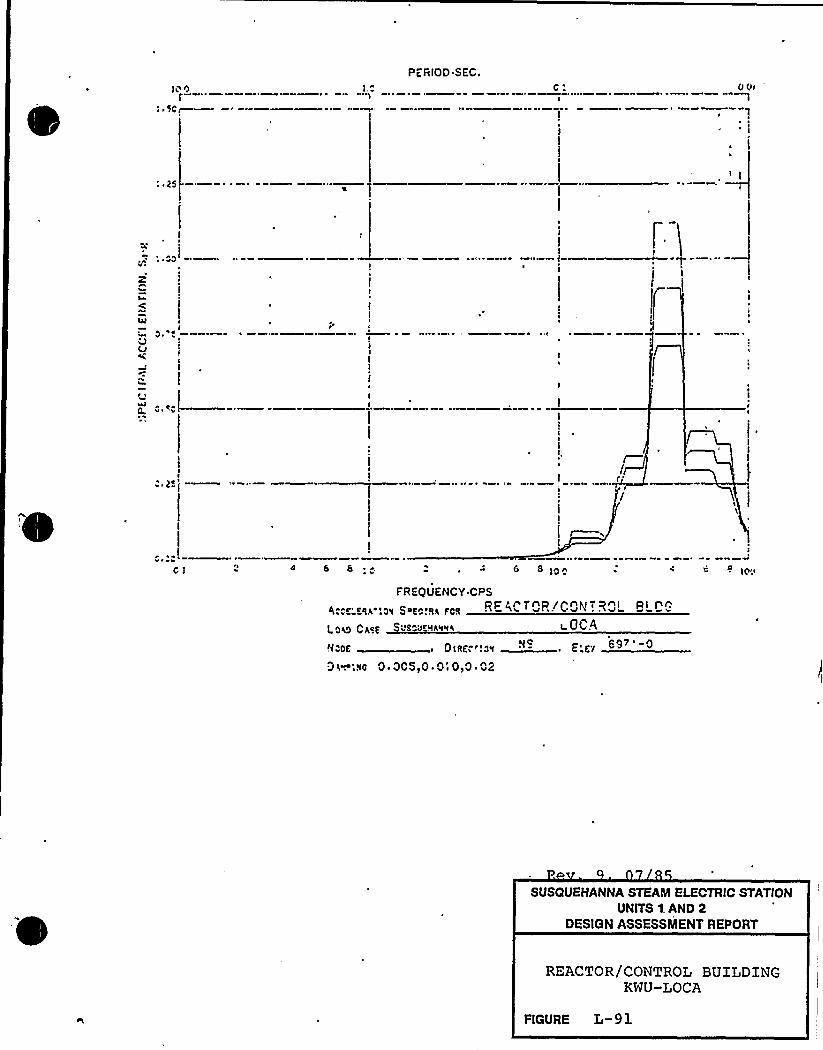
~ .'1
PERIOD.SEC.00'
4 8 8 G 8 i@n
FREQUENCY.CPS
c'gg' ~ cq $ 4@ tQq peg R i\ vP CV'1 14m B
OCA
H FACE giga ptgq il p gy 69 0
Da.:~c 0.005,0 0'0,0 ~ 02
SUSQUEHANNA STEAM ELECTRIC STATIONUNITS 1. AND 2
DESIGN ASSESSMENT AEPORT
REACTOR/CONTROL BUXLDINGKWU-LOCA
FIGURE L-91
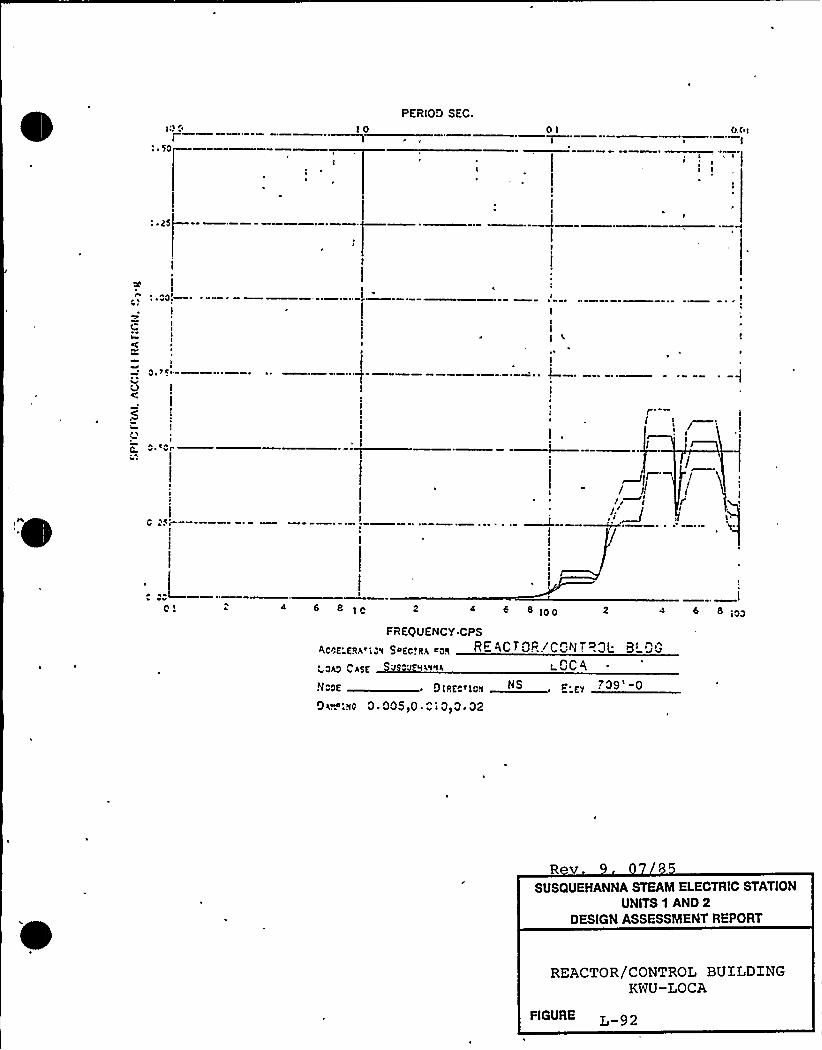
10PERIOD SEC.
OI
II
C ~
I
C I
II
o,)ca ~
~O I
C
~'II
I If '
/
C +Si-
o ~ s e icFREQUENCY CPS
Acce'eh'<ow 9 ~EC'f RA ~oe
SJS J RKVNl
NoN ~ 5 !ceo'aoA
5~~:sc 0. 005,0. 0 i 0,0. 02
e ioo
ACTOF.!CG"I; ~0t. B'~0
NS p. )„?09'0
I
e coo
SUSQUEHANNA STEAM ELECTRIC STATIONUNITS 1 AND 2
DESIGN ASSESSMENT REPORT
REACTOR/CONTROL BUILDINGKWU-LOCA
FIGURE L 9 Q
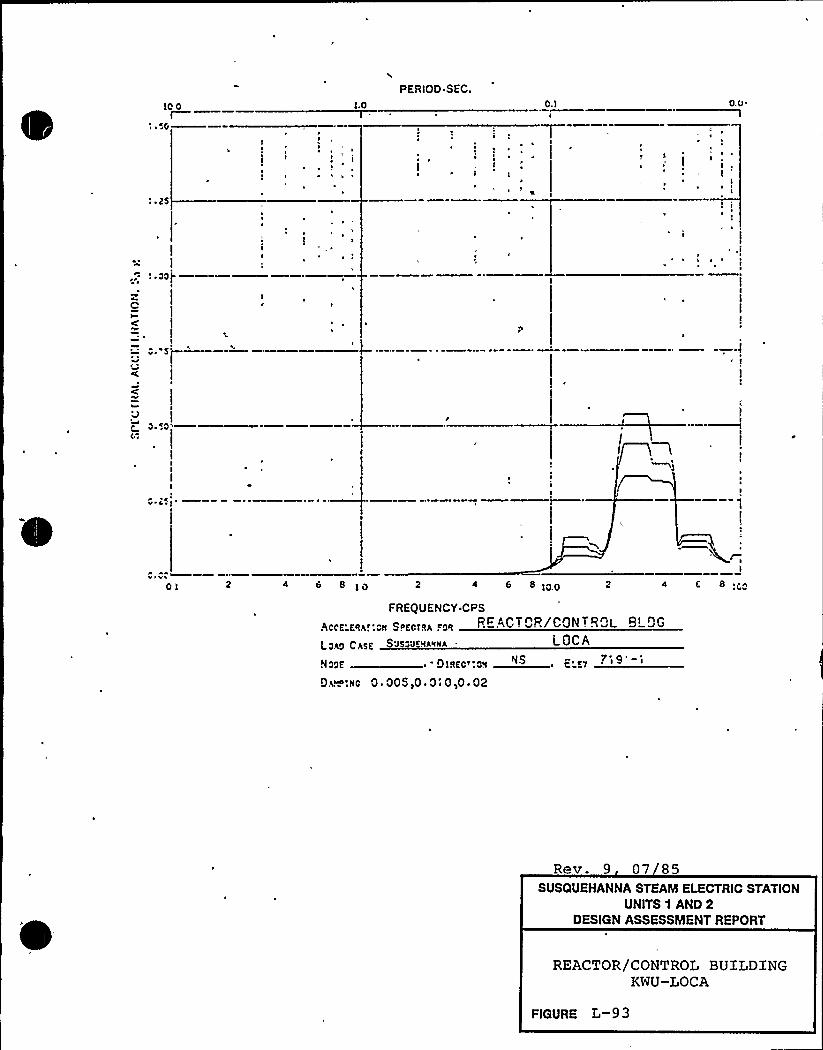
1o0I
co
lII
I
1.0
PERIOD SEC.C.)
: ~ js
: ~ oo I-I
zCIC
8 ~ 'St-
occ
4 8 8 2 4 8 8ioo 4 C 8
FREQUENCY.CPS
Aces vi',:on S.ozcr8r . o~
ops Cpgg Sos)vwHAvMA L OC A
NOO8 .-0:88c'.o~ "S . E av
0.<~:8c 0 ~ OOS,O ~ 0 i 0,0 ~ 02
Rev. 9 07 85SUSQUEHANNA STEAM ELECTRIC STATION
UNITS 1 AND 2DESIGN ASSESSMENT REPORT
REACTOR/CONTROL BUILDINGKWU-LOCA
FIGURE L-93

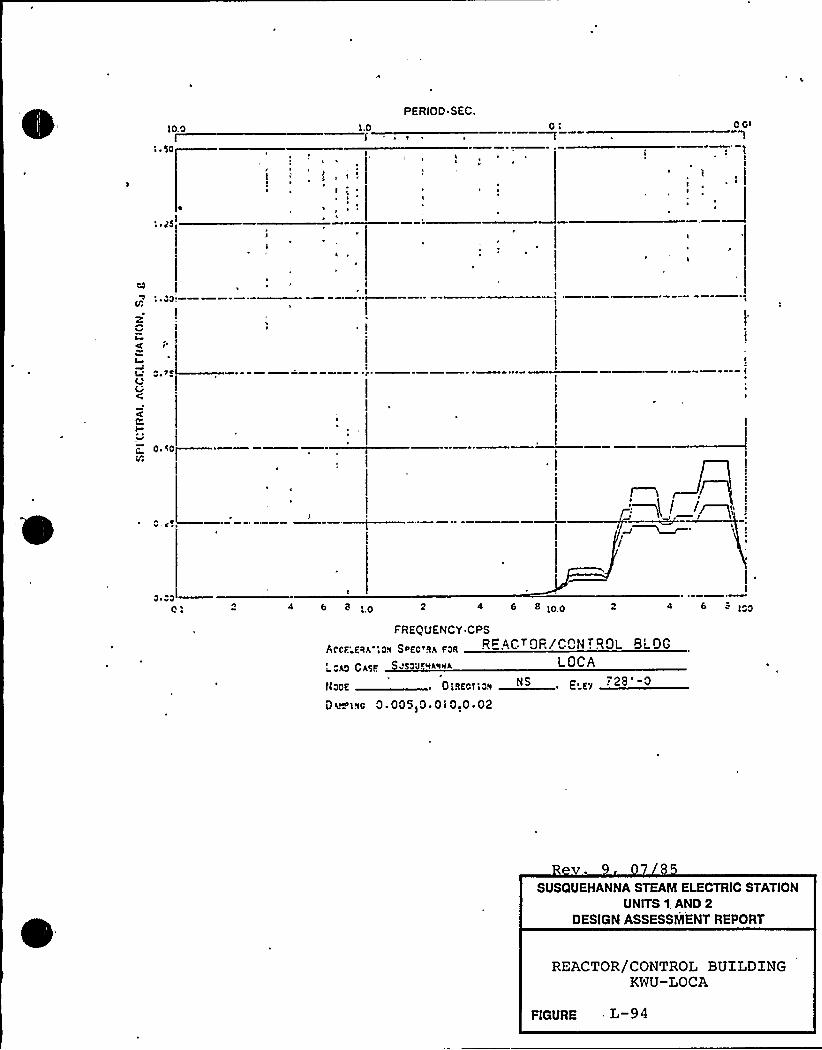
PERIOD SEC.
1.0I . ~ ~
pir
CG>I
I rI I
~~ ~
\
4 b 8 10 4 6 8 1OO = 100
FREQUENCY CPS
Sy)ctv( ))~ R ..C QF/GQN . ROL BLDG
(0 CASF SQJ vAvvA LOCA
~ 01REcli pv NS~ E'Y 'S 0
0<~ivc 0 ~ 005 0 ~ 010.0. 02
SUSQUEHANNA STEAM ELECTRIC STATIONUNITS 1, AND 2
DESIGN ASSESSMENT REPORT
REACTOR/CONTROL BUILDINGKWU-LOCA
FIGURE L 94

10PERIOD SEC.
0: C 0s
I ~ 28
~ 4 IS
z IQI
C
s.sstO
C
o
V.'
t'
8 4 6 8 IJI
FREQUENCY.CPS
P006„.8(-;0, So)0.8P, 08 R" ACTOR/C NTRDL BLDG
C(88 S0IS00 (»»l LOCAnCA
N008 OIaae 0» "S E i ~4
0(~:80 0 005,0 0i0,0 02
Rev. 9 07 85SUSQUEHANNA STEAM ELECTRIC STATION
UNITS 1 AND 2DESIGN ASSESSMENT REPORT
REACTOR/CONTROL BUILDINGKWU-LOCA
FIGURE L 9 5
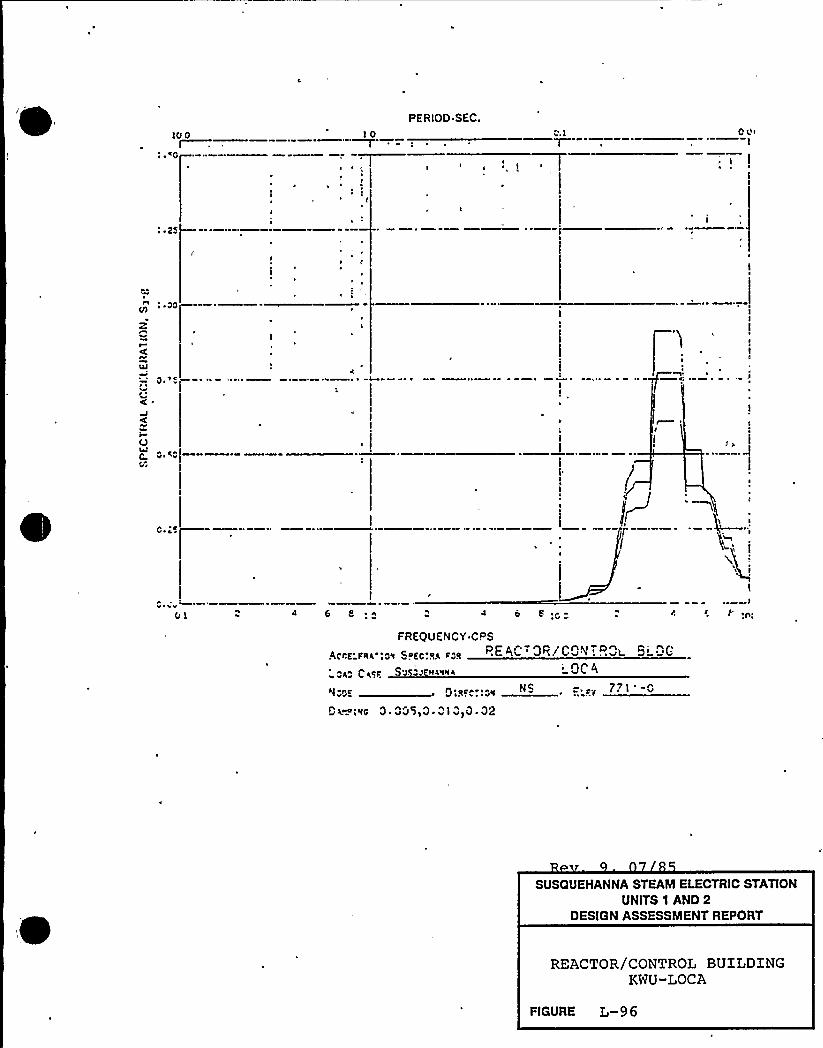
IO 0I
I ~ ~C
IOrPERIOD.SEC.
oo>I
: ~ 25
~ C
zI
UJ
C ~
~ CC
v vvs e e e ~i-' s " n
FREQUENCY CPS
(('nf'/) 'Cg S+fo,eg cCe RE A~ QR! CQN '..» I- 9 DC
C(ep S'J H4'I%4 'CAg vgf =.,y 771 'C0 i~I'Ic 0 ~ OJSiO O1 vpO ~ 02
SUSQUEHANNA STEAM ELECTRIC STATIONUNITS 1 AND 2
DESIGN ASSESSMENT REPORT
REACTOR/CONTROL BUILDINGKWU-LOCA
FIGURE L-96
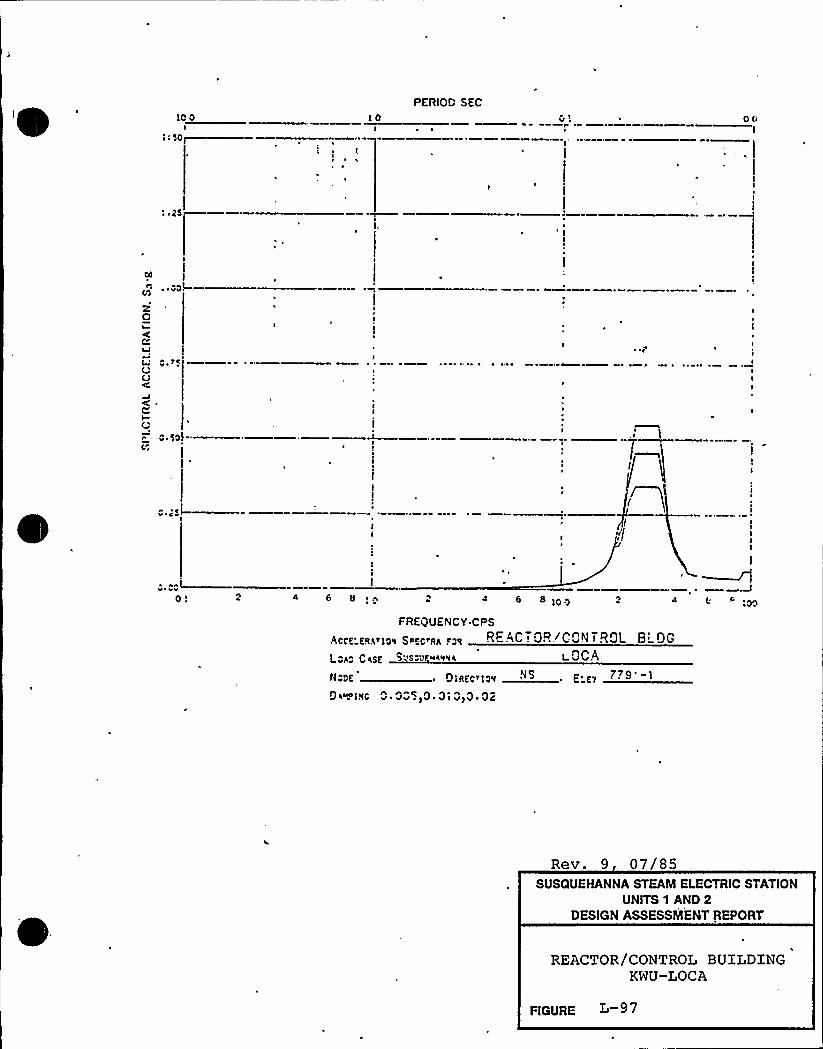
10 0I
iilai—~ Ii
10PERIOD SEC
00I
04I
z0
O
= O.cpfC~r
~ F
0.;:I-
v vv0 6 8 6 8100
FREQUENCY CPS
<CCg'q(t!pq Syph qp, egi! REAC! OR! C 'N ! ROL B'G.'1W h
C (S( > JSvp 9('I'l( L &CA
Nppg . o ~~c ~ a~ ."S E El
0 (~1<0 0 OD qO 0 i 010 02
Rev. 9 07/85SUSQUEHANNA STEAM ELECTRIC STATION
UNITS 1 AND 2DESIGN ASSESSMENT REPORT
REACTOR/CONTROL BUTLDXNGKWU-LOCA
F(GURE

~ ~ '
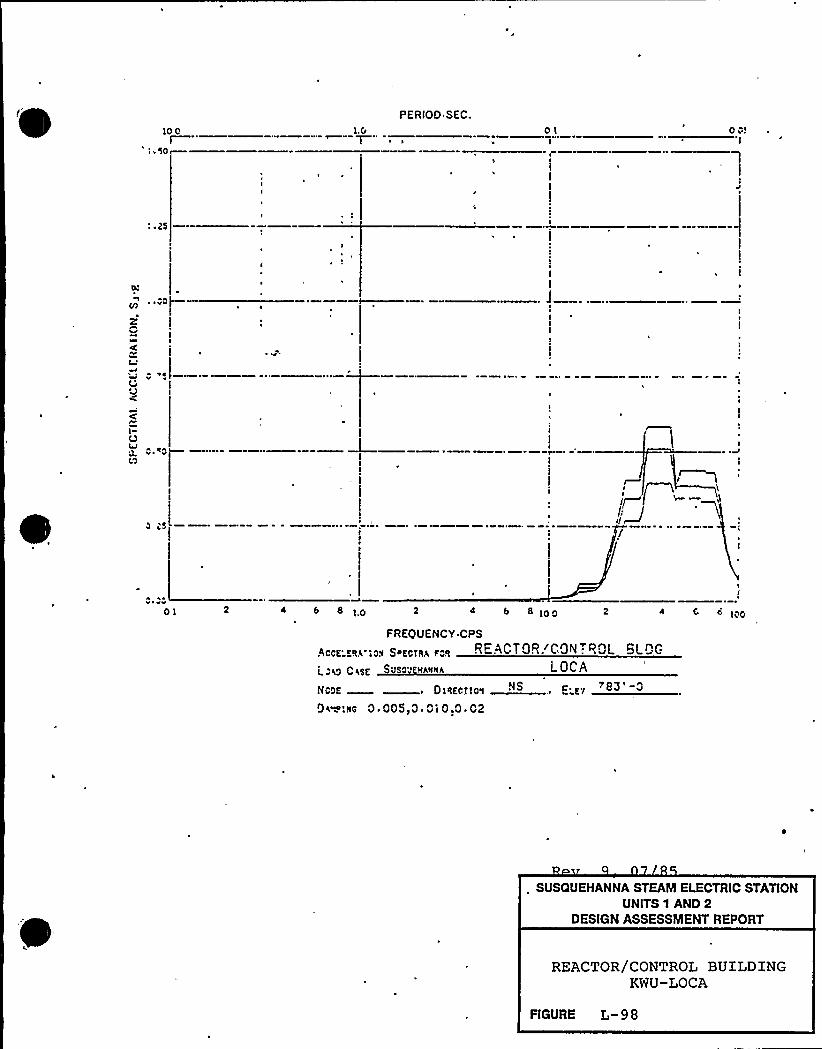
10 0I
r ~ SCI—
r
II
PERIOD SEC.
1.0r
01 0 0!1
25
0
'r cV ~
tg
I l\I
I
l,5
v rrv01 4 6 8 2 4 «1OO 4 6 6 100
FREQUENCY CPS
P„cg .R,-;C„Sage,R, ~0, REACTOR. CONTROL BLDG
g 040 C RSg'o" HhNMA LOCA
NCM r OLRECll0',I '~ 'SNS E.. ~eS -"
9(w: !!e 0. 005,0. 0i 0.0. 02
. SUSQUEHANNA STEAM ELECTRIC STATIONUNITS 1 AND 2
DESIGN ASSESSMENT REPORT
REACTOR/CONTROL BUILDINGKWU-LOCA
FIGURE L-98
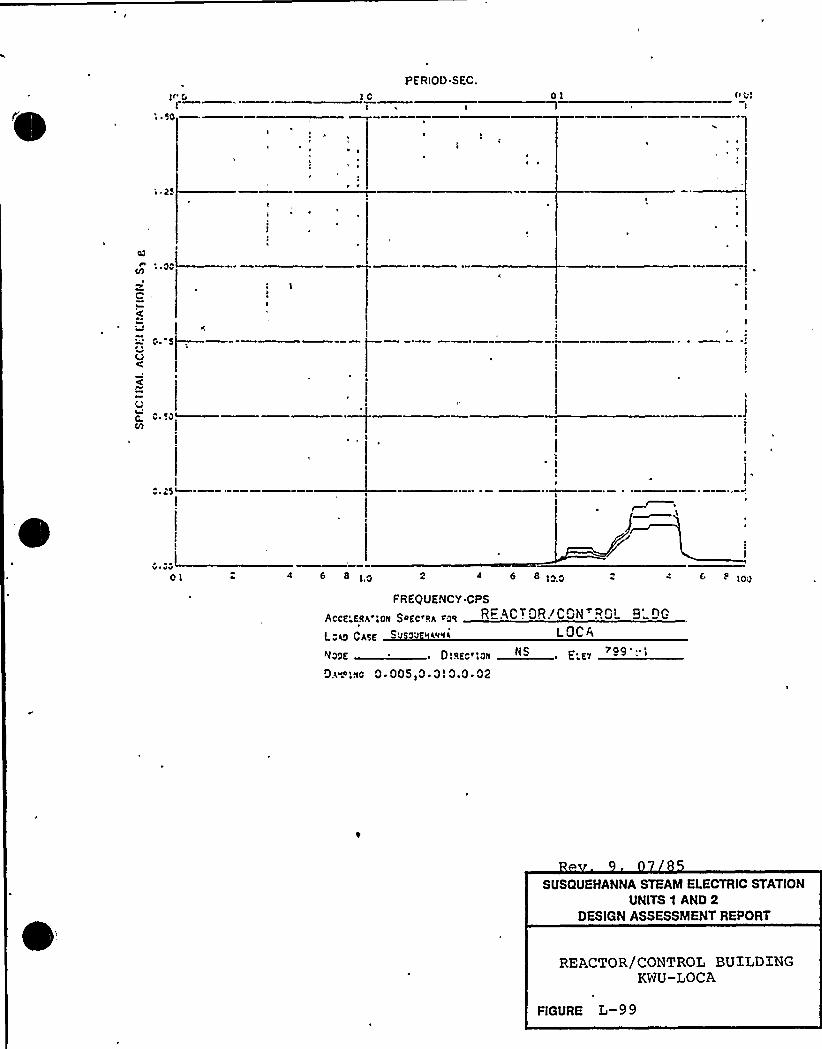
1<'
I: ~ SO
1 ~
loPERIOD SEC.
oll
1=25
I
II
Ol 4 6 81O 2 4 6 8 I'ooFREQUENCY CPS
/ACE'IIA 1orl SOEorIIA iog R .4C . QR. CON '.~ O' C
LoAO CAsf Sv ov RARWA I.OCC
NooE, Q,oEor,oII N$ E., 7gg
OA~4lwo Q.QQ5,Q.QIQ Q n2
SUSQUEHANNA STEAM ELECTRIC STATIONUNITS 1 AND 2
DESIGN ASSESSMENT REPORT
REACTOR/CONTROL BUILDINGKWU-LOCA
FIGURE L-9 9

I
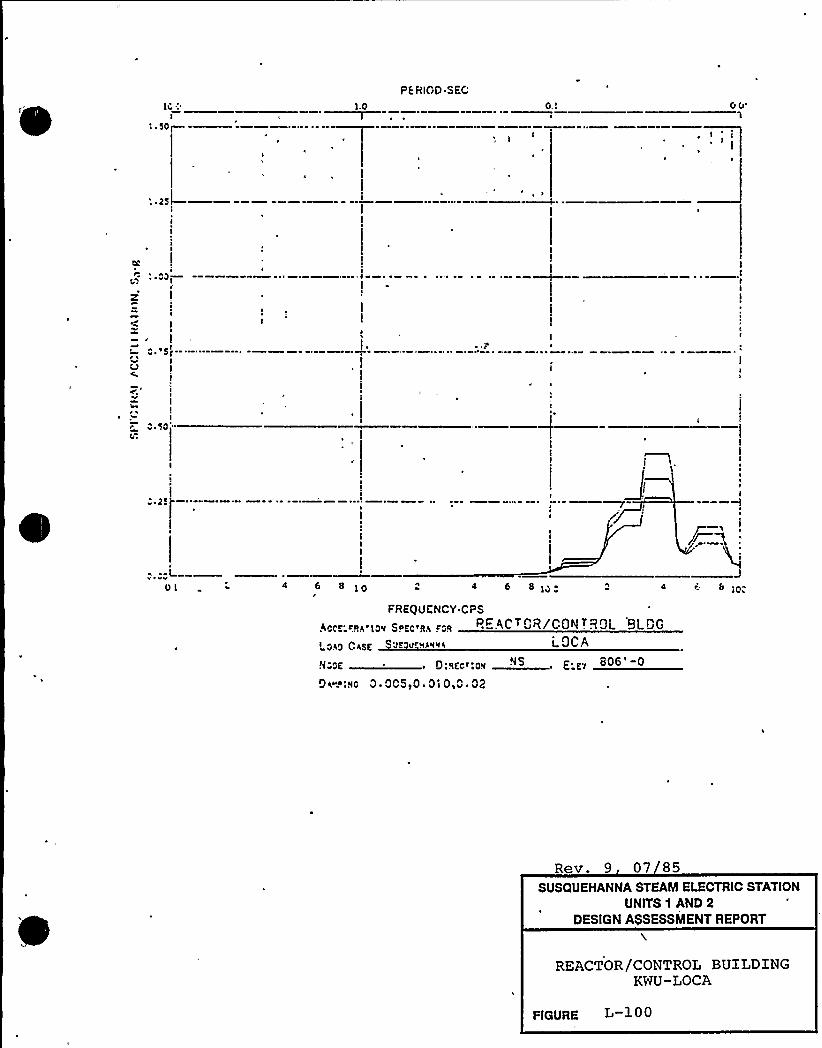
lc;"I
50
1.0
Pt RICO.SECG ~ GG'
c.
z !
I
I
s
t%
I
IIIiI
Ii
/~i'l
4 6 8 4 6 S1v. 4 '. 8
FREQULNCY CPS
egg 1gq 6occ qq c'cq I ~ AC DR/CON . ROL BLDG
GEG CISE cga vrqgqqg i QCA
yegg ~, 0 qgcr cq NS~ E'( 806'
9<~~1<c 0 ~ 005>0 ~ 0i Oi0 02
Rev. 9 07 85SUSQUEHANNA STEAM ELECTRIC STATION
UNITS 1 AND 2DESIGN ASSESSMENT REPORT
REACTOR/CONTROL BUILDINGKWU-LOCA
FIGURE
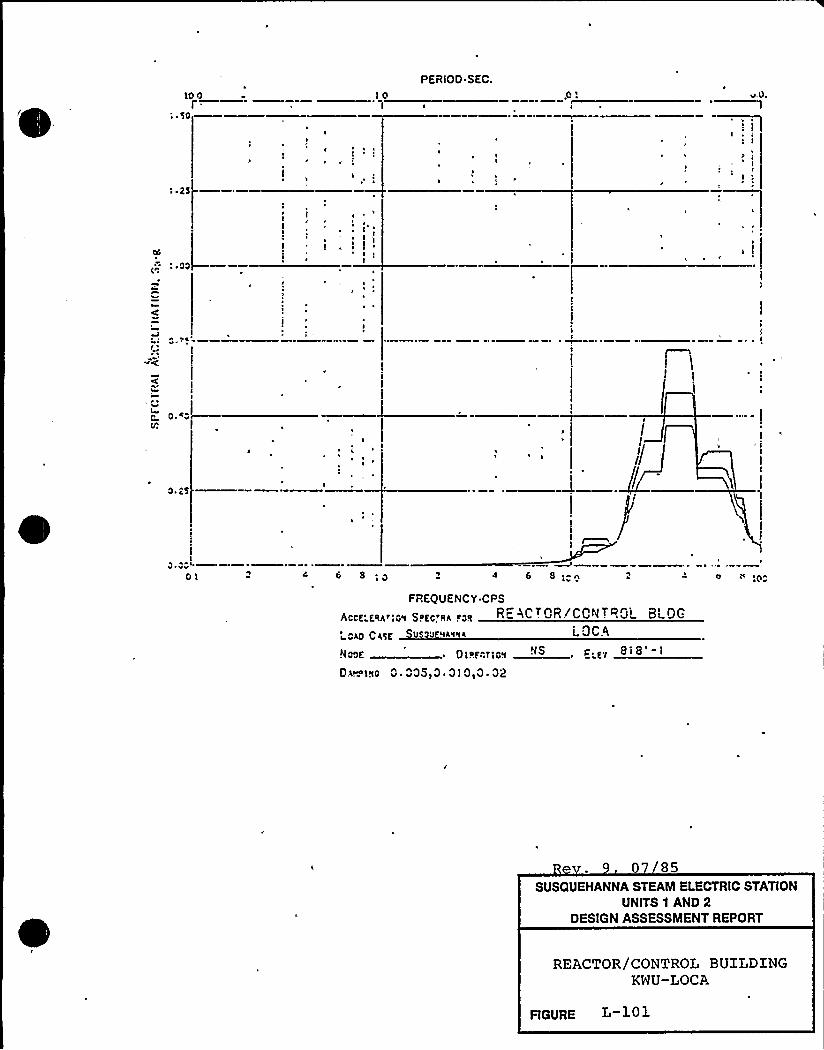
100i.a ~ 'so
PERiOD SEC.
lo'1
v.0
~ ~
lI
I
I~ i ~
~ I~ ',
~I
I ~ ~~
I II
o ~ as
o.ocOr 4 i S 4 6 8;co
FREQUENCY CPS
aces res'.av So,zc'aa ~as R- AC
Lcg) D(qg vsoo vAvvl LOCA
Hone Oi'..rcrrcv NS~ E.cr 818'1
D.v. rvo 0 005,0 ~ 010,0 ~ 02
07 85SUSQUEHANNA STEAM ELECTRIC STATION
UNITS 1 AND 2DESIGN ASSESSMENT REPORT
REACTOR/CONTROL BUXLDXNGKWU-LOCA
FIGURE L-101
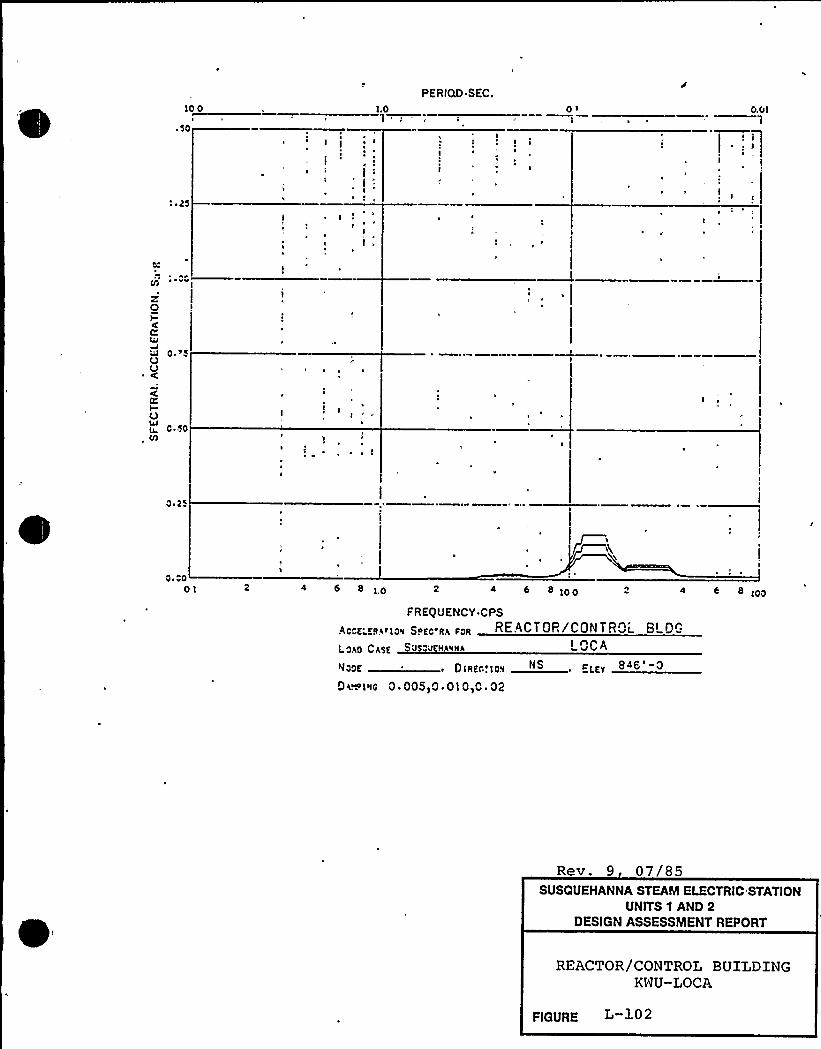
io 0I
~ Sc
i.o
lg C
I -'-„
l I
PERIQD SEC.
I
I I
oc 0.0l'1
Is
II
1
I I ( I
g VV
0C
c.rcUO
Z0:I0~ c..scM
0,2c
0 ~ 00oi 468io 2 8 ioo 4 < ii iO0
FREQUENCY CPS
REACTOR/CONTRO( B'".LgA0 CAJUN $ 05"„0 HA'KNA ~ QC Ai ~C'd
0 iR<r r ice ~ Ci.
Qa.. isc 0. 005 0. 010,0 02
Rev. 9 07/85SUSQUEHANNA STEAM ELECTRIC STATION
UNITS 1 AND 2DESIGN ASSESSMENT REPORT
REACTOR/CONTROL BUILDINGKWU-LOCA
FIGURE L-102
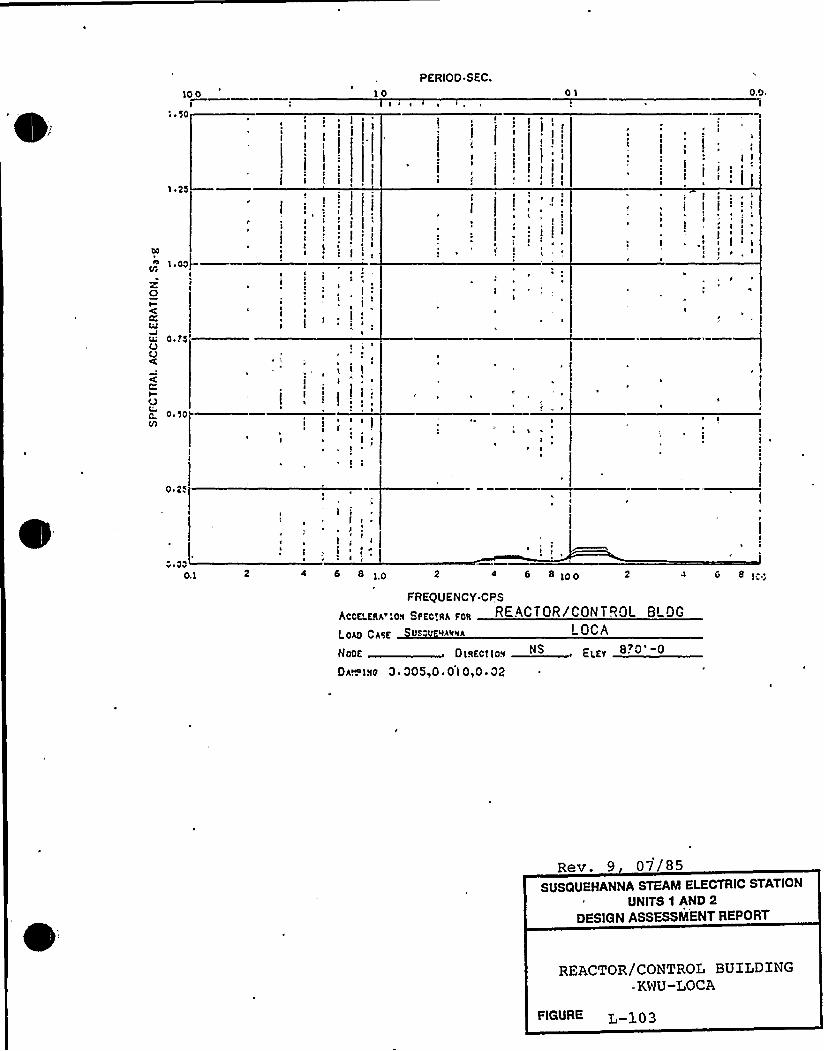
10 0I
To( D
I ~ I
PERIOD SEC.10
I ~ I, l
I
1
I
01 O,o
I!I
liI
j I
I ',: I I
I~ I I I
DI
l I I
I
I * '!
I ~
I
I( I ~ I
1 ~ 00
z0I
0.?0VDJ
I I1~
I1
I
!I- I '
~
I
ICD
0 ~ '10~V)
1 1 1
I !
II I:
DD
i 1
(
I
0 ~ 26
v 'ov
0.1
I II(
II
D
4 6 8 2 4 6 8 Ioo 4 6 8
FREQUENCY CPS
AccKLEijjp;ov SjlzcTgg pop REACTOR/CONTROL B'GCAT6 Su vo we've LOCA
NoDE Dl(D(tl(. I ILD(
Djj~ivo 3 ~ 005,0 'I0,0 '2
Rev. 9, P7/85SUSQUEHANNA STEAM ELECTRIC STATION
UNITS 1 AND 2DESIGN ASSESSMENT REPORT
REACTOR/CONTROL BUILDING=KWU-LOCA
FIGURE L y P 3
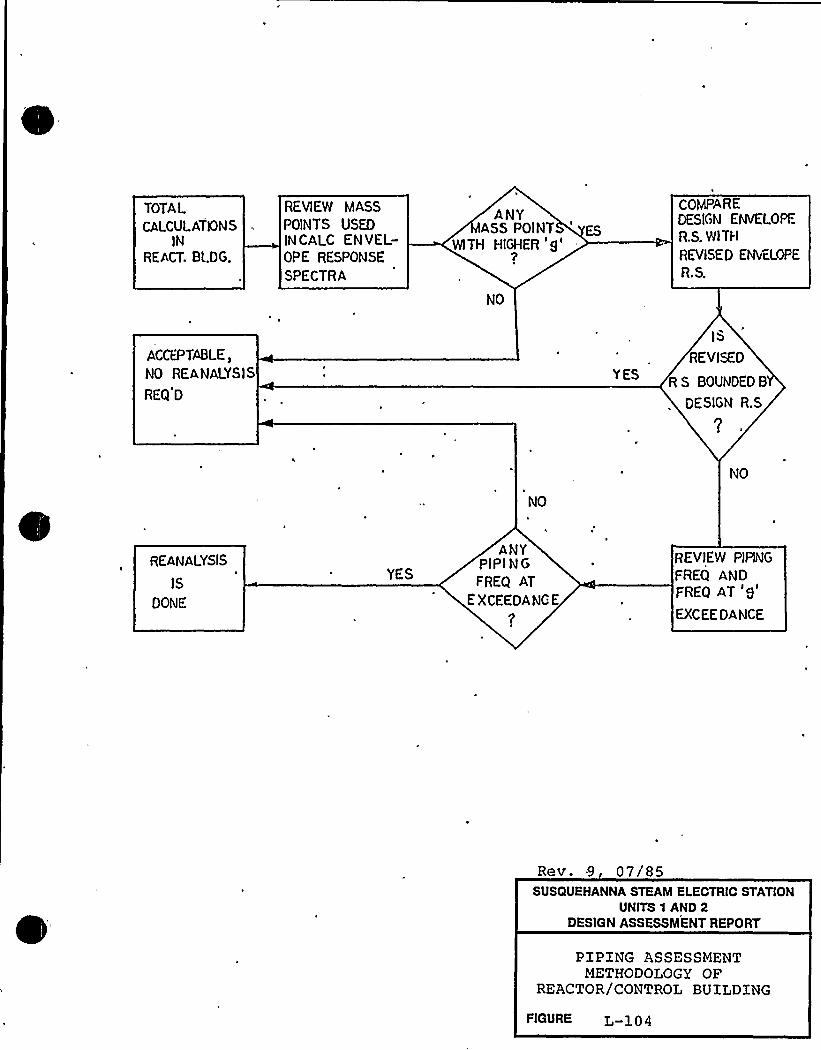
TOTALCALCULATIONS
INREACT. BLDG.
REVIEW MASSPOINTS USEDINCALC ENVEL-OPE RESPONSE
SPECTRA
ANYASS POINT
WITH HIGHER 'g'
COMPAREDESIGN ENVELOPF
R.S. WITI.I
REVISE P ENVELOPE
R.S.
ACCEPTABLE,
NO REANALYSIS
REQ D
YES
IS
REVISED
R S BOUNDED 8
DESIGN R.S
NO
NO
REANALYSIS
IS
DONE
YES
ANYPIPI N G
FREQ AT
E XCEEDANC E
REVIEW PIPING
FREQ ANDFREQ AT '8
EXCEE DANCE
Rev. 9 07/85SUSQUEHANNA STEAM ELECTRIC STATION
UNITS 1 AND 2DESIGN ASSESSMENT REPORT
PIPING ASSESSMENTMETHODOLOGY OF
REACTOR/CONTROL BUILDING
FIGURE L-104
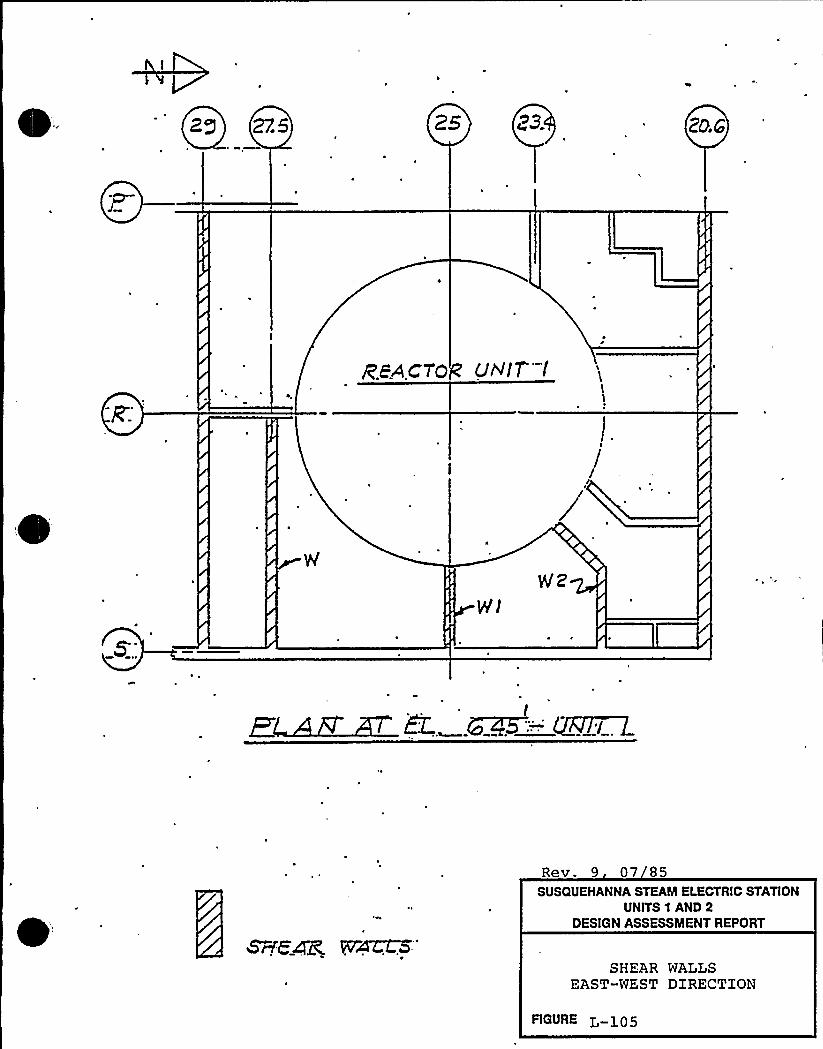
20.G
R.cA.c7'0 UHI7™ 'l
Rev. 9 07 85SUSQUEHANNA STEAM ELECTRIC STATION
UNITS 1 AND 2DESIGN ASSESSMENT REPORT
SHEAR WALLSEAST-WEST DIRECTION
FIGURE L-l05
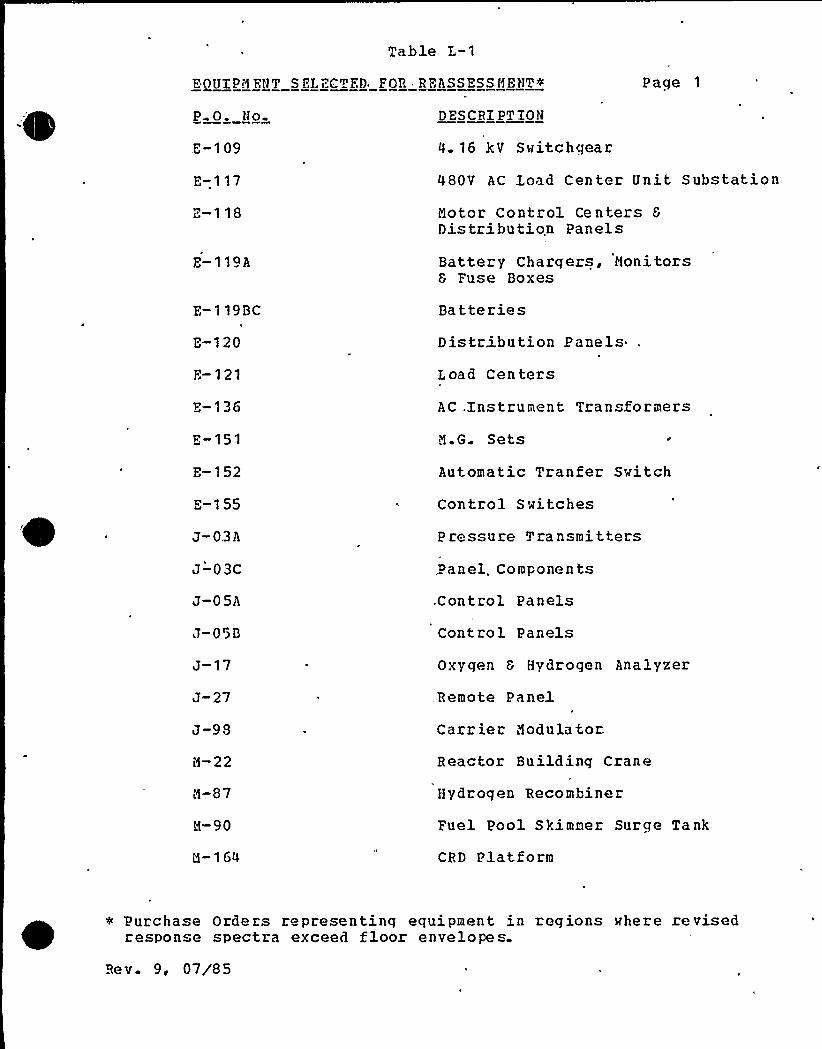
EQUIPM ENT S ELECTED FOR ~ REASSESS ME>tT> Page 1
P O. tlo
.E-1 09
E-1 17
DESCRI PT ION
4. 16 kV Switchqear
480V AC I.oad Center Unit Substation
E-118 Motor Control Centers 6Distribution Panels
E-119A Battery Chazqers, Monitors6 Fuse Boxes
E-1 19BC
E-120
E-121
E-136
E-151
E-152
E-155
J-0.3A
J-03C
J-05A
7-05B
J-17
J-27
J-98
M-22
M-87
M-90
M-164
Batteries
Distribution Panels
L oad Cen ters
AC .Instrument Transformers
M.G. Sets
Automatic Tranfer Switch
Control Switches
Pressure Transmitters
Panel. Components
.Control Panels
Control Panels
Oxygen 6 Hydrogen Analyzer
Remote Pane1
Carr ier Modula tor.
Reactor Building Czane
Hydrogen Recombiner
Fuel Pool Skimmer Surge Tank
CRD Platform
~ 'Purchase Orders representing equipment in regions @here revisedresponse spectra exceed floor envelopes.
Bev. 9, 07/85
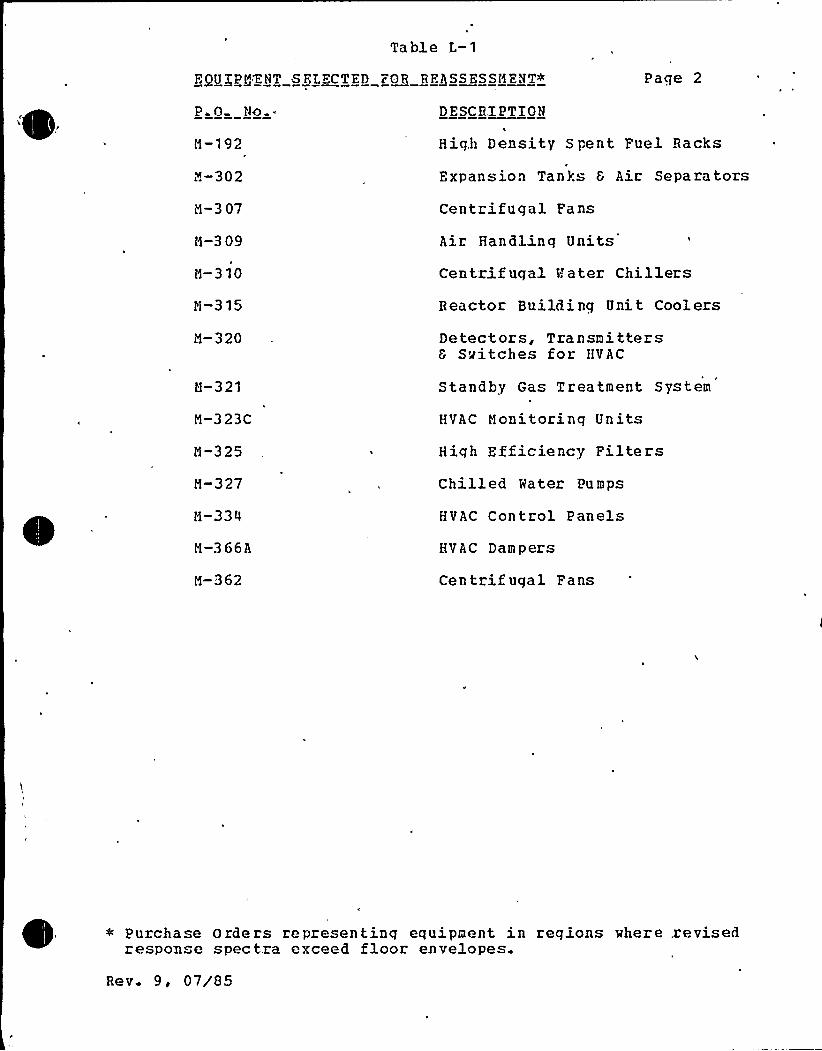
Table L-1
FQU~Pi4'ENT SFLECTED FOR REASSESSMENT< Page 2
P 0 No DESCRY.PTION
M-192
L~-302
M-3 07
M-309
M-310
M-315
M-320
High Density Spent Fuel Racks
E xpans ion Tan l.s 6 Air Sepa ra tors
Centrifugal Fans
Air Handlinq Units
Centrif ugal ! ater ChillersReactor B uilding U ni t Cool ers
Detectors, Transmitters6 Switches for HVAC
M-321
M-323C
M-325
M-327
M-334
M-3 66A
M-362
Standby Gas Treatment System
HVAC Monitorinq Units
Hiqh Efficiency FiltersChilled Water Pu mps
HVAC Control Panels
HVAC Dampers
Centrifugal Fans
Purchase Orders representing equipment in regions where .revisedrespon e spectra exceed floor envelopes.
Rev. 9, 07/85
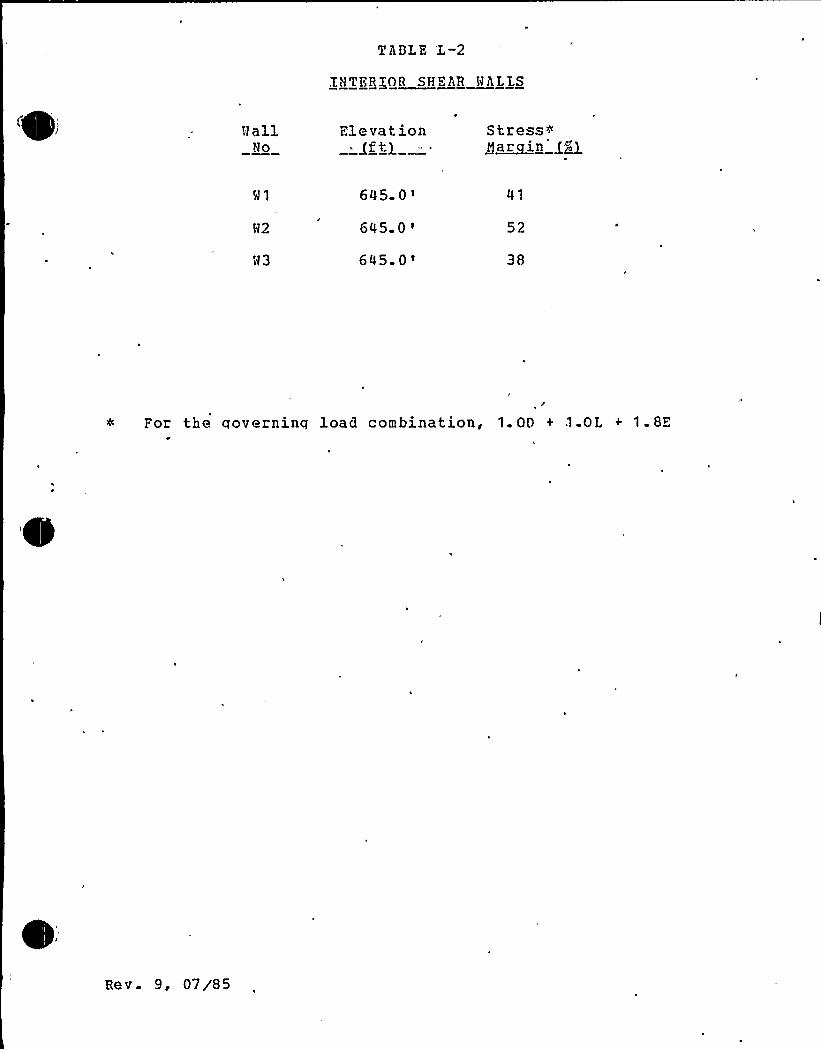
TABLE 'L-2
INTERIOR SHEAR HALLS
»allNo
Elevation Stress~H~ar in '~~
H2
N3
6450'45.0
>
6450'152
For the aoverninq loaQ combination, 1.00 + .1.0L + 1.8K
Re v 9, 07/85

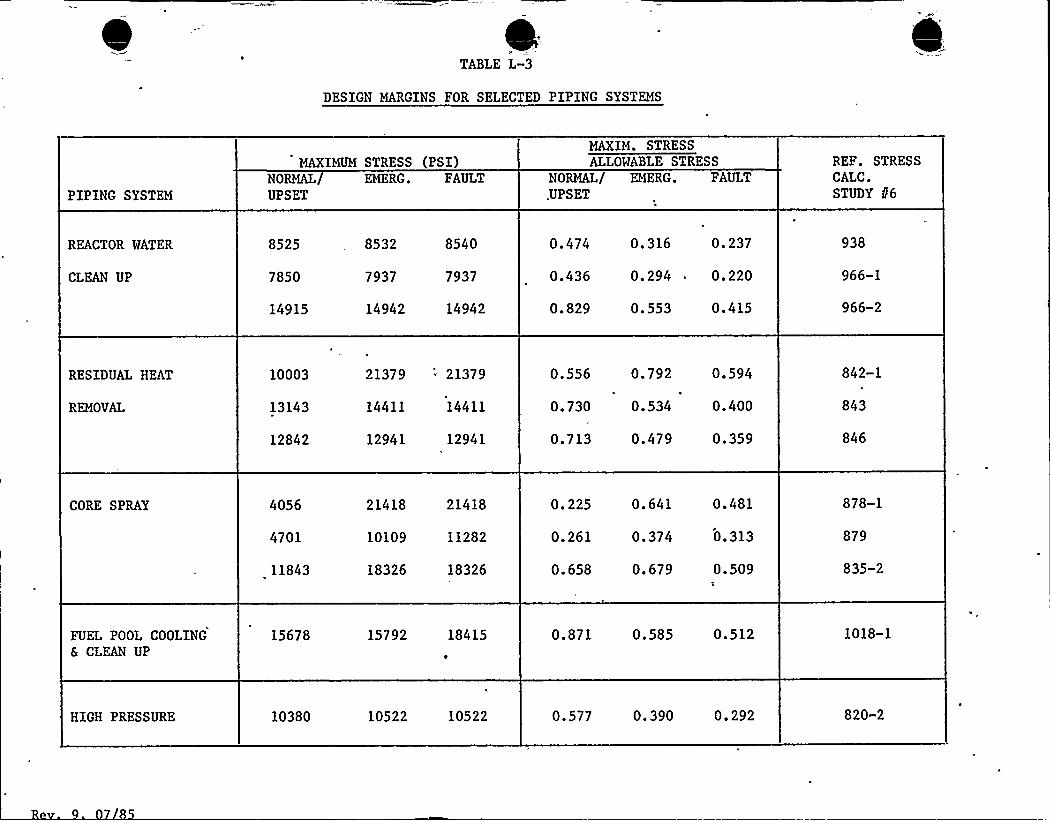
TABLE L-3
DESIGN MARGINS FOR SELECTED PIPING SYSTEMS
PIPING SYSTEMNORMAL/UPSET
EMERG. FAULTMAXIMUM STRESS (PSI)
MAXIM. STRESSALLOWABLE STRESS
NORMAL/ EMERG. FAULT.UPSET
REF. STRESSCALC.STUDY f/6
REACTOR WATER
CLEAN UP
8525
7850
14915
8532 8540
7937 7937
14942 14942
0.474
0.436
0.829
0.316 0.237
0.294 0.220
0.553 0.415
938
966-1
966-2
RESIDUAL HEAT
REMOVAL
10003
13143
12842
21379 " 21379
14411 14411
12941 12941
0.556 0.792 0.594
0.730 0.534 0.400
0.713 0.479 0.359
842-1
843
846
CORE SPRAY 4056
4701
11843
21418 21418
10109 11282
18326 18326
0. 225
0. 261
0. 658
0.641 0.481
0.374 0.313
0.679 0.509
878-1
879
835-2
FUEL POOL COOLING6 CLEAN UP
15678 15792 18415 0.871 0.585 0.512 1018-1
HIGH PRESSURE 10380 10522 10522 0.577 0.390 0.292 820-2