Embed Size (px)
Citation preview

Table of Contents
UNITED STATESSECURITIES AND EXCHANGE COMMISSION
Washington, D.C. 20549
FORM 10-Q
(Mark One)☑ QUARTERLY REPORT PURSUANT TO SECTION 13 OR 15(d) OF THE SECURITIES EXCHANGE ACT OF 1934
For the quarterly period ended August 2, 2008
OR o TRANSITION REPORT PURSUANT TO SECTION 13 OR 15(d) OF THE SECURITIES EXCHANGE ACT OF 1934
For the transition period from to
Commission file number 001-15059
NORDSTROM, INC.(Exact name of Registrant as specified in its charter)
Washington 91-0515058
(State or other jurisdiction of (IRS employerincorporation or organization) Identification No.)
1617 Sixth Avenue, Seattle, Washington 98101
(Address of principal executive offices) (Zip code)
206-628-2111(Registrant’s telephone number, including area code)
Indicate by check mark whether the Registrant (1) has filed all reports required to be filed by Section 13 or 15(d) of the Securities Exchange Act of 1934during the preceding 12 months (or for such shorter period that the Registrant was required to file such reports), and (2) has been subject to such filingrequirements for the past 90 days.YES ☑ NO o
Indicate by check mark whether the registrant is a large accelerated filer, an accelerated filer, a non-accelerated filer, or a smaller reporting company. See thedefinitions of “large accelerated filer,” “accelerated filer” and “smaller reporting company” in Rule 12b-2 of the Exchange Act. (Check one):Large accelerated filer ☑ Accelerated filer oNon-accelerated filer o (Do not check if a smaller reporting company) Smaller reporting company o
Indicate by check mark whether the registrant is a shell company (as defined in Rule 12b-2 of the Exchange Act).YES o NO ☑
Common stock outstanding as of August 30, 2008: 215,512,113 shares of common stock
NORDSTROM, INC. AND SUBSIDIARIESTABLE OF CONTENTS
PagePART I – FINANCIAL INFORMATION Item 1. Financial Statements (Unaudited)
Condensed Consolidated Statements of Earnings Quarter and Six Months Ended August 2, 2008 and August 4, 2007 3
Condensed Consolidated Balance Sheets August 2, 2008, February 2, 2008 and August 4, 2007 4
Condensed Consolidated Statements of Shareholders’ Equity Six Months Ended August 2, 2008 and August 4, 2007 5
Condensed Consolidated Statements of Cash Flows Six Months Ended August 2, 2008 and August 4, 2007 6
Notes to Condensed Consolidated Financial Statements 7 Item 2. Management’s Discussion and Analysis of Financial Condition and Results of Operations 16 Item 3. Quantitative and Qualitative Disclosures About Market Risk 28 Item 4. Controls and Procedures 28 PART II – OTHER INFORMATION Item 1A. Risk Factors. 29 Item 2. Unregistered Sales of Equity Securities and Use of Proceeds. 29 Item 4. Submission of Matters to a Vote of Security Holders. 29 Item 6. Exhibits. 30 SIGNATURES 31 INDEX TO EXHIBITS 32 EXHIBIT 10.1 EXHIBIT 31.1 EXHIBIT 31.2 EXHIBIT 32.1
2 of 32
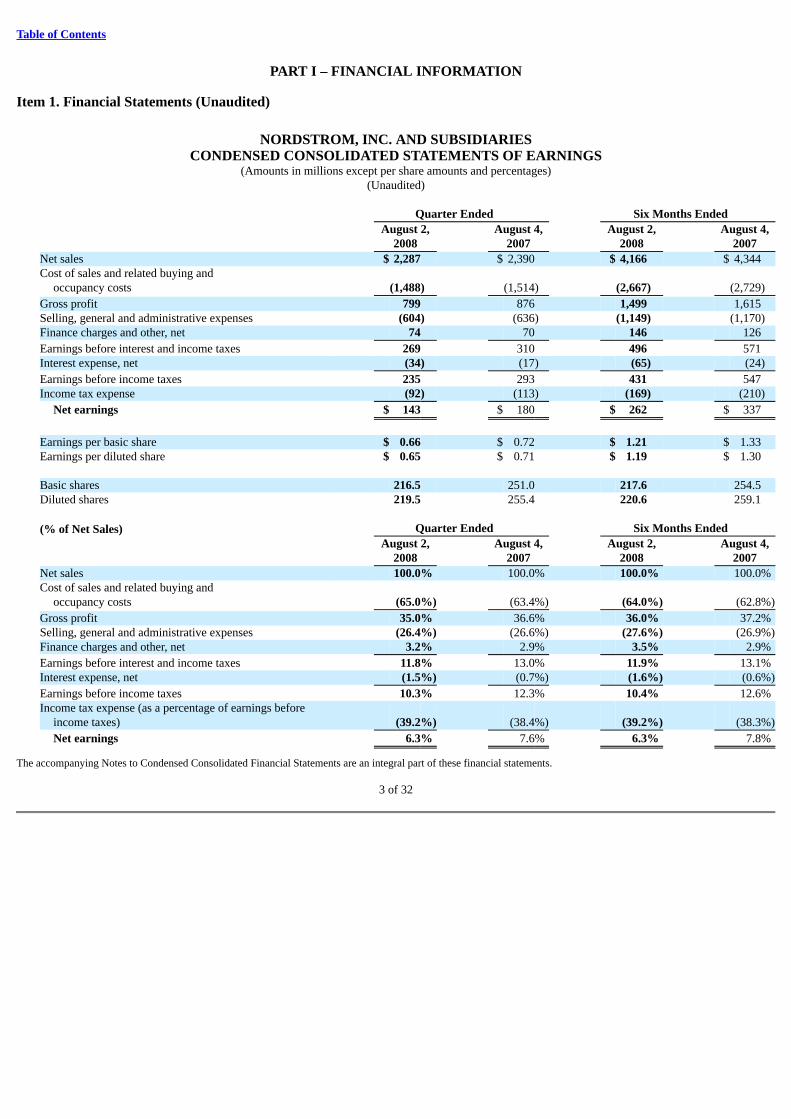
Table of Contents
PART I – FINANCIAL INFORMATION
Item 1. Financial Statements (Unaudited)
NORDSTROM, INC. AND SUBSIDIARIESCONDENSED CONSOLIDATED STATEMENTS OF EARNINGS
(Amounts in millions except per share amounts and percentages)(Unaudited)
Quarter Ended Six Months Ended August 2, August 4, August 2, August 4, 2008 2007 2008 2007Net sales $ 2,287 $ 2,390 $ 4,166 $ 4,344 Cost of sales and related buying and
occupancy costs (1,488) (1,514) (2,667) (2,729)
Gross profit 799 876 1,499 1,615 Selling, general and administrative expenses (604) (636) (1,149) (1,170)Finance charges and other, net 74 70 146 126
Earnings before interest and income taxes 269 310 496 571 Interest expense, net (34) (17) (65) (24)
Earnings before income taxes 235 293 431 547 Income tax expense (92) (113) (169) (210)
Net earnings $ 143 $ 180 $ 262 $ 337
Earnings per basic share $ 0.66 $ 0.72 $ 1.21 $ 1.33 Earnings per diluted share $ 0.65 $ 0.71 $ 1.19 $ 1.30 Basic shares 216.5 251.0 217.6 254.5 Diluted shares 219.5 255.4 220.6 259.1 (% of Net Sales) Quarter Ended Six Months Ended August 2, August 4, August 2, August 4, 2008 2007 2008 2007Net sales 100.0% 100.0% 100.0% 100.0%Cost of sales and related buying and
occupancy costs (65.0%) (63.4%) (64.0%) (62.8%)
Gross profit 35.0% 36.6% 36.0% 37.2%Selling, general and administrative expenses (26.4%) (26.6%) (27.6%) (26.9%)Finance charges and other, net 3.2% 2.9% 3.5% 2.9%
Earnings before interest and income taxes 11.8% 13.0% 11.9% 13.1%Interest expense, net (1.5%) (0.7%) (1.6%) (0.6%)
Earnings before income taxes 10.3% 12.3% 10.4% 12.6%Income tax expense (as a percentage of earnings before
income taxes) (39.2%) (38.4%) (39.2%) (38.3%)
Net earnings 6.3% 7.6% 6.3% 7.8%
The accompanying Notes to Condensed Consolidated Financial Statements are an integral part of these financial statements.
3 of 32
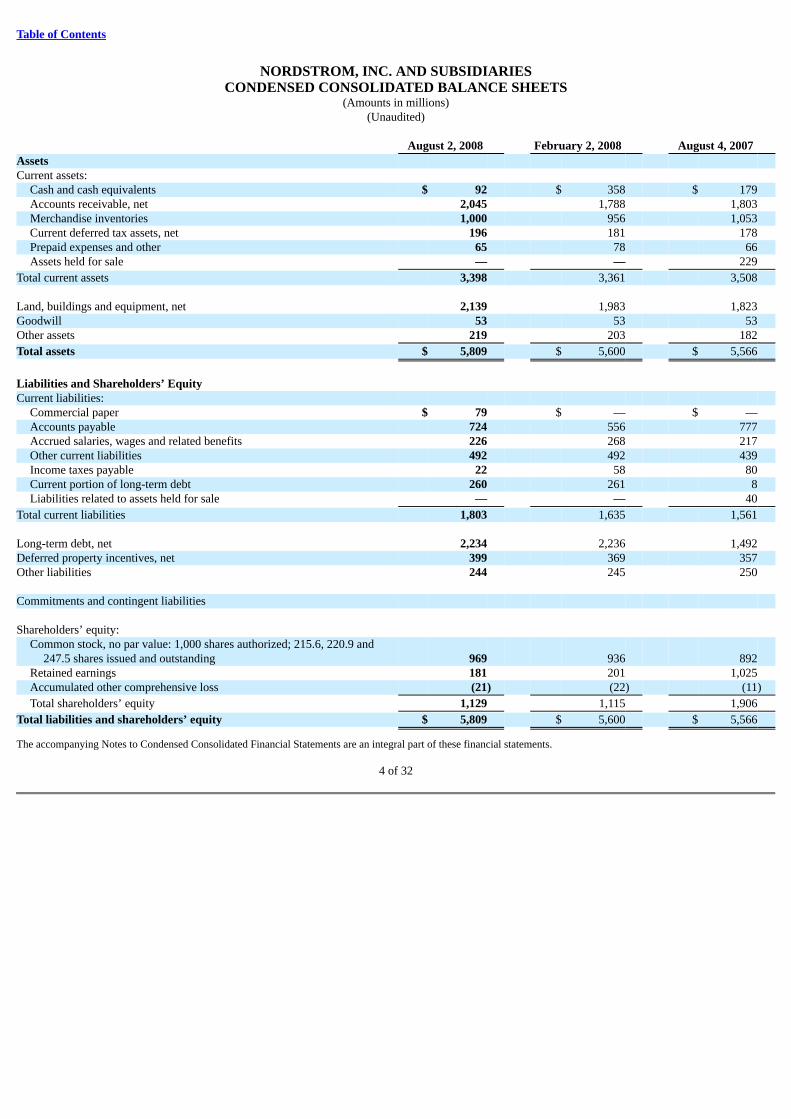
Table of Contents
NORDSTROM, INC. AND SUBSIDIARIESCONDENSED CONSOLIDATED BALANCE SHEETS
(Amounts in millions)(Unaudited)
August 2, 2008 February 2, 2008 August 4, 2007 Assets Current assets:
Cash and cash equivalents $ 92 $ 358 $ 179 Accounts receivable, net 2,045 1,788 1,803 Merchandise inventories 1,000 956 1,053 Current deferred tax assets, net 196 181 178 Prepaid expenses and other 65 78 66 Assets held for sale — — 229
Total current assets 3,398 3,361 3,508 Land, buildings and equipment, net 2,139 1,983 1,823 Goodwill 53 53 53 Other assets 219 203 182
Total assets $ 5,809 $ 5,600 $ 5,566
Liabilities and Shareholders’ Equity Current liabilities:
Commercial paper $ 79 $ — $ — Accounts payable 724 556 777 Accrued salaries, wages and related benefits 226 268 217 Other current liabilities 492 492 439 Income taxes payable 22 58 80 Current portion of long-term debt 260 261 8 Liabilities related to assets held for sale — — 40
Total current liabilities 1,803 1,635 1,561 Long-term debt, net 2,234 2,236 1,492 Deferred property incentives, net 399 369 357 Other liabilities 244 245 250 Commitments and contingent liabilities Shareholders’ equity:
Common stock, no par value: 1,000 shares authorized; 215.6, 220.9 and247.5 shares issued and outstanding 969 936 892
Retained earnings 181 201 1,025 Accumulated other comprehensive loss (21) (22) (11)
Total shareholders’ equity 1,129 1,115 1,906
Total liabilities and shareholders’ equity $ 5,809 $ 5,600 $ 5,566
The accompanying Notes to Condensed Consolidated Financial Statements are an integral part of these financial statements.
4 of 32
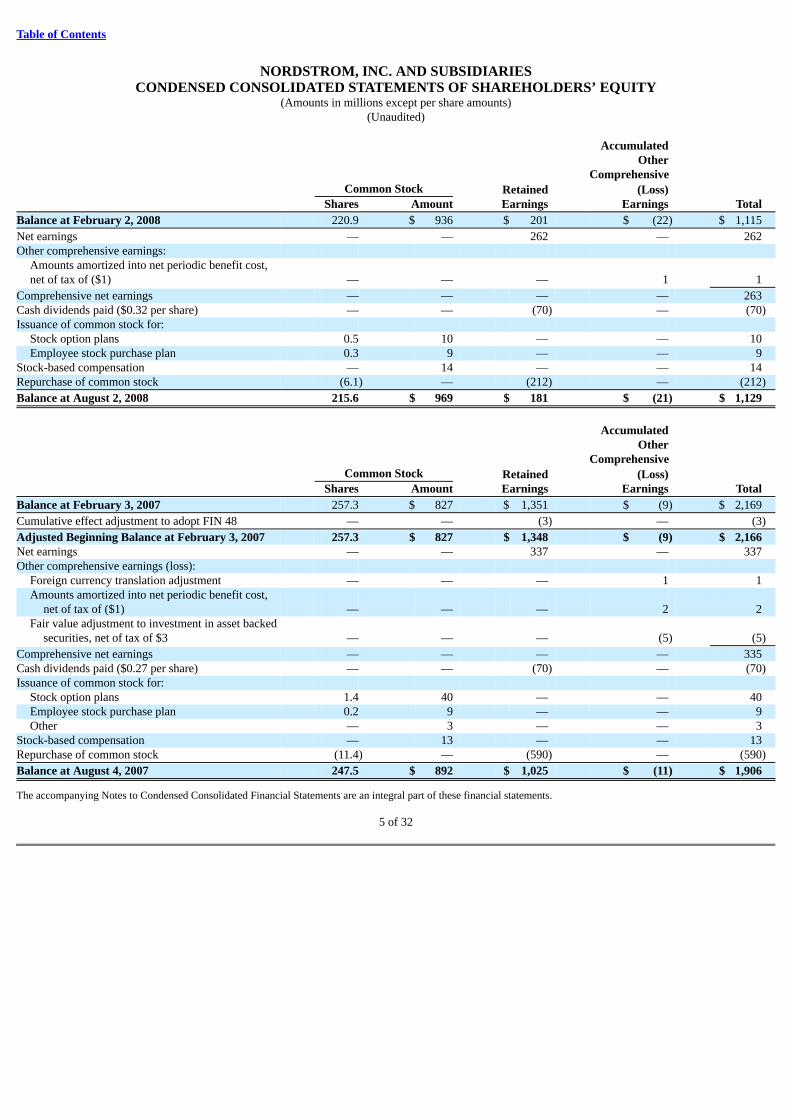
Table of Contents
NORDSTROM, INC. AND SUBSIDIARIESCONDENSED CONSOLIDATED STATEMENTS OF SHAREHOLDERS’ EQUITY
(Amounts in millions except per share amounts)(Unaudited)
Accumulated Other Comprehensive Common Stock Retained (Loss) Shares Amount Earnings Earnings Total
Balance at February 2, 2008 220.9 $ 936 $ 201 $ (22) $ 1,115
Net earnings — — 262 — 262 Other comprehensive earnings:
Amounts amortized into net periodic benefit cost,net of tax of ($1) — — — 1 1
Comprehensive net earnings — — — — 263 Cash dividends paid ($0.32 per share) — — (70) — (70)Issuance of common stock for:
Stock option plans 0.5 10 — — 10 Employee stock purchase plan 0.3 9 — — 9
Stock-based compensation — 14 — — 14 Repurchase of common stock (6.1) — (212) — (212)
Balance at August 2, 2008 215.6 $ 969 $ 181 $ (21) $ 1,129
Accumulated Other Comprehensive Common Stock Retained (Loss) Shares Amount Earnings Earnings Total
Balance at February 3, 2007 257.3 $ 827 $ 1,351 $ (9) $ 2,169
Cumulative effect adjustment to adopt FIN 48 — — (3) — (3)
Adjusted Beginning Balance at February 3, 2007 257.3 $ 827 $ 1,348 $ (9) $ 2,166 Net earnings — — 337 — 337 Other comprehensive earnings (loss):
Foreign currency translation adjustment — — — 1 1 Amounts amortized into net periodic benefit cost,
net of tax of ($1) — — — 2 2 Fair value adjustment to investment in asset backed
securities, net of tax of $3 — — — (5) (5)
Comprehensive net earnings — — — — 335 Cash dividends paid ($0.27 per share) — — (70) — (70)Issuance of common stock for:
Stock option plans 1.4 40 — — 40 Employee stock purchase plan 0.2 9 — — 9 Other — 3 — — 3
Stock-based compensation — 13 — — 13 Repurchase of common stock (11.4) — (590) — (590)
Balance at August 4, 2007 247.5 $ 892 $ 1,025 $ (11) $ 1,906
The accompanying Notes to Condensed Consolidated Financial Statements are an integral part of these financial statements.
5 of 32
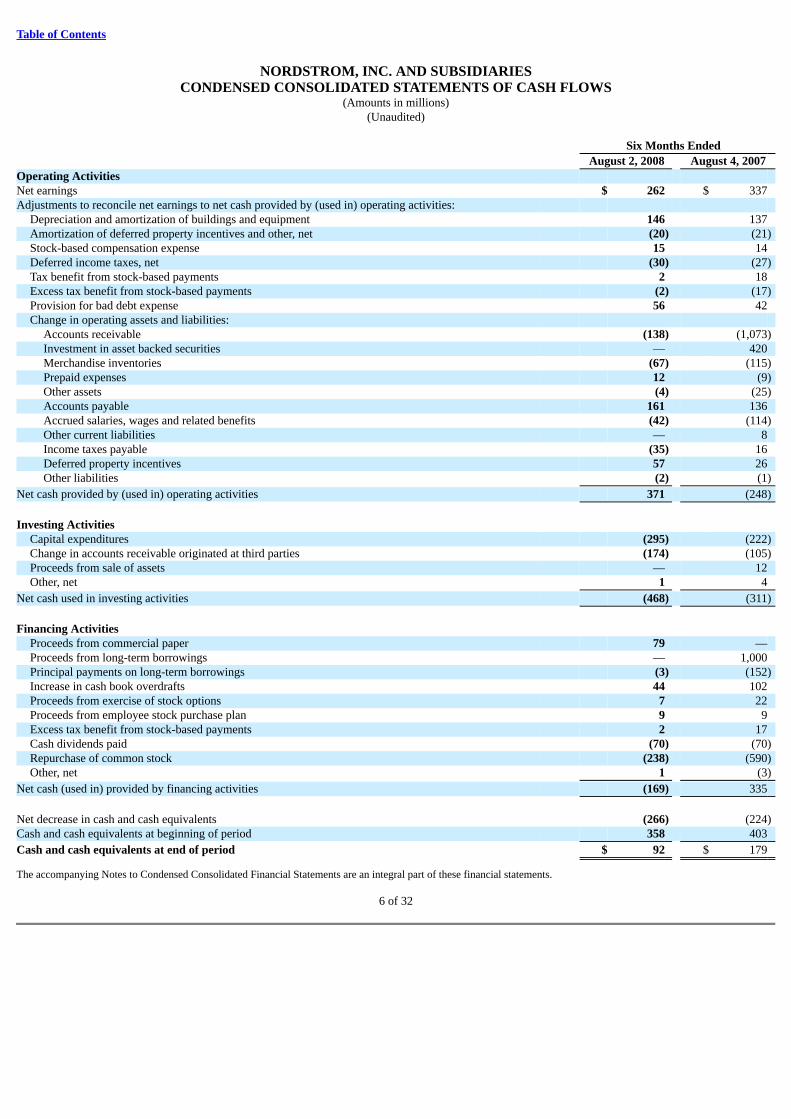
Table of Contents
NORDSTROM, INC. AND SUBSIDIARIESCONDENSED CONSOLIDATED STATEMENTS OF CASH FLOWS
(Amounts in millions)(Unaudited)
Six Months Ended August 2, 2008 August 4, 2007 Operating Activities Net earnings $ 262 $ 337 Adjustments to reconcile net earnings to net cash provided by (used in) operating activities:
Depreciation and amortization of buildings and equipment 146 137 Amortization of deferred property incentives and other, net (20) (21)Stock-based compensation expense 15 14 Deferred income taxes, net (30) (27)Tax benefit from stock-based payments 2 18 Excess tax benefit from stock-based payments (2) (17)Provision for bad debt expense 56 42 Change in operating assets and liabilities:
Accounts receivable (138) (1,073)Investment in asset backed securities — 420 Merchandise inventories (67) (115)Prepaid expenses 12 (9)Other assets (4) (25)Accounts payable 161 136 Accrued salaries, wages and related benefits (42) (114)Other current liabilities — 8 Income taxes payable (35) 16 Deferred property incentives 57 26 Other liabilities (2) (1)
Net cash provided by (used in) operating activities 371 (248)
Investing Activities
Capital expenditures (295) (222)Change in accounts receivable originated at third parties (174) (105)Proceeds from sale of assets — 12 Other, net 1 4
Net cash used in investing activities (468) (311)
Financing Activities
Proceeds from commercial paper 79 — Proceeds from long-term borrowings — 1,000 Principal payments on long-term borrowings (3) (152)Increase in cash book overdrafts 44 102 Proceeds from exercise of stock options 7 22 Proceeds from employee stock purchase plan 9 9 Excess tax benefit from stock-based payments 2 17 Cash dividends paid (70) (70)Repurchase of common stock (238) (590)Other, net 1 (3)
Net cash (used in) provided by financing activities (169) 335
Net decrease in cash and cash equivalents (266) (224)Cash and cash equivalents at beginning of period 358 403
Cash and cash equivalents at end of period $ 92 $ 179
The accompanying Notes to Condensed Consolidated Financial Statements are an integral part of these financial statements.
6 of 32
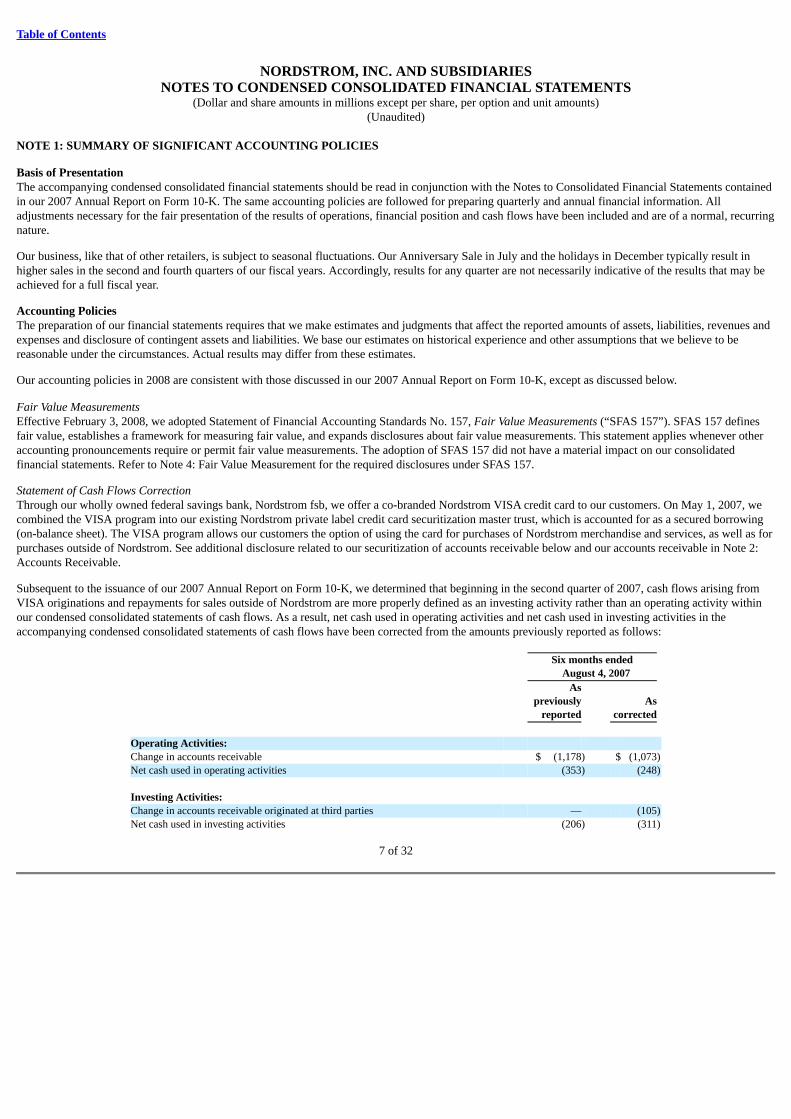
Table of Contents
NORDSTROM, INC. AND SUBSIDIARIESNOTES TO CONDENSED CONSOLIDATED FINANCIAL STATEMENTS
(Dollar and share amounts in millions except per share, per option and unit amounts)(Unaudited)
NOTE 1: SUMMARY OF SIGNIFICANT ACCOUNTING POLICIES
Basis of PresentationThe accompanying condensed consolidated financial statements should be read in conjunction with the Notes to Consolidated Financial Statements containedin our 2007 Annual Report on Form 10-K. The same accounting policies are followed for preparing quarterly and annual financial information. Alladjustments necessary for the fair presentation of the results of operations, financial position and cash flows have been included and are of a normal, recurringnature.
Our business, like that of other retailers, is subject to seasonal fluctuations. Our Anniversary Sale in July and the holidays in December typically result inhigher sales in the second and fourth quarters of our fiscal years. Accordingly, results for any quarter are not necessarily indicative of the results that may beachieved for a full fiscal year.
Accounting PoliciesThe preparation of our financial statements requires that we make estimates and judgments that affect the reported amounts of assets, liabilities, revenues andexpenses and disclosure of contingent assets and liabilities. We base our estimates on historical experience and other assumptions that we believe to bereasonable under the circumstances. Actual results may differ from these estimates.
Our accounting policies in 2008 are consistent with those discussed in our 2007 Annual Report on Form 10-K, except as discussed below.
Fair Value MeasurementsEffective February 3, 2008, we adopted Statement of Financial Accounting Standards No. 157, Fair Value Measurements (“SFAS 157”). SFAS 157 definesfair value, establishes a framework for measuring fair value, and expands disclosures about fair value measurements. This statement applies whenever otheraccounting pronouncements require or permit fair value measurements. The adoption of SFAS 157 did not have a material impact on our consolidatedfinancial statements. Refer to Note 4: Fair Value Measurement for the required disclosures under SFAS 157.
Statement of Cash Flows CorrectionThrough our wholly owned federal savings bank, Nordstrom fsb, we offer a co-branded Nordstrom VISA credit card to our customers. On May 1, 2007, wecombined the VISA program into our existing Nordstrom private label credit card securitization master trust, which is accounted for as a secured borrowing(on-balance sheet). The VISA program allows our customers the option of using the card for purchases of Nordstrom merchandise and services, as well as forpurchases outside of Nordstrom. See additional disclosure related to our securitization of accounts receivable below and our accounts receivable in Note 2:Accounts Receivable.
Subsequent to the issuance of our 2007 Annual Report on Form 10-K, we determined that beginning in the second quarter of 2007, cash flows arising fromVISA originations and repayments for sales outside of Nordstrom are more properly defined as an investing activity rather than an operating activity withinour condensed consolidated statements of cash flows. As a result, net cash used in operating activities and net cash used in investing activities in theaccompanying condensed consolidated statements of cash flows have been corrected from the amounts previously reported as follows:
Six months ended August 4, 2007 As previously As reported corrected Operating Activities: Change in accounts receivable $ (1,178) $ (1,073)Net cash used in operating activities (353) (248) Investing Activities: Change in accounts receivable originated at third parties — (105)Net cash used in investing activities (206) (311)
7 of 32
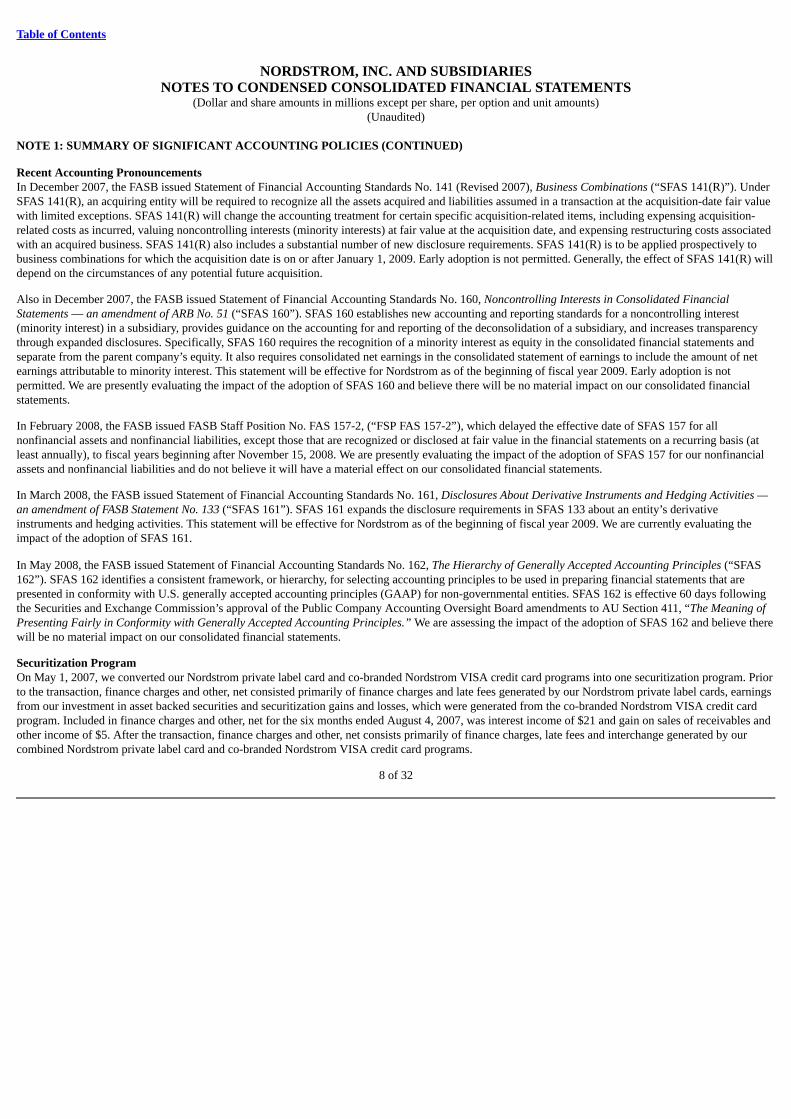
Table of Contents
NORDSTROM, INC. AND SUBSIDIARIESNOTES TO CONDENSED CONSOLIDATED FINANCIAL STATEMENTS
(Dollar and share amounts in millions except per share, per option and unit amounts)(Unaudited)
NOTE 1: SUMMARY OF SIGNIFICANT ACCOUNTING POLICIES (CONTINUED)
Recent Accounting PronouncementsIn December 2007, the FASB issued Statement of Financial Accounting Standards No. 141 (Revised 2007), Business Combinations (“SFAS 141(R)”). UnderSFAS 141(R), an acquiring entity will be required to recognize all the assets acquired and liabilities assumed in a transaction at the acquisition-date fair valuewith limited exceptions. SFAS 141(R) will change the accounting treatment for certain specific acquisition-related items, including expensing acquisition-related costs as incurred, valuing noncontrolling interests (minority interests) at fair value at the acquisition date, and expensing restructuring costs associatedwith an acquired business. SFAS 141(R) also includes a substantial number of new disclosure requirements. SFAS 141(R) is to be applied prospectively tobusiness combinations for which the acquisition date is on or after January 1, 2009. Early adoption is not permitted. Generally, the effect of SFAS 141(R) willdepend on the circumstances of any potential future acquisition.
Also in December 2007, the FASB issued Statement of Financial Accounting Standards No. 160, Noncontrolling Interests in Consolidated FinancialStatements — an amendment of ARB No. 51 (“SFAS 160”). SFAS 160 establishes new accounting and reporting standards for a noncontrolling interest(minority interest) in a subsidiary, provides guidance on the accounting for and reporting of the deconsolidation of a subsidiary, and increases transparencythrough expanded disclosures. Specifically, SFAS 160 requires the recognition of a minority interest as equity in the consolidated financial statements andseparate from the parent company’s equity. It also requires consolidated net earnings in the consolidated statement of earnings to include the amount of netearnings attributable to minority interest. This statement will be effective for Nordstrom as of the beginning of fiscal year 2009. Early adoption is notpermitted. We are presently evaluating the impact of the adoption of SFAS 160 and believe there will be no material impact on our consolidated financialstatements.
In February 2008, the FASB issued FASB Staff Position No. FAS 157-2, (“FSP FAS 157-2”), which delayed the effective date of SFAS 157 for allnonfinancial assets and nonfinancial liabilities, except those that are recognized or disclosed at fair value in the financial statements on a recurring basis (atleast annually), to fiscal years beginning after November 15, 2008. We are presently evaluating the impact of the adoption of SFAS 157 for our nonfinancialassets and nonfinancial liabilities and do not believe it will have a material effect on our consolidated financial statements.
In March 2008, the FASB issued Statement of Financial Accounting Standards No. 161, Disclosures About Derivative Instruments and Hedging Activities —an amendment of FASB Statement No. 133 (“SFAS 161”). SFAS 161 expands the disclosure requirements in SFAS 133 about an entity’s derivativeinstruments and hedging activities. This statement will be effective for Nordstrom as of the beginning of fiscal year 2009. We are currently evaluating theimpact of the adoption of SFAS 161.
In May 2008, the FASB issued Statement of Financial Accounting Standards No. 162, The Hierarchy of Generally Accepted Accounting Principles (“SFAS162”). SFAS 162 identifies a consistent framework, or hierarchy, for selecting accounting principles to be used in preparing financial statements that arepresented in conformity with U.S. generally accepted accounting principles (GAAP) for non-governmental entities. SFAS 162 is effective 60 days followingthe Securities and Exchange Commission’s approval of the Public Company Accounting Oversight Board amendments to AU Section 411, “The Meaning ofPresenting Fairly in Conformity with Generally Accepted Accounting Principles.” We are assessing the impact of the adoption of SFAS 162 and believe therewill be no material impact on our consolidated financial statements.
Securitization ProgramOn May 1, 2007, we converted our Nordstrom private label card and co-branded Nordstrom VISA credit card programs into one securitization program. Priorto the transaction, finance charges and other, net consisted primarily of finance charges and late fees generated by our Nordstrom private label cards, earningsfrom our investment in asset backed securities and securitization gains and losses, which were generated from the co-branded Nordstrom VISA credit cardprogram. Included in finance charges and other, net for the six months ended August 4, 2007, was interest income of $21 and gain on sales of receivables andother income of $5. After the transaction, finance charges and other, net consists primarily of finance charges, late fees and interchange generated by ourcombined Nordstrom private label card and co-branded Nordstrom VISA credit card programs.
8 of 32
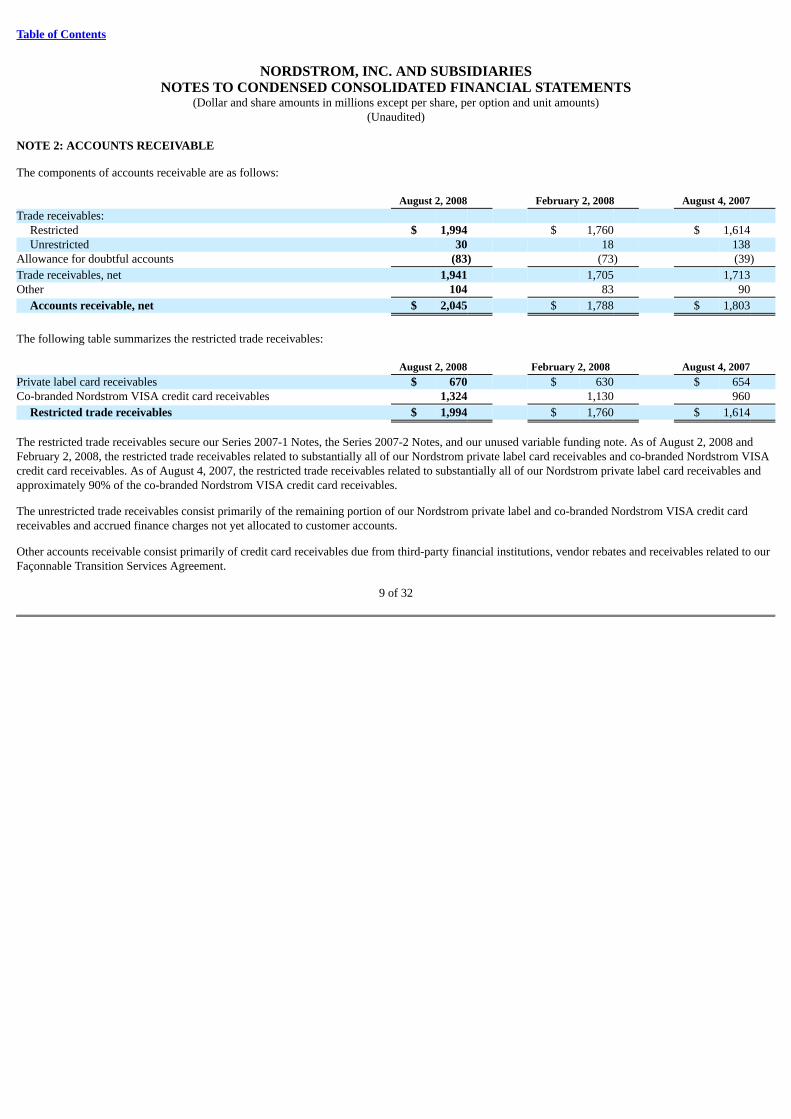
Table of Contents
NORDSTROM, INC. AND SUBSIDIARIESNOTES TO CONDENSED CONSOLIDATED FINANCIAL STATEMENTS
(Dollar and share amounts in millions except per share, per option and unit amounts)(Unaudited)
NOTE 2: ACCOUNTS RECEIVABLE
The components of accounts receivable are as follows: August 2, 2008 February 2, 2008 August 4, 2007 Trade receivables:
Restricted $ 1,994 $ 1,760 $ 1,614 Unrestricted 30 18 138
Allowance for doubtful accounts (83) (73) (39)
Trade receivables, net 1,941 1,705 1,713 Other 104 83 90
Accounts receivable, net $ 2,045 $ 1,788 $ 1,803
The following table summarizes the restricted trade receivables: August 2, 2008 February 2, 2008 August 4, 2007 Private label card receivables $ 670 $ 630 $ 654 Co-branded Nordstrom VISA credit card receivables 1,324 1,130 960
Restricted trade receivables $ 1,994 $ 1,760 $ 1,614
The restricted trade receivables secure our Series 2007-1 Notes, the Series 2007-2 Notes, and our unused variable funding note. As of August 2, 2008 andFebruary 2, 2008, the restricted trade receivables related to substantially all of our Nordstrom private label card receivables and co-branded Nordstrom VISAcredit card receivables. As of August 4, 2007, the restricted trade receivables related to substantially all of our Nordstrom private label card receivables andapproximately 90% of the co-branded Nordstrom VISA credit card receivables.
The unrestricted trade receivables consist primarily of the remaining portion of our Nordstrom private label and co-branded Nordstrom VISA credit cardreceivables and accrued finance charges not yet allocated to customer accounts.
Other accounts receivable consist primarily of credit card receivables due from third-party financial institutions, vendor rebates and receivables related to ourFaçonnable Transition Services Agreement.
9 of 32
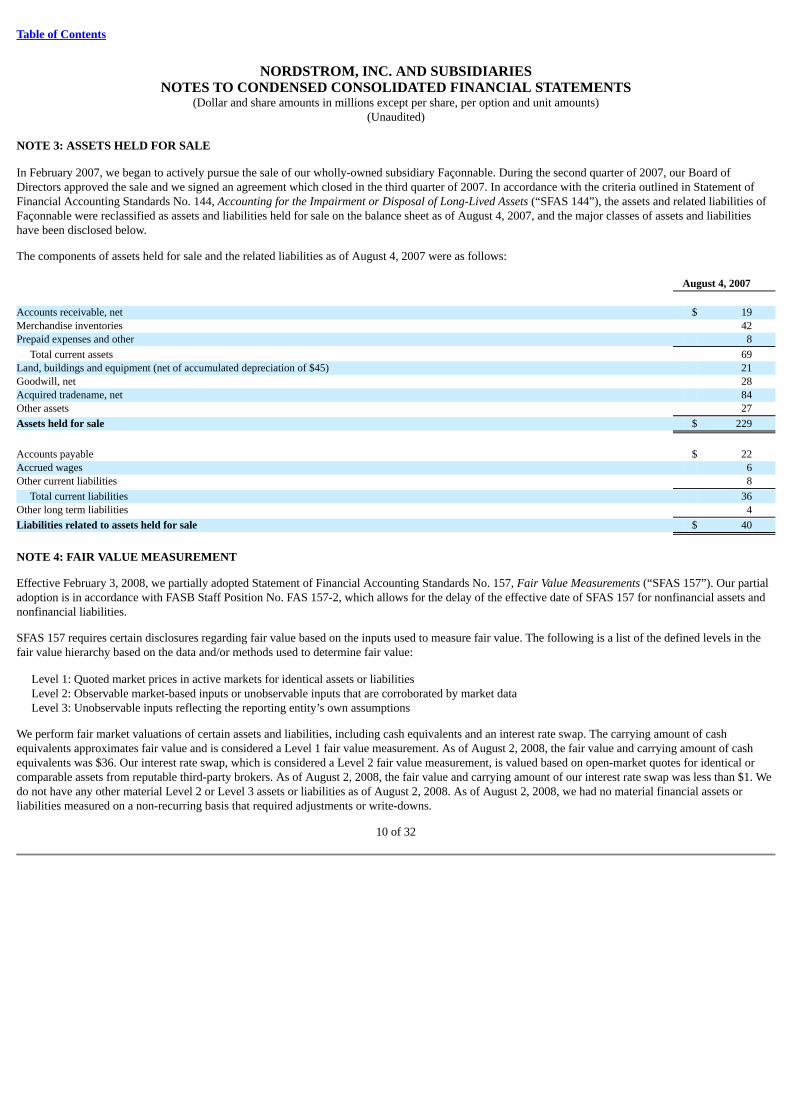
Table of Contents
NORDSTROM, INC. AND SUBSIDIARIESNOTES TO CONDENSED CONSOLIDATED FINANCIAL STATEMENTS
(Dollar and share amounts in millions except per share, per option and unit amounts)(Unaudited)
NOTE 3: ASSETS HELD FOR SALE
In February 2007, we began to actively pursue the sale of our wholly-owned subsidiary Façonnable. During the second quarter of 2007, our Board ofDirectors approved the sale and we signed an agreement which closed in the third quarter of 2007. In accordance with the criteria outlined in Statement ofFinancial Accounting Standards No. 144, Accounting for the Impairment or Disposal of Long-Lived Assets (“SFAS 144”), the assets and related liabilities ofFaçonnable were reclassified as assets and liabilities held for sale on the balance sheet as of August 4, 2007, and the major classes of assets and liabilitieshave been disclosed below.
The components of assets held for sale and the related liabilities as of August 4, 2007 were as follows: August 4, 2007 Accounts receivable, net $ 19 Merchandise inventories 42 Prepaid expenses and other 8
Total current assets 69 Land, buildings and equipment (net of accumulated depreciation of $45) 21 Goodwill, net 28 Acquired tradename, net 84 Other assets 27
Assets held for sale $ 229
Accounts payable $ 22 Accrued wages 6 Other current liabilities 8
Total current liabilities 36 Other long term liabilities 4
Liabilities related to assets held for sale $ 40
NOTE 4: FAIR VALUE MEASUREMENT
Effective February 3, 2008, we partially adopted Statement of Financial Accounting Standards No. 157, Fair Value Measurements (“SFAS 157”). Our partialadoption is in accordance with FASB Staff Position No. FAS 157-2, which allows for the delay of the effective date of SFAS 157 for nonfinancial assets andnonfinancial liabilities.
SFAS 157 requires certain disclosures regarding fair value based on the inputs used to measure fair value. The following is a list of the defined levels in thefair value hierarchy based on the data and/or methods used to determine fair value:
Level 1: Quoted market prices in active markets for identical assets or liabilities Level 2: Observable market-based inputs or unobservable inputs that are corroborated by market data Level 3: Unobservable inputs reflecting the reporting entity’s own assumptions
We perform fair market valuations of certain assets and liabilities, including cash equivalents and an interest rate swap. The carrying amount of cashequivalents approximates fair value and is considered a Level 1 fair value measurement. As of August 2, 2008, the fair value and carrying amount of cashequivalents was $36. Our interest rate swap, which is considered a Level 2 fair value measurement, is valued based on open-market quotes for identical orcomparable assets from reputable third-party brokers. As of August 2, 2008, the fair value and carrying amount of our interest rate swap was less than $1. Wedo not have any other material Level 2 or Level 3 assets or liabilities as of August 2, 2008. As of August 2, 2008, we had no material financial assets orliabilities measured on a non-recurring basis that required adjustments or write-downs.
10 of 32
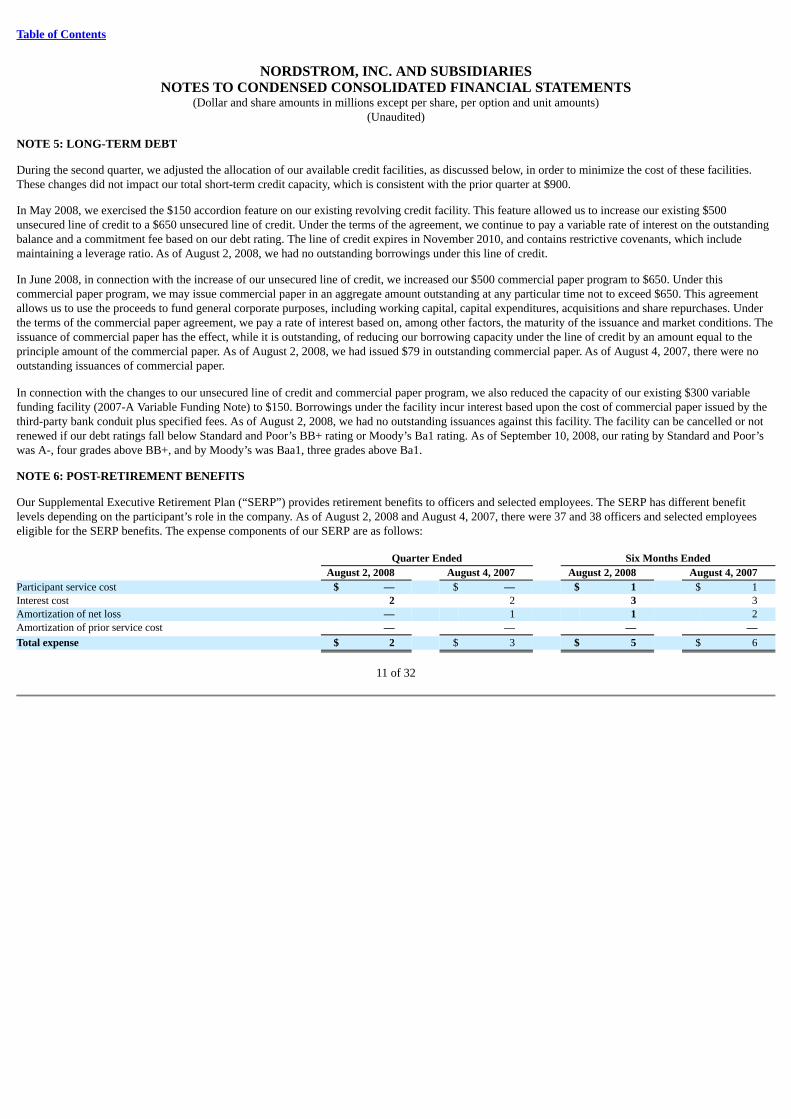
Table of Contents
NORDSTROM, INC. AND SUBSIDIARIESNOTES TO CONDENSED CONSOLIDATED FINANCIAL STATEMENTS
(Dollar and share amounts in millions except per share, per option and unit amounts)(Unaudited)
NOTE 5: LONG-TERM DEBT
During the second quarter, we adjusted the allocation of our available credit facilities, as discussed below, in order to minimize the cost of these facilities.These changes did not impact our total short-term credit capacity, which is consistent with the prior quarter at $900.
In May 2008, we exercised the $150 accordion feature on our existing revolving credit facility. This feature allowed us to increase our existing $500unsecured line of credit to a $650 unsecured line of credit. Under the terms of the agreement, we continue to pay a variable rate of interest on the outstandingbalance and a commitment fee based on our debt rating. The line of credit expires in November 2010, and contains restrictive covenants, which includemaintaining a leverage ratio. As of August 2, 2008, we had no outstanding borrowings under this line of credit.
In June 2008, in connection with the increase of our unsecured line of credit, we increased our $500 commercial paper program to $650. Under thiscommercial paper program, we may issue commercial paper in an aggregate amount outstanding at any particular time not to exceed $650. This agreementallows us to use the proceeds to fund general corporate purposes, including working capital, capital expenditures, acquisitions and share repurchases. Underthe terms of the commercial paper agreement, we pay a rate of interest based on, among other factors, the maturity of the issuance and market conditions. Theissuance of commercial paper has the effect, while it is outstanding, of reducing our borrowing capacity under the line of credit by an amount equal to theprinciple amount of the commercial paper. As of August 2, 2008, we had issued $79 in outstanding commercial paper. As of August 4, 2007, there were nooutstanding issuances of commercial paper.
In connection with the changes to our unsecured line of credit and commercial paper program, we also reduced the capacity of our existing $300 variablefunding facility (2007-A Variable Funding Note) to $150. Borrowings under the facility incur interest based upon the cost of commercial paper issued by thethird-party bank conduit plus specified fees. As of August 2, 2008, we had no outstanding issuances against this facility. The facility can be cancelled or notrenewed if our debt ratings fall below Standard and Poor’s BB+ rating or Moody’s Ba1 rating. As of September 10, 2008, our rating by Standard and Poor’swas A-, four grades above BB+, and by Moody’s was Baa1, three grades above Ba1.
NOTE 6: POST-RETIREMENT BENEFITS
Our Supplemental Executive Retirement Plan (“SERP”) provides retirement benefits to officers and selected employees. The SERP has different benefitlevels depending on the participant’s role in the company. As of August 2, 2008 and August 4, 2007, there were 37 and 38 officers and selected employeeseligible for the SERP benefits. The expense components of our SERP are as follows: Quarter Ended Six Months Ended August 2, 2008 August 4, 2007 August 2, 2008 August 4, 2007 Participant service cost $ — $ — $ 1 $ 1 Interest cost 2 2 3 3 Amortization of net loss — 1 1 2 Amortization of prior service cost — — — —
Total expense $ 2 $ 3 $ 5 $ 6
11 of 32
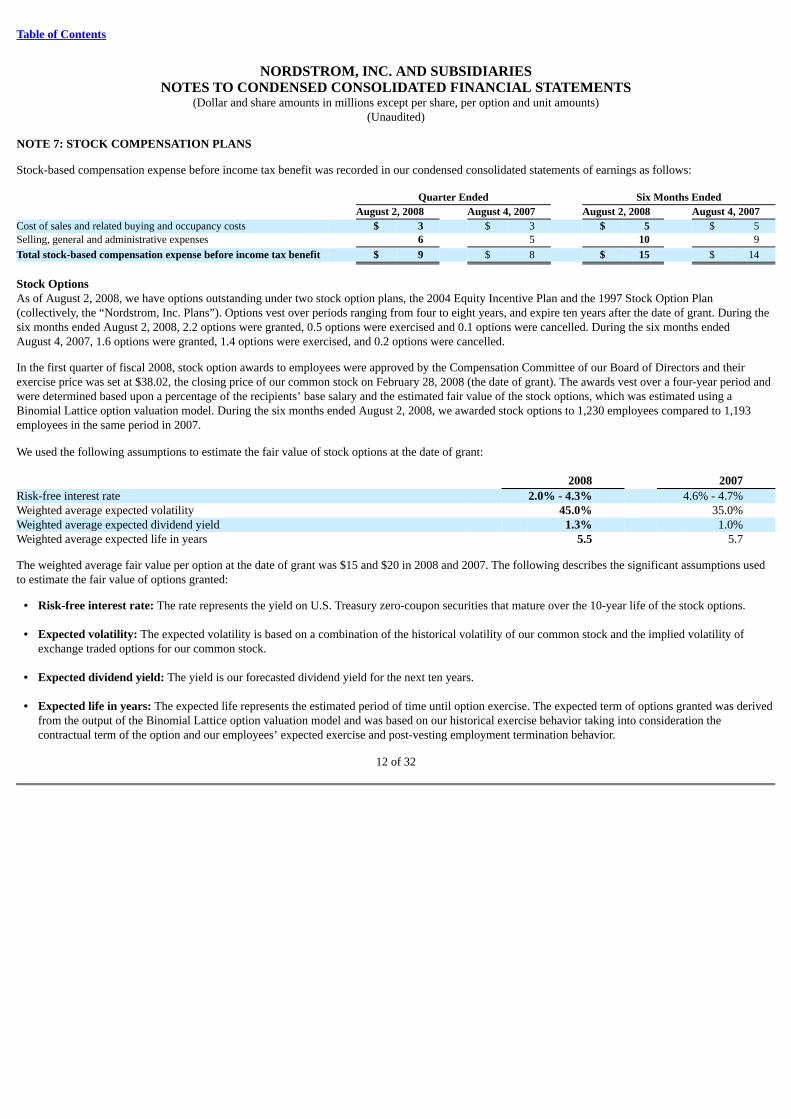
Table of Contents
NORDSTROM, INC. AND SUBSIDIARIESNOTES TO CONDENSED CONSOLIDATED FINANCIAL STATEMENTS
(Dollar and share amounts in millions except per share, per option and unit amounts)(Unaudited)
NOTE 7: STOCK COMPENSATION PLANS
Stock-based compensation expense before income tax benefit was recorded in our condensed consolidated statements of earnings as follows: Quarter Ended Six Months Ended August 2, 2008 August 4, 2007 August 2, 2008 August 4, 2007 Cost of sales and related buying and occupancy costs $ 3 $ 3 $ 5 $ 5 Selling, general and administrative expenses 6 5 10 9
Total stock-based compensation expense before income tax benefit $ 9 $ 8 $ 15 $ 14
Stock OptionsAs of August 2, 2008, we have options outstanding under two stock option plans, the 2004 Equity Incentive Plan and the 1997 Stock Option Plan(collectively, the “Nordstrom, Inc. Plans”). Options vest over periods ranging from four to eight years, and expire ten years after the date of grant. During thesix months ended August 2, 2008, 2.2 options were granted, 0.5 options were exercised and 0.1 options were cancelled. During the six months endedAugust 4, 2007, 1.6 options were granted, 1.4 options were exercised, and 0.2 options were cancelled.
In the first quarter of fiscal 2008, stock option awards to employees were approved by the Compensation Committee of our Board of Directors and theirexercise price was set at $38.02, the closing price of our common stock on February 28, 2008 (the date of grant). The awards vest over a four-year period andwere determined based upon a percentage of the recipients’ base salary and the estimated fair value of the stock options, which was estimated using aBinomial Lattice option valuation model. During the six months ended August 2, 2008, we awarded stock options to 1,230 employees compared to 1,193employees in the same period in 2007.
We used the following assumptions to estimate the fair value of stock options at the date of grant: 2008 2007 Risk-free interest rate 2.0% - 4.3% 4.6% - 4.7%Weighted average expected volatility 45.0% 35.0%Weighted average expected dividend yield 1.3% 1.0%Weighted average expected life in years 5.5 5.7
The weighted average fair value per option at the date of grant was $15 and $20 in 2008 and 2007. The following describes the significant assumptions usedto estimate the fair value of options granted:
• Risk-free interest rate: The rate represents the yield on U.S. Treasury zero-coupon securities that mature over the 10-year life of the stock options. • Expected volatility: The expected volatility is based on a combination of the historical volatility of our common stock and the implied volatility of
exchange traded options for our common stock. • Expected dividend yield: The yield is our forecasted dividend yield for the next ten years. • Expected life in years: The expected life represents the estimated period of time until option exercise. The expected term of options granted was derived
from the output of the Binomial Lattice option valuation model and was based on our historical exercise behavior taking into consideration thecontractual term of the option and our employees’ expected exercise and post-vesting employment termination behavior.
12 of 32
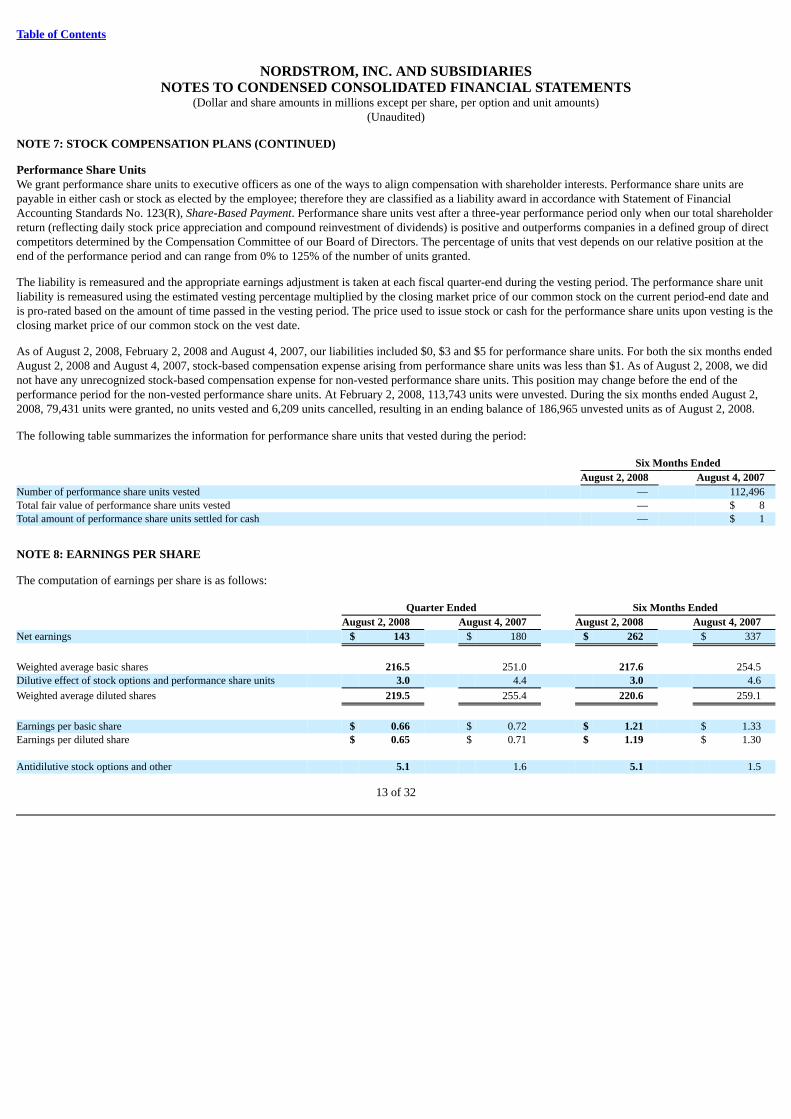
Table of Contents
NORDSTROM, INC. AND SUBSIDIARIESNOTES TO CONDENSED CONSOLIDATED FINANCIAL STATEMENTS
(Dollar and share amounts in millions except per share, per option and unit amounts)(Unaudited)
NOTE 7: STOCK COMPENSATION PLANS (CONTINUED)
Performance Share UnitsWe grant performance share units to executive officers as one of the ways to align compensation with shareholder interests. Performance share units arepayable in either cash or stock as elected by the employee; therefore they are classified as a liability award in accordance with Statement of FinancialAccounting Standards No. 123(R), Share-Based Payment. Performance share units vest after a three-year performance period only when our total shareholderreturn (reflecting daily stock price appreciation and compound reinvestment of dividends) is positive and outperforms companies in a defined group of directcompetitors determined by the Compensation Committee of our Board of Directors. The percentage of units that vest depends on our relative position at theend of the performance period and can range from 0% to 125% of the number of units granted.
The liability is remeasured and the appropriate earnings adjustment is taken at each fiscal quarter-end during the vesting period. The performance share unitliability is remeasured using the estimated vesting percentage multiplied by the closing market price of our common stock on the current period-end date andis pro-rated based on the amount of time passed in the vesting period. The price used to issue stock or cash for the performance share units upon vesting is theclosing market price of our common stock on the vest date.
As of August 2, 2008, February 2, 2008 and August 4, 2007, our liabilities included $0, $3 and $5 for performance share units. For both the six months endedAugust 2, 2008 and August 4, 2007, stock-based compensation expense arising from performance share units was less than $1. As of August 2, 2008, we didnot have any unrecognized stock-based compensation expense for non-vested performance share units. This position may change before the end of theperformance period for the non-vested performance share units. At February 2, 2008, 113,743 units were unvested. During the six months ended August 2,2008, 79,431 units were granted, no units vested and 6,209 units cancelled, resulting in an ending balance of 186,965 unvested units as of August 2, 2008.
The following table summarizes the information for performance share units that vested during the period: Six Months Ended August 2, 2008 August 4, 2007 Number of performance share units vested — 112,496 Total fair value of performance share units vested — $ 8 Total amount of performance share units settled for cash — $ 1
NOTE 8: EARNINGS PER SHARE
The computation of earnings per share is as follows: Quarter Ended Six Months Ended August 2, 2008 August 4, 2007 August 2, 2008 August 4, 2007 Net earnings $ 143 $ 180 $ 262 $ 337
Weighted average basic shares 216.5 251.0 217.6 254.5 Dilutive effect of stock options and performance share units 3.0 4.4 3.0 4.6
Weighted average diluted shares 219.5 255.4 220.6 259.1
Earnings per basic share $ 0.66 $ 0.72 $ 1.21 $ 1.33 Earnings per diluted share $ 0.65 $ 0.71 $ 1.19 $ 1.30 Antidilutive stock options and other 5.1 1.6 5.1 1.5
13 of 32
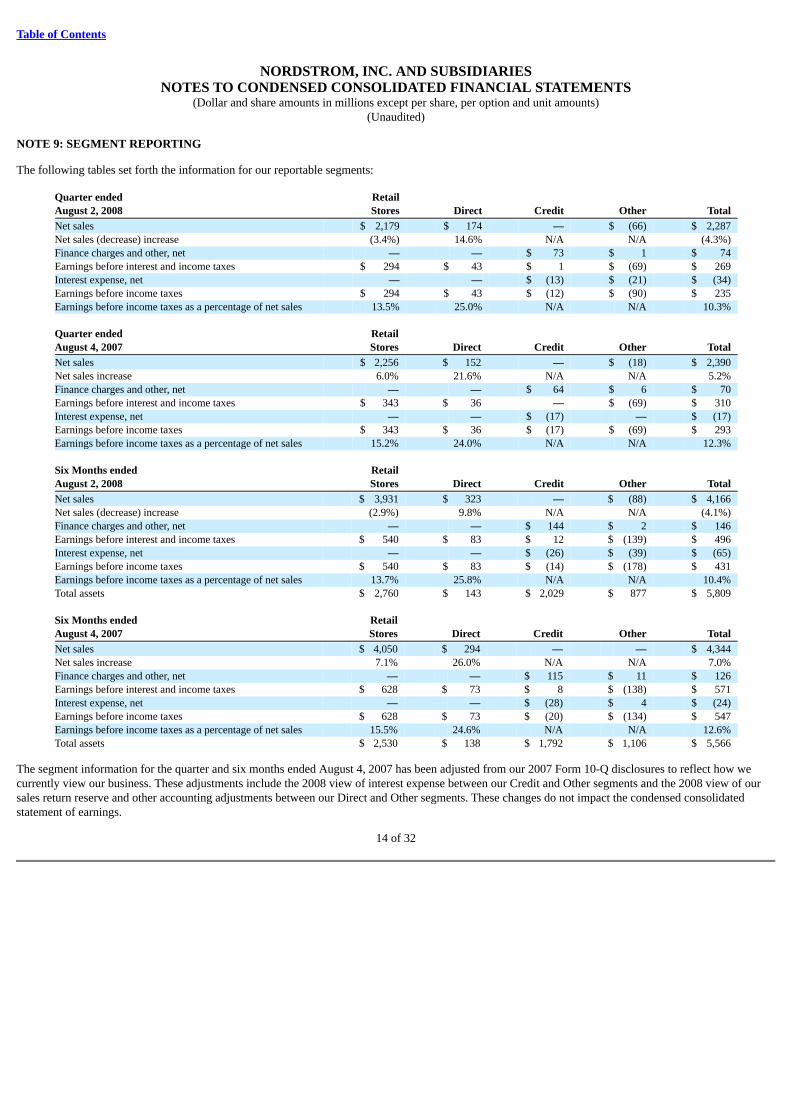
Table of Contents
NORDSTROM, INC. AND SUBSIDIARIESNOTES TO CONDENSED CONSOLIDATED FINANCIAL STATEMENTS
(Dollar and share amounts in millions except per share, per option and unit amounts)(Unaudited)
NOTE 9: SEGMENT REPORTING
The following tables set forth the information for our reportable segments: Quarter ended Retail August 2, 2008 Stores Direct Credit Other Total
Net sales $ 2,179 $ 174 — $ (66) $ 2,287 Net sales (decrease) increase (3.4%) 14.6% N/A N/A (4.3%) Finance charges and other, net — — $ 73 $ 1 $ 74 Earnings before interest and income taxes $ 294 $ 43 $ 1 $ (69) $ 269 Interest expense, net — — $ (13) $ (21) $ (34) Earnings before income taxes $ 294 $ 43 $ (12) $ (90) $ 235 Earnings before income taxes as a percentage of net sales 13.5% 25.0% N/A N/A 10.3% Quarter ended Retail August 4, 2007 Stores Direct Credit Other Total
Net sales $ 2,256 $ 152 — $ (18) $ 2,390 Net sales increase 6.0% 21.6% N/A N/A 5.2% Finance charges and other, net — — $ 64 $ 6 $ 70 Earnings before interest and income taxes $ 343 $ 36 — $ (69) $ 310 Interest expense, net — — $ (17) — $ (17) Earnings before income taxes $ 343 $ 36 $ (17) $ (69) $ 293 Earnings before income taxes as a percentage of net sales 15.2% 24.0% N/A N/A 12.3% Six Months ended Retail August 2, 2008 Stores Direct Credit Other Total
Net sales $ 3,931 $ 323 — $ (88) $ 4,166 Net sales (decrease) increase (2.9%) 9.8% N/A N/A (4.1%) Finance charges and other, net — — $ 144 $ 2 $ 146 Earnings before interest and income taxes $ 540 $ 83 $ 12 $ (139) $ 496 Interest expense, net — — $ (26) $ (39) $ (65) Earnings before income taxes $ 540 $ 83 $ (14) $ (178) $ 431 Earnings before income taxes as a percentage of net sales 13.7% 25.8% N/A N/A 10.4% Total assets $ 2,760 $ 143 $ 2,029 $ 877 $ 5,809 Six Months ended Retail August 4, 2007 Stores Direct Credit Other Total
Net sales $ 4,050 $ 294 — — $ 4,344 Net sales increase 7.1% 26.0% N/A N/A 7.0% Finance charges and other, net — — $ 115 $ 11 $ 126 Earnings before interest and income taxes $ 628 $ 73 $ 8 $ (138) $ 571 Interest expense, net — — $ (28) $ 4 $ (24) Earnings before income taxes $ 628 $ 73 $ (20) $ (134) $ 547 Earnings before income taxes as a percentage of net sales 15.5% 24.6% N/A N/A 12.6% Total assets $ 2,530 $ 138 $ 1,792 $ 1,106 $ 5,566
The segment information for the quarter and six months ended August 4, 2007 has been adjusted from our 2007 Form 10-Q disclosures to reflect how wecurrently view our business. These adjustments include the 2008 view of interest expense between our Credit and Other segments and the 2008 view of oursales return reserve and other accounting adjustments between our Direct and Other segments. These changes do not impact the condensed consolidatedstatement of earnings.
14 of 32
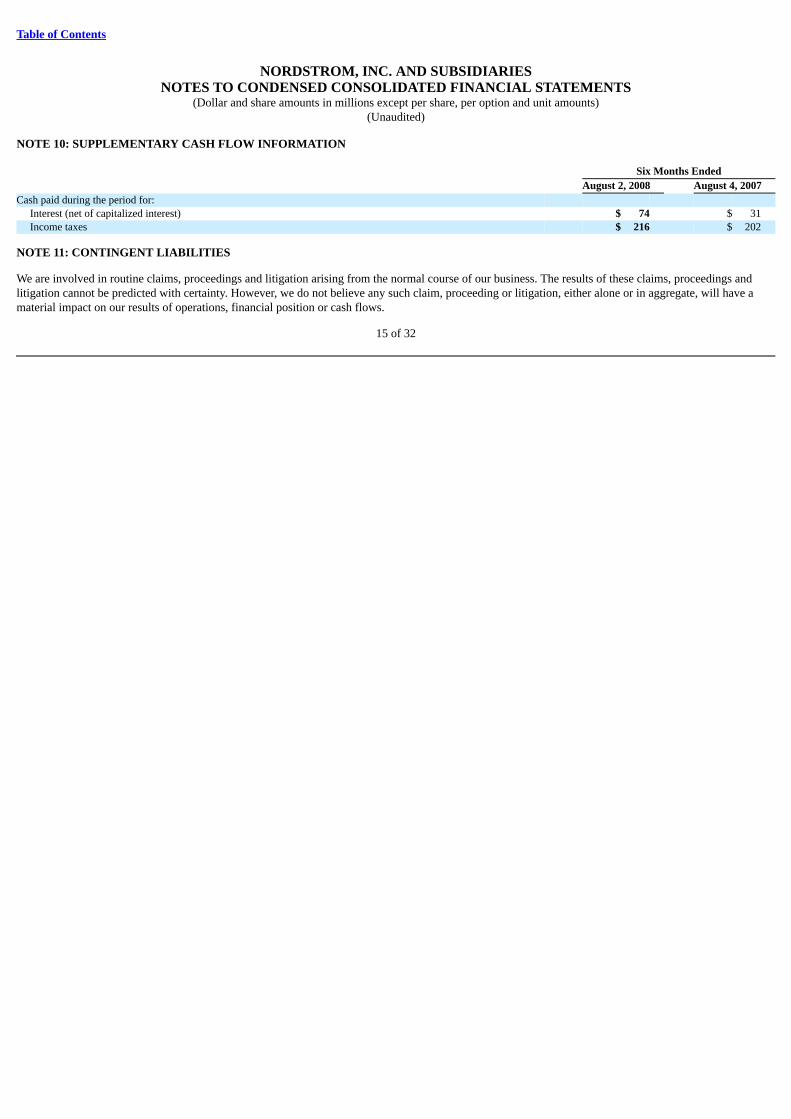
Table of Contents
NORDSTROM, INC. AND SUBSIDIARIESNOTES TO CONDENSED CONSOLIDATED FINANCIAL STATEMENTS
(Dollar and share amounts in millions except per share, per option and unit amounts)(Unaudited)
NOTE 10: SUPPLEMENTARY CASH FLOW INFORMATION Six Months Ended August 2, 2008 August 4, 2007 Cash paid during the period for:
Interest (net of capitalized interest) $ 74 $ 31 Income taxes $ 216 $ 202
NOTE 11: CONTINGENT LIABILITIES
We are involved in routine claims, proceedings and litigation arising from the normal course of our business. The results of these claims, proceedings andlitigation cannot be predicted with certainty. However, we do not believe any such claim, proceeding or litigation, either alone or in aggregate, will have amaterial impact on our results of operations, financial position or cash flows.
15 of 32
Table of Contents
Item 2. Management’s Discussion and Analysis of Financial Condition and Results of Operations(Dollar and share amounts in millions except per share and per square foot amounts)
The following discussion should be read in conjunction with the Management’s Discussion and Analysis section of our 2007 Annual Report on Form 10-K.
FORWARD-LOOKING INFORMATION CAUTIONARY STATEMENTCertain statements in this Quarterly Report on Form 10-Q contain “forward-looking” statements (as defined in the Private Securities Litigation Reform Act of1995) that involve risks and uncertainties, including anticipated financial results, use of cash and liquidity, growth, store openings and trends in ouroperations. Actual future results and trends may differ materially from historical results or current expectations depending upon various factors including, butnot limited to:
• the impact of economic and market conditions and the resulting impact on consumer spending patterns
• our ability to respond to the business environment and fashion trends
• the competitive pricing environment within the retail sector
• effective inventory management
• the effectiveness of planned advertising, marketing and promotional campaigns
• successful execution of our store growth strategy including the timely completion of construction associated with newly planned stores, relocations andremodels
• our compliance with applicable banking and related laws and regulations impacting our ability to extend credit to our customers
• our compliance with information security and privacy laws and regulations, employment laws and regulations and other laws and regulations applicableto the company
• successful execution of our multi-channel strategy
• our ability to safeguard our brand and reputation
• efficient and proper allocation of our capital resources
• successful execution of our technology strategy
• trends in personal bankruptcies and bad debt write-offs
• changes in interest rates
• our ability to maintain our relationships with our employees and to effectively train and develop our future leaders
• our ability to control costs
• risks related to fluctuations in world currencies
• weather conditions and hazards of nature that affect consumer traffic and consumers’ purchasing patterns
• timing and amounts of share repurchases by the company
These and other factors, including those factors described in Part I, “Item 1A. Risk Factors” in our Form 10-K for the fiscal year ended February 2, 2008,could affect our financial results and trends and cause actual results and trends to differ materially from those contained in any forward-looking statements wemay provide. As a result, while we believe there is a reasonable basis for the forward-looking statements, you should not place undue reliance on thosestatements. We undertake no obligation to update or revise any forward-looking statements to reflect subsequent events, new information or futurecircumstances. This discussion and analysis should be read in conjunction with the Condensed Consolidated Financial Statements.
16 of 32
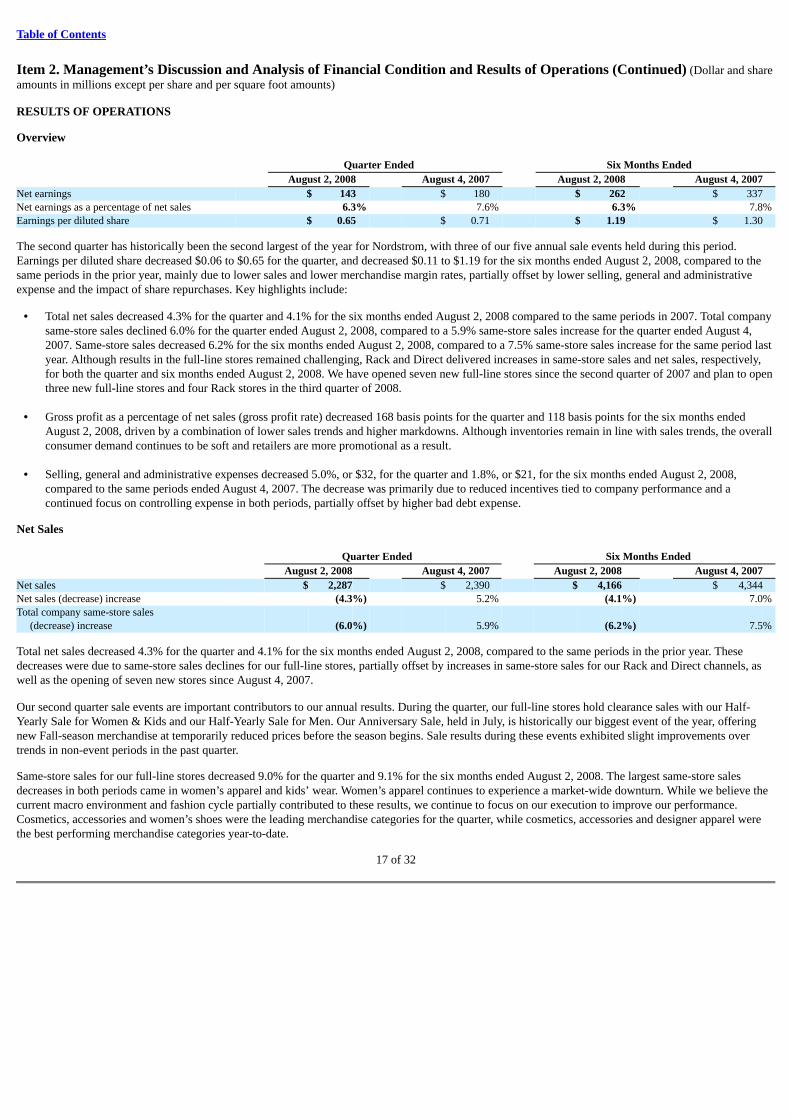
Table of Contents
Item 2. Management’s Discussion and Analysis of Financial Condition and Results of Operations (Continued) (Dollar and shareamounts in millions except per share and per square foot amounts)
RESULTS OF OPERATIONS
Overview Quarter Ended Six Months Ended August 2, 2008 August 4, 2007 August 2, 2008 August 4, 2007 Net earnings $ 143 $ 180 $ 262 $ 337 Net earnings as a percentage of net sales 6.3% 7.6% 6.3% 7.8%Earnings per diluted share $ 0.65 $ 0.71 $ 1.19 $ 1.30
The second quarter has historically been the second largest of the year for Nordstrom, with three of our five annual sale events held during this period.Earnings per diluted share decreased $0.06 to $0.65 for the quarter, and decreased $0.11 to $1.19 for the six months ended August 2, 2008, compared to thesame periods in the prior year, mainly due to lower sales and lower merchandise margin rates, partially offset by lower selling, general and administrativeexpense and the impact of share repurchases. Key highlights include:
• Total net sales decreased 4.3% for the quarter and 4.1% for the six months ended August 2, 2008 compared to the same periods in 2007. Total companysame-store sales declined 6.0% for the quarter ended August 2, 2008, compared to a 5.9% same-store sales increase for the quarter ended August 4,2007. Same-store sales decreased 6.2% for the six months ended August 2, 2008, compared to a 7.5% same-store sales increase for the same period lastyear. Although results in the full-line stores remained challenging, Rack and Direct delivered increases in same-store sales and net sales, respectively,for both the quarter and six months ended August 2, 2008. We have opened seven new full-line stores since the second quarter of 2007 and plan to openthree new full-line stores and four Rack stores in the third quarter of 2008.
• Gross profit as a percentage of net sales (gross profit rate) decreased 168 basis points for the quarter and 118 basis points for the six months ended
August 2, 2008, driven by a combination of lower sales trends and higher markdowns. Although inventories remain in line with sales trends, the overallconsumer demand continues to be soft and retailers are more promotional as a result.
• Selling, general and administrative expenses decreased 5.0%, or $32, for the quarter and 1.8%, or $21, for the six months ended August 2, 2008,
compared to the same periods ended August 4, 2007. The decrease was primarily due to reduced incentives tied to company performance and acontinued focus on controlling expense in both periods, partially offset by higher bad debt expense.
Net Sales Quarter Ended Six Months Ended August 2, 2008 August 4, 2007 August 2, 2008 August 4, 2007 Net sales $ 2,287 $ 2,390 $ 4,166 $ 4,344 Net sales (decrease) increase (4.3%) 5.2% (4.1%) 7.0%Total company same-store sales
(decrease) increase (6.0%) 5.9% (6.2%) 7.5%
Total net sales decreased 4.3% for the quarter and 4.1% for the six months ended August 2, 2008, compared to the same periods in the prior year. Thesedecreases were due to same-store sales declines for our full-line stores, partially offset by increases in same-store sales for our Rack and Direct channels, aswell as the opening of seven new stores since August 4, 2007.
Our second quarter sale events are important contributors to our annual results. During the quarter, our full-line stores hold clearance sales with our Half-Yearly Sale for Women & Kids and our Half-Yearly Sale for Men. Our Anniversary Sale, held in July, is historically our biggest event of the year, offeringnew Fall-season merchandise at temporarily reduced prices before the season begins. Sale results during these events exhibited slight improvements overtrends in non-event periods in the past quarter.
Same-store sales for our full-line stores decreased 9.0% for the quarter and 9.1% for the six months ended August 2, 2008. The largest same-store salesdecreases in both periods came in women’s apparel and kids’ wear. Women’s apparel continues to experience a market-wide downturn. While we believe thecurrent macro environment and fashion cycle partially contributed to these results, we continue to focus on our execution to improve our performance.Cosmetics, accessories and women’s shoes were the leading merchandise categories for the quarter, while cosmetics, accessories and designer apparel werethe best performing merchandise categories year-to-date.
17 of 32
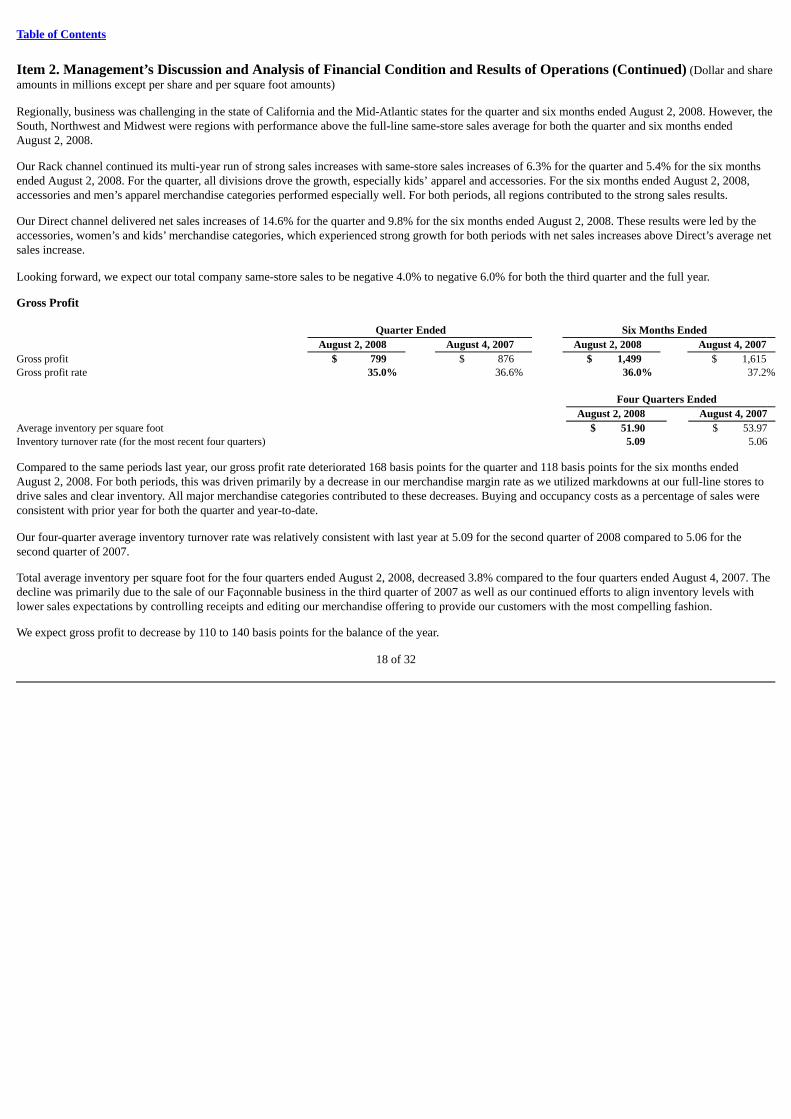
Table of Contents
Item 2. Management’s Discussion and Analysis of Financial Condition and Results of Operations (Continued) (Dollar and shareamounts in millions except per share and per square foot amounts)
Regionally, business was challenging in the state of California and the Mid-Atlantic states for the quarter and six months ended August 2, 2008. However, theSouth, Northwest and Midwest were regions with performance above the full-line same-store sales average for both the quarter and six months endedAugust 2, 2008.
Our Rack channel continued its multi-year run of strong sales increases with same-store sales increases of 6.3% for the quarter and 5.4% for the six monthsended August 2, 2008. For the quarter, all divisions drove the growth, especially kids’ apparel and accessories. For the six months ended August 2, 2008,accessories and men’s apparel merchandise categories performed especially well. For both periods, all regions contributed to the strong sales results.
Our Direct channel delivered net sales increases of 14.6% for the quarter and 9.8% for the six months ended August 2, 2008. These results were led by theaccessories, women’s and kids’ merchandise categories, which experienced strong growth for both periods with net sales increases above Direct’s average netsales increase.
Looking forward, we expect our total company same-store sales to be negative 4.0% to negative 6.0% for both the third quarter and the full year.
Gross Profit Quarter Ended Six Months Ended August 2, 2008 August 4, 2007 August 2, 2008 August 4, 2007 Gross profit $ 799 $ 876 $ 1,499 $ 1,615 Gross profit rate 35.0% 36.6% 36.0% 37.2% Four Quarters Ended August 2, 2008 August 4, 2007 Average inventory per square foot $ 51.90 $ 53.97 Inventory turnover rate (for the most recent four quarters) 5.09 5.06
Compared to the same periods last year, our gross profit rate deteriorated 168 basis points for the quarter and 118 basis points for the six months endedAugust 2, 2008. For both periods, this was driven primarily by a decrease in our merchandise margin rate as we utilized markdowns at our full-line stores todrive sales and clear inventory. All major merchandise categories contributed to these decreases. Buying and occupancy costs as a percentage of sales wereconsistent with prior year for both the quarter and year-to-date.
Our four-quarter average inventory turnover rate was relatively consistent with last year at 5.09 for the second quarter of 2008 compared to 5.06 for thesecond quarter of 2007.
Total average inventory per square foot for the four quarters ended August 2, 2008, decreased 3.8% compared to the four quarters ended August 4, 2007. Thedecline was primarily due to the sale of our Façonnable business in the third quarter of 2007 as well as our continued efforts to align inventory levels withlower sales expectations by controlling receipts and editing our merchandise offering to provide our customers with the most compelling fashion.
We expect gross profit to decrease by 110 to 140 basis points for the balance of the year.
18 of 32
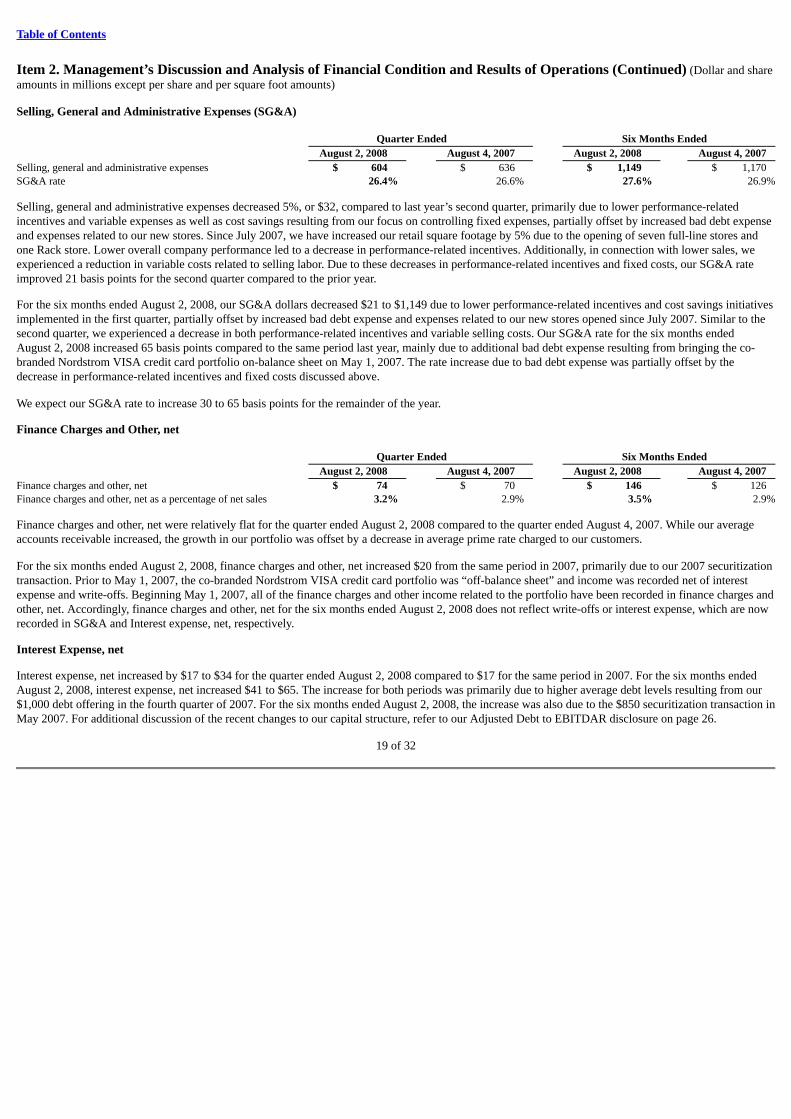
Table of Contents
Item 2. Management’s Discussion and Analysis of Financial Condition and Results of Operations (Continued) (Dollar and shareamounts in millions except per share and per square foot amounts)
Selling, General and Administrative Expenses (SG&A) Quarter Ended Six Months Ended August 2, 2008 August 4, 2007 August 2, 2008 August 4, 2007 Selling, general and administrative expenses $ 604 $ 636 $ 1,149 $ 1,170 SG&A rate 26.4% 26.6% 27.6% 26.9%
Selling, general and administrative expenses decreased 5%, or $32, compared to last year’s second quarter, primarily due to lower performance-relatedincentives and variable expenses as well as cost savings resulting from our focus on controlling fixed expenses, partially offset by increased bad debt expenseand expenses related to our new stores. Since July 2007, we have increased our retail square footage by 5% due to the opening of seven full-line stores andone Rack store. Lower overall company performance led to a decrease in performance-related incentives. Additionally, in connection with lower sales, weexperienced a reduction in variable costs related to selling labor. Due to these decreases in performance-related incentives and fixed costs, our SG&A rateimproved 21 basis points for the second quarter compared to the prior year.
For the six months ended August 2, 2008, our SG&A dollars decreased $21 to $1,149 due to lower performance-related incentives and cost savings initiativesimplemented in the first quarter, partially offset by increased bad debt expense and expenses related to our new stores opened since July 2007. Similar to thesecond quarter, we experienced a decrease in both performance-related incentives and variable selling costs. Our SG&A rate for the six months endedAugust 2, 2008 increased 65 basis points compared to the same period last year, mainly due to additional bad debt expense resulting from bringing the co-branded Nordstrom VISA credit card portfolio on-balance sheet on May 1, 2007. The rate increase due to bad debt expense was partially offset by thedecrease in performance-related incentives and fixed costs discussed above.
We expect our SG&A rate to increase 30 to 65 basis points for the remainder of the year.
Finance Charges and Other, net Quarter Ended Six Months Ended August 2, 2008 August 4, 2007 August 2, 2008 August 4, 2007 Finance charges and other, net $ 74 $ 70 $ 146 $ 126 Finance charges and other, net as a percentage of net sales 3.2% 2.9% 3.5% 2.9%
Finance charges and other, net were relatively flat for the quarter ended August 2, 2008 compared to the quarter ended August 4, 2007. While our averageaccounts receivable increased, the growth in our portfolio was offset by a decrease in average prime rate charged to our customers.
For the six months ended August 2, 2008, finance charges and other, net increased $20 from the same period in 2007, primarily due to our 2007 securitizationtransaction. Prior to May 1, 2007, the co-branded Nordstrom VISA credit card portfolio was “off-balance sheet” and income was recorded net of interestexpense and write-offs. Beginning May 1, 2007, all of the finance charges and other income related to the portfolio have been recorded in finance charges andother, net. Accordingly, finance charges and other, net for the six months ended August 2, 2008 does not reflect write-offs or interest expense, which are nowrecorded in SG&A and Interest expense, net, respectively.
Interest Expense, net
Interest expense, net increased by $17 to $34 for the quarter ended August 2, 2008 compared to $17 for the same period in 2007. For the six months endedAugust 2, 2008, interest expense, net increased $41 to $65. The increase for both periods was primarily due to higher average debt levels resulting from our$1,000 debt offering in the fourth quarter of 2007. For the six months ended August 2, 2008, the increase was also due to the $850 securitization transaction inMay 2007. For additional discussion of the recent changes to our capital structure, refer to our Adjusted Debt to EBITDAR disclosure on page 26.
19 of 32
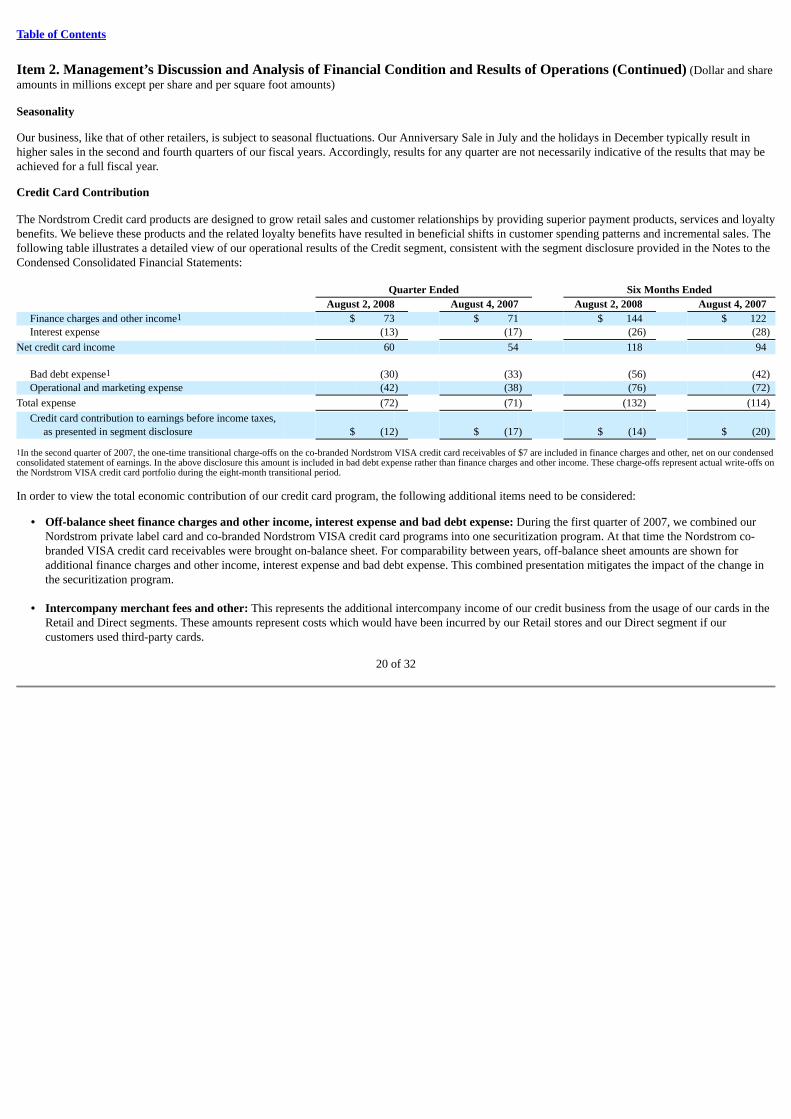
Table of Contents
Item 2. Management’s Discussion and Analysis of Financial Condition and Results of Operations (Continued) (Dollar and shareamounts in millions except per share and per square foot amounts)
Seasonality
Our business, like that of other retailers, is subject to seasonal fluctuations. Our Anniversary Sale in July and the holidays in December typically result inhigher sales in the second and fourth quarters of our fiscal years. Accordingly, results for any quarter are not necessarily indicative of the results that may beachieved for a full fiscal year.
Credit Card Contribution
The Nordstrom Credit card products are designed to grow retail sales and customer relationships by providing superior payment products, services and loyaltybenefits. We believe these products and the related loyalty benefits have resulted in beneficial shifts in customer spending patterns and incremental sales. Thefollowing table illustrates a detailed view of our operational results of the Credit segment, consistent with the segment disclosure provided in the Notes to theCondensed Consolidated Financial Statements: Quarter Ended Six Months Ended August 2, 2008 August 4, 2007 August 2, 2008 August 4, 2007
Finance charges and other income1 $ 73 $ 71 $ 144 $ 122 Interest expense (13) (17) (26) (28)
Net credit card income 60 54 118 94
Bad debt expense1 (30) (33) (56) (42)Operational and marketing expense (42) (38) (76) (72)
Total expense (72) (71) (132) (114)
Credit card contribution to earnings before income taxes,as presented in segment disclosure $ (12) $ (17) $ (14) $ (20)
1In the second quarter of 2007, the one-time transitional charge-offs on the co-branded Nordstrom VISA credit card receivables of $7 are included in finance charges and other, net on our condensedconsolidated statement of earnings. In the above disclosure this amount is included in bad debt expense rather than finance charges and other income. These charge-offs represent actual write-offs onthe Nordstrom VISA credit card portfolio during the eight-month transitional period.
In order to view the total economic contribution of our credit card program, the following additional items need to be considered:
• Off-balance sheet finance charges and other income, interest expense and bad debt expense: During the first quarter of 2007, we combined ourNordstrom private label card and co-branded Nordstrom VISA credit card programs into one securitization program. At that time the Nordstrom co-branded VISA credit card receivables were brought on-balance sheet. For comparability between years, off-balance sheet amounts are shown foradditional finance charges and other income, interest expense and bad debt expense. This combined presentation mitigates the impact of the change inthe securitization program.
• Intercompany merchant fees and other: This represents the additional intercompany income of our credit business from the usage of our cards in the
Retail and Direct segments. These amounts represent costs which would have been incurred by our Retail stores and our Direct segment if ourcustomers used third-party cards.
20 of 32
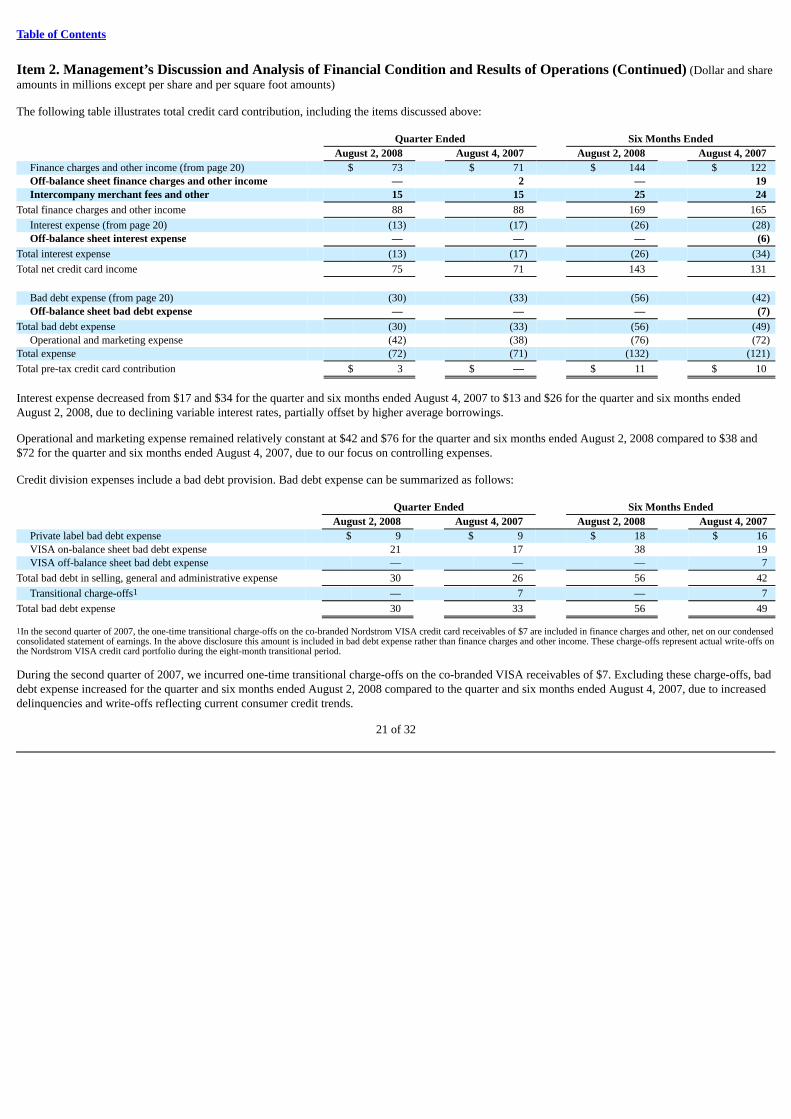
Table of Contents
Item 2. Management’s Discussion and Analysis of Financial Condition and Results of Operations (Continued) (Dollar and shareamounts in millions except per share and per square foot amounts)
The following table illustrates total credit card contribution, including the items discussed above: Quarter Ended Six Months Ended August 2, 2008 August 4, 2007 August 2, 2008 August 4, 2007
Finance charges and other income (from page 20) $ 73 $ 71 $ 144 $ 122 Off-balance sheet finance charges and other income — 2 — 19 Intercompany merchant fees and other 15 15 25 24
Total finance charges and other income 88 88 169 165
Interest expense (from page 20) (13) (17) (26) (28) Off-balance sheet interest expense — — — (6)
Total interest expense (13) (17) (26) (34)
Total net credit card income 75 71 143 131
Bad debt expense (from page 20) (30) (33) (56) (42)Off-balance sheet bad debt expense — — — (7)
Total bad debt expense (30) (33) (56) (49)Operational and marketing expense (42) (38) (76) (72)
Total expense (72) (71) (132) (121)
Total pre-tax credit card contribution $ 3 $ — $ 11 $ 10
Interest expense decreased from $17 and $34 for the quarter and six months ended August 4, 2007 to $13 and $26 for the quarter and six months endedAugust 2, 2008, due to declining variable interest rates, partially offset by higher average borrowings.
Operational and marketing expense remained relatively constant at $42 and $76 for the quarter and six months ended August 2, 2008 compared to $38 and$72 for the quarter and six months ended August 4, 2007, due to our focus on controlling expenses.
Credit division expenses include a bad debt provision. Bad debt expense can be summarized as follows: Quarter Ended Six Months Ended August 2, 2008 August 4, 2007 August 2, 2008 August 4, 2007
Private label bad debt expense $ 9 $ 9 $ 18 $ 16 VISA on-balance sheet bad debt expense 21 17 38 19 VISA off-balance sheet bad debt expense — — — 7
Total bad debt in selling, general and administrative expense 30 26 56 42
Transitional charge-offs1 — 7 — 7
Total bad debt expense 30 33 56 49
1In the second quarter of 2007, the one-time transitional charge-offs on the co-branded Nordstrom VISA credit card receivables of $7 are included in finance charges and other, net on our condensedconsolidated statement of earnings. In the above disclosure this amount is included in bad debt expense rather than finance charges and other income. These charge-offs represent actual write-offs onthe Nordstrom VISA credit card portfolio during the eight-month transitional period.
During the second quarter of 2007, we incurred one-time transitional charge-offs on the co-branded VISA receivables of $7. Excluding these charge-offs, baddebt expense increased for the quarter and six months ended August 2, 2008 compared to the quarter and six months ended August 4, 2007, due to increaseddelinquencies and write-offs reflecting current consumer credit trends.
21 of 32
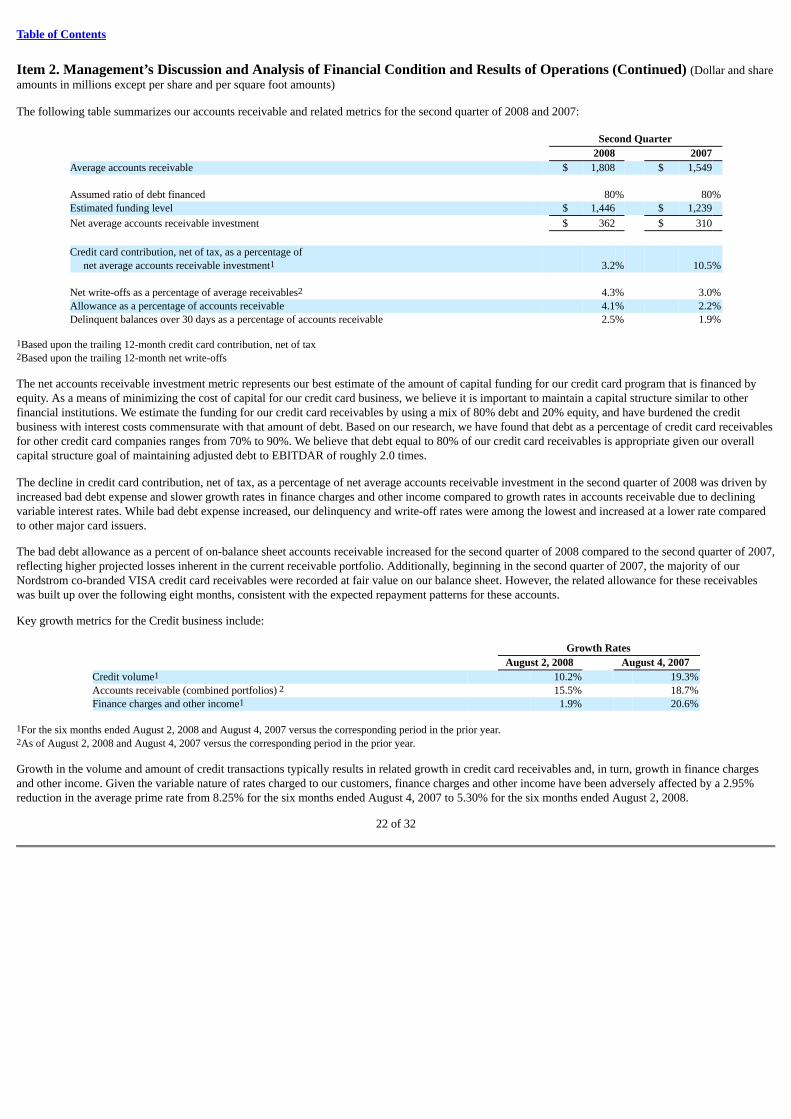
Table of Contents
Item 2. Management’s Discussion and Analysis of Financial Condition and Results of Operations (Continued) (Dollar and shareamounts in millions except per share and per square foot amounts)
The following table summarizes our accounts receivable and related metrics for the second quarter of 2008 and 2007: Second Quarter 2008 2007 Average accounts receivable $ 1,808 $ 1,549 Assumed ratio of debt financed 80% 80%Estimated funding level $ 1,446 $ 1,239
Net average accounts receivable investment $ 362 $ 310
Credit card contribution, net of tax, as a percentage of
net average accounts receivable investment1 3.2% 10.5% Net write-offs as a percentage of average receivables2 4.3% 3.0%Allowance as a percentage of accounts receivable 4.1% 2.2%Delinquent balances over 30 days as a percentage of accounts receivable 2.5% 1.9%
1Based upon the trailing 12-month credit card contribution, net of tax2Based upon the trailing 12-month net write-offs
The net accounts receivable investment metric represents our best estimate of the amount of capital funding for our credit card program that is financed byequity. As a means of minimizing the cost of capital for our credit card business, we believe it is important to maintain a capital structure similar to otherfinancial institutions. We estimate the funding for our credit card receivables by using a mix of 80% debt and 20% equity, and have burdened the creditbusiness with interest costs commensurate with that amount of debt. Based on our research, we have found that debt as a percentage of credit card receivablesfor other credit card companies ranges from 70% to 90%. We believe that debt equal to 80% of our credit card receivables is appropriate given our overallcapital structure goal of maintaining adjusted debt to EBITDAR of roughly 2.0 times.
The decline in credit card contribution, net of tax, as a percentage of net average accounts receivable investment in the second quarter of 2008 was driven byincreased bad debt expense and slower growth rates in finance charges and other income compared to growth rates in accounts receivable due to decliningvariable interest rates. While bad debt expense increased, our delinquency and write-off rates were among the lowest and increased at a lower rate comparedto other major card issuers.
The bad debt allowance as a percent of on-balance sheet accounts receivable increased for the second quarter of 2008 compared to the second quarter of 2007,reflecting higher projected losses inherent in the current receivable portfolio. Additionally, beginning in the second quarter of 2007, the majority of ourNordstrom co-branded VISA credit card receivables were recorded at fair value on our balance sheet. However, the related allowance for these receivableswas built up over the following eight months, consistent with the expected repayment patterns for these accounts.
Key growth metrics for the Credit business include: Growth Rates August 2, 2008 August 4, 2007 Credit volume1 10.2% 19.3%Accounts receivable (combined portfolios) 2 15.5% 18.7%Finance charges and other income1 1.9% 20.6%
1For the six months ended August 2, 2008 and August 4, 2007 versus the corresponding period in the prior year.2As of August 2, 2008 and August 4, 2007 versus the corresponding period in the prior year.
Growth in the volume and amount of credit transactions typically results in related growth in credit card receivables and, in turn, growth in finance chargesand other income. Given the variable nature of rates charged to our customers, finance charges and other income have been adversely affected by a 2.95%reduction in the average prime rate from 8.25% for the six months ended August 4, 2007 to 5.30% for the six months ended August 2, 2008.
22 of 32
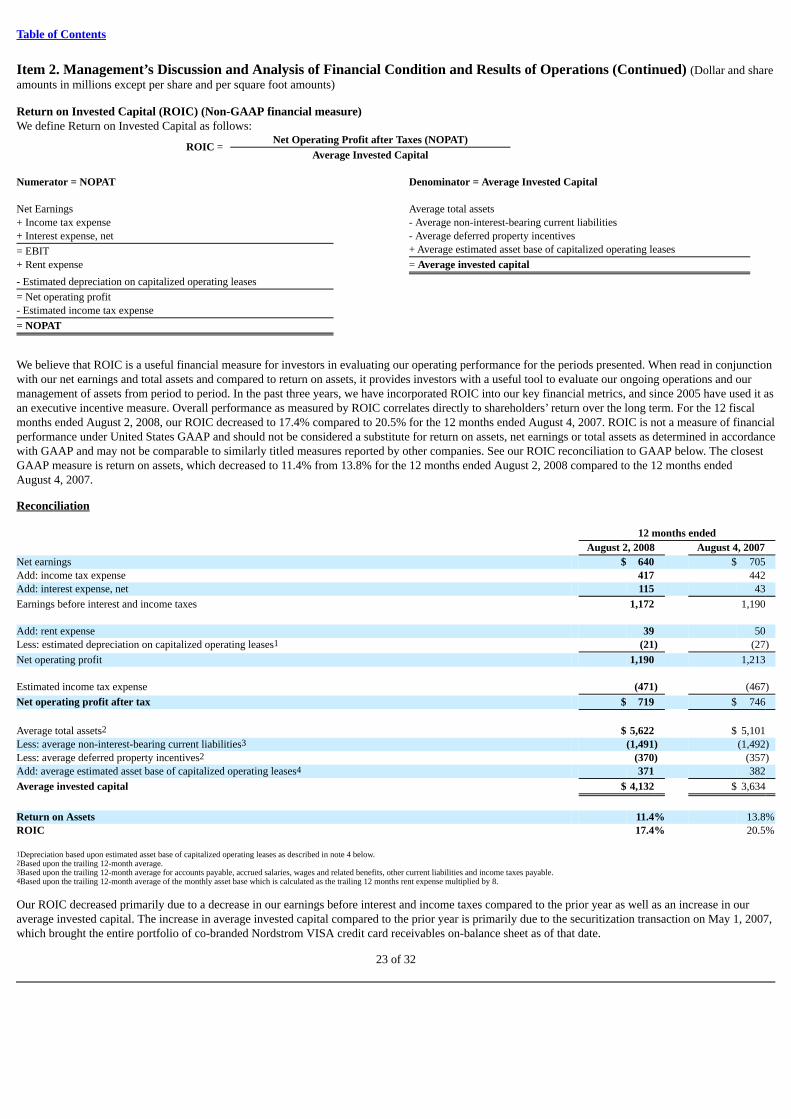
Table of Contents
Item 2. Management’s Discussion and Analysis of Financial Condition and Results of Operations (Continued) (Dollar and shareamounts in millions except per share and per square foot amounts)
Return on Invested Capital (ROIC) (Non-GAAP financial measure)We define Return on Invested Capital as follows:
ROIC =
Net Operating Profit after Taxes (NOPAT)
Average Invested Capital
Numerator = NOPAT Denominator = Average Invested Capital Net Earnings Average total assets + Income tax expense - Average non-interest-bearing current liabilities + Interest expense, net - Average deferred property incentives
= EBIT + Average estimated asset base of capitalized operating leases
+ Rent expense = Average invested capital
- Estimated depreciation on capitalized operating leases
= Net operating profit
- Estimated income tax expense
= NOPAT
We believe that ROIC is a useful financial measure for investors in evaluating our operating performance for the periods presented. When read in conjunctionwith our net earnings and total assets and compared to return on assets, it provides investors with a useful tool to evaluate our ongoing operations and ourmanagement of assets from period to period. In the past three years, we have incorporated ROIC into our key financial metrics, and since 2005 have used it asan executive incentive measure. Overall performance as measured by ROIC correlates directly to shareholders’ return over the long term. For the 12 fiscalmonths ended August 2, 2008, our ROIC decreased to 17.4% compared to 20.5% for the 12 months ended August 4, 2007. ROIC is not a measure of financialperformance under United States GAAP and should not be considered a substitute for return on assets, net earnings or total assets as determined in accordancewith GAAP and may not be comparable to similarly titled measures reported by other companies. See our ROIC reconciliation to GAAP below. The closestGAAP measure is return on assets, which decreased to 11.4% from 13.8% for the 12 months ended August 2, 2008 compared to the 12 months endedAugust 4, 2007.
Reconciliation 12 months ended August 2, 2008 August 4, 2007 Net earnings $ 640 $ 705 Add: income tax expense 417 442 Add: interest expense, net 115 43
Earnings before interest and income taxes 1,172 1,190 Add: rent expense 39 50 Less: estimated depreciation on capitalized operating leases1 (21) (27)
Net operating profit 1,190 1,213 Estimated income tax expense (471) (467)
Net operating profit after tax $ 719 $ 746
Average total assets2 $ 5,622 $ 5,101 Less: average non-interest-bearing current liabilities3 (1,491) (1,492)Less: average deferred property incentives2 (370) (357)Add: average estimated asset base of capitalized operating leases4 371 382
Average invested capital $ 4,132 $ 3,634
Return on Assets 11.4% 13.8%ROIC 17.4% 20.5%
1Depreciation based upon estimated asset base of capitalized operating leases as described in note 4 below.2Based upon the trailing 12-month average.3Based upon the trailing 12-month average for accounts payable, accrued salaries, wages and related benefits, other current liabilities and income taxes payable.4Based upon the trailing 12-month average of the monthly asset base which is calculated as the trailing 12 months rent expense multiplied by 8.
Our ROIC decreased primarily due to a decrease in our earnings before interest and income taxes compared to the prior year as well as an increase in ouraverage invested capital. The increase in average invested capital compared to the prior year is primarily due to the securitization transaction on May 1, 2007,which brought the entire portfolio of co-branded Nordstrom VISA credit card receivables on-balance sheet as of that date.
23 of 32
Table of Contents
Item 2. Management’s Discussion and Analysis of Financial Condition and Results of Operations (Continued) (Dollar and shareamounts in millions except per share and per square foot amounts)
LIQUIDITY AND CAPITAL RESOURCESOverall for the first six months of 2008, cash and cash equivalents decreased by $266, primarily due to capital expenditures, share repurchases and changes inaccounts receivable originated at third parties, partially offset by cash provided by operating activities. In the prior year, cash and cash equivalents decreaseddue to bringing the Nordstrom private label card and co-branded Nordstrom VISA credit card receivables into one on-balance sheet securitization program,capital expenditures, and share repurchases, partially offset by the $850 Series 2007-1 and 2007-2 Notes issued.
Operating ActivitiesNet cash provided by operating activities was $371 for the six months ended August 2, 2008, compared to net cash used in operating activities of $248 in thesame period last year. In the prior year, cash used in operating activities was primarily due to the increase in accounts receivable as a result of the new on-balance sheet co-branded Nordstrom VISA credit card receivables, partially offset by the elimination of investment in asset backed securities.
Investing ActivitiesNet cash used in investing activities for the six months ended August 2, 2008 increased by $157 to $468 compared to the same period in 2007, primarily dueto an increase in capital expenditures resulting from the timing of our new store openings and remodels. We are preparing to open three full-line stores:Thousand Oaks, Calif.; Indianapolis, Ind.; and Pittsburgh, Pa., in the third quarter of 2008. We also plan to relocate and open one new full-line store inTacoma, Wash., and open four Racks: White Plains, N.Y.; Laguna Hills, Calif.; Naperville, Ill.; and Lyndhurst, Ohio in the third quarter.
Additionally, we experienced growth in our co-branded Nordstrom VISA credit card receivables related to purchases made by our customers for other thanNordstrom merchandise and services. During the six months ended August 2, 2008, our customers used $174 for third party purchases, using our co-brandedNordstrom VISA credit cards, compared to $105 in the same period last year. The co-branded Nordstrom VISA credit cards enable our customers to purchaseat merchants outside of Nordstrom and accumulate points for our Nordstrom Fashion Rewards program. Through the Fashion RewardsTM program,customers may accumulate points which, upon reaching a cumulative purchase threshold, result in Nordstrom Notes®, which can be redeemed for goods orservices in our stores. Participation in the Fashion Rewards program has resulted in beneficial shifts in customer spending patterns and incremental sales.
Financing ActivitiesNet cash used in financing activities was $169 for the six months ended August 2, 2008, compared to net cash provided by financing activities of $335 for thesame period in 2007. The change was primarily due to cash inflows from the $850 in Notes issued during the securitization transaction in the prior year thatdid not recur in 2008, partially offset by a decrease in share repurchases in 2008 as compared to 2007.
During the second quarter, we adjusted the allocation of our available credit facilities, as discussed below, in order to minimize the cost of these facilities.These changes did not impact our total short-term credit capacity, which is consistent with the prior quarter at $900.
In May 2008, we exercised the $150 accordion feature on our existing revolving credit facility. This feature allowed us to increase our existing $500unsecured line of credit to a $650 unsecured line of credit. Under the terms of the agreement, we continue to pay a variable rate of interest on any outstandingbalance and a commitment fee based on our debt rating. The line of credit expires in November 2010, and contains restrictive covenants, which includemaintaining a leverage ratio. As of August 2, 2008, we had no outstanding borrowings under this line of credit.
In June 2008, in connection with the increase of our unsecured line of credit, we increased our $500 commercial paper program to $650. Under thiscommercial paper program, we may issue commercial paper in an aggregate amount outstanding at any particular time not to exceed $650. This agreementallows us to use the proceeds to fund general corporate purposes, including working capital, capital expenditures, acquisitions and share repurchases. Underthe terms of the commercial paper agreement, we pay a rate of interest based on, among other factors, the maturity of the issuance and market conditions. Theissuance of commercial paper has the effect, while it is outstanding, of reducing our borrowing capacity under the line of credit by an amount equal to theprinciple amount of the commercial paper. As of August 2, 2008, we had issued $79 in outstanding commercial paper. As of August 4, 2007, there were nooutstanding issuances of commercial paper.
24 of 32
Table of Contents
Item 2. Management’s Discussion and Analysis of Financial Condition and Results of Operations (Continued) (Dollar and shareamounts in millions except per share and per square foot amounts)
In connection with the changes to our unsecured line of credit and commercial paper program, we also reduced the capacity of our existing $300 variablefunding facility (2007-A Variable Funding Note) to $150. Borrowings under the facility incur interest based upon the cost of commercial paper issued by thethird-party bank conduit plus specified fees. As of August 2, 2008, no issuances have been made against this facility. The facility can be cancelled or notrenewed if our debt ratings fall below Standard and Poor’s BB+ rating or Moody’s Ba1 rating. As of September 10, 2008, our rating by Standard and Poor’swas A-, four grades above BB+, and by Moody’s was Baa1, three grades above Ba1.
Our reported results include $238 in share repurchases. In the first six months of 2008, we repurchased 6.1 shares of our common stock for an aggregatepurchase price of $212, at an average price per share of $34.77. In addition, our results for the quarter include the settlement of $26 in repurchases initiated inthe fourth quarter of 2007. In August 2007, our Board of Directors authorized a $1,500 share repurchase program and in November 2007 authorized anadditional $1,000 for share repurchases bringing the total program to $2,500. The program will expire in August 2009. As of August 2, 2008, we had $1,151in remaining capacity under our share repurchase program. The actual amount and timing of future share repurchases will be subject to market conditions andapplicable Securities and Exchange Commission rules.
Contractual ObligationsThere were no material changes in our contractual obligations as specified in Item 303(a)(5) of Regulation S-K during the six months ended August 2, 2008.For additional information regarding our contractual obligations as of February 2, 2008, see Management’s Discussion and Analysis section of the 2007 Form10-K.
LiquidityWe maintain a level of liquidity to allow us to cover our seasonal cash needs. We believe that our operating cash flows and available credit facilities aresufficient to finance our cash requirements for the next 12 months.
Over the long term, we manage our cash and capital structure to maximize shareholder return by minimizing our cost of capital, while maintaining ourfinancial position and flexibility for future strategic initiatives. We continuously assess our debt and leverage levels, capital expenditure requirements,principal debt payments, dividend payouts, potential share repurchases and future investments or acquisitions. We believe our operating cash flows andavailable credit facilities, as well as any potential future borrowing facilities will be sufficient to fund future payments and potential long-term initiatives.
25 of 32
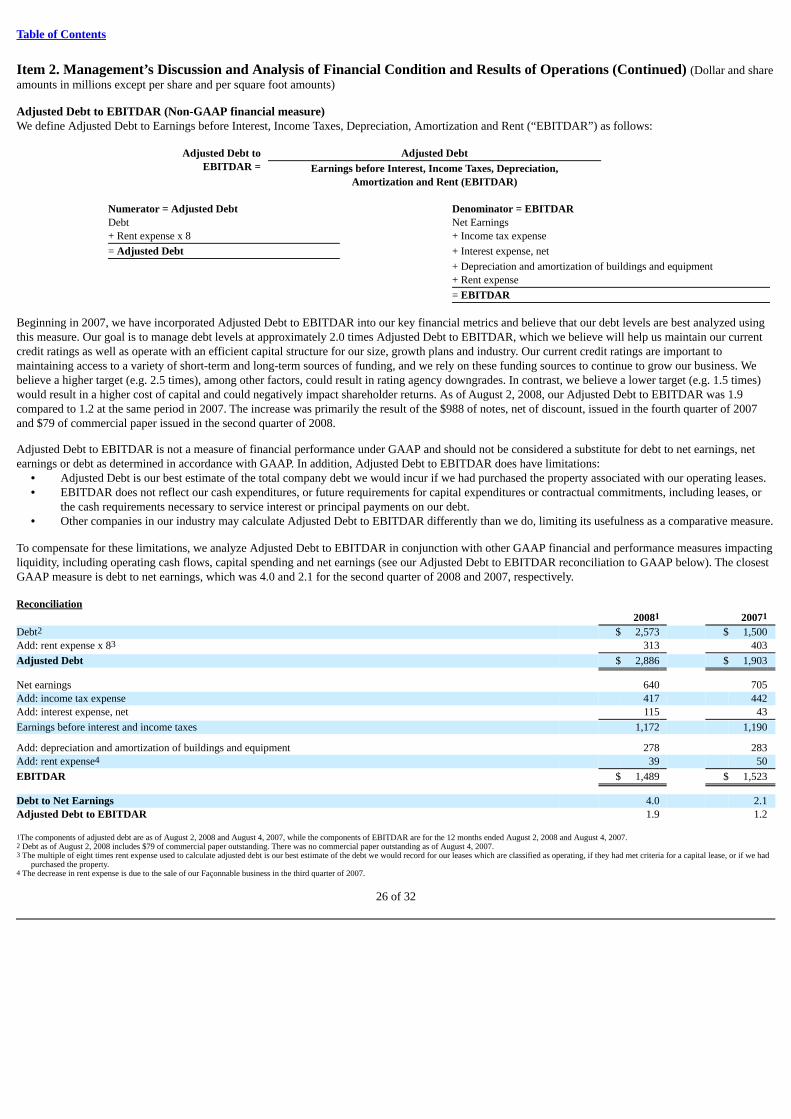
Table of Contents
Item 2. Management’s Discussion and Analysis of Financial Condition and Results of Operations (Continued) (Dollar and shareamounts in millions except per share and per square foot amounts)
Adjusted Debt to EBITDAR (Non-GAAP financial measure)We define Adjusted Debt to Earnings before Interest, Income Taxes, Depreciation, Amortization and Rent (“EBITDAR”) as follows: Adjusted Debt to Adjusted Debt EBITDAR =
Earnings before Interest, Income Taxes, Depreciation, Amortization and Rent (EBITDAR)
Numerator = Adjusted Debt Denominator = EBITDAR Debt Net Earnings + Rent expense x 8 + Income tax expense
= Adjusted Debt + Interest expense, net
+ Depreciation and amortization of buildings and equipment + Rent expense
= EBITDAR
Beginning in 2007, we have incorporated Adjusted Debt to EBITDAR into our key financial metrics and believe that our debt levels are best analyzed usingthis measure. Our goal is to manage debt levels at approximately 2.0 times Adjusted Debt to EBITDAR, which we believe will help us maintain our currentcredit ratings as well as operate with an efficient capital structure for our size, growth plans and industry. Our current credit ratings are important tomaintaining access to a variety of short-term and long-term sources of funding, and we rely on these funding sources to continue to grow our business. Webelieve a higher target (e.g. 2.5 times), among other factors, could result in rating agency downgrades. In contrast, we believe a lower target (e.g. 1.5 times)would result in a higher cost of capital and could negatively impact shareholder returns. As of August 2, 2008, our Adjusted Debt to EBITDAR was 1.9compared to 1.2 at the same period in 2007. The increase was primarily the result of the $988 of notes, net of discount, issued in the fourth quarter of 2007and $79 of commercial paper issued in the second quarter of 2008.
Adjusted Debt to EBITDAR is not a measure of financial performance under GAAP and should not be considered a substitute for debt to net earnings, netearnings or debt as determined in accordance with GAAP. In addition, Adjusted Debt to EBITDAR does have limitations: • Adjusted Debt is our best estimate of the total company debt we would incur if we had purchased the property associated with our operating leases. • EBITDAR does not reflect our cash expenditures, or future requirements for capital expenditures or contractual commitments, including leases, or
the cash requirements necessary to service interest or principal payments on our debt. • Other companies in our industry may calculate Adjusted Debt to EBITDAR differently than we do, limiting its usefulness as a comparative measure.
To compensate for these limitations, we analyze Adjusted Debt to EBITDAR in conjunction with other GAAP financial and performance measures impactingliquidity, including operating cash flows, capital spending and net earnings (see our Adjusted Debt to EBITDAR reconciliation to GAAP below). The closestGAAP measure is debt to net earnings, which was 4.0 and 2.1 for the second quarter of 2008 and 2007, respectively. Reconciliation 20081 20071 Debt2 $ 2,573 $ 1,500 Add: rent expense x 83 313 403
Adjusted Debt $ 2,886 $ 1,903
Net earnings 640 705 Add: income tax expense 417 442 Add: interest expense, net 115 43
Earnings before interest and income taxes 1,172 1,190 Add: depreciation and amortization of buildings and equipment 278 283 Add: rent expense4 39 50
EBITDAR $ 1,489 $ 1,523
Debt to Net Earnings 4.0 2.1 Adjusted Debt to EBITDAR 1.9 1.2
1The components of adjusted debt are as of August 2, 2008 and August 4, 2007, while the components of EBITDAR are for the 12 months ended August 2, 2008 and August 4, 2007.2 Debt as of August 2, 2008 includes $79 of commercial paper outstanding. There was no commercial paper outstanding as of August 4, 2007.3 The multiple of eight times rent expense used to calculate adjusted debt is our best estimate of the debt we would record for our leases which are classified as operating, if they had met criteria for a capital lease, or if we had
purchased the property.4 The decrease in rent expense is due to the sale of our Façonnable business in the third quarter of 2007.
26 of 32
Table of Contents
Item 2. Management’s Discussion and Analysis of Financial Condition and Results of Operations (Continued) (Dollar and shareamounts in millions except per share and per square foot amounts)
CRITICAL ACCOUNTING POLICIESThe preparation of our financial statements requires that we make estimates and judgments that affect the reported amounts of assets, liabilities, revenues andexpenses, and disclosure of contingent assets and liabilities. We base our estimates on historical experience and other assumptions that we believe to bereasonable under the circumstances. Actual results may differ from these estimates. Our critical accounting policies and methodologies in 2008 are consistentwith those discussed in our 2007 Annual Report on Form 10-K.
RECENT ACCOUNTING PRONOUNCEMENTSIn December 2007, the FASB issued Statement of Financial Accounting Standards No. 141 (Revised 2007), Business Combinations (“SFAS 141(R)”). UnderSFAS 141(R), an acquiring entity will be required to recognize all the assets acquired and liabilities assumed in a transaction at the acquisition-date fair valuewith limited exceptions. SFAS 141(R) will change the accounting treatment for certain specific acquisition-related items, including expensing acquisition-related costs as incurred, valuing noncontrolling interests (minority interests) at fair value at the acquisition date, and expensing restructuring costs associatedwith an acquired business. SFAS 141(R) also includes a substantial number of new disclosure requirements. SFAS 141(R) is to be applied prospectively tobusiness combinations for which the acquisition date is on or after January 1, 2009. Early adoption is not permitted. Generally, the effect of SFAS 141(R) willdepend on the circumstances of any potential future acquisition.
Also in December 2007, the FASB issued Statement of Financial Accounting Standards No. 160, Noncontrolling Interests in Consolidated FinancialStatements — an amendment of ARB No. 51 (“SFAS 160”). SFAS 160 establishes new accounting and reporting standards for a noncontrolling interest(minority interest) in a subsidiary, provides guidance on the accounting for and reporting of the deconsolidation of a subsidiary, and increases transparencythrough expanded disclosures. Specifically, SFAS 160 requires the recognition of a minority interest as equity in the consolidated financial statements andseparate from the parent company’s equity. It also requires consolidated net earnings in the consolidated statement of earnings to include the amount of netearnings attributable to minority interest. This statement will be effective for Nordstrom as of the beginning of fiscal year 2009. Early adoption is notpermitted. We are presently evaluating the impact of the adoption of SFAS 160 and believe there will be no material impact on our consolidated financialstatements.
In February 2008, the FASB issued FASB Staff Position No. FAS 157-2, (“FSP FAS 157-2”), which delayed the effective date of SFAS 157 for allnonfinancial assets and nonfinancial liabilities, except those that are recognized or disclosed at fair value in the financial statements on a recurring basis (atleast annually), to fiscal years beginning after November 15, 2008. We are presently evaluating the impact of the adoption of SFAS 157 for our nonfinancialassets and nonfinancial liabilities and do not believe it will have a material effect on our consolidated financial statements.
In March 2008, the FASB issued Statement of Financial Accounting Standards No. 161, Disclosures About Derivative Instruments and Hedging Activities —an amendment of FASB Statement No. 133 (“SFAS 161”). SFAS 161 expands the disclosure requirements in SFAS 133 about an entity’s derivativeinstruments and hedging activities. This statement will be effective for Nordstrom as of the beginning of fiscal year 2009. We are currently evaluating theimpact of the adoption of SFAS 161.
In May 2008, the FASB issued Statement of Financial Accounting Standards No. 162, The Hierarchy of Generally Accepted Accounting Principles (“SFAS162”). SFAS 162 identifies a consistent framework, or hierarchy, for selecting accounting principles to be used in preparing financial statements that arepresented in conformity with U.S. GAAP for non-governmental entities. SFAS 162 is effective 60 days following the Securities and Exchange Commission’sapproval of the Public Company Accounting Oversight Board amendments to AU Section 411, “The Meaning of Presenting Fairly in Conformity withGenerally Accepted Accounting Principles.” We are assessing the impact of the adoption of SFAS 162 and believe there will be no material impact on ourconsolidated financial statements.
27 of 32
Table of Contents
Item 3. Quantitative and Qualitative Disclosures About Market Risk
We discussed our interest rate risk and our foreign currency exchange risk in Part 1, “Item 7A. Quantitative and Qualitative Disclosures About Market Risk”of our Annual Report on Form 10-K for the fiscal year ended February 2, 2008. There has been no material change to these risks since that time.
Item 4. Controls and Procedures
As of the end of the period covered by this Quarterly Report on Form 10-Q, the Company performed an evaluation under the supervision and with theparticipation of management, including our President and Chief Financial Officer, of the design and effectiveness of our disclosure controls and procedures(as defined in Rules 13a-15(e) or 15d-15(e) under the Securities and Exchange Act of 1934 (the “Exchange Act”)). Based upon that evaluation, our Presidentand Chief Financial Officer concluded that, as of the end of the period covered by this Quarterly Report, our disclosure controls and procedures were effectivein the timely and accurate recording, processing, summarizing and reporting of material financial and non-financial information within the time periodsspecified within the Commission’s rules and forms. Our President and Chief Financial Officer also concluded that our disclosure controls and procedureswere effective to ensure that information required to be disclosed in the reports that we file or submit under the Exchange Act is accumulated andcommunicated to our management, including our President and Chief Financial Officer, to allow timely decisions regarding required disclosure.
There has been no change in our internal control over financial reporting (as defined in Rules 13a-15(f) or 15d-15(f) of the Exchange Act) during our mostrecently completed fiscal quarter that has materially affected, or is reasonably likely to materially affect, our internal control over financial reporting.
28 of 32
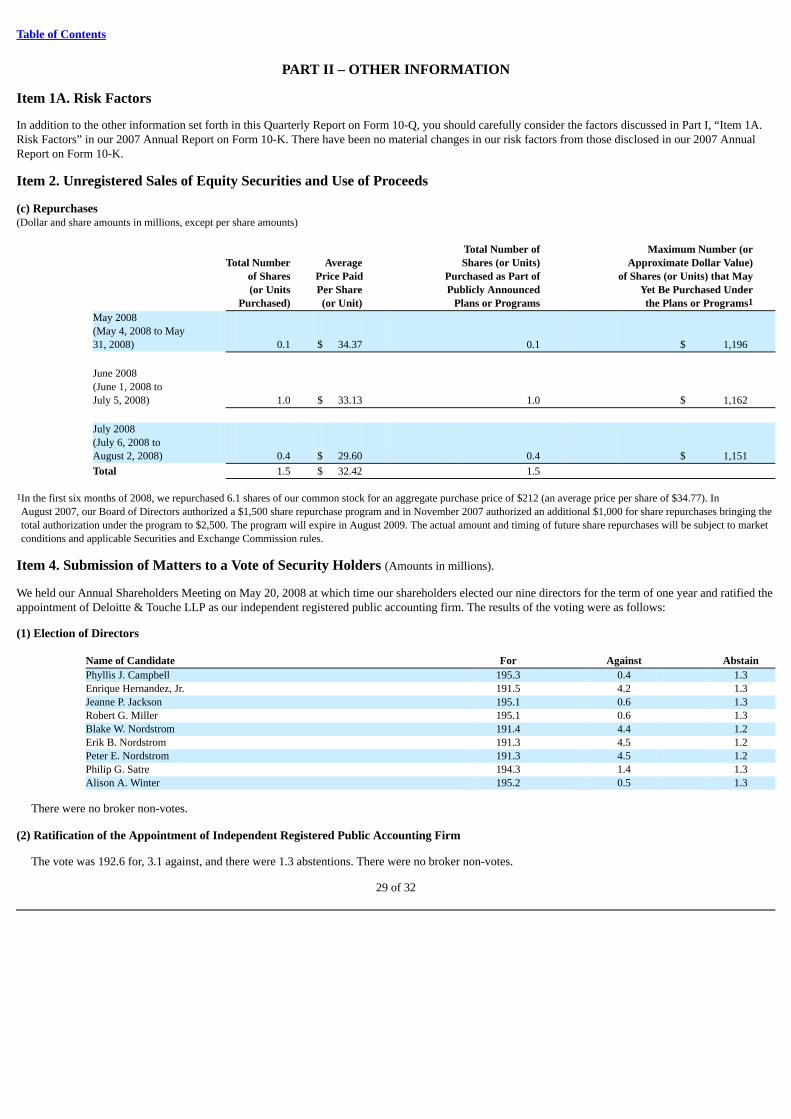
Table of Contents
PART II – OTHER INFORMATION
Item 1A. Risk Factors
In addition to the other information set forth in this Quarterly Report on Form 10-Q, you should carefully consider the factors discussed in Part I, “Item 1A.Risk Factors” in our 2007 Annual Report on Form 10-K. There have been no material changes in our risk factors from those disclosed in our 2007 AnnualReport on Form 10-K.
Item 2. Unregistered Sales of Equity Securities and Use of Proceeds
(c) Repurchases(Dollar and share amounts in millions, except per share amounts)
Total Number of Maximum Number (or Total Number Average Shares (or Units) Approximate Dollar Value) of Shares Price Paid Purchased as Part of of Shares (or Units) that May (or Units Per Share Publicly Announced Yet Be Purchased Under Purchased) (or Unit) Plans or Programs the Plans or Programs1 May 2008(May 4, 2008 to May31, 2008) 0.1 $ 34.37 0.1 $ 1,196
June 2008(June 1, 2008 toJuly 5, 2008) 1.0 $ 33.13 1.0 $ 1,162
July 2008(July 6, 2008 toAugust 2, 2008) 0.4 $ 29.60 0.4 $ 1,151
Total 1.5 $ 32.42 1.5
1In the first six months of 2008, we repurchased 6.1 shares of our common stock for an aggregate purchase price of $212 (an average price per share of $34.77). InAugust 2007, our Board of Directors authorized a $1,500 share repurchase program and in November 2007 authorized an additional $1,000 for share repurchases bringing thetotal authorization under the program to $2,500. The program will expire in August 2009. The actual amount and timing of future share repurchases will be subject to marketconditions and applicable Securities and Exchange Commission rules.
Item 4. Submission of Matters to a Vote of Security Holders (Amounts in millions).
We held our Annual Shareholders Meeting on May 20, 2008 at which time our shareholders elected our nine directors for the term of one year and ratified theappointment of Deloitte & Touche LLP as our independent registered public accounting firm. The results of the voting were as follows:
(1) Election of Directors Name of Candidate For Against AbstainPhyllis J. Campbell 195.3 0.4 1.3Enrique Hernandez, Jr. 191.5 4.2 1.3Jeanne P. Jackson 195.1 0.6 1.3Robert G. Miller 195.1 0.6 1.3Blake W. Nordstrom 191.4 4.4 1.2Erik B. Nordstrom 191.3 4.5 1.2Peter E. Nordstrom 191.3 4.5 1.2Philip G. Satre 194.3 1.4 1.3Alison A. Winter 195.2 0.5 1.3
There were no broker non-votes.
(2) Ratification of the Appointment of Independent Registered Public Accounting Firm
The vote was 192.6 for, 3.1 against, and there were 1.3 abstentions. There were no broker non-votes.
29 of 32

Table of Contents
Item 6. Exhibits
Exhibits are incorporated herein by reference or are filed with this report as set forth in the Index to Exhibits on page 32 hereof.
30 of 32
Table of Contents
SIGNATURES
Pursuant to the requirements of the Securities Exchange Act of 1934, the Registrant has duly caused this report to be signed on its behalf by the undersignedthereunto duly authorized. NORDSTROM, INC.
(Registrant)
/s/ Michael G. Koppel Michael G. Koppel
Executive Vice President and Chief Financial Officer(Principal Financial Officer)
Date: September 10, 2008
31 of 32
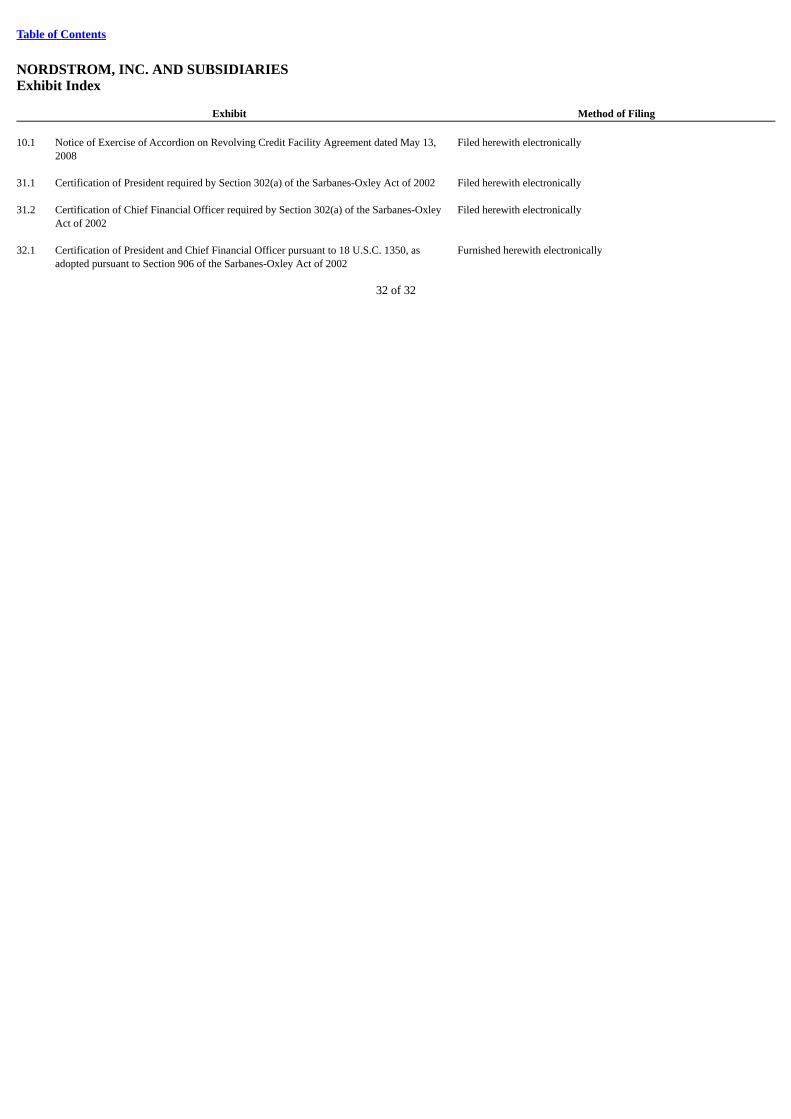
Table of Contents
NORDSTROM, INC. AND SUBSIDIARIESExhibit Index
Exhibit Method of Filing
10.1
Notice of Exercise of Accordion on Revolving Credit Facility Agreement dated May 13,2008
Filed herewith electronically
31.1 Certification of President required by Section 302(a) of the Sarbanes-Oxley Act of 2002 Filed herewith electronically 31.2
Certification of Chief Financial Officer required by Section 302(a) of the Sarbanes-OxleyAct of 2002
Filed herewith electronically
32.1
Certification of President and Chief Financial Officer pursuant to 18 U.S.C. 1350, asadopted pursuant to Section 906 of the Sarbanes-Oxley Act of 2002
Furnished herewith electronically
32 of 32
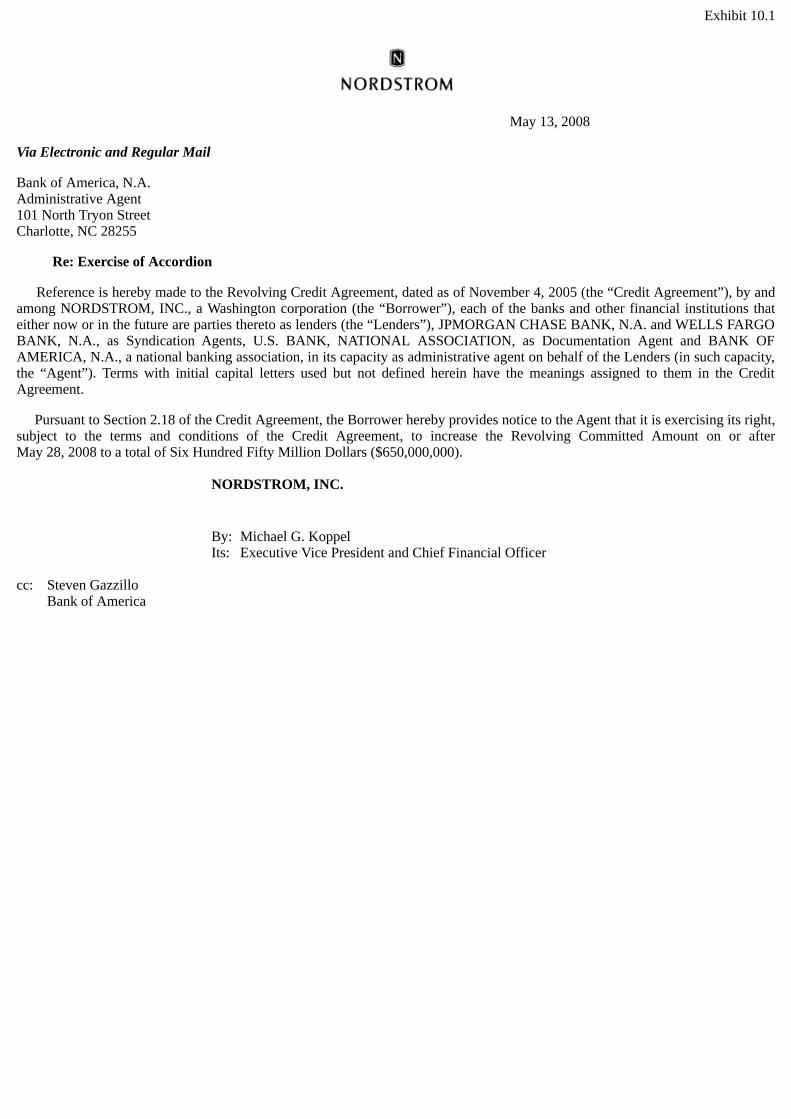
Exhibit 10.1
May 13, 2008
Via Electronic and Regular Mail
Bank of America, N.A.Administrative Agent101 North Tryon StreetCharlotte, NC 28255
Re: Exercise of Accordion
Reference is hereby made to the Revolving Credit Agreement, dated as of November 4, 2005 (the “Credit Agreement”), by andamong NORDSTROM, INC., a Washington corporation (the “Borrower”), each of the banks and other financial institutions thateither now or in the future are parties thereto as lenders (the “Lenders”), JPMORGAN CHASE BANK, N.A. and WELLS FARGOBANK, N.A., as Syndication Agents, U.S. BANK, NATIONAL ASSOCIATION, as Documentation Agent and BANK OFAMERICA, N.A., a national banking association, in its capacity as administrative agent on behalf of the Lenders (in such capacity,the “Agent”). Terms with initial capital letters used but not defined herein have the meanings assigned to them in the CreditAgreement.
Pursuant to Section 2.18 of the Credit Agreement, the Borrower hereby provides notice to the Agent that it is exercising its right,subject to the terms and conditions of the Credit Agreement, to increase the Revolving Committed Amount on or afterMay 28, 2008 to a total of Six Hundred Fifty Million Dollars ($650,000,000). NORDSTROM, INC.
By: Michael G. Koppel Its: Executive Vice President and Chief Financial Officer cc: Steven Gazzillo Bank of America
Exhibit 31.1
Certification required by Section 302(a) of the Sarbanes-Oxley Act of 2002
I, Blake W. Nordstrom, certify that:
1. I have reviewed this Quarterly Report on Form 10-Q of Nordstrom, Inc.;
2. Based on my knowledge, this report does not contain any untrue statement of a material fact or omit to state a material fact necessary to make thestatements made, in light of the circumstances under which such statements were made, not misleading with respect to the period covered by this report;
3. Based on my knowledge, the financial statements, and other financial information included in this report, fairly present in all material respects the financialcondition, results of operations and cash flows of the registrant as of, and for, the periods presented in this report;
4. The registrant’s other certifying officer and I are responsible for establishing and maintaining disclosure controls and procedures (as defined in ExchangeAct Rules 13a-15(e) and 15d-15(e)) and internal control over financial reporting (as defined in Exchange Act Rules 13a-15(f) and 15d-15(f)) for the registrantand have:
a) Designed such disclosure controls and procedures, or caused such disclosure controls and procedures to be designed under our supervision, to ensurethat material information relating to the registrant, including its consolidated subsidiaries, is made known to us by others within those entities, particularlyduring the period in which this report is being prepared;
b) Designed such internal control over financial reporting, or caused such internal control over financial reporting to be designed under our supervision, toprovide reasonable assurance regarding the reliability of financial reporting and the preparation of financial statements for external purposes in accordancewith generally accepted accounting principles;
c) Evaluated the effectiveness of the registrant’s disclosure controls and procedures and presented in this report our conclusions about the effectiveness ofthe disclosure controls and procedures, as of the end of the period covered by this report based on such evaluation; and
d) Disclosed in this report any change in the registrant’s internal control over financial reporting that occurred during the registrant’s most recent fiscalquarter (the registrant’s fourth fiscal quarter in the case of an annual report) that has materially affected, or is reasonably likely to materially affect, theregistrant’s internal control over financial reporting; and
5. The registrant’s other certifying officer and I have disclosed, based on our most recent evaluation of internal control over financial reporting, to theregistrant’s auditors and the audit committee of registrant’s board of directors (or persons performing the equivalent functions):
a) All significant deficiencies and material weaknesses in the design or operation of internal control over financial reporting which are reasonably likely toadversely affect the registrant’s ability to record, process, summarize and report financial information; and
b) Any fraud, whether or not material, that involves management or other employees who have a significant role in the registrant’s internal control overfinancial reporting.
/s/ Blake W. Nordstrom Blake W. Nordstrom
President of Nordstrom, Inc.
Date: September 10, 2008
Exhibit 31.2
Certification required by Section 302(a) of the Sarbanes-Oxley Act of 2002
I, Michael G. Koppel, certify that:
1. I have reviewed this Quarterly Report on Form 10-Q of Nordstrom, Inc.;
2. Based on my knowledge, this report does not contain any untrue statement of a material fact or omit to state a material fact necessary to make thestatements made, in light of the circumstances under which such statements were made, not misleading with respect to the period covered by this report;
3. Based on my knowledge, the financial statements, and other financial information included in this report, fairly present in all material respects the financialcondition, results of operations and cash flows of the registrant as of, and for, the periods presented in this report;
4. The registrant’s other certifying officer and I are responsible for establishing and maintaining disclosure controls and procedures (as defined in ExchangeAct Rules 13a-15(e) and 15d-15(e)) and internal control over financial reporting (as defined in Exchange Act Rules 13a-15(f) and 15d-15(f)) for the registrantand have:
a) Designed such disclosure controls and procedures, or caused such disclosure controls and procedures to be designed under our supervision, to ensurethat material information relating to the registrant, including its consolidated subsidiaries, is made known to us by others within those entities, particularlyduring the period in which this report is being prepared;
b) Designed such internal control over financial reporting, or caused such internal control over financial reporting to be designed under our supervision, toprovide reasonable assurance regarding the reliability of financial reporting and the preparation of financial statements for external purposes in accordancewith generally accepted accounting principles;
c) Evaluated the effectiveness of the registrant’s disclosure controls and procedures and presented in this report our conclusions about the effectiveness ofthe disclosure controls and procedures, as of the end of the period covered by this report based on such evaluation; and
d) Disclosed in this report any change in the registrant’s internal control over financial reporting that occurred during the registrant’s most recent fiscalquarter (the registrant’s fourth fiscal quarter in the case of an annual report) that has materially affected, or is reasonably likely to materially affect, theregistrant’s internal control over financial reporting; and
5. The registrant’s other certifying officer and I have disclosed, based on our most recent evaluation of internal control over financial reporting, to theregistrant’s auditors and the audit committee of registrant’s board of directors (or persons performing the equivalent functions):
a) All significant deficiencies and material weaknesses in the design or operation of internal control over financial reporting which are reasonably likely toadversely affect the registrant’s ability to record, process, summarize and report financial information; and
b) Any fraud, whether or not material, that involves management or other employees who have a significant role in the registrant’s internal control overfinancial reporting.
/s/ Michael G. Koppel Michael G. Koppel
Executive Vice President and ChiefFinancial Officer of Nordstrom, Inc.
Date: September 10, 2008
Exhibit 32.1
NORDSTROM, INC.
1617 SIXTH AVENUE
SEATTLE, WASHINGTON 98101
CERTIFICATION PURSUANT TO18 U.S.C. SECTION 1350,
AS ADOPTED PURSUANT TOSECTION 906 OF THE SARBANES-OXLEY ACT OF 2002
In connection with the Quarterly Report of Nordstrom, Inc (the “Company”) on Form 10-Q for the period ended August 2, 2008, as filed with the Securitiesand Exchange Commission on the date hereof (the “Report”), we, Blake W. Nordstrom, President (Principal Executive Officer), and Michael G. Koppel,Executive Vice President and Chief Financial Officer (Principal Financial Officer), of the Company, certify, pursuant to 18 U.S.C. Section 1350, as adoptedpursuant to Section 906 of the Sarbanes-Oxley Act of 2002, that:
• The Report fully complies with the requirements of Section 13(a) or 15(d) of the Securities Exchange Act of 1934; and
• The information contained in the Report fairly presents, in all material respects, the financial condition and results of operations of the Company. September 10, 2008
/s/ Blake W. Nordstrom Blake W. Nordstrom President /s/ Michael G. Koppel Michael G. Koppel
Executive Vice President andChief Financial Officer
A signed original of this written statement required by Section 906 has been provided to Nordstrom, Inc. and will be retained by Nordstrom, Inc. andfurnished to the Securities and Exchange Commission or its staff upon request.


