Embed Size (px)
Citation preview

North-eastern Laurentide, western Greenland andsouthern Innuitian ice stream dynamics during the lastglacial cycle
QUENTIN SIMON,1* CLAUDE HILLAIRE-MARCEL,1 GUILLAUME ST-ONGE1,2 and JOHN T. ANDREWS31GEOTOP-UQAM, Montreal, QC, Canada2Canada Research Chair in Marine Geology, ISMER-UQAR, Rimouski, QC, Canada3INSTAAR, University of Colorado, Boulder, CO, USA
Received 29 October 2012; Revised 22 April 2013; Accepted 12 June 2013
ABSTRACT: Precise relationships between high-frequency ice sheet dynamics and late Quaternary climatevariability are still poorly understood, notably with regard to their relative timing and causal mechanisms. BaffinBay is of particular interest in this regard due to the influence of ice streaming activities from the north-easternLaurentide, southern Innuitian and western Greenland ice margins on its sedimentary regimes during glacial times.Here we document such ice margin dynamics using a sedimentological analysis performed on a piston core fromcentral Baffin Bay and spanning the last 115 ka. Lithofacies analysis and mineralogical assemblages are used toreconstruct sediment sources (using the SedUnMix program) and depositional mechanisms. Coarse detritalcarbonate (DC, dolomite-rich) layers are attributed either to north-eastern Laurentide and Innuitian ice streamsurges or to pervasive ice rafted debris delivery processes at distinct periods. Out-of-phase fine-grainedglaciomarine sediments with a mineralogical signature from western Greenland, linked to Uummannaq icestreaming activity, are interbedded with the coarse DC layers. The new results suggest that during the last glacialcycle, the north-eastern Laurentide and southern Innuitian ice streams were sensitive to high-frequency climatefluctuations, such as the Dansgaard–Oeschger events, while the western Greenland margins were more sensitive tolarge-scale climatic/oceanic reorganizations, such as relative sea-level changes and/or advection of warmerAtlantic waters into the bay. Copyright # 2013 John Wiley & Sons, Ltd.
KEYWORDS: Baffin Bay; ice stream; last glacial cycle; sediment provenance; X-ray diffraction.
Introduction
Over the last few decades, ice sheet and glacier dynamicshave received considerable attention, notably due to acceler-ated melting of the Greenland Ice Sheet (GIS) and majoroutlet retreats (e.g. Weidick and Bennike, 2007; Hollandet al., 2008; Alley et al., 2010; Rignot and Mouginot, 2012).Numerous studies and publications have also focused on pastice sheet dynamics, especially with regard to the linkagesbetween Laurentide Ice Sheet (LIS) instabilities and Quater-nary climatic changes (e.g. MacAyeal, 1993; Bond andLotti, 1995; Bond et al., 1999; Dowdeswell et al., 1995,1997, 1999; Andrews, 2000; Andrews and Maclean 2003;Hemming, 2004; Hulbe et al., 2004). The growth and decayof ice sheets are controlled by (1) mass balance parameters(e.g. accumulation of snow and ice, calving at marine-basedmargins, basal melting) relating to atmospheric and oceanicchanges (Marshall and Koutnik, 2006), and (2) intrinsic icesheet instabilities (e.g. Heinrich events). The mass balanceand stability of ice sheets is associated with rapidly flowingice streams and outlet glaciers along their margins (Stokesand Clark, 2001). The modeling of the ice sheet responsesto past and present climatic changes is a prerequisite tounderstanding their past behavior and is essential for interpre-tation of the ongoing ice stream retreats along the Greenlandice margin. Building such simulations requires knowledge ofrates and timing of the rapid and/or long-term ice streamingprocesses (Stokes and Tarasov, 2010). However, the triggeringand driving mechanisms behind such processes and theirtiming are still poorly documented. As a consequence, recentchanges in Greenland ice margin dynamics could be attribut-ed to either climate/ocean warming (through mass balancechanges) or to longer-term changes in the GIS budget
responses to Holocene climate changes (i.e. a mix of massbalance and internal dynamics; Stokes et al., 2012).In this respect, and because it was surrounded by some of
the largest Late Quaternary ice sheets, Baffin Bay holds greatinterest for the identification of ice margin dynamics [i.e. thewestern Greenland, north-eastern (NE) Laurentide and south-ern Innuitian Ice Sheets] from its sedimentary records. Toachieve this, the recognition of sedimentary features interrigenous layers that are characteristic of their origin,transport and depositional mechanisms is required. In addi-tion, the temporal relationship between such layers and high-frequency ice sheet and/or climate variability is also critical.Until now, the interpretations of sedimentary sequences fromBaffin Bay have proven challenging due to the lack of well-dated records (Simon et al., 2012). Moreover, very fewmarine geophysical and geological data reflecting ice streamadvances and retreats pre-dating the Last Glacial Maximum(LGM) are available, due largely to ice erosion during theLGM itself and the last deglaciation (Andrews et al., 1998;Alley et al., 2010), thus hampering any direct reconstructionof the longer (pre-LGM) history of paleo-ice streams and theirdynamics during glacial times.In this paper, we use sedimentological and mineralogical
properties of a piston core (HU2008-029-016PC, Fig. 1)raised from central Baffin Bay and spanning the last 115 ka(Simon et al., 2012) to document surrounding ice margindynamics. Lithofacies analysis and mineralogical assemblagesare used to unravel and discuss sediment provenance anddepositional mechanisms. The main objectives of this paperare to (i) reconstruct sediment provenances based on mineral-ogical assemblages (using the SedUnMix program developedby Andrews and Eberl, 2012), (ii) compare provenancesignatures and transport/depositional processes, (iii) docu-ment the advance and retreat of western Greenland andeastern Baffin Island ice margins, and their timing with regard
�Correspondence: Q. Simon, as above.E-mail: [email protected]
Copyright # 2013 John Wiley & Sons, Ltd.
JOURNAL OF QUATERNARY SCIENCE (2013) ISSN 0267-8179. DOI: 10.1002/jqs.2648

to climatic/oceanic variability (e.g. Dansgaard–Oeschgercycles) during the last glacial cycle, and (iv) compare thesereconstructions with recent model experiments (e.g. Gano-polski et al., 2010; Stokes et al., 2012).
Regional setting
Baffin Bay (Fig. 1) is a narrow oceanic basin (1300 km longand 450 km wide, �690 000 km2) resulting from the exten-sion of the North Atlantic-Labrador Shelf Sea rift system(Maclean et al., 1990). Surface current circulation is counter-clockwise in the bay (Tang et al., 2004; Fig. 1). Extensive seaice (mainly first-year sea ice) covers the bay except in Augustand September. The influence of Atlantic waters on theGreenland margin contributes to an asymmetric distributionof the sea ice cover (Tang et al., 2004). The present-day fast-flowing outlets of the GIS are estimated to have a totaliceberg flux of �141 km3 a�1 (Bigg and Wadley, 2001), whilethe contribution from tidewater glaciers on the CanadianArctic Archipelago are minor (Weidick and Bennike, 2007).Marshall and Koutnik (2006) have estimated the total icebergflux originating from ice sheets that surrounded Baffin Bayduring the last glacial cycle to be �16.8� 106 km3.The bedrock geology of the circum-Baffin Bay region is
largely characterized by a Precambrian crystalline basementoverlain by a Lower Paleozoic succession dominated byshallow-marine platform carbonates at the northern end ofthe bay (Hiscott et al., 1989). Paleocene rifting resulted inbasaltic flows observed on the Greenland Precambrian Shieldmargins near the Disko Island and Uummannaq fjord regions
(see Fig. 1 for a geological overview, and Harrison et al.,2011, for a detailed geological map of the area). Baffin Bay isbounded to the north by Nares Strait, a probable transformfault, and to the south by the Ungava transform fault systemunderlying Davis Strait (Ehrhardt et al., 2008). The centralabyssal plain (2000–2500m) is surrounded by steep continen-tal slopes on both sides, while the northern slope dips slightlytowards the abyssal plain (Li et al., 2011). Thick sedimentarystrata are found along the narrow east Baffin Island shelf(25–50 km) and the opposing and much broader westGreenland shelf (>250 km), which is also characterized bylarge submarine fans at the mouth of cross-shelf troughs(Jakobsson et al., 2012).The identification and recent interpretation of a series of
major submarine fans located at the mouths of westernGreenland cross-shelf troughs (e.g. Uummannaq fan at themouth of the Uummannaq Trough), and marine geophysicaland geological data provide clear evidence for a formerextension of fast-flowing grounded ice streams across theWest Greenland continental shelf during the LGM (O Cofaighet al., 2012, 2013). Such major fan structures are eitherabsent or very limited on the narrower eastern Baffin Islandshelf. O Cofaigh et al. (2012) suggested that these geomor-phological discrepancies may be explained by the widerGreenland shelf together with larger ice sheet outlets, as theseallow a large ice stream flow path on the Greenland side,while the shorter continental shelf and smaller fjord outletsfrom Baffin Island do not favor the development of large icestreams. Furthermore, the repeated occupation of majorcross-shelf troughs by successive grounded ice streams during
PC16
3500 m
3000 m
2500 m
2000 m
1500 m
1250 m
1000 m
750 m
500 m
250 m
100 m
50 m
Oce
an D
ata
Vie
w
60 N
65 N
70 N
75 N
80 N
90 W
80 W70 W 60 W
50 W
40 W
Siliciclastic (quartzarenites) rocks interbedded with minor shales, limestones and dolostones (Thule Group and Borden Basin)
Cambrian to Late Devonian limestones and dolostones, interbedded with calcareous shales + Late Triassic clastics and carbonates and Cretaceous-Paleocene siliciclastic outcrops
Paleocene - Late Cretaceous “Tertiary volcanics” basalts (i.e., mafic)
Granites of the 'Cumberland batholith (1850-1870 Ma) and Piling Group (Baffin orogen) + gneisses and metasediments (marbles and siliciclastic rocks) in Rinkian mobile belt (i.e., Karrat Group) + felsic granites in the Ketilidian mobile belt (KMB) (South Greenland)
Archean Block (AB) - gneisses (orthogneiss in granulite facies) 3200
Pre
cam
bria
n S
hiel
d
Granites, granite gneiss and quartzofeldspathic orthogneiss + metasediments (marbles and siliciclastic rocks) in the Rae Craton (Committee belt, Churchill Province) and Rinkian mobile belt 3200Nagssugtoqidian Mobile Belt (NMB) - reworked granulite facies Archaean gneisses in early Proterozoic fold belts in West Greenland
Arc
hean
Pro
tero
zoic
Age (Ma)34-70360-542
12001750-
Paleo-zoic
2500-
650-
GIS
LIS
IIS
Paleozoiccarbonate outcrops
West Greenland Intermediate Water
Arctic Water
Core Location
Nagssutoqidian Mobile Belt
Archean Block
Ketilidian Mobile Belt
Rinkian Mobile Belt
Karrat Group
Thule Group
Borden Basin
Piling Group
Committee Fold Belt
Uummannaq
Jakobshavn Baffin Island
Nares Strait
Melville Bugt Major LGM ice-streams
Ellesmere Isl.
?LGM ice-sheets maximum extent?
Hudson Strait
Cumberland Sound
BoothiaSound
Hudson Bay
Regional ice-sheets: IIS: Innuitian GIS: GreenlandLIS: Laurentide
Figure 1. Baffin Bay generalmap and core location. The ba-thymetry, oceanic circulationand simplified bedrock geologyare from www.geus.dk, Harrisonet al. (2011) and Tang et al.(2004). Last Glacial Maximumlimits of the Greenland (GIS),Innuitian (IIS) and Laurentide(LIS) ice sheets and major icestream locations are adaptedfrom Funder et al. (2011), OCofaigh et al. (2012, 2013), Dyke(2004), England et al. (2006) andLi et al. (2011). This figure isavailable in colour online at wi-leyonlinelibrary.com.
Copyright # 2013 John Wiley & Sons, Ltd. J. Quaternary Sci., (2013)
JOURNAL OF QUATERNARY SCIENCE

glacial maxima has probably increased the erosion andrecycling of Greenland shelf sediments and their deliveryoffshore into Baffin Bay.
Glacial history
During the LGM, the NE LIS, the Innuitian Ice Sheet (IIS)and the western GIS constituted an almost continuous icebelt surrounding Baffin Bay (Fig. 1). NE LIS and southern IISice streams (in Lancaster Sound, Jones Sound and SmithSound – Nares Strait) advanced into northern Baffin Bay(MacLean et al., 2010) with an LGM grounding line situated270 km off the mouth of Lancaster Sound (in a water depthof 1300m; Li et al., 2011) and potentially expanded laterallyto create an ice shelf in the northern part of the bay (Hulbeet al., 2004; Marcott et al., 2011). The LIS outlets extendedthrough Baffin Island, probably as far as the fjord mouthsand inlets, and possibly over part of the Baffin Island shelf(Briner et al., 2003, 2006, 2007; Young et al., 2012), whilethe GIS outlets expanded westward onto the Greenland innershelf, and as far as the shelf edge off Disko Bugt andthe Uummannaq Trough at the LGM (O Cofaigh et al.,2012, 2013). The buildup of the IIS as late as �19k cal a BPis out of phase with the buildup of the LIS (Dyke et al., 2002;England et al., 2006, 2009), which had attained its maximumextent between 24 and 20k cal a BP, while the GIS marginwas probably close to its maximum extent as late as �15k cala BP (Funder et al., 2011; O Cofaigh et al., 2013). Thisphasing and the continued fall of global eustatic sea leveluntil �18k cal a BP indicate that growth of the LIS, GIS andIIS probably responded to different forcings (Clark andMix, 2002; Dyke et al., 2002; England et al., 2006).Although pre-LGM glaciations are poorly documented
around Baffin Bay, the recognition and interpretation of largeBaffin Bay Detrital Carbonate (BBDC) layers [i.e. coarsedolomite-rich ice-rafted debris (IRD) layers] in deep BaffinBay cores (Aksu and Piper, 1987; Andrews et al., 1998, 2013;Parnell et al., 2007) and their precise timing in core PC16(Simon et al., 2012; Table 1; Figs 2 and 6) confirmed recentnumerical simulations (Ganopolski et al., 2010; Stokes et al.,2012) of a rapid NE LIS and IIS inception and extension afterthe last Interglacial [i.e. Marine Isotope Stage (MIS)5e],followed by several phases of ice sheet growth and reductionduring the last glacial cycle. Simon (2013) suggested twocausal processes to explain the deposition of BBDC layers: (i)
the initiation and extension of fast-flowing ice streams fromthe northern end of Baffin Bay (i.e. especially from the largeLancaster Sound ice stream) with increasing iceberg flux overa long period; and/or (ii) a rapid destabilization of the sea-ice/ice shelf covering Baffin Bay, which would trigger northernice streams (i.e. Lancaster and Jones Sound) surges producingdeposition of BBDC layers over short periods. These causalprocesses were probably related to external forcing, such asthe Dansgaard–Oeschger cycles (i.e. mass balance factors),rather to internal ice sheet instabilities (i.e. ice sheet dynam-ics processes and associated surges) (Marcott et al., 2011;Petersen et al., 2013).
Materials and methods
The HU2008-029-016PC piston core, hereafter PC16, is a741-cm-long piston core raised from central Baffin Bay duringthe 2008-029 CCGS Hudson expedition (70˚46.14’N/64˚65.77’W; water depth: 2063m; Campbell and deVernal, 2009). The core location (Fig. 1) is near an OceanDrilling Program (ODP) site that was drilled in 1985 (ODP645, Leg 105; Srivastava, 1989) and several cores retrievedfrom the deep central Baffin Bay during the 1970s and 1980s(e.g. Aksu, 1981; Aksu and Piper, 1987; Hillaire-Marcelet al., 1989; Andrews et al., 1998).
Physical and geochemical properties
The core sections (1.5 m long) were described and sampledwith u-channels (rigid u-shaped plastic liners, 2� 2 cm cross-section) from the center of the working halves. To allowvisualization of the sedimentary structures, the archive halveswere run through a computerized coaxial tomography (CT)scanner at 1-mm intervals at INRS-ETE in Quebec City(Fig. 2). The results of this scan mainly reflect changes in bulkdensity (quantified through the CT numbers; e.g. St-Ongeet al., 2007). High-resolution micro X-ray fluorescence(mXRF) spectrometry measurements were performed at 0.5-cmintervals and during a 50-s counting time using an ITRAXcore scanner (Cox Analytical Systems, Molndal, Sweden)at the GIRAS (Geochemistry, Imagery and Radiography ofSediment) laboratory of INRS-ETE. The output data representrelative concentrations, which have been reported here ascumulative concentrations (relative to depth) to provideindependent information about sedimentation depositionvariability (Fig. 2). Grain size analyses were performed onsediment samples (1–2 g) at the Institut des sciences de lamer de Rimouski (ISMER) using a Beckman Coulter LS13320laser diffraction grain size analyser at 4-cm intervals(Simon et al., 2012).
Mineralogy and SedUnMix
Bulk mineralogical assemblages were determined by X-raydiffraction (XRD) at UQAM using a Siemens D-5000 diffrac-tometer (˚2Q, CoKa1,2 radiation and a silicon detector).Semi-quantitative estimates (� 1s �5%) of the main mineralspecies were based on the peak height (in counts per second)of the first diffraction peak for each mineral corrected forquartz and normalized to 100% (following the methodpresented by Thorez, 2003). The analyses were performed onsediment fractions sieved at 63mm and 2mm with a 4-cmsample interval and then merged to compare our mineralogi-cal assemblages with the source signatures (Andrews andEberl, 2011). Additional samples were measured to obtainhigh-resolution results of the mineralogical compositionchanges where lithofacies variability occurred within the 4-cm interval. We used weighting factors (ratio between the
Table 1. Timing and duration of the Baffin Bay Detrital Carbonatelayers (BBDC).
BBDC layers�BBDC timing interval
(cal ka BP)BBDC duration
(ka)
10.5–12 1.51 13.7–15 1.32 24.7–25 0.33 26.4–27.7 1.34 31.9–37 5.15 48.5–50 1.56 58–64 67a 73–79.5 6.57b 80.5–84.5 48a 91.5–95 3.58b 99–100.5 1.58c 103–104.5 1.59a 107.5–108.5 19b 110–115? >5?
�Numbering according to Simon (2013).
Copyright # 2013 John Wiley & Sons, Ltd. J. Quaternary Sci., (2013)
ICE STREAM DYNAMICS IN BAFFIN BAY

weight of individual fractions) on both fractions (i.e. <63 and63 mm to 2mm) to respect grain-size proportion. Highcorrelation coefficients between the weight percentage andlaser grain size analysis (r¼ 0.88 for silt and r¼ 0.91 forsand) confirmed the reliability of the merging process.To unravel sediment provenance based on the mineralogi-
cal composition, we applied the sediment unmixing model(SedUnMix) proposed by Andrews and Eberl (2012). Themodel calculates the contribution of different source areas ofmixed sediments. SedUnMix seeks an iterative solution(we used 20 iterations in this study) to optimize a non-linearsolution for the respective percentages of source regions
and sample compositions. This iteration process reduces theaverage absolute difference between the observed and thecalculated mineralogy (see Andrews and Eberl, 2012, fordetails about the method). We ran SedUnMix using data fromour new mineralogical semi-quantitative estimates from PC16and from the different possible sources previously determinedby Andrews and Eberl (2011) based on cluster analysis onprincipal component scores calculated on box cores andsurface sediments from across the bay. These possible end-members represent sediment signatures from the JakobshavnTrough, Uummannaq Trough, eastern Baffin Island andnorthern Baffin Bay (see Table 4 in Andrews and Eberl, 2011;
2 10 8030sandgravel
silt0
40
80
120
160
200
240
280
320
360
400
440
480
520
560
600
640
680
720
Dep
th (
cm)
Sedimentation Rate (cm/kyr)
Age (cal ka BP)
0
40
80
120
160
200
240
280
320
360
400
440
480
520
560
600
640
680
720
Ti cum (peak areas)
Age Model (Simon et al., 2012)14C datesExcursions
20 40 60 80 100 12010 30 50 70 90 110
RPI tie-pointsCalcite% tie-points
Ca cum (peak areas)
CT Number1010 1060
(a) (b) (c) (d)
ClaySiltSandGravel
0 50 100
Grain Size (%)
dark yellowish browndark brown
olive gray
grayish browndark grayish brownbrown dark gray
BBDC-layerPebblesSandy Mud
Gravelly Mud
Silty Mudfacies color:
UB LDCDC OC
Lower rates
Higher rates
Figure 2. Core PC16 lithostratigraphy and age model. (a) Simplified stratigraphy log (see legend for details). (b) CAT scan image (X-ray) of thecore (left) and associated CT number (density proxy). High-resolution digital image (right). (c) Grain size distribution (%) for clay (0–2mm), silt (2–63mm), sand (63mm to 2mm) and gravel (>2mm). (d) Core PC16 age model (red curve; Simon et al., 2012) and associated sedimentaccumulation rates. The Ti (green) and Ca (orange) cumulative curves represent the cumulative addition of titanium and calcium relativeconcentrations (peak areas measured with the mXRF ITRAX core scanner). Gradient changes give independent information about sedimentarydepositional process variability. Distinct lithofacies are highlighted with color banding (see text for details). This figure is available in colouronline at wileyonlinelibrary.com.
Copyright # 2013 John Wiley & Sons, Ltd. J. Quaternary Sci., (2013)
JOURNAL OF QUATERNARY SCIENCE

and Fig. 1). We decided to exclude the Jakobshavn sourcein our calculations because (i) our semi-quantitative XRDapproach does not yield a detailed record of the feldsparmineral suite, in comparison with the quantitative XRD(qXRD) approach used by Andrews and Eberl (2011), whichcould induce biases in the provenance calculation (notablyprecluding a strong distinction between eastern Baffin Islandand Jakobshavn signatures). Moreover, (ii) the core locationlies off the Uummannaq Trough and too far north of theJakobshavn Trough outlet to allow for the large presence ofJakobshavn sediments at the study site, as demonstrated byAndrews and Eberl (2011) with analysis of a nearby box core(JCR175-BC06) analysis.
Chronology
The age model of core PC16 (Fig. 2) is based primarily on thecorrelation of its relative paleointensity (RPI) profile withregional and global RPI reference curves (Simon et al., 2012).Three radiocarbon ages and two geomagnetic excursionsfurther support the established age model. The derived agemodel is consistent with previous regional age models (deVernal et al., 1987; Andrews et al., 1998) but offers a muchmore precise and accurate temporal resolution (see Simonet al., 2012 for details).
Results
Lithofacies
Four major lithofacies were identified and described in thecore (Simon et al., 2012). They represent distinctive sedimentdelivery processes and probable provenance changes duringthe last glacial cycle and the Holocene (Fig. 2). Olive gray todark gray poorly sorted sandy muds to slightly gravelly sandymuds with low detrital carbonate percentages [Low DetritalCarbonate (LDC) facies] and carbonate-rich (mainly dolomite)yellowish-brown to dark brown very poorly sorted gravellysandy muds (corresponding to the BBDC layers) describemainly the bulk of the core (these two lithofacies arehighlighted with white and dark green banding in Fig. 2).Two additional lithofacies are found at specific intervals: thetop of the core (0–20 cm) is characterized by brown to darkbrown silty muds (Uppermost Brown unit, UB) while theinterval between 120 and 215 cm is characterized bybrownish-black and olive-black silty muds to clayey muds(Olive clay unit, OC). The UB and OC facies representsediments deposited solely during the Holocene and anextended MIS2 (16–32 ka), respectively, and characterizespecific environmental conditions during these time periods(see Simon et al., 2012, for additional information on thelithofacies and their environmental interpretations).
Mineralogical results
Following this lithofacies interpretation, the XRD relativemineralogical composition demonstrates a significant down-corevariability (Fig. 3). Two principal modes are distinguished:(i) carbonate-rich layers with about 30–40% dolomite and10–15% calcite; and (ii) feldspar-rich layers (i.e. K-feldsparand plagioclase minerals) with values between 30 and 50%associated with increases of clay minerals (Fig. 3). Thispattern is consistent with the identification and interpretationof BBDC layers related to the glacial erosion of basementrocks at the northern end of Baffin Bay, where major icestreams of the NE LIS and north-western GIS merged (Aksuand Piper, 1987; Andrews et al., 1998; Parnell et al., 2007).Feldspar-rich layers are probably associated with lateral
sources (from Greenland and Baffin Island), while the feldsparminerals are highly diluted by more rapid erosion of carbon-ate rocks at the northern end of the bay (Parnell et al., 2007;Andrews and Eberl, 2011). Coarse sediments characterize thecarbonate-rich layers, while the LDC facies is accompaniedby an increase in the clay and silt fractions (Fig. 3). Thecontent of clay minerals, especially illite, increases in theLDC, UB and OC facies (Fig. 3). The large increase ofsmectite relative content in the OC facies is probablyassociated with the erosion of the Tertiary basalt terrainsfrom the Uummannaq region (Figs. 1 and 3; Simon, 2013).
SedUnMix tuning
To test the reliability of our semi-quantitative estimate withthe qXRD method used by Andrews and Eberl (2011) forsource identification, we measured ten samples with theqXRD method described in Eberl (2003, 2004). The resultspresent nearly identical relative distribution and similarpercentage values (within the statistical uncertainty, Support-ing information, Fig. S1). Nevertheless, a large deviation ofthe quartz weight percentage in one sample, associated withthe overall ubiquity of quartz in the source composition(12.7� 7.2 wt%), raised the question of its impact on theprovenance calculation. We therefore ran SedUnMix analyses(ten iterations) by including/excluding the quartz. The resultswithout the quartz have lower degrees-of-fit (DOF, 0.42�0.21 vs. 0.56� 0.31) and smaller average deviation values (ameasure of the level of agreement between the observed andexpected mineralogy, 2.37� 1.38 vs. 3.12� 1.66), therebyexpressing a better fit between sources and core samples(Andrews and Eberl, 2012). Accordingly, we removed thequartz from the mineralogical assemblage to improve thegeographical clustering and avoid misinterpretation of someresults caused by methodological differences between sour-ces and down-core sample measurements. Besides, thedissolution of carbonates in deep-basin surface sediments(due to corrosive waters, see Azetsu-Scott et al., 2010)introduces an important ‘no analog’ problem, as the mineral-ogical assemblage failed to accurately represent the respec-tive sources with respect to the carbonate contents aspreviously demonstrated by Andrews and Eberl (2011).Consequently, the carbonate minerals have also been re-moved from the mineralogical assemblage. The removal ofdolomite, calcite and quartz from the mineralogical assem-blage reduced the possibility of misinterpreting the prove-nance calculation results using our semi-quantitativeestimates (based on the partial composition using the eightmineralogical species selected, which have been summed to100%) and the SedUnMix program. An important conse-quence of the removal of the carbonates implies that theweight percentages calculated between the sources arerelative and not absolute due to the artificial reduction of thenorthern Baffin Bay contribution. Then, weight percentagesrepresent lateral source contributions (i.e. eastern BaffinIsland versus western Greenland, Fig. 4), while the BBDCsignal is significantly reduced. This is of particular interest forreconstructing the lateral source changes and their precisetiming, as the strong BBDC signal may prevent the recogni-tion of these changes. Consequently, we interpret our resultsin terms of relative change in any given source activity (icestream dynamics) in time rather than providing a preciseestimate of sediment provenance.Finally, we compared the results of SedUnMix runs on ten
samples measured with the semi-quantitative and qXRDmethods. For the last glacial period, the results yieldcomparable source contributions, with high correlation
Copyright # 2013 John Wiley & Sons, Ltd. J. Quaternary Sci., (2013)
ICE STREAM DYNAMICS IN BAFFIN BAY

coefficients for Uummannaq (r¼ 0.90) and eastern BaffinIsland (r¼ 0.85) (supporting Fig. S2), which validate the useof semi-quantitative estimates for the provenance calculationusing SedUnMix.
Provenance changes
Given the distinct lithofacies already described and themineralogical composition variability, we expect to findvariations in sediment provenance within the core. Thisis well illustrated by comparing the composition of thesurface samples (i.e. the top two samples) with the down-coreassemblages using a SedUnMix calculation. Large deviationsfrom 100% are observed within several layers, indicating
major changes in primary sediment sources throughoutthe core (up to 40 wt%, Fig. 4). The larger deviationsappear mainly within the BBDC layers, correspondingprobably with major changes in the transport process (i.e. icerafting) between these intervals and modern sedimentationsettings.According to our analysis, the largest non-carbonate and
non-quartz contribution is attributed to Uummannaq (average53.7 wt%) and eastern Baffin Island (38.5 wt%) sources, whilethe northern Baffin Bay source is nearly absent from thecalculation (0.5 wt%) (Fig. 4). The fraction of source notresolved by the program is relatively low (7.3 wt%). Thesevalues confirm the removal of the BBDC signal (i.e. northernBaffin Bay sources) from the calculation. A very large increase
sandgravel
silt0
40
80
120
160
200
240
280
320
360
400
440
480
520
560
600
640
680
720
Dep
th (
cm)
CT Number1010 1060 0 10 20 30 40 50 60 70 80 90 100
semi-quantitative XRD (relative %)
Amphiboles QuartzK-FeldsparPlagioclasePyroxene
CalciteDolomite
SmectiteChloriteIlliteKaolinite
Clay
0
40
80
120
160
200
240
280
320
360
400
440
480
520
560
600
640
680
720
ClaySiltSandGravel
0 50 100
Grain Size (%)
BBDC-layer =>Pebbles
Sandy MudGravelly Mud
Silty Mud
Figure 3. Core PC16 relative XRD mineralogical assemblages (calculated on the most abundant minerals and summed to 100%). This figure isavailable in colour online at wileyonlinelibrary.com.
Copyright # 2013 John Wiley & Sons, Ltd. J. Quaternary Sci., (2013)
JOURNAL OF QUATERNARY SCIENCE

of nearly 100wt% of the Uummannaq sediments correspondsto the facies OC (Fig. 4), while a 2nd peak of nearly 100wt%is found between 410 and 460 cm. These peaks correspondto major sediment deliveries from Greenland, probablycorresponding to important GIS ice margin advances whileseveral peaks of Uummannaq sediments (>60wt%) probablyrelate to reduced ice margin extensions on the UummannaqTrough. Several peaks of sediments from eastern Baffin Island(>50 wt%) are observed episodically through the core whilethe higher values, comprising between 60 and 80 wt%,characterized the interval 215–255 cm (Fig. 4). The largereastern Baffin Island wt% values are mainly found within thecoarser carbonate-rich BBDC intervals.
Principal component analysis
Principal components analysis (PCA) was used to simplifythe dataset to only a few primary clusters that retain the mainfeatures of the mineralogical and grain-size variability(Davis, 2002). The first two principal components accountedfor 52% (PC1 40.7% and PC2 11.3%) of the total variance
(Fig. 5). PC1 has positive loadings for finer sediments, suchas clay and very fine silts (i.e. ‘glacial flour’; Table 2). Thesepositive loadings with the Uummannaq source are coherentwith the hypothesis of fine-grained sediments originatingfrom Greenland ice streams (Fig. 6). By contrast, PC1 hasnegative loadings with proxies of coarse detrital carbonatelayers, such as XRD dolomite and calcite, chlorite, CTnumber (density) and sand (Table 2). Therefore, positiveloadings on PC1 probably represent western Greenland icemargin advance stages, while negative loadings on PC1 areassociated with coarser sediments originating from eithereastern Baffin Island or the northern end of the Baffin Bay.Given this association between mineralogy and grain size,the mineralogical variability is probably a combination ofchanges in sediment delivery processes at the ice margin andsediment transport (i.e. shown by grain size variability), aswell as of sediment provenance. Minerals in the upper rightquadrant could come from either eastern Baffin Island orGreenland crystalline rocks, whereas minerals in the lowerleft quadrant are related to the northern Paleozoic carbonateoutcrops.
Figure 4. (a) Cumulative wt% contributionsfrom the three major sediment sources (Uum-mannaq, east Baffin Island and northernBaffin Bay) calculated from the mineralogicalassemblages using SedUnMix (Andrews andEberl, 2012). ‘Not resolved’ indicates that thesum wt% was< 100%. (b) Average wt%species deviations for each sample based onthree sources and excluding carbonate (dolo-miteþ calcite) and quartz. (c) Mineralogical-assemblage deviation (wt%) between surfaceand downcore samples. Large deviationsfrom 100% indicate major changes in mineralcomposition. This figure is available in colouronline at wileyonlinelibrary.com.
sandgravel
silt0
40
80
120
160
200
240
280
320
360
400
440
480
520
560
600
640
680
720
Dep
th (
cm)
0 10020 6040 80
Average deviations (wt.%)
Cumulative (wt.%)
E. Baffin IslandUummannaq
Sources (wt.%)
not resolvedN. Baffin Bay
(a) (b) (c)20 40 60 80 100Dev. surf. (wt.%)
1 2.5 4
Changes in mineralcomposition rel. to surface
Copyright # 2013 John Wiley & Sons, Ltd. J. Quaternary Sci., (2013)
ICE STREAM DYNAMICS IN BAFFIN BAY

Discussion
In contrast to the coarse dolomite-rich IRD layers (i.e. BBDC)released from northern ice streams, fine-grained Ti-rich sedi-ments in the LDC facies have been related to a ‘lateral’ modecharacterized by sediment supplies from the advances and/or
retreats of western Greenland and eastern Baffin Island icestreams (Aksu and Piper, 1987; Hiscott et al., 1989). Howev-er, to date no common provenance proxies have confirmedsuch a ‘lateral’ source provenance or provided a means todistinguish and quantify between sediment originating fromeastern Baffin Island or western Greenland. In this study, theremoval of carbonates (dolomite and calcite) from themineralogical composition allows us to eliminate the strongBBDC imprint, thereby highlighting the variability of sedi-ments from the ‘lateral’ sources (Figs. 4 and 6) and reducingthe intermingling impact of Greenland and Laurentide sup-plies. These new results illustrate a clear distinction betweenwestern Greenland and eastern Baffin Island sediment sup-plies, confirming the usefulness of the mineralogical ap-proach (Fig. 4). The new data also reveal distinct depositionpatterns, with sharp peaks of eastern Baffin Island coarsesediments that are interbedded with more steady supplies ofUummannaq fine-grained sediment (Fig. 6). These observa-tions raised two questions: (i) Were the lateral ice streamsfrom western Greenland and Baffin Island in phase and/or didthey relate to distinct processes? (ii) Were these lateral icestream advance/retreat phases driven by climatic and/oroceanic reorganization processes (i.e. mass balance) similarto northern ice streaming pulses or rather related to ice sheetdynamics (i.e. ice sheet surges)?
Eastern Baffin Island
The larger eastern Baffin Island sediment pulses (>50 wt%)correspond typically to short intervals (<1 ka) occurringwithin the BBDC layers (Fig. 4), pointing to a similaractivating mechanism and deposition processes. The corre-spondence of sediment delivery between these sourcessuggests synchronous dynamics from separated ice streamslocated over the Canadian Arctic Archipelago and BaffinIsland. This apparent synchronicity suggests that climate/
Chlorite
Smectite
Illite
Kaolinite
Ti
0-2 µm
2-4 µm4-8 µm
Silt (2-63 µm)
8-63 µm
CT#
Dolomite
Sand(63µm - 2 mm)
Gravel (2-16 mm)
Calcite
K-Feldspar
Plagioclases
Quartz
Pyroxene
Amphiboles
PC
2 (
11.3
%)
PC 1 (40.7%)
BBDC
Not resolved
E. Baffin Island
Uummannaq
>63µm
NB?
0-4 µm
-0.4
-0.2
0
0.2
0.4
-0.4 -0.3 -0.2 -0.1 0 0.1 0.2 0.3 0.4
eld
Ped
Figure 5. Principal component analysis (PCA) of the mineralogicaland grain-size dataset. The loading scores for PC1 vs. PC2 explain,respectively, 40.7 and 11.3% of the total variance. PCA analysisillustrates the two sedimentary modes in Baffin Bay during the lastglacial cycle. The colored ellipses represent sediments signaturesfrom the three main sources discussed (using the same color as inFigs. 4 and 6). This figure is available in colour online at wileyonli-nelibrary.com.
Table 2. Principal component analysis (PCA) data and Pearson correlation coefficients.
Loading PC1 PC2 PC3 PC1 PC2
Eigenvalues 10.57 2.94 2.6Variance (%) 40.68 11.34 9.99Variance (cumulative %) 40.68 52.02 62.01
– – – r rQuartz 0.10 0.10 0.34 0.32 0.17K-feldspar 0.10 0.42 0.03 0.33 0.73Plagioclase 0.20 0.25 –0.03 0.66 0.42Amphibole 0.23 0.15 –0.08 0.76 0.26Pyroxene 0.26 0.01 0.04 0.83 0.01Calcite –0.20 –0.33 –0.16 –0.66 –0.56Dolomite –0.24 –0.18 –0.16 –0.79 –0.32Smectite 0.13 0.02 0.34 0.42 0.04Illite 0.11 0.23 –0.46 0.35 0.40Kaolinite –0.05 –0.18 0.46 –0.16 –0.31Chlorite –0.19 –0.23 0.18 –0.63 –0.39Gravel% –0.13 0.24 –0.05 –0.42 0.41Sand% –0.27 0.09 0.06 –0.89 0.15>63mm (%) –0.27 0.16 0.03 –0.87 0.28Silt (0–63mm) (%) 0.20 –0.07 0.18 0.64 –0.12Clay (0–2mm) (%) 0.24 –0.20 –0.23 0.77 –0.34Very fine silts (2–4mm) (%) 0.29 –0.08 0.00 0.94 –0.14‘Glacial flour’ (0–4mm) (%) 0.27 –0.17 –0.17 0.87 –0.29Medium to coarse silt (8–63mm) (%) –0.11 0.04 0.24 –0.35 0.07CT no. (density) –0.19 –0.07 –0.14 –0.61 –0.11Ti (peak area) 0.25 0.09 0.14 0.81 0.16Uummannaq wt% 0.14 –0.34 –0.07 0.45 –0.59Eastern Baffin Island wt% –0.19 0.28 0.05 –0.60 0.48Northern Baffin Bay wt% 0.11 –0.10 0.13 0.36 –0.17Not resolved wt% 0.01 0.22 0.04 0.04 0.37
Copyright # 2013 John Wiley & Sons, Ltd. J. Quaternary Sci., (2013)
JOURNAL OF QUATERNARY SCIENCE

ocean played a significant part in the ice dynamics of theseregions. The timing of these sharp peaks of eastern BaffinIsland sediments corresponds to Dansgaard–Oeschger events(Greenland interstadials recorded by higher d18O values inthe GISP2 ice core, Fig. 6), except for a large peak at the endof MIS5a (associated with a fast-flowing northern Baffin Bayice stream episode, explaining the deposition of the BBDC-7alayer, Simon, 2013). Therefore, the eastern Baffin Island icemargin dynamics was probably driven by external param-eters, such as Dansgaard–Oeschger cycles, rather than inter-nal ice sheet processes.Hence, we suggest that the contribution of eastern Baffin
Island sediments to the central Baffin Bay sedimentary budget(at least at the core location, Fig. 1) would correspond to the
release of IRD and meltwater plumes from the calving andmelting of marine-based glacier outlets, or of grounded icestreams that advanced onto the outer fjords area. Duringintervals of glacial retreat and/or fast flowing ice streams(Simon, 2013), an IRD sedimentary setting would resume inBaffin Bay with the deposition of BBDC layers, linked tonorthern sources as indicated by the presence of largeamounts of dolomite-rich carbonates as well as to pulses ofcoarse sediments from the eastern Baffin Island margin (Fig.6). These coarse IRD horizons were probably depositedduring periods when ice margins retreated behind theirmaximum extent following oceanic circulation increase andsubsurface warming in the bay (Fig. 7a). During suchepisodes, western Greenland sediments would have been
MIS1 MIS2 MIS3 MIS4 MIS5a 5b 5d5cMIS1 MIS2 MIS3 MIS4 MIS5a 5b 5c 5d100 1100 10 20 30 40 50 60 70 80 90
100 1100 10 20 30 40 50 60 70 80 90
Age (ka BP)
020406080
100
Uum
man
naq
(wt.%
)E.
Baf
. Isl
. (w
t.%)
0
20
4060
80
100
-8
0
8
PC
A -
PC
1 (4
0.7%
) 0
40
80
XR
D C
arbo
nate
s (%
)
? ?
020406080100
2 - 4
4 - 8
< 2
8 - 63 G
rain
Siz
e (%
)
2324
14121
234 5
818
16 172019 21
22
-44
-40
-36
-32
GISP2 δ18O (‰)
0
20
40
60
80
100
- G
rain
Siz
e %
(µm
) +
1000
460
480
500
July
Inso
l. at
70°
N (W
/m2)
0 1 2 3 4 7a 7b 8a 8b 9a 9b8c5 6
-120
-80
-40
0 + S
L (m
) -
BBDC#
wes
tern
Gre
enla
nd ic
e-m
argi
n ex
pans
ion
6312
525
050
0
BB
DC
E. B
af. c
alvi
ng
H5aH1 H4H3H2 H5 H6YD
(a)
(b)
(c)
(d)
(e)
(f)
(g)
(h)
(i)
UIS
adv
ance
s
Figure 6. Sediment provenance and grain-size variability during the last glacial cycle. (a) Coarse grain size distribution (%) per size fraction (seelegend). (b) GISP2 d18O and Greenland interstadials (1-24). (c) July insolation values calculated at the site latitude (Laskar et al., 2004). (d) EasternBaffin Island wt% contribution. (e) XRD carbonate (dolomiteþ calcite) relative percentages. (f) First component (40.7%) of the PCA analysis. (g)Sea level record (SL, y-axis reverse) from Waelbroeck et al. (2002). (h) Uummannaq ice stream (UIS) wt% contribution. Large increases ofUummannaq sediments are highlighted by green banding. (i) Grain-size distribution (%) of clay and silt fractions. Marine isotopic stages (MIS1 toMIS5d) are represented by color boxes along the age axis. Baffin Bay Detrital Carbonate (BBDC) layers are represented by a vertical brick patternand numbered according to Simon et al. (Simon, 2013; see Table 1). Heinrich events are represented by gray lines according to Hemming (2004).This figure is available in colour online at wileyonlinelibrary.com.
Copyright # 2013 John Wiley & Sons, Ltd. J. Quaternary Sci., (2013)
ICE STREAM DYNAMICS IN BAFFIN BAY

mostly deposited over the Greenland shelf rather than beingtransported farther away towards the center of the bay (Fig.7a), while iceberg circulation and melting delivered northernand western sediments to central Baffin Bay.
Western Greenland (Uummannaq)
Interbedded with the rapidly deposited coarse sediments fromnorthern and western Baffin Bay, the large increases inUummannaq-sourced, fine-grained sediments are interpretedas indicating a stable and relatively long-duration (>5 ka)Greenland ice sheet expansion and development, notablyover the Greenland shelf along Uummannaq Trough. Largeincreases in Uummannaq sediment deliveries (i.e.> 60 wt%)occurred within the intervals 110–105, 91–85, 72–63 and32–16 ka, while two additional smaller Uummannaq weightpercentage peaks are found between 58 and 55 ka andaround 44 ka (Fig. 6). From these results, we suggest that theUummannaq Trough ice stream expanded over theGreenland shelf immediately after the onset of the northernglacial inception after the last Interglacial (as early as 110 ka)and was followed by subsequent advances during colderepisodes (highlighted by green banding in Fig. 6). Two ofthese advances are characterized by wt% values of nearly100% and large peaks of glacial flour (Figs 5 and 6). Theyoccurred during an ‘extended MIS2’ interval (32–16 ka) andduring MIS4 (72–63 ka). The smaller ones (i.e. 80 wt%)correspond to MIS5b (91–85 ka) and late MIS5d (110–105 ka)intervals, respectively (Fig. 6). The large fast-flowing icestreams over the large Greenland cross-shelf troughs haveprobably contributed to increase Greenland sediment erosionand sediment delivery rates into Baffin Bay, while smaller icestream systems from Baffin Island did not permit high
sediment loads to be deposited at the core location duringglacial maxima.The recording of nearly 100% of Uummannaq sediments
during the LGM confirms the development of a grounded,fast-flowing ice stream in the Uummannaq Trough as far asthe shelf edge that delivered glaciomarine sediments to theUummannaq fan and into deep central Baffin Bay, as recentlyproposed by O Cofaigh et al. (2012, 2013). The observedmineralogical signatures in our site indicate large Uumman-naq ice stream extent and/or activity from �32 to nearly 16ka (Fig. 6). Therefore, from our study, we propose that the lastmassive growth of the western GIS (reaching a maximumextent during the LGM, sensu stricto) started from �32 ka,while substantial ice stream retreat from the Greenland shelfdid not begin before �16k cal a BP (Fig. 6).The other Uummannaq sediment pulses (e.g. MIS5d and
5b, MIS4) probably corresponded to somewhat reducedadvances and thickenings of the GIS outlet glaciers on theGreenland shelf. The very high percentages of Uummannaqsediments (almost 100%) and a fine grain size signature (largepeak of glacial flour) within the MIS4 interval (Fig. 6) couldbe attributed to advances of the western Greenland icemargin comparable to those of MIS2 in scale. Unfortunately,11 cm of sediments corresponding broadly to the 69–65.5 kainterval are missing, therefore preventing a precise interpreta-tion of the glacial advance within that interval. Nonetheless,the hypothesis of a large advance of the ice margin on thewestern Greenland shelf at that time is in accordance withthe lower relative sea-level (Cutler et al., 2003; Fig. 6), lowJuly insolation values (Laskar et al., 2004; Fig. 6) andcomplementary evidence for the expansion of an ice shelfoffshore south-western Greenland during MIS4 (Seidenkrantzet al., 2010). From our study, we cannot ascertain an advance
80 W 70 W 60 W 50 W
?
?
80 W 70 W 60 W 50 W65 N
70 N
75 N
80 N
(a) Partially open bay (b) Full glacial
UummannaqTrough
Jakobshavn Trough
Baffin Island
LancasterSound
JonesSound
Nares Strait
Baffin Island
GIS
LIS
IIS
LIS
IIS
GISMelville Bugt
Major ice-streams
West Greenland Current
Eastern Baffin Island Current
Seasonal Sea-iceMeltwater plumes
Icebergs Permanently ice-covered bay (sea-ice or ice-shelf)(yellow: dolomitic-rich)
(brown: calcitic-rich)
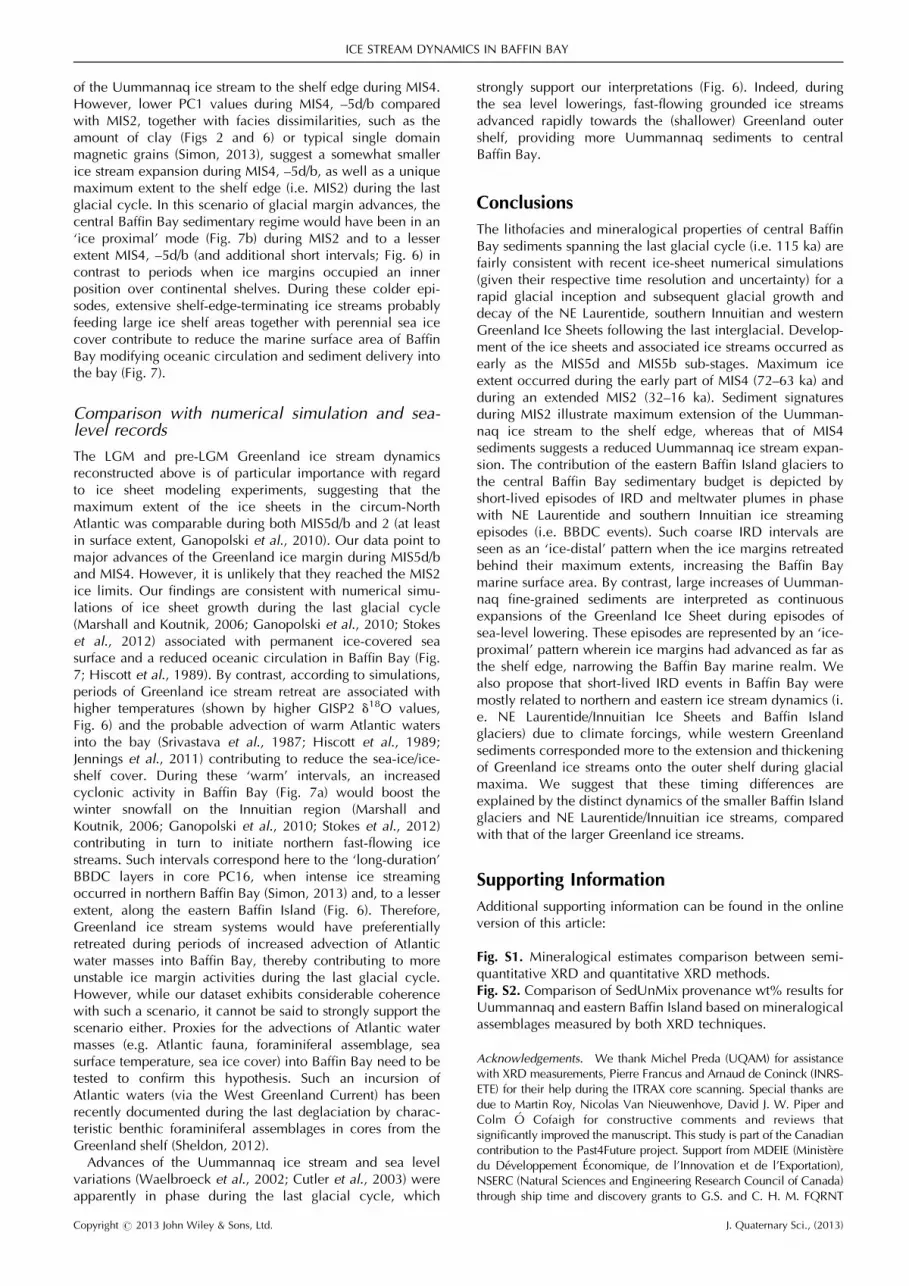
Figure 7. Simplified Baffin Baypaleogeography during the lastglacial cycle. (a) Partially openbay characterized by IRD sedi-ments originating from the north-ern ice streams, and bymeltwater plumes from BaffinIsland ice streams. (b) Full glacialmode characterized byGreenland and Baffin Island gla-cial flour sediments correspond-ing to a permanently ice-coveredbay, and by extended fast-flow-ing ice streams (i.e. Lancasterand Uummannaq) probably feed-ing an ice shelf in the bay. Thisfigure is available in colour on-line at wileyonlinelibrary.com.
Copyright # 2013 John Wiley & Sons, Ltd. J. Quaternary Sci., (2013)
JOURNAL OF QUATERNARY SCIENCE
of the Uummannaq ice stream to the shelf edge during MIS4.However, lower PC1 values during MIS4, –5d/b comparedwith MIS2, together with facies dissimilarities, such as theamount of clay (Figs 2 and 6) or typical single domainmagnetic grains (Simon, 2013), suggest a somewhat smallerice stream expansion during MIS4, –5d/b, as well as a uniquemaximum extent to the shelf edge (i.e. MIS2) during the lastglacial cycle. In this scenario of glacial margin advances, thecentral Baffin Bay sedimentary regime would have been in an‘ice proximal’ mode (Fig. 7b) during MIS2 and to a lesserextent MIS4, –5d/b (and additional short intervals; Fig. 6) incontrast to periods when ice margins occupied an innerposition over continental shelves. During these colder epi-sodes, extensive shelf-edge-terminating ice streams probablyfeeding large ice shelf areas together with perennial sea icecover contribute to reduce the marine surface area of BaffinBay modifying oceanic circulation and sediment delivery intothe bay (Fig. 7).
Comparison with numerical simulation and sea-level records
The LGM and pre-LGM Greenland ice stream dynamicsreconstructed above is of particular importance with regardto ice sheet modeling experiments, suggesting that themaximum extent of the ice sheets in the circum-NorthAtlantic was comparable during both MIS5d/b and 2 (at leastin surface extent, Ganopolski et al., 2010). Our data point tomajor advances of the Greenland ice margin during MIS5d/band MIS4. However, it is unlikely that they reached the MIS2ice limits. Our findings are consistent with numerical simu-lations of ice sheet growth during the last glacial cycle(Marshall and Koutnik, 2006; Ganopolski et al., 2010; Stokeset al., 2012) associated with permanent ice-covered seasurface and a reduced oceanic circulation in Baffin Bay (Fig.7; Hiscott et al., 1989). By contrast, according to simulations,periods of Greenland ice stream retreat are associated withhigher temperatures (shown by higher GISP2 d18O values,Fig. 6) and the probable advection of warm Atlantic watersinto the bay (Srivastava et al., 1987; Hiscott et al., 1989;Jennings et al., 2011) contributing to reduce the sea-ice/ice-shelf cover. During these ‘warm’ intervals, an increasedcyclonic activity in Baffin Bay (Fig. 7a) would boost thewinter snowfall on the Innuitian region (Marshall andKoutnik, 2006; Ganopolski et al., 2010; Stokes et al., 2012)contributing in turn to initiate northern fast-flowing icestreams. Such intervals correspond here to the ‘long-duration’BBDC layers in core PC16, when intense ice streamingoccurred in northern Baffin Bay (Simon, 2013) and, to a lesserextent, along the eastern Baffin Island (Fig. 6). Therefore,Greenland ice stream systems would have preferentiallyretreated during periods of increased advection of Atlanticwater masses into Baffin Bay, thereby contributing to moreunstable ice margin activities during the last glacial cycle.However, while our dataset exhibits considerable coherencewith such a scenario, it cannot be said to strongly support thescenario either. Proxies for the advections of Atlantic watermasses (e.g. Atlantic fauna, foraminiferal assemblage, seasurface temperature, sea ice cover) into Baffin Bay need to betested to confirm this hypothesis. Such an incursion ofAtlantic waters (via the West Greenland Current) has beenrecently documented during the last deglaciation by charac-teristic benthic foraminiferal assemblages in cores from theGreenland shelf (Sheldon, 2012).Advances of the Uummannaq ice stream and sea level
variations (Waelbroeck et al., 2002; Cutler et al., 2003) wereapparently in phase during the last glacial cycle, which
strongly support our interpretations (Fig. 6). Indeed, duringthe sea level lowerings, fast-flowing grounded ice streamsadvanced rapidly towards the (shallower) Greenland outershelf, providing more Uummannaq sediments to centralBaffin Bay.
Conclusions
The lithofacies and mineralogical properties of central BaffinBay sediments spanning the last glacial cycle (i.e. 115 ka) arefairly consistent with recent ice-sheet numerical simulations(given their respective time resolution and uncertainty) for arapid glacial inception and subsequent glacial growth anddecay of the NE Laurentide, southern Innuitian and westernGreenland Ice Sheets following the last interglacial. Develop-ment of the ice sheets and associated ice streams occurred asearly as the MIS5d and MIS5b sub-stages. Maximum iceextent occurred during the early part of MIS4 (72–63 ka) andduring an extended MIS2 (32–16 ka). Sediment signaturesduring MIS2 illustrate maximum extension of the Uumman-naq ice stream to the shelf edge, whereas that of MIS4sediments suggests a reduced Uummannaq ice stream expan-sion. The contribution of the eastern Baffin Island glaciers tothe central Baffin Bay sedimentary budget is depicted byshort-lived episodes of IRD and meltwater plumes in phasewith NE Laurentide and southern Innuitian ice streamingepisodes (i.e. BBDC events). Such coarse IRD intervals areseen as an ‘ice-distal’ pattern when the ice margins retreatedbehind their maximum extents, increasing the Baffin Baymarine surface area. By contrast, large increases of Uumman-naq fine-grained sediments are interpreted as continuousexpansions of the Greenland Ice Sheet during episodes ofsea-level lowering. These episodes are represented by an ‘ice-proximal’ pattern wherein ice margins had advanced as far asthe shelf edge, narrowing the Baffin Bay marine realm. Wealso propose that short-lived IRD events in Baffin Bay weremostly related to northern and eastern ice stream dynamics (i.e. NE Laurentide/Innuitian Ice Sheets and Baffin Islandglaciers) due to climate forcings, while western Greenlandsediments corresponded more to the extension and thickeningof Greenland ice streams onto the outer shelf during glacialmaxima. We suggest that these timing differences areexplained by the distinct dynamics of the smaller Baffin Islandglaciers and NE Laurentide/Innuitian ice streams, comparedwith that of the larger Greenland ice streams.
Supporting Information
Additional supporting information can be found in the onlineversion of this article:
Fig. S1. Mineralogical estimates comparison between semi-quantitative XRD and quantitative XRD methods.Fig. S2. Comparison of SedUnMix provenance wt% results forUummannaq and eastern Baffin Island based on mineralogicalassemblages measured by both XRD techniques.
Acknowledgements. We thank Michel Preda (UQAM) for assistancewith XRD measurements, Pierre Francus and Arnaud de Coninck (INRS-ETE) for their help during the ITRAX core scanning. Special thanks aredue to Martin Roy, Nicolas Van Nieuwenhove, David J. W. Piper andColm O Cofaigh for constructive comments and reviews thatsignificantly improved the manuscript. This study is part of the Canadiancontribution to the Past4Future project. Support from MDEIE (Ministeredu Developpement Economique, de l’Innovation et de l’Exportation),NSERC (Natural Sciences and Engineering Research Council of Canada)through ship time and discovery grants to G.S. and C. H. M. FQRNT
Copyright # 2013 John Wiley & Sons, Ltd. J. Quaternary Sci., (2013)
ICE STREAM DYNAMICS IN BAFFIN BAY

(Fonds Quebecois de la Recherche sur la Nature et les Technologies) andthe CFI (Canadian Foundation for Innovation) is acknowledged.
Abbreviations. BBDC, Baffin Bay Detrital Carbonate; DOF, degrees-of-fit; GIS, Greenland Ice Sheet; IIS, Innuitian Ice Sheet; IRD, ice-rafteddebris; LDC, Low Detrital Carbonate; LGM, Last Glacial Maximum;MIS, Marine Isotope Stage; ODP, Ocean Drilling Program; PCA,principal components analysis; RPI, relative paleointensity; XRD, X-ray diffraction; mXRF, micro X-ray fluorescence.
References
Aksu AE. 1981. Late Quaternary stratigraphy, paleoenvironmento-logy, and sedimentation history of Baffin Bafy and Davis Strait.PhD Thesis, Dalhousie University, Halifax, NS.
Aksu AE, Piper DJW. 1987. Late Quaternary sedimentation in BaffinBay. Canadian Journal of Earth Sciences 24: 1833–1846.
Alley RB, Andrews JT, Brigham-Grette J, et al. 2010. History of theGreenland Ice Sheet: paleoclimatic insights. Quaternary ScienceReviews 29: 1728–1756.
Andrews JT. 2000. Icebergs and iceberg rafted detritus (IRD) in theNorth Atlantic: facts and assumptions. Journal of Oceanography13: 100–108.
Andrews JT, Eberl DD. 2011. Surface (sea floor) and near-surface(box cores) sediment mineralogy in Baffin Bay as a key to sedimentprovenance and ice sheet variations. Canadian Journal of EarthSciences 48: 1307–1328.
Andrews JT, Eberl DD. 2012. Determination of sediment provenanceby unmixing the mineralogy of source-area sediments: the ‘SedUn-Mix’ program. Marine Geology 291–294: 24–33.
Andrews JT, Kirby M, Aksu AE, et al. 1998. Late Quaternary detritalcarbonate (DC-) layers in Baffin Bay marine sediments (67˚–74˚ N):correlation with Heinrich events in the North Atlantic? QuaternaryScience Reviews 17: 1125–1137.
Andrews JT, MacLean B. 2003. Hudson Strait ice streams: a review ofstratigraphy, chronology and links with North Atlantic Heinrichevents. Boreas 32: 4–17.
Andrews JT, Jennings AE, Gibb OT, et al. 2013. Variations in theprovenance of sediment from ice sheets surrounding Baffin Bayduring MIS2 and 3 and export to the Labrador Shelf Sea: siteHU2008029-0008 Davis Strait. Journal of Quaternary Science.[doi: 10.1002/jqs.2643]
Azetsu-Scott K, Clarke A, Falkner K. 2010. Calcium carbonatesaturation states in the waters of the Canadian Arctic Archipelagoand the Labrador Shelf Sea. Journal of Geophysical Research 115:C11021.
Bigg GR, Wadley MR. 2001. The origin and flux of icebergs releasedinto the Last Glacial Maximum northern hemisphere oceans: theimpact of ice-sheet topography. Journal of Quaternary Science16: 565–573.
Bond GC, Lotti R. 1995. Iceberg discharges into the North Atlanticon millennial time scales during the Last Glaciation. Science267: 1005–1010.
Bond GC, Showers W, Elliot M, et al. 1999. The North Atlantic’s 1–2kyr climate rhythm: relation to Heinrich Events, Dansgaard/Oeschger cycle and the Little Ice Age. In Mechanisms of GlobalClimate Change at Millennial Time Scales. Geophysical Mono-graph Series 112, Clark P, Webb R, Keigwin L (eds). AmericanGeophysical Union: Washington, DC; 35–58.
Briner JP, Miller GH, Davis PT, et al. 2003. Last Glacial Maximumice sheet dynamics in Arctic Canada inferred from young erraticsperched on ancient tors. Quaternary Science Reviews 22: 437–444.
Briner JP, Miller GH, Davis PT, et al. 2006. Cosmogenic radio-nuclides from fiord landscapes support differential erosion byoverriding ice sheets. Geological Society of America Bulletin 118:406–420.
Briner JP, Overeem I, Miller G, et al. 2007. The deglaciation of ClydeInlet, northeastern Baffin Island, Arctic Canada. Journal of Quater-nary Science 23: 223–232.
Campbell DC, de Vernal A. 2009. CCGS Hudson Expedition2008029: Marine geology and paleoceanography of Baffin Bay and
adjacent areas, Nain, NL to Halifax, NS, August 28- September 23;Geological Survey of Canada, Open File 5989, 1 DVD.
Clark PU, Mix AC. 2002. Ice sheets and sea level of the Last GlacialMaximum. Quaternary Science Reviews 21: 1–7.
Cutler KB, Edwards RL, Taylor FW, et al. 2003. Rapid sea-level falland deep-ocean temperature change since the last interglacialperiod. Earth and Planetary Science Letters 206, 253–271.
Davis JC. 2002. Statistics and Data Analysis in Geology, 3rd edn.Wiley: New York.
de Vernal A, Hillaire-Marcel C, Aksu AE, et al. 1987. Palynostratig-raphy and chronostratigraphy of Baffin Bay deep sea cores:climatostratigraphic implications. Palaeogeography, Palaeoclima-tology, Palaeocology 61: 97–105.
Dowdeswell JA, Elverhøi A, Andrews JT, et al. 1999. Asynchronousdeposition of ice-rafted layers in the Nordic seas and North AtlanticOcean. Nature 400: 348–351.
Dowdeswell JA, Hagen J, Bjornsson H, et al. 1997. The mass balanceof circum-Arctic glaciers and recent climate change. QuaternaryResearch 48: 1–14.
Dowdeswell JA, Maslin MA, Andrews JT, et al. 1995. Icebergproduction, debris rafting, and the extent and thickness of Heinrichlayers (H-1, H-2) in North Atlantic sediments. Geology 23: 301–304.
Dyke A. 2004. An outline of North American deglaciation withemphasis on central and northern Canada. Developments inQuaternary Science 2: 373–424.
Dyke AS, Andrews JT, Clark PU, et al. 2002. The Laurentide andInnuitian Ice Sheets during the Last Glacial Maximum. QuaternaryScience Reviews 21: 9–31.
Eberl DD. 2003. User guide to RockJock: a program for determin-ing quantitative mineralogy from X-ray diffraction data. UnitedStates Geological Survey, Open File Report 03-78, Washington,DC.
Eberl DD. 2004. Quantitative mineralogy of the Yukon River system:variations with reach and season, and determining sedimentprovenance. American Mineralogist 89: 1784–1794.
England JH, Atkinson N, Bednarski J, et al. 2006. The Innuitian IceSheet: configuration, dynamics and chronology. Quaternary Sci-ence Reviews 25: 689–703.
England JH, Furze MFA, Doupe JP. 2009. Revision of the NWLaurentide Ice Sheet: implications for paleoclimate, the northeastextremity of Beringia, and Arctic Ocean sedimentation. QuaternaryScience Reviews 28: 1573–1596.
Ehrhardt A, Gohl K, Neben S, et al. 2008. Davis strait andUngava Fault Zone: first results from a recent geophysical survey.Eos Trans. AGU, 89(53), Fall Meet. Suppl., AGU Fall Meeting, SanFrancisco.
Funder S, Kjellerup K, Kjær K, et al. 2011. The Greenland Ice Sheet,the last 300,000 years: a review. In Quaternary Glaciations, Extentand Chronology. Part IV. A Closer Look. Developments inQuaternary Science 16. Elsevier: Amsterdam.
Ganopolski A, Calov R, Clausen M. 2010. Simulation of the lastglacial cycle with a coupled climate ice-sheet model of intermedi-ate complexity. Climate of the Past 6: 229–244.
Harrison JC, St-Onge MR, Petrov O, et al. 2011. Geological map ofthe Arctic. Geological Survey of Canada, Map 2159A, scale1:5000000.
Hemming SR. 2004. Heinrich events: massive Late Pleistocenedetritus layers of the North Atlantic and their global climateimprint. Reviews of Geophysics 42: RG1005.
Hillaire-Marcel C, de Vernal A, Aksu AE, et al. 1989. High-resolutionisotopic and micropaleontological studies of Upper Pleistocenesediment at ODP site 645, Baffin Bay. In Proceedings of the OceanDrilling Program, Scientific Results leg 105-B, Srivastava SP et al.Ocean Drilling Program: College Station, TX; 599–616.
Hiscott RN, Aksu AE, Nielsen OB. 1989. Provenance and dispersalpatterns, Pliocene–Pleistocene section at site 645, Baffin Bay. InProceedings of the Ocean Drilling Program, Scientific Results Leg105, Srivastava SP et al. Ocean Drilling Program: College Station,TX; 31–52.
Holland DM, Thomas RH, De Young B, et al. 2008. Acceleration ofJakobshavn Isbrae triggered by warm subsurface ocean waters.Nature Geoscience 1: 659–664.
Copyright # 2013 John Wiley & Sons, Ltd. J. Quaternary Sci., (2013)
JOURNAL OF QUATERNARY SCIENCE

Hulbe CL, MacAyeal DR, Denton GH, et al. 2004. Catastrophic iceshelf break up as the source of Heinrich event icebergs. Paleocea-nography 19: PA1004.
Jakobsson M, Mayer LA, Coakley B, et al. 2012. The InternationalBathymetric Chart of the Arctic Ocean (IBCAO), version 3.0.Geophysical Research Letters 39: L12609. doi: 10.1029/2012GL052219
Jennings AE, Sheldon C, Cronin TM, et al. 2011. The Holocenehistory of Nares Strait: transition from glacial bay to Arctic-Atlanticthroughflow. Journal of Oceanography 24: 26–41.
Laskar JP, Robutel F, Joutel F, et al. 2004. A long term numericalsolution for the insolation quantities of the Earth. Astronomy andAstrophysics 428: 261–285.
Li G, Piper DJW, Campbell DC. 2011. The Quaternary LancasterSound trough-mouth fan, NW Baffin Bay. Journal of QuaternaryScience 26: 511–522.
MacAyeal DR. 1993. Binge-purge oscillations of the Laurentide IceSheet as a cause of the North Atlantic’s Heinrich events. Paleo-ceanography 8: 775–784.
MacLean B, Blasco S, Bennett R, et al. 2010. Ice keel seabed featuresin marine channels of the central Canadian Arctic Archipelago:evidence for former ice streams and iceberg scouring. QuaternaryScience Reviews 29: 2280–2301.
Maclean B, Williams GL, Srivastava SP. 1990. Geology of Baffin Bayand Davis Strait. In Geology of Canada No.2: Geology of thecontinental margin of eastern Canada, Keen MJ, Williams GL (eds).Geological Survey of Canada: 293–348.
Marcott SA, Clark PU, Padman L, et al. 2011. Ice-shelf collapse fromsubsurface warming as a trigger for Heinrich events. Proceedings ofthe National Academy of Sciences of the USA 108: 13415–13419.
Marshall SJ, Koutnik MR. 2006. Ice sheet action versus reaction:distinguishing between Heinrich events and Dansgaard-Oeschgercycles in the North Atlantic. Paleoceanography 21: PA2021.
O Cofaigh C, Andrews JT, Jennings AE, et al. 2012. Glacimarinelithofacies, provenance and depositional processes on a WestGreenland trough-mouth fan. Journal of Quaternary Science doi:10.1002/jqs.2569
O Cofaigh C, Dowdeswell JA, Jennings AE, et al. 2013. An extensiveand dynamic ice sheet on the west Greenalnd shelf during the lastglacial cycle. Geology 41: 219–222.
Parnell J, Bowden S, Andrews JT, et al. 2007. Biomarker determina-tion as a provenance tool for detrital carbonate events (Heinrichevents?): fingerprinting Quaternary glacial sources into Baffin Bay.Earth and Planetary Science Letters 257: 71–82.
Petersen SV, Schrag DP, Clark PU. 2013. A new mechanism forDansgaard-Oeschger cycles. Paleoceanography 28: 1–7. [doi:10.1029/2012PA002364]
Rignot E, Mouginot J. 2012. Ice flow in Greenland for the Internation-al Polar Year 2008. Geophysical Research Letters 39: L11501.
Seidenkrantz MS, Kuijpers A, Aagaard-Sørensen S, et al. 2010.Glacial ocean circulation and shelf edge glaciation offshore SW
Greenland during the past 75.000 years. Geophysical ResearchAbstract, vol. 12: EGU2010-4721.
Sheldon C. 2012. The deglacial History and Paleoceanography of theUummannaq System, West Greenland. MSc thesis, University ofColorado.
Simon Q. 2013. Proprietes magnetiques, mineralogiques et sedimen-tologique des sediments profond de la baie de Baffin: chronologieet dynamique des glaciers ouest groenlandais, innuitiens etlaurentidiens au cours de la derniere glaciation. PhD Thesis,Universite du Quebec a Montreal.
Simon Q, St-Onge G, Hillaire-Marcel C. 2012. Late Quaternarychronostratigraphic framework of deep Baffin Bay glacio-marine sediments from high-resolution paleomagnetic data. Geo-chemistry, Geophysics, Geosystems 13: Q0AO03. doi: 10.1029/2012GC004272
Srivastava SP. 1989. Proceedings of the Ocean Drilling Program,Scientific Results. Baffin, Bay and Labrador Sea. Leg 105, Sites645–647. Ocean Drilling Program: College Station, TX.
Srivastava SP, Arthur M, Clement B. 1987. Introduction. Proceedingsof the Ocean Drilling Program, Scientific Results Leg 105,Srivastava SP, Arthur M, Clement B (eds). Ocean Drilling Program:College Station, TX; 5–20.
St-Onge G, Mulder T, Francus P, et al. 2007. Continuous physicalproperties of cored marine sediments. In Developments in MarineGeology. Proxies in Late Cenozoic Paleoceanography, vol. 1Hillaire-Marcel C, de Vernal A (eds). Elsevier: Amsterdam; 63–98.
Stokes CR, Clark CD. 2001. Palaeo-ice streams. Quaternary ScienceReviews 20: 1437–1457.
Stokes CR, Tarasov L. 2010. Ice streaming in the Laurentide Ice Sheet:a first comparison between data-calibrated numerical model outputand geological evidence. Geophysical Research Letters 37:L01501.
Stokes CR, Tarasov L, Dyke AS. 2012. Dynamics of the NorthAmerican Ice Sheet Complex during its inception and build-up tothe Last Glacial Maximum. Quaternary Science Reviews 50: 86–104.
Tang C, Ross C, Yao T, et al. 2004. The circulation, water massesand sea-ice of Baffin Bay. Progress in Oceanography 63: 183–228.
Thorez J. 2003. L’argile, mineral pluriel. Bulletin de la Societe Royaledes Sciences de Liege 72: 19–70.
Waelbroeck C, Labeyrie L, Michel E, et al. 2002. Sea-level and deepwater temperature changes derived from benthic foraminiferaisotopic records. Quaternary Science Reviews 21: 295–305.
Weidick A, Bennike O. 2007. Quaternary glaciation history andglaciology of Jakobshavn Isbræ and the Disko Bugt region, WestGreenland: a review. Geological Survey of Denmark andGreenland Bulletin 14.
Young NE, Briner JP, Rood DR, et al. 2012. Glacier extent during theYounger Dryas and 8.2-ka event on Baffin Island, Arctic Canada.Science 337: 1330–1333.
ICE STREAM DYNAMICS IN BAFFIN BAY
Copyright # 2013 John Wiley & Sons, Ltd. J. Quaternary Sci., (2013)


