Embed Size (px)
Citation preview

Deep-Sea Research, Vol. 36, No. 8, pp. 1219--1236, 1989. 0198-0149/89 $3.00 + 0.00 Printed in Great Britain. © 1989 Pergamon Press plc.
Northern Indian Ocean upwelling cells and the stable isotope composition of living planktonic foraminifers
DICK KROON* and GERALD GANSSEN*
(Received 19 November 1987; in revised form 29 March 1989; accepted 21 April 1989)
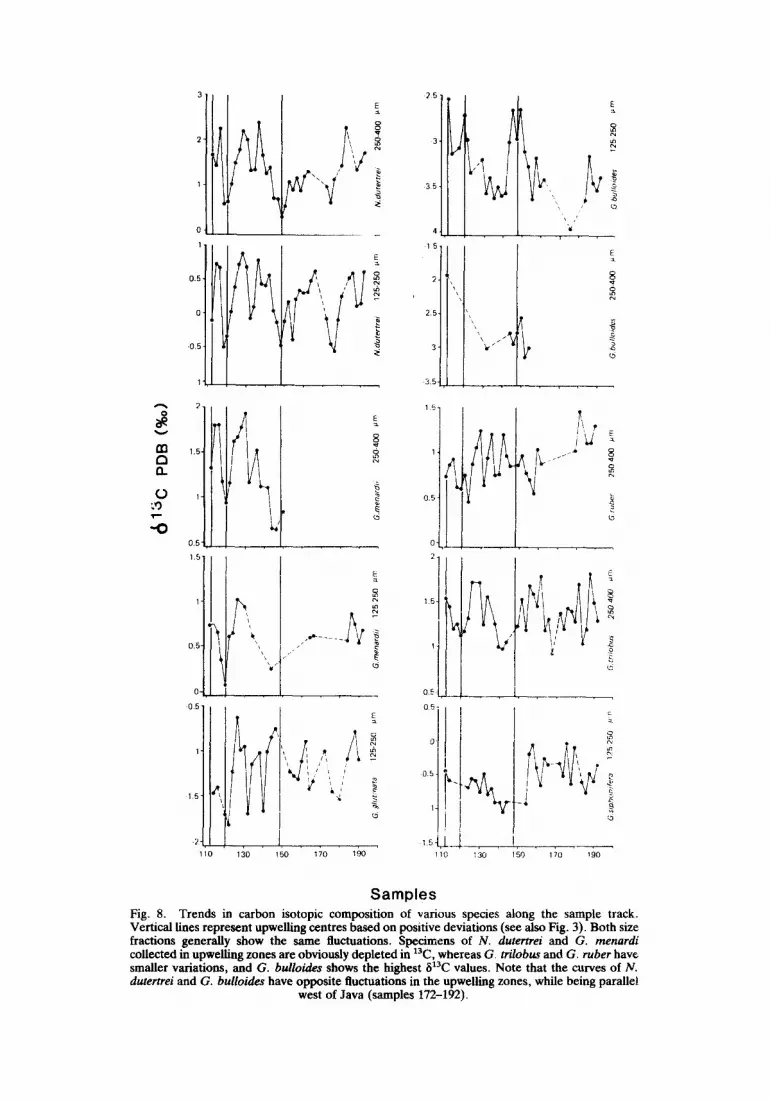
Abstract---Oxygen and carbon isotope ratios were determined of the shells of riving planktonic foraminifers, collected along a west-east transect in northern Indian Ocean surface waters. The 51so values of all species do not corresp,,',d closely to the temperature fluctuations caused by the upwelling of colder subsurface waters. This is explained mainly by rapid warming of the episodically advected colder subsurface waters into the euphotic zone. The carbon isotope composition of shells of the non-spinose Neoqloboquadrina dutertrei, Globorotalia menardii and to a lesser extent Globigerinita glutinata clearly shows depletion in 13C within upwelling areas. The 8~3C values of the symbiont-bearing, spinose carnivorous species Globigerinoides trilobus, Globigerinoides ruber and GlobigerineUa siphonifera only exhibit minor variations. Globigerina bulloides shows an enrichment in ~3C.
We explained the observed ~3C variations assuming that the species represent different phases of the pulsating upwelling system; N. dutertrei and G. menardii representing its initial phase, when nutrient-rich, 13C-depleted water reaches the surface. G. buUoides invades later, after the phyto- and zooplankton blooms are well developed and the uptake of ~2C in the organic material has balanced or even exceeded the amount of 12C carded into the surface waters through upwelling. Thus the 13C/12C ratios of the various species depend on their timing of optimum occurrence determined by the intensity, longevity and corresponding biological activities in the upwelling cycle. Unknown vital effects caused by food source and/or metabolic activities may further influence the 13C/12C ratios of the various species.
INTRODUCTION
RATIOS of stable isotopes of oxygen and carbon in calcareous tests of planktonic foraminifers are widely used in paleoceanography to reconstruct environmental para- meters of ancient ocean surface waters, assuming that the isotope signal of the shells reflects the isotopic characteristics of the ambient surface waters in which they formed. However, this assumption can not simply be made. Studies on the isotope ratios in the shells of extant planktonic foraminifers (EREz and HONJO, 1981; DUPLESSY et al., 1981; GANSSEN, 1983; BOUVIER-SouMAGNAC and DUPLESSY, 1985) showed that more knowledge of the factors that determine these ratios is needed to properly understand the isotopic signal in the tests of fossil foraminifers.
As for oxygen, there has been much debate whether planktonic foraminifers build their tests in isotopic equilibrium with the ambient s e a w a t e r (SHACKLETON et al., 1973; KAnN, 1979; DUPLESSY et al., 1981; FAIRBANKS et al., 1980; KAH~ and WILLIAMS, 1981; EREZ and HoNJO, 1981; EREZ and Luz, 1983; BOUVIER-SouMAGNAC and DUPLESSY, 1985; among others). Most authors agree that the deviation from isotopic equilibrium is
* Geomarine Center, Institute for Earth Sciences, Free University, P.O. Box 7161, 1007 MC Amsterdam, The Netherlands.
1219

1220 D. KROON and G. GANSSEN
small and that the offset is constant. Therefore the 5180 value in the shells reflects the oxygen isotope ratios of the seawater, and its temperature.
On the other hand, WILLIAMS el al. (1977), BERGER et al. (1978) and BOUVIER- SOUMAGNAC and DUPLESSY (1985) demonstrated that the carbon isotope composition in the tests of planktonic foraminifers is clearly out of equilibrium with the ambient seawater, with the largest departures in small specimens. However, they also showed that 813C variations of the total dissolved inorganic carbon (ZCO2) in the surface waters are recorded in the shells, if specific size fractions are analysed.
DUPLESSY et al. (1981) and BOUVIER-SOuMAGNAC and DUPLESSY (1985) measured the isotope signal of Indian Ocean planktonic foraminifers along a north-south transect and determined the differences between the shells of living specimens and their empty counterparts in the sediments. Thus they were able to detect deviations from the original isotope ratio, caused by secondary calcification lower in the water column, just during the sinking process to the bottom prior to reproduction. PRELL and CURRY (1981) studied the effects of upwelling in core top sediments along an east-west transect in the Arabian Sea. They concluded that 6180 gradients of some species are highly correlated with sea surface temperatures produced by upwelling conditions during the southwestern mon- soon. In contrast, the 813C variations of various species in the bottom sediment appeared not to be related to upwelling waters.
In this paper we report trends in isotopic composition of the tests of various living species along a northern Indian Ocean west-east transect controlled by upwelling zones. Species that record the 6180 and 813C variations related to upwelling may provide the possibility to reconstruct changes in upwelling properties through time from the fossil record.
M E T H O D S
Plankton samples were collected from 15 June to 2 July 1984, during the outward voyage (cruise GO) of the Dutch R.V. Tyro on its Indonesian-Dutch Snellius II Expedition (Fig. 1). We obtained a continuous set of samples by a pump method, filtering 40--60 m 3 of seawater every 2--4 h through a 75 ~tm sieve. Seawater temperature and salinity were measured at the time of sampling. The samples were preserved in alcohol.
A Low-Temperature Asher (LTA) was used to obtain a concentrate of shelled plankton. DUPLESSY et al. (1981) showed that roasting by means of a LTA has no profound effect on the stable isotope ratios. Large samples were split into suitable aliquots of at least 250 specimens of foraminifers and species were identified and counted in two size fractions (125-250 and 250--400 ~tm) to reveal relative frequency patterns (KROON, 1988).
Every second sample was examined. The following species were selected for isotopic analysis: Neogloboquadrina dutertrei (d'Orbigny), Globorotalia menardii (Parker, Jones and Brady), Globigerina bulloides d'Orbigny, Globigerinella siphonifera (d'Orbigny), Globigerinoides trilobus (Reuss), Globigerinoides ruber (d'Orbigny) and Globigerinita glutinata (Egger). We analysed specimens from distinct size fractions (125-250 and 250- 400 pan) to avoid noise from size effects. The analyses were performed on a MAT 251 mass spectrometer equipped with a fully automated carbonate preparation device. Analytical procedures have been described by ZAI-IN-KnoLL (1986). The analytical

Indian Ocean upwelling cells 1221
30 ° 4no 50 ° 600 70 ° 80 v 90 v IUU ~
Fig. l . Track of R.V. Tyro cruise GO of the Snellins I I Expedition, June 1984, showing locations of starting points of sampled intervals in the northern Indian Ocean. Samples 112-192 have been analysed for the stable isotope composition in foraminifera] tests; shaded pattern
denotes upwelling areas, based on isotherms from WYRTK[ (197]), contours in °C.
, ,U °
~iiilii i~iii~iil i i - - ~i~ ~ii~ ~iiii~i~i I ,,,~
iiii r
i MC.
S,E.C. IND IAN OCEAN ~ l 1 JAVA
30 ° 400 .5O ° eoo 70 ° so o go o ~oo o
Fig. 2. Surface water circulation pattern during the summer monsoon; S.C., Somali Current; M.C., Monsoon Current; S.E.C., South Equatorial Current (after Drd~Atcr, 1961). Intense
upwelling areas are shaded.
110 °

1222 D. KROO~ and G. GANSSEN
precision reached during the measurements from working standards was 0.07%0 for ~]80 and 0.04%0 for 613C. The ~ values are referred to PDB by the standard notation (CRAIG, 1957) and are calibrated to the NBS standard through a laboratory standard (Solnhofen Limestone).
280
270
2 6 0 S
250
~3 240
230
22 0
410
4 0 0
o 39 0 E
ls . JwEsT A.AS,AN SEA E-N ,NO,AN OCEAN OF I N D I A J A V A
37 0
~oo ~ ~ . ~ 350 )
320
31 0
300
E 290
g 280
27.0
26O
2 5 0
24 0 V Vl VIf VI VI I
114 t19 123 127 131 135 139 143 147 152 156 160 164 168 172 177 181 185 189 193
SAMPLES Fig. 3. Temperature and salinity values measured during the R.V. Tyro cruise GO of the SneUius II Expedition. Note temperature drops in upwelling areas. Black dots represent analysed plankton samples. V-VII are foramind" eral assemblages recognized through P.C.A. of species counts (KROON, 1988): V, G. menardii-N, dutertrei upwelling assemblage, VI, G. trilobus
assemblage, VII, N. dutertrei--G, bulloides upwelling assemblage. For location see Fig. 1.

Indian Ocean upwelling cells 1223
E N V I R O N M E N T A L S E T T I N G
The oceanic circulation pattern of the northern Indian Ocean provides an ideal setting to study the influences of upwelling processes on the foraminiferal fauna and the isotopic signal in the tests of various species. The direction of currents and physical parameters of the water masses are determined by the seasonally reversing monsoons (WYRTKI, 1973). The summer monsoon (May-October) creates distinct upwelling areas along the Arabian coast, the southern tip of India and west of Java and Sumatra (Figs 1 and 2). The intensity and longevity of upwelling depend on the speed and the duration of the prevailing winds. Rapidly changing wind patterns and local topography cause upwelling plumes to spread offshore as isolated ellipses.
During our cruise (summer 1984) we measured distinct temperature drops near the coasts of Somalia, Socotra and south of India (Fig. 3). These drops mark cells of colder subsurface waters which are characterized by an enhanced nutrient content and fertility (WYRTKI, 1971).
O X Y G E N I S O T O P E S
The oxygen isotope ratios measured in the tests of planktonic foraminifers are expected to reflect the temperature gradients produced by colder upwelling pulses, showing a change of about 0.25%o in 81So per I°C (EPSTEIN et al., 1953). Indeed, all species show a clear filao gradient across the Arabian Sea, with highest values near the coast of Somalia (sample 112) and Socotra (samples 118, 120 and 122) and a gradual decrease towards the eastern Arabian Sea (Fig. 4). Most species also show a significant 1So enrichment south of India. However, the observed ~laO values do not agree with the predicted values of temperatures (Fig. 5).
There are two probable causes for these aberrant slopes. First, the low ~180 values west of Java (samples 172-192) are due to fresh water from fiver discharge in the Bay of Bengal, resulting in depletion of 180 (Fig. 4). Thus specimens collected west of Indonesia originate further north and are transported southward (Fig. 2). If these samples are excluded in the temperature- 8180 plots then the slopes of the regressions become steeper (Fig. 5). Secondly, the filSo values in the tests do not correspond with the measured temperatures in the upwelling cells, particularly not in the western Arabian Sea. That the collected specimens did not secrete their tests under these temperatures is not surprising in such a rapidly changing environment, where pulsating and shifting upwelling plumes influence the surface layer. Coincidentally the ~lao values of G. bulloides and N. dutertrei from south of India do match the recorded temperatures during this cruise. Consequently N. dutertrei and G. bulloides approximately show the predicted slopes in a temperature- filSo plot when western Arabian Sea data (samples 112-132) are omitted (Fig. 6). Thus our temperature and ~lSo relationships do not always correspond because the upwelled cool waters have warmed up significantly or the fringes of the upwelling cell have been mixed with surrounding relatively warmer surface water.
In fact, the collected species assemblage in one sample represents a mixture of populations formed during, before and/or after an upwelling pulse, depending on their depth habitat and reproduction strategy. Even discrete species may have their optimum abundances during subsequent phases within one upwelling cycle. The spinose species G. trilobus, G. ruber and G. buUoides have a negative deviation in 61So with respect to the

1224 D. KROON and G. GANSSEN
1 5 "
2'
2.5.
3.
35-
15-
2"
25-
3"
35-
q.
L , ° o P.,
I . . . . . ,
,,5
2-
4~
15
2
E
I / i "~ " ~ ~ !
A
a Q.
0 o0
'..o
15,
2~
25,
3
35 . 15
2.5
E ~5
&
. o
f
I
E ,
2
- % ~
~ ~ll m ° ~
~5
35
15
25
35
4 ~ . . . . . . . .
E
Q
I
E
4 . 5 I 110 130 1 ~ 170 190 110 130 150 170 190
S a m p l e s Fig. 4. Variations in oxygen isotope composition of various species along the sample track of Fig. 1. Note the 1sO enrichment for most species in upwelling areas. Vertical lines mark
upwelling centres.

O o
UJ n-
b- < m IJJ O. :E iii I -
3O
29
28
27
26
30.
29-
28-
27-
26.
30-
R--0.77 N.dutertrei 250-400 #m
R=-0.73 N, dutertrei 125-250 ~um
• • ° o O
\ \
30
29
28
R--0.77 G.tri/obus
27 250-400 #m
3O
29
28
R= -0.75 G.siphonifera
27, 125-250 #m 30,
,P
% ,,,~'.~....
\ \ \ \
29.
28.
R--0.77 G,menardii
27 • 250-400 um
3 0
2 9
2 8
R,-0.79 G, menardii
27 125-250 pm
3O
29
28'
• e • %
~e •
' l \ "~,,'-, a
e X • \%
29-
28-
R=-0.84 G.ruber
27. 250-400 .um
30-
29.
28.
27-
R=-O.76 G.bulloide$
26" 125-250 pm
29'
28-
27 ¸
%Xxx •
~ o oe e ..-,\
R=-0.77 R=-O.39 ! G, glutinara G.bulloides •
27 125-250 #m 2 6 250-40Oum
(5180 PDB (%0) Fig. 5. Plots showing temperature vs 61sO. Solid line shows linear regression; R=correlation coefficient; broken lines are regression in which the easternmost samples are excluded (squares): Note that not a single species shows the relationship predicted by the EPSTEIN et al. (1953)
o 18 equation (4 C per 1%o fi O). Broken regression lines show that the tests of populations collected west of Indonesia were formed somewhere in the bay of Bengal, where river discharge produces negative 6iaC and ~'80 deviations. Circulation patterns presumably transported these popula-
tions to the south (see also Fig. 2).

1226 D. KROON and G. GANSSEN
o
<
ILl o.
t.~
30
29
28
27-
N clutet tres
250-400 ,urn 26- _ _
4 ~
IVdutertres ~ 125 250 l~m •
• ~ o o •
G.bulhode~ 125250 ; m •
I~ 1 8 0 P D B ( % 0 )
Fig. 6. Temperature-~lsO plots for G. bulloides and N. dutertrei (excluding samples 112-132, western Arabian Sea). The regression lines fit approximately the EPSTEIN et al. (1953) correlation (4°C per 1%o ~180). This is due to significant warming of the originally cool subsurface waters
after the tests have been formed.
non-spinose thermocline dwellers G. menardii and N. dutertrei (Fig. 7). This may imply that the tests of the spinose species were formed in a later stage of the upwelling cycle when temperatures of advected cooler waters were raised. However, ~ 8 0 differences of --0.5%o between different extant species also have been attributed to vital effects (VERGN~uD-GRAZZINI, 1976; KAHN, 1979; FAIRBANKS et al., 11980; KAHN and WILLIAMS, 1981; DEUSER et al., 1981; DUPLESSY et al., 1981; BOUV1ER-SOUMAGNAC and DUPLESSEY, 1985).
CARBON ISOTOPES
The horizontal distribution of carbon isotopic variations in the ]~CO 2 of surface waters is highly influenced by upwelling processes that bring eutrophic subsurface waters to the surface. These deeper waters are depleted in 13C by the release of ~2C through the oxidatior of organic material that sank from the surface where lZC is preferentially fixed during photosynthesis (KRooPNICK et al., 1972; KROOPNICK, 1974, 1985; BERGER and VINCENT, 1986). The total dissolved carbon of normal surface waters is consequently enriched in 13C.
The 513C of the ECO2 at a depth of 100--200 m is 0%0 (PDB), and at the surface 1.6%o (PDB) in the Arabian Sea (KROOPNICK, 1985, GEOSECS Stas 413, 416 and 417). Therefore, the isotopic carbon signal in the shells of foraminifers should register upwelling regions, particularly the species with a short life cycle whose distribution is more or less confined to these cells, as the bulk of their carbonate is formed during the upwelling period.
The non-spinose species G. menardii and N. dutertrei obviously show variations in ~13C. Minimal values correspond ~o upwelling areas and confirm the model (Fig. S). However, the observed absolute minimal values in the 250-400 ~tm size fraction (0.31%o for N. dutertrei and 0.73%o for G. menardii, south of India) are too low with respect to the predicted value of 2.1%o, if we correct for temperature (EMRICH et al., 1970). Distinct v'~tal effects of the various species are considered to cause the difference between the observed and predicted values. Yet, the trends in carbon isotope composition in the shells reflect those of the ECO2 in the surface waters, because limited size fractions have been used and both size fractions show the same general fluctuations.

Indian Ocean upwelling cells 1227
-1.5
-2
-2.5
-3
-3.5-
-4-
110
-1.5-
a .
-2-
",0 -2.5-
-3-
-3.5-
' 1~o 1 ~
125-250 pm
o-o N, durerrrei
o - o G.siphonifera
G, bulloides
170 190
250-400 vm
G.menardii
N.dutertrei
~ G.rubor
G.rri/obus
/I
t ,
-4-
11o ' 1~o 1;o 1;o 1;o
S a m p l e s Fig. 7. Diagrams showing 8180 values of two size fractions plotted along sample trajectory of Fig. 1. Note offset of spinose species towards fighter values compared to non-spinose species. Different 8tso responses of spinose and non-spinose species in both size fractions indicate that their tests were formed during successive colder and warmer periods of the upwelling cycle,
respectively, or different vital effects.
~..o~o~
613
C
PD
B (%0)
~.~ ~
= p_..
"IV
@
~<
@
@
O
" '
..
..
~--
- ~
tC
.
~
Gsl
l~h~
Jn/fe
ra
125
25
0
~m
G
trno
bu$
25
0 4
00
~
r'l
Gru
be
r 2
50
40
0
#m
G
.bul
toJd
es
25
0 4
00
u
m
G b
ullo
tde$
12
5 2
50
U
rn

Indian Ocean upwelling cells 1229
C3 n
O oO
"O
-1.5 -2- I R , - 0 . 2 3 6 E =+
• +
-2.5
3 • • • ~
-3.5
+1.5
.2 ! • ~
2.5 • 11o
3
• o e +3.5 • •
-0.5 0 0.5 1
+1.5 = -0.06 • E
• ; }
-2.5 ~
3 0.5 1 1.5 2
-15" R ~ +0.34
~,5 ~ ~
• ,,d
t " -3.5-
2"
.2.5
3
3.5 2 -1.5 -1 0 .5
o15 i 115
R+ 0+05
• •
o e • • e m +ii N
~ °
• I
R , 0.32 • o • oee E
• ~
0.5 1 1.5 2
-2" R , -0.16 • E
2.5- • •
-3- ~ ~
. . ; -" -3.5-
-4. i -~+5 .i o;5 6 o.5
2 R = -0.38
". ° ~ 2.5. •
• • ~. . =.9_ • 6
• •
3,5" o'5 i 115
2" 1 R= 0.719 ° = ° ° J ~ • E
3t " t ~ ~ . " ~
i + . . . . ~ -
1.5
.2
2.5
-3
- 3 5 3
R = 0,84 E :L
• ~
t~ 13C PDB (%o)
-L 215 ~ ,,s
Fig. 9. Plots of ~ 1 8 0 VS ~ 1 3 C for two size fractions of carious species. Note that ++he stable isotopes in the tests are not highly correlated except for G. buUoides.

1230 D. KROON and G. GAN~SEN
v
f13 (:3 13. O
¢D
"O
1.5-
2-
2.5-
3 ' 0,5
1.5-
2 "
2 .5 -
-3"
Samples 112 132 250-400 pm
R = 0 .687
Samples 134-162 250-400 ~m
R = 0.61
2 / ] Samples 134 166
' • 125-250 ~m
3 •
R = 0 ,76 3.5
-2.5
0.5
1 5 7
0 0 5 I
Samples 112 132 125-250 ~rn
R = 0.47 • 3
3 ' -0.5 0 0.5
613C PDB (%0). Fig. 10. Plots of 8]so vs 813C for both size fractions of N. dutertrei, showing negative correlations if we discriminate the two distinct upwelling areas. Samples west of Java are excluded, as the stable isotopes in the tests of these specimens are influenced by river outflow into the Bay of Bengal. Thus G. bulloides and the thermocline dweller N. dutertrei show opposite
relationships during upwelling conditions.
The variations in 13C/12C ratios in the tests of G. bulloides show an inverse pattern; contrary to the non-spinose species, enrichment in 13C occurs in specimens derived from the upwelling zones (Fig. 8). In general the average curve shows a large offset from isotopic equilibrium fractionation.
The spinose surface dwellers G. trilobus and G. ruber exhibit small fluctuations in carbon isotope composition. In general, slight variations of -0.5%0 in 613C can be observed in both species within upwelling areas (Fig. 8). No obvious latitudinal trends in 813C can be observed in the tests of G. siphonifera, except that an obvious break appears between Arabian Sea and eastern North Indian Ocean samples (Fig. 8).
Plots of 8180 vs 813C show a positive correlation for G. buUoides; other species do not demonstrate an obvious relationship, if all the samples along the traject are included in the analysis (Fig. 9). However, N. dutertrei shows negative correlations in distinct upwelling areas (Fig. 10) when the samples west of Java are not used, as these populations reflect the xaC impoverishment in the shells due to river discharge in the Bay of Bengal. Remarkably, the 813C curves of N. dutertrei and G. bulloides show opposite trends in the upwelling areas while they parallel each other west of Java (Fig. 8). This may provide a tool to distinguish high fertility areas induced by upwelling from those caused by river input.
Also, the stable isotopes in the tests of specimens caught in the eastern Arabian Sea may be affected by river run-off. N. dutertrei shows a significant 8~3C drop in samples 132-134, while no enrichment in 1So was measured.

Indian Ocean upwelling cells 1231
D I S C U S S I O N
The variations in oxygen and carbon isotope ratios in the shells of living planktonic foraminifers caught in northern Indian Ocean surface waters are influenced by variations in temperature and nutrients caused by upwelling conditions. The carbon isotopic signature of various species exhibits distinct trends, which can be explained in terms of upwelling processes (Fig. 11). The non-spinose species N. dutertrei and G. menardii and to a lesser extent G. glutinata are depleted in 13C in the upwelling cells. The spinose species G. tuber, G. trilobus and G. siphonifera only show small fluctuations in ~13C (Fig. 8). The ~13C signals of the various species may reflect the thermodynamical system of upwelling. Spasmodically cool, deeper water cells enrich the surface layer, initiating primary and secondary production. The non-spinose species G. menardii and N. dutertrei have a deeper position in the water column. Therefore, these species will thrive during the incipient stage of upwelling, when seawater is enriched in 12C. This is reflected in our
B.
[•TIME (1day - full year)
MARINE I PHYTOPLANKTON ZOOPLANKTON ENVIRONMENT I STAGE STAGE
NORMAL TROPICAL I MARINE ]
ENVIRONMENT I
:~!~i~i~i~!~i~i~i~i~i!i~i~i~i~i~i~i~i!i~i~i~iiii!iii!!~i!iii!iii!iiii~iii~iii~iii~iiiiiiii~i~i~i~iiiiii~!!!iiii!iii!!i!!~!::i~ ....
ii~i~iiii~{i~ii~:iii~ii~iiiii~::~i~iii::iiiiiiiiiiiiiii:i~iii~ii~i~iii~iiiii~iiiii~i~i~iiiiiiiiiii~iiiiiiiiiiiii~iiiii~.. ~:~i~i~i~i~i~i~i~i~:~i:i:i~i~i~i~~iiiiii~ii!~i~i~ii!~i~i~i!~:~!~
::::%iiiii!iigiiiiiiiiiiiiiiiii!iiiiiiiiiiiiiiiig::iii~i~ . . . . . . . !i!i!ii~{ji~-i~::.:N:i:66:~.i:~:~
o/oo
Fig. 11. Model to account for our observations, showing life cycle of an upwelling cell and implications for planktonic foraminifers. (A) Sketch of standing crop illustrating phyto- and zooplankton proportions of upwelling increased biomass (scale is hypothetical). (B) Sketch, illustrating relative frequencies of foraminifera as a consequence of maturation of upweiling cell. Note that the differential behaviour of the non-spinose and spinose species is recorded in 1i13C trends. Additionally symbiont activities may explain that the spinose species G. trilobus, G. tuber
and G. siphonifera do not show a relation to upwelling-induced trends in 813C of ZCO2.

1232 D. KROON and G. GANSSEN
data on the thermocline dwellers G. menardii and N. dutertrei. The spinose, carnivorous species G. trilobus, G. tuber and G. siphonifera would find optimal conditions in a later stage of upwelling. This could explain why our spinose species have only smaller changes in 513C values and 5180 values, suggesting somewhat warmer conditions than the non- spinose. By then the preferential uptake of 12C in the organic material has compensated the upwelling enrichment of 12C in the surface layer. In addition these species have symbiotic algae (HEMLEBEN and SPINDLER, 1983) that may disturb the upwelling-induced 513C variations.
The fact that G. bulloides is even enriched in 13C in the upwelling zones suggests that it thrives during the final stage of upwelling when the fixation of 12C in the phytoplankton blooms exceeds the amount of 12C brought into the surface waters. Since this species lacks symbiotic algae (HEMLEaEN and SPINDLER, 1983), the carbon ratios can not be influenced by their activities.
Exceptional nutrient conditions occur when particulate organic matter is raining down from the offshore-flowing upwelled water. This material gets recycled in the onshore- flowing, upwelling source water (REDFIELD et al., 1963). Subsequently biomass will increase to extraordinary values, which may explain the enriched values observed in the tests of G. bulloides.
Differential response in 513C of various species caused by distinct phases in the upwelling cycle should be confirmed by corresponding 5180 signals, since the 180/160 ratios in the shells depend on temperature. Indeed, the spinose species are depleted in ~So, suggesting that their tests calcified during final warmer stages of upwelling. However, vital effects would produce the same deviations in 5180. Consequently carbon isotopic fractionations also may result from biological factors like metabolic rates or food habits. We conclude that the thermodynamical processes in the upwelling cycle, in combination with biological factors, cause differential trends in 8180 and 813C of various planktonic foraminiferal species.
Differential responses in the carbon isotopic composition of various species also were noted by GANSSEN and SARNTHEIN (1982) and GANSSEN (1983), who found a slight depletion in G. tuber pink and an enrichment of 13C in G. bulloides from the coastal upwelling zone off northwest Africa. CURRY et al. (1983) measured the isotopic composition of foraminifers derived from sediment traps deployed in the Panama Basin. They reported only small changes in 513C in all species, with the largest depletion of 13C for the deeper living cold-water species. Apparently, the carbon isotopic response in the tests of various species in upwelling zones is consistent, but the amplitude of the signal displays variation from one region to the other as a function of the intensity of upwelling or biological factors.
IMPLICATIONS FOR PALEOCEANOGRAPHICAL RECONSTRUCFIONS
PRELL and CURRY (1981) recognized a horizontal gradient in 6180 across the Arabian Sea in the shells of various planktonic foraminifers in the seafloor sediments, which they interpreted as a function of temperature caused by upwelling. In contrast, the predicted 513C gradient was not present. They attributed this to dilution of the upwelled waters, biological fixation, and vital effects. Equilibration with ~tmospheric CO2 also would have dampened the signal. However, our results imply that there should be a ~lac signal of upwelling in the tests of foraminifers that differs for various species Add','fion'~l

Indian Ocean upwelling cells 1233
calcification of the tests at deeper levels may mask the signal to some extent (B~, 1980; Dopt~.ssY et al., 1981). The fact that the surface sediments in a core represent a long time interval with a mixture of shells deposited during upwelling and non-upwelling con- ditions, also could explain the lack of a clear 813C gradient. The limited data set used, bioturbation processes or the fact that not all core tops represented Recent sediments (often piston core sediments were used) also may have caused low 81SO and 8X3C correlations in the tests of G. bulloides and G. menardii.
Still the exact origin for the observed stable isotope trends in G. bulloides and N. dutertrei is not clear, because we cannot discriminate between upwelling dynamics and vital effects. However, past upwelling intensities can be monitored by using stable isotope variations in combination with other parameters like relative frequencies, phenotypic variation of these and other species.
Acknowledgements---We thank G. J. A. Brummer, H.S.M. Jansen and J. E. van Hinte for critically reading the manuscript. J. E. van Hinte was the initiator of this project. We are grateful to H. Willkomm and his staff at the "Iustitut/fir Reine mad Angewandte Kernphysik" in Kid, who not only gave us the opportunity to do the isotopic analyses, but also provided technical assistance and gave many suggestions. This study has been carried out as a part of the SNELLIUS--II expedition, organized by the Netherlands Council of Oceanic Research (NRZ) and the Indonesian Institute of Science (LIPI), and was supported by the Netherlands Organisation for the Advancement of pure Research (NWO, grant 76-84 Urg). This paper is contribution no. 41 of the Geomarine Center Amsterdam.
R E F E R E N C E S
BI~ A. W. H. (1980) Gametogenic calcification in a spinose planktonic foraminifer, Globigerinoides sacculifer (Brady). Marine Micropaleontology, 5, 283--310.
BERGER W. H. and E. VINCENT (1986) Deep-sea carbonates: Reading the carbon-isotope signal. Geologische Rundschau, 75, 249--269.
BERGF_~ W. H., J. S. KILLINOLE¥ and E. VINCENT (1978) Stable isotopes in deep sea carbonates: boxcore ERDC-92, West Equatorial Pacific. Oceanologica Acta, 1,203--216.
BOUVIER-SOLrMAONAC Y. and DUI'LESSY J. C. (1985) Carbon and oxygen isotopic composition of planktonic foraminifera from laboratory culture, plankton tows and Recent sediment: Impfications for the recon- struction of paleoelimatic conditions and of the global carbon cycle. Journal of Foraminiferal Research, 15, 302-320.
CRAIG H. (1957) Isotopic standards for carbon and oxygen and correction factors for mass spectromatic analysis of CO2. Geochimica et Cosmochiraica Acta, 12, 133-149.
Ctrp~Y W. B., R. C. "I'Htrt~ELL and S. HONJO (1983) Seasonal changes in the isotopic composition of planktonic foraminifera collected in Panama Basin sediment traps. Earth and Planetary Science Letters, 64, 33--42.
DEF~Cr A. (1961) Physical oceanography, Pergamon Press, New York, 2 vols, pp. 1-1327. DEUSER W. G., E. H. ROSS, C. I-IE~.EBF_~ and M. SPINDLER (1981) Seasonal changes in species composition,
numbers, mass, size and isotopic composition of planktonic foraminifera settling in the deep Sargasso Sea, Palaeogeography , Palaeoclimatology, Palaeoecology , 33, 103-127.
Dtn't~ssY J. C., A. W. H. BI~ and P. L. BLANC (1981) Oxygen and carbon isotopic composition and the biogeographic distribution of planktonic foraminifera in the Indian Ocean. Palaeogeography, Palaeo- climatology, Palaeoecology , 33, 9--47.
EMRICH K., D. H. E ~ T and J. C. VOGEL (1970) Carbon isotope fraetionation during the precipitation of calcium carbonate. Earth and Planetary Science Letters, 8, 363-371.
EPSTEIN S., R. BUCHSBAUM, H. A. LOWENSTAM and H. C. UREY (1953) Revised carbonate-water isotopic temperature scale. Bulletin of the Geological Society of America, 64, 1315-1326.
E ~ z J. and S. HONJO (1981) Comparison of isotopic composition of planktonic foraminifera in plankton tows, sediment traps and sediments. Palaeogeography, Palaeoclimatology, Palaeoecology, 33, 129-156.
EREZ J. and B. Luz (1983) Experimental paleotemperature equation for planktonic foraminifera: Geochimica et Cosmochimica Acta, 4, 1025-1031.
F~aP, B~CS R. G., P. H. WmBE and A. W. H. BI~ (1980) Vertical distribution and isotopic composition of riving planktic foraminifera in the western North Atlantic. Science, 207, 61-63.
G,~SSEN G. (1983) Dokumentation von Kiistenauftrieb anhand stabiler Isotopen in Schalen rezenter Foramini- feren vor West-Afrika. "Meteor" Forschungsergebnisse, 37, 1--,16.
1234 D. KROOlq and G. GANSSEN
GANSSEN G. and M. SARNTHEIN (1982) Stable-isotope composition of foraminifers: the surface and bottom water record of coastal upwelling. In: Coastal upweUing, Part A, E. SOESS and J. THIEDE, editors, Plenum Press, New York, pp. 99--121.
HEMLEBEN C. and M. SPINDLER, (1983) Recent advances in research on living planktonic foraminifera: In: Reconstruction of marine paleoenvironments, J. E. MEULENKAMP, editor, Utrecht Micropaleontology Bulletin, 30, 141-170.
KAnN M. I. (1979) Non equilibrium oxygen and carbon isotopic fractionation in tests of living planktonic foraminifera. Oceanologica Acta, 2, 195-200.
KAHN M. I. and D. F. WILLIAMS (1981) Oxygen and carbon isotopic composition of living planktonic foraminifera from the northeast Pacific Ocean. Palaeogeography, Palaeoclimatology, Paleoecology, 33, 47-71.
KROON D. (1988) Distribution of extant planktic foraminiferal assemblages in Red Sea and northern Indian Ocean surface waters. In: Planktonicforaminifers as tracers of ocean-climate history, G. J. A. BRUMMER and D. KROON, editors, Free University Press, Amsterdam, pp. 229-267.
KROOPNICK P. M. (1974) The dissolved O2-CO2-13C system in the eastern equatorial Pacific. Deep-Sea Research, 21, 211-227.
KROOPNICK P. M. (1985) The distribution of 13C of CO2 in the world oceans. Deep-Sea Research, 32, 5%84. KROOPNICK P. M., R. F. WEISS and H. CRAIG (1972) Total CO2, 13C and dissolved oxygen-18 at Geosecs II in
the North Atlantic. Earth and Planetary Science Letters, 16, 103-110. PRELL W. L. and W. B. CtJRRY (1981) Faunal and isotopic indices of monsoonal upweUing: Western Arabian
Sea. Oceanologica Acta, 4, 91-98. REDFmLD A. C., B. H. KETCnUM and F. A. RICHARDS (1963) The influence of organisms on the composition
of seawater. In: The sea, Vol. 2, M. HILL, editor, Interscience Publishers, New York, pp. 26-77. SHACKLETON N. J., J. D. H. WISEMAN and H. A. BUCKLY (1973) Non-equilibrium isotopic fractionation
between seawater and planktonic foraminiferal tests. Nature, 242, 17%179. VERGNAUD-GRAZZINI C. (1976) Non-equilibrium isotopic conpositions of shells of planktonic Foraminifera in
the Mediterranean Sea. Palaeogeography, Palaeodimatology, Palaeoecology, 20, 263-276. WmLIAMS D. F., M. A. SOMMER and M. L. BENDER (1977) Carbon isotopic compositions of Recent planktonic
foraminifera of the Indian Ocean. Earth and Planetary Science Letters, 36, 391-403. WVRTrO K. (1971) Oceanographic Atlas of the International Indian Ocean expedition, National Science
Foundation, Washington, D.C., pp. 1-531. WYRTKI K. (1973) Physical oceanography of the Indian Ocean. In: Zeitzschel: The biology of the Indian
Ocean. Spdnger-Verlag, New York, pp. 18-36. ZAHN-KNOLL R. (1986) Spiitquartiire Entwicklung von Kiistenauftrieb und Tiefenwasserzirkulation im Nor-
dost-Atlantik. Rekonstruktion anhand stabiler Isotope kalkschaliger Foraminiferen. Unpublished thesis, Kiel, pp. 1-111.

Indian Ocean upwelling cells 1235
A P P E N D I X
125-250 lun 250-400 tun 125-250 p,m 250--400 tan Sample 51sO 51aC 51sO 513C Sample 5180 513C 5180 513C
G. trilobus 112 -2.67 0.08 -2.23 1.63 114 -2.37 1.55 116 -2.86 1.30 118 -2.27 1.34 120 -2.23 1.20 122 -2.19 1.26 124 -2.42 1.43 126 -2.68 1.84 130 -2.64 1.71 132 -3.01 0.40 -2.87 1.37 134 -3.01 0.43 -2.76 1.70 138 -2.56 1.39 140 -3.19 1.12 142 -3.55 1.12 144 -3.38 1.19 146 -2.77 0.41 150 -2.75 0.36 -2.57 1.33 152 -2.77 1.63 154 -2.88 0.53 -2.73 1.30 156 -2.92 1.81 158 -2.92 1.72 160 -3.22 0.27 -2.97 1.57 162 -2.89 1.91 164 -3.37 1.31 166 -3.43 1.45 168 -3.53 1.07 172 -3.12 1.52 174 -3.42 1.34 176 -3.31 1.57 178 -3.44 1.39 180 -3.41 0.64 -3.35 1.42 182 -3.19 1.82 184 -4.02 1.15 186 -3.90 1.32 188 -3.55 0.70 -3.05 1.94 190 -3.14 1.61 192 -3.30 1.43
G. siphonifera 112 -2.22 -0.36 114 -2.50 -0.47 124 -2.46 -0.59 126 -2.71 -0.45 128 -2.80 -0.47 130 -2.70 -0.63 132 -2.96 -0.36 134 -2.92 -0.66 136 -3.12 -0.56 138 -2.96 -0.78 140 -3.14 -0.78 142 -3.07 -0.92 144 -2.88 -0.76 152 154 -2.89 -0.81 156 -3.00 -0.06 158 -3.07 0.09
-2.71 0.78 -3.04 0.49 -2.92 -0.19 -2.74 0.29 -2.70 0.27 -3.11 1.16 -2.62 0.42 -2.61 0.93 -2.62 0.44 -2.90 0.69 -2.88 0.77
G. siphonifera contd. 160 -2.99 -0.26 -2.79 0.77 162 -3.11 -0.53 -2.71 0.78 164 -3.22 -0.12 166 -3.19 -0.24 172 -3.21 -0.18 174 -3.52 -0.36 176 -3.31 0.12 178 -3.47 -0.53 180 -3.41 0.05 -3.38 0.66 183 -2.84 -0.31 184 -3.59 -0.49 186 -3.64 -0.65 188 -3.34 -0.35 190 -3.42 -0.49 -2.60 0.17 192 -3.14 -0.21
G. tuber 112 -2.72 0.35 -2.41 0.81 114 -2.50 0.96 116 -2.62 1.03 118 -2.64 0.13 -2.31 0.69 120 -2.21 O.67 122 -2.34 0.84 124 -2.56 0.56 126 -2.74 0.99 128 -2.76 1.19 130 -2.61 1.38 132 -3.08 0.13 -3.01 0.77 134 -3.05 0.47 -2.89 1.08 136 -2.99 1.35 138 -2.94 0.89 140 -3.06 0.89 142 -3.05 1.35 144 -3.14 1.12 146 -2.87 0.37 -2.76 0.95 150 -2.77 0.96 152 -2.85 1.08 154 -2.95 0.24 -2.96 0.90 156 -2.95 0.84 158 -3.34 0.69 160 -3.01 0.46 -2.92 1.18 162 -3.72 -0.21 -3.05 1.01 172 -3.38 0.18 180 -4.16 0.03 -3.40 1.17 182 -2.90 1.59 186 -3.43 1.24 188 -3.13 1.25 190 -3.28 1.43
G. bulloides 112 -2.37 -2.47 114 -2.67 -3.04 118 -2.50 -3.00 120 -2.57 -2.63 122 -2.52 -2.91 124 -2.87 -3.25
-1.94 -1.68

APPENDIX. Continued
125-250 ~tm 250-400 ~un 125-250 Itm 250-400 lun Sample 8180 ~13C 8180 ~13C Sample 8t80 813C 8180 813C
G. bulloides contd. 130 -3.02 -3.08 132 -3.39 -3.45 134 -3.19 -3.27 136 -3.35 -3.51 138 -3.33 -3.37 140 -3.29 -3.48 142 -3.47 -3.43 144 -3.08 -2.88 146 -2.95 -2.57 148 -2.64 -2.97 150 -3.29 -2.56 152 -3.42 -2.99 154 -3.47 -3.17 156 -3.63 -3.51 158 -2.94 -3.05 160 -3.47 -3.38 162 -3.44 -3.30 176 -3.98 -3.84 184 -4.06 -3.54 186 -3.79 -3.05 188 -3.80 -3.34 190 -3.99 -3.43 192 -3.63 -3.27
-3.03 -2.50
-2.82 -2.25 -2.96 -2.44 -2.80 -2.60 -2.58 -1.67 -3.16 -2.41 -3.02 -2.55
N. dutertrei 112 -1.96 -0.03 -1.94 1.75 114 -2.46 0.82 -2.25 1.52 116 -2.42 0.77 -2.43 2.36 118 -2.23 -0.43 -1.95 0.66 120 -2.21 -0.26 -1.88 0,71 122 -2.23 0.10 -1,94 1.11 124 -2.56 0.49 -2.27 1.59 126 -2.95 0.84 -2.40 1.91 128 -2.54 1.00 -2.66 2.32 130 -2.47 0.82 -2.30 2.13 132 -2.90 0.04 -2.64 1.46 134 -2.81 0.23 -2.76 1.47 136 -2.86 0.91 -2.73 2.52 138 -2.79 0.56 -2.62 1.79 140 -2.80 0.53 -2.67 1.38 142 -2.74 0.71 -2.77 1.54 144 -2.59 0.17 -2.49 0.85 146 -2.70 -0.04 -2.71 0.79 148 -2.32 -0.45 -2.18 0.32 150 -2.49 -0.02 -2.51 0.63 152 -2.63 0.28 -2.60 1.19 154 -2.67 -0,29 -2.54 0.99 156 -2.73 0.34 -2.69 1.31 158 -2.84 0.46 -2.77 1.02 160 -2.72 0.42 -2.64 1.32 162 -2.71 0.43 -2.68 1.43 164 -2.94 0.62 166 -3.06 0.76 172 -2.86 0.06 -2.57 1.12 174 -3.48 -0.30 -3.04 0.77 176 -3.09 -0.42 -3.08 1.28 178 -3.36 0.04 180 -3.47 0.39 -3.24 1.58 182 -3.24 2.41 183 -3.10 0.85 184 -3.38 0.64
N. dutertrei contd. 186 -3.38 0.72 188 -3.29 0.24 -3.01 1.47 190 -3.27 0.26 -3.17 1.65 192 -2.86 0,76 -2.79 1.88
G. menardii 112 -1.98 0.81 -1.63 1.40 114 -2.61 0.84 -2.23 1.89 116 -2.72 0.75 -2.05 1.90 118 -2.09 0.43 -1.95 1.25 120 -2.18 0.14 -1.88 1.01 122 -2.11 0.69 -1.89 1.24 124 -2.53 0.75 -2.09 1.72 126 -2.71 1.14 -2.23 1.78 128 -2.14 1.89 130 -2.63 1.07 -2.18 2.06 132 -2.41 1.28 134 -2.81 0.75 -2.27 1.46 136 -2.60 1.65 138 -2.50 1.25 142 -2.31 1.25 144 -2.37 0.39 -2.14 0.78 146 -2.26 0.73 150 -2.21 0.93 164 -2.98 0.74 166 -2.95 0.76 184 -3.32 0.69 186 -3.15 0.99 188 -3.02 0.89 190 -3.27 0.67 192 -2.84 0.84
G. glutinata 114 -2.45 -1.36 116 -2.65 -1.30 120 -2.38 -1.62 122 -2.46 -1,74 124 -2.59 -1.12 126 -2.65 -0.50 128 -2.78 -O.87 130 -2.61 -0.82 132 -3.02 -1.57 134 -2.88 -1.01 138 -2.85 --0.89 140 -3.01 -1.53 142 -2.99 -0.86 144 -2.76 -0.71 146 -2.75 -0.65 150 -2.68 -1.20 154 -2.72 -1.12 156 -3.03 - t . 14 158 -2.95 -1.18 160 -3.01 -0.99 162 -2.95 --0.76 164 -3.25 -1.29 166 -3.21 -1.20 172 -3.03 -0.85 176 -3.30 -1.30 180 -3.49 --1.40 184 -3.49 -0.97 188 -3.29 -0.65 190 -3.41 -0.98


