Embed Size (px)
Citation preview
at SciVerse ScienceDirect
Journal of Archaeological Science 39 (2012) 698e703
Contents lists available
Journal of Archaeological Science
journal homepage: http: / /www.elsevier .com/locate/ jas
Object-based landform delineation and classification from DEMs forarchaeological predictive mapping
Philip Verhagen a,*, Lucian Dr�agut b,c
aResearch Institute for the Heritage and History of the Cultural Landscape and Urban Environment (CLUE), Faculty of Arts, VU University, Amsterdam, The NetherlandsbDepartment of Geography and Geology, University of Salzburg, Hellbrunnerstr. 34, 5020 Salzburg, AustriacDepartment of Geography, West University of Timisoara, Romania
a r t i c l e i n f o
Article history:Received 2 March 2011Received in revised form26 October 2011Accepted 1 November 2011
Keywords:GeomorphometryArchaeological predictive modellingObject-based image analysisGeomorphological mapping
* Corresponding author. Tel.: þ31 20 5982848.E-mail addresses: [email protected] (P. Ve
uvt.ro (L. Dr�agut).
0305-4403/$ e see front matter � 2011 Elsevier Ltd.doi:10.1016/j.jas.2011.11.001
a b s t r a c t
In this paper we report the results of an experiment with automated landform delineation and classi-fication from digital elevation models (DEMs) using object-based image analysis (OBIA). Archaeologistsrely on accurate and detailed geomorphological maps to predict and interpret the location of archaeo-logical sites. However, they have been using high-resolution DEMs primarily for visual interpretation andexpert-judgement classification of landform. OBIA can perform these classifications much faster and ina more objective fashion. The method was tested on a study area in the south east of the Netherlands. It isconcluded that OBIA is a suitable technique for quick and objective delineation of landform, but needs animproved conceptual framework adapted to the local situation and archaeological questions to betteridentify and interpret the derived landform objects.
� 2011 Elsevier Ltd. All rights reserved.
1. Introduction
Archaeologists in the Netherlands routinely rely on geomor-phological maps to predict the location of archaeological sites andto understand their position in the landscape. The availability ofnation-wide LiDAR-based digital elevationmodels (DEMs) since theearly 2000s has highly increased the level of detail of the availableinformation on landforms. High-resolution DEMs have howeveronly been ‘translated’ into geomorphological maps for some partsof the country (Koomen andMaas, 2004), and are still only availableat a 1:50,000 scale in order to guarantee compatibility with theolder mapping (ten Cate and Maarleveld, 1977). Archaeologistshowever are also interested in the small detail that is visible inhigh-resolution DEMs since the location of archaeological sitesoften seems to be tied to relatively minor elevation differences andsmall landscape units. Therefore, they tend to create more detailedlandform maps of their own making on the basis of these DEMs.These are then used for making the predictive maps that havebecome an important tool for archaeological heritage managementin the Netherlands (see Kamermans et al., 2009). The mappingprocedures used are however basically the same as theywere in the1960s: a visual interpretation of the LiDAR-based elevation maps
rhagen), lucian_dragut@cbg.
All rights reserved.
and aerial photographs is combined with field visits to draw themaps. This process is subjective and highly time-consuming. In thispaper we will report the results of an experiment that was carriedout to see if automated landform delineation and classificationmethods can produce results that 1) can be used for archaeologicalpredictive mapping purposes, 2) are based on more objectivecriteria and 3) speed up geomorphological mapping.
2. Background: geomorphometry and archaeology
Geomorphometry is a relatively young science (Hengl andReuter, 2009) that uses quantitative methods and techniques tocharacterize the earth’s surface from digital elevation models. It isespecially concerned with the quantification of land-surfaceparameters and the extraction of objects from DEMs. Landformsand landform elements are particular cases of objects extractedfrom DEMs, beside drainage networks and watershed boundaries,for instance. As MacMillan and Sharry (2009, pp. 228) pointed out“a geometrical definition of landforms would focus on objectiveconsideration of surface shape or form only”. Therefore, landformsextracted from DEMs are usually not direct equivalents ofgeomorphological maps, the latter incorporating more knowledgeand interpretation of various information besides surface shape.Nevertheless, geomorphometrical maps depicting land-surfaceobjects relatively homogeneous in terms of a given surface prop-erty (e.g. slope, curvature, etc.), or combinations of properties,
P. Verhagen, L. Dr�agut / Journal of Archaeological Science 39 (2012) 698e703 699
might be a valuable support for digital geomorphologic mapping(see Evans, in press for details on this topic). Landforms are referredto from a geomorphometric perspective throughout this paper.Geomorphometric methods are attractive to many disciplines,including soil science, hydrology, and ecology (see Hengl andReuter, 2009 and www.geomorphometry.org).
Archaeologists have used DEMs for a long time to analyse thelandscape and the position of archaeological sites in it (see forexample Kvamme, 1990; Gaffney and Stan�ci�c, 1991). They areprobably among the most avid users of the high-resolution LiDAR-based elevationmodels that are increasingly available inmany partsof the world. The level of detail available in DEMs nowadays allowsarchaeologists to use elevation models as support for prospection:individual archaeological sites and featuresmaybedetecteddirectlyfrom the DEM representations, as if they were aerial photographs.Archaeologists will usually try to identify and delineate objects ofinterest (archaeological features and/or landformunits) bymeans ofvisual inspection and manual digitizing. Hillshading and colourmanipulation will be the major analytical tools used for this. Geo-morphometric analysis techniques however have not attractedmuch interest. The rate of success of geomorphometric approachesin automatically identifying archaeological features seems to belimited to specific cases such as round barrows (de Boer et al., 2008).Some successes with regard to the automatic recognition anddelimitation of specific landforms containing archaeological sitesare reported from British Columbia by Eldridge et al. (2002) andEldridge and Anaya-Hernandez (2005). Filtering techniques tobetter recognize the micro-relief typical of archaeological featureshave been applied with reasonable success, especially in forestedareas (e.g. Devereux et al., 2005; Humme et al., 2006; Doneus et al.,2008; Hesse, 2010). The multi-scalar landform classificationroutines available in LandSerf (www.landserf.org) have attractedsome interest as well as additional parameters to analyse andpredict archaeological site location (Löwenborg, 2009; Kay andWitcher, 2009). These advanced geomorphometric methods oflandform characterization however do not seem to represent theearth’s surface in a way that allows for easy archaeological inter-pretation, and this may explain to a large degree the lack of successof archaeological geomorphometry up to now.
3. Creating landform maps with object-based image analysis(OBIA)
In geomorphology, the characterization of landforms and land-form elements through automated, GIS-based procedures has beena topic of interest for over two decades; now it is probably one ofthe most active research areas in this field (Evans et al., 2009). Mostpublished case studies consider mountainous areas and seem to bereasonably successful in delineating broad landform categories likeplateaus, different types of hills, slopes and valleys (Macmillan andShary, 2009). However, cell-based classification approaches thathave been prevalent for this show some clear shortcomings, due tothe absence of comprehensive conceptual data models for land-surface (Brändli, 1996). As footprints of cells have nothing to dowith the size and shape of real-world entities such as landforms(Dr�agut and Eisank, 2011), the approach of classifying cells directlyfrom DEMs is limited in several aspects such as: the ‘salt-and-pepper effect’, tying the scale of analysis by the raster resolution,and difficulties in including topological relationships in classifica-tion (Dr�agut and Eisank, 2011). In an apparently paradoxicalevolution, some of these shortcomings are made worse whenapplied to high-resolution DEMs.
A relatively new technique however, object-based image analysis(OBIA), offers the potential to quickly create highly detailed land-form maps for large areas without the drawbacks of cell-based
classification approaches. Object-based image analysis was origi-nally developed formedical imagery and remote sensing purposes. Itis a method that can be applied on DEMs aswell for recognition and/or classification of landforms (Dr�agut and Blaschke, 2006). It createsimage objects through the aggregation of pixels into discrete regionsthat are homogeneous with regard to their spatial and spectralcharacteristics by means of multi-resolution image segmentation(MRS) (Baatz and Schäpe, 2000; Ryherd and Woodcock, 1996).Image objects are then classified according to the research purpose.From the various methods described in literature for landformclassification (for a comprehensive review see Macmillan and Shary,2009), MRS shows the highest sensitivity to local terrain variations,and produces landform units that are more homogeneous, andtherefore easier to interpret and analyse (van Niekerk, 2010).
It is important to understand that OBIA can produce (landform)classifications at any scale level desired. It was argued by Fisheret al. (2004) that landforms will manifest themselves at variousscale levels, so we need to describe and analyse landforms atvarious scales as well. The real challenge in OBIA is therefore tofind the appropriate scale levels for which the image segmentationshould be performed. To cope with this issue in this particular casestudy, the multi-scale pattern of elevation was explored with theaid of the Estimation of Scale Parameters (ESP) tool, designed asa customized algorithm for the Definiens Developer� suite byDr�agut et al. (2010). It calculates the local variance (LV) (Woodcockand Strahler, 1987) of object heterogeneity within a scene. The ESPtool iteratively generates image objects at multiple scale levels(with different values of scale parameter used for segmentation) ina bottom-up approach and calculates the local variance (LV) foreach scale. The LV graph method (Woodcock and Strahler, 1987)enables investigating the variation of heterogeneity within a sceneand finding the appropriate scale for analysis, where cells orobjects match features in the real world. Variation in heteroge-neity is explored by evaluating LV values (e.g. mean standarddeviation of elevation of all segmented objects) plotted against thecorresponding scale level (e.g. the unitless value of the scaleparameter used to generate image objects at various scales). Thethresholds in rates of change of LV indicate the scale levels atwhich the image can be segmented in the most appropriatemanner, relative to the data properties at the scene level (seeDr�agut et al., 2010 for details).
4. Study area
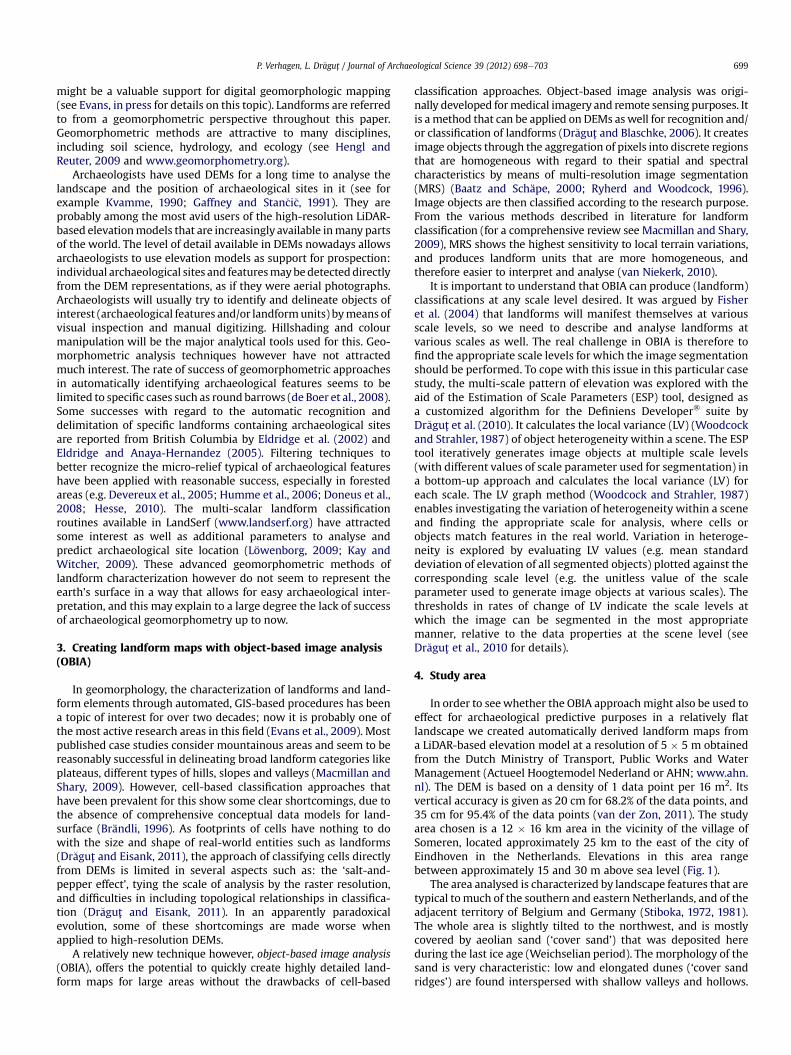
In order to seewhether the OBIA approachmight also be used toeffect for archaeological predictive purposes in a relatively flatlandscape we created automatically derived landform maps froma LiDAR-based elevation model at a resolution of 5 � 5 m obtainedfrom the Dutch Ministry of Transport, Public Works and WaterManagement (Actueel Hoogtemodel Nederland or AHN; www.ahn.nl). The DEM is based on a density of 1 data point per 16 m2. Itsvertical accuracy is given as 20 cm for 68.2% of the data points, and35 cm for 95.4% of the data points (van der Zon, 2011). The studyarea chosen is a 12 � 16 km area in the vicinity of the village ofSomeren, located approximately 25 km to the east of the city ofEindhoven in the Netherlands. Elevations in this area rangebetween approximately 15 and 30 m above sea level (Fig. 1).
The area analysed is characterized by landscape features that aretypical tomuch of the southern and eastern Netherlands, and of theadjacent territory of Belgium and Germany (Stiboka, 1972, 1981).The whole area is slightly tilted to the northwest, and is mostlycovered by aeolian sand (‘cover sand’) that was deposited hereduring the last ice age (Weichselian period). The morphology of thesand is very characteristic: low and elongated dunes (‘cover sandridges’) are found interspersed with shallow valleys and hollows.
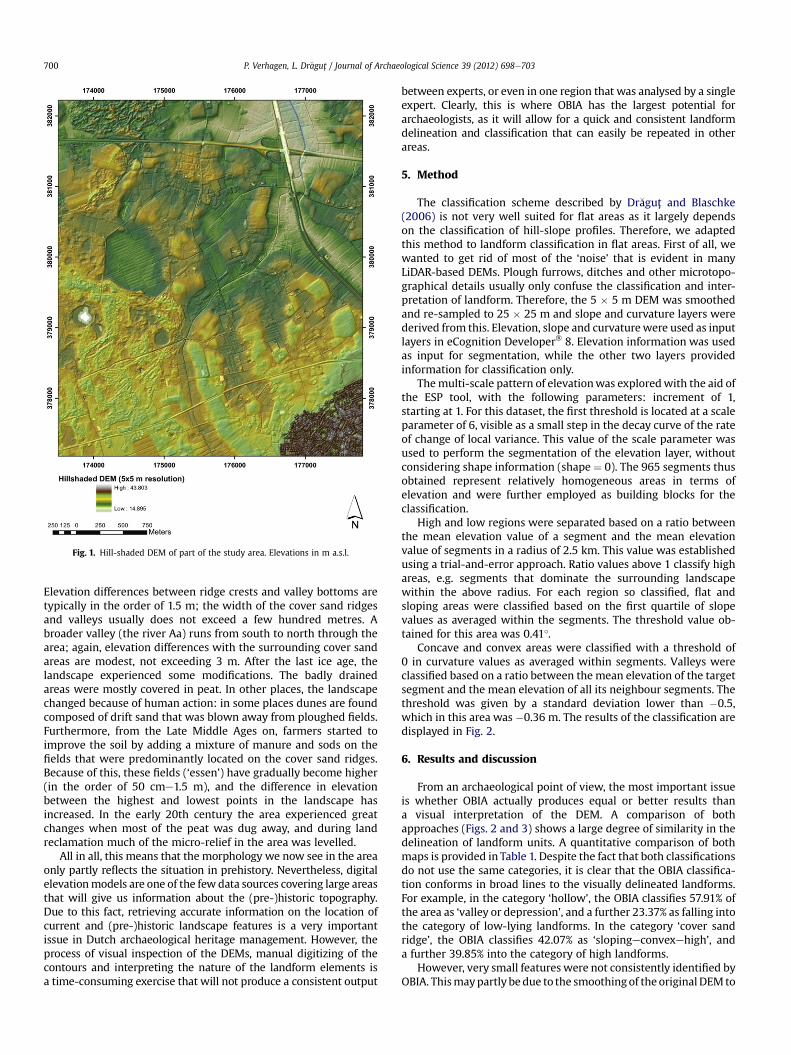
Fig. 1. Hill-shaded DEM of part of the study area. Elevations in m a.s.l.
P. Verhagen, L. Dr�agut / Journal of Archaeological Science 39 (2012) 698e703700
Elevation differences between ridge crests and valley bottoms aretypically in the order of 1.5 m; the width of the cover sand ridgesand valleys usually does not exceed a few hundred metres. Abroader valley (the river Aa) runs from south to north through thearea; again, elevation differences with the surrounding cover sandareas are modest, not exceeding 3 m. After the last ice age, thelandscape experienced some modifications. The badly drainedareas were mostly covered in peat. In other places, the landscapechanged because of human action: in some places dunes are foundcomposed of drift sand that was blown away from ploughed fields.Furthermore, from the Late Middle Ages on, farmers started toimprove the soil by adding a mixture of manure and sods on thefields that were predominantly located on the cover sand ridges.Because of this, these fields (‘essen’) have gradually become higher(in the order of 50 cme1.5 m), and the difference in elevationbetween the highest and lowest points in the landscape hasincreased. In the early 20th century the area experienced greatchanges when most of the peat was dug away, and during landreclamation much of the micro-relief in the area was levelled.
All in all, this means that the morphology we now see in the areaonly partly reflects the situation in prehistory. Nevertheless, digitalelevationmodels are one of the few data sources covering large areasthat will give us information about the (pre-)historic topography.Due to this fact, retrieving accurate information on the location ofcurrent and (pre-)historic landscape features is a very importantissue in Dutch archaeological heritage management. However, theprocess of visual inspection of the DEMs, manual digitizing of thecontours and interpreting the nature of the landform elements isa time-consuming exercise that will not produce a consistent output
between experts, or even in one region that was analysed by a singleexpert. Clearly, this is where OBIA has the largest potential forarchaeologists, as it will allow for a quick and consistent landformdelineation and classification that can easily be repeated in otherareas.
5. Method
The classification scheme described by Dr�agut and Blaschke(2006) is not very well suited for flat areas as it largely dependson the classification of hill-slope profiles. Therefore, we adaptedthis method to landform classification in flat areas. First of all, wewanted to get rid of most of the ‘noise’ that is evident in manyLiDAR-based DEMs. Plough furrows, ditches and other microtopo-graphical details usually only confuse the classification and inter-pretation of landform. Therefore, the 5 � 5 m DEM was smoothedand re-sampled to 25 � 25 m and slope and curvature layers werederived from this. Elevation, slope and curvaturewere used as inputlayers in eCognition Developer� 8. Elevation information was usedas input for segmentation, while the other two layers providedinformation for classification only.
Themulti-scale pattern of elevationwas exploredwith the aid ofthe ESP tool, with the following parameters: increment of 1,starting at 1. For this dataset, the first threshold is located at a scaleparameter of 6, visible as a small step in the decay curve of the rateof change of local variance. This value of the scale parameter wasused to perform the segmentation of the elevation layer, withoutconsidering shape information (shape ¼ 0). The 965 segments thusobtained represent relatively homogeneous areas in terms ofelevation and were further employed as building blocks for theclassification.
High and low regions were separated based on a ratio betweenthe mean elevation value of a segment and the mean elevationvalue of segments in a radius of 2.5 km. This value was establishedusing a trial-and-error approach. Ratio values above 1 classify highareas, e.g. segments that dominate the surrounding landscapewithin the above radius. For each region so classified, flat andsloping areas were classified based on the first quartile of slopevalues as averaged within the segments. The threshold value ob-tained for this area was 0.41�.
Concave and convex areas were classified with a threshold of0 in curvature values as averaged within segments. Valleys wereclassified based on a ratio between the mean elevation of the targetsegment and the mean elevation of all its neighbour segments. Thethreshold was given by a standard deviation lower than �0.5,which in this area was �0.36 m. The results of the classification aredisplayed in Fig. 2.
6. Results and discussion
From an archaeological point of view, the most important issueis whether OBIA actually produces equal or better results thana visual interpretation of the DEM. A comparison of bothapproaches (Figs. 2 and 3) shows a large degree of similarity in thedelineation of landform units. A quantitative comparison of bothmaps is provided in Table 1. Despite the fact that both classificationsdo not use the same categories, it is clear that the OBIA classifica-tion conforms in broad lines to the visually delineated landforms.For example, in the category ‘hollow’, the OBIA classifies 57.91% ofthe area as ‘valley or depression’, and a further 23.37% as falling intothe category of low-lying landforms. In the category ‘cover sandridge’, the OBIA classifies 42.07% as ‘slopingeconvexehigh’, anda further 39.85% into the category of high landforms.
However, very small features were not consistently identified byOBIA. Thismaypartly bedue to the smoothingof the original DEM to
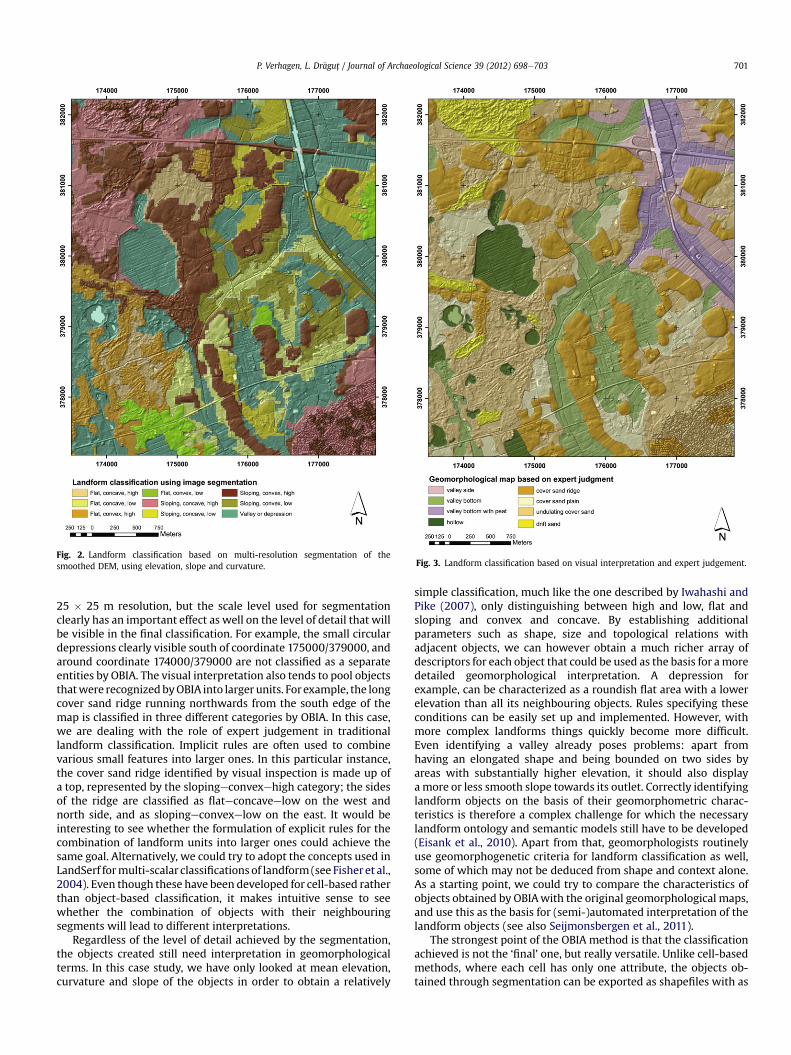
Fig. 3. Landform classification based on visual interpretation and expert judgement.Fig. 2. Landform classification based on multi-resolution segmentation of thesmoothed DEM, using elevation, slope and curvature.
P. Verhagen, L. Dr�agut / Journal of Archaeological Science 39 (2012) 698e703 701
25 � 25 m resolution, but the scale level used for segmentationclearly has an important effect as well on the level of detail that willbe visible in the final classification. For example, the small circulardepressions clearly visible south of coordinate 175000/379000, andaround coordinate 174000/379000 are not classified as a separateentities by OBIA. The visual interpretation also tends to pool objectsthatwere recognizedbyOBIA into larger units. Forexample, the longcover sand ridge running northwards from the south edge of themap is classified in three different categories by OBIA. In this case,we are dealing with the role of expert judgement in traditionallandform classification. Implicit rules are often used to combinevarious small features into larger ones. In this particular instance,the cover sand ridge identified by visual inspection is made up ofa top, represented by the slopingeconvexehigh category; the sidesof the ridge are classified as flateconcaveelow on the west andnorth side, and as slopingeconvexelow on the east. It would beinteresting to see whether the formulation of explicit rules for thecombination of landform units into larger ones could achieve thesame goal. Alternatively, we could try to adopt the concepts used inLandSerf formulti-scalar classifications of landform (see Fisher et al.,2004). Even though these have been developed for cell-based ratherthan object-based classification, it makes intuitive sense to seewhether the combination of objects with their neighbouringsegments will lead to different interpretations.
Regardless of the level of detail achieved by the segmentation,the objects created still need interpretation in geomorphologicalterms. In this case study, we have only looked at mean elevation,curvature and slope of the objects in order to obtain a relatively
simple classification, much like the one described by Iwahashi andPike (2007), only distinguishing between high and low, flat andsloping and convex and concave. By establishing additionalparameters such as shape, size and topological relations withadjacent objects, we can however obtain a much richer array ofdescriptors for each object that could be used as the basis for amoredetailed geomorphological interpretation. A depression forexample, can be characterized as a roundish flat area with a lowerelevation than all its neighbouring objects. Rules specifying theseconditions can be easily set up and implemented. However, withmore complex landforms things quickly become more difficult.Even identifying a valley already poses problems: apart fromhaving an elongated shape and being bounded on two sides byareas with substantially higher elevation, it should also displayamore or less smooth slope towards its outlet. Correctly identifyinglandform objects on the basis of their geomorphometric charac-teristics is therefore a complex challenge for which the necessarylandform ontology and semantic models still have to be developed(Eisank et al., 2010). Apart from that, geomorphologists routinelyuse geomorphogenetic criteria for landform classification as well,some of which may not be deduced from shape and context alone.As a starting point, we could try to compare the characteristics ofobjects obtained by OBIAwith the original geomorphological maps,and use this as the basis for (semi-)automated interpretation of thelandform objects (see also Seijmonsbergen et al., 2011).
The strongest point of the OBIA method is that the classificationachieved is not the ‘final’ one, but really versatile. Unlike cell-basedmethods, where each cell has only one attribute, the objects ob-tained through segmentation can be exported as shapefiles with as
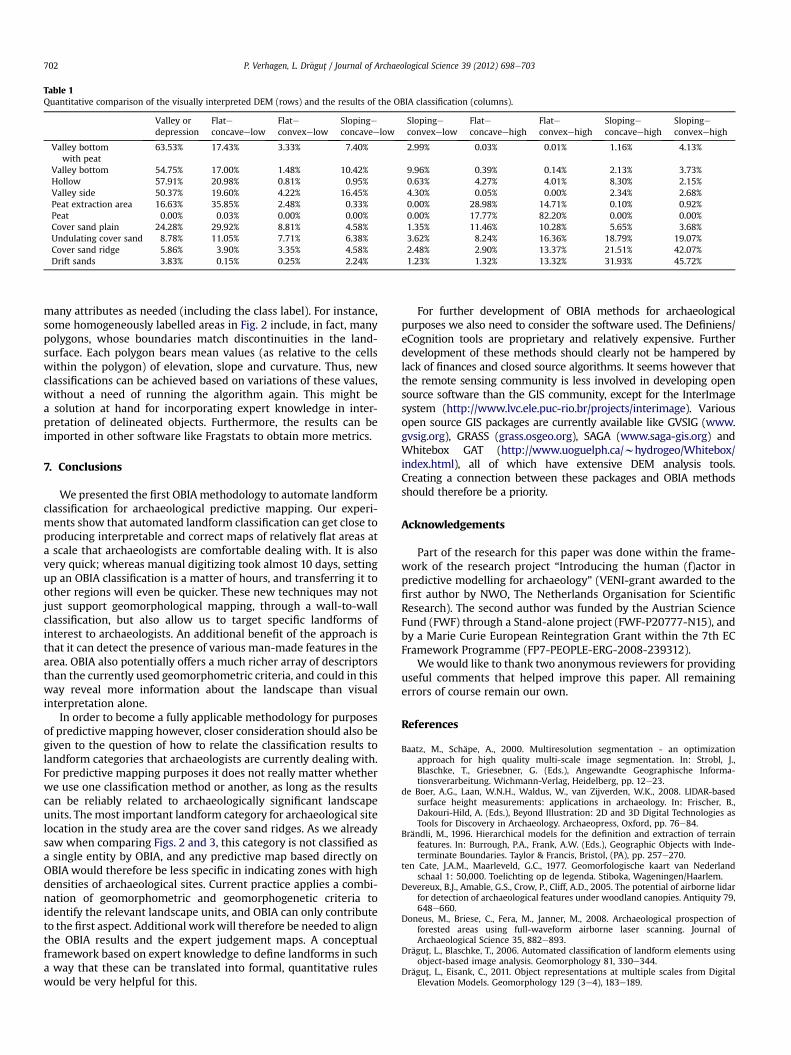
Table 1Quantitative comparison of the visually interpreted DEM (rows) and the results of the OBIA classification (columns).
Valley ordepression
Flateconcaveelow
Flateconvexelow
Slopingeconcaveelow
Slopingeconvexelow
Flateconcaveehigh
Flateconvexehigh
Slopingeconcaveehigh
Slopingeconvexehigh
Valley bottomwith peat
63.53% 17.43% 3.33% 7.40% 2.99% 0.03% 0.01% 1.16% 4.13%
Valley bottom 54.75% 17.00% 1.48% 10.42% 9.96% 0.39% 0.14% 2.13% 3.73%Hollow 57.91% 20.98% 0.81% 0.95% 0.63% 4.27% 4.01% 8.30% 2.15%Valley side 50.37% 19.60% 4.22% 16.45% 4.30% 0.05% 0.00% 2.34% 2.68%Peat extraction area 16.63% 35.85% 2.48% 0.33% 0.00% 28.98% 14.71% 0.10% 0.92%Peat 0.00% 0.03% 0.00% 0.00% 0.00% 17.77% 82.20% 0.00% 0.00%Cover sand plain 24.28% 29.92% 8.81% 4.58% 1.35% 11.46% 10.28% 5.65% 3.68%Undulating cover sand 8.78% 11.05% 7.71% 6.38% 3.62% 8.24% 16.36% 18.79% 19.07%Cover sand ridge 5.86% 3.90% 3.35% 4.58% 2.48% 2.90% 13.37% 21.51% 42.07%Drift sands 3.83% 0.15% 0.25% 2.24% 1.23% 1.32% 13.32% 31.93% 45.72%
P. Verhagen, L. Dr�agut / Journal of Archaeological Science 39 (2012) 698e703702
many attributes as needed (including the class label). For instance,some homogeneously labelled areas in Fig. 2 include, in fact, manypolygons, whose boundaries match discontinuities in the land-surface. Each polygon bears mean values (as relative to the cellswithin the polygon) of elevation, slope and curvature. Thus, newclassifications can be achieved based on variations of these values,without a need of running the algorithm again. This might bea solution at hand for incorporating expert knowledge in inter-pretation of delineated objects. Furthermore, the results can beimported in other software like Fragstats to obtain more metrics.
7. Conclusions
We presented the first OBIAmethodology to automate landformclassification for archaeological predictive mapping. Our experi-ments show that automated landform classification can get close toproducing interpretable and correct maps of relatively flat areas ata scale that archaeologists are comfortable dealing with. It is alsovery quick; whereas manual digitizing took almost 10 days, settingup an OBIA classification is a matter of hours, and transferring it toother regions will even be quicker. These new techniques may notjust support geomorphological mapping, through a wall-to-wallclassification, but also allow us to target specific landforms ofinterest to archaeologists. An additional benefit of the approach isthat it can detect the presence of various man-made features in thearea. OBIA also potentially offers a much richer array of descriptorsthan the currently used geomorphometric criteria, and could in thisway reveal more information about the landscape than visualinterpretation alone.
In order to become a fully applicable methodology for purposesof predictive mapping however, closer consideration should also begiven to the question of how to relate the classification results tolandform categories that archaeologists are currently dealing with.For predictive mapping purposes it does not really matter whetherwe use one classification method or another, as long as the resultscan be reliably related to archaeologically significant landscapeunits. Themost important landform category for archaeological sitelocation in the study area are the cover sand ridges. As we alreadysaw when comparing Figs. 2 and 3, this category is not classified asa single entity by OBIA, and any predictive map based directly onOBIA would therefore be less specific in indicating zones with highdensities of archaeological sites. Current practice applies a combi-nation of geomorphometric and geomorphogenetic criteria toidentify the relevant landscape units, and OBIA can only contributeto the first aspect. Additional workwill therefore be needed to alignthe OBIA results and the expert judgement maps. A conceptualframework based on expert knowledge to define landforms in sucha way that these can be translated into formal, quantitative ruleswould be very helpful for this.
For further development of OBIA methods for archaeologicalpurposes we also need to consider the software used. The Definiens/eCognition tools are proprietary and relatively expensive. Furtherdevelopment of these methods should clearly not be hampered bylack of finances and closed source algorithms. It seems however thatthe remote sensing community is less involved in developing opensource software than the GIS community, except for the InterImagesystem (http://www.lvc.ele.puc-rio.br/projects/interimage). Variousopen source GIS packages are currently available like GVSIG (www.gvsig.org), GRASS (grass.osgeo.org), SAGA (www.saga-gis.org) andWhitebox GAT (http://www.uoguelph.ca/whydrogeo/Whitebox/index.html), all of which have extensive DEM analysis tools.Creating a connection between these packages and OBIA methodsshould therefore be a priority.
Acknowledgements
Part of the research for this paper was done within the frame-work of the research project “Introducing the human (f)actor inpredictive modelling for archaeology” (VENI-grant awarded to thefirst author by NWO, The Netherlands Organisation for ScientificResearch). The second author was funded by the Austrian ScienceFund (FWF) through a Stand-alone project (FWF-P20777-N15), andby a Marie Curie European Reintegration Grant within the 7th ECFramework Programme (FP7-PEOPLE-ERG-2008-239312).
Wewould like to thank two anonymous reviewers for providinguseful comments that helped improve this paper. All remainingerrors of course remain our own.
References
Baatz, M., Schäpe, A., 2000. Multiresolution segmentation - an optimizationapproach for high quality multi-scale image segmentation. In: Strobl, J.,Blaschke, T., Griesebner, G. (Eds.), Angewandte Geographische Informa-tionsverarbeitung. Wichmann-Verlag, Heidelberg, pp. 12e23.
de Boer, A.G., Laan, W.N.H., Waldus, W., van Zijverden, W.K., 2008. LIDAR-basedsurface height measurements: applications in archaeology. In: Frischer, B.,Dakouri-Hild, A. (Eds.), Beyond Illustration: 2D and 3D Digital Technologies asTools for Discovery in Archaeology. Archaeopress, Oxford, pp. 76e84.
Brändli, M., 1996. Hierarchical models for the definition and extraction of terrainfeatures. In: Burrough, P.A., Frank, A.W. (Eds.), Geographic Objects with Inde-terminate Boundaries. Taylor & Francis, Bristol, (PA), pp. 257e270.
ten Cate, J.A.M., Maarleveld, G.C., 1977. Geomorfologische kaart van Nederlandschaal 1: 50,000. Toelichting op de legenda. Stiboka, Wageningen/Haarlem.
Devereux, B.J., Amable, G.S., Crow, P., Cliff, A.D., 2005. The potential of airborne lidarfor detection of archaeological features under woodland canopies. Antiquity 79,648e660.
Doneus, M., Briese, C., Fera, M., Janner, M., 2008. Archaeological prospection offorested areas using full-waveform airborne laser scanning. Journal ofArchaeological Science 35, 882e893.
Dr�agut, L., Blaschke, T., 2006. Automated classification of landform elements usingobject-based image analysis. Geomorphology 81, 330e344.
Dr�agut, L., Eisank, C., 2011. Object representations at multiple scales from DigitalElevation Models. Geomorphology 129 (3e4), 183e189.

P. Verhagen, L. Dr�agut / Journal of Archaeological Science 39 (2012) 698e703 703
Dr�agut, L., Tiede, D., Levick, S., 2010. ESP: a tool to estimate scale parameters formultiresolution image segmentation of remotely sensed data. InternationalJournal of Geographical Information Science 24 (6), 859e871.
Eisank, C., Dr�agut, L., Götz, J., Blaschke, T., 2010. Developing a semantic model ofglacial landforms for object-based terrain classification - the example of glacialcirques. In: Addink, E.A., Van Coillie, F.M.B. (Eds.), GEOBIA 2010-GeographicObject-Based Image Analysis. ISPRS, vol. XXXVIII-4/C7 Archives ISSN No. 1682-1777, Ghent University, Ghent, Belgium, 29 Junee2 July.
Eldridge, M., Anaya-Hernandez, A., 2005. Archaeological Overview of NortheasternBritish Columbia: Year Four and Five Report and Project Summary. MillenniaResearch Limited, Victoria.
Eldridge, M., Owens, D., Vincent, R., Seip, L., Dady, P., Benson, K., 2002. Archaeo-logical Overview of Northeastern British Columbia: Year Two Report. MillenniaResearch Limited, Victoria.
Evans, I.S., Hengl, T., Gorsevski, P., 2009. Chapter 22 Applications in geomorphology.In: Hengl, T., Reuter, H.I. (Eds.), Geomorphometry. Concepts, Software, Applica-tions. Developments in Soil Science, vol. 33. Elsevier, Amsterdam, pp. 497e525.
Evans, I.S., in press. Geomorphometry and landform mapping: what is a landform?Geomorphometry. doi:10.1016/j.geomorph.2010.09.029.
Fisher, P., Wood, J., Cheng, T., 2004. Where is Helvellyn? Fuzziness of multi-scalelandscape morphometry. Transactions of the Institute of British Geographers29, 106e128.
Gaffney, V., Stan�ci�c, Z., 1991. GIS Approaches to Regional Analysis: A Case Study ofthe Island of Hvar. Znanstveni in�stitut Filozofske fakultete, Ljubljana.
Hengl, T., Reuter, H.I. (Eds.), 2009. Geomorphometry. Concepts, Software, Applica-tions. Developments in Soil Science, vol. 33. Elsevier, Amsterdam.
Hesse, R., 2010. LiDAR-derived Local Relief Models e a new tool for archaeologicalprospection. Archaeological Prospection 17 (2), 67e72.
Humme, A., Lindenbergh, R., Sueur, C., 2006. Revealing celtic fields from LiDAR datausing kriging based filtering. In: Proceedings of the ISPRS Commission VSymposium ‘Image Engineering and Vision Metrology’, vol. XXXVI, part 5,Dresden, 25e27 September 2006.
Iwahashi, J., Pike, R.J., 2007. Automated classifications of topography from DEMs byan unsupervised nested-means algorithm and a three-part geometric signature.Geomorphology 86, 409e440.
Kamermans, H., Leusen van, M., Verhagen, P. (Eds.), 2009. Archaeological Predictionand Risk Management. Leiden University Press, Leiden (ASLU 17).
Kay, S.J., Witcher, R.E., 2009. Predictive modelling of Roman settlement in themiddle Tiber valley. Archeologia e Calcolatori 20, 277e290.
Koomen, A.J.M., Maas, G.J., 2004. Geomorfologische Kaart Nederland (GKN). Ach-tergronddocument bij het landsdekkende digitale bestand. Alterra, Wagenin-gen (Alterra-rapport 1039).
Kvamme, K.L., 1990. GIS algorithms and their effects on regional archaeologicalanalysis. In: Allen, K.M.S., Green, S.W., Zubrow, E.B.W. (Eds.), Interpreting Space:GIS and Archaeology. Taylor & Francis, London, pp. 112e125.
Löwenborg, D., 2009. Landscapes of death: GIS modelling of a dated sequence ofprehistoric cemeteries in Västmanland, Sweden. Antiquity 83, 1134e1143.
Macmillan, R.A., Shary, P.A., 2009. Landforms and landform elements in geo-morphometry. In: Hengl, T., Reuter, H.I. (Eds.), Geomorphometry. Concepts,Software, Applications. Developments in Soil Science, vol. 33. Elsevier,Amsterdam, pp. 227e254.
van Niekerk, A., 2010. A comparison of land unit delineation techniques for landevaluation in the Western Cape, South Africa. Land Use Policy 27 (3), 937e945.
Ryherd, S., Woodcock, C., 1996. Combining spectral and texture data in thesegmentation of remotely sensed images. Photogrammetric Engineering andRemote Sensing 62, 181e194.
Seijmonsbergen, A.C., Hengl, T., Anders, N.S., 2011. Semi-automatedidentificationand extraction of geomorphological features using digital elevation data. In:Smith, M.J., Paron, P., Griffiths, J. (Eds.), Geomorphological Mapping. Methodsand Applications, vol. 15. Elsevier, Amsterdam (Developments in Earth SurfaceProcesses).
Stiboka, 1972. Bodemkaart van Nederland schaal 1: 50,000. Toelichting bij dekaartbladen 57 Oost Valkenswaard en 58 West Roermond. Stichting voorBodemkartering, Wageningen.
Stiboka, 1981. Bodemkaart Van Nederland Schaal 1: 50,000. Toelichting bij kaart-blad 51 Oost Eindhoven. Stichting voor Bodemkartering, Wageningen.
Woodcock, C.E., Strahler, A.H., 1987. The factor of scale in remote-sensing. RemoteSensing of Environment 21 (3), 311e332.
van der Zon, N., 2011. Kwaliteitsdocument AHN-2 Release 1.1. http://www.ahn.nl/$40t/page.


