Embed Size (px)
Citation preview
Stat170: Lecture 1 © Copyright Macquarie University 2015 1
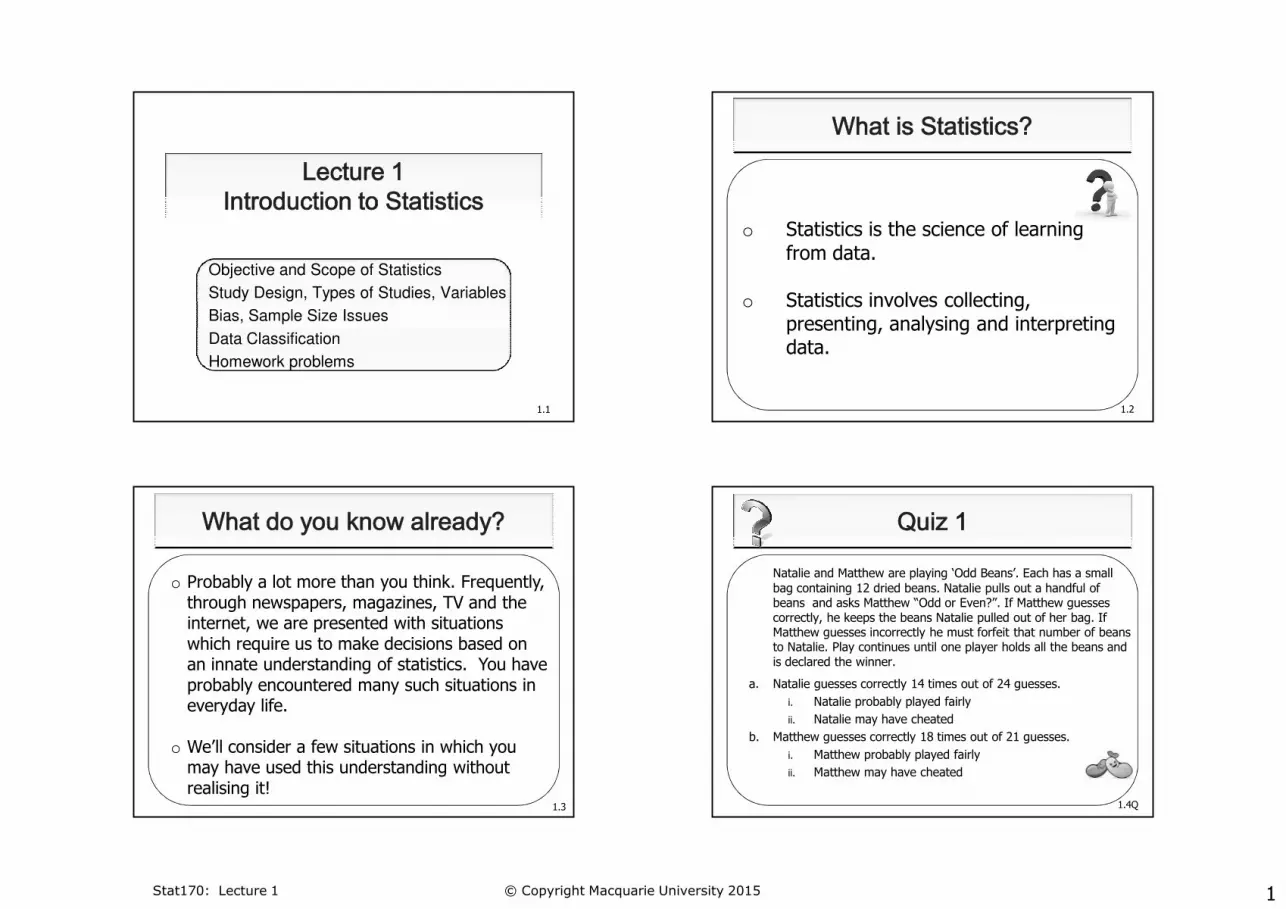
Objective and Scope of Statistics
Study Design, Types of Studies, Variables
Bias, Sample Size Issues
Data Classification
Homework problems
1.1
o Statistics is the science of learning
from data.
o Statistics involves collecting, presenting, analysing and interpreting data.
1.2
o Probably a lot more than you think. Frequently, through newspapers, magazines, TV and the internet, we are presented with situations which require us to make decisions based on an innate understanding of statistics. You have probably encountered many such situations in everyday life.
o We’ll consider a few situations in which you may have used this understanding without realising it!
1.3
Natalie and Matthew are playing ‘Odd Beans’. Each has a small
bag containing 12 dried beans. Natalie pulls out a handful of beans and asks Matthew “Odd or Even?”. If Matthew guesses correctly, he keeps the beans Natalie pulled out of her bag. If Matthew guesses incorrectly he must forfeit that number of beans to Natalie. Play continues until one player holds all the beans and is declared the winner.
a. Natalie guesses correctly 14 times out of 24 guesses.
i. Natalie probably played fairly
ii. Natalie may have cheated
b. Matthew guesses correctly 18 times out of 21 guesses.
i. Matthew probably played fairly
ii. Matthew may have cheated
1.4Q

Stat170: Lecture 1 © Copyright Macquarie University 2015 2
According to the Australian Bureau of Statistics, Australia’s health generally compares well to many other OECD countries. Comment.
1.5Q
Country Males – Life Expectancy
Females - Life Expectancy
Tobacco Smoking
AlcoholConsumption (lpc)
Obesity
Australia 79.3 83.9 16.6% 10.3 24.6%
Finland 77.3 83.8 17.8% 9.8 23.0%
Ireland 77.4 82.5 21.7% 11.6 23.0%
Japan 79.6 86.4 26.0% 7.5 3.3%
New Zealand 78.8 82.7 18.1% 9.5 26.5%
Norway 78.7 83.2 22.0% 6.8 17.0%
Spain 78.6 84.9 23.9% 11.4 23.9%
Switzerland 79.9 84.6 20.4% 10.2 17.5%
UK 78.3 82.5 21.0% 10.8 24.0%
USA 75.7 80.6 15.4% 8.8 33.8%
Sources: ABS – 4102.0 – Australian Social Trends, June 2012, OECD Health Data 2011: Frequently Requested Data www.oecd.org
Health Care in Australia and the OECD – 2008
Comment on any differences and any similarities between health care in Australia and health care in other OECD countries. Rates for other OECD countries have been averaged.
1.6QSource: OECD Health Data 2011: Frequently Requested Data www.oecd.org
1.7
Objectives andScope of Statistical Studies
o A primary objective of the statistician is to obtain information about a target population, using a sample.
o The target population comprises all relevant
subjects of interest.
o The sample is a manageable subset, selected to make the study feasible.
1.8

Stat170: Lecture 1 © Copyright Macquarie University 2015 3
Population
?? ?We use aSAMPLE to
answerquestions about a target POPULATION
Research QuestionsResearch Questions
1.9
o Study Design
o Data Analysis
o Interpretation of Results
o Next Study?
1.11
Study DesignTypes of StudiesVariables
1.12
o Formulate the question of interest (What? Why? Who?)
o Specify the target population (Who/What? Where? When?)
o Determine the measurements to be collected (the variables).
o Define the method of data collection (How? When? Where?)
1.13

Stat170: Lecture 1 © Copyright Macquarie University 2015 4
o The target population should be well defined.
o The sample should be representative of the target population (not biased), and large enough to give accurate information about the population.
o Ideally, the observations should be independent of each other.
1.14
Only a representative sample should be used to make inferences about the target population. One way to
ensure that a sample is representative of the target population is to obtain a random sample.
A simple random sample, of a given size n, is one in which each set of that size has the same chance of being selected from the target population.
A random sample is one where each member of the population has the same chance of being selected.
1.15
It is often difficult, or even impossible, to obtain a simple random sample.
However, researchers should ensure that the sample they obtain is a representative sample. That is, its
characteristics should represent those of the target population without bias.
For example, if opinion on same sex marriage was sought from people living in Australia, our sample
should have people living in Australia from different backgrounds, different age groups, different occupations etc.
1.16
Indicate, for each of the following situations, whether the sample is random and/or representative.
a. To investigate the association between alcohol consumption and sleeping patterns in adults, a medial centre selects 50 patients from among those claiming to be moderate drinkers. Each is asked to record information on their sleeping patterns on two separate nights – one night after drinking alcohol and a second night after drinking no alcohol.
b. A vet is considering offering a boarding service for pets while their owners are on holiday. The receptionist is asked to canvass opinions from pet owners who use the clinic. The receptionist decides to select as a sample all owners of pets vaccinated at the clinic in the following week. These owners are asked whether they would consider using the boarding service.
1.17Q

Stat170: Lecture 1 © Copyright Macquarie University 2015 5
1.17A
deductive (non-
empirical)
inductive
(empirical)
qualitative
(unstructured)
quantitative
(structured)
observational experimental
1.19
Involves Involves
collecting data.collecting data.
An observational study is one in which there is no intervention by the investigator nor is there any treatment imposed.
An experimental study is one in which the investigator has some control over the
determinant.
1.20 1.21
o A German study (Stang et al., 2001) investigated the association between the use of mobile phones and a rare form of eye cancer called uveal melanoma. 118 subjects with the eye cancer were compared to 475
subjects who did not have the eye cancer. Subjects with eye cancer had significantly higher mobile phone usage.
o A researcher takes blood samples from students to measure blood alcohol levels during Monday morning lectures in Week 1 of semester.

Stat170: Lecture 1 © Copyright Macquarie University 2015 6
1.22
o The Physicians’ Health Study (1982) was a clinical trial conducted to determine whether low-dose aspirin reduced the risk of cardiovascular disease. 22,071 male physicians between the ages of 40 and 84 were
randomly assigned into one of two groups taking either aspirin or a placebo. In follow up, heart attack rates were compared in the two groups.
o A researcher randomly assigns law students into two groups. Members of one group are all given an alcoholic drink. Each student is asked to argue on a topic and the quality of their arguments are rated. Ratings are compared for the two groups.
Randomisation
CompareCompare
1.23
For the following examples, indicate the type of study:
a. To investigate whether the antidepressant, Zyban, was useful for smoking cessation, 429 smokers who wished to quit were randomly assigned to one of two
groups: Zyban or Control. After 12 months, the study observed whether each subject had successfully abstained from smoking or relapsed.
b. To investigate a link between exposure to lead and tooth decay, a study of 24901 American children
showed that the greater a child’s exposure to lead, the more missing or decayed teeth.
1.24Q
o Measurements are taken on subjects in a study according to the variables of interest. The measurements will vary from one subject to another.
o In any study, variables take on specific roles and these roles may be classified as:
outcomes (responses) or
determinants (may influence responses)
1.25
influenceinfluencedeterminants outcomes
When we collect data we are When we collect data we are
collecting “values” of variablescollecting “values” of variables

Stat170: Lecture 1 © Copyright Macquarie University 2015 7
1.26
For example, in Quiz 4:
Part a: outcomes may be: number of hours sleep the previous night/difference between number of hours sleep with and without alcohol the previous night….
Part b: outcome may be: whether client uses a pet boarding service
For each of these studies, any other measurements recorded on the subjects such as age, sex, etc may be possible determinants.
For part a. number of alcoholic drinks may be a possible determinant. For part b. how many pets/how often client goes on holiday may be possible determinants.
BiasSample size
1.27
Bias may be defined as any systematic error (ie. not occurring randomly) which results in an incorrect estimate of a parameter or an incorrect association between variables in a study. Studies can be affected
by various types of bias including:
o selection bias
o measurement bias
o response bias
o confounding
1.28
Selection bias refers to any systematic differences occurring in the way that subjects are selected for a study.
For example, suppose we wish to estimate the
proportion of 18 to 25 year olds in Australia who have private health insurance.
Selecting a sample from a student database could produce a biased result, since the proportion of
students with private health insurance may differ from the proportion of other young adults with private health insurance.
1.29

Stat170: Lecture 1 © Copyright Macquarie University 2015 8
1.30
Measurement bias refers to systematic differences in the measurement of variables. For example:
o in a comparison of influenza rates among people with and without chronic illnesses, the responses for people with chronic illnesses may be more accurate as their past illnesses may be better
documented and/or recalled.
o people collecting information from subjects may do
so more carefully in the morning than in the afternoon.
1.31
Response bias can occur when the response rate to a survey is too low.
It is well known that those who respond to a survey often have different characteristics than those who
don’t respond.
Ideally, the response rate should be at least 75% to
ensure that a study is not significantly affected by response bias.
1.32
A confounder is a variable that distorts (increases or decreases) the apparent effect of one variable (determinant) on another (outcome).
For example:
It has been suggested that watching more than four hours of TV per day is associated with an increased risk
of heart disease.
However, it is likely that those who watch a lot of TV do not exercise much and it is the lack of exercise which leads to the increased risk of heart disease.
a. The Centre for Addiction and Substance Abuse sent a mail out questionnaire to 5000 randomly selected teenagers and elicited
1297 responses. 130 reported that parents are never present at parties they attend and that marijuana is available at the parties they attend. Is it reasonable to conclude that approximately 10% of teenagers attend parties where parents are not present and where marijuana is available?
b. In 2013 a digital magazine company, CatalogSpree, conducted an online survey and claimed, as a result, that consumers use
tablets to shop for 66% of all Christmas presents. The survey was conducted using the CatalogSpree app which can be
installed on tablets. Can we conclude that two thirds of Christmas presents in 2013 were bought online?
1.34Q

Stat170: Lecture 1 © Copyright Macquarie University 2015 9
1.34A
Sample size for determining a proportion:
o Most opinion polls are based on surveys of at least 500 persons. We need this number to ensure a reasonable degree of accuracy.
Sample size for determining a mean:
o Smaller samples are often sufficient for estimating characteristics of populations of numerical(measured) data.
1.36
A study was undertaken to investigate the link between red wine consumption and heart disease. Research had indicated that
people living in France, particularly in the Burgundy area, experience a lower rate of heart disease than people living in Australia.
Researchers wish to estimate the average number of glasses of red wine consumed per week by people living in France, which has a population of more than 60 million, and people in Australia,
which has a population of more than 20 million. Researchers have decided to sample 400 subjects for the study.
Assuming the variability in the number of glasses of red wine consumed per week is the same in France and Australia, how many subjects should be sampled from each country such that each sample provides the same degree of accuracy?
1.38Q
Number to be sampled from each country?
from Australia:
from France:
total:
Reason:
400
1.38A

Stat170: Lecture 1 © Copyright Macquarie University 2015 10
1.39
Data Classification
numerical
categorical
ordinal
nominal
continuous
discrete
Grouped variables
Ordered groups
Only integer values are possible
Named
groups
1.40
Can take any values
Measured variables
Categorical variables are variables for which each observation falls into one of a number of groups.
Nominal variables are named variables with no inherent ordering: eg. favourite colour.
Ordinal variables are grouped variables with some ordering: eg. grade attained in unit.
If there are two groups the variable may be referred to as binary or dichotomous.
Binary variables can be either
o nominal, eg. sex, or
o ordinal eg. age group - ie. < 20 years, ≥ 20 years.
1.42 1.44
Numerical variables are measured variables and can be either discrete or continuous.
o Discrete variables are variables that take discrete values:
eg. number of students in class.
o Continuous variables are those that can assume any value, usually within a certain range:
eg. height, weight.

Stat170: Lecture 1 © Copyright Macquarie University 2015 11
1.45 1.46
Country Location LifeExp InfMort Unemp Olympics
Australia Oceania 82.0 4.49 1 2
Cameroon Africa 55.0 58.51 3 0
Chad Africa 49.1 91.94 3 0
China Asia 75.0 15.2 1 1
Ethiopia Africa 60.0 58.28 2 0
Fiji Oceania 71.9 10.46 1 0
France Europe 81.6 3.34 1 5
Germany Europe 80.3 3.48 1 3
Greece Europe 80.2 4.85 3 3
Hong Kong Asia 82.2 2.89 1 0
India Asia 67.5 44.60 1 0
Indonesia Asia 71.9 26.06 1 0
Italy Europe 82.0 3.33 2 3
Japan Asia 84.2 2.17 1 3
Country Location LifeExp InfMort Unemp Olympics
Malaysia Asia 74.3 14.12 1 0
Mozambique Africa 52.3 74.63 2 0
Namibia Africa 52.0 45.62 6 0
New Zealand Oceania 80.8 4.65 1 0
Singapore Asia 84.1 2.59 1 0
Solomon Is. Oceania 74.7 16.7 4 0
Spain Europe 81.4 3.35 3 1
Sri Lanka Asia 76.2 9.24 1 0
Sweden Europe 81.3 2.73 1 1
Tanzania Africa 60.8 45.10 2 0
Tunisia Africa 75.5 24.07 2 0
UK Europe 80.3 4.50 1 3
Zambia Africa 51.5 68.58 2 0
Location is nominal (categorical) Life expectancy is continuous (numerical)
Infant Mortality is continuous (numerical) Unemployment Rate is ordinal (categorical)
Olympics is discrete (numerical)
1.47
Homework problems
Classify the following variables, which recorded information on a sample of patients at a veterinary clinic. The patients were all female dogs which had given birth to puppies at the clinic in the past year.
a. Breed
b. Vaccinated (vaccinations up to date: yes/no)
c. Age
d. Weight
e. General health (poor, average, good, excellent)
f. Puppies (number of puppies in litter)
1.48Q

Stat170: Lecture 1 © Copyright Macquarie University 2015 12
Classification: discrete ordinalcontinuous nominal
a. Breed
b. Vaccinated
c. Age
d. Weight
e. General health
f. Puppies
1.48A
For the two following studies identify:
i. when the study was conducted
ii. the target population
iii. the variables recorded and indicate the type of each variable
a. A study was undertaken to investigate the link between TV violence and aggressive behaviour (Johnson et al., Science, 2002). Researchers randomly sampled 707 teenagers from New York State. Of the 88 who watched less than one hour of TV per day, 5 were reported to have later committed an aggressive act whilst of the 619 who watched at least one hour of TV per day, 154 were reported to have committed an aggressive act.
1.49Q
b. An experiment was conducted to investigate the link between mobile phone usage and drivers’ reaction times (Strayer et al., Psych Science, 2001). 64 university students were randomly assigned to one of two groups, a treatment group and a control group, both of which used a machine to simulate driving situations. The treatment group carried out a conversation on a mobile phone throughout the simulation. Participants were instructed to press a brake button as soon as a red light flashed. The mean response time was compared for the two groups.
1.49Q
a. Teenagers
i.
ii.
iii.
b. Drivers
i.
ii.
iii.
1.49A

Stat170: Lecture 1 © Copyright Macquarie University 2015 13
A clinical trial was conducted to determine the effectiveness of a new drug which was aimed at reducing blood cholesterol levels and preventing heart
attacks. 1500 middle-aged men at high risk of heart attack took part in the study. Each subject was randomly assigned to one of three groups of 500. The first group was prescribed a regular dose of the drug. The second group was prescribed a low dose of the drug and the third group was prescribed a
placebo. It was a double blind trial. By the end of the two year trial, 50 of the subjects in the placebo group had suffered heart attacks, 27 of the subjects in the regular dose group had suffered heart attacks and 47 of the
subjects in the low dose group had suffered heart attacks. Choose the statement which you think best summarises the trial:
i. Both the regular dose and the low dose of the treatment is effective in preventing heart attacks
ii. Neither the regular nor the low dose is effective
iii. Only the regular dose is effective
iv. Only the low dose is effective
1.50Q
i. Both the regular dose and the low dose of the treatment appear to be effective in
preventing heart attacks
ii. Neither the regular nor the low dose appear to be effective
iii. Only the regular dose appears to be effective
iv. Only the low dose appears to be effective
1.50A
Further information on the topics discussed in this lecture can be found in the prescribed textbook:
Modern Statistics: An Introductionby Don McNeil and Jenny Middledorp
(ISBN 9781486007011).
1.53
o Chapter 1: Pages 2 to 25