Embed Size (px)
Citation preview

Observation of the slow, Debye-like relaxation in hydrogen-bonded liquids by dynamiclight scatteringYangyang Wang, Philip J. Griffin, Adam Holt, Fei Fan, and Alexei P. Sokolov Citation: The Journal of Chemical Physics 140, 104510 (2014); doi: 10.1063/1.4867913 View online: http://dx.doi.org/10.1063/1.4867913 View Table of Contents: http://scitation.aip.org/content/aip/journal/jcp/140/10?ver=pdfcov Published by the AIP Publishing
This article is copyrighted as indicated in the article. Reuse of AIP content is subject to the terms at: http://scitation.aip.org/termsconditions. Downloaded to IP:
192.249.1.188 On: Thu, 13 Mar 2014 15:54:31

THE JOURNAL OF CHEMICAL PHYSICS 140, 104510 (2014)
Observation of the slow, Debye-like relaxation in hydrogen-bonded liquidsby dynamic light scattering
Yangyang Wang,1,a) Philip J. Griffin,2 Adam Holt,2 Fei Fan,3 and Alexei P. Sokolov1,2,3
1Chemical Sciences Division, Oak Ridge National Laboratory, Oak Ridge, Tennessee 37831, USA2Department of Physics and Astronomy, University of Tennessee, Knoxville, Tennessee 37996, USA3Department of Chemistry, University of Tennessee, Knoxville, Tennessee 37996, USA
(Received 15 January 2014; accepted 25 February 2014; published online 13 March 2014)
The slow, Debye-like relaxation in hydrogen-bonded liquids has largely remained a dielectric phe-nomenon and has thus far eluded observation by other experimental techniques. Here we reportthe first observation of a slow, Debye-like relaxation by both depolarized dynamic light scattering(DLS) and dielectric spectroscopy in a model hydrogen-bonded liquid, 2-ethyl-4-methylimidazole(2E4MIm). The relaxation times obtained by these two techniques are in good agreement and canbe well explained by the Debye model of rotational diffusion. On the one hand, 2E4MIm is anal-ogous to the widely studied monohydroxy alcohols in which transient chain-like supramolecularstructure can be formed by hydrogen bonding. On the other hand, the hydrogen-bonded backbone of2E4MIm is much more optically polarizable, making it possible to apply light scattering to study thedynamics of the supramolecular structure. These findings provide the missing evidence of the slow,Debye-like relaxation in DLS and open the venue for the application of dynamic light scattering tothe study of supramolecular structures in hydrogen-bonded liquids. © 2014 AIP Publishing LLC.[http://dx.doi.org/10.1063/1.4867913]
I. INTRODUCTION
Water, monohydroxy alcohols, and several otherhydrogen-bonded liquids display a pronounced Debye-likelow-frequency dielectric relaxation.1–11 Despite extensivestudies of more than half a century, the molecular originof this process still remains an open question. It is widelybelieved that the slow Debye-like relaxation is a distinctsignature of hydrogen-bonded supramolecular structures, andunderstanding the nature of this relaxation is a key step fora complete elucidation of the dynamics of hydrogen-bondedliquids.
Dynamic light scattering (DLS) is a powerful experimen-tal method for investigating the dynamics of glass-formingliquids, providing information complimentary to dielectricand dynamic mechanical spectroscopy techniques.12, 13 So far,however, this technique (DLS) has not been able to detect aDebye-like process in hydrogen-bonded liquids in the neatstate. In particular, no slow Debye-like relaxation has beenfound in water14 and monohydroxy alcohols6, 14 by DLS. Sim-ilarly, studies employing other non-dielectric techniques suchas calorimetry15 and dynamic mechanical spectroscopy16
were, until recently, unable to identify the slow, Debye-likerelaxation process in monohydroxy alcohols. It was thereforebelieved that this Debye-like relaxation is a purely dielectricphenomenon. However, this traditional view has been chal-lenged by recent nuclear magnetic resonance5 and mechani-cal measurements.17 The emerging experimental results fromnon-dielectric techniques have provided some essential ingre-dients for the explanation of the slow Debye-like relaxation.
a)Author to whom correspondence should be addressed. Electronic mail:[email protected]
In this context, the missing evidence from DLS appears morepuzzling than ever.
In this article we report the first observation of the slowDebye-like relaxation in a model hydrogen-bonded liquid, 2-ethyl-4-methylimidazole (2E4MIm), by depolarized photoncorrelation spectroscopy (PCS) and Brillouin-Raman spec-troscopy. Unlike monohydroxy alcohols, a slow Debye-likerelaxation can be detected in 2E4MIm by both broadband di-electric spectroscopy (BDS) and depolarized DLS, due to themuch higher optical polarizability of the hydrogen-bondedimidazole supramolecular backbone. The relaxation times forthe slow Debye-like process from BDS and DLS are consis-tent with each other and can be well described by the Debyemodel of rotational diffusion. This finding provides the miss-ing evidence of the slow Debye-like relaxation in DLS andopens the door for the application of dynamic light scatteringto the study of supramolecular hydrogen-bonded structures inthe neat liquid state.
II. EXPERIMENT
The 2-ethyl-4-methylimidazole (2E4MIm) compoundwas obtained from Sigma-Aldrich and used as received. Simi-lar to monohydroxy alcohols, 2E4MIm can form linear chain-like supramolecular structure through hydrogen bonding(Fig. 1).
Broadband dielectric spectroscopy (BDS) measurementsof 2E4MIm were carried out on a Novocontrol Concept80 system in the frequency range 10−2–107 Hz. Depolar-ized photon correlation spectroscopy (PCS) measurementsof 2E4MIm were performed in right angle geometry in anOxford Optistat cryostat with temperature stability of ±0.1 K.
0021-9606/2014/140(10)/104510/8/$30.00 © 2014 AIP Publishing LLC140, 104510-1
This article is copyrighted as indicated in the article. Reuse of AIP content is subject to the terms at: http://scitation.aip.org/termsconditions. Downloaded to IP:
192.249.1.188 On: Thu, 13 Mar 2014 15:54:31

104510-2 Wang et al. J. Chem. Phys. 140, 104510 (2014)
FIG. 1. Illustration of the hydrogen-bonded structures of 2-ethyl-1-hexanol(2E1H) (a model monohydroxy alcohol) and 2-ethyl-4-methylimidazole. Thehydrogen, carbon, oxygen, and nitrogen atoms are represented by white,gray, red, and blue sticks, respectively. The dashed lines stand for the inter-molecular hydrogen bonds. Both molecules are capable of forming chain-likesupramolecular structures.
The laser wavelength was 647 nm and the power was 75 mW.The scattered light was collected with an optical fiber, splitbetween two avalanche photodiode detectors, and analyzedusing an ALV-7004/FAST multi-tau digital correlator.
In addition to the PCS measurements, Brillouin-Ramanmeasurements were also carried out to access the dynamicsat shorter timescales and higher temperatures. The depolar-ized light scattering spectra of 2E4MIm were measured in thebackscattering geometry, using a tandem Fabry-Perot interfer-ometer (Sandercock Model) and a Raman spectrometer (JobinYvon T64000). A solid-state laser with wavelength = 532 nmand power = 75 mW was used for the measurements.
Differential scanning calorimetry measurement of2E4MIm was performed on a TA Instruments Q2000 devicewith aluminum hermetic pans. The experiment was carriedout in the temperature range 333–193 K at cooling/heatingrate of 10 K/min. The glass transition temperature (Tg) wasdetermined from the mid-point of the step in heat flow,which corresponded to the maximum in the derivative of heatflow with respect to temperature. The Tgs from cooling andheating scans are 232 and 235 K, respectively (Fig. 2).
Rheological measurements of 2E4MIm were performedon an AR2000ex rheometer (TA Instruments) with 4 and25 mm parallel plates. Creep measurements were used to de-termine the zero-shear viscosity (η) of 2E4MIm. η can be ob-tained from the creep compliance J(t) in the long-time limit:η = lim
t→∞ t/J (t). In addition to creep experiments, dynamic
mechanical measurements of complex modulus were carriedout to obtain the mechanical spectra in the frequency domain.
FIG. 2. Heat flow (red dotted line) and its temperature derivative (blue solidline) measured during (a) cooling and (b) heating scans, at 10 K/min.
Parallel plates of small diameter (4 mm) were used to mini-mize the contribution of instrument compliance.
III. RESULTS
A. Broadband dielectric spectroscopy
Representative dielectric spectra of 2E4MIm are pre-sented in Fig. 3, where the real and imaginary parts of per-mittivity (ε′ and ε′′), derivative of ε′ (ε′′
der), and loss modulus(M′′) are shown as a function of frequency ( f ). Unlike mono-hydroxy alcohols, 2E4MIm has high intrinsic proton conduc-tivity, due to its autodissociation.18 As a result, the dc con-ductivity dominates the dielectric loss spectra. To assist ouranalysis, the derivative spectra [ε′′
der = (− π /2)∂ε′/∂ln f ] areused.19 A typical spectrum of 2E4MIm consists of three pro-cesses (Fig. 3): a fast relaxation in the high frequency region,a pronounced slow Debye-like relaxation in the intermedi-ate frequency region, and electrode polarization (EP) effect20
at low frequencies. The complex dielectric permittivity ε∗ of2E4MIm can be modeled by the following equation:
ε∗(f ) = ε′ − iε′′
= ε∞ + �ε1
[1 + (i2πf τHN,1)α1 ]β1
+ �ε2
[1 + (i2πf τHN,2)α2 ]β2
+ σ
i2πf ε0+ A(2πf )n, (1)
where ε∞ is the dielectric permittivity at infinite frequency,�εj (j = 1, 2) is the dielectric relaxation strength, τHN,j isthe relaxation time, αj, β j are the shape parameters, σ is thedc conductivity, n is the slope of EP’s high frequency tail,and A is related to the amplitude of EP. The use of an EPterm improves the accuracy of our analysis, but is not essen-tial, because the main relaxation processes and EP are wellseparated. The relaxation frequency of the fast process coin-cides with the peak frequency of the electrical loss modulus
This article is copyrighted as indicated in the article. Reuse of AIP content is subject to the terms at: http://scitation.aip.org/termsconditions. Downloaded to IP:
192.249.1.188 On: Thu, 13 Mar 2014 15:54:31

104510-3 Wang et al. J. Chem. Phys. 140, 104510 (2014)
FIG. 3. Representative spectra of 2E4MIm at 258.15 K: (a) real part of di-electric permittivity ε′( f ); (b) imaginary part of dielectric permittivity ε′′( f );(c) derivative of ε′( f ), ε′′
der = (−π /2)∂ε′/∂ln f ; and (d) imaginary part ofelectrical modulus M′′( f ). Inset: Frequency dependence of real part of con-ductivity σ ′( f ). (Black) solid curves: Fittings of experimental data usingEq. (1).
M′′ (Fig. 3(d)) as well as the onset of dc conductivity (inset ofFig. 3). This process is therefore assigned to the conductivityrelaxation of 2E4MIm. It is widely believed that the protonhopping within the hydrogen-bonded chain structure plays animportant role in imidazole-based molecules. Because of itshigh intrinsic conductivity, the high-frequency dielectric be-havior of 2E4MIm resembles that of typical ionic conductorssuch as ionic liquids21 and phosphoric acids.22 It should beemphasized that the possibility of observing dipolar structuralrelaxation in highly ionic molecules has remained an openquestion.23 It is possible that the fast relaxation has a dipolarcontribution. The assignment of this process to conductivityrelaxation is mainly due to the ionic nature of 2E4MIm andits close connection to dc conduction (inset of Fig. 3). Furtherexperiments, however, are required to understand the exactnature of the fast relaxation (i.e., ionic vs. dipolar).
A pronounced slow relaxation can be observed in ε′( f )(Fig. 3(a)) and ε′′
der( f ) (Fig. 3(c)) at intermediate frequencies,and the shape of this slow relaxation was resolved by simul-taneously fitting ε′ and ε′′ using Eq. (1). It was observed thatthis slow relaxation is Debye-like, with α in the range 0.83–1.0 and β in the range 0.89–1.0. The fitting parameters areprovided in Table I.
It is important to recognize the difference between theslow Debye-like relaxation in 2E4MIm and those observed
TABLE I. Fit parameters for the slow Debye-like relaxation in dielectricmeasurements.
T (K) τHN,1 (s) �ε1 α1 β1
263.15 0.00252 3.79 0.89 0.89260.65 0.00491 5.32 0.83 1.0258.15 0.0120 6.20 0.93 0.91255.65 0.0243 8.14 0.93 0.99253.15 0.0590 10.8 0.92 0.94250.65 0.140 12.7 0.95 0.95
in polyalcohols and similar materials. It has been frequentlyreported that an ultra-slow Debye-like relaxation can showup in the vicinity of conductivity relaxation frequency inpolyalcohols24, 25 and polymers.26 Although the nature of thisprocess has not been completely settled, it is highly likelythat it originates from surface polarization effects due to pres-ence of impurities or voids,27–29 and is not an intrinsic featureof the material itself. In contrast to the close connection ofDebye-like relaxation and conductivity relaxation in polyal-cohols, the frequency of the slow, Debye-like relaxation in2E4MIm is approximately 1–2 orders lower than the conduc-tivity relaxation frequency. More importantly, as we demon-strate below, the observation of the same process in three dif-ferent techniques (BDS, PCS, and Brillouin-Raman) rules outany connection between the slow Debye-like relaxation andconductivity relaxation in 2E4MIm.
B. Photon correlation spectroscopy
The normalized intensity correlation functions (ICF) of2E4MIm are shown in Fig. 4. The decay of the ICF canbe well described by the superposition of two Kohlrausch-William-Watts (KWW) stretched exponential functions forthe normalized electric field correlation function (g1):
〈I (0)I (t)〉〈I 〉2
− 1 = g2(t) − 1 = γ [g1(t)]2
= γ {ϕ1 exp[−(t/τKWW,1)βKWW,1 ]
+ϕ2 exp[−(t/τKWW,2)βKWW,2 ]}2, (2)
where g1(t) and g2(t) are normalized electric field correlationfunction and normalized intensity correlation function (ICF),respectively, γ is the spatial coherence factor, ϕj (j = 1, 2) isthe relative relaxation strength, τKWW,j is the relaxation time,and βKWW,j is the stretching parameter. The slow relaxationis Debye-like, with βKWW in the range 0.77–0.86, whereasthe fast relaxation is highly stretched, with βKWW around 0.5.A detailed summary of the corresponding fit parameters isprovided in Table II. Fig. 4(b) shows that the use of a sin-gle Kohlrausch-William-Watts (KWW) stretched exponentialfunction is insufficient for fitting the experimental correlationfunctions.
C. Brillouin-Raman spectroscopy
The PCS results are corroborated by further Brillouin-Raman measurements. Similar to the time-domain PCSexperiments, the susceptibility spectrum χ ′′(ω) from BR
This article is copyrighted as indicated in the article. Reuse of AIP content is subject to the terms at: http://scitation.aip.org/termsconditions. Downloaded to IP:
192.249.1.188 On: Thu, 13 Mar 2014 15:54:31

104510-4 Wang et al. J. Chem. Phys. 140, 104510 (2014)
FIG. 4. (a) Depolarized photon correlation spectroscopy measurements attemperatures T = 240, 245, 250, 255, 260, 265, 275, 285, and 295 K (fromright to left). (b) Fitting of the electric field correlation function (EFCF) at260 K by one (red solid line) and two (blue short-dashed line) KWW func-tions. The slow relaxation (green dashed line) is Debye-like and approx-imately 1.5 decades slower than the structural relaxation process (orangedashed-dotted line). The residuals of the fits are displayed in the bottompanel, with open (red) circles for the single-KWW fit and (blue) crossed cir-cles for the double-KWW fit.
TABLE II. Fit parameters for the first-order autocorrelation function in PCSmeasurements.a
Slow (Debye-like) relaxation Fast (structural) relaxation
T (K) ϕ1 τKWW,1 (s) βKWW,1 ϕ2 τKWW,2 (s) βKWW,2
295 0.81 1.1 × 10⁻⁶ 0.86 ± 0.03 0.19 2.3 × 10⁻⁸ 0.50 ± 0.04285 0.78 6.2 × 10⁻⁶ 0.86 ± 0.03 0.23 2.2 × 10⁻⁷ 0.50 ± 0.04275 0.79 4.3 × 10⁻⁵ 0.84 ± 0.01 0.21 1.5 × 10⁻⁶ 0.50 ± 0.04265 0.83 5.4 × 10⁻⁴ 0.79 ± 0.01 0.17 1.5 × 10⁻⁵ 0.51 ± 0.04260 0.79 2.2 × 10⁻³ 0.85 ± 0.01 0.21 7.3 × 10⁻⁵ 0.52 ± 0.04255 0.82 1.1 × 10⁻² 0.84 ± 0.01 0.18 3.7 × 10⁻⁴ 0.53 ± 0.04250 0.86 6.4 × 10⁻² 0.77 ± 0.02 0.14 1.7 × 10⁻³ 0.50 ± 0.04245 0.83 0.47 0.82 ± 0.02 0.17 0.019 0.49 ± 0.04240 0.82 4.4 0.84 ± 0.02 0.18 0.19 0.50 ± 0.04
aFitting error: contrast: 1%; relaxation time: 1%.
FIG. 5. Imaginary part of the depolarized light scattering susceptibility spec-tra of 2E4MIm at 400 and 450 K. The red and black solid lines represent thefits of experimental data by Eq. (3).
experiments consists of a slow, Debye-like relaxation and afast, highly stretched relaxation (Fig. 5). Moreover, the re-laxation times and shape parameters of these two processesare also consistent with those from the PCS measurements(Tables II and III and Fig. 6). Here, it is important to pointout that previous BR measurements failed to identify a slow,Debye-like relaxation in hydrogen-bonded liquids, includingwater.6, 14
The depolarized scattering intensities I(ω) were con-verted to the susceptibility spectra χ ′′(ω) by using thefluctuation-dissipation theorem: χ ′′(ω) = I(ω)/[n(ω) + 1],where n(ω) = [exp (¯ω/kBT) − 1]−1 is the Bose factor. Fig. 5shows the χ ′′ spectra of 2E4MIm at 400 and 450 K, where tworelaxation processes are clearly visible. The slow relaxationhas a Debye-like shape, while the fast (alpha) relaxation isstretched. In order to extract their relaxation times and shapeparameters, we fit the light scattering susceptibility spectra bythe following equation:
χ ′′ = −�[
�χ1
(1 + iωτ1)βCD,1+ �χ2
(1 + iωτ2)βCD,2− i�χ3ω
ν
],
(3)where � stands for imaginary part, the first and second Cole-Davidson (CD) terms describe the slow Debye-like relaxationand alpha relaxation, respectively, and the last term accountsfor the low-frequency tail of the fast dynamics. The fit param-eters are summarized in Table III.
IV. DISCUSSION
A. Glass transition temperature
To further explore the nature of the relaxation processesobserved by BDS and depolarized PCS, their relaxation timesare shown as a function of inverse temperature in Fig. 6. Themechanical structural relaxation time (τ η), evaluated from theMaxwell relation: τ η = η/G, is also presented as a refer-ence. The viscosity η was determined from the creep mea-surement and the glassy modulus G = 0.425 GPa was deter-mined from the dynamic mechanical measurement close toTg and assumed to be a constant. As a first observation, the
This article is copyrighted as indicated in the article. Reuse of AIP content is subject to the terms at: http://scitation.aip.org/termsconditions. Downloaded to IP:
192.249.1.188 On: Thu, 13 Mar 2014 15:54:31

104510-5 Wang et al. J. Chem. Phys. 140, 104510 (2014)
TABLE III. Fit parameters for the χ ′′ spectra in Fig. 5.a
Slow (Debye-like) relaxation Structural (α) relaxation Fast relaxation
T (K) �χ1 βCD,1 τ 1 (ns) �χ2 βCD,2 τ 2 (ns) �χ3 ν
400 4.1 0.83 0.76 1.1 0.38 0.059 0.12 0.3450 2.8 0.84 0.12 1.1 0.38 0.011 0.14 0.3
aFitting error: amplitude: 5%; relaxation time: 1%.
relaxation time of the fast (alpha) process from PCS matchesτ η, suggesting that the origin of this process is the structuralrelaxation of 2E4MIm. Fitting τα with the Vogel-Fulcher-Tammann (VFT) equation and extrapolating the relaxationtime to 100 s yield a dynamic glass transition temperature(Tg) of 231 K. This agrees well with the differential scan-ning calorimetry measurement, which gives a Tg of 232 K onthe cooling scan. In addition, the conductivity relaxation time,τσ , which is ∼2 orders of magnitude faster than the dielectricτ slow, matches τα from PCS and τ η from rheology. Accordingto the classical theory, the ionic transport should be closelyconnected to the structural relaxation.30 The assignment ofthe fast process in PCS to structural relaxation is consistentwith the coincidence of τσ and τα . Therefore, it is clear thatthe Debye-like relaxation in 2E4MIm is slower than the struc-tural relaxation and not responsible for the glass transition.
B. Derivative analysis
We have shown that the light scattering intensity corre-lation function (ICF) measured for 2E4MIm is not well de-
FIG. 6. Comparison of the temperature dependence of the different relax-ation processes probed by broadband dielectric spectroscopy (BDS), rheol-ogy (RH), depolarized photon correlation spectroscopy (PCS), and Brillouin-Raman spectroscopy (BR). τσ is the conductivity relaxation time from BDS.τ slow is the relaxation time for the slow Debye-like process. τη is the seg-mental relaxation time from the mechanical measurement, calculated us-ing the Maxwell relation, τη = η/G. The viscosity η was determined fromthe creep measurement and the glassy modulus G = 0.425 GPa was deter-mined from the dynamic mechanical measurement. τα is the structural relax-ation time from PCS and BR. Dashed lines are the fits of the τ slow and τα
from optical measurements by the Vogel-Fulcher-Tammann (VFT) equation:τ = τ 0exp[B/(T − T0)], where τ 0, B, and T0 are fit parameters. The insetshows that the relaxation times of the slow process from BDS and PCS canbe collapsed onto a master curve by vertically shifting the BDS data by ∼0.48order (a factor of 3).
scribed by a single stretched exponential decay correspondingto the characteristic structural relaxation process. Instead, wehave demonstrated that the ICF can be precisely fit with a su-perposition of two decays – a faster, stretched exponential de-cay, and a slower, “Debye-like” component that accounts fora majority of the total decay of the ICF. The faster relaxationtime is nearly identical to the structural relaxation time calcu-lated from rheological measurements, and due to this agree-ment we attribute it to the molecular reorientational α processand not to secondary relaxations or the excess wing. Theseresults for 2E4MIm are unique, because for nearly all super-cooled liquids studied via depolarized DLS, the ICF has beenshown to be composed of one stretched exponential functioncorresponding to the structural relaxation process. Addition-ally, for measurements close to the calorimetric glass tran-sition temperature, the excess wing can also contribute to thedecay of the ICF, and it typically accounts for a small percent-age of the measured decay – similar to dielectric relaxationmeasurements.31, 32
In order to more thoroughly demonstrate that two relax-ations are present in the ICF of 2E4MIm and to precisely de-termine the stretching exponents corresponding to these tworelaxation processes, we have analyzed a quantity associatedwith the derivative of the ICF for both 2E4MIm and 2-ethyl-1-hexanol (2E1H), a model monohydroxy alcohol. If the mea-sured ICF is composed of one stretched exponential decay,such that ICF = {a · exp [ − (t/τα)β]}2, it is straightforwardto show that
Z = log10
[−d ln(ICF)
dt
]= log10
(2β
ταβ
)+ (β − 1) log10 t.
(4)Thus the KWW stretching exponent can be isolated and
determined by analyzing the slope of the line on a log-logplot fitted to the quantity −dln(ICF)/dt calculated from theexperimental data. Just as a single KWW function is shownto fit the ICF data of 2E1H in Fig. 7(a), it follows accordinglythat a single straight line is sufficient to describe the data for2E1H in Fig. 7(b). The stretching exponent for 2E1H was de-termined to be β = 0.6 from the slope of this line. At shorttimes, the ICF reaches a plateau and the statistical noise dom-inates the signal.
In contrast, it is clearly seen in Fig. 7(b) that the quan-tity Z calculated from the ICF measured for 2E4MIm has twodistinct regions where lines of quite different slope are re-quired to interpolate the data. This immediately demonstratesthat the decay of the ICF of 2E4MIm proceeds in two distinctsteps corresponding to two different relaxation processes. Theslope of each line corresponds to the stretching exponent ofeach individual relaxation in a manner similar to Eq. (4),
This article is copyrighted as indicated in the article. Reuse of AIP content is subject to the terms at: http://scitation.aip.org/termsconditions. Downloaded to IP:
192.249.1.188 On: Thu, 13 Mar 2014 15:54:31

104510-6 Wang et al. J. Chem. Phys. 140, 104510 (2014)
FIG. 7. (a) Normalized intensity correlation function (ICF) for 2-ethyl-1-hexanol (2E1H) at two representative temperatures. (b) Derivative analysis of ICF for2E4MIm and 2E1H.
although some approximations are necessary to quantify thesestretching exponents.
For the case of 2E4MIm, we consider the correla-tion function as being a sum of two separate decays,where ICF = [a1�1(t) + a2�2(t)]2 = {a1 · exp[−(t/τ1)β1 ]+ a2 · exp[−(t/τ2)β2 ]}2, with the first term corresponding tothe faster relaxation and the second term corresponding to theslower relaxation. In order to determine the stretching param-eter β2 of the slow relaxation, we make the approximationthat for t ≥ τ 2, �1 = 0. After this approximation is made,we retrieve the case of a single-step correlation function, andEq. (4) can be used to determine the stretching parameter β2
from the slope of the data in Fig. 7(b) at longer times. Thisslope corresponds to β ≈ 0.8 as is shown in Fig. 7(b).
In order to determine β1 from the slope of the data atshorter times, we make the approximation that for t ≤ τ 1, �2
= 1, such that ICF ≈ {a1 · exp[−(t/τ1)β1 ] + a2}2. Taking thederivative, we find that in this time window
Z = log10
[−d ln(ICF)
dt
]
≈ − log10
{1 + a2
a1exp
[(t
τ1
)β1]}
+ log10
(2β1
τ1β1
)+ (β1 − 1) log10 t, (5)
and since the first term of Eq. (5) is approximately constantfor t ≤ τ 1, we can further approximate that in the vicinity ofthe decay of the fast relaxation component,
Z= log10
[−d ln(ICF)
dt
]≈C+log10
(2β1
τ1β1
)+(β1−1) log10 t.
(6)
Once again we see that the slope of Z plotted against log10(t)in this time interval is directly related to the stretching expo-
nent of the fast decay, which we determined to be β ≈ 0.5 asseen in Fig. 7(b).
This derivative analysis clearly demonstrates that thereare two decays contributing to the ICF measured in 2E4MIm.Moreover, it shows that they correspond to a slow relaxationcomponent with β ≈ 0.8 and a faster relaxation componentwith β ≈ 0.5. This result is consistent with the fitting of ICFusing Eq. (2) (Table II).
C. Comparison of BDS and DLS
We now turn to the slow Debye-like relaxations in BDSand DLS. The relaxation times from the two measurementsare comparable on absolute scales and exhibit similar temper-ature dependence. According to the Debye-Stokes-Einsteinrelation,12, 33 the rotational diffusion rate (τ−1) of a sphericalparticle in a viscous medium is inversely proportional to thecube of its hydrodynamic radius R,
τ−1 = l(l + 1)kBT
8πηR3, (7)
where l is the tensor rank of the probed relaxation, kB is theBoltzmann constant, T is the absolute temperature, and η isthe viscosity of the medium. It follows that the ratio of the firstand second-rank rotational correlation time should be equal to3. It is well known that BDS and depolarized DLS probe thefirst- and second-rank rotational correlation, respectively.34
Therefore, for the same rotational diffusion process, the di-electric and light scattering relaxation times should differ bya factor of 3, if the angle for each reorientational jump issmall.35–37 The inset of Fig. 6 shows that the BDS and DLS re-laxation times for the slow, Debye-like relaxation can be col-lapsed onto a master curve by shifting the dielectric logτ databy ∼0.48 order (a factor of 3). This coincidence not only con-firms that the slow processes observed by BDS and DLS areof the same origin, but also suggests that the slow, Debye-likerelaxation in 2E4MIm proceeds through small-angle jumps
This article is copyrighted as indicated in the article. Reuse of AIP content is subject to the terms at: http://scitation.aip.org/termsconditions. Downloaded to IP:
192.249.1.188 On: Thu, 13 Mar 2014 15:54:31
104510-7 Wang et al. J. Chem. Phys. 140, 104510 (2014)
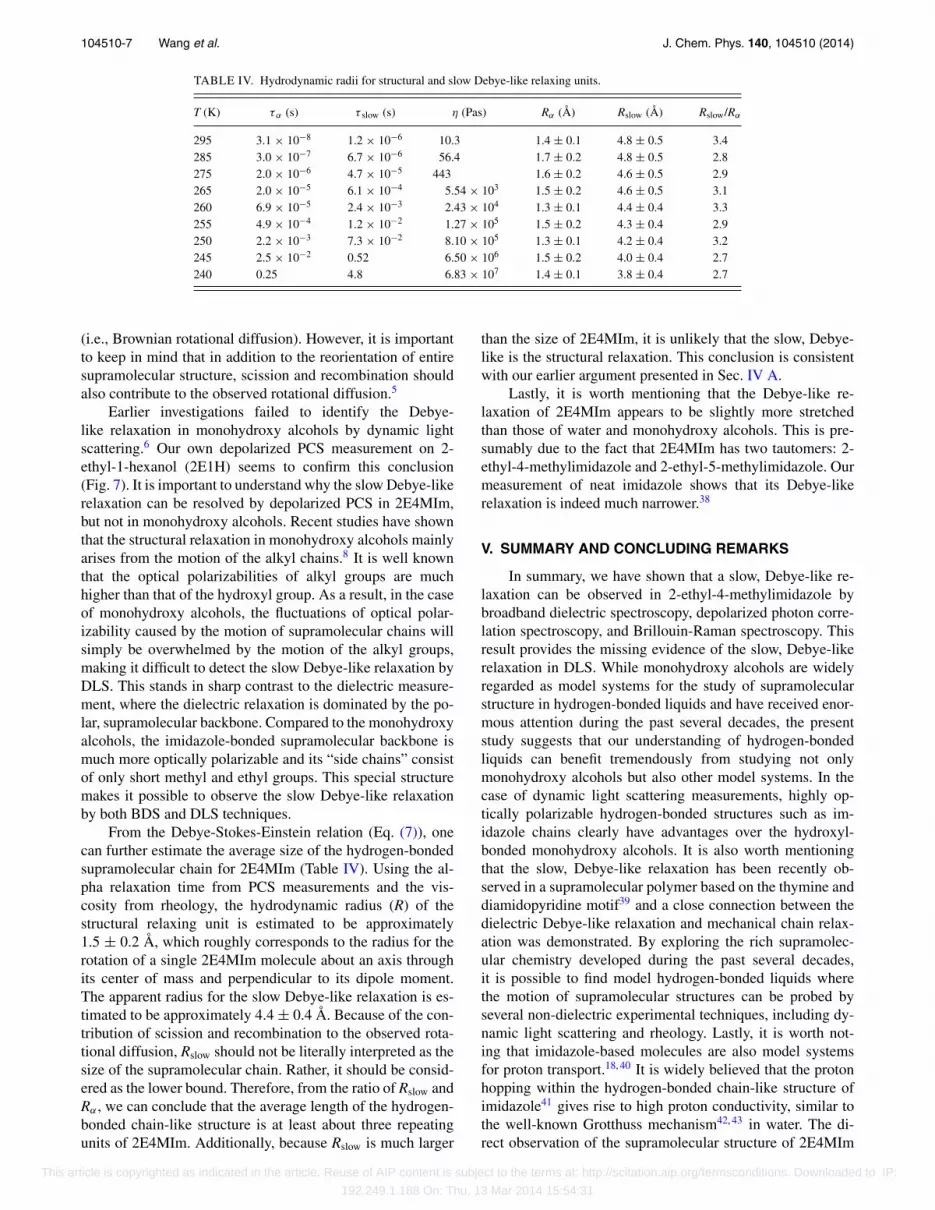
TABLE IV. Hydrodynamic radii for structural and slow Debye-like relaxing units.
T (K) τα (s) τ slow (s) η (Pas) Rα (Å) Rslow (Å) Rslow/Rα
295 3.1 × 10⁻⁸ 1.2 × 10⁻⁶ 10.3 1.4 ± 0.1 4.8 ± 0.5 3.4285 3.0 × 10⁻⁷ 6.7 × 10⁻⁶ 56.4 1.7 ± 0.2 4.8 ± 0.5 2.8275 2.0 × 10⁻⁶ 4.7 × 10⁻⁵ 443 1.6 ± 0.2 4.6 ± 0.5 2.9265 2.0 × 10⁻⁵ 6.1 × 10⁻⁴ 5.54 × 10³ 1.5 ± 0.2 4.6 ± 0.5 3.1260 6.9 × 10⁻⁵ 2.4 × 10⁻³ 2.43 × 10⁴ 1.3 ± 0.1 4.4 ± 0.4 3.3255 4.9 × 10⁻⁴ 1.2 × 10⁻² 1.27 × 10⁵ 1.5 ± 0.2 4.3 ± 0.4 2.9250 2.2 × 10⁻³ 7.3 × 10⁻² 8.10 × 10⁵ 1.3 ± 0.1 4.2 ± 0.4 3.2245 2.5 × 10⁻² 0.52 6.50 × 10⁶ 1.5 ± 0.2 4.0 ± 0.4 2.7240 0.25 4.8 6.83 × 10⁷ 1.4 ± 0.1 3.8 ± 0.4 2.7
(i.e., Brownian rotational diffusion). However, it is importantto keep in mind that in addition to the reorientation of entiresupramolecular structure, scission and recombination shouldalso contribute to the observed rotational diffusion.5
Earlier investigations failed to identify the Debye-like relaxation in monohydroxy alcohols by dynamic lightscattering.6 Our own depolarized PCS measurement on 2-ethyl-1-hexanol (2E1H) seems to confirm this conclusion(Fig. 7). It is important to understand why the slow Debye-likerelaxation can be resolved by depolarized PCS in 2E4MIm,but not in monohydroxy alcohols. Recent studies have shownthat the structural relaxation in monohydroxy alcohols mainlyarises from the motion of the alkyl chains.8 It is well knownthat the optical polarizabilities of alkyl groups are muchhigher than that of the hydroxyl group. As a result, in the caseof monohydroxy alcohols, the fluctuations of optical polar-izability caused by the motion of supramolecular chains willsimply be overwhelmed by the motion of the alkyl groups,making it difficult to detect the slow Debye-like relaxation byDLS. This stands in sharp contrast to the dielectric measure-ment, where the dielectric relaxation is dominated by the po-lar, supramolecular backbone. Compared to the monohydroxyalcohols, the imidazole-bonded supramolecular backbone ismuch more optically polarizable and its “side chains” consistof only short methyl and ethyl groups. This special structuremakes it possible to observe the slow Debye-like relaxationby both BDS and DLS techniques.
From the Debye-Stokes-Einstein relation (Eq. (7)), onecan further estimate the average size of the hydrogen-bondedsupramolecular chain for 2E4MIm (Table IV). Using the al-pha relaxation time from PCS measurements and the vis-cosity from rheology, the hydrodynamic radius (R) of thestructural relaxing unit is estimated to be approximately1.5 ± 0.2 Å, which roughly corresponds to the radius for therotation of a single 2E4MIm molecule about an axis throughits center of mass and perpendicular to its dipole moment.The apparent radius for the slow Debye-like relaxation is es-timated to be approximately 4.4 ± 0.4 Å. Because of the con-tribution of scission and recombination to the observed rota-tional diffusion, Rslow should not be literally interpreted as thesize of the supramolecular chain. Rather, it should be consid-ered as the lower bound. Therefore, from the ratio of Rslow andRα , we can conclude that the average length of the hydrogen-bonded chain-like structure is at least about three repeatingunits of 2E4MIm. Additionally, because Rslow is much larger
than the size of 2E4MIm, it is unlikely that the slow, Debye-like is the structural relaxation. This conclusion is consistentwith our earlier argument presented in Sec. IV A.
Lastly, it is worth mentioning that the Debye-like re-laxation of 2E4MIm appears to be slightly more stretchedthan those of water and monohydroxy alcohols. This is pre-sumably due to the fact that 2E4MIm has two tautomers: 2-ethyl-4-methylimidazole and 2-ethyl-5-methylimidazole. Ourmeasurement of neat imidazole shows that its Debye-likerelaxation is indeed much narrower.38
V. SUMMARY AND CONCLUDING REMARKS
In summary, we have shown that a slow, Debye-like re-laxation can be observed in 2-ethyl-4-methylimidazole bybroadband dielectric spectroscopy, depolarized photon corre-lation spectroscopy, and Brillouin-Raman spectroscopy. Thisresult provides the missing evidence of the slow, Debye-likerelaxation in DLS. While monohydroxy alcohols are widelyregarded as model systems for the study of supramolecularstructure in hydrogen-bonded liquids and have received enor-mous attention during the past several decades, the presentstudy suggests that our understanding of hydrogen-bondedliquids can benefit tremendously from studying not onlymonohydroxy alcohols but also other model systems. In thecase of dynamic light scattering measurements, highly op-tically polarizable hydrogen-bonded structures such as im-idazole chains clearly have advantages over the hydroxyl-bonded monohydroxy alcohols. It is also worth mentioningthat the slow, Debye-like relaxation has been recently ob-served in a supramolecular polymer based on the thymine anddiamidopyridine motif39 and a close connection between thedielectric Debye-like relaxation and mechanical chain relax-ation was demonstrated. By exploring the rich supramolec-ular chemistry developed during the past several decades,it is possible to find model hydrogen-bonded liquids wherethe motion of supramolecular structures can be probed byseveral non-dielectric experimental techniques, including dy-namic light scattering and rheology. Lastly, it is worth not-ing that imidazole-based molecules are also model systemsfor proton transport.18, 40 It is widely believed that the protonhopping within the hydrogen-bonded chain-like structure ofimidazole41 gives rise to high proton conductivity, similar tothe well-known Grotthuss mechanism42, 43 in water. The di-rect observation of the supramolecular structure of 2E4MIm
This article is copyrighted as indicated in the article. Reuse of AIP content is subject to the terms at: http://scitation.aip.org/termsconditions. Downloaded to IP:
192.249.1.188 On: Thu, 13 Mar 2014 15:54:31

104510-8 Wang et al. J. Chem. Phys. 140, 104510 (2014)
by DLS also offers a new powerful experimental approach tothe study of proton transport in hydrogen-bonded liquids.
ACKNOWLEDGMENTS
The authors thank A. L. Agapov and J. R. Sangoro forhelpful discussions. This work was supported by the NSFChemistry Program (CHE-1213444).
1M. A. Floriano and C. A. Angell, J. Chem. Phys. 91, 2537 (1989).2V. V. Levin and Y. D. Feldman, Chem. Phys. Lett. 87, 162 (1982).3D. Fragiadakis, C. M. Roland, and R. Casalini, J. Chem. Phys. 132, 144505(2010).
4C. Gainaru, S. Kastner, F. Mayr, P. Lunkenheimer, S. Schildmann, H. J.Weber, W. Hiller, A. Loidl, and R. Böhmer, Phys. Rev. Lett. 107, 118304(2011).
5C. Gainaru, R. Meier, S. Schildmann, C. Lederle, W. Hiller, E. A. Rössler,and R. Böhmer, Phys. Rev. Lett. 105, 258303 (2010).
6C. Hansen, F. Stickel, T. Berger, R. Richert, and E. W. Fischer, J. Chem.Phys. 107, 1086 (1997).
7S. Pawlus, S. Klotz, and M. Paluch, Phys. Rev. Lett. 110, 173004 (2013).8L. P. Singh and R. Richert, Phys. Rev. Lett. 109, 167802 (2012).9L.-M. Wang and R. Richert, J. Phys. Chem. B 109, 8767 (2005).
10Y. Yomogida and R. Nozaki, in 5th International Workshop on ComplexSystems, edited by M. Tokuyama, I. Oppenheim, and H. Nishiyama (Amer-ican Institute of Physics, Sendai, Japan, 2008), p. 350.
11U. Kaatze, R. Behrends, and R. Pottel, J. Non-Cryst. Solids 305, 19 (2002).12B. J. Berne and R. Pecora, Dynamic Light Scattering: With Applications to
Chemistry, Biology, and Physics (Dover, New York, 1976).13A. P. Sokolov and V. G. Sakai, in Dynamics of Soft Matter: Neutron Ap-
plications, edited by V. García Sakai, C. Alba-Simionesco, and S.-H. Chen(Springer, New York, 2012), p. 1.
14T. Fukasawa, T. Sato, J. Watanabe, Y. Hama, W. Kunz, and R. Buchner,Phys. Rev. Lett. 95, 197802 (2005).
15L.-M. Wang, Y. Tian, R. Liu, and R. Richert, J. Chem. Phys. 128, 084503(2008).
16B. Jakobsen, C. Maggi, T. Christensen, and J. C. Dyre, J. Chem. Phys. 129,184502 (2008).
17C. Gainaru, R. Figuli, T. Hecksher, B. Jakobsen, J. C. Dyre, M. Wilhelm,and R. Böhmer, Phys. Rev. Lett. 112, 098301 (2014).
18K.-D. Kreuer, S. J. Paddison, E. Spohr, and M. Schuster, Chem. Rev. 104,4637 (2004).
19M. Wübbenhorst and J. van Turnhout, J. Non-Cryst. Solids 305, 40 (2002).20A. Serghei, J. R. Sangoro, and F. Kremer, in Electrical Phenomena at In-
terfaces and Biointerfaces: Fundamentals and Applications in Nano-, Bio-,and Environmental Sciences, edited by H. Ohshima (John Wiley and Sons,Inc., Hoboken, New Jersey, 2012).
21J. R. Sangoro, A. Serghei, S. Naumov, P. Galvosas, J. Kärger, C. Wespe, F.Bordusa, and F. Kremer, Phys. Rev. E 77, 051202 (2008).
22Y. Wang, N. A. Lane, C.-N. Sun, F. Fan, T. A. Zawodzinski, and A. P.Sokolov, J. Phys. Chem. B 117, 8003 (2013).
23P. Griffin, A. L. Agapov, A. Kisliuk, X.-G. Sun, S. Dai, V. N. Novikov, andA. P. Sokolov, J. Chem. Phys. 135, 114509 (2011).
24Y. Yomogida, A. Minoguchi, and R. Nozaki, Phys. Rev. E 73, 041510(2006).
25R. Bergman, H. Jansson, and J. Swenson, J. Chem. Phys. 132, 044504(2010).
26S. Zhang and J. Runt, J. Phys. Chem. B 108, 6295 (2004).27R. Richert, A. Agapov, and A. P. Sokolov, J. Chem. Phys. 134, 104508
(2011).28R. Casalini and C. M. Roland, J. Chem. Phys. 135, 094502 (2011).29M. Paluch, S. Pawlus, and K. Kaminski, J. Chem. Phys. 134, 037101
(2011).30P. G. Wolynes, Ann. Rev. Phys. Chem. 31, 345 (1980).31P. J. Griffin, A. L. Agapov, and A. P. Sokolov, Phys. Rev. E 86, 021508
(2012).32A. Brodin, R. Bergman, J. Mattsson, and E. A. Rössler, Eur. Phys. J. B 36,
349 (2003).33P. Debye, Polar Molecules (Dover, New York, 1929).34G. Williams, Chem. Soc. Rev. 7, 89 (1978).35J. G. Powles, Molecular Relaxation Processes (Academic Press, New York,
1966).36C. De Michele and D. Leporini, Phys. Rev. E 63, 036702 (2001).37D. Kivelson and S. A. Kivelson, J. Chem. Phys. 90, 4464 (1989).38Y. Wang, P. J. Griffin, and A. P. Sokolov, “Collective dynamics and proton
transport in liquid imidazole” (unpublished).39N. Lou, Y. Wang, X. Li, H. Li, P. Wang, C. Wesdemiotis, A. P. Sokolov,
and H. Xiong, Macromolecules 46, 3160 (2013).40K.-D. Kreuer, Chem. Mater. 8, 610 (1996).41A. Li, Z. Cao, Y. Li, T. Yan, and P. Shen, J. Phys. Chem. B 116, 12793
(2012).42N. Agmon, Chem. Phys. Lett. 244, 456 (1995).43D. Marx, ChemPhysChem. 7, 1848 (2006).
This article is copyrighted as indicated in the article. Reuse of AIP content is subject to the terms at: http://scitation.aip.org/termsconditions. Downloaded to IP:
192.249.1.188 On: Thu, 13 Mar 2014 15:54:31


