Embed Size (px)
Citation preview

Accid. AM//. and Pwu. Vol. 25. No. 5, pp. 545-554, 1993 Printed in the U.S.A.
0001-4575193 $6.00 + .OO 0 1993 Pergamon Press Ltd.
OBSERVED AND SELF-REPORTED SEAT BELT WEARING AS RELATED TO PRIOR TRAFFIC
ACCIDENTS AND CONVICTIONS
WILLIAM W. HUNTER,J. RICHARD STEWART,JANE C. STUTTS, and ERIC A. RODGMAN
Highway Safety Research Center, University of North Carolina, Chapel Hill, NC, U.S.A.
Abstract-During the summer of 1987, 10,000 color-coded mailback questionnaires that identified belted and unbelted North Carolina drivers were handed out at the 72 sites that constitute the probability sample for determining the statewide belt use rate in North Carolina. By obtaining identifying information to determine the winner of a $500 prize from among the 5,074 respondents, police-reported traffic accident and conviction records from the North Carolina driver history file were linked to the belted and unbelted respondents. Analyses found that drivers who had been observed not wearing seat belts had 35% more accidents and 69% more convictions than did belted drivers in the previous four-year period. Similar findings were obtained from self-reported belt use.
INTRODUCTION
In October, 1985, North Carolina implemented a primary enforcement seat belt use law. The Univer- sity of North Carolina Highway Safety Research Center (HSRC) is conducting an ongoing evaluation of the law. The evaluation includes periodic state- wide observational surveys of on-road belt use and motor vehicle injury and fatality analysis. Although the North Carolina belt use observations have fre- quently produced use rates as high as those of any other state in the country, like other states, we have not experienced the extent of injury reduction that would be expected on the basis of these use rates (Reinfurt, Campbell, Stewart, and Stutts 1990). It has been frequently hypothesized that this discrep- ancy between predicted and actual belt use benefits results from non-belt use by people who are at higher risk of crash involvement.
This paper extends the statewide seat belt ob- servation data by linking additional mail survey and driver history data to address whether non-belt users are indeed overrepresented in traffic crashes and convictions and whether these crashes and convic- tions differ from those of belt users. Observational belt use data are needed because drivers and passen- gers who are involved in crashes have been found to greatly exaggerate self-reported belt use with a mandatory belt use law (MUL) in effect (Reinfurt et al. 1990).
BACKGROUND
The assumption that persons who do not wear seat belts are more likely to become involved in crashes has been with us almost since seat belts were first introduced as an automotive safety feature. In
1969, Campbell compared observed belt use among drivers in the population at risk with reported belt
use for drivers in crashes investigated by the North
Carolina State Highway Patrol. He found belt use
to be “consistently and considerably greater in the non-accident population.” Campbell’s recommen-
dation even at this early time was that for maximum
effect, seat belt promotion attempts should be aimed more directly at identifiable groups known to have
higher accident involvement rates.
The issue of overrepresentation of unbelted drivers in crashes has drawn increased attention in recent years with efforts to evaluate the effective-
ness of mandatory seat belt legislation. In one of the earlier published evaluations of MULs, Robert-
son and Williams (1978) suggested that one reason
belt laws in the four countries they examined did
not reduce deaths and injuries as much as expected was that “belts are less often worn by persons dis- proportionately involved in severe crashes-parti- cularly teenagers and persons driving with high
blood alcohol concentrations.” Examining belt use, injury, and fatality data from 27 countries and four
545

546 W. W. HUNTER et al
Canadian provinces with belt laws. McCarthy, Tay- lor, Sanford, and Lange (1984) also found a lower than expected reduction in injuries and noted that “Drivers who generally exhibit more risk-taking be- havior and who have the most automobile accidents. are the least likely to comply voluntarily with the seat belt law, and are the last drivers to be affected by enforcement programs.”
Whereas some earlier U.S. and Canadian stud- ies found no relationship between .sc~~,,porrrd belt use and accident involvement (Teknekron Research, Inc. 1979; Heron 1975), more recent analyses based on ohsrrved belt use and police reported accident data do show a trend of higher accident involvement for unbelted drivers. Evans and Wasielewski (1983) mounted cameras on overpasses outside Detroit and Toronto to use in measuring headways (following times between vehicles) and recording associated vehicle and driver characteristics, including license plate number and seat belt use. More specific driver history information on the Mi~hi~n observations was then obtained from state data files. In addition to finding that nonuse of seat belts was associated with reduced headways, their results showed a rela- tionship between likelihood of prior accident involvement and a number of driver characteristics including seat belt use. In a similar study of observed speeds and driver/vehicle characteristics. Wasie- lewski (1984) also found lower belt use for drivers with prior accidents or convictions (but no relation- ship between driving speed and belt use). More re- cent Canadian studies conducted since passage of mandatory belt legislation have also shown modest correlations between belt use and previous accident involvement (Jonah and Lawson 1986).
Using the Michigan data in the headway and speed studies described above along with Fatal Acci- dent Reporting System (FARS) data, Evans (I987a) has attempted to quantify the relative prior accident invoIvement rates for observed belted and unbelted drivers. Evans concluded that unbelted drivers had a 53% higher accident involvement rate than belted drivers. In a subsequent study, Evans (1987b) em- ploys this higher involvement rate for unhehed driv- ers in predicting the reduction in driver fatalities as observed belt use increases in a population.
In addition to examining the overinvolvement of unbelted North Carolina drivers in traffic crashes and convictions, a second goal of this current re- search was to examine how the prior crashes and violations of drivers who do not wear seat belts differ from those of drivers who do wear belts. Certainly there is ample evidence from past examinations of seat belt effectiveness that the crashes of drivers who are belted at the time of their crash differ from
the crashes of drivers who are unbelted: the crashes of unbelted drivers are likely to involve higher vehi- cle damage (TAD) severities, more single-vehicle and rollover accidents, younger drivers, etc. (Camp- bell 1984; Reinfurt, Silva, and Seila 1976). However, whether or not the crashes of belted and unbelted drivers continue to differ in the presence of a MUL is not well known at this time. and in fact is difficult to evaluate given the tendency of crash victims to overreport belt use where a law is in place.
METHOD
Since the fall of 1985. observers have routinely collected seat belt observation data at a probability sample of 72 sites to determine the North Carolina statewide seat belt use rate. To gather data for the current project, data collectors working during the fall of 1987 also distributed color-coded survey pack- ets (green for belted drivers and yellow for unbelted drivers) to drivers of North Carolina vehicles. The appendix shows the mailback survey form contained in each packet. Along with the one-page survey form, each packet also contained a newly published North Carolina road map and a pen for filling out the questionnaire that was imprinted with the mcs- sage, “A pen for your thoughts.” The drivers’ par- ticipation in the survey made them eligible for a $500 cash prize drawing-hence encouragement for them to include their name and address on the returned survey form. Name and address were then used to link survey respondents with the North Carolina driver history file.
The probability sampling plan used to collect statewide seat belt data involves seat belt observa- tions of front-seat occupants of both in-state and out-of-state vehicles covered by the North Carolina law (i.e. manufactured with various lap and shoulder belt systems) stratified by region of the state (coast. Piedmont. mountains), rural/urban location, and time of dayiday of week. Within these strata 72 compLlter-pinpointed locations are used as perma- nent seat belt observation sites for North Carolina.
Full 72-site surveys have typically been con- ducted two or more times each year since the North Carolina law became effective in October, 1985. Pairs of observers collect data for one and one-half hours at each site using a sampling plan that stratifies by peak commuting times (7:00 A.M. to 9:30 A.M.
and 4:00 P.M. to 6:3O P.M.), noncommuting hours during the week, and also weekend periods. The observation points are at intersections where vehi- cles must come to a stop. This allows a brief conver- sation with the driver or another occupant, if neces- sary, to obtain the following information:

Seat belt wearing and prior traffic accidents and convictions 547
I.
2. 3 _ . 4.
Vehicle type (passenger car, van pickup, convertible, or other) Sex Race (white, non-white) Belt status (no restraint, lap only, lap and shoulder belt, child restraint, child restraint improperly used).
For this project, the data collectors went one step further and handed out the color-coded survey packets to drivers of North Carolina vehicles, using the presence of a North Carolina inspection sticker to identify the vehicle as in-state. In-state drivers were needed to link both their observed and self- reported (from the mailback survey) belt use status with the North Carolina driver history file.
Pilot testing of this approach at four of the 72 data collection sites yielded a 55% response rate. Based on these results, it was determined that distri- bution of 10,000 packets at the 72 sites should be sufficient to reach our overail target of 5,000 mail- back responses. In order to obtain a sufficient num- ber of responses from non-belt wearers, we decided to oversample this population. Thus, while only about a third of all observed drivers were not wear- ing seat belts at the time this survey was conducted, we distributed half of our forms to these drivers (i.e. at each site equal numbers of yellow (unbelted) and green (belted) forms were distributed). Since observ- ers mentioned the possibility of a $500 prize when handing out the packets, drivers tended to accept the information readily.
A total of 5,074 surveys were returned for an overall response rate of 51%. Returns were fairly consistent across individual sites, generally ranging between 40%-55%. Eventually, 4,505 names were matched to the driver history files, or about 90% of all returns.
At this point the most recent four years (1983-1986) of the driver history file were accessed, and police-reported accident and conviction data ap- pended to each mailback survey record. In addition, accident case numbers from the driver history file were linked to the police-reported accident file so that more complete accident information could be appended. Thus, a complete record contained mail- back survey responses, driver history data, and po- lice-reported accident data.
SAMPLE CHARACTERISTICS
To examine the representativeness of the mail survey respondents, their (self-reported) sex and race distributions were compared with the sex and race distributions for all drivers observed at the time
Table I. Sex and race distributions of all drivers observed vs. the mailback survey return sample
Male Female White Nonwhite
% total sample of drivers observed
60.9 39.1 86.2 13.8
% survey return sample
54.3 45.7 88.4 11.7
the survey forms were distributed. Resufts are sum- marized in Table 1. Even though half of the survey forms were given to unbelted drivers, 61% of the returns came from observed belted drivers (based on the color of the form). This compares to a 64% belt use rate for the total sample of drivers observed at the time of the survey. The percentage of females was somewhat higher among those returning the sur- vey, but the racial composition of the two samples was similar.
It was also possible to compare the sample of survey respondents with a sample of all North Caro- lina licensed drivers across certain key variables on the driver history file. Of particular interest was a comparison of the police-reported accident and con- viction records of the two, since it might be argued that persons with a history of accidents and convic- tions would be less likely to respond to the survey. These comparisons are shown in Table 2 and do not support the notion that the survey return sample was biased toward “better” drivers.
Finally, the age distribution of the survey re- spondents, compared with all 1987 North Carolina licensed drivers, is shown in Table 3. The survey sample shows a slightly higher percentage of middle- aged drivers and a lower percentage of young driv- ers, but again this could be anticipated, since middle-
Table 2. Police-reported accidents and convictions for all North Carolina licensed drivers vs. the mailback survey return sample
Reported accidents % North Carolina 5% survey and convictions licensed drivers return sample
Number of police reported accidents during 1983-1986 0 82.4 81.5 1 14.8 15.1 2 or more 2.9 3.4
Number of convictions for moving violations during 1983- 1986 0 77.7 74.4 1 14.4 17.3 2 4.6 4.x 3 or more 3.3 3.3

548 W. W. HUNTER et al
Table 3. Age distribution of ail 1987 North Carolina licensed drivers vs. the mailback survey return
sample
‘Z N.C. licensed % survey
Age driver> (1987) return sample - -.-
<?5 years 19.5 15.0 25-54 years 5x.3 63.5 55 + years 22.4 21.5
aged drivers tend to accumulate the highest annual mileages (Klinger and Kuzmyak 1986).
O~SERVEDVERSUSREPORTED BELT USE
One item on the mailback survey asked how often the respondent currently wore a seat belt when driving, The response distribution is shown in TabIe 4.
The fact that the survey questionnaire forms were color-coded to indicate each driver’s observed belt use or nonuse was a unique feature of this sur- vey. Thus, we could compare their self-reported belt use information with an observed on-road measure of belt use at one time for each driver in our sample. The former situation, whereby respondents arc asked to report on their belt wearing frequency over an extended period of time, will tend to yield a higher usage rate than the one-time assessment during any observation period. In other words, the tendency would be to report more frequent belt use over an extended time period (a period prevalence measure), resulting in a higher use rate than that produced by the on-road observation (a point prevalence mea- sure) ~~ac~ahon and Pugh 1970). In the current analysis, the observed belt use is used to provide an interpretation of, and to lend some validity to. the self-reported belt use.
Table 5 shows current self-reported belt use cross classified by observed belt use. For each cate- gory of current self-reported belt use the table shows the distribution of drivers in that category who were
Table 4. Current self-reported belt use for survey
rexpondents
Current self-reported belt use
-----
Always Most of the time Sometimes
Rarely Never
Total
II 2
307 55.x
963 11.5
413 9.4 360 8.0 236 ii.2
4489 IOO.0
Table 5. Cwrent self-reported belt use cross-classified by ob-
zerved belt use ._ -
Observed belt use Current self-reported
belt use Belted CT) Not belted ($7) Tot:11 -
AlV”Xys
Most of the time
Sometimes
Karely
Never
observed belted and not belted. Thus, of the 2.507 drivers who responded by saying they “always” wear belts, 87% were observed wearing belts while 13% were observed not belted.
There are discrepancies between self-reported and observed belt use that appear in the “always” and ‘?tever” categories of Table 5. These are re- vealed by 13% of the respondents who say they “always” wear their behs but who were observed to be not belted. Likewise, 6% of the respondents who say they “never” wear their belts were ob- served to be belted. For the other belt wearing groups, the part-time wearers, the nature of any discrepancies is not clear.
Reasons for the discrepancies might include er- rors in distributing the coded survey forms, exagger- ated reporting of belt USC by the respondents. or simply the fact that many surveys were not filled out immediately and part-time users may not have correctly remembered their actual belt use. There could also have been a halo effect present, with respondents thinking that the $500 prize would bc given to a belt wearer.
The mailback survey allowed another cheek of observed versus reported belt use through aquestion that asked, “Were you wearing your seat belt at the time this survey was given to you?” The responses to this question cross-classified by observed belt use are shown in Table 6. These results seem quite COII-
sistent with those of Table S. In addition, when re- ported use at the time of the survey was cross-classi- fied with current self-reported belt use, 97% of those respondents who reported being belted at the time of the survey also reported wearing seat belts “~IlW~t~S.”
OVERREPRESENTATION OF NON-BELT USERS IN POLICE-REPORTED
ACCIDENTS AND CONVICTIONS
The analyses found that non-belt users are over- represented in prior police-reported accidents and

Seat belt wearing and prior traffic accidents and convictions 549
Table 6, Self-reported belt use at time of survey by ob- served belt use
Self-reported belt use at
time of survey
Belted
Not belted
No belts in vehicle
Total
Observed belt use
Belted Not belted (%) (%‘c)
2690 419 (86.5) (13.5)
SO 1256 (3.8) (96.2)
(:.@I (9Y0, 2743 1717 (hi .S) (38.5)
Total
3109 (69.7)
1306 (29.3)
45 (i.0) 4460
convictions. Average numbers of accidents and con- victions per observed belted and unbelted driver over the four-year ( 1983-1986) period were:
Observed Average Average belt status PI accidents convictions
Belted 2759 0.20 0.32 Not belted 1746 0.27 0.54
On average, each non-belted driver had 35% more accidents and 69% more convictions than did each belted driver. Based on f-tests, these differ- ences are statistically significant (p < .OOOl in both cases). These values match very closely the results reported in Evans (1987a), where photographic methods were used to detect seat belt use in separate travel speed and headway studies, and the belt use was linked to driver histories.
Moreover, in the same four-year period, of those drivers observed wearing belts
83% had no prior accidents while 17% had one or more.
Of those observed not belted
79% had no accidents while 21% had one or more.
Similarly, of the observed belted drivers
78% had no prior convictions, 16% had one conviction, and 6% had two or more,
while of the drivers observed not wearing belts
69% had no prior convictions, 19% had one conviction, and 12% had two or more convictions.
The question of overrepresentation is further explored in Table 7, which shows the number and percentages of survey respondents having no re- ported accidents, one accident, and two or more accidents during the four-year period 1983-1986, cross-classified by current self-reported belt use. For these analyses, self-reported belt use was col- lapsed into three categories: always, mostly/some- times, rarely/never. The table also shows average number of accidents per driver for each belt use category. Similar to the observed belted/unbelted results, the self-reported “rarely/never” wearers have, on average, 33% more accidents than the “al- ways” wearers. While the magnitude of the differ- ences in the accident distributions across belt use categories is not particularly striking, these differ- ences are statistically significant (p = .016). The relationship is monotonic, with accident involve- ment increasing with decreasing belt use.
It might be argued that these results are biased, since nonwearers of seat belts are more likely to be injured in a crash, and hence their crashes are more likely to be reported. In North Carolina, all accidents are required to be reported if they exceed a $500 damage criterion, regardless of injury occurrence. This may reduce potential sample biases. In addi- tion, less than 25% of North Carolina drivers wore seat belts just prior to the enactment of the seat belt law in October of 1985, and even after the law’s enactment, usage rose to only 42% before full en- forcement began in January 1987. This low level of use prior to the law’s enactment should also reduce any biases resulting from the group of “belted” driv- ers in 1983-1986 having had fewer injuries and hence fewer reported accidents.
Overrepresentation of nonusers with respect to convictions over the same four-year period is shown in Table 8. Results are even more pronounced than for accidents. The ““rarely/never” conviction rate is more than twice as large as the “always” conviction rate. Again, conviction histories become progres- sively worse as frequency of belt use decreases.
There are many other factors that are correlated both with driver belt use and with reported accident and conviction records. For example, the group re- porting ‘rarely” or “never” wearing seat belts had a higher proportion of young drivers and male drivers than did the other belt use categories. Young males also tend to have the highest reported accident and conviction rates. The association between age and sex and reported accidents and convictions may arise through differences in both basic driving be- havior and exposure. Thus, factoring out effects due to age and sex accounts, to some extent, for differ- ences in exposure. Therefore. it was of interest to

550 W. W. HUNTER et al.
Table 7. Prior accidents by current self-reported belt use
Current self-reported belt use
Always
Mostly/ sometimes
Karelyl never
Number of prior accidents Average
0 1 ? or more accidents (c/r) (c/r) (%) Total per driver
2082 343 x2 2507 .21 (83.1) (13.7) (3.3) 1102 234 SO I386 .25
(79.S) (16.9) (3.6) 466 104 76 596 .28
(7X.2) (17.5) (4.4)
X; &= 12.3: p = .OIh.
investigate the extent to which the differences in accident and conviction rates between the belt use groups could be accounted for by differences in the group demographic composition.
To this end higher dimensional tables were gen- erated, and categorical models were developed to examine the proportions of drivers having one or more accidents and one or more convictions as a function of belt use status and other factors. Since both the dependent and independent variables were discrete valued, categorical models of the type pre- sented by Grizzle, Starmer, and Koch (1969) were fit to the data. Separate models were developed us- ing both observed belt use and self-reported belt use. Models for the proportion having accidents con- tained significant effects for belt use (both observed and self-reported) in addition to effects due to driver age and sex.
Since conviction frequencies were higher than accident frequencies, it was possible in models for proportions of drivers with one or more convictions to include an additional factor along with age, sex, and seat belt use. In particufar, an exposure variable based on self-reported annual mileage was used. This variable was derived from a question on the mailback survey that asked for total yearly mileage in the form of eight mileage categories ranging from under 5,000 miles per year to more than 50,000 miles per year.
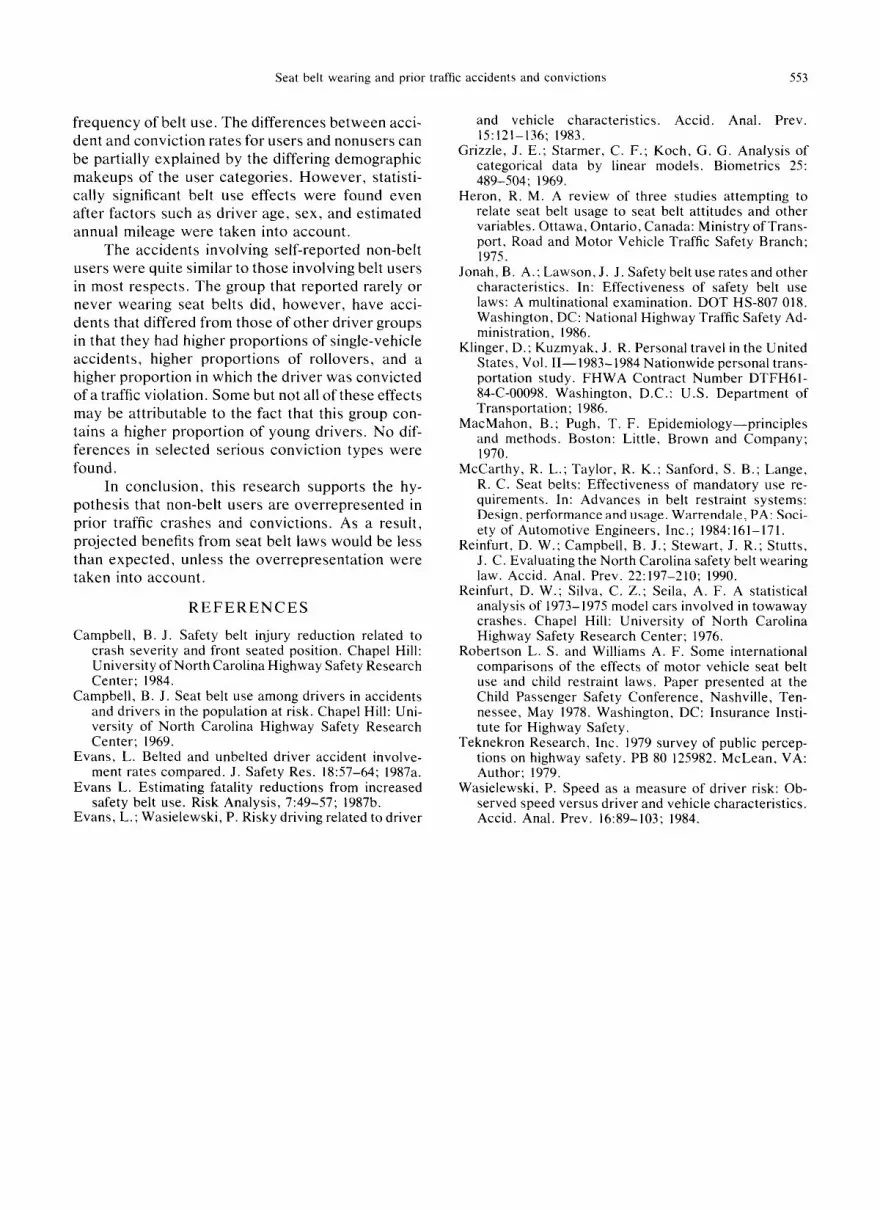
Sample size limitations dictated that no more than two or three categories of mileage could be included in the conviction rate analyses. Preliminary analysis indicated that splitting the annual mileage into two categories (520,000 miles and >20,000 miles) yielded a variable that was significantly corre- lated with convictions and provided adequate cell sizes when cross-classified with age, sex, and con- viction occurrence. Table 9 gives the analysis of variance table from a model containing the variables: (i) convictions (0, I or more) as the dependent vari- able with independent variables, (ii) age (25 or under. over 2S), (iii) sex (male, female), (iv) mileage (1 20,000, over 20,000), and (v) belt use (rarely/never, mostly/sometimes. always). Table 9 shows that ail factors and the age-by-sex interaction are highly sig- nificant, and the lack of significance of the residual x1 indicates that the model fits well to the data. The estimated within-cell probabilities of one or more convictions (anaiogous to cell means in ANOVA) are generally more informative than the basic param- eter estimates. These estimated probabilities are presented graphically in Fig. I, along with the actual values. The effects of belt use can be clearly seen within each subpopulation defined by combinations of the other variables. Similar results were obtained in a model that substituted observed belt USC for current self-reported belt use. These models show that drivers who do not wear seat belts tend to have
Table 8. Prior convictions by current self-reported belt use
Number of prior conviction5 Average
Current self-reported 0 I 2 3 or more convictions belt use (%) ( ‘;i ) (‘%) (%) Total per driver
AIWUYS 1977 (78.9)
MOdly: %I
wmetimes (70.X) Rurelyf 373
never (62.61
>c; & = 107.6: p = .ooo.
38X 87 55 2507 31 (15.5) (3.5) (2.2)
x9 XI 55 I386 .46
119.4) (5.X) (4.0) 124 is 44 59h .69
(20.X) (9.21 (7.4) ._-

Seat belt wearing and prior traffic accidems and convictions 551
Table 9. Analysis of variance table for categori- cal conviction rate model
Source
Intercept Age Sex Mileage Age*sex Belt use
Residual
I>F Chi-square Prob
I 1179.35 0.0001 I 95.21 0.000 I I 58.58 0.0001 I 56.47 0.0001 1 26.13 0.0001 2 38.21 0.0001
17 20.00 0.2744
worse driving records than those who do, even after demographic differences and annual mileage have been taken into account.
DIFFERENCES BETWEEN THE REPORTED ACCIDENTS AND
CONVICTIONS OF BELT USERS AND NONUSERS
The data file used to examine differences be- tween the accidents of self-reported belt users and non-belt users consisted of police records from the
&h
s2.5 M
225 M
52.5 F
<25 F
>2s M
>2S M
>25 F
>25 F
1,038 accidents involving mailback survey respon- dents in calendar years 1983-1986. Of these acci- dents,
526 involved “always” users, 346 involved “mostly/sometimes” users, and 166 involved ‘“rarely/never” users.
These numbers of actual crashes reflect the fact that the “‘always” users constituted 56% of the survey returns, while the L‘mostly/sometimes” and “rarely/never” users constituted 31% and 13%, re- spectively.
A series of contingency tables of current self- reported belt use by each of the following factors were examined:
1. Accident severity (no or minor injury vs. moderate to fatal injury).
2. Alcohol involvement (alcohol not a factor vs. alcohol a factor).
3. Speed of accident (O-29 mph, 30-49 mph, 50-79 mph).
Proportion Having One Conviction or More
Current Predicted Self-Reported
Annual Miles Belt Use
Never, Rarefy Sometimes, Mostly Always
< 2o,c#
;r 20,000
< 20,000
2 20,000
< 20,oW
2 20,ooo
< zo,c00
> 20,oW
Never, Rarely Sometimes, Mostly Always
Never, Rarely Sometimes, Mostly Always
Never, Rarely Sometimes, Mostly Always
Never, Rarely Someti~s, Mostly Always
Never, Rarely Sometimes, Mostly Always
Never, Rarely Sometimes, Mostly Always
Never, Rarely Sometimes, Mostly Always
& 27%
% 6%
Fig. 1. Predicted and actual proportions of groups with one conviction or more.

W. W. HUNTER et al
4.
5. 6.
7.
8.
9. 10.
II.
12.
Accident type (single vehicle. multiple ve- hicle). Light condition (daylight, other). Vehicle deformation based on pictorial TAD scale (minor, moderate, severe). Child in accident (child <13 years old, yes or no). Vehicle drivability (vehicle drivable from scene, not drivable). Rollover (vehicle rollover yes or no) Region of impact (front, right side, left side, rear, unspecified). Driver charged (driver charged with viola- tion yes or no). Driver injury (none or minor vs. moderate to fatal).
Using self-reported belt use, results showed that the accidents of belt users differed statistically from the accidents of non-belt users only with respect to single-vehicle accidents, rollover accidents, and ac- cidents in which the driver is charged with a viola- tion. In all three cases, self-reported non-belt users have higher percentages of the accident type. With respect to accident type the percentage of single vehicle crashes was
7% for “always” users, 10% for “mostly/sometimes” users, and 14% for “rarely/never” users.
The corresponding percentages for rollovers were
2% for “always” 2% for “mostly/sometimes,” and 7% for “rarely/never” users,
while the percentage of drivers charged was
20% for “always” 20%’ for “mostly/sometimes”, and 3 I% for “rarely/never” users.
The p-values associated with the x’ statistics for these three comparisons were .027, .Ol I, and ,006,
respectively. Given differences with respect to these three
variables it seems rather surprising that factors such as accident severity, vehicle deformation, and acci- dent speed did not also vary over the self-reported belt use categories, since single-vehicle and rollover accidents generally tend to be more severe. Such was not the case. Even so, the group reporting to “rarely” or “never” use seat belts seems to be in- volved in accidents that differ from those of the
rest of the North Carolina driving population with respect to the three factors discussed.
Similar analyses were carried out with observed belt use in place of self-reported belt use. None of the twelve factors differed significantly between the belted and not-belted populations.
As with numbers of accidents and convictions. the question naturally arises as to whether or not the differences discussed above could be explained solely in terms of differing group demographic com- position. To investigate this, categorical models, similar to those described in the previous section, were fit to the proportion of reported accidents in which the driver was charged with a violation which included the factors,
driver age (5 25 vs. over 25). driver sex, and belt use (“rarely/never” vs. all other).
Driver age and belt use were both significant with p-values of .OOOl and ,026, respectively. Driver sex was not significant (p = ,964).
During the same four-year period, the “always” belt users had 802 convictions, the “mostly/some- times” group had 634, while the “rarely/never” group had 412 (the numbers again reflecting the com- position of the sample). Contingency tables were analyzed to determine if nonusers had higher rates of serious convictions, namely, reckless driving and alcohol convictions. In three separate analyses in- volving reckless driving, alcohol convictions, and reckless and alcohol combined, no statistically sig- nificant relationships were found between self- reported belt use and these serious conviction types.
CONCLUSION
There are some limitations to this study. The response rate to the mailback survey was 5l%, much higher than the IO%-15% return initially predicted by outside consultants before pilot testing (pilot test- ing yielding 55%), but perhaps lower than some crit- ics would prefer. Additionally, as in any survey ef- fort like this, the results may reflect the returns of people who are favorably disposed to surveys.
These caveats notwithstanding, the findings were consistent for both observed and self-reported belt use.
To summarize the findings, drivers observed not wearing seat belts had significantly worse re- ported accident and conviction records than did drivers observed wearing seat belts. When self- reported belt use categories were used, driver re- cords became progressively worse with decreasing
Seat belt wearing and prior traffic accidents and convictions 553
frequency of belt use. The differences between acci- dent and conviction rates for users and nonusers can be partially explained by the differing demographic makeups of the user categories. However, statisti- cally significant belt use effects were found even after factors such as driver age, sex, and estimated annual mileage were taken into account.
The accidents involving self-reported non-belt users were quite similar to those involving belt users in most respects. The group that reported rarely or never wearing seat belts did, however, have acci- dents that differed from those of other driver groups in that they had higher proportions of single-vehicle accidents, higher proportions of rollovers, and a higher proportion in which the driver was convicted of a traffic violation. Some but not all of these effects may be attributable to the fact that this group con- tains a higher proportion of young drivers. No dif- ferences in selected serious conviction types were
found. In conclusion, this research supports the hy-
pothesis that non-belt users are overrepresented in prior traffic crashes and convictions. As a result, projected benefits from seat belt laws would be less than expected, unless the overrepresentation were taken into account.
REFERENCES
Campbell, B. J. Safety belt injury reduction related to crash severity and front seated position. Chapel Hill: University of North Carolina Highway Safety Research Center; 1984.
Campbell, B. J. Seat belt use among drivers in accidents and drivers in the population at risk. Chapel Hill: Uni- versity of North Carolina Highway Safety Research Center; 1969.
Evans, L. Belted and unbelted driver accident involve- ment rates compared. J. Safety Res. 18:_57-64; 1987a.
Evans L. Estimating fatality reductions from increased safety belt use. Risk Analysis, 7:49-57; 1987b.
Evans, L.; Wasielewski, P. Risky driving related to driver
and vehicle characteristics. Accid. Anal. Prev. 15:121-136; 1983.
Grizzle, J. E.; Starmer, C. F.; Koch, G. G. Analysis of categorical data by linear models. Biometrics 25: 489-504; 1969.
Heron, R. M. A review of three studies attempting to relate seat belt usage to seat belt attitudes and other variables. Ottawa. Ontario, Canada: Ministry of Trans- port, Road and Motor Vehicle Traffic Safety Branch; 1975.
Jonah, B. A.; Lawson, J. J. Safety belt use rates and other characteristics. In: Effectiveness of safety belt use laws: A multinational examination. DOT HS-807 018. Washington, DC: National Highway Traffic Safety Ad- ministration, 1986.
Klinger, D.; Kuzmyak. J. R. Personal travel in the United States, Vol. 11-1983-1984 Nationwide personal trans- portation study. FHWA Contract Number DTFH61- 84-C-00098. Washington, D.C.: U.S. Department of Transportation; 1986.
MacMahon, B.; Pugh. T. F. Epidemiology-principles and methods. Boston: Little, Brown and Company; 1970.
McCarthy, R. L.; Taylor, R. K.; Sanford, S. B.; Lange, R. C. Seat belts: Effectiveness of mandatory use re- quirements. In: Advances in belt restraint systems: Design, performance and usage. Warrendale, PA: Soci- ety of Automotive Engineers, Inc.; 1984:161-171.
Reinfurt, D. W.; Campbell, B. J.; Stewart, J. R.; Stutts, J. C. Evaluating the North Carolina safety belt wearing law. Accid. Anal. Prev. 22:197-210; 1990.
Reinfurt, D. W.; Silva, C. Z.; Seila, A. F. A statistical analysis of 1973-1975 model cars involved in towaway crashes. Chapel Hill: University of North Carolina Highway Safety Research Center; 1976.
Robertson L. S. and Williams A. F. Some international comparisons of the effects of motor vehicle seat belt use and child restraint laws. Paper presented at the Child Passenger Safety Conference. Nashville, Ten- nessee, May 1978. Washington, DC: Insurance Insti- tute for Highway Safety.
Teknekron Research, Inc. 1979 survey of public percep- tions on highway safety. PB 80 125982. McLean, VA: Author; 1979.
Wasielewski, P. Speed as a measure of driver risk: Ob- served speed versus driver and vehicle characteristics. Accid. Anal. Prev. 16:89-103; 1984.

554 W. W. HUNTER et al.
APPENDIX
Mailback Survey Form
UNC Seat Belt Survey
1 A N C law that tegar? oci 1985 req”!res dnvers and front seal passengers of motor vehldes lo wear seal bells. What ts your opinion of tits law7
01 strongly oppose 01 moderately oppose 01 rwls”re
Ck moderately support
0, strongly suppcfl
2 Before the law went into effect Ott 1985. how often did YOU wear YOM seat bell when drrvina?
01 “e”er
01 rarefy 01 sometimes 0 most of the time 0, always
3 Between 0cl 1985 and Jan 1987, there was no fine for not wearing a seat belt During thla “grace” period how often did you wear your seat bell when drrvmg?
cl new3r 01 rarely 01 sometimes 0 most of the bme
03 always
Q For those times L+M you do nol wear a seat belt. please check tie on 0 most important reason
01 Seal balls don’t prevent intunes.
01 Seat belLs are likely to cause mjurles 0 1 Seat belLs are unoomforlable. they don’l let me
move around m I’m afrad of bemg trapped m my car II 11 catches
on fire or goes under waler 0 D
I only wear seal bells on long hips or m bad weatier I’m a careful driver; I don’t need lo wear seal belts
0 I forget, I’m not in the habit.
0 Check hem dyou ahvap war a sear belt.
10. About how many total miles do you drrve 01 ride each year7
01 Less than 5,ooO miles 02 20,ooO 29.999 miles
01 5.000 9,999 miles q 0 30,OOO 39.999 miles 01 lO.ooO 14.999 mlkas 01 40,ooO 49,999 miles
ID 15,ooO - 19,999 ml!es 01 50,ooO or more miles
11 Out of 100 N C drovers. how many do you mmk are likely lo be I” an amdent in tie nexT 2 years?
drivers
4 Smca Jan. 1987 drivers not wearing seal belh may be fined $25 How often do you wear a seal belt now when driving?
q l never 01 rarely 09 sometimes 01 most of the bme Cl’ always
5. What is your opinon of the $25 fine?
01 There should not be a fine q t There should be a lower fine -@ $ _ 01 There should be a higher fine+ f _ 0 The $25 fine IS about rghl
6 Were you weaung your Seat belt at the bme this survey was given to you?
01 no 01 yes q 1 no belb m vehlde
7 How many total miles was the Inp you ware maklng at &e time ttus survey was given lo you?
0, Less than 5 m&6 q ~5-Om&s 01 IO- 1Qmlles 01 20.40 mllas Cl’ K) miles or more
I2 On a scale from 0 to 100. please tell us how likely you
lfxnk you are lo be in an accident in me nexT two years
(0 means fhaf you certa!nlj WI// not be ,” a” amdent and 1W that you m-tam/y IV;//.)
0 10 m 30 4 Y) 60 ?o a, 90 la,
00000000000 CerMnry Censnly 111 co! rll
13 How much control do you feel you have in preventing an acudent?
01 Almost total control 01 A lot of control 01 Moderate ConlrOl CE A little control 01 Very little control
14 If you could vole IcrJay, would you vote lo keep the N C seat ball law?
cl yes on0 D nor sure
15. What IS your hlghesl level of educabon~
8. For those bmes that you do wear a seat Ml. 04 grade s&00( 04 attended college
please check the one mast tmportanl rea.5~ 01 attended high school 0, graduated college
m To avoid IM $25 fine 0, graduated high school 00 post college degree
0: Because irs the law 01 To prevent injury if in an acddent
16 Your marital status?
D Because my friiflamily want me lo ID married 01 wldowed
01 Irs a habn. I don? think abour it. 0: separated o( dnforced 01 never marriid
q 1 Because of my own experienca in an aaldenl. D Because of saneone else’s expenenca in 17 Your date of birth?
an acddent. 0’ Check hem ilyou never wear a seat Mt. month------ day year
Please complete the lollowing. This part of tie survey will be your entry for the drawing and our way 01 r&tying you if you win. so please pnnt clearly We would also like lo contact a few of you later by telephone for a brief follow-up interview Those who are interviewed till have a chance to win an sddlllonal $500. If mlling lo be caflec,
be sure to grve us your telephone number and a best bme lo cafl.
Name ,FrP) WulbJW &-I Telephone Number: Home ( )
Address Work ( ) ,sJen M. P 0. ea. .!L4
eesl tin-m IO call: Preferred hours.
,c;~~“om, ,s*., I* bal Cl Mwning q Evening rJ (Lm. cl AnernWn q weekend - to - 0 p-m.
Thank youl
Fig. Al. University of North Carolina seat belt survey form.


