Embed Size (px)
Citation preview
Biomedical Human Kinetics, 13, 81–96, 2021DOI: 10.2478/bhk-2021-0011Original Paper
The effects of wearing high heeled shoes on the muscles and joints of lower limbSema Polat, Ayşe Gül Kabakcı
Department of Anatomy, Faculty of Medicine, Cukurova University, Adana, Turkey
Abstract
Study aim: The aim of this study is to investigate whether the lower extremity muscles’ force/torque/strength and range of mo-tion may be affected in females wearing high heeled shoes and not wearing high heeled shoes. Material and methods: The study was carried out with 136 females aged between 18 and 45 years. The first group consisted of 66 females wearing 5 cm or higher high heeled shoes. The second group consisted of 70 females wearing shoes having heel height less than 5 cm. The Nicholas Manual Muscle Tester was used to evaluate lower extremity muscle force/torque/strength, while range of motion was assessed with an electronic goniometer. The SPSS 21.0 program was used for statistical analysis.Results: A significant difference was found in the lower extremity muscles’ force (except for hip adduction, dorsiflexion, meta-tarsophalangeal joint and interphalangeal joint extension), and muscles’ torque (except for hip adduction, dorsiflexion and left tibialis anterior muscle) and muscles’ strength values (except for hip adduction, dorsiflexion and tibialis anterior muscle). Also, as heel height increased, the range of motion of hip joint flexion, internal rotation and plantar flexion increased significantly. Conclusions: Excessive use of high heeled shoes can cause changes in muscle force/torque/strength and joint range of motion.
Key words: High heeled shoes – Isometric muscle force – Torque – Strength
Introduction
The use of high heel shoes (HHS) increases day by day because today’s fashion supports the design and popular-ity of HHS. HHS are not only foot accessories, but also an important part of female fashion that represents personal-ity [6, 49]. It is reported that females wearing high heeled shoes feel more confident and psychologically strong. Also, HHS give great happiness to a person and provide selfrespect. They are preferred especially due to increas-ing beauty and are thought to be a source of authority [6, 7, 21, 31, 35, 39, 49]. However, high heeled shoes are often associated with pain in the plantar surface of the foot, dis-comfort, and muscle fatigue [7, 39, 44, 50]. As heel height increases, the plantarflexion range of motion (PFROM) in-creases. The Achilles tendon becomes shorter. The pressure is spread to especially the forefoot and knee. The center of gravity moves more and more forward. The lower part of the body leans forward and the upper part of the body leans backward. An impairment in the normal S-shaped curve of the spine develops [5, 7, 21, 28, 34, 44, 50]. Moreover, in-creased knee flexion is a response to compensate the reduced
dorsiflexion range of motion (DFROM) [17, 39, 44]. HHS lead to a smaller and unstable supporting surface and may change lower extremity musculoskeletal structure and re-duce shock absorbing ability and weight bearing function [18, 43]. Furthermore, the musculoskeletal system is more highly activated to reduce the stress and re-equilibrate against the biomechanical changes [43]. Also, the rectus femoris muscle (mRF) becomes more active to control the raised knee flexion, while the peroneus longus muscle (mPL) that stabilizes ankle joint activity and is a foot ever-tor works excessively. For this reason, when wearing HHS it is possible to control the foot supination with these muscles [39, 44]. When wearing HHS, calf muscles known as the gastrocnemius (mGC) and soleus muscles have a primary role, whereas the vastus lateralis (mVL) and tibialis anterior muscles (mTA) play a secondary role in maintaining bal-ance [5, 21, 28, 34, 39, 49]. HHS have an ill effect; on the other hand, these shoes have positive effects. For instance, they can be used in treatment of tendinitis and Achilles ten-don partial ruptures [32].
Muscle force is defined as the produced power against the resistance of a muscle or muscle group with maximal effort. Torque is the turning moment which comprises the
Author’s address Sema Polat, Department of Anatomy, Faculty of Medicine, Cukurova University, Adana, Turkey [email protected]
S. Polat, A.G. Kabakcı82
force applied multiplied by the lever arm. Lever arm is defined as the perpendicular distance from the axis rota-tion of this force. Also, torque is the product of the force applied times the distance between the force and the pivot point (usually a joint). Torque is often a more accurate indicator of total strength because it takes into account the length of the muscle being tested. On the other hand, strength can also be quantified as torque per kilogram bodyweight (N · m/kg). This value is obtained by dividing the torque by the person’s bodyweight in kg. Muscle force tests are performed to determine muscle power, stability and support ability [33, 42]. The most preferred tests are the isometric loading tests which cause less stress to the musculoskeletal system than eccentric loading [47]. Also, hip strength assessments provide screening in clinical ex-amination of hip, assessment of the lower extremity prob-lems and determination of hip muscles’ weakness [26, 47]. Moreover, these evaluations make it possible to determine objectively whether changes in muscle strength develop or not. The weakness of hip muscles leads to a decrease in balance and postural problems. Also, the hip abductors move the leg out to the side and thus play an important role in stabilizing the tilt of the pelvis. The weakness of these muscles limits the stride and alters gait, and causes abnormal walking. The gluteal muscles are one of the most affected by hip pathology [2, 30, 37, 47].
We aimed to evaluate the obtained data such as lower extremity muscle force, torque, strength and joint range of motion which may be affected because of using high heeled shoes.
Material and methods
A. Subjects and study designThe study group consisted of 136 participants aged be-
tween 18 and 45 years. The participants were divided two groups. The first group consisted of 66 females wearing 5 cm or higher high heeled shoes, at least 5 hours a day, three days a week and at least one year. The second group consisted of 70 females wearing shoes having heel height less than 5 cm at least one year. The study was conducted during two years. All subjects signed an informed con-sent form. The study protocol was approved by the Ethics Committee of Cukurova University (Approval date and number: February 14, 2014; 28/11) [38].
Inclusion criteria:(1) Absence of any history of trauma or fracture and pre-
vious surgery on lower extremity.(2) Absence of congenital anomalies, systemic diseases,
neuromuscular and musculoskeletal disorder. (3) Participants attended information and voluntary parti-
cipation meeting.(4) Subjects do not exercise or are sedentary.
Exclusion criteria:(1) Participants who cannot complete the test. (2) Participants with obesity [38].
B. Protocol of muscle strength methodsThe Nicholas Manual Muscle Tester (NMMT- model
01165, SI Instruments, USA), which is a kind of hand-held dynamometer (HHD), is a reliable, valid, portable and cost-effective assessment method for leg muscles lo-cated at the hip and knee [2]. Also, the NMMT provides isometric strength assessment and is easy and practical to use, just like HHD. There are many studies related to reli-ability and validity of the NMMT [2–4, 8, 20, 26]. The reliability validity (ICC) was for dorsal and plantar flexion 0.72 and 0.86, respectively, in this study. Length meas-urements were taken from the anterosuperior iliac spine (ASIS) to the medial malleolus (MM) and from the ASIS to the condylus medialis (medial knee joint) before taking the muscle force measurement. The length measurements were used to determine the torque and strength values. The NMMT attachment was placed on the skin 5 cm from the reference point. While the moment arm was from the ASIS to the malleolus medialis (MM) for the long arm lever, the moment arm was calculated from the condylus medialis to the MM and from the ASIS to the condylus medialis for the short arm lever [26]. Torque and strength values were determined with the following formula [26, 42]:
Formula calculationStrength was calculated by dividing torque by weight
(N · m/kg) [42]. Muscle force test measurements were performed ac-
cording to manual muscle test instructions. The NMMT was used as follows [33, 42, 48]:
Hip flexion muscle test: Movement is executed with three muscles: the psoas major, psoas minor and iliacus. The subject sits in an upright position with legs hanging down from the examination table. While hip flexion move-ment is performed actively (approximately 45 degrees) without the subject getting strength from the two sides with the hands, the practitioner with the NMMT instru-ment arranged just above the knee joint applies resistance to the knee joint downward [33, 42, 48].
Hip extension muscle test: Movement is executed by semitendinosus, semimembranosus, biceps femoris caput longum and gluteus maximus muscles. The subject lies down in a prone position, the pelvis is stabilized by the practitioner and the subject brings his/her leg to the hyperextension position actively without bending his/her knee. Resistance is applied to the knee joint downward by the practitioner with the NMMT instrument, which is ar-ranged just above the knee joint [33, 42, 48].
Gluteus maximus muscle test (hip extension knee flexed): The subject lies down in a prone position, the
High heeled shoes 83
pelvis is stabilized by the practitioner and the subject brings his/her leg to the hyperextension position actively while bending his/her knee 90 degrees. The NMMT in-strument is arranged just above the knee joint and resist-ance is applied to the knee joint downward [33].
Hip abduction muscle test: Movement is executed by the gluteus medius fundamentally. The subject is lying on the side with the test leg up and the non-test side is the bottom leg. The practitioner stabilizes with one hand at the hip, standing behind the subject. When the subject active-ly lifts (abducts) his/her hip against downward resistance, the other hand holding the NMMT instrument is arranged just above the knee joint and resistance/force is applied to the knee joint downward and subjects exert resistance against the NMMT [33,42,48].
Hip adduction muscle test: Movement is performed by the adductor magnus, adductor brevis, adductor lon-gus, pectineus and gracilis. The subject is lying on the side with the test leg lowermost and resting on the table the non-test leg abducted to 25 degrees and supported by the practitioner. When the subject actively lifts (adducts) his/her hip, resistance is applied with the NMMT instrument, which is arranged to the thigh medial surface in the direc-tion opposite to adduction downward [33, 42, 48].
Hip external rotation muscle test: Movement is ex-erted by the obturator externus, obturator internus, quad-ratus femoris, piriformis, gemellus superior and gemellus inferior. The subject is short sitting. The practitioner sits on the kneels beside the subject and places one hand at the lateral aspect of the distal thigh to stabilize and applies re-sistance with the NMMT which is placed at the medial an-kle just above the malleolus in a medial direction while the subject is actively externally rotating at the hip [33, 48].
Hip internal rotation muscle test: Movement is per-formed with the gluteus minimus and tensor fasciae latae muscles. The subjects is short sitting. The practitioner sits on a stool or kneels beside the subject and places one hand at the medial aspect of the distal thigh and applies resist-ance with the NMMT which is placed at the lateral ankle just above the malleolus in a lateral direction while the subjects is actively internally rotating at the hip [33,48].
Hip abduction flexed muscle test (tensor fasciae latae muscle): Movement is exerted with the tensor fas-ciae latae muscle. The subject is lying on the side with the test leg uppermost, and hip flexed to 45 degrees. The prac-titioner stands behind the subject and stabilizes with one hand at the hip (at the greater trochanter). The other hand with the NMMT applies resistance across the lateral sur-face of the knee while the subject abducts the hip against downward resistance [33].
Knee flexion muscle test: The muscle test is per-formed by three different methods:
The subject is prone with legs straight and toes hang-ing over the edge of the table. The practitioner stands next
to the test leg and places one hand on the posterior thigh and the NMMT which is placed at just above the ankle applies resistance in a downward direction as the patient actively flexes the knee. This method evaluates all knee flexor muscles including the semitendinosus, semimem-branosus and biceps femoris [33, 48].
Semitendinosus and semimembranosus muscle test: The subject is prone with knee flexed to less than 90 de-grees and the leg in external rotation. The practitioner sta-bilizes the thigh with one hand and applies downward and outward resistance at the ankle with the NMMT, while the subject flexes the knee, maintaining the leg in internal ro-tation [33, 48].
Biceps femoris muscle test: The subject is prone with the knee flexed to less than 90 degrees and the leg in inter-nal rotation. The practitioner stabilizes the thigh with one hand and applies downward and inward resistance at the ankle with the NMMT, while the subject flexes the knee, maintaining the leg in external rotation [33, 48].
Knee extension muscle test: Movement is done by the quadriceps femoris muscle. The subject is short sit-ting. Place a rolled tower under the distal thigh. The prac-titioner stands at the side of the leg being tested. The hand applying resistance with the NMMT is contoured over the anterior surface of the distal leg just above the ankle and resistance is applied in a downward direction as the pa-tient actively extends the knee [33, 48].
Plantar flexion muscle test: The gastrocnemius and soleus work to move and two different tests are applied.
For gastrocnemius muscle test: The subject is in a su-pine position with the ankle in a neutral position. While the subject actively moves the foot in plantar flexion and inward, resistance with the NMMT is directed toward dor-siflexion [33].
For soleus muscle test: The position is nearly the same as in the gastrocnemius muscle test, but the knee is placed in a flexed position. Evaluation is made in the same way [33].
Inversion with dorsiflexion: Movement is exerted by the tibialis anterior muscle. The subject is in a supine po-sition. The practitioner sits on a stool in front of the sub-ject with the subject’s heel resting on the thigh. One hand stabilizes the posterior leg just above the malleolus while the other hand with the NMMT provides resistance over the dorsomedial aspect of the foot. The subject actively dorsiflexes the ankle and inverts the foot, keeping the toes relaxed [33, 48].
Inversion with plantar flexion: Movement is exerted by the tibialis posterior. The subject is short sitting with the ankle in a neutral position. The practitioner is sitting on a stool in front of the subject. One hand stabilizes the ankle just above the malleoli while the other hand with the NMMT applies resistance around the dorsum and lat-eral border of the forefoot. Resistance is directed toward
S. Polat, A.G. Kabakcı84
eversion and slight dorsiflexion while the subject actively turns the foot down and inward [33, 48].
Eversion muscle test: Movement is performed with the fibularis longus and fibularis brevis. The subject is short sitting with the ankle in slight plantar flexion. The practitioner sits in front of test limb and uses one hand to stabilize the ankle just above the malleoli. The other hand with the NMMT applies resistance by contouring over the dorsum and medial side of the foot at the level of the metatarsal heads. Resistance is directed toward inversion and slight dorsiflexion while the subject actively everts the foot [33, 48].
Great toe metatarsophalangeal flexion muscle test: The subject is short sitting with legs hanging over the edge of the table. The ankle is in a neutral position. The exam-iner is seated on a stool in front of the patient. The test foot rests on the examiner’s table. The examiner stabilizes the dorsum of the foot just below the ankle with one hand, and uses the NMMT with the other hand to resist beneath the proximal phalanx of the great toe. Then the subject ac-tively flexes the great toe [33, 48].
Great toe metatarsophalangeal flexion muscle test: The subject is short sitting with legs hanging over the edge of the table. The ankle is in a neutral position. The exam-iner is seated on a stool in front of the subject. The test foot rests on the examiner’s table. The practitioner stabi-lizes the dorsum of the foot just below the ankle with one hand, and using the NMMT applies resistance to the distal phalanx of the great toe while the subject actively flexes the great toe at the IP joint [33, 48].
Great toe metatarsophalangeal flexion and inter-phalangeal extension muscle test Position and evalua-tion are the same as in the great toe metatarsophalangeal and interphalangeal flexion muscle test, but the resistance is used with the NMMT, which is placed thumb over the MP and IP is applied respectively, while the subject ac-tively extends the MP and IP joint respectively [33, 48].
Baseline Digital Absolute with Axis Goniometer and Baseline Stainless Steel Goniometer 180° and Baseline Stainless Steel Phalanx Goniometer were used to evalu-ate the hip joint (flexion, extension, abduction, adduction, internal rotation, external rotation), knee joint (flexion, ex-tension), ankle joint (plantar flexion, dorsiflexion, inver-sion, eversion) and first metatarsophalangeal and the first interphalangeal joints of foot. American Academy of Or-thopaedic Surgeons (AAOS) directives and active range of motion were used [33].
C. Statistical analysisThe SPSS 21.0 program was used for statistical analy-
sis. From these measurements, means, standard deviations and minimum and maximum values were evaluated. The Kolmogorov-Smirnov test was applied to determine the normal distribution of variables. If it is significant at the p < 0.05 level, its hypothesis is rejected and the distribu-tion is considered not to be normal and for this reason the Mann-Whitney U test from non-parametric tests was cho-sen. However, if it is significant at the p > 0.05 level, its hypothesis is accepted and the distribution is considered to be normal. For this reason, the parametric test ANOVA was preferred. Some parameters did not demonstrate nor-mal distribution. Moreover, the chi square test and Spear-man’s rank correlation analysis were used. In addition, the results were assessed at a 95% confidence interval, with a significance of p < 0.05. Also, p < 0.05 was accepted as significant according to the Sig (2-tailed) score in Spear-man’s rank correlation analysis.
Results
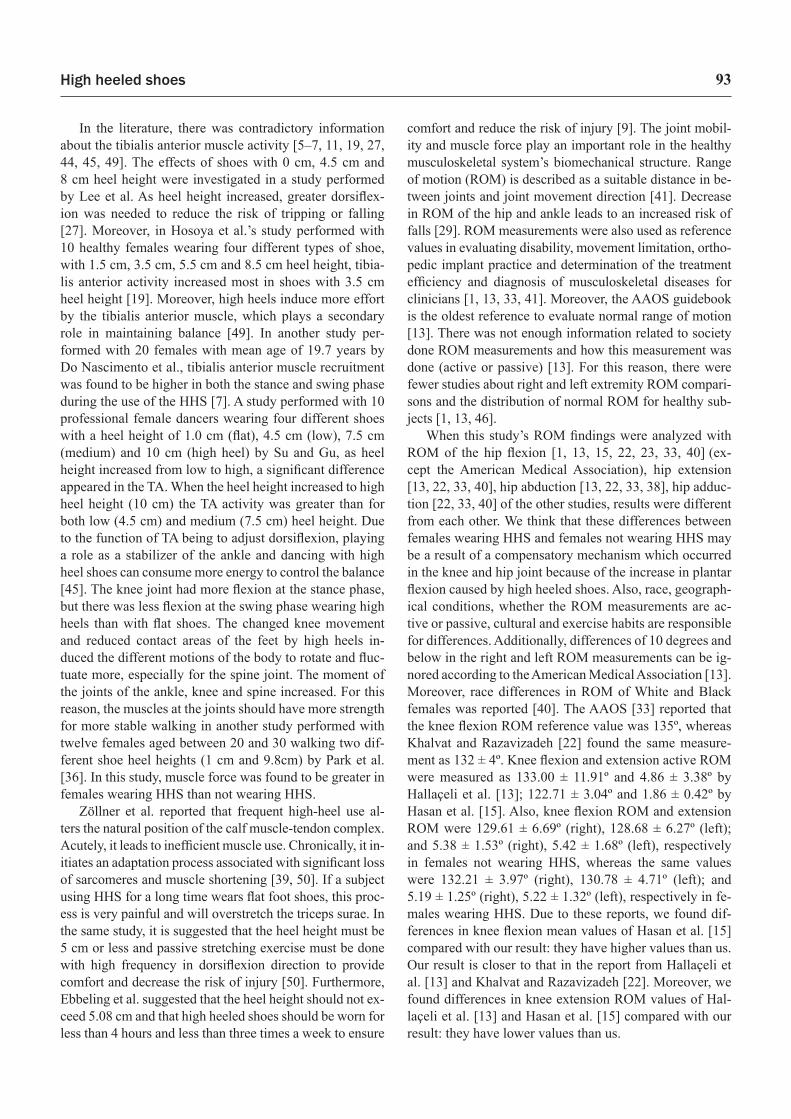
The records of 136 females (70 females not wearing high heeled shoes [FNWHHS], 66 females wearing high heeled shoes [FWHHS] were assessed. The mean ages of FWHHS
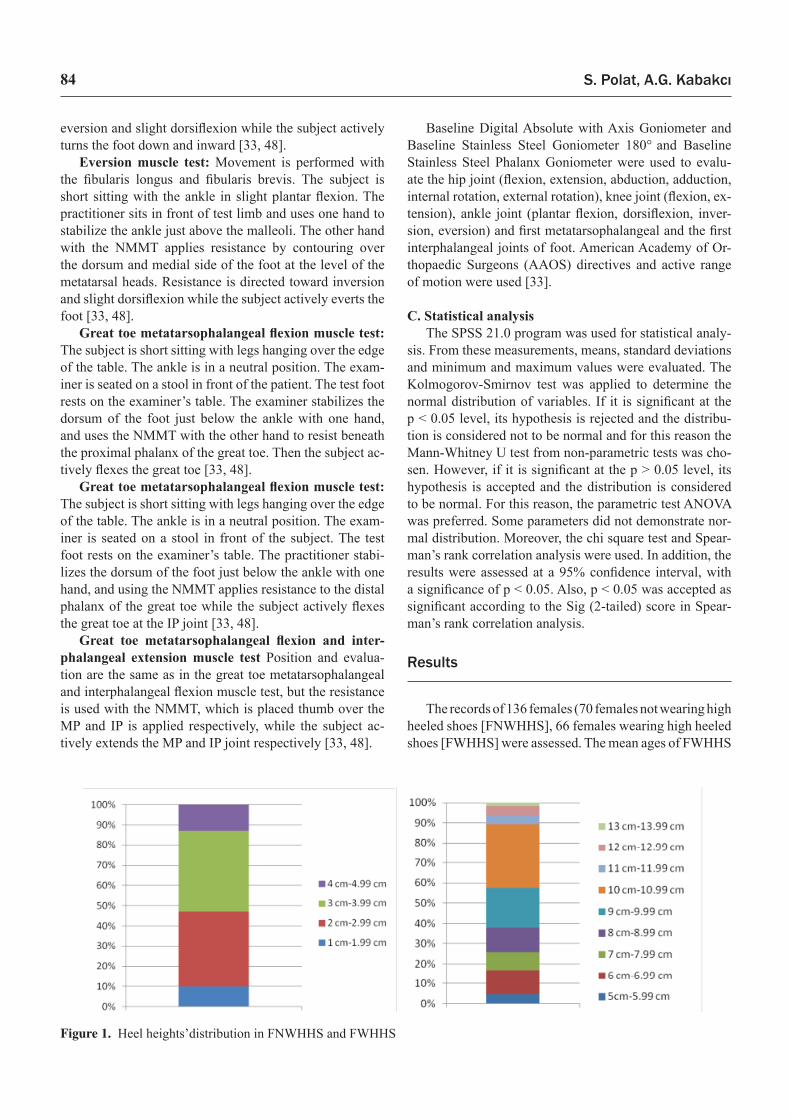
Figure 1. Heel heights’distribution in FNWHHS and FWHHS
High heeled shoes 85
and FNWHHS were 33.41 ± 7.02 years (range 18–45 years) and 30.50 ± 6.74 years (range 19–45 years) respectively. The mean height, weight and BMI values of FWHHS and FNWHHS were 163.06 ± 6.41 cm, 58.51 ± 7.65 kg, and 22.18 ± 3.04 kg/m2, and 163.63 ± 5.60 cm, 58.29 ± 6.52 kg and 21.80 ± 2.25 kg/m2, respectively. Moreover, heel heights’ distributions were as follows:
1–1.99 cm, 7 subjects (10%); 2–2.99 cm, 26 subjects (34.14%); 3–3.99 cm, 28 subjects (40%); 4–4.99 cm, 9 subjects (12.86%); 5–5.99 cm, 3 subjects (4.55%); 6–6.99 cm, 8 subjects (12.12%); 7–7.99 cm, 6 subjects (9.10%); 8–8.99 cm, 8 subjects (12.12%); 9–9.99 cm, 13 subjects (19.70%); 10–10.99 cm, 21 subjects (31.82%); 11–11.99 cm, 3 subjects (4.55%); 12–12.99 cm, 3 subjects (4.55%) and 13 cm, 1 subject (1.52%).
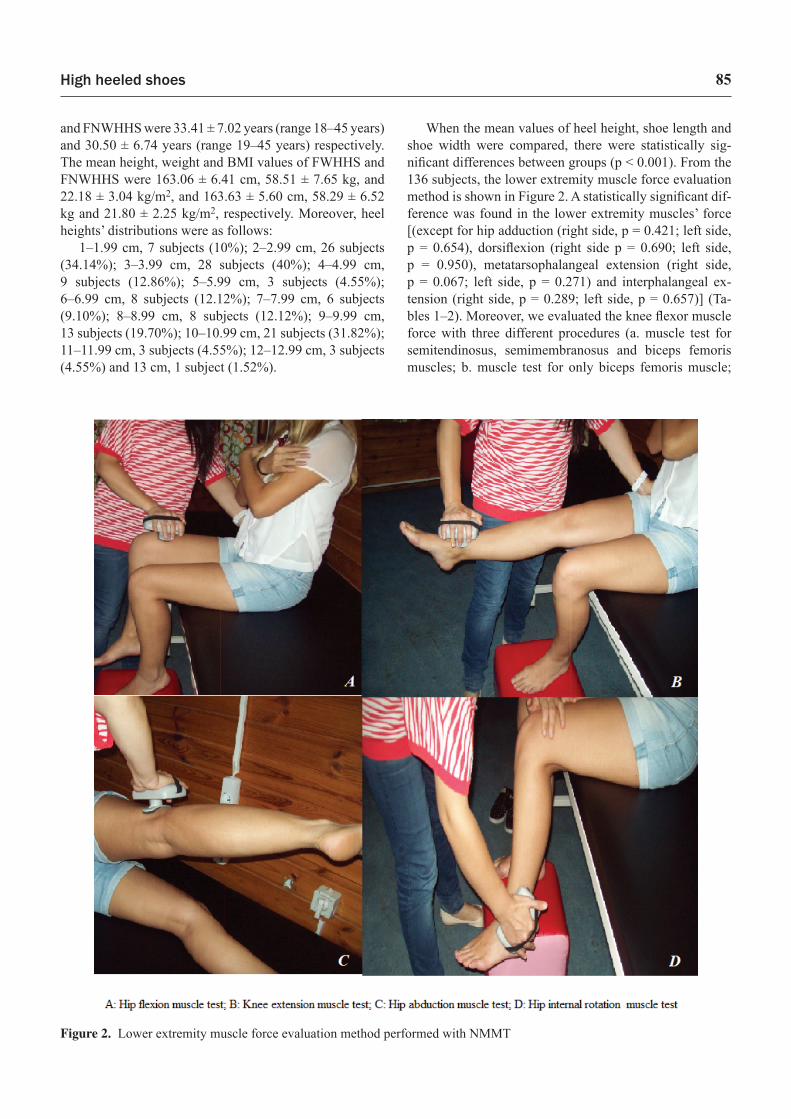
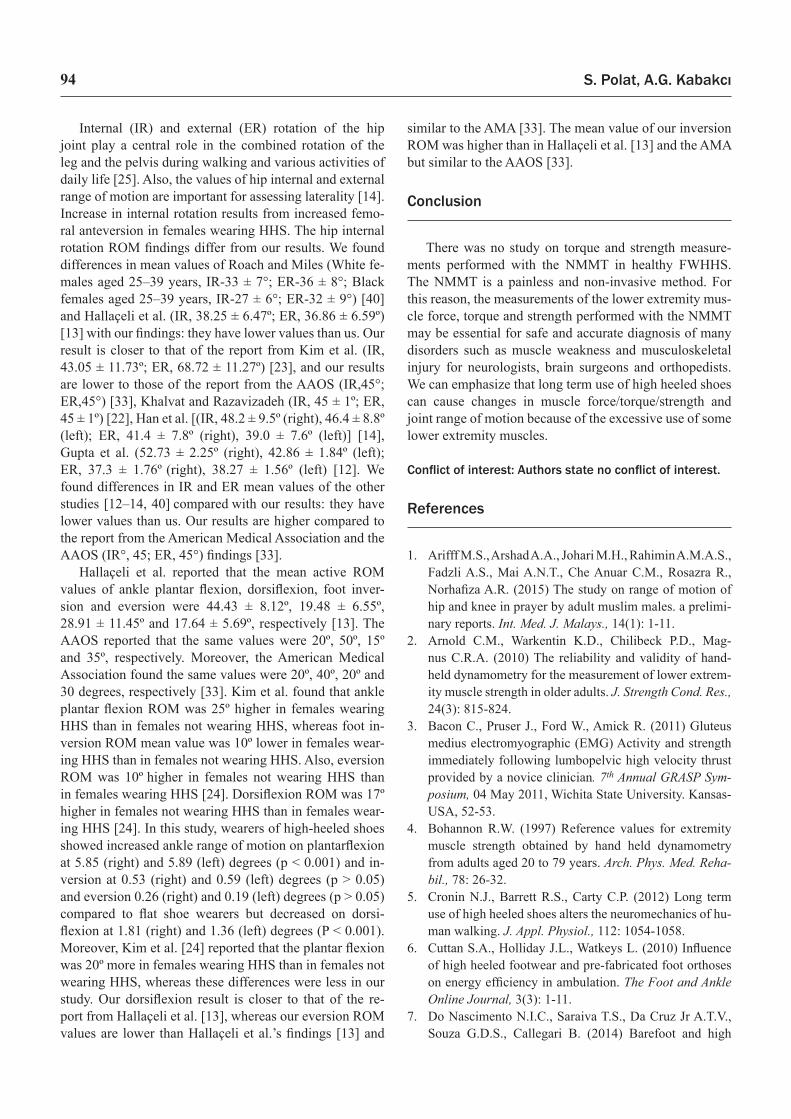
When the mean values of heel height, shoe length and shoe width were compared, there were statistically sig-nificant differences between groups (p < 0.001). From the 136 subjects, the lower extremity muscle force evaluation method is shown in Figure 2. A statistically significant dif-ference was found in the lower extremity muscles’ force [(except for hip adduction (right side, p = 0.421; left side, p = 0.654), dorsiflexion (right side p = 0.690; left side, p = 0.950), metatarsophalangeal extension (right side, p = 0.067; left side, p = 0.271) and interphalangeal ex-tension (right side, p = 0.289; left side, p = 0.657)] (Ta-bles 1–2). Moreover, we evaluated the knee flexor muscle force with three different procedures (a. muscle test for semitendinosus, semimembranosus and biceps femoris muscles; b. muscle test for only biceps femoris muscle;
Figure 2. Lower extremity muscle force evaluation method performed with NMMT
S. Polat, A.G. Kabakcı86
and c. muscle test for semitendinosus and semimembrano-sus muscles). Knee flexion measurement results performed with three different methods were higher in FWHHS than in FNWHHS (Table 1), whereas the dorsiflexion and inter-phalangeal extension muscle force was lower in FWHHS than in FNWHHS (Table 2). When we analyzed lower ex-tremity muscle torque results, there were statistically sig-nificant differences between the two groups [(except for hip adduction (right side, p = 0.417; left side, p = 0.263), ankle dorsiflexion (right side, p = 0.212; left side, p = 0.051) and left tibialis anterior muscle (p = 0.375)] (Table 3).
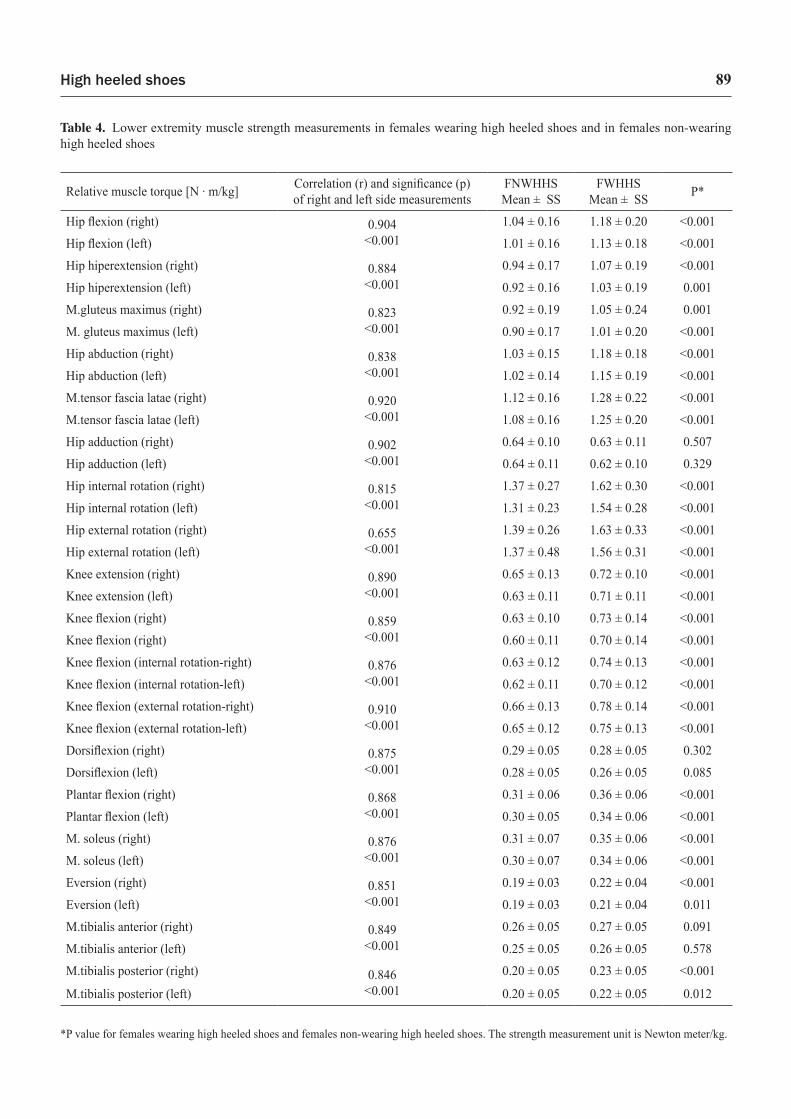
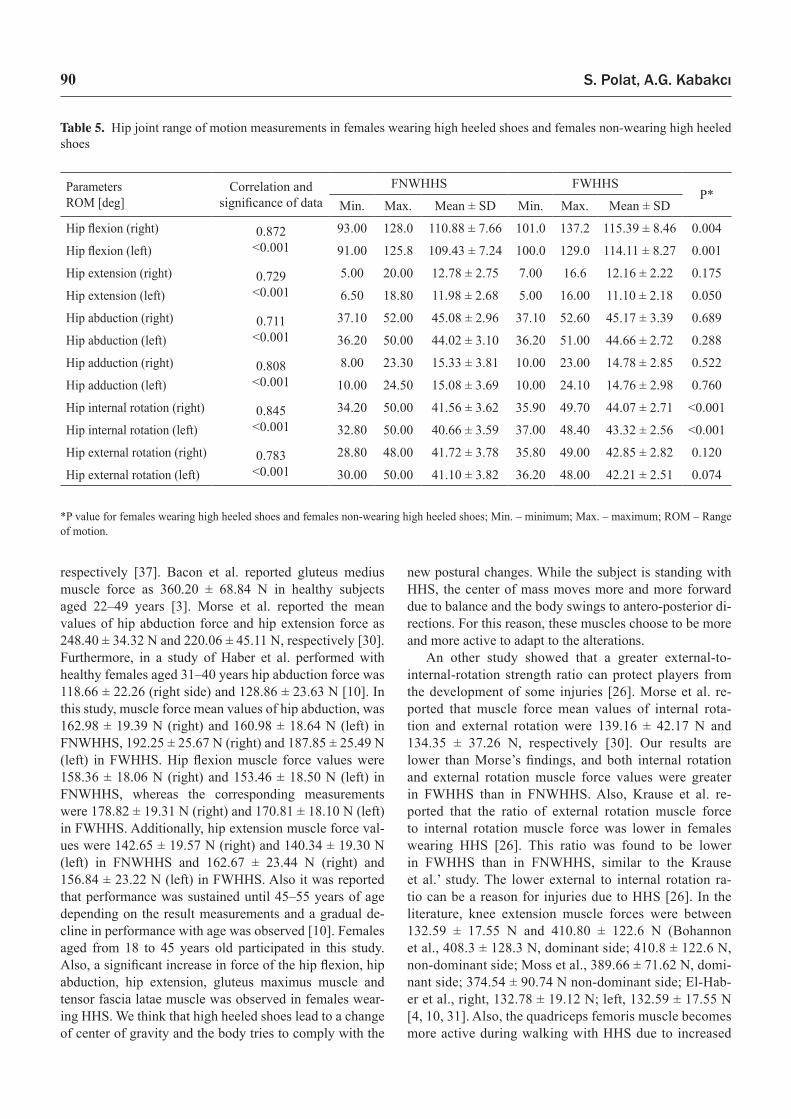
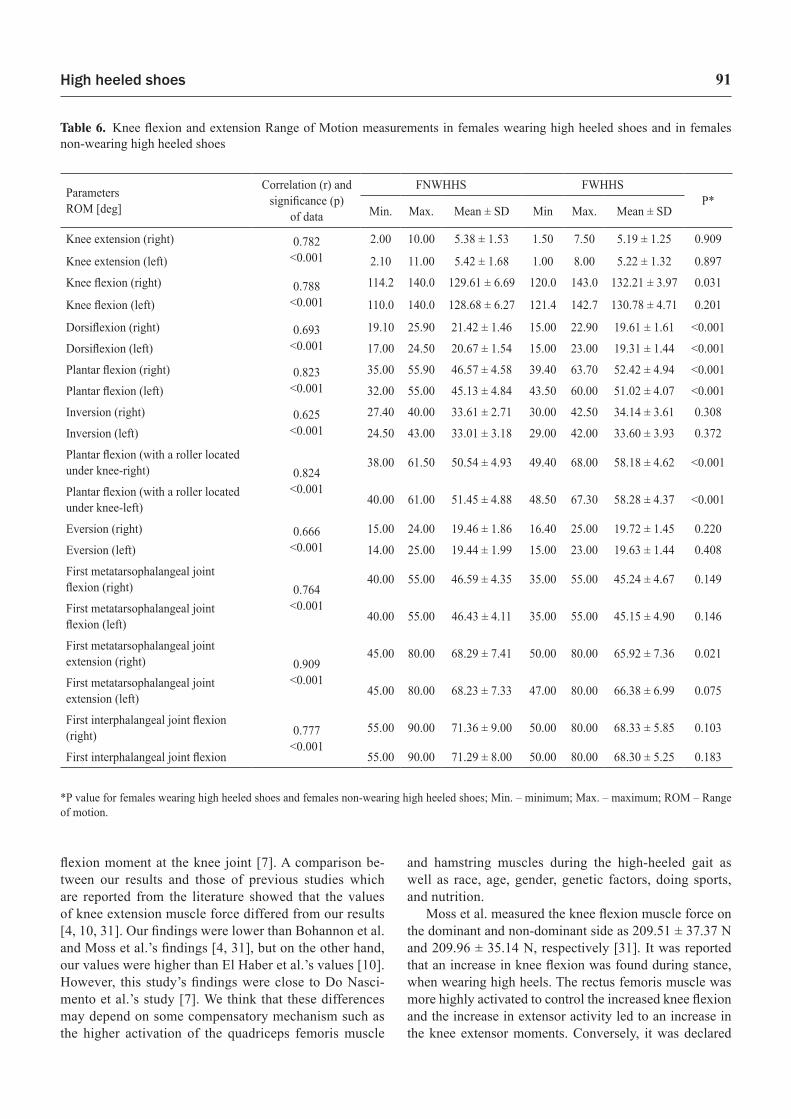
Lower extremity muscle strength was calculated by di-viding torque by the weight (torque/weight). Statistically significant differences was found in lower extremity muscle strength values between FWHHS and FNWHHS [(except for hip adduction right side, p = 0.507; left side, p = 0.329; dorsiflexion right side, p = 0.302; left side, p = 0.085); tibialis anterior muscle (right side, p = 0.091; left side, p = 0.578 )] (Table 4). The range of lower extremity joint motion is shown in Tables 5–6. There were significantly differences in some parameters, especially hip internal rotation ROM (p < 0.001), hip flexion (p < 0.01), dorsi-
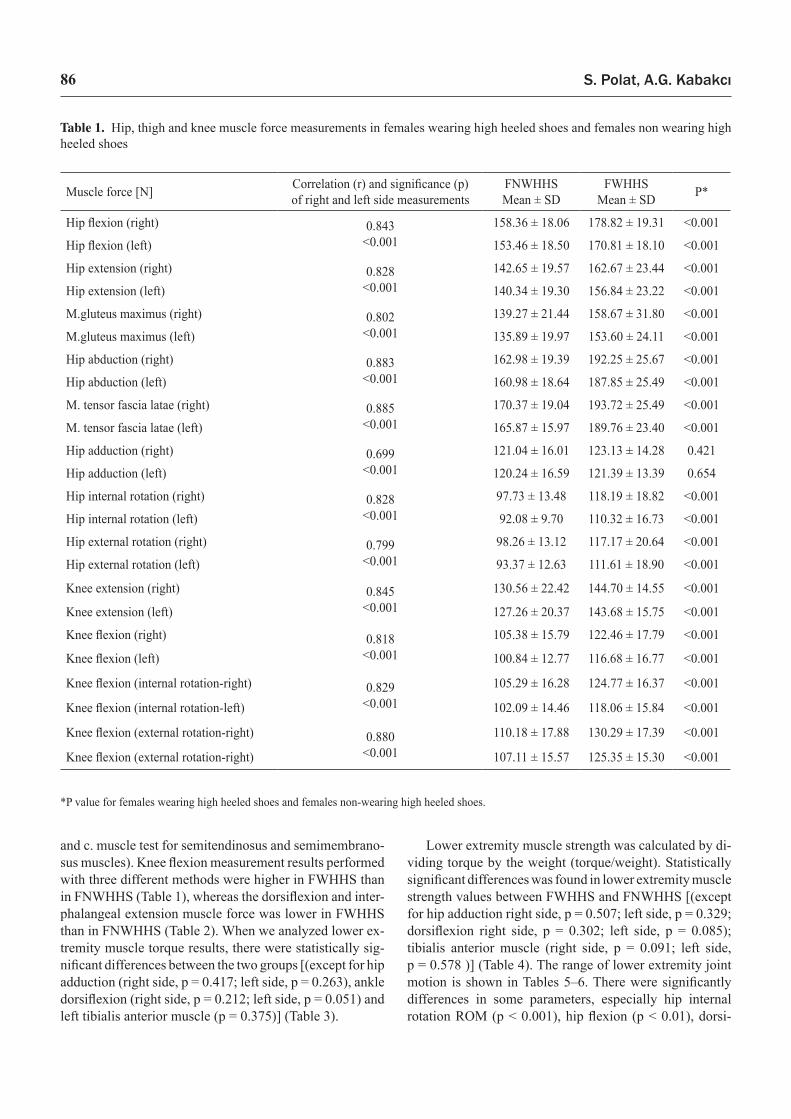
Table 1. Hip, thigh and knee muscle force measurements in females wearing high heeled shoes and females non wearing high heeled shoes
*P value for females wearing high heeled shoes and females non-wearing high heeled shoes.
Muscle force [N] Correlation (r) and significance (p) of right and left side measurements
FNWHHS Mean ± SD
FWHHSMean ± SD P*
Hip flexion (right) 0.843<0.001
158.36 ± 18.06 178.82 ± 19.31 <0.001
Hip flexion (left) 153.46 ± 18.50 170.81 ± 18.10 <0.001
Hip extension (right) 0.828<0.001
142.65 ± 19.57 162.67 ± 23.44 <0.001
Hip extension (left) 140.34 ± 19.30 156.84 ± 23.22 <0.001
M.gluteus maximus (right) 0.802<0.001
139.27 ± 21.44 158.67 ± 31.80 <0.001
M.gluteus maximus (left) 135.89 ± 19.97 153.60 ± 24.11 <0.001
Hip abduction (right) 0.883<0.001
162.98 ± 19.39 192.25 ± 25.67 <0.001
Hip abduction (left) 160.98 ± 18.64 187.85 ± 25.49 <0.001
M. tensor fascia latae (right) 0.885<0.001
170.37 ± 19.04 193.72 ± 25.49 <0.001
M. tensor fascia latae (left) 165.87 ± 15.97 189.76 ± 23.40 <0.001
Hip adduction (right) 0.699<0.001
121.04 ± 16.01 123.13 ± 14.28 0.421
Hip adduction (left) 120.24 ± 16.59 121.39 ± 13.39 0.654
Hip internal rotation (right) 0.828<0.001
97.73 ± 13.48 118.19 ± 18.82 <0.001
Hip internal rotation (left) 92.08 ± 9.70 110.32 ± 16.73 <0.001
Hip external rotation (right) 0.799<0.001
98.26 ± 13.12 117.17 ± 20.64 <0.001
Hip external rotation (left) 93.37 ± 12.63 111.61 ± 18.90 <0.001
Knee extension (right) 0.845<0.001
130.56 ± 22.42 144.70 ± 14.55 <0.001
Knee extension (left) 127.26 ± 20.37 143.68 ± 15.75 <0.001
Knee flexion (right) 0.818<0.001
105.38 ± 15.79 122.46 ± 17.79 <0.001
Knee flexion (left) 100.84 ± 12.77 116.68 ± 16.77 <0.001
Knee flexion (internal rotation-right) 0.829<0.001
105.29 ± 16.28 124.77 ± 16.37 <0.001
Knee flexion (internal rotation-left) 102.09 ± 14.46 118.06 ± 15.84 <0.001
Knee flexion (external rotation-right) 0.880<0.001
110.18 ± 17.88 130.29 ± 17.39 <0.001
Knee flexion (external rotation-right) 107.11 ± 15.57 125.35 ± 15.30 <0.001
High heeled shoes 87
flexion (p < 0.001), plantar flexion (p < 0.001) and plantar flexion with a roller located under the knee (p < 0.001).
Discussion
An increase in heel height was associated with de-crease in an individual’s balance including worsened pos-tural balance, limits of stability in terms of excursions and directional control, and functional mobility [49]. Also, during the use of high-heeled shoes, postural adaptation
such as exaggerated plantar flexion develops, increase in knee flexor moment, and displacement of the center of gravity [7]. In a study performed with females aged be-tween 30 and 39 years by Bohannon et al., it was reported that the mean values of hip abduction force and hip flexion force were 212.3 ± 58.9 N, 119.0 ± 38.3 N in the domi-nant extremity, whereas in the non-dominant extremity the same measurements were established as 211.1 ± 54.6 N and 115.5 ± 36.5 N, respectively [4]. Moreover, in a study of Pasco et al. performed with females aged 44–70 years the same parameters were 134 ± 51 N and 163 ± 53 N,
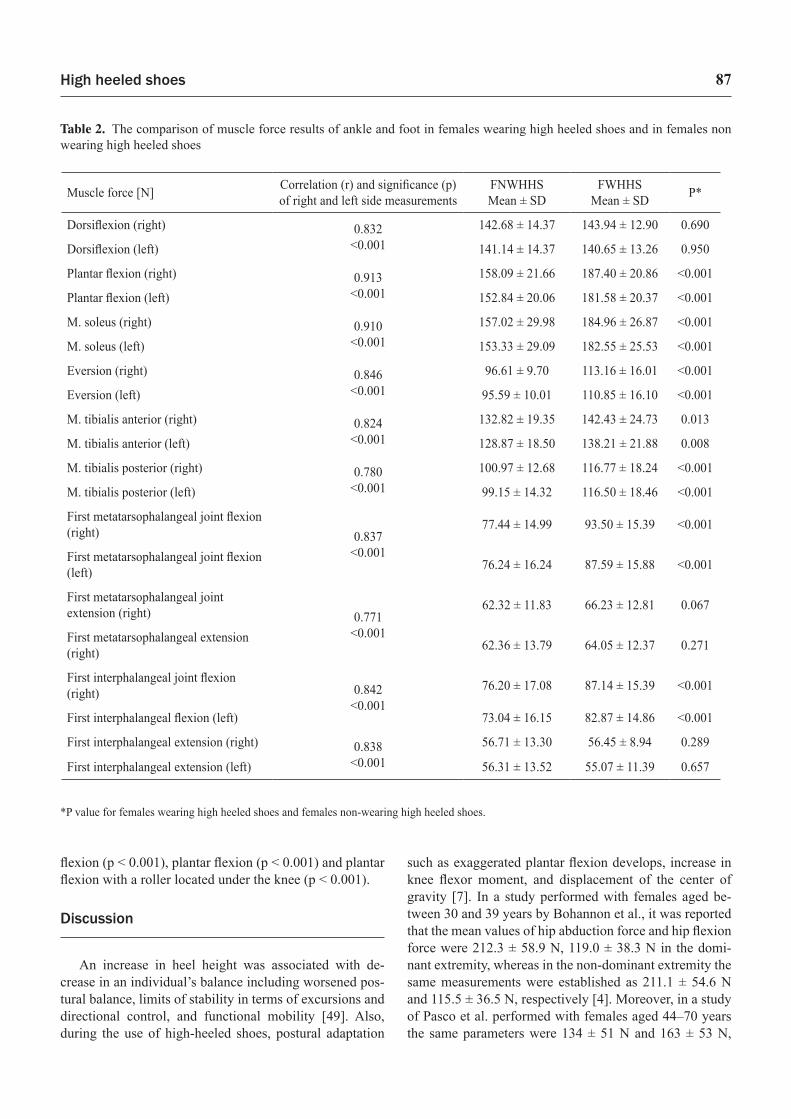
Table 2. The comparison of muscle force results of ankle and foot in females wearing high heeled shoes and in females non wearing high heeled shoes
*P value for females wearing high heeled shoes and females non-wearing high heeled shoes.
Muscle force [N] Correlation (r) and significance (p) of right and left side measurements
FNWHHSMean ± SD
FWHHSMean ± SD P*
Dorsiflexion (right) 0.832<0.001
142.68 ± 14.37 143.94 ± 12.90 0.690
Dorsiflexion (left) 141.14 ± 14.37 140.65 ± 13.26 0.950
Plantar flexion (right) 0.913<0.001
158.09 ± 21.66 187.40 ± 20.86 <0.001
Plantar flexion (left) 152.84 ± 20.06 181.58 ± 20.37 <0.001
M. soleus (right) 0.910<0.001
157.02 ± 29.98 184.96 ± 26.87 <0.001
M. soleus (left) 153.33 ± 29.09 182.55 ± 25.53 <0.001
Eversion (right) 0.846<0.001
96.61 ± 9.70 113.16 ± 16.01 <0.001
Eversion (left) 95.59 ± 10.01 110.85 ± 16.10 <0.001
M. tibialis anterior (right) 0.824<0.001
132.82 ± 19.35 142.43 ± 24.73 0.013
M. tibialis anterior (left) 128.87 ± 18.50 138.21 ± 21.88 0.008
M. tibialis posterior (right) 0.780<0.001
100.97 ± 12.68 116.77 ± 18.24 <0.001
M. tibialis posterior (left) 99.15 ± 14.32 116.50 ± 18.46 <0.001
First metatarsophalangeal joint flexion (right) 0.837
<0.001
77.44 ± 14.99 93.50 ± 15.39 <0.001
First metatarsophalangeal joint flexion (left) 76.24 ± 16.24 87.59 ± 15.88 <0.001
First metatarsophalangeal joint extension (right) 0.771
<0.001
62.32 ± 11.83 66.23 ± 12.81 0.067
First metatarsophalangeal extension (right) 62.36 ± 13.79 64.05 ± 12.37 0.271
First interphalangeal joint flexion (right) 0.842
<0.00176.20 ± 17.08 87.14 ± 15.39 <0.001
First interphalangeal flexion (left) 73.04 ± 16.15 82.87 ± 14.86 <0.001
First interphalangeal extension (right) 0.838<0.001
56.71 ± 13.30 56.45 ± 8.94 0.289
First interphalangeal extension (left) 56.31 ± 13.52 55.07 ± 11.39 0.657
S. Polat, A.G. Kabakcı88
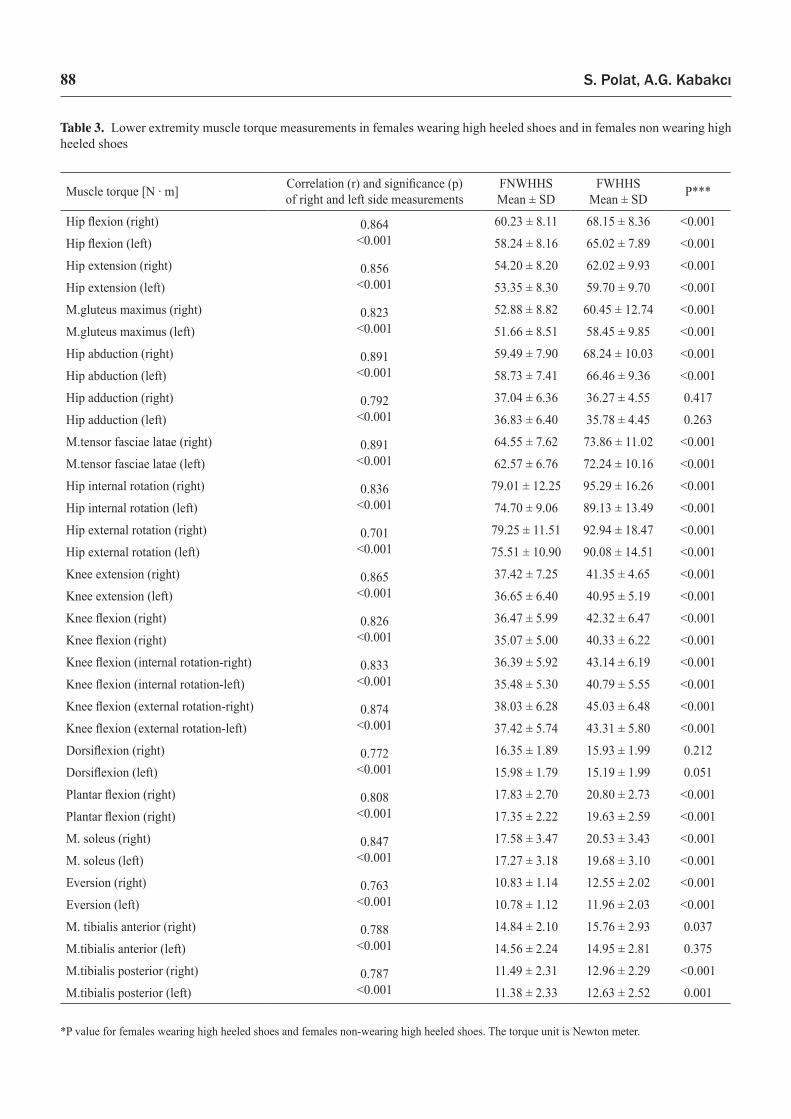
Table 3. Lower extremity muscle torque measurements in females wearing high heeled shoes and in females non wearing high heeled shoes
*P value for females wearing high heeled shoes and females non-wearing high heeled shoes. The torque unit is Newton meter.
Muscle torque [N · m] Correlation (r) and significance (p) of right and left side measurements
FNWHHSMean ± SD
FWHHS Mean ± SD P***
Hip flexion (right) 0.864<0.001
60.23 ± 8.11 68.15 ± 8.36 <0.001
Hip flexion (left) 58.24 ± 8.16 65.02 ± 7.89 <0.001
Hip extension (right) 0.856<0.001
54.20 ± 8.20 62.02 ± 9.93 <0.001
Hip extension (left) 53.35 ± 8.30 59.70 ± 9.70 <0.001
M.gluteus maximus (right) 0.823<0.001
52.88 ± 8.82 60.45 ± 12.74 <0.001
M.gluteus maximus (left) 51.66 ± 8.51 58.45 ± 9.85 <0.001
Hip abduction (right) 0.891<0.001
59.49 ± 7.90 68.24 ± 10.03 <0.001
Hip abduction (left) 58.73 ± 7.41 66.46 ± 9.36 <0.001
Hip adduction (right) 0.792<0.001
37.04 ± 6.36 36.27 ± 4.55 0.417
Hip adduction (left) 36.83 ± 6.40 35.78 ± 4.45 0.263
M.tensor fasciae latae (right) 0.891<0.001
64.55 ± 7.62 73.86 ± 11.02 <0.001
M.tensor fasciae latae (left) 62.57 ± 6.76 72.24 ± 10.16 <0.001
Hip internal rotation (right) 0.836<0.001
79.01 ± 12.25 95.29 ± 16.26 <0.001
Hip internal rotation (left) 74.70 ± 9.06 89.13 ± 13.49 <0.001
Hip external rotation (right) 0.701<0.001
79.25 ± 11.51 92.94 ± 18.47 <0.001
Hip external rotation (left) 75.51 ± 10.90 90.08 ± 14.51 <0.001
Knee extension (right) 0.865<0.001
37.42 ± 7.25 41.35 ± 4.65 <0.001
Knee extension (left) 36.65 ± 6.40 40.95 ± 5.19 <0.001
Knee flexion (right) 0.826<0.001
36.47 ± 5.99 42.32 ± 6.47 <0.001
Knee flexion (right) 35.07 ± 5.00 40.33 ± 6.22 <0.001
Knee flexion (internal rotation-right) 0.833<0.001
36.39 ± 5.92 43.14 ± 6.19 <0.001
Knee flexion (internal rotation-left) 35.48 ± 5.30 40.79 ± 5.55 <0.001
Knee flexion (external rotation-right) 0.874<0.001
38.03 ± 6.28 45.03 ± 6.48 <0.001
Knee flexion (external rotation-left) 37.42 ± 5.74 43.31 ± 5.80 <0.001
Dorsiflexion (right) 0.772<0.001
16.35 ± 1.89 15.93 ± 1.99 0.212
Dorsiflexion (left) 15.98 ± 1.79 15.19 ± 1.99 0.051
Plantar flexion (right) 0.808<0.001
17.83 ± 2.70 20.80 ± 2.73 <0.001
Plantar flexion (right) 17.35 ± 2.22 19.63 ± 2.59 <0.001
M. soleus (right) 0.847<0.001
17.58 ± 3.47 20.53 ± 3.43 <0.001
M. soleus (left) 17.27 ± 3.18 19.68 ± 3.10 <0.001
Eversion (right) 0.763<0.001
10.83 ± 1.14 12.55 ± 2.02 <0.001
Eversion (left) 10.78 ± 1.12 11.96 ± 2.03 <0.001
M. tibialis anterior (right) 0.788<0.001
14.84 ± 2.10 15.76 ± 2.93 0.037
M.tibialis anterior (left) 14.56 ± 2.24 14.95 ± 2.81 0.375
M.tibialis posterior (right) 0.787<0.001
11.49 ± 2.31 12.96 ± 2.29 <0.001
M.tibialis posterior (left) 11.38 ± 2.33 12.63 ± 2.52 0.001
High heeled shoes 89
Table 4. Lower extremity muscle strength measurements in females wearing high heeled shoes and in females non-wearing high heeled shoes
*P value for females wearing high heeled shoes and females non-wearing high heeled shoes. The strength measurement unit is Newton meter/kg.
Relative muscle torque [N · m/kg] Correlation (r) and significance (p) of right and left side measurements
FNWHHSMean ± SS
FWHHSMean ± SS P*
Hip flexion (right) 0.904<0.001
1.04 ± 0.16 1.18 ± 0.20 <0.001
Hip flexion (left) 1.01 ± 0.16 1.13 ± 0.18 <0.001
Hip hiperextension (right) 0.884<0.001
0.94 ± 0.17 1.07 ± 0.19 <0.001
Hip hiperextension (left) 0.92 ± 0.16 1.03 ± 0.19 0.001
M.gluteus maximus (right) 0.823<0.001
0.92 ± 0.19 1.05 ± 0.24 0.001
M. gluteus maximus (left) 0.90 ± 0.17 1.01 ± 0.20 <0.001
Hip abduction (right) 0.838<0.001
1.03 ± 0.15 1.18 ± 0.18 <0.001
Hip abduction (left) 1.02 ± 0.14 1.15 ± 0.19 <0.001
M.tensor fascia latae (right) 0.920<0.001
1.12 ± 0.16 1.28 ± 0.22 <0.001
M.tensor fascia latae (left) 1.08 ± 0.16 1.25 ± 0.20 <0.001
Hip adduction (right) 0.902<0.001
0.64 ± 0.10 0.63 ± 0.11 0.507
Hip adduction (left) 0.64 ± 0.11 0.62 ± 0.10 0.329
Hip internal rotation (right) 0.815<0.001
1.37 ± 0.27 1.62 ± 0.30 <0.001
Hip internal rotation (left) 1.31 ± 0.23 1.54 ± 0.28 <0.001
Hip external rotation (right) 0.655<0.001
1.39 ± 0.26 1.63 ± 0.33 <0.001
Hip external rotation (left) 1.37 ± 0.48 1.56 ± 0.31 <0.001
Knee extension (right) 0.890<0.001
0.65 ± 0.13 0.72 ± 0.10 <0.001
Knee extension (left) 0.63 ± 0.11 0.71 ± 0.11 <0.001
Knee flexion (right) 0.859<0.001
0.63 ± 0.10 0.73 ± 0.14 <0.001
Knee flexion (right) 0.60 ± 0.11 0.70 ± 0.14 <0.001
Knee flexion (internal rotation-right) 0.876<0.001
0.63 ± 0.12 0.74 ± 0.13 <0.001
Knee flexion (internal rotation-left) 0.62 ± 0.11 0.70 ± 0.12 <0.001
Knee flexion (external rotation-right) 0.910<0.001
0.66 ± 0.13 0.78 ± 0.14 <0.001
Knee flexion (external rotation-left) 0.65 ± 0.12 0.75 ± 0.13 <0.001
Dorsiflexion (right) 0.875<0.001
0.29 ± 0.05 0.28 ± 0.05 0.302
Dorsiflexion (left) 0.28 ± 0.05 0.26 ± 0.05 0.085
Plantar flexion (right) 0.868<0.001
0.31 ± 0.06 0.36 ± 0.06 <0.001
Plantar flexion (left) 0.30 ± 0.05 0.34 ± 0.06 <0.001
M. soleus (right) 0.876<0.001
0.31 ± 0.07 0.35 ± 0.06 <0.001
M. soleus (left) 0.30 ± 0.07 0.34 ± 0.06 <0.001
Eversion (right) 0.851<0.001
0.19 ± 0.03 0.22 ± 0.04 <0.001
Eversion (left) 0.19 ± 0.03 0.21 ± 0.04 0.011
M.tibialis anterior (right) 0.849<0.001
0.26 ± 0.05 0.27 ± 0.05 0.091
M.tibialis anterior (left) 0.25 ± 0.05 0.26 ± 0.05 0.578
M.tibialis posterior (right) 0.846<0.001
0.20 ± 0.05 0.23 ± 0.05 <0.001
M.tibialis posterior (left) 0.20 ± 0.05 0.22 ± 0.05 0.012
S. Polat, A.G. Kabakcı90
respectively [37]. Bacon et al. reported gluteus medius muscle force as 360.20 ± 68.84 N in healthy subjects aged 22–49 years [3]. Morse et al. reported the mean values of hip abduction force and hip extension force as 248.40 ± 34.32 N and 220.06 ± 45.11 N, respectively [30]. Furthermore, in a study of Haber et al. performed with healthy females aged 31–40 years hip abduction force was 118.66 ± 22.26 (right side) and 128.86 ± 23.63 N [10]. In this study, muscle force mean values of hip abduction, was 162.98 ± 19.39 N (right) and 160.98 ± 18.64 N (left) in FNWHHS, 192.25 ± 25.67 N (right) and 187.85 ± 25.49 N (left) in FWHHS. Hip flexion muscle force values were 158.36 ± 18.06 N (right) and 153.46 ± 18.50 N (left) in FNWHHS, whereas the corresponding measurements were 178.82 ± 19.31 N (right) and 170.81 ± 18.10 N (left) in FWHHS. Additionally, hip extension muscle force val-ues were 142.65 ± 19.57 N (right) and 140.34 ± 19.30 N (left) in FNWHHS and 162.67 ± 23.44 N (right) and 156.84 ± 23.22 N (left) in FWHHS. Also it was reported that performance was sustained until 45–55 years of age depending on the result measurements and a gradual de-cline in performance with age was observed [10]. Females aged from 18 to 45 years old participated in this study. Also, a significant increase in force of the hip flexion, hip abduction, hip extension, gluteus maximus muscle and tensor fascia latae muscle was observed in females wear-ing HHS. We think that high heeled shoes lead to a change of center of gravity and the body tries to comply with the
new postural changes. While the subject is standing with HHS, the center of mass moves more and more forward due to balance and the body swings to antero-posterior di-rections. For this reason, these muscles choose to be more and more active to adapt to the alterations.
An other study showed that a greater external-to-internal-rotation strength ratio can protect players from the development of some injuries [26]. Morse et al. re-ported that muscle force mean values of internal rota-tion and external rotation were 139.16 ± 42.17 N and 134.35 ± 37.26 N, respectively [30]. Our results are lower than Morse’s findings, and both internal rotation and external rotation muscle force values were greater in FWHHS than in FNWHHS. Also, Krause et al. re-ported that the ratio of external rotation muscle force to internal rotation muscle force was lower in females wearing HHS [26]. This ratio was found to be lower in FWHHS than in FNWHHS, similar to the Krause et al.’ study. The lower external to internal rotation ra-tio can be a reason for injuries due to HHS [26]. In the literature, knee extension muscle forces were between 132.59 ± 17.55 N and 410.80 ± 122.6 N (Bohannon et al., 408.3 ± 128.3 N, dominant side; 410.8 ± 122.6 N, non-dominant side; Moss et al., 389.66 ± 71.62 N, domi-nant side; 374.54 ± 90.74 N non-dominant side; El-Hab-er et al., right, 132.78 ± 19.12 N; left, 132.59 ± 17.55 N [4, 10, 31]. Also, the quadriceps femoris muscle becomes more active during walking with HHS due to increased
Parameters ROM [deg]
Correlation and significance of data
FNWHHS FWHHSP*
Min. Max. Mean ± SD Min. Max. Mean ± SD
Hip flexion (right) 0.872<0.001
93.00 128.0 110.88 ± 7.66 101.0 137.2 115.39 ± 8.46 0.004
Hip flexion (left) 91.00 125.8 109.43 ± 7.24 100.0 129.0 114.11 ± 8.27 0.001
Hip extension (right) 0.729<0.001
5.00 20.00 12.78 ± 2.75 7.00 16.6 12.16 ± 2.22 0.175
Hip extension (left) 6.50 18.80 11.98 ± 2.68 5.00 16.00 11.10 ± 2.18 0.050
Hip abduction (right) 0.711<0.001
37.10 52.00 45.08 ± 2.96 37.10 52.60 45.17 ± 3.39 0.689
Hip abduction (left) 36.20 50.00 44.02 ± 3.10 36.20 51.00 44.66 ± 2.72 0.288
Hip adduction (right) 0.808<0.001
8.00 23.30 15.33 ± 3.81 10.00 23.00 14.78 ± 2.85 0.522
Hip adduction (left) 10.00 24.50 15.08 ± 3.69 10.00 24.10 14.76 ± 2.98 0.760
Hip internal rotation (right) 0.845<0.001
34.20 50.00 41.56 ± 3.62 35.90 49.70 44.07 ± 2.71 <0.001
Hip internal rotation (left) 32.80 50.00 40.66 ± 3.59 37.00 48.40 43.32 ± 2.56 <0.001
Hip external rotation (right) 0.783<0.001
28.80 48.00 41.72 ± 3.78 35.80 49.00 42.85 ± 2.82 0.120
Hip external rotation (left) 30.00 50.00 41.10 ± 3.82 36.20 48.00 42.21 ± 2.51 0.074
Table 5. Hip joint range of motion measurements in females wearing high heeled shoes and females non-wearing high heeled shoes
*P value for females wearing high heeled shoes and females non-wearing high heeled shoes; Min. – minimum; Max. – maximum; ROM – Range of motion.
High heeled shoes 91
flexion moment at the knee joint [7]. A comparison be-tween our results and those of previous studies which are reported from the literature showed that the values of knee extension muscle force differed from our results [4, 10, 31]. Our findings were lower than Bohannon et al. and Moss et al.’s findings [4, 31], but on the other hand, our values were higher than El Haber et al.’s values [10]. However, this study’s findings were close to Do Nasci-mento et al.’s study [7]. We think that these differences may depend on some compensatory mechanism such as the higher activation of the quadriceps femoris muscle
and hamstring muscles during the high-heeled gait as well as race, age, gender, genetic factors, doing sports, and nutrition.
Moss et al. measured the knee flexion muscle force on the dominant and non-dominant side as 209.51 ± 37.37 N and 209.96 ± 35.14 N, respectively [31]. It was reported that an increase in knee flexion was found during stance, when wearing high heels. The rectus femoris muscle was more highly activated to control the increased knee flexion and the increase in extensor activity led to an increase in the knee extensor moments. Conversely, it was declared
Parameters ROM [deg]
Correlation (r) and significance (p)
of data
FNWHHS FWHHSP*
Min. Max. Mean ± SD Min Max. Mean ± SD
Knee extension (right) 0.782<0.001
2.00 10.00 5.38 ± 1.53 1.50 7.50 5.19 ± 1.25 0.909
Knee extension (left) 2.10 11.00 5.42 ± 1.68 1.00 8.00 5.22 ± 1.32 0.897
Knee flexion (right) 0.788<0.001
114.2 140.0 129.61 ± 6.69 120.0 143.0 132.21 ± 3.97 0.031
Knee flexion (left) 110.0 140.0 128.68 ± 6.27 121.4 142.7 130.78 ± 4.71 0.201
Dorsiflexion (right) 0.693<0.001
19.10 25.90 21.42 ± 1.46 15.00 22.90 19.61 ± 1.61 <0.001
Dorsiflexion (left) 17.00 24.50 20.67 ± 1.54 15.00 23.00 19.31 ± 1.44 <0.001
Plantar flexion (right) 0.823<0.001
35.00 55.90 46.57 ± 4.58 39.40 63.70 52.42 ± 4.94 <0.001
Plantar flexion (left) 32.00 55.00 45.13 ± 4.84 43.50 60.00 51.02 ± 4.07 <0.001
Inversion (right) 0.625<0.001
27.40 40.00 33.61 ± 2.71 30.00 42.50 34.14 ± 3.61 0.308
Inversion (left) 24.50 43.00 33.01 ± 3.18 29.00 42.00 33.60 ± 3.93 0.372
Plantar flexion (with a roller located under knee-right) 0.824
<0.001
38.00 61.50 50.54 ± 4.93 49.40 68.00 58.18 ± 4.62 <0.001
Plantar flexion (with a roller located under knee-left) 40.00 61.00 51.45 ± 4.88 48.50 67.30 58.28 ± 4.37 <0.001
Eversion (right) 0.666<0.001
15.00 24.00 19.46 ± 1.86 16.40 25.00 19.72 ± 1.45 0.220
Eversion (left) 14.00 25.00 19.44 ± 1.99 15.00 23.00 19.63 ± 1.44 0.408
First metatarsophalangeal joint flexion (right) 0.764
<0.001
40.00 55.00 46.59 ± 4.35 35.00 55.00 45.24 ± 4.67 0.149
First metatarsophalangeal joint flexion (left) 40.00 55.00 46.43 ± 4.11 35.00 55.00 45.15 ± 4.90 0.146
First metatarsophalangeal joint extension (right) 0.909
<0.001
45.00 80.00 68.29 ± 7.41 50.00 80.00 65.92 ± 7.36 0.021
First metatarsophalangeal joint extension (left) 45.00 80.00 68.23 ± 7.33 47.00 80.00 66.38 ± 6.99 0.075
First interphalangeal joint flexion (right) 0.777
<0.00155.00 90.00 71.36 ± 9.00 50.00 80.00 68.33 ± 5.85 0.103
First interphalangeal joint flexion 55.00 90.00 71.29 ± 8.00 50.00 80.00 68.30 ± 5.25 0.183
*P value for females wearing high heeled shoes and females non-wearing high heeled shoes; Min. – minimum; Max. – maximum; ROM – Range of motion.
Table 6. Knee flexion and extension Range of Motion measurements in females wearing high heeled shoes and in females non-wearing high heeled shoes
S. Polat, A.G. Kabakcı92
that there were no significant differences in the activity of the vastus medialis, biceps femoris, or semitendino-sus muscles as heel height increased [44]. In this study, knee flexion muscle force was measured with three dif-ferent methods. Knee flexion muscle force (semitendino-sus, semimembranosus and biceps femoris muscles), knee flexion muscle force (medial part of hamstring muscles, semitendinosus and semimembranosus muscles) and knee flexion muscle force (lateral part of hamstring muscles bi-ceps femoris muscle) were found to be 105.38 ± 15.79 N (right), 100.84 ± 12.77 N (left); 105.29 ± 16.28 N (right), 102.09 ± 14.46 N (left); and 110.18 ± 17.88 N (right), 107.11 ± 15.57 N (left) in FNWHHS, respectively. The same values were 122.46 ± 17.79 N (right), 116.68 ± 16.77 N (left); 124.77 ± 16.37 N (right), 118.06 ± 15.84 N (left); and 130.29 ± 17.39 N (right), 125.35 ± 15.30 N (left) in FWHHS, respectively. In FWHHS, biceps femoris muscle force was stronger than semimembranosus and semitendi-nosus muscles’ force in this study.
In a study performed by Bohannon, ankle dorsiflexion muscle force was found to be 248.7 ± 75.5 N (dominant side) and 252.9 ± 55.8 N (non-dominant side) [4]. This parameter was reported as right, 143.37 ± 34.81 N; and left, 136.02 ± 50.41 N in females aged between 21 and 30 years in El Haber et al.’s study [10]. When we ana-lyzed the results, our findings [142.68 ± 14.37 N (right), 141.14 ± 14.37 N (left) in FNWHHS; 143.94 ± 12.90 N (right), 140.65 ± 13.26 N (left) in FWHHS)] were similar to the study performed with Australian healthy females aged 21–30 years [10], whereas our findings were lower than the findings of the study performed with healthy American females [4]. It was reported there were different remarks corresponding with muscles such as gastrocnemius caput laterale (GCL), gastrocnemius caput mediale (GCM), per-oneus longus, tibialis anterior (mTA), soleus, rectus femo-ris and biceps femoris. There was a graded response in the activity of the rectus femoris, soleus, and peroneus longus muscles, whereas the muscle activity of the gastrocnemius, tibialis anterior, semitendinosus, biceps femoris, and vas-tus medialis did not show a graded response to increasing heel heights [44]; on the other hand, there was an increase in activity of the GCM, GCL and soleus muscles in a study performed with EMG in 60 healthy Indian females aged 18–24 years, when standing in high heeled shoes. The in-crease was statistically significant especially at 6 cm and 9 cm heel height. The increased activity of the GC may be due to the control of the increased plantarflexion of the ankle and to stabilization of the ankle joint when standing and wearing high heels [43]. Also, as heel height increased, effort on both sides of the calf muscles, which play primary roles in maintaining balance, increased [6, 49]. Addition-ally, another study reported that GCLbecame more active as heel height increased (from 1 cm to 4.5 cm) [45]. Do Nascimento et al. reported that the gastrocnemius muscle
participated for a longer period during the gait cycle when wearing 7 cm stiletto heels than when walking barefoot [7]. Hosoya et al. reported that there was a significant dif-ference and positive correlation in gastrocnemius muscle activity especially in 8.5 cm heel height [19]. Additionally, a study carried out with 10 professional female dancers (more than five years’ dancing history, and wearing four types of shoes with a heel height of 1.0 cm, 4.5 cm, 7.5 cm and 10 cm, designated as flat, low heel, medium high heel and high heel shoe, respectively) with mean age 22.8 years using EMG showed that there were significant increases in GCM, GCL, TA and soleus muscles in heightened heel shoes compared to dancers wearing flat heels. TA was the part most vulnerable to the heel height increase. Moreo-ver, there was a greater increase in the lateral part of the gastrocnemius (GCL’s recruitment was up to 36%) between flat and low heel height. Differences were not found in LG, MG and SO among low, medium and high heel height. Val-ues in LG were similar between the low and medium heel height [45]. In a study performed with five healthy females while standing with bare feet, flat heels and high heels by Henderson and Piazza, there were no significant differ-ences in EMG activity for the tibialis anterior (p = 0.883), peroneal (p = 0.077), lateral gastrocnemius (p = 0.093) or medial gastrocnemius (p = 0.330) [16]. The increased ac-tivity of the peroneal muscles could be due to the control of the increased plantarflexion when standing in high heels. Another response to the increased activity of the peroneal muscles is related to its role of protection of the foot from sudden inversion (supination increase) about the ankle and a stabilizer [19, 44]. In both Srivastava et al.’s study and Henderson and Piazza’s study it was declared that muscles of GCL and GCM responded differently to use of HHS. Especially, mGCL was more sensitive to fatigue [16, 43]. In this study, there was a statistically significant increase in especially mPL, mGC and soleus muscle forces when wearing high heels.
As heel height increases, the center of gravity goes more forward due to increased ankle plantar flexion and knee flexion consistently increases as a counteractive measure to balance the forward movement. For this rea-son, the rectus femoris muscle overworks to control the in-creased knee flexion, and there was a significant increase in vastus lateralis activity [19, 44]. In a study performed with ten Japanese healthy students of mean age 21.7 years who wore four different heel heights, 1.5 cm, 3.5 cm, 5.5 cm, and 8.5 cm, by Hosoya et al., as heel height increased the activity of the GC and vastus lateralis increased [19]. Also, another study carried out on thirty healthy females wearing 0 cm (flat), 4 cm (low), 7 cm (medium), and 10 cm (high) heel heights by Xiong and Hapsari reported that high heels induce more effort on both heads of the calf muscles (gas-trocnemius medialis, gastrocnemius lateralis), tibialis an-terior muscle, and vastus lateralis muscle [49].
High heeled shoes 93
In the literature, there was contradictory information about the tibialis anterior muscle activity [5–7, 11, 19, 27, 44, 45, 49]. The effects of shoes with 0 cm, 4.5 cm and 8 cm heel height were investigated in a study performed by Lee et al. As heel height increased, greater dorsiflex-ion was needed to reduce the risk of tripping or falling [27]. Moreover, in Hosoya et al.’s study performed with 10 healthy females wearing four different types of shoe, with 1.5 cm, 3.5 cm, 5.5 cm and 8.5 cm heel height, tibia-lis anterior activity increased most in shoes with 3.5 cm heel height [19]. Moreover, high heels induce more effort by the tibialis anterior muscle, which plays a secondary role in maintaining balance [49]. In another study per-formed with 20 females with mean age of 19.7 years by Do Nascimento et al., tibialis anterior muscle recruitment was found to be higher in both the stance and swing phase during the use of the HHS [7]. A study performed with 10 professional female dancers wearing four different shoes with a heel height of 1.0 cm (flat), 4.5 cm (low), 7.5 cm (medium) and 10 cm (high heel) by Su and Gu, as heel height increased from low to high, a significant difference appeared in the TA. When the heel height increased to high heel height (10 cm) the TA activity was greater than for both low (4.5 cm) and medium (7.5 cm) heel height. Due to the function of TA being to adjust dorsiflexion, playing a role as a stabilizer of the ankle and dancing with high heel shoes can consume more energy to control the balance [45]. The knee joint had more flexion at the stance phase, but there was less flexion at the swing phase wearing high heels than with flat shoes. The changed knee movement and reduced contact areas of the feet by high heels in-duced the different motions of the body to rotate and fluc-tuate more, especially for the spine joint. The moment of the joints of the ankle, knee and spine increased. For this reason, the muscles at the joints should have more strength for more stable walking in another study performed with twelve females aged between 20 and 30 walking two dif-ferent shoe heel heights (1 cm and 9.8cm) by Park et al. [36]. In this study, muscle force was found to be greater in females wearing HHS than not wearing HHS.
Zöllner et al. reported that frequent high-heel use al-ters the natural position of the calf muscle-tendon complex. Acutely, it leads to inefficient muscle use. Chronically, it in-itiates an adaptation process associated with significant loss of sarcomeres and muscle shortening [39, 50]. If a subject using HHS for a long time wears flat foot shoes, this proc-ess is very painful and will overstretch the triceps surae. In the same study, it is suggested that the heel height must be 5 cm or less and passive stretching exercise must be done with high frequency in dorsiflexion direction to provide comfort and decrease the risk of injury [50]. Furthermore, Ebbeling et al. suggested that the heel height should not ex-ceed 5.08 cm and that high heeled shoes should be worn for less than 4 hours and less than three times a week to ensure
comfort and reduce the risk of injury [9]. The joint mobil-ity and muscle force play an important role in the healthy musculoskeletal system’s biomechanical structure. Range of motion (ROM) is described as a suitable distance in be-tween joints and joint movement direction [41]. Decrease in ROM of the hip and ankle leads to an increased risk of falls [29]. ROM measurements were also used as reference values in evaluating disability, movement limitation, ortho-pedic implant practice and determination of the treatment efficiency and diagnosis of musculoskeletal diseases for clinicians [1, 13, 33, 41]. Moreover, the AAOS guidebook is the oldest reference to evaluate normal range of motion [13]. There was not enough information related to society done ROM measurements and how this measurement was done (active or passive) [13]. For this reason, there were fewer studies about right and left extremity ROM compari-sons and the distribution of normal ROM for healthy sub-jects [1, 13, 46].
When this study’s ROM findings were analyzed with ROM of the hip flexion [1, 13, 15, 22, 23, 33, 40] (ex-cept the American Medical Association), hip extension [13, 22, 33, 40], hip abduction [13, 22, 33, 38], hip adduc-tion [22, 33, 40] of the other studies, results were different from each other. We think that these differences between females wearing HHS and females not wearing HHS may be a result of a compensatory mechanism which occurred in the knee and hip joint because of the increase in plantar flexion caused by high heeled shoes. Also, race, geograph-ical conditions, whether the ROM measurements are ac-tive or passive, cultural and exercise habits are responsible for differences. Additionally, differences of 10 degrees and below in the right and left ROM measurements can be ig-nored according to the American Medical Association [13]. Moreover, race differences in ROM of White and Black females was reported [40]. The AAOS [33] reported that the knee flexion ROM reference value was 135º, whereas Khalvat and Razavizadeh [22] found the same measure-ment as 132 ± 4º. Knee flexion and extension active ROM were measured as 133.00 ± 11.91º and 4.86 ± 3.38º by Hallaçeli et al. [13]; 122.71 ± 3.04º and 1.86 ± 0.42º by Hasan et al. [15]. Also, knee flexion ROM and extension ROM were 129.61 ± 6.69º (right), 128.68 ± 6.27º (left); and 5.38 ± 1.53º (right), 5.42 ± 1.68º (left), respectively in females not wearing HHS, whereas the same values were 132.21 ± 3.97º (right), 130.78 ± 4.71º (left); and 5.19 ± 1.25º (right), 5.22 ± 1.32º (left), respectively in fe-males wearing HHS. Due to these reports, we found dif-ferences in knee flexion mean values of Hasan et al. [15] compared with our result: they have higher values than us. Our result is closer to that in the report from Hallaçeli et al. [13] and Khalvat and Razavizadeh [22]. Moreover, we found differences in knee extension ROM values of Hal-laçeli et al. [13] and Hasan et al. [15] compared with our result: they have lower values than us.
S. Polat, A.G. Kabakcı94
Internal (IR) and external (ER) rotation of the hip joint play a central role in the combined rotation of the leg and the pelvis during walking and various activities of daily life [25]. Also, the values of hip internal and external range of motion are important for assessing laterality [14]. Increase in internal rotation results from increased femo-ral anteversion in females wearing HHS. The hip internal rotation ROM findings differ from our results. We found differences in mean values of Roach and Miles (White fe-males aged 25–39 years, IR-33 ± 7°; ER-36 ± 8°; Black females aged 25–39 years, IR-27 ± 6°; ER-32 ± 9°) [40] and Hallaçeli et al. (IR, 38.25 ± 6.47º; ER, 36.86 ± 6.59º) [13] with our findings: they have lower values than us. Our result is closer to that of the report from Kim et al. (IR, 43.05 ± 11.73º; ER, 68.72 ± 11.27º) [23], and our results are lower to those of the report from the AAOS (IR,45°; ER,45°) [33], Khalvat and Razavizadeh (IR, 45 ± 1º; ER, 45 ± 1º) [22], Han et al. [(IR, 48.2 ± 9.5º (right), 46.4 ± 8.8º (left); ER, 41.4 ± 7.8º (right), 39.0 ± 7.6º (left)] [14], Gupta et al. (52.73 ± 2.25º (right), 42.86 ± 1.84º (left); ER, 37.3 ± 1.76º (right), 38.27 ± 1.56º (left) [12]. We found differences in IR and ER mean values of the other studies [12–14, 40] compared with our results: they have lower values than us. Our results are higher compared to the report from the American Medical Association and the AAOS (IR°, 45; ER, 45°) findings [33].
Hallaçeli et al. reported that the mean active ROM values of ankle plantar flexion, dorsiflexion, foot inver-sion and eversion were 44.43 ± 8.12º, 19.48 ± 6.55º, 28.91 ± 11.45º and 17.64 ± 5.69º, respectively [13]. The AAOS reported that the same values were 20º, 50º, 15º and 35º, respectively. Moreover, the American Medical Association found the same values were 20º, 40º, 20º and 30 degrees, respectively [33]. Kim et al. found that ankle plantar flexion ROM was 25º higher in females wearing HHS than in females not wearing HHS, whereas foot in-version ROM mean value was 10º lower in females wear-ing HHS than in females not wearing HHS. Also, eversion ROM was 10º higher in females not wearing HHS than in females wearing HHS [24]. Dorsiflexion ROM was 17º higher in females not wearing HHS than in females wear-ing HHS [24]. In this study, wearers of high-heeled shoes showed increased ankle range of motion on plantarflexion at 5.85 (right) and 5.89 (left) degrees (p < 0.001) and in-version at 0.53 (right) and 0.59 (left) degrees (p > 0.05) and eversion 0.26 (right) and 0.19 (left) degrees (p > 0.05) compared to flat shoe wearers but decreased on dorsi-flexion at 1.81 (right) and 1.36 (left) degrees (P < 0.001). Moreover, Kim et al. [24] reported that the plantar flexion was 20º more in females wearing HHS than in females not wearing HHS, whereas these differences were less in our study. Our dorsiflexion result is closer to that of the re-port from Hallaçeli et al. [13], whereas our eversion ROM values are lower than Hallaçeli et al.’s findings [13] and
similar to the AMA [33]. The mean value of our inversion ROM was higher than in Hallaçeli et al. [13] and the AMA but similar to the AAOS [33].
Conclusion
There was no study on torque and strength measure-ments performed with the NMMT in healthy FWHHS. The NMMT is a painless and non-invasive method. For this reason, the measurements of the lower extremity mus-cle force, torque and strength performed with the NMMT may be essential for safe and accurate diagnosis of many disorders such as muscle weakness and musculoskeletal injury for neurologists, brain surgeons and orthopedists. We can emphasize that long term use of high heeled shoes can cause changes in muscle force/torque/strength and joint range of motion because of the excessive use of some lower extremity muscles.
Conflict of interest: Authors state no conflict of interest.
References
1. Arifff M.S., Arshad A.A., Johari M.H., Rahimin A.M.A.S., Fadzli A.S., Mai A.N.T., Che Anuar C.M., Rosazra R., Norhafiza A.R. (2015) The study on range of motion of hip and knee in prayer by adult muslim males. a prelimi-nary reports. Int. Med. J. Malays., 14(1): 1-11.
2. Arnold C.M., Warkentin K.D., Chilibeck P.D., Mag-nus C.R.A. (2010) The reliability and validity of hand-held dynamometry for the measurement of lower extrem-ity muscle strength in older adults. J. Strength Cond. Res., 24(3): 815-824.
3. Bacon C., Pruser J., Ford W., Amick R. (2011) Gluteus medius electromyographic (EMG) Activity and strength immediately following lumbopelvic high velocity thrust provided by a novice clinician. 7th Annual GRASP Sym-posium, 04 May 2011, Wichita State University. Kansas-USA, 52-53.
4. Bohannon R.W. (1997) Reference values for extremity muscle strength obtained by hand held dynamometry from adults aged 20 to 79 years. Arch. Phys. Med. Reha-bil., 78: 26-32.
5. Cronin N.J., Barrett R.S., Carty C.P. (2012) Long term use of high heeled shoes alters the neuromechanics of hu-man walking. J. Appl. Physiol., 112: 1054-1058.
6. Cuttan S.A., Holliday J.L., Watkeys L. (2010) Influence of high heeled footwear and pre-fabricated foot orthoses on energy efficiency in ambulation. The Foot and Ankle Online Journal, 3(3): 1-11.
7. Do Nascimento N.I.C., Saraiva T.S., Da Cruz Jr A.T.V., Souza G.D.S., Callegari B. (2014) Barefoot and high
High heeled shoes 95
heeled gait: Changes in muscles activation patterns. Health, 6: 2190-2196.
8. Dunn J.C., Iversen M.D. (2003) Interrater reliability of knee muscle forces obtained by hand held dynamometer from elderly subjects with degenerative back pain. J. Geriatr. Phys. Ther., 26(3): 23-29.
9. Ebbeling C.J., Hamill J., Crussemeyer J.A. (1994) Lower extremity mechanisc and energy cost of walking in high heeled shoes. J. Orthop. Sports Phys. Ther., 19: 190-196
10. El Haber N., Erbas B., Hill K.D., Wark J.D. (2008) Rela-tionship between age and measures of balance, strength and gait: linear and non-linear analyses. Clin. Sci., 114: 719-727.
11. Franklin M.E., Chenier T.C., Brauninger L., Cook H., Harris S. (1995) Effect of positive heel inclination on posture. J. Orthop. Sports Phys. Ther., 21(2): 94-99.
12. Gupta A., Fernihough B., Bailey G., Bombeck P., Clarke A., Hopper D. (2004) An evaluation of differenc-es in hip external rotation strength and range of motion between female dancers and non-dancers. Br. J. Sports Med., 38: 778-783.
13. Hallaçeli H., Uruç V., Uysal H.H., Özden R., Hallaçeli Ç., Soyuer F., Parpucu T.I., Yengil E., Cavlak U. (2014) Türk toplumunda kalça diz ve ayak bileğinin normal eklem hareket açıklığı. Acta Orthop. Traumatol. Turc., 48(1): 37-42.
14. Han H., Kubo A., Kurosawa K., Maruichi S., Maru-yama H. (2015) Hip Rotation range of motion in sitting and prone positions in healthy Japanese adults. J. Phys. Ther. Sci., 27: 441-445.
15. Hasan F.F., Ibrahim E.K. (2012) The effects of gender on range of motion (ROM) for knee joint. Tikrit Medical Journal,18(1): 112-120.
16. Henderson P.D., Scholar M.N., State P., Piazza S.J. (2004) A Biomechanical Evaluation of Standing in High heeled Shoes. Penn State McNair. J., 11: 25-38.
17. Ho K.Y., Blanchette M.G., Powers C.M. (2012) The in-fluence of heel height on patellofemoral joint kinetics during walking. Gait Posture, 36: 271-275.
18. Hong W.H., Lee Y.H., Lin Y.H., Tang S.F.T., Chen H.C. (2013) Effect of shoe heel height and total contact insert on muscle loading and foot stability while walking. Foot Ankle Int., 34(2): 273-281.
19. Hosoya S., Hayashi R., Yoshino Y., Saito K., Horiba Y. (2012) Research on heel height of women’s shoes based on walking analysis. J. Fiber Bioeng. Inform., 5(4): 379-388.
20. Ireland M.L., Willson J.D., Ballantyne B.T., Davis I.M. (2003) Hip strength in females with and without patellafem-oral pain. J. Orthop. Sports Phys. Ther., 33(11): 671-678.
21. Iqbal R., De A., Mishra W., Maulik S., Am C. (2012) Study on lumbar kinematics and the risk of low back dis-order in female university students by using shoes of dif-ferent heel heights. Work, 41: 2521-2526.
22. Khalvat A., Razavizadeh M. (2005) A prospective cross sectional study of joint motion in healthy adult subjects. Acta Med. Iran., 43(2): 151-154.
23. Kim S.H., Kwon O.Y., Park K.N., Jeon I.C., Weon J.H. (2015) Lower extremity strength and the range of motion in relation to squat depth. J. Hum. Kinet., 45: 59-69.
24. Kim Y., Lim J.M., Yoon B.C. (2013) Changes in Ankle range of Motion and Muscle Strength in Habitual Wearers of high heeled shoes. Foot Ankle Int., 34(3): 414-419.
25. Kouyoumdjian P., Coulomb R., Sanchez T., Asencio G. (2012) Clinical evaluation of hip joint rotation range of mo-tion in adults. Orthop. Traumatol. Surg. Res., 98: 17-23.
26. Krause D.A., Neuger M.D., Lambert K.A., Johnson A.E., Devinny H.A., Hollman J.H. (2014) Effects of exam-iner strength on reliability of hip strength testing using a handheld dynamometer. J. Sport Rehabil., 23: 56-64.
27. Lee C.M., Jeong E.H., Freivalds A. (2001) Biomechani-cal effects of wearing high heeled shoes. Int. J. Ind. Er-gon., 28: 321-326
28. Madge M., Iselin F., Yann R., Maider G., Stanislava P., De Lausanne E.P.F. (2014) Impact of high heels on fe-male body and proposed solution for improved biome-chanics. 1-16.
29. Moghadam A.N., Taghipour M., Alibazi R.G., Bahar Louei H. (2014) The comparison of spinal curves and hip and ankle range of motions between old and young per-sons. Med. J. Islam Repub. Iran., 28(74): 1-5.
30. Morse C., Cheatham S., Greiner C., Cook R. (2010) Hip flexibility and strength immediately following manual therapy interventions. 6th Annual GRASP Symposium, 23 April 2010, Wichita State University, 151-152.
31. Moss C.L., Wright P.T. (1993) Comparison of three meth-ods of assessing muscle strength and imbalance ratios of the knee. J. Athl. Train., 28(1): 55-58.
32. Nwankwo M.J., Egwuonwu A.V., Ezeukwu A.O., Nwa-fulume C.K. (2012) Effects of different heel heigts on se-lectes gait parameters of young undergraduate females. J. Paramed. Sci., 3(3): 9-14.
33. Otman S., Demirel H., Sade A. (2013) Basic evaluation principles in treatment movements. 6th Ed., Ankara: Pe-likan Publishing.
34. Pannell S.L. (2012) The postural and biomechanical ef-fects of high heel shoes: a literature review. http://www.logan.edu/mm/files/LRC/Senior-Research/2012-Apr-18.pdf.
35. Park S., Lee K. (2009) Simulation of biomechanical in-fluence of high heels on musculuskeletal system of foot and ankle. International Society of Biomechanics. XVII. Congress of the International Society of Biomechanics, July 2009. Cape Town, South Africa.
36. Park S., Lee M., Park J. (2013) The relationship among stride parameters, joint angles, and trajectories of the body parts during high heeled walking of woman. Jour-nal of the Ergonomics Society of Korea, 32(3): 245-252.
S. Polat, A.G. Kabakcı96
37. Pasco J.A., Holloway K.L., Brennan Olsen S.L., Moloney D.J., Kotowicz M.A. (2015) Muscle strength and areal bone mineral density at the hip in women: a cross-sec-tional study. BMC Musculoskel. Disord., 16: 124-129.
38. Polat S.Ö., Yücel A.H. (2018) Wearing high-heeled shoes increases the foot arch angle inducing measurable chang-es in the musculoskeletal system. J. Back Musculoskelet. Rehabil., 31(6): 1119-1129.
39. Polat S.Ö., Yücel A.H. (2017) High Heeled Shoes and their Effects on Musculoskeletal System. Arch. Med. Rev. J., 26(4): 509-520.
40. Roach K.E., Miles T.P. (1991) Normal Hip and knee ac-tive range of motion: the relationship to age. Phys. Ther., 71: 656-665.
41. Sengupta P., De S., Pal A., Maity P., Banerjee M., Dhara P.C. (2012) Variation of range of joint motion in Bengalee (Indian) Healthy adult subjects. J. Life. Sci., 4(2): 123-133
42. Smitley B.E. Lafayette Instrument Company. Lafayette Instrument Model 01165 Lafayette Manual Muscle Test System User Instructions.
43. Srivastava A., Mishra A., Tewari R.P. (2012) Electromy-ography analysis of high heel walking. Aeu. Int. J. Elec-tron C., 3(1): 166-169.
44. Stefanyshyn D.J., Nigg B.M., Fisher V., O’Flynn B., Liu W. (2000) The Influence of high heeled shoes on kinematics, kinetics, and muscle EMG of normal female gait. J. Appl. Biomech., 16: 309-319.
45. Su X., Gu Y. (2012) EMG in People with different heel height condition. Applications of EMG in Clinical and Sports Medicine, 109-116.
46. Svenningsen S., Terjesen T., Auflem M., Berg V. (1989) Hip motion related to age and sex. Acta Ortop. Scand., 60: 97-100.
47. Thorborg K., Petersen J., Magnusson S.P., Hölmich P. (2010) Clinical assessment of hip strength using a hand held dynamometer is reliable. Scand. J. Med. Sci. Sports, 20: 493-501.
48. www.at.uwa.edu/mmt/hip,knee,ankle and toes. Manual musle testing.
49. Xiong S., Hapsari V.D. (2014) Effects of heel height and wearing experience on human standing balance. J. Foot Ankle Res., 7(1): A97.
50. Zöllner A.M., Pok J.M., McWalter E.J., Gold G.E., Kuhl E. (2015) On high heels and short muscles: A multi-scale model for sarcomere loss in the gastrocnemius mus-cle. J. Theor. Biol., 365: 301-310.
Received 10.09.2020Accepted 15.01.2021
© University of Physical Education, Warsaw, Poland
Acknowledgments
We would like to thank the Scientific Research Projects Unit for financial support (Grant number: TF 2014 DT-1110). Also, we would like to thank for our gone but not forgotten Prof. Dr. Ahmet Hilmi Yücel for supervising on us.


