Embed Size (px)
Citation preview
Journal of Archaeological Science (2002) 29, 1055–1075doi:10.1006/jasc.2001.0692, available online at http://www.idealibrary.com on
Obsidian Diffusion Dating by Secondary Ion MassSpectrometry: A Test using Results from Mound 65, Chalco,Mexico
Lee R. Riciputi
Chemical Sciences Division, Oak Ridge National Laboratory, P.O. Box 2008, Oak Ridge, TN 37831-6365, U.S.A.
J. Michael Elam
Department of Anthropology, 252 South Stadium Hall, University of Tennessee, Knoxville, TN 37996-0720,U.S.A.
Lawrence M. Anovitz and David R. Cole
Chemical Sciences Division, Bldg. 4500S, MS 6110, P.O. Box 2008, Oak Ridge National Laboratory, Oak Ridge,TN 37831-6110, U.S.A.
(Received 25 April 2000, revised manuscript accepted 17 April 2001)
Secondary ion mass spectrometry (SIMS) was used to measure hydrogen and other elemental concentrations as afunction of depth in ten obsidian artifacts (Pachuca Source), each with a well-constrained 14C date, from Mound 65,Chalco, Mexico. Hydrogen depth profiles for the different artifacts all display a characteristic S-shape, and increasingmaximum hydrogen content in each profile and profile depths are well correlated with time. These data are used toinvestigate the potential use of Obsidian Diffusion Dating by SIMS (ODDSIMS) for both extrinsic and intrinsic datingof obsidian artifacts. Using ‘‘characteristic points’’ on the hydrogen profile (half-fall depth, inflection point depth),simple hydration rate equations were evaluated against time constraints provided by associated 14C dates. Wedemonstrate that neither the traditional OHD equation for depth (x) as a function of the square root of time (t1/2) nora linear function (t1) fit the data. Solving the more generalized tn function provides an excellent fit between characteristicpoint depths and 14C dates (for n�0·75), and meets the constraint that at time equal to zero, the depth of the hydrationprofile must also be zero. However, this may be an average coefficient over the range of ages available, and may notaccurately reflect rates at shorter or longer times. Using only two obsidian samples and their associated 14C dates, acalibration curve can be derived that provides ODDSIMS dates for the other pieces that are in excellent agreementwith associated 14C dates, indicating that empirical application of the technique is potentially feasible, at least atindividual sites.
The underlying processes governing hydrogen transport into the obsidian were also investigated by using finitedifference modelling to reproduce the shape of the hydrogen depth profile. Excellent fits were obtained by assumingconcentration-dependent diffusion, and dates that agree well with associated 14C dates can also be extracted from thefinite difference profiles. Although considerable additional work needs to be done, the success of the finite differencemodelling suggests that development of an independent, intrinsic ODDSIMS model may be possible.
� 2002 Elsevier Science Ltd. All rights reserved.
Keywords: OBSIDIAN, GLASS, HYDRATION, CHALCO, MOUND 65, DEPTH-PROFILE, ODDSIMS,DIFFUSION.
Introduction
O f the various classes of artifacts recoveredfrom Mesoamerican sites, perhaps none has asmuch potential scientific value as obsidian.
This volcanic glass, intensively utilized by the culturesof ancient Mesoamerica to produce a variety of imple-
10550305–4403/02/$-see front matter
ments and ornaments, was distributed across the vastcommercial networks that characterized much of pre-hispanic Mesoamerica, and the geographic distributionof different obsidians can be used to infer commercialand political connections (e.g., Charlton et al., 1978;Santley et al., 1986; Stark et al., 1992; Elam et al.,1994). Obsidian also has the potential to be used as a
� 2002 Elsevier Science Ltd. All rights reserved.
1056 L. R. Riciputi et al.
chronometer by measuring the amount of water ab-sorbed on the surface of obsidian artifacts. If practical,ancient exchange networks could be ordered tempo-rally allowing study of Mesoamerican economiesdiachronically (Neff et al., 1993; Elam et al., 1994).Furthermore, dates resulting from obsidian chronom-etry could be used to develop and revise chronologiesboth locally and regionally (cf. Webster & Freter,1990).
Obsidian Hydration Dating (OHD) was first pro-posed by Friedman & Smith (1960), who observedbirefringent rims on obsidian artifacts under highmagnification (approximately 500�). Research subse-quent to Friedman & Smith’s original presentation hasrefined the method into two distinct techniques. Thesimplest, referred to as empirical rate dating, requirescorrelating the width of optically measured rims toindependent chronometric data, such as 14C dates (e.g.,Ambrose, 1976). The more complex and widely appliedform, known as intrinsic-rate dating, requires experi-mentally determined rate constants and a measure ofsite temperature because it is theoretically a fullyindependent chronometric method (Friedman et al.,1966; Friedman & Long, 1976; Michels et al., 1983;Stevenson et al., 1989, 1998). In spite of nearly 40 yearsof development and application, neither the intrinsicnor extrinsic methods has produced consistently reli-able results. In some cases the results have so contra-dicted other well-established chronometric data thatthe utility of obsidian as a chronometer has beenquestioned (Braswell, 1992; Braswell et al., 1996;Nichols & Charlton, 1996; Ridings, 1996; Anovitzet al., 1999).
A recent study (Anovitz et al., 1999) utilized second-ary ion mass spectrometry (SIMS) to directly analyzethe concentration of hydrogen as a function of depththrough the hydration rim in a series of obsidianartifacts, and explored some of the assumptions under-lying traditional optical OHD techniques. They docu-mented a variety of problems, but focused on twoprimary difficulties with the traditional OHD method:
(a) The mathematical model utilized in intrinsic rateOHD
x2=Ate�E/RT (1)
where x is depth, A is a constant, E is the activationenergy, R is the gas constant, and T is temperaturedoes not correctly predict the shape of the waterconcentration depth profile actually measured bySIMS. This equation assumes that the hydration rimgrows at a rate proportional to the square root of time,and that the diffusion coefficient is constant. TheS-shaped hydrogen profiles measured by SIMS indicatethat both assumptions are incorrect, and thus the rateequation that has been used in traditional OHD isincorrect.
(b) Traditional measurement techniques involvenon-systematic errors arising from the inherent
imprecision of optical measurement. This is due to twofactors, both of which are related to the physicallimitations of optical microscopy. These factors, thewavelength of light and differential refractive indices,combine to produce the illusion of a sharp boundarybetween the hydrated and unhydrated portionsof the glass (see Anovitz et al., 1999 for a fulldiscussion of these limitations). Consequently, opticalmeasurement becomes a highly subjective, observerdependent exercise. Additionally, the wavelength oflight imposes a theoretical precision limit of �0·25 �mon the rim width measurement. The net outcomeis significant scatter, often on the order of hundredsif not thousands of years, in the predicted hydrationdates.
Given these problems, Anovitz et al. (1999) con-cluded that it is unlikely that traditional optical OHDwill ever produce consistently reliable chronometricresults. At best, it may still be useful for relative datingor ordering of surface assemblages if age variations arelarge enough (Jones & Beck, 1990). More importantly,Anovitz et al. (1999) concluded that hydrated obsidianartifacts remain a potentially valuable source ofchronometric data. However, for this potential to berealized, they indicated that a more rigorous analyticaltechnique providing a direct measure of the hydrationprofile, and a correct understanding and model of therates and mechanisms of obsidian hydration, would berequired.
Obsidian diffusion dating by secondary ionmass spectrometry (ODDSIMS)In this report, we present the results of the first directanalyses (by SIMS) of hydration profiles from a set ofchronometrically constrained obsidian artifacts from asingle site. These samples span a 1000 year interval,and were recovered from Mound 65 at Chalco, Mexico(Hodges, (ed), in press). We will utilize the data fromthe Chalco artifacts to evaluate the potential of whatwe have termed ODDSIMS (Obsidian DiffusionDating by Secondary Ion Mass Spectrometry) as achronometric technique. As with traditional opticalOHD, ODDSIMS shares the concept that the width ofthe hydration rim on obsidian can be used to date theamount of time elapsed between the manufacture of anobsidian artifact and the present. However, the SIMSanalyses yield detailed data on the concentration ofhydrogen (and other elements) as a function of depththrough the hydrated obsidian rim, information thatcan not be obtained optically. This information pro-vides a quantitative measure of the chemical processesoccurring in the hydration rim, allowing more directinvestigation and mathematical modelling of diffusionkinetics. We will use the data in two ways.
Firstly, ‘‘characteristic points’’, representative ofthe hydration depth, can be compared with associated14C dates for multiple artifacts. The 14C ages and
Obsidian Diffusion Dating by Secondary Ion Mass Spectrometry 1057
‘‘characteristic points’’ can be regressed using varioussimple rate equations. If a good fit is obtained using arate equation, the potential of applying an empiricalcalibration to use hydration depths as a chronometercan be evaluated. Secondly, the detailed shape of thehydration profiles can be used to investigate actualhydration mechanisms, processes, and rates. This isdone by taking fundamental diffusion equations andusing finite difference modelling to attempt to repro-duce (1) the shape of the hydration profiles, and (2)how the shapes and depths vary as a function of time.This modelling yields valuable information about thenature of transport mechanisms (e.g., how the diffusionrate varies as a function of water content) and canprovide a generalized rate equation. If equations canbe developed that provide a good fit between measuredand predicted hydration profiles, it suggests that thehydration processes are systematic. Although full de-velopment of such an approach will have to wait untilthe completion of experiments designed expressly toextract rate information, successful modelling will pro-vide the basis for developing an accurate, independentchronometric methodology.
Analysed Samples and Archaeological Setting
To carry out a rigorous investigation of the potential ofODDSIMS utilizing obsidian artifacts, it is crucial toobtain samples from a single site that (1) are fromsecure contexts, (2) span a significant temporal period,and (3) have good independently determined ages. Asdescribed below, obsidian samples recovered from theChalco, Mexico site provide an excellent suite ofmaterial.
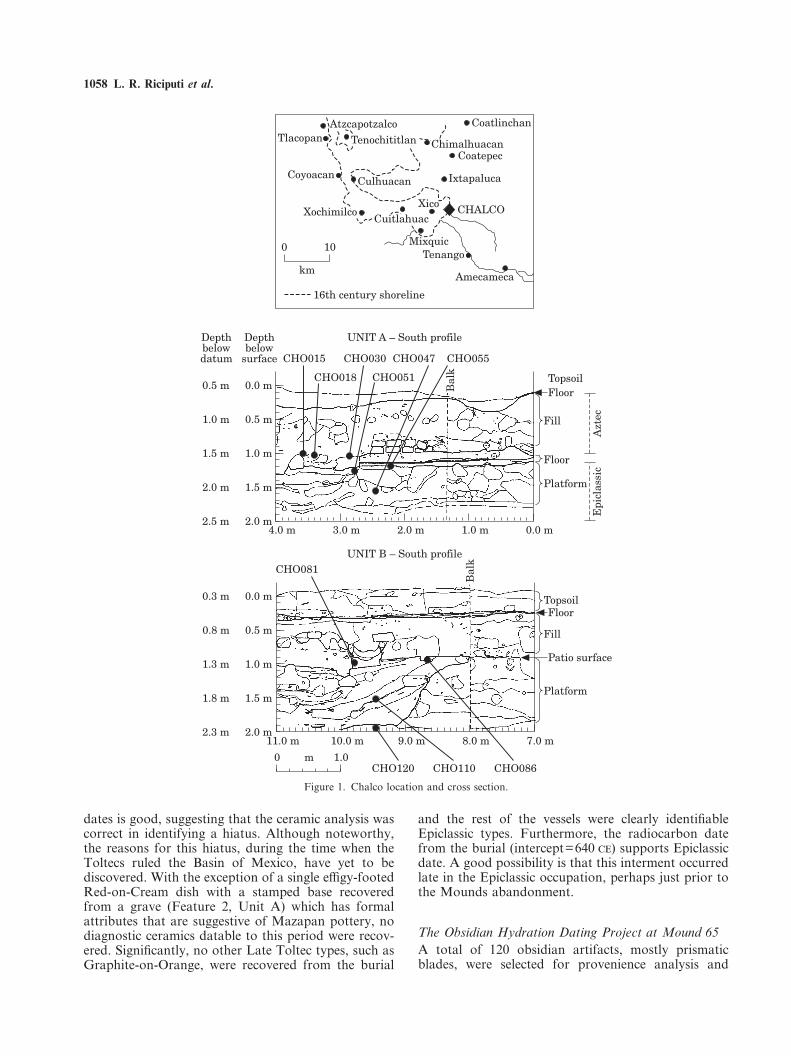
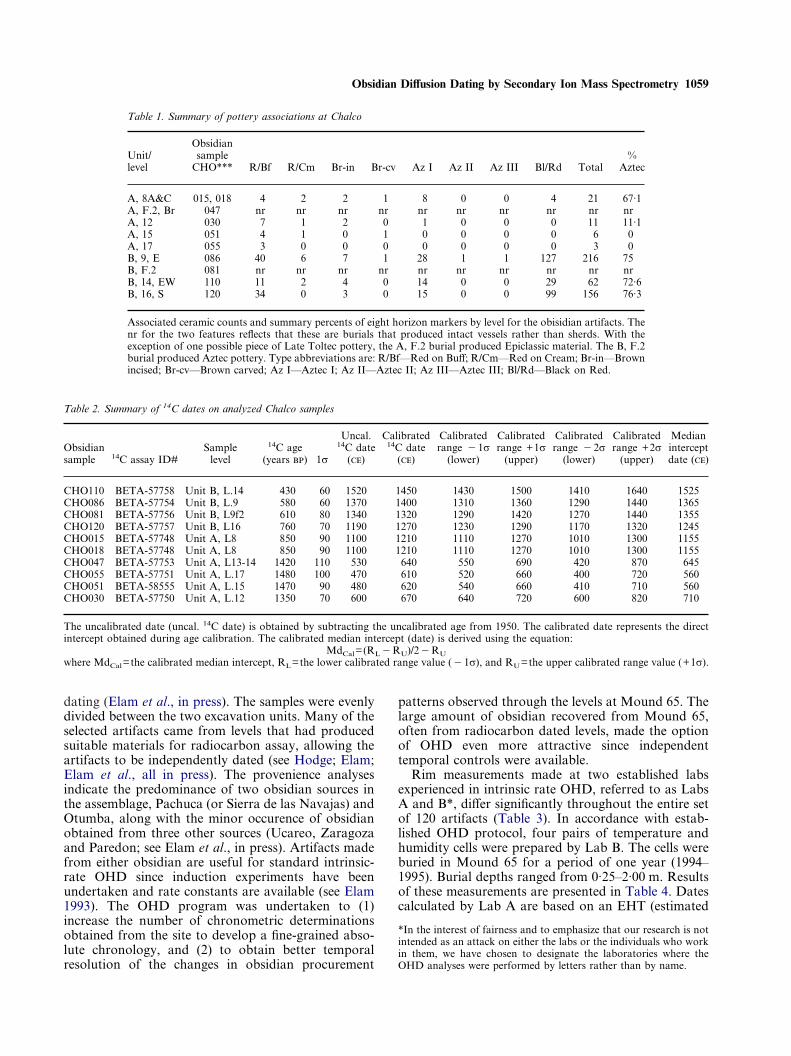
The ancient city-state of Chalco was located alongthe southeastern shore of Lake Chalco in the Basin ofMexico (Figure 1). Little is known of the Classic(200–750 ) period of settlement, but during the EarlyPostclassic (750–1200 ) Chalco grew to be the prin-cipal city of the Chalca, and was one of 40 major urbancentres in the Basin of Mexico during the LatePostclassic (�1200–1521 ) (Sanders et al., 1979;Parsons et al., 1982; Hodge, in press). The artifactsanalysed for this report were recovered during the 1992excavation of Mound 65 (formerly known as siteCh-ET-27), directed by the late Mary Hodge. Previouswork at the site indicated the presence of both EarlyToltec (Early Postclassic) and Aztec occupations(Parsons et al., 1982; Hodge, in press). The excavationphase of the project involved two units, designated‘‘A’’ and ‘‘B’’. Both excavation units encompassed asurface area of 2�4 m2 and were hand excavatedaccording to natural stratigraphy. As illustrated inFigure 1, Unit A was excavated to a depth of 2·33 mrevealing a total of 20 cultural levels, and Unit B wasexcavated to a depth of 2·37 m revealing 16 distinctcultural levels.
Chronology at Mound 65: CeramicsCombined excavation and surface collection recovereda total of 990 kg of potsherds. Analysis identified atotal of 6660 diagnostic rim sherds, including 2588recovered by surface collection (Hodge, in press).Analysis of the diagnostic rims was undertaken todetermine the degree of local variability in the ceramicassemblage at Mound 65 and to fit the site into theregional Basin of Mexico chronology (Hodge, in press).The analysis revealed two major occupations. The firstdates to the Epiclassic (also known as the Early Toltecperiod or the Coyotlatelco phase) and spans the period750–950 (Sanders et al., 1979). The second spansthe Aztec period, encompassing all three sub-periodsnumbered Aztec I–III (Sanders et al., 1979) coveringthe epoch 1150–1519 . This indicates a hiatus(abandonment) at Mound 65 of roughly 200 years.
A detailed review of the results of the ceramicanalysis is beyond the scope of this report, but Table 1presents a summary of the counts and percents of eightimportant pottery types recovered from Mound 65 forlevels that produced an obsidian artifact analysed forthis report. Although more than 60 types of vesselswere identified during the analysis (Hodge, in press),these eight types are considered to be excellent regionalhorizon markers and thus link Mound 65 to the widerchronology of the Basin of Mexico. Types indicative ofthe Epiclassic include Red-on-Buff (the hallmarkCoyotlatelco phase horizon marker), Red-on-Cream,Brown Incised and Brown Carved. Types considereddatable to the Aztec periods include Aztec Black-on-Orange (variants I, II & III; once again, ideal horizonmarkers) and Black-on-Red. Table 1 clearly depicts thedichotomy in occupation noted during the ceramicanalysis. The Epiclassic occupation at Mound 65 isseen primarily in the deepest levels of Unit A. Unit Bmainly reflects the Aztec period occupation. Note thatthe absence of values for the two features (associatedwith obsidian samples CHO047 and CHO081) reflectsthe fact that these are burials that produced intactvessels.
Chronology of Mound 65: Radiocarbon AssayMound 65 was relatively rich in samples suitable forradiocarbon dating, especially charcoal and other car-bonized plant remains, but also bone. All of thecollected samples were submitted to Beta Analytic foranalysis. Table 2 presents the radiocarbon dates for thelevels that yielded obsidian artifacts discussed in thisreport. The radiocarbon dates indicated occupations atMound 65 dating from 400–1620 (based on 2 sigmacalibrated ranges) with a hiatus occurring roughlyfrom 900–1100 . One significant aspect of the radio-carbon assay is the indication that the Epiclassic periodbegins substantially earlier than previously believed,but further analysis is needed from other sites in thesouthern Basin to substantiate this possibility. Agree-ment between the ceramic data and the radiocarbon
1058 L. R. Riciputi et al.
dates is good, suggesting that the ceramic analysis wascorrect in identifying a hiatus. Although noteworthy,the reasons for this hiatus, during the time when theToltecs ruled the Basin of Mexico, have yet to bediscovered. With the exception of a single effigy-footedRed-on-Cream dish with a stamped base recoveredfrom a grave (Feature 2, Unit A) which has formalattributes that are suggestive of Mazapan pottery, nodiagnostic ceramics datable to this period were recov-ered. Significantly, no other Late Toltec types, such asGraphite-on-Orange, were recovered from the burial
and the rest of the vessels were clearly identifiableEpiclassic types. Furthermore, the radiocarbon datefrom the burial (intercept=640 ) supports Epiclassicdate. A good possibility is that this interment occurredlate in the Epiclassic occupation, perhaps just prior tothe Mounds abandonment.
7.0 m11.0 m 10.0 m 9.0 m 8.0 m2.3 m
0.3 m
1.8 m
1.3 m
0.8 m
Bal
k
CHO081
Fill
Floor
Platform
UNIT B – South profile
Patio surface
Topsoil
CHO120 CHO110 CHO0861.00 m
2.0 m
0.0 m
1.5 m
1.0 m
0.5 m
Coatepec
Ixtapaluca
CoatlinchanAtzcapotzalcoTlacopan
CulhuacanCoyoacan
CHALCOXico
MixquicTenango
Amecameca
Tenochititlan Chimalhuacan
XochimilcoCuitlahuac
0 10
km
16th century shoreline
0.0 m4.0 m 3.0 m 2.0 m 1.0 m
Depthbelow
surface
2.0 m
0.0 m
1.5 m
1.0 m
0.5 m
Depthbelowdatum
2.5 m
0.5 m
2.0 m
1.5 m
1.0 m
Bal
k
CHO015
CHO018
CHO030
CHO051
CHO047 CHO055
Fill
FloorTopsoil
Platform
Floor
Azt
ecE
picl
assi
c
UNIT A – South profile
Figure 1. Chalco location and cross section.
The Obsidian Hydration Dating Project at Mound 65A total of 120 obsidian artifacts, mostly prismaticblades, were selected for provenience analysis and
Obsidian Diffusion Dating by Secondary Ion Mass Spectrometry 1059
*In the interest of fairness and to emphasize that our research is notintended as an attack on either the labs or the individuals who workin them, we have chosen to designate the laboratories where theOHD analyses were performed by letters rather than by name.
Table 1. Summary of pottery associations at Chalco
Unit/level
Obsidiansample
CHO*** R/Bf R/Cm Br-in Br-cv Az I Az II Az III Bl/Rd Total%
Aztec
A, 8A&C 015, 018 4 2 2 1 8 0 0 4 21 67·1A, F.2, Br 047 nr nr nr nr nr nr nr nr nr nrA, 12 030 7 1 2 0 1 0 0 0 11 11·1A, 15 051 4 1 0 1 0 0 0 0 6 0A, 17 055 3 0 0 0 0 0 0 0 3 0B, 9, E 086 40 6 7 1 28 1 1 127 216 75B, F.2 081 nr nr nr nr nr nr nr nr nr nrB, 14, EW 110 11 2 4 0 14 0 0 29 62 72·6B, 16, S 120 34 0 3 0 15 0 0 99 156 76·3
Associated ceramic counts and summary percents of eight horizon markers by level for the obisidian artifacts. Thenr for the two features reflects that these are burials that produced intact vessels rather than sherds. With theexception of one possible piece of Late Toltec pottery, the A, F.2 burial produced Epiclassic material. The B, F.2burial produced Aztec pottery. Type abbreviations are: R/Bf—Red on Buff; R/Cm—Red on Cream; Br-in—Brownincised; Br-cv—Brown carved; Az I—Aztec I; Az II—Aztec II; Az III—Aztec III; Bl/Rd—Black on Red.
Table 2. Summary of 14C dates on analyzed Chalco samples
Obsidiansample 14C assay ID#
Samplelevel
14C age(years ) 1�
Uncal.14C date
()
Calibrated14C date
()
Calibratedrange �1�
(lower)
Calibratedrange +1�
(upper)
Calibratedrange �2�
(lower)
Calibratedrange +2�
(upper)
Medianinterceptdate ()
CHO110 BETA-57758 Unit B, L.14 430 60 1520 1450 1430 1500 1410 1640 1525CHO086 BETA-57754 Unit B, L.9 580 60 1370 1400 1310 1360 1290 1440 1365CHO081 BETA-57756 Unit B, L9f2 610 80 1340 1320 1290 1420 1270 1440 1355CHO120 BETA-57757 Unit B, L16 760 70 1190 1270 1230 1290 1170 1320 1245CHO015 BETA-57748 Unit A, L8 850 90 1100 1210 1110 1270 1010 1300 1155CHO018 BETA-57748 Unit A, L8 850 90 1100 1210 1110 1270 1010 1300 1155CHO047 BETA-57753 Unit A, L13-14 1420 110 530 640 550 690 420 870 645CHO055 BETA-57751 Unit A, L.17 1480 100 470 610 520 660 400 720 560CHO051 BETA-58555 Unit A, L.15 1470 90 480 620 540 660 410 710 560CHO030 BETA-57750 Unit A, L.12 1350 70 600 670 640 720 600 820 710
The uncalibrated date (uncal. 14C date) is obtained by subtracting the uncalibrated age from 1950. The calibrated date represents the directintercept obtained during age calibration. The calibrated median intercept (date) is derived using the equation:
MdCal=(RL�RU)/2�RU
where MdCal=the calibrated median intercept, RL=the lower calibrated range value (�1�), and RU=the upper calibrated range value (+1�).
dating (Elam et al., in press). The samples were evenlydivided between the two excavation units. Many of theselected artifacts came from levels that had producedsuitable materials for radiocarbon assay, allowing theartifacts to be independently dated (see Hodge; Elam;Elam et al., all in press). The provenience analysesindicate the predominance of two obsidian sources inthe assemblage, Pachuca (or Sierra de las Navajas) andOtumba, along with the minor occurence of obsidianobtained from three other sources (Ucareo, Zaragozaand Paredon; see Elam et al., in press). Artifacts madefrom either obsidian are useful for standard intrinsic-rate OHD since induction experiments have beenundertaken and rate constants are available (see Elam1993). The OHD program was undertaken to (1)increase the number of chronometric determinationsobtained from the site to develop a fine-grained abso-lute chronology, and (2) to obtain better temporalresolution of the changes in obsidian procurement
patterns observed through the levels at Mound 65. Thelarge amount of obsidian recovered from Mound 65,often from radiocarbon dated levels, made the optionof OHD even more attractive since independenttemporal controls were available.
Rim measurements made at two established labsexperienced in intrinsic rate OHD, referred to as LabsA and B*, differ significantly throughout the entire setof 120 artifacts (Table 3). In accordance with estab-lished OHD protocol, four pairs of temperature andhumidity cells were prepared by Lab B. The cells wereburied in Mound 65 for a period of one year (1994–1995). Burial depths ranged from 0·25–2·00 m. Resultsof these measurements are presented in Table 4. Datescalculated by Lab A are based on an EHT (estimated
1060 L. R. Riciputi et al.
hydration temperature) of 20�C and a Rh (relativehumidity) of 100%, and those of Lab B are based on aEHT of 19·4�C and 97·5% Rh. The Lab A valuerepresents the upper range of recorded temperatures(see Table 4), whereas the values used by Lab B werethe averages of the cell values. The dates calculatedusing the two data sets disagree, and neither set ofmeasurements produced acceptable results when com-pared to either 14C dates or ceramic assemblages.Using the same set of temperature and humidity valuesto recalculate the dates does not improve the agree-ment between the two labs. Use of ambient air tem-perature data from Chalco (Garcia M, 1987) and theconversion equation of Lee (1969) results in an EHT of16·3�C, substantially lower than that obtained by directmeasurement. Dates based on this value are even moreunacceptable than the ones based on the temperature-humidity cells. Regardless of which EHT and Rhvalues are used, the results are discordant with theradiocarbon assays and ceramic data. In fact, theresults from the OHD program are so at odds (insome cases by thousands of years) with the other
chronological indicators that they could not be usedand were excluded from the excavation report.
The sample set from Mound 65 is ideal for demon-strating both the potential of obsidian as a chronom-eter and the advantages of the ODDSIMS method.The attractiveness of this sample set lies in the contex-tual integrity of Mound 65 (as demonstrated by thecareful excavation of Dr Hodge), the fact that obsidiandating was a primary focus of the excavation, and bythe independent chronological control provided by thedetailed radiocarbon sequence. To demonstrate theadvantages of the ODDSIMS approach, we selected 10artifacts manufactured from Pachuca obsidian (Table1) from the original OHD sample set, based on havingan associated 14C date and to span the range ofoccupation at Chalco.
Analytical Methods
SIMS analysisTable 3. Summary of measured parameters in Chalco samples
Obsidiansample
Maximumwt% H2O
Fittedsurface
wt% H2O
SIMShalf-fall
depth (�m)
SIMSinflection
depth (�m)
Lab AOHD
Depth (�m)
Lab BOHD
Depth (�m)
Lab AOHD
date ()
Lab BOHD
date ()
CHO110 8·18 9·0 1·97 2·18 2·53 2·28 1108 794CHO110 8·20 9·1 2·11 2·30 2·53 2·28 1108 794CHO086 8·36 8·9 2·08 2·21 2·49 2·34 1137 768CHO081 8·16 9·0 2·19 2·38 2·52 2·53 1113 550CHO081 8·36 9·0 2·28 2·44 2·52 2·53 1113 550CHO120 8·58 8·8 2·23 2·41 2·85 2·51 866 585CHO015 8·88 9·4 2·41 2·63 2·59 2·58 1062 613CHO018 8·92 9·1 2·48 2·85 2·76 2·86 937 149CHO047 10·00 10·2 3·79 4·19 3·56 3·43 228 �551CHO055 10·09 10·0 3·81 4·25 3·60 3·56 194 �805CHO051 9·95 9·85 4·00 4·40 4·29 3·71 �576 �984CHO051 10·10 3·87 4·29 3·71 �576 �984CHO030 9·32 9·9 2·69 2·91 2·93 2·78 802 343
OHD dates for Lab A calculated from measured depths using an EHT of 20�C and a Rh of 100%.OHD dates for Lab B calculated from measured depths using an EHT of 19·4�C and an Rh of 97·5%.Note that a ‘‘�’’ sign before an OHD date indicates .
Table 4. Summary of Ambrose cell measurements at the Chalco site
Cell #
Depth belowmound surface
(cm)EHT(�C) Rh
94–194–2 25 20·3 95%94–3 5094–4 50 19·1 97%94–5 10094–6 100 18·9 98%94–7 20094–8 200 19·3 100%
Sample preparation. To prepare samples for ODD-SIMS analysis, small cross-sections (approximately1 mm wide) were cut from each of the obsidian arti-facts. The ventral face was typically chosen for analysisbecause it is the flattest and broadest surface of atypical prismatic blade. Five to six holes were drilled in1 in diameter, 3
8in thick aluminum disks. Epoxy was
used to mount the obsidian samples in these holes withthe hydrated surface exposed. A sample of freshlypolished Pachuca obsidian was also mounted in eachdisk to (a) ensure the availability of a flat surface to aidwith calibrating sputter depths (see discussion below)and (b) provide an internal standard. The finisheddisks were coated with a thin layer of gold to providesurface conductivity. To minimize the presence ofadsorbed water, samples were baked at 45�C for
Obsidian Diffusion Dating by Secondary Ion Mass Spectrometry 1061
12–18 h prior to analysis before introduction into thevacuum system of the mass spectrometer, whichoccurred a minimum of 12 h before analysis. Exper-iments discussed below indicate that these stepsresult in minimization of adsorbed hydrogen prior toanalysis.
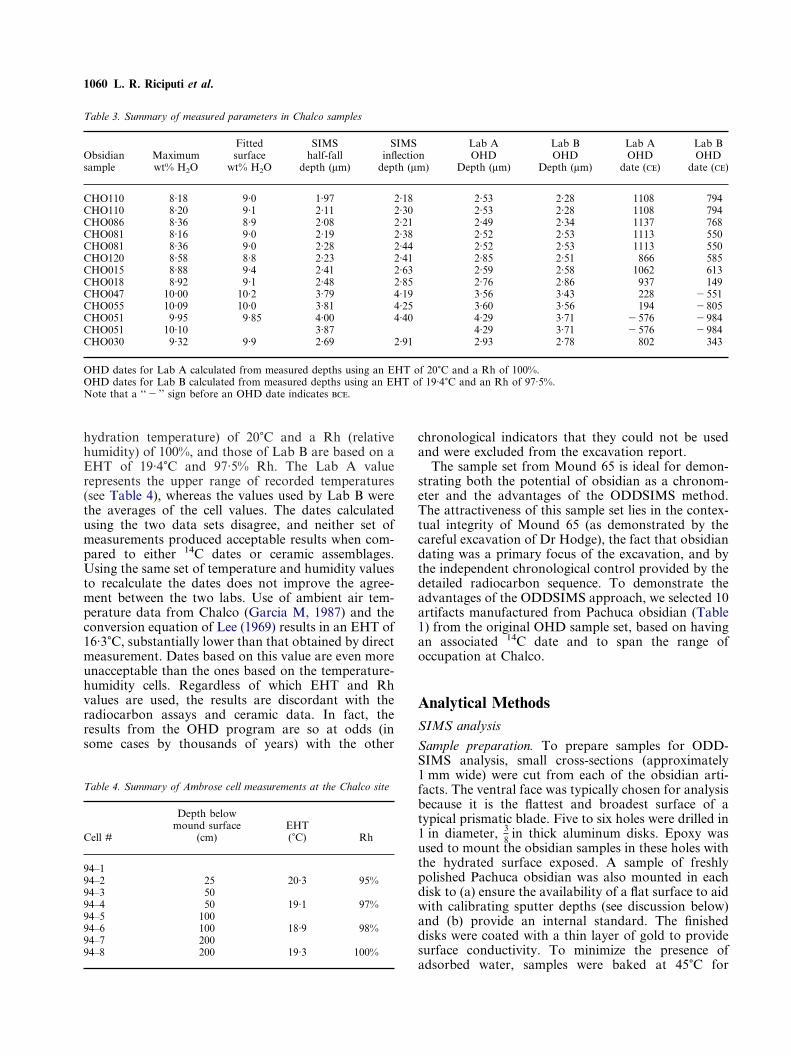
Analytical conditions. The distribution of hydrogen(and other elements including O, Na, Mg, Al, K, Ca,Fe) as a function of depth (depth-profiles) wasmeasured using a Cameca 4f secondary ion massspectrometer. The SIMS technique utilizes a focused,mass selected beam of primary ions accelerated tosputter the surface of the obsidian. For these analyses,negatively-charged, 16O primary ions were acceleratedat 12·5 keV. The primary beam, with a diameter of�50 �m and a current of 130 nA, was rastered over anarea of 150�150 �m2 to produce a well-shaped craterwith a flat bottom (Figure 2). The primary ion beamslowly sputters into the sample surface (a few atomlayers at a time; the sputter rate was �2·2 �m/h). Bymonitoring changes in the intensity of secondary ionsejected from the sample surface as a function of time, aspatially resolved profile of changing elemental concen-trations as a function of depth is obtained. Positivelycharged secondary ions with 80�20 eV of excesskinetic energy were analysed. Use of the 150 �m diam-eter transfer lens and a 400 �m diameter field aperturerestricts transmission so that only ions from the central33 �m of the sputter crater are transmitted through thesecondary mass spectrometer. Selected masses wereanalysed by cycling the secondary ion magnet throughthe masses of interest. Secondary ion signals weremonitored using an electron multiplier, with counttimes of 1–3 s per cycle per element of interest. Ionyields of the different elements are directly correlatedwith concentration, and were calibrated using a suite ofglass standards. The intensity of 30Si was used as areference species to correct for variations in secondaryion intensities due to changes in primary ion beamintensity between different analyses.
Measurement of sputter crater depth. One critical stepin the analytical procedure is measurement of craterdepth, because without this information, the time-series elemental distributions obtained during theSIMS analysis can not be depth-calibrated. Craterdepths were measured using an Tencor Alpha-Step 200profilometer. For most samples, the craters are veryregular in shape with wide, flat, bottoms, indicatingthat depth resolution was optimized during the analysis(Figure 2). Repeated depth measurement on craterssputtered on flat samples indicates that reproducibilityof the depth measurement is better than 3%.
For some samples, fractures, excessive curvature,and other surface imperfections make determination ofthe sputter depth using the surface profilometer muchless certain. Fortunately, if the primary beam current iskept constant, the sputter rate is also constant. Aspreviously noted, a flat piece of polished Pachucaobsidian was mounted in every sample block to ensurethe presence of a flat surface. Craters were routinelysputtered into this material to provide a check on thesputter rate. Crater depth versus sputter time (in mag-netic cycles) is plotted in Figure 3 for both the polishedsamples and the unknowns. The correlation betweensputter rate and crater depth is linear and very repro-ducible, even over a span of several days. Using thiscalibration, the sputter depth can be estimated accu-rately even on samples where direct profilometermeasurements are difficult.
–8
2
Width (µm)
Dep
th (
µm)
0
0
–2
–4
–6
300200100
Figure 2. Shape of typical crater sputtered in obsidian during aSIMS analysis. Only ions from the centre �30 �m of the crater (flatarea) are analysed. Note �40:1 vertical exaggeration.
10
600
Depth (µm)
# A
nal
ytic
al c
ycle
s
0
100
300
500
200
84
400
2 6
2-5-992-4-992-3-992-2-992-1-991-28-99
Figure 3. Plot of crater depth as a function of number of analyticalcycles on Pachuca obsidian. Data obtained over a 2 week period. Allanalyses conducted using a 130 nA primary ion beam rastered over a150�150 �m2 area. Analytical cycles are directly correlated to timeof sputtering (100 cycles�45 min).
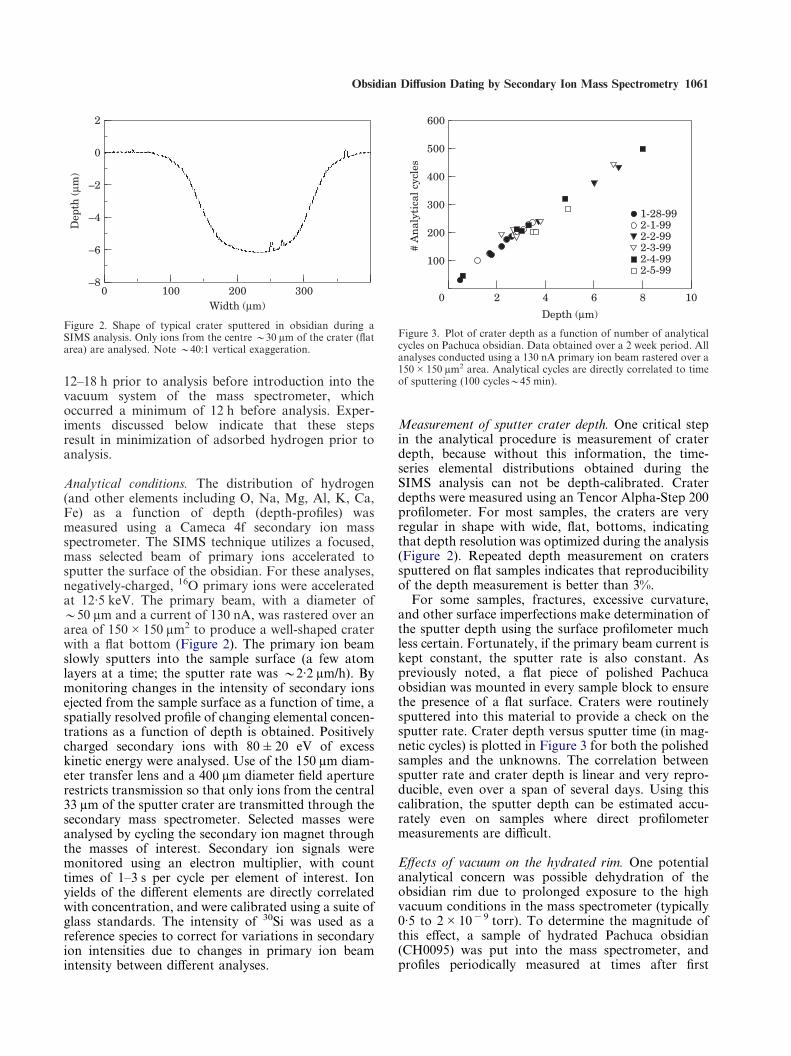
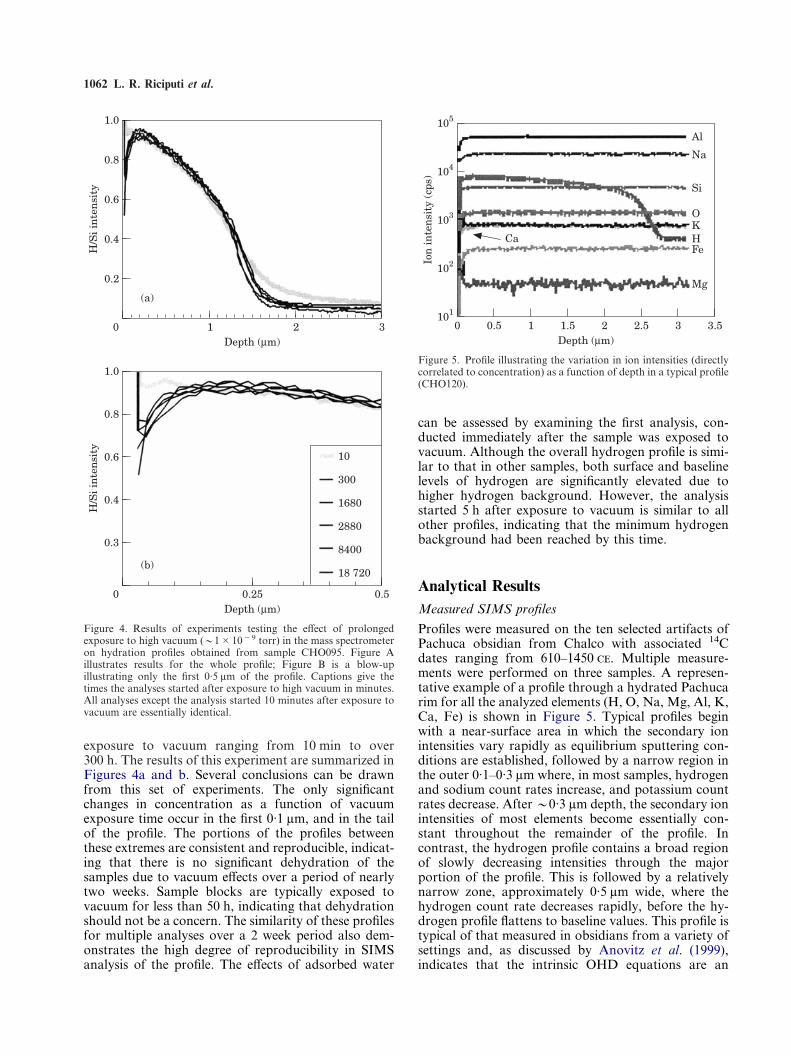
Effects of vacuum on the hydrated rim. One potentialanalytical concern was possible dehydration of theobsidian rim due to prolonged exposure to the highvacuum conditions in the mass spectrometer (typically0·5 to 2�10�9 torr). To determine the magnitude ofthis effect, a sample of hydrated Pachuca obsidian(CH0095) was put into the mass spectrometer, andprofiles periodically measured at times after first
1062 L. R. Riciputi et al.
exposure to vacuum ranging from 10 min to over300 h. The results of this experiment are summarized inFigures 4a and b. Several conclusions can be drawnfrom this set of experiments. The only significantchanges in concentration as a function of vacuumexposure time occur in the first 0·1 �m, and in the tailof the profile. The portions of the profiles betweenthese extremes are consistent and reproducible, indicat-ing that there is no significant dehydration of thesamples due to vacuum effects over a period of nearlytwo weeks. Sample blocks are typically exposed tovacuum for less than 50 h, indicating that dehydrationshould not be a concern. The similarity of these profilesfor multiple analyses over a 2 week period also dem-onstrates the high degree of reproducibility in SIMSanalysis of the profile. The effects of adsorbed water
can be assessed by examining the first analysis, con-ducted immediately after the sample was exposed tovacuum. Although the overall hydrogen profile is simi-lar to that in other samples, both surface and baselinelevels of hydrogen are significantly elevated due tohigher hydrogen background. However, the analysisstarted 5 h after exposure to vacuum is similar to allother profiles, indicating that the minimum hydrogenbackground had been reached by this time.
Analytical Results
0.51.0
Depth (µm)
H/S
i in
ten
sity
0.8
0
0.6
0.4
0.3
0.25
3
1.0
Depth (µm)
H/S
i in
ten
sity
0.8
0
0.6
0.4
0.2
21
(b)
(a)
10
18 720
8400
2880
1680
300
Figure 4. Results of experiments testing the effect of prolongedexposure to high vacuum (�1�10�9 torr) in the mass spectrometeron hydration profiles obtained from sample CHO095. Figure Aillustrates results for the whole profile; Figure B is a blow-upillustrating only the first 0·5 �m of the profile. Captions give thetimes the analyses started after exposure to high vacuum in minutes.All analyses except the analysis started 10 minutes after exposure tovacuum are essentially identical.
101
3.5
105
Depth (µm)
Ca
Ion
inte
nsi
ty (
cps)
0
104
103
102
32.521.510.5
Al
Na
Si
OKHFe
Mg
Figure 5. Profile illustrating the variation in ion intensities (directlycorrelated to concentration) as a function of depth in a typical profile(CHO120).
Measured SIMS profiles
Profiles were measured on the ten selected artifacts ofPachuca obsidian from Chalco with associated 14Cdates ranging from 610–1450 . Multiple measure-ments were performed on three samples. A represen-tative example of a profile through a hydrated Pachucarim for all the analyzed elements (H, O, Na, Mg, Al, K,Ca, Fe) is shown in Figure 5. Typical profiles beginwith a near-surface area in which the secondary ionintensities vary rapidly as equilibrium sputtering con-ditions are established, followed by a narrow region inthe outer 0·1–0·3 �m where, in most samples, hydrogenand sodium count rates increase, and potassium countrates decrease. After �0·3 �m depth, the secondary ionintensities of most elements become essentially con-stant throughout the remainder of the profile. Incontrast, the hydrogen profile contains a broad regionof slowly decreasing intensities through the majorportion of the profile. This is followed by a relativelynarrow zone, approximately 0·5 �m wide, where thehydrogen count rate decreases rapidly, before the hy-drogen profile flattens to baseline values. This profile istypical of that measured in obsidians from a variety ofsettings and, as discussed by Anovitz et al. (1999),indicates that the intrinsic OHD equations are an
Obsidian Diffusion Dating by Secondary Ion Mass Spectrometry 1063
incorrect model of the actual hydration process. Oneadditional important observation is that the oxygenconcentration appears to be constant throughoutthe entire depth profile, which, as discussed below,has important ramifications for the mechanism ofhydration.
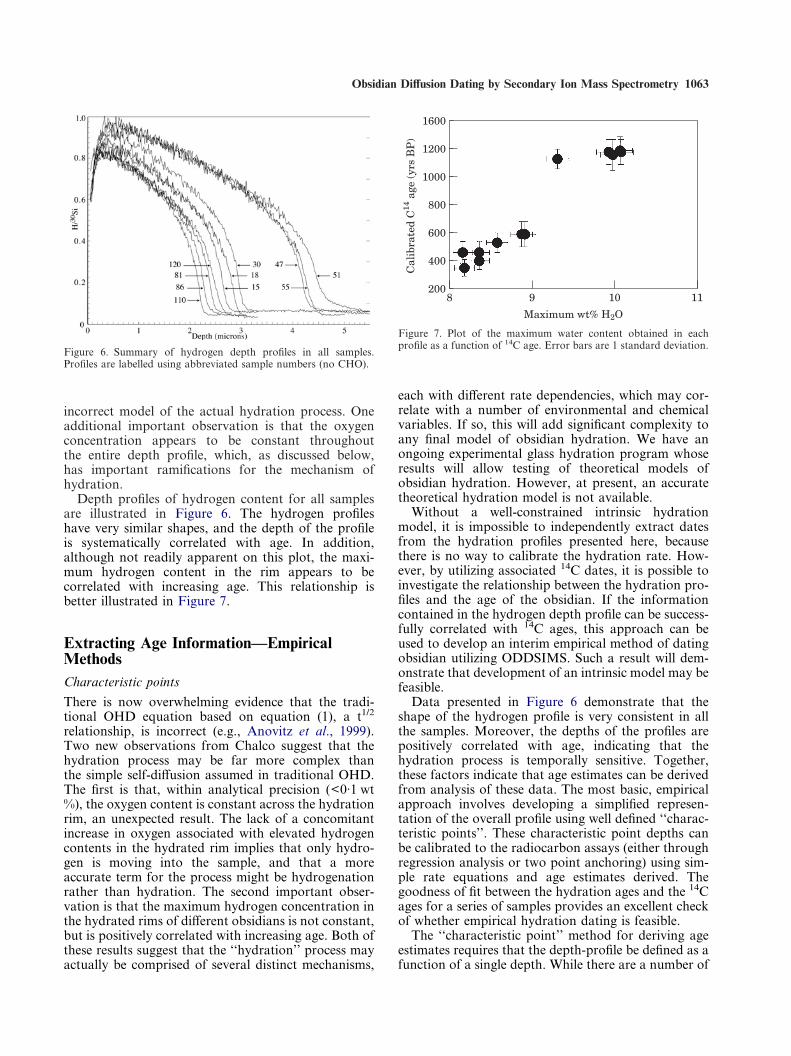
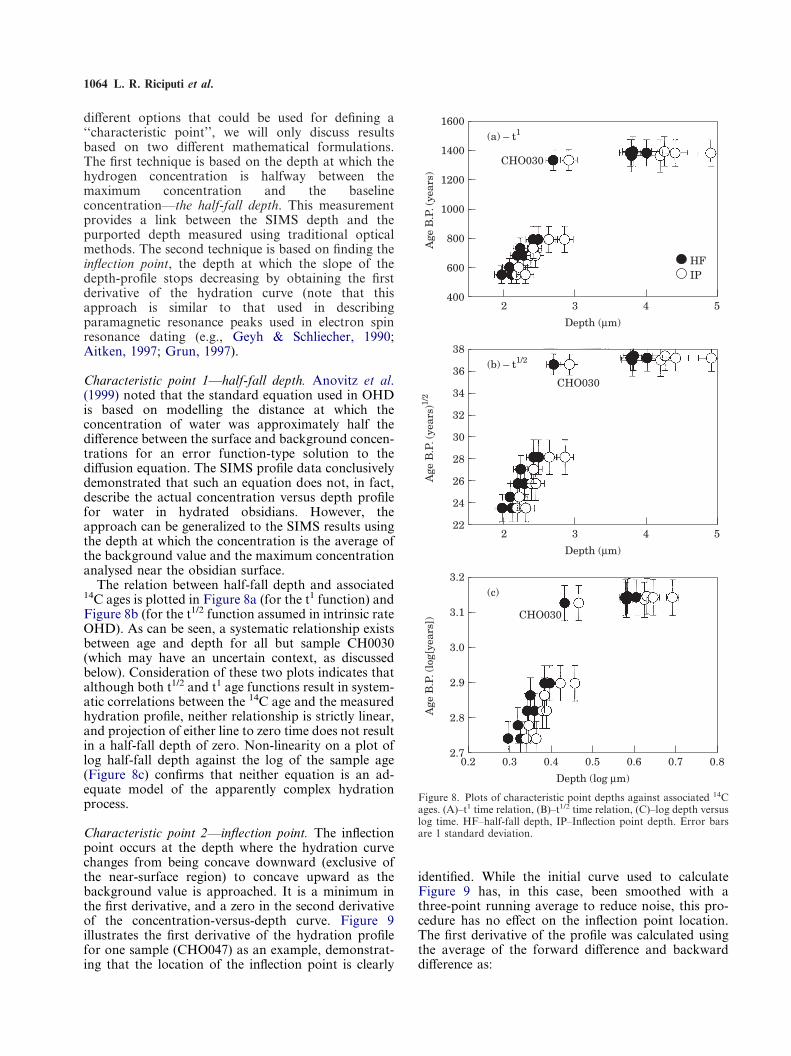
Depth profiles of hydrogen content for all samplesare illustrated in Figure 6. The hydrogen profileshave very similar shapes, and the depth of the profileis systematically correlated with age. In addition,although not readily apparent on this plot, the maxi-mum hydrogen content in the rim appears to becorrelated with increasing age. This relationship isbetter illustrated in Figure 7.
Extracting Age Information—EmpiricalMethods
Figure 6. Summary of hydrogen depth profiles in all samples.Profiles are labelled using abbreviated sample numbers (no CHO).
20011
1600
Maximum wt% H2O
Cal
ibra
ted
C14
age
(yr
s B
P)
8
400
600
1000
1200
800
109
Figure 7. Plot of the maximum water content obtained in eachprofile as a function of 14C age. Error bars are 1 standard deviation.
Characteristic points
There is now overwhelming evidence that the tradi-tional OHD equation based on equation (1), a t1/2
relationship, is incorrect (e.g., Anovitz et al., 1999).Two new observations from Chalco suggest that thehydration process may be far more complex thanthe simple self-diffusion assumed in traditional OHD.The first is that, within analytical precision (<0·1 wt%), the oxygen content is constant across the hydrationrim, an unexpected result. The lack of a concomitantincrease in oxygen associated with elevated hydrogencontents in the hydrated rim implies that only hydro-gen is moving into the sample, and that a moreaccurate term for the process might be hydrogenationrather than hydration. The second important obser-vation is that the maximum hydrogen concentration inthe hydrated rims of different obsidians is not constant,but is positively correlated with increasing age. Both ofthese results suggest that the ‘‘hydration’’ process mayactually be comprised of several distinct mechanisms,
each with different rate dependencies, which may cor-relate with a number of environmental and chemicalvariables. If so, this will add significant complexity toany final model of obsidian hydration. We have anongoing experimental glass hydration program whoseresults will allow testing of theoretical models ofobsidian hydration. However, at present, an accuratetheoretical hydration model is not available.
Without a well-constrained intrinsic hydrationmodel, it is impossible to independently extract datesfrom the hydration profiles presented here, becausethere is no way to calibrate the hydration rate. How-ever, by utilizing associated 14C dates, it is possible toinvestigate the relationship between the hydration pro-files and the age of the obsidian. If the informationcontained in the hydrogen depth profile can be success-fully correlated with 14C ages, this approach can beused to develop an interim empirical method of datingobsidian utilizing ODDSIMS. Such a result will dem-onstrate that development of an intrinsic model may befeasible.
Data presented in Figure 6 demonstrate that theshape of the hydrogen profile is very consistent in allthe samples. Moreover, the depths of the profiles arepositively correlated with age, indicating that thehydration process is temporally sensitive. Together,these factors indicate that age estimates can be derivedfrom analysis of these data. The most basic, empiricalapproach involves developing a simplified represen-tation of the overall profile using well defined ‘‘charac-teristic points’’. These characteristic point depths canbe calibrated to the radiocarbon assays (either throughregression analysis or two point anchoring) using sim-ple rate equations and age estimates derived. Thegoodness of fit between the hydration ages and the 14Cages for a series of samples provides an excellent checkof whether empirical hydration dating is feasible.
The ‘‘characteristic point’’ method for deriving ageestimates requires that the depth-profile be defined as afunction of a single depth. While there are a number of
1064 L. R. Riciputi et al.
different options that could be used for defining a‘‘characteristic point’’, we will only discuss resultsbased on two different mathematical formulations.The first technique is based on the depth at which thehydrogen concentration is halfway between themaximum concentration and the baselineconcentration—the half-fall depth. This measurementprovides a link between the SIMS depth and thepurported depth measured using traditional opticalmethods. The second technique is based on finding theinflection point, the depth at which the slope of thedepth-profile stops decreasing by obtaining the firstderivative of the hydration curve (note that thisapproach is similar to that used in describingparamagnetic resonance peaks used in electron spinresonance dating (e.g., Geyh & Schliecher, 1990;Aitken, 1997; Grun, 1997).
HFIP
4005
1600
Depth (µm)
Age
B.P
. (ye
ars)
2
600
1000
1200
1400
800
43
(a) – t1
CHO030
225
38
Depth (µm)
Age
B.P
. (ye
ars)
1/2
2
24
32
34
36
28
43
(b) – t1/2
CHO030
30
26
2.70.8
3.2
Depth (log µm)
Age
B.P
. (lo
g[ye
ars]
)
0.2
2.8
3.0
3.1
2.9
0.70.5
(c)
CHO030
0.60.40.3
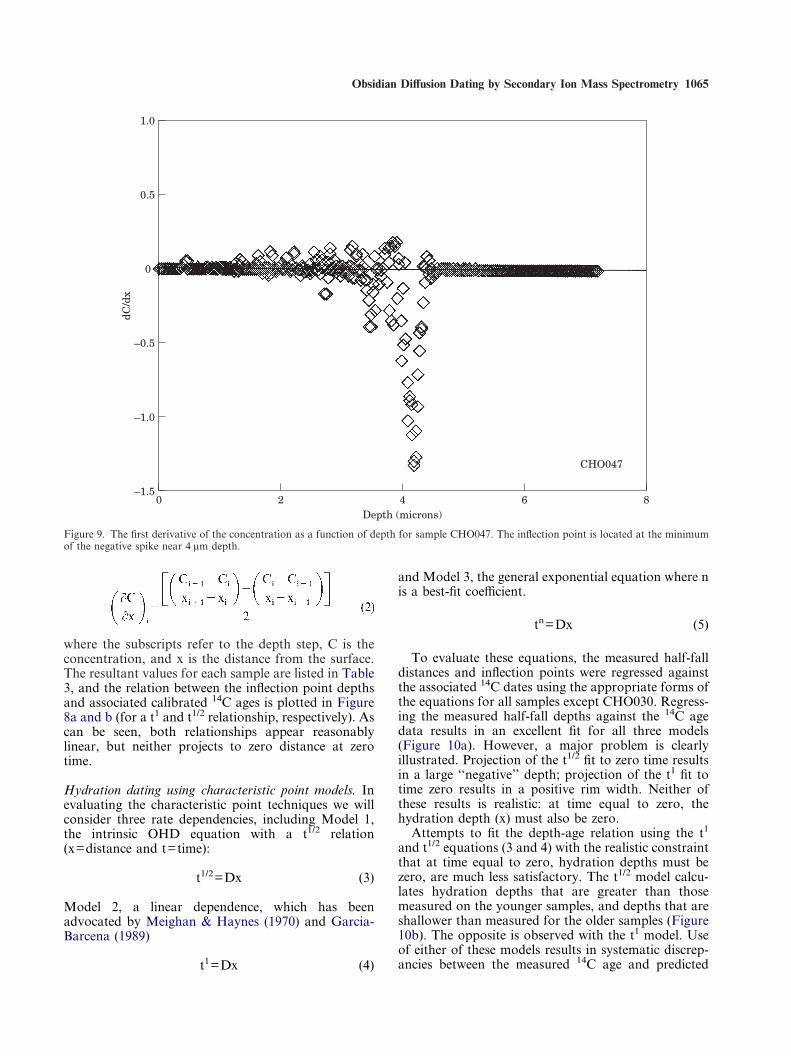
Figure 8. Plots of characteristic point depths against associated 14Cages. (A)–t1 time relation, (B)–t1/2 time relation, (C)–log depth versuslog time. HF–half-fall depth, IP–Inflection point depth. Error barsare 1 standard deviation.
Characteristic point 1—half-fall depth. Anovitz et al.(1999) noted that the standard equation used in OHDis based on modelling the distance at which theconcentration of water was approximately half thedifference between the surface and background concen-trations for an error function-type solution to thediffusion equation. The SIMS profile data conclusivelydemonstrated that such an equation does not, in fact,describe the actual concentration versus depth profilefor water in hydrated obsidians. However, theapproach can be generalized to the SIMS results usingthe depth at which the concentration is the average ofthe background value and the maximum concentrationanalysed near the obsidian surface.
The relation between half-fall depth and associated14C ages is plotted in Figure 8a (for the t1 function) andFigure 8b (for the t1/2 function assumed in intrinsic rateOHD). As can be seen, a systematic relationship existsbetween age and depth for all but sample CH0030(which may have an uncertain context, as discussedbelow). Consideration of these two plots indicates thatalthough both t1/2 and t1 age functions result in system-atic correlations between the 14C age and the measuredhydration profile, neither relationship is strictly linear,and projection of either line to zero time does not resultin a half-fall depth of zero. Non-linearity on a plot oflog half-fall depth against the log of the sample age(Figure 8c) confirms that neither equation is an ad-equate model of the apparently complex hydrationprocess.
Characteristic point 2—inflection point. The inflectionpoint occurs at the depth where the hydration curvechanges from being concave downward (exclusive ofthe near-surface region) to concave upward as thebackground value is approached. It is a minimum inthe first derivative, and a zero in the second derivativeof the concentration-versus-depth curve. Figure 9illustrates the first derivative of the hydration profilefor one sample (CHO047) as an example, demonstrat-ing that the location of the inflection point is clearly
identified. While the initial curve used to calculateFigure 9 has, in this case, been smoothed with athree-point running average to reduce noise, this pro-cedure has no effect on the inflection point location.The first derivative of the profile was calculated usingthe average of the forward difference and backwarddifference as:
Obsidian Diffusion Dating by Secondary Ion Mass Spectrometry 1065
8
1.0
Depth (microns)
dC/d
x
0.5
0
–0.5
–1.0
6420–1.5
CHO047
Figure 9. The first derivative of the concentration as a function of depth for sample CHO047. The inflection point is located at the minimumof the negative spike near 4 �m depth.
Hydration dating using characteristic point models. Inevaluating the characteristic point techniques we willconsider three rate dependencies, including Model 1,the intrinsic OHD equation with a t1/2 relation(x=distance and t=time):
t1/2=Dx (3)
Model 2, a linear dependence, which has beenadvocated by Meighan & Haynes (1970) and Garcia-Barcena (1989)
t1=Dx (4)
and Model 3, the general exponential equation where nis a best-fit coefficient.
tn=Dx (5)
To evaluate these equations, the measured half-falldistances and inflection points were regressed againstthe associated 14C dates using the appropriate forms ofthe equations for all samples except CHO030. Regress-ing the measured half-fall depths against the 14C agedata results in an excellent fit for all three models(Figure 10a). However, a major problem is clearlyillustrated. Projection of the t1/2 fit to zero time resultsin a large ‘‘negative’’ depth; projection of the t1 fit totime zero results in a positive rim width. Neither ofthese results is realistic: at time equal to zero, thehydration depth (x) must also be zero.
Attempts to fit the depth-age relation using the t1
and t1/2 equations (3 and 4) with the realistic constraintthat at time equal to zero, hydration depths must bezero, are much less satisfactory. The t1/2 model calcu-lates hydration depths that are greater than thosemeasured on the younger samples, and depths that areshallower than measured for the older samples (Figure10b). The opposite is observed with the t1 model. Useof either of these models results in systematic discrep-ancies between the measured 14C age and predicted
where the subscripts refer to the depth step, C is theconcentration, and x is the distance from the surface.The resultant values for each sample are listed in Table3, and the relation between the inflection point depthsand associated calibrated 14C ages is plotted in Figure8a and b (for a t1 and t1/2 relationship, respectively). Ascan be seen, both relationships appear reasonablylinear, but neither projects to zero distance at zerotime.
1066 L. R. Riciputi et al.
–20006
2000
Half-fall depth (µm)
Pre
dict
ed h
ydra
tion
dat
e (y
rs C
E)
0
–1000
1000
4
0
1 3
1500
–1500
500
–500
52
(c)
t1t1/2tn
Chalco samples
2000
6
Calibrated C14 ages (yrs BP)
Hal
f-fa
ll d
epth
(µm
)
0
4
2
500 1500
5
3
1
1000
(b)
–22500
6
Calibrated C14 ages (yrs BP)
Hal
f-fa
ll d
epth
(µm
)
0
4
500 1500
2
0
1000
(a)
2000
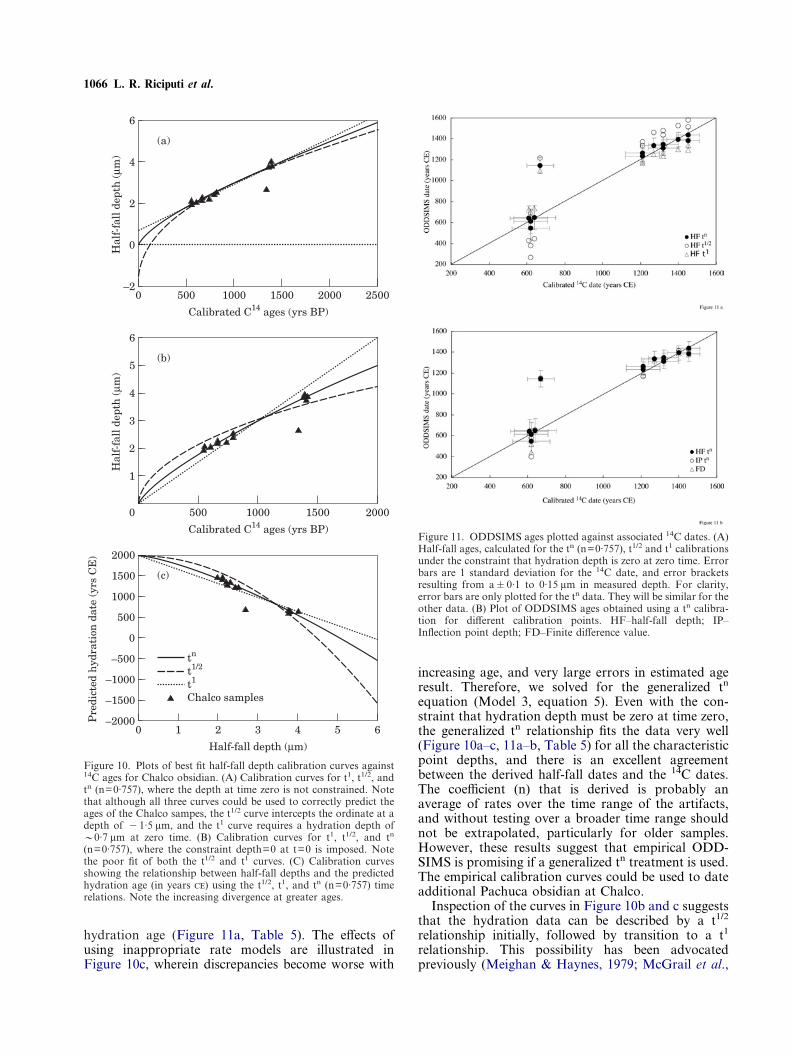
Figure 10. Plots of best fit half-fall depth calibration curves against14C ages for Chalco obsidian. (A) Calibration curves for t1, t1/2, andtn (n=0·757), where the depth at time zero is not constrained. Notethat although all three curves could be used to correctly predict theages of the Chalco sampes, the t1/2 curve intercepts the ordinate at adepth of �1·5 �m, and the t1 curve requires a hydration depth of�0·7 �m at zero time. (B) Calibration curves for t1, t1/2, and tn
(n=0·757), where the constraint depth=0 at t=0 is imposed. Notethe poor fit of both the t1/2 and t1 curves. (C) Calibration curvesshowing the relationship between half-fall depths and the predictedhydration age (in years ) using the t1/2, t1, and tn (n=0·757) timerelations. Note the increasing divergence at greater ages.
Figure 11. ODDSIMS ages plotted against associated 14C dates. (A)Half-fall ages, calculated for the tn (n=0·757), t1/2 and t1 calibrationsunder the constraint that hydration depth is zero at zero time. Errorbars are 1 standard deviation for the 14C date, and error bracketsresulting from a�0·1 to 0·15 �m in measured depth. For clarity,error bars are only plotted for the tn data. They will be similar for theother data. (B) Plot of ODDSIMS ages obtained using a tn calibra-tion for different calibration points. HF–half-fall depth; IP–Inflection point depth; FD–Finite difference value.
hydration age (Figure 11a, Table 5). The effects ofusing inappropriate rate models are illustrated inFigure 10c, wherein discrepancies become worse with
increasing age, and very large errors in estimated ageresult. Therefore, we solved for the generalized tn
equation (Model 3, equation 5). Even with the con-straint that hydration depth must be zero at time zero,the generalized tn relationship fits the data very well(Figure 10a–c, 11a–b, Table 5) for all the characteristicpoint depths, and there is an excellent agreementbetween the derived half-fall dates and the 14C dates.The coefficient (n) that is derived is probably anaverage of rates over the time range of the artifacts,and without testing over a broader time range shouldnot be extrapolated, particularly for older samples.However, these results suggest that empirical ODD-SIMS is promising if a generalized tn treatment is used.The empirical calibration curves could be used to dateadditional Pachuca obsidian at Chalco.
Inspection of the curves in Figure 10b and c suggeststhat the hydration data can be described by a t1/2
relationship initially, followed by transition to a t1
relationship. This possibility has been advocatedpreviously (Meighan & Haynes, 1979; McGrail et al.,
Obsidian Diffusion Dating by Secondary Ion Mass Spectrometry 1067
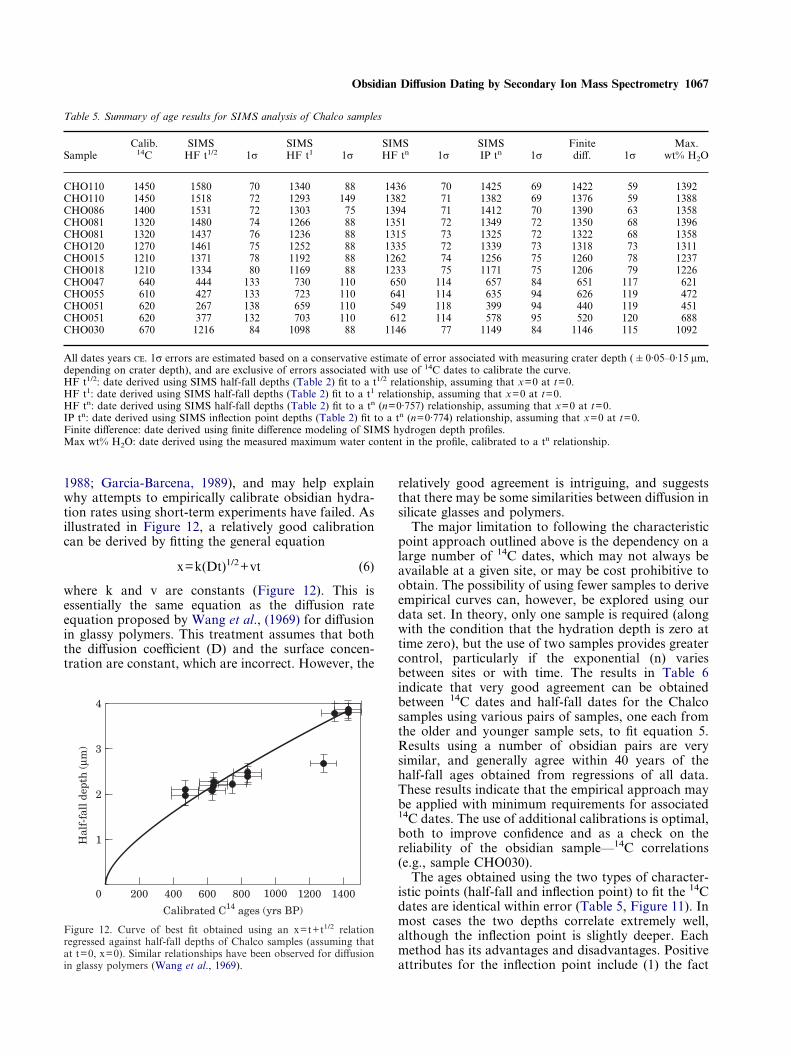
Table 5. Summary of age results for SIMS analysis of Chalco samples
SampleCalib.
14CSIMS
HF t1/2 1�SIMSHF t1 1�
SIMSHF tn 1�
SIMSIP tn 1�
Finitediff. 1�
Max.wt% H2O
CHO110 1450 1580 70 1340 88 1436 70 1425 69 1422 59 1392CHO110 1450 1518 72 1293 149 1382 71 1382 69 1376 59 1388CHO086 1400 1531 72 1303 75 1394 71 1412 70 1390 63 1358CHO081 1320 1480 74 1266 88 1351 72 1349 72 1350 68 1396CHO081 1320 1437 76 1236 88 1315 73 1325 72 1322 68 1358CHO120 1270 1461 75 1252 88 1335 72 1339 73 1318 73 1311CHO015 1210 1371 78 1192 88 1262 74 1256 75 1260 78 1237CHO018 1210 1334 80 1169 88 1233 75 1171 75 1206 79 1226CHO047 640 444 133 730 110 650 114 657 84 651 117 621CHO055 610 427 133 723 110 641 114 635 94 626 119 472CHO051 620 267 138 659 110 549 118 399 94 440 119 451CHO051 620 377 132 703 110 612 114 578 95 520 120 688CHO030 670 1216 84 1098 88 1146 77 1149 84 1146 115 1092
All dates years . 1� errors are estimated based on a conservative estimate of error associated with measuring crater depth (�0·05–0·15 �m,depending on crater depth), and are exclusive of errors associated with use of 14C dates to calibrate the curve.HF t1/2: date derived using SIMS half-fall depths (Table 2) fit to a t1/2 relationship, assuming that x=0 at t=0.HF t1: date derived using SIMS half-fall depths (Table 2) fit to a t1 relationship, assuming that x=0 at t=0.HF tn: date derived using SIMS half-fall depths (Table 2) fit to a tn (n=0·757) relationship, assuming that x=0 at t=0.IP tn: date derived using SIMS inflection point depths (Table 2) fit to a tn (n=0·774) relationship, assuming that x=0 at t=0.Finite difference: date derived using finite difference modeling of SIMS hydrogen depth profiles.Max wt% H2O: date derived using the measured maximum water content in the profile, calibrated to a tn relationship.
1400
4
Calibrated C14 ages (yrs BP)
Hal
f-fa
ll d
epth
(µm
)
0
3
2
800400
1
200 1200600 1000
Figure 12. Curve of best fit obtained using an x=t+t1/2 relationregressed against half-fall depths of Chalco samples (assuming thatat t=0, x=0). Similar relationships have been observed for diffusionin glassy polymers (Wang et al., 1969).
1988; Garcia-Barcena, 1989), and may help explainwhy attempts to empirically calibrate obsidian hydra-tion rates using short-term experiments have failed. Asillustrated in Figure 12, a relatively good calibrationcan be derived by fitting the general equation
x=k(Dt)1/2+vt (6)
where k and v are constants (Figure 12). This isessentially the same equation as the diffusion rateequation proposed by Wang et al., (1969) for diffusionin glassy polymers. This treatment assumes that boththe diffusion coefficient (D) and the surface concen-tration are constant, which are incorrect. However, the
relatively good agreement is intriguing, and suggeststhat there may be some similarities between diffusion insilicate glasses and polymers.
The major limitation to following the characteristicpoint approach outlined above is the dependency on alarge number of 14C dates, which may not always beavailable at a given site, or may be cost prohibitive toobtain. The possibility of using fewer samples to deriveempirical curves can, however, be explored using ourdata set. In theory, only one sample is required (alongwith the condition that the hydration depth is zero attime zero), but the use of two samples provides greatercontrol, particularly if the exponential (n) variesbetween sites or with time. The results in Table 6indicate that very good agreement can be obtainedbetween 14C dates and half-fall dates for the Chalcosamples using various pairs of samples, one each fromthe older and younger sample sets, to fit equation 5.Results using a number of obsidian pairs are verysimilar, and generally agree within 40 years of thehalf-fall ages obtained from regressions of all data.These results indicate that the empirical approach maybe applied with minimum requirements for associated14C dates. The use of additional calibrations is optimal,both to improve confidence and as a check on thereliability of the obsidian sample—14C correlations(e.g., sample CHO030).
The ages obtained using the two types of character-istic points (half-fall and inflection point) to fit the 14Cdates are identical within error (Table 5, Figure 11). Inmost cases the two depths correlate extremely well,although the inflection point is slightly deeper. Eachmethod has its advantages and disadvantages. Positiveattributes for the inflection point include (1) the fact
1068 L. R. Riciputi et al.
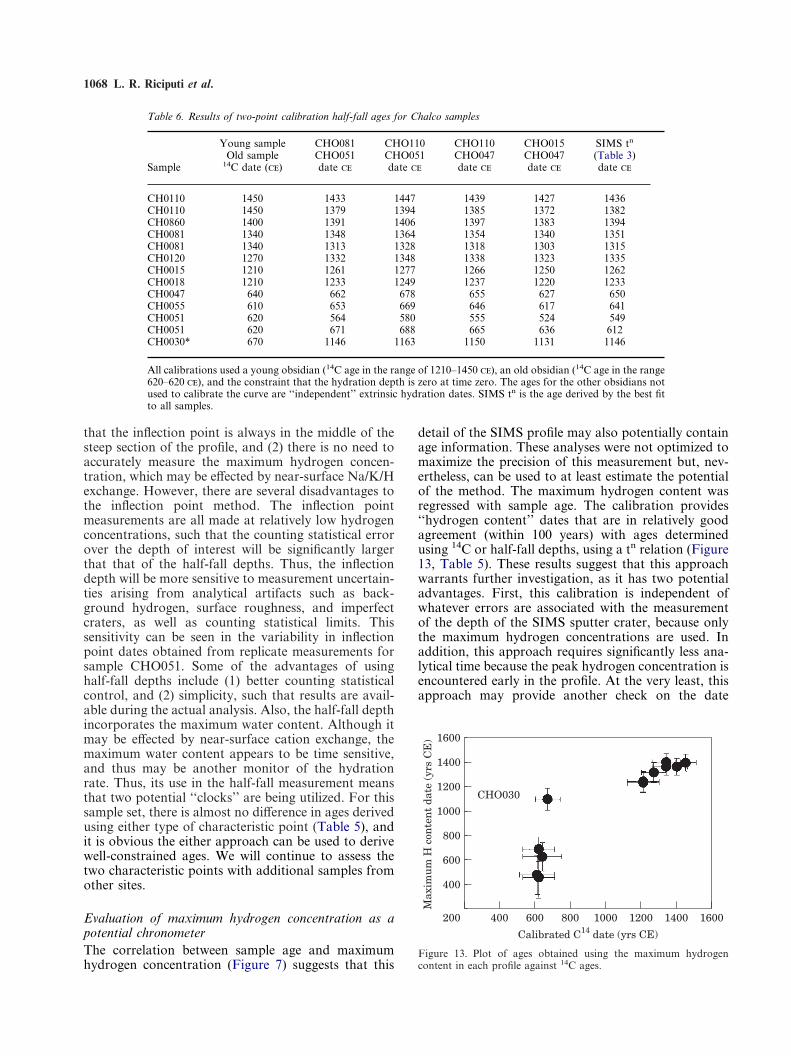
Table 6. Results of two-point calibration half-fall ages for Chalco samples
Sample
Young sampleOld sample
14C date ()
CHO081CHO051date
CHO110CHO051date
CHO110CHO047date
CHO015CHO047date
SIMS tn
(Table 3)date
CH0110 1450 1433 1447 1439 1427 1436CH0110 1450 1379 1394 1385 1372 1382CH0860 1400 1391 1406 1397 1383 1394CH0081 1340 1348 1364 1354 1340 1351CH0081 1340 1313 1328 1318 1303 1315CH0120 1270 1332 1348 1338 1323 1335CH0015 1210 1261 1277 1266 1250 1262CH0018 1210 1233 1249 1237 1220 1233CH0047 640 662 678 655 627 650CH0055 610 653 669 646 617 641CH0051 620 564 580 555 524 549CH0051 620 671 688 665 636 612CH0030* 670 1146 1163 1150 1131 1146
All calibrations used a young obsidian (14C age in the range of 1210–1450 ), an old obsidian (14C age in the range620–620 ), and the constraint that the hydration depth is zero at time zero. The ages for the other obsidians notused to calibrate the curve are ‘‘independent’’ extrinsic hydration dates. SIMS tn is the age derived by the best fitto all samples.
1600
1600
Calibrated C14 date (yrs CE)
Max
imu
m H
con
ten
t da
te (
yrs
CE
)
200
400
600
1000
1200
1400
800
140012001000800600400
CHO030
Figure 13. Plot of ages obtained using the maximum hydrogencontent in each profile against 14C ages.
detail of the SIMS profile may also potentially containage information. These analyses were not optimized tomaximize the precision of this measurement but, nev-ertheless, can be used to at least estimate the potentialof the method. The maximum hydrogen content wasregressed with sample age. The calibration provides‘‘hydrogen content’’ dates that are in relatively goodagreement (within 100 years) with ages determinedusing 14C or half-fall depths, using a tn relation (Figure13, Table 5). These results suggest that this approachwarrants further investigation, as it has two potentialadvantages. First, this calibration is independent ofwhatever errors are associated with the measurementof the depth of the SIMS sputter crater, because onlythe maximum hydrogen concentrations are used. Inaddition, this approach requires significantly less ana-lytical time because the peak hydrogen concentration isencountered early in the profile. At the very least, thisapproach may provide another check on the date
that the inflection point is always in the middle of thesteep section of the profile, and (2) there is no need toaccurately measure the maximum hydrogen concen-tration, which may be effected by near-surface Na/K/Hexchange. However, there are several disadvantages tothe inflection point method. The inflection pointmeasurements are all made at relatively low hydrogenconcentrations, such that the counting statistical errorover the depth of interest will be significantly largerthat that of the half-fall depths. Thus, the inflectiondepth will be more sensitive to measurement uncertain-ties arising from analytical artifacts such as back-ground hydrogen, surface roughness, and imperfectcraters, as well as counting statistical limits. Thissensitivity can be seen in the variability in inflectionpoint dates obtained from replicate measurements forsample CHO051. Some of the advantages of usinghalf-fall depths include (1) better counting statisticalcontrol, and (2) simplicity, such that results are avail-able during the actual analysis. Also, the half-fall depthincorporates the maximum water content. Although itmay be effected by near-surface cation exchange, themaximum water content appears to be time sensitive,and thus may be another monitor of the hydrationrate. Thus, its use in the half-fall measurement meansthat two potential ‘‘clocks’’ are being utilized. For thissample set, there is almost no difference in ages derivedusing either type of characteristic point (Table 5), andit is obvious the either approach can be used to derivewell-constrained ages. We will continue to assess thetwo characteristic points with additional samples fromother sites.
Evaluation of maximum hydrogen concentration as apotential chronometerThe correlation between sample age and maximumhydrogen concentration (Figure 7) suggests that this
Obsidian Diffusion Dating by Secondary Ion Mass Spectrometry 1069
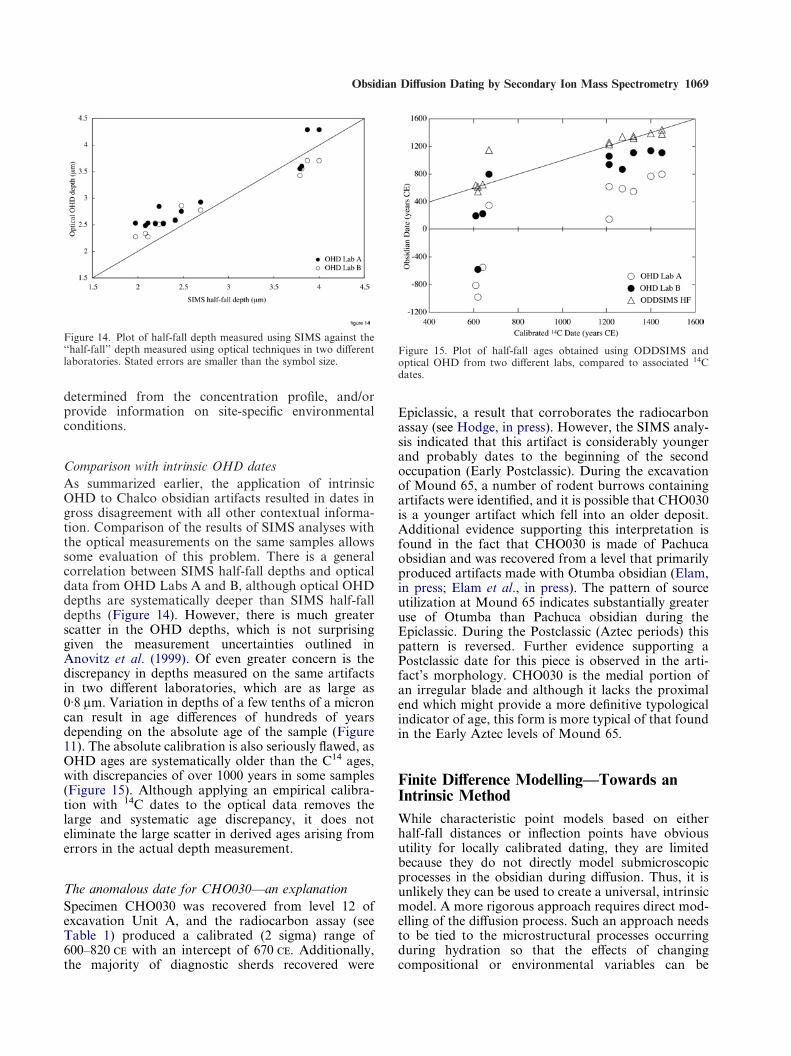
Comparison with intrinsic OHD datesAs summarized earlier, the application of intrinsicOHD to Chalco obsidian artifacts resulted in dates ingross disagreement with all other contextual informa-tion. Comparison of the results of SIMS analyses withthe optical measurements on the same samples allowssome evaluation of this problem. There is a generalcorrelation between SIMS half-fall depths and opticaldata from OHD Labs A and B, although optical OHDdepths are systematically deeper than SIMS half-falldepths (Figure 14). However, there is much greaterscatter in the OHD depths, which is not surprisinggiven the measurement uncertainties outlined inAnovitz et al. (1999). Of even greater concern is thediscrepancy in depths measured on the same artifactsin two different laboratories, which are as large as0·8 �m. Variation in depths of a few tenths of a microncan result in age differences of hundreds of yearsdepending on the absolute age of the sample (Figure11). The absolute calibration is also seriously flawed, asOHD ages are systematically older than the C14 ages,with discrepancies of over 1000 years in some samples(Figure 15). Although applying an empirical calibra-tion with 14C dates to the optical data removes thelarge and systematic age discrepancy, it does noteliminate the large scatter in derived ages arising fromerrors in the actual depth measurement.
The anomalous date for CHO030—an explanationSpecimen CHO030 was recovered from level 12 ofexcavation Unit A, and the radiocarbon assay (seeTable 1) produced a calibrated (2 sigma) range of600–820 with an intercept of 670 . Additionally,the majority of diagnostic sherds recovered were
Epiclassic, a result that corroborates the radiocarbonassay (see Hodge, in press). However, the SIMS analy-sis indicated that this artifact is considerably youngerand probably dates to the beginning of the secondoccupation (Early Postclassic). During the excavationof Mound 65, a number of rodent burrows containingartifacts were identified, and it is possible that CHO030is a younger artifact which fell into an older deposit.Additional evidence supporting this interpretation isfound in the fact that CHO030 is made of Pachucaobsidian and was recovered from a level that primarilyproduced artifacts made with Otumba obsidian (Elam,in press; Elam et al., in press). The pattern of sourceutilization at Mound 65 indicates substantially greateruse of Otumba than Pachuca obsidian during theEpiclassic. During the Postclassic (Aztec periods) thispattern is reversed. Further evidence supporting aPostclassic date for this piece is observed in the arti-fact’s morphology. CHO030 is the medial portion ofan irregular blade and although it lacks the proximalend which might provide a more definitive typologicalindicator of age, this form is more typical of that foundin the Early Aztec levels of Mound 65.
Figure 14. Plot of half-fall depth measured using SIMS against the‘‘half-fall’’ depth measured using optical techniques in two differentlaboratories. Stated errors are smaller than the symbol size.
Figure 15. Plot of half-fall ages obtained using ODDSIMS andoptical OHD from two different labs, compared to associated 14Cdates.
Finite Difference Modelling—Towards anIntrinsic MethodWhile characteristic point models based on eitherhalf-fall distances or inflection points have obviousutility for locally calibrated dating, they are limitedbecause they do not directly model submicroscopicprocesses in the obsidian during diffusion. Thus, it isunlikely they can be used to create a universal, intrinsicmodel. A more rigorous approach requires direct mod-elling of the diffusion process. Such an approach needsto be tied to the microstructural processes occurringduring hydration so that the effects of changingcompositional or environmental variables can be
determined from the concentration profile, and/orprovide information on site-specific environmentalconditions.
1070 L. R. Riciputi et al.
incorporated. In our previous work (Anovitz et al.,1999) we showed that a finite difference model had thepotential for such an application, in that it was capableof reproducing the detailed shape of the hydrogenconcentration depth profiles measured in realobsidians.
The finite difference method uses a numerical calcu-lation to model the formation of the entire diffusionprofile as a function of time, and is fit to the profile asa whole (excluding the near-surface region). Solutionof the equations involves a number of assumptions,including boundary conditions and the nature of theactual diffusion process so that appropriate diffusionequations can be selected. This technique is substan-tially more complex than the characteristic point ap-proach. However, the goodness of fit to the measuredprofile provides a method of evaluating whether thechoice of diffusion equation (and hence mechanism) isappropriate, yielding insights into the actual process ofhydration that are not available using ‘‘characteristicpoint’’ techniques. Below, we will extend this model toreproduce the results from the Chalco sample suite,laying the foundation for further work on developingan intrinsic age dating technique.
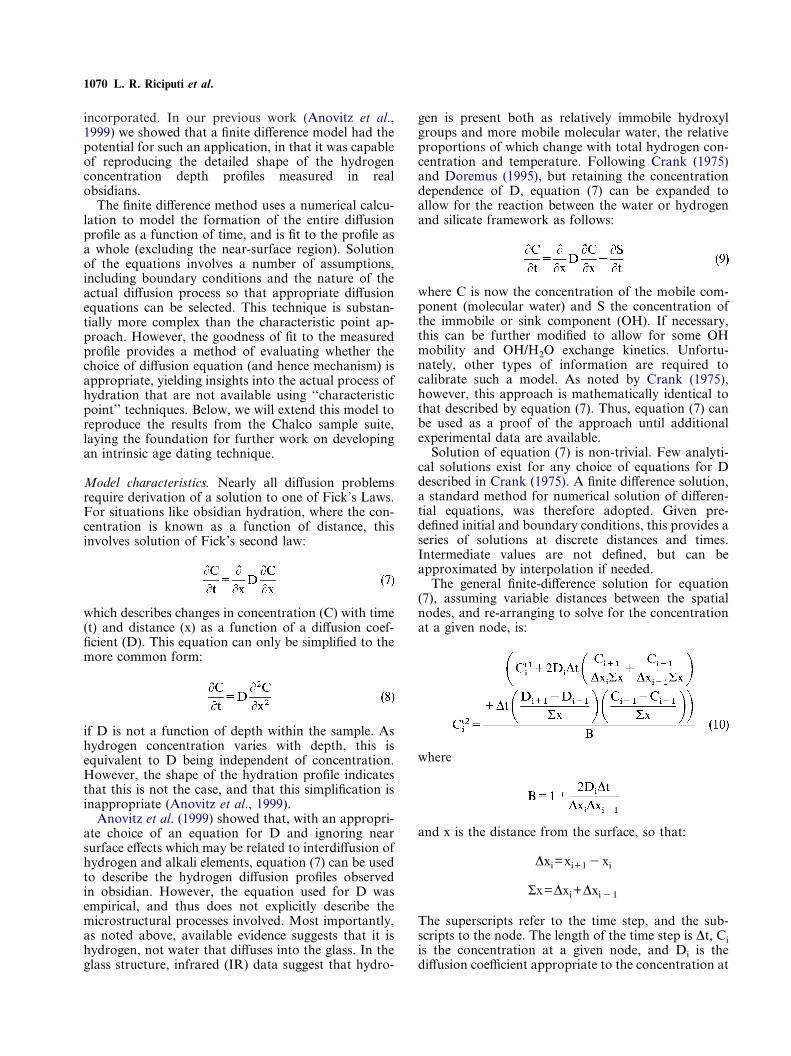
Model characteristics. Nearly all diffusion problemsrequire derivation of a solution to one of Fick’s Laws.For situations like obsidian hydration, where the con-centration is known as a function of distance, thisinvolves solution of Fick’s second law:
which describes changes in concentration (C) with time(t) and distance (x) as a function of a diffusion coef-ficient (D). This equation can only be simplified to themore common form:
if D is not a function of depth within the sample. Ashydrogen concentration varies with depth, this isequivalent to D being independent of concentration.However, the shape of the hydration profile indicatesthat this is not the case, and that this simplification isinappropriate (Anovitz et al., 1999).
Anovitz et al. (1999) showed that, with an appropri-ate choice of an equation for D and ignoring nearsurface effects which may be related to interdiffusion ofhydrogen and alkali elements, equation (7) can be usedto describe the hydrogen diffusion profiles observedin obsidian. However, the equation used for D wasempirical, and thus does not explicitly describe themicrostructural processes involved. Most importantly,as noted above, available evidence suggests that it ishydrogen, not water that diffuses into the glass. In theglass structure, infrared (IR) data suggest that hydro-
gen is present both as relatively immobile hydroxylgroups and more mobile molecular water, the relativeproportions of which change with total hydrogen con-centration and temperature. Following Crank (1975)and Doremus (1995), but retaining the concentrationdependence of D, equation (7) can be expanded toallow for the reaction between the water or hydrogenand silicate framework as follows:
where C is now the concentration of the mobile com-ponent (molecular water) and S the concentration ofthe immobile or sink component (OH). If necessary,this can be further modified to allow for some OHmobility and OH/H2O exchange kinetics. Unfortu-nately, other types of information are required tocalibrate such a model. As noted by Crank (1975),however, this approach is mathematically identical tothat described by equation (7). Thus, equation (7) canbe used as a proof of the approach until additionalexperimental data are available.
Solution of equation (7) is non-trivial. Few analyti-cal solutions exist for any choice of equations for Ddescribed in Crank (1975). A finite difference solution,a standard method for numerical solution of differen-tial equations, was therefore adopted. Given pre-defined initial and boundary conditions, this provides aseries of solutions at discrete distances and times.Intermediate values are not defined, but can beapproximated by interpolation if needed.
The general finite-difference solution for equation(7), assuming variable distances between the spatialnodes, and re-arranging to solve for the concentrationat a given node, is:
where
and x is the distance from the surface, so that:
�xi=xi+1�xi
�x=�xi+�xi�1
The superscripts refer to the time step, and the sub-scripts to the node. The length of the time step is �t, Ciis the concentration at a given node, and Di is thediffusion coefficient appropriate to the concentration at
Obsidian Diffusion Dating by Secondary Ion Mass Spectrometry 1071
the ith node. As this equation is algebraic, its solutionappears trivial. There are, however, complications.Equation (10) contains a simplification of the finitedifference solution to the second derivative for non-constant inter-node distances, although work is on-going to refine this solution. Additionally, equation(10) does not define what timestep should be used foreach value of the concentration at a given node. Thereare two end-member approaches to this problem. Inexplicit finite difference modelling the values attimestep (t+1) are based on values at timestep (t). Thisis the simplest approach because the starting values attimestep (t=0) are pre-determined and values for eachsucceeding timestep can be calculated directly. Unfor-tunately, for some combinations of D, �t and �x anexplicit solution becomes numerically unstable.
The alternative is the implicit finite differenceapproach. In this case the values of the concentrationsat timestep (t) are based on concentrations at timestep(t+1), and must be obtained by iteration. It is assumedinitially that the concentrations at timestep (t+1) areequal to those at timestep (t). Once a solution isobtained the newly calculated values are used to obtaina second estimate. This is repeated until the result isstable. Implicit finite difference calculations are uncon-ditionally stable, but the iterations require greatercalculation time. A third alternative utilizes a weightedaverage of the explicit and implicit approaches. In theCrank-Nicholson method (Crank, 1975) the average ofthe two is used. In our calculations this occasionallyyielded some numerical instability due to the largeinitial difference between the initial hydrogen concen-tration values at the first (surface) and second (base-line) nodes. A fully implicit approach was thereforeadopted.
The finite difference model has been written to allowfor variable �x and �t values. The grid spacing (�x)varies, with the nodes being spaced more closely nearthe glass surface. This provides detailed informationnear the surface where the actual diffusion profileforms, but a long enough total distance that, for thecalculations of interest, the system acts as a one-dimensional, semi-infinite medium and a no-flowboundary condition can be imposed at depth. Theinitial time steps are quite short. Initially a significantdiscontinuity can exist between the surface boundaryvalue, assumed in some calculations to be constant atthe hydrogen surface concentration, and the first node,assumed initially to equal the baseline hydrogen con-centration. Short initial time steps enhance the numeri-cal stability of the model. Once this initial instability isovercome, however, it becomes possible to increase�t (values up to two years were used) to decreasecalculation time.
Modeling procedure and results. The SIMS data for theChalco samples exhibits several features which neededto be incorporated into the final model. First, and mostsignificant, the overall profile is S-shaped. This dictates
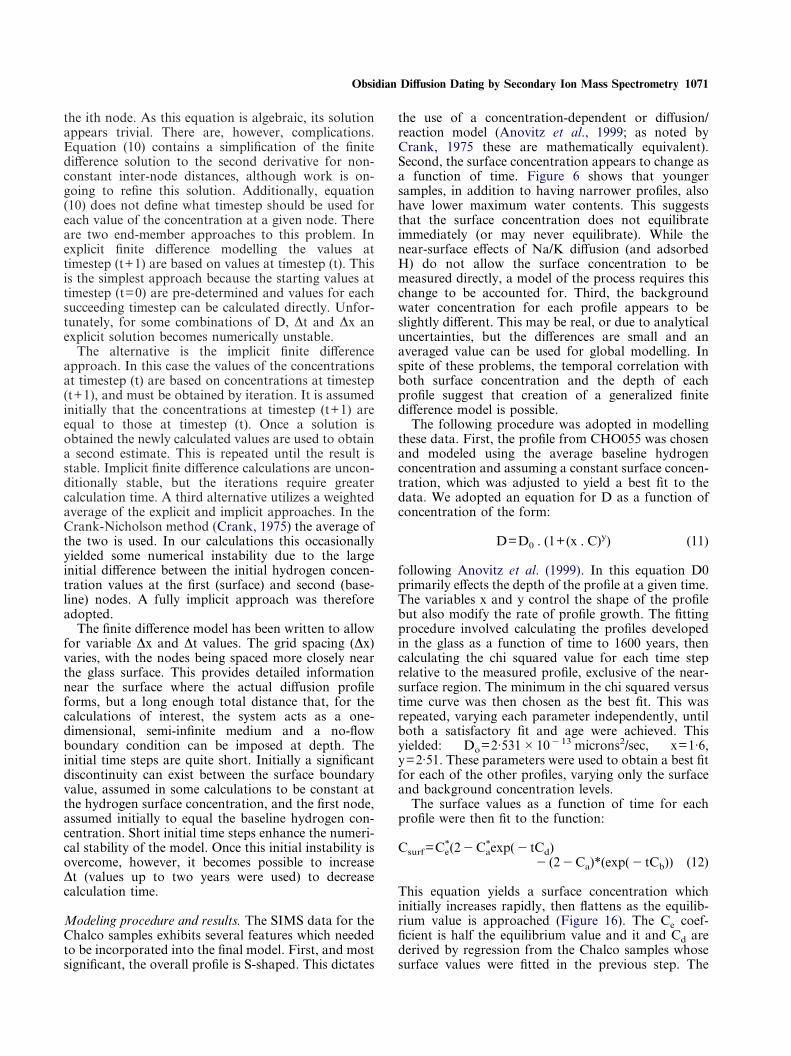
the use of a concentration-dependent or diffusion/reaction model (Anovitz et al., 1999; as noted byCrank, 1975 these are mathematically equivalent).Second, the surface concentration appears to change asa function of time. Figure 6 shows that youngersamples, in addition to having narrower profiles, alsohave lower maximum water contents. This suggeststhat the surface concentration does not equilibrateimmediately (or may never equilibrate). While thenear-surface effects of Na/K diffusion (and adsorbedH) do not allow the surface concentration to bemeasured directly, a model of the process requires thischange to be accounted for. Third, the backgroundwater concentration for each profile appears to beslightly different. This may be real, or due to analyticaluncertainties, but the differences are small and anaveraged value can be used for global modelling. Inspite of these problems, the temporal correlation withboth surface concentration and the depth of eachprofile suggest that creation of a generalized finitedifference model is possible.
The following procedure was adopted in modellingthese data. First, the profile from CHO055 was chosenand modeled using the average baseline hydrogenconcentration and assuming a constant surface concen-tration, which was adjusted to yield a best fit to thedata. We adopted an equation for D as a function ofconcentration of the form:
D=D0 . (1+(x . C)y) (11)
following Anovitz et al. (1999). In this equation D0primarily effects the depth of the profile at a given time.The variables x and y control the shape of the profilebut also modify the rate of profile growth. The fittingprocedure involved calculating the profiles developedin the glass as a function of time to 1600 years, thencalculating the chi squared value for each time steprelative to the measured profile, exclusive of the near-surface region. The minimum in the chi squared versustime curve was then chosen as the best fit. This wasrepeated, varying each parameter independently, untilboth a satisfactory fit and age were achieved. Thisyielded: Do=2·531�10�13 microns2/sec, x=1·6,y=2·51. These parameters were used to obtain a best fitfor each of the other profiles, varying only the surfaceand background concentration levels.
The surface values as a function of time for eachprofile were then fit to the function:
Csurf=C*e(2�C*
aexp(�tCd)�(2�Ca)*(exp(�tCb)) (12)
This equation yields a surface concentration whichinitially increases rapidly, then flattens as the equilib-rium value is approached (Figure 16). The Ce coef-ficient is half the equilibrium value and it and Cd arederived by regression from the Chalco samples whosesurface values were fitted in the previous step. The
1072 L. R. Riciputi et al.
coefficient t is time, and Ca and Cb control the initialhydration rate: the larger Cb, the faster the initialincrease in water content (from t=0); the smaller Ca,the sharper the transition from the initial, rapidlyincreasing part of the curve to the flatter, near equilib-rium section. Unfortunately, testing demonstrated thatthe initial shape of the profile has a profound effect onthe relative rate of growth of the profile with time, andthe youngest sample (�600 years old) is too old toprovide strong constraints on the initial shape of theprofile. The model calculation was therefore repeated,modelling all of the sample profiles simultaneouslyassuming an average background value of 0·0473 andsurface values that varied with time according to theabove equation. The relative growth rate of the profilewith time was then varied by changing Ca or Cb,refitting the other parameters in equation (12) to thesample data, adjusting D0 as needed, and repeating theprocess until a best fit to the 14C ages was achieved.This yielded: Ce=0·5085, Ca=1·0, Cb=0·02, andCd=232·41�10�5.
Two samples were excluded from the finite differencemodelling, and are not included in the statistical analy-sis that follows. As previously discussed, qualitativeexamination of CHO030 suggests that it has beenstratigraphically relocated, possibly due to rodent ac-tivity. One of the analyses on sample CHO051 (2) wasalso excluded, as the profile has a significantly differentshape compared to the other profiles, possibly due toroughness on the analysed surface. Although it is apoor candidate for fitting with a generalized model,reasonable ages can still be obtained from this profileby characteristic point analysis.
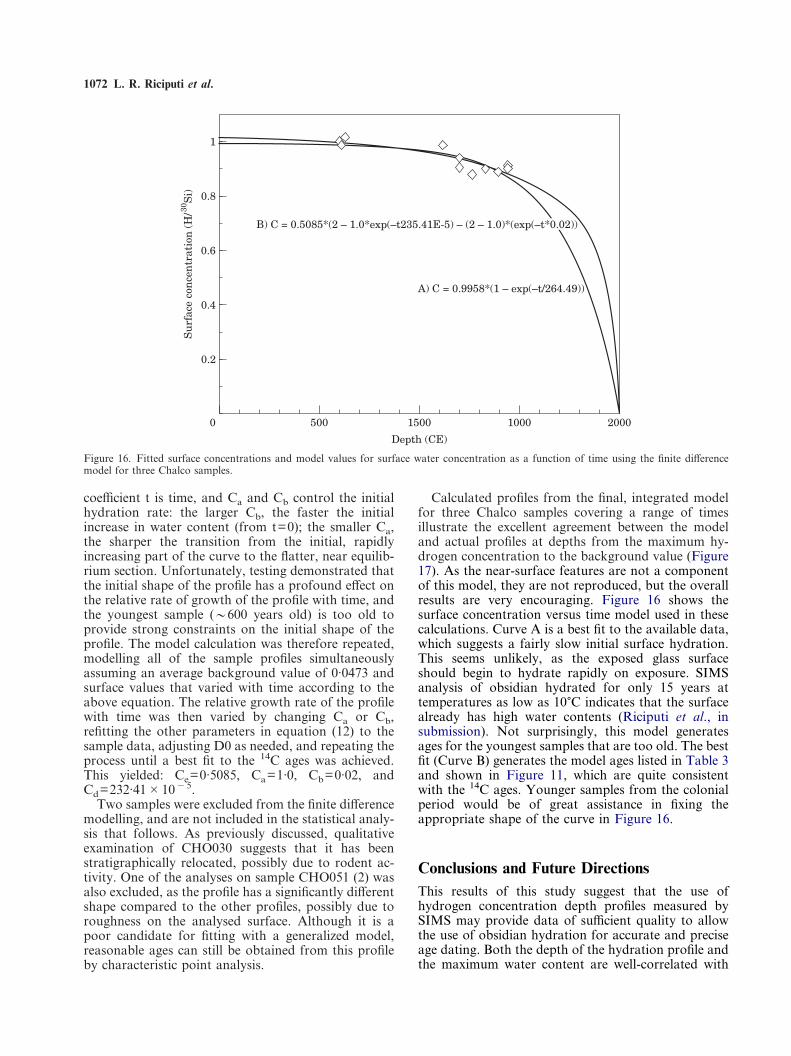
Calculated profiles from the final, integrated modelfor three Chalco samples covering a range of timesillustrate the excellent agreement between the modeland actual profiles at depths from the maximum hy-drogen concentration to the background value (Figure17). As the near-surface features are not a componentof this model, they are not reproduced, but the overallresults are very encouraging. Figure 16 shows thesurface concentration versus time model used in thesecalculations. Curve A is a best fit to the available data,which suggests a fairly slow initial surface hydration.This seems unlikely, as the exposed glass surfaceshould begin to hydrate rapidly on exposure. SIMSanalysis of obsidian hydrated for only 15 years attemperatures as low as 10�C indicates that the surfacealready has high water contents (Riciputi et al., insubmission). Not surprisingly, this model generatesages for the youngest samples that are too old. The bestfit (Curve B) generates the model ages listed in Table 3and shown in Figure 11, which are quite consistentwith the 14C ages. Younger samples from the colonialperiod would be of great assistance in fixing theappropriate shape of the curve in Figure 16.
2000
1
Depth (CE)
Su
rfac
e co
nce
ntr
atio
n (
H/30
Si)
0
0.4
0.8
0.2
1000
0.6
500 1500
A) C = 0.9958*(1 – exp(–t/264.49))
B) C = 0.5085*(2 – 1.0*exp(–t235.41E-5) – (2 – 1.0)*(exp(–t*0.02))
Figure 16. Fitted surface concentrations and model values for surface water concentration as a function of time using the finite differencemodel for three Chalco samples.
Conclusions and Future DirectionsThis results of this study suggest that the use ofhydrogen concentration depth profiles measured bySIMS may provide data of sufficient quality to allowthe use of obsidian hydration for accurate and preciseage dating. Both the depth of the hydration profile andthe maximum water content are well-correlated with
Obsidian Diffusion Dating by Secondary Ion Mass Spectrometry 1073
5
1.0
Depth (microns)
Con
cen
trat
ion
(H
/30S
i)
0.8
0.6
0.4
0.2
43210
CHO055 (1389 BP)
CHO018(729 BP)
CHO086(599 BP)
Figure 17. Examples of the fit of the finite difference model to hydrogen profiles from three Chalco samples.
age, providing multiple methods of dating. Theseresults confirm that hydration rates are concentrationdependent, and are not linear with either a t1 or t1/2
time-depth relationship. However, solving for the gen-eral equation tn by regressing depth against 14C agesfor a suite of obsidian artifacts from Chalco indicatesthat an excellent correlation can be achieved, suggest-ing that using characteristic points may yield excellentresults for empirical studies. This is confirmed by thesuccessful results obtained using 14C dates from justtwo artifacts, and the constraint that hydration depthis zero at time zero, to calibrate the depth-age curve,and then using this curve to derive ages for the otherartifacts. These extrinsic ODDSIMS ages agree verywell with the 14C ages, and indicate that the methodcan be quite successful if there are a few artifacts withassociated 14C dates available at a site.
If a predictive, uncalibrated, intrinsic approach is tobe developed, additional refinements are still needed.This work shows that the finite difference approach canreproduce the observed time vs. depth progression aswell as characteristic point models. The finite difference
equations are based on a number of assumptions aboutthe behavior of water as it diffuses into the glass. Thegood agreement between the measured and predictedprofile shapes suggests that the basic assumptions arecorrect. However, a number of parameters will have tobe rigorously quantified before the potential of anintrinsic approach can be fully evaluated. The modelwill have to explicitly account for the reaction of waterwith the silicate framework to form OH and H2O (or,for that matter, H2 or H3O+) as well as the kinetics ofthis process. The effects of changes in the compositionof the glass and the nature of the reaction at theglass/water interface will also have to be understood.This has become a standard approach for analysis ofthe reaction of water with high-temperature silicateglasses or melts (cf. Zhang et al., 1991, 1995; Doremus,1999), and provides an avenue for generalization ofODDSIMS. Temperature (and potentially relative hu-midity) control will have to be developed, and depend-ing on the sensitivity of the model to these parameters,techniques to constrain these values for archaeologicalsamples will have to be evaluated. In addition, if other
1074 L. R. Riciputi et al.
obsidian sources are to be used, the effects of majorelement composition on hydration rates will have to beinvestigated.
The processes which cause the near-surface changesin the hydration profile may also provide importantinformation allowing further quantification of tem-poral effects. These processes may be related to alkaliexchange (Anovitz et al., 1999). Examination of theChalco data suggests that, in the very near surface,hydrogen diffusion is an uphill process, against thechanging water concentration gradient. This impliesthat the thermodynamics of mixing of the glass, waterand other diffusing elements are strongly nonideal.Such processes are not unknown (cf. Crank, 1975), butimply that the thermochemistry of the multicomponentdiffusion process is somewhat complex (the cross termsin the multicomponent diffusion matrix must benonzero).
In spite of these complications, the very simplecharacteristic point analysis indicates that the hydra-tion rate at a single site can be very systematic withtime, and that the complex hydration mechanism maybe reduced to allow successful empirical modelling ofhydration rate-time dependencies. The SIMS methodprovides excellent precision and accuracy, and outsideof the uncertainties inherent in the 14C calibration, ismainly limited by errors associated with measurementof the crater depth. Although the depth errors varywith surface roughness and crater depth (age), forartifacts of 500–1500 years in age, the analytical errorstranslate into two standard errors on the order of50–100 years, similar to the precision available from14C age dating. In addition, the ODDSIMS techniqueprovides a direct measurement of the age of the artifactitself, avoiding potential association errors thatcan be problematic with carbon dating (e.g., sampleCHO030). These results indicate that, although a greatdeal of work remains to be done, the ODDSIMStechnique holds considerable potential as a tool to dateobsidian artifacts, and that this may finally provide themethod to realize the potential of hydration dating.
AcknowledgementsResearch sponsored by the Division of ChemicalSciences, Geosciences and Biosciences, Office of BasicEnergy Sciences, U.S. Department of Energy undercontract DE-AC05-00OR22725 with Oak RidgeNational Laboratory, managed by UT-Battelle LLC,and by National Science Foundation grant SBR-98-04350 and BCS-0108956 to the University ofTennessee. We also thank the Instituto Nacional deAntropologia e Historia (INAH), especially Ing.Joaquin Garcia-Barcena, Presidente de Consejo deArqueologia, INAH for his advice and assistance. Wethank Richard Klein and two anonymous reviewers,whose suggestions greatly improved the manuscript.Finally, we would like to acknowledge the late Dr
Mary Hodge who provided the Chalco obsidiansample set. Her careful work, both in the field and inthe lab, made the analysis presented here possible. It isto her memory that we dedicate this report.
ReferencesAitkin, M. J. (1997). Science-based Dating in Archaeology. London &
New York: Longman Archaeology Series.Ambrose, W. R. (1976). Intrinsic hydration rate dating of obsidian.
In (R. E. Taylor, Ed.) Advances in Obsidian Glass Studies. NewJersey: Noyes Press, pp. 81–105.
Anovitz, L. M., Elam, J. M., Riciputi, L. R. & Cole, D. R. (1999).The Failure of Obsidian Hydration Dating: Sources, Implicationsand New Directions. Journal of Archaeological Science 26, 735–752.
Braswell, G. E. (1992). Obsidian hydration dating, the Coner phaseand revisionist chronology at Copan, Honduras. Latin AmericanAntiquity 3, 130–147.
Braswell, G. E., Glascock, M. D. & Neff, H. (1996). The obsidianartefacts of Group 10L-2, Copan: production, exchange andchronology. Paper Presented at the 61st Annual Meeting of theSociety for American Archaeology, New Orleans, LA, April 1996.
Charlton, T. H., Nichols, D. L. & Charlton, C. O. (1991). Aztec craftproduction and specialization: archeological evidence from thecity-state of Otumba, Mexico. World Archaeology 23, 98–114.
Crank, J. (1975). The Mathematics of Diffusion. Oxford: OxfordUniversity Press.
Doremus, R. H. (1995). Diffusion of water in glass. Journal ofMaterials Research 10, 2379–2389.
Doremus, R. H. (1999). Diffusion of water in rhyolite glass:Diffusion-reaction model. Journal of Non-crystalline Solids 261,101–107.
Elam, J. M. (1993). Obsidian exchange in the Valley of Oaxaca,Mexico 2500–500 . Ph.D. Thesis. University of Missouri-Columbia, Columbia, MO.
Elam, J. M. (in press). Style and use of obsidian and other lithicartifacts. In (M. Hodge, Ed.) Place of Jade: Society and Economyin Ancient Chalco. Pittsburgh, PA: Monographs in LatinAmerican Archaeology, University of Pittsburgh.
Elam, J. M., Glascock, M. D. & Neff, H. (1994). Obsidian artifactsfrom Oaxaca, Mexico: source identification and hydration dating.In (D. A. Scott & P. Meyers, Eds) Archaeometry of PrecolumbianSites and Artifacts. Los Angeles, CA: Getty Conservation Insti-tute, pp. 135–160.
Elam, J. M., Glascock, M. D. & Neff, H. (in press). Obsidian sourceanalysis. In (M. Hodge, Ed.) Place of Jade: Society and Economyin Ancient Chalco. Pittsburgh, PA: Monographs in LatinAmerican Archaeolog, University of Pittsburgh.
Friedman, I. & Long, W. (1976). Hydration rate of obsidian. Science191, 347–352.
Friedman, I. & Smith, R. (1960). A new method of dating usingobsidian: Part I, the development of the method. American Antiq-uity 25, 476–522.
Friedman, I., Smith, R. L. & Long, W. D. (1966). Hydration ofnatural glass and formation of perlite. Geological Society ofAmerica Bulletin 77, 232–327.
Garcia-Barcena, J. (1989). Las Ecuaciones de Hidratacion de laObsidiana. In (G. M. Gaxiola & J. E. Clark, Eds) La Obsidiana enMesoamerica. Mexico: Coleccion Cientifica, Serie Arqueologia,Instituto Nacional de Antropologia e Historia, pp. 59–68.
Garcia de Miranda, E. (1987). Modificadiones al Sistema de Clasifi-cacion Climatica de Koppen (para adaptarlo a las condiciones de laRepublica de Mexicana). Mexico: Instituto Nacional de Estadis-tica y Geografica, p. 135.
Geyh, M. A. & Schleicher, H. (1990). Absolute Age Determination.Berlin: Springer-Verlan.
Obsidian Diffusion Dating by Secondary Ion Mass Spectrometry 1075
Grun, R. (1997). Electron Spin Resonance Dating. In (R. E. Taylor& M. J. Aitken, Eds) Chronometric Dating in Archaeology. Ad-vances in Archaeological and Museum Science, Vol. 2. New Yorkand London: Plenum Press, pp. 217–260.
Hodge, M. G. (in press). Place of Jade: Society and Economy inAncient Chalco. Pittsburgh, PA: : Monographs in Latin AmericanArchaeology, University of Pittsburgh.
Lee, R. (1969). Chemical temperature integration. Journal ofMeteorology 8, 423–430.
McGrail, B. P., Pederson, L. R., Strachan, D. M. & Ewing, R. C.(1988). Obsidian hydration dating—field, laboratory and mod-eling results. Materials Research Society Symposium Proceedings123, 263–269.
Meighan, C. W. & Haynes, C. V. (1970). The Borax Lake siterevisited. Science 167, 1213–1221.
Michels, J. W., Tsong, I. S. T. & Smith, G. A. (1983). Experimentallyderived hydration rates in obsidian dating. Archaeometry 25,107–117.
Neff, H., Bove, E. J., Johnson, T. H. & Arroyo, B. (1993).Fechimientos a traves de hidratacion de obsidiana en la costa surde Guatemala. Apuntes Arqueologicos 2, 55–79.
Nichols, D. L. & Charlton, T. H. (1996). The postclassic occupationat Otumba. Ancient Mesoamerica 7, 231–244.
Parsons, J. R., Brumfiel, E. M., Parsons, H. & Wilson, D. J. (1982).Prehistoric Settlement Patterns in the Southern Valley of Mexico:The Chalco-Xochimilco Regions. Ann Arbor, MI: Memoirs No. 14,Museum of Anthropology, University of Michigan.
Riciputi, L. R., Anovitz, L. M. & Elam, J. M. (in submission). SIMSanalysis of Wekwok obsidian under ambient conditions: Implica-tions for temperature dependence of obsidian hydration rates.Geoarchaeology.
Ridings, R. (1996). Where in the world does obsidian hydrationdating work? American Antiquity 61, 136–148.
Sanders, W. T., Parsons, J. R. & Santley, R. S. (1979). The Basin ofMexico: Ecological Processes in the Evolution of a Civilization.New York, NY: Academic Press.
Santley, R. S., Kerley, J. M. & Kneebone, R. R. (1986). Obsidianworking, long distance exchange and the politico-economic or-ganization of early states in Central Mexico. In (B. L. Issacs, Ed.)Research in Economic Anthropology, Supplement 2. Greenwich,CT: JAI Press, Inc., pp. 101–132.
Stark, B. L., Heller, L., Glascock, M. D., Elam, J. M. & Neff, H.(1992). Obsidian-artifact analysis for the La Mixtequilla region,South-Central Vera Cruz, Mexico. Latin American Antiquity 3,221–239.
Stevenson, C. M., Carpenter, J. & Scheetz, B. E. (1989). Obsidiandating: Recent advances in the experimental determination andapplication of hydration rates. Archaeometry 31, 1193–1206.
Stevenson, C. M., Mazer, J. J. & Scheetz, B. E. (1998). LaboratoryObsidian Hydration Rates. Theory, Method and Application. In(M. S. Shackley, Ed.) Archaeological Obsidian Studies. Method andTheory. New York, NY: Plenum Press, Advances in Archaeologi-cal and Museum Science, Vol. 3, pp. 181–204.
Wang, T. T., Kwei, T. K. & Frisch, H. L. (1969). Diffusion in glasspolymers III. Journal of Polymer Science 7, 2019–2028.
Webster, D. & Freter, A. (1990). Settlement history and the Classiccollapse at Copan: a redefined chronological perspective. LatinAmerican Antiquity 1, 66–85.
Zhang, Y., Stolper, E. M. & Wasserberg, G. J. (1991). Diffusion ofwater in rhyolitic glasses. Geochim Cosmochim Acta 55, 441–456.
Zhang, Y., Stolper, E. M. & Ihinger, P. D. (1995). Kinetics of thereaction H2O+O=2OH in rhyolitic and albitic glasses: prelimi-nary results. Amer Mineral 80, 593–612.


