Embed Size (px)
Citation preview
ORGANIZATIONALBEHAVIOR
Organizational Behavior and Human Decision Processes 91 (2003) 186–202
www.elsevier.com/locate/obhdp
AND HUMANDECISION PROCESSES
Omission bias in vaccination decisions: Where�s the‘‘omission’’? Where�s the ‘‘bias’’?
Terry Connolly* and Jochen Reb
Eller College of Business and Public Administration, University of Arizona, Tucson, AZ 84721–0108, USA
Abstract
Several studies have reported that parents are often reluctant to vaccinate their own or other people�s children, even when thebalance of health risks and benefits clearly favors vaccination. This reluctance has been interpreted as a manifestation of ‘‘omission
bias’’, a general tendency to prefer inactive to active options even when inaction leads to worse outcomes or greater risks. The
research raises significant public health concerns as well as worries about human decision biases in general. In this paper we argue
that existing research on vaccination decisions has not convincingly demonstrated any general reluctance to vaccinate nor has it
made the case that such a tendency, if found, would constitute a bias. We identify several conceptual and methodological issues that,
we argue, cloud interpretation of earlier studies. In a new questionnaire-based study (Experiment 1) we examined the vaccination
decisions of undergraduate students (N ¼ 103) and non-student adults (N ¼ 192). In both groups a clear majority chose to vaccinate
when disease and vaccination risks were balanced. Experiments 2 and 3 identify several problems associated with the measures used
in earlier studies, and show how these problems could have led to the misleading appearance of majority anti-vaccination prefer-
ences. In our data, vaccination intentions appear to be less a function of generalized preferences for action or inaction than they are
of the regret respondents expect to feel if vaccination or non-vaccination were to lead to a poor outcome. Regret-avoiding choices
led some respondents to favor vaccination, others to oppose it. In two follow-up studies, few respondents mentioned action or
inaction per se in explaining their choices. We conclude that there is no convincing evidence that a generalized ‘‘omission bias’’ plays
any important role in vaccination decisions.
� 2003 Elsevier Science (USA). All rights reserved.
Keywords: Vaccination; Regret; Omission bias; Action; Justification
Introduction
A number of studies have reported an ‘‘omission
bias’’ in decision making, a tendency towards ‘‘...the
choice of a potentially harmful omission over a poten-tially less harmful act’’ (Asch et al., 1994, p. 118), or
‘‘...to favor omissions (such as letting someone die) over
otherwise equivalent commissions (such as killing
someone actively)’’ (Ritov & Baron, 1990, p. 263). Ritov
and Baron (1990), for example, offered students a (hy-
pothetical) choice between exposing a child to a disease
with some risk of death and giving a protective vaccine
with some risk of lethal side-effects. Most subjects de-manded that the vaccine risk be significantly smaller
than the disease risk before they would vaccinate (i.e.,
* Corresponding author. Fax: 1-520-621-4171.
E-mail address: [email protected] (T. Connolly).
0749-5978/03/$ - see front matter � 2003 Elsevier Science (USA). All rights
doi:10.1016/S0749-5978(03)00057-8
take action). Spranca, Minsk, and Baron (1991, Exper-
iment 4) asked subjects to judge a physician�s (hypo-thetical) decision on whether or not to recommend a
risky brain surgery that would cure a disease that
threatened permanent brain injury. In some cases thesurgery was described as higher in risk, in others the
disease itself was riskier. The subjects, unsurprisingly,
preferred the less risky option in each case, but generally
rated the inactive option as better, or as less bad, than
the corresponding active option. Spranca et al. (1991)
found that subjects judged the active theft of $100 to be
morally worse than merely failing to point out a store�s$100 error in one�s favor (Experiment 5). Their subjectsalso judged the active poisoning of a tennis opponent to
be more immoral than simply failing to warn him of a
suspect dish (Experiment 1). Baron (1992, Experiment 1)
found large majorities of subjects reluctant to commit a
single murder even if it would lead to saving the lives of
reserved.
T. Connolly, J. Reb / Organizational Behavior and Human Decision Processes 91 (2003) 186–202 187
two other individuals. The effect known as omission biasthus touches on important issues of medical, ethical, and
mundane decision making.
As many of these authors note, a plausible psycho-
logical mechanism underlying the effect relies on an as-
sociation between active choice and increased regret.
The classic demonstration of this effect is that of
Kahneman and Tversky (1982) in their example of two
investors who lose the same moderate amount of mon-ey, one by changing his portfolio, the other by failing to
change it. By a huge majority, subjects judged that the
investor who actively changed would feel more regret
over his loss than would the investor who sat still. There
is now a considerable literature on this linkage between
action and regret. Kahneman and Miller (1986) propose
that, in many contexts, taking action is more ‘‘abnor-
mal’’ than inaction, and this abnormality amplifiesemotions (such as regret) associated with a bad out-
come. Gilovich and Medvec (1995) report evidence of a
reversal of the linkage over time, with inaction more
strongly associated with regret in the longer term.
Landman (1987) examined the converse linkage of po-
sitive outcomes and such emotions as rejoicing. Other
authors have examined its connection to decision re-
sponsibility (Connolly, Ord�oo~nnez, & Coughlan, 1997;Zeelenberg, van Dijk, & Manstead, 1998) and the rela-
tionship between real and imagined regrets (Crawford,
McConnell, Lewis, & Sherman, 2002; Feldman, Mi-
yamoto, & Loftus, 1999).
There thus appear to be two converging bodies of
evidence pointing to an important decisional bias. First,
there are numerous studies (Baron, in personal corre-
spondence, claims some 30 experiments by himself andothers) that have reported omission bias in a variety of
contexts. Second, there is a plausible mechanism, the
action-regret linkage, by which to account for a gener-
alized reluctance to take action when consequences of
action and inaction are roughly balanced. This conver-
gence has led a number of authors (e.g., Asch et al.,
1994; Meszaros et al., 1996) to voice concern that im-
portant medical benefits such as childhood vaccinationsare being significantly underused. The broader issue of a
possible widespread reluctance to vaccinate is of obvious
current concern in light of terrorist bioweapons threats.
A close examination of the evidence, however, raises
questions about both omission bias and its supposed
link to anticipated regret. In the next section of the
paper we review a number of findings that suggest that
action is not invariably associated with increased regret.In the following section we examine the omission bias
literature itself, particularly focusing on vaccination
decisions. We find a number of conceptual and meth-
odological concerns that raise questions both about the
prevalence of omission (non-vaccination) and about the
claim that it reflects a bias. We then report a scenario-
based study of vaccination decisions, examining partic-
ipants� preferences for vaccination and non-vaccination,and the role of anticipated regret in these preferences.
Two further experiments identify likely sources of
measurement error in earlier studies. The concluding
section of the paper discusses both theoretical and
practical implications of these results. An appendix de-
velops a formal model of risk-balancing in decisions like
vaccination and derives some unintuitive implications.
The linkage between action and regret
As noted above a number of earlier studies found
evidence that poor decision outcomes are more regretted
when they are the result of action than of inaction.
Several recent studies have raised questions about the
robustness of this relationship. First, both in our own
work (Connolly et al., 1997; Ord�oo~nnez & Connolly, 2000)and in studies by Zeelenberg et al. (1998), subjects an-
ticipated significant levels of regret over poor outcomes
for which they had no decision responsibility. Further,
between-subject studies (N�gbala & Branscombe, 1997;
Connolly & Reb, 2001) do not replicate the within-
subject results of Kahneman and Tversky (1982) in the
two-investors problem (see also Sevdalis & Harvey,
2001). Second, in Connolly and Reb (2001) and inZeelenberg, van den Bos, van Dijk, and Pieters (2001),
the key issue seems to be less whether or not the agent
took action, but whether or not this (in)action was jus-
tified (see Connolly & Zeelenberg, 2002). In Zeelenberg
et al. (2001), for example, a soccer coach who changes
his team and then loses was seen as feeling regret over
this action only if the team�s previous record did notjustify the change. If the team had been doing poorly,the change was seen as appropriate, and the subsequent
loss attracted little regret. Similarly Seta, McElory, and
Seta (2001) found that regret was associated with action
only when the (in)action taken was inconsistent with the
agent�s personality or prior record. Kahneman and
Miller (1986) propose that perceived normalcy is a
common justificatory rationale, and that inaction is, in
many—but not necessarily all—contexts, the normal(and thus more readily justified) choice.
Since justifiability is likely to be context-dependent,
and to vary across individuals, these demonstrations
weaken the assumed robustness of the action-regret
linkage. For some people and settings, action may be
seen as less justified, and thus more regrettable, than
inaction; but it seems clear that the reverse may also be
true for other people and other settings. There are, ofcourse, other mechanisms that might shape a tendency
to prefer inaction. Baron and Ritov (1994), for example,
suggest both an ‘‘inaction heuristic’’, a generalized rule
of avoiding direct harm, and an alternative account
based on loss aversion. Before pressing further with ri-
val explanations, however, we should examine the ro-
bustness of the phenomenon itself. How strong is the
188 T. Connolly, J. Reb / Organizational Behavior and Human Decision Processes 91 (2003) 186–202
evidence for a generalized tendency to prefer inaction inrealistic choice contexts?
Studies of moral intuitions
Two lines of evidence are commonly cited in support
of the idea that humans predominantly prefer inactions
(omissions) to actions. One line of work concerns our
moral intuitions on matters such as killing someonerather than allowing someone to die, stealing money vs.
not correcting an equivalent error in one�s favor or,more generally, actively causing a bad event to happen
rather than passively allowing it to happen. Many of the
demonstrations are, by design, quite far from the ev-
eryday experience of the subjects: an opportunity to win
a tennis game by poisoning one�s opponent (Sprancaet al., 1991), to save lives by deflecting the path of a run-away railroad car (Petrinovitch & O�Neill, 1996) or toprotect another person by intercepting a bullet in a
shopping-mall shoot-out (Royzman & Baron, 1999).
These ingeniously contrived scenarios are more in the
spirit of illustrations from introductory ethics textbooks
than samples of the real lives of real people. They in-
tentionally assume away such realistic details as how the
respondent is to know that the shopping-mall gunmanhas only a single bullet and unerring aim, and will kill,
with certainty, exactly one person; or how the tennis
player is to know that his opponent will be sickened but
not killed by the tainted salad dressing, or that his own
pleasure in winning will be undiminished by his dinner-
time trickery. As Petrinovitch and O�Neill (1996) note ina review of such studies, ‘‘Philosophers often create
fantasy moral dilemmas to investigate the nature ofmoral beliefs and intuitions’’ (p. 146; emphasis added);
and Baron (1992, p. 322) notes of a hostage murder
scenario, ‘‘...I assumed that the case was not realistic’’.
These stories are contrived to probe a moral intuition,
not to model a realistic choice. Thus, Petrinovitch and
O�Neill (1996, p. 149) instruct their subjects: ‘‘Acceptonly the information given and try not to introduce
additional assumptions that go beyond the problem asstated. Although some of the questions might appear
artificial...’’.
These fantasy moral dilemma studies commonly find
a preference for inaction: active or direct evil-doing is
often judged more reprehensible that indirect or passive
tolerance of evil (Haidt & Baron, 1996; Petrinovitch &
O�Neill, 1996; Royzman & Baron, 1999; Spranca et al.,
1991). The pattern is not invariable, however. Recentwork by Tanner and Medin (2002), for example, iden-
tifies a number of issues concerning environmental
stewardship in which common moral intuitions call for
action, and inaction is seen as morally deplorable.
Where the earlier studies appear to have identified moral
issues in which the dominant rule is ‘‘Thou shall not’’,
the more recent work identifies other issues in which the
preferred rule is ‘‘Thou shalt’’. It is, anyway, unlikelythat such moral intuitions are the predominant drivers
of real, mundane decisions such as flu vaccination.
Studies of realistic decisions
Although much of the literature on ‘‘omission bias’’
in mundane decisions seems to postulate a rather broad
and general tendency towards inaction, there is evidencethat the same individuals may display such a tendency in
one class of decisions but not another. Doctors, for
example, have been found to be reluctant to take action
in some contexts where action might be justified (Cohen
& Pauker, 1994), while appearing over-eager to take
action in others where such action is harder to support
(Ayanian & Berwick, 1991). We will therefore focus here
specifically on a single class of decisions, those involvingvaccination. These decisions are important in them-
selves, and have also been the focus of numerous studies
of ‘‘omission bias’’. Major studies of vaccination deci-
sions include Asch et al. (1994); Baron (1992, Experi-
ments 1 & 2); Baron and Ritov (1994, Experiment 4);
Meszaros et al. (1996); and Ritov and Baron (1990,
1998, Experiment 4)—a total of 10 studies involving
some 900 participants. All have reported data suggestingthat a substantial number, often a majority, of partici-
pants are reluctant to vaccinate when vaccination and
disease risks appear comparable or favor vaccination.
All have interpreted this reluctance as evidence of
‘‘omission bias’’. The central thrust of this paper is to
challenge both of these claims, on several grounds.
The first worry concerns measurement methods. In
laboratory studies of real-world vaccination decisions,the most commonly used measures of omission tendency
ask the respondent to make a numerical response that
would balance risks between two options. For example
in Asch et al. (1994), the respondent was told that her
child is exposed to a specified risk of contracting a flu,
and that an effective but potentially risky vaccine is
available. How safe must the vaccine be before the re-
spondent would vaccinate her child? In the Asch et al.study, the typical respondent demanded a sizable risk
premium (vaccine risk less than 40% of flu risk) before
he or she would vaccinate, a result the authors inter-
preted as indicating a strong preference for inaction (not
vaccinating) over action (vaccinating). The logic of this
measure is developed in more detail in Appendix A.
There are a number of problems in this numerical
risk-balancing approach. First, of course, it supposesthat the subject can approximate the complex balance of
utilities and probabilities represented in Eq. (A.1) of
Appendix A. This is not a trivial task. (See Connolly,
1987, for a discussion of the unintuitive results of such
utility/probability balancing in another context of bi-
nary choice under risk, the juror�s assessment of ‘‘rea-sonable doubt’’.) Note that the measure requires not
T. Connolly, J. Reb / Organizational Behavior and Human Decision Processes 91 (2003) 186–202 189
only that the respondent can see the directional impli-cations of, say, increasing flu risk, but also that he or she
can express the numerical size of this effect. Studies such
as Slovic and Monahan (1995) suggest that numerical
estimates of this sort should be treated with considerable
caution. Second, the logic of the measure is compelling
only if one assumes that the respondent considers the
facts provided by the experimenter as appropriate for
her decision—for example, that the population flu riskgiven is appropriate for her child, and that the vaccine
risk is honestly presented by the manufacturer. If Asch
et al.�s respondents assumed that the vaccine manufac-turer was understating the real risk, or that their chil-
dren were healthier or better-protected than the average
child, then their demand for a risk premium could have
been simply a way of equating real risk between the two
options.Third, interpreting the risk premium as a measure
of preference for inaction requires one to make the
strong assumption that the subject considers only the
outcome elements specified in the scenario by the ex-
perimenter (the state of the child�s health and one�shorror at directly causing harm). This assumption may
be defensible in a deliberately artificial scenario aimed
at isolating a moral intuition (see Petrinovitch andO�Neill�s instructions to their subjects, quoted above).However, in studies of realistic decisions such as
vaccination, it seems undesirable (and, perhaps, im-
possible) to exclude factors that parents would, in fact,
consider in making their decisions. Our interest is not
what they might do in an artificial world but what
they would do in the real world. In the context of a
real vaccination decision a parent�s choice might beshaped by innumerable other factors other than those
specified in the researcher�s scenario: a horror of
needle-pricks, the cost of, distance to and inconve-
nience of vaccination clinics, the ability vaccination
allows to control the timing of the child�s possiblesickness, the relevance and trustworthiness of the
probabilities offered (Meszaros et al., 1996), the sup-
port or disapproval of her friends, altruistic, free-rid-ing, and herd immunity considerations (Hershey,
Asch, Thumasathit, Meszaros, & Waters, 1994), ex-
posure to nagging by medical personnel or to sick
children in a clinic waiting-room, reluctance to engage
in complex risk/benefit assessments and any number of
other factors. At best, the risk-balancing measure re-
flects the aggregate influence of multiple factors such
as these—a list that may or may not include action orinaction per se. An individual who is disinclined to
vaccinate, or who demands a risk premium to do so,
might be revealing a preference for inaction per se, but
might just as plausibly be revealing any of a dozen
other preferences. Reluctance to vaccinate, in short, is
only the most tenuous evidence for a general reluc-
tance to act.
A fourth concern with the risk premium evidence isthat there may have been inadvertent bias in the re-
sponse scales used. In Asch et al.�s study, the only re-sponses allowed were those indicating a risk premium
favoring the vaccine. Respondents who indicated a
preference for vaccination even if it were riskier than
the flu were simply excluded, as ‘‘suggesting they had
misunderstood the question’’ (p. 121). In Ritov and
Baron (1990, Experiments 1 & 2), similarly, the onlyresponses allowed were those indicating a demand that
vaccine risk be less than flu risk. In their Experiment 4,
vaccine risk was specified and respondents indicated
the lowest flu risk at which they would vaccinate. The
responses were thus bounded below at zero, but un-
bounded above, so that the means would have been
inflated by any large-number responses participants
used to register reluctance to vaccinate under anycircumstances. Experiments 2 and 3, below, provide
direct evidence of measurement distortions of exactly
these sorts.
The final, and perhaps most telling, concern with the
numerical risk balancing approach is simply that it
produces extraordinary numbers. As noted above the
subjects in Asch et al. (1994) demanded risk premiums
implying that they typically felt that a child�s death fromvaccine was about 2.5 times as bad as is death from flu,
and a similar result is implied in Meszaros et al. (1996).
We find this ratio surprising, but not entirely unbeliev-
able. However, equivalent questions in Ritov and Baron
(1990, Experiment 4: 274) imply ratios ranging from
10:1 (Case 3) to 258:1 (Case 1). The authors interpret
these results as indicating an ‘‘immense omission bias’’
(p. 274) on the part of their subjects, though withoutexplaining why this bias should vary to such an ex-
traordinary degree from study to study. We offer an
alternative interpretation, based on measurement bias,
later in the paper. Whatever the interpretation, one
must surely treat with suspicion a procedure that pro-
duces utility estimates that vary across studies by a
factor of more than 100, and where the highest estimate
indicates that one�s grief at the death of a child isless than 1% due to the death per se, more than 99%
to one�s agency in bringing it about (Appendix A,
Example 2).
In summary, we see the numerical risk balancing
procedure as having several weaknesses. It requires the
subject to make complex tradeoffs of utility and
probability, and to accept probability numbers pro-
vided by the experimenter as relevant to her child; itrequires the experimenter to make strong assumptions
about what elements are included in the subject�smodel and how these elements are valued; its imple-
mentations to date appear to have inadvertently in-
corporated measurement bias; and it yields implausible
and widely varying numerical estimates of the outcome
utilities.
190 T. Connolly, J. Reb / Organizational Behavior and Human Decision Processes 91 (2003) 186–202
The problem of requiring a respondent to makedirect numerical estimates of acceptable risk can be
avoided if he or she is simply given a choice between
two options, as in Baron (1992, Experiment 1) where
subjects were asked whether they ‘‘should’’, and whe-
ther they ‘‘would’’, vaccinate their own child against a
flu with a 10 in 10,000 mortality rate if the vaccine had
a 5 in 10,000 mortality rate. On balance we prefer this
choice procedure to the numerical risk matching pro-cedure (though Experiment 3, below, suggests that it
may still retain measurement error problems). How-
ever, even if the procedure is interpreted as capturing
the respondent�s real preference, it does not establishthat the preference is biased in the sense of showing a
departure from a generally agreed-upon normative
standard. To establish bias, one must further assume
(a) that the only outcomes that should be consideredare those shown in Eq. (A.1) in Appendix A, and (b)
that the respondent should value both good outcomes
equally, and both bad outcomes equally. Neither nor-
mative claim seems self-evidently true. Why should a
parent not consider other factors, such as those sug-
gested earlier? And why should no allowance be made,
for example, for an element of parental rejoicing when
a prudent choice rather than simple luck heads off achild�s illness? Both normative assertions are requiredbefore a preference for inaction compels a verdict of
error. Whether the evidence suggests a predominant
tendency towards or against vaccination, there seems
to be no clear basis to claim that such a tendency
would be a bias.
Estimates of vaccination preference
In light of the methodological concerns discussed
above, and the widely varying results reported in the
studies, it is difficult to assess from existing studies the
distribution of vaccination preferences in the general
public. Asch et al. (1994) intentionally selected a
sample of adults markedly more hostile to vaccination
than the general public: the subscribers to Mothering
magazine, a journal sympathetic to ‘‘alternative’’
medicine, and in which several articles opposing dip-
theria–pertussis–tetanus (DPT) vaccine had recently
appeared. They found a mean anti-vaccine risk pre-
mium of approximately 2.5:1 (after eliminating two
respondents who indicated a pro-vaccine risk pre-
mium). Using a similar sample, Meszaros et al. (1996)
found almost no risk premium for self-reported vac-cinators, and about 2.2 for self-reported non-vaccina-
tors. Using student subjects, Ritov and Baron (1990),
found a tendency to anti-vaccination risk premiums in
their Experiments 1 and 2, with wide variation de-
pending on whether the same or different children were
affected by flu and vaccine. Their Experiment 4 yielded
the extraordinarily large anti-vaccine risk premiums
discussed earlier (ranging up to 258:1). Baron (1992,Experiment 1), in a scenario offering a pro-vaccine risk
premium of 2:1, found more than 80% of subjects
thought they should, and 70% that they would, vac-
cinate, and both percentages rose to above 90% after a
brief persuasive message. Baron and Ritov (1994, Ex-
periment 4) found 19% of subjects leaning against
vaccination even with a vaccine risk premium of 10:1,
and about 50% doing so when risks were roughlyequal, though 12% were pro-vaccine even when vac-
cine risks were 1.3 times flu risks. Ritov and Baron
(1995, Experiment 4) found a small majority (57%)
willing to vaccinate when vaccine and flu risks were
approximately equal, and only 4% unwilling to take
any vaccine risk at all. Ritov and Baron (1999) simi-
larly report that a minority of their sample held
avoidance of risky vaccination as a ‘‘protected value’’for which they were not prepared to make any
tradeoffs. We are hesitant to attempt a summary of
these widely varying responses, other than to note that
(a) most of the data suggest that at least some re-
spondents are reluctant to vaccinate when significant
risk is involved in doing so; (b) all the studies reviewed
involve one or more of the measurement problems
discussed above.
Experiment 1
The first experiment reported here had two pur-
poses. First, given the practical public health issues
involved, we wished to assess preferences for a hypo-
thetical flu vaccination in two populations, studentsand non-student adults. Second, we wished to test
whether the regret avoidance mechanism discussed
earlier might offer a more compelling account of vac-
cination preferences than does a hypothetical general
aversion to taking action (i.e., ‘‘omission bias’’). As
well as measuring vaccination preferences, the study
examines the extent to which respondents expect to feel
regret if they were to experience a bad outcome fromeither vaccination or non-vaccination. It also examines
the relationship between these anticipated regrets and
the respondents� readiness to choose vaccination for
their children.
To avoid the suspect numerical risk-balancing mea-
sures, we used a scenario in which the negative outcomes
of vaccination and non-vaccination were described as
equally likely, and as very similar in content, so that nocomplex balancing of probabilities and utilities was
required of the participants. The logic of Eq. (A.1)
(Appendix A) would predict indifference between vac-
cination and non-vaccination for this case. Any general
tendency toward omission (inaction) should thus shift
the predominant choice sharply in the direction of non-
vaccination.
T. Connolly, J. Reb / Organizational Behavior and Human Decision Processes 91 (2003) 186–202 191
Method
Task. Participants read a scenario in which they were
asked to imagine themselves in the role of a parent
having to decide whether or not to vaccinate his or her
small child. The scenario, modified from one used by
Asch et al. (1994) and Ritov and Baron (1990), read as
follows:
Imagine that, in Arizona, there have been several outbreaks of a
certain kind of flu, which can cause severe illness in children un-
der three. Only a small number of children exposed actually
catch this flu, but for those who do it�s quite severe. The chil-dren get very sick with high fevers, a lot of pain, and generally
feel horrible for several weeks.
A vaccine for this kind of flu has been developed and tested.
The vaccine eliminates any possibility of the child getting the
flu. The vaccine, however, can sometimes cause side-effects that
are very similar to the severe flu symptoms: high fever, pain,
feeling horrible. Fortunately, these unpleasant effects are rare.
In fact, the risk of a vaccinated child getting the unpleasant
side-effects is about as low as the chance of a non-vaccinated
child getting severe flu symptoms.
Imagine that you are married and have one child, a one-year
old. You have spent a lot of time trying to decide whether or
not to have the child vaccinated against this flu. After talking
to several doctors, reading medical journals and consulting with
friends it�s now time to decide whether to have your child vac-cinated or not.
Participants. The study included two different groups
of participants. The first (N ¼ 192) were recruited in
the jury waiting room of a large Southwestern city.Volunteers completed questionnaires while waiting to
be called for jury service. The pool was predominantly
(61%) women, and ranged in age from 19 to 78 with a
mean of 41.8 years. 60% reported themselves currently
married, 13% divorced or widowed, 26% single. Most
(86%) reported that they had received at least some
college education. Sixty-seven percent reported having
one or more children. The second group (N ¼ 103)were business undergraduates at a large Southwestern
university, participating for course credit. The sample
included a majority (55%) of men, and ranged in age
from 19 to 39, with a mean of 21.1 years. Only one
student reported having children. The student sample is
thus typical of the young and mainly childless samples
used in earlier studies, while the juror sample is more
closely representative of the larger adult popula-tion: older, predominantly married, and with parenting
experience.
Measures
Vaccination intention. After reading the scenario,
participants were asked: ‘‘How would you decide?’’
They indicated their vaccination intentions on a seven-point scale anchored at )3: Definitely not vaccinate; 0:Don�t know; and +3: Definitely vaccinate. They werealso asked, on two similar scales, what they would
decide if, instead of the equal risks stated in the sce-nario, the risk of a vaccinated child getting the un-
pleasant side-effects were (a) higher or (b) lower than
the risk of an unvaccinated child getting the severe flu
symptoms.
Emotion ratings. Respondents were asked to assess
the extent to which they would experience each of 11
emotions if their vaccination decision were to turn out
badly. On one page, the respondents were asked toimagine their feelings if their vaccinated child experi-
enced the severe side-effects. On a second page they were
asked about their feelings if their unvaccinated child
experienced the severe flu symptoms. The emotions as-
sessed were regret, self-blame, guilt, anger, shame, re-
sponsibility, dissatisfaction with self, disappointment,
sadness, pain, and happiness. A short header preceded
each instrument:
Suppose you [did decide] [decided not] to vaccinate. Unfortu-
nately, your child is one of those who has the [bad vaccine
side-effects] [severe flu symptoms]: high fever, a lot of pain,
and several weeks of feeling very sick. How much do you think
you would experience each of the following feelings in this sit-
uation?
Responses were on 0–10 scales anchored at 0: I would
not experience this at all, and 10: I would experience this
a lot.
Relative seriousness ratings. Participants were asked
on a final page:
From what you understand of the story, how do the severe flu
symptoms and the vaccine side-effects compare in terms of over-
all seriousness? Would you say that (check one):
(—) The severe flu symptoms are more serious overall than the
vaccine side-effects.
(—) The severe flu symptoms are less serious overall than the
vaccine side-effects.
(—) The severe flu symptoms are just as serious overall as the
vaccine side-effects.
A response indicating flu symptoms were perceived as
less serious was coded as )1, equally serious as 0, andmore serious as 1. To control for possible question-order
effects, half of the questionnaires were assembled withemotion ratings preceding the vaccination intention
questions. Within each, half of the emotion ratings ad-
dressed side-effects first, the other half addressed severe
flu first.
Results
Overall a clear majority of respondents favored vac-cination in the base-line scenario we presented (i.e.,
equally low risks of severe side-effects and of severe flu).
Of 293 respondents, 192 (65.3%) favored vaccination vs.
73 (24.8%) who opposed it (v2ð1Þ ¼ 53:44, p < :001).This tendency was still stronger when respondents con-
sidered the hypothetical case in which the vaccine risk
was lower than the flu risk, 71.7% vs. 22.5%, but it
Table 1
Numbers of respondents indicating pro- and anti-vaccination intentions vs. relative risk of vaccine side-effects and flu (Experiment 1)
Relative risk of vaccine side-effects and flu
If vaccine risk higher Base-line scenario If vaccine risk lower
Vaccination intention n Percent n Percent n Percent
Negativea 154 52.6 73 24.8 66 22.5
Don�t know 22 7.5 29 9.9 17 5.8
Positive 117 39.9 192 65.3 210 71.7
Total 293 100 294 100 293 100
a ‘‘Negative’’ includes all responses from )1 to )3 (i.e., anti-vaccination); ‘‘Positive’’ includes all responses from +1 to +3 (i.e., pro-vaccination).
1 In response to a reviewer�s request, we tested two alternativewordings of the seriousness measure, the standard format (‘‘Are flu
symptoms more serious, just as serious or less serious than the side
effects?’’) and an alternate format (‘‘Are side effects more serious, just
as serious, or less serious than the flu symptoms?’’). We also
manipulated placement, inserting the question either before or after
asking about vaccination preferences, to check for possible post-
decision bolstering. A 2 (wording)� 2 (placement) factorial experimentusing 80 undergraduate respondents found no effect on either judged
seriousness or on vaccination preference for either manipulation. As in
Experiment 1, the majority of respondents (21 or 22 of 40) judged the
two risks equally serious, with a substantial minority (15 or 16 of 40)
judging the flu more serious (or the side effects less so). The majority
thus appear to stick closely to the facts given in the scenario (flu and
side effects equally serious), while participants who introduce other,
extra-scenario considerations do so predominantly on the pro-vacci-
nation side. Wording and placement appear to have no effect on these
evaluations of relative seriousness.
192 T. Connolly, J. Reb / Organizational Behavior and Human Decision Processes 91 (2003) 186–202
reversed when the opposite balance of risks was sug-gested, 39.9% vs. 52.6% (Table 1). A 3(Risk: vaccine risk
lower vs. equal risk vs. vaccine risk higher; within-sub-
ject)� 2(Sample: general population vs. students; be-
tween-subjects) repeated measures ANOVA of
vaccination intention showed a significant main effect for
Risk, (F ð2; 582Þ ¼ 57:05, p < :001), but no significantmain effect for Sample, (F ð1; 291Þ ¼ 1:85, ns) and nosignificant Risk� Sample interaction (F ð2; 582Þ ¼ 2:22,ns). Both pairwise differences were significant. Vaccina-tion intention was higher when vaccine risk was lower
than baseline (M ¼ 1:15; 0:84; tð292Þ ¼ 2:62, p < :01),and lower when vaccine risk was higher than baseline
(M ¼ �0:34, 0.84; tð292Þ ¼ 9:28, p < :001). Vaccinationintention was reliably greater than zero for both baseline
(tð293Þ ¼ 7:34, p < :001) and low vaccine risk
(tð292Þ ¼ 9:79, p < :001) conditions, and reliably nega-tive (tð292Þ ¼ 2:63, p < :01) for the high vaccine riskcondition. The pattern of results thus suggests an ap-
propriate sensitivity to relative risks, with a majority in
favor of vaccination when the risks are equal. Given the
substantial similarity in vaccination intentions for the
two subject pools, subsequent findings will be reported
only for the pooled samples unless significant differences
were found in the analysis.The size of the pro-vaccination majority is moder-
ated by the perceived relative seriousness of the flu
symptoms and the vaccine side-effects. The scenario
described the two bad outcomes as equally serious.
Both involved ‘‘high fevers, a lot of pain, and gener-
ally feeling horrible’’, and were described as ‘‘very
similar’’. (Since our interest is in realistic vaccination
decisions, no effort was made to equate or eliminateother aspects of these outcomes the respondents may
have thought relevant.) Of a pooled total of 290 re-
spondents, a majority (n ¼ 175 or 60.3%) rated the flu
and the vaccine side-effects equally serious. Among
these a majority favored vaccination (53.7% vs. 34.9%
opposed, v2 ¼ 7:03, p < :01), and mean vaccina-
tion intention was significantly positive (M ¼ :33;tð174Þ ¼ 2:16, p < :05). A substantial minority of re-spondents (n ¼ 92; 31:2%) rated the flu as more seri-ous than the vaccine side-effects, presumably
considering other factors as well as those specified inthe scenario.1 These respondents were overwhelmingly
in favor of vaccination (90.2% in favor, 3.3% opposed,
v2ð1Þ ¼ 78:4, p < :001). Even among those few who
saw the side-effects as more serious than the flu
symptoms (n ¼ 23, 7.8%) there was a slight tendency
to favor vaccination (56.5% in favor, 39.1% opposed),
but this difference was not statistically significant
(v2ð1Þ ¼ :73, ns). This pattern of results (Table 2)suggests that perceptions of the relative seriousness of
flu and side effects are systematically related to vac-
cination intentions. In fact, the two measures are
significantly correlated, r ¼ :31, p < :001. The more
serious the flu is perceived to be in comparison to the
vaccine side-effects, the stronger the intention to vac-
cinate.
There is thus evidence of at least some degree ofthoughtful risk-balancing in the overall pattern of re-
sponses, with enthusiasm for vaccination appropriately
related both to relative probabilities and to perceived
relative seriousness of the possible bad outcomes. The
overall tendency is to prefer vaccination: When vacci-
nation and non-vaccination present equally serious risks
at equal probabilities, vaccination is preferred in both
pools of respondents by a substantial majority.
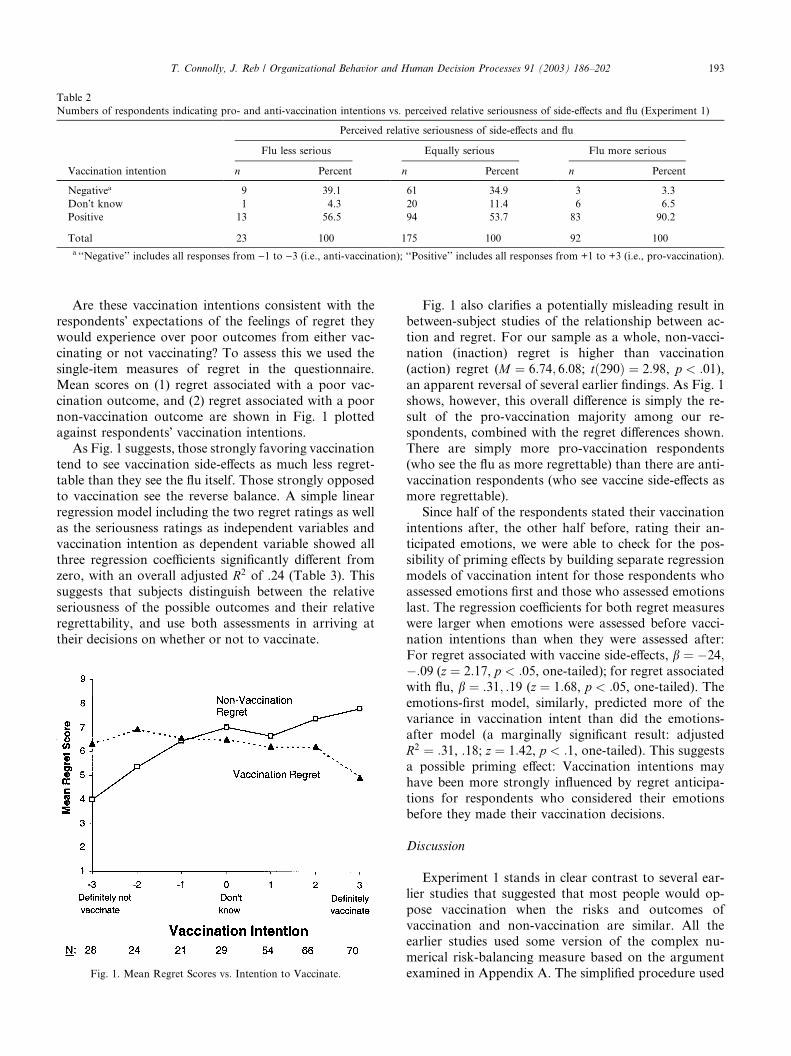
Table 2
Numbers of respondents indicating pro- and anti-vaccination intentions vs. perceived relative seriousness of side-effects and flu (Experiment 1)
Perceived relative seriousness of side-effects and flu
Flu less serious Equally serious Flu more serious
Vaccination intention n Percent n Percent n Percent
Negativea 9 39.1 61 34.9 3 3.3
Don�t know 1 4.3 20 11.4 6 6.5
Positive 13 56.5 94 53.7 83 90.2
Total 23 100 175 100 92 100
a ‘‘Negative’’ includes all responses from )1 to )3 (i.e., anti-vaccination); ‘‘Positive’’ includes all responses from +1 to +3 (i.e., pro-vaccination).
T. Connolly, J. Reb / Organizational Behavior and Human Decision Processes 91 (2003) 186–202 193
Are these vaccination intentions consistent with the
respondents� expectations of the feelings of regret theywould experience over poor outcomes from either vac-
cinating or not vaccinating? To assess this we used the
single-item measures of regret in the questionnaire.
Mean scores on (1) regret associated with a poor vac-
cination outcome, and (2) regret associated with a poor
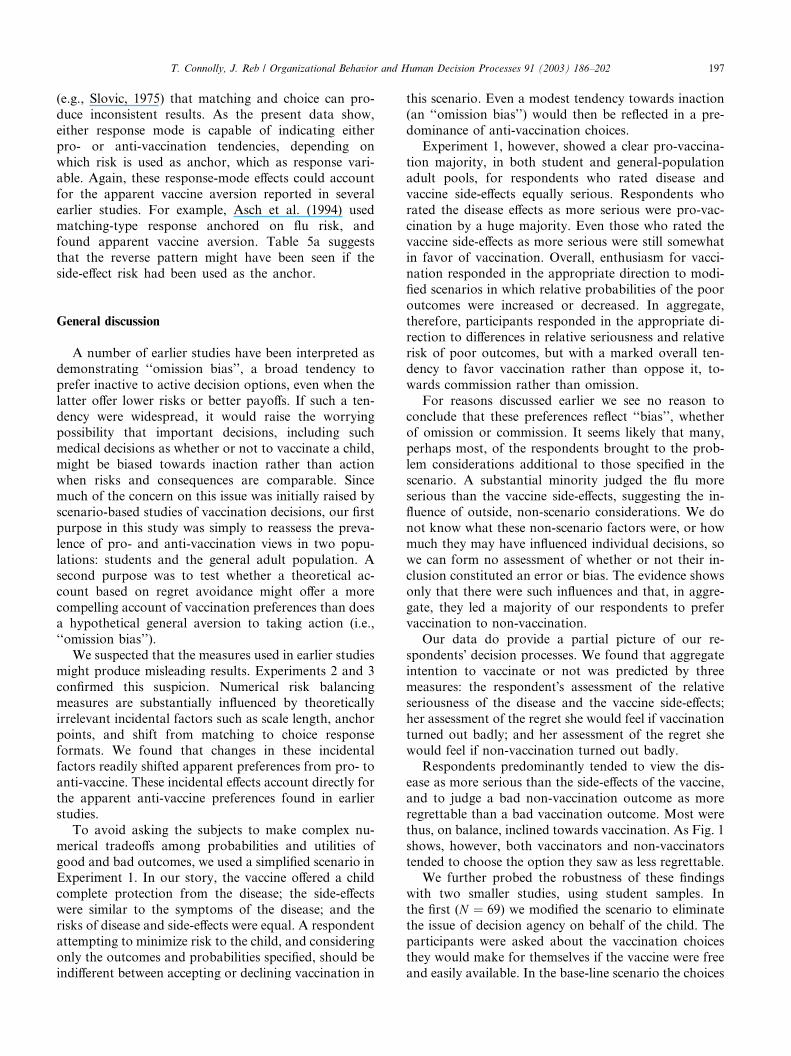
non-vaccination outcome are shown in Fig. 1 plottedagainst respondents� vaccination intentions.As Fig. 1 suggests, those strongly favoring vaccination
tend to see vaccination side-effects as much less regret-
table than they see the flu itself. Those strongly opposed
to vaccination see the reverse balance. A simple linear
regression model including the two regret ratings as well
as the seriousness ratings as independent variables and
vaccination intention as dependent variable showed allthree regression coefficients significantly different from
zero, with an overall adjusted R2 of .24 (Table 3). Thissuggests that subjects distinguish between the relative
seriousness of the possible outcomes and their relative
regrettability, and use both assessments in arriving at
their decisions on whether or not to vaccinate.
Fig. 1. Mean Regret Scores vs. Intention to Vaccinate.
Fig. 1 also clarifies a potentially misleading result in
between-subject studies of the relationship between ac-
tion and regret. For our sample as a whole, non-vacci-
nation (inaction) regret is higher than vaccination
(action) regret (M ¼ 6:74; 6:08; tð290Þ ¼ 2:98, p < :01),an apparent reversal of several earlier findings. As Fig. 1
shows, however, this overall difference is simply the re-
sult of the pro-vaccination majority among our re-spondents, combined with the regret differences shown.
There are simply more pro-vaccination respondents
(who see the flu as more regrettable) than there are anti-
vaccination respondents (who see vaccine side-effects as
more regrettable).
Since half of the respondents stated their vaccination
intentions after, the other half before, rating their an-
ticipated emotions, we were able to check for the pos-sibility of priming effects by building separate regression
models of vaccination intent for those respondents who
assessed emotions first and those who assessed emotions
last. The regression coefficients for both regret measures
were larger when emotions were assessed before vacci-
nation intentions than when they were assessed after:
For regret associated with vaccine side-effects, b ¼ �24;�:09 (z ¼ 2:17, p < :05, one-tailed); for regret associatedwith flu, b ¼ :31; :19 (z ¼ 1:68, p < :05, one-tailed). Theemotions-first model, similarly, predicted more of the
variance in vaccination intent than did the emotions-
after model (a marginally significant result: adjusted
R2 ¼ :31, .18; z ¼ 1:42, p < :1, one-tailed). This suggestsa possible priming effect: Vaccination intentions may
have been more strongly influenced by regret anticipa-
tions for respondents who considered their emotionsbefore they made their vaccination decisions.
Discussion
Experiment 1 stands in clear contrast to several ear-
lier studies that suggested that most people would op-
pose vaccination when the risks and outcomes of
vaccination and non-vaccination are similar. All theearlier studies used some version of the complex nu-
merical risk-balancing measure based on the argument
examined in Appendix A. The simplified procedure used
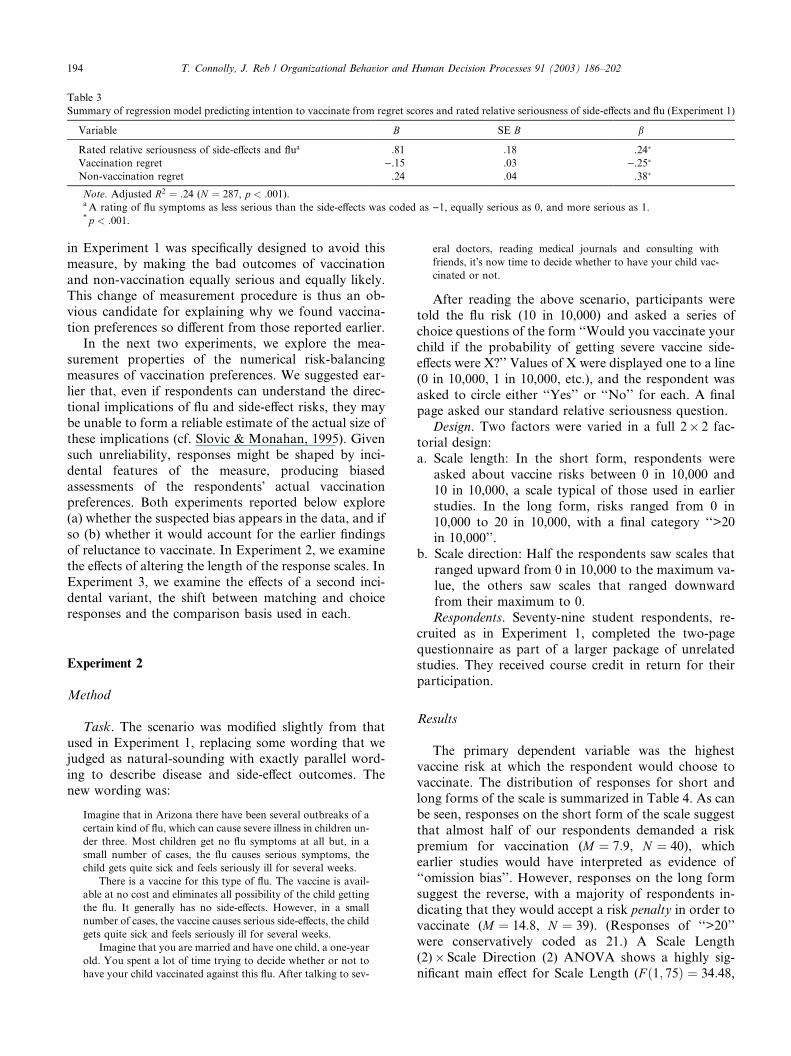
Table 3
Summary of regression model predicting intention to vaccinate from regret scores and rated relative seriousness of side-effects and flu (Experiment 1)
Variable B SE B b
Rated relative seriousness of side-effects and flua .81 .18 .24�
Vaccination regret ).15 .03 ).25�
Non-vaccination regret .24 .04 .38�
Note. Adjusted R2 ¼ :24 (N ¼ 287, p < :001).aA rating of flu symptoms as less serious than the side-effects was coded as )1, equally serious as 0, and more serious as 1.* p < :001.
194 T. Connolly, J. Reb / Organizational Behavior and Human Decision Processes 91 (2003) 186–202
in Experiment 1 was specifically designed to avoid this
measure, by making the bad outcomes of vaccination
and non-vaccination equally serious and equally likely.
This change of measurement procedure is thus an ob-
vious candidate for explaining why we found vaccina-
tion preferences so different from those reported earlier.
In the next two experiments, we explore the mea-
surement properties of the numerical risk-balancingmeasures of vaccination preferences. We suggested ear-
lier that, even if respondents can understand the direc-
tional implications of flu and side-effect risks, they may
be unable to form a reliable estimate of the actual size of
these implications (cf. Slovic & Monahan, 1995). Given
such unreliability, responses might be shaped by inci-
dental features of the measure, producing biased
assessments of the respondents� actual vaccinationpreferences. Both experiments reported below explore
(a) whether the suspected bias appears in the data, and if
so (b) whether it would account for the earlier findings
of reluctance to vaccinate. In Experiment 2, we examine
the effects of altering the length of the response scales. In
Experiment 3, we examine the effects of a second inci-
dental variant, the shift between matching and choice
responses and the comparison basis used in each.
Experiment 2
Method
Task. The scenario was modified slightly from that
used in Experiment 1, replacing some wording that wejudged as natural-sounding with exactly parallel word-
ing to describe disease and side-effect outcomes. The
new wording was:
Imagine that in Arizona there have been several outbreaks of a
certain kind of flu, which can cause severe illness in children un-
der three. Most children get no flu symptoms at all but, in a
small number of cases, the flu causes serious symptoms, the
child gets quite sick and feels seriously ill for several weeks.
There is a vaccine for this type of flu. The vaccine is avail-
able at no cost and eliminates all possibility of the child getting
the flu. It generally has no side-effects. However, in a small
number of cases, the vaccine causes serious side-effects, the child
gets quite sick and feels seriously ill for several weeks.
Imagine that you are married and have one child, a one-year
old. You spent a lot of time trying to decide whether or not to
have your child vaccinated against this flu. After talking to sev-
eral doctors, reading medical journals and consulting with
friends, it�s now time to decide whether to have your child vac-cinated or not.
After reading the above scenario, participants were
told the flu risk (10 in 10,000) and asked a series of
choice questions of the form ‘‘Would you vaccinate your
child if the probability of getting severe vaccine side-
effects were X?’’ Values of X were displayed one to a line
(0 in 10,000, 1 in 10,000, etc.), and the respondent was
asked to circle either ‘‘Yes’’ or ‘‘No’’ for each. A finalpage asked our standard relative seriousness question.
Design. Two factors were varied in a full 2� 2 fac-torial design:
a. Scale length: In the short form, respondents were
asked about vaccine risks between 0 in 10,000 and
10 in 10,000, a scale typical of those used in earlier
studies. In the long form, risks ranged from 0 in
10,000 to 20 in 10,000, with a final category ‘‘>20in 10,000’’.
b. Scale direction: Half the respondents saw scales that
ranged upward from 0 in 10,000 to the maximum va-
lue, the others saw scales that ranged downward
from their maximum to 0.
Respondents. Seventy-nine student respondents, re-
cruited as in Experiment 1, completed the two-page
questionnaire as part of a larger package of unrelatedstudies. They received course credit in return for their
participation.
Results
The primary dependent variable was the highest
vaccine risk at which the respondent would choose to
vaccinate. The distribution of responses for short andlong forms of the scale is summarized in Table 4. As can
be seen, responses on the short form of the scale suggest
that almost half of our respondents demanded a risk
premium for vaccination (M ¼ 7:9, N ¼ 40), which
earlier studies would have interpreted as evidence of
‘‘omission bias’’. However, responses on the long form
suggest the reverse, with a majority of respondents in-
dicating that they would accept a risk penalty in order tovaccinate (M ¼ 14:8, N ¼ 39). (Responses of ‘‘>20’’
were conservatively coded as 21.) A Scale Length
(2)� Scale Direction (2) ANOVA shows a highly sig-
nificant main effect for Scale Length (F ð1; 75Þ ¼ 34:48,
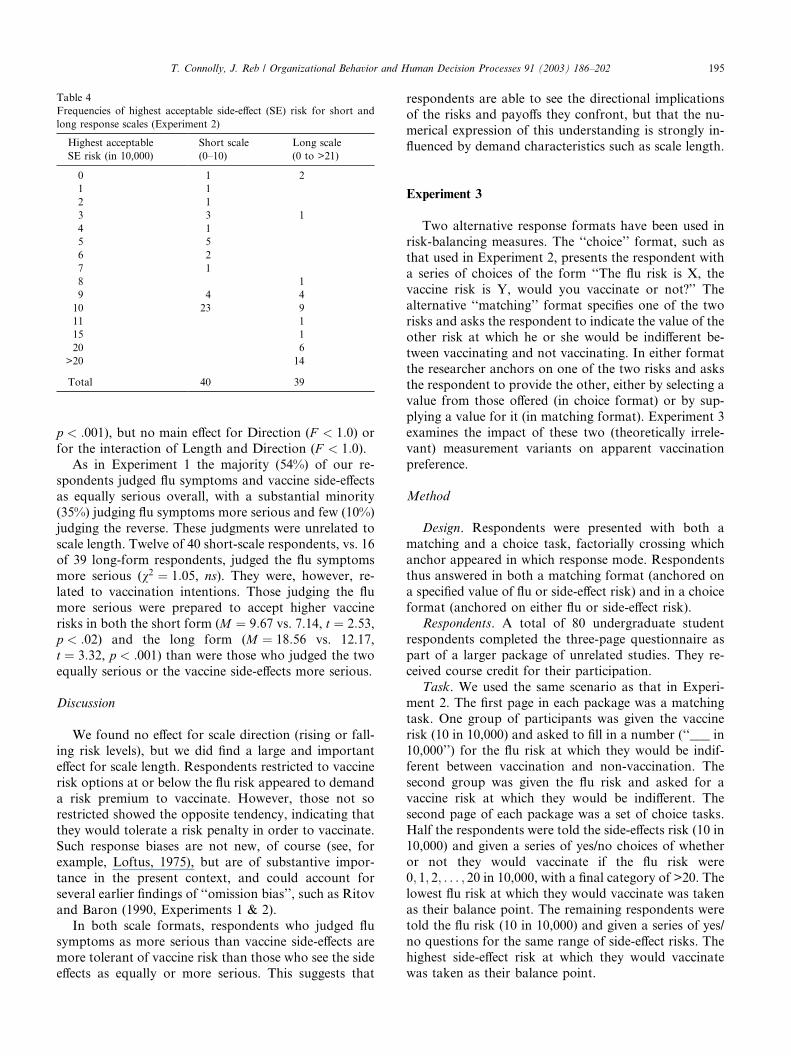
Table 4
Frequencies of highest acceptable side-effect (SE) risk for short and
long response scales (Experiment 2)
Highest acceptable Short scale Long scale
SE risk (in 10,000) (0–10) (0 to >21)
0 1 2
1 1
2 1
3 3 1
4 1
5 5
6 2
7 1
8 1
9 4 4
10 23 9
11 1
15 1
20 6
>20 14
Total 40 39
T. Connolly, J. Reb / Organizational Behavior and Human Decision Processes 91 (2003) 186–202 195
p < :001), but no main effect for Direction (F < 1:0) orfor the interaction of Length and Direction (F < 1:0).As in Experiment 1 the majority (54%) of our re-
spondents judged flu symptoms and vaccine side-effects
as equally serious overall, with a substantial minority
(35%) judging flu symptoms more serious and few (10%)
judging the reverse. These judgments were unrelated to
scale length. Twelve of 40 short-scale respondents, vs. 16of 39 long-form respondents, judged the flu symptoms
more serious (v2 ¼ 1:05, ns). They were, however, re-lated to vaccination intentions. Those judging the flu
more serious were prepared to accept higher vaccine
risks in both the short form (M ¼ 9:67 vs. 7.14, t ¼ 2:53,p < :02) and the long form (M ¼ 18:56 vs. 12.17,
t ¼ 3:32, p < :001) than were those who judged the twoequally serious or the vaccine side-effects more serious.
Discussion
We found no effect for scale direction (rising or fall-
ing risk levels), but we did find a large and important
effect for scale length. Respondents restricted to vaccine
risk options at or below the flu risk appeared to demand
a risk premium to vaccinate. However, those not sorestricted showed the opposite tendency, indicating that
they would tolerate a risk penalty in order to vaccinate.
Such response biases are not new, of course (see, for
example, Loftus, 1975), but are of substantive impor-
tance in the present context, and could account for
several earlier findings of ‘‘omission bias’’, such as Ritov
and Baron (1990, Experiments 1 & 2).
In both scale formats, respondents who judged flusymptoms as more serious than vaccine side-effects are
more tolerant of vaccine risk than those who see the side
effects as equally or more serious. This suggests that
respondents are able to see the directional implicationsof the risks and payoffs they confront, but that the nu-
merical expression of this understanding is strongly in-
fluenced by demand characteristics such as scale length.
Experiment 3
Two alternative response formats have been used inrisk-balancing measures. The ‘‘choice’’ format, such as
that used in Experiment 2, presents the respondent with
a series of choices of the form ‘‘The flu risk is X, the
vaccine risk is Y, would you vaccinate or not?’’ The
alternative ‘‘matching’’ format specifies one of the two
risks and asks the respondent to indicate the value of the
other risk at which he or she would be indifferent be-
tween vaccinating and not vaccinating. In either formatthe researcher anchors on one of the two risks and asks
the respondent to provide the other, either by selecting a
value from those offered (in choice format) or by sup-
plying a value for it (in matching format). Experiment 3
examines the impact of these two (theoretically irrele-
vant) measurement variants on apparent vaccination
preference.
Method
Design. Respondents were presented with both a
matching and a choice task, factorially crossing which
anchor appeared in which response mode. Respondents
thus answered in both a matching format (anchored on
a specified value of flu or side-effect risk) and in a choice
format (anchored on either flu or side-effect risk).Respondents. A total of 80 undergraduate student
respondents completed the three-page questionnaire as
part of a larger package of unrelated studies. They re-
ceived course credit for their participation.
Task. We used the same scenario as that in Experi-
ment 2. The first page in each package was a matching
task. One group of participants was given the vaccine
risk (10 in 10,000) and asked to fill in a number (‘‘___ in10,000’’) for the flu risk at which they would be indif-
ferent between vaccination and non-vaccination. The
second group was given the flu risk and asked for a
vaccine risk at which they would be indifferent. The
second page of each package was a set of choice tasks.
Half the respondents were told the side-effects risk (10 in
10,000) and given a series of yes/no choices of whether
or not they would vaccinate if the flu risk were0; 1; 2; . . . ; 20 in 10,000, with a final category of >20. Thelowest flu risk at which they would vaccinate was taken
as their balance point. The remaining respondents were
told the flu risk (10 in 10,000) and given a series of yes/
no questions for the same range of side-effect risks. The
highest side-effect risk at which they would vaccinate
was taken as their balance point.
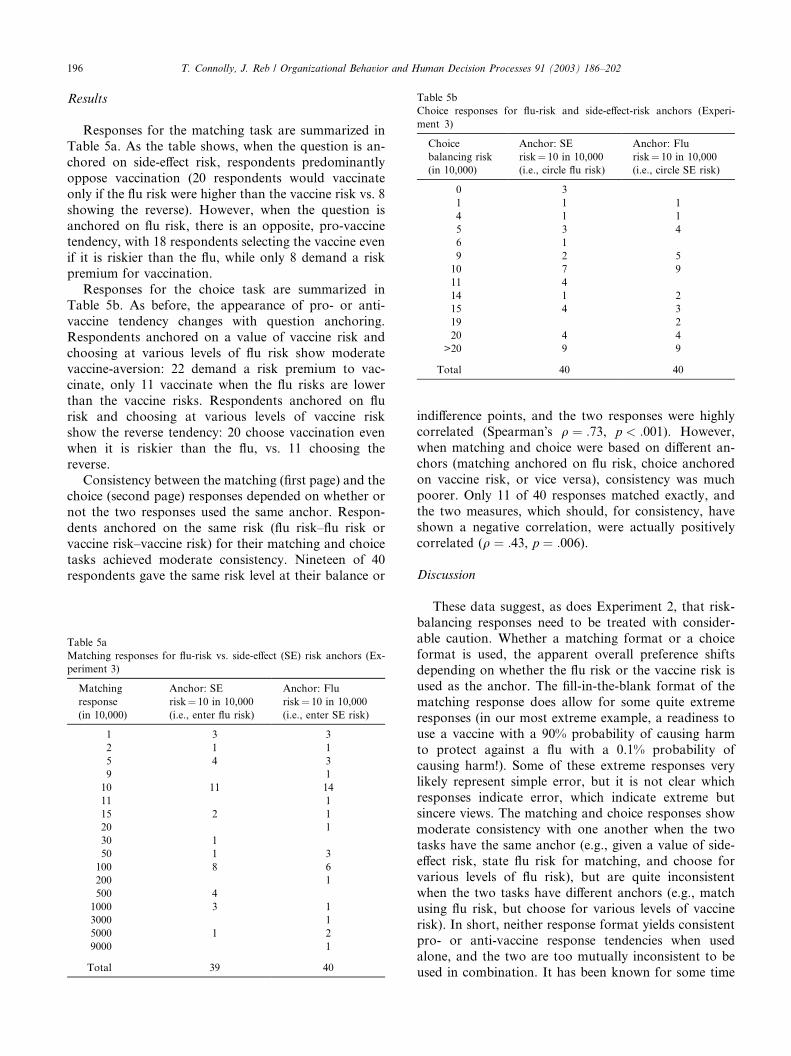
Table 5b
Choice responses for flu-risk and side-effect-risk anchors (Experi-
ment 3)
Choice
balancing risk
(in 10,000)
Anchor: SE
risk¼ 10 in 10,000(i.e., circle flu risk)
Anchor: Flu
risk¼ 10 in 10,000(i.e., circle SE risk)
0 3
1 1 1
4 1 1
5 3 4
6 1
9 2 5
10 7 9
11 4
14 1 2
15 4 3
19 2
20 4 4
>20 9 9
Total 40 40
196 T. Connolly, J. Reb / Organizational Behavior and Human Decision Processes 91 (2003) 186–202
Results
Responses for the matching task are summarized in
Table 5a. As the table shows, when the question is an-
chored on side-effect risk, respondents predominantly
oppose vaccination (20 respondents would vaccinate
only if the flu risk were higher than the vaccine risk vs. 8
showing the reverse). However, when the question is
anchored on flu risk, there is an opposite, pro-vaccinetendency, with 18 respondents selecting the vaccine even
if it is riskier than the flu, while only 8 demand a risk
premium for vaccination.
Responses for the choice task are summarized in
Table 5b. As before, the appearance of pro- or anti-
vaccine tendency changes with question anchoring.
Respondents anchored on a value of vaccine risk and
choosing at various levels of flu risk show moderatevaccine-aversion: 22 demand a risk premium to vac-
cinate, only 11 vaccinate when the flu risks are lower
than the vaccine risks. Respondents anchored on flu
risk and choosing at various levels of vaccine risk
show the reverse tendency: 20 choose vaccination even
when it is riskier than the flu, vs. 11 choosing the
reverse.
Consistency between the matching (first page) and thechoice (second page) responses depended on whether or
not the two responses used the same anchor. Respon-
dents anchored on the same risk (flu risk–flu risk or
vaccine risk–vaccine risk) for their matching and choice
tasks achieved moderate consistency. Nineteen of 40
respondents gave the same risk level at their balance or
Table 5a
Matching responses for flu-risk vs. side-effect (SE) risk anchors (Ex-
periment 3)
Matching
response
(in 10,000)
Anchor: SE
risk¼ 10 in 10,000(i.e., enter flu risk)
Anchor: Flu
risk¼ 10 in 10,000(i.e., enter SE risk)
1 3 3
2 1 1
5 4 3
9 1
10 11 14
11 1
15 2 1
20 1
30 1
50 1 3
100 8 6
200 1
500 4
1000 3 1
3000 1
5000 1 2
9000 1
Total 39 40
indifference points, and the two responses were highlycorrelated (Spearman�s q ¼ :73, p < :001). However,when matching and choice were based on different an-
chors (matching anchored on flu risk, choice anchored
on vaccine risk, or vice versa), consistency was much
poorer. Only 11 of 40 responses matched exactly, and
the two measures, which should, for consistency, have
shown a negative correlation, were actually positively
correlated (q ¼ :43, p ¼ :006).
Discussion
These data suggest, as does Experiment 2, that risk-
balancing responses need to be treated with consider-
able caution. Whether a matching format or a choice
format is used, the apparent overall preference shifts
depending on whether the flu risk or the vaccine risk isused as the anchor. The fill-in-the-blank format of the
matching response does allow for some quite extreme
responses (in our most extreme example, a readiness to
use a vaccine with a 90% probability of causing harm
to protect against a flu with a 0.1% probability of
causing harm!). Some of these extreme responses very
likely represent simple error, but it is not clear which
responses indicate error, which indicate extreme butsincere views. The matching and choice responses show
moderate consistency with one another when the two
tasks have the same anchor (e.g., given a value of side-
effect risk, state flu risk for matching, and choose for
various levels of flu risk), but are quite inconsistent
when the two tasks have different anchors (e.g., match
using flu risk, but choose for various levels of vaccine
risk). In short, neither response format yields consistentpro- or anti-vaccine response tendencies when used
alone, and the two are too mutually inconsistent to be
used in combination. It has been known for some time
T. Connolly, J. Reb / Organizational Behavior and Human Decision Processes 91 (2003) 186–202 197
(e.g., Slovic, 1975) that matching and choice can pro-duce inconsistent results. As the present data show,
either response mode is capable of indicating either
pro- or anti-vaccination tendencies, depending on
which risk is used as anchor, which as response vari-
able. Again, these response-mode effects could account
for the apparent vaccine aversion reported in several
earlier studies. For example, Asch et al. (1994) used
matching-type response anchored on flu risk, andfound apparent vaccine aversion. Table 5a suggests
that the reverse pattern might have been seen if the
side-effect risk had been used as the anchor.
General discussion
A number of earlier studies have been interpreted asdemonstrating ‘‘omission bias’’, a broad tendency to
prefer inactive to active decision options, even when the
latter offer lower risks or better payoffs. If such a ten-
dency were widespread, it would raise the worrying
possibility that important decisions, including such
medical decisions as whether or not to vaccinate a child,
might be biased towards inaction rather than action
when risks and consequences are comparable. Sincemuch of the concern on this issue was initially raised by
scenario-based studies of vaccination decisions, our first
purpose in this study was simply to reassess the preva-
lence of pro- and anti-vaccination views in two popu-
lations: students and the general adult population. A
second purpose was to test whether a theoretical ac-
count based on regret avoidance might offer a more
compelling account of vaccination preferences than doesa hypothetical general aversion to taking action (i.e.,
‘‘omission bias’’).
We suspected that the measures used in earlier studies
might produce misleading results. Experiments 2 and 3
confirmed this suspicion. Numerical risk balancing
measures are substantially influenced by theoretically
irrelevant incidental factors such as scale length, anchor
points, and shift from matching to choice responseformats. We found that changes in these incidental
factors readily shifted apparent preferences from pro- to
anti-vaccine. These incidental effects account directly for
the apparent anti-vaccine preferences found in earlier
studies.
To avoid asking the subjects to make complex nu-
merical tradeoffs among probabilities and utilities of
good and bad outcomes, we used a simplified scenario inExperiment 1. In our story, the vaccine offered a child
complete protection from the disease; the side-effects
were similar to the symptoms of the disease; and the
risks of disease and side-effects were equal. A respondent
attempting to minimize risk to the child, and considering
only the outcomes and probabilities specified, should be
indifferent between accepting or declining vaccination in
this scenario. Even a modest tendency towards inaction(an ‘‘omission bias’’) would then be reflected in a pre-
dominance of anti-vaccination choices.
Experiment 1, however, showed a clear pro-vaccina-
tion majority, in both student and general-population
adult pools, for respondents who rated disease and
vaccine side-effects equally serious. Respondents who
rated the disease effects as more serious were pro-vac-
cination by a huge majority. Even those who rated thevaccine side-effects as more serious were still somewhat
in favor of vaccination. Overall, enthusiasm for vacci-
nation responded in the appropriate direction to modi-
fied scenarios in which relative probabilities of the poor
outcomes were increased or decreased. In aggregate,
therefore, participants responded in the appropriate di-
rection to differences in relative seriousness and relative
risk of poor outcomes, but with a marked overall ten-dency to favor vaccination rather than oppose it, to-
wards commission rather than omission.
For reasons discussed earlier we see no reason to
conclude that these preferences reflect ‘‘bias’’, whether
of omission or commission. It seems likely that many,
perhaps most, of the respondents brought to the prob-
lem considerations additional to those specified in the
scenario. A substantial minority judged the flu moreserious than the vaccine side-effects, suggesting the in-
fluence of outside, non-scenario considerations. We do
not know what these non-scenario factors were, or how
much they may have influenced individual decisions, so
we can form no assessment of whether or not their in-
clusion constituted an error or bias. The evidence shows
only that there were such influences and that, in aggre-
gate, they led a majority of our respondents to prefervaccination to non-vaccination.
Our data do provide a partial picture of our re-
spondents� decision processes. We found that aggregateintention to vaccinate or not was predicted by three
measures: the respondent�s assessment of the relativeseriousness of the disease and the vaccine side-effects;
her assessment of the regret she would feel if vaccination
turned out badly; and her assessment of the regret shewould feel if non-vaccination turned out badly.
Respondents predominantly tended to view the dis-
ease as more serious than the side-effects of the vaccine,
and to judge a bad non-vaccination outcome as more
regrettable than a bad vaccination outcome. Most were
thus, on balance, inclined towards vaccination. As Fig. 1
shows, however, both vaccinators and non-vaccinators
tended to choose the option they saw as less regrettable.We further probed the robustness of these findings
with two smaller studies, using student samples. In
the first (N ¼ 69) we modified the scenario to eliminate
the issue of decision agency on behalf of the child. The
participants were asked about the vaccination choices
they would make for themselves if the vaccine were free
and easily available. In the base-line scenario the choices
198 T. Connolly, J. Reb / Organizational Behavior and Human Decision Processes 91 (2003) 186–202
were balanced (31 in favor of vaccination, 31 opposed).They were strongly pro-vaccination if side-effect risks
were to drop: 53 (76.8%) in favor, 13 (18.8%) opposed
(v2ð1Þ ¼ 24:24, p < :001), and strongly opposed if side-effect risks were to rise: 60 (87.0%) opposed, 6 (8.7%) in
favor (v2ð1Þ ¼ 44:18, p < :001). As in the main study, wefound that both expected regret over a bad vaccination
outcome (b ¼ �:21, p < :09) and over a bad non-vac-cination outcome (b ¼ :39, p < :01) were significantpredictors of vaccination intention.
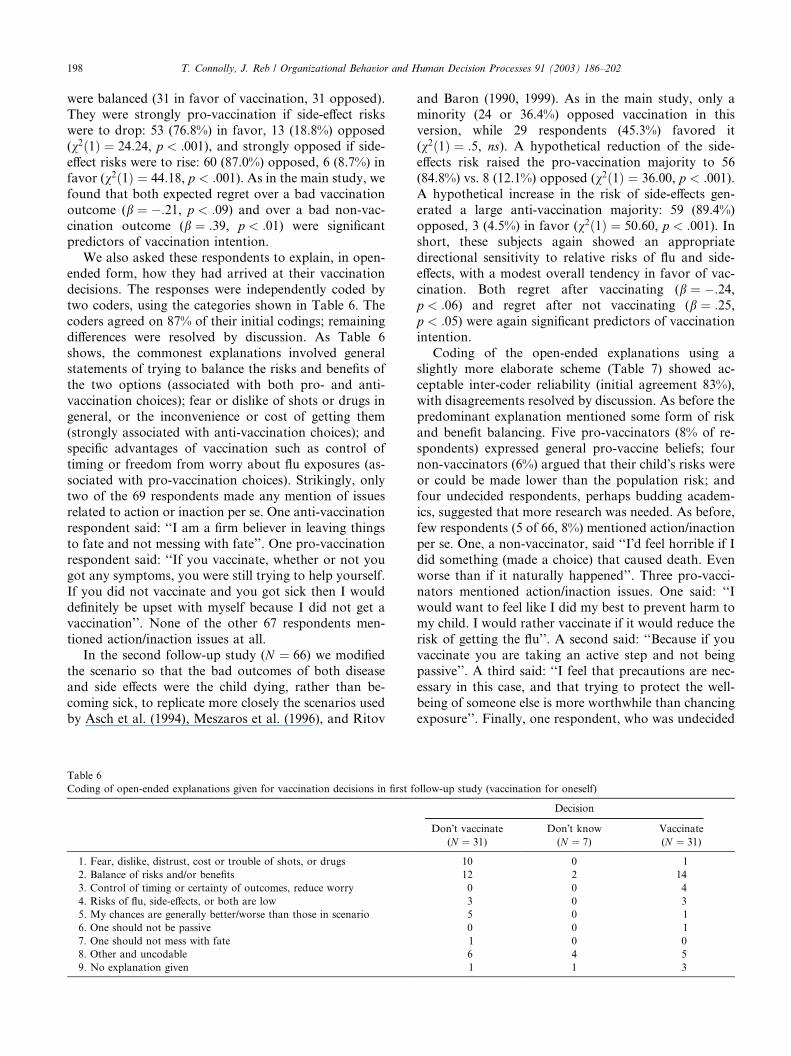
We also asked these respondents to explain, in open-
ended form, how they had arrived at their vaccination
decisions. The responses were independently coded by
two coders, using the categories shown in Table 6. The
coders agreed on 87% of their initial codings; remaining
differences were resolved by discussion. As Table 6
shows, the commonest explanations involved generalstatements of trying to balance the risks and benefits of
the two options (associated with both pro- and anti-
vaccination choices); fear or dislike of shots or drugs in
general, or the inconvenience or cost of getting them
(strongly associated with anti-vaccination choices); and
specific advantages of vaccination such as control of
timing or freedom from worry about flu exposures (as-
sociated with pro-vaccination choices). Strikingly, onlytwo of the 69 respondents made any mention of issues
related to action or inaction per se. One anti-vaccination
respondent said: ‘‘I am a firm believer in leaving things
to fate and not messing with fate’’. One pro-vaccination
respondent said: ‘‘If you vaccinate, whether or not you
got any symptoms, you were still trying to help yourself.
If you did not vaccinate and you got sick then I would
definitely be upset with myself because I did not get avaccination’’. None of the other 67 respondents men-
tioned action/inaction issues at all.
In the second follow-up study (N ¼ 66) we modified
the scenario so that the bad outcomes of both disease
and side effects were the child dying, rather than be-
coming sick, to replicate more closely the scenarios used
by Asch et al. (1994), Meszaros et al. (1996), and Ritov
Table 6
Coding of open-ended explanations given for vaccination decisions in first f
1. Fear, dislike, distrust, cost or trouble of shots, or drugs
2. Balance of risks and/or benefits
3. Control of timing or certainty of outcomes, reduce worry
4. Risks of flu, side-effects, or both are low
5. My chances are generally better/worse than those in scenario
6. One should not be passive
7. One should not mess with fate
8. Other and uncodable
9. No explanation given
and Baron (1990, 1999). As in the main study, only aminority (24 or 36.4%) opposed vaccination in this
version, while 29 respondents (45.3%) favored it
(v2ð1Þ ¼ :5, ns). A hypothetical reduction of the side-
effects risk raised the pro-vaccination majority to 56
(84.8%) vs. 8 (12.1%) opposed (v2ð1Þ ¼ 36:00, p < :001).A hypothetical increase in the risk of side-effects gen-
erated a large anti-vaccination majority: 59 (89.4%)
opposed, 3 (4.5%) in favor (v2ð1Þ ¼ 50:60, p < :001). Inshort, these subjects again showed an appropriate
directional sensitivity to relative risks of flu and side-
effects, with a modest overall tendency in favor of vac-
cination. Both regret after vaccinating (b ¼ �:24,p < :06) and regret after not vaccinating (b ¼ :25,p < :05) were again significant predictors of vaccinationintention.
Coding of the open-ended explanations using aslightly more elaborate scheme (Table 7) showed ac-
ceptable inter-coder reliability (initial agreement 83%),
with disagreements resolved by discussion. As before the
predominant explanation mentioned some form of risk
and benefit balancing. Five pro-vaccinators (8% of re-
spondents) expressed general pro-vaccine beliefs; four
non-vaccinators (6%) argued that their child�s risks wereor could be made lower than the population risk; andfour undecided respondents, perhaps budding academ-
ics, suggested that more research was needed. As before,
few respondents (5 of 66, 8%) mentioned action/inaction
per se. One, a non-vaccinator, said ‘‘I�d feel horrible if Idid something (made a choice) that caused death. Even
worse than if it naturally happened’’. Three pro-vacci-
nators mentioned action/inaction issues. One said: ‘‘I
would want to feel like I did my best to prevent harm tomy child. I would rather vaccinate if it would reduce the
risk of getting the flu’’. A second said: ‘‘Because if you
vaccinate you are taking an active step and not being
passive’’. A third said: ‘‘I feel that precautions are nec-
essary in this case, and that trying to protect the well-
being of someone else is more worthwhile than chancing
exposure’’. Finally, one respondent, who was undecided
ollow-up study (vaccination for oneself)
Decision
Don�t vaccinate Don�t know Vaccinate
(N ¼ 31) (N ¼ 7) (N ¼ 31)
10 0 1
12 2 14
0 0 4
3 0 3
5 0 1
0 0 1
1 0 0
6 4 5
1 1 3
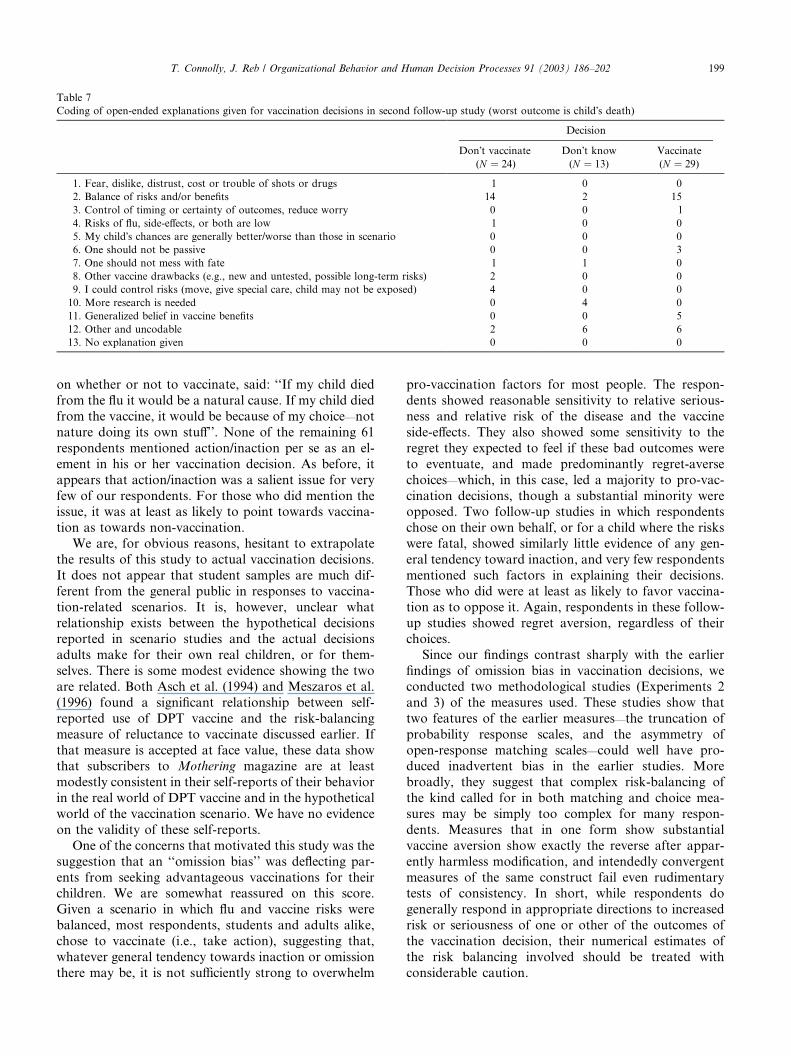
Table 7
Coding of open-ended explanations given for vaccination decisions in second follow-up study (worst outcome is child�s death)
Decision
Don�t vaccinate Don�t know Vaccinate
(N ¼ 24) (N ¼ 13) (N ¼ 29)
1. Fear, dislike, distrust, cost or trouble of shots or drugs 1 0 0
2. Balance of risks and/or benefits 14 2 15
3. Control of timing or certainty of outcomes, reduce worry 0 0 1
4. Risks of flu, side-effects, or both are low 1 0 0
5. My child�s chances are generally better/worse than those in scenario 0 0 0
6. One should not be passive 0 0 3
7. One should not mess with fate 1 1 0
8. Other vaccine drawbacks (e.g., new and untested, possible long-term risks) 2 0 0
9. I could control risks (move, give special care, child may not be exposed) 4 0 0
10. More research is needed 0 4 0
11. Generalized belief in vaccine benefits 0 0 5
12. Other and uncodable 2 6 6
13. No explanation given 0 0 0
T. Connolly, J. Reb / Organizational Behavior and Human Decision Processes 91 (2003) 186–202 199
on whether or not to vaccinate, said: ‘‘If my child died
from the flu it would be a natural cause. If my child died
from the vaccine, it would be because of my choice—not
nature doing its own stuff’’. None of the remaining 61
respondents mentioned action/inaction per se as an el-
ement in his or her vaccination decision. As before, it
appears that action/inaction was a salient issue for very
few of our respondents. For those who did mention theissue, it was at least as likely to point towards vaccina-
tion as towards non-vaccination.
We are, for obvious reasons, hesitant to extrapolate
the results of this study to actual vaccination decisions.
It does not appear that student samples are much dif-
ferent from the general public in responses to vaccina-
tion-related scenarios. It is, however, unclear what
relationship exists between the hypothetical decisionsreported in scenario studies and the actual decisions
adults make for their own real children, or for them-
selves. There is some modest evidence showing the two
are related. Both Asch et al. (1994) and Meszaros et al.
(1996) found a significant relationship between self-
reported use of DPT vaccine and the risk-balancing
measure of reluctance to vaccinate discussed earlier. If
that measure is accepted at face value, these data showthat subscribers to Mothering magazine are at least
modestly consistent in their self-reports of their behavior
in the real world of DPT vaccine and in the hypothetical
world of the vaccination scenario. We have no evidence
on the validity of these self-reports.
One of the concerns that motivated this study was the
suggestion that an ‘‘omission bias’’ was deflecting par-
ents from seeking advantageous vaccinations for theirchildren. We are somewhat reassured on this score.
Given a scenario in which flu and vaccine risks were
balanced, most respondents, students and adults alike,
chose to vaccinate (i.e., take action), suggesting that,
whatever general tendency towards inaction or omission
there may be, it is not sufficiently strong to overwhelm
pro-vaccination factors for most people. The respon-
dents showed reasonable sensitivity to relative serious-
ness and relative risk of the disease and the vaccine
side-effects. They also showed some sensitivity to the
regret they expected to feel if these bad outcomes were
to eventuate, and made predominantly regret-averse
choices—which, in this case, led a majority to pro-vac-
cination decisions, though a substantial minority wereopposed. Two follow-up studies in which respondents
chose on their own behalf, or for a child where the risks
were fatal, showed similarly little evidence of any gen-
eral tendency toward inaction, and very few respondents
mentioned such factors in explaining their decisions.
Those who did were at least as likely to favor vaccina-
tion as to oppose it. Again, respondents in these follow-
up studies showed regret aversion, regardless of theirchoices.
Since our findings contrast sharply with the earlier
findings of omission bias in vaccination decisions, we
conducted two methodological studies (Experiments 2
and 3) of the measures used. These studies show that
two features of the earlier measures—the truncation of
probability response scales, and the asymmetry of
open-response matching scales—could well have pro-duced inadvertent bias in the earlier studies. More
broadly, they suggest that complex risk-balancing of
the kind called for in both matching and choice mea-
sures may be simply too complex for many respon-
dents. Measures that in one form show substantial
vaccine aversion show exactly the reverse after appar-
ently harmless modification, and intendedly convergent
measures of the same construct fail even rudimentarytests of consistency. In short, while respondents do
generally respond in appropriate directions to increased
risk or seriousness of one or other of the outcomes of
the vaccination decision, their numerical estimates of
the risk balancing involved should be treated with
considerable caution.
200 T. Connolly, J. Reb / Organizational Behavior and Human Decision Processes 91 (2003) 186–202
Overall we find no evidence for either ‘‘omission’’ orfor ‘‘bias’’ as shaping vaccination decisions. The data
suggest, instead, that both pro- and anti-vaccination
decisions are shaped, in part, by regret avoidance. There
is, of course, debate as to whether regret avoidance of
this sort is normatively proper (for example Bittner,
1992) but there seems little question that it does influ-
ence real choices (e.g., Zeelenberg, 1999). There is also
evidence that regret expectations can be shaped byconsiderations of what is normal (Kahneman & Miller,
1986; Zeelenberg et al., 2001); by the justifying ratio-
nales the decision maker has available (Connolly & Reb,
2001; Connolly & Zeelenberg, 2002); and even by direct
persuasion (Baron, 1992). This suggests that efforts to
influence vaccination decisions might be usefully tar-
geted at regret expectations, and the justifications for
action and inaction on which they depend. Issues ofaction and inaction per se do not seem to have a very
substantial role in vaccination decisions, at least to the
extent that these decisions are well represented by sim-
plified scenario-based studies of the sort reported here.
Within the obvious limitations of such studies, the an-
swers to both the questions in our title seem to be neg-
ative: it is difficult to make a convincing case that either
‘‘omission’’ or ‘‘bias’’ has been demonstrated in thevaccination setting.
Acknowledgments
We benefited from the comments of Jon Baron, Lisa
Ord�oo~nnez, Howard Raiffa and Ilana Ritov on earlier
drafts of this paper, as well as from the suggestions ofthe Editor and three anonymous reviewers.
Appendix A
The vaccination decision may be modeled as a binary
choice under risk, of the following form. A decision is to
be made between two alternatives A1 (Vaccinate) and
A2 (Do not vaccinate). Al leads with probability P1 to a
‘‘good’’ outcome Gl (Child healthy) and with proba-
bility (1-P1) to a ‘‘bad’’ outcome Bl (Child sick). Al-ternative A2, similarly, offers {G2, P2; B2, (1-P2)}.
Assuming a decision maker with utilities U(.) for these
outcomes, he or she will be indifferent between Al and
A2 iff
P1 �UðG1Þ þ ð1� P1Þ �UðB1Þ¼ P2 �UðG2Þ þ ð1� P2Þ �UðB2Þ: ðA:1Þ
The numerical values of P1 and P2 at which a subject
feels indifferent between Al and A2 thus cast some light
on his or her utilities for the four outcomes. If one isprepared to make the further assumption that
U(G1)¼U(G2), (that is, one is equally pleased with the
child�s health, whether it resulted from good luck orfrom benefits of the vaccination) then the indifference
ratio of P1 to P2 can be used as a coarse measure of the
relative size of U(B1) and U(B2), (the utilities associated
with a child sick or dead from the vaccine and the child
sick or dead from the flu). Our interpretation of the
‘‘omission bias’’ literature is that it concerns the relative
size of these two utilities.
In the risk balancing procedure, the experimenterspecifies one of the two probabilities and asks the sub-
ject for a value of the other probability which would
make A1 and A2 equally attractive. For example, Asch
et al. (1994) specified that the risk of inaction leading to
flu fatality was 10 in 10,000. Their typical subject indi-
cated indifference between vaccination and non-vacci-
nation if the death risk from vaccination was about 4 in
10,000. If one assumes that U(G1)¼U(G2) and that P1and P2 are both close to 1.0 (i.e., that death from either
flu or vaccine is a rare event), the logic of Eq. (A.1)
implies that U(B1) is about 2.5 as large as U(B2)—that
is, a vaccine-related death was judged to be about 2.5
times as bad as a flu-related death. The ‘‘risk premium’’
demanded for the vaccination option thus indexes the
ratio of U(B1) and U(B2), as long as the logic of Eq.
(A.1) and the utility equivalence of Gl and G2 holds, asin the following example.
Example A.1. Suppose that a particular individual is
indifferent between vaccination, with a risk of death of
5 in 10,000 and non-vaccination, with a risk of 10 in
10,000. We may, without loss of generality, assign each
outcome a utility between 0 (Worst) and 1 (Best). As-
sume initially that U(G1)¼U(G2)¼ 1 (i.e., the bestpossible outcome is a healthy child, and the parent does
not care whether this is a result of vaccination or good
luck). Assume also that U(B1)¼ 0 (i.e., the worst out-come is the child�s death resulting from vaccination).
Then, substituting into Eq. (A.1):
ð9995� 1:0Þ þ ð5� 0Þ ¼ ð9990� 1:0Þ þ ð10�UðB2ÞÞor
UðB2Þ ¼ 0:5:
That is, on a utility scale bounded at 0 (Worst:
Vaccine-caused death) and 1 (Best: Child healthy), the
flu-caused death is seen as at the mid-point. This is thebasis for the comments in text that the vaccine-caused
death outcome is some multiple as bad as the flu-caused
death—in this case, twice as bad.
Example A.2. Ritov and Baron (1990, Experiment 4)
found their average subject indifferent between a vaccine
risk of 10 in 100,000 and a flu risk of 2,584 in 100,000.
By the same calculation as above, this corresponds to aU(B2) value of .996, indicating that the flu-caused death
is virtually as desirable as the two ‘‘best’’ outcomes!
T. Connolly, J. Reb / Organizational Behavior and Human Decision Processes 91 (2003) 186–202 201
Example A.3. Suppose we relax the assumption of equal‘‘best’’ outcomes and allow instead for U(G1) to be
slightly larger than U(G2)—that is, we allow a small
measure of ‘‘rejoicing’’ (Landman, 1987; Loomes &
Sugden, 1982), reflecting our extra pleasure in a good
outcome that was the result of our actions. If, in Ex-
ample 1, we keep U(G1) at 1.0 and put U(G2) at .99—a
very tiny amount of rejoicing—Eq. (A.1) solves with
U(B2)¼ 10.49, a meaningless value for a utility. Alter-natively, given this same tiny amount of rejoicing, Eq.
(A.1) shows that vaccination, with its 5 in 10,000 death
risk, will be preferred to non-vaccination even if there is
no risk whatever of death from flu!
Comment. We find the result from Example 1 to be
reasonably intuitive, but those of Examples 2 and 3 to
be quite surprising. Our intuition required some edu-
cation before we grasped that these utility calculations
are dominated by the values of the good (non-death)
outcomes, since they are so very much more likely
that the bad (death) outcomes. It seems likely thatactual subjects, like ourselves, tend to focus only on
the undesirable branches of these options, without
taking adequate account of the vastly more likely
desirable branches. This ignoring of positive outcomes
would constitute a much more serious decision error
in such contexts than any modest distortion of the
utilities of negative outcomes associated with action or
inaction.
References
Asch, D. A., Baron, J., Hershey, J. C., Kunreuther, H., Meszaros, J.,
Ritov, I., & Spranca, M. (1994). Omission bias and pertussis
vaccination. Medical Decision Making, 14, 118–123.
Ayanian, J. Z., & Berwick, D. M. (1991). Do physicians have a bias
toward action? Medical Decision Making, 11, 154–158.
Baron, J. (1992). The effect of normative beliefs on anticipated
emotions. Journal of Personality and Social Psychology, 63, 320–
330.
Baron, J., & Ritov, I. (1994). Reference points and omission bias.
Organizational Behavior and Human Decision Processes, 59, 475–
498.
Bittner, R. (1992). Is it reasonable to regret the things one did? Journal
of Philosophy, 47, 262–273.
Cohen, B. J., & Pauker, S. G. (1994). How do physicians weight
iatrogenic complications? Journal of General Internal Medicine, 9,
20–23.
Connolly, T. (1987). Decision theory, reasonable doubt, and the
utility of erroneous acquittals. Law and Human Behavior, 11,
101–112.
Connolly, T., Ord�oo~nnez, L. D., & Coughlan, R. (1997). Regret and
responsibility in the evaluation of decision outcomes. Organiza-
tional Behavior and Human Decision Processes, 70, 73–85.
Connolly, T., & Reb, J. (2001). ‘‘No reason to blame yourself’’:
Justification in decision-related regret. Working paper, University
of Arizona.
Connolly, T., & Zeelenberg, M. (2002). Regret in decision making.
Current Directions in Psychological Science, 11, 212–220.
Crawford, M. T., McConnell, A. R., Lewis, A. C., & Sherman, S. J.
(2002). Reactance, compliance, and anticipated regret. Journal of
Experimental Social Psychology, 38, 56–63.
Feldman, J., Miyamoto, J., & Loftus, E. F. (1999). Are actions
regretted more than inactions. Organizational Behavior and Human
Decision Processes, 78, 232–255.
Gilovich, T., & Medvec, V. H. (1995). The experience of regret: What,
when, and why. Psychological Review, 102, 379–395.
Haidt, J., & Baron, J. (1996). Social roles and the moral judgment of
acts and omissions. European Journal of Social Psychology, 26,
201–218.
Hershey, J. C., Asch, D. A., Thumasathit, T., Meszaros, J., & Waters,
V. V. (1994). The role of altruism, free riding, and bandwagoning
in vaccination decisions. Organizational Behavior and Human
Decision Processes, 59, 177–187.
Kahneman, D., & Miller, D. T. (1986). Norm theory: Compar-
ing reality to its alternatives. Psychological Review, 93, 136–
153.
Kahneman, D., & Tversky, A. (1982). The psychology of preferences.
Scientific American, 246(1), 160–173.
Landman, J. (1987). Regret and elation following action and inaction:
Affective responses to positive versus negative outcomes. Person-
ality and Social Psychology Bulletin, 13, 524–536.
Loftus, E. F. (1975). Leading questions and the eyewitness report.
Cognitive Psychology, 7, 560–572.
Loomes, G., & Sugden, R. (1982). Regret theory: An alternative theory
of rational choice under uncertainity. Economic Journal, 92, 805–
824.
Meszaros, J. R., Asch, D. A., Baron, J., Hershey, J. C.,
Kunreuther, H., & Schwartz-Buzaglo, J. (1996). Cognitive
processes and the decisions of some parents to forgo pertussis
vaccination for their children. Journal of Clinical Epidemiology,
49, 697–703.
N�gbala, A., & Branscombe, N. R. (1997). When does action elicit
more regret than inaction and is counterfactual mutation the
mediator of this effect? Journal of Experimental Social Psychology,
33, 324–343.
Ord�oo~nnez, L. D., & Connolly, T. (2000). Regret and responsibility: A
reply to Zeelenberg et al. Organizational Behavior and Human
Decision Processes, 81, 132–142.
Petrinovitch, L., & O�Neill, P. (1996). Influence of wording and
framing effects on moral intuitions. Ethology and Sociobiology, 17,
145–171.
Ritov, L., & Baron, J. (1990). Reluctance to vaccinate: Omission
bias and ambiguity. Journal of Behavioral Decision Making, 3,
263–277.
Ritov, R., & Baron, J. (1995). Outcome knowledge, regret, and
omission bias. Organizational Behavior and Human Decision
Processes, 64, 119–127.
Ritov, I., & Baron, J. (1999). Protected values and omission bias.
Organizational Behavior and Human Decision Processes, 79,
79–94.
Royzman, E. B., & Baron, J. (1999). The bias toward indirect harm
and its relation to omission bias. Working paper, University of
Pennsylvania.
Seta, J. J., McElory, T., & Seta, C. E. (2001). To do or not to do:
Desirability and consistency mediate judgments of regret. Journal
of Personality and Social Psychology, 80, 861–870.
Sevdalis, N., & Harvey, N. (2001). Measurement issues in experi-
enced utility research. Working paper, University College Lon-
don.
Slovic, P. (1975). Choice between equally valued alternatives. Journal
of Experimental Psychology: Human Perception and Performance,
1, 280–287.
Slovic, P., & Monahan, J. (1995). Probability, danger and coercion: A
study of risk perception and decision making in mental health law.
Law and Human Behavior, 19, 49–65.

Received 13 August 2002
202 T. Connolly, J. Reb / Organizational Behavior and Human Decision Processes 91 (2003) 186–202
Spranca, M., Minsk, E., & Baron, J. (1991). Omission and commission
in judgment and choice. Journal of Experimental Social Psychology,
27, 76–105.
Tanner, C., & Medin, D. L. (2002). Protected Values: No omission
bias and no framing effects. Working paper, Department of
Psychology, Northwestern University.
Zeelenberg, M. (1999). Anticipated regret, expected feedback and
behavioral decision making. Journal of Behavioral Decision Mak-
ing, 12, 93–106.
Zeelenberg, M., van Dijk, W. W., & Manstead, A. S. R. (1998).
Reconsidering the relation between regret and responsibility.
Organizational Behavior and Human Decision Processes, 74,
254–272.
Zeelenberg, M., van den Bos, K., van Dijk, E., & Pieters, R. (2001).
The inaction effect in the psychology of regret. Working paper,
Tilburg University.


