Embed Size (px)
Citation preview

Introduction
The solubility of charged macromolecules, polyelectro-lytes, in polar solvents is primarily based on the presenceof dissociating ionic groups [1]. Mixing solutions ofoppositely charged macromolecules, polyanions (PAs)and polycations (PCs), spontaneously yields polyelec-trolyte complexes [2]. During this complex formationcomplete or partial charge neutralization occurs, leading,in general, to phase separation and/or nonspecific pre-cipitation [3, 4]. The combination of a limited number ofPA/PC pairs results in highly swollen network structuresexhibiting membrane properties if the complex formationtakes place at well-defined interfaces. These can be of anyshape, for example, flat or spherical, as long as the mac-romolecules are allowed to interpenetrate by self-diffu-sion and the polyion concentration is sufficiently high.
Such semipermeable materials have become increas-ingly interesting as materials for isolation, protection,storage, or delivery purposes in areas such as cosmetics,personal care, pharmacy, biotechnology, and medicine
[5]. The specific applications require the design of dif-ferent network properties, including mechanical stabil-ity, durability, and permeability. Moreover, in order toselect the right technology and formation process con-ditions, knowledge about the formation kinetics isadvantageous. However, the prediction of polyelectro-lyte complex networks/membranes, as a function ofmacromolecular, physicochemical, structural, and envi-ronmental conditions, has not been achieved to date.
Recently, the synthetic boundary experiment and theoptical system of an analytical ultracentrifuge (AUC)have been proposed to study the membrane formation,on-line, at a flat interface [6]. Both the experimentalprinciple and the sensitivity for various componentcombinations have been demonstrated by screeningexperiments [7].
Analytical ultracentrifugation is well established forthe characterization of macromolecules, colloids, ornanoparticles by a variety of parameters [8]. Since a newgeneration of equipment became available, which allowsfast on-line data acquisition, and partially evaluation,
Laurent Bourdillon
Christine WandreyOn-line study of polyelectrolyte networkformation by interfacial reaction
Received: 12 December 2003Accepted: 9 February 2004Published online: 1 April 2004� Springer-Verlag 2004
Abstract A modified syntheticboundary experiment of analyticalultracentrifugation has beenemployed to examine, on-line, poly-electrolyte complex formation at flatinterfaces yielding highly swollenmembranes/networks. Systematicexperiments with sodium alginate asa polyanion and chitosan andpoly(L-lysine) as polycations identi-fied the influence of concentration,pH, molar mass, and polycationtype on the membrane characteris-tics and the formation process. The
membranes have been evaluated byfive characteristics defined herein:total thickness, compactness, heter-ogeneity, symmetry, and growth.The results confirm the sensitivity ofthe method suited to elaborate gen-eral relationships for polyelectrolytemembrane design.
Keywords Polyelectrolyte complex ÆAnalytical ultracentrifugation ÆSodium alginate Æ Chitosan ÆPoly(L-lysine)
Colloid Polym Sci (2004) 282: 1247–1257DOI 10.1007/s00396-004-1076-5 ORIGINAL CONTRIBUTION
L. Bourdillon Æ C. WandreyInstitute of Chemical and BiologicalProcess Science, Swiss Federal Instituteof Technology, 1015 Lausanne, Switzerland
C. Wandrey (&)EPFL-ISP-LBCh,1015 Lausanne, SwitzerlandE-mail: [email protected].: +41-21-6933672Fax: +41-21-6936030
the basic techniques of analytical ultracentrifugationhave been employed to study other materials and evenreactions [9, 10, 11]. One of these techniques is thesynthetic boundary experiment, where two liquids comeinto contact at a well-defined surface. The appropriatesynthetic boundary cell has been selected to study thepolyelectrolyte complex formation [6].
Systematic experiments have been performed toidentify the influence of the polyion concentration andthe solution pH in the case of the two-componentpolyelectrolyte network alginate/chitosan (Ch). Addi-tional studies with poly(L-lysine) (PLL) as a PC reactingwith sodium alginate (SA)/CaCl2 served to evaluate theinfluence of the molar mass. The pH has a minorinfluence on the charge density at the polymer chain ofSA but determines the degree of protonation at the Chand PLL chains. However, in order to progress and,finally, conclude interdependencies between chemicalstructure, macromolecular characteristics, and experi-mental conditions, membrane evaluation parametershad to be defined. Five are reported here, including theirapplication to the networks/membranes formed duringthe two selected experimental series.
Materials and methods
Materials
SA (Keltone HV, Kelco Chemical Company, San Diego,USA, batch no. 54660) was used as a PA for all theexperiments. It was characterized by an intrinsic vis-cosity [g]=807 ml/g in 0.1 M NaCl, partial specificvolumes m�=400 ml/g in water and m�=0.470 ml/g in0.1 m NaCl, and an a-L-guluronic acid structure content(G content) of 40% determined by 1H NMR [12].
Various PCs were employed for the complex forma-tion. Modified oligochitosan was prepared as describedpreviously [13]. PLL hydrobromide samples were pur-chased from Sigma (Switzerland). The characteristics ofall the polymeric materials are summarized in Table 1.
The additives NaCl and CaCl2 were provided by Fluka(Switzerland).
Method
All experiments were carried out in an Optima XL-IAUC (Beckman, Palo Alto, CA, USA). The two inte-grated detection systems, scanning UV/vis, and Rayleighinterference optics [14] served to follow the membraneformation on-line. The principle of the experiment isillustrated in Fig. 1 but has been described, in detail, inpreceding publications [6, 15].
A systematic study was performed with alginate as aPA and Ch or PLL as a PC (Table 2). The less viscous
Table 1 Polyelectrolyte characteristics
Polyelectrolyte Abbreviation Type Molar mass (g/mol)
Sodium alginate SA Polyanion 204,000a
Poly(L-lysine)hydrobromide
PLL1 Polycation 27,400–30,200b
Poly(L-lysine)hydrobromide
PLL2 Polycation 2,300–2,900b
Chitosan Ch Polycation 2,600c
aCalculated from analytical ultracentrifuge sedimentation velocityexperimentsbProvided by the suppliercFrom gel permeation chromatography characterization, polydis-persity 1.7
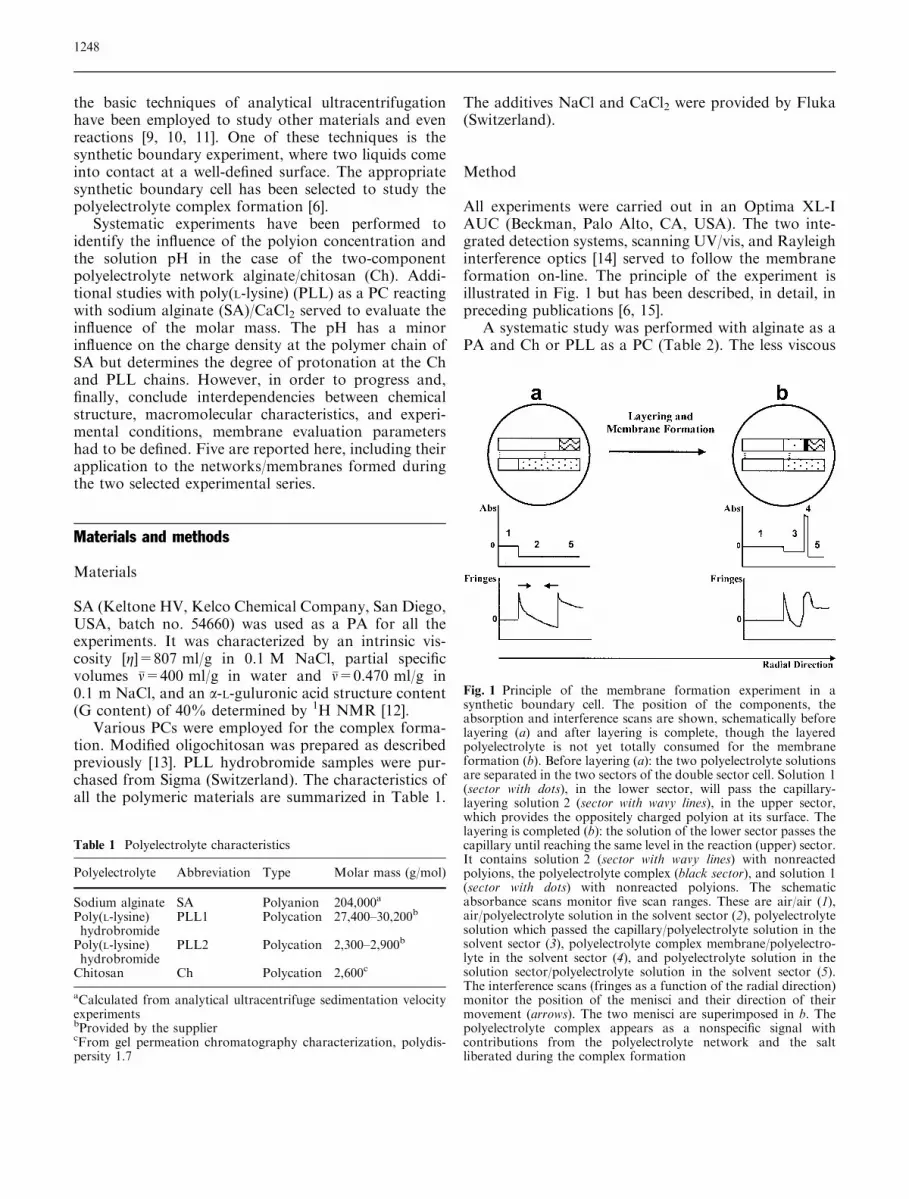
Fig. 1 Principle of the membrane formation experiment in asynthetic boundary cell. The position of the components, theabsorption and interference scans are shown, schematically beforelayering (a) and after layering is complete, though the layeredpolyelectrolyte is not yet totally consumed for the membraneformation (b). Before layering (a): the two polyelectrolyte solutionsare separated in the two sectors of the double sector cell. Solution 1(sector with dots), in the lower sector, will pass the capillary-layering solution 2 (sector with wavy lines), in the upper sector,which provides the oppositely charged polyion at its surface. Thelayering is completed (b): the solution of the lower sector passes thecapillary until reaching the same level in the reaction (upper) sector.It contains solution 2 (sector with wavy lines) with nonreactedpolyions, the polyelectrolyte complex (black sector), and solution 1(sector with dots) with nonreacted polyions. The schematicabsorbance scans monitor five scan ranges. These are air/air (1),air/polyelectrolyte solution in the solvent sector (2), polyelectrolytesolution which passed the capillary/polyelectrolyte solution in thesolvent sector (3), polyelectrolyte complex membrane/polyelectro-lyte in the solvent sector (4), and polyelectrolyte solution in thesolution sector/polyelectrolyte solution in the solvent sector (5).The interference scans (fringes as a function of the radial direction)monitor the position of the menisci and their direction of theirmovement (arrows). The two menisci are superimposed in b. Thepolyelectrolyte complex appears as a nonspecific signal withcontributions from the polyelectrolyte network and the saltliberated during the complex formation
1248
PC solution possessing, in addition, a lower density wasfilled into the solvent sector and layered during slightacceleration onto the more viscous PA solution in thesolution sector. All experiments were performed at5,000 rpm after 2–3 min at 1,000 rpm. During this shortperiod no layering occurred but the PA solution wasremoved from the optical lenses. Running at 5,000 rpmthe PA solution meniscus becomes sufficiently flat inorder not to disturb the detection of the interfacialreaction [6]. However, no sedimentation of the poly-meric components occurs at this sedimentation force.The absorbance scans were taken at a wavelength of370 nm with a step width of 10 lm in a radial direction.Thirty absorbance scans were collected, scans 1–20 witha delay of 2 min, and the following ten scans with adelay of 10 min. The minimum delay depends on thestep width and the size of the radial range. The fillingvolumes were 100 ll in the solution sector (PA) and400 ll in the solvent sector (PC). Each experiment wascarried out at least in duplicate to ensure reproducibility.The membrane formation was monitored by absorbancescans, whereas interference scans allowed us to calculatethe layering velocity from the movement of the meniscusin both the solvent and the solution sector [6].
Note that membrane components with origin fromone solution, which participate in the network formation,will be separated by a slash (/) in the text. The compo-nents of different solutions will be separated by a doubleslash (//). Application of this formalism to the experi-ments of this study yields SA//Ch and SA//PLL/CaCl2.
Results
Two types of raw data were collected during the exper-iments. First, absorbance scans detecting the membraneformation as a function of time. The superposition ofsuch a series of absorbance scans provides basic infor-mation on the network formation process and thegeometry of the membrane. Second, the interference
scans indicate the position of the meniscus in each of thetwo sectors. This allows us to know precisely the amountof each polyelectrolyte solution in the two sectorsmoving into the bottom direction in the solvent sectorand in the opposite direction in the solution sector wherethe reaction occurs (Fig. 1). Since the dimensions of thesectors are known exactly [16] these positions may servefor a precise calculation of the amount of solution in thetwo sectors.
The six plots in Fig. 2 represent the superposition ofthe scans collected during the membrane formation ofthe two-component system SA//Ch. The three plots inthe left column correspond to three different SA con-centrations, 1.0%, 1.5%, and 2.0% at constant pH 6.5,whereas for the three plots in the right column the pHwas varied in the range 6.0–7.0 keeping constant the SAconcentration of 1.5%. From previous qualitativescreening experiments an influence on the formationprocess and the membrane dimensions was expected [7].Indeed differences are clearly visible for all the plots inFig. 2. These differences concern the peak position, thepeak area, the peak width, and the peak symmetry.
The results of the second experimental series employ-ing PLL of different molar masses as the PC are presentedin Fig. 3. The network obtained from the three-compo-nent system SA//PLL/CaCl2 is shown there in more de-tail. CaCl2 was added to PLL to form a gel with SAsupporting the very fragile SA//PLL hydrogel network[17]. The calcium ions diffuse very fast into the SA solu-tion but only partially replace the sodium counterions inthe alginate used in this study. The scans reveal differentmembrane dimensions and formation characteristics,which will be discussed in the subsequent paragraphs.
Discussion
Considering the dimensions of the centerpiece sectors aswell as the position of the cell in the rotor of the AUCthe 100 ll PA solution in the solution sector ranges from
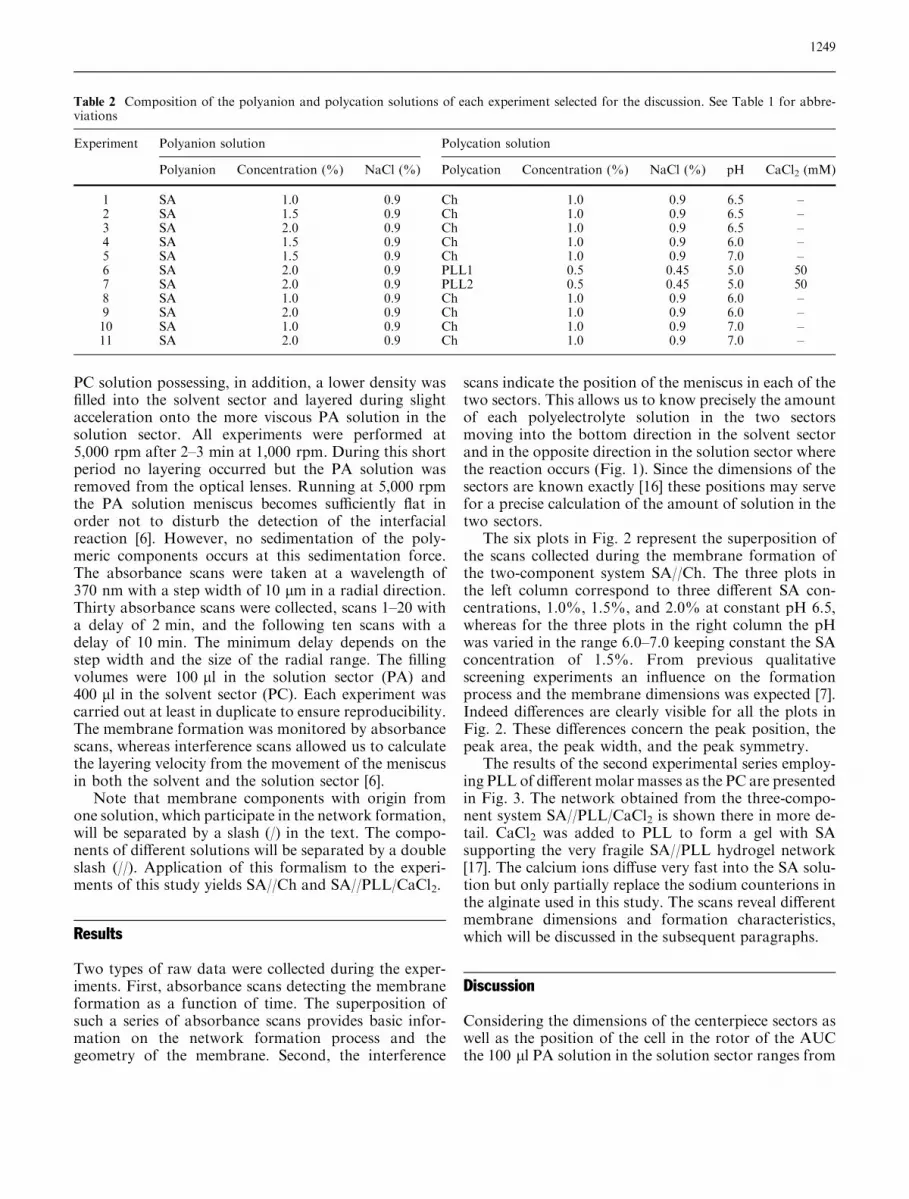
Table 2 Composition of the polyanion and polycation solutions of each experiment selected for the discussion. See Table 1 for abbre-viations
Experiment Polyanion solution Polycation solution
Polyanion Concentration (%) NaCl (%) Polycation Concentration (%) NaCl (%) pH CaCl2 (mM)
1 SA 1.0 0.9 Ch 1.0 0.9 6.5 –2 SA 1.5 0.9 Ch 1.0 0.9 6.5 –3 SA 2.0 0.9 Ch 1.0 0.9 6.5 –4 SA 1.5 0.9 Ch 1.0 0.9 6.0 –5 SA 1.5 0.9 Ch 1.0 0.9 7.0 –6 SA 2.0 0.9 PLL1 0.5 0.45 5.0 507 SA 2.0 0.9 PLL2 0.5 0.45 5.0 508 SA 1.0 0.9 Ch 1.0 0.9 6.0 –9 SA 2.0 0.9 Ch 1.0 0.9 6.0 –10 SA 1.0 0.9 Ch 1.0 0.9 7.0 –11 SA 2.0 0.9 Ch 1.0 0.9 7.0 –
1249

6.92 to 7.2 cm of the radial position before the experi-ment has started. Consequently, the first contact withthe PC solution occurs at 6.92 cm. The scans in Fig. 2
cover the radial range from 6.8 to 7.0 cm. This rangewas limited to 7.0 cm and was not extended to thebottom of the cell since the absorbance intensity did notchange between 7.0 and 7.2 cm containing the PAsolution. In addition, recording with a short scan delayrequires a short radial distance for the selected stepwidth of 10 lm. The negative intensity of the base lineson both sides of the membrane peak results fromdetecting the difference between the absorbance in the
Fig. 2 Analytical ultracentrifuge (AUC) absorbance scans at370 nm for sodium alginate layered with chitosan demonstratingthe influence of the concentration (three left scans), and the pH(three right scans) on the polyelectrolyte network formation. Leftfrom top to bottom: experiments 1–3 in Table 2. Right from top tobottom: experiments 4, 2, 5 in Table 2. 5,000 rpm, 20 �C, 30 scans,scan delay 2 min for the 20 first scans, 10 min for the last ten scans
1250

solution and solvent sector in all AUC experiments [8].The PC sector containing the oligochitosan solutions ofthe initial concentration in this series of experimentsabsorbs more strongly than the solutions on both sidesof the membrane in the PA sector but not the membraneitself. The decreasing intensity on the left side of themembrane corresponds to the Ch consumption withtime. The constant absorbance on the right side confirmsthat SA does not absorb, no oligochitosan permeateswithout complex formation, and no sedimentation takesplace. Only for the experiment at pH 6.0 (upper plot ofthe right column in Fig. 2) does the absorbance have aslightly different level. It is known that the solubility ofCh improves with decreasing pH; therefore, a better
solution state can be suggested at pH 6.0 and, as aconsequence, there is less absorbance, which reduces thedifference recorded.
The general scan characteristics are different for thesecond membrane type, SA//PLL/CaCl2, studied here(Fig. 3). In this case the range between 6.8 and 7.1 cmwas selected for scanning. For this system, both the PA(SA) and the PC (PLL) do not absorb at 370 nm;therefore, the base line appears at zero absorbance onthe left side of the membrane peak. The signal on theright side is caused by the turbidity of the supportingcalcium alginate gel, which is built immediately andmuch faster than the polyelectrolyte network, thoughthe membrane range is clearly separated from the
Fig. 3 AUC absorbance scansat 370 nm for sodium alginatelayered with poly(L-lysine)(PLL)/CaCl2 demonstrating theinfluence of the molar mass ofPLL Top: experiment 6 inTable 2. Bottom: experiment 7in Table 2. 5,000 rpm, 20 �C,30 scans, scan delay 2 min forthe 20 first scans, 10 min for thelast ten scans
1251

calcium gel. Regarding the right side of the membrane,in the upper graph, a flat sedimentation velocity profileseems to result. This is explained later in the sectionMembrane compactness.
The scans contain different information; however, thesoftware package supplied with the AUC does notprovide any software for a specific evaluation of thisinterfacial reaction. For a more detailed interpretation, aprocedure has been developed based on MATLABsoftware, version 6.1.0. Five characteristics have beenselected and defined for an objective scan evaluation andconclusions thereof applicable to different types ofpolyelectrolyte networks formed at the flat interface andpossessing limited dimensions. These are total mem-brane thickness (MT0), membrane compactness (MC),membrane heterogeneity (MH), membrane symmetry(MS), and membrane growth and kinetics.
These characteristics will be discussed, in detail, forSA//Ch and SA//PLL/CaCl2. For this purpose, mem-brane scans taken after 140 min were extracted fromFigs. 2 and 3, and are collected in Figs. 4 and 5. Theycorrespond to the membrane structure at this time. Theappropriate characteristic values of all experiments aresummarized in Table 3.
Total membrane thickness
The total membrane thickness is measured as the scanwidth at a given absorbance, for example, at )0.5absorbance in the case of the Ch membranes in thisexperimental series. Performing the comparison at a fixedintensity corresponding to the same network densityseems to be more reliable than to take the values at thebase line, which is, in some cases, relatively noisy. It isobvious that the membrane thickness strongly dependson the initial concentration of the PA solution. It in-creases with increasing SA concentration though differ-ently with the pH variation. Moreover, the pH does notinfluence the membrane thickness to such an extent.Fig. 5 clearly reveals the influence of the molar mass ofPLL on the total membrane thickness, with the lowermolar mass forming thicker membranes. If comparedwith the Ch membranes (2% SA concentration), they areslightly thicker for PLL in a similar molar mass range.
Membrane compactness
The membrane compactness parameter provides infor-mation on the density of the polyelectrolyte complexnetwork. This compactness is concluded from the max-imum value of the absorbance scan. All SA//Ch mem-branes exhibit a maximum at approximately 2.2absorbance units. Both pH and alginate concentrationdo not systematically influence the compactness of the
membrane, though a slight decrease may be concludedwith decreasing SA concentration. The polyelectrolytecomplex network SA//PLL is suggested to be denser inthe case of the lower molar mass PLL2, for which ahigher absorbance is detected. This suggestion has beenverified by permeability measurements clearly indicatinga cutoff decrease (denser network) if the membrane SA//PLL was formed with lower molar mass PLL [18]. Afurther conclusion is that for the thinner and less com-pact membrane formed with PLL1 less alginate from thePA solution has reacted with PLL1. Consequently, morealginate remained available to react with calcium,resulting in a higher calcium alginate concentration.This calcium alginate could then start to precipitate,causing scans with sedimentation profiles as seem to be
Fig. 4a, b AUC absorbance scans at 370 nm after 140-mindetecting and comparing the membrane characteristics and themembrane position at this time. Scans taken from Fig. 2. aInfluence of the concentration: experiment 1 (dotted line), experi-ment 2 (dashed line), experiment 3 (solid line). b Influence of thepH: experiment 4 (dotted line), experiment 2 (dashed line), exper-iment 5 (solid line)
1252

visible in the upper graph of Fig. 3 on the right side ofthe membrane peak. The calcium alginate concentrationin the lower graph of Fig. 3 is expected to be lower sincemore alginate is bound to PLL2.
Nevertheless, the impact of several influences on theabsorbance signal of the membranes must be carefullydistinguished. Clearly, self-absorbing PAs and PCs willcontribute. Depending on their concentration, which isexpected to be higher in the polyelectrolyte complex, theintensity will increase in comparison to the solution.Furthermore, since the ability of the PA/PC pairs toform polyelectrolyte complex hydrogels and not solidprecipitates is determined, to a large extent, by the hy-drophile of the polymer backbone, the degree of swellingof the complex affects the signal by more or less pro-nounced turbidity. In the case of SA//Ch, oligochitosanbecame absorbing after chain degradation. The absor-bance of a 1% Ch solution is 1.2 at 370 nm detected by a
)1.2 signal in the solution difference scans in the scanplots. The higher membrane signal may, therefore, resultfrom a higher Ch concentration in the membrane and/ora turbidity contribution. As the second system a com-bination of nonabsorbing components (SA, PLL, CaCl2)was selected, with the membrane peak then only relatedto the turbidity. Considering all these aspects, a quan-titative comparison of the compactness between differ-ent membrane chemistries needs further investigation.
Membrane heterogeneity
The heterogeneity of the membrane is defined as thedifference between the total membrane thickness (MT0),in general taken close to the base line, and the scanwidth at a second selected absorbance value (MT1) re-lated to both the absorbance difference, A1)A0, wherethe thickness was measured, and the total membranethickness, MT0:
MH ¼ MT0 - MT1
A1 � A0ð ÞMT0: ð1Þ
The heterogeneity becomes zero for MT0=MT1. Thisevaluation is presented schematically in Fig. 6. Thecalculation considers the slope of the scan by relating thescan width difference (MT0)MT1), at two absorbancevalues, to the appropriate absorbance difference(A1)A0). This is assumed to correlate to a networkdensity gradient on both sides of the membrane. Sincethe same slope will be more significant for a thinnermembrane than for a thicker one, this ratio is, in addi-tion, related to the total membrane thickness. Such anevaluation provides more information than simplyrelating the peak area to the width at the maximum ofthe absorbance value. In the case of SA//Ch the heter-ogeneity was calculated for the scan widths at )0.5 and0.5 absorbance. For SA//PLL/ the values in Table 3relate to MT0 at 1.0 absorbance and MT1 at 2.0 absor-
Fig. 5 AUC absorbance scans at 370 nm after 140-min detectingand comparing the membrane characteristics and the membraneposition at this time. Scans taken from Fig. 4. Experiment 6 (solidline), experiment 7 (dashed line)
Table 3 Membrane evaluation. All values are averages of experi-ments performed, as least, in duplicate
Experiment Membrane thickness Heterogeneity SymmetryMT0 (lm) (average) MH (average) MS (average)
1 460 0.35 0.332 560 0.22 0.483 650 0.14 0.804 525 0.32 0.285 550 0.34 0.906 500 0.40 –7 710 0.39 –8 620 0.30 0.609 680 0.24 0.8010 540 0.22 0.5011 890 0.38 0.91
Fig. 6 Principle of the heterogeneity calculation. Total membranethickness at A0 (MT0), membrane thickness at a second absorbancevalue A1 (MT1)
1253

bance. Unfortunately, the heterogeneity parameter doesnot provide information on which side of the membranethe heterogeneity occurs. This was reason for introduc-ing a further parameter, the symmetry parameter.
Membrane symmetry
The membrane symmetry parameter provides, to a cer-tain extent, information about the diffusion process.Working at low SA concentration, the SA//Ch mem-brane exhibits a significant absorbance difference onboth sides of the membrane peak with a lower one in theSA solution direction. A quantitative, and objective,evaluation of this parameter seems to be more compli-cated and needs further investigation concerning itsgeneralization.
The membrane peak consists, in some experiments, oftwo parts: a more regular, more or less heterogeneousone in the lower peak area and a nonsymmetric one onthe top. For comprehensive evaluation these two peakparts have to be considered. Nevertheless, real experi-mental values become available by the AUC method.This is not easy, for example, for imaging methods. Asthe simplest evaluation for the SA/Ch-type membranesthe difference in the absorbance units on both peaksides, S1 and S2, related to the higher absorbance isproposed:
MS ¼ 1� S1 � S2
S1; ð2Þ
with S1=A1)A0 and S2=A2)A0. MS=1 for S1=S2, afully symmetric membrane. The estimated symmetriesare summarized in the last column of Table 3. A moresymmetric membrane is concluded from the scanobservation at high alginate concentration (2%, experi-ments 3, 9, 11). Keeping the alginate concentrationconstant, at 1.5%, the symmetry increases with the pH.
The molar masses of PLL have a significant impacton the membrane symmetry. The two membranes inFig. 5, however, possess a different shape compared withthe SA//Ch membranes in Fig. 4. The symmetry for Chcorresponds to an absorbance decrease at the top of thepeak. The peak shape for PLL is characterized by theonset of an absorbance decrease in the middle of thepeak. Equation (2) is not applicable in this case. The twosymmetry types are presented schematically in Fig. 7.
Several mechanisms for the formation of polyelec-trolyte complex networks/gels/membranes are underdiscussion [19] or can be concluded based on the ther-modynamics of the process, which may lead to varioussymmetry and membrane growth processes. Overall, theinitial contact of the oppositely charges polyions canresult in the formation of a permanent network which iscompletely neutral and its density allows penetration oflater incoming polyions, increasing the membrane
thickness. However, there is evidence that the complexunderlies dynamics and the polyion chains arriving atthe interface replace the network contacts, pushing thepolyions of the same charge in the direction of theoppositely charged polyions, which have not reacted yet.Moreover, such a process will be thermodynamicallyfavorable for polydisperse polyion components with thelonger chains replacing the shorter ones. On the otherhand, the diffusion of shorter chains is favored. But it isalso known that shorter chains, in general, form net-works possessing lower mechanical stability at compa-rable concentrations [20].
The different types of peak symmetry for Ch and PLLcorrespond, for most of the SA/Ch experiments, tomembranes with a continuously decreasing compactnessbut still a relatively high compactness in the direction ofthe SA solution. In contrast, the SA//PLL membranesconsist of one relatively homogeneous, symmetric andcompact part, which continues in a region of relativelylow compactness and, finally, the calcium gel.
Membrane growth and kinetics
Differences of the membrane formation process areobvious from Figs. 2 and 3. This concerns both theformation of a certain shape and the kinetics. Since forthe study of SA//Ch the same components were em-ployed for all experiments the differences result from thevariation of the experimental conditions. Probably,lower SA concentrations yield, initially, less dense net-works allowing the penetration of further Ch chains intothe less concentrated SA solution. The excess of SA inthe case of higher SA concentrations will push the SAchains to react with Ch. This process is indicated by thedifferent positions of the membrane peak in the AUCcell. At low pH, where Ch is more positively charged, themovement in the SA direction is favored.
The formation process is quantitatively described inFig. 8, where the increase of the membrane thicknesswith time is compared for 1% and 2% SA at pH 6.5. At
Fig. 7 Schematic presentation of the two membrane symmetrytypes: a corresponds to sodium alginate//chitosan; b corresponds tosodium alginate//PLL/CaCl2. Principle of the symmetry calculationin a
1254

1%, the membrane thickness continuously increases,whereas at 2% SA a final thickness seems to be reachedafter approximately 50 min. Clearly, this process is alsoinfluenced by the availability of Ch, which, indeed, waskept constant for the two experiments.
If not only the increase of the membrane thickness asa function of time is plotted but also the change of theradial positions at selected absorbance with time, aspresented in Fig. 9 for SA/PLL, a more comprehensivedescription of the growth process becomes accessible. Itanalyzes the movement of the contact interface, thegrowth direction, and may serve to calculate the growthvelocity from the slop. A much faster growth is visiblefor PLL2. Moreover, if there is a minor difference in theradial positions at various absorbance values a morehomogeneous network with well-defined surfaces can beconcluded. The difference of the upper and lower curvescorresponds, for the same absorbance, to the scan widthat this position. A quantification of the formationkinetics has to consider several steps by different mech-anisms: spontaneous network formation when the firstcontact of the PA and PC chains takes place, a very fastprocess; diffusion and/or movement of the polyionsinfluenced, for example, by the characteristics of theinitially formed network, the macromolecular and elec-trochemical characteristics of the components, or med-ium conditions, a process of moderate velocity; networkequilibration and/or reorganization, a slow to very slowprocess [6].
Further characteristics
The absorbance scans, but also the interference scans,provide further information, which is not easy to gen-eralize. As has already been mentioned, the same
amount of SA solution, 100 ll, was always filled into theAUC cell. The various positions of the membrane peaksdeserve, therefore, attention. They may result from theformation mechanism influenced by the experimentalconditions. In addition, shrinking during complex for-mation and/or osmotic influences can superimpose thedetection of the formation process. The position of thepeak, in the case of the SA concentration variation,correlates with the interpretation that, at low concen-tration, the diffusion of Ch through a then less densenetwork is favored. At high SA concentration the SAreplacement in the network may serve as an explanation.At low pH the electrostatic attraction of the more pos-itively charged Ch may cause the position. At higher pHthis effect is less pronounced. The position of the peakmay be useful to support a mechanistic explanation. Inthe case of PLL the lower molar mass PLL2 will diffusefaster into the SA solution. The thicker and morecompact membrane probably causes strong shrinking.
Fig. 8 Membrane thickness as a function of time. Experiment 1(dashed line), experiment 3 (solid line)
Fig. 9a, b Membrane growth as a function of time at variousabsorbances: 1.0 (solid line), 1.5 (dashed line), 2.0 (dotted line).a Experiment 7, b experiment 8
1255

The total membrane thickness, MT0, was estimatedsomewhat far from the base line. In particular, in thecase of SA//Ch, at 2% SA, a peak broadening at lowabsorbance appears. This corresponds to a less definedand rough surface of the membrane. A well-defined andsteep absorbance jump refers to a flat, sharp surface. Ingeneral, the surfaces of the PLL membranes are betterdefined than the SA//Ch surfaces.
The interference scans serve to calculate the amount ofsolvent in the two sectors. In detail, from the movementof the meniscus in the PC sector the volume decrease isavailable. Themovement of the meniscus in the PA sectorreflects the volume increase there. Both should beidentical, but were not for these experiments. Figure 10shows the calculated differences, for three experiments,decreasing with time. This is the difference between theexpected volume increase and the real increase, moreprecisely, the volume in the PA sector increases less thanexpected from additivity. The volume loss identifies theshrinking during the complex formation, a process that is
difficult to follow experimentally but becomes accessiblehere.
Conclusions and outlook
The systematic experiments performed clearly demon-strate the influence of the concentration, pH, and molarmass on the polyelectrolyte network formation at a well-defined flat interface. The recently developed AUCtechnique provides a multitude of information about theformation process and the network characteristics. Allthe information that can be taken from the AUC scanshas been generalized, and exploited, by introducing anddefining characteristics which allow the comparison ofdifferent membrane types. Although some of them, themembrane compactness, heterogeneity, and symmetry,are qualitative parameters as they depend on the tur-bidity reading via absorption optics, all characteristicstogether will contribute to establish qualitative andpartly quantitative relationships for the influence of thepolyelectrolyte properties and the experimental condi-tions on the membrane formation process and themembrane properties. Such relationships will be used tosupport the development of membranes for specificapplications. Further investigations are in progress tocorrelate the experimental findings from AUC with re-sults from other methods such as mechanical stabilityand permeability. Overall, AUC is a valuable and un-ique tool to study on-line polyelectrolyte network for-mation in detail.
Acknowledgements We thank P. Schuck, National Institute ofHealth, Bethesda, USA, for his support developing the evaluationsoftware. W. Strand, Norwegian University of Science and Tech-nology, Trondheim, Norway, is acknowledged for the alginatestructural analysis. Furthermore, the authors gratefully acknowl-edge financial support by the Swiss National Science Foundation,grant 2100-064996.
Fig. 10 Volume difference during the complex formation as afunction of time (volume decrease in the polycation sector minusvolume increase in the polyanion sector). Experiment 8 (closedcircles), experiment 4 (open circles), experiment 9 (triangles)
References
1. Dautzenberg H, Jaeger W, Kotz J,Philipp B, Seidel C (1994) Polyelectro-lytes: formation, characterization andapplications. Hanser, Munich
2. Zintchenko A, Rother G, DautzenbergH (2003) Langmuir 19:2507
3. Kabanov VA, Zezin AB (1984) Macro-mol Chem 6:259
4. Dautzenberg H (2001) In: Radeva T(ed) Physical chemistry of polyelectro-lytes. Surfactant science series, vol 99.Dekker, New York, p 743
5. Gander B, Blanco-Prieto MJ, ThomasinC, Wandrey C, Hunkeler D (2001) In:Swarbrick J, Boylan JC (eds) Encyclo-pedia of pharmaceutical technology,2nd edn. Dekker, New York, p 481
6. Wandrey C, Bartkowiak A (2001)Colloids Surf A 180:141
7. Wandrey C, Grigorescu G, Hunkeler D(2002) Prog Colloid Polym Sci 119:84
8. Colfen H (1998) Polym News 23:59. Colfen H (1999) In: Harding SE (ed)
Biotechnology and genetic engineeringreviews. , p 87
10. Borger L, Colfen H (1999) Prog ColloidPolym Sci 113:23
11. Lucas G, Borger L, Colfen H (2002)Prog Colloid Polym Sci 119:11
12. Draget KI, Skjak-Bræk G, Smidsrod O(1994) Carbohydr Polym 25:31
13. Bartkowiak A, Hunkeler D (2000)Chem Mater 12:206
14. Beckman Instruments, Inc (1998)Model XL-I analytical ultracentrifuge.Beckman Instruments, Inc, Palo Alto,USA
15. Wandrey C, Bartkowiak A, Hunkeler D(2000) In: Transact 6th World BiomatCongr 15–20 May, 2000, Hawaii USA,vol II. Soc. Biomat., USA, p 893
1256

16. Chervenka CH (1969) A manual ofmethods for the analytical ultracentri-fuge. Spinco Dev Instr, Palo Alto
17. Lim, F., Science (1980) 210.
18. Gugerli R (2003) Doctoral thesisno 2720. Swiss Federal Institute ofTechnology, Lausanne, Switzerland
19. Potemkin II, Khokhlov AR (2002) In:Osada Y, Khokhlov AR (eds) Polymergels and networks. Dekker, New York,p 47
20. Wandrey C, Espinosa D, Rehor A,Hunkeler D (2003) J Microencapsula-tion 20:597
1257


