Embed Size (px)
Citation preview
1
2
3
4
5
6
7
9
10111213141516
1 7
Q1
33
34
35
36
37
38
39 Q2
40
41
42
43
44
45
46
47
48
49
50
51
52
Expert Systems with Applications xxx (2011) xxx–xxx
ESWA 6143 No. of Pages 14, Model 5G
18 March 2011
Contents lists available at ScienceDirect
Expert Systems with Applications
journal homepage: www.elsevier .com/locate /eswa
Review
On the application of genetic programming for software engineering predictivemodeling: A systematic review
Wasif Afzal ⇑, Richard TorkarBlekinge Institute of Technology, S-371 79 Karlskrona, Sweden
a r t i c l e i n f o a b s t r a c t
1819202122
Keywords:Systematic reviewGenetic programmingSymbolic regressionModeling
232425262728293031
0957-4174/$ - see front matter � 2011 Elsevier Ltd. Adoi:10.1016/j.eswa.2011.03.041
⇑ Corresponding author. Tel.: +46 455 385840; fax:E-mail addresses: [email protected] (W. Afzal
Torkar).
Please cite this article in press as: Afzal, W., & Ttematic review. Expert Systems with Applications
The objective of this paper is to investigate the evidence for symbolic regression using genetic program-ming (GP) being an effective method for prediction and estimation in software engineering, when com-pared with regression/machine learning models and other comparison groups (including comparisonswith different improvements over the standard GP algorithm). We performed a systematic review of lit-erature that compared genetic programming models with comparative techniques based on differentindependent project variables. A total of 23 primary studies were obtained after searching different infor-mation sources in the time span 1995–2008. The results of the review show that symbolic regressionusing genetic programming has been applied in three domains within software engineering predictivemodeling: (i) Software quality classification (eight primary studies). (ii) Software cost/effort/size estima-tion (seven primary studies). (iii) Software fault prediction/software reliability growth modeling (eightprimary studies). While there is evidence in support of using genetic programming for software qualityclassification, software fault prediction and software reliability growth modeling; the results are incon-clusive for software cost/effort/size estimation.
� 2011 Elsevier Ltd. All rights reserved.
32
53
54
56
57
58
59
60
61
62
63
64
65
66
67
68
69
70
7172
73
74
1. Introduction
Evolutionary algorithms represent a subset of the metaheuristicapproaches inspired by evolution in nature, (Burke & Kendall,2005) such as reproduction, mutation, cross-over, natural selectionand survival of the fittest. All evolutionary algorithms share a set ofcommon properties (Bäck, Fogel, & Michalewicz, 2000):
1. These algorithms work with a population of solutions, utilizinga collective learning process. This population of solutions make-up the search space for the evolutionary algorithms.
2. The solutions are evaluated by means of a quality or fitnessvalue whereby the selection process promotes better solutionsthan those that are worse.
3. New solutions are generated by random variation operatorsintended to model mutation and recombination.
The above process is iterated over successive generations ofevaluation, selection and variation, with a hope that increasinglysuitable solutions would be found, i.e., the search is guided to morefeasible locations of the search space. Examples of typical evolu-tionary algorithms include genetic algorithms, evolution strategies
ll rights reserved.
+46 455 385057.), [email protected] (R.
orkar, R. On the application of g(2011), doi:10.1016/j.eswa.20
and evolutionary programming. The structure of an evolutionaryalgorithm is given below (Michalewicz & Fogel, 2004):
procedure evolutionary algorithm
P(t): population of solutions; t: iteration number;begin
t 0initialize P(t)evaluate P(t)while (not termination-condition) dobegin
t t + 1select P(t) from P(t � 1)alter P(t)evaluate P(t)
endend
The evolutionary algorithm maintains a population of solutions
75
76
77
78
79
P(t) for iteration t. Each solution in the population is evaluated forits fitness (the ‘‘evaluate step’’). A new population at iteration t + 1is formed by selecting the more fitter solutions (the ‘‘select step’’).Some solutions of the new population undergo transformations(the ‘‘alter step’’) using the variation operators. The algorithm isiterated until a predefined termination criterion is reached.
enetic programming for software engineering predictive modeling: A sys-11.03.041
80
81
82
83
84
85
86
87
88
89
90
91
92
93
94
95
96
97
98
99
100
101
102
103
104
105
106
107
108
109
110
111
112
113
114
115
116
117
118
119
120
121
122
123
124
125
126
127
128
129
130
131
132
133
134
135
136
137
138
139
140
141
142
143
144
145
146
147
148
149
150
151
152
153
154
155
156
157
158
159
160
161
162
163
164
165
166
167
168
169
170
171
172
173
174
175
176
177
178
179
180
181
182
183
184
185
186
187
188
189
190
191
192
193
194
195
196
197
198
199
200
201
202
203
204
205
206
207
2 W. Afzal, R. Torkar / Expert Systems with Applications xxx (2011) xxx–xxx
ESWA 6143 No. of Pages 14, Model 5G
18 March 2011
Genetic programming (GP) (Banzhaf, Nordin, Keller, & Francone,1998; Koza, 1992; Poli, Langdon, & McPhee, 2008) is an extensionof genetic algorithms. It is a systematic, domain-independent methodfor getting computers to solve problems automatically starting from ahigh-level statement of what needs to be done (Poli et al., 2008). Likeother evolutionary algorithms, GP applies iterative, random varia-tion to an existing pool of computer programs (potential solutionsto the problem) to form a new generation of programs by applyinganalogs of naturally occurring genetic operations (Koza & Poli,2005). Programs may be expressed in GP as syntax trees, withthe nodes indicating the instructions to execute (called functions),while the tree leaves are called terminals and may consist of inde-pendent variables of the problem and random constants. To use GPone usually needs to take five preparatory steps (Koza & Poli,2005):
1. Specifying the set of terminals.2. Specifying the set of functions.3. Specifying the fitness measure.4. Specifying the parameters for controlling the run.5. Specifying the termination criterion and designating the result
of the run.
The first two steps define the search space that will be ex-plored by GP. The fitness measure guides the search in promisingareas of the search space and is a way of communicating a prob-lem’s requirements to a GP algorithm. The fitness evaluation of aparticular individual is determined by the correctness of the out-put produced for all of the fitness cases (Bäck et al., 2000). Thelast two steps are administrative in their nature. The controlparameters limit and control how the search is performed likesetting the population size and probabilities of performing the ge-netic operations, while the termination criterion specifies theending condition for the GP run and typically includes a maxi-mum number of generations (Koza & Poli, 2005). Genetic opera-tors of mutation, crossover and reproduction are mainlyresponsible for introducing variation in successive generations.The crossover operator recombines randomly chosen parts fromtwo selected programs and creates new program(s) for the newpopulation. The mutation operator selects a point in a parent treeand generates a new random sub-tree to replace the selected sub-tree, while the reproduction operator simply replicates a selectedindividual to a new population.
Symbolic regression is one of the many application areas of GPwhich finds a function, with the outputs having desired outcomes.It has the advantage of being independent of making any assump-tions about the function structure. Another potential advantage isthat models built using symbolic regression application of GP canalso help in identifying the significant variables which might beused in subsequent modeling attempts (Kotanchek, Smits, & Kor-don, 2003).
This paper reviews the available literature on the applicationof symbolic regression using GP for predictions and estimationswithin software engineering. The performance of symbolic regres-sion using GP is assessed in terms of its comparison with compet-ing models which might include common machine learningmodels, statistical models, models based on expert opinion andmodels generated using different improvements over the stan-dard GP algorithm. There are two reasons for carrying out thisstudy:
1. To be able to draw (if possible) general conclusions about theextent of application of symbolic regression using GP for predic-tions and estimations in software engineering.
2. To summarize the benefits and limitations of using symbolicregression as a prediction and estimation tool.
Please cite this article in press as: Afzal, W., & Torkar, R. On the application of gtematic review. Expert Systems with Applications (2011), doi:10.1016/j.eswa.20
The authors are not aware of any study having goals similar toours. Prediction and estimation in software engineering has beenapplied to measure different attributes. A non-exhaustive list in-cludes prediction and estimation of software quality, e.g. Lanubileand Visaggio (1997), software size, e.g. Low and Jeffery (1990),software development cost/effort, e.g. Jørgensen and Shepperd(2007), maintenance task effort, e.g. Jørgensen (1995), correctioncost, e.g. de Almeida, Lounis, and Melo (1998), software fault,e.g. Thelin (2004), and software release timing, e.g. Dohi, Nishio,and Osaki (1999). A bulk of the literature contributes to softwarecost/effort and software fault prediction. A systematic review ofsoftware fault prediction studies is given by Catal and Diri(2009), while a systematic review of software development costestimation studies is provided by Jørgensen and Shepperd(2007). The current study differs from these systematic reviewsin several ways. Firstly, the studies as in Catal and Diri (2009)and Jørgensen and Shepperd (2007) are more concerned withclassification of primary studies and capturing different trends.This is not the primary purpose of this study which is more con-cerned with investigating the comparative efficacy of using sym-bolic regression across software engineering predictive studies.Secondly, Catal and Diri (2009) and Jørgensen and Shepperd(2007) review the subject area irrespective of the applied method,resulting in being more broad in their coverage of the specificarea. This is not the case with this study as it is narrowly focusedin terms of the applied technique and open in terms of capturingprediction and estimation of different attributes (as will be evi-dent from the addressed research question in Section 2.1).Thirdly, one additional concern, which makes this study differentfrom studies of Catal and Diri (2009) and Jørgensen and Shepperd(2007), is that it also assesses the evidence of comparative anal-ysis of applying symbolic regression using GP with other compet-ing techniques.
A paper by Crespo, Cuadrado, Garcia, Marban, and andSan-chez-Segura (2003) presents a classification of software develop-ment effort estimation into artificial intelligence (AI) methods ofneural networks, case-based reasoning, regression trees, fuzzy lo-gic, dynamical agents and genetic programming. While theauthors were able to present a classification scheme, it is notcomplete in terms of its coverage of studies within each AImethod.
One other motivation of us carrying out this systematic reviewis the general growing interest in search-based approaches to solvesoftware engineering problems (Harman & Jones, 2001). In this re-gards, it is interesting to investigate the extent of application of ge-netic programming (a search-technique) within softwareengineering predictive modeling. This presents an opportunity toassess different attributes which can be measured using GP. It alsoallows us to gain an understanding of different improvements/variations used by these studies to predict and estimate in a betterway.
In rest of the text below, wherever we refer to GP, we mean thesymbolic regression application of it.
This paper is organized as follows: Section 2 describes the re-search method including the research question, the search strat-egy, the study selection procedure, the study quality assessmentand the data extraction. Results are presented in Section 3, whileSection 4 discusses the results and future work. Validity threatsand conclusions appear in Sections 5 and 6, respectively.
2. Method
This section describes our review protocol, which is a multi-step process following the guidelines outlined in Kitchenham(2007).
enetic programming for software engineering predictive modeling: A sys-11.03.041
208
209
210
211
212
213
214
215
216
217
218
219
220
221
222
223
224
225
226
227
228
229
230
231
232
233
234
235
236
237
238
239
240
241
242
243
244
245
246
247
248
249
250
251
252
253
254
255
256
257
258
259
260
261
262
263
264
265
266
267
268
269
270
271
272
273
274
275
276
277
278
279
280
281
282
283
284
285
W. Afzal, R. Torkar / Expert Systems with Applications xxx (2011) xxx–xxx 3
ESWA 6143 No. of Pages 14, Model 5G
18 March 2011
2.1. Research question
We formulated the following research question for this study:
RQ Is there evidence that symbolic regression using genetic pro-gramming is an effective method for prediction and estima-tion, in comparison with regression, machine learning andother models (including expert opinion and differentimprovements over the standard GP algorithm)?
The research questions can conveniently be structured in theform of PICOC (Population, Intervention, Comparison, Outcome,Context) criteria (Petticrew & Roberts, 2005). The population is thisstudy is the domain of software projects. Intervention includesmodels evolved using symbolic regression application of GP. Thecomparison intervention includes the models built using regres-sion, machine learning and other methods. The outcome of ourinterest represents the comparative effectiveness of prediction/estimation using symbolic regression and machine learning/regression/other models (including different improvements overthe standard GP algorithm). We do not pose any restrictions interms of context and experimental design.
286
287
288
289
290
291
292
293
294
295
296
297
298
299
300
301
302
303
304
305
306
307
308
309
310
311
312
313
314
315
316
317
318
319
320
321
322
323
324
2.2. The search strategy
Balancing comprehensiveness and precision in the search strat-egy is both an important and difficult task. We used the followingapproach for minimizing the threat of missing relevant studies:
1. Breaking down the research question into PICOC criteria. This isdone to manage the complexity of a search string that can getsophisticated in pursuit of comprehensiveness.
2. Identification of alternate words and synonyms for each of PICOCcriterion. First, since it is common that terminologies differ inreferring to the same concept, derivation of alternate wordsand synonyms helps ensuring completeness of search. Thegenetic programming bibliography maintained by Langdon,Gustafson, and Koza (2009) and Alander’s bibliography ofgenetic programming (Alander, 2009) turned out to be valuablesources for deriving the alternate words and synonyms. Sec-ondly our experience of conducting studies in a similar domainwas also helpful (Afzal, Torkar, & Feldt, 2009).
3. Use of Boolean OR to join alternate words and synonyms.4. Use of Boolean AND to join major terms.
We came up with the following search terms (divided accordingto the PICOC criteria given in Section 2.1):
� Population. Software, application, product, web, Internet,World-Wide Web, project, development.� Intervention. Symbolic regression, genetic programming.� Comparison intervention. Regression, machine learning,
machine-learning, model, modeling, modelling, system identifi-cation, time series, time-series.� Outcomes. Prediction, assessment, estimation, forecasting.
Hence, leading to the following search string: (software ORapplication OR product OR Web OR Internet OR ‘‘World-WideWeb’’ OR project OR development) AND (‘‘symbolic regression’’OR ‘‘genetic programming’’) AND (regression OR ‘‘machine learn-ing’’ OR machine-learning OR model OR modeling OR modellingOR ‘‘system identification’’ OR ‘‘time series’’ OR time-series) AND(prediction OR assessment OR estimation or forecasting).
325
Please cite this article in press as: Afzal, W., & Torkar, R. On the application of gtematic review. Expert Systems with Applications (2011), doi:10.1016/j.eswa.20
The search string was applied to the following digital libraries,while searching within all the available fields:
� INSPEC� EI Compendex� ScienceDirect� IEEEXplore� ISI Web of Science (WoS)� ACM Digital Library
In order to ensure the completeness of the search strategy, wecompared the results with a small core set of primary studies wefound relevant, i.e. (Burgess & Lefley, 2001; Costa, de Souza, Pozo,& Vergilio, 2007; Dolado, 2001). All of the known papers werefound using multiple digital libraries.
We additionally scanned the online GP bibliography maintainedby Langdon et al. (2009) by using the search-term symbolic regres-sion. We also searched an online data base of software cost and ef-fort estimation called BESTweb (Jørgensen, 2009), using thesearch-term genetic programming.
The initial automatic search of publication sources was comple-mented with manual search of selected journals (J) and conferenceproceedings (C). These journals and conference proceedings wereselected due to their relevance within the subject area and in-cluded: Genetic Programming and Evolvable Machines (J), Euro-pean Conference on Genetic Programming (C), Genetic andEvolutionary Computation Conference (C), Empirical SoftwareEngineering (J), Information and Software Technology (J), Journalof Systems and Software (J), IEEE Transactions on Software Engi-neering (J) and IEEE Transactions on Evolutionary Computation(J). We then also scanned the reference lists of all the studies gath-ered as a result of the above search strategy to further ensure amore complete set of primary studies.
The time span of the search had a range of 1995–2008. Theselection of 1995 as the starting year was motivated by the factthat we did not find any relevant study prior to 1995 from oursearch of relevant GP bibliographies (Alander, 2009; Langdonet al., 2009). In addition, we also did not find any relevant studypublished before 1995 as a result of scanning of the reference listsof studies found by searching the electronic databases.
2.3. The study selection procedure
The purpose of the study selection procedure is to identify pri-mary studies that are directly related to answering the researchquestion (Kitchenham, 2007). We excluded studies that:
1. Do not relate to software engineering or software development,e.g. Alfaro-Cid, McGookin, Murray-Smith, and Fossen (2008).
2. Do not relate to prediction/estimation of software cost/effort/size, faults, quality, maintenance, correction cost and releasetiming, e.g. Abraham (2008).
3. Report performance of a particular technique/algorithmicimprovement without being applied to software engineering,e.g. Andersson, Svensson, Nordin, and Nordahl (1999).
4. Do not relate to symbolic regression (or any of its variants)using genetic programming, e.g. Shukla (2000).
5. Do not include a comparison group, e.g. Khoshgoftaar and Liu(2007).
6. Do not include a valid comparison group, e.g. in Evett,Khoshgoftar, der Chien, and Allen (1998) where GP is comparedwith random rank ordering of software modules which is not avalid technique for software quality classification.
7. Use genetic programming only for feature selection prior to usingsome other technique, e.g. Ratzinger, Gall, and Pinzger, 2007.
enetic programming for software engineering predictive modeling: A sys-11.03.041
326
327
328
329
330
331
332
333
334
335
336
337
338
339
340
341
342
343
344
345
346
347
348
349
350
351
352
353
354
355
356
357
358
359
360
361
362
363
364
365
366
367
368
369
370
371
372
373
374
375
376
377
378
379
380
381
382
383
384
385
386
387
388
389
390
391
392
393
394
395
396
397
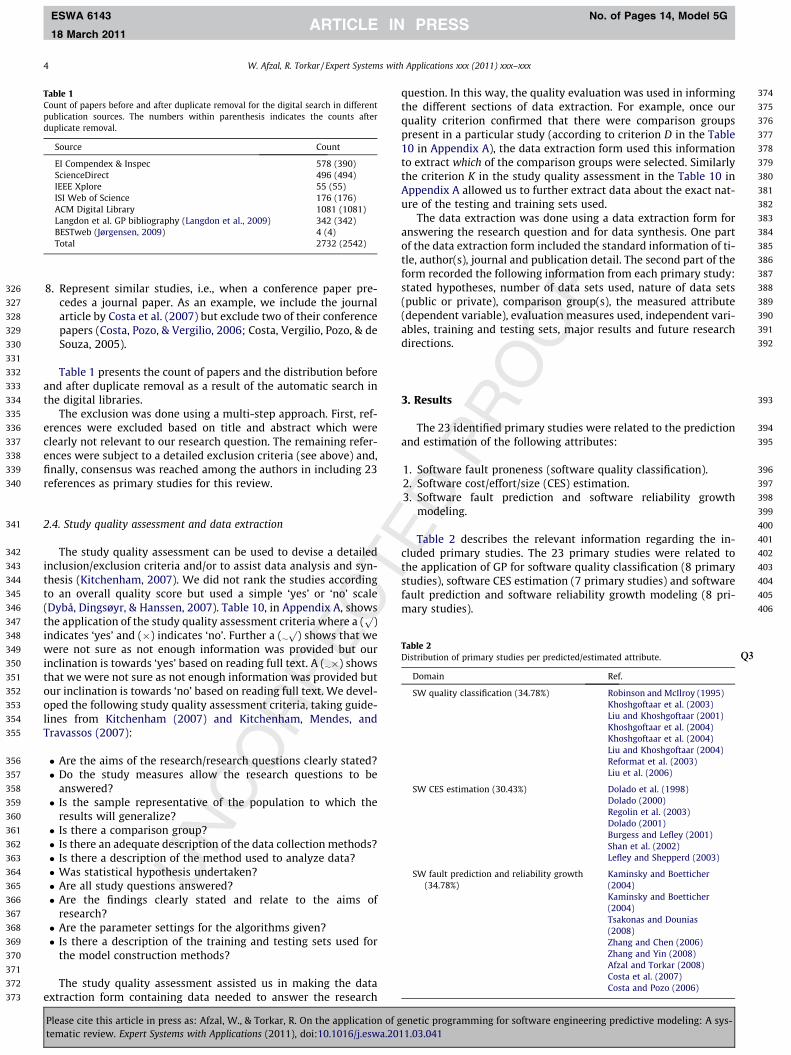
Table 1Count of papers before and after duplicate removal for the digital search in differentpublication sources. The numbers within parenthesis indicates the counts afterduplicate removal.
Source Count
EI Compendex & Inspec 578 (390)ScienceDirect 496 (494)IEEE Xplore 55 (55)ISI Web of Science 176 (176)ACM Digital Library 1081 (1081)Langdon et al. GP bibliography (Langdon et al., 2009) 342 (342)BESTweb (Jørgensen, 2009) 4 (4)Total 2732 (2542)
4 W. Afzal, R. Torkar / Expert Systems with Applications xxx (2011) xxx–xxx
ESWA 6143 No. of Pages 14, Model 5G
18 March 2011
8. Represent similar studies, i.e., when a conference paper pre-cedes a journal paper. As an example, we include the journalarticle by Costa et al. (2007) but exclude two of their conferencepapers (Costa, Pozo, & Vergilio, 2006; Costa, Vergilio, Pozo, & deSouza, 2005).
Table 1 presents the count of papers and the distribution beforeand after duplicate removal as a result of the automatic search inthe digital libraries.
The exclusion was done using a multi-step approach. First, ref-erences were excluded based on title and abstract which wereclearly not relevant to our research question. The remaining refer-ences were subject to a detailed exclusion criteria (see above) and,finally, consensus was reached among the authors in including 23references as primary studies for this review.
398
399
400
401
402
403
404
405
406
Table 2Distribution of primary studies per predicted/estimated attribute. Q3
Domain Ref.
SW quality classification (34.78%) Robinson and McIlroy (1995)Khoshgoftaar et al. (2003)Liu and Khoshgoftaar (2001)Khoshgoftaar et al. (2004)Khoshgoftaar et al. (2004)Liu and Khoshgoftaar (2004)Reformat et al. (2003)Liu et al. (2006)
SW CES estimation (30.43%) Dolado et al. (1998)Dolado (2000)Regolin et al. (2003)Dolado (2001)Burgess and Lefley (2001)Shan et al. (2002)Lefley and Shepperd (2003)
SW fault prediction and reliability growth(34.78%)
Kaminsky and Boetticher(2004)Kaminsky and Boetticher(2004)Tsakonas and Dounias(2008)Zhang and Chen (2006)Zhang and Yin (2008)Afzal and Torkar (2008)Costa et al. (2007)Costa and Pozo (2006)
2.4. Study quality assessment and data extraction
The study quality assessment can be used to devise a detailedinclusion/exclusion criteria and/or to assist data analysis and syn-thesis (Kitchenham, 2007). We did not rank the studies accordingto an overall quality score but used a simple ‘yes’ or ‘no’ scale(Dybå, Dingsøyr, & Hanssen, 2007). Table 10, in Appendix A, showsthe application of the study quality assessment criteria where a (
p)
indicates ‘yes’ and (�) indicates ‘no’. Further a (�p
) shows that wewere not sure as not enough information was provided but ourinclination is towards ‘yes’ based on reading full text. A (��) showsthat we were not sure as not enough information was provided butour inclination is towards ‘no’ based on reading full text. We devel-oped the following study quality assessment criteria, taking guide-lines from Kitchenham (2007) and Kitchenham, Mendes, andTravassos (2007):
� Are the aims of the research/research questions clearly stated?� Do the study measures allow the research questions to be
answered?� Is the sample representative of the population to which the
results will generalize?� Is there a comparison group?� Is there an adequate description of the data collection methods?� Is there a description of the method used to analyze data?� Was statistical hypothesis undertaken?� Are all study questions answered?� Are the findings clearly stated and relate to the aims of
research?� Are the parameter settings for the algorithms given?� Is there a description of the training and testing sets used for
the model construction methods?
The study quality assessment assisted us in making the dataextraction form containing data needed to answer the research
Please cite this article in press as: Afzal, W., & Torkar, R. On the application of gtematic review. Expert Systems with Applications (2011), doi:10.1016/j.eswa.20
question. In this way, the quality evaluation was used in informingthe different sections of data extraction. For example, once ourquality criterion confirmed that there were comparison groupspresent in a particular study (according to criterion D in the Table10 in Appendix A), the data extraction form used this informationto extract which of the comparison groups were selected. Similarlythe criterion K in the study quality assessment in the Table 10 inAppendix A allowed us to further extract data about the exact nat-ure of the testing and training sets used.
The data extraction was done using a data extraction form foranswering the research question and for data synthesis. One partof the data extraction form included the standard information of ti-tle, author(s), journal and publication detail. The second part of theform recorded the following information from each primary study:stated hypotheses, number of data sets used, nature of data sets(public or private), comparison group(s), the measured attribute(dependent variable), evaluation measures used, independent vari-ables, training and testing sets, major results and future researchdirections.
3. Results
The 23 identified primary studies were related to the predictionand estimation of the following attributes:
1. Software fault proneness (software quality classification).2. Software cost/effort/size (CES) estimation.3. Software fault prediction and software reliability growth
modeling.
Table 2 describes the relevant information regarding the in-cluded primary studies. The 23 primary studies were related tothe application of GP for software quality classification (8 primarystudies), software CES estimation (7 primary studies) and softwarefault prediction and software reliability growth modeling (8 pri-mary studies).
enetic programming for software engineering predictive modeling: A sys-11.03.041
407
408
409
410
411
412
413
414
415
416
417
418
419
420
421
422
423
424
425
426
427
428
429
430
431
432
433
434
435
436
437
438
439
440
441
442
443
444
445
446
447
448
449
450
451
452
453
454
455
456
457
458
459
Dependentvariable
1996 1997 1998 1999 2000 2001 2002 2003 2004 2005 2006 2007 NN ANN NB SRGM SGP OTSR
Year Comparison groups
1 1 2 3 1
2
SR = statistical regressionNN = k-nearest neighborANN = artificial neural networkNB = naive BayesSRGM = software reliability growth modelsSGP = standard genetic programmingOT = other (random selection, LoC selection & expert ranking)
20081995
Software reliability
growth modeling
Software fault
prediction
Softwarecost/effort
Softwaresize
Softwarequality
classification
1
1 1
2 1 1
1
2 21
2 1 1 3 3
21
34 1 1
21
2 4 1
Fig. 1. Distribution of primary studies over range of applied comparison groups and time period.
W. Afzal, R. Torkar / Expert Systems with Applications xxx (2011) xxx–xxx 5
ESWA 6143 No. of Pages 14, Model 5G
18 March 2011
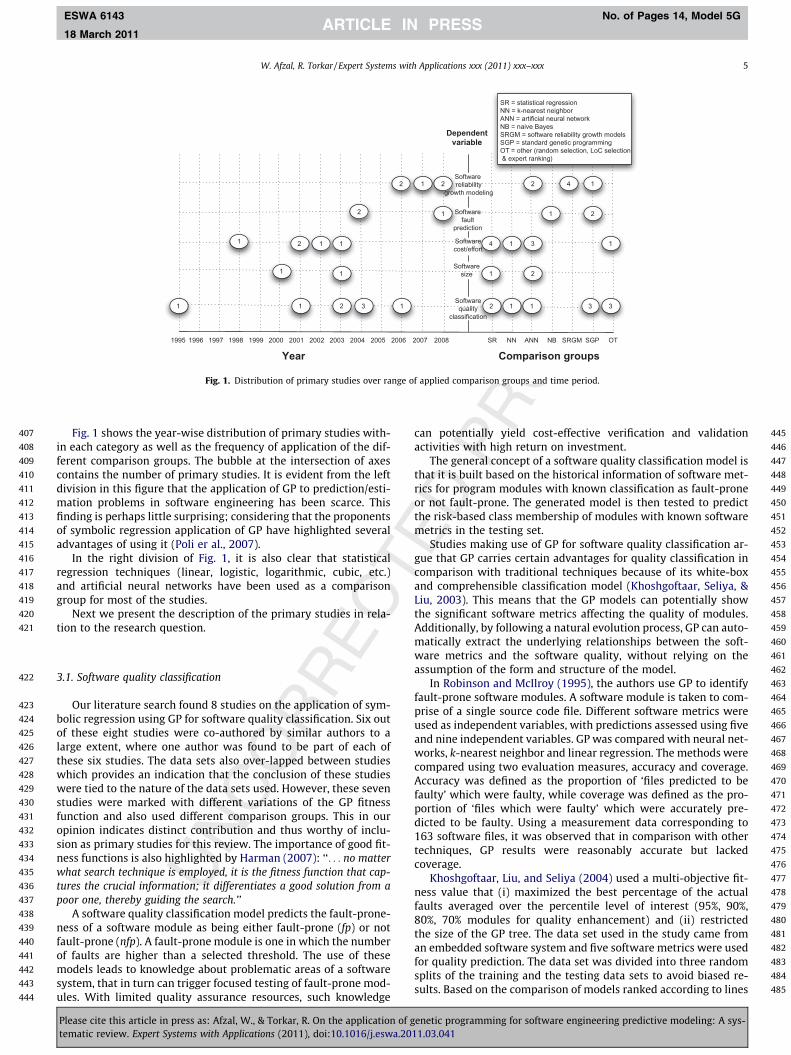
Fig. 1 shows the year-wise distribution of primary studies with-in each category as well as the frequency of application of the dif-ferent comparison groups. The bubble at the intersection of axescontains the number of primary studies. It is evident from the leftdivision in this figure that the application of GP to prediction/esti-mation problems in software engineering has been scarce. Thisfinding is perhaps little surprising; considering that the proponentsof symbolic regression application of GP have highlighted severaladvantages of using it (Poli er al., 2007).
In the right division of Fig. 1, it is also clear that statisticalregression techniques (linear, logistic, logarithmic, cubic, etc.)and artificial neural networks have been used as a comparisongroup for most of the studies.
Next we present the description of the primary studies in rela-tion to the research question.
460
461
462
463
464
465
466
467
468
469
470
471
472
473
474
475
476
477
478
479
480
481
482
483
484
485
3.1. Software quality classification
Our literature search found 8 studies on the application of sym-bolic regression using GP for software quality classification. Six outof these eight studies were co-authored by similar authors to alarge extent, where one author was found to be part of each ofthese six studies. The data sets also over-lapped between studieswhich provides an indication that the conclusion of these studieswere tied to the nature of the data sets used. However, these sevenstudies were marked with different variations of the GP fitnessfunction and also used different comparison groups. This in ouropinion indicates distinct contribution and thus worthy of inclu-sion as primary studies for this review. The importance of good fit-ness functions is also highlighted by Harman (2007): ‘‘. . . no matterwhat search technique is employed, it is the fitness function that cap-tures the crucial information; it differentiates a good solution from apoor one, thereby guiding the search.’’
A software quality classification model predicts the fault-prone-ness of a software module as being either fault-prone (fp) or notfault-prone (nfp). A fault-prone module is one in which the numberof faults are higher than a selected threshold. The use of thesemodels leads to knowledge about problematic areas of a softwaresystem, that in turn can trigger focused testing of fault-prone mod-ules. With limited quality assurance resources, such knowledge
Please cite this article in press as: Afzal, W., & Torkar, R. On the application of gtematic review. Expert Systems with Applications (2011), doi:10.1016/j.eswa.20
can potentially yield cost-effective verification and validationactivities with high return on investment.
The general concept of a software quality classification model isthat it is built based on the historical information of software met-rics for program modules with known classification as fault-proneor not fault-prone. The generated model is then tested to predictthe risk-based class membership of modules with known softwaremetrics in the testing set.
Studies making use of GP for software quality classification ar-gue that GP carries certain advantages for quality classification incomparison with traditional techniques because of its white-boxand comprehensible classification model (Khoshgoftaar, Seliya, &Liu, 2003). This means that the GP models can potentially showthe significant software metrics affecting the quality of modules.Additionally, by following a natural evolution process, GP can auto-matically extract the underlying relationships between the soft-ware metrics and the software quality, without relying on theassumption of the form and structure of the model.
In Robinson and McIlroy (1995), the authors use GP to identifyfault-prone software modules. A software module is taken to com-prise of a single source code file. Different software metrics wereused as independent variables, with predictions assessed using fiveand nine independent variables. GP was compared with neural net-works, k-nearest neighbor and linear regression. The methods werecompared using two evaluation measures, accuracy and coverage.Accuracy was defined as the proportion of ‘files predicted to befaulty’ which were faulty, while coverage was defined as the pro-portion of ‘files which were faulty’ which were accurately pre-dicted to be faulty. Using a measurement data corresponding to163 software files, it was observed that in comparison with othertechniques, GP results were reasonably accurate but lackedcoverage.
Khoshgoftaar, Liu, and Seliya (2004) used a multi-objective fit-ness value that (i) maximized the best percentage of the actualfaults averaged over the percentile level of interest (95%, 90%,80%, 70% modules for quality enhancement) and (ii) restrictedthe size of the GP tree. The data set used in the study came froman embedded software system and five software metrics were usedfor quality prediction. The data set was divided into three randomsplits of the training and the testing data sets to avoid biased re-sults. Based on the comparison of models ranked according to lines
enetic programming for software engineering predictive modeling: A sys-11.03.041
486
487
488
489
490
491
492
493
494
495
496
497
498
499
500
501
502
503
504
505
506
507
508
509
510
511
512
513
514
515
516
517
518
519
520
521
522
523
524
525
526
527
528
529
530
531
532
533
534
535
536
537
538
539
540
541
542
543
544
545
546
547
548
549
550
551
552
553
554
555
556
557
558
559
560
561
562
563
564
565
566
567
568
569
570
571
572
573
574
575
576
577
578
579
580
581
582
583
584
585
586
587
588
589
590
591
592
593
594
595
596
597
598
599
600
601
602
603
604
605
606
607
608
609
610
611
1 The data sets in Table 4 are taken at a coarser level, e.g. ISBSG data (ISBSG, 2009)of multiple projects is 1 data set.
6 W. Afzal, R. Torkar / Expert Systems with Applications xxx (2011) xxx–xxx
ESWA 6143 No. of Pages 14, Model 5G
18 March 2011
of code (LOC), the GP-models ranked the modules closer to the ac-tual ranking on two of the three data splits. The results were notmuch different in an extension of this study (Khoshgoftaar, Liu, &Seliya, 2004), where in an additional case study of a legacy tele-communication system with 28 independent variables, GP outper-formed the module ranking based on LOC.
Another study by Khoshgoftaar et al. (2003) used a differentmulti-objective fitness function for generating the software qualitymodel. First the average weighted cost of misclassification wasminimized and subsequently the trees were simplified by control-ling their size. The average weighted cost of misclassification wasformulated to penalize Type-II error (a fp module misclassified asnfp) more than Type-I error (a nfp module misclassified as fp). Thiswas done by normalizing the cost of Type-II error with respect tothe cost of Type-I error. Data was collected from two embeddedsystems applications which consisted of five different metrics fordifferent modules. In comparison with standard GP, the perfor-mance of multi-objective GP was found to be better with multi-objective GP finding lower Type-I and Type-II error rates withsmaller tree sizes. A similar study was carried out by Liu andKhoshgoftaar (2001) in which a single objective fitness functionwas used which took into account the average weighted cost ofmisclassification. Random subset selection was chosen which eval-uated GP individuals in each generation on a randomly selectedsubset of the fit data set. Random subset selection helped to reducethe problem of over-fitting in GP solutions. Comparisons with lo-gistic regression showed that Type-I and Type-II error rates forGP model were found to be better than for logistic regression.The same authors extended the study by adding a case study withdata from a legacy telecommunication system in Liu and Khoshgof-taar (2004). This time the fitness function was multi-objective withminimization of expected cost of misclassification and also controlof the tree size of GP solutions. The results of applying the randomsubset selection showed that over-fitting was reduced in compar-ison with when there was no random subset selection, hence,yielding solutions with better generalizability in the testing partof the data set.
In Reformat, Pedrycz, and Pizzi (2003), evolutionary decisiontrees were proposed for classifying software objects. The compari-son group in this case was the classification done by two architectsworking on the project under study. The data set consisted of 312objects whose quality was ranked by two architects as high, med-ium and low. The independent variables included 19 different soft-ware metrics for each object. Both genetic algorithms and GP wereused to get best splitting of attribute domains for the decision treeand to get a best decision tree. The GA chromosome was repre-sented by a possible splitting for all attributes. The fitness of thechromosome was evaluated using GP with two possibilities ofthe fitness function: (i) When the number of data samples in eachclass was comparable, K
N, where K= number of correctly specifieddata and N = number of data samples in a training set. (ii) Whenthe number of data samples in each class were not comparable,Qc
i¼1kiþ1
ni, where c = number of different classes, ni = number of data
samples belonging to a class i and, finally, ki = number of correctlyclassified data of a class i. The results showed that in comparisonwith architects’ classification of objects’ quality, the rate of suc-cessful classification for training data was around 66%–72% forthe first and the second architect respectively.
In Liu, Khoshgoftaar, and Yao (2006), the performance of GPbased software quality classification is improved by using a multidata set validation process. In this process, the hundred best mod-els were selected after training on a single data set. These modelswere then validated on 5 validation data sets. The models that per-formed the best on these validation data sets were applied to thetesting data set. The application of this technique to seven differentNASA software projects showed that the misclassification costs
Please cite this article in press as: Afzal, W., & Torkar, R. On the application of gtematic review. Expert Systems with Applications (2011), doi:10.1016/j.eswa.20
were reduced in comparison with standard genetic programmingsolution.
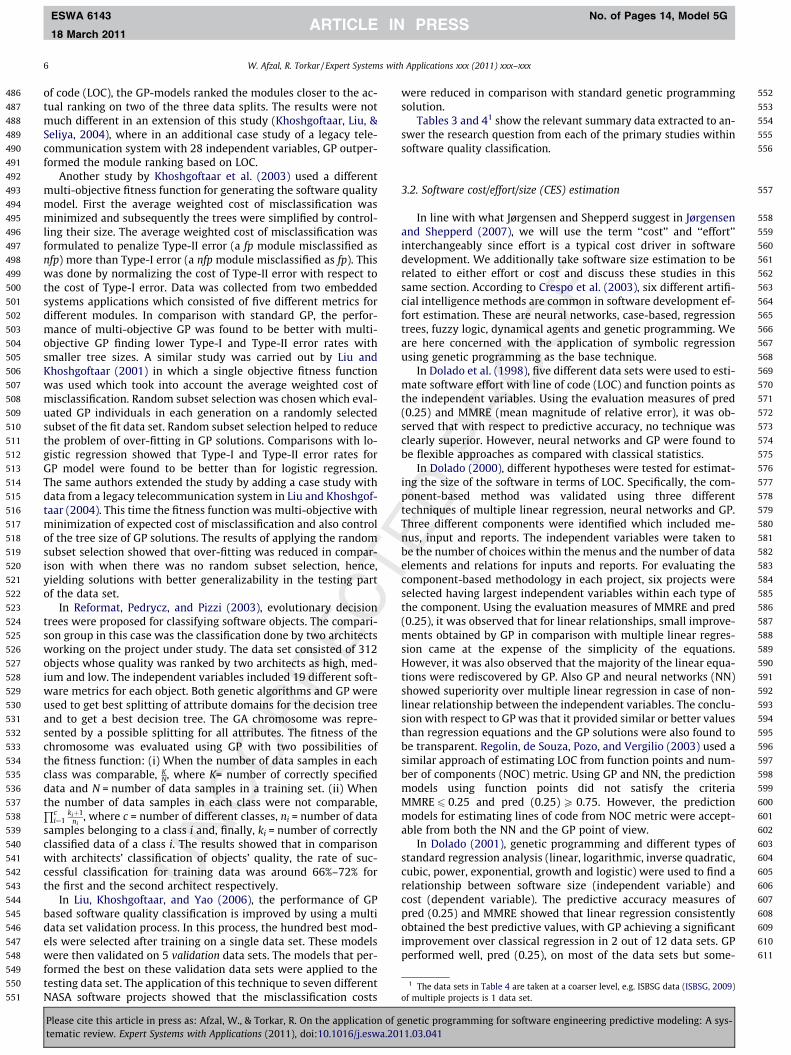
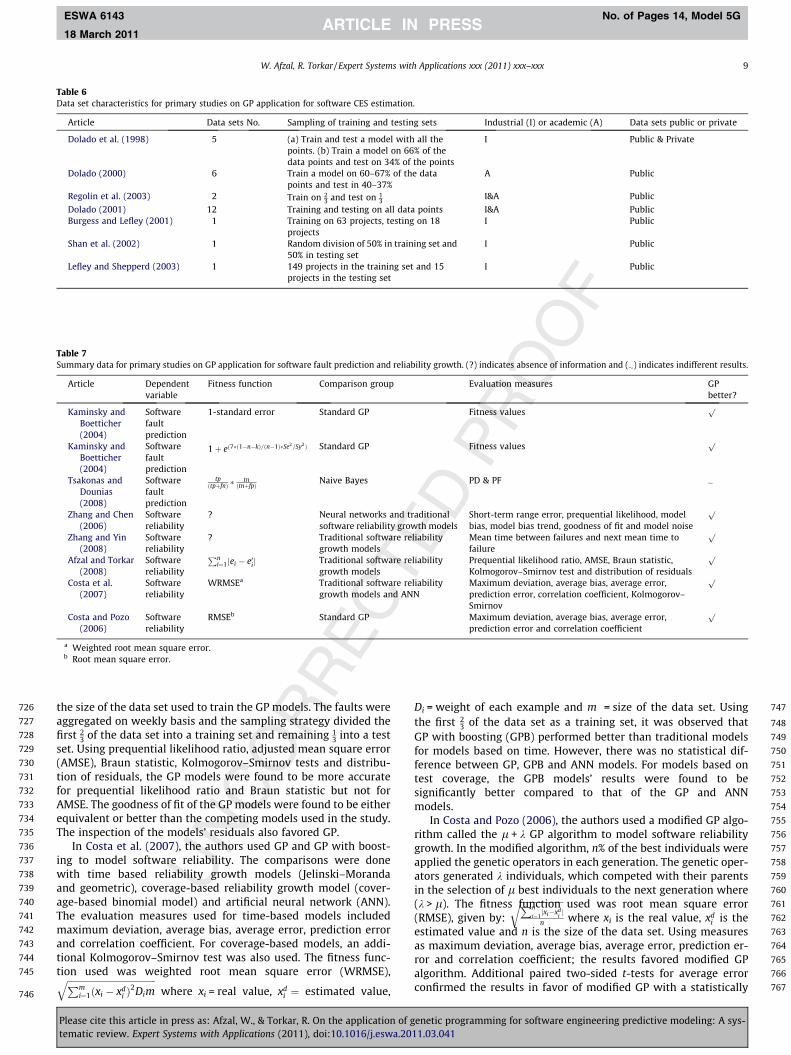
Tables 3 and 41 show the relevant summary data extracted to an-swer the research question from each of the primary studies withinsoftware quality classification.
3.2. Software cost/effort/size (CES) estimation
In line with what Jørgensen and Shepperd suggest in Jørgensenand Shepperd (2007), we will use the term ‘‘cost’’ and ‘‘effort’’interchangeably since effort is a typical cost driver in softwaredevelopment. We additionally take software size estimation to berelated to either effort or cost and discuss these studies in thissame section. According to Crespo et al. (2003), six different artifi-cial intelligence methods are common in software development ef-fort estimation. These are neural networks, case-based, regressiontrees, fuzzy logic, dynamical agents and genetic programming. Weare here concerned with the application of symbolic regressionusing genetic programming as the base technique.
In Dolado et al. (1998), five different data sets were used to esti-mate software effort with line of code (LOC) and function points asthe independent variables. Using the evaluation measures of pred(0.25) and MMRE (mean magnitude of relative error), it was ob-served that with respect to predictive accuracy, no technique wasclearly superior. However, neural networks and GP were found tobe flexible approaches as compared with classical statistics.
In Dolado (2000), different hypotheses were tested for estimat-ing the size of the software in terms of LOC. Specifically, the com-ponent-based method was validated using three differenttechniques of multiple linear regression, neural networks and GP.Three different components were identified which included me-nus, input and reports. The independent variables were taken tobe the number of choices within the menus and the number of dataelements and relations for inputs and reports. For evaluating thecomponent-based methodology in each project, six projects wereselected having largest independent variables within each type ofthe component. Using the evaluation measures of MMRE and pred(0.25), it was observed that for linear relationships, small improve-ments obtained by GP in comparison with multiple linear regres-sion came at the expense of the simplicity of the equations.However, it was also observed that the majority of the linear equa-tions were rediscovered by GP. Also GP and neural networks (NN)showed superiority over multiple linear regression in case of non-linear relationship between the independent variables. The conclu-sion with respect to GP was that it provided similar or better valuesthan regression equations and the GP solutions were also found tobe transparent. Regolin, de Souza, Pozo, and Vergilio (2003) used asimilar approach of estimating LOC from function points and num-ber of components (NOC) metric. Using GP and NN, the predictionmodels using function points did not satisfy the criteriaMMRE6 0.25 and pred (0.25) P 0.75. However, the predictionmodels for estimating lines of code from NOC metric were accept-able from both the NN and the GP point of view.
In Dolado (2001), genetic programming and different types ofstandard regression analysis (linear, logarithmic, inverse quadratic,cubic, power, exponential, growth and logistic) were used to find arelationship between software size (independent variable) andcost (dependent variable). The predictive accuracy measures ofpred (0.25) and MMRE showed that linear regression consistentlyobtained the best predictive values, with GP achieving a significantimprovement over classical regression in 2 out of 12 data sets. GPperformed well, pred (0.25), on most of the data sets but some-
enetic programming for software engineering predictive modeling: A sys-11.03.041
612
613
614
615
616
617
618
619
620
621
622
623
624
625
626
627
628
629
630
631
632
633
634
635
636
637
638
639
640
641
642
643
644
645
646
647
648
Table 3Summary data for primary studies on GP application for software quality classification. (?) indicates absence of information and (�) indicates indifferent results.
Article Dependent variable Fitness function Comparison group Evaluation measures GPbetter?
Robinson and McIlroy(1995)
Fault proneness basedon number of faults
Minimization of root mean square Neural networks, k-nearestneighbor, linear regression
Accuracy & coverage �
Khoshgoftaar et al.(2003)
Fault proneness basedon number of faults
Minimization of average cost ofmisclassification and minimization oftree size
Standard GP Type I, Type II and overall errorrates
p
Liu and Khoshgoftaar(2001)
Fault proneness basedon number of faults
Minimization of the average cost ofmisclassification
Logistic regression Type I, Type II and overall errorrates
p
Khoshgoftaar et al.(2004)
Number of faults foreach software module
Maximization of the best percentageof actual faults averaged over thepercentiles level of interest andcontrolling the tree size
Ranking based on lines ofcode
Number of faults accounted bydifferent cut-off percentiles
p
Khoshgoftaar et al.(2004)
Number of faults foreach software module
Maximization of the best percentageof actual faults averaged over thepercentiles level of interest andcontrolling the tree size
Ranking based on lines ofcode
Number of faults accounted bydifferent cut-off percentiles
p
Liu and Khoshgoftaar(2004)
Fault proneness basedon number of faults
Minimization of expected cost ofmisclassification and controlling thetree size
Standard GP Number of over-fitting modelsand Type I, Type II error rates
p
Reformat et al. (2003) Ranking of object’squality
(a) KN (b)
Qci¼1
kiþ1ni
Quality ranking of an objectassessed by the architects
Rate of successful classificationfor training and testing set
�
Liu et al. (2006) Fault proneness basedon number of faults
Minimization of the expected cost ofmisclassification and controlling thetree size
Standard GP Type I and Type II error ratesp
Table 4Data set characteristics for primary studies on GP application for software quality classification. (?) indicates absence of information.
Article Data sets No. Sampling of training and testing sets Industrial (I) or academic (A) Data sets public or private
Robinson and McIlroy (1995) 1 103 records for training and 60 records fortesting
? Private
Khoshgoftaar et al. (2003) 1 Approximately 23 for training and the rest
for testing
I Private
Liu and Khoshgoftaar (2001) 1 Approximately 23 for training and the rest
for testing and random subset selection
I Private
Khoshgoftaar et al. (2004) 1 23 for training and the rest for testing, threesplits
I Private
Khoshgoftaar et al. (2004) 2 23 for training and the rest for testing, threesplits
I Private
Liu and Khoshgoftaar (2004) 1 Training on release 1 data set, testing onrelease 2,3,4 data sets
I Private
Reformat et al. (2003) 1 10-fold cross-validation I PrivateLiu et al. (2006) 7 1 training data set, 5 validation data sets
and 1 testing data setI Private
2 The data sets in Table 6 are taken at a coarser level, e.g. ISBSG data (ISBSG, 2009)
W. Afzal, R. Torkar / Expert Systems with Applications xxx (2011) xxx–xxx 7
ESWA 6143 No. of Pages 14, Model 5G
18 March 2011
times at the expense of MMRE. This also indicated the potentialexistence of over-fitting in GP solutions. It was also found that sizealone as an independent variable for predicting software cost is notenough since it did not define the types of economies of scale ormarginal return with clarity.
The study by Burgess and Lefley (2001) extends the previousstudy from Dolado (2001) by using 9 independent variables to pre-dict the dependent variable of effort measured in person hours.Using the Desharnais data set of 81 software projects, the studyshowed that GP is consistently more accurate for MMRE but notfor adjusted mean square error (AMSE), pred (0.25) and balancedmean magnitude of relative error (BMMRE). The study concludedthat while GP and NN can provide better accuracy, they requiredmore effort in setting up and training.
In Shan, McKay, Lokan, and Essam (2002) the authors usedgrammar-guided GP on 423 projects from release 7 of the ISBSG(The International Software Benchmarking Standards Group Lim-ited (ISBSG, 2009)) data set to predict software project effort. Theevaluation measures used were R-squared, MSE, MMRE, pred(0.25) and pred (0.5). In comparison with linear and log–log regres-
Please cite this article in press as: Afzal, W., & Torkar, R. On the application of gtematic review. Expert Systems with Applications (2011), doi:10.1016/j.eswa.20
sion, the study showed that GP was far more accurate than simplelinear regression. With respect to MMRE, log–log regression wasbetter than GP which led to the conclusion that GP maximizesone evaluation criterion at the expense of the other. The studyshowed that grammar guided GP provides both a way to representsyntactical constraints on the solutions and a mechanism to incor-porate domain knowledge to guide the search process.
Lefley and Shepperd (2003) used several independent variablesfrom 407 cases to predict the total project effort comparing GP,ANN, least squares regression, nearest neighbor and random selec-tion of project effort. With respect to the accuracy of the predic-tions, GP achieved the best level of accuracy the most often,although GP was found hard to configure and the resulting modelscould be more complex.
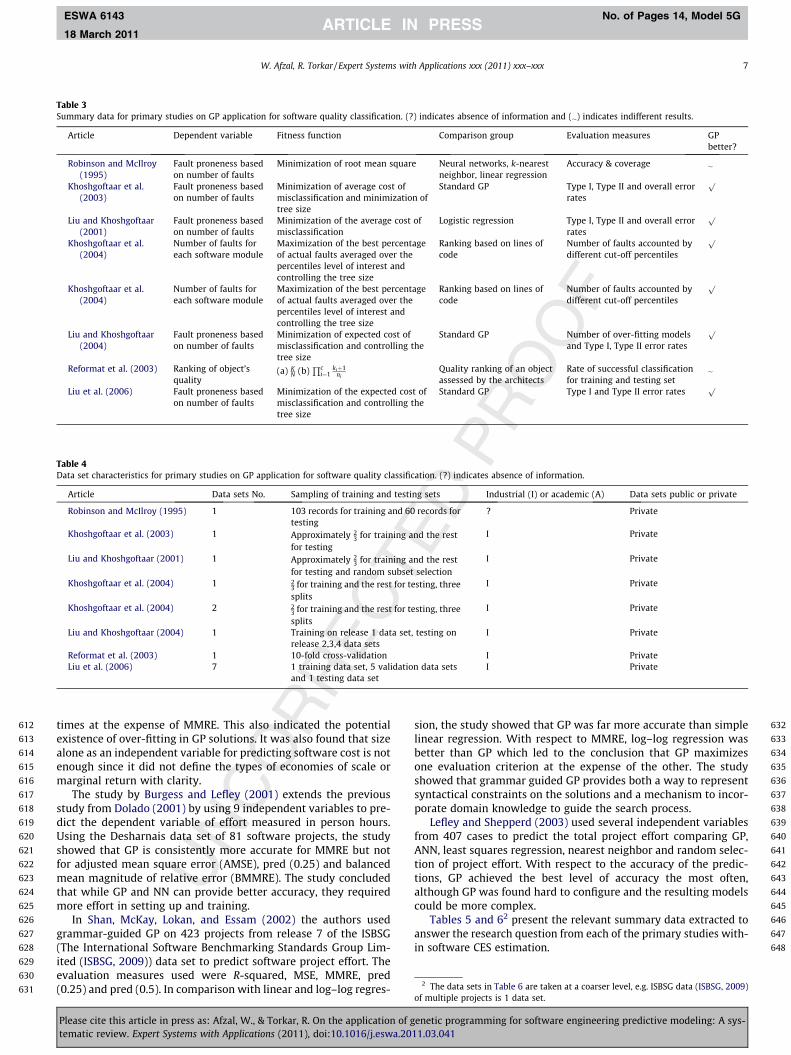
Tables 5 and 62 present the relevant summary data extracted toanswer the research question from each of the primary studies with-in software CES estimation.
of multiple projects is 1 data set.
enetic programming for software engineering predictive modeling: A sys-11.03.041
649
650
651
652
653
654
655
656
657
658
659
660
661
662
663
664
665
666
667
668
669
670
671
672
673
674
675
676
677
678
679
680
681
682
683
684
685
686
687
688
689
690
691
692
693
694
695
696
697
698
699
700
701
702
703
704
705
706
707
708
709
710
711
712
713
714
715
716
717
718
719
720
721
722
723
724
725
Table 5Summary data for primary studies on GP application for software CES estimation. (�) indicates indifferent results.
Article Dependentvariable
Fitnessfunction
Comparison group Evaluation measures GPbetter?
Dolado et al. (1998) Softwareeffort
Meansquarederror
Neural networks & linearregression
pred (0.25)a and MMREb�
Dolado (2000) Softwaresize
Meansquarederror
Neural networks & multiple linearregression
pred (0.25) and MMRE �
Regolin et al. (2003) Softwaresize
MMRE Neural networks pred (0.25) and MMRE �
Dolado (2001) Softwarecost
Meansquareerror
Linear, logarithmic, inversequadratic, cubic, power,exponential, growth and logisticregression
pred (0.25) and MMRE �
Burgess and Lefley (2001) Softwareeffort
MMRE Neural networks MMRE, AMSEc, pred (0.25), BMMREd�
Shan et al. (2002) Softwareeffort
Meansquareerror
Linear regression, log–logregression
R-squarede, MMRE, pred (0.25) and pred (0.5) �
Lefley and Shepperd (2003) Softwareeffort
? ANN, least squares regression,nearest neighbor and randomselection of project effort
Pearson correlation coefficient of actual and predicted,AMSE, pred (0.25), MMRE, BMMRE, worst case error, theease of set up and the explanatory value
�
a Prediction at level 0.25.b Mean magnitude of relative error.c Adjusted mean magnitude of relative error.d Balanced mean magnitude of relative error.e Coefficient of multiple determination.
8 W. Afzal, R. Torkar / Expert Systems with Applications xxx (2011) xxx–xxx
ESWA 6143 No. of Pages 14, Model 5G
18 March 2011
3.3. Software fault prediction and reliability growth
Apart from studies on software quality classification (Section3.1), where the program modules are classified as being either fpor nfp, there are studies which are concerned with prediction ofeither the fault content or software reliability growth.
In Kaminsky and Boetticher (2004) the authors proposed theincorporation of existing equations as a way to include domainknowledge for improving the standard GP algorithm for softwarefault prediction. They specifically used Akiyama’s equations (Akiy-ama, 1971), Halstead’s equation (Halstead, 1977), Lipow’s equation(Lipow, 1982), Gaffney’s equation (Gaffney, 1984) and Compton’sequation (Compton & Withrow, 1990) to add domain knowledgeto a simple GP algorithm which is based on mathematical opera-tors. Using the fitness function (1-standard error), six experimentswere performed using a NASA data set of 379 C functions. Five ofthese experiments compared standard GP with GP enhanced withAkiyama’s, Halstead’s, Lipow’s, Gaffney’s and Compton’s equations.The last experiment compared standard GP with GP enhanced withall these equations simultaneously. The results showed that byincluding explicit knowledge in the GP solutions, the fitness valuesfor the GP solutions increased.
In another study, Kaminsky and Boetticher (2004), the sameauthors used another approach called data equalization to com-pensate for data skewness. Specifically, duplicates of interestingtraining instances (in this case functions with greater than zerofaults) were added to the training set until the total reached thefrequency of most occurring instance (in this case functions withzero faults). The fitness function used was: 1þ eð7�ð1�n�kÞ=
ðn� 1Þ � Se2=Sy2Þ, where k = number of inputs, n = number of validresults, Se = standard error and Sy = standard deviation. Using thesame data sets as before, the experimental results showed thatthe average fitness values for the equalized data set were betterthan for the original data set.
In Tsakonas and Dounias (2008), grammar-guided GP was usedon NASA’s data set consisting of four projects to measure the prob-ability of detection, PD (the ratio of faulty modules found to allknown faulty modules) and false alarm rate, PF (the ratio of num-ber of non-faulty modules misclassified as faulty to all known non-
Please cite this article in press as: Afzal, W., & Torkar, R. On the application of gtematic review. Expert Systems with Applications (2011), doi:10.1016/j.eswa.20
faulty modules). The fitness function represented the coverage ofknowledge represented in the individual, and equaled
tpðtpþfnÞ � tn
ðtnþfpÞ where fp is the number of false positives, tp the num-ber of true positives, tn the number of true negatives and fn thenumber of false negatives. The study showed that grammar-guidedGP performed better than naive Bayes on both measures (PD andPF) in two of the projects’ data while in the rest of the two data,it was better in one of the two measures.
We were also able to find a series of studies where the compar-ison group included traditional software reliability growth models.
Zhang and Chen (2006) used mean time between failures(MTBF) time series to model software reliability growth using ge-netic programming, neural networks (NN) and traditional softwarereliability models, i.e. Schick–Wolverton, Goel–Okumoto, Jelinki–Moranda and Moranda. Using multiple evaluation measures ofshort-term range error, prequential likelihood, model bias, modelbias trend, goodness of fit and model noise; the GP approach wasfound better than the traditional software reliability growth mod-els. However, it is not clear from the study how neural networksperformed against all the evaluation measures (except for theshort-term range error where GP was better than neural net-works). Also it is not clear from the study what sampling strategywas used to split the data set into training and testing set. The fit-ness function information is also lacking from the study. The studyis however extended in Zhang and Yin (2008) with adaptive cross-over and mutation probabilities, and the corresponding GP wasnamed adaptive genetic programming. In comparison with stan-dard GP and the same reliability growth models (as used in theprevious study), the mean time between failures (MTBF) and thenext mean time to failure (MTTF) values for adaptive GP werefound to be more accurate.
Afzal and Torkar (2008) used fault data from three industrialsoftware projects to predict the software reliability in terms ofnumber of faults. Three traditional software reliability growthmodels (Goel–Okumoto, Brooks and Motley, and Yamada’s S-shaped) were chosen for comparison using the fitness function ofsum of absolute differences between the obtained and expected re-sults in all fitness cases,
Pni¼1jei � e0ij, where ei is the actual fault
count data, e0i the estimated value of the fault count data and n
enetic programming for software engineering predictive modeling: A sys-11.03.041
726
727
728
729
730
731
732
733
734
735
736
737
738
739
740
741
742
743
744
745
746
747
748
749
750
751
752
753
754
755
756
757
758
759
760
761
762
763
764
765
766
767
Table 6Data set characteristics for primary studies on GP application for software CES estimation.
Article Data sets No. Sampling of training and testing sets Industrial (I) or academic (A) Data sets public or private
Dolado et al. (1998) 5 (a) Train and test a model with all thepoints. (b) Train a model on 66% of thedata points and test on 34% of the points
I Public & Private
Dolado (2000) 6 Train a model on 60–67% of the datapoints and test in 40–37%
A Public
Regolin et al. (2003) 2 Train on 23 and test on 1
3I&A Public
Dolado (2001) 12 Training and testing on all data points I&A PublicBurgess and Lefley (2001) 1 Training on 63 projects, testing on 18
projectsI Public
Shan et al. (2002) 1 Random division of 50% in training set and50% in testing set
I Public
Lefley and Shepperd (2003) 1 149 projects in the training set and 15projects in the testing set
I Public
Table 7Summary data for primary studies on GP application for software fault prediction and reliability growth. (?) indicates absence of information and (�) indicates indifferent results.
Article Dependentvariable
Fitness function Comparison group Evaluation measures GPbetter?
Kaminsky andBoetticher(2004)
Softwarefaultprediction
1-standard error Standard GP Fitness valuesp
Kaminsky andBoetticher(2004)
Softwarefaultprediction
1þ eð7�ð1�n�kÞ=ðn�1Þ�Se2=Sy2Þ Standard GP Fitness valuesp
Tsakonas andDounias(2008)
Softwarefaultprediction
tpðtpþfnÞ �
tnðtnþfpÞ
Naive Bayes PD & PF �
Zhang and Chen(2006)
Softwarereliability
? Neural networks and traditionalsoftware reliability growth models
Short-term range error, prequential likelihood, modelbias, model bias trend, goodness of fit and model noise
p
Zhang and Yin(2008)
Softwarereliability
? Traditional software reliabilitygrowth models
Mean time between failures and next mean time tofailure
p
Afzal and Torkar(2008)
Softwarereliability
Pni¼1jei � e0ij Traditional software reliability
growth modelsPrequential likelihood ratio, AMSE, Braun statistic,Kolmogorov–Smirnov test and distribution of residuals
p
Costa et al.(2007)
Softwarereliability
WRMSEa Traditional software reliabilitygrowth models and ANN
Maximum deviation, average bias, average error,prediction error, correlation coefficient, Kolmogorov–Smirnov
p
Costa and Pozo(2006)
Softwarereliability
RMSEb Standard GP Maximum deviation, average bias, average error,prediction error and correlation coefficient
p
a Weighted root mean square error.b Root mean square error.
W. Afzal, R. Torkar / Expert Systems with Applications xxx (2011) xxx–xxx 9
ESWA 6143 No. of Pages 14, Model 5G
18 March 2011
the size of the data set used to train the GP models. The faults wereaggregated on weekly basis and the sampling strategy divided thefirst 2
3 of the data set into a training set and remaining 13 into a test
set. Using prequential likelihood ratio, adjusted mean square error(AMSE), Braun statistic, Kolmogorov–Smirnov tests and distribu-tion of residuals, the GP models were found to be more accuratefor prequential likelihood ratio and Braun statistic but not forAMSE. The goodness of fit of the GP models were found to be eitherequivalent or better than the competing models used in the study.The inspection of the models’ residuals also favored GP.
In Costa et al. (2007), the authors used GP and GP with boost-ing to model software reliability. The comparisons were donewith time based reliability growth models (Jelinski–Morandaand geometric), coverage-based reliability growth model (cover-age-based binomial model) and artificial neural network (ANN).The evaluation measures used for time-based models includedmaximum deviation, average bias, average error, prediction errorand correlation coefficient. For coverage-based models, an addi-tional Kolmogorov–Smirnov test was also used. The fitness func-tion used was weighted root mean square error (WRMSE),ffiffiffiffiffiffiffiffiffiffiffiffiffiffiffiffiffiffiffiffiffiffiffiffiffiffiffiffiffiffiffiffiffiffiffiffiffiffiffiPm
i¼1ðxi � xdi Þ
2Dimq
where xi = real value, xdi ¼ estimated value,
Please cite this article in press as: Afzal, W., & Torkar, R. On the application of gtematic review. Expert Systems with Applications (2011), doi:10.1016/j.eswa.20
Di = weight of each example and m = size of the data set. Usingthe first 2
3 of the data set as a training set, it was observed thatGP with boosting (GPB) performed better than traditional modelsfor models based on time. However, there was no statistical dif-ference between GP, GPB and ANN models. For models based ontest coverage, the GPB models’ results were found to besignificantly better compared to that of the GP and ANNmodels.
In Costa and Pozo (2006), the authors used a modified GP algo-rithm called the l + k GP algorithm to model software reliabilitygrowth. In the modified algorithm, n% of the best individuals wereapplied the genetic operators in each generation. The genetic oper-ators generated k individuals, which competed with their parentsin the selection of l best individuals to the next generation where(k > l). The fitness function used was root mean square error(RMSE), given by:
ffiffiffiffiffiffiffiffiffiffiffiffiffiffiffiffiffiffiffiPn
i¼1jxi�xd
ij
n
rwhere xi is the real value, xd
i is theestimated value and n is the size of the data set. Using measuresas maximum deviation, average bias, average error, prediction er-ror and correlation coefficient; the results favored modified GPalgorithm. Additional paired two-sided t-tests for average errorconfirmed the results in favor of modified GP with a statistically
enetic programming for software engineering predictive modeling: A sys-11.03.041
768
769
770
771
772
773
774
775
776
777
778
779
780
781
782
783
784
785
786
787
788
789
790
791
792
793
794
795
796
797
798
799
800
801
802
803
804
805
806
807
808
809
810
811
812
813
814
815
816
817
Table 8Data set characteristics for primary studies on GP application for software fault prediction and reliability growth. (?) indicates absence of information.
Article Data sets No. Sampling of training and testing sets Industrial (I) or academic (A) Data sets public or private
Kaminsky and Boetticher(2004)
1 ? I Public
Kaminsky and Boetticher(2004)
1 ? I Public
Tsakonas and Dounias (2008) 1 10-fold cross-validation I PublicZhang and Chen (2006) 1 ? I PrivateZhang and Yin (2008) 1 ? I PrivateAfzal and Torkar (2008) 3 First 2
3 of the data set for training and the rest for testing I Private
Costa et al. (2007) 2 First 23 of the data set for training and the rest for testing I Public & Private
Costa and Pozo (2006) 1 First 23 of the data set for training and the rest for testing I Public
10 W. Afzal, R. Torkar / Expert Systems with Applications xxx (2011) xxx–xxx
ESWA 6143 No. of Pages 14, Model 5G
18 March 2011
significant difference in the majority of the results between themodified and standard GP algorithm.
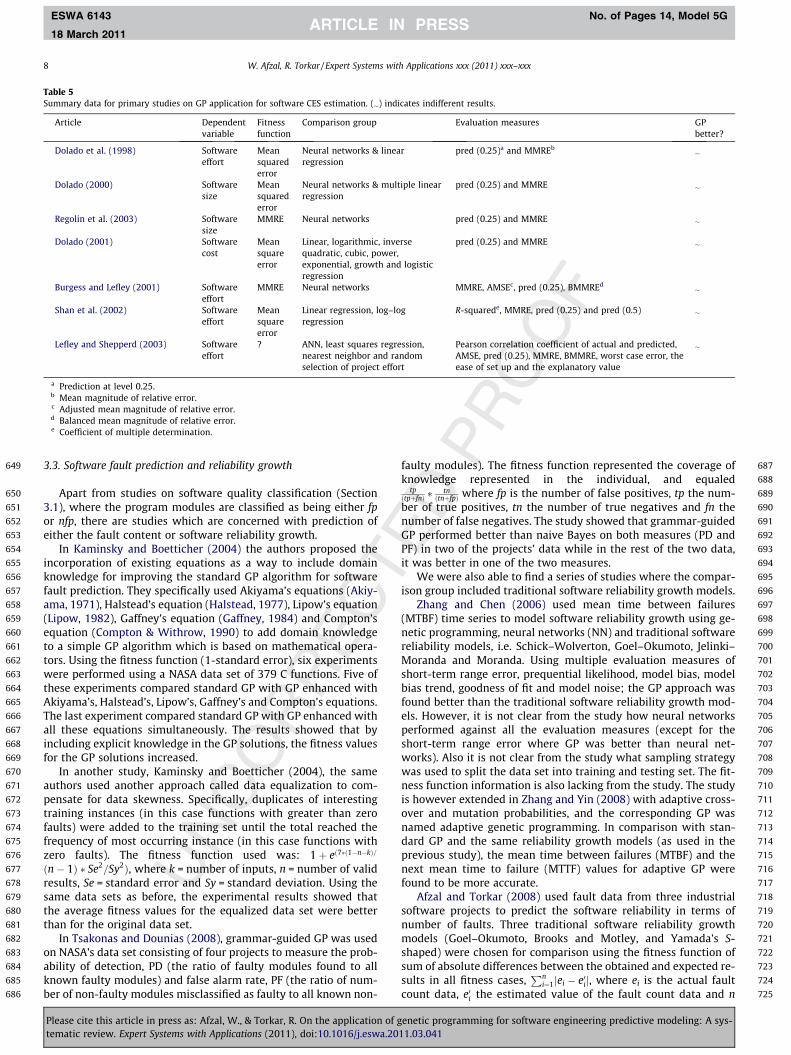
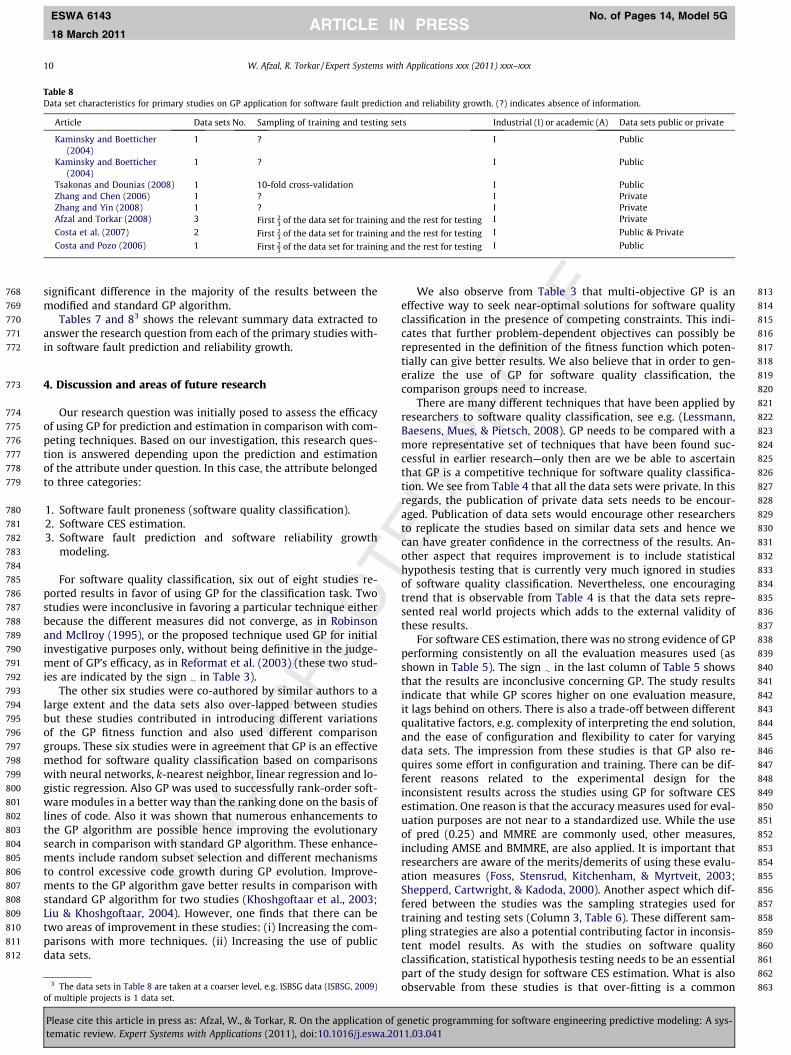
Tables 7 and 83 shows the relevant summary data extracted toanswer the research question from each of the primary studies with-in software fault prediction and reliability growth.
818
819
820
821
822
823
824
825
826
827
828
829
830
831
832
833
834
835
836
837
838
839
840
841
842
843
844
845
846
847
848
849
850
851
852
853
854
855
856
857
858
859
860
861
4. Discussion and areas of future research
Our research question was initially posed to assess the efficacyof using GP for prediction and estimation in comparison with com-peting techniques. Based on our investigation, this research ques-tion is answered depending upon the prediction and estimationof the attribute under question. In this case, the attribute belongedto three categories:
1. Software fault proneness (software quality classification).2. Software CES estimation.3. Software fault prediction and software reliability growth
modeling.
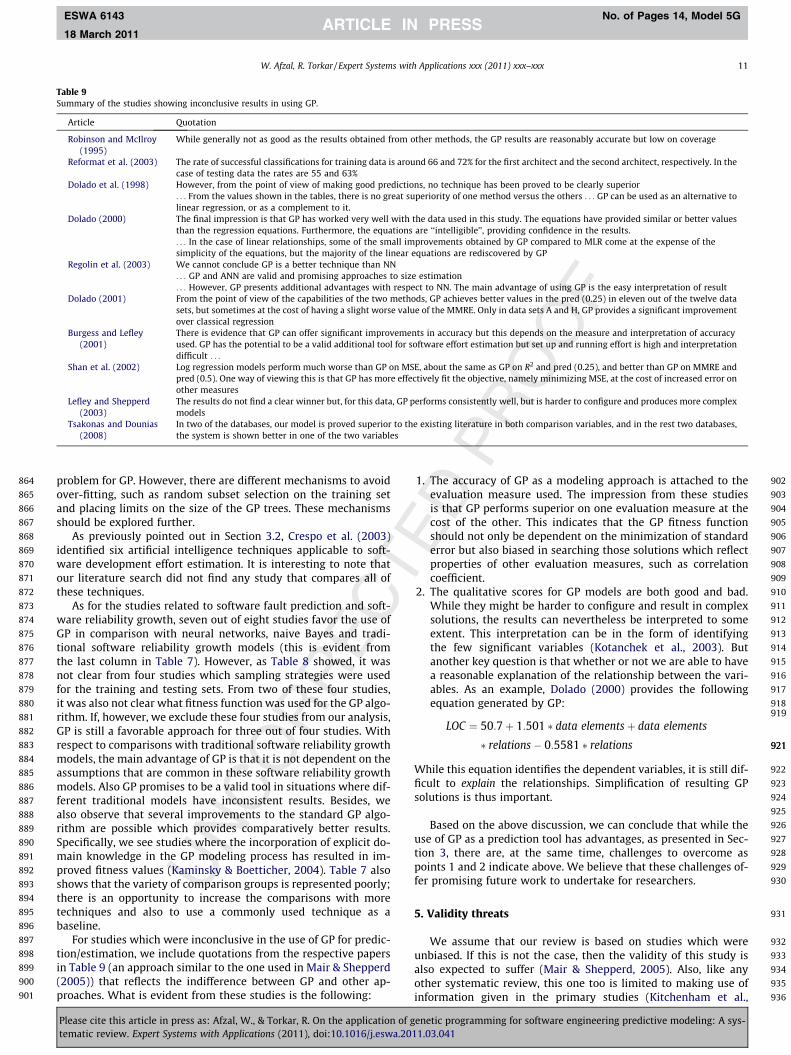
For software quality classification, six out of eight studies re-ported results in favor of using GP for the classification task. Twostudies were inconclusive in favoring a particular technique eitherbecause the different measures did not converge, as in Robinsonand McIlroy (1995), or the proposed technique used GP for initialinvestigative purposes only, without being definitive in the judge-ment of GP’s efficacy, as in Reformat et al. (2003) (these two stud-ies are indicated by the sign � in Table 3).
The other six studies were co-authored by similar authors to alarge extent and the data sets also over-lapped between studiesbut these studies contributed in introducing different variationsof the GP fitness function and also used different comparisongroups. These six studies were in agreement that GP is an effectivemethod for software quality classification based on comparisonswith neural networks, k-nearest neighbor, linear regression and lo-gistic regression. Also GP was used to successfully rank-order soft-ware modules in a better way than the ranking done on the basis oflines of code. Also it was shown that numerous enhancements tothe GP algorithm are possible hence improving the evolutionarysearch in comparison with standard GP algorithm. These enhance-ments include random subset selection and different mechanismsto control excessive code growth during GP evolution. Improve-ments to the GP algorithm gave better results in comparison withstandard GP algorithm for two studies (Khoshgoftaar et al., 2003;Liu & Khoshgoftaar, 2004). However, one finds that there can betwo areas of improvement in these studies: (i) Increasing the com-parisons with more techniques. (ii) Increasing the use of publicdata sets.
862
8633 The data sets in Table 8 are taken at a coarser level, e.g. ISBSG data (ISBSG, 2009)of multiple projects is 1 data set.
Please cite this article in press as: Afzal, W., & Torkar, R. On the application of gtematic review. Expert Systems with Applications (2011), doi:10.1016/j.eswa.20
We also observe from Table 3 that multi-objective GP is aneffective way to seek near-optimal solutions for software qualityclassification in the presence of competing constraints. This indi-cates that further problem-dependent objectives can possibly berepresented in the definition of the fitness function which poten-tially can give better results. We also believe that in order to gen-eralize the use of GP for software quality classification, thecomparison groups need to increase.
There are many different techniques that have been applied byresearchers to software quality classification, see e.g. (Lessmann,Baesens, Mues, & Pietsch, 2008). GP needs to be compared with amore representative set of techniques that have been found suc-cessful in earlier research—only then are we be able to ascertainthat GP is a competitive technique for software quality classifica-tion. We see from Table 4 that all the data sets were private. In thisregards, the publication of private data sets needs to be encour-aged. Publication of data sets would encourage other researchersto replicate the studies based on similar data sets and hence wecan have greater confidence in the correctness of the results. An-other aspect that requires improvement is to include statisticalhypothesis testing that is currently very much ignored in studiesof software quality classification. Nevertheless, one encouragingtrend that is observable from Table 4 is that the data sets repre-sented real world projects which adds to the external validity ofthese results.
For software CES estimation, there was no strong evidence of GPperforming consistently on all the evaluation measures used (asshown in Table 5). The sign � in the last column of Table 5 showsthat the results are inconclusive concerning GP. The study resultsindicate that while GP scores higher on one evaluation measure,it lags behind on others. There is also a trade-off between differentqualitative factors, e.g. complexity of interpreting the end solution,and the ease of configuration and flexibility to cater for varyingdata sets. The impression from these studies is that GP also re-quires some effort in configuration and training. There can be dif-ferent reasons related to the experimental design for theinconsistent results across the studies using GP for software CESestimation. One reason is that the accuracy measures used for eval-uation purposes are not near to a standardized use. While the useof pred (0.25) and MMRE are commonly used, other measures,including AMSE and BMMRE, are also applied. It is important thatresearchers are aware of the merits/demerits of using these evalu-ation measures (Foss, Stensrud, Kitchenham, & Myrtveit, 2003;Shepperd, Cartwright, & Kadoda, 2000). Another aspect which dif-fered between the studies was the sampling strategies used fortraining and testing sets (Column 3, Table 6). These different sam-pling strategies are also a potential contributing factor in inconsis-tent model results. As with the studies on software qualityclassification, statistical hypothesis testing needs to be an essentialpart of the study design for software CES estimation. What is alsoobservable from these studies is that over-fitting is a common
enetic programming for software engineering predictive modeling: A sys-11.03.041
864
865
866
867
868
869
870
871
872
873
874
875
876
877
878
879
880
881
882
883
884
885
886
887
888
889
890
891
892
893
894
895
896
897
898
899
900
901
902
903
904
905
906
907
908
909
910
911
912
913
914
915
916
917
918919
921921
922
923
924
925
926
927
928
929
930
931
932
933
934
935
936
Table 9Summary of the studies showing inconclusive results in using GP.
Article Quotation
Robinson and McIlroy(1995)
While generally not as good as the results obtained from other methods, the GP results are reasonably accurate but low on coverage
Reformat et al. (2003) The rate of successful classifications for training data is around 66 and 72% for the first architect and the second architect, respectively. In thecase of testing data the rates are 55 and 63%
Dolado et al. (1998) However, from the point of view of making good predictions, no technique has been proved to be clearly superior. . . From the values shown in the tables, there is no great superiority of one method versus the others . . . GP can be used as an alternative tolinear regression, or as a complement to it.
Dolado (2000) The final impression is that GP has worked very well with the data used in this study. The equations have provided similar or better valuesthan the regression equations. Furthermore, the equations are ‘‘intelligible’’, providing confidence in the results.. . . In the case of linear relationships, some of the small improvements obtained by GP compared to MLR come at the expense of thesimplicity of the equations, but the majority of the linear equations are rediscovered by GP
Regolin et al. (2003) We cannot conclude GP is a better technique than NN. . . GP and ANN are valid and promising approaches to size estimation. . . However, GP presents additional advantages with respect to NN. The main advantage of using GP is the easy interpretation of result
Dolado (2001) From the point of view of the capabilities of the two methods, GP achieves better values in the pred (0.25) in eleven out of the twelve datasets, but sometimes at the cost of having a slight worse value of the MMRE. Only in data sets A and H, GP provides a significant improvementover classical regression
Burgess and Lefley(2001)
There is evidence that GP can offer significant improvements in accuracy but this depends on the measure and interpretation of accuracyused. GP has the potential to be a valid additional tool for software effort estimation but set up and running effort is high and interpretationdifficult . . .
Shan et al. (2002) Log regression models perform much worse than GP on MSE, about the same as GP on R2 and pred (0.25), and better than GP on MMRE andpred (0.5). One way of viewing this is that GP has more effectively fit the objective, namely minimizing MSE, at the cost of increased error onother measures
Lefley and Shepperd(2003)
The results do not find a clear winner but, for this data, GP performs consistently well, but is harder to configure and produces more complexmodels
Tsakonas and Dounias(2008)
In two of the databases, our model is proved superior to the existing literature in both comparison variables, and in the rest two databases,the system is shown better in one of the two variables
W. Afzal, R. Torkar / Expert Systems with Applications xxx (2011) xxx–xxx 11
ESWA 6143 No. of Pages 14, Model 5G
18 March 2011
problem for GP. However, there are different mechanisms to avoidover-fitting, such as random subset selection on the training setand placing limits on the size of the GP trees. These mechanismsshould be explored further.
As previously pointed out in Section 3.2, Crespo et al. (2003)identified six artificial intelligence techniques applicable to soft-ware development effort estimation. It is interesting to note thatour literature search did not find any study that compares all ofthese techniques.
As for the studies related to software fault prediction and soft-ware reliability growth, seven out of eight studies favor the use ofGP in comparison with neural networks, naive Bayes and tradi-tional software reliability growth models (this is evident fromthe last column in Table 7). However, as Table 8 showed, it wasnot clear from four studies which sampling strategies were usedfor the training and testing sets. From two of these four studies,it was also not clear what fitness function was used for the GP algo-rithm. If, however, we exclude these four studies from our analysis,GP is still a favorable approach for three out of four studies. Withrespect to comparisons with traditional software reliability growthmodels, the main advantage of GP is that it is not dependent on theassumptions that are common in these software reliability growthmodels. Also GP promises to be a valid tool in situations where dif-ferent traditional models have inconsistent results. Besides, wealso observe that several improvements to the standard GP algo-rithm are possible which provides comparatively better results.Specifically, we see studies where the incorporation of explicit do-main knowledge in the GP modeling process has resulted in im-proved fitness values (Kaminsky & Boetticher, 2004). Table 7 alsoshows that the variety of comparison groups is represented poorly;there is an opportunity to increase the comparisons with moretechniques and also to use a commonly used technique as abaseline.
For studies which were inconclusive in the use of GP for predic-tion/estimation, we include quotations from the respective papersin Table 9 (an approach similar to the one used in Mair & Shepperd(2005)) that reflects the indifference between GP and other ap-proaches. What is evident from these studies is the following:
Please cite this article in press as: Afzal, W., & Torkar, R. On the application of gtematic review. Expert Systems with Applications (2011), doi:10.1016/j.eswa.20
1. The accuracy of GP as a modeling approach is attached to theevaluation measure used. The impression from these studiesis that GP performs superior on one evaluation measure at thecost of the other. This indicates that the GP fitness functionshould not only be dependent on the minimization of standarderror but also biased in searching those solutions which reflectproperties of other evaluation measures, such as correlationcoefficient.
2. The qualitative scores for GP models are both good and bad.While they might be harder to configure and result in complexsolutions, the results can nevertheless be interpreted to someextent. This interpretation can be in the form of identifyingthe few significant variables (Kotanchek et al., 2003). Butanother key question is that whether or not we are able to havea reasonable explanation of the relationship between the vari-ables. As an example, Dolado (2000) provides the followingequation generated by GP:
enetic11.03.0
LOC ¼ 50:7þ 1:501 � data elementsþ data elements
� relations� 0:5581 � relations
While this equation identifies the dependent variables, it is still dif-ficult to explain the relationships. Simplification of resulting GPsolutions is thus important.
Based on the above discussion, we can conclude that while theuse of GP as a prediction tool has advantages, as presented in Sec-tion 3, there are, at the same time, challenges to overcome aspoints 1 and 2 indicate above. We believe that these challenges of-fer promising future work to undertake for researchers.
5. Validity threats
We assume that our review is based on studies which wereunbiased. If this is not the case, then the validity of this study isalso expected to suffer (Mair & Shepperd, 2005). Also, like anyother systematic review, this one too is limited to making use ofinformation given in the primary studies (Kitchenham et al.,
programming for software engineering predictive modeling: A sys-41
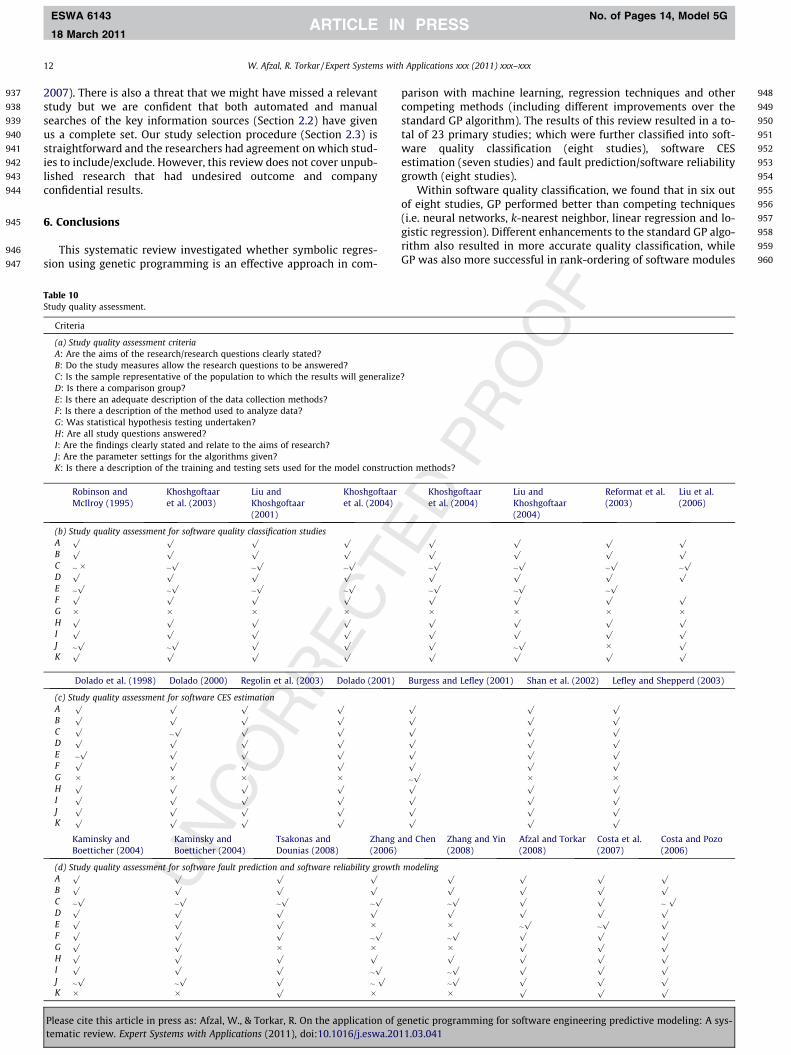
937
938
939
940
941
942
943
944
945
946
947
948
949
950
951
952
953
954
955
956
957
958
959
960
12 W. Afzal, R. Torkar / Expert Systems with Applications xxx (2011) xxx–xxx
ESWA 6143 No. of Pages 14, Model 5G
18 March 2011
2007). There is also a threat that we might have missed a relevantstudy but we are confident that both automated and manualsearches of the key information sources (Section 2.2) have givenus a complete set. Our study selection procedure (Section 2.3) isstraightforward and the researchers had agreement on which stud-ies to include/exclude. However, this review does not cover unpub-lished research that had undesired outcome and companyconfidential results.
6. Conclusions
This systematic review investigated whether symbolic regres-sion using genetic programming is an effective approach in com-
Table 10Study quality assessment.
Criteria
(a) Study quality assessment criteriaA: Are the aims of the research/research questions clearly stated?B: Do the study measures allow the research questions to be answered?C: Is the sample representative of the population to which the results will generalizeD: Is there a comparison group?E: Is there an adequate description of the data collection methods?F: Is there a description of the method used to analyze data?G: Was statistical hypothesis testing undertaken?H: Are all study questions answered?I: Are the findings clearly stated and relate to the aims of research?J: Are the parameter settings for the algorithms given?K: Is there a description of the training and testing sets used for the model construct
Robinson andMcIlroy (1995)
Khoshgoftaaret al. (2003)
Liu andKhoshgoftaar(2001)
Khoshgoftaaret al. (2004)
(b) Study quality assessment for software quality classification studiesA
p p p p
Bp p p p
C � � �p
�p
�p
Dp p p p
E �p
�p
�p
�p
Fp p p p
G � � � �H
p p p p
Ip p p p
J �p
�p p p
Kp p p p
Dolado et al. (1998) Dolado (2000) Regolin et al. (2003) Dolado (2001)
(c) Study quality assessment for software CES estimationA
p p p p
Bp p p p
Cp
�p p p
Dp p p p
E �p p p p
Fp p p p
G � � � �H
p p p p
Ip p p p
Jp p p p
Kp p p p
Kaminsky andBoetticher (2004)
Kaminsky andBoetticher (2004)
Tsakonas andDounias (2008)
Zhang a(2006)
(d) Study quality assessment for software fault prediction and software reliability growthA
p p p p
Bp p p p
C �p
�p
�p
�p
Dp p p p
Ep p p �
Fp p p
�p
Gp p � �
Hp p p p
Ip p p
�p
J �p
�p p
�p
K � � p �
Please cite this article in press as: Afzal, W., & Torkar, R. On the application of gtematic review. Expert Systems with Applications (2011), doi:10.1016/j.eswa.20
parison with machine learning, regression techniques and othercompeting methods (including different improvements over thestandard GP algorithm). The results of this review resulted in a to-tal of 23 primary studies; which were further classified into soft-ware quality classification (eight studies), software CESestimation (seven studies) and fault prediction/software reliabilitygrowth (eight studies).
Within software quality classification, we found that in six outof eight studies, GP performed better than competing techniques(i.e. neural networks, k-nearest neighbor, linear regression and lo-gistic regression). Different enhancements to the standard GP algo-rithm also resulted in more accurate quality classification, whileGP was also more successful in rank-ordering of software modules
?
ion methods?
Khoshgoftaaret al. (2004)
Liu andKhoshgoftaar(2004)
Reformat et al.(2003)
Liu et al.(2006)
p p p pp p p p
�p
�p
�p
�p
p p p p
�p
�p
�p
p p p p
� � � �p p p pp p p pp
�p � p
p p p p
Burgess and Lefley (2001) Shan et al. (2002) Lefley and Shepperd (2003)
p p pp p pp p pp p pp p pp p p
�p � �p p pp p pp p pp p p
nd Chen Zhang and Yin(2008)
Afzal and Torkar(2008)
Costa et al.(2007)
Costa and Pozo(2006)
modeling p p p pp p p p
�p p p
�p
p p p p
� �p
�p p
�p p p p
� p p pp p p p
�p p p p
�p p p p
� p p p
enetic programming for software engineering predictive modeling: A sys-11.03.041
961
962
963
964
965
966
967
968
969
970
971
972
973
974
975
976
977
978
979
980
981
982
983
984
985
986
987
988
989
990
991
992
993
994
995
996
997
998
999
1000
1001
1002
1003
1004
1005
1006
1007
1008
1009
1010
1011
1012
1013
1014
1015
1016
1017
1018
1019
1020
1021
1022
1023
1024
1025
1026
10271028102910301031103210331034103510361037103810391040104110421043104410451046104710481049105010511052105310541055105610571058105910601061106210631064106510661067106810691070107110721073107410751076107710781079108010811082108310841085108610871088108910901091109210931094109510961097109810991100110111021103
W. Afzal, R. Torkar / Expert Systems with Applications xxx (2011) xxx–xxx 13
ESWA 6143 No. of Pages 14, Model 5G
18 March 2011
in comparison with random ranking and ranking based on lines ofcode. We concluded that GP seems to be an effective method forsoftware quality classification. This is irrespective of the fact thatone author was part of seven out of nine primary studies and thefact that there was an overlap of data sets used across the studies.This is because we considered each of these primary studies repre-senting a distinct contribution in terms of different algorithmicvariations.
For software CES estimation, the study results were inconclu-sive in the use of GP as an effective approach. The main reasonbeing that GP optimizes one accuracy measure while degrades oth-ers. Also the experimental procedures among studies varied, withdifferent strategies used for sampling the training and testing sets.We were therefore inconclusive in judging whether or not GP is aneffective technique for software CES estimation.
The results for software fault prediction and software reliabil-ity growth modeling leaned towards the use of GP, with sevenout of eight studies resulting in GP performing better than neuralnetworks, naive Bayes and traditional software reliability growthmodels. Although four out of these eight studies lacked in someof the quality instruments used in Table 10 (Appendix A); stillthree out of the remaining four studies reported results in sup-port of GP. We therefore concluded that the current literatureprovides evidence in support of GP being an effective techniquefor software fault prediction and software reliability growthmodeling.
Based on the results of the primary studies, we can offer the fol-lowing recommendations. Some of these recommendations refer toother researchers’ guidelines which are useful to reiterate in thecontext of this study.
1. Use public data sets wherever possible. In case of private datasets, there are ways to transform the data sets to make it publicdomain (e.g., one such transformation is discussed in Wood(1996)).
2. Apply commonly used sampling strategies to help otherresearchers replicate, improve or refute the established predic-tions and estimations. From our sample of primary studies, thesampling strategy of 2
3 for training, remaining 13 for testing and
10-fold cross validation are mostly used. Kitchenham et al.(2007) recommends using a jackknife approach with leave-one-out cross-validation process for smaller data sets; thisneeds to be validated further.
3. Avoiding over-fitting in GP solutions is possible and is beneficialto increase the generalizability of model results in the testingdata set. The primary studies in this review offer importantresults in this regard.
4. Always report the settings used for the algorithmic parameters(also suggested in Barr, Golden, Kelly, Resende, & Junior (1995)).
5. Compare the performances against a comparison group that isboth commonly used and currently an active field of research.For our set of primary studies, comparisons against differentforms of statistical regression and artificial neural networkscan be seen as a baseline for comparisons.
6. Use statistical experimental design techniques to minimize thethreat of differences being caused by chance alone (Myrtveit &Stensrud, 1999).
7. Report the results even if there is no statistical differencebetween the quality of the solutions produced by differentmethods (Barr et al., 1995).
Acknowledgements
The authors thank Claes Wohlin for his comments on the earlierdrafts of the paper.
Please cite this article in press as: Afzal, W., & Torkar, R. On the application of gtematic review. Expert Systems with Applications (2011), doi:10.1016/j.eswa.20
Appendix A. Study quality assessment
See Table 10.
References
Abraham, A. (2008). Real time intrusion prediction, detection and preventionprograms. In 2008 IEEE international conference on intelligence and securityinformatics (ISI’08), Piscataway, NJ, USA.
Afzal, W., & Torkar, R. (2008). A comparative evaluation of using geneticprogramming for predicting fault count data. In Proceedings of the 3rdinternational conference on software engineering advances (ICSEA’08),Piscataway, NJ, United States.
Afzal, W., Torkar, R., & Feldt, R. (2009). A systematic review of search-based testingfor non-functional system properties. Information and Software Technology,51(6), 957–976.
Akiyama, F. (1971). An example of software system debugging. InternationalFederation for Information Processing Congress, 71(1), 353–359.
Alander, J. T. (1995). An indexed bibliography of genetic programming, ReportSeries no 94-1-GP, Department of Information Technology and IndustrialManagement, University of Vaasa, Finland, last checked: 13 Feb 2009 (1995).<ftp://ftp.uwasa.fi/cs/report94-1/gaGPbib.ps.Z>.
Alfaro-Cid, E., McGookin, E. W., Murray-Smith, D. J., & Fossen, T. I. (2008). Geneticprogramming for the automatic design of controllers for a surface ship. IEEETransactions on Intelligent Transportation Systems, 9(2), 311–321.
Andersson, B., Svensson, P., Nordin, P., & Nordahl, M. (1999). Reactive and memory-based genetic programming for robot control. In Proceedings of the 2nd Europeanworkshop on genetic programming (EuroGP’99), Berlin, Germany.
Bäck, T., Fogel, D. B., & Michalewicz, Z. (Eds.). (2000). Evolutionary computation 1 –Basic algorithms and operators. New York, USA: Taylor & Francis Group, LLC.
Banzhaf, W., Nordin, P., Keller, R., & Francone, F. (1998). Genetic programming – Anintroduction. Morgan Kaufmann Publishers, Inc..
Barr, R. S., Golden, B. L., Kelly, J. P., Resende, M. G. C., & Junior, W. R. S. (1995).Designing and reporting on computational experiments with heuristicmethods. Journal of Heuristics, 1(1), 9–32.
Burgess, C. J., & Lefley, M. (2001). Can genetic programming improve software effortestimation? a comparative evaluation. Information and Software Technology,43(14), 863–873.
Burke, E. K., & Kendall, G. (2005). In E. K. Burke & G. Kendall (Eds.), Searchmethodologies – Introductory tutorials in optimization and decision supporttechniques. New York, USA: Springer Science and Business Media, Inc.[Chapter 1 – Introduction].
Catal, C., & Diri, B. (2009). A systematic review of software fault prediction studies.Expert Systems with Applications, 36(4), 7346–7354.
Compton, B. T., & Withrow, C. (1990). Prediction and control of Ada softwaredefects. Journal of Systems and Software, 12(3), 199–207.
Costa, E. O., de Souza, G. A., Pozo, A. T. R., & Vergilio, S. R. (2007). Exploring geneticprogramming and boosting techniques to model software reliability. IEEETransactions on Reliability, 56(3), 422–434.
Costa, E. O., & Pozo, A. (2006). A mu + lambda � GP algorithm and its use forregression problems. In Proceedings of the 18th IEEE international conference ontools with artificial intelligence (ICTAI’06). Washington, DC, USA: IEEE ComputerSociety.
Costa, E. O., Pozo, A., & Vergilio, S. R. (2006). Using boosting techniques to improvesoftware reliability models based on genetic programming. In Proceedings of the18th IEEE international conference on tools with artificial intelligence (ICTAI’06).Washington, D.C, USA: IEEE Computer Society.
Costa, E. O., Vergilio, S. R., Pozo, A. T. R., & de Souza, G. A. (2005). Modeling softwarereliability growth with genetic programming. In Proceedings of the 16thinternational symposium on software reliability engineering (ISSRE’05). Chicago,IL, USA: IEEE Computer Society.
Crespo, J., Cuadrado, J. J., Garcia, L., Marban, O., &Sanchez-Segura, M. I. (2003).Survey of artificial intelligence methods on software development effortestimation. In Proceedings of the 10th ISPE international conference onconcurrent engineering, Swets en Zeitlinger B.V.
de Almeida, M. A., Lounis, H., & Melo, W. L. (1998). An investigation on the use ofmachine learned models for estimating correction costs. In Proceedings of the20th international conference on software engineering (ICSE’98).
Dohi, T., Nishio, Y., & Osaki, S. (1999). Optimal software release scheduling based onartificial neural networks. Annals of Software Engineering, 8, 167–185.
Dolado, J. J. (2000). A validation of the component-based method for software sizeestimation. IEEE Transactions on Software Engineering, 26(10), 1006–1021.
Dolado, J. J. (2001). On the problem of the software cost function. Information andSoftware Technology, 43(1), 61–72.
Dolado, J. J., & Fernandez, L. (1998). Genetic programming, neural networks andlinear regression in software project estimation. In Proceedings of theinternational conference on software process improvement, research, educationand training (INSPIRE’98). London: British Computer Society.
Dybå, T., Dingsøyr, T., & Hanssen, G. K. (2007). Applying systematic reviews todiverse study types: An experience report. In Proceedings of the 1st internationalsymposium on empirical software engineering and measurement (ESEM’07).
Evett, M., Khoshgoftar, T., der Chien, P., & Allen, E. (1998). GP-based software qualityprediction. In Proceedings of the 3rd annual genetic programming conference.
enetic programming for software engineering predictive modeling: A sys-11.03.041
110411051106110711081109111011111112111311141115111611171118111911201121112211231124112511261127112811291130113111321133113411351136113711381139114011411142114311441145114611471148114911501151115211531154115511561157115811591160116111621163116411651166116711681169117011711172
117311741175117611771178117911801181118211831184118511861187118811891190119111921193119411951196119711981199120012011202120312041205120612071208120912101211121212131214121512161217121812191220122112221223122412251226122712281229123012311232123312341235123612371238123912401241
14 W. Afzal, R. Torkar / Expert Systems with Applications xxx (2011) xxx–xxx
ESWA 6143 No. of Pages 14, Model 5G
18 March 2011
Foss, T., Stensrud, E., Kitchenham, B., & Myrtveit, I. (2003). A simulation study of themodel evaluation criterion MMRE. IEEE Transactions on Software Engineering,29(11), 985–995.
Gaffney, J. E. (1984). Estimating the number of faults in code. IEEE Transactions onSoftware Engineering, 10(4), 459–465.
Halstead, M. H. (1977). Elements of software science. North-Holland: Elsevier.Harman, M. (2007). The current state and future of search-based software
engineering. In Proceedings of future of software engineering at 29thinternational conference on software engineering (FOSE’07). USA: IEEE ComputerSociety.
Harman, M., & Jones, B. F. (2001). Search-based software engineering. Informationand Software Technology, 43(14), 833–839.
ISBSG, The International Software Benchmarking Standards Group Limited, lastchecked: 18 Mar 2009 (2009). <http://www.isbsg.org/>.
Jørgensen, M. (1995). Experience with the accuracy of software maintenance taskeffort prediction models. IEEE Transactions on Software Engineering, 21(8),674–681.
Jørgensen, M. (2009). BESTweb, a repository of software cost and effort estimationpapers – Simula research laboratory, last checked: 07 Mar 2009. <http://home.simula.no/BESTweb/>.
Jørgensen, M., & Shepperd, M. (2007). A systematic review of software developmentcost estimation studies. IEEE Transactions on Software Engineering, 33(1), 33–53.
Kaminsky, K., & Boetticher, G. (2004). Building a genetically engineerable evolvableprogram (GEEP) using breadth-based explicit knowledge for predictingsoftware defects. In Proceedings of the 2004 IEEE annual meeting of the fuzzyinformation processing (NAFIPS’04).
Kaminsky, K., & Boetticher, G. D. 2004. Defect prediction using machine learners inan implicitly data starved domain. In Proceedings of the 8th world multi-conference on systemics, cybernetics and informatics, Orlando, FL.
Khoshgoftaar, T. M., Seliya, N., Liu, Y. (2003). Genetic programming-based decisiontrees for software quality classification. In Proceedings of the 15th IEEEinternational conference on tools with artificial intelligence (ICTAI’03).
Khoshgoftaar, T. M., & Liu, Y. (2007). A multi-objective software qualityclassification model using genetic programming. IEEE Transactions onReliability, 56(2), 237–245.
Khoshgoftaar, T. M., Liu, Y., & Seliya, N. (2004). Module-order modeling using anevolutionary multi-objective optimization approach. In Proceedings of the 10thinternational symposium on software metrics, (METRICS’04). Washington, DC,USA: IEEE Computer Society.
Khoshgoftaar, T. M., Liu, Y., & Seliya, N. (2004). A multiobjective module-ordermodel for software quality enhancement. IEEE Transactions on EvolutionaryComputation, 8(6), 593–608.
Kitchenham, B. A. (2007). Guidelines for performing systematic literature reviews insoftware engineering. Technical Report EBSE-2007-001, UK (July 2007). <http://www.dur.ac.uk/ebse/>.
Kitchenham, B. A., Mendes, E., & Travassos, G. H. (2007). Cross versus within-company cost estimation studies: A systematic review. IEEE Transactions onSoftware Engineering, 33(5), 316–329.
Kotanchek, M., Smits, G., & Kordon, A. (2003). Industrial strength geneticprogramming. In R. L. Riolo & B. Worzel (Eds.), Genetic programming theoryand practise (pp. 239–256). Kluwer [Chapter 15].
Koza, J. R. (1992). Genetic programming: On the programming of computers by meansof natural selection. Cambridge, USA: MIT Press.
Koza, J. R., & Poli, R. (2005). In E. K. Burke & G. Kendall (Eds.), Search methodologies –Introductory tutorials in optimization and decision support techniques. New York,USA: Springer Science and Business Media, Inc. [Chapter 5 – Geneticprogramming].
Langdon, W., Gustafson, S., & Koza, J. (2009). The genetic programmingbibliography, last checked: 13 Feb 2009 (2009). <http://www.cs.bham.ac.uk/wbl/biblio/>.
Lanubile, F., & Visaggio, G. (1997). Evaluating predictive quality models derivedfrom software measures: Lessons learned. Journal of Systems and Software, 38(3),225–234.
Lefley, M., & Shepperd, M. J. (2003). Using genetic programming to improvesoftware effort estimation based on general data sets. In Genetic andevolutionary computation (GECCO’03). LNCS (Vol. 2724). Springer-Verlag.
Lessmann, S., Baesens, B., Mues, C., & Pietsch, S. (2008). Benchmarking classificationmodels for software defect prediction: A proposed framework and novelfindings. IEEE Transactions on Software Engineering, 34(4), 485–496.
1242
Please cite this article in press as: Afzal, W., & Torkar, R. On the application of gtematic review. Expert Systems with Applications (2011), doi:10.1016/j.eswa.20
Lipow, M. (1982). Number of faults per line of code. IEEE Transactions on SoftwareEngineering, 8(4), 437–439.
Liu, Y., Khoshgoftaar, T., & Yao, J.-F. (2006). Developing an effective validationstrategy for genetic programming models based on multiple datasets. InProceedings of the 2006 IEEE international conference on information reuse andintegration.
Liu, Y., & Khoshgoftaar, T. M. (2001). Genetic programming model for softwarequality classification. In Proceedings of the 6th IEEE international symposium onhigh-assurance systems engineering (HASE’01). Washington, DC, USA: IEEEComputer Society.
Liu, Y., & Khoshgoftaar, T. (2004). Reducing overfitting in genetic programmingmodels for software quality classification. In Proceedings of the 8th IEEEinternational symposium on high-assurance systems engineering (HASE’04).Washington, DC, USA: IEEE Computer Society.
Low, G. C., & Jeffery, D. R. (1990). Function points in the estimation and evaluation ofthe software process. IEEE Transactions on Software Engineering, 16(1), 64–71.
Mair, C., & Shepperd, M. (2005). The consistency of empirical comparisons ofregression and analogy-based software project cost prediction. In Proceedings ofthe 4th international symposium on empirical software engineering (ISESE’05). LosAlamitos, CA, USA: IEEE Computer Society.
Michalewicz, Z., & Fogel, D. B. (2004). How to solve it: Modern heuristics (2nd ed.).Springer Verlag.
Myrtveit, I., & Stensrud, E. (1999). A controlled experiment to assess the benefits ofestimating with analogy and regression models. IEEE Transactions on SoftwareEngineering, 25(4), 510–525.
Petticrew, M., & Roberts, H. (2005). Systematic reviews in the social sciences: Apractical guide. Victoria, Australia: Wiley-Blackwell.
Poli, R., Langdon, W. B., McPhee, N. F., & Koza, J. R. (2007). Genetic programming: Anintroductory tutorial and a survey of techniques and applications, Technicalreport CES-475, ISSN: 1744-8050.
Poli, R., Langdon, W. B., & McPhee, N. F. (2008). A field guide to geneticprogramming, Published via <http://lulu.com> and freely available at <http://www.gp-field-guide.org.uk>, (With contributions by J.R. Koza). <http://www.gp-field-guide.org.uk>.
Ratzinger, J., Gall, H., & Pinzger, M. (2007). Quality assessment based on attributeseries of software evolution. In Proceedings of the 14th working conference onreverse engineering (WCRE’07).
Reformat, M., Pedrycz, W., & Pizzi, N. J. (2003). Software quality analysis with theuse of computational intelligence. Information and Software Technology, 45(7),405–417.
Regolin, E. N., de Souza, G. A., Pozo, A. R. T., & Vergilio, S. R. (2003). Exploringmachine learning techniques for software size estimation. In Proceedings of theinternational conference of the Chilean Computer Science Society. Los Alamitos, CA,USA: IEEE Computer Society.
Robinson, G., & McIlroy, P. (1995). Exploring some commercial applications ofgenetic programming. In Selected Papers from AISB Workshop on EvolutionaryComputing. London, UK: Springer-Verlag.
Shan, Y., McKay, R. I., Lokan, C. J., & Essam, D. L. (2002). Software project effortestimation using genetic programming. In Proceedings of the 2002INTERNATIONAL CONFERENCE ON COMMUNICATIONS, CIRCUITS AND SYstems,Piscataway, NJ, USA.
Shepperd, M., Cartwright, M., & Kadoda, G. (2000). On building prediction systemsfor software engineers. Empirical Software Engineering, 5(3), 175–182.
Shukla, K. K. (2000). Neuro-genetic prediction of software development effort.Information and Software Technology, 42(10), 701–713.
Thelin, T. 2004. Team-based fault content estimation in the software inspectionprocess. In Proceedings of the 26th international conference on softwareengineering (ICSE’04).
Tsakonas, A., & Dounias, G. (2008). Predicting defects in software using grammar-guided genetic programming. In Proceedings of the 5th Hellenic conference onartificial intelligence (SETN’08). Berlin, Heidelberg: Springer-Verlag.
Wood, A. (1996). Predicting software reliability. Computer, 29(11), 69–77.Zhang, Y., & Yin, J. (2008). Software reliability model by AGP. In Proceedings of the
IEEE international conference on industrial technology, Piscataway, NJ, UnitedStates.
Zhang, Y., & Chen, H. (2006). Predicting for MTBF failure data series of softwarereliability by genetic programming algorithm. In Proceedings of the 6thinternational conference on intelligent systems design and applications (ISDA’06).Los Alamitos, CA, USA: IEEE Computer Society.
enetic programming for software engineering predictive modeling: A sys-11.03.041


