Embed Size (px)
Citation preview
On the Internet Delay Space Dimensionality
Bruno Abrahao Robert Kleinberg∗Department of Computer Science
Cornell UniversityIthaca, NY, 14850, USA
abrahao,[email protected]
Categories and Subject Descriptors: C.2.4 [Computer-Communication Networks]: Distributed Systems
General Terms: Measurement.
Keywords: Delay Space, Dimensionality, Network Embed-ding, Internet Structure.
ABSTRACTWe investigate the dimensionality properties of the Internetdelay space, i.e., the matrix of measured round-trip laten-cies between Internet hosts. Previous work on network co-ordinates has indicated that this matrix can be embedded,with reasonably low distortion, into a 4- to 9-dimensionalEuclidean space. The application of Principal ComponentAnalysis (PCA) reveals the same dimensionality values. Ourwork addresses the question: to what extent is the dimen-sionality an intrinsic property of the delay space, definedwithout reference to a host metric such as Euclidean space?Is the intrinsic dimensionality of the Internet delay spaceapproximately equal to the dimension determined using em-bedding techniques or PCA? If not, what explains the dis-crepancy? What properties of the network contribute toits overall dimensionality? Using datasets obtained via theKing [14] method, we study different measures of dimension-ality to establish the following conclusions. First, based onits power-law behavior, the structure of the delay space canbe better characterized by fractal measures. Second, theintrinsic dimension is significantly smaller than the valuepredicted by the previous studies; in fact by our measuresit is less than 2. Third, we demonstrate a particular way inwhich the AS topology is reflected in the delay space; sub-networks composed of hosts which share an upstream Tier-1autonomous system in common possess lower dimensional-ity than the combined delay space. Finally, we observe thatfractal measures, due to their sensitivity to non-linear struc-tures, display higher precision for measuring the influence ofsubtle features of the delay space geometry.
∗Both authors are supported by NSF Grant CCF-0643934.
Permission to make digital or hard copies of all or part of this work forpersonal or classroom use is granted without fee provided that copies arenot made or distributed for profit or commercial advantage and that copiesbear this notice and the full citation on the first page. To copy otherwise, torepublish, to post on servers or to redistribute to lists, requires prior specificpermission and/or a fee.IMC’08, October 20–22, 2008, Vouliagmeni, Greece.Copyright 2008 ACM 978-1-60558-334-1/08/10 ...$5.00.
1. INTRODUCTIONNetwork latency plays a central role in the design of a large
class of Internet services as their performance is sensitiveto the choice of the communicating participants. In lightof this, coordinate-based network positioning systems havereceived considerable attention in the past few years [10,12, 28, 32, 35, 39]. These approaches aim at providing acompact representation of the Internet delay space (i.e., thematrix of measured round-trip latencies between Internethosts) by modeling the network as contained in a vectorspace. In this process, known as network embedding, eachnode is assigned a coordinate in a host metric space (e.g.,Euclidean space) in such a way that the geometric distancebetween any two nodes estimates the real latency betweenthem within a tolerable degree of error.
However, coordinate-based systems inherently suffer fromembedding distortion, instability, slow convergence, and dis-appointing accuracy, as pointed out by [22] and [24]. More-over, as discussed in [25] and [37], some aspects of the Inter-net graph make it difficult to model as a well-defined geomet-ric object. As a result, these obstacles motivate positioningsystems without coordinates [25, 26, 33, 44] as a more func-tionally viable alternative due to their improved accuracy,despite the fact that they are often measurement intensiveand, in some cases, some types of queries are not availableto network participants (e.g., the prediction of distances be-tween any two other arbitrary nodes.).
As a way of understanding the potentialities and limita-tions of coordinate-based systems, we investigate a criticalaspect influencing the effectiveness of this approach, namelythe dimensionality of the Internet delay space. The maincomponent of such systems consists of an embedding algo-rithm for which the number of dimensions of the host metricspace (denoted hereafter by d) is a tunable parameter.
Embeddings with different numbers of dimensions resultin different degrees of accuracy, since distance matrices possesa minimum intrinsic dimensionality [12, 28, 39]. In addition,since embedding techniques are based on some variation ofan optimization problem aimed at minimizing the predictionerror, the algorithms suffer from the curse of dimensional-
1A brief announcement to this work appears in the Proceed-ings of the Twenty-Seventh Annual ACM SIGACT-SIGOPSSymposium on Principles of Distributed Computing, August18-21, 2008, Toronto, ON, Canada.2With the permission of the authors of [44], the pro-cessed 2385 × 2385 King dataset annotated withIP addresses, together with the datasets derivedfrom it, is available at the Inetdim project websitehttp://www.cs.cornell.edu/∼rdk/inetdim

ity. That is to say that the algorithm’s complexity increaseswith the number of dimensions to the point that it becomesunable to deal with the overwhelming number of degrees offreedom to explore. Often times, this phenomenon occursdue to the unnecessary inflation of the metric space [6]. Fi-nally, the convergence time, which increases with d, affectsthe stability of coordinates and the adaptability to changes,thereby affecting the reliability of the predictions [12, 22].
Previous studies indicated that embeddings of the Internetdelay space can be created using 4 to 9 dimensions with rea-sonably low distortion in a Euclidean space [28, 39]. Dabeket al. [12] demonstrated that augmenting the embeddingwith height vectors, which are thought of as distance penal-ties incurred by traversing the last-mile access links in theInternet topology, allows one to use a lower-dimensional Eu-clidean space while retaining a similar level of accuracy. Theapplication of Principal Component Analysis (PCA) [38] re-veals the same dimensionality values [39].
However, this work prompts many questions which arestill elusive: Can the dimensionality of the network be deter-mined by embedding it into a host metric such as Euclideanspace, or is there a more robust way of defining dimension-ality, independent of the choice of host metric? Is the ob-served number of dimensions that produces low distortionembeddings in [12, 28, 39] optimal? More importantly, whatproperties of the Internet contribute to its dimensionality?
The characterization of the Internet delay space dimen-sionality, apart from its implications to the performance ofcoordinate systems, is by itself a topic of practical interestas it uncovers properties and opens new questions on thenature and complexity of the network [31].
As illustrated by [40], certain features of the Internet canbe deduced purely from its delay-space geometry. For exam-ple, the partition of Internet hosts according to continentscan be approximately reconstructed by clustering unlabeleddistance data. As another example, it is unknown how muchempty space is left by embedding the Internet using the cur-rent algorithms. If the empty space is significantly large,then extra overhead and complexity are being unnecessar-ily incurred by positioning systems. In addition, previousstudies — as well as ours — have focused on datasets withup to a few thousand data points. However, theoretical re-sults assert that in the worst case, the number of dimensionsand distortion of an embedding increase logarithmically withthe cardinality of the point set [8]. Therefore, a practicalcharacterization issue, also critical for synthetic delay spacegeneration purposes [45], is whether or not the dimension-ality behavior and embedding distortion observed in previ-ous studies will remain invariant with scaling to millions ofnodes. Finally, the performance of positioning systems with-out coordinates also benefits from the characterization of thedelay space geometry. For instance, the scaling guaranteesof Meridian [44] are based on the assumption of a doublingmetric whose main parameter is its dimensionality.
Tang and Crovella [40], and Huffaker et al. [16] demon-strated that geographic location (henceforth, geolocation) isa strong component to the Internet delay space. However,due to routing inefficiencies, caused by sub-optimal behaviorof protocols, wide-area routing policies, and triangle inequal-ity violations [39, 42, 45], great circle distances are not ableto fully explain the Internet delay space dimensionality be-havior. If this is the case, what other forces play a role inthe dimensionality behavior?
This paper presents measurements and analysis to shedinsight on these questions. We study the Internet dimension-ality, defined as an intrinsic property of the distance matrix.This constitutes a geometrical invariant which does not referto an external host metric space, such as Euclidean space,and does not include any structural distortions and unnec-essary dimensionality inflation incurred by the embeddingalgorithms. We also study tools for exploring how and towhat extent network properties drive the delay space dimen-sionality behavior. Using datasets obtained via the King [14]method, we compare four intrinsically-defined measures ofdimensionality with the dimension obtained using networkembedding techniques (such as Vivaldi [12]). We presentthree main conclusions. First, based on its power-law be-havior, the structure of the delay space is best described byfractal measures of dimension, which measure a dimensional-ity intrinsic to the dataset, rather than by integer-valued pa-rameters, such as the embedding dimension or PCA. Second,the intrinsic dimension is much smaller than the dimensionpredicted by the latter methods: in fact, by some measures,the intrinsic dimension is less than 2. Third, we quantify towhat extent geolocation drives the dimensionality behaviorand we present observations that suggest how the AS topol-ogy is reflected in the delay space. More specifically, we showthat subsets of the data which can reach each other withoutgoing through a transit link between two Tier-1 providersconsistently exhibit lower fractal dimension than the com-bined delay space, and that no such dimensionality reduc-tion is achieved when partitioning according to geolocation.Given the properties observed above, we finally show evi-dence that fractal measures of dimensionality, due to theirsensitivity to non-linear structures, display higher precisionfor measuring the influence of subtle features of the delayspace geometry which are not captured by other dimension-ality measures.
The rest of this paper is organized as follows. Section 2presents the related work, Section 3 describes our experi-mental methodology, and Section 4 describes the notions ofdimensionality we use in this work. Finally, Section 5 ap-plies the proposed measures to study delay space features,and Section 6 offers our conclusions.
2. RELATED WORKThe first work to propose network embedding for the In-
ternet was GNP (Global Network Positioning) [28]. In thiswork, Ng and Zhang tackle the complexity of the embeddingby incrementally determining the coordinates of participantswith respect to a set of a few previously chosen nodes (bea-cons or landmarks). These infrastructure nodes measuretheir inter-distance and determine their coordinates in somed-dimensional metric space. As a result they function as ref-erences in space so that subsequent incoming nodes can de-termine their own coordinates. This is done via a non-linearoptimization problem that aims at minimizing the overalldiscrepancy between the geometric and measured distances.Hence, arriving participants compute the same minimiza-tion problem to determine their own absolute coordinates,by actively measuring their distance to the already-orientedbeacons. Later on, a theoretical justification for the suc-cess of this approach was given by Kleinberg, Slivkins, andWexler [19]; we discuss their work in greater detail below.Other examples of systems with similar scope are [10], [32],and [35].

On comparing the distributions of relative errors incurredby GNP using different number of dimensions, Ng and Zhangindicate that for the dataset studied, the best results wereachieved using 7 to 9 dimensions.
Tang and Crovella [39] address the complexity and cost ofnetwork embedding by proposing the Lipschitz embedding.This method relies on the assumption that, by the triangleinequality, two nearby points, say a and b, have similar dis-tance to a third point x, that is |d(a, x)− d(b, x)| ≤ |d(a, b)|and is defined in terms of a set D of subsets of a pointset X. The distance function d defines the distance from apoint x to one of the sets Li ∈ D as the distance from xthe nearest point of Li. Thus, the embedding is the map-ping φ(x) = [d(x, L1), d(x, L2), ..., d(x, L|D|)], where |D| cor-responds to the dimensionality of the embedding. When ev-ery Li is a singleton, each element represents a beacon and,therefore, component j of vector ~xi is actually the measureddistance from x to landmark j.
Since the number of dimensions required by the aboveembedding is high, the authors apply PCA, discussed inSection 4.3.2, to determine an r-dimensional space (wherer n) in which the data can be approximated with lowloss of accuracy. As a result, each ~xi is transformed into a~yi, where each component of the latter is a linear combina-tion of the distances to landmarks. Thus, they can be seenas distances to virtual landmarks. The method is evaluatedusing several real Internet datasets, and the number of di-mensions that capture most of the overall variation of thedata is between 7 and 9, incurring mean relative errors of 8to 25 percent, consistent across the different datasets.
Subsequently, Dabek et al. proposed Vivaldi [12], whichis a coordinate-based system that uses a mass-spring relax-ation problem to determine the coordinates of nodes. Inspite of using beacons, like GNP, Vivaldi has the advantageof not requiring fixed nodes serving this role and providesa degree of accuracy that is competitive with that of GNP.More interestingly, the authors propose the idea of unidi-rectional height vectors to augment the geometric model.Intuitively, the core of the network is mapped into a vec-tor space as before whereas the borders of the network areassigned heights that penalize the distances of access linktraversals. As a result, nodes can be placed up or down inorder to accommodate conflicting distances in low dimen-sionality. It has been shown that this approach was ableto embed the dataset considered into 2-space plus heightswith competitive accuracy as compared to the embeddinginto 5-space.
The Vivaldi project also explores alternative geometricspaces, such as spherical and cylindrical, given that curvedspaces resembles the surface of the globe around which theInternet is deployed. However, since most of the core linksare centered in the U.S. and Europe, and due to the factthat there is no communication passing through the poles,the Internet does not wrap around the earth and, there-fore, it has been shown that these approaches are no betterthan simply fitting the network into a plane space. Shavittand Tankel explore embeddings in hyperbolic space whichaccommodate distance conflicts in low dimensional spaces,achieving a similar level of success as the height vectors [36].
More recently, studies quantified the inaccuracy producedby current positioning systems. Ledlie, Gardner, and Seltzerdemonstrated that the relative errors increase with the car-dinality of the set of hosts, and that the convergence to and
maintenance of stable coordinates produced by the embed-ding algorithms are barriers to the effectiveness of such sys-tems [22]. Lua et al. confirm that the degree of inaccuracyis beyond tolerable and propose new methods to quantifythis fact, which is otherwise hidden by analyzing cumulativedistributions of relative errors [24].
Zhang et al. characterized the delay space and proposed asynthetic data generator that improves upon existing topol-ogy generators [45]. Later on, the same group studied theimpact of triangle inequality violations found in the delayspace on overlay networks [42].
There is a rich body of theoretical work on questions re-garding the existence of low-distortion embeddings of finitepoint sets into Euclidean space and other host metrics, aswell as the computational complexity of algorithms for com-puting such embeddings. The starting point for much ofthis research is Bourgain’s famous theorem which assertsthat every metric space of cardinality n may be embeddedwith distortion O(logn) in a Euclidean space of dimensionO(logn) [8]. A randomized algorithm for computing suchan embedding was supplied by Linial, London, and Rabi-novich [23]; the algorithm is based on semidefinite program-ming combined with a random-projection method due toJohnson and Lindenstraus [18]. Although there has beenprogress on the problem of minimizing the additive distor-tion, i.e., the maximum additive error over all pairs of points,the corresponding problem of computing low multiplicativedistortion embeddings into lower-dimensional spaces — e.g.,Euclidean spaces of dimension o(logn) — is an algorithmicproblem of daunting complexity. Indeed, it is NP-hard toapproximate the minimum-distortion embedding of an n-point metric into a d-dimensional Euclidean space within anapproximation factor less than Ω(n1/12) [17]. Finally, sev-eral recent papers have considered the problem of comput-ing embeddings with slack [5, 19], in which an ε fraction ofall distances may be arbitrarily distorted and the rest mustsatisfy a low-distortion guarantee. This work, which usesbeacon-based embedding techniques a la GNP, culminatedin a theorem that every finite metric space admits an em-bedding in O
`log2 1
ε
´dimensions with O
`log 1
ε
´distortion
and ε slack. Note that both the distortion and the dimen-sionality of the host metric in this theorem are still too highto be of practical value for network coordinate systems.
In Section 4 we study the power-law behavior of the delayspace and its relationship with fractal dimensions. Manydifferent power-laws and self-similar phenomena have beendocumented in the literature on Internet measurement. Ex-amples include power-laws in the distribution of packet rateson an Ethernet link [43], inter-arrival times for FTP connec-tions and TELNET packets [30], HTTP connections [11],different aspects of the Internet topology [13], and round-trip measurements in a time series of pings between a singlepair of hosts [4].
The measures of fractal dimensions used in this work werealso used by Belussi and Faloutsos [7]. Their work demon-strated that when spatial datasets behave like fractals (de-fined in Section 4.2.1) over a wide range of distances, onecan use measurements of their fractal dimensions to rapidlyestimate the spatial selectivity in range queries.
To the best of our knowledge, our work is the first tostudy the underlying dimensionality of the Internet delayspace as a separate issue from the embedding of this delayspace in any particular metric space, the first to document

power-laws in the Internet delay space and to apply frac-tal geometry to its characterization, and the first to explorethe impact of the Internet’s AS-level topology on its delay-space geometry. The dimensionality revealed by our tech-niques is significantly lower than the dimensionality of theembeddings used in the prior work [12, 28, 39], although theexistence of an algorithm that produces embeddings withthis low dimensionality behavior is still an open question.
3. METHODOLOGYOur main analysis is based on the Meridian dataset pre-
sented by Wong, Slivkins, and Sirer [44], and some of ourfindings are also supported by observations made using theMIT King dataset [2, 12].
The Meridian dataset was collected between May 5-132004 via the King [14] method, containing latency measure-ments between more than 5200 DNS servers. The list ofsites to measure was determined by randomly picking web-site names from a set of 593160 entries obtained from theDMOZ and Yahoo directories. The raw data consists ofa set of asymmetric measurements between pairs of DNSservers, that is, the RTT’s in microseconds between twoservers A and B, measured by recursively querying A fordomains served by B, and vice-versa. The number of asym-metric measurements per pair varies between 1 and 20 en-tries with median 11. In order to create the matrix used inthis work, we took the union of the asymmetric measure-ments for each pair, thereby making the dataset symmet-ric. We subsequently filtered out the pairs with less than 10measurements, in order to minimize biases due to queuingdelays at routers or DNS servers, and then computed the me-dian of the symmetric measurements for the remaining pairs.Finally, we approximate the largest clique in the resultingincomplete matrix via a 2-approximation algorithm for thevertex cover problem (i.e., to eliminate the missing entriesby removing the minimum number of nodes), resulting ina all-pairs matrix with 2385 hosts, annotated with their IPaddresses (henceforth referred to as “IPs” for brevity).
The MIT King dataset was first used to study Vivaldi’sbehavior [12]. It was also collected using the King methodand contains measurements among 1953 hosts, selected byfinding the NS records of IP addresses of participants ina Gnutella network. Nevertheless, after applying the abovedata cleaning process, only 298 nodes remained in the dataset.Although the size of this dataset does not allow us to use itfor analyzing all the aspects discussed in this work, it canstill be used to support some of our findings.
We also merged the delay data in the Meridian datasetwith the underlying AS topology by obtaining a snapshot,from the same period the delay dataset was collected, ofthe customer-provider AS graph from the CAIDA AS rela-tionships dataset [3]. Using the combined data, we made adecomposition of the network into AS trees, each rooted atone major Tier-1 Autonomous Systems (AS). Accordingly,each piece comprises the Tier-1 network itself, together withits downstream network of AS customers. After decompos-ing the whole network in this fashion, we classified the IPsfound in the Meridian dataset into each piece. The numberof IPs found in each piece is summarized on Table 1.
Notice that the sum of the number of IPs in each networkexceeds the total number of IPs in the dataset. This is be-cause most of the IPs are located in multihomed networks(i.e., are served by multiple providers). In fact, according
Table 1: List of the major Tier-1 AS together withthe number of IPs in their downstream networksrepresented in the Meridian dataset.
AS Meridian
AS# Name Hosts
2914 NTT Comm. 1212
209 Qwest 1227
3561 SAVVIS 1389
3356 Level 3 1454
7018 AT&T 1487
3549 Global Crossing 1515
701 Verizon 1529
1239 Sprint Nextel 1604
to our data, more than 60% of the customers have contractswith more than one provider, and the number of upstreamproviders per network can be as high as 13. Thus, our de-composition does not consist of a partition of the space, and,in fact, some of the subsets contain more than 50% of thenodes in the whole clique. 3
We emphasize that the King method is a convenient wayto obtain vantage points using DNS servers, which are gen-erally well-connected hosts. Thus, although its hosts aregeographically and topologically diverse, it can be arguedthat datasets collected via King could only give us an ap-proximate picture of the delay space geometry as composedof core and edge networks. Furthermore, both datasets con-tains violations of the triangle inequality to a degree consis-tent with that found in the characterizations by [12], [39],[42], [44], and [45].
The unavailability of Internet latency datasets is a majorlimitation to the study of the dimensionality of the delayspace. We have investigated the other publicly availabledatasets of this kind but they are either limited in scale, i.e.,do not contain a large enough all-pairs matrix so that ouranalysis can be applied, or they are not annotated with IPaddresses, which makes the above decomposition impossible.
In order to analyze the geographic component of the delayspace, we queried the hostip.info database [1] for the IPscontained in the Meridian dataset, obtaining their latitudeand longitude at the time of writing. Since these IPs belongto DNS servers of large domains that are not as likely to havetheir IPs reassigned as are smaller domains, we resort tothe assumption (not quantified) that a large fraction of theIPs contained in the Meridian dataset were not reassignedsince 2004. Even though we believe that this is a reasonableapproximation, it should be emphasized that, together withthe fact that geolocation is currently a process with highdegree of inaccuracy, this could combine several sources oferror for the particular set of results in Section 5.1.
3A recent result indicates that a single snapshot of the in-ferred AS topology map is believed to miss around 10% ofthe customer-provider links involving Tier-1 and Tier-2 net-works [29]. While this does not lead to missclassification,it could possibly exclude the membership of some domains(and its downstream customers) in some of the pieces.

Figure 1 presents a coarse-grained visualization of the geo-location of nodes in the Meridian dataset.
Figure 1: Geographic location of nodes in the Merid-ian dataset.
4. DIMENSIONALITY MEASURESAs a starting point for introducing the measures of di-
mensionality that we use in this work, let us consider thefollowing problem. Suppose that a surveyor chooses a setX of 2500 random points in the plane and measures thedistances between all pairs using a method that introduces5% relative error due to measurement noise. Given the ma-trix of measurements, but not the coordinates of the actualpoints, how could one deduce that the data came from apoint set in 2 dimensions, rather than 1 or 3? We considerthis problem further in the following sections.
4.1 Embedding dimensionAn obvious answer to the question question posed in the
previous section is: for d = 1, 2, 3, . . ., try to embed thepoints in d dimensions using an embedding algorithm suchas Vivaldi. Stop at the lowest dimension D which permitsan embedding with small quartiles of relative errors and letD denote the embedding dimension of the dataset.
We applied this process to the Meridian dataset by embed-ding the network into Euclidean space using Vivaldi, avail-able as part of the P2Psim package [2]. We varied the num-ber of dimensions from d = 1 to d = 9 and Figure 2 presentsthe outcomes of this experiment by displaying the 35-th, 50-th, 65-th, and 80-th percentiles of relative errors incurredby embedding the whole delay space with different valuesof d (with the percentile values chosen in such a way thatthe discrepancy of the distributions could be well captured).In this plot, we can observe that there is a fast improve-ment in accuracy up to d = 4 and a slow improvement up tod = 7. Surprisingly, after 7 dimensions, the accuracy of thealgorithm gets worse, exposing the threshold beyond whichthe curse of dimensionality starts to affect the algorithm’sperformance.
A benefit of this approach is that, if successful, it actu-ally recovers the coordinates of the original points (up totranslations and rotations).
However, it also has many drawbacks: first, embeddingalgorithms are slow, even for relatively small values of d.Second, finding an embedding that minimizes distortion is
0.1
0.2
0.3
0.4
0.5
0.6
0.7
0.8
0.9
1
9D8D7D6D5D4D3D2D1D
Rel
ativ
e E
rror
Dimensionality
Percentile Relative Error versus Dimensionality
80%65%50%35%
Figure 2: Percentiles of relative errors produced byVivaldi using different values of d.
computationally intractable in the worst case [9]. Last butnot least, if the measured distances reflect a metric otherthan the Euclidean distance (e.g., the hyperbolic metric orthe Manhattan metric), the algorithm may fail to find alow-distortion embedding in any dimension.
Moreover, by attempting to fit the distances precisely, thealgorithm may produce a high-dimensional embedding withlots of unnecessary empty space, obscuring the fact that thepoints of the embedding really lie in a lower dimensionalsubset of that space. For example, if a point set X were lo-cated on a hilly terrain instead of a flat plane, the algorithmwould output an embedding using 3 dimensions despite thefact that all of the data lies along a 2-dimensional surface in3-space.
Finally, the embedding may fail to reveal lower dimen-sional substructures which constitute important features ofthe distance matrix. For example, suppose that the entriesof the distance matrix are estimates of the time requiredto walk between various locations in an office building withseveral floors. The geometry of the office building can bemost accurately modeled as a small number of 2-dimensionalpieces (the floors) with a small number of “gateways” (thestairwells) connecting these pieces together. Embedding thedistance matrix accurately in a Euclidean space would re-quire at least 3 dimensions — probably more, since shortestpaths in the office building are very different from shortestpaths in 3-space — obscuring the inherent 2-dimensionalityof the office building’s floor plan. Like the office building, theInternet delay space is also composed of smaller pieces (au-tonomous systems) which meet only at prescribed gateways(customer-provider and peering links). When representingthe geometry of the Internet delay space, one should notchoose a representation which obscures this intricate struc-ture.
For purposes of estimating the dimensionality of a pointset there are several other, more lightweight, ways of defin-ing dimensionality using structural properties of the distancematrix itself. These estimates can be done without mak-ing reference to an outside “host metric”, such as Euclideanspace, and without computing coordinates to represent itspoints.

(a) Unit Square, D2 ≈ 2 (b) Meridian matrix, D2 = 1.78 (c) MIT King Matrix, D2 = 1.97
Figure 3: Correlation fractal dimension, D2, of a) a set of 2500 random points in a unit square, and theInternet delay space as represented by b) the Meridian matrix and c) the MIT King matrix.
These methods also capture the effects of the intricatepatterns mentioned above. We next introduce these defini-tions of dimensionality, explaining the applicability of eachand their degree of accuracy for the solution to the problemintroduced in the beginning of this section. Although thefollowing notions of dimensionality were introduced in thetheory of metric spaces (which assumes the triangle inequal-ity), all of them have the desirable property that they areapplicable even in datasets (like ours) which contain triangleinequality violations, often yielding meaningful results.
4.2 Correlation DimensionSuppose we pick a random point x ∈ X and a radius r, and
we count the number of other points whose distance from x isat most r. If the points are random samples from a boundedregion in the plane, then the expected number of such pointsin a region is proportional to its area. Hence the number ofpoints within distance r of x should be proportional to r2.For the same reason, in d dimensions, the number of pointswould be proportional to rd. Hence, upon plotting the radiusr against the number of pairs whose distance is at mostr in logscale (which we denote as the pair-count plot), forspecial point sets which produce a straight line over a givenrange of interest (i.e., exhibit power-law behavior), we caninterpret the exponent of the power-law d (i.e., the slope ofthe line) as reflecting the underlying d-dimensionality of thedataset. We refer to d as the pair-count exponent [7], whichcorresponds to the correlation fractal dimension, D2 [34],further discussed in Section 4.2.1.
Figure 3(a) illustrates the pair-count plot of a set of 2500random points in a unit square surface. Notice the presenceof a power-law that persists over three decimal orders ofmagnitude. Notice further that the exponent of this power-law is almost exactly equal to the dimension of the spacefrom which points were sampled, in accord with the theo-retical prediction sketched above. In fact, for all “Euclideanobjects”, i.e., distance matrices obtained from uniformly-random point clouds in Euclidean d-space, the fractal di-mension matches the Euclidean dimension.
Figures 3(b) and 3(c) present the pair-count plot of theInternet delay space as represented in the Meridian and MITKing datasets respectively.
The first striking feature of these plots is a power-law thatpersists roughly over two orders of magnitude, i.e., from 3msto 100ms. (Note that this range of latencies includes almostevery Internet route that is not trans-oceanic.) As a re-sult, the Internet delay space exhibits the desirable propertythat it can be measured by fractal measures of dimensional-ity (see Section 4.2.1). The second unexpected observationis that the magnitude of its dimensionality is less than 2,represented by the pair-count exponents D2 = 1.782 andD2 = 1.975 in the Meridian and MIT King dataset respec-tively. The estimation of these values contains errors to adegree that would not affect the conclusions derived in thiswork. These dimensionality values are much smaller thanthe embedding dimension indicates (i.e., between 4 to 7 di-mensions), suggesting a different geometric picture of thestructure of the Internet delay space. Sections 4.3.2 and5.2 discuss the reasons for this discrepancy. Finally, thepower-law behavior, including the dimensionality value, isconsistent across random subsets of the data, as discussedin Section 5.2.
The fractal measures can help us understand the weak-nesses of embedding algorithms by showing how they af-fect the properties of the original delay space. Accordingly,upon computing the pair-count plot of the embedded net-work produced by Vivaldi in 7 dimensions, we can observehow the resulting coordinate space does not preserve the ge-ometric properties of the original delay space and suffers amajor dimensionality inflation. Figure 4(a) shows the result-ing pair-count plot of the delay matrix reconstructed fromthe 7-space coordinates. Notice that the curve has a con-cave shape, thereby deviating from the power-law behaviorof the original space. Moreover, the best effort to measureits dimensionality, by finding the best straight line fit to thecurve, results in a pair-count exponent of value 5.46.
Although the Internet hosts live in a sphere that can be de-scribed by two coordinates in spherical space, the values near2, which the fractal measures revealed for the delay space di-mensionality, are not a reflection of the 2-dimensional struc-ture of a sphere’s surface. This phenomenon would be fur-ther explored in Section 5.1.

(a) Pair-Count of Meridian Embedded (b) Hausdorff dimension, D0 = 1.51
1 2 3 4 5 6 7 8 9 100
10
20
30
40
50
60
70
80
90
100
Principal Component
Variance E
xpla
ined (
%)
0%
10%
20%
30%
40%
50%
60%
70%
80%
90%
100%
(c) PCA, DPCA = 42.66%
Figure 4: Measures of dimensionality applied to the Meridian matrix: a) pair-count plot of the embeddedMeridian data into 7-Euclidean space, b) the Hausdorff dimension computed by the greedy set cover plot,and c) Principal Component Analysis (PCA) applied to the Meridian matrix.
4.2.1 Fractal dimensionsThe previous section introduced a measure of dimension-
ality which was based on measuring the exponent of a power-law arising in distance data. In general, this power-law doesnot necessarily arise and, when it does, it need not have aninteger exponent. Point sets whose pair-count plots displaya power-law are called fractals.
The correlation dimension is just an example from amongan infinite family of fractal dimensions Dq, indexed by anon-negative number q. Formally, if µ is a fractal measureon a set Y and A1, A2, . . . , AN is a partition of Y into piecesof diameter less than r, with µ(Ai) = pi for i = 1, 2, . . . , N ,then4
Dq(Y ) =1
q − 1limr→0
log“PN
i=1 pqi
”log r
. (1)
The correlation dimension corresponds to the fractal di-mension D2. Among these dimensions, only the first threecan be efficiently measured in practice.
Fractals may arise by applying recursive constructions inwhich a self-similar point set is composed of finitely manypieces, each of which is a scaled-down copy of the entirepoint set. If one samples a large number of points uniformlyat random on such a perfect infinite fractal, and measuresany of the fractal dimensions (e.g., for all q), they mustcoincide. For example, if a point set is made up of 2p pieces,each of which is a copy of the entire set scaled down by2k, then all its fractal dimensions equal p/k. However, ifthe data is non-uniformly distributed inside the fractal, onegets a fractal measure or multifractal — a fractal togetherwith a probability measure expressing the density of pointsat different locations.
Despite this recursive definition, the most surprising ex-amples of fractal behavior are non-recursive structures com-monly found in nature. Some examples are snowflakes, coast-lines and the surface of the human brain [34]. The question
4The case q = 1 is exceptional. In equation (1) when q = 1,one uses the log of the entropy of the distribution pi inthe numerator and drops the constant 1/(q − 1) out front.
of exactly what features of the Internet delay space lead toits fractal behavior is still elusive. In the search for theseproperties, we discovered some hints that are discussed inSection 5.2. However, this question is currently a subject ofour ongoing work.
4.3 Other dimensionality measuresIn this section, we introduce another instance of fractal di-
mension, namely Hausdorff dimension (D0) and two dimen-sionality reduction techniques, namely Principal ComponentAnalysis (PCA) and Isomap, explaining the relevance ofeach of them to this work.
4.3.1 Hausdorff dimensionConsider partitioning a point set X into low-diameter sub-
sets. IfX lies in a bounded region of the plane, then for everyr > 0 it can be partitioned into O(1/r2) subsets of diame-ter less than 2r, for example using grid cells of side lengthr. The analogous low-diameter covering in dimension d usesO(1/rd) subsets. Even if we are given only the distancematrix — so that it is infeasible to identify the partitioninto grid cells — a partition into low-diameter sets can stillbe constructed by considering the collection of all radius-r balls and selecting a sub-collection using the greedy setcover algorithm. For d-dimensional Euclidean objects thecardinality of this greedy covering will also be O(1/rd) withhigh probability, though it is less obvious than in the caseof the grid-cell covering.
This suggests defining N(r) to be the minimum size of apartition of X into pieces of diameter less than 2r, and plot-ting r against N(r) in logscale. For d-dimensional Euclideanobjects we have seen that this will lead to a line of slope −d.For any distance matrix, if a power-law with exponent −dis present over a given range of interest, we refer to d asthe Hausdorff fractal dimension [34], or D0, from the fractaldefinition presented in Section 4.2.1, Equation 1.
Figure 4(b) presents the measure of D0 for the Internetdelay space as represented in the Meridian matrix. Similarlyto the pair-count plot, we observe the presence of a power-law with exponent −1.51.

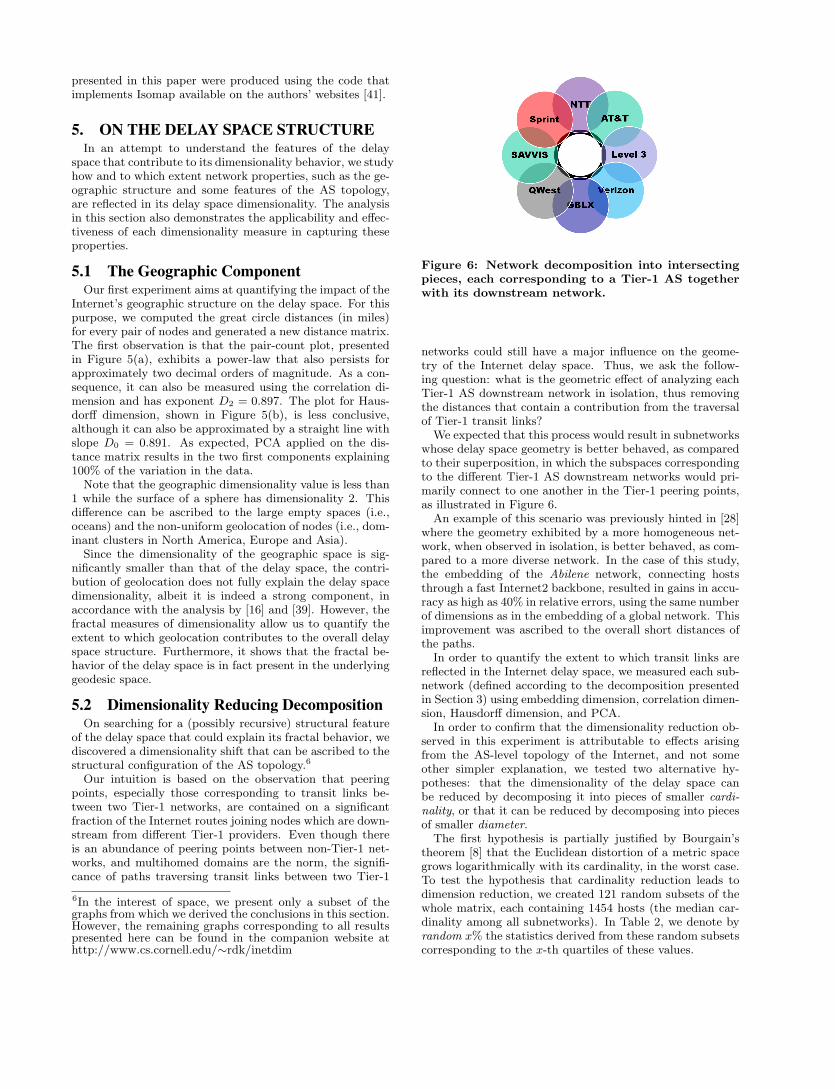
(a) Correlation dimension, D2 = 0.90 (b) Hausdorff dimension, D0 = 0.89 (c) Diameter-based Cluster
Figure 5: Dimensionality of the distance space based on great circle distances via a) the correlation dimensionand b) The Hausdorff dimension. c) The correlation dimension of one of the latency-based clusters.
While D2 encompasses the geometric structure of the de-lay space and also the spatial distribution of points, D0 in-cludes only the former notion [7, 34]. Nevertheless, we in-troduce D0 for two main reasons. First, it exhibits the samepower-law behavior displayed by D2 when applied to thedelay space as represented by the datasets considered (al-beit with a different power-law exponent). This observationreinforces the fractal behavior of the delay space. Second,D0 behaves similarly to D2 when measuring networks thatpossess different intrinsic dimensionality values. Section 5.2presents this behavior in greater detail.
Finally, a number of algorithms are known to run effi-ciently on metric spaces that possess some form of boundeddoubling dimension [15]. In general, that is to say that everyball of radius R in the metric can be covered by at most 2d
balls of radius R/2. Similarly to the Hausdorff dimension, ad-dimensional metric space has doubling dimension approx-imately d. While the doubling dimension has convenientalgorithmic properties, it is difficult to precisely determinethe doubling dimension of a dataset. (See [21] for an ex-ample of this process.) The difficulty arises because, unlikethe correlation or Hausdorff dimension which are statisti-cally robust against perturbing a few entries of the distancematrix, the doubling dimension is very sensitive to outliersas it involves taking the maximum covering number over allballs in the entire metric space.
4.3.2 Principal component analysisPCA is the main technique adopted in previous work to
characterize the Internet delay space dimensionality [12, 22,39]. In our experiments we have applied PCA directly tothe distance matrix. This is similar to the analysis appliedin [39], where the method was justified with the additionalobservation that the columns of the distance matrix itselfrepresent the coordinates for a particular embedding of thedelay matrix, namely the Lipschitz embedding in the L∞norm, discussed earlier in Section 2.
Figure 4(c) presents the application of this approach tothe delay space as represented by the Meridian matrix. Thecommon practice suggests that the dimensionality of a datasetis determined by the point d in the x-axis in which the
contribution of the corresponding component differs signif-icantly from the previous one, and the percentage varianceexplained by components with labels greater than d becomesnegligible. However, as in the case of this plot, it is not al-ways clear where to establish this threshold. Since we usePCA for the purpose of comparison of the dimensionalityvalues of different networks, we define our PCA measure asthe percentage variance explained by the three most signif-icant components. Accordingly, low dimensionality impliesmore variance being captured by these components whereashigh dimensionality tends to spread the variance across agreater number of components. In the case of Figure 4(c),the PCA measure equals 42.66%.
As PCA is a method grounded in linear algebra, whenapplied directly to a distance matrix, it is oblivious to non-linear relationships between different dimensions. 5 For ex-ample, if the points are sampled uniformly at random from acircle in the plane, PCA applied to the distance matrix willstrongly indicate a 2-dimensional dataset despite the factthat all of the points belong to a 1-dimensional curve. Hereis where the fractal measures come into play: by capturingnon-linear, as well as linear, relationships among the dimen-sions, the fractal measures are able to capture patterns inthe data otherwise ignored by PCA. Therefore, they providea more genuine characterization of dimensionality.
4.3.3 IsomapFinally, we apply Isomap [41], a geometric dimensional-
ity reduction technique, proposed in the Machine Learningcommunity, which is sensitive to both linear and non-linearcorrelations between the dimensions. Like PCA, when ap-plied to a dataset, Isomap outputs the fraction of the totalvariance explained by each of the dimensions and produces ad-dimensional non-linear embedding where the d is a tunableparameter. Our results indicate that, similarly to the frac-tal measures, Isomap displays higher sensitivity to Internetstructural properties as compared to PCA and the embed-ding dimension (see Section 5.2), thereby indicating thatthe delay space is rich in non-linearity. The Isomap results
5PCA can in principle capture non-linear relationships whencombined with kernels [27]
presented in this paper were produced using the code thatimplements Isomap available on the authors’ websites [41].
5. ON THE DELAY SPACE STRUCTUREIn an attempt to understand the features of the delay
space that contribute to its dimensionality behavior, we studyhow and to which extent network properties, such as the ge-ographic structure and some features of the AS topology,are reflected in its delay space dimensionality. The analysisin this section also demonstrates the applicability and effec-tiveness of each dimensionality measure in capturing theseproperties.
5.1 The Geographic ComponentOur first experiment aims at quantifying the impact of the
Internet’s geographic structure on the delay space. For thispurpose, we computed the great circle distances (in miles)for every pair of nodes and generated a new distance matrix.The first observation is that the pair-count plot, presentedin Figure 5(a), exhibits a power-law that also persists forapproximately two decimal orders of magnitude. As a con-sequence, it can also be measured using the correlation di-mension and has exponent D2 = 0.897. The plot for Haus-dorff dimension, shown in Figure 5(b), is less conclusive,although it can also be approximated by a straight line withslope D0 = 0.891. As expected, PCA applied on the dis-tance matrix results in the two first components explaining100% of the variation in the data.
Note that the geographic dimensionality value is less than1 while the surface of a sphere has dimensionality 2. Thisdifference can be ascribed to the large empty spaces (i.e.,oceans) and the non-uniform geolocation of nodes (i.e., dom-inant clusters in North America, Europe and Asia).
Since the dimensionality of the geographic space is sig-nificantly smaller than that of the delay space, the contri-bution of geolocation does not fully explain the delay spacedimensionality, albeit it is indeed a strong component, inaccordance with the analysis by [16] and [39]. However, thefractal measures of dimensionality allow us to quantify theextent to which geolocation contributes to the overall delayspace structure. Furthermore, it shows that the fractal be-havior of the delay space is in fact present in the underlyinggeodesic space.
5.2 Dimensionality Reducing DecompositionOn searching for a (possibly recursive) structural feature
of the delay space that could explain its fractal behavior, wediscovered a dimensionality shift that can be ascribed to thestructural configuration of the AS topology.6
Our intuition is based on the observation that peeringpoints, especially those corresponding to transit links be-tween two Tier-1 networks, are contained on a significantfraction of the Internet routes joining nodes which are down-stream from different Tier-1 providers. Even though thereis an abundance of peering points between non-Tier-1 net-works, and multihomed domains are the norm, the signifi-cance of paths traversing transit links between two Tier-1
6In the interest of space, we present only a subset of thegraphs from which we derived the conclusions in this section.However, the remaining graphs corresponding to all resultspresented here can be found in the companion website athttp://www.cs.cornell.edu/∼rdk/inetdim
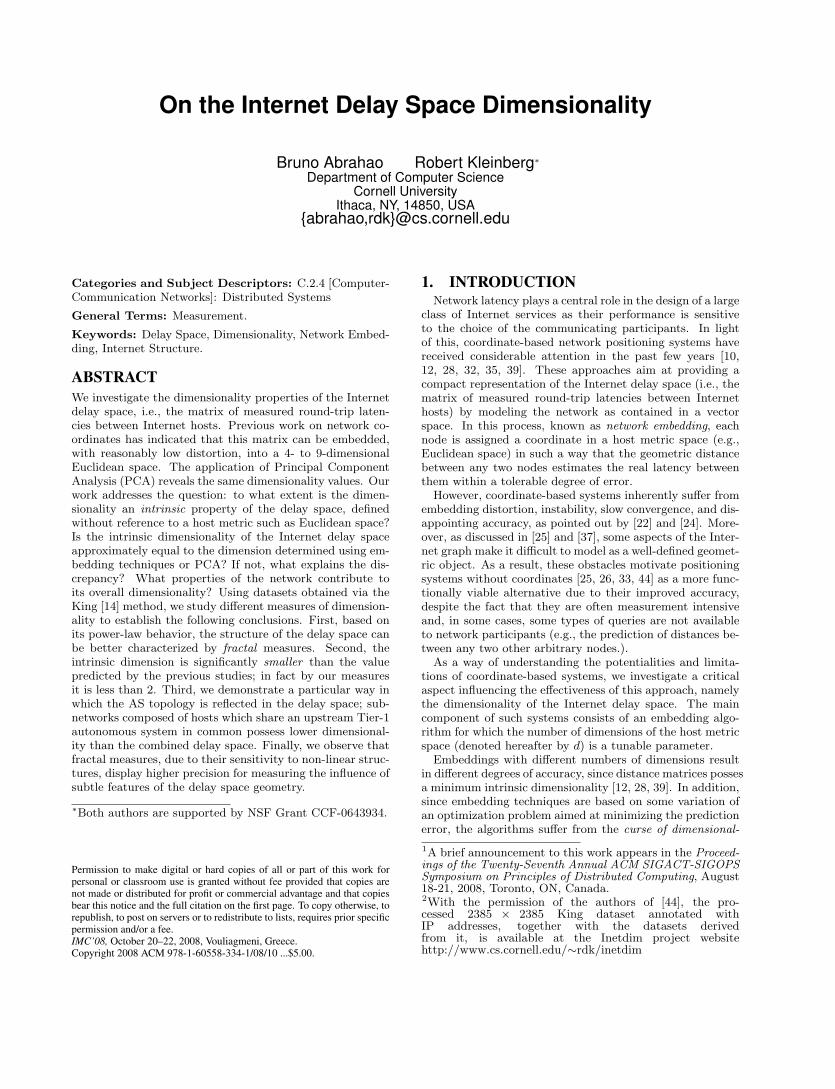
Figure 6: Network decomposition into intersectingpieces, each corresponding to a Tier-1 AS togetherwith its downstream network.
networks could still have a major influence on the geome-try of the Internet delay space. Thus, we ask the follow-ing question: what is the geometric effect of analyzing eachTier-1 AS downstream network in isolation, thus removingthe distances that contain a contribution from the traversalof Tier-1 transit links?
We expected that this process would result in subnetworkswhose delay space geometry is better behaved, as comparedto their superposition, in which the subspaces correspondingto the different Tier-1 AS downstream networks would pri-marily connect to one another in the Tier-1 peering points,as illustrated in Figure 6.
An example of this scenario was previously hinted in [28]where the geometry exhibited by a more homogeneous net-work, when observed in isolation, is better behaved, as com-pared to a more diverse network. In the case of this study,the embedding of the Abilene network, connecting hoststhrough a fast Internet2 backbone, resulted in gains in accu-racy as high as 40% in relative errors, using the same numberof dimensions as in the embedding of a global network. Thisimprovement was ascribed to the overall short distances ofthe paths.
In order to quantify the extent to which transit links arereflected in the Internet delay space, we measured each sub-network (defined according to the decomposition presentedin Section 3) using embedding dimension, correlation dimen-sion, Hausdorff dimension, and PCA.
In order to confirm that the dimensionality reduction ob-served in this experiment is attributable to effects arisingfrom the AS-level topology of the Internet, and not someother simpler explanation, we tested two alternative hy-potheses: that the dimensionality of the delay space canbe reduced by decomposing it into pieces of smaller cardi-nality, or that it can be reduced by decomposing into piecesof smaller diameter.
The first hypothesis is partially justified by Bourgain’stheorem [8] that the Euclidean distortion of a metric spacegrows logarithmically with its cardinality, in the worst case.To test the hypothesis that cardinality reduction leads todimension reduction, we created 121 random subsets of thewhole matrix, each containing 1454 hosts (the median car-dinality among all subnetworks). In Table 2, we denote byrandom x% the statistics derived from these random subsetscorresponding to the x-th quartiles of these values.

Table 2: Dimensionality measures: correlation di-mension (D2), Hausdorff dimension (D0) and PCAfound for the different AS networks.
Dimensionality
Network D2 D0 PCA
Meridian 1.783 1.510 42.66
1239 1.780 1.333 46.54
209 1.637 1.225 28.42
2914 1.618 1.161 44.25
3356 1.691 1.230 48.60
3549 1.634 1.265 48.96
3561 1.686 1.239 49.54
7018 1.710 1.304 49.68
701 1.701 1.244 49.68
random 0% 1.725 1.389 27.71
random 25% 1.762 1.465 45.76
random 50% 1.775 1.506 46.67
random 75% 1.789 1.554 53.10
random 100% 1.837 1.682 72.86
To test the second hypothesis, that diameter reductionleads to dimensionality reduction, we created a new decom-position of the distance matrix by the following process.Starting from an element selected from a geographically di-verse set of hosts, we grew a ball around it by selecting its1454 closest neighbors, and examined the delay space con-sisting of all inter-distances among these 1454 hosts. Wehave constructed 12 of these subsets centered at hosts lo-cated in 9 different countries, 4 continents.
Table 2 summarizes the dimensionality of each the sub-networks and values of the statistic thereof for the randomsubsets7 in terms of the correlation dimension, Hausdorff di-mension, and PCA measures. The corresponding measuresfor the whole network are also displayed in the table forreference, under the label Meridian.
The first observation is that the power-law behavior ob-served in the whole matrix was preserved over the samerange of distances in the submatrices, though not necessarilywith the same exponent. Second, with the exception of thecorrelation dimension of the subnetwork rooted at AS 1239(Sprint), all other networks exhibit smaller dimensionalitythan the whole matrix according to the two fractal measures.
The values of both the correlation and Hausdorff dimen-sions for the random networks, including the minimum ofthese values (random 0%), are consistently higher than thoseof every subnetwork (except for the pair count of network1239), and a higher percent of these values are close to thatof the whole matrix. As one increases the size of the originaldataset and the number of representatives in the set of ran-dom networks, one expects even less deviation between the
7The decomposition based on low-diameter subsets pro-duced results which are incomparable with these results be-cause the clustering rule significantly altered the nature ofthe power-law behavior, as explained further below. Hencethe results of these experiments are not included in Table 2.
correlation and Hausdorff dimensions of the original datasetand the median values measured in the random subnetworks.
The decomposition based on clustering of growing ballsresulted in the following observations. For all clusters, thepair-count plots present a power-law persisting over one dec-imal order of magnitude less than the whole matrix. Forsmaller values of r (in the range 3ms to 10ms) the numberof pairs at distance r is significantly higher than the numberof pairs predicted by the power-law approximation. This isperhaps not surprising, since the clusters were selected fortheir proximity to a single central host. Figure 5(c) showsone example of this outcome for one of the clusters. More-over, the pair-count exponents (i.e., correlation dimensions)computed over the range in which the power-law persists in-dicate dimensionality consistently greater than that of thewhole matrix. The deviation from a power-law is also ob-served in the range from 20ms to 30ms of set cover plots. Inaddition, the Hausdorff dimension measured over the rangefrom 30 to 90ms is consistently greater than that of thewhole matrix for all clusters.
Interestingly, delay space dimensionality reduction cannotbe explained by a corresponding reduction in the geographiccomponent. Upon applying the same decomposition analysisto the great-circle distances of the subnetworks, we observeno statistically significant difference in the power-law expo-nent of the subnetworks as compared to the pair count andset cover exponents found for the combined network.
It is important to emphasize that the AS relationshipgraph is complex and, therefore, other forms of decompo-sition could result in pieces that display the optimal di-mensionality reduction. Nevertheless, the analysis presentedhere shows evidence, with statistical significance, that thepresence of Tier-1 transit links has a non-negligible effecton the Internet’s delay space geometry.
Interestingly, both fractal measures are sensitive enoughto capture this structural change, in the form of a reductionin fractal dimension when one restricts attention to a subsetof the delay space consisting of a single Tier-1 provider andits downstream networks. Table 2 also contains values forthe percentage variance explained by the first three compo-nents (i.e., the three greatest in magnitude) found by PCA.Notice that, as opposed to the fractal measures, there is noclear distinction in dimensionality behavior between the sub-networks and the random sets as reported by PCA. We havealso computed the embedding dimension of each network inEuclidean space using Vivaldi and did not observe that de-composing the network into subnetworks had any effect onthe embedding dimensionality. In fact, similarly to PCA, insome cases, the dimensionality of subnetworks is reported asbeing much greater than that of the entire network.
We hypothesize three possible explanations for the in-sensitivity of PCA and Vivaldi to the network decomposi-tion, which was otherwise very well captured by the fractalmeasures. First, PCA and Vivaldi are oblivious to non-linear relationships in delay space. Second, PCA and Vivalditry to represent non-linear relationships using linear ones.Therefore, the process of accommodating these discrepan-cies causes the dimensionality to inflate. Finally, PCA andVivaldi are suited to reporting an integer which summarizesthe dataset’s dimensionality; such methods are too coarse todetect a difference of 0.2 in the dimensionality.
To confirm our hypotheses we applied Isomap (see Sec-tion 4.3.3) to the networks. Figure 7 shows the outcome of

0.01
0.02
0.03
0.04
0.05
0.06
0.07
0.08
0 1 2 3 4 5 6 7 8 9
Fra
ctio
n of
Var
ianc
e
Dimension
Scree Plot: Fraction of variance explained by each dimension
Meridian1239209
29143356701833493561701
Figure 7: The scree plot outputted by Isomap.
this experiment. In the plot, the fraction of the total vari-ance explained by the first five (also five most significant)components of all subnetworks is consistently greater thanthat of the entire network. As opposed to what PCA andVivaldi tell us, and in accordance with the fractal measures,the dimensionality of the subnetworks is indeed consistentlysmaller than the dimensionality of the whole network. How-ever, the dimensionality values reported by Isomap for allnetworks that is still larger than those predicted by the frac-tal measures. This result shows evidence of non-negligiblenon-linear structures in the delay space and suggests thatmethods sensitive to them might reflect the structural prop-erties of the Internet with superior degree of accuracy.
6. CONCLUSIONThis work studies different dimensionality measures and
investigates the dimensionality observed in the Internet de-lay space, thus providing insight into some of the underly-ing causes. Characterizing the geometry of the delay spaceis critical for designing and analyzing effective coordinate-based positioning systems and also sheds light on the struc-tural properties of the network.
We have observed that the Internet delay space displaysspecial structural and statistical characteristics in that it ad-heres to a power-law that extends over a significant rangeof Internet distances, namely the intra-continental distances.Therefore, its dimensionality can be characterized using frac-tal measures, sensitive to non-linear as well as linear struc-tures in the delay space. Moreover, they are intrinsic proper-ties of the delay space, independent of a target host metricspace (e.g., Euclidean space). Therefore, the delay spacedimensionality can be measured without computing coordi-nates for points, and is not subject to dimensionality infla-tion caused by embedding algorithms.
We have used the proposed fractal measures to quantifythe extent to which geodesic distances are reflected in thedimensionality of the Internet, and we have also shown that,upon decomposing the Internet into subnetworks consistingof hosts that share an upstream Tier-1 autonomous systemin common, we observe a reduction in the intrinsic dimen-sionality of the pieces.
Moreover, both fractal measures were able to capture therole of the Internet’s AS-level topology in determining its
delay space geometry, a factor not revealed by previouslyapplied methods. Accordingly, linear methods as well asembedding algorithms based on linear optimization prob-lems, such as PCA and Vivaldi, are insensitive to subtlestructural features of the network, thereby explaining thedisappointing degree of accuracy observed in previous stud-ies. Furthermore, our discovery of a dimensionality-reducingdecomposition of the delay space lends support to the theorythat embedding techniques based on hierarchical decomposi-tions [46] may outperform existing techniques that attemptto embed the entire distance matrix in one shot.
We leave for future work the applicability of nonlineardimensionality reduction techniques originally developed inthe machine learning and pattern recognition communities,e.g., [20, 41]. These methods, including the Isomap methodbriefly studied in Section 5.2 as well as more recent diffusion-based techniques [20], are based on metric embeddings whichcan reflect the intrinsic geometry of datasets and allow mul-tiscale analysis for solving dimensionality reduction, cluster-ing and parametrization.
Finally, we expect that the future availability of more com-prehensive datasets, containing a larger number of represen-tatives, including hosts in edge networks, and path infor-mation (i.e., traceroutes) will allow us to better quantifythe effectiveness of the fractal measures and discover subtleproperties of the delay space geometry that cannot be fullycontemplated via analyzing the King datasets.
AcknowledgmentsThe authors would like to thank Emin Gun Sirer and BernardWong for making their raw measurements available, andMark Crovella, Paul Francis, and Bruce Maggs for providingfruitful comments on this research. Finally, we are gratefulto Niel Spring for his service as shepherd to this publication.
7. REFERENCES[1] Hostip.info database. http://www.hostip.info.
[2] P2PSim. http://www.pdos.lcs.mit.edu/p2psim/.
[3] University of Oregon RouteViews Project.http://www.antc.uoregon.edu/route-views/.
[4] S. Abe and N. Suzuki. Omori’s law in the Internettraffic. Europhysics Letters, 61(6), 2003.
[5] I. Abraham, Y. Bartal, H. T.-H. Chan, K. Dhamdere,A. Gupta, J. Kleinberg, O. Neiman, and A. Slivkins.Metric embeddings with relaxed guarantees. In Proc.of IEEE FOCS, 2005.
[6] R. E. Bellman. Adaptive Control Processes. PrincetonUniversity Press, 1961.
[7] A. Belussi and C. Faloutsos. Estimating the selectivityof spatial queries using the correlation fractaldimension. In Proc. of VLDB, 1995.
[8] J. Bourgain. On Lipschitz embedding of finite metricspaces in Hilbert space. Israel J. Math., 52, 1985.
[9] M. Badoiu, J. Chuzhoy, P. Indyk, and A. Sidiropoulos.Low-distortion embeddings of general metrics into theline. In Proc. of ACM STOC, 2005.
[10] M. Costa, M. Castro, A. Rowstron, and P. Key. PIC:Practical Internet coordinates for distance estimation.In Proc. of ICDCS, 2004.
[11] M. E. Crovella and A. Bestavros. Self-similarity inWorld Wide Web traffic: evidence and possible causes.IEEE/ACM Transactions on Networking, 5(6), 1997.

[12] F. Dabek, R. Cox, F. Kaashoek, and R. Morris.Vivaldi: a decentralized network coordinate system. InProc. of ACM SIGCOMM, 2004.
[13] M. Faloutsos, P. Faloutsos, and C. Faloutsos. Onpower-law relationships of the Internet topology.SIGCOMM Comput. Commun. Rev., 29(4), 1999.
[14] K. P. Gummadi, S. Saroiu, and S. D. Gribble. King:estimating latency between arbitrary Internet endhosts. SIGCOMM Comput. Commun. Rev., 32(3),2002.
[15] A. Gupta, R. Krauthgamer, and J. R. Lee. Boundedgeometries, fractals, and low-distortion embeddings. InProc. of IEEE FOCS, 2003.
[16] B. Huffaker, M. Fomenkov, D. J. Plummer, D. Moore,and K. Claffy. Distance metrics in the Internet. InProc. of IEEE Intl. Telecom. Symposium (ITS), 2002.
[17] P. Indyk. Algorithmic applications of low-distortiongeometric embeddings. In Proc. of FOCS, 2001.
[18] W. B. Johnson and J. Lindenstrauss. Extensions ofLipschitz mappings into a Hilbert space. Contemp.Math., 26, 1984.
[19] J. Kleinberg, A. Slivkins, and T. Wexler.Triangulation and embedding using small sets ofbeacons. In Proc. of IEEE FOCS, 2004.
[20] S. Lafon and A. B. Lee. Diffusion maps andcoarse-graining: A unified framework fordimensionality reduction, graph partitioning, and dataset parameterization. IEEE Trans. on PatternAnalysis and Machine Intelligence, 28(9):1393–1403,2006.
[21] E. Lebhar, P. Fraigniaud, and L. Viennot. Theinframetric model for the Internet. In Proc. of IEEEINFOCOM, 2008.
[22] J. Ledlie, P. Gardner, and M. Seltzer. Networkcoordinates in the wild. In Proc. of USENIX NSDI,2007.
[23] N. Linial, E. London, and Y. Rabinovich. Thegeometry of graphs and some of its algorithmicapplications. Combinatorica, 15, 1990.
[24] E. K. Lua, T. Griffin, M. Pias, H. Zheng, andJ. Crowcroft. On the accuracy of embeddings forInternet coordinate systems. In Proc. ofACM/SIGCOMM Internet Measurement Conference,2005.
[25] H. V. Madhyastha, T. Anderson, A. Krishnamurthy,N. Spring, and A. Venkataramani. A structuralapproach to latency prediction. In Proc. ofACM/SIGCOMM Internet Measurement Conference,2006.
[26] H. V. Madhyastha, T. Isdal, M. Piatek, C. Dixon,T. E. Anderson, A. Krishnamurthy, andA. Venkataramani. iplane: An information plane fordistributed services. In Proc. of OSDI, 2006.
[27] K. R. Muller, S. Mika, G. Ratsch, K. Tsuda, andB. Scholkopf. An introduction to kernel-based learningalgorithms. IEEE Transactions on Neural Networks,12(2), 2001.
[28] T. S. E. Ng and H. Zhang. Predicting Internetnetwork distance with coordinates-based approaches.In Proc. of IEEE INFOCOM, 2002.
[29] R. V. Oliveira, D. Pei, W. Willinger, B. Zhang, and
L. Zhang. In search of the elusive ground truth: theinternet’s as-level connectivity structure. InSIGMETRICS, 2008.
[30] V. Paxson and S. Floyd. Wide-area traffic: The failureof Poisson modeling. IEEE/ACM Transactions onNetworking, 3(3), 1995.
[31] V. Paxson and S. Floyd. Why we don’t know how tosimulate the Internet. In Proc. of Winter SimulationConference, 1997.
[32] M. Pias, J. Crowcroft, S. Wilbur, S. Bhatti, andT. Harris. Lighthouses for scalable distributedlocation. In Proc. of IPTPS, 2003.
[33] S. Ratnasamy, M. Handley, R. Karp, and S. Shenker.Topologically aware overlay construction and serverselection. In Proc. of IEEE INFOCOM, 2002.
[34] M. Schroeder. Fractal, Chaos and Power Laws:Minutes from an Infinite Paradise. W. H. Freemanand Co., NY, 1990.
[35] Y. Shavitt and T. Tankel. Big-bang simulation forembedding network distances in Euclidean space.IEEE/ACM Transactions on Networking, 12(6), 2004.
[36] Y. Shavitt and T. Tankel. On the curvature of theInternet and its usage for overlay construction anddistance estimation. In Proc. of IEEE INFOCOM,2004.
[37] N. Spring, R. Mahajan, and T. Anderson. Quantifyingthe causes of path inflation. In Proc. of ACMSIGCOMM, 2003.
[38] G. Strang. Linear Algebra and its Application, 2nd.Ed. Academic Press, 1980.
[39] L. Tang and M. Crovella. Virtual landmarks for theInternet. In Proc. of ACM/SIGCOMM InternetMeasurement Conference 2003, 2003.
[40] L. Tang and M. Crovella. Geometric exploration of thelandmark selection problem. In Proc. of Passive andActive Measurement Workshop, 2004.
[41] J. B. Tenenbaum, V. de Silva, and J. C. Langford. Aglobal geometric framework for nonlineardimensionality reduction. Science, 290(5500), 2000.
[42] G. Wang, B. Zhang, and T. S. E. Ng. Towardsnetwork triangle inequality violation aware distributedsystems. In Proc. of ACM/SIGCOMM InternetMeasurement Conference, 2007.
[43] W. Willinger, W. E. Leland, M. S. Taqqu, and D. V.Wilson. On the self-similar nature of Ethernet traffic(extended version). IEEE/ACM Transactions onNetworking, 2(1), 1994.
[44] B. Wong, A. Slivkins, and E. G. Sirer. Meridian: alightweight network location service without virtualcoordinates. SIGCOMM Comput. Commun. Rev.,35(4), 2005.
[45] B. Zhang, T. S. E. Ng, A. Nandi, R. Riedi,P. Druschel, and G. Wang. Measurement basedanalysis, modeling, and synthesis of the Internet delayspace. In Proc. of ACM/SIGCOMM InternetMeasurement Conference, 2006.
[46] R. Zhang, C. Hu, X. Lin, and S. Fahmy. A hierarchicalapproach to Internet distance prediction. In Proc. ofIEEE International Conference on DistributedComputing Systems, 2006.


