Embed Size (px)
Citation preview

Chemical Engineering Science 72 (2012) 51–60
Contents lists available at SciVerse ScienceDirect
Chemical Engineering Science
0009-25
doi:10.1
n Corr
and Ch
Stockho
E-m
journal homepage: www.elsevier.com/locate/ces
On the local filtration properties of microcrystalline cellulose duringdead-end filtration
Tuve Mattsson a,b, Maria Sedin a, Hans Theliander a,b,n
a Department of Chemical & Biological Engineering, Chalmers University of Technology, SE-412 96 Gothenburg, Swedenb Wallenberg Wood Science Center, Forest Products and Chemical Engineering, Chalmers University of Technology, SE-100 44 Stockholm, Sweden
a r t i c l e i n f o
Article history:
Received 18 November 2011
Received in revised form
12 January 2012
Accepted 13 January 2012Available online 20 January 2012
Keywords:
Filtration
Porous media
Separation
Skin formation
Flow stabilisation
Mathematical modelling
09/$ - see front matter & 2012 Elsevier Ltd. A
016/j.ces.2012.01.022
esponding author at: Wallenberg Wood Scie
emical Engineering, Chalmers University
lm, Sweden. Tel.: þ46 31 772 29 92; fax: þ4
ail address: [email protected] (H. Theliande
a b s t r a c t
Dead-end filtration is frequently used in solid–liquid separation. In order to increase understanding
of the filtration of materials that form compressible cakes, local filtration properties need to be taken
into consideration. The compressible nature of these filter cakes requires phenomena such as skin
formation, a dense layer of high filtration resistance close to the filter medium and flow stabilisation to
be considered. This study investigates local filtration properties, i.e. the hydrostatic pressure and
solidosity, in the dead-end filtration of microcrystalline cellulose, using slurries of varying pH levels and
concentrations and two different filter media. The local measurements indicated that a dense skin was
formed. This could be avoided when the nature of the particle–particle and particle–filter medium
interactions was altered, using the pH to regulate the surface charge. Local filtration properties were
used to find a critical material dependent Reynolds number indicating a flow stabilisation behaviour.
& 2012 Elsevier Ltd. All rights reserved.
1. Introduction
Dead-end filtration is employed as a means of separating solidsfrom liquids in an energy-efficient manner and, as such, it is animportant unit operation. Dead-end filtration is used extensivelyin many sectors, ranging from forest products and minerals tothe chemical process and pharmaceutical industries. Excellent costefficiency means that filtration is often the preferred method ofsolid–liquid separation complemented, if necessary, with a dryingstage to reach higher levels of dryness.
The fundaments of dead-end filtration are based on Darcy’swork with respect to flow through porous beds (Darcy, 1856). TheDarcy equation for flow and pressure drop over a stationaryporous bed can be used to construct models for growing cakes:it is the source of the classical filtration equation that is based onthe average properties of the bed being formed (e.g. Ruth, 1935).The classical filtration equation is derived from the assumptionthat the filter cake formed is incompressible: an assumptionthat works well for some materials, especially the inorganickind. Materials that form compressible cakes, however, requirean approach that uses local filtration properties.
When local filtration properties such as the local solidosity (thevolume fraction of solids), filtration resistance and pressure are
ll rights reserved.
nce Center, Forest Products
of Technology, SE-100 44
6 31 772 29 95.
r).
being considered, constitutive relationships are necessary to relatethese to each other. Several approaches for this can be found in theliterature; they include the use of empirical equations (e.g. Tiller andLeu, 1980), the Kozeny–Carman equation (Kozeny, 1927) based onthe assumption of laminar flow through capillaries and cell models,e.g. Happel’s cell model (Happel, 1958).
Several investigations of local filtration properties have beenconducted in studies using a range of techniques. Local pressurewithin a filter cake has been studied using pressure probes indifferent configurations in several studies (e.g. Chase and Willis,1992; Fathi-Najafi and Theliander, 1995; Johansson and Theliander,2003; Mattsson et al., 2011a; Okamura and Shirato, 1955; Shiratoet al., 1971). Local solidosity has been investigated for filtration andsedimentation using a range of techniques: x-rays and g-attenuationhave been used in several studies (e.g. Bergstrom, 1992; Bierck et al.,1988; Johansson and Theliander, 2003; Mattsson et al., 2011a; Tilleret al., 1995). 1H NMR has been used to determine the solidosity of afilter cake during its build up and expression (e.g. La Heij et al.,1996). Conductivity measurements have also been used to deter-mine local solidosity (e.g. Chase and Willis, 1992; Holdich andSinclair, 1992; Rietema, 1953; Shirato et al., 1971), as well asthe dissection of cakes (e.g. Dell and Sinha, 1964; Meeten, 1993;Smiles and Rosenthal, 1968). A few of these studies have measuredboth the local solidosity and the local pressure (e.g. Chase andWillis, 1992; Johansson and Theliander, 2003; Rietema, 1953;Shirato et al., 1971).
In the case of compressible cakes it has been suggested that adense skin may be formed close to the filter medium. Whilst
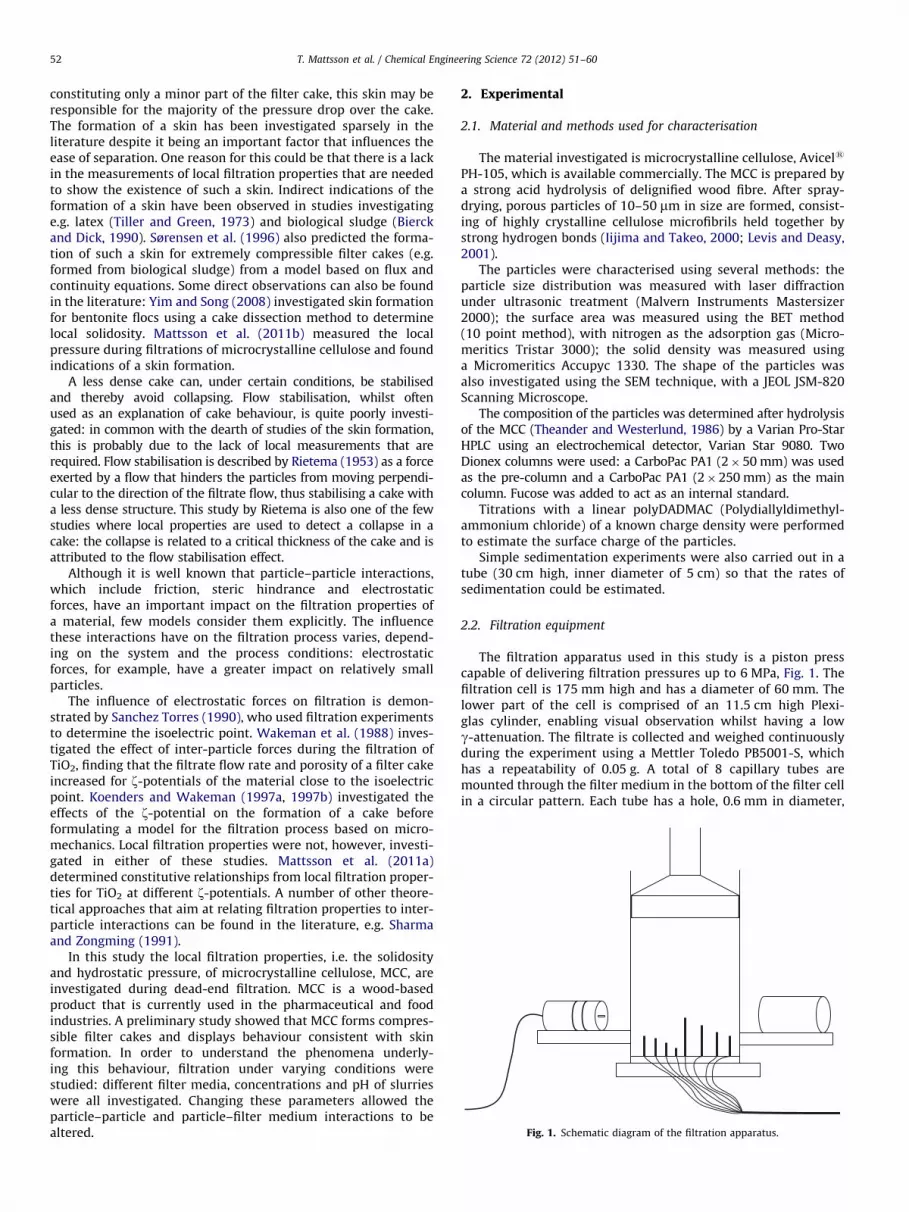
Fig. 1. Schematic diagram of the filtration apparatus.
T. Mattsson et al. / Chemical Engineering Science 72 (2012) 51–6052
constituting only a minor part of the filter cake, this skin may beresponsible for the majority of the pressure drop over the cake.The formation of a skin has been investigated sparsely in theliterature despite it being an important factor that influences theease of separation. One reason for this could be that there is a lackin the measurements of local filtration properties that are neededto show the existence of such a skin. Indirect indications of theformation of a skin have been observed in studies investigatinge.g. latex (Tiller and Green, 1973) and biological sludge (Bierckand Dick, 1990). Sørensen et al. (1996) also predicted the forma-tion of such a skin for extremely compressible filter cakes (e.g.formed from biological sludge) from a model based on flux andcontinuity equations. Some direct observations can also be foundin the literature: Yim and Song (2008) investigated skin formationfor bentonite flocs using a cake dissection method to determinelocal solidosity. Mattsson et al. (2011b) measured the localpressure during filtrations of microcrystalline cellulose and foundindications of a skin formation.
A less dense cake can, under certain conditions, be stabilisedand thereby avoid collapsing. Flow stabilisation, whilst oftenused as an explanation of cake behaviour, is quite poorly investi-gated: in common with the dearth of studies of the skin formation,this is probably due to the lack of local measurements that arerequired. Flow stabilisation is described by Rietema (1953) as a forceexerted by a flow that hinders the particles from moving perpendi-cular to the direction of the filtrate flow, thus stabilising a cake witha less dense structure. This study by Rietema is also one of the fewstudies where local properties are used to detect a collapse in acake: the collapse is related to a critical thickness of the cake and isattributed to the flow stabilisation effect.
Although it is well known that particle–particle interactions,which include friction, steric hindrance and electrostaticforces, have an important impact on the filtration properties ofa material, few models consider them explicitly. The influencethese interactions have on the filtration process varies, depend-ing on the system and the process conditions: electrostaticforces, for example, have a greater impact on relatively smallparticles.
The influence of electrostatic forces on filtration is demon-strated by Sanchez Torres (1990), who used filtration experimentsto determine the isoelectric point. Wakeman et al. (1988) inves-tigated the effect of inter-particle forces during the filtration ofTiO2, finding that the filtrate flow rate and porosity of a filter cakeincreased for z-potentials of the material close to the isoelectricpoint. Koenders and Wakeman (1997a, 1997b) investigated theeffects of the z-potential on the formation of a cake beforeformulating a model for the filtration process based on micro-mechanics. Local filtration properties were not, however, investi-gated in either of these studies. Mattsson et al. (2011a)determined constitutive relationships from local filtration proper-ties for TiO2 at different z-potentials. A number of other theore-tical approaches that aim at relating filtration properties to inter-particle interactions can be found in the literature, e.g. Sharmaand Zongming (1991).
In this study the local filtration properties, i.e. the solidosityand hydrostatic pressure, of microcrystalline cellulose, MCC, areinvestigated during dead-end filtration. MCC is a wood-basedproduct that is currently used in the pharmaceutical and foodindustries. A preliminary study showed that MCC forms compres-sible filter cakes and displays behaviour consistent with skinformation. In order to understand the phenomena underly-ing this behaviour, filtration under varying conditions werestudied: different filter media, concentrations and pH of slurrieswere all investigated. Changing these parameters allowed theparticle–particle and particle–filter medium interactions to bealtered.
2. Experimental
2.1. Material and methods used for characterisation
The material investigated is microcrystalline cellulose, Avicels
PH-105, which is available commercially. The MCC is prepared bya strong acid hydrolysis of delignified wood fibre. After spray-drying, porous particles of 10–50 mm in size are formed, consist-ing of highly crystalline cellulose microfibrils held together bystrong hydrogen bonds (Iijima and Takeo, 2000; Levis and Deasy,2001).
The particles were characterised using several methods: theparticle size distribution was measured with laser diffractionunder ultrasonic treatment (Malvern Instruments Mastersizer2000); the surface area was measured using the BET method(10 point method), with nitrogen as the adsorption gas (Micro-meritics Tristar 3000); the solid density was measured usinga Micromeritics Accupyc 1330. The shape of the particles wasalso investigated using the SEM technique, with a JEOL JSM-820Scanning Microscope.
The composition of the particles was determined after hydrolysisof the MCC (Theander and Westerlund, 1986) by a Varian Pro-StarHPLC using an electrochemical detector, Varian Star 9080. TwoDionex columns were used: a CarboPac PA1 (2�50 mm) was usedas the pre-column and a CarboPac PA1 (2�250 mm) as the maincolumn. Fucose was added to act as an internal standard.
Titrations with a linear polyDADMAC (Polydiallyldimethyl-ammonium chloride) of a known charge density were performedto estimate the surface charge of the particles.
Simple sedimentation experiments were also carried out in atube (30 cm high, inner diameter of 5 cm) so that the rates ofsedimentation could be estimated.
2.2. Filtration equipment
The filtration apparatus used in this study is a piston presscapable of delivering filtration pressures up to 6 MPa, Fig. 1. Thefiltration cell is 175 mm high and has a diameter of 60 mm. Thelower part of the cell is comprised of an 11.5 cm high Plexi-glas cylinder, enabling visual observation whilst having a lowg-attenuation. The filtrate is collected and weighed continuouslyduring the experiment using a Mettler Toledo PB5001-S, whichhas a repeatability of 0.05 g. A total of 8 capillary tubes aremounted through the filter medium in the bottom of the filter cellin a circular pattern. Each tube has a hole, 0.6 mm in diameter,

Table 1BET surface area, density and size of the particles at neutral pH. D(x) indicates that
x% in volume of the particles are smaller than the value stated.
BET surface
area (m2/g)
Density (kg/m3) D(10) (mm) D(50) (mm) D(90) (mm)
2.1 1560 9.9 21.6 42.2
0
2
4
6
8
10
12
101 100
Vol
ume
%
Particle size [μm]
Fig. 2. Size distribution of the MCC particles based on volume at neutral pH.
Fig. 3. SEM photograph of the MCC particles. The black line indicates a distance
of 10 mm.
T. Mattsson et al. / Chemical Engineering Science 72 (2012) 51–60 53
located perpendicular to the flow. These tubes are connected topressure transducers, enabling local measurement of the hydro-static pressure to be made at eight different heights. The capillarytubes are filled with degased, distilled water. After each experi-ment the tubes were checked for plugging by particles andthoroughly flushed. A movable rack with a 241Am g-source anddetector is used to measure the total attenuation for a selected1 mm high horizontal slice of the filter cell. The total number ofcounts registered in the detector for energies ranging from 36 keVto 91 keV is collected after both filtration and expression, for20 min each at several different heights. This data can then beused to calculate a local solidosity at these particular heights inthe filter cake. A detailed description of the apparatus can befound elsewhere (Johansson and Theliander, 2003).
2.3. Filter media
Two different filter media were used in the filtration experi-ments: filter medium 1 (FM1) was a hydrophilic polyethersul-phone filter (Supors-450) and filter medium 2 (FM2) was ahydrophilic regenerated cellulose membrane filter (SartoriusStedim 18406-100-G). According to the manufacturers both filtershave a pore size of 0.45 mm. In addition, a grade 5 Munktell filterpaper was used as a support medium in every experiment.
2.4. Filtration experiments
Each filtration experiment was performed at a filtrationpressure of 0.3 MPa. Three pH levels were investigated: 2.9,6.3 and 9.3. Two different slurry concentrations, 5% and 10% involume, were used. The slurry was prepared in advance and left,whilst being stirred, for at least 12 h but no longer than 48 hbefore being used in the filtration experiment. The pH value of theslurry was adjusted with NaOH for the high pH value and HCl forthe low. Adjusting the pH allowed the degree of protonation ofthe carboxylic acidic groups, pKa 3–4 (Sjostrom, 1989), on thecellulose to be changed, thus altering the surface charge of theparticles. A total of 15 experiments, including duplicates, wereperformed.
At the end of the filtration experiment the piston was haltedbefore it reached the filter cake that had been formed. Solidositymeasurements were then made at 7 or 8 heights to map thesolidosity profile of the cake. The solidosity was measured at7 heights for cakes formed with a 5% slurry concentration, withthe highest being at 21 mm from the filter medium; 8 measure-ments, up to 36 mm, were made for cakes formed with a 10%concentration. The lowest measurement was made at 2 mmabove the medium: the high attenuation of the metal at thebottom of the filter cell prevented measurements being made anylower down.
Once the measurements were complete the same pressure, i.e.0.3 MPa, was reapplied to the piston and the expression phasebegan. The cake was allowed to reach equilibrium and, after atleast 12 h had passed, the solidosity measurements were repeatedto yield a profile after expression. The expressed cake wasweighed, freeze-dried and reweighed to calculate its final averagesolidosity.
3. Characterisation
3.1. Microcrystalline cellulose
The MCC particles were characterised according to the meth-ods described in Section 2.1; a summary of their characteristicscan be found in Table 1.
Fig. 2 shows the complete distribution of particle size. Whilstmeasured at neutral pH, measurements at pH levels of 2.9 and9.3 gave quite similar results.
An example of an SEM photograph of the dry MCC particlesis shown in Fig. 3. The particles appear to be approximatelycylindrical in shape. The size distribution of the particles seen inthe photograph is rather wide: the smallest particles are in therange of a few microns and the largest are about 100 mm in size.This range corresponds reasonably well with the measurementsof the distribution in size that were made using laser diffraction.The BET surface area was determined to be 2.1 m2/g in a doublesample; assuming a perfect sphere, this corresponds to a particlediameter of about 2 mm. It is not surprising that the BET surfaceyields a smaller calculated particle diameter than the particle sizedistribution: irregularities in shape of the particles, would beincluded in the BET measurements. Different particles sizes will

Fig. 4. SEM photograph of FM1. The black line indicates a distance of 10 mm. Fig. 5. SEM photograph of FM2. The black line indicates a distance of 10 mm.
T. Mattsson et al. / Chemical Engineering Science 72 (2012) 51–6054
also contribute differently to the diameter measured with laserdiffraction and the diameter calculated from the surface mea-sured with BET.
Analysis of the particles after hydrolysis indicated that theywere composed of quite pure cellulose, with a negligible contentof lignin and low amounts of hemicelluloses. Glucose constituted97% in weight of the carbohydrate monomers, while the hemi-cellulose monomers xylane and mannase were each detected inamounts of about 1.5% in weight. The titrations indicated thatthe particles had a somewhat negative charge: in the range of�1 meq g�1 at pH 6.3/9.3 and close to zero at pH 2.9.
The simple sedimentation experiments indicated a constantsedimentation velocity of about 7�10�5 m/s for the 5% slurriesand 2�10�5 m/s for the 10% slurries.
3.2. The filter media
The filter media were investigated using SEM, see Figs. 4 and 5.The surface structures of the filter media differ from each
other: FM2 has a stacked structure that resembles a spider’s web,whereas FM1 is composed of interconnected elongated elements.The pore openings of both media are in the order of a few micronsin size.
The surface charge of each media was estimated by millingthem before titrating with a polymer of known charge density.Both filter media were found to have a weak charge at pH 6.3/9.3:in the range from �0.5 to �0.9 meq g�1 for FM1 and from �1 to�1.8 meq g�1 for FM2. At a lower pH, i.e. 2.9, the charge wasfound to be close to zero for both.
4. Evaluation of the experimental data
4.1. Local solidosity
The local solidosity profile of the cake after filtration and afterexpression was determined from the g-attenuation measurement
using the Beer–Lambert law for two phases:
�lnng
ng,0¼ mg,ldgþðmg,s�mg,lÞdgf ð1Þ
where Zg is the number of counts, Zg,0 the number of counts forthe empty filter cell, mg,l the attenuation coefficient of the liquidphase, mg,s the attenuation coefficient of the solid phase, dg theaverage path of the g-radiation within the filter cell and f thevolume fraction of solids, i.e. the solidosity.
The attenuation coefficients were determined by calibration. Inthe case of water this could be determined directly by filling thefiltration cell with pure water and measuring the attenuation; forthe MCC, the filter cakes were used. The local solidosity at heightsover 2 cm from the filter medium were measured after at least 12 hof expression at uniform pressure, which ensured a uniform profile;they were then related to the average solidosity of the whole cakeafter freeze drying. The following attenuation coefficients werethereby obtained: mg,l¼19.8 m�1, mg,s¼28.9 m�1. The error in themeasurements of the local solidosity between individual experi-ments was estimated to be less than 70.01 (m3 solids/m3 cake).The calibration procedure determining the absolute solidosity levelsin all of the experiments adds uncertainty, making the absolute localsolidosity values accurate to within 70.03 (m3 solids/m3 cake).
4.2. Average specific filtration resistance
The average specific filtration resistance was estimated usingthe classical filtration theory. The classical filtration equation (e.g.Ruth, 1935) relates the inversed filtrate flow, dt=dV , through afilter cake to a cake and filter media resistance according to thefollowing equation for filtration at constant pressure:
dt
dV¼mðaavcVþRmAÞ
A2DPð2Þ
where t is the time, V the volume of the filtrate, m the viscosity ofthe fluid, aav the average specific filtration resistance, c the massof solids per unit filtrate volume, Rm the resistance of the filtermedia, A the filtration area and DP the pressure drop over the cakeand filtration medium.
0
0.05
0.1
0.15
0.2
0.25
0.3
0 100 200 300 400
Pl
[MP
a]
V [ml]
1 mm
2 mm
3 mm
5 mm
7 mm
9 mm
12 mm
Fig. 6. Local hydrostatic measurement that indicates a pressure drop over the
cake (FM1, low pH, 5%).
0.15
0.2
0.25
0.3
0.35
Pl [
MP
a]
1 mm
2 mm
3 mm
5 mm
T. Mattsson et al. / Chemical Engineering Science 72 (2012) 51–60 55
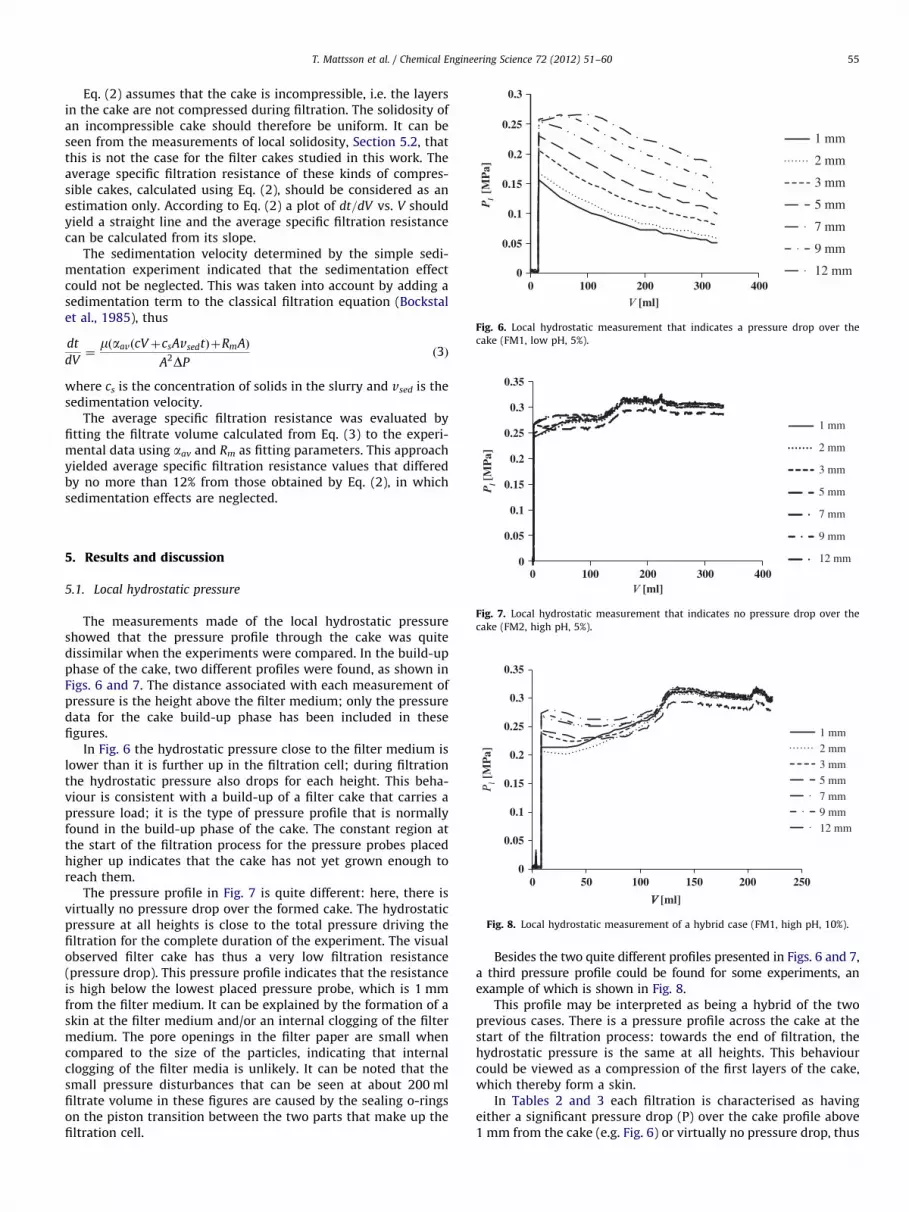
Eq. (2) assumes that the cake is incompressible, i.e. the layersin the cake are not compressed during filtration. The solidosity ofan incompressible cake should therefore be uniform. It can beseen from the measurements of local solidosity, Section 5.2, thatthis is not the case for the filter cakes studied in this work. Theaverage specific filtration resistance of these kinds of compres-sible cakes, calculated using Eq. (2), should be considered as anestimation only. According to Eq. (2) a plot of dt=dV vs. V shouldyield a straight line and the average specific filtration resistancecan be calculated from its slope.
The sedimentation velocity determined by the simple sedi-mentation experiment indicated that the sedimentation effectcould not be neglected. This was taken into account by adding asedimentation term to the classical filtration equation (Bockstalet al., 1985), thus
dt
dV¼mðaavðcVþcsAvsedtÞþRmAÞ
A2DPð3Þ
where cs is the concentration of solids in the slurry and vsed is thesedimentation velocity.
The average specific filtration resistance was evaluated byfitting the filtrate volume calculated from Eq. (3) to the experi-mental data using aav and Rm as fitting parameters. This approachyielded average specific filtration resistance values that differedby no more than 12% from those obtained by Eq. (2), in whichsedimentation effects are neglected.
0
0.05
0.1
0 100 200 300 400V [ml]
7 mm
9 mm
12 mm
Fig. 7. Local hydrostatic measurement that indicates no pressure drop over the
cake (FM2, high pH, 5%).
0
0.05
0.1
0.15
0.2
0.25
0.3
0.35
0 50 100 150 200 250
Pl [
MP
a]
V V [ml]
1 mm 2 mm 3 mm 5 mm 7 mm 9 mm 12 mm
Fig. 8. Local hydrostatic measurement of a hybrid case (FM1, high pH, 10%).
5. Results and discussion
5.1. Local hydrostatic pressure
The measurements made of the local hydrostatic pressureshowed that the pressure profile through the cake was quitedissimilar when the experiments were compared. In the build-upphase of the cake, two different profiles were found, as shown inFigs. 6 and 7. The distance associated with each measurement ofpressure is the height above the filter medium; only the pressuredata for the cake build-up phase has been included in thesefigures.
In Fig. 6 the hydrostatic pressure close to the filter medium islower than it is further up in the filtration cell; during filtrationthe hydrostatic pressure also drops for each height. This beha-viour is consistent with a build-up of a filter cake that carries apressure load; it is the type of pressure profile that is normallyfound in the build-up phase of the cake. The constant region atthe start of the filtration process for the pressure probes placedhigher up indicates that the cake has not yet grown enough toreach them.
The pressure profile in Fig. 7 is quite different: here, there isvirtually no pressure drop over the formed cake. The hydrostaticpressure at all heights is close to the total pressure driving thefiltration for the complete duration of the experiment. The visualobserved filter cake has thus a very low filtration resistance(pressure drop). This pressure profile indicates that the resistanceis high below the lowest placed pressure probe, which is 1 mmfrom the filter medium. It can be explained by the formation of askin at the filter medium and/or an internal clogging of the filtermedium. The pore openings in the filter paper are small whencompared to the size of the particles, indicating that internalclogging of the filter media is unlikely. It can be noted that thesmall pressure disturbances that can be seen at about 200 mlfiltrate volume in these figures are caused by the sealing o-ringson the piston transition between the two parts that make up thefiltration cell.
Besides the two quite different profiles presented in Figs. 6 and 7,a third pressure profile could be found for some experiments, anexample of which is shown in Fig. 8.
This profile may be interpreted as being a hybrid of the twoprevious cases. There is a pressure profile across the cake at thestart of the filtration process: towards the end of filtration, thehydrostatic pressure is the same at all heights. This behaviourcould be viewed as a compression of the first layers of the cake,which thereby form a skin.
In Tables 2 and 3 each filtration is characterised as havingeither a significant pressure drop (P) over the cake profile above1 mm from the cake (e.g. Fig. 6) or virtually no pressure drop, thus

Table 2Characterisation of pressure profiles over the filter cake for FM1.
pH/Slurry conc. 5% 10%
2.9 P P
6.3 P H
9.3 P H
Table 3Characterisation of pressure profiles over the filter cake for FM2.
pH/Slurry conc. 5% 10%
2.9 P P
6.3 C C
9.3 C C
Table 4Filtrate volume (ml) collected at the time of collapse for filtrations using FM1
(/ indicates replicates.).
pH/Slurry conc. 5% 10%
2.9 – –
6.3 – 53
9.3 – 120/88/100
Table 5Filtrate volume (ml) collected at the time of collapse
for filtrations using FM2 (/ indicates replicates.).
pH/Slurry conc. 5% 10%
2.9 –/– –
6.3 125 15
9.3 111 24
T. Mattsson et al. / Chemical Engineering Science 72 (2012) 51–6056
resulting in an almost constant (C) profile (e.g. Fig. 7) or a hybridcase (H) (e.g. Fig. 8).
Regardless of the concentration of the slurry a pressure drop isobtained across the cake for both media at the lower pH level.A constant pressure profile is found for the filtrations with FM2 atthe two higher pH levels, whilst the corresponding profiles forFM1 are a pressure drop at the low concentration of slurry andhybrid behaviour for the high concentration. These results indi-cate that the formation of a skin is influenced both by the filtermedium and the pH: the former interacts with the top layers ofthe cake, thus affecting its structure, and the latter alters theinteractions between the particles and between the particles andthe filter medium.
In Figs. 7 and 8 an increase in the hydrostatic pressure at allheights can be observed after some length of time: in these twoexperiments it occurs after 100 ml. Indicating an increase inresistance below the lowest pressure probe, the increase inpressure is also relatively fast, thereby suggesting that the cakestructure may have experienced a collapse. Such a collapse takesplace below the lowest pressure measurement, which is inaccordance with the fact that the highest compression pressureis to be found at the bottom of the cake. This increase inhydrostatic pressure can only be observed in experiments thatdisplay either a hybrid or constant pressure profile. The filtratevolumes at which this collapse takes place are reported inTables 4 and 5; they range from quite low to significantly higheramounts at the time for this collapse. This phenomenon isinvestigated further in Section 5.4.
5.2. Local solidosity
The solidosity profiles of the filter cakes after the cake-build-up phase but prior to expression are visualised in Fig. 9, groupedafter choice of filter medium and slurry concentration. The finalheights of the filter cake after expression were about 25 mm forthe 5% slurry and 50 mm for the 10% slurry; the solidosity of thesecakes after expression was in the range of 0.3–0.35.
A solidosity profile, clearly visible for all of the experiments,shows that the local solidosity increases closer to the filtermedium. The skin indicated by the pressure probes could not beobserved directly since it is assumed to be situated below 2 mm.The differences in the profiles measured in the experiments usingthe 5% slurry are small between the different filter papers andslurry pH used. In the trials using the 10% slurry, on the otherhand, the neutral and high pH filtrations are characterised by asomewhat lower local solidosity than those at low pH. This can beattributed to the decreased repulsion between particles at low pHlevels, as the surface charge is lower than at higher pH levels. Theparticles with a low surface charge repel each other to a lesserdegree, which enables them to pack more closely together thancharged particles. This phenomenon becomes pronounced for the10% slurry where the higher concentration of particles makescloser packing more difficult.
5.3. Average specific filtration resistance
Fig. 10 shows the dt=dV vs. V plots of the individualexperiments.
Some of the filtration experiments were repeated (see Fig. 10band c), indicating a good repeatability between the experiments.The pressure profile discussed in Section 5.1 was also quitesimilar for the experiments performed under the same conditions.
Most of the experiments display a linear behaviour with theexception of those at high and neutral pH using FM1 and the10% slurry: the slope of the dt=dV vs. V plot increases for theseparticular experiments. This increase can be seen as a continuousprocess but, as there is a rather sudden transition, the plot canalso be divided into two linear segments: the first has a slope thatis less steep than the second. It should be observed that each ofthese filtrations had a hybrid pressure profile: in Figs. 11 and 12the dt=dV vs. V plot can be related to the local pressure profile fora case of a segmented or straight plot.
The shift in the segmented plot, Fig. 11, can be related to thetransition from a pressure profile with a pressure drop over thecake to one of a uniform profile. Fig. 12 shows that the dt=dV vs. V
plot is linear through the uniform increase in local hydrostaticpressure, i.e. the collapse, indicating that it is the formation of theskin that has a significant impact on the filtration resistance ofthe cake.
Although the classical filtration theory predicts a pressuredrop over the cake, the dt=dV vs. V plot is quite linear even inthe cases with a constant pressure profile from 1 mm and upthrough the cake. One way of viewing this could be to consider acase where two filtration processes run sequentially. A less densecake, with a low filtration resistance, is formed in the larger partof the cell. The dense cake at the bottom of the cell, which gives asignificant pressure drop, is also built up through filtration sincethe material is filtered through the less dense cake above it. This‘‘dual’’ filtration approach would explain the general build-up ofthe cake as well as the linearity of the dt=dV vs. V plot. The dt=dV
vs. V slope for filtration in which a pressure drop can be seen overthe whole cake would thus be related to the filtration resistanceof a skinless cake. While for a case where the vast majority of thepressure drop is located over the skin, this slope corresponds to

0.15
0.2
0.25
0.3
0 5 10 15 20 25z [mm]
z z [mm] z [mm]
z [mm]
Low Neutral High
0.15
0.2
0.25
0.3
0.35Low Neutral High High High
0.15
0.2
0.25
0.3
0.35
0
Low
Neutral
High
0.15
0.2
0.25
0.3
0.35
0 10 20 30 40
10 20 30 400 5 10 15 20 25
Low
Low
Neutral
High
φ [-
] φ
[-]
φ [-
] φ
[-]
0.35
Fig. 9. (a) Local solidosity at the different pH levels for filtrations of 5% slurries using FM1. (b) Local solidosity at the different pH levels for filtrations of 10% slurries using FM1.
(c) Local solidosity at the different pH levels for filtrations of 5% slurries using FM2. (d) Local solidosity at the different pH levels for filtrations of 10% slurries using FM2.
0
0.1
0.2
0.3
0.4
0.5
0.6
0.7
0 100 200 300 400
Low
Neutral
High
0
0.2
0.4
0.6
0.8
1
1.2
1.4
1.6
1.8
2
0 100 200 300 400
Low
Low
Neutral
High
0
0.5
1
1.5
2
2.5
3
3.5
0 100 200 300
Low
Neutral
High
High
High
0
0.5
1
1.5
2
2.5
3
3.5
0 50 100 150 200 250
Low
Neutral
High
dt/d
Vdt
/dV
[s/
ml]
dt
/dV
dt/d
V [
s/m
l]
dt/d
Vdt
/dV
[s/
ml]
dt
/dV
dt/d
V [
s/m
l]
V V [ml] V V [ml]
V V [ml] V [ml]
Fig. 10. (a) dt=dV vs. plots for filtrations of 5% slurries using FM1. (b) dt=dV vs. plots for filtrations of 10% slurries using FM1. (c) dt=dV vs. plots for filtrations of 5% slurries
using FM2. (d) dt=dV vs. plots for filtrations of 10% slurries using FM2.
T. Mattsson et al. / Chemical Engineering Science 72 (2012) 51–60 57

0
0.5
1
1.5
2
2.5
3
3.5
0
0.05
0.1
0.15
0.2
0.25
0.3
0.35
0 50 100 150 200 250
dt/d
V [s
/ml]
P l [
MP
a]
V [ml]
1 mm 2 mm 3 mm 5 mm 7 mm 9 mm 12 mm
Fig. 11. Local hydrostatic pressure and dt=dV vs. plot showing 2 segments (FM1,
high pH, 10% conc.).
0
0.5
1
1.5
2
2.5
3
0
0.05
0.1
0.15
0.2
0.25
0.3
0.35
0 100 200 300 400
dt/d
V [s
/ml]
Pl [
MP
a]
V [ml]
1 mm 2 mm 3 mm 5 mm 7 mm 9 mm 12 mm
Fig. 12. Local hydrostatic pressure and dt=dV vs. plot showing 1 segment (FM2,
high pH, 5% conc.).
Table 6Average specific filtration resistance of filtrations using FM1.
pH/Slurry conc. aav�10�10 (m kg�1)
5% 10%
2.9 1.4 1.5
6.3 3.3 11.4/43.9
9.3 2.5 6.3/15.6
9.3 – 8.0/23.4
9.3 – 4.7/36.7
Table 7Average specific filtration resistance of filtrations using FM2.
pH/Slurry conc. aav�10�10 (m kg�1)
5% 10%
2.9 2.4 1.4
2.9 1.4 –
6.3 28.9 48.7
9.3 28.2 23.3
T. Mattsson et al. / Chemical Engineering Science 72 (2012) 51–6058
the filtration resistance of the second filtration, i.e. when the cakeis filtered forming a dense skin.
The average specific filtration resistance was calculated usingEq. (3) and can be found in Tables 6 and 7. Two values are givenfor the experiments that show a segmented dt=dV plot: one eachfor the initial and secondary slopes.
Comparing Tables 6 and 7 to Tables 2 and 3 shows a clearcorrelation between the hydrostatic pressure profile and theaverage specific filtration resistance. The filtration resistance isabout 1–3�1010 m kg�1 in filtrations where there is a pressuredrop over the cake profile while for the cases with a constantpressure profile it is in the range of 2–4�1011 m kg�1, i.e. anorder of magnitude higher. The filtrations with a hybrid profilegive two values: one of the same order of magnitude as for thefiltrations with a pressure drop over the profile and the other inthe same range as for the filtrations with a constant profile. Thedifference of an order of magnitude in the average specificfiltration resistance between filtrations in which a skin is formedor not demonstrates the importance of choosing the processparameters for this separation.
The average specific filtration resistance at pH 2.9 is somewhatlower than for the experiments at higher pH levels, which alsohad a pressure drop over the cake profile. This may be an effect ofthe low surface charge of the particles at pH 2.9 which decreasestheir electrostatic resistance to form agglomerations, thus facil-itating separation and decreasing the filtration resistance.
Comparing the average specific filtration resistances for theexperiments at pH levels of 6.3 and 9.3 reveals a trend of a
somewhat higher filtration resistance at pH 6.3, although thecharacterisation of the material and filter media indicated thesurface charge to be similar for both levels. One way of explainingthis trend could be to consider the ionic strength of the slurry.While the particles of the system still have the same chargethe higher ionic strength, which is a result of the NaOH added,increases the electrostatic shielding in the experiments at pH 9.3.This would lead to behaviour similar to that seen for theseexperiments at pH 2.9 when compared to those at pH 6.3, whereno ions were added.
5.4. Local flow conditions
The local pressure profiles indicated that a collapse occurredin the cake in some of the filtrations. This phenomenon couldbe investigated from the perspective of flow stabilisation: theflow passing through the cake helps it maintain a more porousstructure. The collapse could then be initiated by a change in theflow conditions within the cake; local flow conditions need to beconsidered for this to be investigated.
The Hagen–Poiseuilles equation, which assumes laminar flowin capillaries, can be written as
�dPl
dz¼
32mvcap
D2cap
ð4Þ
where z is the distance from the filter medium, vcap the averagevelocity in the capillary, v¼vcap(1�f) and Dcap the diameter ofthe capillary. The diameter of the capillary can be expressed as
Dcap ¼4ð1�fÞ
Spfð5Þ
where Sp is the specific surface area of the particle. For a sphere Sp
can be expressed as
Sp ¼ 6=Dp ð6Þ
where Dp is the diameter of the particle.Using the definition of the Reynolds number, Re, for flow in
a tube the following Reynolds number can be suggested for the

0
0.25
0.5
0.75
1
1.25
0 0.5 1 1.5
Re
·103 [
-]
FM1, Neutral, 10%
FM1, High, 10%
FM1, High, 10%
FM1, High, 10%
FM2, Neutral, 5%
FM2, Neutral, 10%
FM2, High, 5%
FM2, High, 10%
V/Vc [-]
Fig. 15. Re vs. dimensionless filtrate volume.
T. Mattsson et al. / Chemical Engineering Science 72 (2012) 51–60 59
laminar flow through the capillaries of a filter cake:
Re¼rlDcapvcap
m ¼4rlv
mSpfð7Þ
where rl is the density of the liquid.While this Reynolds number may be used as a simple model to
describe the flow conditions in the cake, several assumptions andsimplifications were used in its derivation. Although the model ofa filter cake having straight capillaries is flawed, the Kozeny–Carman equation (Kozeny, 1927) that is based on Eqs. (4) and (5)can still often be used to predict relationships between localfiltration properties.
The first layers of the cake, i.e. those closest to the filtermedium, are subjected to the highest compressible pressure,suggesting that a collapse would most likely occur in these layers.The Reynolds number was calculated according to Eq. (7) usinglocal properties. The average capillary velocity used was esti-mated from the filtrate rate using the cross sectional area of thefilter cell and the local solidosity at the lowest height investi-gated, i.e. 2 mm from the filter medium. The capillary diameter,estimated from Eqs. (5) and (6), assumed a spherical particle withthe diameter of 21.6 mm: the average particle diameter measuredby laser diffraction. An alternative would be to use the BET sur-face area measurement to estimate the diameter of the capillary,which would alter the calculated Reynolds number by the samefactor for each experiment.
The calculated Reynolds number vs. filtrate volume can be foundin Fig. 13 for several of the experiments that displayed a collapseaccording to Tables 2 and 3. Fig. 14 shows the corresponding data
0
0.5
1
1.5
2
2.5
0 20 40 60 80 100 120 140
Re
·103 [
-]
V [ml]
FM1, Neutral, 10%
FM1, High, 10%
FM1, High, 10%
FM2, Neutral, 5%
FM2, High, 5%
FM2, High, 10%
Fig. 13. Re vs. filtrate volume, with collapse.
0
0.5
1
1.5
2
2.5
3
3.5
0 100 200 300
Re
·103 [
-]
V V [ml]
FM1 Low 5%
FM1 Low 10%
FM1 Neutral 5%
FM1 High 5%
FM2 Low 5%
FM2 Low 5%
FM2 Low 10%
Fig. 14. Re vs. filtrate volume, with no collapse.
for the experiments that showed no sign of a collapse. In all of theexperiments the Reynolds number decreased as the velocity of theliquid in the cake decreased.
The calculated Reynolds number can be related to the cakecollapse by plotting the Reynolds number vs. the dimensionlessfiltrate volume, i.e. the filtrate volume divided by the criticalfiltrate volume at the point of collapse (Tables 4 and 5), Fig. 15.This allows the experiments performed under the varying condi-tions to be compared.
The collapse in each of the experiments occurred at a dimen-sionless filtrate volume of 1. Fig. 15 indicates that the range of theReynolds number at which this takes place is rather limited(0.14–0.23�10�3) for all the experiments that were performedunder quite different conditions. It can also be noted that thecalculated Reynolds numbers for the filtrations that show nosigns of a collapse are above this range during the entire cakebuild-up phase.
This behaviour indicates that the collapse is related to the localflow characteristics within the cake and that it could be inter-preted as a decrease in the stabilisation caused by the flow as itpasses through the cake. In addition, the collapse occurs within arather narrow interval of Reynolds number, indicating that acritical local Reynolds number is required for flow stabilisation totake place. While this number seems to be quite unaffected bythe pH, slurry concentration and type of filter media, it is stillmaterial specific since the particle size distribution and shapeaffect the flow conditions.
6. Conclusions
Measurements of local solidosity showed that MCC formscompressible filter cakes. There were also indications that, undercertain conditions, it can form a skin with a high filtrationresistance, thus increasing its average specific filtration resistancefrom 1–3�1010 m kg�1 to 2–4�1011 m kg�1. The filtration pro-cess of MCC was facilitated by lowering the pH, which decreasesthe surface charge. Furthermore the ionic strength was found toaffect the filtration rate. Using local filtration properties a critical,material dependent, Reynolds number was found at the point ofcollapse within the cake, indicating the existence of flow stabili-sation behaviour.
Nomenclature
A filtration area (m2)c mass of solids per unit filtrate volume (kg/m3)

T. Mattsson et al. / Chemical Engineering Science 72 (2012) 51–6060
cs concentration of solids in the slurry (kg/m3)Dcap capillary diameter (m)Dp particle diameter (m)dg average path of the g-radiation (m)K permeability (m2)Pl local liquid pressure (Pa)Rm resistance of the filter medium (m�1)Sp specific surface (m�1)t time (s)V volume of filtrate (m3)Vc critical volume of filtrate (m3)v superficial velocity in the z direction (m/s)vcap average velocity in the capillary in the z direction (m/s)vsed sedimentation velocity (m/s)z distance from the filter medium (m)
Greek letters
aav average specific filtration resistance (m/kg)Zg number of counts (dimensionless)Zg,0 number of counts for the empty filter cell
(dimensionless)m viscosity of the fluid (Pa s)mg,l attenuation coefficient of the liquid phase (m�1)mg,s attenuation coefficient of the solid phase (m�1)rl liquid density (kg/m3)f local volume fraction of solids, solidosity
(dimensionless)
Acknowledgements
The authors are indebted to the Knut and Alice WallenbergFoundation and the Swedish Research Council for their financialsupport.
References
Bergstrom, L., 1992. Sedimentation of flocculated alumina suspensions: g-raymeasurements and comparison with model predictions. J. Chem. Soc. FaradayTrans. 88 (21), 3201–3211.
Bierck, B.R., Dick, R.I., 1990. In situ examination of effects of pressure differentialon compressible cake filtration. Water Sci. Technol. 22 (12), 125–134.
Bierck, B.R., Wells, S.A., Dick, R.I., 1988. Compressible cake filtration: monitoringcake formation and shrinkage using synchrotron x-rays. J. Water Pollut.Control Fed. 60 (5), 645–650.
Bockstal, F., Fouarge, L., Hermia, J., Rahler, G., 1985. Constant pressure cakefiltration with simultaneous sedimentation. Filtr. Sep. 21, 255–257.
Chase, G.G., Willis, M.S., 1992. Compressive cake filtration. Chem. Eng. Sci. 47 (6),1373–1381.
Darcy, H.P.G., 1856. Les Fontaines Publiques de la Ville de Dijon. Victor Dalmont,Paris.
Dell, C.C., Sinha, J., 1964. The mechanism of removal of water from flocculated claysediments. Trans. J. Br. Ceram. Soc. 63, 603–614.
Fathi-Najafi, M., Theliander, H., 1995. Determination of local filtration propertiesat constant pressure. Sep. Technol. 5 (3), 165–178.
Happel, J., 1958. Viscous flow in multiparticle systems: Slow motion of fluidsrelative to beds of spherical particles. AIChE J. 4 (2), 197–201.
Holdich, R.G., Sinclair, I., 1992. Measurement of slurry solids content by electricalconductivity. Powder Technol. 72, 77–87.
Iijima, H., Takeo, K., 2000. Microcrystalline cellulose: an overview. In: Phillips,G.O., Williams, P.A. (Eds.), Handbook of Hydrocolloids. Woodhead Publishing,Cambridge, UK, pp. 331–346.
Johansson, C., Theliander, H., 2003. Measuring concentration and pressure profilesin deadend filtration. Filtration 3 (2), 114–120.
Koenders, M.A., Wakeman, R.J., 1997a. Filter cake formation from structuredsuspensions. Chem. Eng. Res. Des. 75 (A3), 309–320.
Koenders, M.A., Wakeman, R.J., 1997b. Initial deposition of interacting particles byfiltration of dilute suspensions. AIChE J. 43 (4), 946–958.
Kozeny, J., 1927. Uber Kapillare Leitung des Wasser im Boden. Sitzungsber. Akad.Wiss. Wien Math-Naturwiss. Kl. 136 (IIa), 271–306.
La Heij, E.J., Kerkhof, P.J.A.M., Kopinga, K., Pel, L., 1996. Determining porosityprofiles during filtration and expression of sewage sludge by NMR imaging.AIChE J. 42 (4), 953–959.
Levis, S.R., Deasy, P.B., 2001. Production and evaluation of size reduced grades ofmicro crystalline cellulose. Int. J. Pharm. 213, 13–24.
Mattsson, T., Sedin, M., Theliander, H., 2011a. Zeta-potential and local filtrationproperties: constitutive relationships for TiO2 from experimental filtrationmeasurements. Chem. Eng. Sci. 66, 4573–4581.
Mattsson, T., Sedin, M., Lindstrom M.E., Theliander, H., 2011b. Local filtrationproperties for hard-to-filter compressible materials. In: Proceedings of Filtech2011, vol. I, pp. 336–343.
Meeten, G.H., 1993. A dissection method for analysing filter cakes. Chem. Eng. Sci.48 (13), 2391–2398.
Okamura, S., Shirato, M., 1955. Liquid pressure distribution within cakes in theconstant pressure filtration. Kagaku Kogaku 19 (111), 104–110.
Rietema, K., 1953. Stabilizing effects in compressible filter cakes. Chem. Eng. Sci. 2,88–94.
Ruth, B.F., 1935. Studies in filtration III. Derivation of general filtration equations.Ind. Eng. Chem. 27, 707–723.
Sanchez Torres, R.M., 1990. Filtration as a method of isoelectric point determina-tion. Mater. Chem. Phys. 26, 173–180.
Sharma, M.M., Zongming, L., 1991. A model for clay filter cake properties. ColloidsSurf. 56, 357–381.
Shirato, M., Aragaki, T., Ichimura, K., Ootsuji, N., 1971. Porosity variation in filtercake under constant-pressure filtration. J. Chem. Eng. Jpn. 4 (2), 60–65.
Sjostrom, E., 1989. The origin of charge on cellulosic fibers. Nord. Pulp Pap. Res. J.2, 90–93.
Smiles, D.E., Rosenthal, M.J., 1968. The movement of water in swelling materials.Aust. J. Soil Res. 6, 237–248.
Sørensen, P.B., Mouldrup, P., Hansen, J.A.A., 1996. Filtration and expression ofcompressible cakes. Chem. Eng. Sci. 51, 967–979.
Theander, O., Westerlund, E.A., 1986. Studies on dietary fiber. 3. Improvedprocedures for analysis of dietary fiber. J. Agric. Food Chem. 34 (2), 330–336.
Tiller, F.M., Green, T.C., 1973. Role of porosity in filtration-IX, skin effect withhighly compressible materials. AIChE J. 19, 1266–1269.
Tiller, F.M., Hsyung, N.B., Cong, D.Z., 1995. Role of porosity in filtration: XII.Filtration with sedimentation. AIChE J. 41 (5), 1153–1164.
Tiller, F.M., Leu, W.F., 1980. Basic data fitting in filtration. J. Chin. Inst. Chem. Eng.11, 61–70.
Wakeman, R.J., Thuraisingham, S.T., Tarleton, E.S., 1988. Colloid science in solid/liquid separation technology. Is it important?. In: Faseur, A., de Bruyne, R.(Eds.), Particle Technology in Relation to Filtration & Separation. The RoyalFlemish Society of Engineers, Antwerp, Belgium, pp. 3.39–60.
Yim, S.S., Song, Y.M., 2008. Porosity distribution in highly compressible cake:experimental and theoretical verification of the dense skin. Korean J. Chem.Eng. 25 (6), 1524–1531.


