Embed Size (px)
Citation preview

Esmail M. A. Mokheimer1
Professor
Mechanical Engineering Department,
King Fahd University of Petroleum and Minerals,
P.O. Box 279,
Dhahran 31261, Saudi Arabia
e-mail: [email protected]
Muhammad Ibrar HussainMechanical Engineering Department,
King Fahd University of Petroleum and Minerals,
P.O. Box 279,
Dhahran 31261, Saudi Arabia
e-mail: [email protected]
Shakeel AhmedResearch Scientist
Center for Refining and Petrochemicals,
Research Institute,
King Fahd University of Petroleum and Minerals,
P.O. Box 279,
Dhahran 31261, Saudi Arabia
e-mail: [email protected]
Mohamed A. HabibProfessor
Mechanical Engineering Department,
KACST TIC on CCS,
King Fahd University of Petroleum and Minerals,
P.O. Box 279,
Dhahran 31261, Saudi Arabia
e-mail: [email protected]
Amro A. Al-QutubProfessor
Mechanical Engineering Department,
King Fahd University of Petroleum and Minerals,
P.O. Box 279,
Dhahran 31261, Saudi Arabia
e-mail: [email protected]
On the Modeling of SteamMethane ReformingModeling and simulations of steam methane reforming (SMR) process to produce hydro-gen and/or syngas are presented in this article. The reduced computational time withhigh model validity is the main concern in this study. A volume based reaction model isused, instead of surface based model, with careful estimation of mixture’s physical prop-erties. The developed model is validated against the reported experimental data andmodel accuracy as high as 99.75% is achieved. The model is further used to study theeffect of different operating parameters on the steam and methane conversion. Generalbehaviors of the reaction are obtained and discussed. The results showed that increasingthe conversion thermodynamic limits with the decrease of the pressure results in a needfor long reformers so as to achieve the associated fuel reforming thermodynamics limit.It is also shown that not only increasing the steam to methane molar ratio is favorablefor higher methane conversion but the way the ratio is changed also matters to a consid-erable extent. [DOI: 10.1115/1.4027962]
Keywords: computational fluid dynamics modeling, hydrogen, steam methane reforming,syngas, volume based reaction model
Introduction
Greenhouse gases emitted by the combustion of fossil fuelshave severe environmental and health issues [1]. There is a needto look for availability of clean energy resources [2]. A lot ofresearch is being carried out for wind, wave, and hydro energyresources [3–5]. Another available choice is the hydrogen thathas lot of advantages over fossil fuels such as clean combustionand higher heating value [6]. Hydrogen is also used in refineriesfor desulfurization, hydrotreating, and for production ofchemicals [7].
Hydrogen is produced by a number of ways such as electrolysis,SMR, auto CO2 methane reforming, partial oxidation reforming,and some extensions of these processes. The production of hydro-gen form electrolysis is much expensive because of the high pro-duction cost of electricity [8,9]. Other processes use hydrocarbonsas the main reactant for hydrogen production [10]. Among all ofthese processes, SMR process is the cheapest and is used
commercially to meet the hydrogen demands worldwide [11].Operating temperature for SMR is low as compared to partial oxi-dation reforming and CO2 reforming due to absence of oxygen. Italso has higher H2/CO ratio for higher H2 production [12]. Usualhydrocarbon used for SMR reaction is methane due to its highhydrogen contents and low capital cost compared to other hydro-carbon such as coal for which the capital cost is three times that ofmethane [13]. SMR reaction is represented by following chemicalequations:
CH4 þ H2OÐ COþ 3H2 DH�
298 ¼ 206 kJ=mol (1)
COþ H2OÐ CO2 þ H2 DH�
298 ¼ �41:1 kJ=mol (2)
CH4 þ 2H2OÐ CO2 þ 4H2 DH�
298 ¼ 164:9 kJ=mol (3)
First and third reactions are endothermic while the second reac-tion is exothermic as it is evident from their standard enthalpies ofreactions, DH�298. However, the overall reaction is endothermic innature. It is worth mentioning here that standard enthalpies ofreactions, DH�298, are enthalpy changes that occur when quantitiesof species given by chemical equations react under standardconditions. SMR faces certain problems such as low methane con-version due to reversibility, coke formation, catalyst deactivation,
1Corresponding author.Contributed by the Advanced Energy Systems Division of ASME for publication
in the JOURNAL OF ENERGY RESOURCES TECHNOLOGY. Manuscript received June 4,2014; final manuscript received June 23, 2014; published online July 29, 2014.Editor: Hameed Metghalchi.
Journal of Energy Resources Technology JANUARY 2015, Vol. 137 / 012001-1Copyright VC 2015 by ASME
Downloaded From: http://asmedigitalcollection.asme.org/ on 04/05/2015 Terms of Use: http://asme.org/terms

heat transfer issues, and diffusion limitations [7,14–29]. The phys-ical structure of the catalyst affects the SMR reaction largely.Complex dependence of SMR reaction on the flow variable makesthe simulative studies inevitable.
Different models dealing with kinetics as well as heat transferphenomena are available [30–50]. Improvement of heat transfer inreformers to get less radial gradients has always been the mainconcerns in these models [51]. Most of the models are either toocomplex or take too much execution time that make the simulativepurpose meaningless. Flow modeling of SMR is performed byusing two approaches. The first one is surface based approach andthe second is a volume based approach. Modeling the SMR usingsurface based approach takes lot of computational time. On theother hand, volume based approach requires less computationaltime. The choice of the modeling approach depends on thedetails one interested in. The surface based modeling approachprovides minor details of variations of flow variables, whereas thevolume based approach gives averaged distribution of flow varia-bles. Volume based approach is used in the present study due toits simplicity and less computational time. Models developedusing volume based approach can also be used easily for the fur-ther studies of SMR reaction such as flow optimization or shapeoptimization of steam methane reformer. In these studies, generaldependence of SMR on flow variable is required that is obtainedusing volume based approach. Use of surface based approachmakes the study complex due to its minor details. Results mayalso have considerable noise. Thus in the present study, a volu-metric reaction model is developed.
In earlier publications, simple kinetic rate expression wasdeveloped where rate of reaction is proportional to methane par-tial pressure and similar expression is developed by many authorseven in recent years [52–54]. Agnelli et al. [55] argued thatexperiments done previously were in the range of diffusion limita-tions that was not taken care of at that time. Moreover the partialpressure of hydrogen was low for those experiments. Experimentswere done for lower value of PH2O=PH2
ratio to check the depend-ence on other species’ concentrations. Model developed wassimilar to first order kinetic rate expression. Some powerbased kinetics are also developed such as over nickel aluminate(Ni/Al2O3) catalyst, reaction rate was found close to one for meth-ane and negative one for steam [56]. Kinetic models, dependingon the scheme of reaction, are also developed by recognizing therate determining step for proposed reaction’s scheme. In thesemodels, formation of CO, CO2, dissociation of methane or reac-tion of some carbon intermediates are taken to be rate determiningsteps. Allen et al. [57] developed a model by taking the CO andCO2 formation as rate determining step, over pressure range of1–18 atm and for constant temperature of 1180 �F. The averageerror, between simulated and experimental conversion, was 7%with maximum error as high as 23%. Adsorption of methane wasfound to be the rate determining step with the competitive adsorp-tion of steam over coprecipitated Ni/Al2O3 catalyst that high-lighted the inhibiting effect caused by steam [58].
Taking the reaction of carbon intermediate with absorbedoxygen as rate determining step, Xu and Froment [59] developeda model over pressure range of 1–10 bar and temperature of778–848 K. This model has non monatomic reaction rate orderwith respect to partial pressure of steam [60]. A complex modeldeveloped by Avetisov et al. [61] converges to the model devel-oped by Xu and Froment [59] under usual operating conditionsof SMR. Moreover, the same reaction path is successfully used todevelop the kinetic rate expressions for supported nickel catalystsby many authors [62–64]. Model developed by Xu and Froment[59] is also used extensively for modeling of SMR process[65–74] and is used in this work also.
Several models have been developed for SMR process topredict the extent of reaction as well as to serve for optimizationpurposes. These models vary from 1D homogeneous models to3D heterogeneous models. In heterogeneous models, effectivenessfactor is determined locally everywhere in the reactor by
solving species transport equations over the catalyst particle[66,67,70,71,73,75–77]. Pseudo homogeneous models assume aprofile of effectiveness factor along the length of catalyst bed. Inthese models, a correlation for effectiveness factor is used thatusually depends on the catalyst particle’s shape. Thus for one cat-alyst bed profile of effectiveness factor remains same [69,78–80].Homogenous models assume the constant value of effectivenessfactors [65,68,72]. In most of the models, diffusion limitations areneglected, i.e., taking the effectiveness factor equal to one [81].When the rate of diffusion of species in the reaction mixture islow as compared to the rate of reaction, then, effectiveness factorbecomes important. The larger the catalyst’s particle size, thesmaller will be the effectiveness factor [52,73]. When catalystparticle size is fairly small the assumption of constant effective-ness factor is valid.
In most of the models, a general continuity equation represent-ing the whole flow along with one momentum and one energyequation is solved. Estimation of pressure drop along the length ofreactor is usually done by using Fanning friction factor[66,67,73,75,76,78,79] but separate pressure drop correlation isalso used solely or in combination with complete momentum con-servation equation [65,68]. In most of the 1D energy equationssolved for various models, only energy losses and energy sink dueto endothermic nature of reaction are taken into account[67,69,73,75,76,78]. Where as in recently developed 3D models,energy dissipation by shear stresses and by expansion or contrac-tion of fluid, energy diffusion due to mass diffusion caused byconcentration gradient as well as temperature gradient along withconvection are considered [65,70]. Separate species transportequations are solved for the species in reaction mixture. Specietransport equations vary from simple 1D equation without diffu-sion [67,76] to complex 3D ones with mass and thermal diffusion[68,70,75]. Estimation of main fluid properties such as thermalconductivity, density, viscosity, and specific heat varies largelyfrom model to model. In simple 1D models, porosity of catalystbed only affects the diffusion coefficients [75,76]. In 3D models,apart from affecting the diffusion taking place, porosity affectsthe mass conservation by changing the flow velocity. It alsoreduces the energy diffusion due to diffusion of species’ flux andthe volumetric rate of appearance or disappearance of species[68,70]. Mass diffusion coefficient is usually determined by takingthe Knudsen and molecular diffusion into account [66–70,75–78].
The main objective of this article is to present the developmentof a comprehensive computational fluid dynamics (CFD) modelfor SMR process that has reduced computational time with highmodel validity. The developed model is validated against thereported experimental data. The validated model is further used tostudy the effect of different operating parameters on the steamand methane conversion.
Detailed Model
The geometry of SMR reformer is shown in Fig. 1. It is a tubu-lar reformer. Instead of modeling the catalyst pellet, a continuumof catalyst of reduced density is modeled inside the reformer[65,68]. Chemical reaction is assumed to take place everywhere in
Fig. 1 Steam methane reformer with operating conditions
012001-2 / Vol. 137, JANUARY 2015 Transactions of the ASME
Downloaded From: http://asmedigitalcollection.asme.org/ on 04/05/2015 Terms of Use: http://asme.org/terms

the reformer domain. This approach is justified as long as catalystparticle size is small. As well, this approach is justified wheninterest is focused on changes in concentrations of species atlength scale larger than the size of catalyst particle because, inthis case, a stretched distribution of concentrations of species isattained. Modeling the catalyst bed as continuum requires specialattention while solving temperature, pressure and velocity fieldthroughout the domain, because there are no catalyst pellets tooffer the inertial and viscous resistance to the flow. The effect ofaccelerating the coming flow due to difference in flow area anddecreased convection of momentum and energy as well as diffu-sion of energy due to difference in the thermal conductivities ofmain fluid flow and catalyst particle cannot be obtained in theabsence of catalyst pellets.
In actual reformers, porosity of catalyst bed is a decreasing fac-tor for cross sectional area of the reformer to accelerate the fluid.In the present model, porosity is used as a decreasing factor forvelocity to achieve the same mass flow rate through the reformeras the flow area is not being decreased due to absence of catalystpellets. This decreased velocity is also called the superficial veloc-ity. It reduces the convection and shear stresses of fluid in such away that, per unit change in length, convection, and shear stressesat a scale larger than the scale of catalyst particle size remain thesame as expected in original reformer filled with catalyst pellets.Conductivity of main fluid is determined by mass weighted law.Volume averaged conductivity of main fluid and catalyst pelletsis used for diffusion of energy. Density of main fluid flow isdetermined by volume averaged value of temperature and pressuredependent densities of individual species. For species transportequations, superficial velocity stretches the convection and diffu-sion of species due to concentration and temperature gradients bymultiplying the diffusive constants by porosity.
The rate of chemical reaction expressed in kg/(m3s) is correctedby multiplying it by one minus porosity that is actually the reduc-ing factor for density of catalyst bed. In some experiments, somediluents such are quartz or alumina are used. In this case, chemicalreaction rate should be corrected such that reaction rate is alwaysexpressed per unit reformer volume. Instead of solving the wholeStephen–Maxwell equation for molecular diffusion, an equivalentbinary diffusion equation was solved where the binary diffusioncoefficients were calculated by Wilke Chang equation for dilutefluids [82]. As the particle size was small as compared to the parti-cle size of the commercially used catalyst, binary diffusion coeffi-cients were of order of 10�14. Finally, the effective diffusioncoefficient was calculated by using parallel pore model.
Mathematical and CFD Model
The mathematical model adopted in the present work to simu-late the SMR process comprise the conservation equations ofmass, momentum, and energy along with (n� 1) species transportequations and one species conservation equation are solved wheren is the total number of species in reaction mixture. The governingequations are solved under the assumptions of steady flow condi-tions and the absence of gravitational effects.
Continuity equation
r qfVð Þ ¼ 0 (4)
Momentum equation
r qfVVð Þ ¼ �rPþr sð Þ � 150
d2p
1� eð Þ2
e3lfV (5)
Energy equation
r � qfVEþ VPð Þ ¼ r � kerT �X
i
hiJi þ s � Vð Þ !
þX
i
higiRi (6)
Fluid mixture’s thermal conductivity
ki ¼15Rli
4Mi
5Cpi
Rþ 1
3
� �(7)
kf ¼X
i
Yiki (8)
Effective conductivity
ke ¼ ekf þ 1� eð Þks (9)
Species transport equation
r � qiVYið Þ ¼ �r � Ji þ giRi (10)
where
Ji ¼ qiDi;erYi þ DT;irT
T(11)
1
De;i¼ 1
Dn;iþ 1
Dm;i(12)
Equation of state
P ¼ qfRTX
i
Yi
Mi(13)
Effective density
qf ¼1X
i
Yi
qi
(14)
Effective specific heat
Cpi ¼ A1 þ A2T þ A3T2 þ A4T3 þ A5T4 (15)
Cp ¼X
i
YiCpi (16)
Effective viscosity
li ¼ li;o
T
To
� �n
(17)
l ¼X
i
Yili (18)
The kinetic reaction rates for reactions 1, 2, and 3 are asfollows:
r1 ¼k1
p2:5H2
pCH4pH2O � pCOp3
H2=Ke;1
� �DENð Þ2
(19)
r2 ¼k2
pH2
pCOpH2O � pCO2pH2
=Ke;2
� �DENð Þ2
(20)
r3 ¼k3
p3:5H2
pCH4p2
H2O � pCO2p4
H2=Ke;3
� �DENð Þ2
(21)
where
DENð Þ ¼ 1þ KCH4pCH4
þ KCOpCO þ KH2pH2þ PH2OKH2O=pH2
(22)
Journal of Energy Resources Technology JANUARY 2015, Vol. 137 / 012001-3
Downloaded From: http://asmedigitalcollection.asme.org/ on 04/05/2015 Terms of Use: http://asme.org/terms

where k1, k2, and k3 are forward rate constants for reactions 1, 2,and 3, respectively. On the other hand, reverse reaction rate con-stants are obtained using ki/Ki, while r1, r2, and r3 are the net rates(forward-backward) of reactions 1, 2, and 3, respectively. It isworth mentioning here that reverse reaction rate constants shouldbe estimated carefully to avoid inconsistency and some levels oferrors such as the possible negative productions of entropy duringkinetic transients as discussed by Janbozorgi et al. [83]. The accu-rate estimations of the forward and reverse reaction rates arebeyond the scope of the present article. Thus, the forward andreverse reaction rate constants are calculated from equations thatare given in the literature as indicated in Parameters for KineticModel of SMR.
Parameters for Kinetic Model of SMR
Rate constants for Arrhenius equation ki ¼ Ai exp�Ei
RT
� �
Constants for Van’t Hoff equation Ki ¼ Bi exp�Hi
RT
� �
Solution Procedure
The solution domain is shown in Fig. 2. Constant value of po-rosity allows modeling of reformer as 2D axisymmetric domain.Mass flow rate boundary condition is used at the inlet. Wall of thereformer is isothermally heated with zero wall thickness and theexit is maintained at constant pressure.
The governing equations are solved numerically using ANSYS
FLUENT 13.0. A pressure-correction based solver is used, wherethe momentum equations are solved separately by taking eachvelocity component as a scalar. After that, continuity and pres-sure correction equations are solved to correct the velocity andpressure fields. The energy equation is, then, solved and certaindata such as pressure, temperature, and mass fraction of speciesare extracted and used to edit the kinetic reaction rate using auser defined function (UDF). UDFs are used to customize ANSYS
FLUENT code. These UDFs are built in macros in ANSYS FLUENT.ANSYS FLUENT provides a variety of UDF. Most of UDFs are
used for a specific purpose but there are some general purposeUDFs as well. Each UDF has certain inputs and outputs. Out-puts of these UDF depend upon the purpose they are used for.To incorporate the kinetic model by Xu and Froment [59] intoANSYS FLUENT code, a UDF named “DEFINE_VR_RATE” isused. By using this UDF, mass fractions, molar masses, andreaction rates are accessed for each cell of grid. Reaction ratesare edited using mass fraction, molar mass, pressure, and tem-perature. Pressure and temperature are obtained using flow vari-able macros. Diffusion coefficient for each species is alsoedited using UDF named “DEFINE_DIFFUSIVITY”. ThisUDF provides access to species diffusion coefficients for eachcell of grid. These reaction rates and diffusion coefficients dataare, then, used in the specie transport equation. Another UDFnamed “DEFINE_PROPERTY” is also used for properties ofindividual species. These property UDFs are used before the so-lution of momentum equations to edit the material properties.Convection criteria for momentum and energy equation areupwind first order.
Grid Independence Test
To check the independence of the solution on the grid, a gridindependence study is conducted and a convergence criterion offlow field variables of 10�7 is applied. In this regard, five meshesare developed. Details of meshes containing the number of nodesand elements are shown in Table 3. The fractional methane con-version is selected as a judging variable to decide that either thesolution is independent of the grid or it needs further refinement.It can be seen from Fig. 3 that initially a very high value of frac-tional methane conversion is achieved for very course mesh butas the mesh is refined, the relative difference in the fractionalmethane conversion decreases and finally vanishes for the meshcontaining up to 3000 elements. Thus, the grid was not refinedfurther to save the computational time. Therefore, mesh no. 5 with3000 elements and 3146 nodes have been used to generate all theresults presented in this article.
Model Validation
To check the validity of the model, simulations are carried outat the operating conditions reported by Xu and Froment [59]. Inthis regard, Fig. 4 depicts the comparison between the simulatedmethane conversion and experimental methane conversionreported by Xu and Froment [59]. Simulations are carried out attemperatures of 848 K, 823 K, 798 K, and 773 K at the exit pres-sure of 10 bar with FH2O=FCH4
value of 3 and FH2=FCH4
value of1.25. To quantize the quality of fit, a correlation factor is calcu-lated. This correlation factor is the measure of fit of a straight linebetween simulated and experimental methane conversion. Corre-lation factor is found to be 0.9929, 0.9919, 0.9954, and 0.9975 foroperating temperatures of 848 K, 823 K, 798 K, and 773 K, respec-tively. A value very close to one indicates a high quality valida-tion of developed model against the experimental data as shownin Fig. 4. Thus, the developed model can be effectively used forfurther studies.
Correlation factor ¼X
x� �xð Þ y� �yð ÞffiffiffiffiffiffiffiffiffiffiffiffiffiffiffiffiffiffiffiffiffiffiffiffiffiffiffiffiffiffiffiffiffiffiffiffiffiffiffiffiffiffiffiffiffiffiffiXx� �xð Þ2
Xy� �yð Þ2
q (23)
Fig. 2 Axisymmetric solution domain
Table 1 Rate constant for Arrhenius equation [59]
E1 E2 E3
Activation energy,Ei (kJ mol� 1)
240.1 67.13 243.9
Pre-exponentialfactor,Ai (dimension of ki)
A1 (kmol bar5
kgcat�1h�1)
A2 (kmol bar�1
kgcat�1h�1)
A3 (kmol bar5
kgcat�1h�1)
4.225� 1015 1.955� 106 1.020� 1015
Table 2 Constant for Van’t Hoff equation [59]
HH2O HCH4HCO HH2
Absorption enthalpychange, Hi (kJ mol�1)
88.68 �38.28 �70.61 �82.90
Pre-exponential factor,Bi (dimension of Ki)
BH2O BCH4,
(bar�1)BCO,
(bar�1)BH2
,(bar�1)
1.77� 105 6.65� 10� 4 8.23� 10�5 6.12� 10�9
012001-4 / Vol. 137, JANUARY 2015 Transactions of the ASME
Downloaded From: http://asmedigitalcollection.asme.org/ on 04/05/2015 Terms of Use: http://asme.org/terms
Results and Discussion
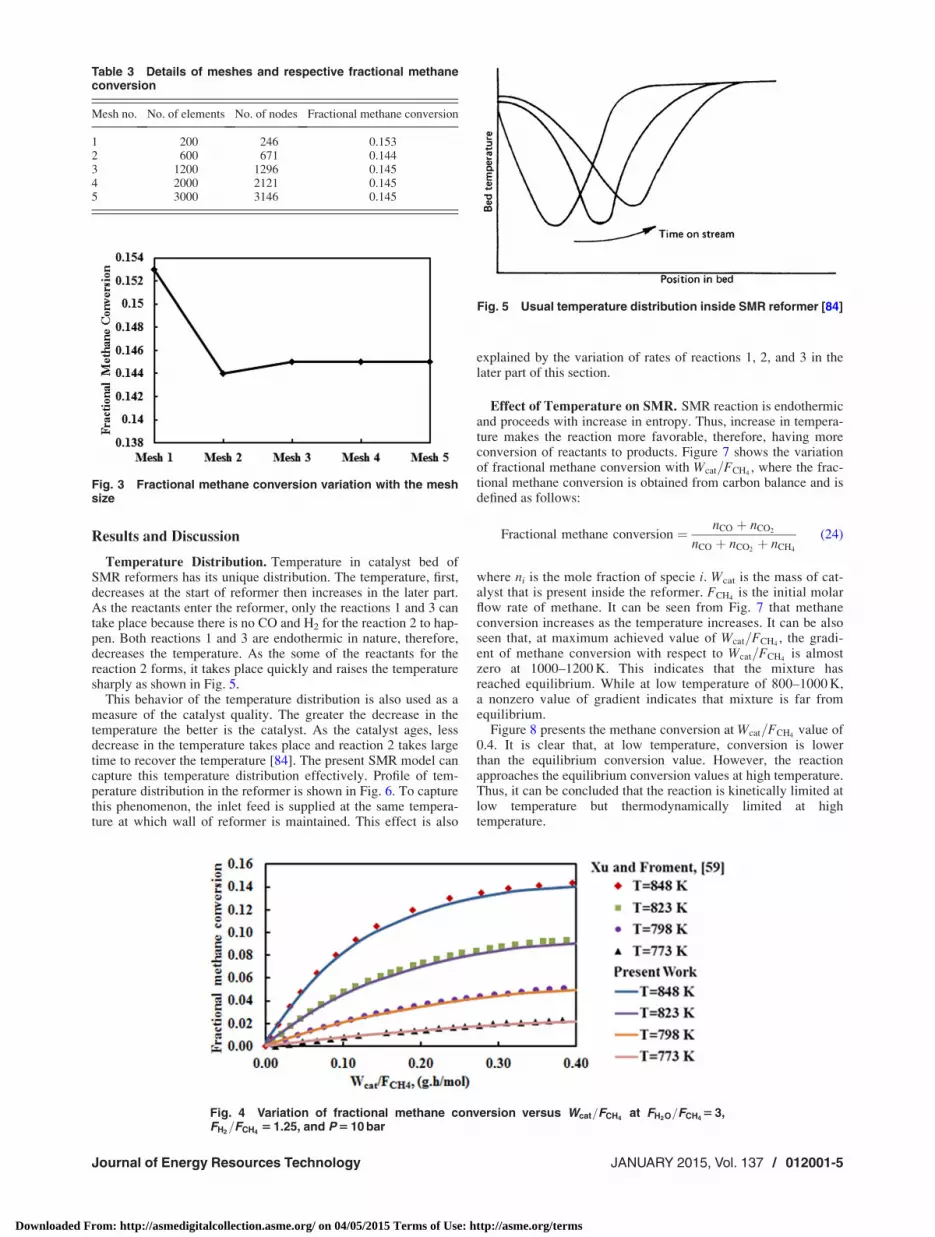
Temperature Distribution. Temperature in catalyst bed ofSMR reformers has its unique distribution. The temperature, first,decreases at the start of reformer then increases in the later part.As the reactants enter the reformer, only the reactions 1 and 3 cantake place because there is no CO and H2 for the reaction 2 to hap-pen. Both reactions 1 and 3 are endothermic in nature, therefore,decreases the temperature. As the some of the reactants for thereaction 2 forms, it takes place quickly and raises the temperaturesharply as shown in Fig. 5.
This behavior of the temperature distribution is also used as ameasure of the catalyst quality. The greater the decrease in thetemperature the better is the catalyst. As the catalyst ages, lessdecrease in the temperature takes place and reaction 2 takes largetime to recover the temperature [84]. The present SMR model cancapture this temperature distribution effectively. Profile of tem-perature distribution in the reformer is shown in Fig. 6. To capturethis phenomenon, the inlet feed is supplied at the same tempera-ture at which wall of reformer is maintained. This effect is also
explained by the variation of rates of reactions 1, 2, and 3 in thelater part of this section.
Effect of Temperature on SMR. SMR reaction is endothermicand proceeds with increase in entropy. Thus, increase in tempera-ture makes the reaction more favorable, therefore, having moreconversion of reactants to products. Figure 7 shows the variationof fractional methane conversion with Wcat=FCH4
, where the frac-tional methane conversion is obtained from carbon balance and isdefined as follows:
Fractional methane conversion ¼ nCO þ nCO2
nCO þ nCO2þ nCH4
(24)
where ni is the mole fraction of specie i. Wcat is the mass of cat-alyst that is present inside the reformer. FCH4
is the initial molarflow rate of methane. It can be seen from Fig. 7 that methaneconversion increases as the temperature increases. It can be alsoseen that, at maximum achieved value of Wcat=FCH4
, the gradi-ent of methane conversion with respect to Wcat=FCH4
is almostzero at 1000–1200 K. This indicates that the mixture hasreached equilibrium. While at low temperature of 800–1000 K,a nonzero value of gradient indicates that mixture is far fromequilibrium.
Figure 8 presents the methane conversion at Wcat=FCH4value of
0.4. It is clear that, at low temperature, conversion is lowerthan the equilibrium conversion value. However, the reactionapproaches the equilibrium conversion values at high temperature.Thus, it can be concluded that the reaction is kinetically limited atlow temperature but thermodynamically limited at hightemperature.
Table 3 Details of meshes and respective fractional methaneconversion
Mesh no. No. of elements No. of nodes Fractional methane conversion
1 200 246 0.1532 600 671 0.1443 1200 1296 0.1454 2000 2121 0.1455 3000 3146 0.145
Fig. 3 Fractional methane conversion variation with the meshsize
Fig. 4 Variation of fractional methane conversion versus Wcat=FCH4at FH2O=FCH4
5 3,FH2
=FCH45 1.25, and P 5 10 bar
Fig. 5 Usual temperature distribution inside SMR reformer [84]
Journal of Energy Resources Technology JANUARY 2015, Vol. 137 / 012001-5
Downloaded From: http://asmedigitalcollection.asme.org/ on 04/05/2015 Terms of Use: http://asme.org/terms

Pressure Distribution. Pressure drop due to porous nature ofcatalyst is estimated using Blake kozeny correlation DP=L¼ 150 1� eð Þ2lfV=d2
pe3 [85]. It is a momentum sink and offers
viscous resistance to flow. Pressure field does not highlight theminor pressure variations at the scale smaller than the size of cata-lyst particle. According to the used correlation, the pressure fielddepends on the inlet feed velocity, size of catalyst particle and
porosity of the catalyst bed. A catalyst bed with high porosityand large catalyst particles give low pressure gradient across thereformer. Similarly, the low value of inlet feed velocity gives highpressure gradient across the reformer. For the present study, thevariation of pressure drop is shown in Fig. 9. In the present study,a reformer of small length (0.114 m) is used; therefore, over allpressure drop is small.
Fig. 6 Temperature distribution inside SMR reformer
Fig. 7 Fractional methane conversion variation with Wcat=FCH4
at different temperature for FH2O=FCH45 3, FH2/FCH4 5 1.25, and
P 5 10 bar
Fig. 8 Fractional methane conversion versus operating tem-perature at FH2O=FCH4
5 3, FH2=FCH4
5 1.25, and P 5 10 bar
Fig. 9 Pressure distribution inside the reformer
Fig. 10 Fractional methane conversion versus exit pressurefor FH2O=FCH4
5 3, FH2=FCH4
5 1.25, and T 5 800 K
Fig. 11 Fractional methane conversion versus Wcat=FCH4at dif-
ferent operating pressure for FH2O=FCH45 3, FH2
=FCH45 1.25,
and T 5 800 K
012001-6 / Vol. 137, JANUARY 2015 Transactions of the ASME
Downloaded From: http://asmedigitalcollection.asme.org/ on 04/05/2015 Terms of Use: http://asme.org/terms

Effect of Pressure on SMR. As stated earlier, steam methanereaction is favored by expansion, thus, decreasing the pressureresults in an increase in the methane conversion as shown byFig. 10. If one compares the gradient of fractional methane con-version with Wcat=FCH4
at different pressure, it is clear that thegradient deceases as the pressure increases, indicating that reac-tion mixture is closer to equilibrium at high pressure but far fromequilibrium at low pressure as shown in Fig. 11. To elaboratemore on this effect, a comparison of distance from equilibrium atthe pressure of 2 bar and 10 bar is conducted and the results areshown in Fig. 12. More contact time or longer reformer is neededto reach equilibrium conversion at low pressure. Moreover athreshold minimum value of distance from equilibrium can beused as an optimization limit so that process can always be ther-modynamically limited. To further elaborate on the effect of pres-sure on the mole fraction of individual species, Fig. 13 shows theincrease in mole fraction of CO, CO2 and hydrogen and decrease
Fig. 12 Fractional distance from equilibrium versus Wcat=FCH4
at 2 bar and 10 bar for FH2O=FCH45 3, FH2
=FCH45 1.25, and
T 5 800 K
Fig. 13 Comparison of species mole fraction along the reformer length at 2 bar and 10 bar for FH2O=FCH45 3,
FH2=FCH4
5 1.25, and T 5 800 K
Journal of Energy Resources Technology JANUARY 2015, Vol. 137 / 012001-7
Downloaded From: http://asmedigitalcollection.asme.org/ on 04/05/2015 Terms of Use: http://asme.org/terms

the mole fraction of CH4 and H2O as the pressure is decreasedfrom 10 bar to 2 bar.
Effect of Mass Flow Rate. Increasing the mass flow rate ofgas, reduces the contact time over a fixed rector length. Eventuallythe conversion of the reactants decreases but the way the massflow rate is decreased also matters. Changing the mass flow rateby changing the flow velocity of the reacting mixture can producedifferent curves than those resulting from changing the pressureof the system. If the mass flow rate of the reacting mixture ischanged by changing the flow pressure of the system, a combinedeffect of change in pressure and contact time will be obtained onthe conversion of reaction. Changing the mass flow rate by chang-ing the flow velocity at the constant pressure gives the sole varia-tion of conversion with respect to contact time. Thus instead ofmass flow rate, the variation of conversion with respect to theflow velocity should be studied. Figure 14 shows the variation ofmethane conversion with respect to the average inlet flow velocityof reacting gas.
The general trends of the SMR reaction rates are important.The rate of reactions 1 and 3 are very high at the start of thereformer. This is due to the presences of excess of reactants forboth of these reactions. Rates of reactions 1 and 3 decrease gentlyalong the reformer as shown in Fig. 15. The rate of reaction 2 iszero at the start of the reformer due to absence of reactants of thisreaction. As reactions 1 and 3 proceed considerably producingreactants for reaction 2, its rate reaches its peak and, then,
decreases gently along the reformer as shown in Fig. 15. Thus, thelow concentrations of CO2 and H2 with excess of steam cause therate of reaction 2 to increase but as the considerable amount ofCO2 and H2 is produced by the parallel reactions, rate of reaction2 starts to decrease.
Effect of Relative Molar Ratios of Species. To study theeffect of reacting species at the inlet, three ratios FH2O=FCH4
;FH2
=FCH4, and 1=nCH4
have been defined as below
FCH4þ FH2O þ FH2
¼ FMIX
FCH4
FCH4
þ FH2O
FCH4
þ FH2
FCH4
¼ FMIX
FCH4
1þ FH2O
FCH4
þ FH2
FCH4
¼ FMIX
FCH4
FH2O=FCH4and FH2
=FCH4ratios are varied from 1 to 4 and 1=nCH4
ratio is varied from 6 to 12. Figures 16 and 17 show the variationof methane conversion with respect to FH2
=FCH4ratio. It is clear
that methane conversion increases with increase in FH2O=FCH4
ratio but the value of increment depends on either FH2O=FCH4ratio
is increased on the expense of FH2=FCH4
ratio or 1=nCH4ratio. If
FH2O=FCH4ratio is increased by keeping the FH2
=FCH4ratio con-
stant as in Fig. 16, the mole fractions of CH4 and hydrogendecrease in the inlet feed and mole fraction of H2O increases.Thus, the methane conversion is always increasing but increase isless because along with hydrogen, methane is also decreasing. Onthe other hand, if 1=nCH4
ratio and FH2O=FCH4ratio are kept con-
stant by decreasing the FH2=FCH4
ratio as in Fig. 17, mole fraction
Fig. 14 Fractional methane conversion versus average inletfeed velocity for FH2O=FCH4
5 3, FH2=FCH4
5 1.25, T 5 800 K, andP 5 10 bar
Fig. 15 Kinetic reaction rate versus Wcat=FCH4for FH2O=
FCH45 3, FH2
=FCH45 1.25, T 5 800 K, and P 5 10 bar
Fig. 16 Fractional methane conversion versus FH2=FCH4
ratiofor constant FH2
=FCH4ratio, T 5 800 K, and P 5 10 bar
Fig. 17 Fractional methane conversion versus FH2O=FCH4ratio
for constant 1=nCH4ratio, T 5 800 K and P 5 10 bar
012001-8 / Vol. 137, JANUARY 2015 Transactions of the ASME
Downloaded From: http://asmedigitalcollection.asme.org/ on 04/05/2015 Terms of Use: http://asme.org/terms

of the methane remains constant. Increasing the FH2O=FCH4ratio
decreases the hydrogen mole fraction that in turn is going to moveall the reaction in forward direction. Thus, methane conversionincreases sharply as compared to the precious case.
Moreover the variation of methane conversion for constantvalue of FH2O=FCH4
ratio is also studied that is varying theFH2
=FCH4ratio with 1=nCH4
ratio. It is clear from Fig. 18 that forthe constant value of FH2O=FCH4
ratio, increase in FH2=FCH4
ratiorequires a decrease in mole fraction of CH4 and H2O. Thus, themole fraction of H2 increases. This will make the reaction toproceed in reverse direction. Similarly, if some inert gases areused along with feed, the effect of change in mole fraction ofthese gases on methane conversion depends on the way their molefraction is decreased.
Conclusion
It is clear from the study that modeling the continuum of cata-lyst inside the reformer instead of catalyst pellets is a validassumption and can provide highly accurate results. Moreover,with a careful use of porosity as a decreasing factor for the sourceterm in species transport equations along with the other term inmomentum and energy equations, actual trends of fractionalmethane conversion with different operating parameters can beobtained. Validity up to 99.75% of developed model with experi-mental data is obtained which showed that the model can be usedfor further studies of SMR reaction.
Parametric studies have shown that longer reformers arerequired at low pressure to attain the thermodynamically limitedconversion. This is basically attributed to the fact that the equilib-rium conversion values are high at low pressures. Thus, reactorsworking at low pressure can achieve high conversion values butthis would need enough time (or reactor length) so as to achievethese high equilibrium conversion values. It is also recognizedthat fractional distance from equilibrium with some minimumthreshold value can be used as an optimization limit to get thermo-dynamically limited conversion. The influence of ratios of react-ing species at the inlet is also highlighted and it is shown thatnot only increasing the FH2O=FCH4
ratio enhances the methaneconversion but the way this ratio is increased also affect the con-version to a considerable extent. The methane conversion variessharply if FH2O=FCH4
ratio is varied on expense of FH2=FCH4
ratio.On the other hand, the change in methane conversion is not sharpenough if FH2O=FCH4
is varied on the expense FMIX=FCH4 ratio.
Acknowledgment
The authors of this article highly appreciate and acknowledgethe support of King Fahd University of Petroleum and Mineralsfor this work through the research Grant No. R12-CE-10 offered
by KFUPM-MIT Clean Water and Clean Energy ResearchCollaboration center.
Nomenclature
A ¼ area (m2)Ai ¼ pre-exponential factor for Arrhenius equation,
dimensions of ko,i
Bi ¼ pre-exponential factor for Van’t Hoff equation,dimension of Ki
Cp ¼ specific heat capacity of reaction mixture (kJ/kg K)Cpi ¼ specific heat capacity of reaction mixture (kJ/kg K)dp ¼ equivalent particle diameter (m)
Di,e ¼ effective diffusive coefficient of specie i (m2/s)Di,T ¼ thermal diffusive coefficient of specie i, (kg/ms)Dm,i ¼ molecular diffusive coefficient of specie i (m2/s)Dn,i ¼ Knudsen diffusive coefficient of specie i (m2/s)
DEN ¼ denominatorEi ¼ activation energy of reaction i (kJ/mol)Fi ¼ molar flow rate of specie i (mol/h)
Fmix ¼ molar flow rate of reaction mixture (mol/h)hi ¼ enthalpy of specie i (W/m�K)Hi ¼ absorption enthalpy of specie i (kJ/mol)ji ¼ diffusive flux of specie i (kg/m2�s)
ke ¼ effective heat conduction coefficient (W/m�K)kf ¼ heat conduction coefficient of reaction mixture (W/m�K)ki ¼ heat conduction coefficient of specie i (W/m�K)ki ¼ rate constant of reaction i, Table 1ks ¼ heat conduction coefficient of catalyst (W/m�K)Ki ¼ Van’t Hoff constant for specie i, Table 2
Ke,i ¼ equilibrium constant for reaction i, bar2 for i¼ 1, 3 and0 for i¼ 2
Mi ¼ molecular weight of specie i (kg/mol)ni ¼ molar ratio of specie i, Fi/FMIX
P ¼ pressure of reaction mixture (N/m2)pi ¼ partial pressure of specie i (bar)
r1,r2,r3 ¼ rate of reactions 1, 2, and 3 (kmol/kgcath)R ¼ general gas constant (J/mol K)Ri ¼ rate of reaction of specie i (mol/m3s)
S/C ¼ steam to carbon molar ratioT ¼ temperature of reaction mixture (K)
To ¼ reference temperature for viscosity calculation (K)V ¼ velocity of reaction mixture (m/s)
Wcat ¼ mass of catalyst (kg)Yi ¼ mass fraction of specie, i
Greek Symbols
e ¼ porosity of catalyst bedgi ¼ effectiveness factor of reaction, ilf ¼ viscosity of reaction mixture (kg/ms)li ¼ viscosity of specie i (kg/ms)
li;o ¼ viscosity of specie at reference temperature (kg/ms)qf ¼ density of reaction mixture (kg/m3)qi ¼ density of specie i (kg/m3)s ¼ effective shear stress (N/m2)
References[1] Vellini, M., and Tonziello, J., 2011, “Hydrogen Use in an Urban District:
Energy and Environmental Comparisons,” ASME J. Energy Resour. Technol.,132(4), 42601.
[2] Dunn, S., 2002, “Hydrogen Futures: Toward a Sustainable Energy System,” Int.J. Heat Mass Transfer, 27, pp. 235–264.
[3] Monds, J. R., 2013, “Multicriteria Decision Analysis for Wave Power Technol-ogy in Canada,” ASME J. Energy Resour. Technol., 136(2), p. 021201.
[4] Platzer, M. F., Sarigul-Klijn, N., Young, J., Ashraf, M. A., and Lai, J. C. S.,2014, “Renewable Hydrogen Production Using Sailing Ships,” ASME J.Energy Resour. Technol., 136(2), p. 021203.
[5] Kaufui, V. W., 2014, “Engineering Solutions to the Greenhouse Gases Gener-ated by Hydroelectric Plants,” ASME J. Energy Resour. Technol., 136(2),p. 024701.
[6] Nowotny, J., Sorrell, C. C., Sheppard, L. R., and Bak, T., 2005, “Solar-Hydro-gen: Environmentally Safe Fuel for the Future,” Int. J. Hydrogen Energy, 30(5),pp. 521–544.
Fig. 18 Fractional methane conversion versus FH2=FCH4
ratiofor constant FH2O=FCH4
ratio, T 5 800 K and P 5 10 bar
Journal of Energy Resources Technology JANUARY 2015, Vol. 137 / 012001-9
Downloaded From: http://asmedigitalcollection.asme.org/ on 04/05/2015 Terms of Use: http://asme.org/terms

[7] Armor, J. N., 1999, “The Multiple Roles for Catalysis in the Production of H2,”Appl. Catal. A Gen., 176(2), pp. 159–176.
[8] Ewan, B., and Allen, R., 2005, “A Figure of Merit Assessment of the Routes toHydrogen,” Int. J. Hydrogen Energy, 30(8), pp. 809–819.
[9] Crabtree, G. W., Dresselhaus, M. S., and Buchanan, M. V., 2004, “The Hydro-gen Economy,” Phys. Today, 57(12), p. 39.
[10] Hong, H., Liu, Q., and Jin, H., 2009, “Solar Hydrogen Production IntegratingLow Grade Solar Thermal Energy and Methanol Steam Reforming,” ASME J.Energy Resour. Technol., 13(1), p. 012601.
[11] Steinberg, M., and Cheng, H. C., 1989, “Modern and Prospective Technologiesfor Hydrogen Production From Fossil Fuels,” Int. J. Hydrogen Energy, 14(11),pp. 797–820.
[12] Holladay, J. D., Hu, J., King, D. L., and Wang, Y., 2009, “An Overview ofHydrogen Production Technologies,” Catal. Today, 139(4), pp. 244–260.
[13] Rostrup-Nielsen, J. R., 1993, “Production of Synthesis Gas,” Catal. Today,18(4), pp. 305–324.
[14] Paramaliana, A., Frusteri, F., Arena, F., Mondello, N., and Giordano, N., 1989,“Activity and Characterization of Alkali Doped Ni/MgO Catalysts,” Struct.React. Surf., 48, pp. 739–748.
[15] Bernardo, C. A., and Trimms, D. L., 1979, “The Kinetics of Gasification ofCarbon Deposited on Nickel Catalysts,” Carbon, 17(2), pp. 115–120.
[16] Bernardo, C. A., Alstrup, I., and Rostrup-Nielsen, J. R., 1985, “Carbon Deposi-tion and Methane Steam Reforming on Silica-Supported Ni-Cu Catalysts,”J. Catal., 96(2), pp. 517–534.
[17] Chen, W. J., Sheu, F. R., and Savage, R. L., 1987, “Catalytic Activity of CoalAsh on Steam Methane Reforming and Water-Gas Shift Reactions,” Fuel Pro-cess. Technol., 16(3), pp. 279–288.
[18] Guo, X., Sun, Y., Yu, Y., Zhu, X., and Liu, C., 2012, “Carbon Formation andSteam Reforming of Methane on Silica Supported Nickel Catalysts,” Catal.Commun., 19, pp. 61–65.
[19] Kuo, H. K., Ganesan, P., and De Angelis, R. J., 1980, “The Sintering of aSilica-Supported Nickel Catalyst,” J. Catal., 64(2), pp. 303–319.
[20] Ruojun, S., Liangqu, Z., and Shendu, G. U. O., 1991, “Coking Resistant NickelCatalysts for Hydrocarbon Steam Reforming,” Catal. Deactiv., 68, pp.243–247.
[21] Sehested, J., 2003, “Sintering of Nickel Steam-Reforming Catalysts,” J. Catal.,217(2), pp. 417–426.
[22] Sehested, J., 2004, “Sintering of Nickel Steam-Reforming Catalysts: Effectsof Temperature and Steam and Hydrogen Pressures,” J. Catal., 223(2), pp.432–443.
[23] Sehested, J., Carlsson, A., Janssens, T. V. W., Hansen, P. L., and Datye, A. K.,2001, “Sintering of Nickel Steam-Reforming Catalysts on MgAl2O4 SpinelSupports,” J. Catal., 197(1), pp. 200–209.
[24] Sehested, J., 2006, “Four Challenges for Nickel Steam-Reforming Catalysts,”Catal. Today, 111(1–2), pp. 103–110.
[25] Snoeck, J., and Froment, G. F., 2002, “Steam/CO2 Reforming of Methane.Carbon Formation and Gasification on Catalysts With Various Potassium Con-tents,” Ind. Eng. Chem. Res., 41(15), pp. 3548–3556.
[26] Teixeira, A. C. S. C., and Giudici, R., 1999, “Deactivation of Steam ReformingCatalysts by Sintering: Experiments and Simulation,” Chem. Eng. Sci.,54(15–16), pp. 3609–3618.
[27] Trimm, D. L., 1999, “Catalysts for the Control of Coking During SteamReforming,” Catal. Today, 49(1–3), pp. 3–10.
[28] Trimm, D. L., 1997, “Coke Formation and Minimisation During Steam Reform-ing Reactions,” Catal. Today, 37(3), pp. 233–238.
[29] Bshish, A., Yaakob, Z., Ebshish, A., and Alhasan, F. H., 2013, “Hydrogen Pro-duction Via Ethanol Steam Reforming Over Ni/Al2O3 Catalysts: Effect of NiLoading,” ASME J. Energy Resour. Technol., 136(1), p. 012601.
[30] Barbieri, G., and Di Maio, F. P., 1997, “Simulation of the Methane SteamRe-Forming Process in a Catalytic Pd-Membrane Reactor,” Ind. Eng. Chem.Res., 5885(96), pp. 2121–2127.
[31] Adris, A. M., Lim, C. J., and Gracc, J. R., 1997, “The Fluidized-Bed MembraneReactor for Steam Methane Reforming: Model Verification and ParametricStudy,” Chem. Eng. J., 52(10), pp. 1609–1622.
[32] Barbieri, G., Marigliano, G., Perri, G., and Drioli, E., 2001,“Conversion–Temperature Diagram for a Palladium Membrane Reactor. Analy-sis of an Endothermic Reaction: Methane Steam Reforming,” Ind. Eng. Chem.Res., 40(9), pp. 2017–2026.
[33] Barbieri, G., Violante, V., Di Maio, F. P., Criscuoli, A., and Drioli, E., 1997,“Methane Steam Reforming Analysis in a Palladium-Based Catalytic Mem-brane Reactor,” Ind. Eng. Chem. Res., 36(8), pp. 3369–3374.
[34] Catalano, J., Guazzone, F., Mardilovich, I. P., Kazantzis, N. K., and Ma,Y. H., 2013, “Hydrogen Production in a Large Scale Water Gas Shift Pd-Based Catalytic Membrane Reactor,” Ind. Eng. Chem. Res., 52(3), pp. 1042–1055.
[35] Gallucci, F., Comite, A., Capannelli, G., and Basile, A., 2006, “Steam Reform-ing of Methane in a Membrane Reactor: An Industrial Case Study,” Ind. Eng.Chem. Res., 45(9), pp. 2994–3000.
[36] Gallucci, F., Paturzo, L., Fama, A., and Basile, A., 2004, “Experimental Studyof the Methane Steam Reforming Reaction in a Dense Pd/Ag Membrane Reac-tor,” Ind. Eng. Chem. Res., 43(4), pp. 928–933.
[37] Galuszka, J., Pandey, R., and Ahmed, S., 1998, “Methane Conversion to Syngasin a Palladium Membrane Reactor,” Catal. Today, 46(2-3), pp. 83–89.
[38] Grace, J. R., Li, X., and Jim Lim, C., 2001, “Equilibrium Modelling of CatalyticSteam Reforming of Methane in Membrane Reactors With Oxygen Addition,”Catal. Today, 64(3–4), pp. 141–149.
[39] Kikuchi, E., 2000, “Membrane Reactor Application to Hydrogen Production,”Catal. Today, 56(1–3), pp. 97–101.
[40] Kikuchi, E., Nemoto, Y., Kajiwara, M., Uemiya, S., and Kojima, T., 2000,“Steam Reforming of Methane in Membrane Reactors: Comparison ofElectroless-Plating and CVD Membranes and Catalyst Packing Modes,” Catal.Today, 56(1–3), pp. 75–81.
[41] Mahecha-Botero, A., Chen, Z., Grace, J. R., Elnashaie, S. S. E. H., Jim Lim, C.,Rakib, M., Yasuda, I., and Shirasaki, Y., 2009, “Comparison of Fluidized BedFlow Regimes for Steam Methane Reforming in Membrane Reactors: A Simu-lation Study,” Chem. Eng. Sci., 64(16), pp. 3598–3613.
[42] Nam, S. W., Yoon, S. P., Ha, H. Y., Hong, S.-A., and Maganyuk, A. P., 2000,“Methane Steam Reforming in a Pd-Ru Membrane Reactor,” Korean J. Chem.Eng., 17(3), pp. 288–291.
[43] Nielsen, P. E. H., and Lehrmann, P., 1995, “Steam Reforming of Methane in aMembrane Reactor,” Catal. Today, 25(3), pp. 303–307.
[44] Oklany, J. S., Hou, K., and Hughes, R., 1998, “A Simulative Comparison ofDense and Microporous Membrane Reactors for the Steam Reforming of Meth-ane,” Appl. Catal., 170(1), pp. 13–22.
[45] Patel, K., and Sunol, A., 2007, “Modeling and Simulation of Methane SteamReforming in a Thermally Coupled Membrane Reactor,” Int. J. HydrogenEnergy, 32(13), pp. 2344–2358.
[46] Shu, J., Grandjean, B. P. A., and Kaliaguine, S., 1994, “Methane SteamReforming in Asymmetric Pd- and Pd-Ag/Porous SS Membrane Reactors,” Sci-ence, 119(2), pp. 305–325.
[47] Tong, J., and Matsumura, Y., 2006, “Pure Hydrogen Production by MethaneSteam Reforming With Hydrogen-Permeable Membrane Reactor,” Catal.Today, 111(3–4), pp. 147–152.
[48] Tong, J., Su, L., Kashima, Y., Shirai, R., Suda, H., and Matsumura, Y., 2006,“Simultaneously Depositing Pd�Ag Thin Membrane on Asymmetric PorousStainless Steel Tube and Application to Produce Hydrogen From SteamReforming of Methane,” Ind. Eng. Chem. Res., 45(2), pp. 648–655.
[49] Uemiya, S., Sato, N., Ando, H., and Matsuda, T., 1991, “Steam Reforming ofMethane in a Hydrogen-Permeable Membrane Reactor,” Appl. Catal., 67(1),pp. 223–230.
[50] Adris, A. M., Lim, C. J., and Grace, J. R., 1994, “The Fluidized Bed MembraneReactor System: A Pilot Scale Experimental Study,” Chem. Eng. Sci., 49(24),pp. 5833–5843.
[51] OhI, G. L., Stein, J. L., and Smith, G. E., 1996, “Fundamental Factors in theDesign of a Fast Responding Methanol to Hydrogen Steam Reformer for Trans-portation Applications,” ASME J. Energy Resour. Technol., 118(2), pp.112–119.
[52] Hou, K., and Hughes, R., 2001, “The Kinetics of Methane Steam ReformingOver a Ni/alpha-Al2O Catalyst,” Chem. Eng. J., 82(1–3), pp. 311–328.
[53] Munster, P., and Grabke, H. J., 1981, “Kinetics of the Steam Reforming ofMethane With Iron, Nickel, and Iron-Nickel Alloys as Catalysts,” J. Catal.,72(2), pp. 279–287.
[54] Nikolla, E., Schwank, J., and Linic, S., 2009, “Comparative Study of theKinetics of Methane Steam Reforming on Supported Ni and Sn/Ni Alloy Cata-lysts: The Impact of the Formation of Ni Alloy on Chemistry,” J. Catal., 263(2),pp. 220–227.
[55] Agnelli, M. E., Ponzi, E. N., and Yermian, A. A., 1987, “Catalytic Deactivationon Methane Steam Reforming Catalysis. 2. Kinetics Study,” Ind. Eng. Chem.Res., 26(8), pp. 1707–1713.
[56] Ko, K.-D., Lee, J. K., Park, D., and Shin, S. H., 1995, “Kinetics of SteamReforming Over a Ni/Alumina Catalyst,” Korean J. Chem. Eng., 12(4), pp.478–480.
[57] Allen, D. W., Gerhard, E. R., and Likins, M. R., 1975, “Kinetics of theMethane-Steam Reaction,” Ind. Eng. Chem. Process. Des. Dev., 14(3), pp.256–259.
[58] Ross, J. R. H., and Steel, M. C. F., 1973, “Mechanism of the Steam Reformingof Methane Over a Coprecipitated Nickel-Alumina Catalyst,” J. Chem. Soc.Faraday Trans. 1 Phys. Chem. Condens. Phases, 69, p. 10.
[59] Xu, J., and Froment, G. F., 1989, “Methane Steam Reforming, Methanation andWater–Gas Shift: I. Intrinsic Kinetics,” AIChE J., 35(1), pp. 88–96.
[60] Adris, A. M., Elnashie, S. S. E. H., AL-Ubaid, A. S., and Soliman, M. A., 1990,“On the Non-Monotonic Behavior of Methane-Steam Reforming Kinetics,”Chem. Eng. Sci., 45(2), pp. 491–501.
[61] Avetisov, A. K., Rostrup-Nielsen, J. R., Kuchaev, V. L., Bak Hansen, J.-H.,Zyskin, A. G., and Shapatina, E. N., 2010, “Steady-State Kinetics andMechanism of Methane Reforming With Steam and Carbon Dioxide Over NiCatalyst,” J. Mol. Catal. A: Chem., 315(2), pp. 155–162.
[62] Wei, J., and Iglesia, E., 2009, “Steam Methane Reforming in a Ni/Al2O3 Cata-lyst: Kinetics and Diffusional Limitations in Extrudates,” Can. J. Chem. Eng.,87(6), pp. 945–956.
[63] Hoang, D. L., Chan, S. H., and Ding, O. L., 2005, “Kinetic and ModellingStudy of Methane Steam Reforming Over Sulfide Nickel Catalyst on a GammaAlumina Support,” Chem. Eng. J., 112(1–3), pp. 1–11.
[64] Soliman, M. A., Adris, A. M., Al-Ubaid, A. S., and El-Nashaie, S. S. E. H.,2007, “Intrinsic Kinetics of Nickel/Calcium Aluminate Catalyst for MethaneSteam Reforming,” J. Chem. Technol. Biotechnol., 55(2), pp. 131–138.
[65] Seo, Y.-S., Seo, D.-J., Seo, Y.-T., and Yoon, W.-L., 2006, “Investigation of theCharacteristics of a Compact Steam Reformer Integrated With a Water-GasShift Reactor,” J. Power Sources, 161(2), pp. 1208–1216.
[66] Soliman, M. A., El-Nashaie, S. S. E. H., Al-Ubaid, A., and Adris, A., 1801,“Simulation of Steam Reformer for Methane,” Chem. Eng. J., 13(8), pp.1801–1806.
[67] Pin, J., Schbib, S., and Borio, D. O., 2001, “Influence of the Heat Flux Profileson the Operation of Primary Steam Reformers,” Ind. Eng. Chem. Res., 40(2),pp. 5215–5221.
012001-10 / Vol. 137, JANUARY 2015 Transactions of the ASME
Downloaded From: http://asmedigitalcollection.asme.org/ on 04/05/2015 Terms of Use: http://asme.org/terms

[68] Irani, M., Alizadehdakhel, A., Pour, A. N., Hoseini, N., and Adinehnia, M.,2011, “CFD Modeling of Hydrogen Production Using Steam Reforming ofMethane in Monolith Reactors: Surface or Volume-Base Reaction Model?,”Int. J. Hydrogen Energy, 36(24), pp. 15602–15610.
[69] Schwaab, M., Alberton, L., Fontes, C. E., Bittencourt, R. C., Pinto, C., and Mu,L., 2009, “Hybrid Modeling of Methane Reformers. 2. Modeling of the Indus-trial Reactors,” Ind. Eng. Chem. Res., 48(21), pp. 9376–9382.
[70] De Wilde, J., and Froment, G. F., 2012, “Computational Fluid Dynamics inChemical Reactor Analysis and Design: Application to the ZoneFlow TMReactor for Methane Steam Reforming,” Fuel, 100, pp. 48–56.
[71] Zanfir, M., and Gavriilidis, A., 2003, “Catalytic Combustion Assisted Methane SteamReforming in a Catalytic Plate Reactor,” Chem. Eng. Sci., 58(17), pp. 3947–3960.
[72] Zhai, X., Ding, S., Cheng, Y., Jin, Y., and Cheng, Y., 2010, “CFD SimulationWith Detailed Chemistry of Steam Reforming of Methane for Hydrogen Pro-duction in an Integrated Micro-Reactor,” Int. J. Hydrogen Energy, 35(11), pp.5383–5392.
[73] Pantoleontos, G., Kikkinides, E. S., and Georgiadis, M. C., 2012, “A Heteroge-neous Dynamic Model for the Simulation and Optimisation of the Steam Meth-ane Reforming Reactor,” Int. J. Hydrogen Energy, 2, pp. 1–13.
[74] Froment, G. F., and Xu, J., 1989, “Methane Steam Reforming: II. DiffusionalLimitations and Reactor Simulation,” AIChE J., 35(1), pp. 97–103.
[75] Pedernera, M. N., Pi~na, J., Borio, D. O., and Bucal�a, V., 2003, “Use of a Heter-ogeneous Two-Dimensional Model to Improve the Primary Steam ReformerPerformance,” Chem. Eng. J., 94(1), pp. 29–40.
[76] Froment, G. F., 2000, “Production of Synthesis Gas by Steam- andCO2-Reforming of Natural Gas,” J. Mol. Catal. A Chem., 163(1–2), pp. 147–156.
[77] Nandasana, A. D., Ray, A. K., and Gupta, S. K., 2003, “Dynamic Model of anIndustrial Steam Reformer and Its Use for Multiobjective Optimization,” Ind.Eng. Chem. Res., 42(17), pp. 4028–4042.
[78] Vakhshouri, K., and Hashemi, M. M. Y. M., 2008, “Simulation Study of RadialHeat and Mass Transfer Inside a Fixed Bed Catalytic Reactor,” Int. J. Chem.Biol. Eng., 23(1), pp. 1–8.
[79] Shayegan, J., Hashemi, M. M. Y. M., and Vakhshouri, K., 2008, “Operation ofan Industrial Steam Reformer Under Severe Condition: A Simulation Study,”Can. J. Chem. Eng., 86(4), pp. 747–755.
[80] Alberton, L., Schwaab, M., Fontes, C. E., Bittencourt, R. C., and Pinto C. Jose,2009, “Hybrid Modeling of Methane Reformers. 1. A Metamodel for the Effec-tiveness Factor of a Catalyst Pellet With Complex Geometry,” Ind. Eng. Chem.Res., 48(21), pp. 9369–9375.
[81] Singh, C. P. P., and Saraf, D. N., 1979, “Simulation of Side Fired Steam-Hydrocarbon Reformers,” Ind. Eng. Chem. Process. Des. Dev., 18(1),pp. 1–7.
[82] Wilke, C. R., and Chang, P., 1955, “Correlation of Diffusion Coefficients inDilute Solutions,” AIChE J., 1(2), pp. 264–270.
[83] Janbozorgi, M., Sheikhi, M. R. H., and Metghalchi, H., 2013, “Principle ofDetailed Balance and Second Law of Thermodynamics,” ASME J. EnergyResour. Technol., 135(4), p. 041901.
[84] Bond, G. C., Webb, G., and Ross, J. R. H., 1982, “Metal Catalysed Methana-tion and Steam Reforming,” Catal. R. Soc. Chem. Spec. Period. Rep., 7,pp. 1–45.
[85] Erugn, S., 1952, “Fluid Flow Through Packed Columns,” Chem. Eng. Prog.,48(2), pp. 89–94.
Journal of Energy Resources Technology JANUARY 2015, Vol. 137 / 012001-11
Downloaded From: http://asmedigitalcollection.asme.org/ on 04/05/2015 Terms of Use: http://asme.org/terms


