Embed Size (px)
Citation preview
On the sheltering effect of islands in ocean wave models
S. Ponce de Leon and C. Guedes SoaresUnit of Marine Technology and Engineering, Technical University of Lisbon, Instituto Superior Tecnico, Lisbon, Portugal
Received 24 August 2004; revised 3 March 2005; accepted 13 June 2005; published 28 September 2005.
[1] The effect of resolving relatively small islands in a third-generation wave modelcovering the whole North Atlantic is shown to have noticeable effects at long distancesfrom the islands in addition to the local effects that have been reported earlier. To resolvethe islands, a very fine grid is adopted locally, which is then nested in the overall model.The examples presented show the shadowing effect of Azores Islands for three specificwave conditions: when they come from the southwest, from the west, and from thenorthwest. The sheltering effect of the islands was demonstrated by a reduction of thesignificant wave height in the region on the leeward side of Azores Archipelago whencomparing the wave model results with the island resolved and unresolved.
Citation: Ponce de Leon, S., and C. Guedes Soares (2005), On the sheltering effect of islands in ocean wave models, J. Geophys.
Res., 110, C09020, doi:10.1029/2004JC002682.
1. Introduction
[2] Wave models have become established as robust toolsto predict wave conditions generated by wind fields. Thethird-generation models such as WAM [WAMDI Group,1988] and WAVEWATCH [Tolman, 1991] have been shownto provide good predictions and are widely used by mete-orological offices.[3] The skill of these models is good, but it depends much
on the quality of the input wind fields, as has beendemonstrated in several studies [Teixeira et al., 1995;Holthuijsen et al., 1996; Ponce de Leon and Ocampo-Torres, 1998]. The interest of climatology in reanalyzingpast data so as to produce consistent data sets of atmo-spheric data is very useful as the wind fields can be used toforce wave models and also to produce consistent sets ofwave data.[4] In the scope of a European project, a 40 year
reanalysis has been done in order to produce consistentwave predictions over that time period for the waters aroundEurope as described by Guedes Soares et al. [2002]. It takesadvantage of the 40 year atmospheric reanalysis done by theNational Centers for Environmental Prediction (NCEP) forthe period 1958–1998 [Kalnay et al., 1996], which pro-vides the basic wind fields used in that study. These windfields were used to force a local area atmospheric model,which produces fine-grid and high-time-resolution winddata for the Atlantic coasts of Europe. This local area modeltakes due account of the land topography and thus is able toproduce better wind fields close to the coast than the globalatmospheric model that is used to force it. Waves are beingpredicted by the WAMc4 model [Gunther et al., 1992] inthe deep water mode, which produces good hindcasts for theoffshore areas around Europe.[5] As a follow-up activity, an effort has been started to
hindcast the wave conditions in coastal shallow waters
using an appropriate shallow water model. Several modelshave been developed to take into account the specificeffects that occur in shallow waters. Ris et al. [1999]have developed SWAN, a near-shore model that dealswith wave generation, dissipation, and nonlinear transfersin addition to several shallow water processes such asdepth-induced wave breaking and triad interactions. Itallows for different possibilities of parameterizing thedifferent laws.[6] A different approach was adopted by Schneggenburger
et al. [2000] in the K model, which only captures the mainphysical processes, i.e., it accounts for wind input energy,nonlinear dissipation, and bottom interaction dissipation.[7] A still different approach was adopted by Monbaliu et
al. [2000], who have modified the original code of WAMc4by adapting it for shallow waters and high spatial applica-tions. This work has been done during the PROMISEproject, and this version of the model is being denoted asWAM-PRO, which is thus a third-generation wave modelthat describes the evolution of the directional wave spec-trum through the energy balance equation, or the so-calledtransport wave equation [Komen et al., 1994].[8] The new version of WAM-PRO has implemented
additional source terms to deal with the shallow waterphysics, a depth-induced wave breaking, and six newbottom friction formulations, two of them taking intoaccount wave-current interaction, and it also incorporatesa new fetch growth limiter according to Luo and Sclavo[1997]. Another improvement related to the numericalmethods was introduced in WAM-PRO by Osuna [2002]for the nested run procedure and for the generation ofboundary conditions to avoid a large amount of disk space.[9] WAM-PRO was adopted for the present study, and
comparisons with WAMc4 results and with buoy measure-ments are reported by Ponce de Leon et al. [2004a, 2004b].In deep water the differences between the models arenegligible, but on the coastal regions, some differenceswere identified, as expected.
JOURNAL OF GEOPHYSICAL RESEARCH, VOL. 110, C09020, doi:10.1029/2004JC002682, 2005
Copyright 2005 by the American Geophysical Union.0148-0227/05/2004JC002682$09.00
C09020 1 of 17
[10] As the study was aimed at the conditions very closeto the coast, a fine grid of 0.25� was used around continentalPortugal and the Azores Islands. When using the fine grid,the Azores Islands could be discriminated, and their effectbecame apparent in the wave calculations. In performingdifferent studies, it was observed that in some cases thepresence of the Azores Islands would induce a shelteringeffect that was felt at unexpected large distances from theislands.[11] Observations of wave shadows induced by islands of
arbitrary shape are limited, and one of the few examples arePawka [1983] and Pawka et al. [1984], which reportedexperiments in southern California to evaluate a numericalmodel of the sheltering of waves by islands.[12] The sheltering effect of islands has been studied in
connection with its effects in the relative vicinity of theislands by O’Reilly et al. [1999]. They studied the dissipa-tion of wave energy by the reflection from cliffs on the coastof California using the spectral analysis derived from a databuoy, showing that swell is affected by the sheltering ofPoint Conception and Channel Islands. Also, Oliveira-Pireset al. [1997] have studied the effect of sheltering at closeproximity to the Azores Islands using a ray model.[13] Tolman [2003] has discussed the problem of unre-
solved islands in ocean wave models, which were identifiedas a source of major local errors. He developed a scheme todeal with the presence of the islands without having to use afine grid at those locations.[14] This paper considers the effect of unresolved islands
in ocean wave models not only locally but also at longdistances from the islands. In the present work a fine grid isadopted around the Azores Islands, and it will be shown thatresolving the islands has, in addition to the strong localeffect, a noticeable effect at large distances from the islands.In order to assess the influence of the Azores archipelago onthe wave field, two independent hindcasts were performed,first by omitting the islands and second by taking them intoaccount.[15] It was observed that in certain wind conditions the
spatial distribution of the significant wave height exhibits astrong spatial distortion when the presence of the islandswas considered in the hindcast. In the region of the AzoresIslands the significant wave height could be reduced by upto 4 m compared with the case in which the islands were notdiscriminated in the wave modeling, while for distances ofthe order of 500 km, reductions of 1 or 2 m can still beobserved. This was observed when waves come from thewest, the northwest, or the southwest.
2. Modeling the Azores Area
[16] The Azores archipelago is located between Europe,North America, and Africa. It is characterized by a rela-tively strong seismicity and active volcanism. Landscapefeatures are characteristic of volcanic formation, with sharppeaks and ridges, craters, ravines, and lava fields.[17] The nine islands that form the Azores archipelago lie
between longitudes 25� and 32�W and latitudes 37� and40�N. The archipelago has three groups of islands: first isthe western group composed of the Flores and CorvoIslands, the second group is composed of the Terceira,Faial, Pico, Sao Jorge, and Graciosa Islands, and the third
group is composed of the Sao Miguel and Santa MariaIslands. The eastern group is 760 nautical miles west ofPortugal, and the western group is about 1070 nautical mileseast-southeast of Cape Race, Newfoundland. The wholearchipelago is oriented west-northwest to east-southeast andis about 330 nautical miles in extent (Figure 1).[18] When a cyclonic low pressure in the open ocean is
formed, some specific wind field is generated associatedwith it and generates a system of wind waves. When thewave systems propagate across the North Atlantic Ocean,they will encounter the Azores archipelago in the middle ofthe Atlantic Ocean.[19] The islands are exposed to the wind and waves
generated by the extra tropical storms and by the tropicalcyclones usually approaching from the southwest and south.According to Brand [2002], the most severe winds onrecord in the last 50 years occurred during the winter stormin 1980 (120 mph). Several container vessels were lost inthe open seas of the Azores area. They pointed out that extratropical storm winds and seas tend to have a more westerlycomponent than tropical cyclones.[20] In this work the wind fields adopted are the ones that
have been produced in the HIPOCAS project [GuedesSoares et al., 2002]. The NCEP results of Kalnay et al.[1996] were used to force the fine-grid REMO regionalmodel of Jacob and Podzum [1997]. The REMO output,described by Feser and Weisse [2003], for the northeastAtlantic was then complemented with the NCEP fields inthe areas away from Europe. In this way the entire NorthAtlantic Ocean region was covered to deal properly with thespatial scale of the wind wave systems associated with theatmospheric depression that often appear in the area ofAzores. The final product is a wind field with 0.5� ofresolution in latitude and longitude and a wind input timestep of 1 hour.[21] Two representative wind conditions from this period
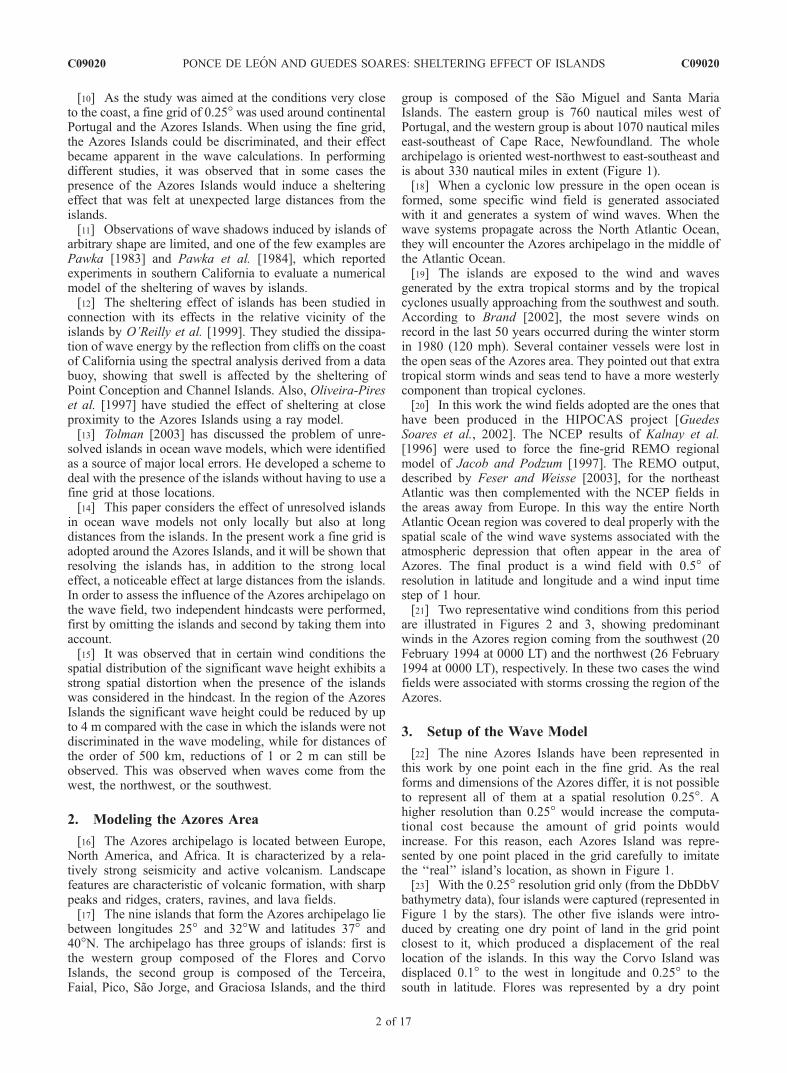
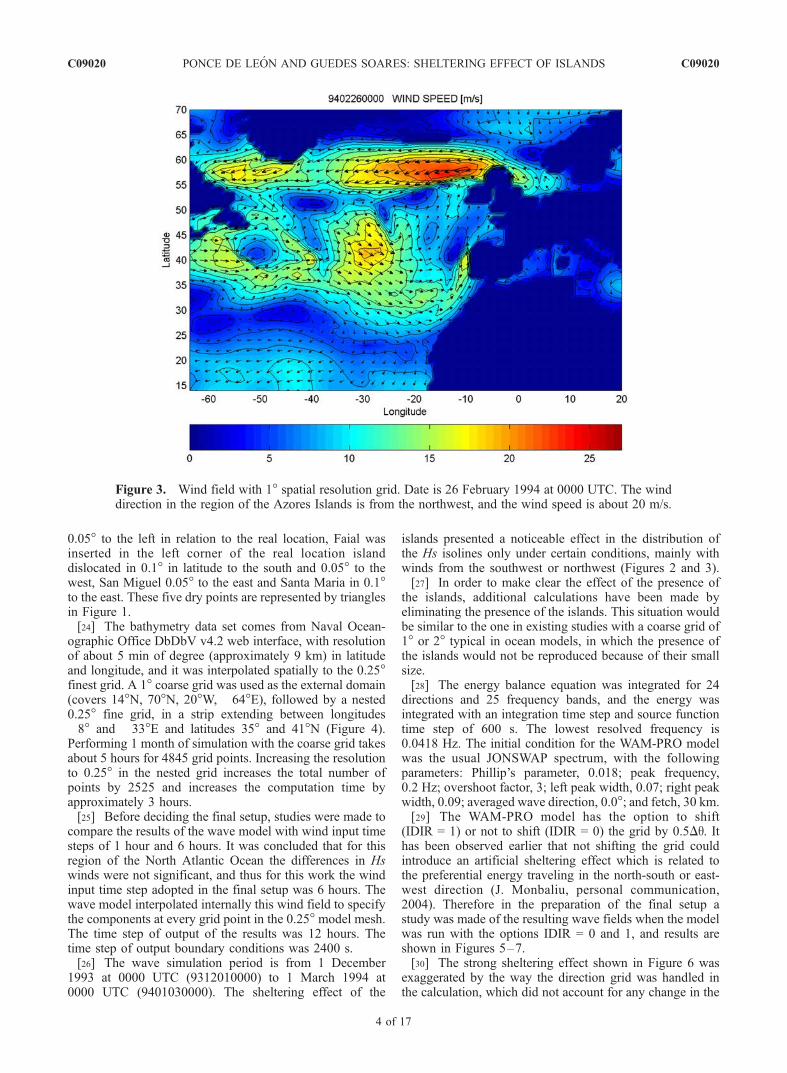
are illustrated in Figures 2 and 3, showing predominantwinds in the Azores region coming from the southwest (20February 1994 at 0000 LT) and the northwest (26 February1994 at 0000 LT), respectively. In these two cases the windfields were associated with storms crossing the region of theAzores.
3. Setup of the Wave Model
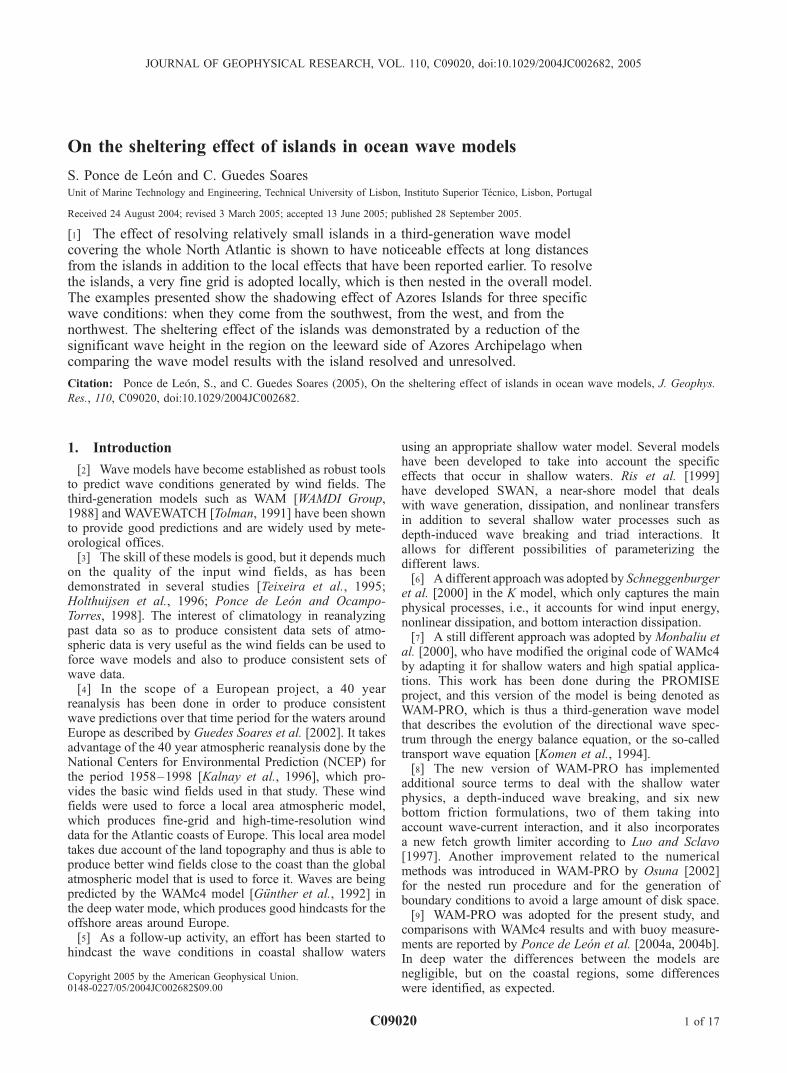
[22] The nine Azores Islands have been represented inthis work by one point each in the fine grid. As the realforms and dimensions of the Azores differ, it is not possibleto represent all of them at a spatial resolution 0.25�. Ahigher resolution than 0.25� would increase the computa-tional cost because the amount of grid points wouldincrease. For this reason, each Azores Island was repre-sented by one point placed in the grid carefully to imitatethe ‘‘real’’ island’s location, as shown in Figure 1.[23] With the 0.25� resolution grid only (from the DbDbV
bathymetry data), four islands were captured (represented inFigure 1 by the stars). The other five islands were intro-duced by creating one dry point of land in the grid pointclosest to it, which produced a displacement of the reallocation of the islands. In this way the Corvo Island wasdisplaced 0.1� to the west in longitude and 0.25� to thesouth in latitude. Flores was represented by a dry point
C09020 PONCE DE LEON AND GUEDES SOARES: SHELTERING EFFECT OF ISLANDS
2 of 17
C09020
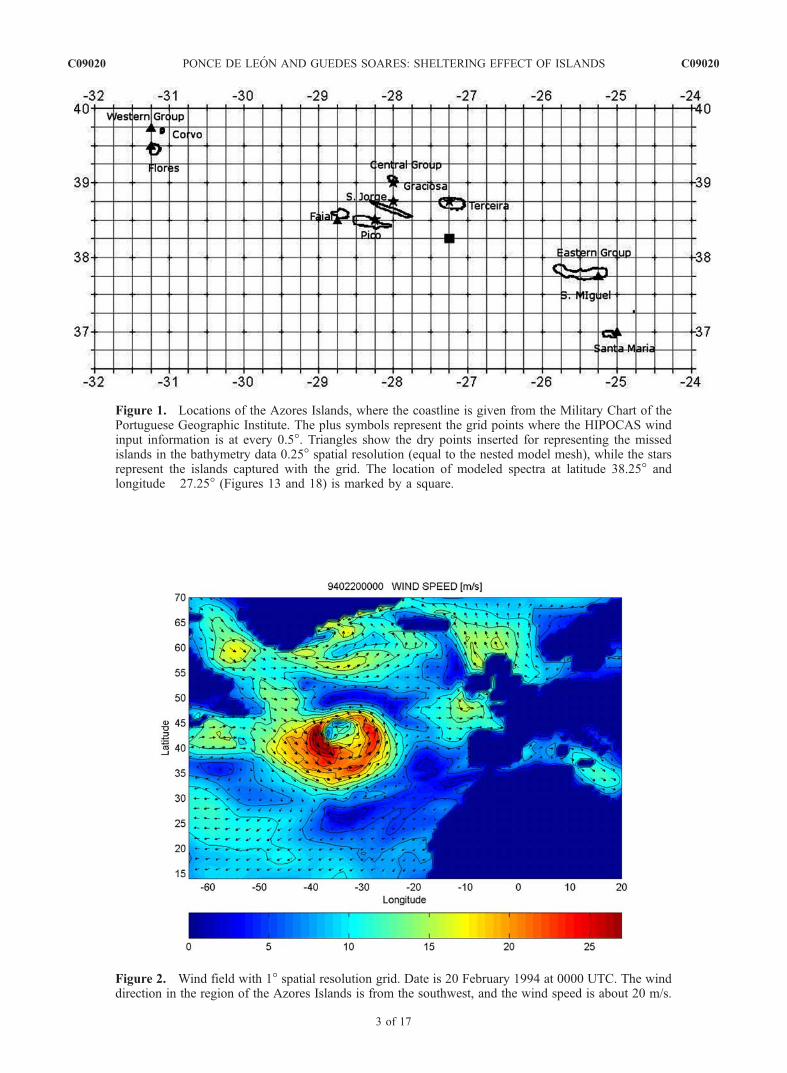
Figure 1. Locations of the Azores Islands, where the coastline is given from the Military Chart of thePortuguese Geographic Institute. The plus symbols represent the grid points where the HIPOCAS windinput information is at every 0.5�. Triangles show the dry points inserted for representing the missedislands in the bathymetry data 0.25� spatial resolution (equal to the nested model mesh), while the starsrepresent the islands captured with the grid. The location of modeled spectra at latitude 38.25� andlongitude �27.25� (Figures 13 and 18) is marked by a square.
Figure 2. Wind field with 1� spatial resolution grid. Date is 20 February 1994 at 0000 UTC. The winddirection in the region of the Azores Islands is from the southwest, and the wind speed is about 20 m/s.
C09020 PONCE DE LEON AND GUEDES SOARES: SHELTERING EFFECT OF ISLANDS
3 of 17
C09020
0.05� to the left in relation to the real location, Faial wasinserted in the left corner of the real location islanddislocated in 0.1� in latitude to the south and 0.05� to thewest, San Miguel 0.05� to the east and Santa Maria in 0.1�to the east. These five dry points are represented by trianglesin Figure 1.[24] The bathymetry data set comes from Naval Ocean-
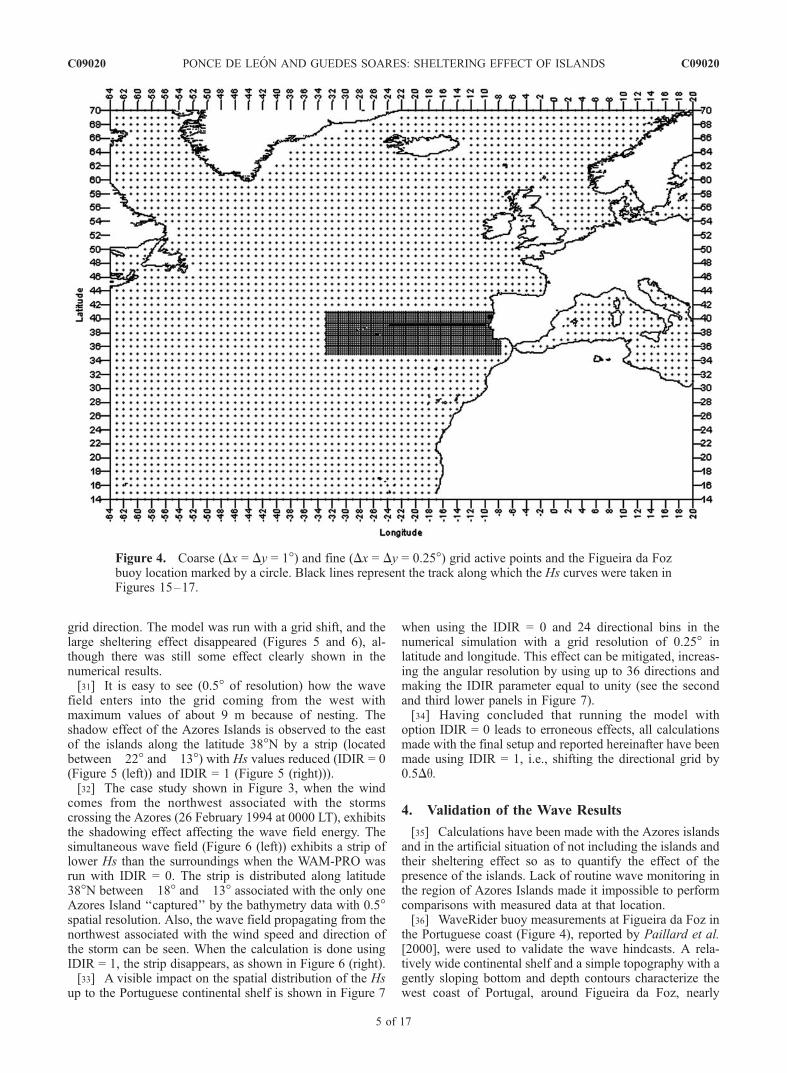
ographic Office DbDbV v4.2 web interface, with resolutionof about 5 min of degree (approximately 9 km) in latitudeand longitude, and it was interpolated spatially to the 0.25�finest grid. A 1� coarse grid was used as the external domain(covers 14�N, 70�N, 20�W, �64�E), followed by a nested0.25� fine grid, in a strip extending between longitudes�8� and �33�E and latitudes 35� and 41�N (Figure 4).Performing 1 month of simulation with the coarse grid takesabout 5 hours for 4845 grid points. Increasing the resolutionto 0.25� in the nested grid increases the total number ofpoints by 2525 and increases the computation time byapproximately 3 hours.[25] Before deciding the final setup, studies were made to
compare the results of the wave model with wind input timesteps of 1 hour and 6 hours. It was concluded that for thisregion of the North Atlantic Ocean the differences in Hswinds were not significant, and thus for this work the windinput time step adopted in the final setup was 6 hours. Thewave model interpolated internally this wind field to specifythe components at every grid point in the 0.25� model mesh.The time step of output of the results was 12 hours. Thetime step of output boundary conditions was 2400 s.[26] The wave simulation period is from 1 December
1993 at 0000 UTC (9312010000) to 1 March 1994 at0000 UTC (9401030000). The sheltering effect of the
islands presented a noticeable effect in the distribution ofthe Hs isolines only under certain conditions, mainly withwinds from the southwest or northwest (Figures 2 and 3).[27] In order to make clear the effect of the presence of
the islands, additional calculations have been made byeliminating the presence of the islands. This situation wouldbe similar to the one in existing studies with a coarse grid of1� or 2� typical in ocean models, in which the presence ofthe islands would not be reproduced because of their smallsize.[28] The energy balance equation was integrated for 24
directions and 25 frequency bands, and the energy wasintegrated with an integration time step and source functiontime step of 600 s. The lowest resolved frequency is0.0418 Hz. The initial condition for the WAM-PRO modelwas the usual JONSWAP spectrum, with the followingparameters: Phillip’s parameter, 0.018; peak frequency,0.2 Hz; overshoot factor, 3; left peak width, 0.07; right peakwidth, 0.09; averaged wave direction, 0.0�; and fetch, 30 km.[29] The WAM-PRO model has the option to shift
(IDIR = 1) or not to shift (IDIR = 0) the grid by 0.5Dq. Ithas been observed earlier that not shifting the grid couldintroduce an artificial sheltering effect which is related tothe preferential energy traveling in the north-south or east-west direction (J. Monbaliu, personal communication,2004). Therefore in the preparation of the final setup astudy was made of the resulting wave fields when the modelwas run with the options IDIR = 0 and 1, and results areshown in Figures 5–7.[30] The strong sheltering effect shown in Figure 6 was
exaggerated by the way the direction grid was handled inthe calculation, which did not account for any change in the
Figure 3. Wind field with 1� spatial resolution grid. Date is 26 February 1994 at 0000 UTC. The winddirection in the region of the Azores Islands is from the northwest, and the wind speed is about 20 m/s.
C09020 PONCE DE LEON AND GUEDES SOARES: SHELTERING EFFECT OF ISLANDS
4 of 17
C09020
grid direction. The model was run with a grid shift, and thelarge sheltering effect disappeared (Figures 5 and 6), al-though there was still some effect clearly shown in thenumerical results.[31] It is easy to see (0.5� of resolution) how the wave
field enters into the grid coming from the west withmaximum values of about 9 m because of nesting. Theshadow effect of the Azores Islands is observed to the eastof the islands along the latitude 38�N by a strip (locatedbetween �22� and �13�) with Hs values reduced (IDIR = 0(Figure 5 (left)) and IDIR = 1 (Figure 5 (right))).[32] The case study shown in Figure 3, when the wind
comes from the northwest associated with the stormscrossing the Azores (26 February 1994 at 0000 LT), exhibitsthe shadowing effect affecting the wave field energy. Thesimultaneous wave field (Figure 6 (left)) exhibits a strip oflower Hs than the surroundings when the WAM-PRO wasrun with IDIR = 0. The strip is distributed along latitude38�N between �18� and �13� associated with the only oneAzores Island ‘‘captured’’ by the bathymetry data with 0.5�spatial resolution. Also, the wave field propagating from thenorthwest associated with the wind speed and direction ofthe storm can be seen. When the calculation is done usingIDIR = 1, the strip disappears, as shown in Figure 6 (right).[33] A visible impact on the spatial distribution of the Hs
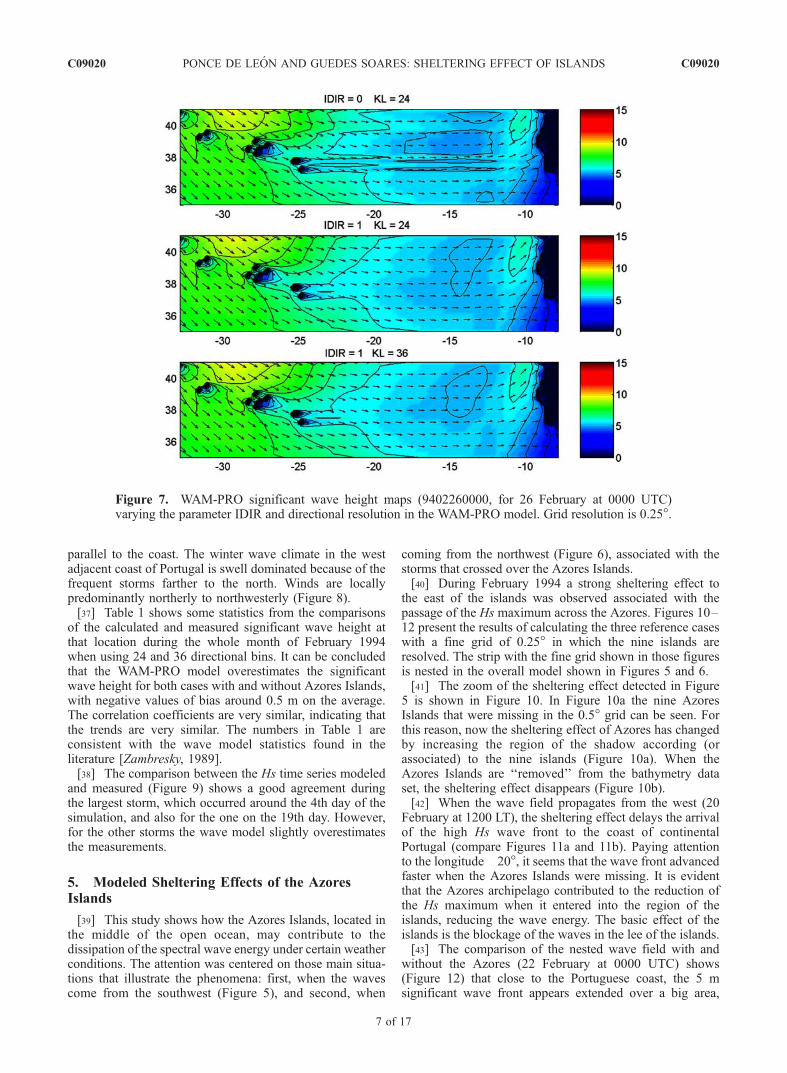
up to the Portuguese continental shelf is shown in Figure 7
when using the IDIR = 0 and 24 directional bins in thenumerical simulation with a grid resolution of 0.25� inlatitude and longitude. This effect can be mitigated, increas-ing the angular resolution by using up to 36 directions andmaking the IDIR parameter equal to unity (see the secondand third lower panels in Figure 7).[34] Having concluded that running the model with
option IDIR = 0 leads to erroneous effects, all calculationsmade with the final setup and reported hereinafter have beenmade using IDIR = 1, i.e., shifting the directional grid by0.5Dq.
4. Validation of the Wave Results
[35] Calculations have been made with the Azores islandsand in the artificial situation of not including the islands andtheir sheltering effect so as to quantify the effect of thepresence of the islands. Lack of routine wave monitoring inthe region of Azores Islands made it impossible to performcomparisons with measured data at that location.[36] WaveRider buoy measurements at Figueira da Foz in
the Portuguese coast (Figure 4), reported by Paillard et al.[2000], were used to validate the wave hindcasts. A rela-tively wide continental shelf and a simple topography with agently sloping bottom and depth contours characterize thewest coast of Portugal, around Figueira da Foz, nearly
Figure 4. Coarse (Dx = Dy = 1�) and fine (Dx = Dy = 0.25�) grid active points and the Figueira da Fozbuoy location marked by a circle. Black lines represent the track along which the Hs curves were taken inFigures 15–17.
C09020 PONCE DE LEON AND GUEDES SOARES: SHELTERING EFFECT OF ISLANDS
5 of 17
C09020
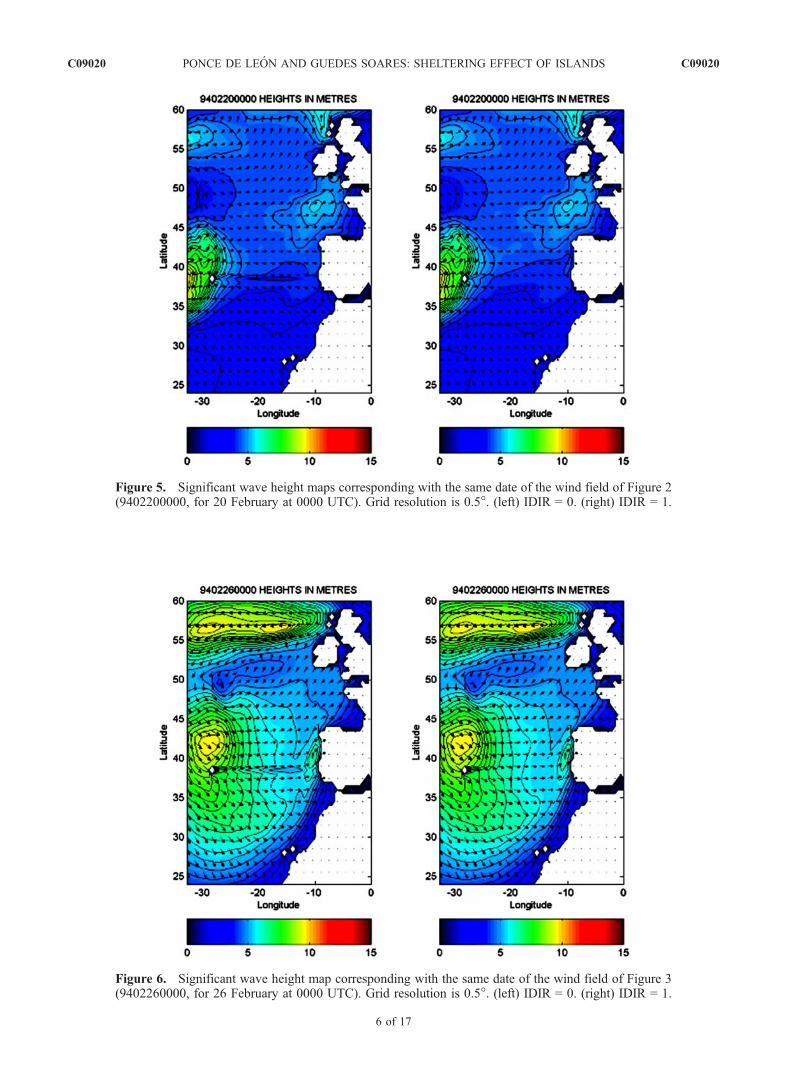
Figure 6. Significant wave height map corresponding with the same date of the wind field of Figure 3(9402260000, for 26 February at 0000 UTC). Grid resolution is 0.5�. (left) IDIR = 0. (right) IDIR = 1.
Figure 5. Significant wave height maps corresponding with the same date of the wind field of Figure 2(9402200000, for 20 February at 0000 UTC). Grid resolution is 0.5�. (left) IDIR = 0. (right) IDIR = 1.
C09020 PONCE DE LEON AND GUEDES SOARES: SHELTERING EFFECT OF ISLANDS
6 of 17
C09020
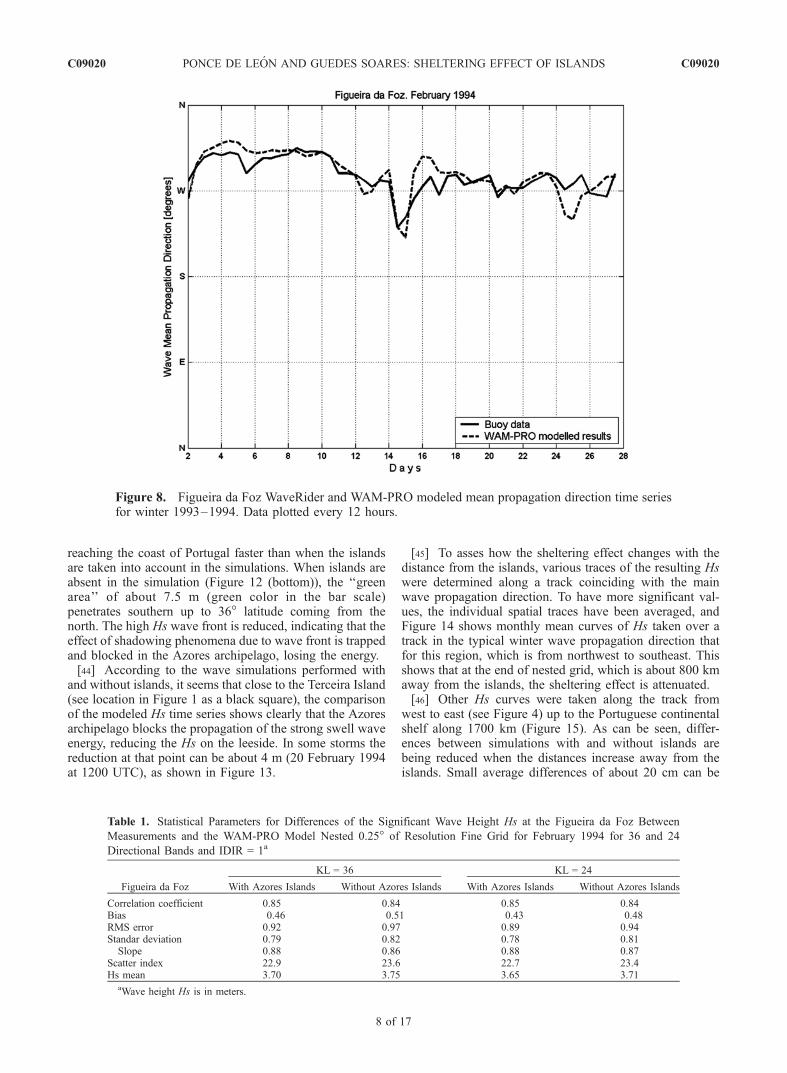
parallel to the coast. The winter wave climate in the westadjacent coast of Portugal is swell dominated because of thefrequent storms farther to the north. Winds are locallypredominantly northerly to northwesterly (Figure 8).[37] Table 1 shows some statistics from the comparisons
of the calculated and measured significant wave height atthat location during the whole month of February 1994when using 24 and 36 directional bins. It can be concludedthat the WAM-PRO model overestimates the significantwave height for both cases with and without Azores Islands,with negative values of bias around 0.5 m on the average.The correlation coefficients are very similar, indicating thatthe trends are very similar. The numbers in Table 1 areconsistent with the wave model statistics found in theliterature [Zambresky, 1989].[38] The comparison between the Hs time series modeled
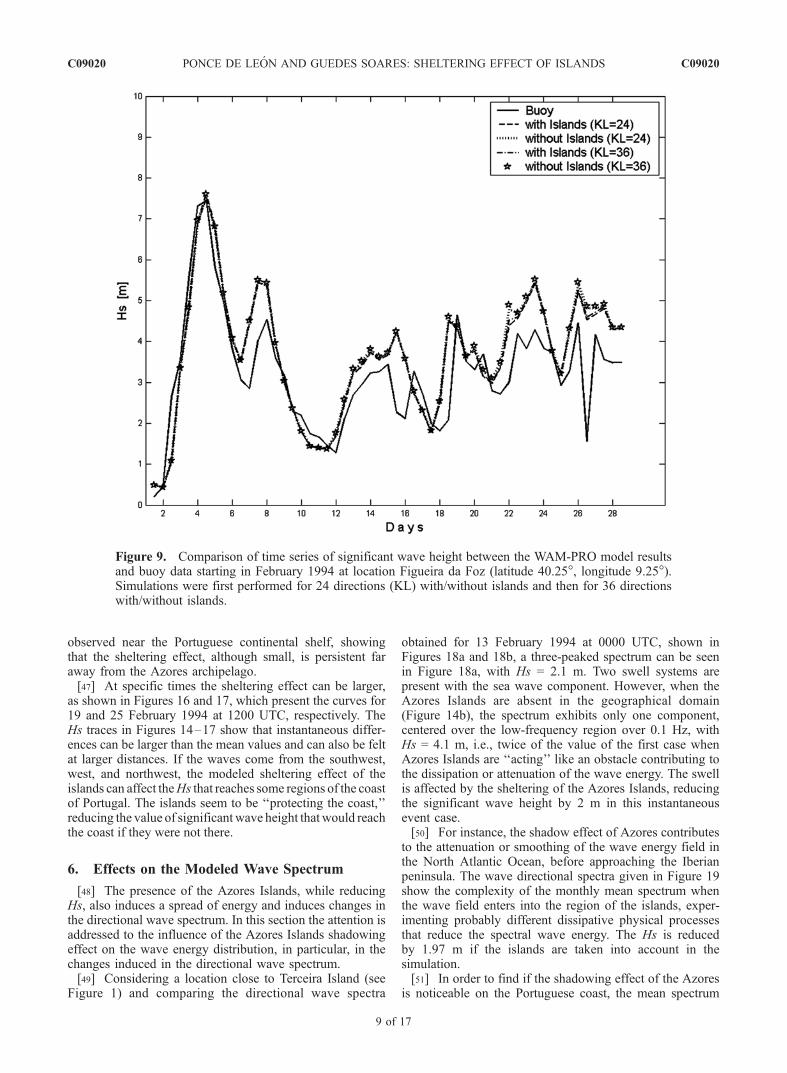
and measured (Figure 9) shows a good agreement duringthe largest storm, which occurred around the 4th day of thesimulation, and also for the one on the 19th day. However,for the other storms the wave model slightly overestimatesthe measurements.
5. Modeled Sheltering Effects of the AzoresIslands
[39] This study shows how the Azores Islands, located inthe middle of the open ocean, may contribute to thedissipation of the spectral wave energy under certain weatherconditions. The attention was centered on those main situa-tions that illustrate the phenomena: first, when the wavescome from the southwest (Figure 5), and second, when
coming from the northwest (Figure 6), associated with thestorms that crossed over the Azores Islands.[40] During February 1994 a strong sheltering effect to
the east of the islands was observed associated with thepassage of the Hs maximum across the Azores. Figures 10–12 present the results of calculating the three reference caseswith a fine grid of 0.25� in which the nine islands areresolved. The strip with the fine grid shown in those figuresis nested in the overall model shown in Figures 5 and 6.[41] The zoom of the sheltering effect detected in Figure
5 is shown in Figure 10. In Figure 10a the nine AzoresIslands that were missing in the 0.5� grid can be seen. Forthis reason, now the sheltering effect of Azores has changedby increasing the region of the shadow according (orassociated) to the nine islands (Figure 10a). When theAzores Islands are ‘‘removed’’ from the bathymetry dataset, the sheltering effect disappears (Figure 10b).[42] When the wave field propagates from the west (20
February at 1200 LT), the sheltering effect delays the arrivalof the high Hs wave front to the coast of continentalPortugal (compare Figures 11a and 11b). Paying attentionto the longitude �20�, it seems that the wave front advancedfaster when the Azores Islands were missing. It is evidentthat the Azores archipelago contributed to the reduction ofthe Hs maximum when it entered into the region of theislands, reducing the wave energy. The basic effect of theislands is the blockage of the waves in the lee of the islands.[43] The comparison of the nested wave field with and
without the Azores (22 February at 0000 UTC) shows(Figure 12) that close to the Portuguese coast, the 5 msignificant wave front appears extended over a big area,
Figure 7. WAM-PRO significant wave height maps (9402260000, for 26 February at 0000 UTC)varying the parameter IDIR and directional resolution in the WAM-PRO model. Grid resolution is 0.25�.
C09020 PONCE DE LEON AND GUEDES SOARES: SHELTERING EFFECT OF ISLANDS
7 of 17
C09020
reaching the coast of Portugal faster than when the islandsare taken into account in the simulations. When islands areabsent in the simulation (Figure 12 (bottom)), the ‘‘greenarea’’ of about 7.5 m (green color in the bar scale)penetrates southern up to 36� latitude coming from thenorth. The high Hs wave front is reduced, indicating that theeffect of shadowing phenomena due to wave front is trappedand blocked in the Azores archipelago, losing the energy.[44] According to the wave simulations performed with
and without islands, it seems that close to the Terceira Island(see location in Figure 1 as a black square), the comparisonof the modeled Hs time series shows clearly that the Azoresarchipelago blocks the propagation of the strong swell waveenergy, reducing the Hs on the leeside. In some storms thereduction at that point can be about 4 m (20 February 1994at 1200 UTC), as shown in Figure 13.
[45] To asses how the sheltering effect changes with thedistance from the islands, various traces of the resulting Hswere determined along a track coinciding with the mainwave propagation direction. To have more significant val-ues, the individual spatial traces have been averaged, andFigure 14 shows monthly mean curves of Hs taken over atrack in the typical winter wave propagation direction thatfor this region, which is from northwest to southeast. Thisshows that at the end of nested grid, which is about 800 kmaway from the islands, the sheltering effect is attenuated.[46] Other Hs curves were taken along the track from
west to east (see Figure 4) up to the Portuguese continentalshelf along 1700 km (Figure 15). As can be seen, differ-ences between simulations with and without islands arebeing reduced when the distances increase away from theislands. Small average differences of about 20 cm can be
Table 1. Statistical Parameters for Differences of the Significant Wave Height Hs at the Figueira da Foz Between
Measurements and the WAM-PRO Model Nested 0.25� of Resolution Fine Grid for February 1994 for 36 and 24
Directional Bands and IDIR = 1a
Figueira da Foz
KL = 36 KL = 24
With Azores Islands Without Azores Islands With Azores Islands Without Azores Islands
Correlation coefficient 0.85 0.84 0.85 0.84Bias �0.46 �0.51 �0.43 �0.48RMS error 0.92 0.97 0.89 0.94Standar deviation 0.79 0.82 0.78 0.81
Slope 0.88 0.86 0.88 0.87Scatter index 22.9 23.6 22.7 23.4Hs mean 3.70 3.75 3.65 3.71
aWave height Hs is in meters.
Figure 8. Figueira da Foz WaveRider and WAM-PRO modeled mean propagation direction time seriesfor winter 1993–1994. Data plotted every 12 hours.
C09020 PONCE DE LEON AND GUEDES SOARES: SHELTERING EFFECT OF ISLANDS
8 of 17
C09020
observed near the Portuguese continental shelf, showingthat the sheltering effect, although small, is persistent faraway from the Azores archipelago.[47] At specific times the sheltering effect can be larger,
as shown in Figures 16 and 17, which present the curves for19 and 25 February 1994 at 1200 UTC, respectively. TheHs traces in Figures 14–17 show that instantaneous differ-ences can be larger than the mean values and can also be feltat larger distances. If the waves come from the southwest,west, and northwest, the modeled sheltering effect of theislands can affect theHs that reaches some regions of the coastof Portugal. The islands seem to be ‘‘protecting the coast,’’reducing the value of significant wave height that would reachthe coast if they were not there.
6. Effects on the Modeled Wave Spectrum
[48] The presence of the Azores Islands, while reducingHs, also induces a spread of energy and induces changes inthe directional wave spectrum. In this section the attention isaddressed to the influence of the Azores Islands shadowingeffect on the wave energy distribution, in particular, in thechanges induced in the directional wave spectrum.[49] Considering a location close to Terceira Island (see
Figure 1) and comparing the directional wave spectra
obtained for 13 February 1994 at 0000 UTC, shown inFigures 18a and 18b, a three-peaked spectrum can be seenin Figure 18a, with Hs = 2.1 m. Two swell systems arepresent with the sea wave component. However, when theAzores Islands are absent in the geographical domain(Figure 14b), the spectrum exhibits only one component,centered over the low-frequency region over 0.1 Hz, withHs = 4.1 m, i.e., twice of the value of the first case whenAzores Islands are ‘‘acting’’ like an obstacle contributing tothe dissipation or attenuation of the wave energy. The swellis affected by the sheltering of the Azores Islands, reducingthe significant wave height by 2 m in this instantaneousevent case.[50] For instance, the shadow effect of Azores contributes
to the attenuation or smoothing of the wave energy field inthe North Atlantic Ocean, before approaching the Iberianpeninsula. The wave directional spectra given in Figure 19show the complexity of the monthly mean spectrum whenthe wave field enters into the region of the islands, exper-imenting probably different dissipative physical processesthat reduce the spectral wave energy. The Hs is reducedby 1.97 m if the islands are taken into account in thesimulation.[51] In order to find if the shadowing effect of the Azores
is noticeable on the Portuguese coast, the mean spectrum
Figure 9. Comparison of time series of significant wave height between the WAM-PRO model resultsand buoy data starting in February 1994 at location Figueira da Foz (latitude 40.25�, longitude 9.25�).Simulations were first performed for 24 directions (KL) with/without islands and then for 36 directionswith/without islands.
C09020 PONCE DE LEON AND GUEDES SOARES: SHELTERING EFFECT OF ISLANDS
9 of 17
C09020
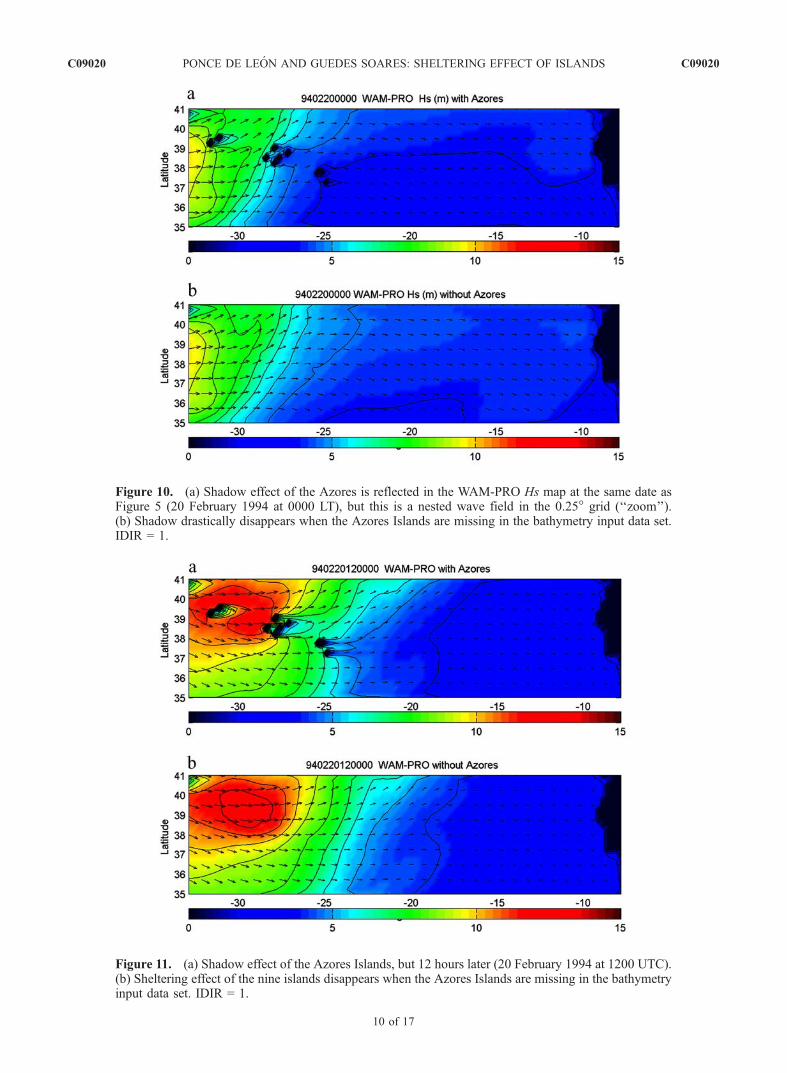
Figure 10. (a) Shadow effect of the Azores is reflected in the WAM-PRO Hs map at the same date asFigure 5 (20 February 1994 at 0000 LT), but this is a nested wave field in the 0.25� grid (‘‘zoom’’).(b) Shadow drastically disappears when the Azores Islands are missing in the bathymetry input data set.IDIR = 1.
Figure 11. (a) Shadow effect of the Azores Islands, but 12 hours later (20 February 1994 at 1200 UTC).(b) Sheltering effect of the nine islands disappears when the Azores Islands are missing in the bathymetryinput data set. IDIR = 1.
C09020 PONCE DE LEON AND GUEDES SOARES: SHELTERING EFFECT OF ISLANDS
10 of 17
C09020
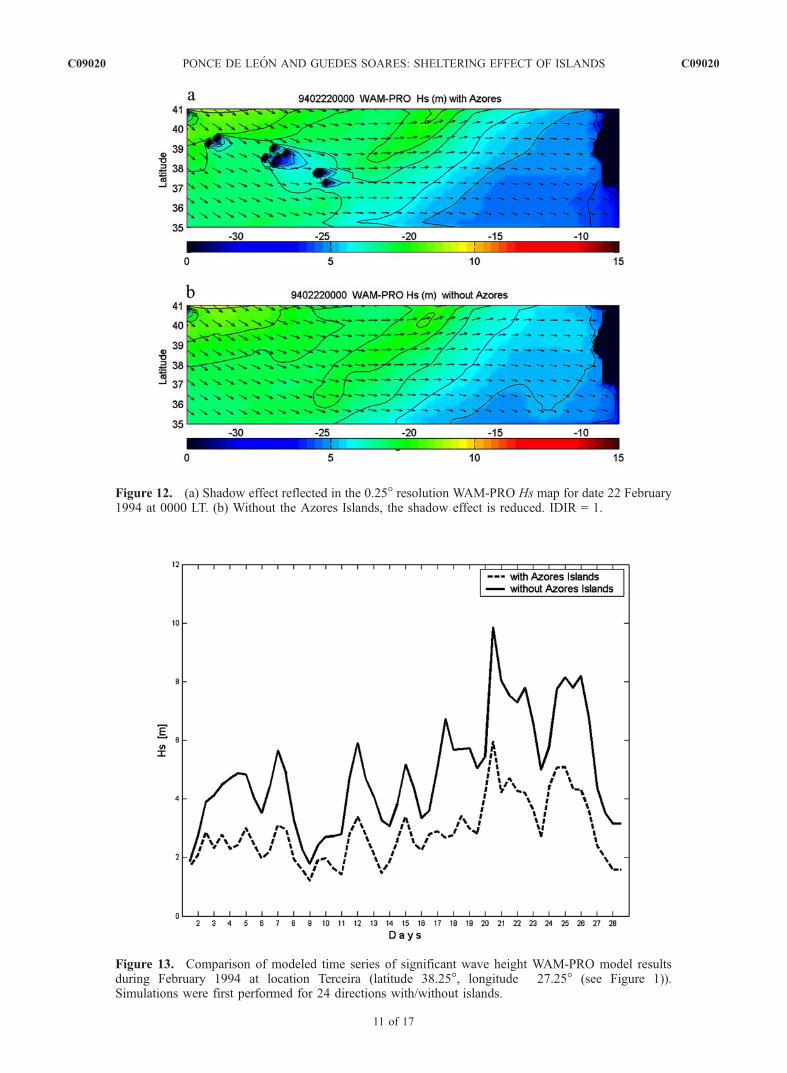
Figure 12. (a) Shadow effect reflected in the 0.25� resolution WAM-PRO Hs map for date 22 February1994 at 0000 LT. (b) Without the Azores Islands, the shadow effect is reduced. IDIR = 1.
Figure 13. Comparison of modeled time series of significant wave height WAM-PRO model resultsduring February 1994 at location Terceira (latitude 38.25�, longitude �27.25� (see Figure 1)).Simulations were first performed for 24 directions with/without islands.
C09020 PONCE DE LEON AND GUEDES SOARES: SHELTERING EFFECT OF ISLANDS
11 of 17
C09020
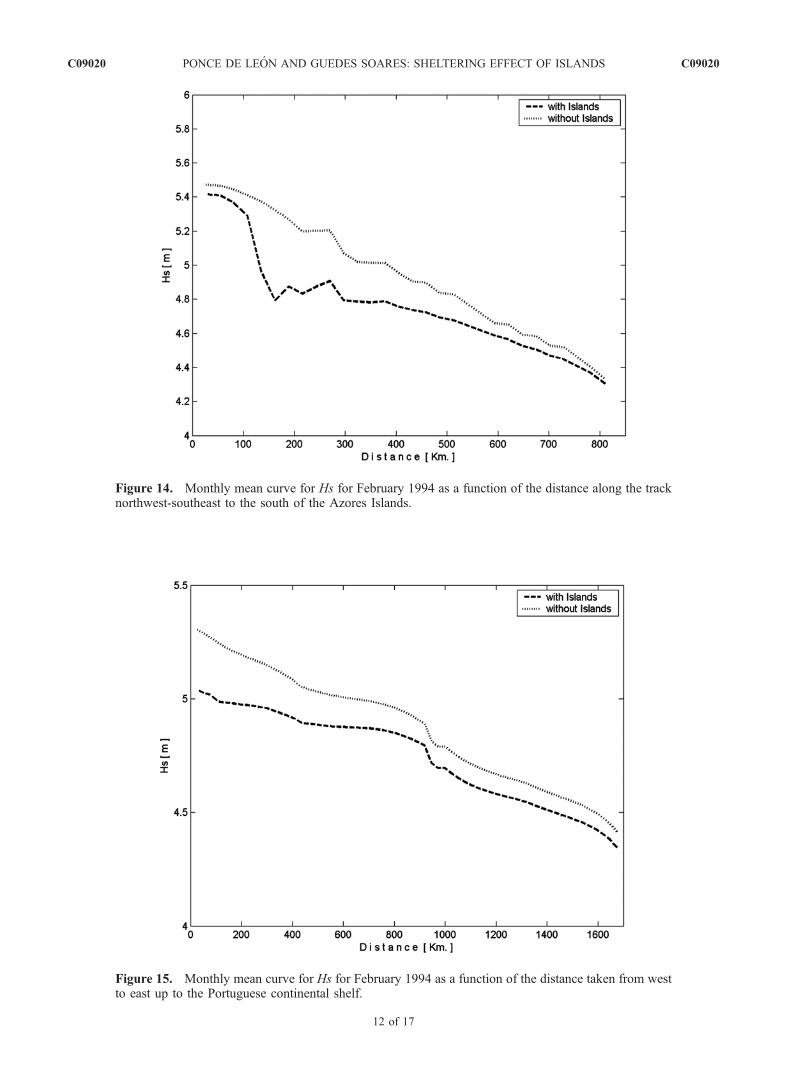
Figure 14. Monthly mean curve for Hs for February 1994 as a function of the distance along the tracknorthwest-southeast to the south of the Azores Islands.
Figure 15. Monthly mean curve for Hs for February 1994 as a function of the distance taken from westto east up to the Portuguese continental shelf.
C09020 PONCE DE LEON AND GUEDES SOARES: SHELTERING EFFECT OF ISLANDS
12 of 17
C09020
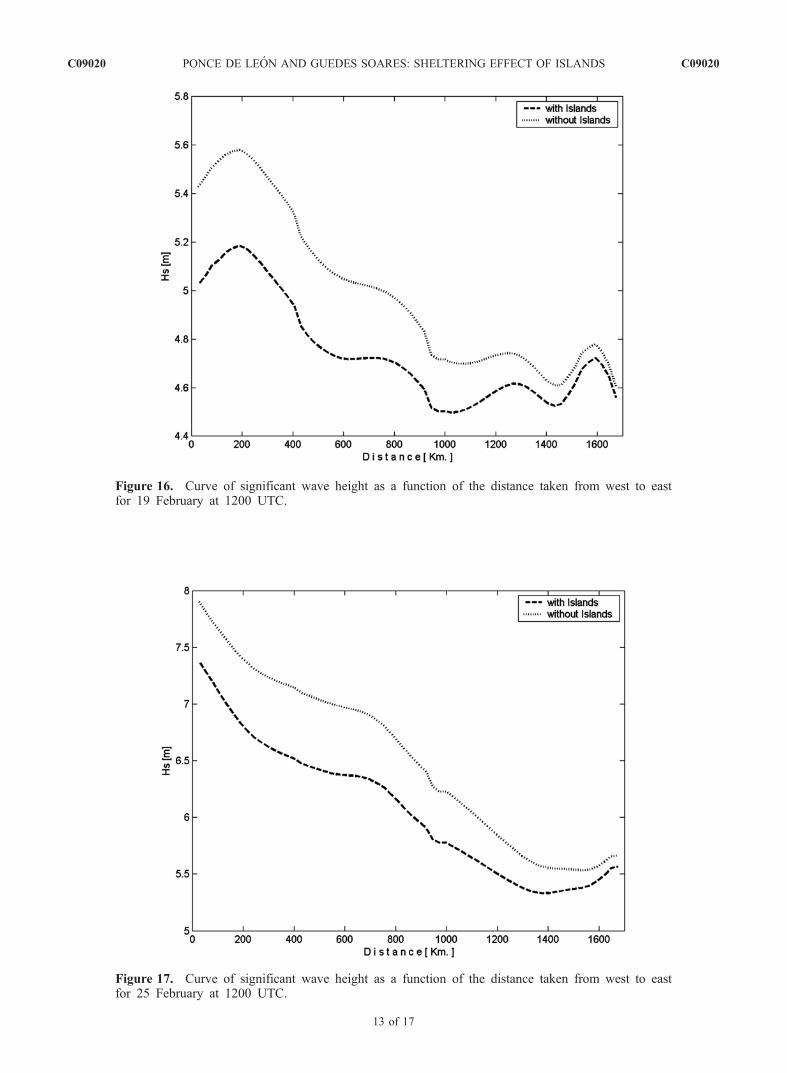
Figure 16. Curve of significant wave height as a function of the distance taken from west to eastfor 19 February at 1200 UTC.
Figure 17. Curve of significant wave height as a function of the distance taken from west to eastfor 25 February at 1200 UTC.
C09020 PONCE DE LEON AND GUEDES SOARES: SHELTERING EFFECT OF ISLANDS
13 of 17
C09020
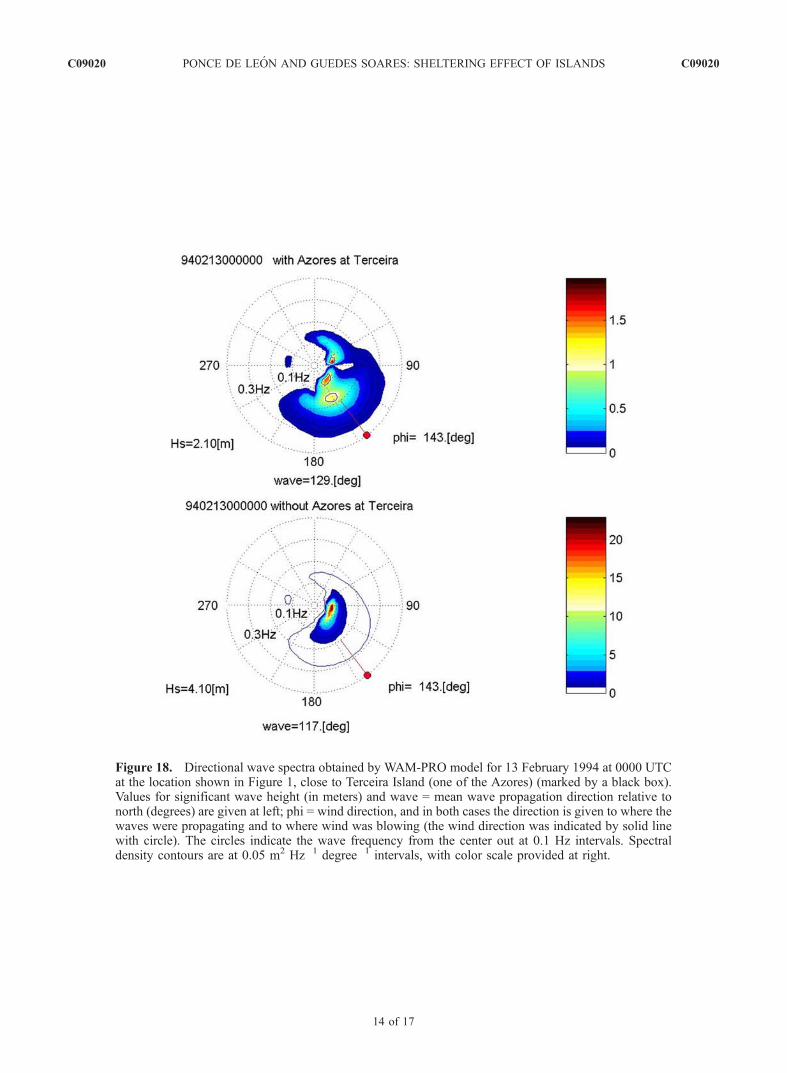
Figure 18. Directional wave spectra obtained by WAM-PRO model for 13 February 1994 at 0000 UTCat the location shown in Figure 1, close to Terceira Island (one of the Azores) (marked by a black box).Values for significant wave height (in meters) and wave = mean wave propagation direction relative tonorth (degrees) are given at left; phi = wind direction, and in both cases the direction is given to where thewaves were propagating and to where wind was blowing (the wind direction was indicated by solid linewith circle). The circles indicate the wave frequency from the center out at 0.1 Hz intervals. Spectraldensity contours are at 0.05 m2 Hz�1 degree�1 intervals, with color scale provided at right.
C09020 PONCE DE LEON AND GUEDES SOARES: SHELTERING EFFECT OF ISLANDS
14 of 17
C09020
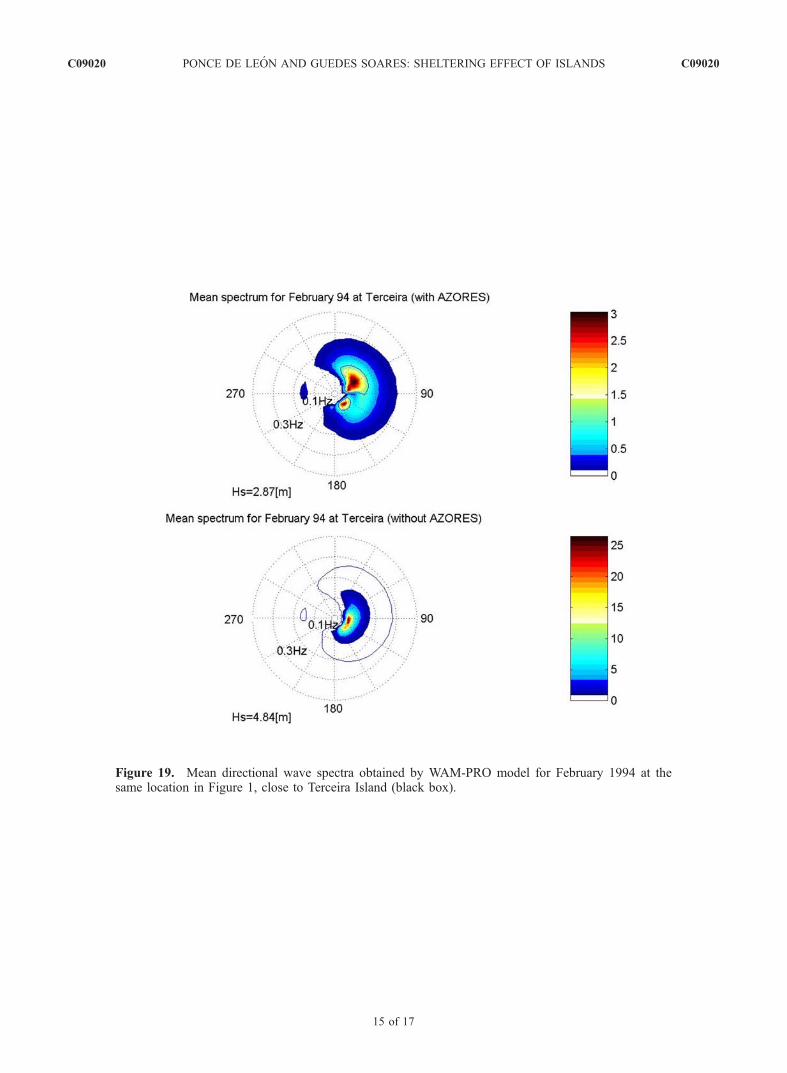
Figure 19. Mean directional wave spectra obtained by WAM-PRO model for February 1994 at thesame location in Figure 1, close to Terceira Island (black box).
C09020 PONCE DE LEON AND GUEDES SOARES: SHELTERING EFFECT OF ISLANDS
15 of 17
C09020
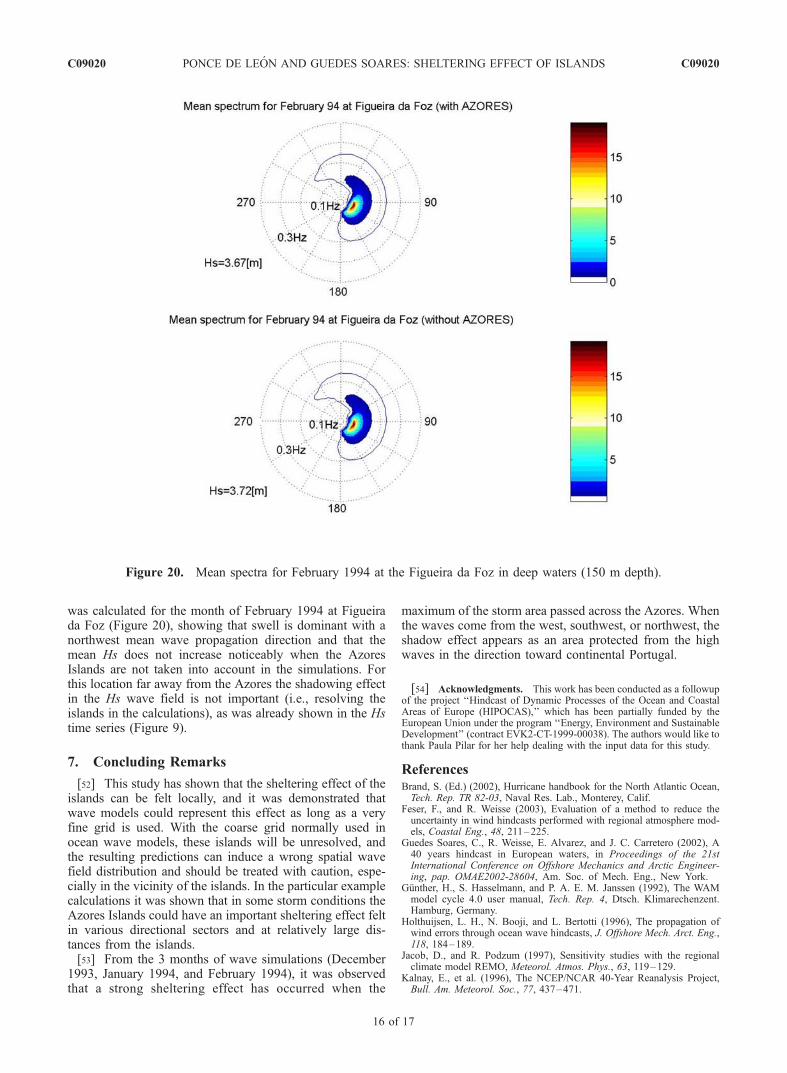
was calculated for the month of February 1994 at Figueirada Foz (Figure 20), showing that swell is dominant with anorthwest mean wave propagation direction and that themean Hs does not increase noticeably when the AzoresIslands are not taken into account in the simulations. Forthis location far away from the Azores the shadowing effectin the Hs wave field is not important (i.e., resolving theislands in the calculations), as was already shown in the Hstime series (Figure 9).
7. Concluding Remarks
[52] This study has shown that the sheltering effect of theislands can be felt locally, and it was demonstrated thatwave models could represent this effect as long as a veryfine grid is used. With the coarse grid normally used inocean wave models, these islands will be unresolved, andthe resulting predictions can induce a wrong spatial wavefield distribution and should be treated with caution, espe-cially in the vicinity of the islands. In the particular examplecalculations it was shown that in some storm conditions theAzores Islands could have an important sheltering effect feltin various directional sectors and at relatively large dis-tances from the islands.[53] From the 3 months of wave simulations (December
1993, January 1994, and February 1994), it was observedthat a strong sheltering effect has occurred when the
maximum of the storm area passed across the Azores. Whenthe waves come from the west, southwest, or northwest, theshadow effect appears as an area protected from the highwaves in the direction toward continental Portugal.
[54] Acknowledgments. This work has been conducted as a followupof the project ‘‘Hindcast of Dynamic Processes of the Ocean and CoastalAreas of Europe (HIPOCAS),’’ which has been partially funded by theEuropean Union under the program ‘‘Energy, Environment and SustainableDevelopment’’ (contract EVK2-CT-1999-00038). The authors would like tothank Paula Pilar for her help dealing with the input data for this study.
ReferencesBrand, S. (Ed.) (2002), Hurricane handbook for the North Atlantic Ocean,Tech. Rep. TR 82-03, Naval Res. Lab., Monterey, Calif.
Feser, F., and R. Weisse (2003), Evaluation of a method to reduce theuncertainty in wind hindcasts performed with regional atmosphere mod-els, Coastal Eng., 48, 211–225.
Guedes Soares, C., R. Weisse, E. Alvarez, and J. C. Carretero (2002), A40 years hindcast in European waters, in Proceedings of the 21stInternational Conference on Offshore Mechanics and Arctic Engineer-ing, pap. OMAE2002-28604, Am. Soc. of Mech. Eng., New York.
Gunther, H., S. Hasselmann, and P. A. E. M. Janssen (1992), The WAMmodel cycle 4.0 user manual, Tech. Rep. 4, Dtsch. Klimarechenzent.Hamburg, Germany.
Holthuijsen, L. H., N. Booji, and L. Bertotti (1996), The propagation ofwind errors through ocean wave hindcasts, J. Offshore Mech. Arct. Eng.,118, 184–189.
Jacob, D., and R. Podzum (1997), Sensitivity studies with the regionalclimate model REMO, Meteorol. Atmos. Phys., 63, 119–129.
Kalnay, E., et al. (1996), The NCEP/NCAR 40-Year Reanalysis Project,Bull. Am. Meteorol. Soc., 77, 437–471.
Figure 20. Mean spectra for February 1994 at the Figueira da Foz in deep waters (150 m depth).
C09020 PONCE DE LEON AND GUEDES SOARES: SHELTERING EFFECT OF ISLANDS
16 of 17
C09020
Komen, G. J., L. Cavaleri, M. Donelan, K. Hasselmann, S. Hasselmann,and P. A. E. M. Janssen (1994), Dynamics and Modeling of OceanWaves, Cambridge Univ. Press, New York.
Luo, W., and M. Sclavo (1997), Improvement of the third generation WAMmodel (cycle 4) for applications in the nearshore regions, Int. Doc. 116,Proudman Oceanogr. Lab., Liverpool, U. K.
Monbaliu, J., R. Padilla-Hernandez, J. C. Hargreaves, J. C. Carretero-Albiach, W. Luo, M. Sclavo, and H. Gunther (2000), The spectralwave model WAM adapted for applications with high spatial resolu-tion, Coastal Eng., 41, 41–62.
Oliveira-Pires, H., F. Carvalho, and M. T. Pontes (1997), Modelling theeffects of shelter in the modification of waves from the open sea to near-shore, J. Offshore Mech. Arct. Eng., 119, 70–72.
O’Reilly, W. C., R. T. Guza, and R. J. Seymour (1999), Wave prediction inthe Santa Barbara channel, in Proceedings of the 5th California IslandsSymposium, pp. 76–80, Min. Manage. Serv., Santa Barbara, Calif.
Osuna, C. J. P. (2002), On the high-resolution simulation of the dynamicinteraction between current and waves in coastal waters: An applicationto the southern North Sea, Ph.D. thesis, Katholieke Univ. eit Leuven,Belgium.
Paillard, M., M. Prevosto, S. Barstow, and C. Guedes Soares (2000), Fieldmeasurements of coastal waves and currents in Portugal and Greece,Coastal Eng., 40, 285–296.
Pawka, S. S. (1983), Islands shadows in wave directional spectra, J. Geo-phys. Res., 88, 2579–2591.
Pawka, S. S., D. L. Juman, and R. T. Guza (1984), Island sheltering ofsurface gravity waves: Model and experiment, Cont. Shelf Res., 3, 35–53.
Ponce de Leon, S., and F. J. Ocampo-Torres (1998), Sensitivity of a wavemodel to wind variability, J. Geophys. Res., 103, 3179–3201.
Ponce de Leon, S., P. Pilar, and C. Guedes Soares (2004a), Wave hindcastof the entrance of Lisbon Harbour (in Portuguese), in Proceedings of
‘‘Congresso de Metodos Computacionais em Engenharia’’, pap. 383,Lab. Nac. de Engenharia Civil, Lisbon.
Ponce de Leon, S., P. Pilar, and Guedes C. Soares (2004b), On the accuracyof wave models in the coastal zone, in Coastal Engineering 2004, editedby J. M. Smith, pp. 920–933, World Sci., Hackensack, N. J.
Ris, R. C., L. H. Holthuijsen, and N. Booij (1999), A third-generation wavemodel for coastal regions: 2. Verification, J. Geophys. Res., 104, 7667–7681.
Schneggenburger, C., H. Gunther, and W. Rosenthal (2000), Spectral wavemodelling with non-linear dissipation: Validation and applications in acoastal tidal environment, Coastal Eng., 41, 201.
Teixeira, J. C., M. P. Abreu, and C. Guedes Soares (1995), Uncertainty ofocean wave hindcasts due to wind modeling, J. Offshore Mech. Arct.Eng., 117, 294–297.
Tolman, H. L. (1991), A third generation model for wind waves on slowlyvarying unsteady and inhomogeneous depths and current, J. Phys.Oceanogr., 21, 782–797.
Tolman, H. L. (2003), Treatment of the unresolved islands and ice in windwave models, Ocean Modell., 5, 219–231.
WAMDI Group (1988), The WAM model—A third generation ocean waveprediction model, J. Phys. Oceanogr., 18, 1775–1810.
Zambresky, L. F. (1989), A validation study of the global WAM model:December 1987–November 1988, Tech. Rep. 63, Eur. Cent. for Medium-Range Weather Forecasts, Reading, U. K.
�����������������������C. Guedes Soares and S. Ponce de Leon, Unit of Marine Technology and
Engineering, Technical University of Lisbon, Instituto Superior Tecnico,Av. Rovisco Pais, P-1049-001 LISBOA, Portugal. ([email protected])
C09020 PONCE DE LEON AND GUEDES SOARES: SHELTERING EFFECT OF ISLANDS
17 of 17
C09020


