Embed Size (px)
Citation preview

On Visualizing Heterogeneous Semantic
Networks from Multiple Data Sources
Maureen1, Aixin Sun1, Ee-Peng Lim2, Anwitaman Datta1, and Kuiyu Chang1
1 School of Computer Engineering, Nanyang Technological University, Singapore{maureen, axsun, anwitaman, askychang}@ntu.edu.sg
2 School of Information Systems, Singapore Management University, [email protected]
Abstract. In this paper, we focus on the visualization of heterogeneoussemantic networks obtained from multiple data sources. A semantic net-work comprising a set of entities and relationships is often used for rep-resenting knowledge derived from textual data or database records. Al-though the semantic networks created for the same domain at differentdata sources may cover a similar set of entities, these networks could alsobe very different because of naming conventions, coverage, view points,and other reasons. Since digital libraries often contain data from mul-tiple sources, we propose a visualization tool to integrate and analyzethe differences among multiple social networks. Through a case studyon two terrorism-related semantic networks derived from Wikipedia andTerrorism Knowledge Base (TKB) respectively, the effectiveness of ourproposed visualization tool is demonstrated.
1 Introduction
1.1 Motivation
A semantic network refers to a set of concepts or entities, possibly of differ-ent types, connected by relationships. In the digital library context, semanticnetworks have always been a useful paradigm for representing knowledge foundin text and database records which in turn helps users to more effectively andquickly search and navigate information. Some often cited examples of seman-tic networks in digital libraries include author co-citation networks [2], keywordco-occurrence networks [10], etc. In this paper, we focus on social networks askinds of semantic networks found in text collections and databases. For largesocial networks, visualization tools will be required to assist users in viewing,searching and analyzing entities and relationships in the networks as well aslocating the documents or database records containing the sub-networks usersare interested in. In this paper, we therefore describe our proposed interactivetool that supports social network visualization and data access based on networknavigation.
As digital libraries often include data taken from different sources, the socialnetworks obtained from one source may look very different from other sources

2 Maureen et. al.
even when they share some common entities and relationships. This heterogene-ity is often caused by different naming conventions, attribute format, coverage,and view points adopted at different sources. For example, the (first name, lastname) person name format may be used in source A, while source B uses the(last name, first name) name format. Person entities from A may have a phoneattribute but person entities from B may not have it. As the social networkscan be contributed by different sets of users, they may not cover the same setof entities and relationships. Furthermore, the users who are responsible for cre-ating content at different sources may assign different type labels or attributevalues to the same entity or relationship due to varying view points. Given theseheterogeneity issues, a visualization tool is necessary to integrate multiple socialnetworks together via entity (and relationship) resolution as well as attributemerging and to keep the unresolved and resolved entities distinctive in the userinterface.
With the recent advances in social computing and the wide availability ofsocial software (e.g., wikis and blogs), it is increasingly easy to find semanticnetworks or even social networks of specific domains defined over Web content orpublicly accessible databases. For example, Wikipedia, the largest encyclopediaon the Web collaboratively created by millions of users, provides rich articlecontent about interlinked entities, thereby providing additional semantics abouttheir relationships (e.g., topic category labels of articles).
1.2 Objective and Contribution
The main objective of this research is to develop an interactive tool for visu-alizing semantic networks from multiple data sources. Other than viewing andnavigating network entities and relationships, the visualization tool will assistusers in exploring the underlying data (documents or database records) fromwhich the networks are obtained, and comparing the entities, relationships, andnetwork connectivities between semantic networks.
Figure 1 depicts the system architecture of the visualization tool. It consistsof a network extractor that extracts semantic networks from data sources. Theextracted network information is stored in the network database. The net-
work integrator is responsible for taking two or more heterogeneous semanticnetworks and integrating their entities and relationships. These integrated se-mantic networks are then stored in the network database. The network viewer
provides an interactive interface for users to retrieve semantic networks, navigate,and access semantic networks and their underlying text or database records.
In this paper, we describe our visualization tool built based on the abovesystem architecture and summarize the research contributions as follows:
– We have defined a database schema for modeling semantic networks and theentity matchings among different semantic networks. This database schemais designed to be generic enough to handle as many different types of semanticnetworks as possible.

On Visualizing Heterogeneous Semantic Networks 3
Fig. 1. System Architecture for Visualization Tool
– We have developed a working prototype visualization tool using TouchGraphAPI [14], a graphical user interface programming package for graph visual-ization. We use color and shape to distinguish the different data sources andentity types.
– We have applied our tool to a case study involving two terrorism related so-cial networks from (a) Wikipedia and (b) Terrorism Knowledge Base (TKB).TKB was provided on the Web and maintained by the Memorial Institutefor the Prevention of Terrorism (MIPT). In this case study, the social net-work derived from Wikipedia represents the common web user knowledgein the terrorism domain, in which users acquire information from news arti-cles and other online sources (some of them are mentioned as references inWikipedia articles). TKB on the other hand is an expert maintained knowl-edge base containing information about terrorist groups and members. Thiscase study leads to some interesting observations of the integrated social net-works, which help users identify discrepancies between TKB and Wikipediasocial networks.
1.3 Paper Outline
The remainder of the paper is organized as follows. Section 2 reviews the relatedwork. Section 3 discusses the modeling and integrating of semantic networks.The visualization interface is given in Section 4 followed by a case study inSection 5. Finally, Section 6 concludes this paper.
2 Related Work
There have been several work on the visualization of different kinds of networkgraphs. For example, Vizster provides visualization functions for exploration,

4 Maureen et. al.
search, and analysis of online social networks [5]. A survey of visualization tech-niques for ontology networks is reported in [8]. Gene network visualization isaddressed in [3]. All of the aforementioned network visualization tools cannothandle multiple networks as they are confined to display only a single network.In our research, we propose the idea of visualizing multiple semantic networksby integrating them together. The integrated network allows us to better un-derstand the global network connectivities and compare any variations acrossdifferent networks.
With reference to the survey by Katifori et al in [8], our visualization tooladopts both context plus focus and distortion techniques. Our semantic networkgraphs when displayed in the network viewer require a combination of contextand focus. That is, each graph has a node serving the focus (central node)surrounded by other nodes with edges connected to it. Some of the other visu-alization tools that use this technique include TGVizTab [1], MoireGraphs [7],OntoRama [4], OntoViz [11], and OZONE [13] .
A closely related work to our visualization tool is Protege [12], a frameworkfor ontology creation, editing, and visualization. Under the Protege framework,several visualization tools have been developed including the above-mentionedtool such as TGVizTab and OntoViz. Our tool is similar in the graph visualiza-tion aspect but differs in usage and data storage aspects. In particular, we aimto use our visualization tool for multi-modal social networks which are stored ina relational database.
3 Modeling and Integration of Semantic Networks
3.1 Semantic Network Representation
A semantic network comprises typed entities and relationships. Our networkdata model supports a configurable set of entity types and relationship types.Each entity type defines a set of attributes shared by all entities belonging tothe type; each entity type may have one or more relationship type with otherentity types. For example, in our case study, the semantic network created inthe terrorism domain involves two entity types: Terrorist Group and Terrorist.Terrorist Group entity type has attributes: name, location, and date. Terrorist
Group may be related to itself by an Associated With relationship type, and toTerrorist entity type by a Has Leader relationship type. At the instance level, theTerrorist Group entity Al-Qaeda has an Associated With relationship with YemenIslamic Jihad (an entity of Terrorist Group) and a Has Leader relationship withOsama bin Laden, a Terrorist entity. In our visualization, like many others, eachentity is depicted as a node, and each relationship is depicted as a directed edgeconnecting the related pair of nodes.
To store the semantic networks from different data sources in our networkdatabase, we define meta-data to describe the data sources and their mappings.Each data source is an instance of the Source entity type, identified by its Sour-ceID. Each data source is also given a SourceName and it consists of one or more

On Visualizing Heterogeneous Semantic Networks 5
EntityType instances. EntityType instances can be related to other EntityTypeinstances through some relationships. Other than EntityTypeID and EntityType-Name, each EntityType instance may have attributes defined through Attributeinstances. Specifically, each Attribute instance is given a AttributeName, Or-der, and IsMultivalued flag. The Order value indicates the relative position atwhich the attribute will be subsequently displayed by the network viewer. TheIsMultivalued flag is a boolean value indicating whether the attribute allows setvalues. An Attribute instance is also assigned a Domain instance, which definesthe DataType, MinValue and MaxValue of the the attribute value. Our defaultDomain instances include integer, character strings, date, and float numbers,which are supported by most existing database systems. A user defined Domaininstance will have its enumerable domain values given by the multi-valued at-tribute UserDefined. As in many database systems, by separating domain infor-mation from the attribute definition, the same Domain instance can be sharedamong different Attribute instances. The EquivalentTo relationship is used tostore matching entities discussed in the following subsections.
3.2 Semantic Network Integration
To integrate different heterogeneous semantic networks, the mapping of entitiesand relationships between networks need to be addressed. There are two kindsof entity matching, namely inter-source and intra-source entity matchings. Theformer refers to finding matching entities from different data sources, while thelatter detects matching entities from the same data source.
Inter-Source Entity Matching In this kind of entity matching, we aim tofind common real-world entity with different names from different data sources,i.e., synonyms. When the difference between two synonyms is minor, they canbe detected by a simple name similarity test. An example of this is a terroristgroup known as Harakat-ul-jihad-i-islami and Harakat-ul-jihad-ul-islami definedin TKB and Wikipedia, respectively. We measure the similarity between themusing edit distance, i.e., the minimum number of operations (character insertion,deletion, or substitution) required to transform one name into another. Whenthe edit distance between two entity names is smaller than a specified threshold(30% of the shortest name length in our case study), we flag entities as can-didate synonyms for subsequent human verification. Fuzzy search provided byLucene is utilized in our implementation to automate the above matching pro-cess. However, for synonyms that are very different, name similarity tests faildue to their low similarity score. For example, a terrorist group known as BlackWidow in TKB is known as Shahdika in Wikipedia. One can only tell they aresynonyms by reading the content of the Wikipedia article and the correspondingTKB database record, as well as referring to external knowledge. For such kindof synonyms, manual matching is adopted in our current implementation.
Intra-Source Entity Matching Each real world entity is supposed to berepresented by a unique entry in a data source. However, this assumption does
6 Maureen et. al.
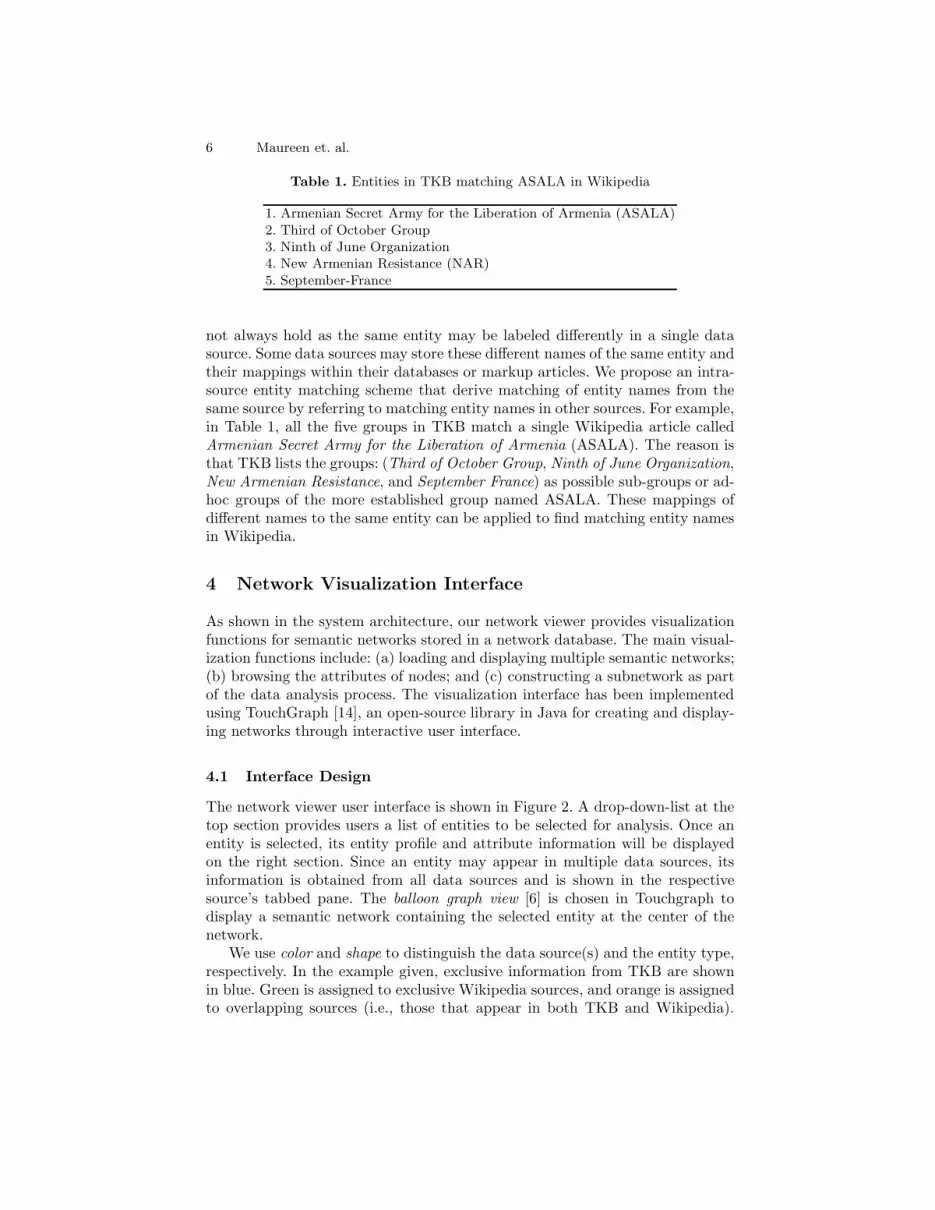
Table 1. Entities in TKB matching ASALA in Wikipedia
1. Armenian Secret Army for the Liberation of Armenia (ASALA)2. Third of October Group3. Ninth of June Organization4. New Armenian Resistance (NAR)5. September-France
not always hold as the same entity may be labeled differently in a single datasource. Some data sources may store these different names of the same entity andtheir mappings within their databases or markup articles. We propose an intra-source entity matching scheme that derive matching of entity names from thesame source by referring to matching entity names in other sources. For example,in Table 1, all the five groups in TKB match a single Wikipedia article calledArmenian Secret Army for the Liberation of Armenia (ASALA). The reason isthat TKB lists the groups: (Third of October Group, Ninth of June Organization,New Armenian Resistance, and September France) as possible sub-groups or ad-hoc groups of the more established group named ASALA. These mappings ofdifferent names to the same entity can be applied to find matching entity namesin Wikipedia.
4 Network Visualization Interface
As shown in the system architecture, our network viewer provides visualizationfunctions for semantic networks stored in a network database. The main visual-ization functions include: (a) loading and displaying multiple semantic networks;(b) browsing the attributes of nodes; and (c) constructing a subnetwork as partof the data analysis process. The visualization interface has been implementedusing TouchGraph [14], an open-source library in Java for creating and display-ing networks through interactive user interface.
4.1 Interface Design
The network viewer user interface is shown in Figure 2. A drop-down-list at thetop section provides users a list of entities to be selected for analysis. Once anentity is selected, its entity profile and attribute information will be displayedon the right section. Since an entity may appear in multiple data sources, itsinformation is obtained from all data sources and is shown in the respectivesource’s tabbed pane. The balloon graph view [6] is chosen in Touchgraph todisplay a semantic network containing the selected entity at the center of thenetwork.
We use color and shape to distinguish the data source(s) and the entity type,respectively. In the example given, exclusive information from TKB are shownin blue. Green is assigned to exclusive Wikipedia sources, and orange is assignedto overlapping sources (i.e., those that appear in both TKB and Wikipedia).

On Visualizing Heterogeneous Semantic Networks 7
Fig. 2. Look and feel of our visualization tool
Note that the color scheme can be configured by users. Moreover, all Terrorist
entities are represented by ellipses and Terrorist Group entities are depicted asrectangles. For instance, as shown in Figure 2, an entity named Andreas Baaderbelongs to the Terrorist entity type from TKB. The corresponding node is a blueellipse. Another entity named Red Army Faction belongs to Terrorist Group andcan be found in both TKB and Wikipedia. The corresponding node is an orangerectangle. Tools including zooming, rotating, etc are provided at the bottom ofthe interface.
4.2 Database Configuration
Other than visualizing semantic networks, our visualization tool also supportsconfiguration of the data sources, entity types and their attributes to minimizeuser effort in maintaining the databases. The wizard dialog allows user to (a) addnew data source to the network database, and (b) create new entity types. Screencaptures are not shown due to page limits. All of the above operations affect thenetwork database content. As soon as a user completes configuration using thiswizard, the necessary tables in the network database will be automatically builtand/or updated. Users may then import, view, insert, edit, remove, and export

8 Maureen et. al.
Fig. 3. Network of Tanzim based on information from TKB and Wikipedia
network data in the network database. To allow semantic network data to beportable across applications, we adopted eXtensible Markup Language (XML)for data import and export operations [9]. These functions are provided mainlyfor those users who are less familiar with database systems.
5 Case Study
In this section, we demonstrate the usefulness of our visualization graph for so-cial network analysis through a case study. Following our earlier discussion, ourcase study involves two semantic networks both consisting of terrorism relatedentities and relationships from TKB and Wikipedia respectively. The semanticnetwork derived from Wikipedia represents the common web user knowledge inthe terrorism domain while the one from TKB represents the expert understand-ing of the domain. Here, we would like to find out how the knowledge of expertsdiffer from that of the public.
For Terrorist Group, 858 entities and 1179 relationships were extracted fromTKB; 998 entities and 2302 relationships from Wikipedia. Among them 305 en-tities and 259 relationships appear in both sources. For Terrorist entity type,1463 entities have been extracted from TKB together with 1374 relationshipsbetween Terrorist and Terrorist Group. For Wikipedia, since there is no particu-lar category label for extracting terrorists, extracting terrorists from Wikipediaremains challenging. In this case study, we hence mainly focus on the differ-ences among terrorist groups. As shown in Figure 3, the selected terrorist groupTanzim is shown at the center of the network. Those nodes that only appear inone data source are clearly indicated by their colors. Recall that all informationderived from TKB are shown in blue and that from Wikipedia in green; and

On Visualizing Heterogeneous Semantic Networks 9
orange is used for information derived from both sources. It is therefore inter-esting to observe differences in relationships among entities that appear in bothdata sources. For example, according to TKB, Tanzim is related to Badr Orga-nization, Al-Aqsa Martyr’s Brigades, Fatah, and Popular Resistance Committee.On the other hand, according to Wikipedia Tanzim is related to all these groupsexcept Badr Organization. Furthermore, there are no relationships between BadrOrganization and Al-Aqsa Martyr’s Brigades in Wikipedia whereas in TKB sucha relationship exists. Also, we have observed that according to Wikipedia, thereis a relationship between Popular Resistance Committee and Al-Aqsa Martyr’sBrigades whereas it is not mentioned in TKB. This specific example illustratesthat in the homeland security domain, the knowledge of the public can be quitedifferent from that of domain experts. Understanding how this can happen isanother interesting topic that can be further investigated.
6 Conclusion
In this paper, we proposed a tool for visualizing heterogeneous semantic net-works obtained from multiple data sources. The modeling of metadata for theentities and relationships contained in semantic networks and their mappings aredescribed. In order to have an easy way of analyzing the integrated network andcomparing their differences as well, we have delivered a visualization interfaceusing TouchGraph API. A case study on two semantic networks obtained fromTKB and Wikipedia is reported to illustrate the differences in the understandingof terrorism related information from the public and the expert domains.
The future work for this visualization tool is to embed the system with func-tionality to query the graph using faceted search technique [15]. Faceted search isbasically a method for refining search results by categories. For example, givena library of terrorism from our database, faceted search will enable a user topare down the search results using attributes such as location of incident, dateof event, terrorist’s nationality and so on. Thus, this method will allow the userto browse and navigate the information to find what he/she really wants.
We will also continue working on ways to minimize manual effort for entitymatching. Some of the possible enhancements like the ability to zoom in/outof complex networks with a fish-eye view, retrace steps during browsing usingback/forward buttons, load/save the current network view for selected node, areamong the list of candidate features to be incorporated into our visualizationtool.
7 Acknowledgement
This work was supported by A*STAR Public Sector R&D, Singapore, ProjectNumber 062 101 0031.
10 Maureen et. al.
References
1. H. Alani. Tgviztab: An ontology visualization extension for protege. In Proc.of Knowledge Capture (K-Cap’03), Workshop on Visualization Information inKnowledge Engineering, Sanibel Island, Florida, 2003.
2. C. Chen. Visualizing semantic spaces and author co-citation networks in digitallibraries. Information Processing and Management, pages 401–420, 1999.
3. P. Ciccarese, S. Mazzocchi, F. Ferrazzia, and L. Sacchia. Genius: a new tool for genenetworks visualization. In Intelligent Data Analysis in Medicine and Pharmacology(IDAMAP) Proceedings, pages 107–111, 2004.
4. P. W. Eklund, N. Roberts, and S. Green. Ontorama: Browsing an rdf ontologyusing a hyperbolic-like browser. In Proc. of the First International Symposium onCyberWorlds (CW2002) Theory and Practices, pages 405–411, Seattle, Washing-ton, 2002.
5. J. Heer and D. Boyd. Vizster: Visualizing online social networks. In Proc. IEEESymposium on Information Visualization, Minneapolis, MN, USA, 2005.
6. I. Herman, G. Melancon, and M. S. Marshall. Graph visualization and navigationin information visualization: A survey. IEEE Transactions on Visualization andComputer Graphics, 6(1):24–43, 2000.
7. K. T. J. Jankun and L. M. Kwan. Moiregraphs: Radial focus plus context visual-ization and interaction for graphs with visual nodes. In Proc. of IEEE Symposiumon Information Visualization, pages 20–21, Seattle, Washington, 2003.
8. A. Katifori, C. Halatsis, G. Lepouras, C. Vassilakis, and E. Giannopoulou. Ontol-ogy visualization methods—a survey. ACM Comput. Surv., 39(4):10, 2007.
9. A. C. Lear. Xml seen as integral to application integration. IT Professional,1(5):12–16, 1999.
10. Y. Matsuo and M. Ishizuka. Keyword extraction from a single document usingword co-occurrence statistical information. International Journal on Artificial In-telligence Tools, 13(1):157–169, 2004.
11. OntoViz. http://protegewiki.stanford.edu/index.php/OntoViz.12. M. Storey, R. Lintern, and N. Ernst. Visualization and protege. 7th International
Protege Conference, 2004.13. B. Suh and B. B. Bederson. Ozone: A zoomable interface for navigating ontology
information. In Proc. of Advanced Visual Interfaces. ACM, 2002.14. Touchgraph. http://www.touchgraph.com/.15. K.-P. Yee, K. Swearingen, K. Li, and M. Hearst. Faceted metadata for image search
and browsing. In CHI ’03: Proceedings of the SIGCHI conference on Human factorsin computing systems, pages 401–408, New York, NY, USA, 2003. ACM.


