Embed Size (px)
Citation preview

Supporting Information
� Wiley-VCH 2013
69451 Weinheim, Germany
Doping of Organic Semiconductors: Impact of Dopant Strength andElectronic Coupling**Henry M�ndez, Georg Heimel,* Andreas Opitz, Katrein Sauer, Patrick Barkowski,Martin Oehzelt, Junshi Soeda, Toshihiro Okamoto, Jun Takeya, Jean-Baptiste Arlin, Jean-Yves Balandier, Yves Geerts, Norbert Koch, and Ingo Salzmann*
ange_201302396_sm_miscellaneous_information.pdf

CONTENTS
I. Experimental Details S2
II. Chemical Structures of the Compounds S2
III. X-ray Diffraction Reciprocal Space Maps S3
A. 1:1 Mixed Films of (1) and (2d) S3
B. 1:1 Mixed Films of (1) with (2a-d) and (3) S4
IV. Dopant Electron Affinities S5
V. Huckel-like Treatment of the Energy Levels of the Complexes S6
VI. Supporting UV-VIS Absorption Data S7
A. Optical Absorption Spectroscopy on (1) Doped with (2a-c) and (3) S7
B. Schematic Energy Level Diagrams S8
C. Optical Absorption Spectroscopy on the Ionized Dopants (2a-d) S9
VII. Single Crystal Solution of the (1)-(2a-d) Mixed Crystals S10
A. Crystal data S10
B. Structure refinement S11
References S12
S1

I. EXPERIMENTAL DETAILS
Compound (1) [1] was synthesized at the Laboratory of Polymer Chemistry (Free University of
Brussels). (3) was received from Novaled AG (Dresden, Germany), (2a-d) were purchased from
TCI Europe. Mother solutions of the host [0.5 mg/ml] and acceptor molecules [0.20-0.28 mg/ml]
were obtained using chloroform as solvent (Aldrich, HPLC type with purity > 99.9%). A series
of mixed solutions at different OSC/dopant ratios was prepared. Drop-cast and spin-coated films
(10 Hz) were prepared on SiOx substrates (Siegert prime grade, native oxide, used as received) for
structural analysis (XRD) and on QX-type quartz (Prazisions Glas & Optik GmbH, Germany)
for UV-VIS (Perkin-Elmer Lambda 900 spectrometer). The conductivity was measured between
interdigitated indium tin oxide contacts with a Keithley SourceMeter 2400, and film thickness was
measured with a Dektak II (Veeco GmbH) profilometer. All processing was done under N2 at-
mosphere (Glovebox by Braun GmbH, O2< 0.1 ppm, H2O< 0.1 ppm). XRD and grazing-incidence
XRD were carried out at the beamline W1 at DESY-HASYLAB (hν= 10.5 KeV) using a MYTHEN
1D detector. Single-crystal diffraction was carried out on (1)/(2a-d) mixed single crystals grown
from chloroform solution (for details see Sec. VII). DFT calculations (6-31G** basis set) on iso-
lated molecules and complexes employed the long-range corrected ωB97X-D exchange-correlation
functional for full geometry optimization, as it contains semi-empirical van der Waals corrections
[2], and the PBE0 hybrid functional [3] to subsequently compute molecular orbitals (isosurfaces
drawn at an isovalue of 0.01 a−30 ), their energies, and optical transitions with TDDFT.
II. CHEMICAL STRUCTURES OF THE COMPOUNDS
S
S
H21C10
C10H21
Y X
ZX
CN
CNNC
NC
CN
CNNC
NC FFF
FF F
1
2a : X,Y,Z = H2b : X,Y = H; Z = F2c : X = H; Y,Z = F2d : X,Y,Z = F3
(d) (e)
FIG. S1. Chemical structures of 1: 2,7-didecyl-[1]benzothieno[3,2-b][1]benzothiophene (C10BTBT), 2a:
tetracyanoquinodimethane (TCNQ), its derivatives with increasing fluorination 2b: FTCNQ, 2c: F2TCNQ,
2d: F4TCNQ, and 3: 2,2’-(perfluoronaphtalene 2,6-diylidene)dimalononitrile (F6TCNNQ).
S2

III. X-RAY DIFFRACTION RECIPROCAL SPACE MAPS
A. 1:1 Mixed Films of (1) and (2d)
q z / Å-1
qxy / Å-11.0 2.01.5 2.5 3.0 3.5
1.4
1.2
1.0
0.8
0.6
0.4
0.2
0.0
FIG. S2. Grazing-incidence x-ray diffraction (GIXRD) reciprocal space map of a 1:1 mixed film of (1)
and (2d) processed via drop-casting from CHCl3 solution on native SiOx under N2 atmosphere. The
map is indexed with triclinic unit-cell parameters of the single crystal solution: a= 7.0715 A, b= 8.0773 A,
c= 19.8477 A, α= 97.718 ◦, β= 94.049 ◦, and γ= 107.845 ◦. The incident angle of the primary beam
(10.5 keV) was set to αi = 0.15◦. Colors correspond to diffraction intensities in logarithmic scale, circle
areas to calculated structure factors; qxy and qz denote the in-plane and out-of-plane components of the
scattering vector.
S3

B. 1:1 Mixed Films of (1) with (2a-d) and (3)q z / Å
-1
qxy / Å-1
0.8 1.21.0 1.4 1.6 1.8 2.0 2.2
1.4
1.2
1.0
0.8
0.6
0.4
0.2
0.0
q z / Å-1
qxy / Å-1
0.8 1.21.0 1.4 1.6 1.8 2.0 2.2
1.4
1.2
1.0
0.8
0.6
0.4
0.2
0.0
q z / Å-1
qxy / Å-1
0.8 1.21.0 1.4 1.6 1.8 2.0 2.2
1.4
1.2
1.0
0.8
0.6
0.4
0.2
0.0
q z / Å-1
qxy / Å-1
0.8 1.21.0 1.4 1.6 1.8 2.0 2.2
1.4
1.2
1.0
0.8
0.6
0.4
0.2
0.0
q z / Å-1
qxy / Å-1
0.8 1.21.0 1.4 1.6 1.8 2.0 2.2
1.4
1.2
1.0
0.8
0.6
0.4
0.2
0.0
q z / Å-1
qxy / Å-1
0.8 1.21.0 1.4 1.6 1.8 2.0 2.2
1.4
1.2
1.0
0.8
0.6
0.4
0.2
0.0
pure (1) spincoated (1) + (2a) dropcast
(1) + (2c) dropcast
(1) + (3) dropcast
(1) + (2a) spincoated
(1) + (2d) spincoated
(a)
(c)
(e)
(b)
(d)
(f)
FIG. S3. GIXRD reciprocal space map of spincoated (left) and dropcast (right) films of (a) pure (1),
1:1 mixed films with (b-c) (2a), (d) (2c), (e) (2d), and (f) (3) on SiOx substrates; unit cells from single-
crystal diffraction are listed in Fig. 2c of the main text and Tab. S2. For (3), no single-crystal solution is
available and unit-cell determination from GIXRD was impossible due to the low intensity of the diffraction
features [see peaks in the left corner of (f) marked with arrows]. Colors correspond to diffraction intensities
in logarithmic scale; features of pure (1) are marked with red circles, circle areas correspond to structure
factors; qxy and qz denote the in-plane and out-of-plane components of the scattering vector.
S4

IV. DOPANT ELECTRON AFFINITIES
0 1 2 3 4 56.0
5.5
5.0
4.5
4.0
Ene
rgy
w.r.
tEva
c/e
V
number of fluorine (x)
IE of (1)
Number of fluorines
Ene
rgy
from
Eva
c
4.0
4.5
5.0
5.5
6.00 1 2 3 4 6
(a) (b)
(2a) (2b) (2c) (2d) (3)
(F3)
(1)
FIG. S4. (a) DFT-calculated energies of the lowest unoccupied molecular orbitals (open squares) and
experimental [4] (filled squares) electron affinities (EA) of the dopants (2a-d, 3) used within this work
and that of the additional dopant (F3) [that is (2a) with three fluorine substitutions] plotted against the
number of fluorines. The dashed line indicates the DFT-calculated HOMO energy of (1). (b) DFT-calculated
isosurface plots (isovalue 0.01 a−30 ) of the HOMO of (1) and the respective LUMOs of the dopants.
2a 2b F3 2c 2d 3
EAexp 4.23 4.55 n/a 4.59 5.08 n/a
EL 4.69 4.81 4.91 5.02 5.13 5.17
T1 1.66 1.57 n/a 1.50 1.34 1.29
T2 2.20 2.11 n/a 2.05 1.88 1.85
β 0.43 0.56 n/a 0.53 0.61 0.59
TABLE S1. Experimental [4] electron affinities (EAexp) and DFT-calculated LUMO energies (EL) of the
dopants from Fig. S1 (in eV) and that of (2a) with three fluorine substitutions [labelled as (F3)]. T1 and
T2 denote the energies of the optical transitions taken from Fig. 3b of the main text; β is the value of the
resonance integral extracted from: the respective EAexp values from Ref. 4, the DFT-calculated HOMO
energy of (1) as an approximation for its IE, and the experimentally determined optical gaps (T1) of the
complexes; see caption of Fig. S5 for details on a Huckel-like treatment yielding β.
S5

V. HUCKEL-LIKE TREATMENT OF THE ENERGY LEVELS OF THE COMPLEXES
5.6 5.4 5.2 5.0 4.8 4.6 4.4 4.2 4.06.5
6.0
5.5
5.0
4.5
4.0
3.5
Cal
c.en
ergy
leve
lsof
com
plex
/eV
EA of p-dopant / eV
β = 0.55 eV
EA
= IE
Complex
HOsc
EVac
T1
IEEA
vari
able
2a 2b
2c 2d
3
1
2a-d, 3
LHyb
HHyb
LAcc
HHyb
LHyb
FIG. S5. Energy levels of the complexes formed between (1) and all dopants [(2a-d) and (3)] as modelled
by a Huckel-like treatment [5] (solid curve) using the minimal basis set of the two frontier molecular orbitals
(that is HOsc, the HOMO of (1), and LAcc, the LUMO of the dopants). The eigenvalues of the Hamiltonian
satisfy the secular equation E1/2 = 1/2[(HOsc + LAcc)±√
(HOsc − LAcc)2 + 4β2], where the two solutions
E1/2 are the energies of HHyb and LHyb, respectively, and β is the resonance integral; energy values for
HOsc and LAcc as depicted in Fig. S7; β set constant to 0.55 eV. The respective optical gaps (deduced from
from transition T1 in Fig. 3b of the main text) are indicated as vertical lines. For the hypothetic case of EA
being equal to 5.65 eV [that is the IE of (1)] a finite gap remains. Note that by this treatment the exciton
binding energy is not taken into account. It is assumed constant for all complexes and is absorbed into a
lower value of β (adding, e.g., an exciton binding energy of 0.5 eV to the experimentally determined energies
of T1 would require setting β ≈ 0.86).
S6
VI. SUPPORTING UV-VIS ABSORPTION DATA
A. Optical Absorption Spectroscopy on (1) Doped with (2a-c) and (3)
T1T2
Opt
ical
den
sity
/ ar
br. u
nits
Opt
ical
den
sity
/ ar
br. u
nits
Opt
ical
den
sity
/ ar
br. u
nits
Opt
ical
den
sity
/ ar
br. u
nits
Energy / eV Energy / eV
Energy / eV Energy / eV
(1) doped with (2a) (1) doped with (2b)
(1) doped with (2c) (1) doped with (3)
pure (1)
pure (1)
pure (1)
pure (1)
pure (2a)
pure (2c)pure (3)
50%
25%
17%
10%
(a)
(c)
(b)
(d)
T1T2 pure (2b) 50%
25%
17%
10%
T1T2
50%
25%
17%
10%
50%
25%17%
T1T2
4.0 3.5 3.0 2.5 2.0 1.5 1.0
010
17
50
25
100
4.0 3.5 3.0 2.5 2.0 1.5 1.0
0
10
17
50
25
100
4.0 3.5 3.0 2.5 2.0 1.5 1.0
010
17
50
25
100
4.0 3.5 3.0 2.5 2.0 1.5 1.0
010
17
50
25
100
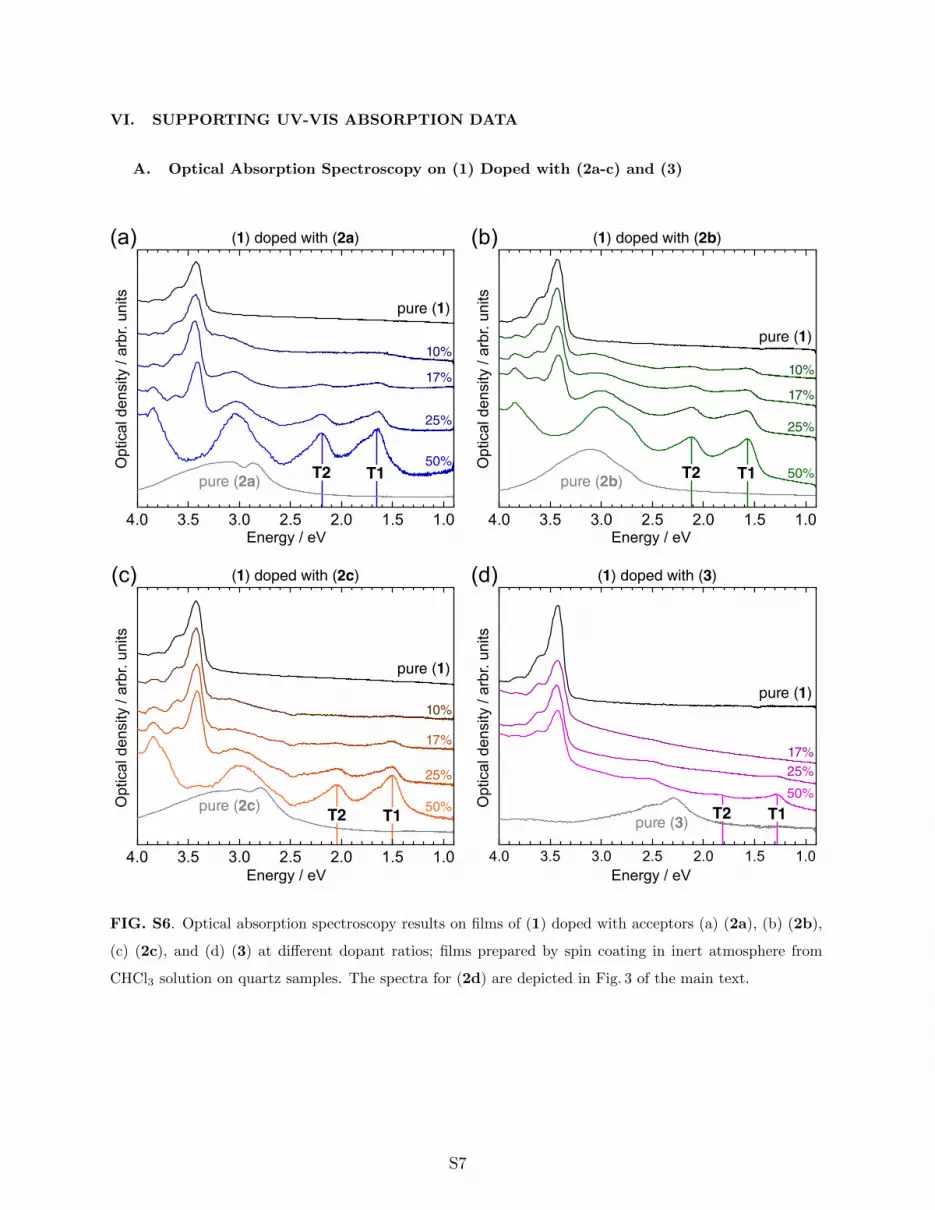
FIG. S6. Optical absorption spectroscopy results on films of (1) doped with acceptors (a) (2a), (b) (2b),
(c) (2c), and (d) (3) at different dopant ratios; films prepared by spin coating in inert atmosphere from
CHCl3 solution on quartz samples. The spectra for (2d) are depicted in Fig. 3 of the main text.
S7

B. Schematic Energy Level Diagrams
- 4.5
Ene
rgy
w.r.
t. E
Vac / e
V
- 4.0
- 5.0
- 5.5
- 6.0
- 6.5
- 3.5
N
N
F F
F F
N
N
N
N
F
F
N
N
F
F
F F
N
N
N
N
N
N
F
F
N
N
EF
HCpx
HOsc
LCpx
LAcc
HCpx-1
N
N
FN
N
1.661.57 1.50
1.34 1.292.20
2.11 2.05
1.88 1.85
2a
2c2b
2d 3
1 1 1 1 1
FIG. S7. Schematic energy-level diagrams of the complexes formed by (1) with dopants (2a-d) of increasing
EA (from left to right). HOsc and LAcc denote the HOMO and LUMO levels of (1) and the dopant,
respectively. HCpx and H−1Cpx are the two highest occupied and LCpx the lowest unoccupied supramolecular
hybrid orbital of the (1)/(2a-d) complexes; EF denotes the Fermi energy, which is assumed at mid-gap of
the complex in the 1:1 cases. HOsc is calculated to 5.65 eV for (1) by DFT, the EA values for (2a-d) (LAcc)
stem from inverse photoelectron spectroscopy [4], and that for (3) from DFT calculations (see Fig. S4).
Note that for the difference between HHyb and LHyb the optical gap is indicated, which is lower than the
transport gap by the exciton binding energy.
S8

C. Optical Absorption Spectroscopy on the Ionized Dopants (2a-d)
4.0 3.5 3.0 2.5 2.0 1.5
0.0 eq
10.0 eq
Energy / eV
4.0 3.5 3.0 2.5 2.0 1.5
Energy / eV
0.0 eq
13.0 eq
4.0 3.5 3.0 2.5 2.0 1.5
0.0 eq
5.0 eq
Energy / eV
4.0 3.5 3.0 2.5 2.0 1.5Energy / eV
0.0 eq
10.0 eq
T2 T1
T2 T1
T2 T1T2 T1
Opt
ical
den
sity
/ ar
br. u
nits
Opt
ical
den
sity
/ ar
br. u
nits
Opt
ical
den
sity
/ ar
br. u
nits
Opt
ical
den
sity
/ ar
br. u
nits
Energy / eV Energy / eV
Energy / eV Energy / eV
Titration of (2a) with LiI Titration of (2b) with LiI
Titration of (2c) with LiI Titration of (2d) with LiI
(a)
(c)
(b)
(d)
1.472 eV
1.466 eV
1.449 eV1.469 eV
FIG. S8. (a-d) Evolution of absorption spectra of the dopants (2a-d) upon titration with increasing
equivalents (eq) of LiI in CH3CN solution yielding FxTCNQ radical anions according to the reaction
3LiI + 2FxTCNQ→ 2FxTCNQLi + LiI3 [6]. The transitions assigned to the ionized dopants arise at es-
sentially identical positions (most intense peaks at 2a: 1.472 eV, 2b: 1.466 eV, 2c: 1.469 eV, 2d: 1.449 eV)
[6–9]. They differ from those of the respective complexes with compound (1), indicated as T1 and T2,
in energy, in their shape (cf. main manuscript), and, importantly, in that they do not shift with dopant
strength (i.e., degree of fluorination).
S9

VII. SINGLE CRYSTAL SOLUTION OF THE (1)-(2A-D) MIXED CRYSTALS
A. Crystal data
Compounds (1)-(2a) (1)-(2b) (1)-(2c) (1)-(2d)
Formula Weight 725.06 743.05 761.04 797.03
Crystal Color, Habit black, needle-like black, needle-like black, needle-like black, needle-like
Crystal Dimensions 0.5x0.5x10 mm 0.5x0.5x10 mm 0.5x0.5x10 mm 0.5x0.5x10 mm
Crystal System triclinic triclinic triclinic triclinic
Lattice Type primitive primitive primitive primitive
a = 7.1901(3) A 7.1743(9) A 7.1609(5) A 7.0715(5) A
b = 7.7142(4) A 7.7822(10) A 7.8523(6) A 8.0773(6) A
c = 19.8510(14) A 19.852(3) A 19.8799(16) A 19.8477(14) A
α= 96.265(7)◦ 96.595(7)◦ 97.021(7)◦ 97.718(6)◦
β= 93.168(7)◦ 93.249(7)◦ 93.286(7)◦ 94.049(6)◦
γ= 106.512(8)◦ 106.783(8)◦ 107.556(8)◦ 107.845(5)◦
V = 1045.0(2) A3 1049.4(2) A3 1052.53(15) A3 1061.82(13) A3
Space Group P-1 P-1 P-1 P-1
Z value 1 1 1 1
calculated density 1.152 g cm−3 1.176 g cm−3 1.201 g cm−3 1.246 g cm−3
collected reflections 21449 21197 21635 21606
unique reflections 3784 3796 3809 3841
Rint 0.0587 0.0618 0.1082 0.0988
radiation Cu Kα Cu Kα Cu Kα Cu Kα
exposure time 15 sec/◦ 20 sec/◦ 30 sec/◦ 15 sec/◦
detector distance 191 mm 191 mm 191 mm 191 mm
2Θmax 136.5◦ 136.5◦ 136.5◦ 136.5◦
TABLE S2. Single crystal data for the 1:1 mixed crystal structures of (1) with (2a-d) grown from CHCl3
solution. A Rigaku R-AXIS RAPID 191R single-crystal diffractometer with filtered Cu-Kα radiation was
used recording 72 oscillation images, readout in 0.1 mm pixel mode. A linear absorption coefficient µ for Cu-
Kα radiation of 15.810 cm−1 was applied; empirical absorption correction resulted in transmission factors
0.486 - 0.854; data corrected for Lorentz and polarization effects.
S10

B. Structure refinement
The structures were solved by direct methods [10] and expanded using Fourier techniques.
The non-hydrogen atoms were refined anisotropically. Hydrogen atoms were refined using the
riding model. Data for (2a/2b/2c/2d): The final cycle of full-matrix least-squares refinement
(least squares function minimized:∑w(F 2
0 − F 2c )2) on F2 was based on 3784/3796/3809/3841
observed reflections and 235/253/254/253 variable parameters unweighted and weighted agree-
ment factors of: R1 =∑||F0| − |Fc||/
∑|F0| = 0.052/0.056/0.058/0.068, wR2 = [
∑(w(F 2
0 −
F 2c )2)/
∑w(F 2
0 )2]1/2 = 0.1437/0.1782/0.1583/0.1939; standard deviation of an observation of unit
weight was 1.01/1.05/0.95/0.95; maximum and minimum peaks on the final difference Fourier
map corresponded to 0.22/0.33/0.39/0.45 and -0.17/-0.23/-0.21/-0.34 e−/A3, respectively. Neu-
tral atom scattering factors were taken from Cromer and Waber [11]. Anomalous dispersion effects
were included in Fc [12]; the values for ∆f ′ and ∆f ′′ were those of Creagh and McAuley [13]; those
for the mass attenuation coefficients of Creagh and Hubbell [14]. All calculations were performed
using the CrystalStructure [15] crystallographic software package except for refinement, which was
performed using SHELXL-97 [16].
0.0 0.5 1.0 1.5 2.0qz / Å
-1
Log(
Inte
nsity
) / a
rbr.
units
2a
1
2b
2c
2d
FIG. S9. Comparison of the calculated powder diffraction patterns of the (1)-(2a-d) mixed crystal to that
of pure (1) [17]; intensities are normalized to the respective (001)-reflection.
S11

[1] H. Ebata, T. Izawa, E. Miyazaki, K. Takimiya, M. Ikeda, H. Kuwabara, T. Yui, J. Am. Chem. Soc.
2007, 129 (51), 15732.
[2] J. D. Chai, M. Head-Gordon, Phys. Chem. Chem. Phys. 2008, 10 (44), 6615–6620.
[3] C. Adamo, V. Barone, J. Chem. Phys. 1999, 110 (13), 6158–6170.
[4] K. Kanai, K. Akaike, K. Koyasu, K. Sakai, T. Nishi, Y. Kamizuru, T. Nishi, Y. Ouchi, K. Seki, Appl.
Phys. A 2009, 95 (1), 309–313.
[5] E. Huckel, Zeitschrift Fur Physik 1931, 70 (3-4), 204–286.
[6] L. R. Melby, R. J. Harder, W. R. Hertler, W. Mahler, R. E. Benson, W. E. Mochel, J. Am. Chem. Soc.
1962, 84 (17), 3374–3387.
[7] T. Shimizu, T. Yamamoto, Inorg. Chim. Acta 1999, 296 (1), 278–280.
[8] D. T. Duong, C. Wang, E. Antono, M. F. Toney, A. Salleo, Org. Electron. 2013, 14 (5), 1330–1336.
[9] I. Zanon, C. Pecile, J. Phys. Chem. 1983, 87 (19), 3657–3664.
[10] M. C. Burla, R. Caliandro, M. Camalli, B. Carrozzini, G. L. Cascarano, L. De Caro, C. Giacovazzo,
G. Polidori, R. Spagna, J. Appl. Crystallogr. 2005, 38, 381–388.
[11] J. T. Cromer, D. T. Waber, International Tables for X-ray Crystallography, The Kynoch Press, Birm-
ingham (England), 1974.
[12] W. C. Ibers, J. A. Hamilton, Acta Cryst. 1964, 17, 781.
[13] W. Creagh, D. C. McAuley, International Tables for Crystallography, Bd. C, (Hrsg.: A. Wilson), Kluwer
Academic Publishers (Boston), 1992, 219–222, Table 4.2.6.8.
[14] J. Creagh, D. C. Hubbell, International Tables for Crystallography, Bd. C, (Hrsg.: A. Wilson), Kluwer
Academic Publishers (Boston), 1992, 200–206, Table 4.2.4.3.
[15] Crystal Structure Analysis Package, Rigaku Corporation (2000-2013), Tokyo 196-8666, Japan.
[16] G. M. Sheldrick, Acta Cryst. A 2008, 64, 112–122.
[17] T. Izawa, E. Miyazaki, K. Takimiya, Adv. Mater. 2008, 20 (18), 3388.
S12