Embed Size (px)
Citation preview
PAPER I
Nguyen Ngoc Duy, Ola Flaaten, Nguyen Thi Kim Anh and Quach Thi Khanh Ngoc
(2012). Open-access Fishing Rent and Efficiency - The Case of Gillnet Vessels in Nha
Trang, Vietnam. Fisheries Research, 127-128:98-108.

ON
Na
b
a
ARRA
KEFFSV
1
mafcavwtcwi1mac
is
oq
0h
Fisheries Research 127– 128 (2012) 98– 108
Contents lists available at SciVerse ScienceDirect
Fisheries Research
j ourna l ho me pag e: www.elsev ier .com/ locate / f i shres
pen-access fishing rent and efficiency—The case of gillnet vessels inha Trang, Vietnam
guyen Ngoc Duya,∗, Ola Flaatenb, Nguyen Thi Kim Anha, Quach Thi Khanh Ngoca
Faculty of Economics, Nha Trang University, No. 02, Nguyen Dinh Chieu Street, Nha Trang, Viet NamNorwegian College of Fishery Science, University of Tromsø, N-9037 Tromsø, Norway
r t i c l e i n f o
rticle history:eceived 23 August 2011eceived in revised form 18 April 2012ccepted 20 April 2012
eywords:conomic performance
a b s t r a c t
This paper first discusses vessel behaviour and efficiency theoretically and then applies this knowledge toevaluate the economic performance of an open-access fishery. The case of the Nha Trang, Vietnam, gillnetfishery is surveyed with respect to the earnings, costs and technical characteristics and efficiency of 58offshore vessels in 2008. On average, these vessels proved to be heterogeneous with a gross profit marginof 17.3% and a profit margin of 3.8% despite the open-access characteristics of this fishery. However,adding the calculated interest of 9% per annum on the owner’s capital to the costs significantly worsens
ishing rentishing subsidiestandardised effortietnamese gillnet fishery
the economic results. Engine capacity (HP), gear size and days of fishing best reflect the fishing effortof vessels in the production function, and these were used to compute standardised effort and costefficiency. An application of the Salter diagram shows that a large number of vessels with high relativestandardised effort are the most cost-efficient, but not without exception. The majority of these vesselsearned intra-marginal rent, while the smallest vessels are most dependent on the government’s 2008quasi-lump-sum fuel subsidy scheme.
. Introduction
This paper investigates the economic efficiency and perfor-ance of vessels in an open-access fishery. Three main hypotheses
re tested: first, that the vessel owner has a positive gross cash flowrom his fishing operation; second, that the calculated opportunityost of capital is not covered in full because of the special char-cteristics of the fishing industry; and third, that fishing efficiencyariation is higher than cost efficiency variation among vessels. It isell known in the fisheries economics literature that in equilibrium
he potential resource rent is wasted under open access if the fleetonsists of homogeneous vessels (Clark, 1990). However, it is alsoell known that a producer’s surplus, called intra-marginal rent
n fisheries, may exist even under open-access equilibrium (Copes,972). Since fisheries management has both benefits and costs, itay be appropriate to know whether an open-access fishery cre-
tes any net benefits, such as intra-marginal rent, before instigatingostly management systems (Wallis and Flaaten, 2003).
The empirical focus is a Vietnamese open-access gillnet fisheryn the South China Sea, which is fished competitively by ves-els from more than 10 countries. Vietnam has a coastline of
∗ Corresponding author. Tel.: +84 98 3 128 350; fax: +84 58 3 831 147.E-mail addresses: [email protected], [email protected] (N.N. Duy),
[email protected] (O. Flaaten), [email protected] (N.T.K. Anh),[email protected] (Q.T.K. Ngoc).
165-7836/$ – see front matter © 2012 Elsevier B.V. All rights reserved.ttp://dx.doi.org/10.1016/j.fishres.2012.04.008
© 2012 Elsevier B.V. All rights reserved.
about 3260 km and its exclusive economic zone (EEZ) extends overmore than one million square kilometres (FAO, 2005). In Vietnam’smarine waters, there are about 3.1 million tonnes of standing stockof marine fish with more than 2000 fish species and around 1.4million tonnes of potential sustainable yields (FAO, 2004).
Owing to the fear of the overexploitation of coastal resources, aprogramme investing in offshore fishing vessels has been imple-mented since 1997. The Vietnamese government, therefore, hasemphasised the need to develop its offshore fleet with great cau-tion to avoid the development of an economically unsustainablefleet (FAO, 2005). In 2005, the Ministry of Fisheries proposedtwo new major development goals for offshore fisheries1: (1) “toensure sustainable and efficient offshore fisheries, while maintain-ing both marine ecosystem functions and harmonious relationshipswith coastal fisheries and contributing to the protection of thesovereignty of the territorial waters and the national security ofVietnam” and (2) “to enhance income, create new occupations andimprove the living standards of fishing communities that dependon offshore fisheries” (FAO, 2005). In order to assess whether
these two development goals are being achieved, the monitoringand reporting of annual performance indicators were introducedat a conference on the national strategy for marine fisheries1 The Ministry of Fisheries has now merged with the Ministry of Agriculture andRural Development.
esearc
miipro
dtflrveCsposonbrbba
ifteitreeca
g345fs
2
cagcts(c2e(cC
d
In this study, the main economic performance indicators(Table 1) are used to estimate the level of intra-marginal rentgenerated by each vessel in the open-access gillnet fishery.6 The
N.N. Duy et al. / Fisheries R
anagement and development in Vietnam (FAO, 2005).2 Thesendicators are referred to as measures to assist when draft-ng policies for marine resource management. Thus, Vietnameseolicymakers require not only reliable assessments of offshoreesources, but also an understanding of the economic realities offfshore fishing (FAO, 2005; Long et al., 2008).
To the best of our knowledge, official government institutionso not regularly collect costs and earnings data for the evalua-ion of the economic performance and efficiency of offshore fishingeets despite the stated need for this. However, some independentesearch papers have been published in recent years for offshoreessels (Long et al., 2008; Flaaten, 2008). This study addresses theconomic performance and efficiency of gillnet vessels in Southentral Vietnam in the 2008 season through a costs and earningsurvey. The home port of these vessels, the city of Nha Trang in therovince of Khanh Hoa, is one of the main ports for Vietnameseffshore vessels fishing the South China Sea. The gillnet fleet waselected for this research mainly for two reasons: (1) gillnet is onef the main Vietnamese gear types for offshore fisheries and (2) gill-et is a fishing gear which has high selectivity and is considered toe less likely than trawl to damage the sea floor (King, 1995). A rep-esentative survey of all Vietnamese offshore vessels would haveeen the preferred approach for this research. However, owing tooth financial and time constraints this work had to be limited to
smaller geographic area.It is now a rather standard procedure to conduct costs and earn-
ngs surveys and measure basic economic performance indicatorsor a fishery. The same applies to this case. However, this paper con-ributes to the further development of the methods of comparingconomic performance and efficiency of vessels by the standard-sation of fishing effort and the estimation of a Salter diagram forhis fleet. This method makes it possible to estimate intra-marginalent for each vessel and for the fishery. Further, the profitabilityffects of the 2008 government fuel cost compensation subsidy arestimated and discussed. This subsidy scheme was introduced toompensate fishing vessels for the large increase that year in fuelnd lubricant oil costs, but was abolished after one year.3
The remainder of this paper is organised as follows. Section 2ives background information on the investigated fishery. Section
describes the theory and methods used and developed. Section focuses on the data from the costs and earnings survey. Section is devoted to the research results. Section 6 highlights the keyeatures of the results, and the findings and recommendations areummarised in Section 7.
. Background
Vietnam’s coast has many bays and estuaries as well as diverseoastal and marine resources, and thus the EEZ of Vietnam containsn abundant number of species (FAO, 2005). These have createdood potential for the development of mainly multi-species marineapture fisheries as well as marine aquaculture. The fisheries sec-or, including marine capture fisheries, has become an importantector in the national economy, contributing 4% to GDP in 2006Pomeroy et al., 2009). However, Vietnam’s marine fisheries areonsidered to be small scale (Pomeroy et al., 2009; Raakjaer et al.,007) and open access (Long et al., 2008; FAO, 2009). Marine fish-ries’ production levels have increased continuously over time
GSO, 2008), and the number of fishing vessels has increased signifi-antly and far beyond the control of fisheries managers (FAO, 2005).oastal fishing capacity has exceeded the sustainable limit (FAO,2 See these performance indicators in FAO (2005).3 The Vietnamese Government 2008 fuel cost support for fishers was outlined and
iscussed in Decision (2008a,b).
h 127– 128 (2012) 98– 108 99
2004, 2005),4 and coastal resources have thus been overexploitedand seem to be decreasing.
Most offshore fishing vessels of the Khanh Hoa province arelocated in the provincial capital Nha Trang. In 2009, the Nha Trangoffshore gillnet fleet amounted to 233 of 290 vessels that haveengines larger than 50 horsepower (HP), more than 80%, and 178of 208 vessels whose engines are larger than 90 HP, nearly 86%(DECAFIREP, 20095). Most gillnet vessels with engines of more than250 HP are also located in this city. The offshore fishery has beenopen access since its inception and a minor resource tax was abol-ished in 2008 (Flaaten, 2008).
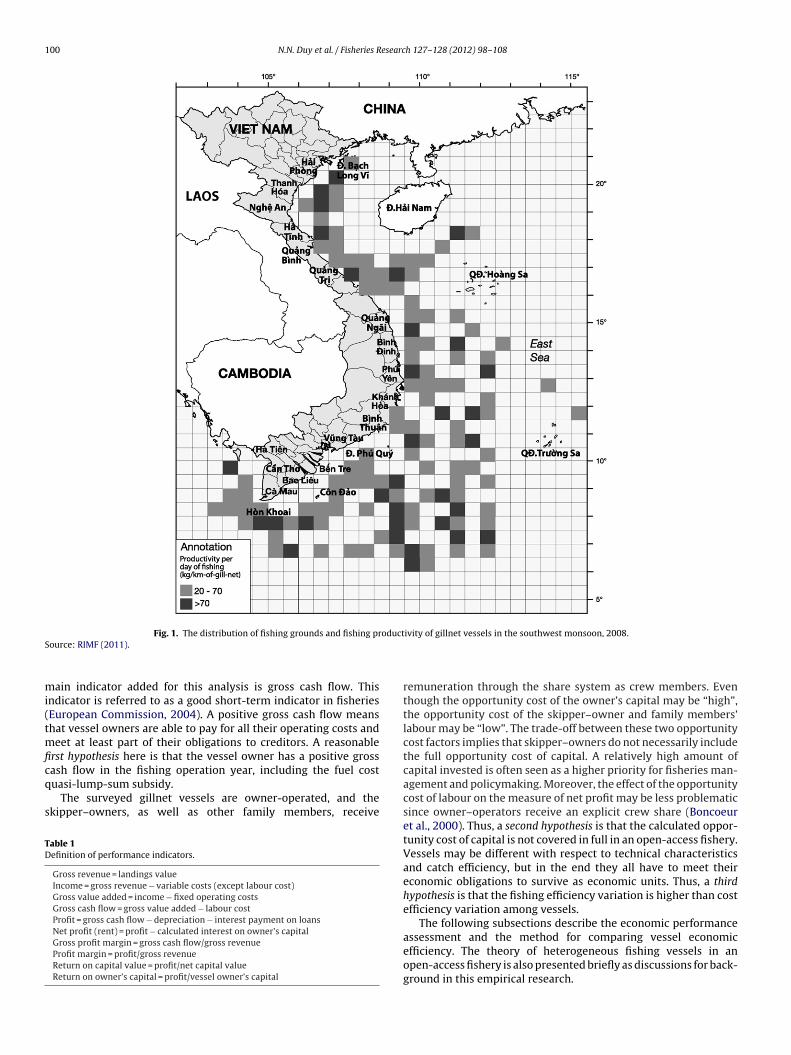
Nha Trang’s offshore gillnet operators often operate in waters50–70 nautical miles from the coastline, along the territorial watersof the Khanh Hoa province, and move towards the east and south-west waters (6◦00′–8◦00′N; 104◦30′–108◦00′E) and southwest ofthe Spratly Islands (Truong Sa) (6◦00′–9◦00′N; 110◦30′–114◦00′E),as well as to fishing grounds of high sea waters (6◦00′–7◦00′N;109◦00′–110◦00′E) (Fig. 1). The actual fishing grounds depend onthe movement direction of fish and the aggregation of migratoryspecies. The target fish species are mainly tuna and mackerel. Off-shore gillnet vessels operate from September (or October) to July(or August) of the following year. The major fishing season for tunaruns from February to July (called the southwest monsoon), whenfish are found in the offshore waters from Khanh Hoa to the Ba Ria-Vung Tau province, while the fishing season for mackerel speciesranges from February to June. The second season is normally calledthe northwest monsoon, ranging from October (or November) toJanuary of the following year. Tuna is concentrated in the extremesouth of Vietnam in the second season and only gillnet vessels witha large amount of engine power can venture further into this fish-ing ground. Offshore gillnet vessels often stay onshore for repairsand maintenance from August to September. The majority of themare tuna gillnet vessels, as it is difficult to find mackerel gillnettersin Nha Trang because of mackerel stock depletion and the weakfishing experience and capacity of prediction of the fishing ground(Kim Anh et al., 2006).
3. Theory and methods
The economic performance of fisheries is often assessed fromeconomic surveys of vessels participating in the fishery. From afisheries management perspective with heterogeneous vessels, thelevel of economic rent accruing in the open-access fishery can beestimated from the economic profits of the vessels surveyed andit consists of two components: resource rent and intra-marginalrent (Copes, 1972; Coglan and Pascoe, 1999). Resource rent isdissipated under open-access conditions because of the commonproperty problem discussed in Gordon (1954), Hardin (1968) andMunro and Scott (1985). With heterogeneous vessels under anopen-access regime, the profits generated could be considered tobe intra-marginal rent gained by the factors of production, such ascapital, variable inputs and labour, through more efficient vesselsand practices (Coglan and Pascoe, 1999).
4 In the fisheries context, the coastal sea areas are measured from the coast tothe line connecting points of 24 nautical miles from the coast. Fishing in the seaareas outside the 24 nautical mile limit, to the outer limit of Vietnam’s sea areas, isreferred to as offshore fishing (Decree, 2006).
5 For this and other references in the Vietnamese language further informationcan be obtained from the corresponding author.
6 This rent is not relevant to the rent gained by preventing excessive harvestingcapacity that is caused by the Class I and II forms of the common property problemdiscussed in Munro and Scott (1985).
100 N.N. Duy et al. / Fisheries Research 127– 128 (2012) 98– 108
oductS
mi(tmficq
s
TD
Fig. 1. The distribution of fishing grounds and fishing prource: RIMF (2011).
ain indicator added for this analysis is gross cash flow. Thisndicator is referred to as a good short-term indicator in fisheriesEuropean Commission, 2004). A positive gross cash flow meanshat vessel owners are able to pay for all their operating costs and
eet at least part of their obligations to creditors. A reasonablerst hypothesis here is that the vessel owner has a positive gross
ash flow in the fishing operation year, including the fuel costuasi-lump-sum subsidy.The surveyed gillnet vessels are owner-operated, and thekipper–owners, as well as other family members, receive
able 1efinition of performance indicators.
Gross revenue = landings valueIncome = gross revenue − variable costs (except labour cost)Gross value added = income − fixed operating costsGross cash flow = gross value added − labour costProfit = gross cash flow − depreciation − interest payment on loansNet profit (rent) = profit − calculated interest on owner’s capitalGross profit margin = gross cash flow/gross revenueProfit margin = profit/gross revenueReturn on capital value = profit/net capital valueReturn on owner’s capital = profit/vessel owner’s capital
ivity of gillnet vessels in the southwest monsoon, 2008.
remuneration through the share system as crew members. Eventhough the opportunity cost of the owner’s capital may be “high”,the opportunity cost of the skipper–owner and family members’labour may be “low”. The trade-off between these two opportunitycost factors implies that skipper–owners do not necessarily includethe full opportunity cost of capital. A relatively high amount ofcapital invested is often seen as a higher priority for fisheries man-agement and policymaking. Moreover, the effect of the opportunitycost of labour on the measure of net profit may be less problematicsince owner–operators receive an explicit crew share (Boncoeuret al., 2000). Thus, a second hypothesis is that the calculated oppor-tunity cost of capital is not covered in full in an open-access fishery.Vessels may be different with respect to technical characteristicsand catch efficiency, but in the end they all have to meet theireconomic obligations to survive as economic units. Thus, a thirdhypothesis is that the fishing efficiency variation is higher than costefficiency variation among vessels.
The following subsections describe the economic performance
assessment and the method for comparing vessel economicefficiency. The theory of heterogeneous fishing vessels in anopen-access fishery is also presented briefly as discussions for back-ground in this empirical research.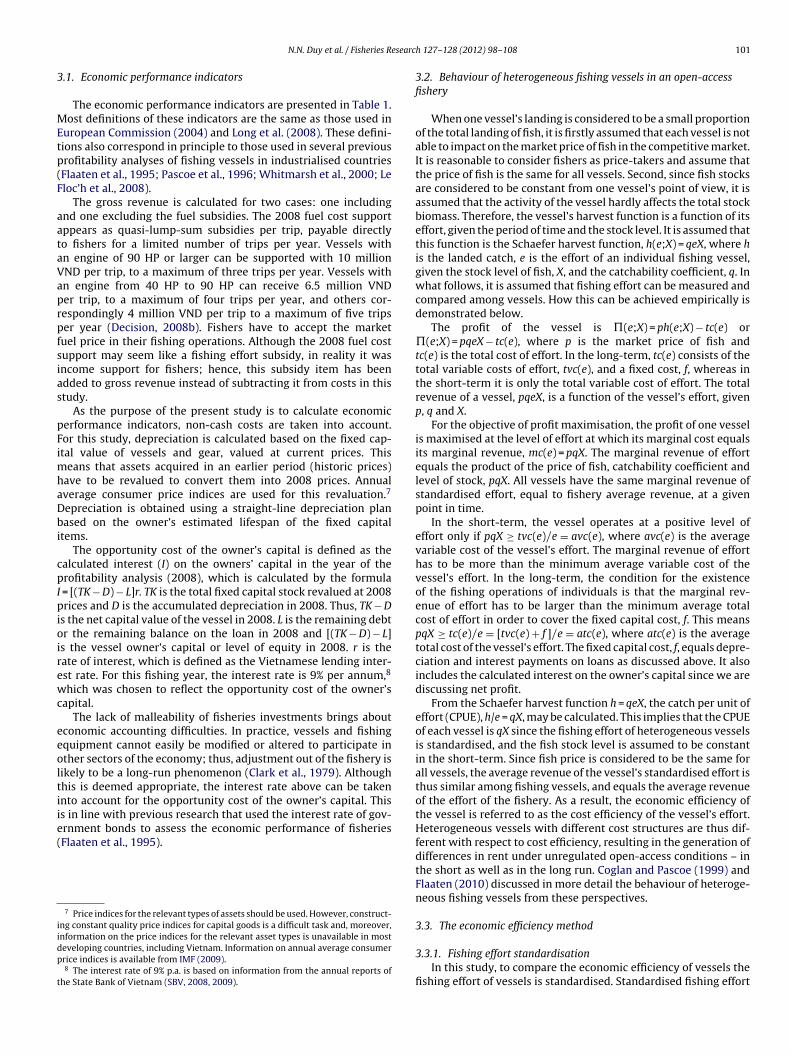
esearc
3
MEtp(F
aataVaprpfsias
pFimhaDbi
cpIpioirewc
eeoltiie(
iidp
t
N.N. Duy et al. / Fisheries R
.1. Economic performance indicators
The economic performance indicators are presented in Table 1.ost definitions of these indicators are the same as those used in
uropean Commission (2004) and Long et al. (2008). These defini-ions also correspond in principle to those used in several previousrofitability analyses of fishing vessels in industrialised countriesFlaaten et al., 1995; Pascoe et al., 1996; Whitmarsh et al., 2000; Leloc’h et al., 2008).
The gross revenue is calculated for two cases: one includingnd one excluding the fuel subsidies. The 2008 fuel cost supportppears as quasi-lump-sum subsidies per trip, payable directlyo fishers for a limited number of trips per year. Vessels withn engine of 90 HP or larger can be supported with 10 millionND per trip, to a maximum of three trips per year. Vessels withn engine from 40 HP to 90 HP can receive 6.5 million VNDer trip, to a maximum of four trips per year, and others cor-espondingly 4 million VND per trip to a maximum of five tripser year (Decision, 2008b). Fishers have to accept the marketuel price in their fishing operations. Although the 2008 fuel costupport may seem like a fishing effort subsidy, in reality it wasncome support for fishers; hence, this subsidy item has beendded to gross revenue instead of subtracting it from costs in thistudy.
As the purpose of the present study is to calculate economicerformance indicators, non-cash costs are taken into account.or this study, depreciation is calculated based on the fixed cap-tal value of vessels and gear, valued at current prices. This
eans that assets acquired in an earlier period (historic prices)ave to be revalued to convert them into 2008 prices. Annualverage consumer price indices are used for this revaluation.7
epreciation is obtained using a straight-line depreciation planased on the owner’s estimated lifespan of the fixed capital
tems.The opportunity cost of the owner’s capital is defined as the
alculated interest (I) on the owners’ capital in the year of therofitability analysis (2008), which is calculated by the formula
= [(TK − D) − L]r. TK is the total fixed capital stock revalued at 2008rices and D is the accumulated depreciation in 2008. Thus, TK − D
s the net capital value of the vessel in 2008. L is the remaining debtr the remaining balance on the loan in 2008 and [(TK − D) − L]s the vessel owner’s capital or level of equity in 2008. r is theate of interest, which is defined as the Vietnamese lending inter-st rate. For this fishing year, the interest rate is 9% per annum,8
hich was chosen to reflect the opportunity cost of the owner’sapital.
The lack of malleability of fisheries investments brings aboutconomic accounting difficulties. In practice, vessels and fishingquipment cannot easily be modified or altered to participate inther sectors of the economy; thus, adjustment out of the fishery isikely to be a long-run phenomenon (Clark et al., 1979). Althoughhis is deemed appropriate, the interest rate above can be takennto account for the opportunity cost of the owner’s capital. Thiss in line with previous research that used the interest rate of gov-rnment bonds to assess the economic performance of fisheries
Flaaten et al., 1995).7 Price indices for the relevant types of assets should be used. However, construct-ng constant quality price indices for capital goods is a difficult task and, moreover,nformation on the price indices for the relevant asset types is unavailable in mosteveloping countries, including Vietnam. Information on annual average consumerrice indices is available from IMF (2009).8 The interest rate of 9% p.a. is based on information from the annual reports of
he State Bank of Vietnam (SBV, 2008, 2009).
h 127– 128 (2012) 98– 108 101
3.2. Behaviour of heterogeneous fishing vessels in an open-accessfishery
When one vessel’s landing is considered to be a small proportionof the total landing of fish, it is firstly assumed that each vessel is notable to impact on the market price of fish in the competitive market.It is reasonable to consider fishers as price-takers and assume thatthe price of fish is the same for all vessels. Second, since fish stocksare considered to be constant from one vessel’s point of view, it isassumed that the activity of the vessel hardly affects the total stockbiomass. Therefore, the vessel’s harvest function is a function of itseffort, given the period of time and the stock level. It is assumed thatthis function is the Schaefer harvest function, h(e;X) = qeX, where his the landed catch, e is the effort of an individual fishing vessel,given the stock level of fish, X, and the catchability coefficient, q. Inwhat follows, it is assumed that fishing effort can be measured andcompared among vessels. How this can be achieved empirically isdemonstrated below.
The profit of the vessel is �(e;X) = ph(e;X) − tc(e) or�(e;X) = pqeX − tc(e), where p is the market price of fish andtc(e) is the total cost of effort. In the long-term, tc(e) consists of thetotal variable costs of effort, tvc(e), and a fixed cost, f, whereas inthe short-term it is only the total variable cost of effort. The totalrevenue of a vessel, pqeX, is a function of the vessel’s effort, givenp, q and X.
For the objective of profit maximisation, the profit of one vesselis maximised at the level of effort at which its marginal cost equalsits marginal revenue, mc(e) = pqX. The marginal revenue of effortequals the product of the price of fish, catchability coefficient andlevel of stock, pqX. All vessels have the same marginal revenue ofstandardised effort, equal to fishery average revenue, at a givenpoint in time.
In the short-term, the vessel operates at a positive level ofeffort only if pqX ≥ tvc(e)/e = avc(e), where avc(e) is the averagevariable cost of the vessel’s effort. The marginal revenue of efforthas to be more than the minimum average variable cost of thevessel’s effort. In the long-term, the condition for the existenceof the fishing operations of individuals is that the marginal rev-enue of effort has to be larger than the minimum average totalcost of effort in order to cover the fixed capital cost, f. This meanspqX ≥ tc(e)/e = [tvc(e) + f ]/e = atc(e), where atc(e) is the averagetotal cost of the vessel’s effort. The fixed capital cost, f, equals depre-ciation and interest payments on loans as discussed above. It alsoincludes the calculated interest on the owner’s capital since we arediscussing net profit.
From the Schaefer harvest function h = qeX, the catch per unit ofeffort (CPUE), h/e = qX, may be calculated. This implies that the CPUEof each vessel is qX since the fishing effort of heterogeneous vesselsis standardised, and the fish stock level is assumed to be constantin the short-term. Since fish price is considered to be the same forall vessels, the average revenue of the vessel’s standardised effort isthus similar among fishing vessels, and equals the average revenueof the effort of the fishery. As a result, the economic efficiency ofthe vessel is referred to as the cost efficiency of the vessel’s effort.Heterogeneous vessels with different cost structures are thus dif-ferent with respect to cost efficiency, resulting in the generation ofdifferences in rent under unregulated open-access conditions – inthe short as well as in the long run. Coglan and Pascoe (1999) andFlaaten (2010) discussed in more detail the behaviour of heteroge-neous fishing vessels from these perspectives.
3.3. The economic efficiency method
3.3.1. Fishing effort standardisationIn this study, to compare the economic efficiency of vessels the
fishing effort of vessels is standardised. Standardised fishing effort
1 esearc
iatcEiaiw
iwt(vtiavtp
e
wtfiTl
daEesioyqfii
3e
ac
ε
wsit“eTCafi
rrea
great differences in profit, but also by wide ranges in the net capitalvalue and net owner’s capital of vessels.
On the positive gross cash flow hypothesis: The average vessel’sgross cash flow was 195.8 million VND (Table 2). There were only
9 Other types of software programs, such as GLIM (e.g. Healy, 1988), could of
02 N.N. Duy et al. / Fisheries R
ndicators for vessels are estimated using the production functionpproach to effort. Hannesson (1983) and Campbell (1991) appliedhis method to the estimation of fishing effort in the Lofoten winterod fishery and in the Tasmanian rock lobster fishery, respectively.ide et al. (2003) also included a seasonal term to take care ofntra-annual variation in the CPUE. Padilla and Trinidad (1995)pplied the production function to fishing effort standardisationn the small-pelagic fishery in the central Philippines, the catch of
hich was referred to as a measure of fishing effort.The Schaefer production function of each vessel discussed above
s a special form of the Cobb–Douglas function, h = qeˇ1 Xˇ2 , namelyith ˇ1 = ˇ2 = 1. The general form of the economic production func-
ion is h = f (e,X), where e is a vector of inputs consisting of capitalK), labour (L) and other variable inputs (V). With cross-sectionalessel data for one year being used for the short-term, an assump-ion of constant stock resources is reasonable. This assumptionmplies that the production function is separable. This separabilityllows for the aggregation of individual inputs into the aggregateariable fishing effort. The production function can thus be rewrit-en h = f(g(e),X). The effort function of each vessel, g(e), can also beresented in the form of the Cobb–Douglas function:
= Ax˛11 x˛2
2 . . . x˛kk (1)
here e is now the standardised fishing effort; x1, x2, . . ., xk arehe k inputs of the vessel; and A is a constant. The Cobb–Douglasunction has been widely used in analyses of the fisheries sector,ncluding in Hannesson (1983), Campbell (1991) and Padilla andrinidad (1995). In practise, Eq. (1) can be estimated through a log-inear function.
In previous research, it seems most common to estimate a pro-uction (catch) function, such that the estimated catch functionlso can be considered to be an effort function (Hannesson, 1983;ide et al., 2003; Andersen, 1999). Padilla and Trinidad (1995)stimated fishing effort equations, which were used to derivetandardised measures of fishing effort, through using the catchnterpreted as effective fishing effort. By assuming that the pricesf fish are fixed and the same for all vessels and months within oneear, annual gross revenue is considered to be a proxy for the annualuantity of fish, for which actual data are lacking. Thus, annual grossshing revenue per vessel can be interpreted as a fishing effort
ndicator, which usually varies across vessels.
.3.2. Relative standardised fishing effort and vessel economicfficiency
Adapting the definition of relative fishing power by Bevertonnd Holt (1957), the relative standardised fishing effort of vessel ian be determined by the following formula:
i = ei
e(2)
here εi is the relative standardised fishing effort of vessel i, ei is thetandardised fishing effort of vessel i and e is the average standard-sed effort of all vessels. This definition of εi is used below to analysehe economic efficiency of vessels. By nature, using the results ofstandardised effort” estimated in Eq. (1) or “relative standardisedffort” calculated from Eq. (2) should lead to the same conclusions.he notion of “relative standardised effort” is applied in this study.alculating “relative standardised effort” also gives indices of rel-tive fishing power. These indices can be expressed as the relativeshing power efficiency of vessels.
In this study, the ratio of cost to relative standardised efforteflects the cost efficiency and economic efficiency of the vessel. Theelationship between cost efficiency and the relative standardisedffort of each vessel will be graphed using a Salter diagram, with rel-tive standardised effort along the horizontal axis and the average
h 127– 128 (2012) 98– 108
cost per unit of relative standardised effort on the vertical axis.9 Foreach vessel, relative standardised fishing effort is measured by thewidth of the bar, whereas the height of the bar measures cost perunit effort (Fig. 3). All vessels are arranged from left to right accord-ing to their cost efficiency levels, from the most cost-efficient oneto the least cost-efficient.
4. Data
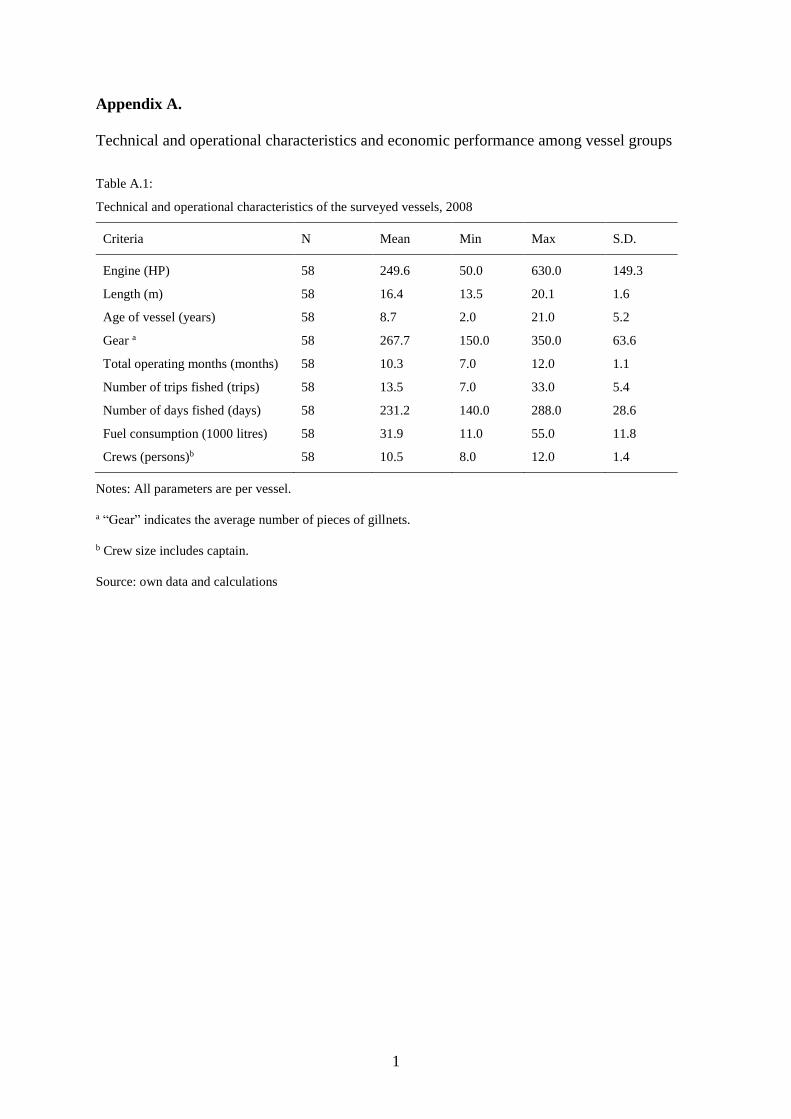
The 2008 data were obtained by a survey of costs and earningsas well as the technical and operational characteristics of offshoregillnet vessels in Nha Trang (Appendix A, Tables A.1 and A.2).10
These data were collected through direct face-to-face interviewswith fishing households, which were represented by the vesselowner and/or his wife. They consist of detailed information onvarious aspects of the gillnet fishery such as vessel technical andoperational characteristics and cost and landing value information.
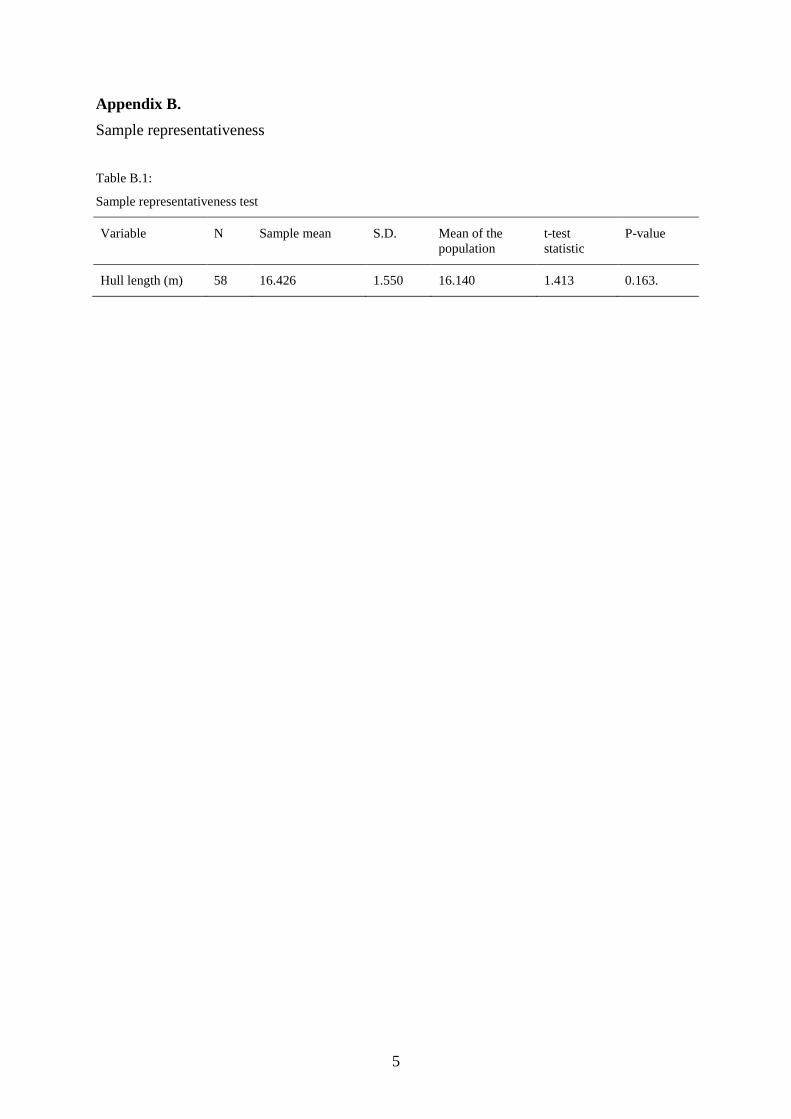
From a population of 225 registered offshore gillnet vessels inNha Trang, a sample of 58 gillnet vessels was selected for investi-gation. The sample of gillnet vessels investigated comprises about25.8% of the population. The investigation process was performedwith the aim of obtaining a representative sample. Hull length wasthe physical characteristic used to test the sample representative-ness because of available data. A comparison of the hull length ofthe sample with that of the offshore gillnet fleet in Nha Trang as awhole suggests that the sample was fairly representative of the fleet(Appendix B). Although there would be some uncertainties aboutthe reliability of the results of any survey (Pascoe et al., 1996), thestatistical results presented below are those of the sample.
5. Results
5.1. Economic performance indicators
5.1.1. The subsidies caseTable 2 shows that the average vessel’s annual gross revenue
from fishing operations was 1044.6 million VND.11 Because all 58surveyed gillnet vessels received the 2008 quasi-lump-sum fuelsubsidy, the average gross revenue increased by 2.8%. The resultsshow that income, gross value added, gross cash flow and profitare positive for an average vessel, whereas net profit is negativebecause of the calculated interest on the owner’s capital (Table 2).The average annual crew share was about 17.1 million VND, result-ing in the average monthly crew share during fishing season of 1.65million VND, with the average annual total operating months of agillnet vessel being 10.3.
Also shown in Table 2, the averages of vessels’ gross profit mar-gin and profit margin were 17.3% and 3.8%, respectively, with wideranges for both indicators. However, by using the sample meanvalues in Table 2, these two indicators would increase to 18.2% and4.7%, respectively. The averages of vessels’ return on capital valueand return on the owner’s capital were 5.3% and 6.1%, respectively,also with large ranges. The large variance of the return on capi-tal value and return on the owner’s capital was caused not only by
course have been used for this type of analysis.10 A copy of the questionnaire may be obtained from the corresponding author on
request.11 VND: Vietnamese dong, the unit of Vietnamese currency. The average exchange
rate for 2008 was 1 USD = 16,302.3 VND (GSO, 2009).
N.N. Duy et al. / Fisheries Research 127– 128 (2012) 98– 108 103
Table 2Economic performance indicators, in million VND, 2008.
Criteria The subsidies case The non-subsidies case
Mean S.D. Mean S.D.
Gross revenue from fishing 1044.6 341.2 1044.6 341.2Subsidy 29.2 1.6
Gross revenue with subsidy 1073.7 342.3Variable costs 604.4 174.5 604.4 174.5
Income 469.3 193.8 440.2 192.9Fixed costs 89.4 30.1 89.4 30.1
Gross value added 379.9 172.3 350.7 171.4Labour costs 184.1 78.4 184.1 78.4
Gross cash flow 195.8 121.2 166.6 120.5Depreciation 136.4 45.8 136.4 45.8Interest payment on loans 8.9 13.9 8.9 13.9
Profit 50.5 93.1 21.4 92.7Calculated interest on owner’s capital 68.9 39.2 68.9 39.2
Net profit −18.4 84.4 −47.6 84.4Net capital value 862.8 454.7 862.8 454.7Net owner’s capital 766.1 435.3 766.1 435.3Gross profit margina 0.173 0.083 0.147 0.089Profit margina 0.038 0.085 0.008 0.092Return on capital valuea 0.053 0.127 0.007 0.128Return on owner’s capitala 0.061 0.139 0.007 0.142Average income per fisherman 17.1 5.8 17.1 5.8
Sed in d
ttaetf
sasgdhtwe((
5
vhhamscfi
Icof(noao
from Eq. (3) show that vessel number 35 has the lowest standard-ised effort of 478.53, whereas the highest standardised effort of1514.77 is for vessel number 30. Average standardised fishing effortis 1043.18 (units of effort).
Table 3Parameter estimate and test statistics of the standardised effort function.
Variablename
Estimatedcoefficient
t-Value P-value Whitet-value
WhiteP-value
ln HP 0.251 16.400 0.000a 20.570 0.000a
ln GEAR 0.541 12.530 0.000a 12.330 0.000a
ln DAY 0.474 9.649 0.000a 10.600 0.000a
ource: Own data and calculations.a These indicators are estimated with relative to standard deviation, and measur
wo vessels (vessel numbers 25 and 40) whose gross revenue withhe 2008 subsidies did not offset their variable, fixed operatingnd labour costs. However, the positive gross cash flow hypoth-sis is not statistically rejected for the sample of 58 vessels sincehe average vessel’s gross cash flow was positive and sufficiently farrom zero.
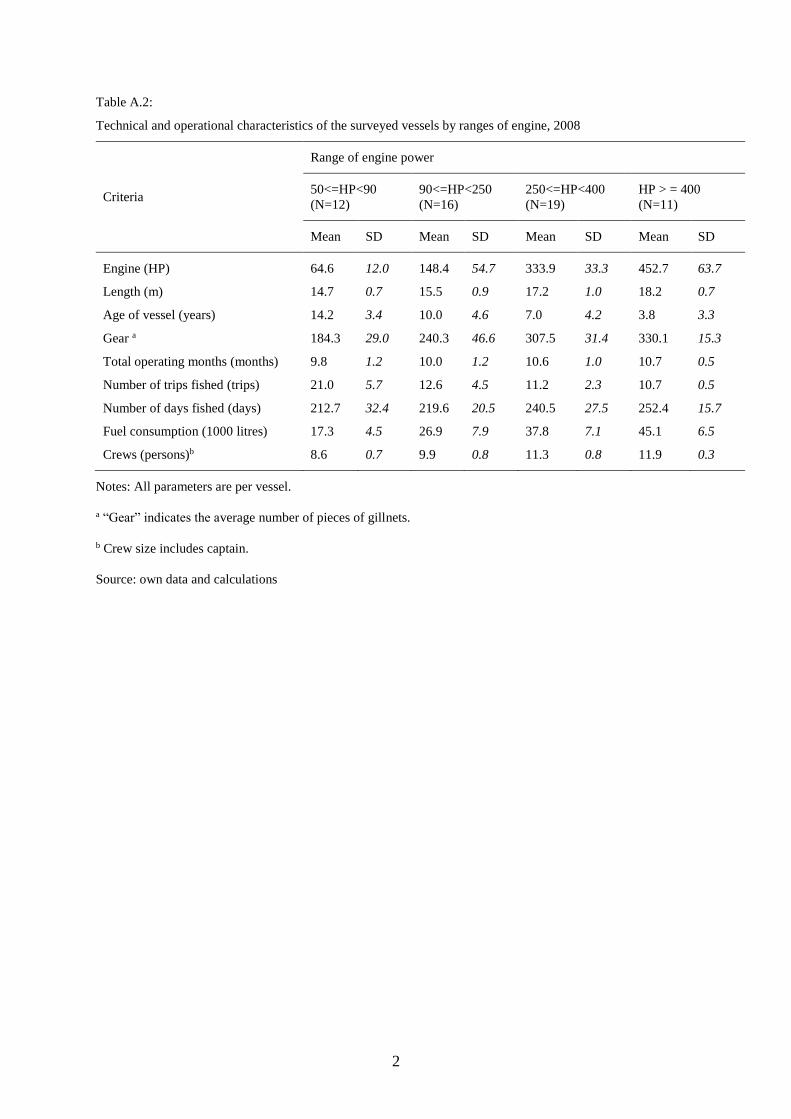
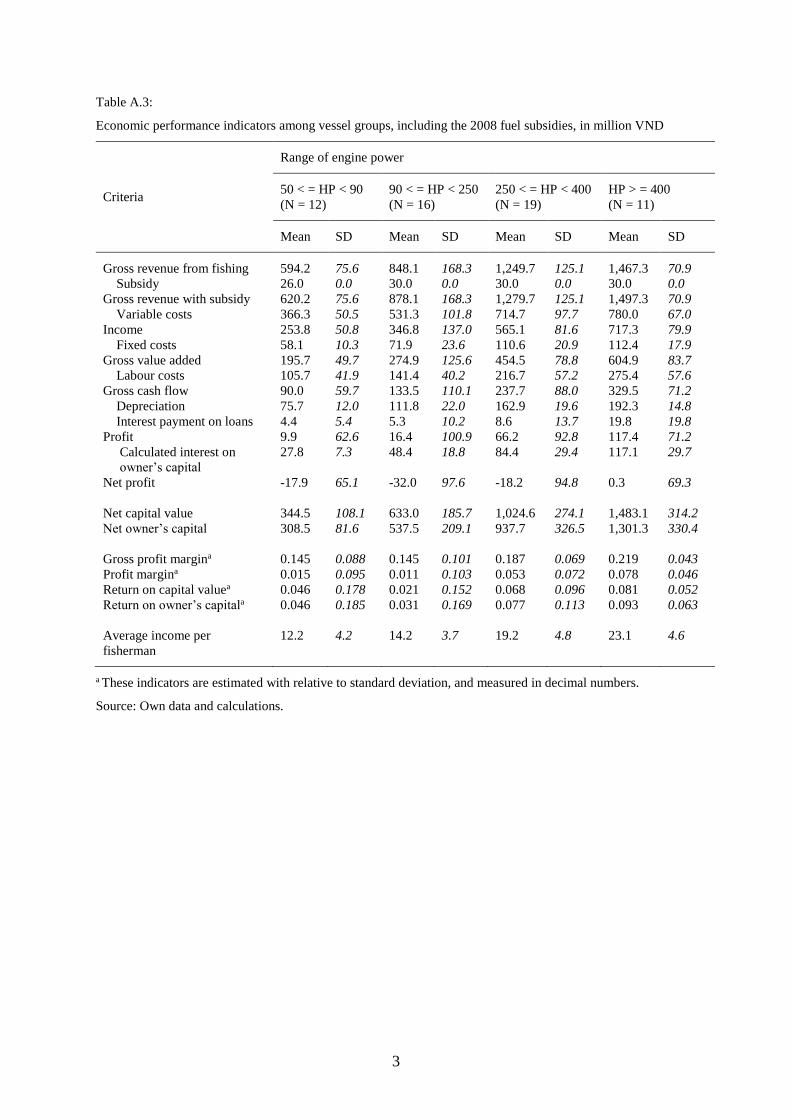
A breakdown of the sample according to the engine size of ves-els shows that most annual performance indicators increase onverage with engine size (Appendix A, Table A.3). Costs follow theame trend as gross revenue and vessel engine size. An averageillnet vessel of each group covered the cash cost as well as theepreciation. In 2008, the two vessel groups with larger enginesad economic performance indicators far better than those of thewo vessel groups with smaller engines. However, while vesselsith more than 400 HP on average for 2008 barely covered all their
xpenses and received only a very small surplus with a net profitrent) of 0.3 million VND, other vessels attained a negative net profitAppendix A, Table A.3).
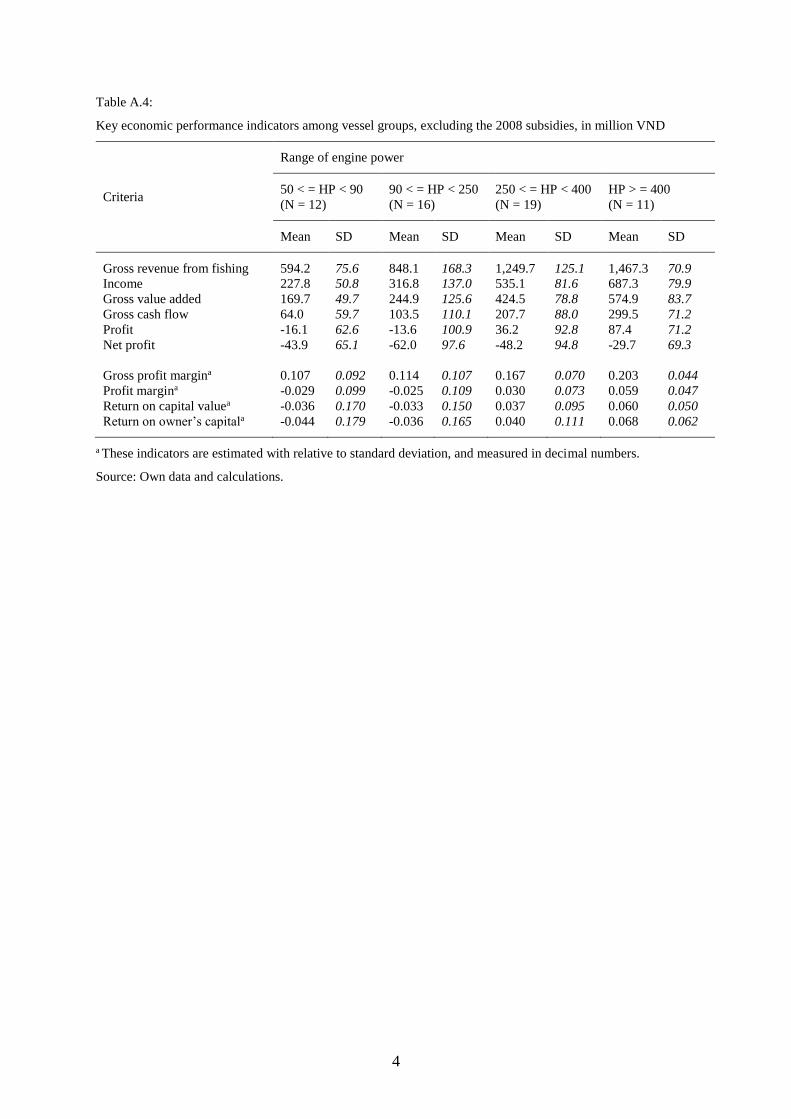
.1.2. The non-subsidies caseThe average quasi-lump-sum subsidy was 29.2 million VND per
essel (Table 2). Without the subsidy, one more vessel would havead a negative gross cash flow and seven additional vessels wouldave had a negative profit. The average gillnet vessel was earning
profit of 21.4 million VND from its actual fishing operations atarket prices, but 50.5 million VND including the fuel cost sub-
idy. Only vessels with more than 250 HP on average were able toover depreciation and interest payments on loans from their grossshing revenue (Appendix A, Table A.4).
On the opportunity cost of capital not covered-in-full hypothesis:t may be concluded that the second hypothesis, in which the cal-ulated opportunity cost of capital is not covered in full in thispen-access fishery, cannot be rejected. The net profit is negativeor an average vessel both in the case of subsidies and non-subsidiesTable 2). Additionally, all vessel groups on average earn negative
et profits in the two cases, except for the vessel group with enginesf 400 HP and larger in the subsidies case (Appendix A, Tables A.3nd A.4). Thus, vessel owners do not consider the opportunity costf the owner’s capital in full as a regular fishing cost.ecimal numbers.
5.2. Standardised fishing effort – econometric results
Initially, many factors were considered to be an input bundle togenerate fishing effort. However, some of them were excluded fromthe final model because neither individual nor joint tests producedany evidence to support their significant effects on the fishing effortof the vessel. Consequently, engine capacity and fishing gear, asproxies for capital inputs, and fishing days in a year, as the proxyfor variable inputs, were identified as the factors affecting the fish-ing effort of the vessel. The estimated coefficients are presented inTable 3.
The econometric results indicate that the effect of independentvariables in explaining variations in fishing effort is significant forthe sample vessels with an R2 of 98.7%. The F-statistic of 1419.4specifically shows that the estimated relationship is significant. Allthe coefficients estimated for the explanatory variables are signifi-cantly different from zero at the 1% level or better based on the OLSestimation with White’s procedure for correcting for heteroskedas-ticity.
The equation used to standardise fishing effort for each vessel is
ei = exp(−0.018) ∗ HPi0.251GEARi
0.541DAYi0.474 (3)
where HP is horsepower, GEAR is the number of pieces of gillnetsand DAY is the number of fishing days in 2008. The results estimated
Constant −0.018 −0.060 0.952 −0.063 0.950
Source: own data.R2 = 0.987; F-statistic = 1419.4.
a Statistically significant at the level of 1%.
104 N.N. Duy et al. / Fisheries Research 127– 128 (2012) 98– 108
0.0
0.2
0.4
0.6
0.8
1.0
1.2
1.4
1.6
35 44 5 56 46 54 49 55 47 40 36 3 48 2 25 45 53 38 34 58 50 52 18 33 4 51 24 14 43 37 1 12 39 22 23 20 21 42 13 29 8 7 11 26 10 57 9 32 27 16 41 6 19 28 17 15 31 30
Rel
ativ
e st
anda
rdis
ed e
ffort
Vessel number (ID)
efforS
5
sndteirmA
5
5
itTsgocses
v
i[
d
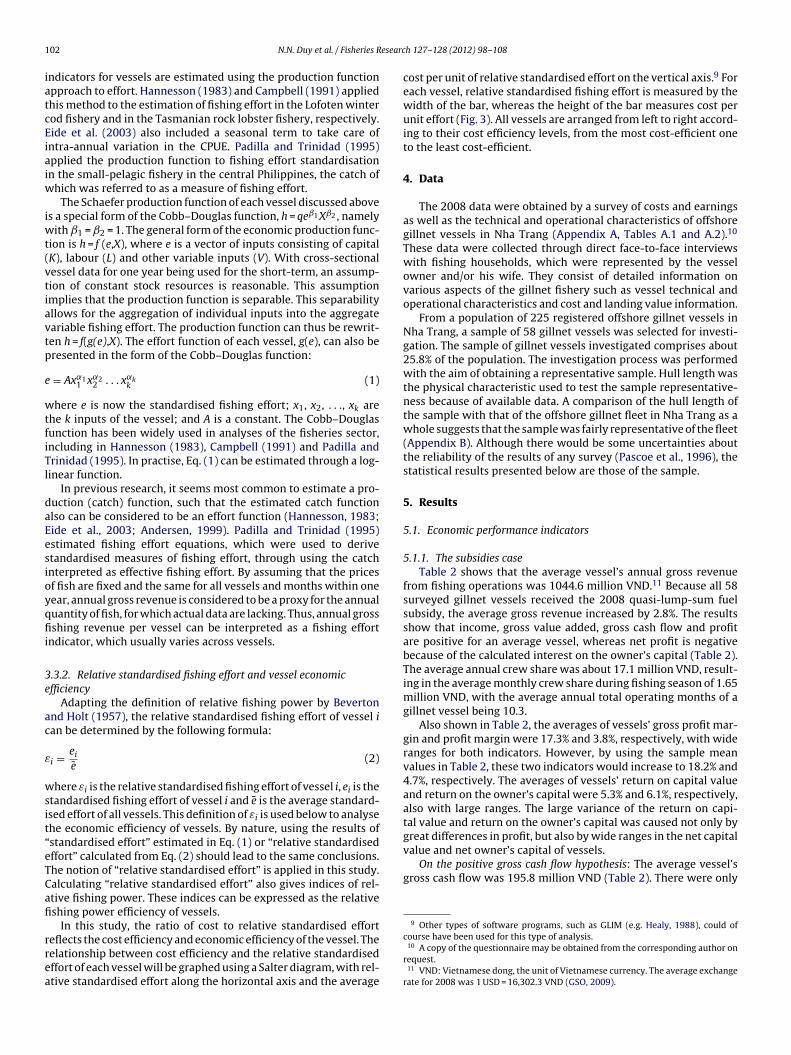
Fig. 2. The relative standardisedource: Own data.
.2.1. Relative standardised fishing effortFig. 2 shows that the minimum and maximum values of relative
tandardised effort are 0.46 and 1.45, with corresponding vesselumbers 35 and 30, respectively. Thus, the highest relative stan-ardised effort, thereby also fishing efficiency, is more than threeimes the lowest. There were 28 vessels with a relative standardisedffort of less than one, whereas 30 vessels had a relative standard-sed effort greater than one (Fig. 2). The majority of vessels withelative standardised effort indices above one had engines withore than 250 HP and 300 pieces of gillnets or more (Appendix, Tables A.1 and A.2).
.3. Economic efficiency of vessels
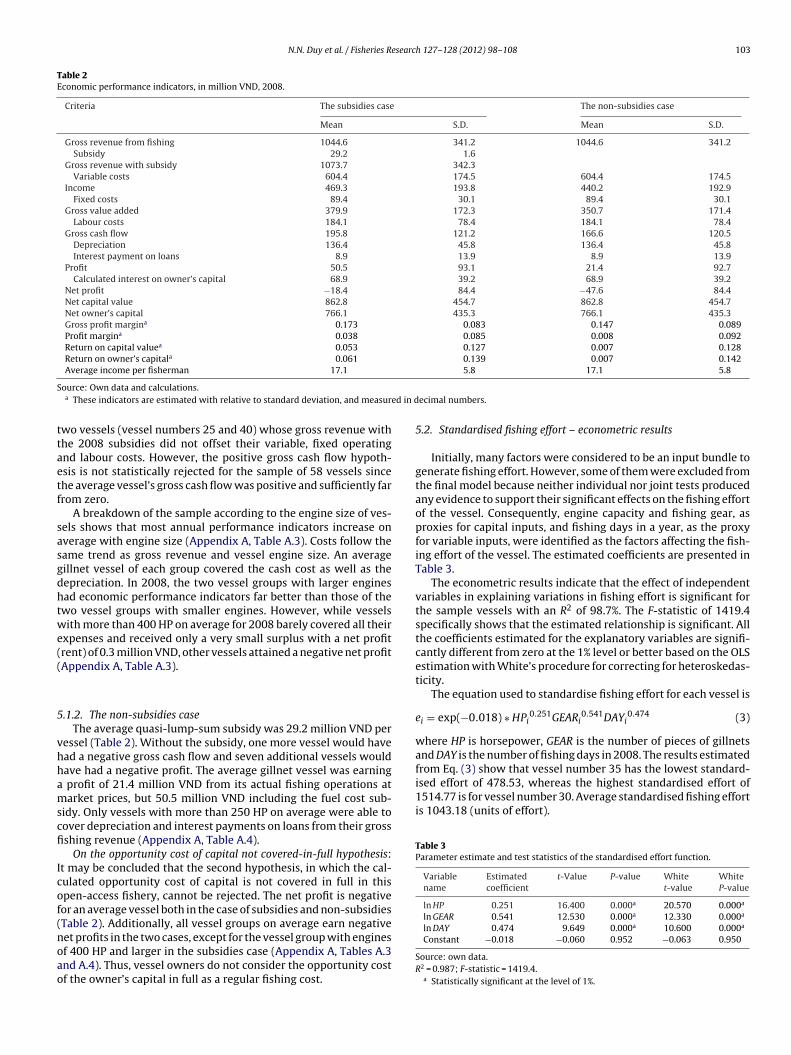
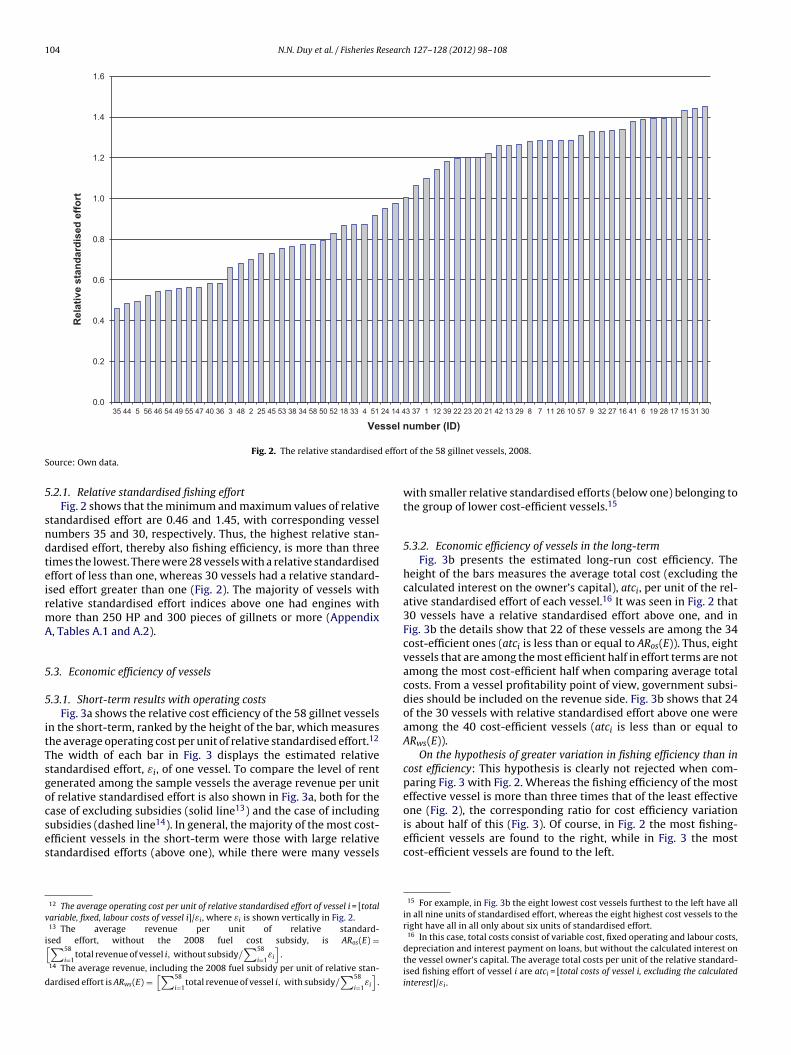
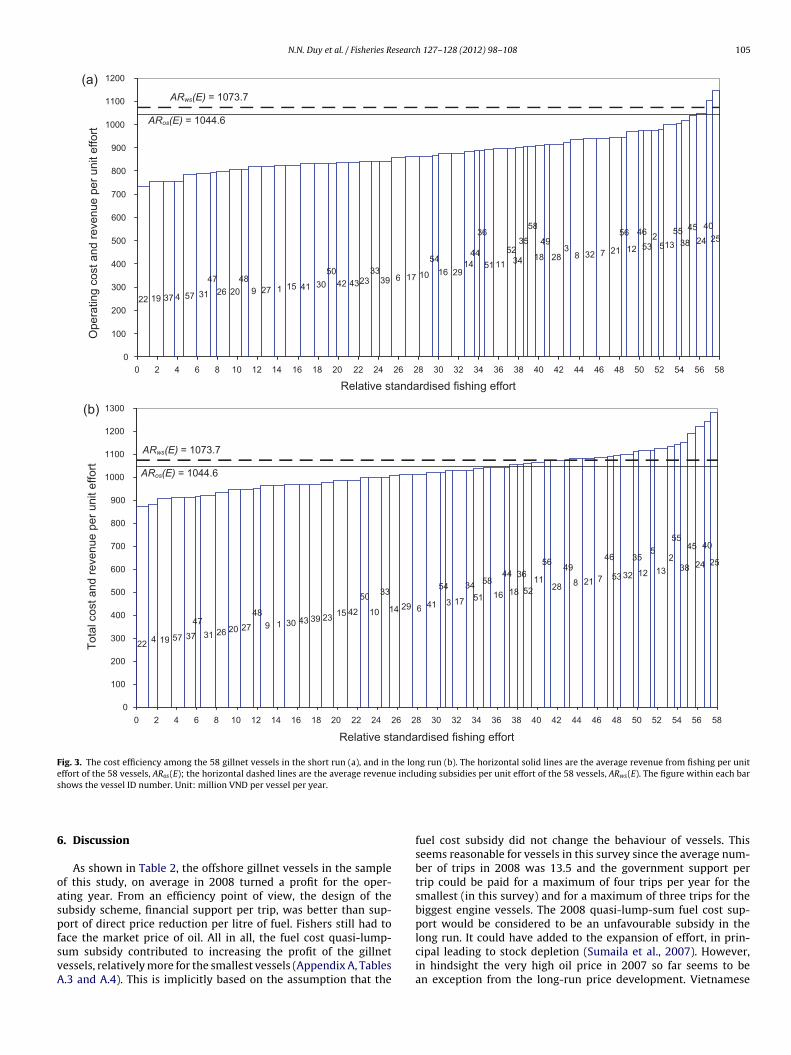
.3.1. Short-term results with operating costsFig. 3a shows the relative cost efficiency of the 58 gillnet vessels
n the short-term, ranked by the height of the bar, which measureshe average operating cost per unit of relative standardised effort.12
he width of each bar in Fig. 3 displays the estimated relativetandardised effort, εi, of one vessel. To compare the level of rentenerated among the sample vessels the average revenue per unitf relative standardised effort is also shown in Fig. 3a, both for thease of excluding subsidies (solid line13) and the case of including
ubsidies (dashed line14). In general, the majority of the most cost-fficient vessels in the short-term were those with large relativetandardised efforts (above one), while there were many vessels12 The average operating cost per unit of relative standardised effort of vessel i = [totalariable, fixed, labour costs of vessel i]/εi , where εi is shown vertically in Fig. 2.13 The average revenue per unit of relative standard-sed effort, without the 2008 fuel cost subsidy, is ARos(E) =∑58
i=1total revenue of vessel i, without subsidy/
∑58
i=1εi
].
14 The average revenue, including the 2008 fuel subsidy per unit of relative stan-
ardised effort is ARws(E) =[∑58
i=1total revenue of vessel i, with subsidy/
∑58
i=1εi
].
t of the 58 gillnet vessels, 2008.
with smaller relative standardised efforts (below one) belonging tothe group of lower cost-efficient vessels.15
5.3.2. Economic efficiency of vessels in the long-termFig. 3b presents the estimated long-run cost efficiency. The
height of the bars measures the average total cost (excluding thecalculated interest on the owner’s capital), atci, per unit of the rel-ative standardised effort of each vessel.16 It was seen in Fig. 2 that30 vessels have a relative standardised effort above one, and inFig. 3b the details show that 22 of these vessels are among the 34cost-efficient ones (atci is less than or equal to ARos(E)). Thus, eightvessels that are among the most efficient half in effort terms are notamong the most cost-efficient half when comparing average totalcosts. From a vessel profitability point of view, government subsi-dies should be included on the revenue side. Fig. 3b shows that 24of the 30 vessels with relative standardised effort above one wereamong the 40 cost-efficient vessels (atci is less than or equal toARws(E)).
On the hypothesis of greater variation in fishing efficiency than incost efficiency: This hypothesis is clearly not rejected when com-paring Fig. 3 with Fig. 2. Whereas the fishing efficiency of the mosteffective vessel is more than three times that of the least effectiveone (Fig. 2), the corresponding ratio for cost efficiency variation
is about half of this (Fig. 3). Of course, in Fig. 2 the most fishing-efficient vessels are found to the right, while in Fig. 3 the mostcost-efficient vessels are found to the left.15 For example, in Fig. 3b the eight lowest cost vessels furthest to the left have allin all nine units of standardised effort, whereas the eight highest cost vessels to theright have all in all only about six units of standardised effort.
16 In this case, total costs consist of variable cost, fixed operating and labour costs,depreciation and interest payment on loans, but without the calculated interest onthe vessel owner’s capital. The average total costs per unit of the relative standard-ised fishing effort of vessel i are atci = [total costs of vessel i, excluding the calculatedinterest]/εi .
N.N. Duy et al. / Fisheries Research 127– 128 (2012) 98– 108 105
948
202647
3157437192227 1 15 41 30
5042 4323
3339 6 17 10
5416 29
4414
36
51 1152
34
35
58
18
49
283
8 32 7
56
21 12
46
532
51355
38
4524
4025
0
100
200
300
400
500
600
700
800
900
1000
1100
1200
0 2 4 6 8 10 12 14 16 18 20 22 24 26 28 30 32 34 36 38 40 42 44 46 48 50 52 54 56 58
Relative standardised fishing effort
ARws(E) = 1073.7
ARos(E) = 1044.6
(a)
3
54
4162914
33
10
50
4215233943301948
2720263147
37571922 4
17
3451
5816
44 36
18 5211
56
28
49
8 21 7
46
53 32
35
12
5
132
5545
38 25
40
24
0
100
200
300
400
500
600
700
800
900
1000
1100
1200
1300
0 2 4 6 8 10 12 14 16 18 20 22 24 26 28 30 32 34 36 38 40 42 44 46 48 50 52 54 56 58
Relative standardised fishing effort
Tota
l cos
t and
reve
nue
per u
nit e
ffort
ARws(E) = 1073.7
ARos(E) = 1044.6
(b)
Ope
ratin
g co
st a
nd re
venu
e pe
r uni
t effo
rt
Fig. 3. The cost efficiency among the 58 gillnet vessels in the short run (a), and in the long run (b). The horizontal solid lines are the average revenue from fishing per uniteffort of the 58 vessels, ARos(E); the horizontal dashed lines are the average revenue including subsidies per unit effort of the 58 vessels, ARws(E). The figure within each bars
6
oaspfsvA
hows the vessel ID number. Unit: million VND per vessel per year.
. Discussion
As shown in Table 2, the offshore gillnet vessels in the samplef this study, on average in 2008 turned a profit for the oper-ting year. From an efficiency point of view, the design of theubsidy scheme, financial support per trip, was better than sup-ort of direct price reduction per litre of fuel. Fishers still had to
ace the market price of oil. All in all, the fuel cost quasi-lump-um subsidy contributed to increasing the profit of the gillnetessels, relatively more for the smallest vessels (Appendix A, Tables.3 and A.4). This is implicitly based on the assumption that thefuel cost subsidy did not change the behaviour of vessels. Thisseems reasonable for vessels in this survey since the average num-ber of trips in 2008 was 13.5 and the government support pertrip could be paid for a maximum of four trips per year for thesmallest (in this survey) and for a maximum of three trips for thebiggest engine vessels. The 2008 quasi-lump-sum fuel cost sup-port would be considered to be an unfavourable subsidy in the
long run. It could have added to the expansion of effort, in prin-cipal leading to stock depletion (Sumaila et al., 2007). However,in hindsight the very high oil price in 2007 so far seems to bean exception from the long-run price development. Vietnamese
1 esearc
py
ntrtaebtomame
Vla1woc2ofnfi
tvceirfpts
ndarmsmmise((aov
sHaiob
06 N.N. Duy et al. / Fisheries R
olicymakers decided to abolish the arrangement after only oneear.
In 2008, the larger engine vessels showed a better annual eco-omic performance than smaller engine vessels. There are mainlywo reasons for this. First, larger engine vessels have higher grossevenue (higher fishing efficiency and higher catches). Second,hey are on average more cost-efficient than smaller vessels. Inddition, the two groups of 250–400 HP and larger than 400 HParned the highest annual income for crew members. This is partlyecause of the overall longer fishing season of the bigger vesselshan the small ones. For the Nha Trang gillnet vessels surveyed, thewner–operator derived income from both being a skipper/crewember and from the profit as the vessel owner. Since the average
nnual profit indicator and crew income increase with HP, thereay be incentives for owner–operators to adopt technologies that
xpand fishing efficiency.The average annual income per crew member, 17.1 million
ND, is about 75% more than the 2008 average income of 9.8 mil-ion VND in the Khanh Hoa province (GSO of Khanh Hoa, 2008)nd about 43% higher than the 2008 national average income of1.9 million VND per capita (GSO, 2009). This also correspondsell with the findings reported for 2004 for offshore long-liners
f Khanh Hoa in Long et al. (2008) with 14.5 million VND perrew member, although CPI inflation was 55.4% from 2004 to008. This demonstrates that crew members may have earned theirpportunity cost of labour, or above, in 2008. However, withouturther investigation it is not possible to tell if lower crew remu-eration would still provide sufficient manpower for this offshoreshery.
Capital investment and operating expenses are relatively high inhis offshore fishery, and the risk of damaging and losing workers,essels and fishing gear is high. Gillnets often represent half of theapital invested and the risk of damage is quite large for this fish-ry because of the high density of various types of vessel activitiesn fishing grounds as well as difficult weather conditions and theemoteness of grounds. These risk factors are of course also validor vessels and crew, and they may result in serious outcomes. Inrinciple, risk-induced private costs, such as insurance, gear main-enance and replacement costs, are included in the costs of thistudy.
The short- and long-term ranking of the 58 gillnet vessels wereot very different. A large number of vessels with high relative stan-ardised effort (more than one) were the most effective, both from
fishing efficiency and from a cost efficiency point of view. As aesult, the large quasi-rent generated in the short-term and intra-arginal rent gained in the long-term were mostly earned by the
ame vessels.17 This result indicates that private fishing investorsay still find this fishery attractive in the near future. Either invest-ents in engine capacity and fishing gear or an additional increase
n fishing time may continue this growth. This seems to reflectomewhat the situation of Khanh Hoa’s fisheries since the totalngine power of the fishing fleet continued to increase in 2009DECAFIREP, 2009). Of the vessels surveyed, two gillnet vessels hadestimated) negative gross cash flows and 16 out of 58 (27.6%) oper-
ted at a loss (profit before the calculated opportunity cost of thewner’s capital) even after receiving the 2008 fuel subsidies. Theseessels may continue operations as long as the owners consider17 In practice, the differences in rent may arise from the differences in catch compo-ition. Mackerel species often bring higher revenue than tuna species in this fishery.owever, as mentioned above, the majority of Nha Trang’s offshore gillnet operatorsre tuna gillnet vessels, which were surveyed. The investigation found that, in fish-ng grounds of high sea waters, skipjack tuna is the major target species occupyingver 90% of the total catch and with little variation among vessels. Therefore, it maye appropriate to assume that the catch composition is the same for all vessels.
h 127– 128 (2012) 98– 108
capital costs as sunk. The loss may be perceived as arising from badluck or a poor year and not being expected to persist over time. Thelong-run resource effect of the expansion/contraction of capacity inthis vessel group is probably marginal since their resources mainlyare internationally open-access resources in the East Sea (SouthChina Sea).
The average return on the owner’s capital of 6.1% was less thanthe presumed opportunity cost rate of 9%. A large number of ves-sels made economic losses, after calculated capital costs, whereasa smaller number of vessels were generating intra-marginal rent.In general, the largest vessels (high HP) earned a higher rent thanthe smaller ones, but there are some exceptions. The exceptions,namely that some of the smaller vessels perform well, economi-cally speaking, are important when it comes to policymaking. It isnot always the case that “big is beautiful” and that the smaller ves-sels should be forced or bought out if the fishery is transformedfrom open access to management of some sort. It should also benoted that the average gillnet vessel’s economic loss, includingthe calculated interest on the owner’s capital, does not necessar-ily contradict the open-access fisheries theory with heterogeneousvessels since the results of this study are based on data for onlyone year. Moreover, the effects of the world economic crisis on thenational economy combined with 2007s peak oil prices may havecreated special economic problems for Vietnam as well as for otherdeveloping countries’ fisheries.
7. Conclusion
This study demonstrates that for offshore gillnet vessels theengine HP effect, the amount of gear and the days of operation arethe factors that best produce indicators of vessel efficiency. Rela-tive standardised effort was developed and estimated for surveyedvessels. To the best of our knowledge, this method for comparingvessel efficiency has not been published previously. The presentedeconomic analysis shows that an average gillnetter in 2008 earneda positive gross profit margin and profit margin, even when thequasi-lump-sum fuel subsidies are excluded. This is close to whatwas expected based on the discussion of the theory of open-accessfisheries. However, the average gillnet vessel would not have beenable to meet all the calculated interest on the owner’s capital aswell. The most economically efficient vessels are mainly, but notonly, those with high relative standardised effort. These vesselsearned most of the intra-marginal rent generated. The 2008 fuelsubsidies brought relatively more benefits for small-scale vesselsthan for large-scale ones. The results also demonstrate that onan annual basis, average crew income is almost the same as forthe workers with higher educational levels or technical/vocationaltraining working in the most profitable registered enterprises inKhanh Hoa, and on a monthly basis, it is even more.
The 2007 strong oil price increase sparked outcries in manycountries from frustrated fishers and other small businessesdepending on this input. Some governments reduced petroleum orclimate change taxes or other compensation schemes to mitigatethe income-reducing effects on oil-dependent businesses. This alsohappened in Vietnam with the introduction of quasi-lump-sum fuelcost support. As discussed in this paper, this arrangement had a sig-nificant positive effect on the net earnings of the surveyed gillnetvessels. However, the incentive for fishers to save costly fuel oilwas mainly retained, even though in the long run such a revenue-enhancing scheme would most likely have kept or added capacityto the fleet compared with the situation with no support. The actual
crude oil price decline during 2008 eliminated the arguments forfurther support scheme.The economic efficiency and performance of vessels in an open-access fishery have been investigated and it has been demonstrated
esearc
tvisttbgtansr
A
JmegSnpIM
A
fj
R
A
B
B
C
C
C
C
C
D
D
D
E
E
N.N. Duy et al. / Fisheries R
hat some vessels make good earnings. These are the intra-marginalessels in the heterogeneous fleets. This could imply that evenn equilibrium in an open-access fishery with heterogeneous ves-els, some of them may improve their economic performance byhe introduction of cost saving practices. It is important to notehat even in open-access fisheries many vessels may create netenefits to society as demonstrated in this paper. Before insti-ating costly management systems, a thorough consideration ofhe alternatives with their benefits and costs is a big challenge tony fishing nation, not least to a developing country such as Viet-am. How to govern and manage fisheries in a cost-efficient way istill an important question for governments, fishing industries andesearchers.
cknowledgements
The authors are grateful to the Associate Editor, Andre Punt, theournal Manager, Janani Shanmuga Sundaram, and three anony-
ous reviewers for providing valuable comments and advice onarlier manuscripts. We would also like to thank the Norwe-ian Embassy, Hanoi and Nha Trang University, through projectRV2701, for the partial funding of this research, and to the gill-et vessel owners for their cooperation and provision of data. Arevious version of this paper was presented at the International
nstitute of Fisheries Economics and Trade Conference 2010 inontpellier, France.
ppendices A and B. Supplementary data
Supplementary data associated with this article can beound, in the online version, at http://dx.doi.org/10.1016/.fishres.2012.04.008.
eferences
ndersen, J.L., 1999. Fishing effort: a review of the basic biological and economicapproaches. In: Paper from the XIth Annual Conference of the European Associ-ation of Fisheries Economists, 6th–10th April, 1999, Dublin.
oncoeur, J., Coglan, L., Gallic, B.L., Pascoe, S., 2000. On the (ir)relevance of ratesof return measures of economic performance to small boats. Fish. Res. 49,105–115.
everton, R.J.H., Holt, S.J., 1957. On the dynamics of exploited fish populations. Fish.Invest. Minist. Agric. Fish. Food Ser. Lond. 19, 533.
ampbell, H.F., 1991. Estimating the elasticity of substitution between restrictedand unrestricted inputs in a regulated fishery: a probit approach. Environ. Econ.Manage. 20, 262–274.
lark, C.W., Clarke, F.H., Munro, G.R., 1979. The optimal exploitation of renewableresource stocks: the problem of irreversible investment. Econometrica 47 (1),25–47.
lark, C.W., 1990. Mathematical Bioeconomics—the Optimal Management ofRenewable Resources, 2nd ed. Wiley, New York.
oglan, L., Pascoe, S., 1999. Separating resource rents from intra-marginalrents in Fisheries’ economic survey data. Agric. Resour. Econ. Rev. 28 (2),219–228.
opes, P., 1972. Factor rents, sole ownership and the optimum level of fisheriesexploitation. Manch. Sch. Soc. Econ. Stud. 40, 145–163.
ECAFIREP, 2009. The Annual Report of the Number of Vessels and Engine PowerRegistered in 2009. Khanh Hoa’s Department of Capture Fisheries and ResourcesProtection (DECAFIREP), Vietnam (in Vietnamese) http://www.kso.gov.vn.
ecision, 2008b. Decision 965/QD-TTg by Vietnam’s Prime Minister on July21, 2008, repairing and supplementing Decision 289/QD-TTg by Vietnam’sPrime Minister on March 18, 2008. Available at: http://www.chinhphu.vn/vanbanpq/lawdocs/QD965TTG.DOC?id=73996 (accessed 10.01.10) (in Viet-namese).
ecree, 2006. Decree no. 123/2006/ND-CP of Vietnam’s Prime Minister on October27, 2006, on management of aquatic resource exploitation by Vietnameseorganizations and individuals in sea areas. Available at: http://faolex.fao.org/docs/pdf/vie69865.pdf (accessed 06.05.10).
ide, A., Skjold, F., Olsen, F., Flaaten, O., 2003. Harvest functions: the Norwegianbottom trawl cod fisheries. Mar. Resour. Econ. 18, 81–93.
uropean Commission, 2004. Economic performance of selected European fishingfleets. Annual report 2004. Concerted action “Economic assessment of Europeanfisheries” (Q5CA-2001-01502), December 2004.
h 127– 128 (2012) 98– 108 107
FAO, 2004. Report of the national conference on responsible fisheries in Vietnam.FAO/FishCode Review No. 9, Food and Agricultural Organization of the UnitedNations, Rome, Italy.
FAO, 2005. Report of the conference on the national strategy for marine fisheriesmanagement and development in Vietnam. FAO/FishCode Review No. 16, Foodand Agricultural Organization of the United Nations, Rome, Italy.
FAO, 2009. Fisheries and Aquaculture Country Profiles—Vietnam. Foodand Agricultural Organization of the United Nations, Available at:http://www.fao.org/fishery/countrysector/FI-CP VN/en (accessed 06.05.10).
Flaaten, O., 2008. Fisheries development and management—some reflections onVietnam. In: The International Institute of Fisheries Economics and Trade (IIFET)2008 Proceedings, Nha Trang, Vietnam.
Flaaten, O., Heen, K., Salvanes, K.G., 1995. The invisible resource rent in limited entryand quota managed fisheries: the case of Norwegian purse seine fisheries. Mar.Resour. Econ. 10 (4), 341–356.
Flaaten, O., 2010. Fisheries Economics and Management. University ofTromso, Norway, Available at: http://www.ub.uit.no/munin/handle/10037/2509?language=en (accessed 16.03.11).
Gordon, H.S., 1954. The economic theory of a common property resource: the fishery.J. Polit. Econ. 62, 124–142.
GSO of Khanh Hoa, 2008. Khanh Hoa’s Statistical Yearbook 2008. General Statis-tics Office of Khanh Hoa, Vietnam (in Vietnamese) http://www.kso.gov.vn/news.php?chuyenmuc=10&demuc=38&tintuc=570&nam=2008 (accessed12.04.11).
GSO, 2008. Statistical Yearbook of Vietnam 2008. General StatisticsOffice of Vietnam. Statistical Publishing House, Vietnam, Available at:http://www.gso.gov.vn/default en.aspx?tabid=515&idmid=5&ItemID=9233(accessed 11.01.10).
GSO, 2009. Statistical Handbook of Vietnam 2009. General StatisticsOffice of Vietnam. Statistical Publishing House, Vietnam, Available at:http://www.gso.gov.vn/default en.aspx?tabid=515&idmid=5&ItemID=9233(accessed 24.04.10).
Hannesson, R., 1983. Bioeconomic production function in fisheries: theoretical andempirical analysis. Can. J. Fish. Aquat. Sci. 40, 968–982.
Hardin, G., 1968. The tragedy of the commons. Science 162, 1243–1248.Healy, M.J.R., 1988. GLIM: an Introduction. Clarendon Press, Oxford.IMF, 2009. World Economic Outlook Database, October 2009 Edition. Inter-
national Monetary Fund, Available at: http://www.imf.org/external/pubs/ft/weo/2009/02/weodata/weorept.aspx?sy=1980&ey=2009&ssm=1&scsm=1&ssd=1&sort=country&ds=.&br=1&pr1.x=27&pr1.y=13&c=582&s=PCPIPCH&grp=0&a (accessed 24.03.10).
Kim Anh, N.T., Flaaten, O., Tuan, N., Dung, P.T., Tram Anh, N.T., 2006. A study on costsand earnings of gillnet vessels in Nha Trang, Vietnam. In: The International Insti-tute of Fisheries Economics and Trade (IIFET) 2006 Proceedings, Portsmouth,England.
King, M., 1995. Chapter 2: fishing gear and methods. In: King, M. (Ed.), FisheriesBiology, Assessment and Management. Fishing News Books. Blackwell Science,Osney Mead, Oxford, England, pp. 65–78.
Le Floc’h, P., Daurès, F., Brigaudeau, C., Bihel, J., 2008. A comparison of economicperformance in the fisheries sector: a short- and long-term perspective. Mar.Policy 32, 421–431.
Long, L.K., Flaaten, O., Kim Anh, N.T., 2008. Economic performance of open accessoffshore fisheries–the case of Vietnamese longliners in the South China Sea. Fish.Res. 93, 296–304.
Munro, G.R., Scott, A.D., 1985. The economics of fisheries manage-ment. In: Kneese, A.V., Sweeney, J.L. (Eds.), Handbook of NaturalResource and Energy Economics, vol. II. North-Holland, Amsterdam,pp. 623–676.
Padilla, J.E., Trinidad, A.C., 1995. An application of production theory to fishing effortstandardization in the small-pelagics fishery in central Philippines. Fish. Res. 22,137–153.
Pascoe, S., Robison, C., Coglan, L., 1996. Economic and Financial Performance ofthe UK English Channel Fleet. CEMARE research report No. 44. Centre for theEconomics and Management of Aquatic Resources (CEMARE), University ofPortsmouth, United Kingdom, p. 55.
Pomeroy, R., Kim Anh, N.T., Thong, H.X., 2009. Small-scale fisheries policy in Vietnam.Mar. Policy 33, 419–428.
Raakjaer, J., Son, D.M., Staehr, K.J., Hovgaard, H., Thuy, N.T.D., Ellegaard, K.,Riget, F., Thi, D.V., Hai, P.G., 2007. Adaptive fisheries management in Viet-nam: the use of indicators and the introduction of a multi-disciplinaryMarine Fisheries Specialist Team to support implementation. Mar. Policy 31,143–152.
RIMF. The Webpage of Research Institute for Marine Fisheries, Vietnam. Avail-able at: http://rimf.org.vn/DuBao/2008/SW/Nghe/B200/2008 SW B200 All.jpg(accessed 16.03.11).
SBV, 2008. Annual Report 2008. The State Bank of Vietnam (SBV). Available at:http://www.sbv.gov.vn/wps/wcm/connect/c977740043637a419dffddad7097747d/2008.pdf?MOD=AJPERES&CACHEID=c977740043637a419dffddad7097747d(accessed 21.06.11).
SBV, 2009. Annual Report 2009. The State Bank of Vietnam (SBV). Available at:http://www.sbv.gov.vn/wps/wcm/connect/72088080454da866adfaafbc907cae
b6/2009.pdf?MOD=AJPERES&CACHEID=72088080454da866adfaafbc907caeb6(accessed 21.06.11).Sumaila, U.R., Khan, A., Watson, R., Munro, G., Zeller, D., Baron, N., Pauly, D., 2007.The World Trade Organization and global fisheries sustainability. Fish. Res. 88,1–4.
1 esearc
W
W
08 N.N. Duy et al. / Fisheries R
allis, P., Flaaten, O., 2003. Fisheries management costs—concepts and studies. In:Schrank, W.E., Arnason, R., Hannesson, R. (Eds.), The Cost of Fisheries Manage-
ment. Ashgate, Hants, pp. 211–223.hitmarsh, D., James, C., Pickering, H., Neiland, A.E., 2000. The prof-itability of marine commercial fisheries: a review of economicinformation needs with particular reference to the UK. Mar. Policy 24,257–263.
h 127– 128 (2012) 98– 108
Further reading
Decision, 2008a. Decision 289/QD-TTg by Vietnam’s Prime Minister on March 18,2008, on issuing some policy supporting for ethnic minority people, poor peo-ple and fishermen. Available at: http://www.cpv.org.vn/cpv/Modules/News/NewsDetail.aspx?co id=30340&cn id=29300# (accessed 10.01.10) (in Viet-namese).
1
Appendix A.
Technical and operational characteristics and economic performance among vessel groups
Table A.1:
Technical and operational characteristics of the surveyed vessels, 2008
Criteria N Mean Min Max S.D.
Engine (HP)
Length (m)
Age of vessel (years)
Gear a
Total operating months (months)
Number of trips fished (trips)
Number of days fished (days)
Fuel consumption (1000 litres)
Crews (persons)b
58
58
58
58
58
58
58
58
58
249.6
16.4
8.7
267.7
10.3
13.5
231.2
31.9
10.5
50.0
13.5
2.0
150.0
7.0
7.0
140.0
11.0
8.0
630.0
20.1
21.0
350.0
12.0
33.0
288.0
55.0
12.0
149.3
1.6
5.2
63.6
1.1
5.4
28.6
11.8
1.4
Notes: All parameters are per vessel.
a “Gear” indicates the average number of pieces of gillnets.
b Crew size includes captain.
Source: own data and calculations
2
Table A.2:
Technical and operational characteristics of the surveyed vessels by ranges of engine, 2008
Criteria
Range of engine power
50<=HP<90
(N=12)
90<=HP<250
(N=16)
250<=HP<400
(N=19)
HP > = 400
(N=11)
Mean SD Mean SD Mean SD Mean SD
Engine (HP)
Length (m)
Age of vessel (years)
Gear a
Total operating months (months)
Number of trips fished (trips)
Number of days fished (days)
Fuel consumption (1000 litres)
Crews (persons)b
64.6
14.7
14.2
184.3
9.8
21.0
212.7
17.3
8.6
12.0
0.7
3.4
29.0
1.2
5.7
32.4
4.5
0.7
148.4
15.5
10.0
240.3
10.0
12.6
219.6
26.9
9.9
54.7
0.9
4.6
46.6
1.2
4.5
20.5
7.9
0.8
333.9
17.2
7.0
307.5
10.6
11.2
240.5
37.8
11.3
33.3
1.0
4.2
31.4
1.0
2.3
27.5
7.1
0.8
452.7
18.2
3.8
330.1
10.7
10.7
252.4
45.1
11.9
63.7
0.7
3.3
15.3
0.5
0.5
15.7
6.5
0.3
Notes: All parameters are per vessel.
a “Gear” indicates the average number of pieces of gillnets.
b Crew size includes captain.
Source: own data and calculations
3
Table A.3:
Economic performance indicators among vessel groups, including the 2008 fuel subsidies, in million VND
Criteria
Range of engine power
50 < = HP < 90
(N = 12)
90 < = HP < 250
(N = 16)
250 < = HP < 400
(N = 19)
HP > = 400
(N = 11)
Mean SD Mean SD Mean SD Mean SD
Gross revenue from fishing
Subsidy
Gross revenue with subsidy
Variable costs
Income
Fixed costs
Gross value added
Labour costs
Gross cash flow
Depreciation
Interest payment on loans
Profit
Calculated interest on
owner’s capital
Net profit
Net capital value
Net owner’s capital
Gross profit margina
Profit margina
Return on capital valuea
Return on owner’s capitala
Average income per
fisherman
594.2
26.0
620.2
366.3
253.8
58.1
195.7
105.7
90.0
75.7
4.4
9.9
27.8
-17.9
344.5
308.5
0.145
0.015
0.046
0.046
12.2
75.6
0.0
75.6
50.5
50.8
10.3
49.7
41.9
59.7
12.0
5.4
62.6
7.3
65.1
108.1
81.6
0.088
0.095
0.178
0.185
4.2
848.1
30.0
878.1
531.3
346.8
71.9
274.9
141.4
133.5
111.8
5.3
16.4
48.4
-32.0
633.0
537.5
0.145
0.011
0.021
0.031
14.2
168.3
0.0
168.3
101.8
137.0
23.6
125.6
40.2
110.1
22.0
10.2
100.9
18.8
97.6
185.7
209.1
0.101
0.103
0.152
0.169
3.7
1,249.7
30.0
1,279.7
714.7
565.1
110.6
454.5
216.7
237.7
162.9
8.6
66.2
84.4
-18.2
1,024.6
937.7
0.187
0.053
0.068
0.077
19.2
125.1
0.0
125.1
97.7
81.6
20.9
78.8
57.2
88.0
19.6
13.7
92.8
29.4
94.8
274.1
326.5
0.069
0.072
0.096
0.113
4.8
1,467.3
30.0
1,497.3
780.0
717.3
112.4
604.9
275.4
329.5
192.3
19.8
117.4
117.1
0.3
1,483.1
1,301.3
0.219
0.078
0.081
0.093
23.1
70.9
0.0
70.9
67.0
79.9
17.9
83.7
57.6
71.2
14.8
19.8
71.2
29.7
69.3
314.2
330.4
0.043
0.046
0.052
0.063
4.6
a These indicators are estimated with relative to standard deviation, and measured in decimal numbers.
Source: Own data and calculations.
4
Table A.4:
Key economic performance indicators among vessel groups, excluding the 2008 subsidies, in million VND
Criteria
Range of engine power
50 < = HP < 90
(N = 12)
90 < = HP < 250
(N = 16)
250 < = HP < 400
(N = 19)
HP > = 400
(N = 11)
Mean SD Mean SD Mean SD Mean SD
Gross revenue from fishing
Income
Gross value added
Gross cash flow
Profit
Net profit
Gross profit margina
Profit margina
Return on capital valuea
Return on owner’s capitala
594.2
227.8
169.7
64.0
-16.1
-43.9
0.107
-0.029
-0.036
-0.044
75.6
50.8
49.7
59.7
62.6
65.1
0.092
0.099
0.170
0.179
848.1
316.8
244.9
103.5
-13.6
-62.0
0.114
-0.025
-0.033
-0.036
168.3
137.0
125.6
110.1
100.9
97.6
0.107
0.109
0.150
0.165
1,249.7
535.1
424.5
207.7
36.2
-48.2
0.167
0.030
0.037
0.040
125.1
81.6
78.8
88.0
92.8
94.8
0.070
0.073
0.095
0.111
1,467.3
687.3
574.9
299.5
87.4
-29.7
0.203
0.059
0.060
0.068
70.9
79.9
83.7
71.2
71.2
69.3
0.044
0.047
0.050
0.062
a These indicators are estimated with relative to standard deviation, and measured in decimal numbers.
Source: Own data and calculations.
5
Appendix B.
Sample representativeness
Table B.1:
Sample representativeness test
Variable N Sample mean S.D. Mean of the
population
t-test
statistic
P-value
Hull length (m) 58 16.426 1.550 16.140 1.413 0.163.


