Embed Size (px)
Citation preview
OPERATIONAL GREENHOUSE GAS EMISSIONS OF PUBLIC TRANSPORTATION
IN THE ETHEKWINI MUNICIPALITY
Alison Gopaul
Submitted in fulfilment of the Master of Science in Engineering Degree,
College of Agriculture, Engineering and Science,
University of KwaZulu-Natal
June 2015
Supervisor: Dr. E. Friedrich
Co-supervisor: Prof. D.D. Stretch
Declaration
ii
DECLARATION
I, ……………………………………….………………………., declare that
1. The research reported in this thesis, except where otherwise indicated, is my original
research.
2. This thesis has not been submitted for any degree or examination at any other
university.
3. This thesis does not contain other persons’ data, pictures, graphs or other information,
unless specifically acknowledged as being sourced from other persons.
4. This thesis does not contain other persons' writing, unless specifically acknowledged
as being sourced from other researchers. Where other written sources have been
quoted, then:
a. Their words have been re-written but the general information attributed to them has
been referenced
b. Where their exact words have been used, then their writing has been placed in italics
and inside quotation marks, and referenced.
5. This thesis does not contain text, graphics or tables copied and pasted from the
Internet, unless specifically acknowledged, and the source being detailed in the thesis
and in the References sections.
Signed
………………………………………………………………………………
As the candidate’s Supervisor I agree/do not agree to the submission of this thesis.
Signed
………………………………………………………………………………
Acknowledgements
iii
ACKNOWLEDGEMENTS
I would like to express my most sincere appreciation to the following people, without whom
this dissertation would not have been a success:
The one true God, with whom all things are possible;
Dr E. Friedrich, for her, professional guidance, unwavering commitment and support
as my supervisor;
My family and friends, for their continuous encouragement, patience and
understanding of my absence throughout this study;
Prof D.D. Stretch, for his dedication and time as my co-supervisor; and
The eThekwini Transport Authority, Transport for Cape Town, Metrorail division of
PRASA, Gibela Rail Consortium and Piotrans for assisting with required data.
Abstract
iv
ABSTRACT
The transport sector is responsible for the production of approximately 23% of worldwide
greenhouse gas (GHG) emissions, highlighting the responsibility and opportunity for efficient
mobility. Sustainable measures must be adopted for GHG emission mitigation, as an attempt
to reduce the effects of climate change. The lack of formal and reliable public transport (PT)
systems in South Africa has prompted the proposal of integrated rapid public transport
networks (IRPTNs) for implementation in 12 South African metropolitan municipalities,
including the eThekwini Municipal Area (EMA). The aim is the provision of evolutionary PT
systems that are accessible, affordable and safe, and will ultimately attract more users and
induce a modal shift to minimise congestion on the road network.
Motivated by the shortage of carbon emission studies and scenario analyses in the transport
sector, this study serves as a benchmark for the GO!Durban system – the IRPTN planned
for the EMA. The integrated system is planned to be fully operational by 2027. The baseline
carbon emissions of the Business-As-Usual (BAU) Scenario were compared with the ex-
ante carbon emissions of the GO!Durban system in the year 2030, for several vehicle
technology options.
Results showed that the implementation of GO!Durban, will decrease GHG emissions of the
PT sector of the EMA by 54% to 60% in 2030. The results were partially validated by the
monitored carbon credits study conducted on the Rea Vaya BRT in the City of
Johannesburg, which achieved a 69% decrease in GHG emissions. This is indicates the
achievable success of GO!Durban on a significantly larger scale. The procurement of
efficient vehicle technology is the key factor. The X’Trapolis Mega rolling stock with a
regenerative braking system, is currently in manufacture for the GO!Durban system and
latest European Emission Standard V buses are recommended for operation along bus
routes. Further studies are advised, including investigating the cumulative emission
reductions during implementation of GO!Durban, and incrementalism as an alternative way
forward.
Abbreviations
v
ABBREVIATIONS
BRT – bus rapid transit
CF – carbon footprint
CO2 – carbon dioxide
CO2e – carbon dioxide equivalents
EMA – eThekwini Municipal Area
ETA – eThekwini Transport Authority
GHG – greenhouse gas
IRPTN – integrated rapid public transport network
DoT – Department of Transport
NMT – non-motorised transport
NLTA – National Land Transport Act
POV – privately-owned vehicle
PRASA – Passenger Rail Agency of South Africa
PT – public transport
PTAP – Public Transport Action Plan
ROW – Right of way
RRT – rail rapid transit
TRP – Taxi Recapitalisation Plan
List of Figures
vi
LIST OF FIGURES
Figure 2-1: The Natural Greenhouse Effect (Le Treut et al., 2007) ..................................... 7
Figure 2-2: Global Temperature Increases from 2090-2099 (IPCC, 2007) .......................... 8
Figure 2-3: Projected South African Emissions (Scenario Building Team, 2007) .............. 13
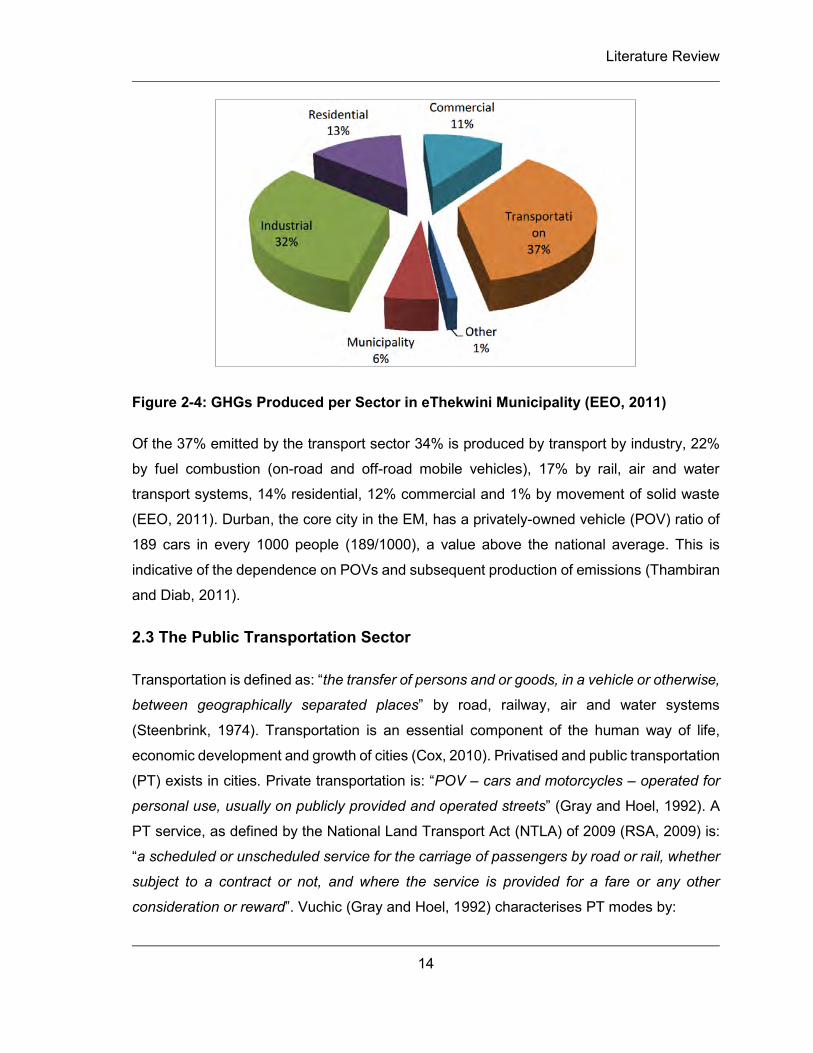
Figure 2-4: GHGs Produced per Sector in eThekwini Municipality (EEO, 2011) ............... 14
Figure 2-5: Average Daily Vehicular Emissions in 2002 (US EPA, 2004) ......................... 18
Figure 2-6: Factors influencing Vehicle Emissions (URS NZL, 2008) ............................... 19
Figure 2-7: BRT Trunk Line with Feeders (Gray and Hoel, 1992) ..................................... 24
Figure 2-8: Rea Vaya BRT Station (City of Johannesburg, 2013) ..................................... 30
Figure 2-9: MyCiTi BRT Lane (CCT, 2013) ...................................................................... 32
Figure 2-10: MyCiTi Bicycle Path (Transport for Cape Town, 2013) ................................. 33
Figure 2-11: Visual Impression of RRT (RLM, 2015) ........................................................ 35
Figure 2-12: Leapfrogging and the Incremental Approach (Hitge and van Dijk, 2012) ...... 37
Figure 3-1: Municipalities of KwaZulu-Natal (EM, 2014b) ................................................. 42
Figure 3-2: Major Industrial Nodes (Barker, 2011) ............................................................ 43
Figure 3-3: PT in West Street in 1898 (Jackson, 2003) .................................................... 44
Figure 3-4: Existing PT Services and Nodes (ETA, 2005) ................................................ 48
Figure 3-5: The Metrorail Network in eThekwini Municipality (EM, 2014b) ........................ 49
Figure 3-6: Metrorail Routes (Bhotha, 2013)..................................................................... 50
Figure 3-7: Metrorail Train (PRASA, 2007) ....................................................................... 51
List of Figures
vii
Figure 3-8: Addition of 24 New Scania Buses to subsidised fleet (Masikane and Mkhize,
2012) ................................................................................................................................ 52
Figure 3-9: People Mover Bus (Schilz, 2013) ................................................................... 52
Figure 3-10: Toyota Siyaya .............................................................................................. 53
Figure 3-11: Overview of Trunk, Feeder and Complementary Routes (Barker, 2011) ....... 56
Figure 3-12: Trunk Routes of the nine corridors of GO!Durban (EM, 2014b) .................... 58
Figure 3-13: Visual Impression of the Bridge City Terminal (Barker, 2011) ....................... 60
Figure 3-14: General cross-section of BRT lanes for GO!Durban (GOBA Consulting et al.,
2012a) .............................................................................................................................. 61
Figure 3-15: Conceptual Design of BRT Station for GO!Durban (Barker, 2011) ............... 61
Figure 3-16: PRASA New Generation Rolling Stock (Barker, 2013) ................................. 62
Figure 3-17: NMT components of GO!Durban (EM, 2014b) .............................................. 63
Figure 4-1: Research Framework for Emme (Alvinsyah and Zulkati, 2005) ...................... 70
Figure 4-2: PT Passenger Travel Trend results from HTS 2008 ....................................... 80
Figure 4-3: Conversion Factors for Annual EMME/2 Outputs ........................................... 81
Figure 5-1: Passengers Boarding PT modes in 2008 for Conversion Factors ................... 89
Figure 5-2: Comparison of 2008 EMME/2 and HTS Results ............................................. 90
Figure 5-3: Projections of annual passengers boarding PT modes up to 2030 for the BAU
Scenario ........................................................................................................................... 92
Figure 5-4: AM Peak Hour Vehicle Projections for the BAU Scenario (ETA, 2012b) ......... 93
Figure 5-5: Projected Total Trip Distances per Vehicle Category for the BAU Scenario ... 94
Figure 5-6: Projected Passenger-km per Vehicle Category for the BAU Scenario ............ 95
List of Figures
viii
Figure 5-7: Annual Passengers Projected for GO!Durban in 2030 .................................... 97
Figure 5-8: AM Peak Hour Vehicle Projections for GO!Durban (ETA, 2012b) ................... 98
Figure 5-9: Annual Distance Travelled per Vehicle Category for the GO!Durban Scenario
......................................................................................................................................... 99
Figure 5-10: 2030 Passenger-kilometres per Vehicle Category for the GO!Durban Scenario
....................................................................................................................................... 100
Figure 6-1: Total Emissions for Option 1 of the BAU Scenario ....................................... 103
Figure 6-2: Total Emissions for Option 2 of the BAU Scenario ....................................... 104
Figure 6-3: Total Emissions for Option 3 of the BAU Scenario ....................................... 105
Figure 6-4: Total Emissions Comparison for all Options of the BAU Scenario ................ 107
Figure 6-5: Emission Split per Vehicle Category for all Options of the BAU Scenario ..... 108
Figure 6-6: 2030 Emissions per Vehicle Category for Option 1 of the GO!Durban Scenario
....................................................................................................................................... 110
Figure 6-7: 2030 Emissions per Vehicle Category for Option 2 of the GO!Durban Scenario
....................................................................................................................................... 111
Figure 6-8: 2030 Emissions per Vehicle Category for Option 3 of the GO!Durban Scenario
....................................................................................................................................... 112
Figure 6-9: 2030 Emissions Comparison for all Options of the GO!Durban Scenario ..... 113
Figure 6-10: Vehicle Emissions Scenario Comparison for Option 1 ................................ 115
Figure 6-11: 2030 Emission Scenario Comparison per Vehicle Category for Option 1 ... 116
Figure 6-12: Vehicle Emissions Scenario Comparison for Option 2 ................................ 117
Figure 6-13: 2030 Emission Scenario Comparison per Vehicle Category for Option 2 ... 118
List of Figures
ix
Figure 6-14: Vehicle Emissions Scenario Comparison for Option 3 ................................ 119
Figure 6-15: 2030 Emission Scenario Comparison per Vehicle Category for Option 3 ... 120
Figure 6-16: 2030 Estimated Emission Reductions for all Options .................................. 121
Figure 6-17: Emissions Profile for the Phasing-in of GO!Durban and Phasing-out of existing
PT services .................................................................................................................... 123
Figure 6-18: Overview of Total Emissions of the PT Sector during the shift to GO!Durban
....................................................................................................................................... 124
Figure 6-19: Sensitivity to Distance Driven by BAU and GO!Durban Scenario Vehicles..126
List of Tables
x
LIST OF TABLES
Table 2-1: Example of Global Warming Potentials (adopted from IPCC, 2007) .................. 6
Table 2-2: CO2 Emissions for Light-Duty Vehicles (EC, 2015a) ........................................ 11
Table 2-3: Euro Emission Standards for Heavy-Duty Vehicles (Lindqvist, 2012) .............. 12
Table 2-4: Modal split before and after the implementation of TransMilenio (Nair & Kumar,
2005) ................................................................................................................................ 23
Table 2-5: The Incremental Development of Rede Integrada de Transporte in Curitiba (Tufts
University, 2015) .............................................................................................................. 38
Table 3-1: Anticipated operational year of GO!Durban Phases (EM, 2014b) .................... 58
Table 4-1: Progress of TRP in KwaZulu-Natal (TSA, 2009) .............................................. 73
Table 4-2: Fuel Consumption Factors and Sources for Existing PT System ..................... 76
Table 4-3: Fuel Consumption Factors and Sources for GO!Durban .................................. 77
Table 4-4: Default Emission Factors (in grams per litre) (CDM, 2011) .............................. 78
Table 4-5: Assumptions for each option of the BAU Scenario .......................................... 83
Table 4-6: Assumptions for each option of GO!Durban .................................................... 84
Table 6-1: 2030 Emissions per Vehicle Category for the GO!Durban Scenario .............. 114
Table 6-2: Sensitivity to 5% and 10% variance in fuel consumption parameters for the BAU
Scenario ......................................................................................................................... 125
Table 6-3: Sensitivity to 5% and 10% variance in fuel consumption parameters for the
GO!Durban Scenario ...................................................................................................... 125
Contents
xi
CONTENTS
DECLARATION .................................................................................................................. ii
ACKNOWLEDGEMENTS .................................................................................................. iii
ABSTRACT ....................................................................................................................... iv
ABBREVIATIONS .............................................................................................................. v
LIST OF FIGURES ............................................................................................................ vi
LIST OF TABLES ............................................................................................................... x
.......................................................................................... 1
1.1 Background – climate change and development of the transportation sector ............ 1
1.2 Motivation ................................................................................................................. 1
1.3 Research Question ................................................................................................... 2
1.4 Aims and Objectives ................................................................................................. 2
1.5 Structure of Report.................................................................................................... 3
................................................................................ 5
2.1 Introduction ............................................................................................................... 5
2.2 Climate Change and Transportation ......................................................................... 5
2.2.1 Definitions and Basic Concepts .......................................................................... 5
2.2.2 Overall and Local Effects of Climate Change ..................................................... 8
2.2.3 Carbon Footprint ................................................................................................ 9
2.2.4 Air Emissions from Transportation .................................................................... 10
Contents
xii
2.2.5 Global GHG Emissions ..................................................................................... 12
2.3 The Public Transportation Sector ............................................................................ 14
2.3.1 Vehicle Fuel Technology .................................................................................. 15
2.3.2 Vehicle Emissions ............................................................................................ 17
2.3.3 Integrated Rapid Public Transport Networks (IRPTNs) ..................................... 19
2.3.4 World-renowned Success of BRT Systems ...................................................... 21
2.3.5 Advantages and Disadvantages of IRPTNs ...................................................... 23
2.4 International Case Studies of PT and Associated Emissions .................................. 25
2.4.1 Metrobus, Mexico City ...................................................................................... 25
2.4.2 Quality Bus Corridor, Dublin ............................................................................. 26
2.4.3 Vehicle Technology .......................................................................................... 26
2.4.4 Summary .......................................................................................................... 27
2.5 IRPTN as a Solution in South Africa ....................................................................... 28
2.5.1 South African IRPTNs ...................................................................................... 29
2.5.2 Problems experienced with South African IRPTNs ........................................... 35
2.5.3 Leapfrogging vs. the Incremental Approach ..................................................... 36
2.6 Increasing PT Ridership .......................................................................................... 39
2.7 Gaps in Knowledge and Research on IRPTNs and GHG Emissions ....................... 40
2.8 Summary ................................................................................................................ 41
............................................................................................ 42
Contents
xiii
3.1 The Current PT System .......................................................................................... 42
3.1.1 The eThekwini Municipality............................................................................... 42
3.1.2 History of PT in the eThekwini Municipality ....................................................... 44
3.1.3 Overview of the Existing Local PT System ....................................................... 47
3.1.4 Challenges in the Local PT Sector .................................................................... 54
3.2 GO!Durban ............................................................................................................. 55
3.2.1 Objectives of GO!Durban ................................................................................. 55
3.2.2 Overview of the Network .................................................................................. 56
3.2.3 Trunk Routes .................................................................................................... 57
3.2.4 Phases of Implementation ................................................................................ 58
3.2.5 Phase One of GO!Durban ................................................................................ 59
3.3 Summary ................................................................................................................ 64
....................................................................................... 65
4.1 Introduction ............................................................................................................. 65
4.2 Approach Evaluation ............................................................................................... 65
4.2.1 Theoretical Approach ....................................................................................... 65
4.2.2 Case Study Approach ....................................................................................... 66
4.3 Scope of study ........................................................................................................ 68
4.4 Data Collection ....................................................................................................... 69
4.4.1 INRO EMME/2 Transportation Forecasting Software ........................................ 69
Contents
xiv
4.4.2 Existing PT System .......................................................................................... 72
4.4.3 The GO!Durban System ................................................................................... 74
4.4.4 List of Emission and Energy Consumption Factors ........................................... 75
4.5 Data Analysis .......................................................................................................... 79
4.5.1 Conversion of AM Peak Hour Data to Annual Outputs ...................................... 79
4.5.2 CO2e Emissions Comparison ........................................................................... 82
4.5.3 Sensitivity Analysis ........................................................................................... 85
4.5.4 Limitations and Uncertainties ............................................................................ 85
4.6 Summary ................................................................................................................ 87
............................................. 89
5.1 Introduction ............................................................................................................. 89
5.2 The EMME/2 2008 Base-Year Model ...................................................................... 89
5.3 PT Sector Projections for eThekwini Municipality .................................................... 91
5.3.1 Existing PT System Scenario ........................................................................... 91
5.3.2 The GO!Durban Scenario ................................................................................. 96
5.4 Summary .............................................................................................................. 101
................................................................. 102
6.1 Introduction ........................................................................................................... 102
6.2 BAU Scenario ....................................................................................................... 102
6.2.1 Option 1.......................................................................................................... 102
Contents
xv
6.2.2 Option 2.......................................................................................................... 104
6.2.3 Option 3.......................................................................................................... 105
6.2.4 Emissions Comparison ................................................................................... 106
6.3 GO!Durban Scenario ............................................................................................ 109
6.3.1 Option 1.......................................................................................................... 110
6.3.2 Option 2.......................................................................................................... 111
6.3.3 Option 3.......................................................................................................... 112
6.3.4 Emissions Comparison ................................................................................... 113
6.4 Comparison of BAU and GO!Durban Scenarios .................................................... 115
6.4.1 Option 1.......................................................................................................... 115
6.4.2 Option 2.......................................................................................................... 117
6.4.3 Option 3.......................................................................................................... 119
6.4.4 Scenario Comparison ..................................................................................... 121
6.5 Sensitivity Analysis ............................................................................................... 124
6.6 Comparison with Rea Vaya Carbon Credits Study ................................................ 126
6.7 Summary .............................................................................................................. 127
......................................................................................... 130
REFERENCES ............................................................................................................... 132
APPENDIX A: NRCS TAXI RECAPTIALISATION PROGRAMME LIST ........................... A
APPENDIX B: SAMPLE CO2e EMISSION CALCULATION…………………………………...B
Introduction
1
CHAPTER 1
INTRODUCTION
1.1 Background – climate change and development of the transportation sector
Global climate change is caused by the increase of energy-trapping gases (greenhouse
gases) in the lower atmosphere, due to increasing urbanisation and human activity, such
as fuel combustion and emissions from industries. Some of the effects of global climate
change include: increases in temperature, freshwater depletion and land degradation. The
impact and intensification of these effects have drawn more attention to the contribution of
human activity to the current environmental crisis and preventing further destruction of the
earth, has become a world-wide concern.
The constant growth of the human population and the demand for mobility will
continuously lead to development in the transportation and supporting construction
industries (McMichael et al., 2003). The substantial contribution of greenhouse gas (GHG)
emissions by the global transportation sector highlights the necessity to address the
environmental impacts of this sector. It is crucial that sustainable practices are adopted for
transformation of the sector with attention to planning and implementation processes, to
ensure no further irreversible damage is caused. The transport sector creates the
opportunity for worldwide GHG mitigation. Moving towards a „greener future‟, the carbon
footprint is an environmental tool that, allows the impact of a project to be evaluated as a
measure of its feasibility (Wiedmann and Minx, 2008). Carbon emission studies can
assess and aid in an informed decision-making process.
1.2 Motivation
As stated by Minister of Transport, Mr Ndebele (Ndebele, 2011), the transport sector emits
13% of the total global GHG emissions, and transport-related emissions are expected to
increase by 57% by 2030. The challenges faced by the existing public transport (PT)
system in South Africa (SA), which is inefficient and unreliable, have prompted the
transformation of PT. According to the Department of Transport, “the concept of a modern
bus rapid transit system is critical to the success of SA's transport systems. Local transport
Introduction
2
cannot work if it does not incorporate a good bus service that is accessible, affordable and
attractive to a broad range of people across society” (City of Tshwane, 2013). Integrated
Rapid Public Transport Networks (IRPTNs) to be implemented in 12 South African cities,
include Bus Rapid Transit (BRT) and Rail Rapid Transit (RRT) with the purpose of
improving service reliability, travel time and convenience. It aims to ultimately reduce the
amount of privately-owned vehicles on the road, thereby decreasing the emissions of the
transport sector (Levinson et al., 2002). The four phases of this revolutionary project shall
be implemented in Durban over the next ten years, with an anticipated cost of R25 billion
(Mbonambi, 2012). This new system was named GO!Durban. Infrastructure development
of this magnitude needs to be of benefit to both the public and the environment. Limited
carbon emission studies in SA and around the world, and the shortage of scenario
analyses assessing the impact of projects like this have motivated this study.
1.3 Research Question
The following research question has been formulated: What is the operational carbon
footprint of the proposed local IRPTN (GO!Durban), and will the project reduce GHG
emissions compared to the existing PT system?
1.4 Aim and Objectives
The following aim and objectives are to be achieved by this study.
Aim:
To investigate the carbon footprint (CF), existing methodology and tools for associated
calculation and to investigate the implications of CF on the proposed vehicles and
transportation network of the GO!Durban system;
Objectives:
Research and gather information from local and international sources pertaining to:
CF concept, methodology and calculation tools for vehicle emissions;
Emissions from public transportation vehicles and electricity generation;
Introduction
3
IRPTNs implemented in South Africa (Johannesburg, Cape Town Nelson
Mandela Bay and Rustenburg (to be implemented)); and
Methods to be considered in reducing the expected CF of the IRPTN.
Review, compare and critically evaluate literature on a suitable method for calculating
the CF of the vehicular emissions (IRPTN and current);
Use software programmes to model traffic of the current transport system and
proposed flow of the GO!Durban system and develop a model to calculate emissions
and estimate the CF;
Determine the CF of the emissions of the current public transport system in the
eThekwini Municipal Area (EMA) and compare these to the expected emissions of the
GO!Durban system; and
Examine the planning process of the GO!Durban system, study IRPTNs around SA
and conduct an improvement analysis on the eThekwini IRPTN for GHG emission
mitigation.
1.5 Structure of Report
This report is divided into six chapters, to allow for easy understanding and interpretation
of the study. A brief description of each chapter is provided in the following sections.
Chapter 1 (Introduction) presents the background information and the motivation for
conducting this study, as well as the aims and objectives which the remaining chapters are
directed at achieving.
Chapter 2 (Literature Review) provides a greater insight into climate change, global GHG
emissions, and the concept of “carbon footprint” and its importance. The transport sector is
the main focus, with the introduction of rapid transit systems (and exploration of the
worldwide applications). The provision of efficient public transportation services (IRPTNs)
as a solution for reduced transportation emissions is explored. This chapter provides the
theoretical background required for this study, using various sources of information.
Introduction
4
Chapter 3 (Case Study) explores the history of PT in EM, the services and challenges of
the existing system and the GO!Durban system as a solution. The proposed IRPTN to be
implemented is studied to acquire a relation between the current PT system and the
transformation offered by the GO!Durban system.
Chapter 4 (Methodology) describes the procedure followed when conducting both the
theoretical and case study components. The scope of the study, limitations and
uncertainties, as well as emission factors and sources, for the calculation of vehicular
emissions, are provided.
Chapter 5 (Data Modeling and Annual Results) provides validation of the transport
modeling and presents the conversion to annual data for the case study.
Chapter 6 (Results and Discussion) provides a clear representation of the results
obtained in the case study and a critical analysis thereof. A comparative analysis of the
existing PT system and GO!Durban was carried out.
Chapter 7 (Conclusion) summarises the main findings. The study is concluded by
addressing the research question and presents overall recommendations.
Literature Review
5
LITERATURE REVIEW
2.1 Introduction
This chapter sets the theoretical background for the research undertaken for this study. It
provides contextual knowledge and understanding through the investigation of the
greenhouse effect, climate change, the transport sector and sustainable practice of
Integrated Rapid Public Transport Networks (IRPTNs), and vehicle technology, as well as
underlining knowledge gaps and shortcomings.
The transport sector is a major energy user and greenhouse gas (GHG) emitter contributing
to climate change; from road and railway construction to vehicular usage. Mobility is a
worldwide necessity; therefore, development within the sector must include adopting
emission mitigation strategies. There are several factors contributing to the overall carbon
footprint of a transport mode and these will be presented in the following sections.
2.2 Climate Change and Transportation
This section provides insight into the energy sector with regard to the following areas:
Climate Change and Global Effects; and
Worldwide and South African GHG Emissions - pertaining to the transport sector.
2.2.1 Definitions and Basic Concepts
Climate, often described as ‘average weather’, is defined by temperature, wind and
precipitation, amongst many other parameters, over a minimum period of 30 years. The
radiation balance influences the climate of the earth, namely changes in: incoming solar
radiation, the amount of solar radiation reflected back into space (cloud cover, aerosols or
distribution of vegetation) and long-wave radiation from earth (influenced by GHG
concentrations) (Le Treut et al., 2007).
The greenhouse effect is the process whereby the solar radiation that warms and is
absorbed by the earth's surface is released back into the atmosphere as infrared radiation.
Literature Review
6
This increase in temperature due to the presence of GHGs, such as, water vapour, carbon
dioxide (CO2), chlorofluorocarbons (CFCs), halons, methane (CH4), tropospheric (ground-
level) ozone (O3), and nitrous oxide (N2O), which absorb heat, without which planet earth
would be more than 30°C cooler. Therefore, the greenhouse effect is natural and essential
for life on earth (Arrhenius and Waltz, 1990).
Global Warming Potential (GWP) refers to the heat-absorbing ability and decay rate of GHG
molecules of a certain gas. GWPs change over time depending on the concentration of
GHGs in the atmosphere. It is measured in terms of carbon dioxide equivalents (CO2e), as
multiples of the potential of CO2, which is used as the reference GHG due to its significant
increase in the atmosphere. CO2 it is the main GHG responsible for global warming. GWP
shows the amount of heat trapped and future impacts of GHGs over a long time horizon, as
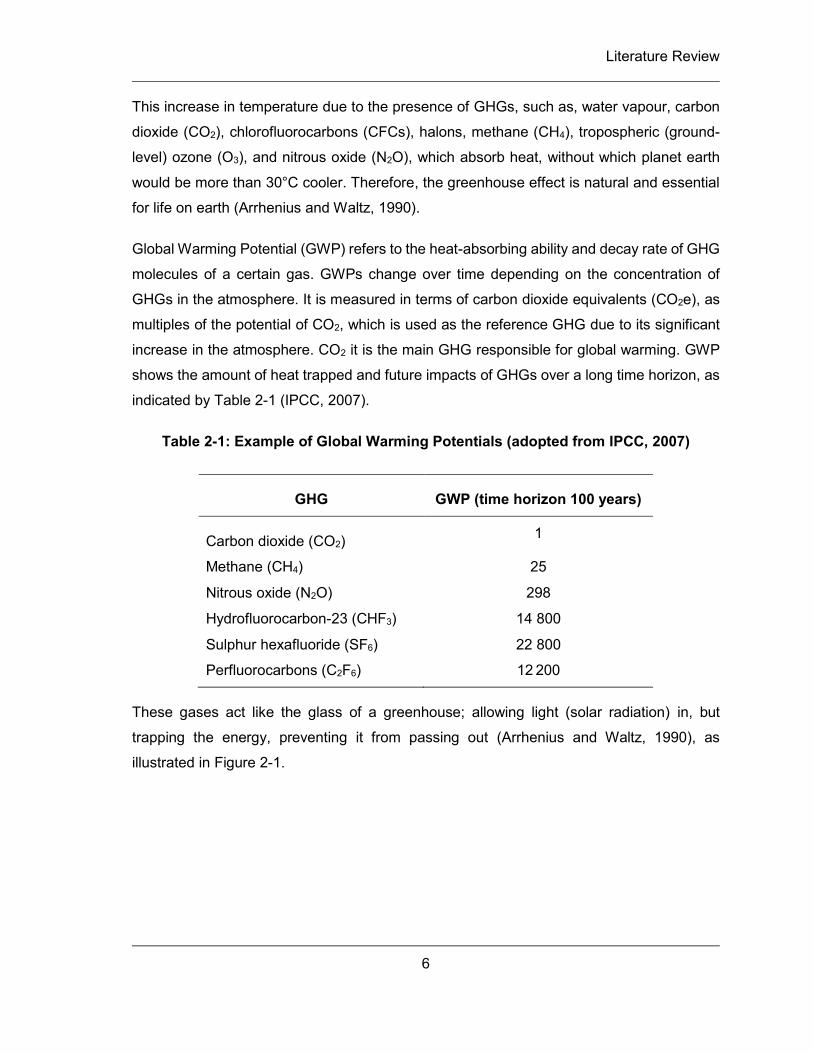
indicated by Table 2-1 (IPCC, 2007).
Table 2-1: Example of Global Warming Potentials (adopted from IPCC, 2007)
GHG GWP (time horizon 100 years)
Carbon dioxide (CO2) 1
Methane (CH4) 25
Nitrous oxide (N2O) 298
Hydrofluorocarbon-23 (CHF3) 14 800
Sulphur hexafluoride (SF6) 22 800
Perfluorocarbons (C2F6) 12 200
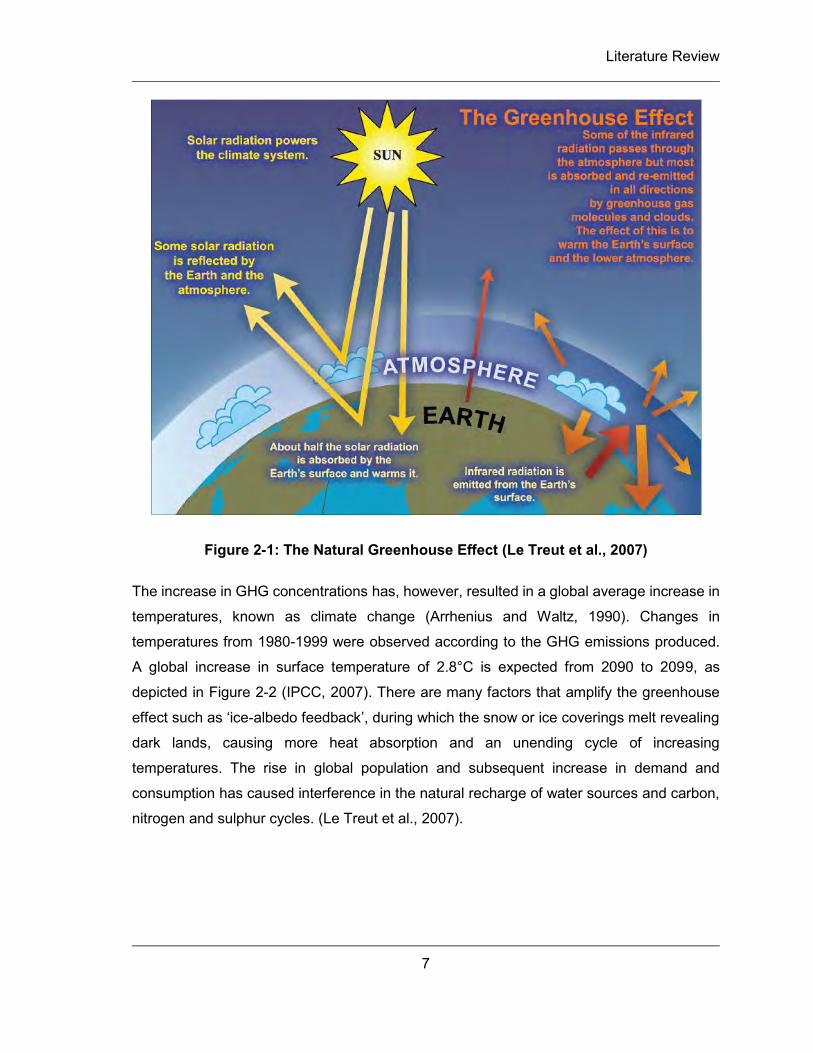
These gases act like the glass of a greenhouse; allowing light (solar radiation) in, but
trapping the energy, preventing it from passing out (Arrhenius and Waltz, 1990), as
illustrated in Figure 2-1.
Literature Review
7
Figure 2-1: The Natural Greenhouse Effect (Le Treut et al., 2007)
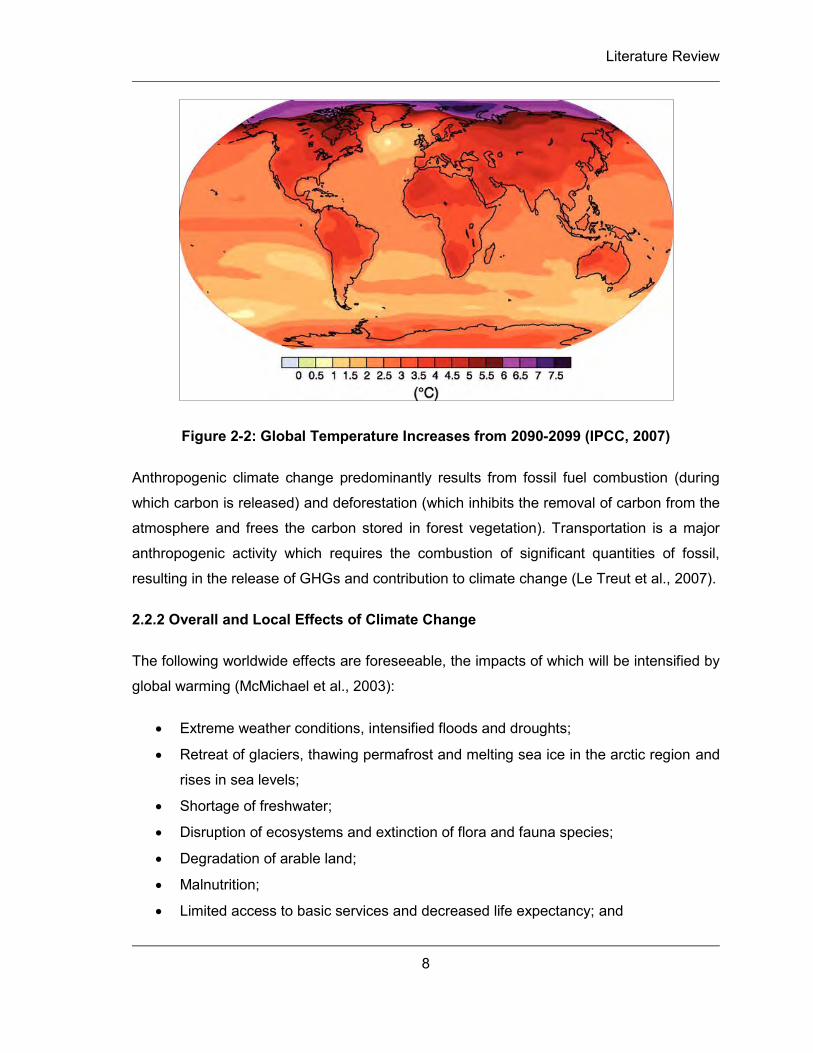
The increase in GHG concentrations has, however, resulted in a global average increase in
temperatures, known as climate change (Arrhenius and Waltz, 1990). Changes in
temperatures from 1980-1999 were observed according to the GHG emissions produced.
A global increase in surface temperature of 2.8°C is expected from 2090 to 2099, as
depicted in Figure 2-2 (IPCC, 2007). There are many factors that amplify the greenhouse
effect such as ‘ice-albedo feedback’, during which the snow or ice coverings melt revealing
dark lands, causing more heat absorption and an unending cycle of increasing
temperatures. The rise in global population and subsequent increase in demand and
consumption has caused interference in the natural recharge of water sources and carbon,
nitrogen and sulphur cycles. (Le Treut et al., 2007).
Literature Review
8
Figure 2-2: Global Temperature Increases from 2090-2099 (IPCC, 2007)
Anthropogenic climate change predominantly results from fossil fuel combustion (during
which carbon is released) and deforestation (which inhibits the removal of carbon from the
atmosphere and frees the carbon stored in forest vegetation). Transportation is a major
anthropogenic activity which requires the combustion of significant quantities of fossil,
resulting in the release of GHGs and contribution to climate change (Le Treut et al., 2007).
2.2.2 Overall and Local Effects of Climate Change
The following worldwide effects are foreseeable, the impacts of which will be intensified by
global warming (McMichael et al., 2003):
Extreme weather conditions, intensified floods and droughts;
Retreat of glaciers, thawing permafrost and melting sea ice in the arctic region and
rises in sea levels;
Shortage of freshwater;
Disruption of ecosystems and extinction of flora and fauna species;
Degradation of arable land;
Malnutrition;
Limited access to basic services and decreased life expectancy; and
Literature Review
9
Spread of infectious disease.
The severity of these effects, and cumulative impacts, highlight the necessity of controlling
GHG emissions.
2.2.2.1 Climate Change in eThekwini Municipality, SA
The city of Durban is situated on the east coast of Africa, within EM. Local trends indicate
that Durban will experience many days of temperatures in excess of 30°C with heat waves
and extreme weather disasters (Roberts, 2008). The issue of water availability will affect
agriculture, productivity, food security, and of course, human health. A rise in sea level will
also influence the function and usage of transport networks (Roberts, 2008). Some of the
changes that may be experienced include (EM, 2014a):
Increases in minimum and maximum temperatures of 1.5° and 2.5° in 2065 and 3°
and 5° in 2100, respectively;
Rises in sea level from 2.7cm per decade may further increase, exacerbating coastal
erosion;
Changes in rainfall patterns – an increase in occurrence and intensity of droughts
and floods – will result in infrastructure damage;
Degradation of arable land, reductions in staple crop yields and increases in livestock
mortality rates;
Heat stress and decreased air quality resulting in respiratory issues; and
Disruption of ecosystems due to endangered grassland habitats unable to use the
excessive concentrations of CO2.
2.2.3 Carbon Footprint
The Carbon Trust (2006) defines a carbon footprint (CF) as the total amount of GHG
emissions for which an organisation is responsible. All GHG emissions are converted to
CO2e, using the GHG Protocol and Emission Trading Scheme (with direct emissions from
combustion and electricity generation, and indirect emissions from other activities). Although
the standard unit for measurement is tonnes (t) of CO2e emitted, Matthews et al. (2008)
claim that since CF is rooted in 'ecological footprint', it should be measured in total area of
land needed to produce the level of human consumption.
Literature Review
10
The World Business Council for Sustainable Development (WBCSD) has specified different
levels of emissions, called “tiers” or “scopes”, similar to those of the Carbon Trust, namely
(Matthews et al., 2008):
Scope 1: Direct emissions of an organisation (from factory and vehicles);
Scope 2: Carbon emissions of energy inputs; and
Scope 3 (optional): Other indirect activities (total supply chain emissions)
According Baldo et al. (2009), CF calculation methods can be classified as: general
guidelines (such as International Organisation for Standardisation (ISO)), specific guidelines
(indicating GHG calculation and monitoring) and calculation tools (for emissions of specific
activities). Accounting guidelines include: the GHG Protocol of World Resource Institute,
Publicly Available Specifications (PAS) 2050 of British Standard Institute, 2006 IPCC
Guidelines for National GHG Inventories, Carbon Trust, and ISO 14064, 14025 and 14067
(Pandey et al., 2011).
The Carbon Trust (2006) recommends a five-step process for the calculation and reporting
of business carbon emissions, namely: setting objectives, choosing a calculation approach
and establishing boundaries, collecting data and emission factors calculation, and validation
and reporting.
The CF tool is proving important for GHG management with developing methodologies
(Pandey et al., 2011). It “informs decision-making when considering reducing emissions of
products and services”, enabling a greater awareness of impacts on future generations; an
awareness which may result in alternative sustainable practices within the transport sector
(DBIS, 2011). Although a frequently used term, CF has not properly been defined within the
scientific society. Confusion regarding measurement units and tiers should be addressed to
ensure full understanding and a global method for calculation within each sector should be
adopted so that proper legislation can be introduced (Baldo et al., 2009).
2.2.4 Air Emissions from Transportation
Exhaust gases resulting from fuel combustion include: CO2 and hydrocarbons (HCs),
nitrogen oxides (NOx), carbon monoxide (CO), sulphur dioxide (SO2), volatile organic
compounds (VOCs) and particulates (DEA, 2009). In addition, chemical reactions occurring
Literature Review
11
in the atmosphere form secondary pollutants such as nitrogen dioxide (NO2), O3, nitric and
sulphuric acid. Some of these gases are GHGs (CH4, CO2, and N2O) and others are air
pollutants (NOx, SOx and particulates), with various environmental and health impacts.(DEA,
2009). The primary and secondary pollutants have different effects, a few of the negative
ones include reducing oxygen flow in the bloodstream, aggravating respiratory problems
and contributing to the formation of acid rain (US EPA, 2005).
The European Union (Euro) Emission Standards for vehicles, amongst others, are widely
used to regulate exhaust gases produced, restricting vehicular air pollution (Delphi,
2014/2015). These include reductions of CO, HCs, CH4, NOx, particulate matter (PM) and
particulate number (PN). The Euro Emission Standards are important for this study as they
are the regulations used in SA. Developed for different vehicle categories, namely light-duty
vehicles (below 3.5 tons) and heavy-duty vehicles (more than 3.5 tons such as buses and
trucks), the Euro Emission Standards are denoted by arabic and roman numerals,
respectively. Vehicles in operation may comply with older Euro Standards, however, new
vehicle sales must comply with more stringent, updated regulations (Lindqvist, 2012).
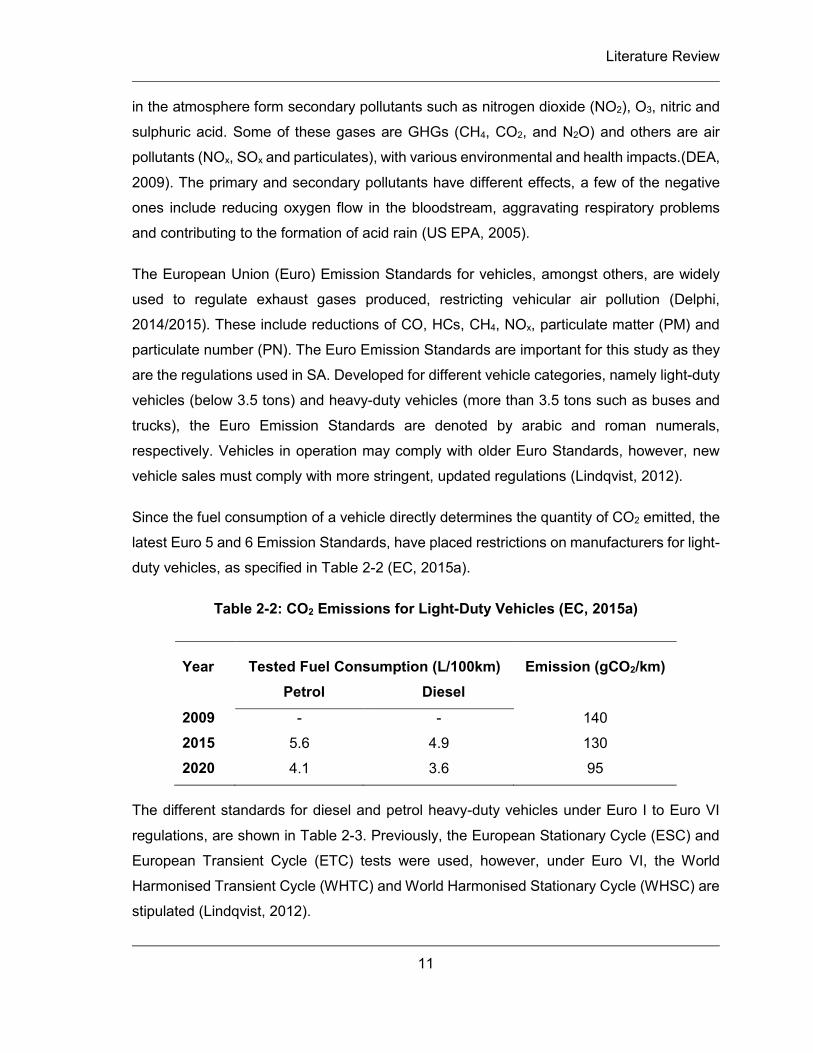
Since the fuel consumption of a vehicle directly determines the quantity of CO2 emitted, the
latest Euro 5 and 6 Emission Standards, have placed restrictions on manufacturers for light-
duty vehicles, as specified in Table 2-2 (EC, 2015a).
Table 2-2: CO2 Emissions for Light-Duty Vehicles (EC, 2015a)
Year Tested Fuel Consumption (L/100km) Emission (gCO2/km) Petrol Diesel
2009 - - 140
2015 5.6 4.9 130
2020 4.1 3.6 95
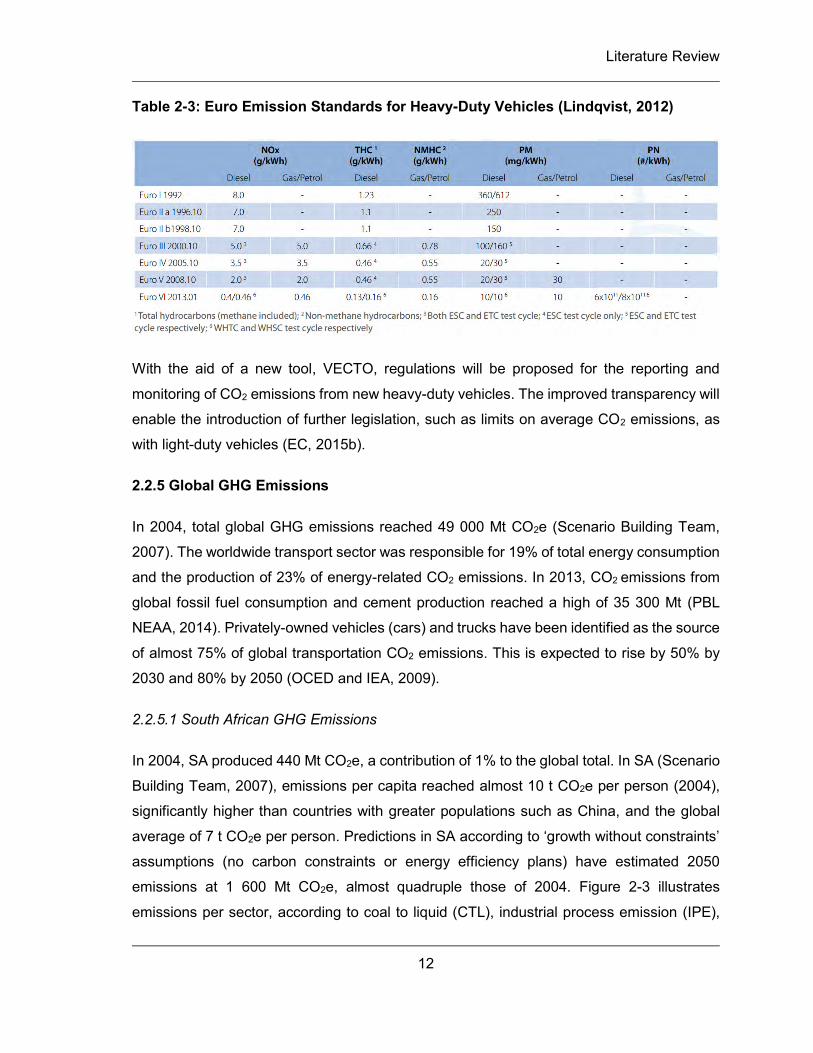
The different standards for diesel and petrol heavy-duty vehicles under Euro I to Euro VI
regulations, are shown in Table 2-3. Previously, the European Stationary Cycle (ESC) and
European Transient Cycle (ETC) tests were used, however, under Euro VI, the World
Harmonised Transient Cycle (WHTC) and World Harmonised Stationary Cycle (WHSC) are
stipulated (Lindqvist, 2012).
Literature Review
12
Table 2-3: Euro Emission Standards for Heavy-Duty Vehicles (Lindqvist, 2012)
With the aid of a new tool, VECTO, regulations will be proposed for the reporting and
monitoring of CO2 emissions from new heavy-duty vehicles. The improved transparency will
enable the introduction of further legislation, such as limits on average CO2 emissions, as
with light-duty vehicles (EC, 2015b).
2.2.5 Global GHG Emissions
In 2004, total global GHG emissions reached 49 000 Mt CO2e (Scenario Building Team,
2007). The worldwide transport sector was responsible for 19% of total energy consumption
and the production of 23% of energy-related CO2 emissions. In 2013, CO2 emissions from
global fossil fuel consumption and cement production reached a high of 35 300 Mt (PBL
NEAA, 2014). Privately-owned vehicles (cars) and trucks have been identified as the source
of almost 75% of global transportation CO2 emissions. This is expected to rise by 50% by
2030 and 80% by 2050 (OCED and IEA, 2009).
2.2.5.1 South African GHG Emissions
In 2004, SA produced 440 Mt CO2e, a contribution of 1% to the global total. In SA (Scenario
Building Team, 2007), emissions per capita reached almost 10 t CO2e per person (2004),
significantly higher than countries with greater populations such as China, and the global
average of 7 t CO2e per person. Predictions in SA according to ‘growth without constraints’
assumptions (no carbon constraints or energy efficiency plans) have estimated 2050
emissions at 1 600 Mt CO2e, almost quadruple those of 2004. Figure 2-3 illustrates
emissions per sector, according to coal to liquid (CTL), industrial process emission (IPE),
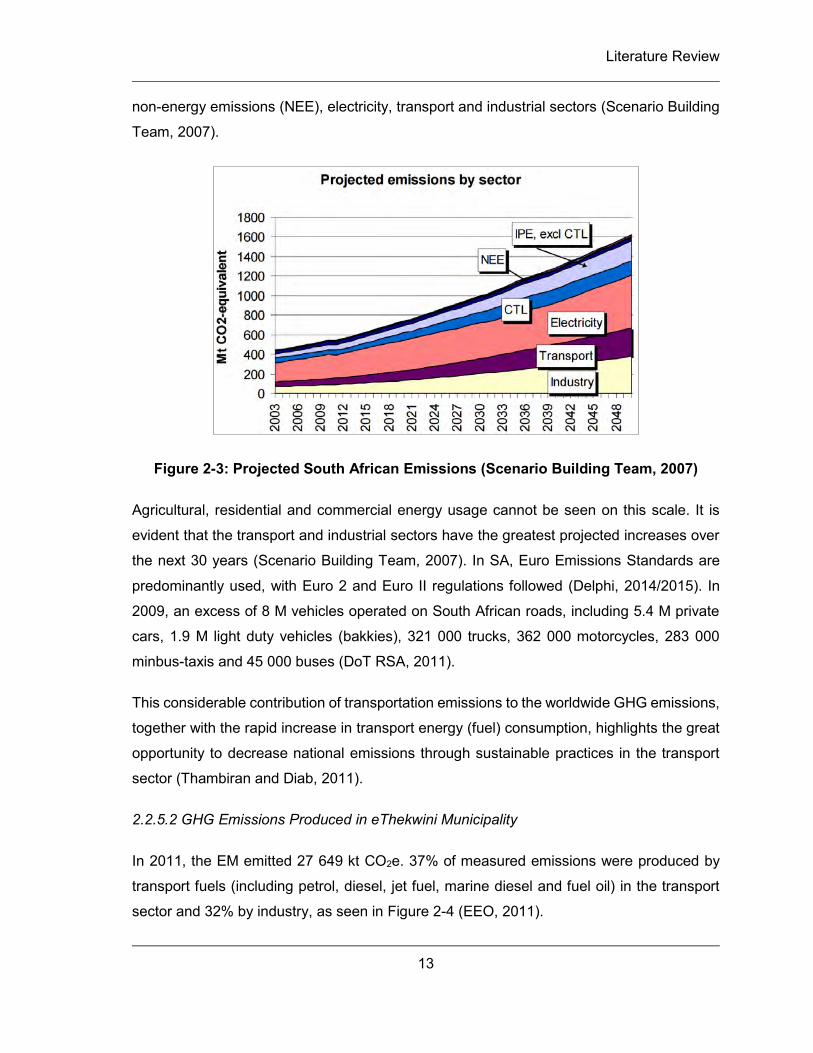
Literature Review
13
non-energy emissions (NEE), electricity, transport and industrial sectors (Scenario Building
Team, 2007).
Figure 2-3: Projected South African Emissions (Scenario Building Team, 2007)
Agricultural, residential and commercial energy usage cannot be seen on this scale. It is
evident that the transport and industrial sectors have the greatest projected increases over
the next 30 years (Scenario Building Team, 2007). In SA, Euro Emissions Standards are
predominantly used, with Euro 2 and Euro II regulations followed (Delphi, 2014/2015). In
2009, an excess of 8 M vehicles operated on South African roads, including 5.4 M private
cars, 1.9 M light duty vehicles (bakkies), 321 000 trucks, 362 000 motorcycles, 283 000
minbus-taxis and 45 000 buses (DoT RSA, 2011).
This considerable contribution of transportation emissions to the worldwide GHG emissions,
together with the rapid increase in transport energy (fuel) consumption, highlights the great
opportunity to decrease national emissions through sustainable practices in the transport
sector (Thambiran and Diab, 2011).
2.2.5.2 GHG Emissions Produced in eThekwini Municipality
In 2011, the EM emitted 27 649 kt CO2e. 37% of measured emissions were produced by
transport fuels (including petrol, diesel, jet fuel, marine diesel and fuel oil) in the transport
sector and 32% by industry, as seen in Figure 2-4 (EEO, 2011).
Literature Review
14
Figure 2-4: GHGs Produced per Sector in eThekwini Municipality (EEO, 2011)
Of the 37% emitted by the transport sector 34% is produced by transport by industry, 22%
by fuel combustion (on-road and off-road mobile vehicles), 17% by rail, air and water
transport systems, 14% residential, 12% commercial and 1% by movement of solid waste
(EEO, 2011). Durban, the core city in the EM, has a privately-owned vehicle (POV) ratio of
189 cars in every 1000 people (189/1000), a value above the national average. This is
indicative of the dependence on POVs and subsequent production of emissions (Thambiran
and Diab, 2011).
2.3 The Public Transportation Sector
Transportation is defined as: “the transfer of persons and or goods, in a vehicle or otherwise,
between geographically separated places” by road, railway, air and water systems
(Steenbrink, 1974). Transportation is an essential component of the human way of life,
economic development and growth of cities (Cox, 2010). Privatised and public transportation
(PT) exists in cities. Private transportation is: “POV – cars and motorcycles – operated for
personal use, usually on publicly provided and operated streets” (Gray and Hoel, 1992). A
PT service, as defined by the National Land Transport Act (NTLA) of 2009 (RSA, 2009) is:
“a scheduled or unscheduled service for the carriage of passengers by road or rail, whether
subject to a contract or not, and where the service is provided for a fare or any other
consideration or reward”. Vuchic (Gray and Hoel, 1992) characterises PT modes by:
Literature Review
15
Right-of-way (ROW) – degree of separation from other vehicles:
o Mixed traffic, physically separated allowing grade crossings for pedestrians
and vehicles, and ‘exclusive’ fully controlled ROW;
Technology – mechanical features of vehicles:
o Support of weight, guidance (steering and direction), control systems and
engine technology; and
Type of service (Gray and Hoel, 1992).
Rapid urbanisation has exacerbated the demands of the transport sector and many people
lack access to affordable transportation and services. POVs have become a mark and
instrument of the modern world. In an effort to combat congestion on roads and subsequent
increases of vehicular emissions and decreased air quality, human mobility must be
understood and the compatibility of development and sustainability within the transportation
sector, addressed (Cox, 2010). The following sections will focus on PT, in particular the
integrated PT intervention and vehicle technology.
2.3.1 Vehicle Fuel Technology
In 1878, German engineer, Nicholaus Otto, built the first internal combustion engine (ICE),
powered by air-oil mixtures. This was followed by the invention of an automobile and later,
petrol-fuelled engines, buses and double decker buses (Vuchic, 1981). Rapid population
growth and urbanisation led to the expansion and upgrade of these technologies in the last
100 years, as cities around the world use different forms of PT. Therefore, the demand for
PT increased, along with fossil fuel (petrol and diesel) consumption and associated GHG
emissions.
Due to the nature of non-renewable fuels, factors such as oil supply and the environmental
impact of fossil fuels have drawn attention to alternative fuels in recent years. Sought after
solutions to the petroleum market include the electric engine (as electric vehicles can rely
on renewable means of generation) and biofuels from sustainable farming practices (Cornell
University, 2013). This section will focus on vehicle and fuel technology and vehicle
emissions, which are relevant for PT.
2.3.1.1 Vehicle Fuel Technology
The following fuel technologies were studied:
Literature Review
16
Crude oil-based (petrol and diesel);
Compressed natural gas (CNG);
Electric and hybrid technology; and
Biofuels.
2.3.1.1.1 Crude oil-based fuel
Crude oil, a naturally occurring fossil fuel, is refined to produce petrol and diesel. Diesel is
easier to refine than petrol, however, further extractions are required to reduce pollutants of
diesel to that of petrol. Containing more energy than petrol, diesel fuels in addition to a more
efficient engine (which can be up to 40% more efficient than petrol) produces lower CO2
emissions (EAMA, 2014). Although diesel contains more sulphur and produces more SO2,
ultra-low sulphur diesel is more efficient than petrol, however, has greater NOx and PM
emissions (de Jong et al., 2009).
2.3.1.1.2 Compressed Natural Gas (CNG)
Also a fossil-based fuel, CNG contains 95% methane stored under high pressure. A CNG
engine, operating the same way as a petrol engine, is less efficient than diesel engines,
however, the usage of CNG reduces PM, NOx and HC pollutants. Petrol and diesel engines
may be altered to run on natural gas, however, the latter may require a small amount of
diesel (de Jong et al., 2009).
2.3.1.1.3 Electric Vehicles
An electric motor converts electrical energy to mechanical energy and produces no
emissions during operation. Hybrid electric vehicles (HEVs) are vehicles powered with the
conventional ICE and an electric motor, which operate on fuels and the energy stored in the
battery. This enables a reduction in tailpipe emissions as fuels burn under more stable
conditions, emitting less pollutants and CO2 (de Jong et al., 2009). Plug-in HEVs (PHEVs)
however, may be charged at electric sources for which emissions produces by electricity
generation must be considered. Emissions that occur at the source can be controlled much
more easily, compared to those during travel (DoT RSA, 2011). In many countries such as
SA, electricity generation is reliant on low-quality coal, therefore PHEVs are not a
sustainable option and may result in higher transport-related emissions (Liu et al., 2012).
Literature Review
17
Electricity generated by renewable sources is an alternative, however, such options are
currently limited in SA.
2.3.1.1.4 Biofuels
Biofuels are organic matter (HCs) produced into fuels by chemical reactions and can be
classified as (Cornell University, 2013):
First generation – from sugars, starches, oils and animal fats (biodiesel, bio-alcohols,
ethanol, and biogas);
Second generation – made from agricultural waste or non-food crops;
Third generation – made from algae and biomass sources; and
Fourth generation – made from genetically engineered crops.
Depending on the biofuel composition, exhaust emissions are slightly lower than fossil fuels
and overall GHGs, significantly lower. There are, however, other environmental issues
associated with biofuels, such as the use of genetically modified species and shortage of
agricultural lands.
2.3.2 Vehicle Emissions
Vehicle emissions, as mentioned in Section 2.2.4, can be classified as exhaust (due to fuel
combustion), evaporative and non-exhaust PM (due to aging of tyres, brakes and road
surface) emissions (Boutler et al., 2009). Exhaust emissions include hot exhaust (while the
engine is running during driving or idling) and cold start (during the ‘warm-up’ of the engine
to optimum operating temperature). Evaporative emissions are categorised as: running
losses (while vehicle is operational), diurnal (temperature fluctuations heat fuel), hot soak
(while hot engine cools after switched off), and refuelling (when gas forced out of tank during
filling) (MECA, 2010). As modelled by the US EPA, the average emissions of a typical car,
for a day in the year 2002 is shown in Figure 2-5.
Literature Review
18
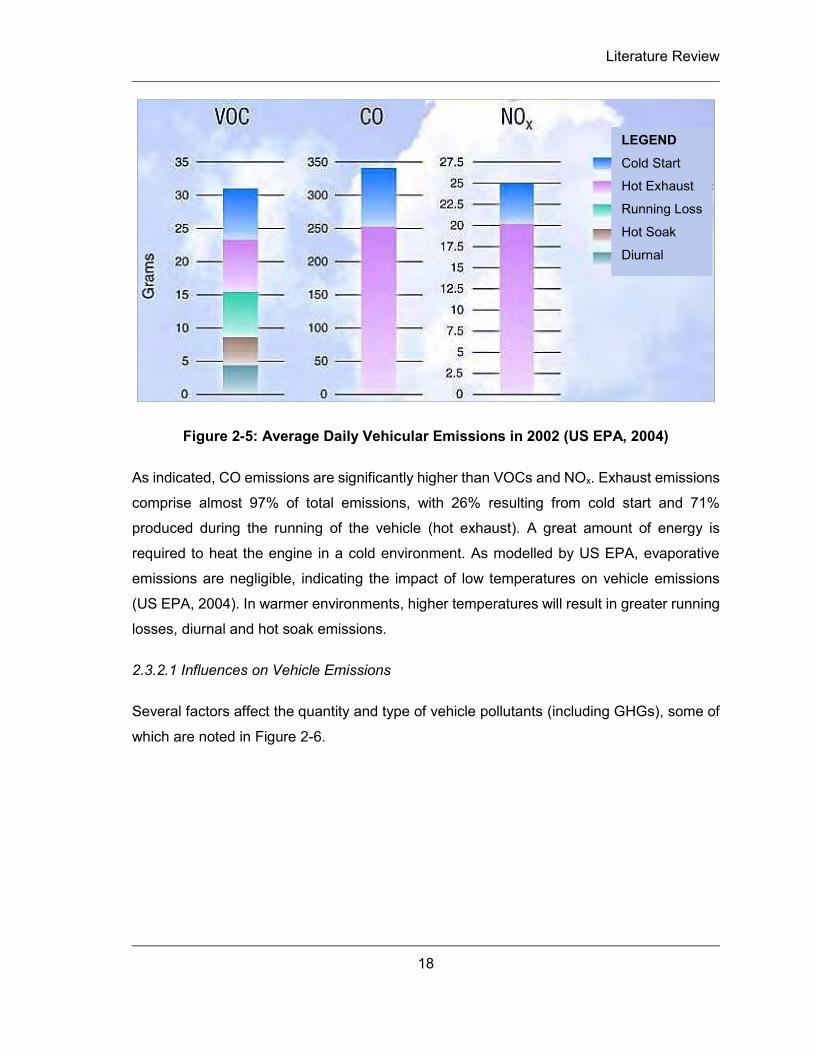
Figure 2-5: Average Daily Vehicular Emissions in 2002 (US EPA, 2004)
As indicated, CO emissions are significantly higher than VOCs and NOx. Exhaust emissions
comprise almost 97% of total emissions, with 26% resulting from cold start and 71%
produced during the running of the vehicle (hot exhaust). A great amount of energy is
required to heat the engine in a cold environment. As modelled by US EPA, evaporative
emissions are negligible, indicating the impact of low temperatures on vehicle emissions
(US EPA, 2004). In warmer environments, higher temperatures will result in greater running
losses, diurnal and hot soak emissions.
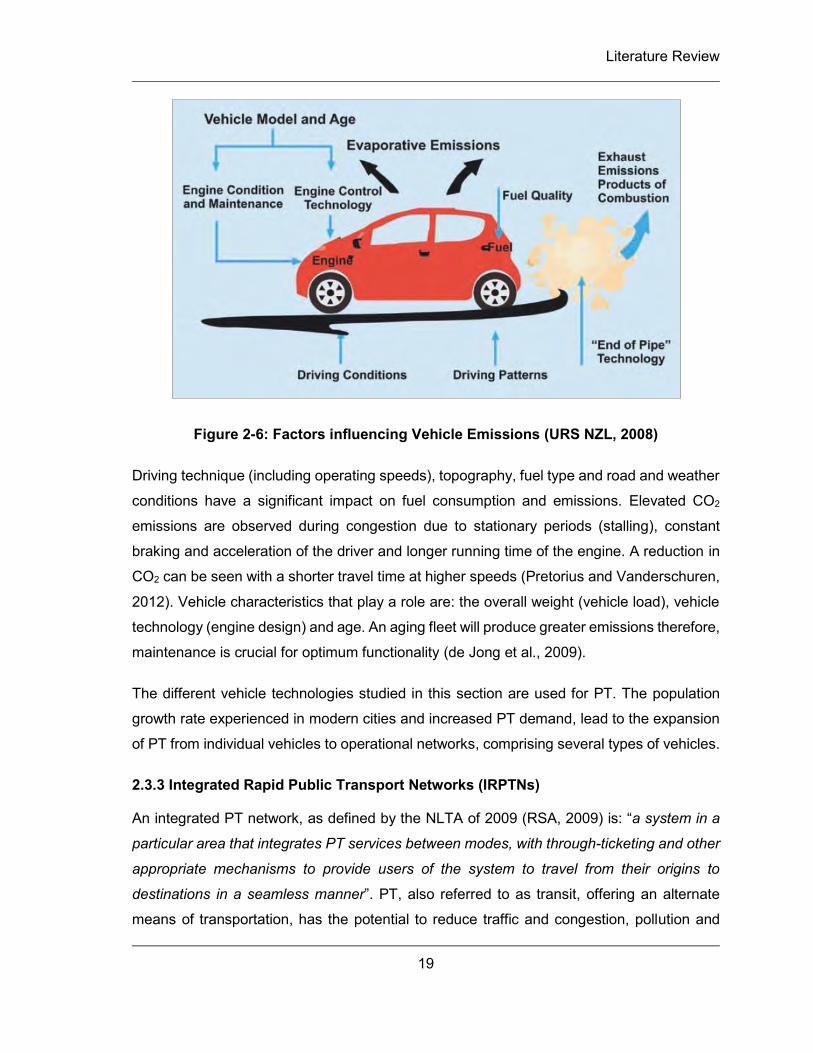
2.3.2.1 Influences on Vehicle Emissions
Several factors affect the quantity and type of vehicle pollutants (including GHGs), some of
which are noted in Figure 2-6.
LEGEND
Cold Start
Hot Exhaust
Running Loss
Hot Soak
Diurnal
Literature Review
19
Figure 2-6: Factors influencing Vehicle Emissions (URS NZL, 2008)
Driving technique (including operating speeds), topography, fuel type and road and weather
conditions have a significant impact on fuel consumption and emissions. Elevated CO2
emissions are observed during congestion due to stationary periods (stalling), constant
braking and acceleration of the driver and longer running time of the engine. A reduction in
CO2 can be seen with a shorter travel time at higher speeds (Pretorius and Vanderschuren,
2012). Vehicle characteristics that play a role are: the overall weight (vehicle load), vehicle
technology (engine design) and age. An aging fleet will produce greater emissions therefore,
maintenance is crucial for optimum functionality (de Jong et al., 2009).
The different vehicle technologies studied in this section are used for PT. The population
growth rate experienced in modern cities and increased PT demand, lead to the expansion
of PT from individual vehicles to operational networks, comprising several types of vehicles.
2.3.3 Integrated Rapid Public Transport Networks (IRPTNs)
An integrated PT network, as defined by the NLTA of 2009 (RSA, 2009) is: “a system in a
particular area that integrates PT services between modes, with through-ticketing and other
appropriate mechanisms to provide users of the system to travel from their origins to
destinations in a seamless manner”. PT, also referred to as transit, offering an alternate
means of transportation, has the potential to reduce traffic and congestion, pollution and
Literature Review
20
accidents on roads. Rapid transit is a high-capacity quality rail or bus system that is fast,
comfortable and convenient, with separated railway lines or lanes which operate along fixed
routes and schedules for a fare (Litman, 2014).
2.3.3.1 Bus Rapid Transit (BRT)
BRT, as defined by the Institute for Transportation and Development Policy (ITDP) is: “A
high-quality bus-based transit system that delivers fast, comfortable, and cost-effective
urban mobility through the provision of segregated ROW infrastructure, rapid and frequent
operations, and excellence in marketing and customer service” (Wright and Hook, 2007).
According to Mejia-Dugand et al. (2012) “BRT does not represent transformation as such,
but a means to achieve transformation”.
Components of successful BRT systems include (Wright and Hook, 2007):
Exclusive ROW lanes located in the centre of the roadway;
Rapid boarding and alighting;
Intelligent transportation systems (ITS);
Fare integration between corridors;
Pre-board fare collection services;
Safe stations along the routes (in the centre of the roadway);
Modal integration at stations and terminals;
Clear route maps, signage, and real-time information displayed; and
Low emission vehicle technologies with universal access.
While imitating the service of a rail-based transit system at 4-20 times less than the cost of
rail, BRT can encompass many route arrangements, providing passengers with alternatives,
unlike rail (Wright and Hook, 2007). BRT aims to make travel by bus more attractive than
other modes, and in so doing, tackle transport demand, congestion and delays, creates the
potential to significantly impact transport emissions (McDonnell et al., 2008). Faster and
more convenient than standard bus services, BRT avoids delays caused by on-board
ticketing and operation in mixed-traffic lanes. A standard BRT system will accommodate 13
000 passengers per hour per direction, typically at speeds of 23-30 kilometres per hour
(km//hr) (Wright and Hook, 2007). Integration with other modes is an essential component,
such as bicycle lanes and pedestrian paths, which encourage non-motorised transport
Literature Review
21
(NMT) (Goodman et al., 2005). The primary purpose of the BRT is to solve mobility issues;
it may also resolve many other issues not initially targeted (Mejia-Dugand et al., 2012).
2.3.3.2 Rail Rapid Transit (RRT)
Quality Rail Services are efficient in moving large populations and contribute to a city’s
livability. High performance articulated rail services – with speed, capacity and reliability –
are electrically powered. With significant start-up costs and low ridership, rail systems may
appear to be the unfavourable option, however, benefits are revealed with time as patronage
increases and costs decrease. Rail services are free of vehicle emissions however, the
means of electricity generation must be considered as point-source pollution for this mode
(Litman, 2014).
2.3.4 World-renowned Success of BRT Systems
BRT systems that have shown the greatest success in transformation and reduction of
GHGs of the transportation sector are:
Rede Integrada de Transporte – Curitiba, Brazil; and
TransMilenio – Bogotá, Colombia.
According to Wright and Hook (2007), Curitiba and Bogotá are the only two ‘full’ BRT
systems in the world, the characteristics upon which the definition of BRT has been
established. These case studies have been included to demonstrate the success of BRT in
countries with population and travel services to South Africa.
2.3.4.1 Rede Integrada de Transporte, Curitiba
The development of Curitiba was anticipated to radiate from the city centre; however, the
growth in POVs and traffic influenced plans. The Transport Master Plan integrated transport
and land-use planning and in 1965 Curitiba was expanded along specified linear corridors.
Traffic was reduced through: restricted vehicle access to the city centre, reduced public
parking and creation of pedestrian facilities. The BRT system consists of residential feeder
routes for five main channels to the city centre, served by minibuses and standard buses.
Reserved lanes provide ROW and buses are not governed by traffic signals. Tickets are to
be purchased at stations and passengers are to wait on the elevated platform for buses.
Literature Review
22
Sheltered wheel chair friendly ramps that extend from the bus to the platform enable rapid
loading and unloading (Goodman et al., 2005).
The reliability of buses, some of which are scheduled to run every 90 seconds, is very
attractive to users. Almost 70% of daily commuters use the system to travel to work. Curitiba
uses 30% less fuel per person compared to 8 other cities of equal size in Brazil. Curitibans
spend 10% of their income on transportation, which is much lower than the national average.
In 1991, a survey showed that the BRT in Curitiba annually eliminated 27 million (M) POV
trips and subsequent litres of fuel. The BRT caused a modal shift of 28% from POVs and
subsequent significant reductions in emissions from the transport sector. Today, the BRT
makes Curitiba a more convenient city with 1 100 buses running 12 500 trips daily, and more
than 50 times the amount of passengers compared to 20 years ago (Goodman et al., 2005).
2.3.4.2 TransMilenio, Bogotá
The capital city of Colombia is Bogotá, with an area of 340 km2 and population of over 7 M
Bogotáns. In 1990, Bogotá’s insufficient road maintenance and congested roads resulted in
increasing pollution levels and occurrence of accidents. Continuous road-widening and
construction of flyovers did not improve traffic, and worsened road maintenance (Nair and
Kumar, 2005).
In 1998, the Japanese International Cooperation Agency (JICA) approached Bogotá with a
‘Transportation Master Plan’. It included a metro system, urban highway and pedestrian
sidewalks. Bogotá however, had another plan – TransMilenio – which was designed to
enable the mobility of people, instead of accommodating vehicles. Completed in 54 months,
TransMilenio consists of separate bus lanes, sheltered stations, newer buses with increased
capacity, pre-boarding ticket facilities and rapid boarding (Nair and Kumar, 2005). The BRT
system with the Pedestrian and a 300km dedicated bicycle pathway has increased non-
motorised modal usage and discouraged the use of POVs. The Pedestrian functions not
only as an NMT facility, but similar to shopping malls, contains stores and serves as a tourist
attraction (Nair and Kumar, 2005). TransMilenio serves 45 000 passengers per hour per
direction; the highest capacity BRT system (Wright and Hook, 2007). As seen in Table 2-4,
the implementation of TransMilenio has drastically improved the modal share of NMT by 4%
and reduced POV usage by 5%.
Literature Review
23
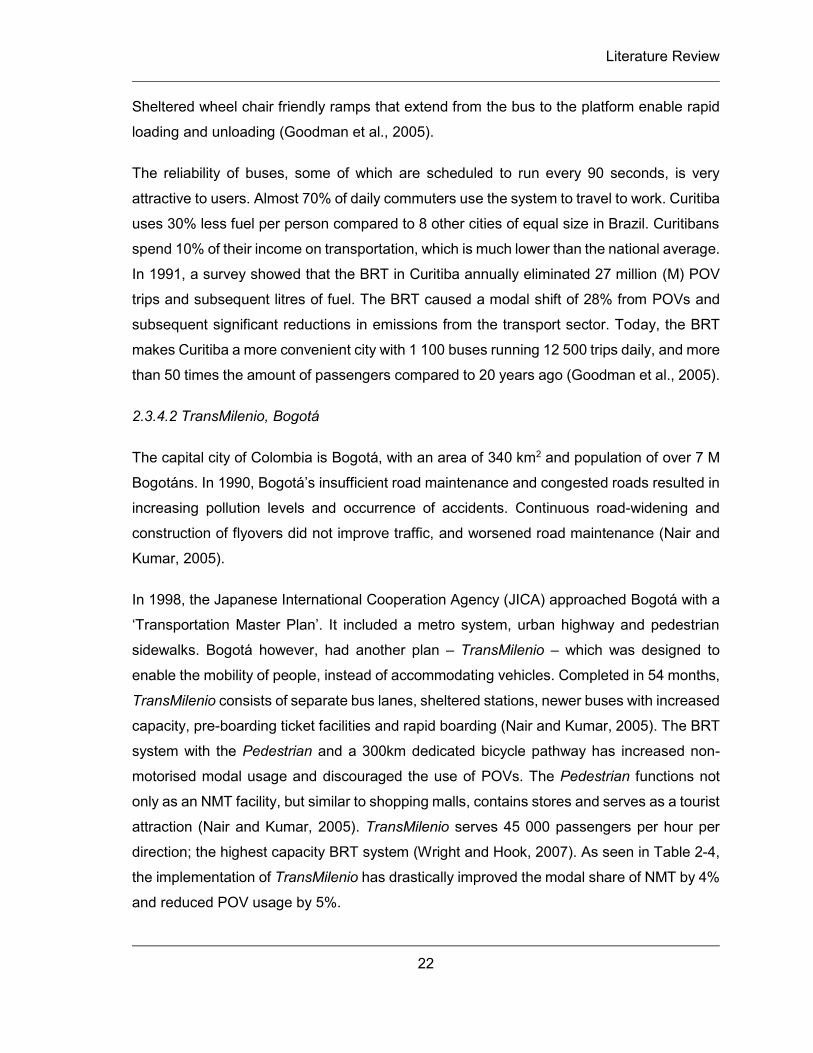
Table 2-4: Modal split before and after the implementation of TransMilenio (Nair & Kumar, 2005)
Modal Share 1998 2002
PT (transit) 72% 73%
POV 16% 11%
NMT 9% 13%
Other 3% 3%
Average Travel Time 48 min 42 min
Perception of PT System 5.56/10 6.94/10
The perception of PT has improved by 13,8%, enabling a greater usage thereof. A
favourable increase in the use of the Pedestrian and decrease in the use of POVs is evident.
This has enabled higher bus travelling speeds, reducing travel time of TransMilenio. The
overall emissions in Bogotá have experienced a subsequent reduction of 28% in CO levels.
This rapid decrease of CO levels offers the most benefit of the transport system development
in Bogotá. O3 and NO2 levels have remained relatively constant over the implementation
process.
Injuries along the TransMilenio routes have decreased from 18 for the year of 1998 to a
mere 4 in 2002. The implementation of TransMilenio, together with education campaigns,
strict law enforcement and restricted access of cars in the city have resulted in reduced
traffic injuries and deaths (Cohen, 2008).
2.3.5 Advantages and Disadvantages of IRPTNs
BRT and rail systems should ideally work together for optimum route coverage to provide
an attractive network which is accessible to all. Competition between services should be
minimised (Litman, 2014). As with any network, many benefits and difficulties are
experienced with IRPTNs.
2.3.5.1 Advantages of IRPTNs
The literature (Litman, 2014) based on case studies specified benefits of IRT including:
Literature Review
24
User safety, comfort and convenience (independence);
Fare integration provides cost-effective services (saving on POV costs);
Reduced road vehicles improves congestion, accident occurrence, demand for road
reserve and maintenance costs;
Optimization of NMT facilities between nodes;
Energy efficiency and emission reduction; and
Strategic promotion of urban development.
2.3.5.2 Disadvantages of IRPTNs
The difficulties experienced in IRPT systems include (Gray and Hoel, 1992):
High initial costs and government investment;
Significant land-use impacts (space required for exclusive lanes);
Long implementation periods and mandatory maintenance;
Extensive planning, management and communication required for success;
Organisation and promotion of integrated services and availability of information;
High level of security and monitoring for necessary crime prevention; and
Prevalent negative public perception of PT.
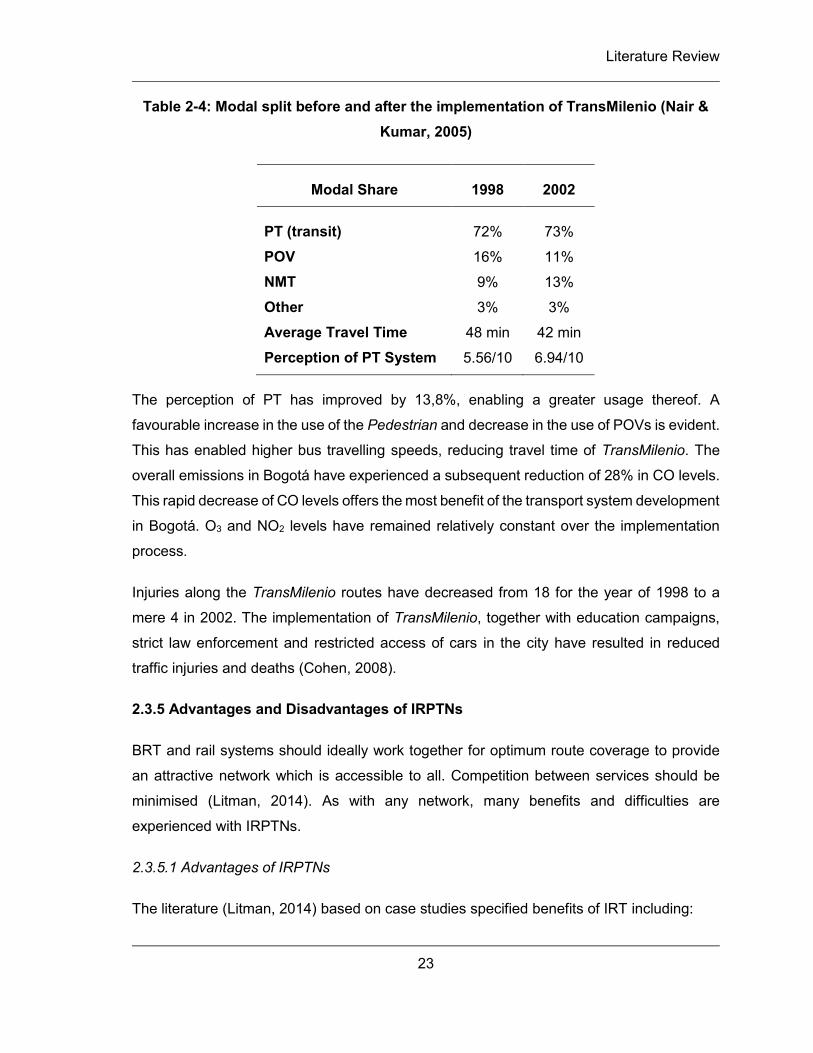
The type of bus network, shown in Figure 2-7, is a trunk line with feeders. A major
disadvantage of this design is the compulsory change of vehicle category by a passenger
along a journey, and cost implication of the requirement of universal access vehicles (Gray
and Hoel, 1992).
Figure 2-7: BRT Trunk Line with Feeders (Gray and Hoel, 1992)
Trunk Route
Feeder Routes
Literature Review
25
These networks have different configurations with diverse vehicle types, resulting in varying
vehicle emissions. The following section will present worldwide case studies focussing on
these emissions.
2.4 International Case Studies of PT and Associated Emissions
In order to compare different IRPTNs and resultant GHG emissions, a series of international
studies have been reviewed. The studies presented in the following sections create a greater
understanding of the influence of PT networks on the reduction of GHG emissions from
transportation, namely:
The implementation of BRT;
Modal shift towards PT; and
Advanced vehicle technology.
2.4.1 Metrobus, Mexico City
The BRT system, Metrobus, was implemented in Mexico City in June 2005 along 20km of
Insurgentes Avenue (a principal arterial route). Minibuses were previously a popular mode
with many of the fleet age exceeding six years, without proper maintenance. Metrobus
introduced new technology articulate diesel buses with high capacity. Wöhrnschimmel et al.
(2008) evaluated the exposure of commuters to levels of suspended particles (PM2.5 and
PM10), benzene, CO and other VOCs. Measurements inside PT vehicles were conducted
before and after the implementation of a BRT system. Using least squares regression
models, results showed reductions in commuter exposure from minibuses to CO, benzene
and PM2.5 of 45%, 69% and 30%, respectively. Due to the introduction of more buses on the
road network, exposure to pollutants from buses increased from 20% to 54%, and exposure
to VOCs are due to emissions from surrounding vehicles on the roads (Wöhrnschimmel et
al., 2008). In addition, buses operating in exclusive lanes do not adhere to traffic signals and
have higher operating speeds due to ROW. More efficient fuel consumption and less
emissions are achieved due to fewer stops (McDonnell et al., 2008). The results showed
that the BRT system was successful as a means of reducing the impact of air pollutants and
should be considered the cleaner alternative with respect to commuter health.
Literature Review
26
2.4.2 Quality Bus Corridor, Dublin
McDonnell et al. (2008) investigated the introduction of PT priority policies for the decrease
of transport GHG emissions during peak travel, particularly CO2 emissions due to modal
shift. These included reserved bus lanes and allocated bus fleet with scheduled services.
The study was carried out on a Quality Bus Corridor (QBC) Exclusive Bus Lane in Dublin,
Ireland, which was introduced in 1999. Population travel patterns and vehicular usage, as
well as, peak traffic counts (used to generate modal share) were used to estimate CO2
emissions. A baseline year was established and four scenarios applied to evaluate the
impact of the QBC, namely (McDonnell et al., 2008):
‘Build QBC’;
‘Not build QBC’;
15% modal shift from POVs to implemented QBC; and
29% modal shift from POVs to implemented QBC.
In Scenario 1, which follows actual events from 1998 to 2003, an overall decrease of
emissions is observed, as car emissions drop by 10 kt CO2 and bus emissions increase by
1, 5 kt CO2. In the absence of the QBC (Scenario 2), emissions would have been 50% higher
in 2012 than that of Scenario 1. A modal shift induced by higher quality services (Scenario
3 and 4) can further reduce emissions. The environmental impact of the QBC serves as an
indication of the importance of policy in PT for curbing CO2 emissions of the sector
(McDonnell et al., 2008).
2.4.3 Vehicle Technology
Studies in Montreal (Zahabi et al., 2012), indicated that average GHG emissions (from total
travel) were lowest at central business areas and suburban households with cars (due to
dependence on POVs) that emit more GHG than those in the central business district (CBD).
The study showed that households with one adult have significantly less emissions than
those with many adults. Low income households emit 51% less GHGs as limited POVs
encourage car-pools and the use of PT.
When suggesting GHG reduction methods, vehicle fleet and rolling stock improvements
were considered according to the following scenarios: current GHG emissions caused by
Literature Review
27
existing technology, upgrading buses to hybrids, replacing trains with electric trains,
complete replacement of all PT fleet, as well as projecting fuel efficiency based on existing
trends. The use of hybrid buses results in an 11% decrease in GHG releases, electric trains
emit negligible GHG emission and a combination of the two measures enables a 32%
reduction. Although PT accessibility is more crucial (from an social perspective) than
implementing the use of greener vehicles, Zahabi et al. (2012) state that the best ways to
reduce GHG emissions would be to improve fuel efficiency of POV and making PT more
accessible, but first and foremost POV fuel efficiencies need to be tackled. Policies aimed
at fuel efficient vehicles that target POV trips and high income households should be
enforced.
By implementing reliable PT services, the dependence on POVs might decrease. Urban
planning plays an important role in reducing GHG emissions in the transport sector by
creating densely populated areas with proper access to PT. According to Zahabi et al. (2012)
a GHG reduction of 7% could be achieved by improving fuel efficiency with respect to POVs,
and PT emissions could be lowered by 32% if electric trains and hybrid buses replaced
current modes.
Chan et al. (2013) investigated the GHG emissions of using alternate fuels such as biodiesel
(with a ratio of canola oil to petroleum diesel of 20:80), CNG and diesel electric hybrid. An
analysis was done along the Cote-des-Neiges (CDN) transit corridor in Montreal, Canada,
which links two bus and one train station, on the Route 165 bus which showed that majority
of GHGs were emitted during operation. CNG produced the least emissions in the
manufacturing process from natural gas and diesel-electric hybrid technology emitted the
least GHG during operational phases. Overall, hybrid technology produced the least
emissions, followed by CNG, biodiesel and diesel-fuelled buses. Changing to biodiesel,
however, did not offer GHG savings as significant as expected (Chan et al., 2013).
2.4.4 Summary
Several solutions are adopted around the world to address challenges in the PT sector. The
development of PT systems occur at different rates depending on the potential,
requirements and most appropriate changes. There is much to be learned from the advance
of PT systems throughout the world and these studies provide an indication of what is
Literature Review
28
achievable through various options. The studies reviewed agree that CO2 emissions can be
lowered by PT, through the implementation of PT interventions. Crozet and Lopez-Ruiz
(2012) concluded that the immediate introduction of new technology is the most effective
way to reduce emissions from transportation. Thereafter, human choices and behaviour
towards available options must be addressed.
2.5 IRPTN as a Solution in South Africa
According to Hitge and van Dijk (2012), the limited investment in the transport sector in SA
over the past 30 years has prompted urgency for improvement. The growth of the informal
PT sector and operation of unreliable road vehicles, in conjunction with limited bus and rail
lines, make up the current PT system. Low quality inefficient PT services have resulted in
increased purchases and usage of POVs, further reducing PT ridership (Hitge and van Dijk,
2012). In an effort to combat the increasing issue of congestion in many municipalities, ROW
bus lanes have been implemented along major freeways, along with additional lanes and
flyovers. The addition of lanes however, does not alleviate the issue of congestion but
creates a greater road capacity to accommodate more vehicles (Thambiran and Diab, 2011).
The most effective solution according to the South African transportation sector is the
IRPTN.
The South African Department of Transport (DoT) introduced the Public Transport Action
Plan (PTAP) in 2007 to put the PT Strategy into practice. It focuses on two key areas:
accelerated modal upgrades and IRPTNs in up to 12 cities and 6 districts in SA over a 20-
year period. The three phases envisaged were (DoT RSA, 2007):
Phase 1 (2007 – 2010) – Accelerated modal recovery and catalytic IRPTN project;
Phase 2 (2010 – 2014) – Promote and deliver basic networks; and
Phase 3 (2014 – 2020) – Advance and sustain accessible networks.
Phase 1 was directed at modal upgrades specifically for the improvement of services for the
2010 FIFA World Cup, which forms part of the final plan to advance, promote and sustain
basic services and networks to be achieved with Phase 2 and 3. This section will provide
insight on the following:
Operational IRPTNs in South Africa including:
Literature Review
29
o Rea Vaya BRT system and Gautrain Rapid Rail Link – Gauteng Province;
o MyCiTi – Cape Town IRT;
o Libhongolethu Integrated PT System – Nelson Mandela Bay Municipality;
and
o Rustenburg Rapid Transit (planning phases) – North West Province.
Issues experienced in implementation;
The incremental approach; and
Increasing PT ridership.
2.5.1 South African IRPTNs
The general modal split of POV: PT in large South African cities is 50:50 (Onatu, 2011).
Private commuters usually carry few or no passengers, causing an increase in cars on the
road with occupancy of one, escalating congestion (Onatu, 2011). Unlike the minibus-taxi
industry, passenger rail and some bus services of SA are subsidised by the government.
Instead of the services complementing each other, in many instances, they are in
competition for commuters. The PT systems of SA are similar to those of Latin America,
which is why the planned BRT systems of SA have been modeled on the successful South
American BRT systems such as Bogota (AA, 2013).
The National Transport Master Plan (NATMAP 2050) goal is: “to develop a dynamic long-
term sustainable land-use or multi-modal transportation systems framework for the
development of network infrastructure facilities, interchange terminal facilities and service
delivery” (DoT RSA, 2010), An integrated PT network, as defined by the NLTA of 2009 (RSA,
2009) is: “A system in a particular area that integrates PT services between modes, with
through-ticketing and other appropriate mechanisms to provide users of the system to travel
from their origins to destinations in a seamless manner”. Many municipalities focused on
BRT as the first step towards an integrated PT system.
The benefits of BRT include: safe and secure accessible PT, job creation and containment
of urban sprawl, and densification along corridors and sustainable transport (AA, 2013).
Cities such as Johannesburg, Cape Town and Nelson Mandela Bay introduced IRPTNs with
a central BRT component (Rea Vaya, MyCiTi and the Libhongolethu, respectively) to
provide PT services for the 2010 FIFA Soccer World Cup and years after. The IRPTNs
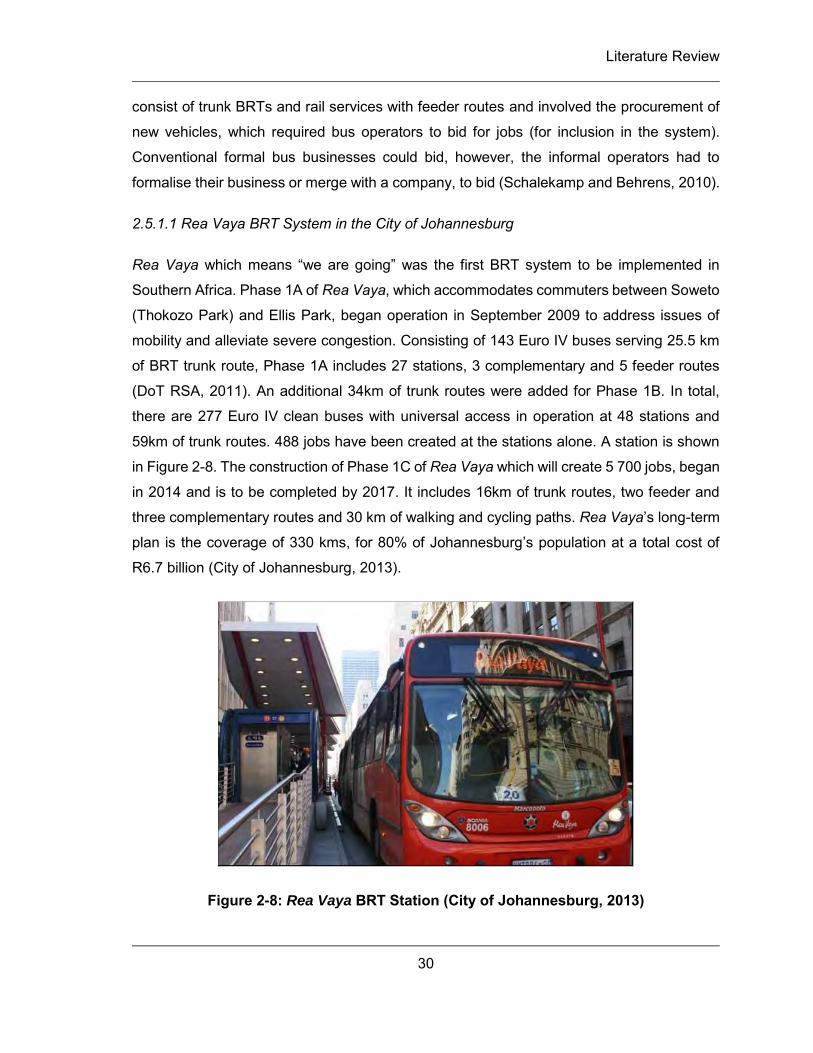
Literature Review
30
consist of trunk BRTs and rail services with feeder routes and involved the procurement of
new vehicles, which required bus operators to bid for jobs (for inclusion in the system).
Conventional formal bus businesses could bid, however, the informal operators had to
formalise their business or merge with a company, to bid (Schalekamp and Behrens, 2010).
2.5.1.1 Rea Vaya BRT System in the City of Johannesburg
Rea Vaya which means “we are going” was the first BRT system to be implemented in
Southern Africa. Phase 1A of Rea Vaya, which accommodates commuters between Soweto
(Thokozo Park) and Ellis Park, began operation in September 2009 to address issues of
mobility and alleviate severe congestion. Consisting of 143 Euro IV buses serving 25.5 km
of BRT trunk route, Phase 1A includes 27 stations, 3 complementary and 5 feeder routes
(DoT RSA, 2011). An additional 34km of trunk routes were added for Phase 1B. In total,
there are 277 Euro IV clean buses with universal access in operation at 48 stations and
59km of trunk routes. 488 jobs have been created at the stations alone. A station is shown
in Figure 2-8. The construction of Phase 1C of Rea Vaya which will create 5 700 jobs, began
in 2014 and is to be completed by 2017. It includes 16km of trunk routes, two feeder and
three complementary routes and 30 km of walking and cycling paths. Rea Vaya’s long-term
plan is the coverage of 330 kms, for 80% of Johannesburg’s population at a total cost of
R6.7 billion (City of Johannesburg, 2013).
Figure 2-8: Rea Vaya BRT Station (City of Johannesburg, 2013)
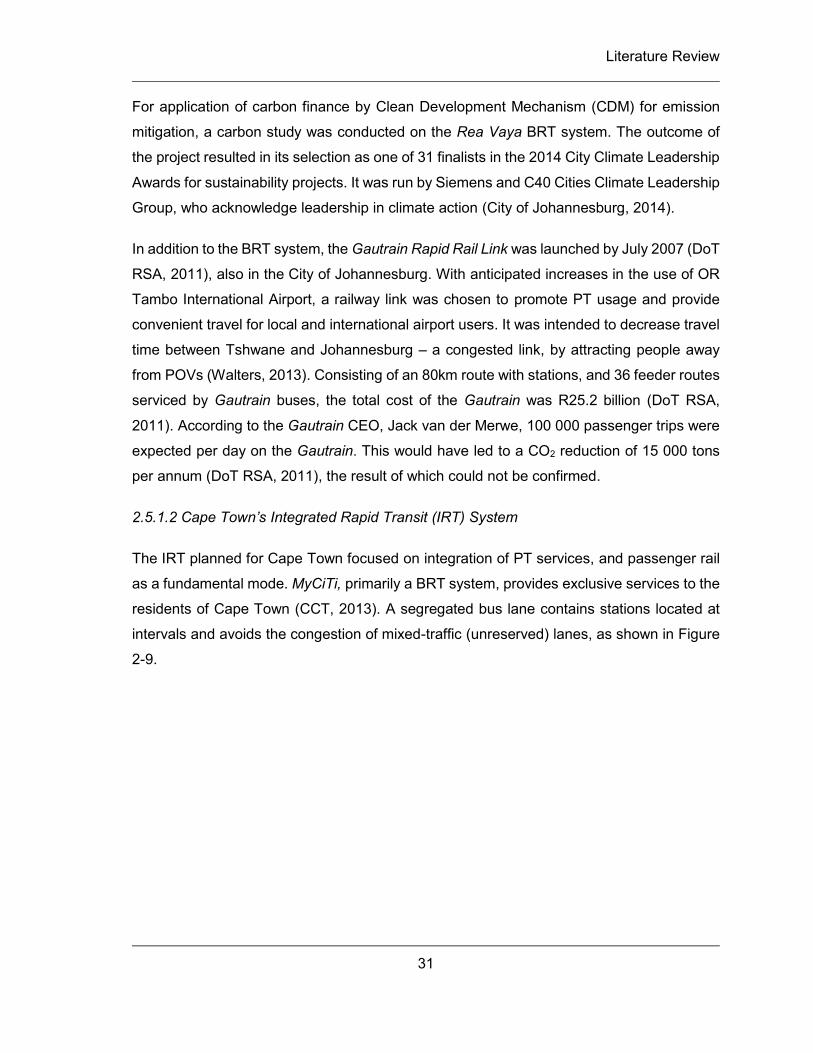
Literature Review
31
For application of carbon finance by Clean Development Mechanism (CDM) for emission
mitigation, a carbon study was conducted on the Rea Vaya BRT system. The outcome of
the project resulted in its selection as one of 31 finalists in the 2014 City Climate Leadership
Awards for sustainability projects. It was run by Siemens and C40 Cities Climate Leadership
Group, who acknowledge leadership in climate action (City of Johannesburg, 2014).
In addition to the BRT system, the Gautrain Rapid Rail Link was launched by July 2007 (DoT
RSA, 2011), also in the City of Johannesburg. With anticipated increases in the use of OR
Tambo International Airport, a railway link was chosen to promote PT usage and provide
convenient travel for local and international airport users. It was intended to decrease travel
time between Tshwane and Johannesburg – a congested link, by attracting people away
from POVs (Walters, 2013). Consisting of an 80km route with stations, and 36 feeder routes
serviced by Gautrain buses, the total cost of the Gautrain was R25.2 billion (DoT RSA,
2011). According to the Gautrain CEO, Jack van der Merwe, 100 000 passenger trips were
expected per day on the Gautrain. This would have led to a CO2 reduction of 15 000 tons
per annum (DoT RSA, 2011), the result of which could not be confirmed.
2.5.1.2 Cape Town’s Integrated Rapid Transit (IRT) System
The IRT planned for Cape Town focused on integration of PT services, and passenger rail
as a fundamental mode. MyCiTi, primarily a BRT system, provides exclusive services to the
residents of Cape Town (CCT, 2013). A segregated bus lane contains stations located at
intervals and avoids the congestion of mixed-traffic (unreserved) lanes, as shown in Figure
2-9.
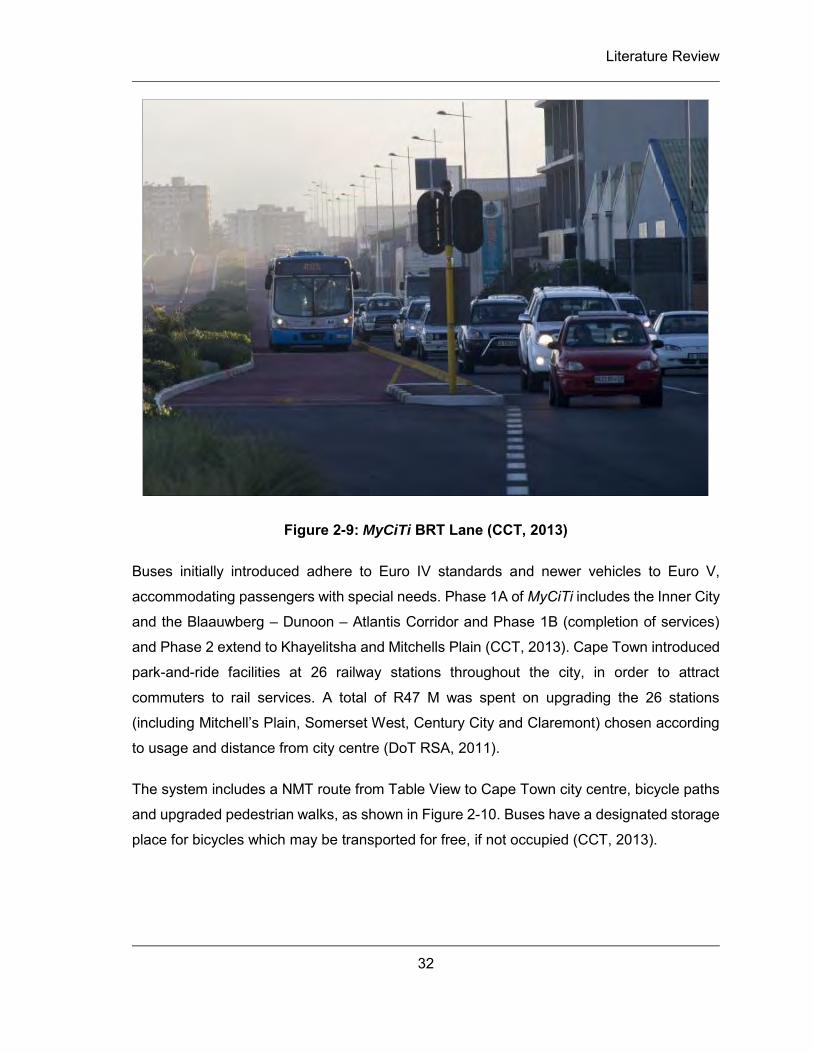
Literature Review
32
Figure 2-9: MyCiTi BRT Lane (CCT, 2013)
Buses initially introduced adhere to Euro IV standards and newer vehicles to Euro V,
accommodating passengers with special needs. Phase 1A of MyCiTi includes the Inner City
and the Blaauwberg – Dunoon – Atlantis Corridor and Phase 1B (completion of services)
and Phase 2 extend to Khayelitsha and Mitchells Plain (CCT, 2013). Cape Town introduced
park-and-ride facilities at 26 railway stations throughout the city, in order to attract
commuters to rail services. A total of R47 M was spent on upgrading the 26 stations
(including Mitchell’s Plain, Somerset West, Century City and Claremont) chosen according
to usage and distance from city centre (DoT RSA, 2011).
The system includes a NMT route from Table View to Cape Town city centre, bicycle paths
and upgraded pedestrian walks, as shown in Figure 2-10. Buses have a designated storage
place for bicycles which may be transported for free, if not occupied (CCT, 2013).
Literature Review
33
Figure 2-10: MyCiTi Bicycle Path (Transport for Cape Town, 2013)
Cape Town’s transportation demand management (TDM) measures include: the promotion
of higher occupancy vehicles, support policies and tax incentives, and investigation of road
user charges (DoT RSA, 2011). These interventions will encourage GHG savings and
enable a more environmentally friendly PT system.
2.5.1.3 Libhongolethu Integrated PT System (IPTS) in Nelson Mandela Bay
Situated in the Eastern Cape, the Nelson Mandela Bay Metropolitan Municipality (NMBMM),
is the second largest metropolitan in area, after Ekurhuleni in Gauteng (NMBMM, 2015). It
comprises three urban nodes Port Elizabeth, Uitenhage and Despatch, which house 90% of
the total population. In 2007, PT comprised 40% of all trips, 75% of which was by minibus-
taxi. With a population of 1.3M, the structural design of the BRT planned for NMBMM was
based on the operational BRT of Pereira, Colombia, with the most similar population of
750 000 (NMMM, 2007). In NMBMM, however, the restriction on physical space for road
reserve posed as a significant challenge. The BRT system had to be incorporated into the
existing road network and limitations were created as the ROW lane had to go through the
city centre, the arrangement of which was already established. This lead to further issues,
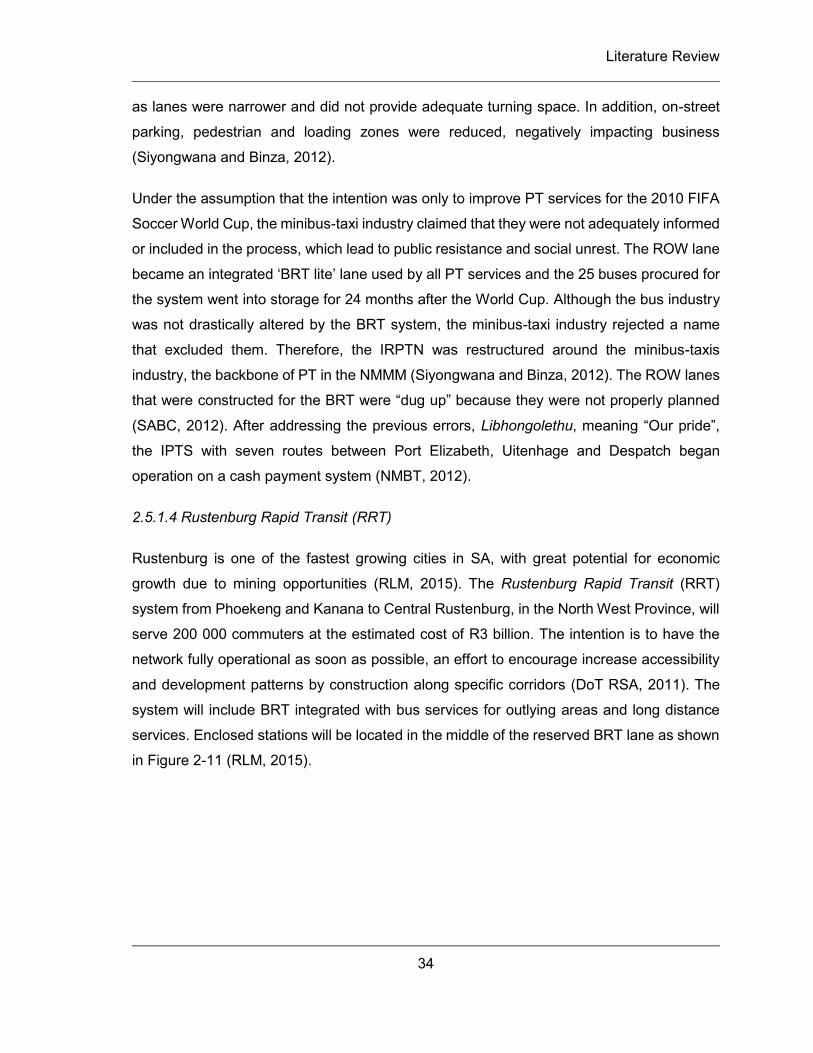
Literature Review
34
as lanes were narrower and did not provide adequate turning space. In addition, on-street
parking, pedestrian and loading zones were reduced, negatively impacting business
(Siyongwana and Binza, 2012).
Under the assumption that the intention was only to improve PT services for the 2010 FIFA
Soccer World Cup, the minibus-taxi industry claimed that they were not adequately informed
or included in the process, which lead to public resistance and social unrest. The ROW lane
became an integrated ‘BRT lite’ lane used by all PT services and the 25 buses procured for
the system went into storage for 24 months after the World Cup. Although the bus industry
was not drastically altered by the BRT system, the minibus-taxi industry rejected a name
that excluded them. Therefore, the IRPTN was restructured around the minibus-taxis
industry, the backbone of PT in the NMMM (Siyongwana and Binza, 2012). The ROW lanes
that were constructed for the BRT were “dug up” because they were not properly planned
(SABC, 2012). After addressing the previous errors, Libhongolethu, meaning “Our pride”,
the IPTS with seven routes between Port Elizabeth, Uitenhage and Despatch began
operation on a cash payment system (NMBT, 2012).
2.5.1.4 Rustenburg Rapid Transit (RRT)
Rustenburg is one of the fastest growing cities in SA, with great potential for economic
growth due to mining opportunities (RLM, 2015). The Rustenburg Rapid Transit (RRT)
system from Phoekeng and Kanana to Central Rustenburg, in the North West Province, will
serve 200 000 commuters at the estimated cost of R3 billion. The intention is to have the
network fully operational as soon as possible, an effort to encourage increase accessibility
and development patterns by construction along specific corridors (DoT RSA, 2011). The
system will include BRT integrated with bus services for outlying areas and long distance
services. Enclosed stations will be located in the middle of the reserved BRT lane as shown
in Figure 2-11 (RLM, 2015).
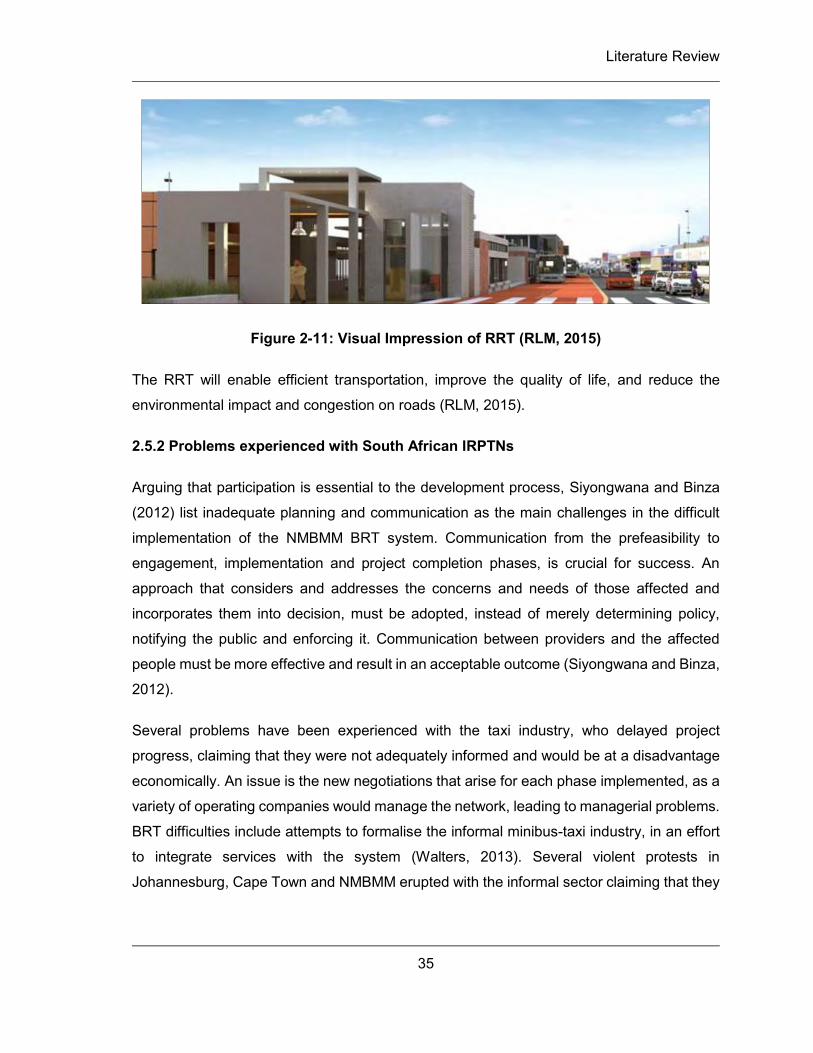
Literature Review
35
Figure 2-11: Visual Impression of RRT (RLM, 2015)
The RRT will enable efficient transportation, improve the quality of life, and reduce the
environmental impact and congestion on roads (RLM, 2015).
2.5.2 Problems experienced with South African IRPTNs
Arguing that participation is essential to the development process, Siyongwana and Binza
(2012) list inadequate planning and communication as the main challenges in the difficult
implementation of the NMBMM BRT system. Communication from the prefeasibility to
engagement, implementation and project completion phases, is crucial for success. An
approach that considers and addresses the concerns and needs of those affected and
incorporates them into decision, must be adopted, instead of merely determining policy,
notifying the public and enforcing it. Communication between providers and the affected
people must be more effective and result in an acceptable outcome (Siyongwana and Binza,
2012).
Several problems have been experienced with the taxi industry, who delayed project
progress, claiming that they were not adequately informed and would be at a disadvantage
economically. An issue is the new negotiations that arise for each phase implemented, as a
variety of operating companies would manage the network, leading to managerial problems.
BRT difficulties include attempts to formalise the informal minibus-taxi industry, in an effort
to integrate services with the system (Walters, 2013). Several violent protests in
Johannesburg, Cape Town and NMBMM erupted with the informal sector claiming that they
Literature Review
36
were inadequately informed on the BRT plans, which would lead to a decrease in
employment opportunities (Schalekamp and Behrens, 2010).
Months before the launch of Rea Vaya, violent threats were made as it was believed that a
loss of jobs would result. The United Taxi Association Forum applied to stop the launch and
South African National Taxi Council (SANTACO) claimed that they were left out of the
negotiations and violent shootings took place at the Soweto trunk and feeder routes. Police
guards were positioned at the stations and negotiations continued for 14 months until
September 2010. Passenger safety influenced low ridership levels of the system (Venter,
2013), which in turn resulted in higher BRT emissions. In addition, the negatively perception
of safety of the minibus-taxi industry was associated with the BRT system in NMBMM, and
resulted in support from low income users only (Siyongwana and Binza, 2012).
2.5.3 Leapfrogging vs. the Incremental Approach
Leapfrogging is a concept that introduces a complete transformation through large,
expensive jumps. It is an intensive approach, aimed at a selected area, which
simultaneously addresses all issues in a system at a single geographical location. In
contrast, Hitge and van Dijk (2012) summarise the incremental approach as a strategy that
does not solve all challenges in one step instead, tackles one problem at a time, enabling
assessment at each level and adjustment before further action is taken. Incrementalism
allows small steps to be taken, on a large scale in order to achieve the final goal (Hitge and
van Dijk, 2012).
Leapfrogging and incrementalism use different methods, namely a few intensively planned
expensive jumps versus many small steps, respectively, to achieve the same result, as
shown in Figure 2-12. In terms of transport planning, leapfrogging focuses on a direct move
to a high quality system by fully implementing one corridor at a time. The impact of this
approach will only be seen at the end of the phase and might be irreversible or too expensive
to correct. In cities that do not immediately benefit from improvement, poor PT services
continue and may further deteriorate and reduce ridership. The demand for PT ridership has
to be built up after the intervention is implemented. In contrast, the incremental approach
addresses once issue at a time, such as formalising the minibus-taxi industry, thereby
improving all systems in the same way and retaining patronage (Hitge and van Dijk, 2012).
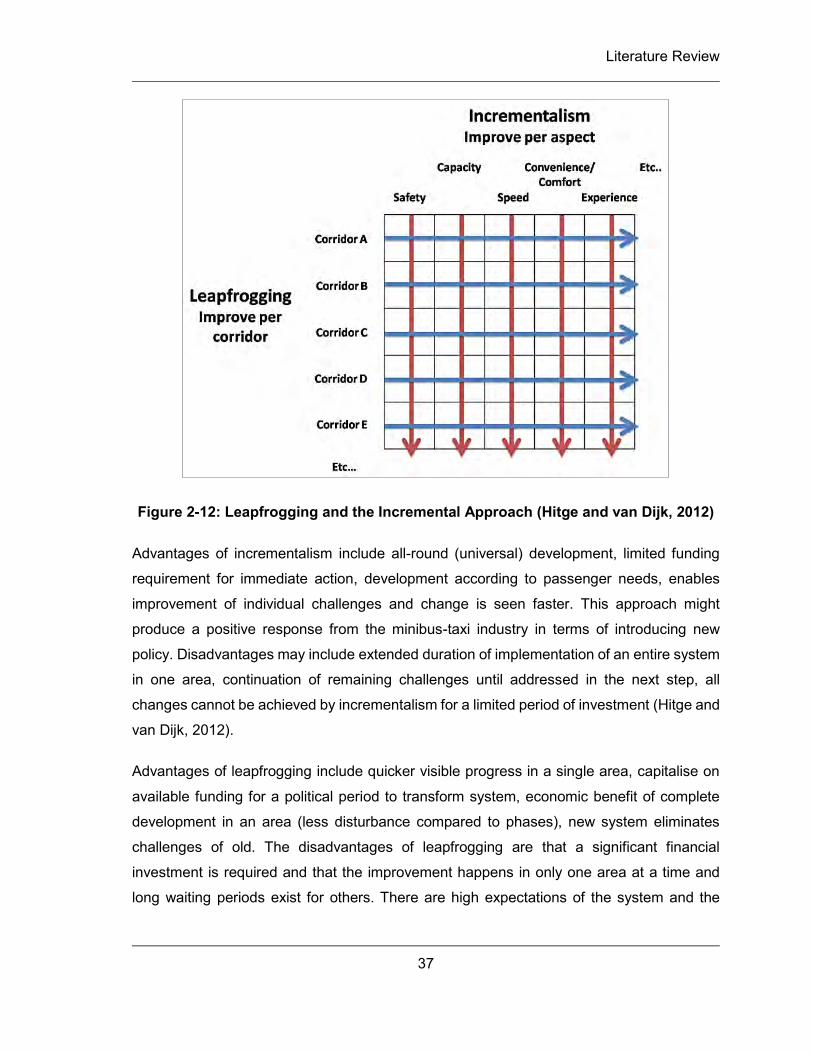
Literature Review
37
Figure 2-12: Leapfrogging and the Incremental Approach (Hitge and van Dijk, 2012)
Advantages of incrementalism include all-round (universal) development, limited funding
requirement for immediate action, development according to passenger needs, enables
improvement of individual challenges and change is seen faster. This approach might
produce a positive response from the minibus-taxi industry in terms of introducing new
policy. Disadvantages may include extended duration of implementation of an entire system
in one area, continuation of remaining challenges until addressed in the next step, all
changes cannot be achieved by incrementalism for a limited period of investment (Hitge and
van Dijk, 2012).
Advantages of leapfrogging include quicker visible progress in a single area, capitalise on
available funding for a political period to transform system, economic benefit of complete
development in an area (less disturbance compared to phases), new system eliminates
challenges of old. The disadvantages of leapfrogging are that a significant financial
investment is required and that the improvement happens in only one area at a time and
long waiting periods exist for others. There are high expectations of the system and the
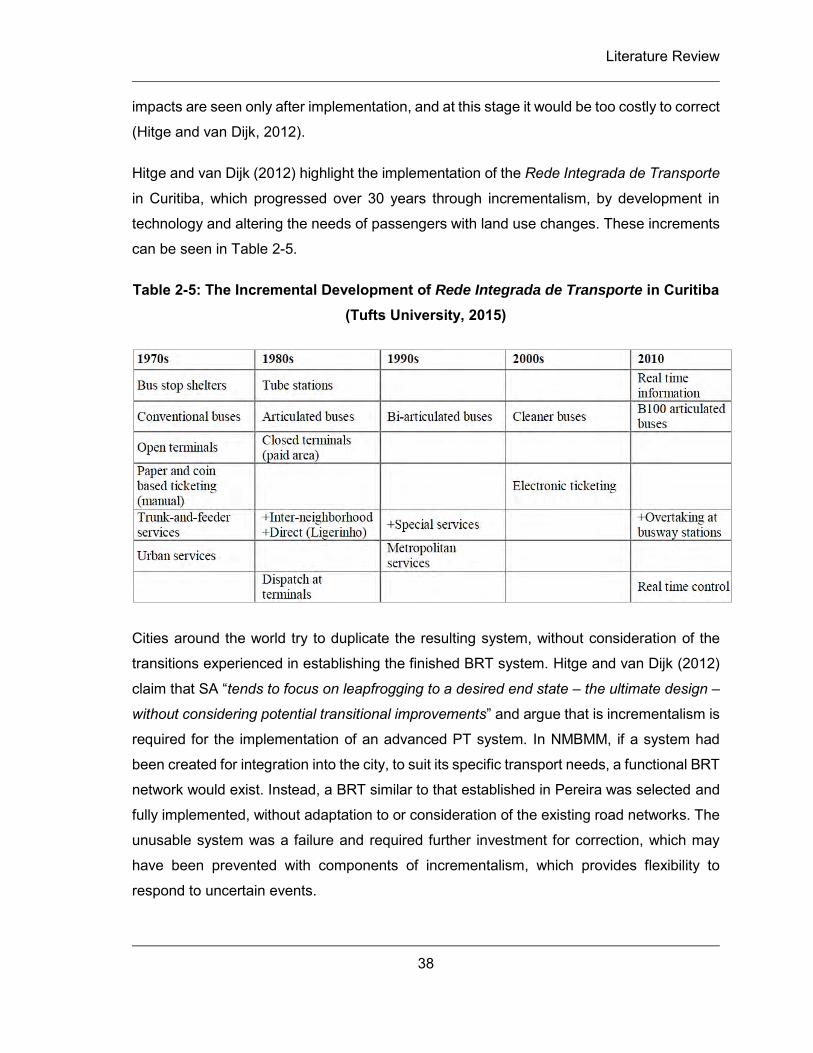
Literature Review
38
impacts are seen only after implementation, and at this stage it would be too costly to correct
(Hitge and van Dijk, 2012).
Hitge and van Dijk (2012) highlight the implementation of the Rede Integrada de Transporte
in Curitiba, which progressed over 30 years through incrementalism, by development in
technology and altering the needs of passengers with land use changes. These increments
can be seen in Table 2-5.
Table 2-5: The Incremental Development of Rede Integrada de Transporte in Curitiba (Tufts University, 2015)
Cities around the world try to duplicate the resulting system, without consideration of the
transitions experienced in establishing the finished BRT system. Hitge and van Dijk (2012)
claim that SA “tends to focus on leapfrogging to a desired end state – the ultimate design –
without considering potential transitional improvements” and argue that is incrementalism is
required for the implementation of an advanced PT system. In NMBMM, if a system had
been created for integration into the city, to suit its specific transport needs, a functional BRT
network would exist. Instead, a BRT similar to that established in Pereira was selected and
fully implemented, without adaptation to or consideration of the existing road networks. The
unusable system was a failure and required further investment for correction, which may
have been prevented with components of incrementalism, which provides flexibility to
respond to uncertain events.
Literature Review
39
The City of Cape Town is using leapfrogging to implement one corridor at a time for success
in a chosen area. Phase 1 of MyCiTi accommodates approximately 15% of the city’s
residents. A benefit is the technology development for the shift from car to PT usage. The
remaining areas, however, with inadequate capacity and decreasing level of PT service,
favour the usage of POVs. A possible application of incrementalism (or an alternative) to
MyCiTi includes: improving driving through training and enforcement in the minibus-taxi
sector, increasing security technology for bus and railway travel, improving the running
schedule of bus and rail services, and integrating fares and ticket stations and equipment
into the system. Other steps include the replacement of vehicles, road and facility upgrades
and improvements for convenience (Hitge and van Dijk, 2012). This is simply an example of
applying the incremental approach to a South African IRPTN, which should be investigated
as part of the planning process from inception, for the most effective implementation method.
Monitoring and feedback received by transport departments record issues experienced in
municipalities, which assists in the incremental approach.
Both approaches have benefits and detriments depending on the circumstances of each
project, therefore, both approaches must be investigated and evaluated for the best
decision. Larger issues or stabilisation of the system can be addressed first through
incrementalism, as it allows for focus on one aspect across all corridors. Figure 2-12 shows
how a combination of the two could be used to ease into the transition of completely
transforming a geographic location. With adequate finances and management, leapfrogging
may be successful in larger cities, however smaller cities should adopt the incremental
approach to individual challenges (Hitge and van Dijk, 2012). In terms of GHG emissions,
these approaches have different consequences. In the incremental approach, emission
savings would be achieved across the board in one instance, whereas emission savings for
the leapfrog approach would be achieved over much longer periods of time.
2.6 Increasing PT Ridership
A study conducted by Chen and Wang (2012) showed that an increased ridership of PT
services through policy for PT priority will have the most desired outcome with regard to
reducing emissions. The promotion of modal shift to PT (over the control of POV purchases
and reduction of average travel distances through planned urban development) could
reduce CO2 emissions from transportation by 24.13% in 2020 in a city in China (Chen and
Literature Review
40
Wang, 2012). As well as improving service quality of PT facilities, high ridership and possible
modal shifts towards PT can be achieved by the following measures:
Walking and bicycle (NMT) facilities;
Provision of park and ride facilities (Cuenot et al., 2012);
Promotion of PT as cheaper and less harmful to the environment; and
Address of negative public perception to PT (Nair and Kumar, 2005).
Results indicated that POVs produced the most GHGs, in comparison to other modes.
If POV usage is made more expensive or inferior to PT services, usage will be discouraged.
The following options are available for implementation (Chen and Wang, 2012):
Restricting POV usage on specific days of the week (similar to Bogota);
Enforcing car-free zones;
More stringent POV monitoring (vehicle licenses and roadworthiness) and penalties;
Disincentives on POV purchases (increased taxes) and increasing fuel levy;
Implementing or increasing parking fees; and
Implementing road user charges on POV.
It is essential that the provision of reliable PT services is ensured prior to enforcing further
measures to decrease POV usage, as timing of interventions is vital.
2.7 Gaps in Knowledge and Research on IRPTNs and GHG Emissions
Worldwide studies have been conducted on the success of rapid transportation systems as
a means of increasing accessibility and moving large populations along specified corridors.
The success of emission reductions of the PT sector and corresponding environmental
impact in Brazil and Colombia has inspired several similar systems throughout the world.
The definition of BRT follows the characteristics of the established systems in Curitiba and
Bogota, due to their achievement in the transformation of the cities. BRT presents a solution
which is cheaper to implement than RRT.
One of the significant results of IRPTNs globally is the reduction in GHG emissions. Only a
few studies, however, have been conducted in developing countries in effort to quantify
Literature Review
41
these reductions. In SA, a Carbon Credits study was only conducted the Rea Vaya BRT
system. Similarly, this study, also measuring the reductions in PT emissions, serves as the
first of its kind carbon calculation for the GO!Durban IRPTN to be implemented in the EM (in
comparison to the previous system). The scarcity of carbon emission studies within the PT
sector of SA must be highlighted, in particular, limited scenario analyses with respect to
GHG in this field. This underlines the requirement for this study and further studies to be
undertaken, in order to understand the potential impact for improved decision-making. As a
means of easier transition from project inception to successful PT interventions, the
incremental approach must be considered and properly assessed against leapfrogging, and
the environmental effects of both evaluated.
2.8 Summary
The irreversible effects of climate change are increasing globally and cannot be ignored.
Emission regulations must be applied world-wide and mitigative measures, together with
adaptation to change, must be adopted. Although transportation is essential to the modern
world, the impacts of the sector are rapidly increasing, pushing beyond 25% of global
emissions. Therefore, the transport sector creates the opportunity to reduce worldwide
emissions on a large scale.
In countries with disorganised, ineffective PT systems, travel by POVs has become the safe,
reliable choice. Local and international case studies show that the provision of effective PT
services can ensure mobility of passengers (stability of the economy and improved quality
of life through better access), reduce transportation costs and encourage the use of PT.
There is, however, an absence of GHG emission studies in many large municipalities in SA.
Carbon studies serve as an indicator of environmental impact and project viability for
informed decision-making. This study serves as an attempt to fill the gap with regard to the
EM.
Many challenges have been experienced with the implementation of BRTs in SA and around
the world, and there is much to be learned from these in ensuring the success of GO!Durban.
Although government commitment and initial investment of rapid PT systems are high, if
followed through with proper management, enforcement and disincentives for POV usage,
safe, affordable access to PT can be provided and the reduction of GHG emissions enabled.
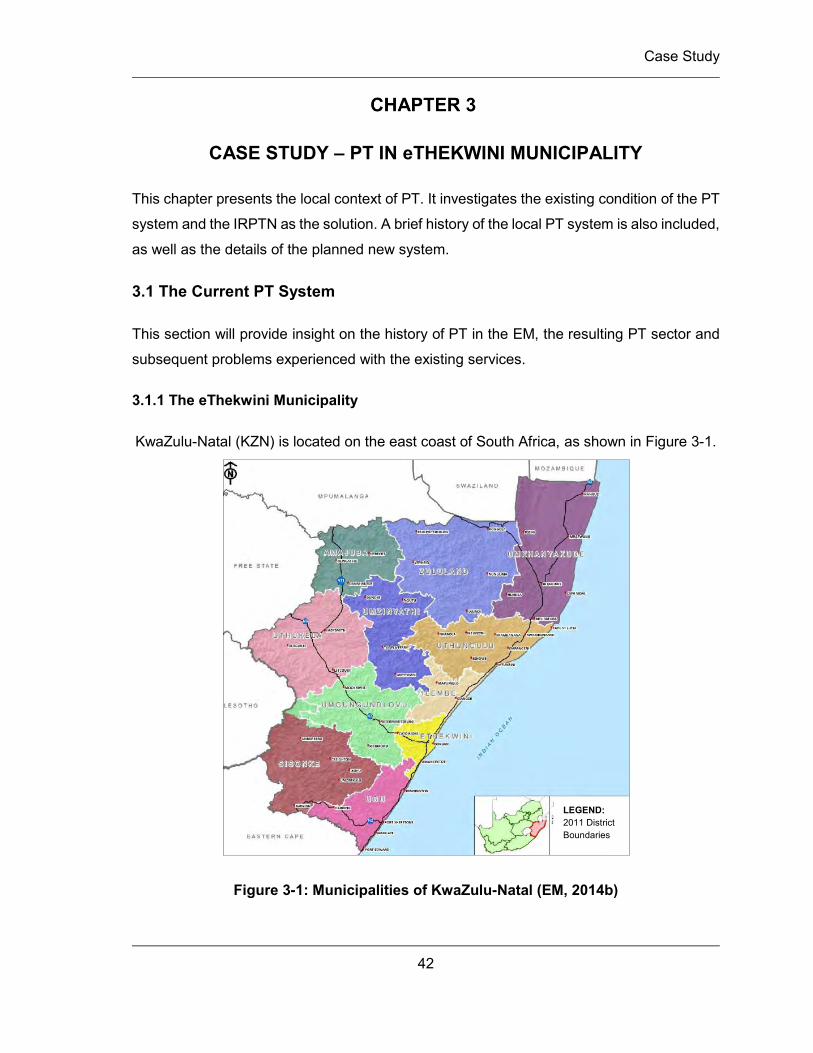
Case Study
42
CASE STUDY – PT IN eTHEKWINI MUNICIPALITY
This chapter presents the local context of PT. It investigates the existing condition of the PT
system and the IRPTN as the solution. A brief history of the local PT system is also included,
as well as the details of the planned new system.
3.1 The Current PT System
This section will provide insight on the history of PT in the EM, the resulting PT sector and
subsequent problems experienced with the existing services.
3.1.1 The eThekwini Municipality
KwaZulu-Natal (KZN) is located on the east coast of South Africa, as shown in Figure 3-1.
Figure 3-1: Municipalities of KwaZulu-Natal (EM, 2014b)
LEGEND: 2011 District Boundaries
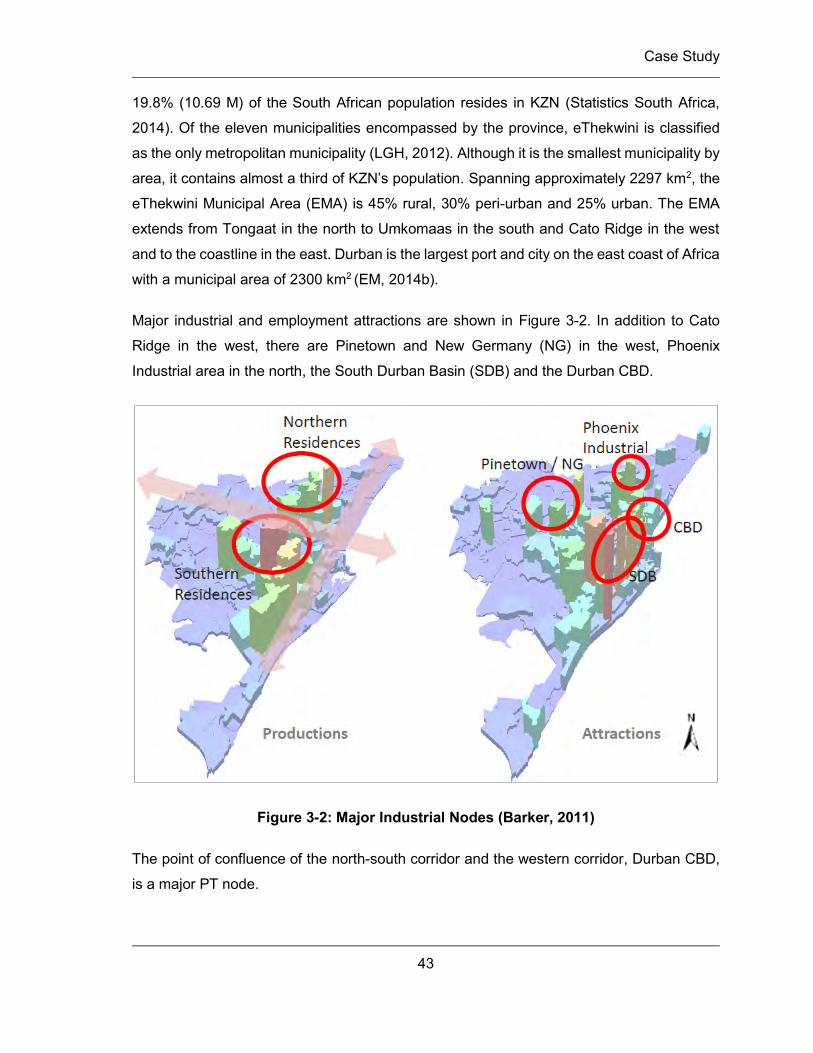
Case Study
43
19.8% (10.69 M) of the South African population resides in KZN (Statistics South Africa,
2014). Of the eleven municipalities encompassed by the province, eThekwini is classified
as the only metropolitan municipality (LGH, 2012). Although it is the smallest municipality by
area, it contains almost a third of KZN’s population. Spanning approximately 2297 km2, the
eThekwini Municipal Area (EMA) is 45% rural, 30% peri-urban and 25% urban. The EMA
extends from Tongaat in the north to Umkomaas in the south and Cato Ridge in the west
and to the coastline in the east. Durban is the largest port and city on the east coast of Africa
with a municipal area of 2300 km2 (EM, 2014b).
Major industrial and employment attractions are shown in Figure 3-2. In addition to Cato
Ridge in the west, there are Pinetown and New Germany (NG) in the west, Phoenix
Industrial area in the north, the South Durban Basin (SDB) and the Durban CBD.
Figure 3-2: Major Industrial Nodes (Barker, 2011)
The point of confluence of the north-south corridor and the western corridor, Durban CBD,
is a major PT node.
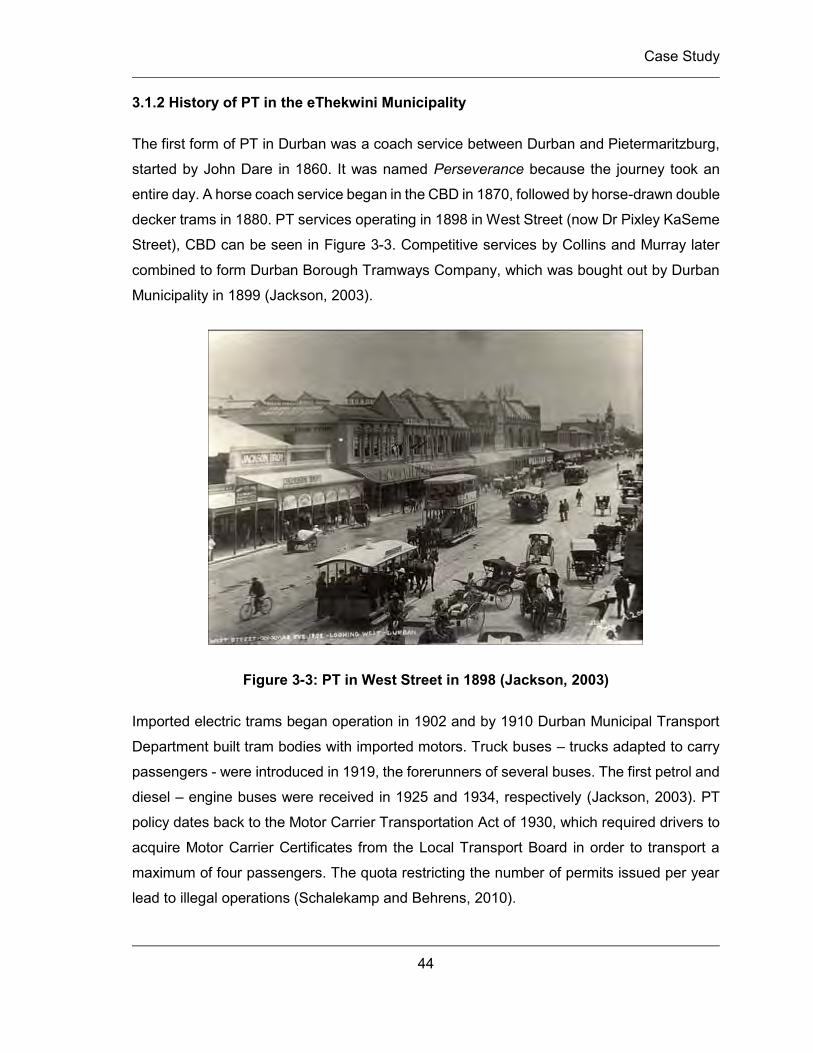
Case Study
44
3.1.2 History of PT in the eThekwini Municipality
The first form of PT in Durban was a coach service between Durban and Pietermaritzburg,
started by John Dare in 1860. It was named Perseverance because the journey took an
entire day. A horse coach service began in the CBD in 1870, followed by horse-drawn double
decker trams in 1880. PT services operating in 1898 in West Street (now Dr Pixley KaSeme
Street), CBD can be seen in Figure 3-3. Competitive services by Collins and Murray later
combined to form Durban Borough Tramways Company, which was bought out by Durban
Municipality in 1899 (Jackson, 2003).
Figure 3-3: PT in West Street in 1898 (Jackson, 2003)
Imported electric trams began operation in 1902 and by 1910 Durban Municipal Transport
Department built tram bodies with imported motors. Truck buses – trucks adapted to carry
passengers - were introduced in 1919, the forerunners of several buses. The first petrol and
diesel – engine buses were received in 1925 and 1934, respectively (Jackson, 2003). PT
policy dates back to the Motor Carrier Transportation Act of 1930, which required drivers to
acquire Motor Carrier Certificates from the Local Transport Board in order to transport a
maximum of four passengers. The quota restricting the number of permits issued per year
lead to illegal operations (Schalekamp and Behrens, 2010).
Case Study
45
The implementation of Apartheid policies (1948–1994), which introduced racial segregation,
created long commuting distances between areas. Low quality and low coverage services
encouraged the operation of minibus-taxi services and although unsafe and unsustainable,
commuters have turned to this mode for mobility (Prozzi, et al., 2002). After the introduction
of minibuses, in 1984 the South African Black Taxi Association and Transport Deregulation
Act of 1988 issued 1453 permits. This number increased by 2537% over the next five years
to 38317, reaching 50 000 minibuses nationally. Minibuses were later phased out over four
years and racial segregation of bus services, implemented. In 1987 Durban Transport
introduced the Mynah Bus Service with 21-seater Mercedes Benz buses. The end of
Apartheid was followed by the development and approval of the White Paper on National
Transport Policy in 1996 for the improvement of transport operations and proposed transport
integration systems (Schalekamp and Behrens, 2010).
In 2003 Durban Transport was sold to the Remnant (Pty) Ltd Alton Coach Africa Consortium.
Privatisation and profit-oriented services have resulted, associated with low levels of service,
unstable government subsidies and reduced ridership (Jackson, 2003). The legacy of the
apartheid era has greatly influenced PT in SA and is still being addressed today. Bearing
this in mind, the significant impact on fuel usage and emissions was not a major concern in
the sector (Prozzi et al., 2002). To keep up with global regulations, however, the usage of
lead-based petrol was completely discontinued by 2006, advancing vehicular technology.
This lead to the introduction of Euro 2 and Euro II Emission Standards for pollution control
technology, such as catalytic converters, in vehicles in SA. Previous vehicles could maintain
operation, however all new vehicles were in adherence to the new specifications (Thambiran
and Diab, 2011).
With the decrease in quality of PT services and increasing subsidies, the DoT introduced
the “Fundamental Restructuring of Durban’s PT System” as priority in 1999. The aim was
the improvement of service quality by the development of a cost effective strategy (ETA,
2005). National Land Transport Transition Act of 2000 (NLTTA), later replaced by the
National Land Transport Act of 2009 (Act 5 of 2009), defined responsibilities of government.
The eThekwini Transport Authority (ETA) was established in 2004 to manage the provision
of PT services in the EMA. The PT Plan (PTP) of 2005, as part of the Integrated Transport
Plan for 2005-2010, specifies long-term strategic planning providing direction for short-term
planning. It documents the following implementation strategies (ETA, 2005):
Case Study
46
Rail Strategy:
o Rail investment for north-south corridor;
o New rail spur line to Bridge City;
o Upgrade and Revitalisation of Chatsworth Rail Service;
o Marketing of north-south PT corridor system; and
o New Kings Park Rail Station.
Bus Strategy:
o Introduce feeder-distribution services (formalisation of appropriate minibus-
taxi services); and
o Remove or reposition bus services in direct competition with rail services.
Minibus-taxi Strategy:
o Regulate and control operations;
o Remove/reposition services duplicated in rail services; and
o Improve infrastructure and operating conditions for existing services.
NMT strategy to implement cycling-development projects; and
Provision of universal access vehicles.
The PTAP (2007) is an extension of the PT Strategy aiming to address the need for high
quality PT services and PTP (2005) in SA in three phases. The focus of Phase 1 is
accelerated modal recovery interventions including provision for the 2010 FIFA World Cup
in host cities. It involved a fast-track programme over four years (2007-2010) including the
following plans (DoT RSA, 2007):
Taxi Recapitalisation Plan (TRP);
Passenger Rail Plan; and
Commuter Bus Transformation Plan.
It was planned that by 2009/10, 75 000 unroadworthy minibus-taxi must be ‘scrapped’ under
the TRP and replaced by new vehicles. The TRP is an intervention introduced by
government in October 2006 to bring about safe, effective services. It involves the scrapping
of old minibus-taxis for an allowance and voluntary replacement with new vehicles (which
are approved by the South African Bureau of Standards). The Rail Plan measures the
Case Study
47
developments in rolling stock and infrastructure required to increase – service reliability,
station passenger access and quality of service. Included in the 2 000 rail coaches must be
upgraded (rolling stock refurbishment) the following upgrades were classified as high priority
in KZN: Reunion Station, Avoca signals and new Umgeni Bridge line (DoT RSA, 2007). The
bus plan included the transfer of bus contracts to metropolitan transport authorities and
subsidisation to distance-based (instead of passenger-based). In addition, 30% of
contracted bus services were to adhere to contract vehicles specifications. All upgrades
were to be done in accordance with universal access standards. Plans for NMT and public
space networks and promotion of safe NMT conditions, as well as expansion of the bicycle
programme, Shova Kalula, were detailed in the PTAP (DoT RSA, 2007).
3.1.3 Overview of the Existing Local PT System
The existing PT system of the EM consists of on-road and railway modes, namely:
Passenger Rail Agency of South Africa (PRASA);
Bus services;
Long-distance services;
Metered-taxi operations; and
Non-motorised transport (NMT) Facilities.
For the purpose of this study long-distance and metered-taxi operations will not be
considered.
The KZN DoT PT vision is (ETA, 2005): “To improve the quality of life of PT users and to
enhance the viability of all sectors reliant on PT within KwaZulu-Natal, through the
development of a safe, efficient, effective, economically and environmentally sustainable PT
system which drives the economic and social upliftment of the Province”. Within the EMA,
ETA’s mission is: “To provide and manage a world-class transport system with a PT focus,
providing high levels of mobility and accessibility for the movement of people and goods in
a safe, sustainable and affordable manner” (ETA, 2005).
Isipingo (to the south), Durban CBD, Bridge City (to the north) and Pinetown (to the west)
have been identified as major PT nodes (ETA, 2005), as indicated by Figure 3-4.
Case Study
48
Figure 3-4: Existing PT Services and Nodes (ETA, 2005)
An estimated 40% of the EMA population utilises available PT services in the following order:
minibus-taxi (68%), bus (25%) and rail (7%) (EM, 2014/2015). The National Household
Travel Survey (2003) indicated that existing PT users are dissatisfied with the quality of the
PT service. Results showed that for rail, minibus-taxi and bus services: 71%, 55% and 54%
of users are frustrated with the level of crowding and 53%, 64% and 74% of users are
unhappy with facilities at stops, ranks and stations, respectively (DoT RSA, 2007).
3.1.3.1 Passenger Rail Agency of South Africa (PRASA)
The South African Rail Commuter Corporation (SARCC) was transformed into PRASA in
2004, for the provision of improved mobility and accessibility for all. The primary objective
of PRASA is: “to ensure that, at the request of the DoT, rail commuter services are provided
within, to and from the Republic of South Africa in the interest of the public”. PRASA is
responsible for the operation and maintenance of local trains for Metrorail and Shosholoza
Meyl, under the PRASA Rail Division (PRASA, 2010). Metrorail operates at 317 stations in
KZN, Gauteng, Cape Town and Eastern Cape; transporting over 2.2 M passengers annually.
The operational Metrorail network in the EMA is shown in Figure 3-5.
Case Study
49
Figure 3-5: The Metrorail Network in eThekwini Municipality (EM, 2014b)
LEGEND
eThekwini Municipality
Railway Stations
Rail
Major Public Transport Nodes
Other Significant Public Transport Nodes
Airport
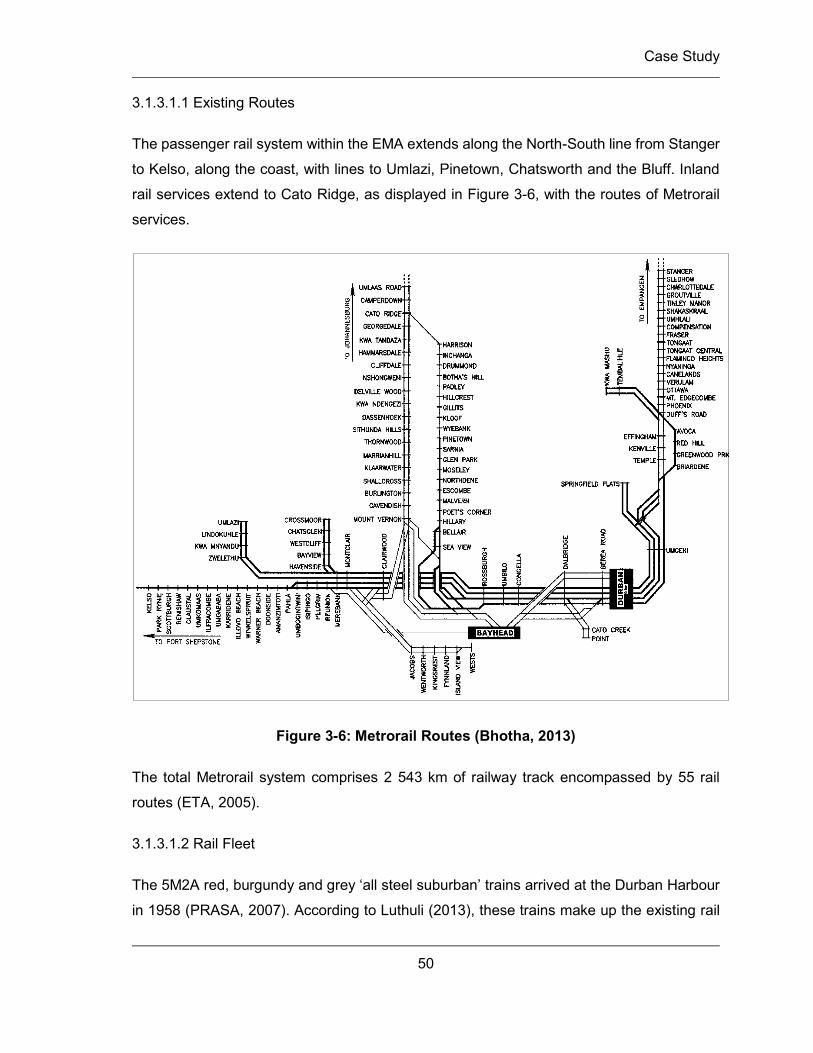
Case Study
50
3.1.3.1.1 Existing Routes
The passenger rail system within the EMA extends along the North-South line from Stanger
to Kelso, along the coast, with lines to Umlazi, Pinetown, Chatsworth and the Bluff. Inland
rail services extend to Cato Ridge, as displayed in Figure 3-6, with the routes of Metrorail
services.
Figure 3-6: Metrorail Routes (Bhotha, 2013)
The total Metrorail system comprises 2 543 km of railway track encompassed by 55 rail
routes (ETA, 2005).
3.1.3.1.2 Rail Fleet
The 5M2A red, burgundy and grey ‘all steel suburban’ trains arrived at the Durban Harbour
in 1958 (PRASA, 2007). According to Luthuli (2013), these trains make up the existing rail
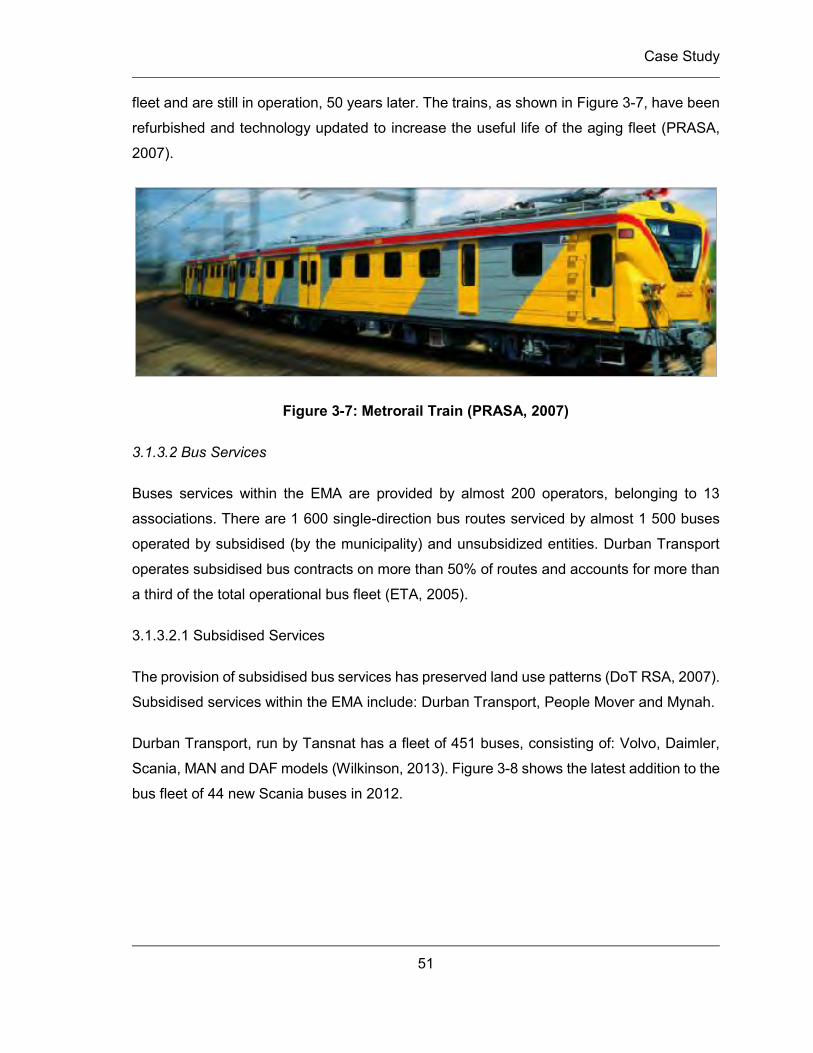
Case Study
51
fleet and are still in operation, 50 years later. The trains, as shown in Figure 3-7, have been
refurbished and technology updated to increase the useful life of the aging fleet (PRASA,
2007).
Figure 3-7: Metrorail Train (PRASA, 2007)
3.1.3.2 Bus Services
Buses services within the EMA are provided by almost 200 operators, belonging to 13
associations. There are 1 600 single-direction bus routes serviced by almost 1 500 buses
operated by subsidised (by the municipality) and unsubsidized entities. Durban Transport
operates subsidised bus contracts on more than 50% of routes and accounts for more than
a third of the total operational bus fleet (ETA, 2005).
3.1.3.2.1 Subsidised Services
The provision of subsidised bus services has preserved land use patterns (DoT RSA, 2007).
Subsidised services within the EMA include: Durban Transport, People Mover and Mynah.
Durban Transport, run by Tansnat has a fleet of 451 buses, consisting of: Volvo, Daimler,
Scania, MAN and DAF models (Wilkinson, 2013). Figure 3-8 shows the latest addition to the
bus fleet of 44 new Scania buses in 2012.
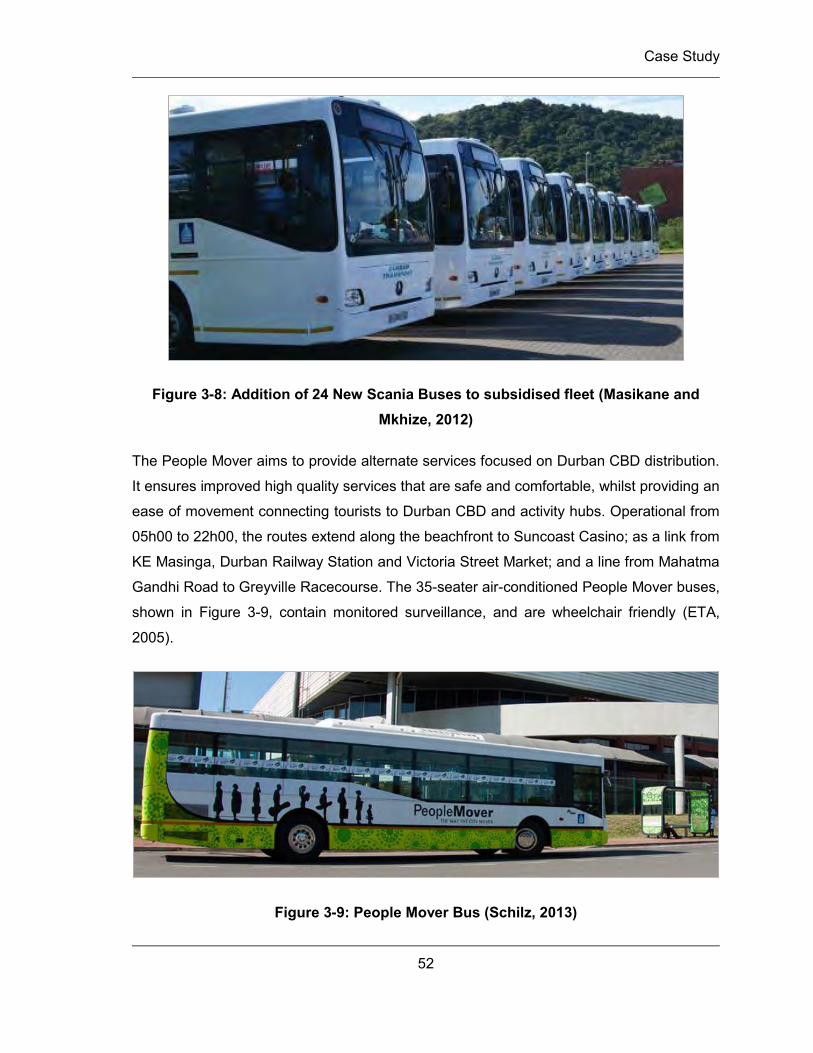
Case Study
52
Figure 3-8: Addition of 24 New Scania Buses to subsidised fleet (Masikane and Mkhize, 2012)
The People Mover aims to provide alternate services focused on Durban CBD distribution.
It ensures improved high quality services that are safe and comfortable, whilst providing an
ease of movement connecting tourists to Durban CBD and activity hubs. Operational from
05h00 to 22h00, the routes extend along the beachfront to Suncoast Casino; as a link from
KE Masinga, Durban Railway Station and Victoria Street Market; and a line from Mahatma
Gandhi Road to Greyville Racecourse. The 35-seater air-conditioned People Mover buses,
shown in Figure 3-9, contain monitored surveillance, and are wheelchair friendly (ETA,
2005).
Figure 3-9: People Mover Bus (Schilz, 2013)
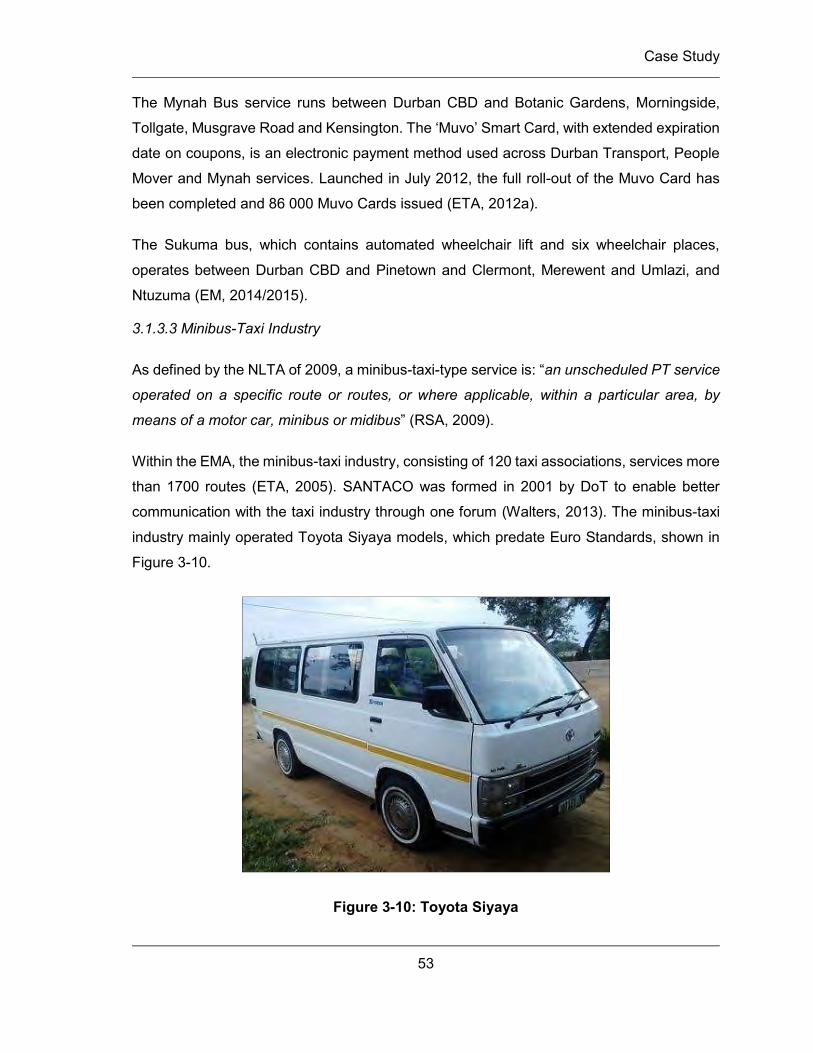
Case Study
53
The Mynah Bus service runs between Durban CBD and Botanic Gardens, Morningside,
Tollgate, Musgrave Road and Kensington. The ‘Muvo’ Smart Card, with extended expiration
date on coupons, is an electronic payment method used across Durban Transport, People
Mover and Mynah services. Launched in July 2012, the full roll-out of the Muvo Card has
been completed and 86 000 Muvo Cards issued (ETA, 2012a).
The Sukuma bus, which contains automated wheelchair lift and six wheelchair places,
operates between Durban CBD and Pinetown and Clermont, Merewent and Umlazi, and
Ntuzuma (EM, 2014/2015).
3.1.3.3 Minibus-Taxi Industry
As defined by the NLTA of 2009, a minibus-taxi-type service is: “an unscheduled PT service
operated on a specific route or routes, or where applicable, within a particular area, by
means of a motor car, minibus or midibus” (RSA, 2009).
Within the EMA, the minibus-taxi industry, consisting of 120 taxi associations, services more
than 1700 routes (ETA, 2005). SANTACO was formed in 2001 by DoT to enable better
communication with the taxi industry through one forum (Walters, 2013). The minibus-taxi
industry mainly operated Toyota Siyaya models, which predate Euro Standards, shown in
Figure 3-10.
Figure 3-10: Toyota Siyaya
Case Study
54
Due to the failure to formalise the minibus-taxi industry, the TRP was implemented to
forcefully encourage the replacement of existing 16-seater minibuses with new, larger 18-
35 seater vehicles. An incentive of R55 000, 00 was given to participating owners as a
scrapping allowance (Venter, 2013). A list of vehicles compliant with the TRP is included in
Appendix A. Although the TRP aimed to introduce larger vehicles with capacity of more than
16 (midibuses), many with a capacity of 14 have been accepted and comply.
3.1.4 Challenges in the Local PT Sector
Overall, the PT system is ineffective and lacks structure. Many services are in competition
with each other, resulting in inefficient and unprofitable trips (EM, 2014a). The ratio of
PT/POV in the EM was 52:48 (ETA, 2005), however, private vehicle sales are anticipated to
increase by 7.5% annually (Kruger, 2012), further reducing PT ridership.
The following obstacles are faced by the PT sector:
Insufficient services and inadequate capital for upgrades;
Lack of control (or enforcement) over transport modes, which gives rise to illegal and
poor driving practices and duplicate services (Walters, 2013);
Limited ability to provide safety at public pick-up and drop-of zones;
Lack of integration of services between modes, resulting in inconvenient and
expensive travel (EM, 2014a); and
Detrimental environmental impact such as air and noise pollution, extreme land
reserve required for road lanes (ETA, 2005).
The following problems exist in each vehicle category:
Passenger rail:
o Decreasing service levels;
o Deteriorated rolling stock may lead to shut down of the system;
o Low ridership suggests economic inefficiency of certain lines; and
o Cable thefts and electricity cuts delay trains and services (ETA, 2005).
Bus services:
o Reducing quality of service and increasing subsidies;
o Limited accessibility and low ridership during peak periods; and
Case Study
55
o Low profit margins of unsubsidized services do not enable fleet upgrades
(DoT RSA, 2007).
Minibus-taxi industry:
o Operates in direct competition with bus and rail services, reducing profitability
of subsidised services;
o Deteriorating fleet affect air quality, safety and reliability as breakdowns occur
often (DoT RSA, 2007);
o Excessive vehicles in operation due to lack of enforcement;
o Overcrowding at inadequate facilities and informal stops;
o Competition for ‘route ownership’ leads to violent confrontation; and
o Unsafe driving practices (high speeds and overloaded vehicles) and high
occurrence of road accidents (Walters, 2013).
Therefore, a restructure of PT services and new, modern IRPTN was needed and
GO!Durban, was planned for the city of Durban in the EMA, as stipulated by the PTAP (DoT
RSA, 2007).
3.2 GO!Durban
In effort to provide a safe and accessible PT network, the evolutionary GO!Durban system
will replace the existing formal and informal PT available services. This section will detail the
components of GO!Durban, to be implemented in the EMA, including an overview of the
network, anticipated timeframes, infrastructure and possible vehicle selections.
3.2.1 Objectives of GO!Durban
GO!Durban, the IRPTN planned for the EMA is centred around eight core provisional areas,
namely: infrastructure, operational plans, intelligent transport systems (ITS) and integrated
fare management systems (IFMS), skills development and sustainability, integrated corridor
expansion, PT evolution and negotiations, marketing communications and transformation
management, and municipal PT regulation (ETA, 2012a). The objectives of the ‘wall-to-wall’
IRPTN system include (EM, 2014b):
Equal accessibility for all South Africans (including those with disabilities) in and
around EM;
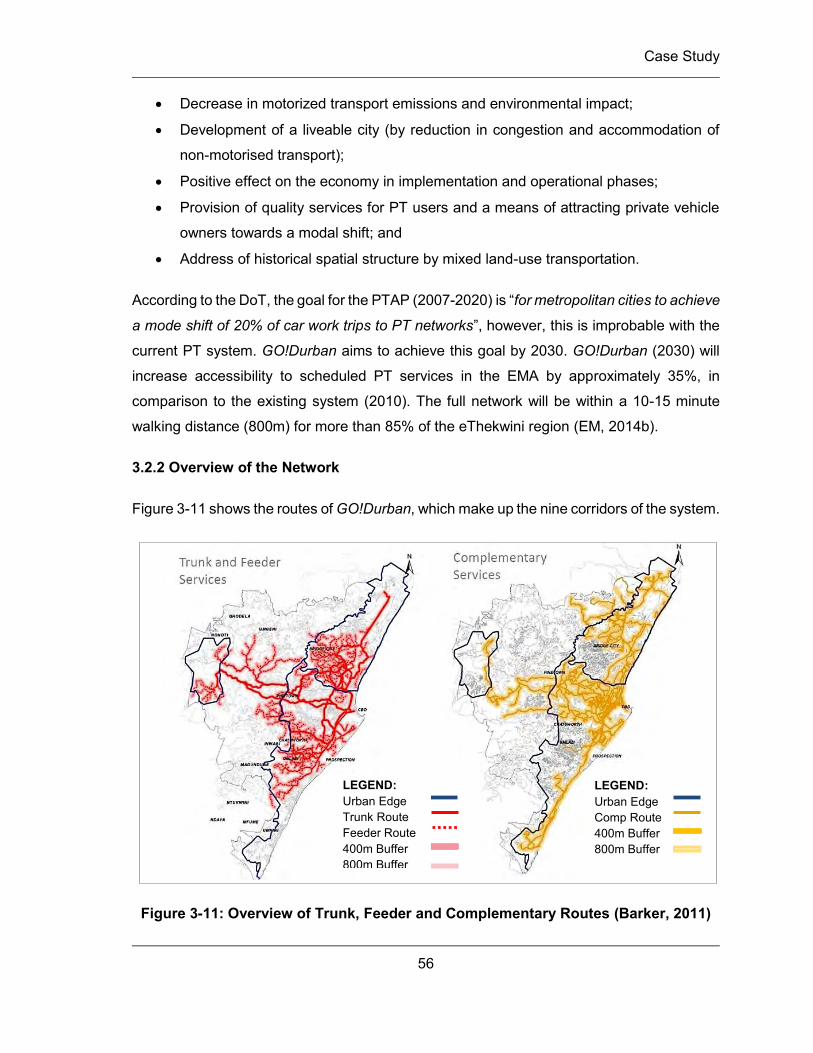
Case Study
56
Decrease in motorized transport emissions and environmental impact;
Development of a liveable city (by reduction in congestion and accommodation of
non-motorised transport);
Positive effect on the economy in implementation and operational phases;
Provision of quality services for PT users and a means of attracting private vehicle
owners towards a modal shift; and
Address of historical spatial structure by mixed land-use transportation.
According to the DoT, the goal for the PTAP (2007-2020) is “for metropolitan cities to achieve
a mode shift of 20% of car work trips to PT networks”, however, this is improbable with the
current PT system. GO!Durban aims to achieve this goal by 2030. GO!Durban (2030) will
increase accessibility to scheduled PT services in the EMA by approximately 35%, in
comparison to the existing system (2010). The full network will be within a 10-15 minute
walking distance (800m) for more than 85% of the eThekwini region (EM, 2014b).
3.2.2 Overview of the Network
Figure 3-11 shows the routes of GO!Durban, which make up the nine corridors of the system.
Figure 3-11: Overview of Trunk, Feeder and Complementary Routes (Barker, 2011)
LEGEND: Urban Edge Comp Route 400m Buffer 800m Buffer
LEGEND: Urban Edge Trunk Route Feeder Route 400m Buffer 800m Buffer
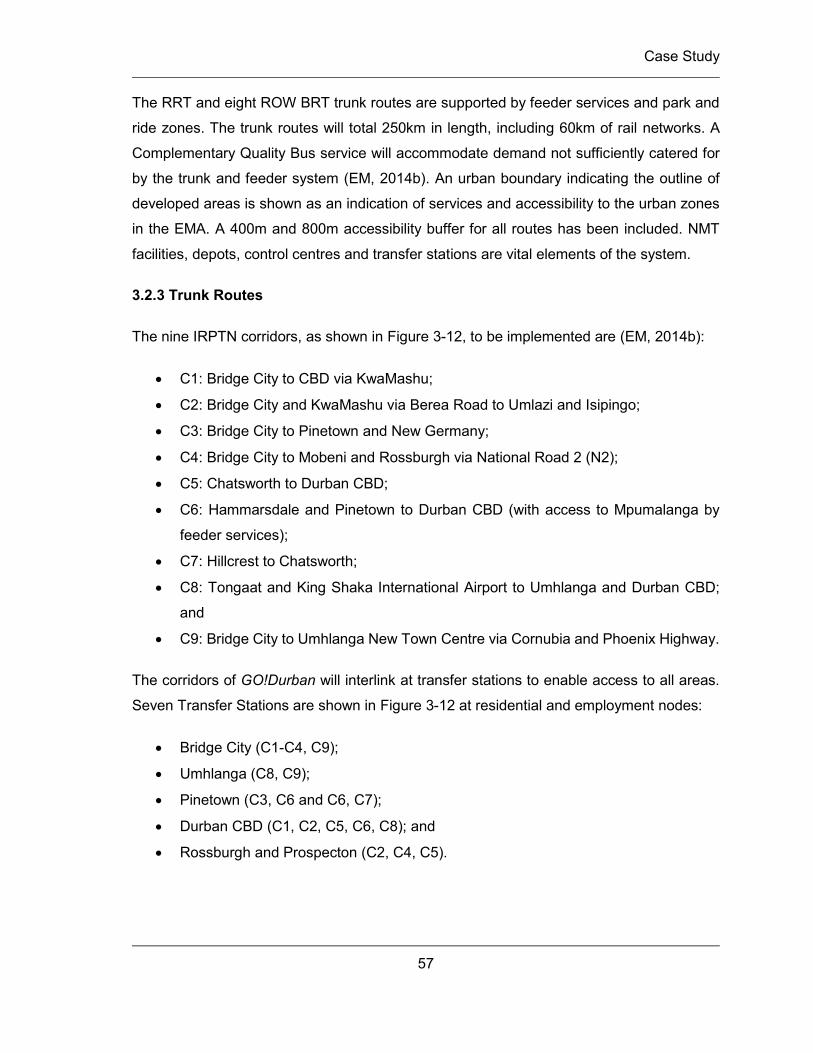
Case Study
57
The RRT and eight ROW BRT trunk routes are supported by feeder services and park and
ride zones. The trunk routes will total 250km in length, including 60km of rail networks. A
Complementary Quality Bus service will accommodate demand not sufficiently catered for
by the trunk and feeder system (EM, 2014b). An urban boundary indicating the outline of
developed areas is shown as an indication of services and accessibility to the urban zones
in the EMA. A 400m and 800m accessibility buffer for all routes has been included. NMT
facilities, depots, control centres and transfer stations are vital elements of the system.
3.2.3 Trunk Routes
The nine IRPTN corridors, as shown in Figure 3-12, to be implemented are (EM, 2014b):
C1: Bridge City to CBD via KwaMashu;
C2: Bridge City and KwaMashu via Berea Road to Umlazi and Isipingo;
C3: Bridge City to Pinetown and New Germany;
C4: Bridge City to Mobeni and Rossburgh via National Road 2 (N2);
C5: Chatsworth to Durban CBD;
C6: Hammarsdale and Pinetown to Durban CBD (with access to Mpumalanga by
feeder services);
C7: Hillcrest to Chatsworth;
C8: Tongaat and King Shaka International Airport to Umhlanga and Durban CBD;
and
C9: Bridge City to Umhlanga New Town Centre via Cornubia and Phoenix Highway.
The corridors of GO!Durban will interlink at transfer stations to enable access to all areas.
Seven Transfer Stations are shown in Figure 3-12 at residential and employment nodes:
Bridge City (C1-C4, C9);
Umhlanga (C8, C9);
Pinetown (C3, C6 and C6, C7);
Durban CBD (C1, C2, C5, C6, C8); and
Rossburgh and Prospecton (C2, C4, C5).
Case Study
58
Figure 3-12: Trunk Routes of the nine corridors of GO!Durban (EM, 2014b)
To encourage usage of the network, park and ride zones have been designed at residential
zones: Westville, Chatsworth, Umhlanga, Pinetown and Umlazi.
3.2.4 Phases of Implementation
The corridors of GO!Durban are to be implemented in phases according to anticipated
timeframes shown in Table 3-1.
Table 3-1: Anticipated operational year of GO!Durban Phases (EM, 2014b)
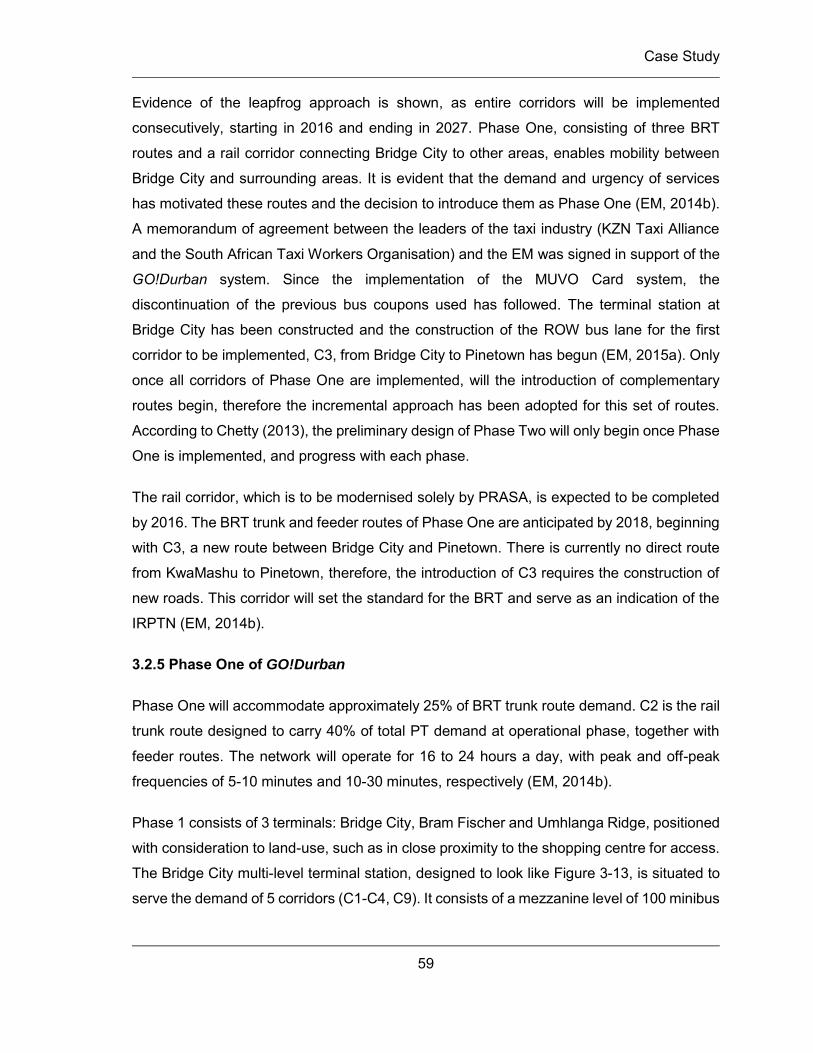
Case Study
59
Evidence of the leapfrog approach is shown, as entire corridors will be implemented
consecutively, starting in 2016 and ending in 2027. Phase One, consisting of three BRT
routes and a rail corridor connecting Bridge City to other areas, enables mobility between
Bridge City and surrounding areas. It is evident that the demand and urgency of services
has motivated these routes and the decision to introduce them as Phase One (EM, 2014b).
A memorandum of agreement between the leaders of the taxi industry (KZN Taxi Alliance
and the South African Taxi Workers Organisation) and the EM was signed in support of the
GO!Durban system. Since the implementation of the MUVO Card system, the
discontinuation of the previous bus coupons used has followed. The terminal station at
Bridge City has been constructed and the construction of the ROW bus lane for the first
corridor to be implemented, C3, from Bridge City to Pinetown has begun (EM, 2015a). Only
once all corridors of Phase One are implemented, will the introduction of complementary
routes begin, therefore the incremental approach has been adopted for this set of routes.
According to Chetty (2013), the preliminary design of Phase Two will only begin once Phase
One is implemented, and progress with each phase.
The rail corridor, which is to be modernised solely by PRASA, is expected to be completed
by 2016. The BRT trunk and feeder routes of Phase One are anticipated by 2018, beginning
with C3, a new route between Bridge City and Pinetown. There is currently no direct route
from KwaMashu to Pinetown, therefore, the introduction of C3 requires the construction of
new roads. This corridor will set the standard for the BRT and serve as an indication of the
IRPTN (EM, 2014b).
3.2.5 Phase One of GO!Durban
Phase One will accommodate approximately 25% of BRT trunk route demand. C2 is the rail
trunk route designed to carry 40% of total PT demand at operational phase, together with
feeder routes. The network will operate for 16 to 24 hours a day, with peak and off-peak
frequencies of 5-10 minutes and 10-30 minutes, respectively (EM, 2014b).
Phase 1 consists of 3 terminals: Bridge City, Bram Fischer and Umhlanga Ridge, positioned
with consideration to land-use, such as in close proximity to the shopping centre for access.
The Bridge City multi-level terminal station, designed to look like Figure 3-13, is situated to
serve the demand of 5 corridors (C1-C4, C9). It consists of a mezzanine level of 100 minibus
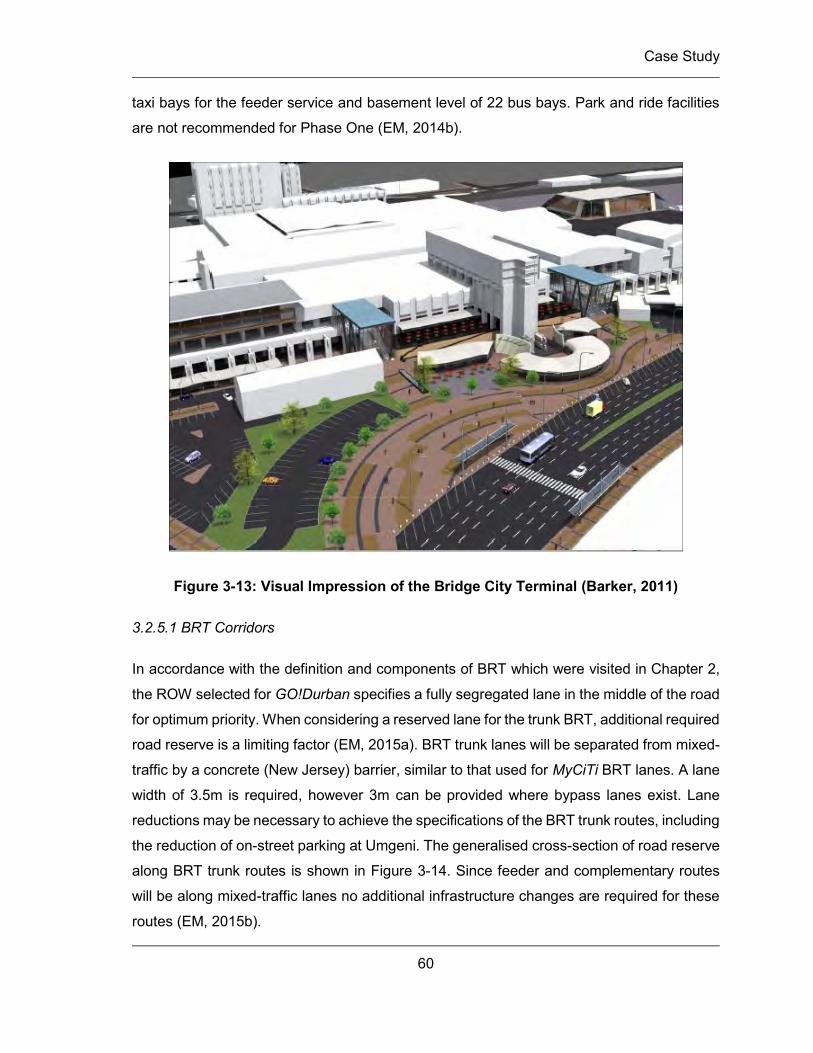
Case Study
60
taxi bays for the feeder service and basement level of 22 bus bays. Park and ride facilities
are not recommended for Phase One (EM, 2014b).
Figure 3-13: Visual Impression of the Bridge City Terminal (Barker, 2011)
3.2.5.1 BRT Corridors
In accordance with the definition and components of BRT which were visited in Chapter 2,
the ROW selected for GO!Durban specifies a fully segregated lane in the middle of the road
for optimum priority. When considering a reserved lane for the trunk BRT, additional required
road reserve is a limiting factor (EM, 2015a). BRT trunk lanes will be separated from mixed-
traffic by a concrete (New Jersey) barrier, similar to that used for MyCiTi BRT lanes. A lane
width of 3.5m is required, however 3m can be provided where bypass lanes exist. Lane
reductions may be necessary to achieve the specifications of the BRT trunk routes, including
the reduction of on-street parking at Umgeni. The generalised cross-section of road reserve
along BRT trunk routes is shown in Figure 3-14. Since feeder and complementary routes
will be along mixed-traffic lanes no additional infrastructure changes are required for these
routes (EM, 2015b).
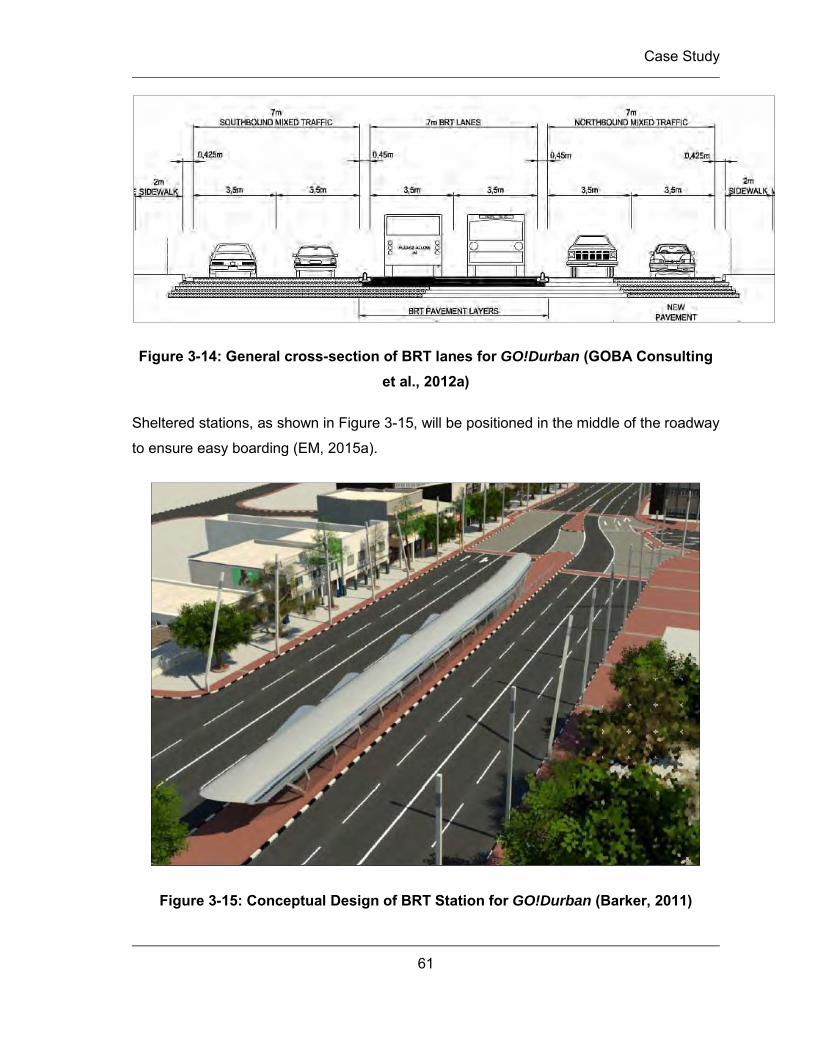
Case Study
61
Figure 3-14: General cross-section of BRT lanes for GO!Durban (GOBA Consulting et al., 2012a)
Sheltered stations, as shown in Figure 3-15, will be positioned in the middle of the roadway
to ensure easy boarding (EM, 2015a).
Figure 3-15: Conceptual Design of BRT Station for GO!Durban (Barker, 2011)
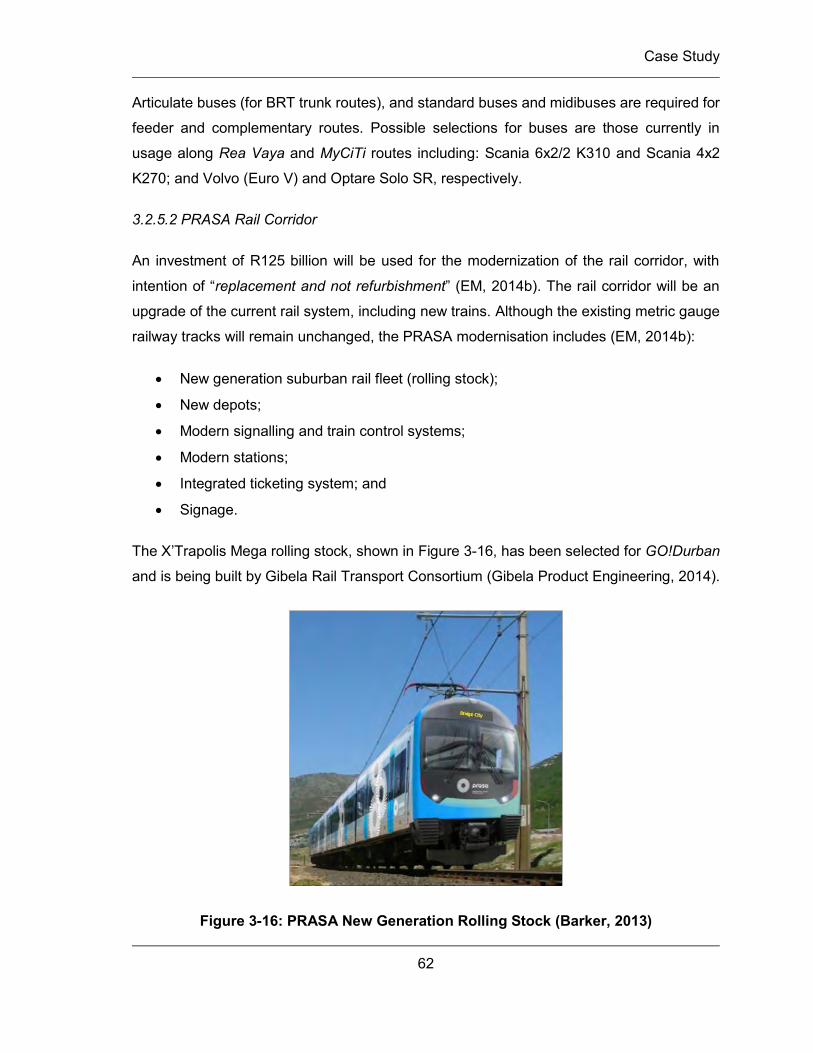
Case Study
62
Articulate buses (for BRT trunk routes), and standard buses and midibuses are required for
feeder and complementary routes. Possible selections for buses are those currently in
usage along Rea Vaya and MyCiTi routes including: Scania 6x2/2 K310 and Scania 4x2
K270; and Volvo (Euro V) and Optare Solo SR, respectively.
3.2.5.2 PRASA Rail Corridor
An investment of R125 billion will be used for the modernization of the rail corridor, with
intention of “replacement and not refurbishment” (EM, 2014b). The rail corridor will be an
upgrade of the current rail system, including new trains. Although the existing metric gauge
railway tracks will remain unchanged, the PRASA modernisation includes (EM, 2014b):
New generation suburban rail fleet (rolling stock);
New depots;
Modern signalling and train control systems;
Modern stations;
Integrated ticketing system; and
Signage.
The X’Trapolis Mega rolling stock, shown in Figure 3-16, has been selected for GO!Durban
and is being built by Gibela Rail Transport Consortium (Gibela Product Engineering, 2014).
Figure 3-16: PRASA New Generation Rolling Stock (Barker, 2013)
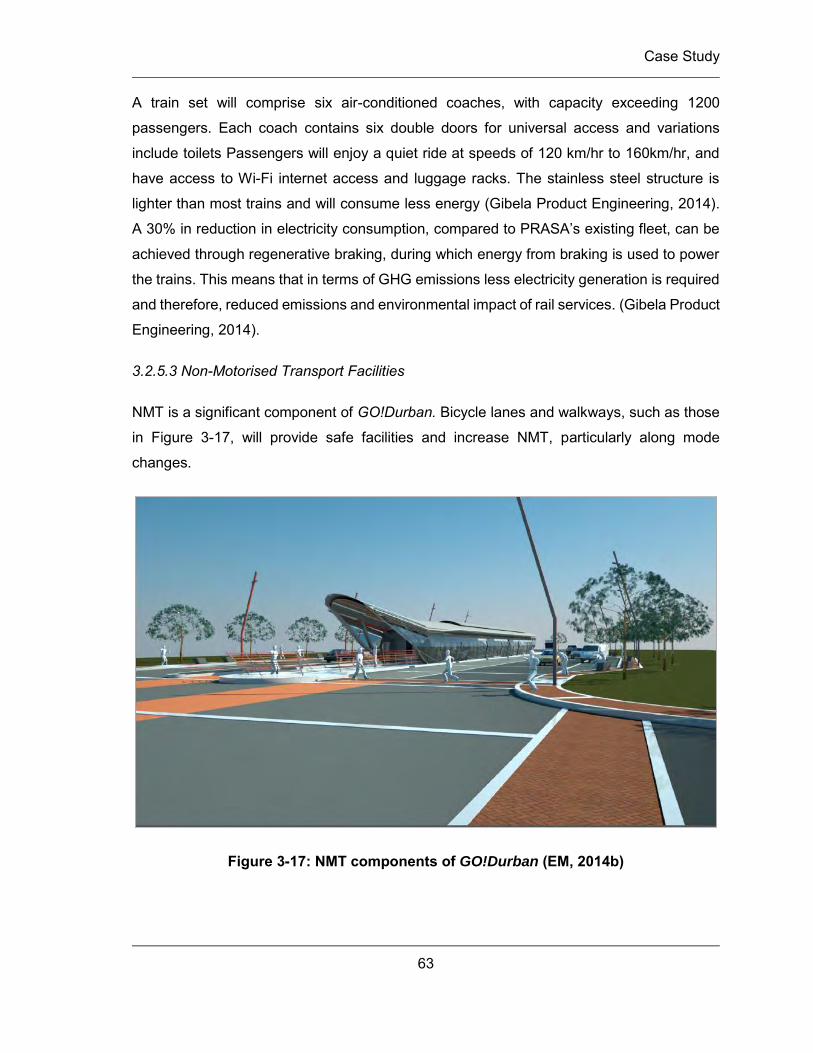
Case Study
63
A train set will comprise six air-conditioned coaches, with capacity exceeding 1200
passengers. Each coach contains six double doors for universal access and variations
include toilets Passengers will enjoy a quiet ride at speeds of 120 km/hr to 160km/hr, and
have access to Wi-Fi internet access and luggage racks. The stainless steel structure is
lighter than most trains and will consume less energy (Gibela Product Engineering, 2014).
A 30% in reduction in electricity consumption, compared to PRASA’s existing fleet, can be
achieved through regenerative braking, during which energy from braking is used to power
the trains. This means that in terms of GHG emissions less electricity generation is required
and therefore, reduced emissions and environmental impact of rail services. (Gibela Product
Engineering, 2014).
3.2.5.3 Non-Motorised Transport Facilities
NMT is a significant component of GO!Durban. Bicycle lanes and walkways, such as those
in Figure 3-17, will provide safe facilities and increase NMT, particularly along mode
changes.
Figure 3-17: NMT components of GO!Durban (EM, 2014b)
Case Study
64
3.3 Summary
The inefficient and inadequate PT services provided in the EMA have resulted in the
uncontrolled operation of the minibus-taxi industry. The operation of old, unreliable fleet has
provided unsafe, expensive services and had a negative impact on vehicle emissions. The
reliance on POVs and increasing demand for road space and maintenance costs are
unsustainable, therefore, the PTAP has introduced IRPTNs in 12 cities in SA, including in
the EMA.
IRPTNs provide high quality travel for high capacities along densified corridors. Overall,
GO!Durban will introduce PT services that are accessible to 80% of eThekwini residents.
Improved access to services will improve the quality of life of many South Africans. Reliable
services with integrated fares will reduce travel costs and enable a more stable work force.
ROW services will reduce travel time and trip lengths and attract a shift towards PT. A
reduction in POVs and congestion on roads, in conjunction with advanced vehicle
technology, will significantly reduce transportation emissions and improve air quality.
Challenges in implementation and integration of existing services exist, however,
commitment from government to enforcement, effective management and communication
will ensure a successful system.
Methodology
65
METHODOLOGY
4.1 Introduction
This chapter describes the methodology used to evaluate the carbon emissions of the study.
As such it presents how data was gathered, how calculations have been done and the
assumptions and related limitations. The methodology presented also includes approach
evaluations, research boundaries, data collection, and data analysis.
4.2 Approach Evaluation
Research relevant to the calculation of GHG emissions and appropriate methodologies were
assessed in order to obtain an approach that would ensure all aims and objectives of the
study were satisfied. A combination of both a theoretical and case study approach proved
to be most effective.
4.2.1 Theoretical Approach
Data collection using international and local sources of information, provided a greater
knowledge on the subject matter of GHG emissions and methods of analysis, with attention
to the transport sector and PT modeled data. General concepts including global warming,
the greenhouse effect and responsible GHG were reviewed. The GHG emission from
transportation, as well as different transportation modes were presented. The history the PT
sector and national policy introduced were investigated to gain an understanding of the
existing PT system, specifically why it functions the way it does, its shortcomings, and the
requirement for a PT intervention. A broad concept of the IRPTN was established and
systems around the world were studied. The IRPTNs introduced within SA (Rea Vaya,
MyCiTi, Libhongolethu, and RRT) were investigated, more specifically the BRT system, with
attention to success and problems incurred. Different vehicle technologies and their GHGs
were critically evaluated.
This data was presented in the form of a literature review (Chapter 2). The case study
(Chapter 3) detailed PT in the EMA to establish the context in which the study was
Methodology
66
undertaken. Critical assessment and analysis of data was carried out and a series of sources
were used. These included books, reports, journal articles, conference proceedings and
reliable internet sources.
4.2.2 Case Study Approach
This approach was relevant to and applicable in a South African context. An attempt was
made to produce an outcome with a valid representation of a GHG emission evaluation of
the PT sector. The study was specific to the PT sector within the EMA according to the
implementation of the PTAP of 2007 (as included in the Literature Review in Section 2.5).
In addition, a mode shift of 20% of car work trips to PT modes is to be achieved by the target
year of 2025. The shift to GO!Durban is detailed in the case study in Chapter 3.
This approach achieves an accurate CO2e emission comparison of the existing PT sector
and the proposed wall-to-wall IRPTN. It involved the use of a software programme namely,
INRO EMME/2 which is used by ETA to model traffic based on different scenarios and
projections. Necessary data on projected population travel patterns was extracted from
INRO EMME/2. A model was developed to calculate the emissions of the existing PT system
and the GO!Durban system with primary data extracted from INRO EMME/2 and required
emission factors, assumptions and fuel consumption applied. These results were used to
evaluate the ability of GO!Durban to reduce emissions as compared to the current PT
system, whilst providing a formal PT system. For the purpose of this study, two PT sector
scenarios were considered for comparison, namely:
Projections of the Existing PT System; and
Projections of GO!Durban.
4.2.2.1 Business-As-Usual (BAU) Scenario
Comprehensive analyses of the current system (consisting of the entire functional fleet; both
railway and on-road transportation) according to a Business-As-Usual (BAU) Scenario
involved projections from the 2008 Household Travel Survey to 2030. Three cases
considering technological improvements for fuel consumption were investigated under the
BAU Scenario, namely:
Option 1 – No improvements (refurbishment of existing fleet);
Methodology
67
Option 2 – Annual technology improvement factors; and
Option 3 – Introduction of latest vehicle technology.
Additional data on electricity consumption was required for the rail component, and fuel
consumption for buses and minibus-taxis, to calculate the total energy usage.
4.2.2.2 GO!Durban Scenario
The preliminary plans and latest available information on GO!Durban, were used for this
study. Considering that only one scenario can be modeled at a time in INRO EMME/2, the
‘wall-to-wall’ IRPTN was modeled. The following vehicle technology assumptions have been
made concerning each emission projection of GO!Durban:
Option 1 – Same vehicle technology used throughout (all phases of) GO!Durban;
Option 2 – Annual technology improvement factor from 2015; and
Option 3 – Latest available vehicle technology introduced in 2030.
For a phased approach, in the event of both systems running simultaneously, ArcGIS aided
in the separation of GO!Durban into phases to create an ‘ideal’ phasing-out of existing PT
system and phasing-in of the GO!Durban Scenario. The current PT record (CPTR) routes
that were to be converted into GO!Durban routes were identified and discontinued as each
phase of GO!Durban was implemented. In terms of phasing from a route perspective, this
was acceptable. However, the two scenarios were modeled independently with different
assumptions regarding integration with other vehicles on the road. Therefore, combining two
scenarios will not accurately represent traffic patterns and the concurrent operation of
systems could not be defined. Although NMT is a significant component of GO!Durban, the
impact of NMT facilities on this study cannot be quantified in terms of GHG reductions.
CDM AM0031 Large-scale Methodology: Bus rapid transit projects Version 05.0.0 and Tool
to calculate baseline project and or leakage emissions from electricity consumption assisted
in the calculation of projected CO2e emissions. AM 0031 is an international methodology
developed by the CDM organization and used for the quantification of emission reduction
projects. The carbon study conducted on Rea Vaya was done according to AM0031
analysed the ability of BRT systems to reduce GHG emissions of the PT sector, and served
as a guideline within a South African context (Grütter, 2011). This research was guided by
Methodology
68
the CDM AM0031 methodology and the results were compared to the results and
conclusions of the carbon credits study on Rea Vaya.
4.3 Scope of study
This study served as an evaluation of the operational emissions of the PT fleet within the
EMA, defined as the total CO2e emissions produced. It was an assessment of vehicular
emissions of the BAU Scenario of the current PT system in comparison to the projections of
the entire GO!Durban. The following components were beyond the scope of this study:
Embodied emissions (from the production of vehicles or fuel, from raw material
acquirement to manufacturing processes);
Emissions from transportation of vehicle fleet (or imported vehicles parts to the
EMA);
Emissions due to construction (earthworks and machinery) and implementation
processes of GO!Durban, including additional lanes or lane widening required; and
Operational energy requirements for facilities of the PT system (such as depots,
control centres, terminal stations, etc.) and emissions thereof.
Majority of the existing PT fleet comprises:
The passenger-rail system run by Metrorail (under PRASA);
Minibus-taxis:
o Toyota HiAce (Siyaya); and
o Toyota Quantum (and Sesfikile).
Buses (those subsidised by the municipality have been used as a representation of
the bus sector):
o Scania;
o Daimler;
o Volvo;
o DAF (Van Doorne's Aanhangwagen Fabriek); and
o MAN (Maschinenfabrik Augsburg-Nürnberg).
On-road vehicles for GO!Durban have not yet been selected, however, a Euro Emission
Standard IV requirement has been specified (Chetty, 2013). Therefore, vehicles used by
Methodology
69
existing BRTs (Rea Vaya and MyCiTi) in SA have been selected as possible choices for the
purpose of this study. The X’Trapolis Mega is the new rolling stock to be manufactured
specifically for the rail corridor of GO!Durban (Gibela Product Engineering, 2014) and
emission data was collected for these new trains.
4.4 Data Collection
Data acquisition from several sources in the EM enabled an accurate assessment of
passenger transport. The following sources were used:
Existing PT system:
o City Fleet – subsidised bus fleet and associated fuel consumption operated
by Durban Transport;
o Metrorail – rail fleet, electricity consumption and annual patronage;
o eThekwini Energy Department – GHG Inventory 2013; and
o ETA – INRO EMME/2 traffic projections of PT in the EM.
GO!Durban:
o ETA – Preliminary IRPTN Plans and INRO EMME/2 traffic modeling;
o Gibela – X’Trapolis Mega profile and energy consumption;
o City of Cape Town – MyCiTi route vehicles and diesel consumption;
o Piotrans (Rea Vaya Operator) – vehicles and fuel consumption; and
o Rea Vaya – Carbon Credits Monitoring.
4.4.1 INRO EMME/2 Transportation Forecasting Software
Emme is a travel demand modeling programme for macroscopic studies (national, regional
and urban areas). Based on the four step model – Trip generation, distribution, assignment
and modal choice – Emme 4 applications include:
Travel demand forecasting;
Transit planning (e.g. IRPTNs);
Traffic planning (evaluation of network expansion); and
Economic, emission and environmental analysis (INRO, 2013).
Methodology
70
A study conducted on TransJakarta utilised EMME/2 software (Alvinsyah and Zulkati, 2005).
A supply-demand model was generated based on the four step model to assess the impact
of the BRT on the existing services in operation along the corridor. Supply focused on the
transport network available and the demand model on transport demand, according to input
factors (data on age, gender, economic status, family structure, number of vehicles owned,
origin and destination points, travel times and modes used) as shown in Figure 4-1.
Figure 4-1: Research Framework for Emme (Alvinsyah and Zulkati, 2005)
Geometric data was used to develop a transport network model, and services along routes,
the PT model. In contrast to the existing system which operates in mixed traffic, the BRT
system operates on designed BRT corridors. Validation of the existing and BRT model is
required before forecasting is conducted. Comparison of the predicted peak hour passenger
usage and observed trips demonstrates an 8% difference between the Emme model and
actual ridership. Within a margin of 10% error, this model is accepted for simulation
(Alvinsyah and Zulkati, 2005).
In a similar manner, this software was used in the EMA by the ETA. Scenarios are projected
onto the 2008 base-year model, which is built on origin-destination (O-D) data from the 2008
Household Travel Survey (HTS) and CPTR of 2004. Efforts to update the CPTR were
unsuccessful. The HTS, conducted between 2007 and 2008, comprised 60 areas as a fair
representation of the 338 traffic zones in the EMA. The survey included age group,
Methodology
71
employment, income group and car ownership, as well as all trips made by members of each
household (trip purpose, origin and destination, time of departure and mode of transportation
used). EMME/2 utilises a (60x60) matrix containing the HTS 2008 data, including expected
population growths and spatial development, as well as vehicle O-D data (routes and
frequencies) and passengers boarding from CPTR 2004. Population growth rates increase
towards 2020 and are projected to decrease after 2035. The progression of AIDS in the
EMA is a contributing factor of the growth rate (Moodley et al., 2011).
Daily traffic volumes consist of: the morning (AM) peak, the afternoon (PM) peak and the
remaining off-peak period. As advised by ETA (Moodley, 2013) the EMME/2 forecasted
outputs comprise the AM Peak Hour travel patterns; the maximum hour during the morning
peak period, as these contain the daily maximum travel (combined work and school morning
trips).
ETA provided necessary traffic data modeled on EMME/2 according to two scenarios for the
AM Peak Hour: Existing PT System and GO!Durban. The EMME/2 AM Peak Hour Scenario
outputs obtained include:
2008;
2015 projections;
2020 projections;
2025 projections; and
2030 projections.
The modeled data is based on population growths according to specified factors for three
growth projections, namely:
Low-population growth – existing modal split;
Intermediate-population growth – with a 10% modal shift from POVs towards PT;
and
High-population growth – with a 20% modal shift towards PT as stipulated by the
PTAP (DoT RSA, 2007) by year 2025.
Methodology
72
For both the intermediate and high-population growth factors, a modal shift from POV usage
towards PT is required to accommodate all passengers on the network due to road reserve
capacities.
4.4.2 Existing PT System
The existing PT system within the EMA consisted of the:
PRASA (Metrorail) passenger system;
Bus system; and
Minibus-taxi system.
In calculating the carbon emissions of the PT fleet, information on the vehicle models used,
fuel usage and emitted GHGs were necessary.
4.4.2.1 eThekwini Municipality Subsidised Bus Fleet
Due to a limited access to information (from private companies), it was assumed that the
entire bus fleet operational within the EMA was similar to the subsidised bus fleet. A list of
all buses (see Appendix B) belonging to the EM Fleet which is operated by Durban
Transport, as obtained directly from Mr. John Wilkinson at Lorne Street Depot. With his
assistance, diesel consumption and total mileage for the month of June 2013 was provided.
Fuel consumption data for the year of 2012 was available; however, record of vehicle
mileages was discontinued for this period.
The respective chassis manufacturers were approached with the request of fuel
consumption and emission studies conducted. Volvo, DAF and MAN assisted in providing
data on the vehicles.
4.4.2.2 Metrorail System
Electricity for the direct operation of Metrorail traction substations was supplied by Eskom
(Winkelspruit, Northdene, Umlazi, Reunion and Clanstal substations) and EM to
metropolitan nodes (Durban CBD, Pinetown, Booth, Springfield) according to available land
for pylon structures (Mbonambi, 2013). Monthly electricity consumption data for each
substation in the EMA was provided by Metrorail for the year of 2012. The total length (km)
Methodology
73
of each route, along with the revised hourly schedules (total number of coaches and trips
made along each route per week) and applicable passenger capacities were obtained from
Metrorail. The total Metrorail passenger stats were made available to the public in published
PRASA annual reports.
Information from Metrorail (PRASA, 2007) indicated the useful life of rolling stock (33 years
for undercarriages and 12 years for components), thereby confirming the new train sets
required by the Passenger Rail Plan (DoT RSA, 2007) as existing rolling stock is more than
50 years old (Luthuli, 2013).
4.4.2.3 Minibus-Taxi Industry
The TRP, as stipulated by the PTAP, requires the replacement of the old vehicles used by
the minibus-taxi industry (DoT RSA, 2007), with vehicles compliant with the National
Regulator for Compulsory Specifications (NRCS, 2014) (included in Appendix A) to provide
transportation by roadworthy vehicles. For the purpose of this study, the Toyota
Quantum/Ses’Fikile was assumed to be the leading replacement vehicle for the TRP. The
progress of the TRP per province was obtained from the Scrapping Taxi Administrator (TSA)
and the results for KZN are shown in Table 4-1. It was assumed that the EMA followed the
same trend as KZN.
Table 4-1: Progress of TRP in KwaZulu-Natal (TSA, 2009)
Year Vehicles Scrapped
2006/7 549
2007/8 1 010
2008/9 853
2009/10 550
Total 2 962
The TRP was terminated in 2011 due to the implementation plans of GO!Durban (Naidoo,
2014). This would normally not have an effect on the BAU Scenario; however, the
completion of TRP cannot be accurately predicted beyond 2011. Within the BAU Scenario,
Methodology
74
the introduction of new vehicles by the TRP brought about the most significant change to
the PT fleet, reducing GHG emissions. This study considered the enforcement of the TRP
to completion (according to existing PT policy), ensuring all non-roadworthy vehicles were
removed from the roads of the EMA.
The number of operating minibus-taxis in the EMA, along with vehicle frequencies and
average trip distances was obtained from the Energy Department (Naidoo, 2014).
4.4.3 The GO!Durban System
In calculating the projected GHG emissions of the IRPTN fleet, information on the proposed
operating schedules, potential vehicle selection and specifications were required. These
were obtained from ETA. Other South African IRPTNs were consulted with regard to
possible vehicle selection, namely: MyCiTi and Rea Vaya. The PTAP (DoT RSA, 2007) and
Long-Term Mitigation Scenarios (2007) were the basis for this scenario.
4.4.3.1 eThekwini Transport Authority (ETA)
Documents obtained from ETA contained:
Preliminary Design Drawings;
Technical Note TN-ROW-22: Feeder Route Analysis along with Appendices.
GIS Shape Files for:
o CPTR 2004; and
o IRPTN (trunk, feeder, complementary) routes.
These were the latest revisions of documentation available at the time of this study.
4.4.3.2 MyCiTi Bus Fleet
Preliminary fuel consumption data for current and prospective fleet (including Volvo, Scania
and Optare Solo models) for a limited operating sample for MyCiTi Phase1 trunk and feeder
routes were obtained from the Transport and Information Centre (TIC) of Cape Town. The
operating vehicles for MyCiTi include:
18m articulated Volvo B12MA chassis;
12m rigid Volvo B7R chassis; and
Methodology
75
9m Solo Optare SR.
4.4.3.3 Rea Vaya Bus Fleet
Piotrans Pty (Ltd) is the private Bus Operating Company contracted for the operation of Rea
Vaya buses for 12 years. Piotrans consists of 300 stakeholders which were previously
minibus-taxi operators, incorporated into the Bus Operation of Rea Vaya (Piotrans, 2011).
Under Scania advisory, bus specifications including actual recorded fuel consumption were
obtained from Piotrans. The existing buses used for operation of Rea Vaya are:
18m Scania 6x2/2 K310; and
12m Scania 4x2 K270.
4.4.3.4 Rea Vaya Carbon Credits Study
A carbon credits study assessing the environmental impact of the implementation of Rea
Vaya Phase 1A and 1B was obtained from the Gauteng Transport Department – Scheduled
Services Business Unit. Monitored gases included: CO2, CH4 and N2O. This study served
as a benchmark, in accordance with the CDM AM0031 Large-scale Methodology, and
provided factors applicable in a South African context (Grütter, 2011).
4.4.4 List of Emission and Energy Consumption Factors
Obtaining data directly from South African producers and manufacturers was extremely
challenging, due to reservations about releasing information into the public domain and
confidentiality agreements in the early planning phases of the system.
4.4.4.1 Fuel Consumption Factors
For buses subsidised by the EMA where data was not provided by the manufacturer
(Daimler and DAF), the general manager at City Fleet, indicated that the average diesel
consumption for buses (containing air-conditioning) owned by the municipality is 55-60
L/100km (Ngwenya, 2013). The fuel consumption (energy requirement) for each PT vehicle
and source of data for the existing PT system is shown in Table 4-2.
Methodology
76
Table 4-2: Fuel Consumption Factors and Sources for Existing PT System
Vehicle Category
Model Euro Std
Fuel Type Fuel Consumption
Source
Bus
A63 MAN 18232 II Diesel 35-42 L/100km
Dias (2013)
HB2 MAN LION’S
Explorer 2009
III 38-45 L/100km
A84 MAN 18-280
HOCL (People
Mover)
III 45 – 50 L/
100km (with air-
conditioning)
Scania K230 III 51.9 L/ 100km Cajiao (2013)
Minibus-Taxi
Toyota HiAce
(Siyaya)
0 Petrol 13.6 L/ 100km IPCC (1996)
Toyota Quantum
2.7 Ses’fikile
II Petrol 6.1 L/ 100km
McCarthy
Toyota (2013) Toyota Quantum
2.5D-4D Ses’fikile
II Diesel 7.3 L/ 100km
Based on the obtained data, the average diesel consumption was calculated for entire bus
fleet. As no published local emission factor for the Toyota HiAce (Siyaya) could be obtained,
the IPCC factor of 13.6 L/100km (IPCC, 1996) as used in a South African study (Grütter,
2011) was considered appropriate. According to AM0031, if less than 10% of vehicles
consume a different fuel type, all fuel can be assumed to be the 90% type. Therefore, the
Methodology
77
Toyota Siyaya was assumed to be petrol and the Toyota Quantum/Ses’Fikile diesel, as this
considered the worst case of emissions.
The fuel consumption or electricity usage for each potential vehicle for GO!Durban is shown
in Table 4-3.
Table 4-3: Fuel Consumption Factors and Sources for GO!Durban
Vehicle Category
Model Euro Std
Fuel Type
Fuel Consumption
Source
Articulated Bus Scania 6x2/2 K310 IV
Diesel
63.5 L/ 100km Cajiao (2013)
Volvo 6x2 B12MA V 61.3 L/ 100km Mostert (2013)
Feeder / Complementary Bus
Scania 4x2 K270 IV 51.9 L/ 100km Cajiao (2013)
Volvo B7R 8700 LE V 40.8 L/ 100km Mostert (2013)
Feeder / Complementary Minibus
Toyota
Quantum/Ses’fikile
II 7.3 L/ 100km McCarthy
Toyota (2013)
Mercedes Benz
Sprinter
V 12.6 L/ 100km Mercedes
Benz (2014)
Rail X’Trapolis
Mega
3V DC - Elec-
tricity
15.56 kWh/ km Gibela Product
Engineering
(2014) 25V AC 16.31 kWh / km
Due to the vehicle capacity of complementary buses being equal to that of feeder buses
(60), as modelled in EMME/2, the same vehicle was selected for both routes. This may not
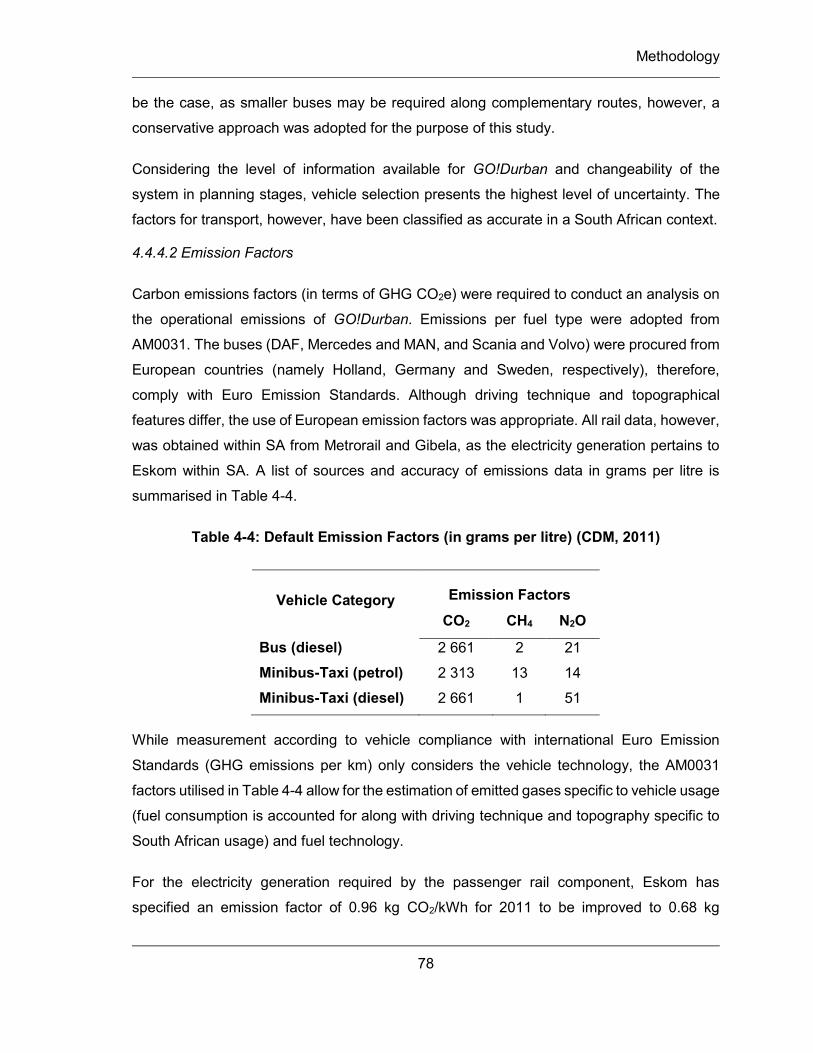
Methodology
78
be the case, as smaller buses may be required along complementary routes, however, a
conservative approach was adopted for the purpose of this study.
Considering the level of information available for GO!Durban and changeability of the
system in planning stages, vehicle selection presents the highest level of uncertainty. The
factors for transport, however, have been classified as accurate in a South African context.
4.4.4.2 Emission Factors
Carbon emissions factors (in terms of GHG CO2e) were required to conduct an analysis on
the operational emissions of GO!Durban. Emissions per fuel type were adopted from
AM0031. The buses (DAF, Mercedes and MAN, and Scania and Volvo) were procured from
European countries (namely Holland, Germany and Sweden, respectively), therefore,
comply with Euro Emission Standards. Although driving technique and topographical
features differ, the use of European emission factors was appropriate. All rail data, however,
was obtained within SA from Metrorail and Gibela, as the electricity generation pertains to
Eskom within SA. A list of sources and accuracy of emissions data in grams per litre is
summarised in Table 4-4.
Table 4-4: Default Emission Factors (in grams per litre) (CDM, 2011)
Vehicle Category Emission Factors
CO2 CH4 N2O
Bus (diesel) 2 661 2 21
Minibus-Taxi (petrol) 2 313 13 14
Minibus-Taxi (diesel) 2 661 1 51
While measurement according to vehicle compliance with international Euro Emission
Standards (GHG emissions per km) only considers the vehicle technology, the AM0031
factors utilised in Table 4-4 allow for the estimation of emitted gases specific to vehicle usage
(fuel consumption is accounted for along with driving technique and topography specific to
South African usage) and fuel technology.
For the electricity generation required by the passenger rail component, Eskom has
specified an emission factor of 0.96 kg CO2/kWh for 2011 to be improved to 0.68 kg
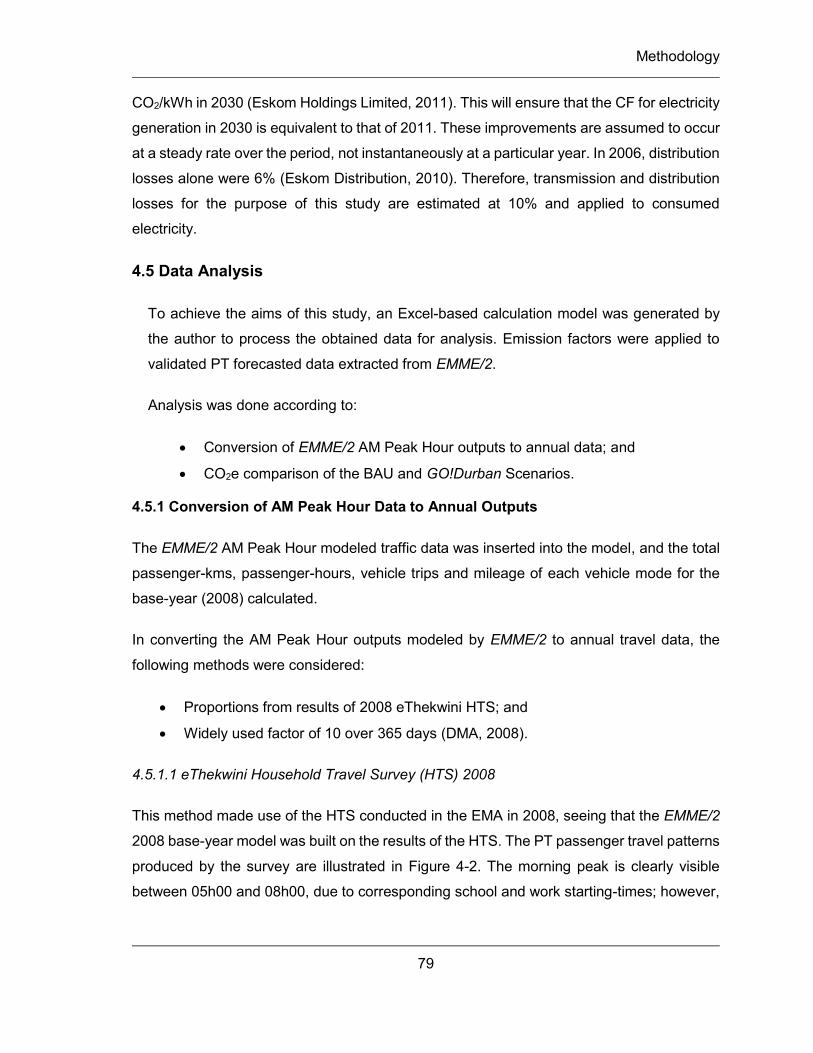
Methodology
79
CO2/kWh in 2030 (Eskom Holdings Limited, 2011). This will ensure that the CF for electricity
generation in 2030 is equivalent to that of 2011. These improvements are assumed to occur
at a steady rate over the period, not instantaneously at a particular year. In 2006, distribution
losses alone were 6% (Eskom Distribution, 2010). Therefore, transmission and distribution
losses for the purpose of this study are estimated at 10% and applied to consumed
electricity.
4.5 Data Analysis
To achieve the aims of this study, an Excel-based calculation model was generated by
the author to process the obtained data for analysis. Emission factors were applied to
validated PT forecasted data extracted from EMME/2.
Analysis was done according to:
Conversion of EMME/2 AM Peak Hour outputs to annual data; and
CO2e comparison of the BAU and GO!Durban Scenarios.
4.5.1 Conversion of AM Peak Hour Data to Annual Outputs
The EMME/2 AM Peak Hour modeled traffic data was inserted into the model, and the total
passenger-kms, passenger-hours, vehicle trips and mileage of each vehicle mode for the
base-year (2008) calculated.
In converting the AM Peak Hour outputs modeled by EMME/2 to annual travel data, the
following methods were considered:
Proportions from results of 2008 eThekwini HTS; and
Widely used factor of 10 over 365 days (DMA, 2008).
4.5.1.1 eThekwini Household Travel Survey (HTS) 2008
This method made use of the HTS conducted in the EMA in 2008, seeing that the EMME/2
2008 base-year model was built on the results of the HTS. The PT passenger travel patterns
produced by the survey are illustrated in Figure 4-2. The morning peak is clearly visible
between 05h00 and 08h00, due to corresponding school and work starting-times; however,
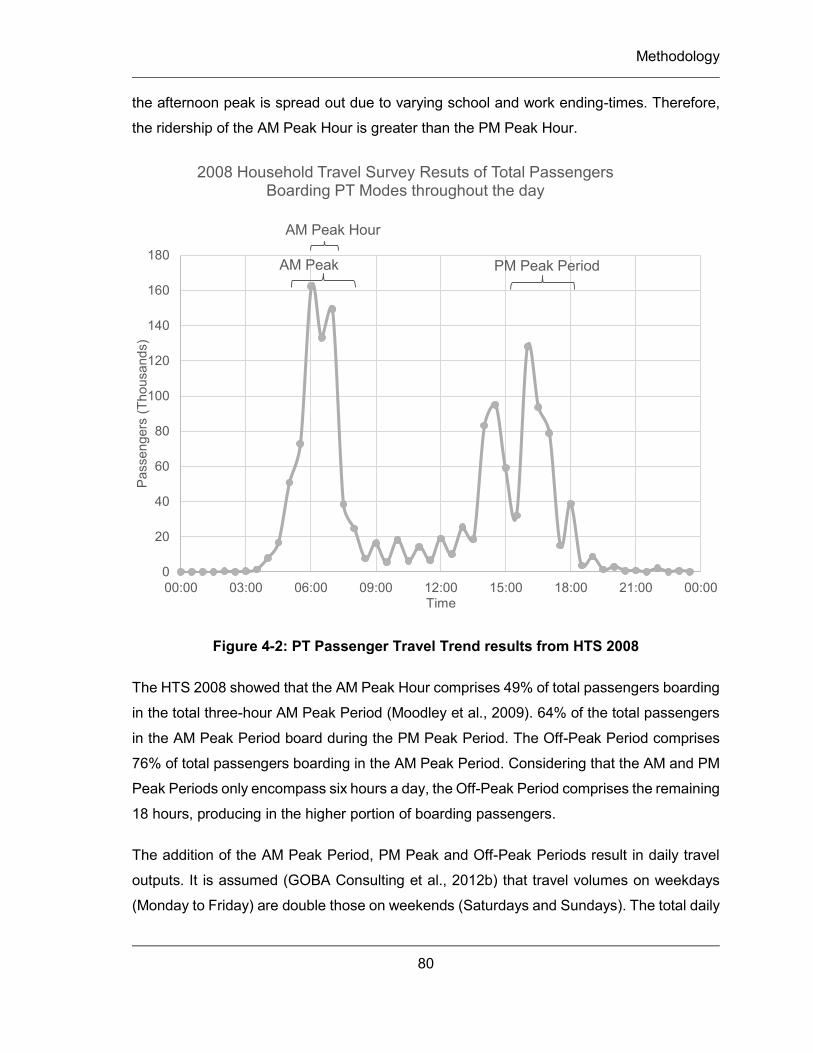
Methodology
80
the afternoon peak is spread out due to varying school and work ending-times. Therefore,
the ridership of the AM Peak Hour is greater than the PM Peak Hour.
Figure 4-2: PT Passenger Travel Trend results from HTS 2008
The HTS 2008 showed that the AM Peak Hour comprises 49% of total passengers boarding
in the total three-hour AM Peak Period (Moodley et al., 2009). 64% of the total passengers
in the AM Peak Period board during the PM Peak Period. The Off-Peak Period comprises
76% of total passengers boarding in the AM Peak Period. Considering that the AM and PM
Peak Periods only encompass six hours a day, the Off-Peak Period comprises the remaining
18 hours, producing in the higher portion of boarding passengers.
The addition of the AM Peak Period, PM Peak and Off-Peak Periods result in daily travel
outputs. It is assumed (GOBA Consulting et al., 2012b) that travel volumes on weekdays
(Monday to Friday) are double those on weekends (Saturdays and Sundays). The total daily
0
20
40
60
80
100
120
140
160
180
00:00 03:00 06:00 09:00 12:00 15:00 18:00 21:00 00:00
Pass
enge
rs (T
hous
ands
)
Time
2008 Household Travel Survey Resuts of Total Passengers Boarding PT Modes throughout the day
AM Peak PM Peak Period
AM Peak Hour
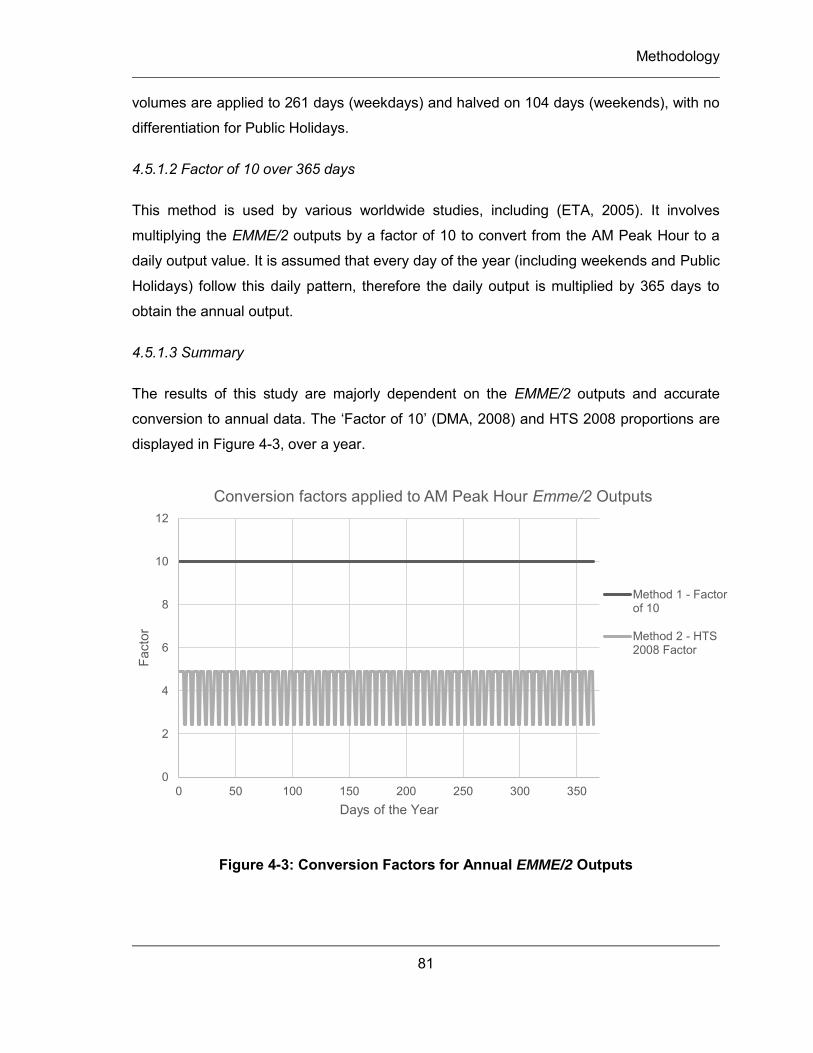
Methodology
81
volumes are applied to 261 days (weekdays) and halved on 104 days (weekends), with no
differentiation for Public Holidays.
4.5.1.2 Factor of 10 over 365 days
This method is used by various worldwide studies, including (ETA, 2005). It involves
multiplying the EMME/2 outputs by a factor of 10 to convert from the AM Peak Hour to a
daily output value. It is assumed that every day of the year (including weekends and Public
Holidays) follow this daily pattern, therefore the daily output is multiplied by 365 days to
obtain the annual output.
4.5.1.3 Summary
The results of this study are majorly dependent on the EMME/2 outputs and accurate
conversion to annual data. The ‘Factor of 10’ (DMA, 2008) and HTS 2008 proportions are
displayed in Figure 4-3, over a year.
Figure 4-3: Conversion Factors for Annual EMME/2 Outputs
0
2
4
6
8
10
12
0 50 100 150 200 250 300 350
Fact
or
Days of the Year
Conversion factors applied to AM Peak Hour Emme/2 Outputs
Method 1 - Factorof 10
Method 2 - HTS2008 Factor
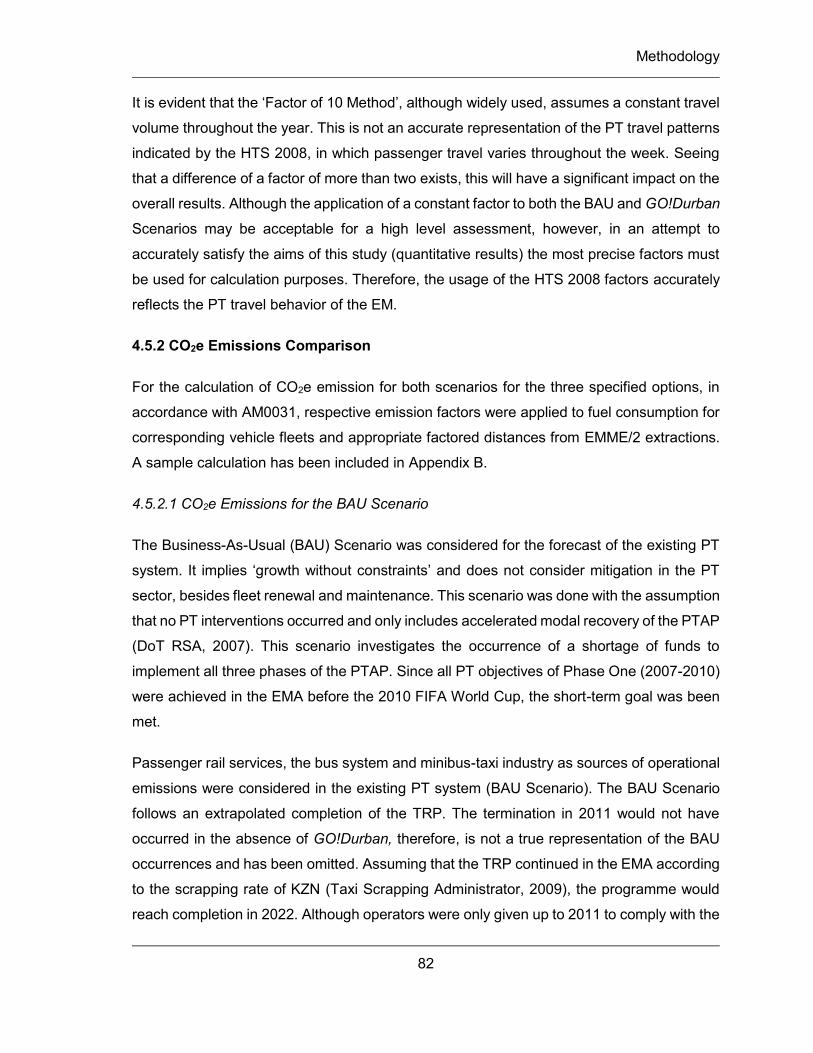
Methodology
82
It is evident that the ‘Factor of 10 Method’, although widely used, assumes a constant travel
volume throughout the year. This is not an accurate representation of the PT travel patterns
indicated by the HTS 2008, in which passenger travel varies throughout the week. Seeing
that a difference of a factor of more than two exists, this will have a significant impact on the
overall results. Although the application of a constant factor to both the BAU and GO!Durban
Scenarios may be acceptable for a high level assessment, however, in an attempt to
accurately satisfy the aims of this study (quantitative results) the most precise factors must
be used for calculation purposes. Therefore, the usage of the HTS 2008 factors accurately
reflects the PT travel behavior of the EM.
4.5.2 CO2e Emissions Comparison
For the calculation of CO2e emission for both scenarios for the three specified options, in
accordance with AM0031, respective emission factors were applied to fuel consumption for
corresponding vehicle fleets and appropriate factored distances from EMME/2 extractions.
A sample calculation has been included in Appendix B.
4.5.2.1 CO2e Emissions for the BAU Scenario
The Business-As-Usual (BAU) Scenario was considered for the forecast of the existing PT
system. It implies ‘growth without constraints’ and does not consider mitigation in the PT
sector, besides fleet renewal and maintenance. This scenario was done with the assumption
that no PT interventions occurred and only includes accelerated modal recovery of the PTAP
(DoT RSA, 2007). This scenario investigates the occurrence of a shortage of funds to
implement all three phases of the PTAP. Since all PT objectives of Phase One (2007-2010)
were achieved in the EMA before the 2010 FIFA World Cup, the short-term goal was been
met.
Passenger rail services, the bus system and minibus-taxi industry as sources of operational
emissions were considered in the existing PT system (BAU Scenario). The BAU Scenario
follows an extrapolated completion of the TRP. The termination in 2011 would not have
occurred in the absence of GO!Durban, therefore, is not a true representation of the BAU
occurrences and has been omitted. Assuming that the TRP continued in the EMA according
to the scrapping rate of KZN (Taxi Scrapping Administrator, 2009), the programme would
reach completion in 2022. Although operators were only given up to 2011 to comply with the
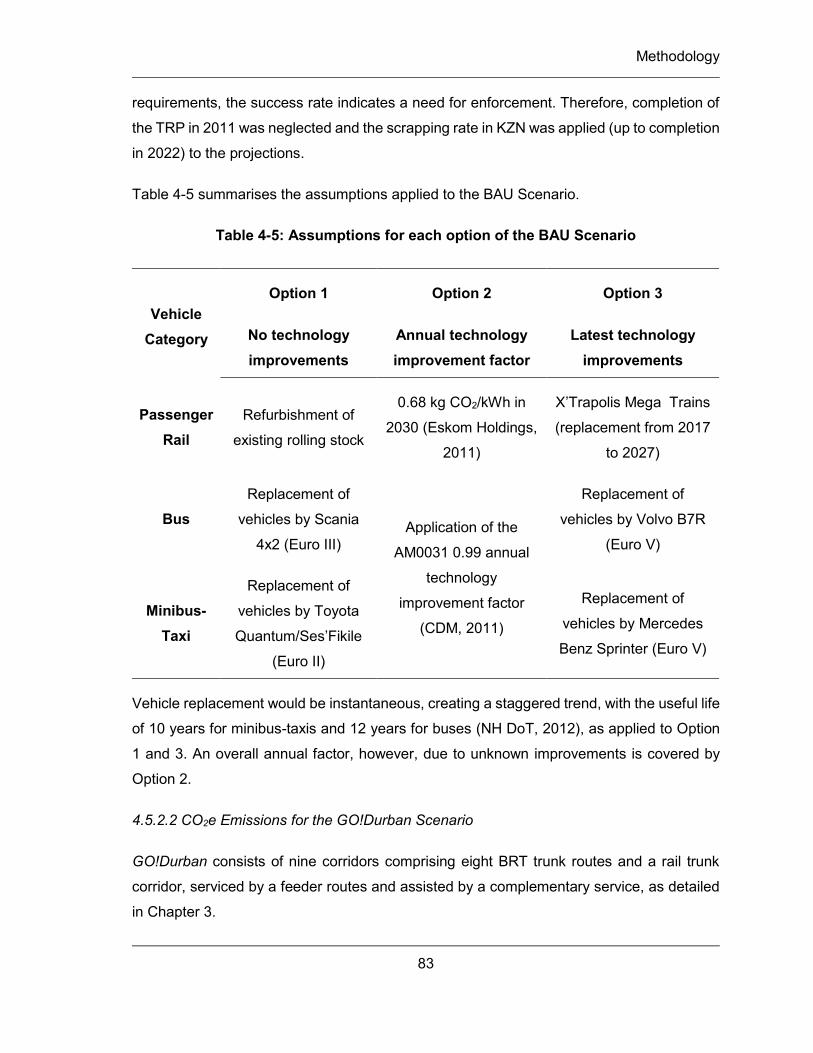
Methodology
83
requirements, the success rate indicates a need for enforcement. Therefore, completion of
the TRP in 2011 was neglected and the scrapping rate in KZN was applied (up to completion
in 2022) to the projections.
Table 4-5 summarises the assumptions applied to the BAU Scenario.
Table 4-5: Assumptions for each option of the BAU Scenario
Vehicle Category
Option 1 Option 2 Option 3
No technology improvements
Annual technology improvement factor
Latest technology improvements
Passenger Rail
Refurbishment of
existing rolling stock
0.68 kg CO2/kWh in
2030 (Eskom Holdings,
2011)
X’Trapolis Mega Trains
(replacement from 2017
to 2027)
Bus Replacement of
vehicles by Scania
4x2 (Euro III) Application of the
AM0031 0.99 annual
technology
improvement factor
(CDM, 2011)
Replacement of
vehicles by Volvo B7R
(Euro V)
Minibus-Taxi
Replacement of
vehicles by Toyota
Quantum/Ses’Fikile
(Euro II)
Replacement of
vehicles by Mercedes
Benz Sprinter (Euro V)
Vehicle replacement would be instantaneous, creating a staggered trend, with the useful life
of 10 years for minibus-taxis and 12 years for buses (NH DoT, 2012), as applied to Option
1 and 3. An overall annual factor, however, due to unknown improvements is covered by
Option 2.
4.5.2.2 CO2e Emissions for the GO!Durban Scenario
GO!Durban consists of nine corridors comprising eight BRT trunk routes and a rail trunk
corridor, serviced by a feeder routes and assisted by a complementary service, as detailed
in Chapter 3.
Methodology
84
All phases of GO!Durban were to be introduced by 2022, however, GO!Durban has released
new completion dates (EM, 2014b). These show implementation of the final corridor and
Phase Four in 2027. Therefore, for the purpose of this study, the wall-to-wall GO!Durban
network can only be modelled according to the 2030 projection. The case study evaluates
the total emissions of the entire network for the year of 2030, comprising CO2e emissions
from the following vehicles:
X’Trapolis Mega – Passenger Rail Corridor;
Articulate Bus – Eight BRT Trunk Routes;
Standard Bus – Feeder and Complementary Routes; and
Minibus – Feeder and Complementary (Comp) Routes.
Table 4-6 summarises the assumptions made for emission calculations for the GO!Durban
Scenario. Electricity emission factor to 0.68 kg CO2/kWh in 2030 (Eskom Holdings Limited,
2011).
Table 4-6: Assumptions for each option of GO!Durban
Vehicle Category
Option 1 Option 2 Option 3
Use of same vehicle model for all phases
Technology improvement factor
Latest technology in 2030 for all phases
BRT Trunk Routes
Scania K310 6x2/2
(Euro IV)
Factor of 0.99 applied
each year from
implementation to
2030.
Volvo B12MA
(Euro IV)
Feeder/ Comp Bus
Scania K270 4x2
(Euro III) Volvo B7R (Euro IV)
Feeder/ Comp Minibus
Toyota
Quantum/Ses’Fikile
(Euro II)
Mercedes Benz
Sprinter (Euro IV)
Methodology
85
4.5.3 Sensitivity Analysis
The input parameters of the BAU and GO!Durban Scenarios were varied by 5% and 10% to
investigate the overall influence on GHG emission reductions of the project. The following
parameters were explored for bus, minibus-taxi and rail modes, and standard bus, articulate
bus, rail and midibus vehicles:
Fuel and electricity consumption rates;
Projected distance driven (vehicle-kilometres); and
Total travelled distances for each system.
4.5.4 Limitations and Uncertainties
Several factors served as limitations for this study and reduced the level of accuracy,
namely: incomplete or inadequate data due to limited availability and confidentiality, and
time constraints. The following factors contributed to the accuracy of this study and created
limitations on this study: the EMME/2 model, bus fleet assumptions; and progress of the
TRP.
4.5.4.1 INRO EMME/2
Considering that the primary source of data for the study was modeled by the EMME/2
software forecasting programme, the constraints within the model influenced the study. The
lack of recent input material, due to the incorrect capture of CPTR 2012, did not enable an
update of PT operations. The forecasts have been conducted according to the 2008 base-
year model (with travel demands and population patterns from HTS 2008), which lacks
spatial development and the use of the most accurate source, CPTR 2004, creates huge
gaps in modeling.
The 2008 base-year model did not include the northern urban development corridor (NUDC)
which consisted of development in Umhlanga and the Dube Tradeport due to the relocation
of Durban International Airport for the 2010 FIFA World Cup. Problems were experienced
as the NUDC scenario was modeled in 2009 using the 2005 base-year model, however,
was not (transposed) input onto the 2008 base-year model. Therefore, only two options were
available: forecasts with the 2008 population input data without the NUDC, or forecasts with
the 2005 population data with the NUDC, and the 2008 option with latest HTS results were
Methodology
86
preferable. The development of the Dig-Out Port, which consists of three phases to be
completed in 2027 (Transnet, 2009), has not been incorporated into the model either.
Therefore, traffic projections modeled on EMME/2 did not include the effect of the new port
on traffic flow and proposed freight routes for the transportation of goods to and from the
harbour were not built into the future projections of GO!Durban. These trips, however,
cannot be neglected as though not occurring.
Cancelled services and strikes by the PT network cannot be predicted, and therefore, are
neglected by the programme.
In addition to that, of the three scenarios available on EMME/2, one scenario could be
modelled at a time (Moodley, 2013a). Therefore, the AM Peak Hour flow for the BAU
Scenario could be run, and then only could the PT vehicles for and the entire GO!Durban
system be modelled. The concurrent modeling of scenarios is not possible. A ‘phasing’
scenario could not be run on EMME/2, as it would require a combination of both scenarios
(tracking the development of GO!Durban, which in itself was not created as a scenario.
However, when GO!Durban is introduced and an increase in congestion is caused during
the construction and implementation phases (due to lane reduction) it cannot be modeled
and subsequent emissions cannot be measured. This might not truly reflect traffic flow,
especially in the undesired case of the continuation of the existing PT system after the
implementation of GO!Durban.
4.5.4.2 Bus Fleet
The bus sector operating within the EMA does not only comprise subsidised buses,
however, a generalisation was made about the bus system, due to limited access to
information. Since the buses subsidised by the EM receive a third of bus fares spent in the
region, it was assumed that the subsidised fleet was an adequate representation of the
sector. Daimler refused to provide any data on the buses in the subsidised fleet. Private
companies, however, may operate vehicles that differ significantly (with various
technological advancements) nevertheless, due to unwillingness of private companies to
cooperate, these were not included. Several private companies, such as KZN Transport and
Olympic Bus Lines, were approached, with no response. Although fleet age and technology
development influence vehicle emissions, the subsidised bus fleet served as an adequate
representation.
Methodology
87
The selection of the same bus for GO!Durban complementary and feeder routes was
motivated by the vehicle capacity assumptions in the EMME/2, according to ETA. Although
this may result in an over-estimation of emissions, the conservative approach was adopted
for the purpose of this study.
4.5.4.3 Minibus-Taxi Fleet
Vehicles introduced by the TRP (Appendix A) include the Toyota Quantum/Ses’Fikile. For
the purpose of this study, it was assumed that majority of old vehicles were replaced by the
Toyota Quantum/Ses’Fikile (BAU Scenario). This is an accurate generalisation due to limited
availability of data. Considering the success rate of scrapping in KZN, the TRP would have
continued to 2022 until all 13 000 minibus-taxis were replaced. ETA, however, ended the
programme in 2010 (Naidoo, 2014), due to the next phase of the PTAP and incorporation of
the minibus-taxi industry in the IRPTN. The BAU Scenario considered Phase One of the
PTAP to completion, in the event of Phase Two not being implemented.
No local fuel consumption data was available for the 2002 Toyota HiAce, hence,
international fuel consumption factors were used.
4.6 Summary
This study is restricted to the total operational emissions (due to fuel consumption by
vehicles) of the PT fleet in the EMA and does not include embodied emissions from the
manufacturing process or construction activities of the network. It required both a theoretical
and case study approach to meet the aims and objectives set in Chapter 1. An attempt to
accurately calculate the CO2e emissions of the existing PT fleet and those expected by the
GO!Durban network was made in this study. Critical to this study was the PTAP as each
scenario focused on the phases to be implemented; BAU Scenario – Phase One, and
GO!Durban – PTAP to completion in 2030 including a 20% modal shift to PT.
The primary source of data was EMME/2 traffic forecasting software which is the modeling
programme used by ETA to assist in transportation planning. The projections were built on
the 2008 base-year model, according to the results of the HTS 2008 and 2004 CPTR. The
CPTR for 2003/2004, which would differ from the 2013 CPTR, was used as it was the only
accurate record available at the time of the study. Hence, a level of uncertainty was created
Methodology
88
due to changes in PT since 2004 and spatial development post 2008, as the model was not
updated to include the development of the NUDC or Dig-Out Port, consequent trips
generated and the influence on traffic. In addition, it and could not run combinations of
scenarios (and track development of the GO!Durban system), limiting modelling of future
events.
The calculation of vehicle emissions of GO!Durban was limited by preliminary plans of the
IRPTN. Road vehicle procurement for GO!Durban is yet to occur, therefore the greatest
uncertainty of the study was created in vehicle selection. Seeing as emission standards of
the vehicles have the greatest impact on GHG emissions of the system, several scenarios
considered the potential vehicles selected based on requirements and vehicles operating in
established IRPTNs in SA. Although detailed plans can change at any time, depending on
the success of phases implemented, the latest revisions of plans were used for the purpose
of this study.
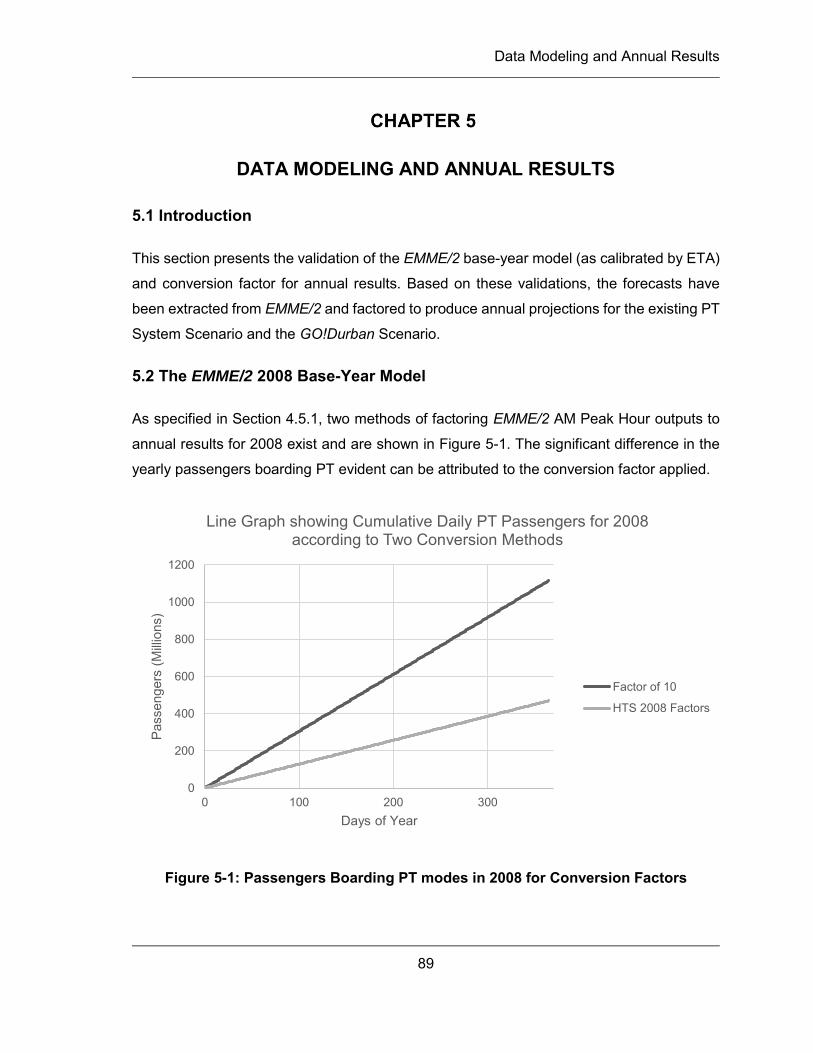
Data Modeling and Annual Results
89
DATA MODELING AND ANNUAL RESULTS
5.1 Introduction
This section presents the validation of the EMME/2 base-year model (as calibrated by ETA)
and conversion factor for annual results. Based on these validations, the forecasts have
been extracted from EMME/2 and factored to produce annual projections for the existing PT
System Scenario and the GO!Durban Scenario.
5.2 The EMME/2 2008 Base-Year Model
As specified in Section 4.5.1, two methods of factoring EMME/2 AM Peak Hour outputs to
annual results for 2008 exist and are shown in Figure 5-1. The significant difference in the
yearly passengers boarding PT evident can be attributed to the conversion factor applied.
Figure 5-1: Passengers Boarding PT modes in 2008 for Conversion Factors
0
200
400
600
800
1000
1200
0 100 200 300
Pass
enge
rs (M
illion
s)
Days of Year
Line Graph showing Cumulative Daily PT Passengers for 2008 according to Two Conversion Methods
Factor of 10
HTS 2008 Factors
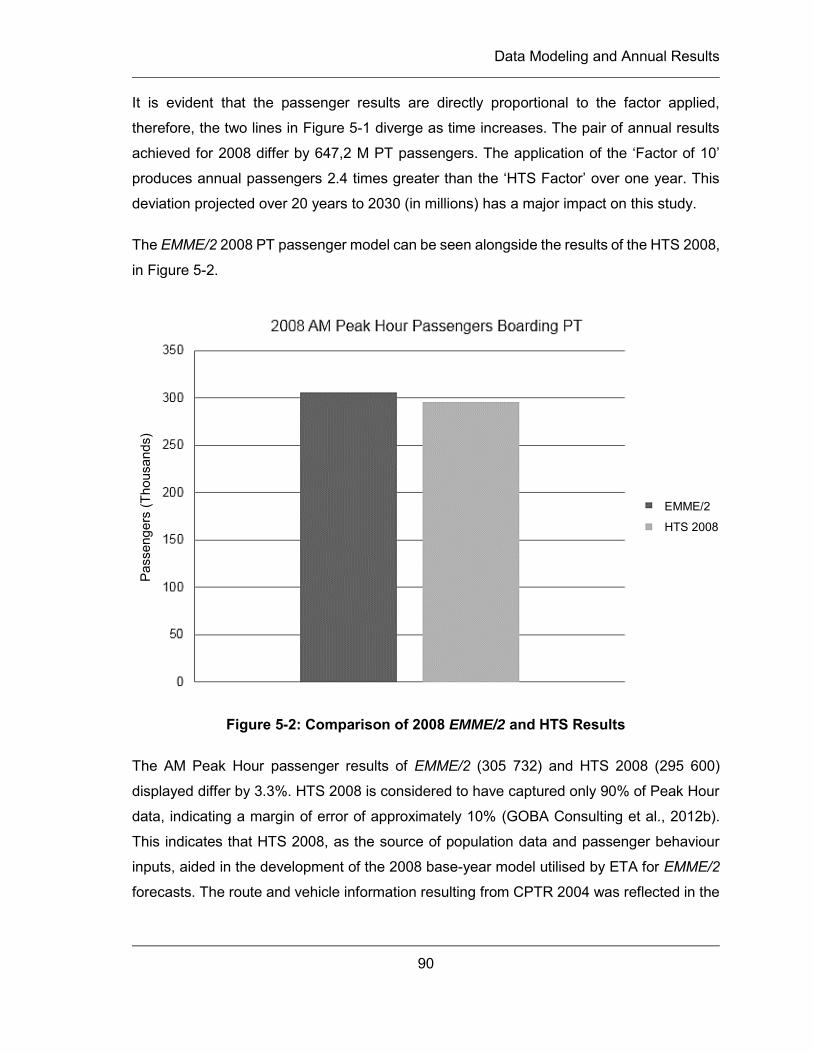
Data Modeling and Annual Results
90
It is evident that the passenger results are directly proportional to the factor applied,
therefore, the two lines in Figure 5-1 diverge as time increases. The pair of annual results
achieved for 2008 differ by 647,2 M PT passengers. The application of the ‘Factor of 10’
produces annual passengers 2.4 times greater than the ‘HTS Factor’ over one year. This
deviation projected over 20 years to 2030 (in millions) has a major impact on this study.
The EMME/2 2008 PT passenger model can be seen alongside the results of the HTS 2008,
in Figure 5-2.
Figure 5-2: Comparison of 2008 EMME/2 and HTS Results
The AM Peak Hour passenger results of EMME/2 (305 732) and HTS 2008 (295 600)
displayed differ by 3.3%. HTS 2008 is considered to have captured only 90% of Peak Hour
data, indicating a margin of error of approximately 10% (GOBA Consulting et al., 2012b).
This indicates that HTS 2008, as the source of population data and passenger behaviour
inputs, aided in the development of the 2008 base-year model utilised by ETA for EMME/2
forecasts. The route and vehicle information resulting from CPTR 2004 was reflected in the
EMME/2
HTS 2008
Pass
enge
rs (T
hous
ands
)
Data Modeling and Annual Results
91
outputs. Hence the application of ratios of peak and off-peak periods as obtained from HTS
2008 would produce the most accurate results for the purpose of this study.
5.3 PT Sector Projections for eThekwini Municipality
The forecasts extracted from EMME/2 are presented in this section as annual projections
up to 2030, according to two scenarios, namely the existing PT system (BAU) and
GO!Durban (PT intervention). Within each scenario, the following projections are examined:
annual PT passenger demand, total mileage by PT vehicles (vehicle-kilometres), passenger
distances (passenger-kilometres) and AM Peak Hour Vehicle Requirements.
5.3.1 Existing PT System Scenario
This section presents the projections of the existing PT system according to the
methodology specified in Chapter 4. For the purpose of this study, the low-population growth
forecasts extracted from EMME/2 for the existing PT modal split represents the BAU
Scenario. It assumes that the modal share between the POV and PT sectors remains
unchanged over the entire projection. The BAU Scenario implies ‘growth without constraints’
or ‘growth according to existing government policy’. This scenario considered projections of
the existing PT system and was carried out with the assumption that no PT interventions
were implemented (other than fleet renewal and maintenance).
Population growth and an increasing transportation demand will have a significant impact
on PT passenger usage over the next 20 years. Figure 5-3 indicates the number of
passengers boarding PT modes per year from 2008 to 2030 for the low growth projection.
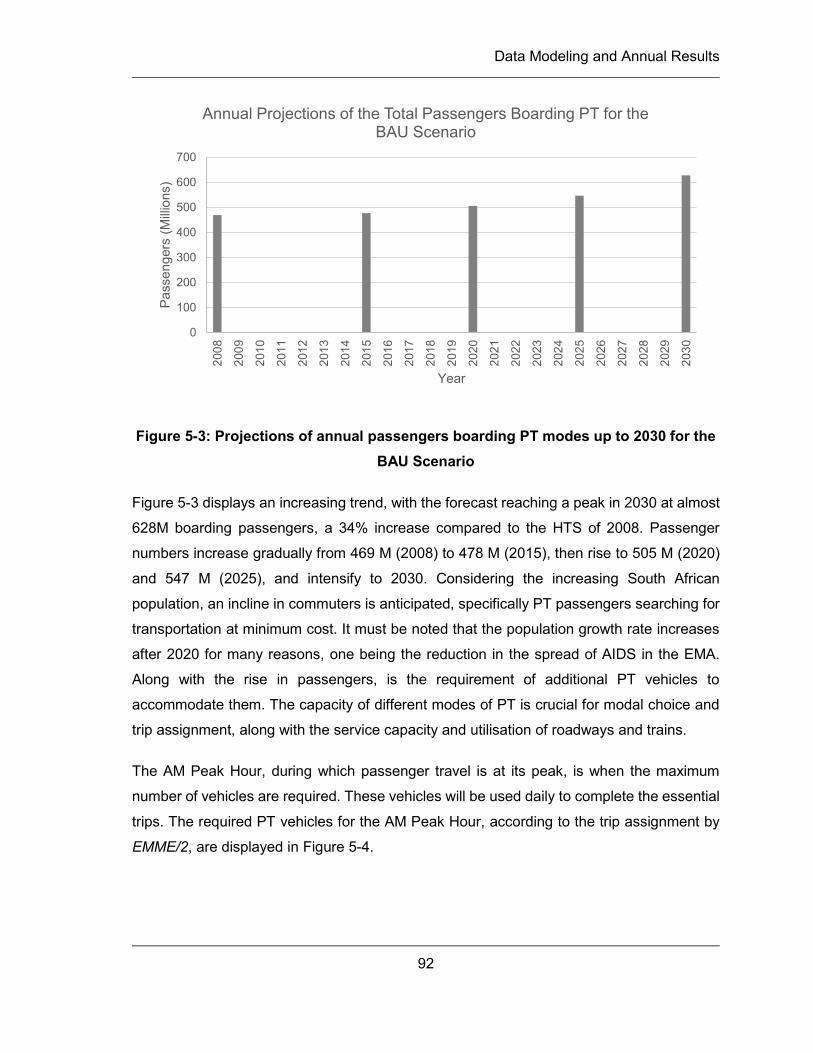
Data Modeling and Annual Results
92
Figure 5-3: Projections of annual passengers boarding PT modes up to 2030 for the BAU Scenario
Figure 5-3 displays an increasing trend, with the forecast reaching a peak in 2030 at almost
628M boarding passengers, a 34% increase compared to the HTS of 2008. Passenger
numbers increase gradually from 469 M (2008) to 478 M (2015), then rise to 505 M (2020)
and 547 M (2025), and intensify to 2030. Considering the increasing South African
population, an incline in commuters is anticipated, specifically PT passengers searching for
transportation at minimum cost. It must be noted that the population growth rate increases
after 2020 for many reasons, one being the reduction in the spread of AIDS in the EMA.
Along with the rise in passengers, is the requirement of additional PT vehicles to
accommodate them. The capacity of different modes of PT is crucial for modal choice and
trip assignment, along with the service capacity and utilisation of roadways and trains.
The AM Peak Hour, during which passenger travel is at its peak, is when the maximum
number of vehicles are required. These vehicles will be used daily to complete the essential
trips. The required PT vehicles for the AM Peak Hour, according to the trip assignment by
EMME/2, are displayed in Figure 5-4.
0
100
200
300
400
500
600
700
2008
2009
2010
2011
2012
2013
2014
2015
2016
2017
2018
2019
2020
2021
2022
2023
2024
2025
2026
2027
2028
2029
2030
Pass
enge
rs (M
illion
s)
Year
Annual Projections of the Total Passengers Boarding PT for the BAU Scenario
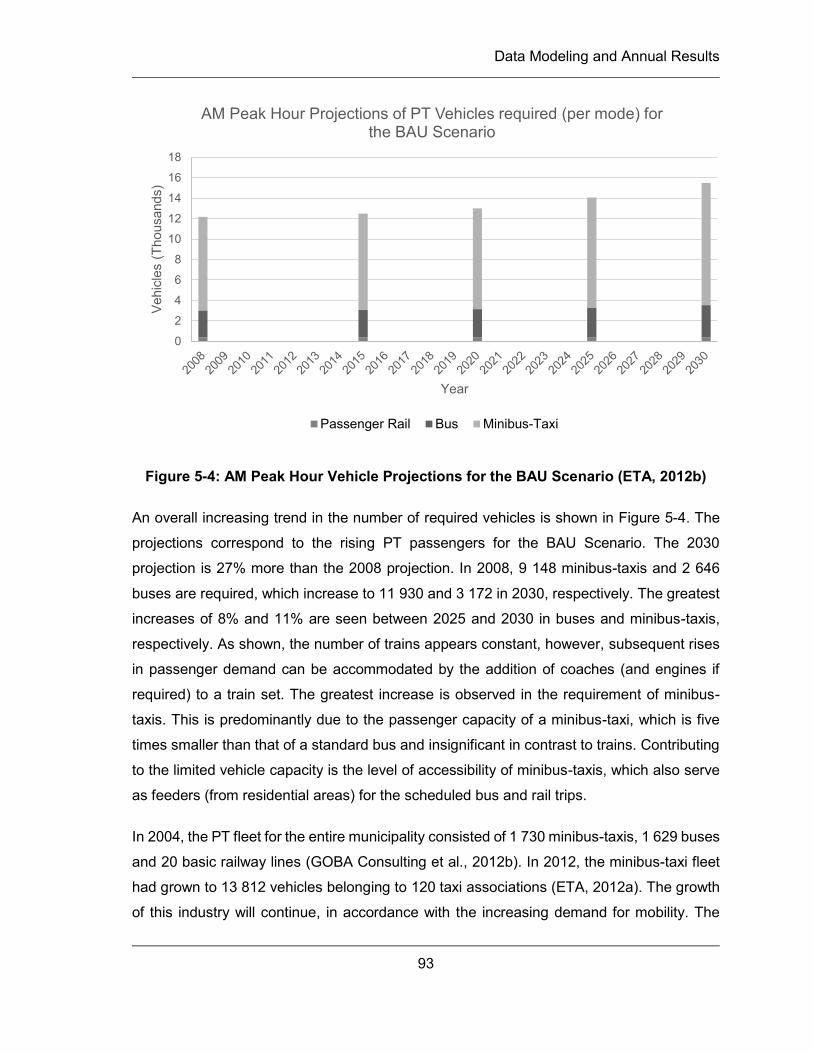
Data Modeling and Annual Results
93
Figure 5-4: AM Peak Hour Vehicle Projections for the BAU Scenario (ETA, 2012b)
An overall increasing trend in the number of required vehicles is shown in Figure 5-4. The
projections correspond to the rising PT passengers for the BAU Scenario. The 2030
projection is 27% more than the 2008 projection. In 2008, 9 148 minibus-taxis and 2 646
buses are required, which increase to 11 930 and 3 172 in 2030, respectively. The greatest
increases of 8% and 11% are seen between 2025 and 2030 in buses and minibus-taxis,
respectively. As shown, the number of trains appears constant, however, subsequent rises
in passenger demand can be accommodated by the addition of coaches (and engines if
required) to a train set. The greatest increase is observed in the requirement of minibus-
taxis. This is predominantly due to the passenger capacity of a minibus-taxi, which is five
times smaller than that of a standard bus and insignificant in contrast to trains. Contributing
to the limited vehicle capacity is the level of accessibility of minibus-taxis, which also serve
as feeders (from residential areas) for the scheduled bus and rail trips.
In 2004, the PT fleet for the entire municipality consisted of 1 730 minibus-taxis, 1 629 buses
and 20 basic railway lines (GOBA Consulting et al., 2012b). In 2012, the minibus-taxi fleet
had grown to 13 812 vehicles belonging to 120 taxi associations (ETA, 2012a). The growth
of this industry will continue, in accordance with the increasing demand for mobility. The
0
2
4
6
8
10
12
14
16
18Ve
hicl
es (T
hous
ands
)
Year
AM Peak Hour Projections of PT Vehicles required (per mode) for the BAU Scenario
Passenger Rail Bus Minibus-Taxi
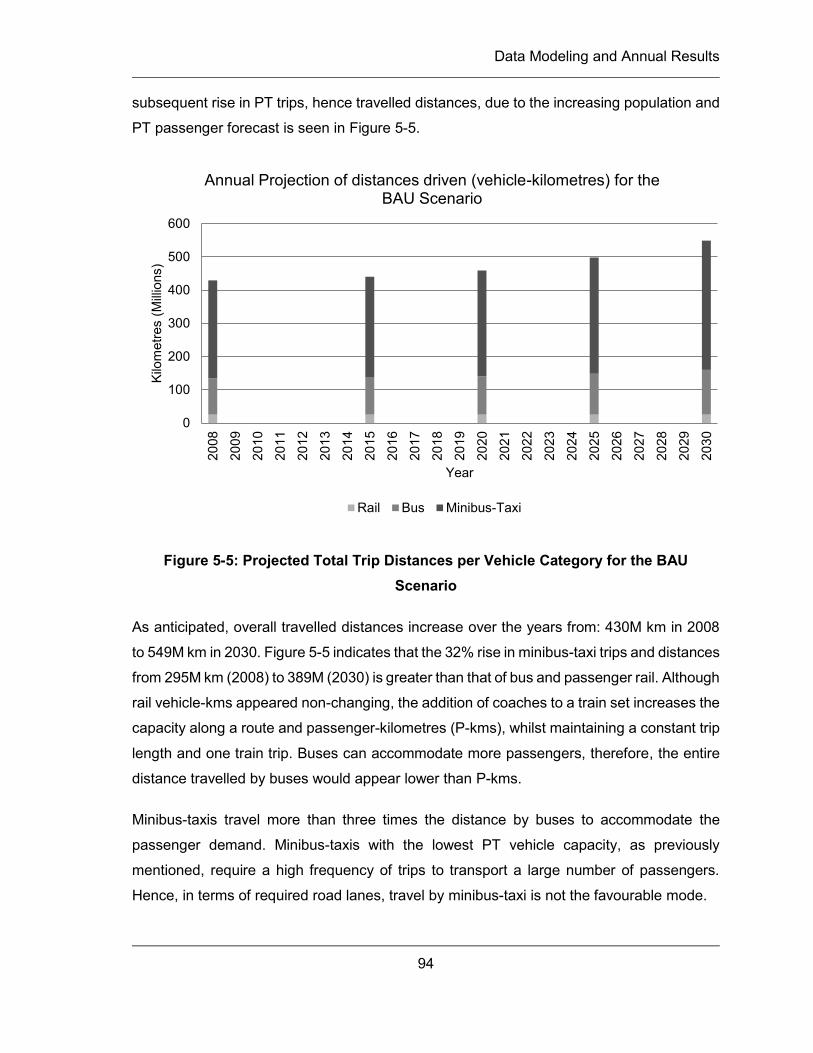
Data Modeling and Annual Results
94
subsequent rise in PT trips, hence travelled distances, due to the increasing population and
PT passenger forecast is seen in Figure 5-5.
Figure 5-5: Projected Total Trip Distances per Vehicle Category for the BAU Scenario
As anticipated, overall travelled distances increase over the years from: 430M km in 2008
to 549M km in 2030. Figure 5-5 indicates that the 32% rise in minibus-taxi trips and distances
from 295M km (2008) to 389M (2030) is greater than that of bus and passenger rail. Although
rail vehicle-kms appeared non-changing, the addition of coaches to a train set increases the
capacity along a route and passenger-kilometres (P-kms), whilst maintaining a constant trip
length and one train trip. Buses can accommodate more passengers, therefore, the entire
distance travelled by buses would appear lower than P-kms.
Minibus-taxis travel more than three times the distance by buses to accommodate the
passenger demand. Minibus-taxis with the lowest PT vehicle capacity, as previously
mentioned, require a high frequency of trips to transport a large number of passengers.
Hence, in terms of required road lanes, travel by minibus-taxi is not the favourable mode.
0
100
200
300
400
500
60020
08
2009
2010
2011
2012
2013
2014
2015
2016
2017
2018
2019
2020
2021
2022
2023
2024
2025
2026
2027
2028
2029
2030
Kilo
met
res
(Milli
ons)
Year
Annual Projection of distances driven (vehicle-kilometres) for the BAU Scenario
Rail Bus Minibus-Taxi
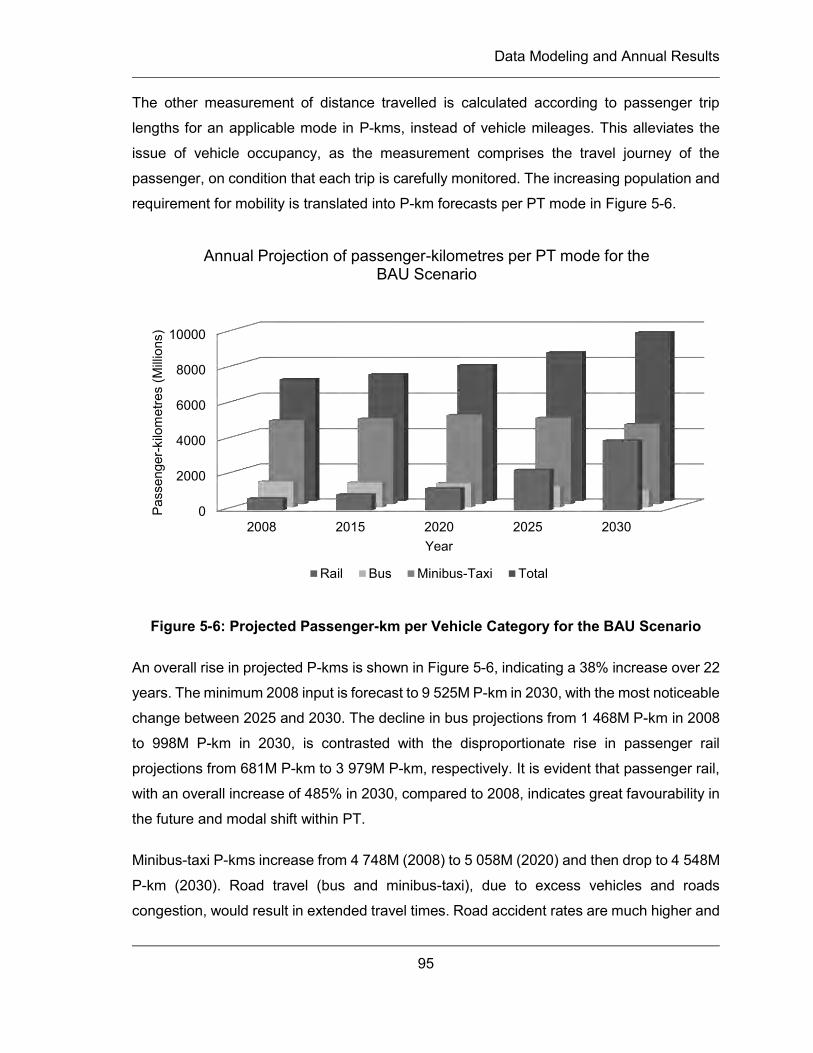
Data Modeling and Annual Results
95
The other measurement of distance travelled is calculated according to passenger trip
lengths for an applicable mode in P-kms, instead of vehicle mileages. This alleviates the
issue of vehicle occupancy, as the measurement comprises the travel journey of the
passenger, on condition that each trip is carefully monitored. The increasing population and
requirement for mobility is translated into P-km forecasts per PT mode in Figure 5-6.
Figure 5-6: Projected Passenger-km per Vehicle Category for the BAU Scenario
An overall rise in projected P-kms is shown in Figure 5-6, indicating a 38% increase over 22
years. The minimum 2008 input is forecast to 9 525M P-km in 2030, with the most noticeable
change between 2025 and 2030. The decline in bus projections from 1 468M P-km in 2008
to 998M P-km in 2030, is contrasted with the disproportionate rise in passenger rail
projections from 681M P-km to 3 979M P-km, respectively. It is evident that passenger rail,
with an overall increase of 485% in 2030, compared to 2008, indicates great favourability in
the future and modal shift within PT.
Minibus-taxi P-kms increase from 4 748M (2008) to 5 058M (2020) and then drop to 4 548M
P-km (2030). Road travel (bus and minibus-taxi), due to excess vehicles and roads
congestion, would result in extended travel times. Road accident rates are much higher and
0
2000
4000
6000
8000
10000
2008 2015 2020 2025 2030
Pass
enge
r-ki
lom
etre
s (M
illion
s)
Year
Annual Projection of passenger-kilometres per PT mode for the BAU Scenario
Rail Bus Minibus-Taxi Total
Data Modeling and Annual Results
96
road closures due to accidents disrupt and may halt travel all together. Minibus-taxis serve
as feeders, transporting major PT hubs and railway stations.
While travel by rail may require mode changes, due to limited routes between stations and
not to specific passenger destinations, many rail passengers either do not have access to
other PT or prefer to walk for cost savings. Another advantage of rail is limited time delays,
which are only experienced during interruptions in train schedules or malfunction of trains,
in comparison to road travel in which congestion may be experienced. Passenger rail is
definitely the safer mode (in terms of passenger mortality rates), which provides services to
all people at the lowest cost, especially along lengthy routes. Considering the number of
passengers that can be transported at once along a densely populated corridor, rail is the
most efficient mode.
5.3.2 The GO!Durban Scenario
This section pertains to the IRPTN, GO!Durban, to be introduced in the EMA. The
projections of GO!Durban are done according to the implementation schedule listed in
Chapter 3, however, due to limitations on scenario modelling, only the fully operational
network planned to be implemented by 2027 is considered in the 2030 forecast.
In 2009, only 22% of expected passengers actually used Phase 1A of the Rea Vaya BRT
system (City of Johannesburg, Planned versus actual performance Rea Vaya, 2010).
Considering this success rate, for the purpose of this study, the following two projections will
be considered: Target Modal Spilt (modeled according to a high-population growth factor
and 20% modal shift from POVs towards PT) and Existing Modal Split (no modal shift). It is,
however important to note that although passenger projections vary, the GO!Durban
Scenario emissions only consider the designed route frequencies, as specified by the
network. While the number of vehicles (required due to trip time) varies, the same vehicle
headways (number of trips) and distance travelled resulted for both projections. As
congestion increases due to the number of POVs on roads, so too does trip time, and the
interaction between road vehicles and GO!Durban vehicles (not operating on reserved
lanes) must be noted.
GO!Durban is the PT intervention introduced by national government to provide improved
services and ultimately increase PT patronage. The ‘high-population growth’ projection
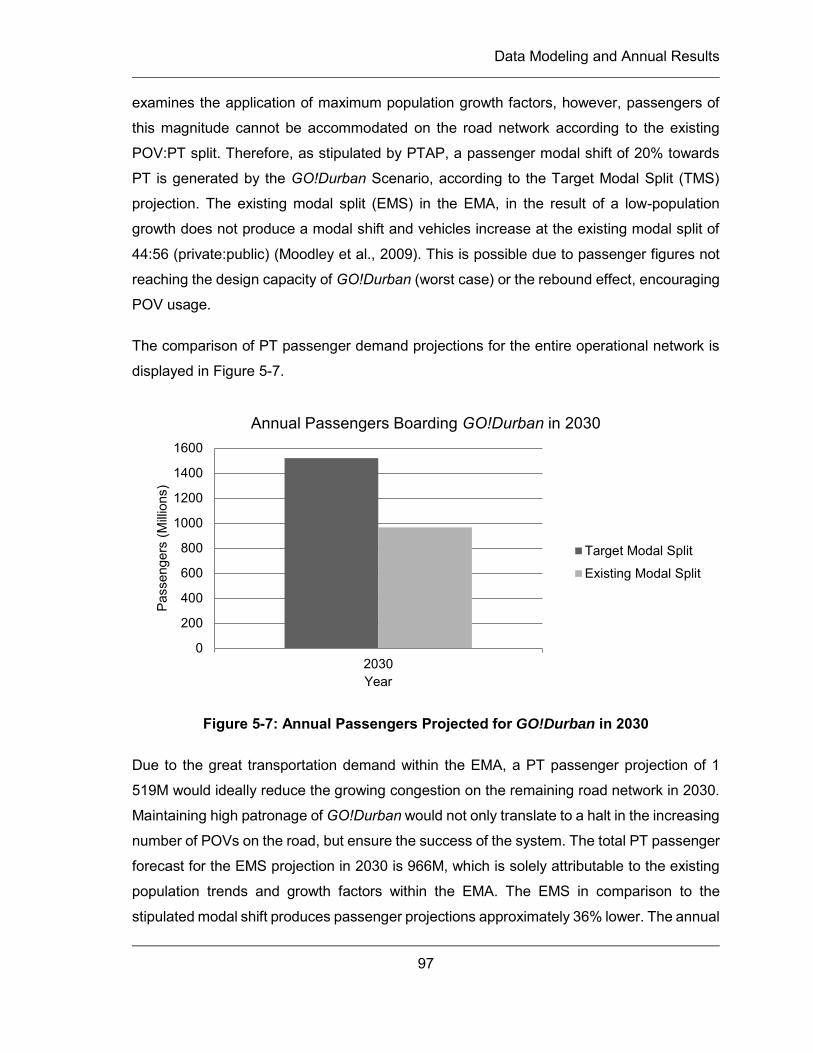
Data Modeling and Annual Results
97
examines the application of maximum population growth factors, however, passengers of
this magnitude cannot be accommodated on the road network according to the existing
POV:PT split. Therefore, as stipulated by PTAP, a passenger modal shift of 20% towards
PT is generated by the GO!Durban Scenario, according to the Target Modal Split (TMS)
projection. The existing modal split (EMS) in the EMA, in the result of a low-population
growth does not produce a modal shift and vehicles increase at the existing modal split of
44:56 (private:public) (Moodley et al., 2009). This is possible due to passenger figures not
reaching the design capacity of GO!Durban (worst case) or the rebound effect, encouraging
POV usage.
The comparison of PT passenger demand projections for the entire operational network is
displayed in Figure 5-7.
Figure 5-7: Annual Passengers Projected for GO!Durban in 2030
Due to the great transportation demand within the EMA, a PT passenger projection of 1
519M would ideally reduce the growing congestion on the remaining road network in 2030.
Maintaining high patronage of GO!Durban would not only translate to a halt in the increasing
number of POVs on the road, but ensure the success of the system. The total PT passenger
forecast for the EMS projection in 2030 is 966M, which is solely attributable to the existing
population trends and growth factors within the EMA. The EMS in comparison to the
stipulated modal shift produces passenger projections approximately 36% lower. The annual
0
200
400
600
800
1000
1200
1400
1600
2030
Pass
enge
rs (M
illion
s)
Year
Annual Passengers Boarding GO!Durban in 2030
Target Modal Split
Existing Modal Split
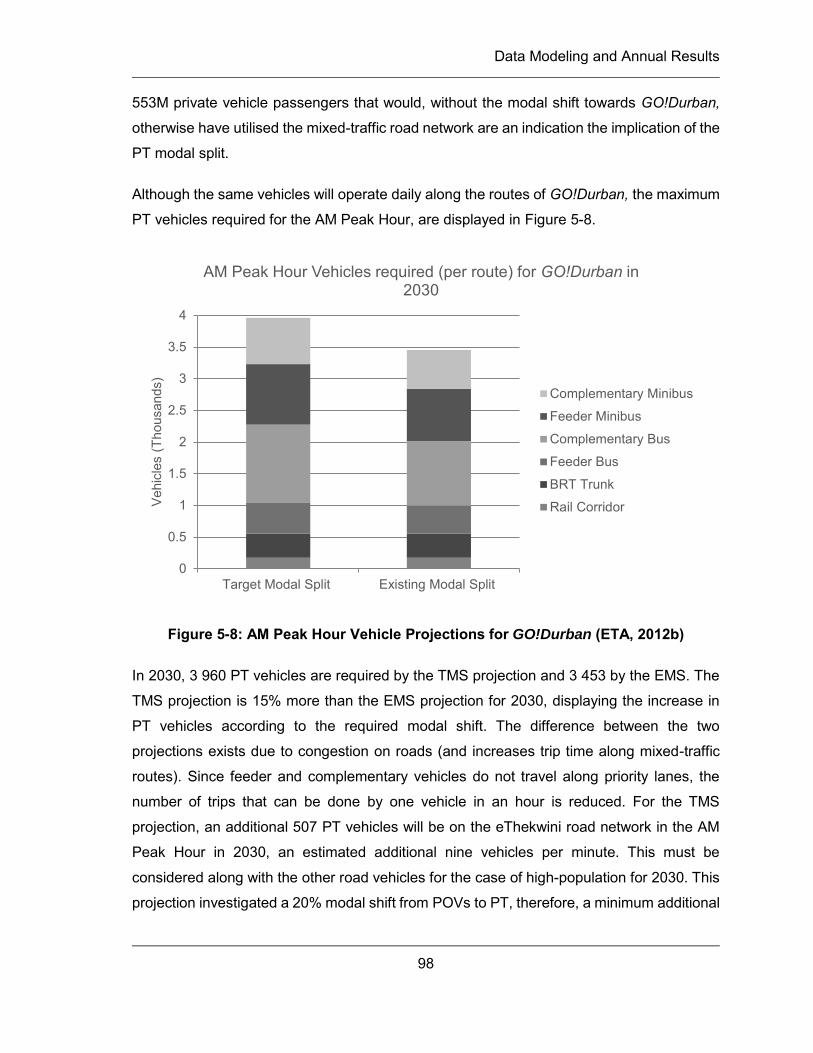
Data Modeling and Annual Results
98
553M private vehicle passengers that would, without the modal shift towards GO!Durban,
otherwise have utilised the mixed-traffic road network are an indication the implication of the
PT modal split.
Although the same vehicles will operate daily along the routes of GO!Durban, the maximum
PT vehicles required for the AM Peak Hour, are displayed in Figure 5-8.
Figure 5-8: AM Peak Hour Vehicle Projections for GO!Durban (ETA, 2012b)
In 2030, 3 960 PT vehicles are required by the TMS projection and 3 453 by the EMS. The
TMS projection is 15% more than the EMS projection for 2030, displaying the increase in
PT vehicles according to the required modal shift. The difference between the two
projections exists due to congestion on roads (and increases trip time along mixed-traffic
routes). Since feeder and complementary vehicles do not travel along priority lanes, the
number of trips that can be done by one vehicle in an hour is reduced. For the TMS
projection, an additional 507 PT vehicles will be on the eThekwini road network in the AM
Peak Hour in 2030, an estimated additional nine vehicles per minute. This must be
considered along with the other road vehicles for the case of high-population for 2030. This
projection investigated a 20% modal shift from POVs to PT, therefore, a minimum additional
0
0.5
1
1.5
2
2.5
3
3.5
4
Target Modal Split Existing Modal Split
Veh
icle
s (T
hous
ands
)
AM Peak Hour Vehicles required (per route) for GO!Durban in 2030
Complementary Minibus
Feeder Minibus
Complementary Bus
Feeder Bus
BRT Trunk
Rail Corridor
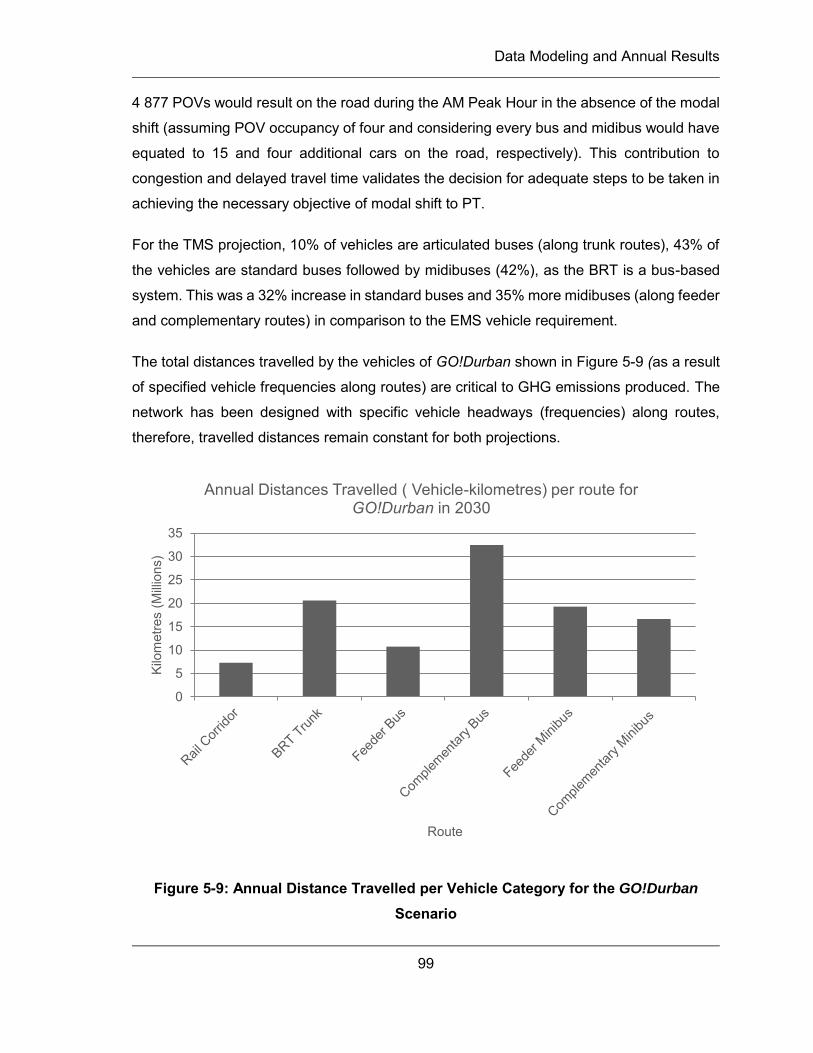
Data Modeling and Annual Results
99
4 877 POVs would result on the road during the AM Peak Hour in the absence of the modal
shift (assuming POV occupancy of four and considering every bus and midibus would have
equated to 15 and four additional cars on the road, respectively). This contribution to
congestion and delayed travel time validates the decision for adequate steps to be taken in
achieving the necessary objective of modal shift to PT.
For the TMS projection, 10% of vehicles are articulated buses (along trunk routes), 43% of
the vehicles are standard buses followed by midibuses (42%), as the BRT is a bus-based
system. This was a 32% increase in standard buses and 35% more midibuses (along feeder
and complementary routes) in comparison to the EMS vehicle requirement.
The total distances travelled by the vehicles of GO!Durban shown in Figure 5-9 (as a result
of specified vehicle frequencies along routes) are critical to GHG emissions produced. The
network has been designed with specific vehicle headways (frequencies) along routes,
therefore, travelled distances remain constant for both projections.
Figure 5-9: Annual Distance Travelled per Vehicle Category for the GO!Durban Scenario
0
5
10
15
20
25
30
35
Kilo
met
res
(Milli
ons)
Route
Annual Distances Travelled ( Vehicle-kilometres) per route for GO!Durban in 2030
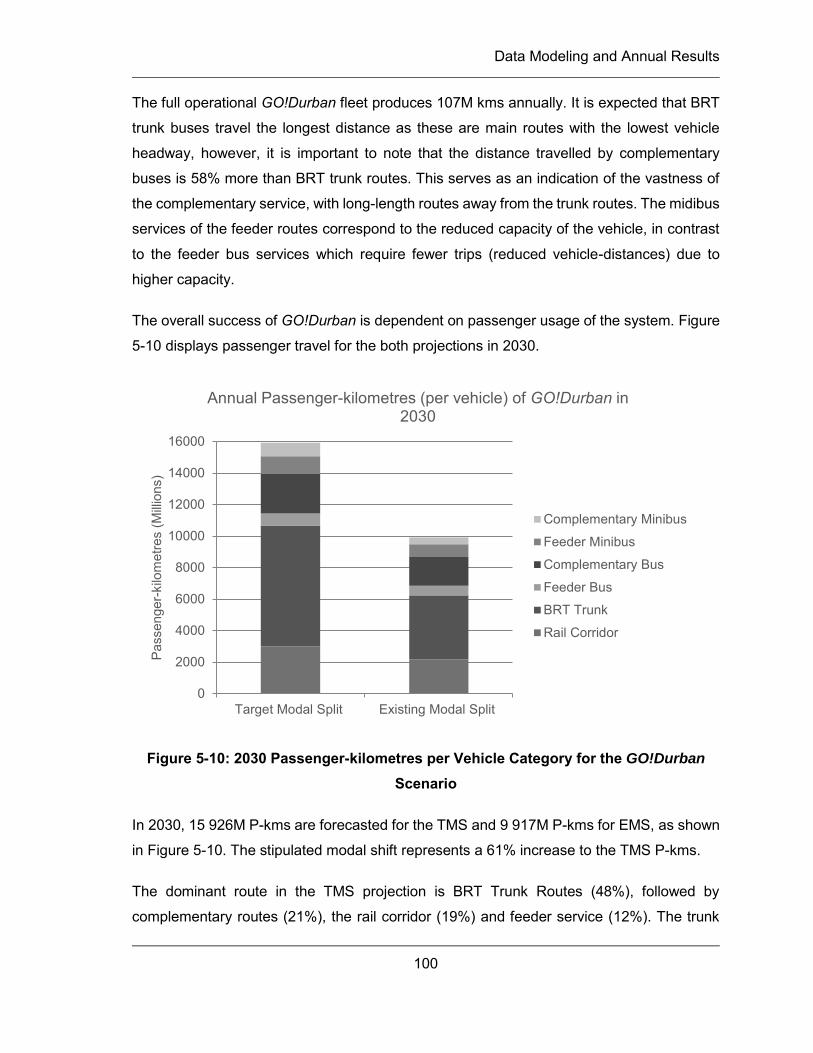
Data Modeling and Annual Results
100
The full operational GO!Durban fleet produces 107M kms annually. It is expected that BRT
trunk buses travel the longest distance as these are main routes with the lowest vehicle
headway, however, it is important to note that the distance travelled by complementary
buses is 58% more than BRT trunk routes. This serves as an indication of the vastness of
the complementary service, with long-length routes away from the trunk routes. The midibus
services of the feeder routes correspond to the reduced capacity of the vehicle, in contrast
to the feeder bus services which require fewer trips (reduced vehicle-distances) due to
higher capacity.
The overall success of GO!Durban is dependent on passenger usage of the system. Figure
5-10 displays passenger travel for the both projections in 2030.
Figure 5-10: 2030 Passenger-kilometres per Vehicle Category for the GO!Durban Scenario
In 2030, 15 926M P-kms are forecasted for the TMS and 9 917M P-kms for EMS, as shown
in Figure 5-10. The stipulated modal shift represents a 61% increase to the TMS P-kms.
The dominant route in the TMS projection is BRT Trunk Routes (48%), followed by
complementary routes (21%), the rail corridor (19%) and feeder service (12%). The trunk
0
2000
4000
6000
8000
10000
12000
14000
16000
Target Modal Split Existing Modal Split
Pass
enge
r-ki
lom
etre
s (M
illion
s)
Annual Passenger-kilometres (per vehicle) of GO!Durban in 2030
Complementary Minibus
Feeder Minibus
Complementary Bus
Feeder Bus
BRT Trunk
Rail Corridor
Data Modeling and Annual Results
101
routes of the corridors consist of 67% of total passenger trips, emphasising the density and
demand along the trunk routes. Bus routes comprise 69% of total 2030 P-kms, indicating
the central mode and design capacity of the routes.
BRT trunk routes display the greatest decrease in passenger distances of 3 575 P-kms, in
comparison to TMS. Travel along complementary midibus routes of the EMS projection are
half those of the TMS in 2030. Trunk routes account for 73% of the overall decrease from
the TMS to the EMS projection. Higher projections, according to the TMS, indicate an
increase in ridership along the densely populated trunk routes as expected due to
advantageous travel times in the priority lanes. This reaffirms the requirement of quicker
services offered by the trunk routes.
5.4 Summary
The traffic outputs extracted from EMME/2 (modelling by ETA) have been validated (within
a 95% confidence level) with the travel patterns observed by the HTS of 2008. Conversion
of the AM Peak Hour outputs to annual traffic data was done in accordance with modal split
proportions obtained from the HTS of 2008. The low growth (existing modal split) and high
growth projection scenarios were used. The BAU Scenario followed the existing PT ridership
(44%) and the GO!Durban Scenario the TMS according to and 20% modal shift towards PT.
Passenger projections of the BAU Scenario increase by 34% from 2008 to 2030. The
upsurge of minibus-taxis, in comparison to buses and trains, is due to the accessibility and
function of the service and limited capacity of the vehicle. The rapid increase of P-kms of
rail services is an indication of the capacity and favourability of the PT mode as fast, safe
and convenient. The 2030 GO!Durban Scenario indicated the greatest distances travelled
along complementary bus routes and highest P-km along BRT trunk routes, due vastness
and length of complementary routes and increased capacity of articulate buses,
respectively. Passenger projections of the TMS and EMS scenarios differed by 36%.
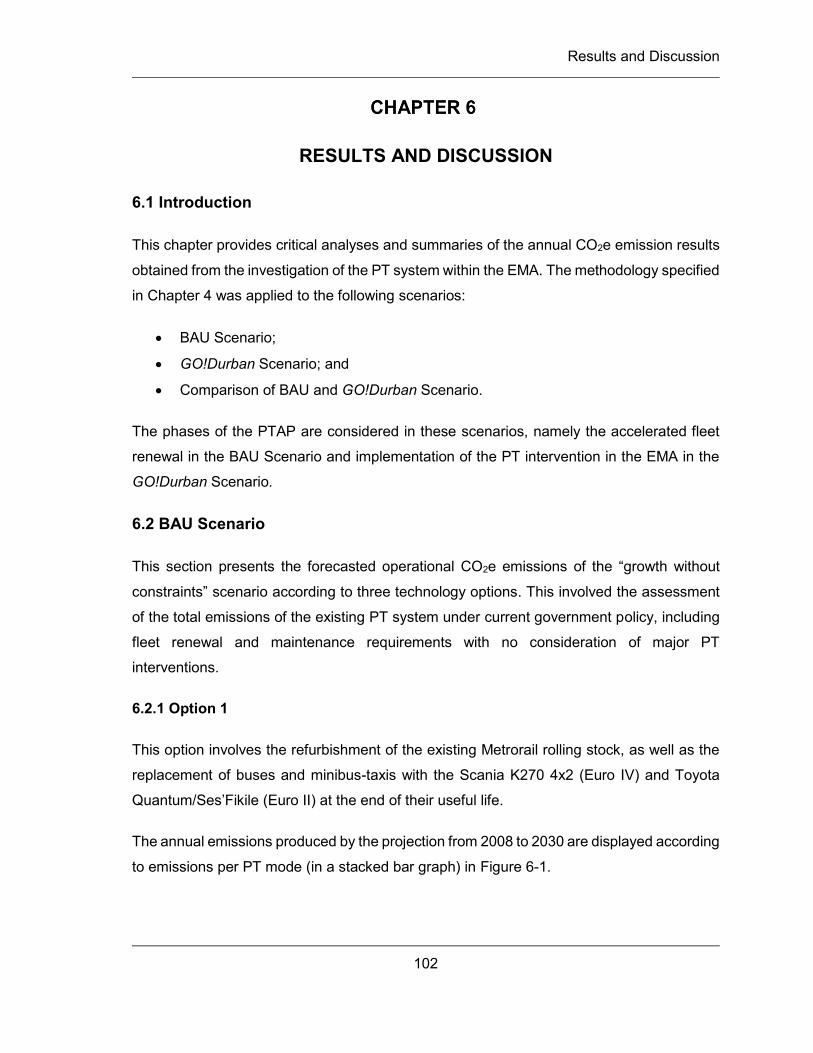
Results and Discussion
102
RESULTS AND DISCUSSION
6.1 Introduction
This chapter provides critical analyses and summaries of the annual CO2e emission results
obtained from the investigation of the PT system within the EMA. The methodology specified
in Chapter 4 was applied to the following scenarios:
BAU Scenario;
GO!Durban Scenario; and
Comparison of BAU and GO!Durban Scenario.
The phases of the PTAP are considered in these scenarios, namely the accelerated fleet
renewal in the BAU Scenario and implementation of the PT intervention in the EMA in the
GO!Durban Scenario.
6.2 BAU Scenario
This section presents the forecasted operational CO2e emissions of the “growth without
constraints” scenario according to three technology options. This involved the assessment
of the total emissions of the existing PT system under current government policy, including
fleet renewal and maintenance requirements with no consideration of major PT
interventions.
6.2.1 Option 1
This option involves the refurbishment of the existing Metrorail rolling stock, as well as the
replacement of buses and minibus-taxis with the Scania K270 4x2 (Euro IV) and Toyota
Quantum/Ses’Fikile (Euro II) at the end of their useful life.
The annual emissions produced by the projection from 2008 to 2030 are displayed according
to emissions per PT mode (in a stacked bar graph) in Figure 6-1.
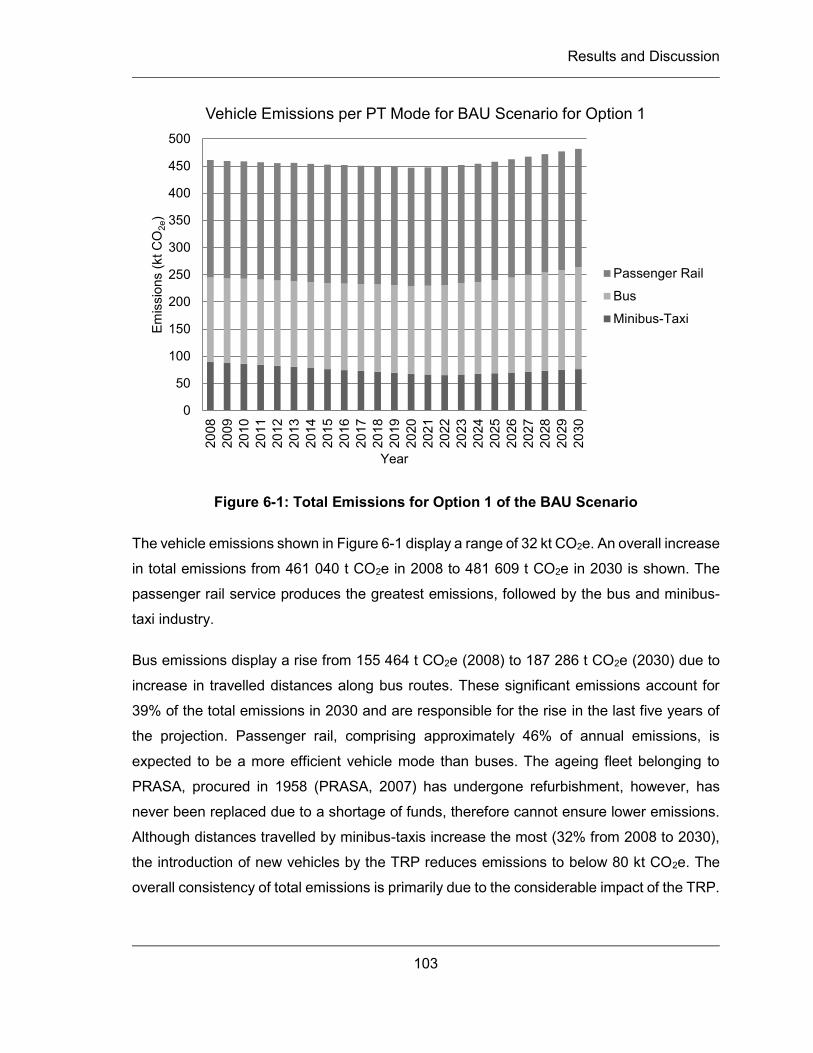
Results and Discussion
103
Figure 6-1: Total Emissions for Option 1 of the BAU Scenario
The vehicle emissions shown in Figure 6-1 display a range of 32 kt CO2e. An overall increase
in total emissions from 461 040 t CO2e in 2008 to 481 609 t CO2e in 2030 is shown. The
passenger rail service produces the greatest emissions, followed by the bus and minibus-
taxi industry.
Bus emissions display a rise from 155 464 t CO2e (2008) to 187 286 t CO2e (2030) due to
increase in travelled distances along bus routes. These significant emissions account for
39% of the total emissions in 2030 and are responsible for the rise in the last five years of
the projection. Passenger rail, comprising approximately 46% of annual emissions, is
expected to be a more efficient vehicle mode than buses. The ageing fleet belonging to
PRASA, procured in 1958 (PRASA, 2007) has undergone refurbishment, however, has
never been replaced due to a shortage of funds, therefore cannot ensure lower emissions.
Although distances travelled by minibus-taxis increase the most (32% from 2008 to 2030),
the introduction of new vehicles by the TRP reduces emissions to below 80 kt CO2e. The
overall consistency of total emissions is primarily due to the considerable impact of the TRP.
0
50
100
150
200
250
300
350
400
450
500
2008
2009
2010
2011
2012
2013
2014
2015
2016
2017
2018
2019
2020
2021
2022
2023
2024
2025
2026
2027
2028
2029
2030
Emis
sion
s (k
t CO
2e)
Year
Vehicle Emissions per PT Mode for BAU Scenario for Option 1
Passenger Rail
Bus
Minibus-Taxi
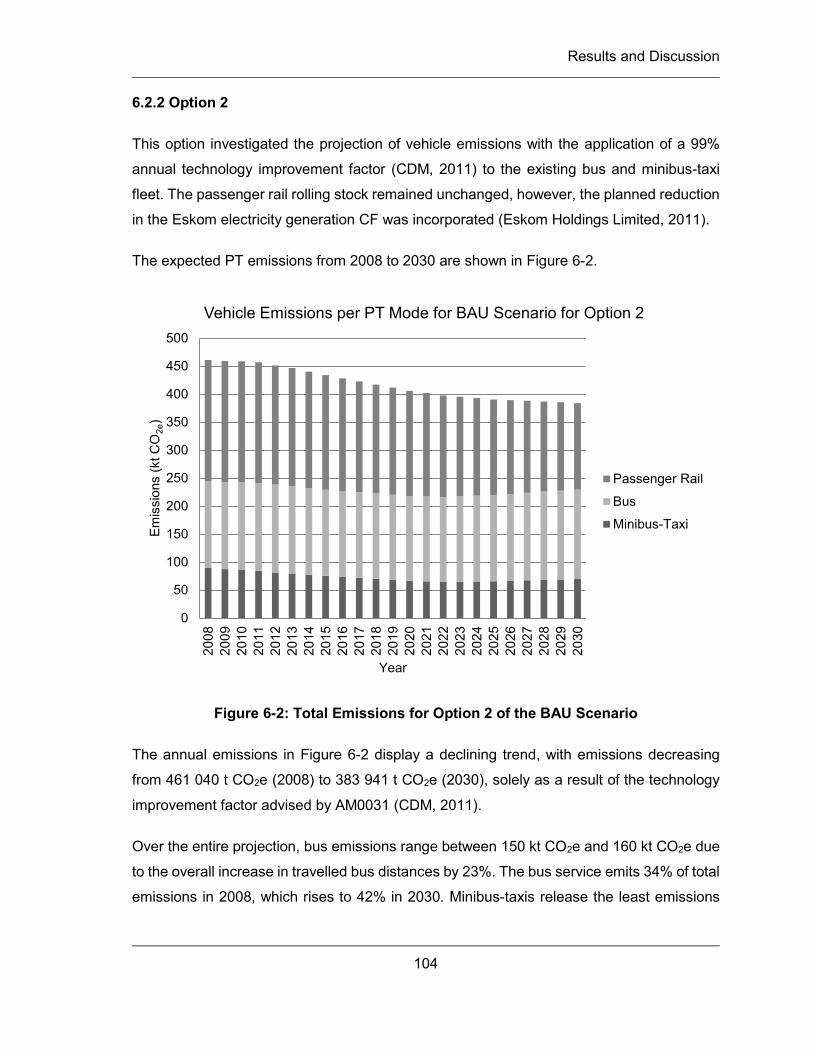
Results and Discussion
104
6.2.2 Option 2
This option investigated the projection of vehicle emissions with the application of a 99%
annual technology improvement factor (CDM, 2011) to the existing bus and minibus-taxi
fleet. The passenger rail rolling stock remained unchanged, however, the planned reduction
in the Eskom electricity generation CF was incorporated (Eskom Holdings Limited, 2011).
The expected PT emissions from 2008 to 2030 are shown in Figure 6-2.
Figure 6-2: Total Emissions for Option 2 of the BAU Scenario
The annual emissions in Figure 6-2 display a declining trend, with emissions decreasing
from 461 040 t CO2e (2008) to 383 941 t CO2e (2030), solely as a result of the technology
improvement factor advised by AM0031 (CDM, 2011).
Over the entire projection, bus emissions range between 150 kt CO2e and 160 kt CO2e due
to the overall increase in travelled bus distances by 23%. The bus service emits 34% of total
emissions in 2008, which rises to 42% in 2030. Minibus-taxis release the least emissions
0
50
100
150
200
250
300
350
400
450
500
2008
2009
2010
2011
2012
2013
2014
2015
2016
2017
2018
2019
2020
2021
2022
2023
2024
2025
2026
2027
2028
2029
2030
Emis
sion
s (k
t CO
2e)
Year
Vehicle Emissions per PT Mode for BAU Scenario for Option 2
Passenger Rail
Bus
Minibus-Taxi
Results and Discussion
105
due to the TRP, with only 18% of total emissions in 2030. Eskom’s attempts to improve the
environmental footprint of electricity generation even with the growing demand up to 2030
(Eskom Holdings Limited, 2011), has significantly reduced emission forecasts of Metrorail.
The mode displays a 29% decrease in emissions (from 2008 to 2030), the most substantial
among the PT vehicles. Although passenger rail produces the most emissions over the
projection, the bus service emissions exceed those of the rail fleet in 2030, due to passenger
capacity and efficient electricity generation of rail.
6.2.3 Option 3
The latest estimated technology developments were considered up to 2030. Buses were
replaced with the Volvo B7R (Euro V) and minibus-taxis with Mercedes Benz Sprinters (Euro
V) at the end of useful life. Together with the Eskom efficiency goals, the new rolling stock,
X’Trapolis Mega, was introduced steadily over 10 years, replacing the existing PRASA
rolling stock.
The CO2e emissions (per mode) for Option 3 are displayed in Figure 6-3.
Figure 6-3: Total Emissions for Option 3 of the BAU Scenario
0
50
100
150
200
250
300
350
400
450
500
2008
2009
2010
2011
2012
2013
2014
2015
2016
2017
2018
2019
2020
2021
2022
2023
2024
2025
2026
2027
2028
2029
2030
Emis
sion
s (k
t CO
2e)
Year
Vehicle Emissions per PT Mode for BAU Scenario for Option 3
Passenger Rail
Bus
Minibus-Taxi
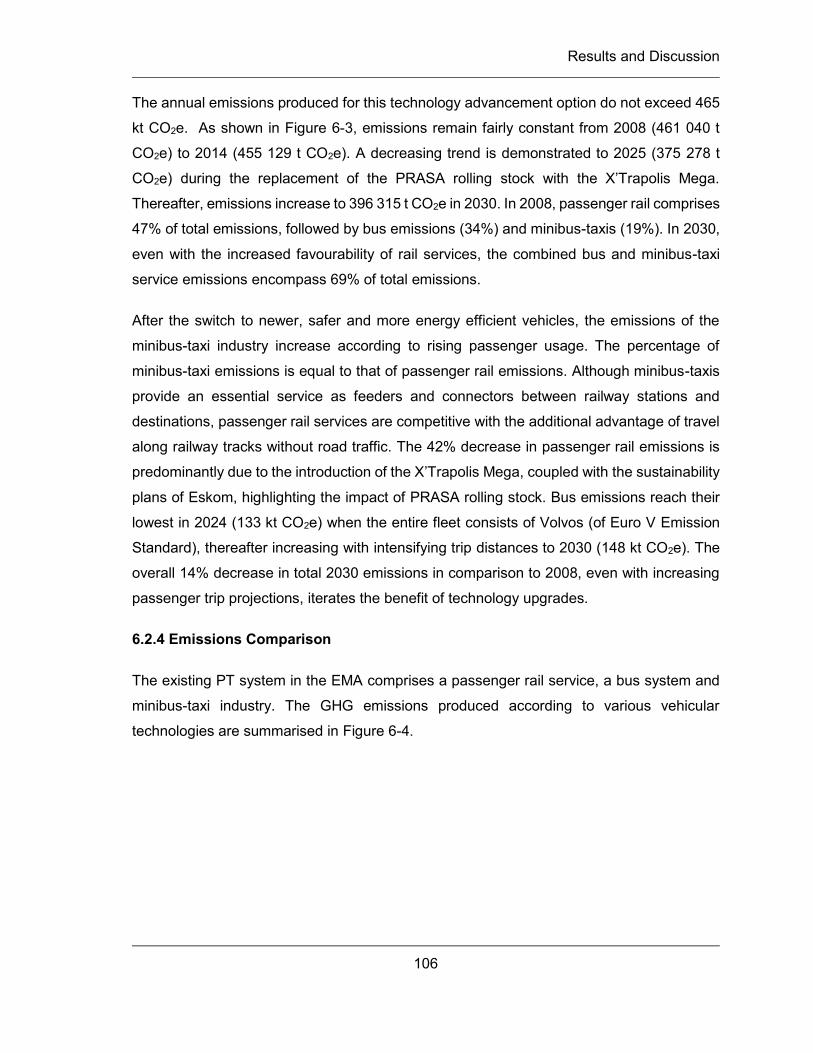
Results and Discussion
106
The annual emissions produced for this technology advancement option do not exceed 465
kt CO2e. As shown in Figure 6-3, emissions remain fairly constant from 2008 (461 040 t
CO2e) to 2014 (455 129 t CO2e). A decreasing trend is demonstrated to 2025 (375 278 t
CO2e) during the replacement of the PRASA rolling stock with the X’Trapolis Mega.
Thereafter, emissions increase to 396 315 t CO2e in 2030. In 2008, passenger rail comprises
47% of total emissions, followed by bus emissions (34%) and minibus-taxis (19%). In 2030,
even with the increased favourability of rail services, the combined bus and minibus-taxi
service emissions encompass 69% of total emissions.
After the switch to newer, safer and more energy efficient vehicles, the emissions of the
minibus-taxi industry increase according to rising passenger usage. The percentage of
minibus-taxi emissions is equal to that of passenger rail emissions. Although minibus-taxis
provide an essential service as feeders and connectors between railway stations and
destinations, passenger rail services are competitive with the additional advantage of travel
along railway tracks without road traffic. The 42% decrease in passenger rail emissions is
predominantly due to the introduction of the X’Trapolis Mega, coupled with the sustainability
plans of Eskom, highlighting the impact of PRASA rolling stock. Bus emissions reach their
lowest in 2024 (133 kt CO2e) when the entire fleet consists of Volvos (of Euro V Emission
Standard), thereafter increasing with intensifying trip distances to 2030 (148 kt CO2e). The
overall 14% decrease in total 2030 emissions in comparison to 2008, even with increasing
passenger trip projections, iterates the benefit of technology upgrades.
6.2.4 Emissions Comparison
The existing PT system in the EMA comprises a passenger rail service, a bus system and
minibus-taxi industry. The GHG emissions produced according to various vehicular
technologies are summarised in Figure 6-4.
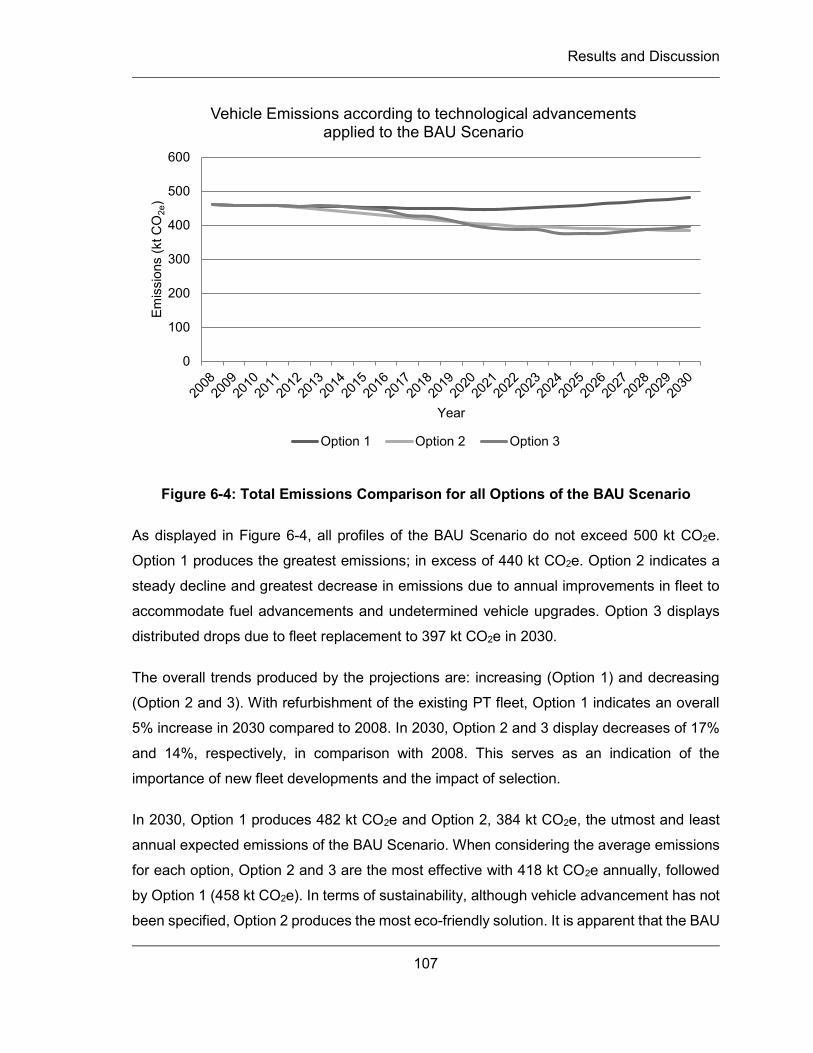
Results and Discussion
107
Figure 6-4: Total Emissions Comparison for all Options of the BAU Scenario
As displayed in Figure 6-4, all profiles of the BAU Scenario do not exceed 500 kt CO2e.
Option 1 produces the greatest emissions; in excess of 440 kt CO2e. Option 2 indicates a
steady decline and greatest decrease in emissions due to annual improvements in fleet to
accommodate fuel advancements and undetermined vehicle upgrades. Option 3 displays
distributed drops due to fleet replacement to 397 kt CO2e in 2030.
The overall trends produced by the projections are: increasing (Option 1) and decreasing
(Option 2 and 3). With refurbishment of the existing PT fleet, Option 1 indicates an overall
5% increase in 2030 compared to 2008. In 2030, Option 2 and 3 display decreases of 17%
and 14%, respectively, in comparison with 2008. This serves as an indication of the
importance of new fleet developments and the impact of selection.
In 2030, Option 1 produces 482 kt CO2e and Option 2, 384 kt CO2e, the utmost and least
annual expected emissions of the BAU Scenario. When considering the average emissions
for each option, Option 2 and 3 are the most effective with 418 kt CO2e annually, followed
by Option 1 (458 kt CO2e). In terms of sustainability, although vehicle advancement has not
been specified, Option 2 produces the most eco-friendly solution. It is apparent that the BAU
0
100
200
300
400
500
600Em
issi
ons
(kt C
O2e
)
Year
Vehicle Emissions according to technological advancements applied to the BAU Scenario
Option 1 Option 2 Option 3
Results and Discussion
108
Scenario according to Option 1 is not a desired outcome. While Option 3 is dependent on
the rate at which new rolling stock is introduced, with defined optimum technology
advancements, it is the more accurate alternative. Examining the consequence of modal
assignment, the contribution of each mode to the overall 2030 emissions for all Options are
summarised in Figure 6-5.
Figure 6-5: Emission Split per Vehicle Category for all Options of the BAU Scenario
In 2030, Option 1 and 2 display similar compositions of emission, however, a slight shift
away from passenger rail is observed in Option 2 with the application of Eskom mitigation.
The overall adjustment in the shares of emissions for Option 3 is due to the introduction of
new rail rolling stock and Euro V vehicles, which has produced an increase in proportion of
minibus-taxi emissions and decrease in bus and passenger rail emissions.
In 2030 despite the vehicle technology assigned, GHG emissions from the bus fleet exceed
those released by passenger rail or the minibus-taxi service for Option 2 and 3. Although
the greatest distance is driven by minibus-taxis (owing to the reduced passenger capacity),
this mode still produces the least emissions over Option 1 and 2. The apparent increase in
45% 40%31%
39%42%
37%
16% 18%31%
0%
10%
20%
30%
40%
50%
60%
70%
80%
90%
100%
Option 1 Option 2 Option 3
Emissions production per mode for the 2030 BAU Scenario options
Minibus-Taxi
Bus
Passenger Rail
Results and Discussion
109
the minibus-taxi segment of Option 3 is due to the introduction of a more advanced vehicles
and the considerable decrease in passenger rail proportions.
The proportion of bus emissions is comparable for all options. Although the distance driven
by buses is only 27% of minibus-taxis, this does not reflect in the share of emissions
produced as bus emissions are more than double those of minibus-taxis in Option 1 and 2.
Minibus-taxis are the most efficient mode, transporting 57% of the annual passenger
demand and releasing only 16%, 18% and 31% of total emissions over all options. In Option
3 however, emissions produced by rail and minibus-taxis are equal, displaying the success
of the X’trapolis Mega in reducing emissions.
During the peak periods, the high passenger demand of the rail service in one direction,
results in low occupancy trains (with the same capacity) on the return trip. This may seem
unproductive however, the passenger rail system is the most efficient means of transporting
high volumes during peak hours. The subsequent rail emissions result from return trips
cannot simply be measured as origin-destination trips of passengers, as coaches may be
empty. Minibus-taxi services are different considering that trips are only made when the
vehicles are full.
6.3 GO!Durban Scenario
This section presented the expected vehicle emissions of the GO!Durban network to be
implemented in the EMA. The anticipated timeframes specified by GO!Durban, however,
indicate that the entire network will be online and functional in 2027 (EM, 2015a). Due to
data modelling constraints, for the purpose of this study, 2030 was considered for the
operational date of the entire system. The GO!Durban CO2e emissions produced over three
technology possibilities are presented according to the vehicle frequency required for the
passenger demand along routes.
Vehicles similar to those operating in Rea Vaya and MyCiTi were selected for use by
GO!Durban. It is possible however, that smaller buses would adequately meet the demands
along the complementary bus routes in the initial stages with lower ridership. Once fully
implemented, however, larger buses may be introduced for greater capacity, as considered
in this scenario.
Results and Discussion
110
6.3.1 Option 1
Considering the option of the same vehicles along the routes of Phase 1 of GO!Durban
introduced for the other phases, the expected operational emissions of the network in 2030
are displayed in Figure 6-6.
Figure 6-6: 2030 Emissions per Vehicle Category for Option 1 of the GO!Durban
Scenario
The total emissions produced by the vehicles selected for GO!Durban start as the first
corridor comes online in 2016 (EM, 2015a). Emissions of the network increase with the
addition of corridors until the wall-to-wall system is achieved in 2027. Thereafter, the entire
network is expected to stabilise and continue operation to the year 2030, for which an
approximate 191 547 t CO2e will be emitted.
As displayed in Figure 6-6, the highest emissions are produced by the rail corridor, a trunk
route for provision of services to 40% of eThekwini’s PT demand (EM, 2015a). Therefore
the anticipated result of 47% of total emissions is acceptable bearing in mind the safety of
travel by rail, as well as convenience and advantage of ROW.
The remaining 53% of emissions result from the operation of road vehicles. Complementary
buses produce the greatest bus emissions, followed by BRT trunk buses and feeder buses,
in proportion with the respective distances driven along the routes. Emissions from
0102030405060708090
2030
Emis
sion
s (k
t CO
2e)
Year
Vehicle Emissions per PT Mode for GO!Durban for Option 1
Trunk Rail Corridor
Trunk Bus
Feeder Bus
Feeder Midibus
Complementary Bus
Complementary Midibus
Results and Discussion
111
midibuses comprise less than 2% of 2030 totals each, an efficient result for their combined
36% of total road trip distances.
Trunk routes produce 65% of total emissions, followed by complementaries (25%) and
feeder routes (10%). Reducing emissions along complementary routes would require
customising each route according to passenger demand, with larger buses for major
demand and midibuses for small demand. Adjustment to preliminary plans, however, can
only be made once the system has been implemented and gaps established.
6.3.2 Option 2
The total operational emissions for the entire GO!Durban network according to annual
technology improvement factors applied from Phase 1 to 2030, are displayed in Figure 6-7.
Figure 6-7: 2030 Emissions per Vehicle Category for Option 2 of the GO!Durban
Scenario
In 2030 GO!Durban vehicle emissions total 177 228 t CO2e. Assuming that Eskom meets
the CF target in 2030 (Eskom Holdings Limited, 2011), the rail corridor emits 50% of total
GHGs. Approximately 103 kt CO2e in 2030 are produced by buses, owing to the allocation
of the eight BRT trunk routes to articulated buses, and feeder and complementary routes to
standard buses and midibuses. Together midibus emissions (6 kt CO2e) and passenger rail
emissions (17 kt CO2e) comprise 22% of the total projected emissions of 2030.
0102030405060708090
2030
Em
issi
ons
(kt C
O2e
)
Year
Vehicle Emissions per PT Mode for GO!Durban for Option 2
Trunk Rail Corridor
Trunk Bus
Feeder Bus
Feeder Midibus
Complementary Bus
Complementary Midibus
Results and Discussion
112
Emissions produced by GO!Durban vehicles along trunk and complementary routes
comprise majority (67% and 24%, respectively) of total 2030 emissions, as shown in Figure
6-7. Complementary routes are referred to as additional bus routes, hence one would expect
complementary route emissions to be minor in comparison to those emitted by trunk routes
with high vehicle frequencies. This, however, indicates the importance for transportation
along many other routes which have been included as a Quality Bus Service in GO!Durban.
Feeder route emissions equate to 13% of trunk emissions, fulfilling their purpose of efficient
assistant services.
6.3.3 Option 3
The total emissions for 2030, for the GO!Durban network consisting of Euro V vehicle
technology, are displayed in Figure 6-8.
Figure 6-8: 2030 Emissions per Vehicle Category for Option 3 of the GO!Durban
Scenario
182 594 t CO2e is produced by GO!Durban in 2030. The total GHG emissions comprise 49%
passenger rail, 19% articulated bus, 25% standard bus and 7% midibus emissions. Trunk
routes produce 123 kt CO2e (68% of the total) along the 190km reserved road length and
rail routes, due to the priority and high frequency of vehicles. In addition, the complementary
0102030405060708090
2030
Emis
sion
s (k
t CO
2e)
Year
Vehicle Emissions per PT Mode for GO!Durban for Option 3
Trunk Rail Corridor
Trunk Bus
Feeder Bus
Feeder Midibus
Complementary Bus
Complementary Midibus
Results and Discussion
113
service emits 41 kt CO2e (22% of the total) due to extensive bus routes, and assistance by
feeders, 18 kt CO2e (remaining 10%).
51% of 2030 emissions are produced by road vehicles which provide services to the
remaining 60% of PT passengers, proving to be the more efficient mode.
6.3.4 Emissions Comparison
The estimated 2030 GHG emissions produced by the functional GO!Durban system
providing PT services in the EMA are summarised in Figure 6-9.
Figure 6-9: 2030 Emissions Comparison for all Options of the GO!Durban Scenario
The final 2030 emissions for Option 1, 2 and 3 are: 192 kt CO2e, 177 kt CO2e and 183 kt
CO2e, respectively. Option 2 and 3 are 7% and 5% less than Option 1, respectively. These
reduced emissions serve as an indication of the impact of technology advancement, which
appears to be minor in 2030 however, the effect of which is considerable over several years
of operation.
Option 2 which accounts for unknown vehicle upgrades, appears to be the most sustainable
alternative. Option 3, however, realistically considers technology improvements according
0
20
40
60
80
100
120
140
160
180
200
Option 1 Option 2 Option 3
Em
issi
ons
(kt C
O2e
)
2030 Emissions along GO!Durban routes for all options
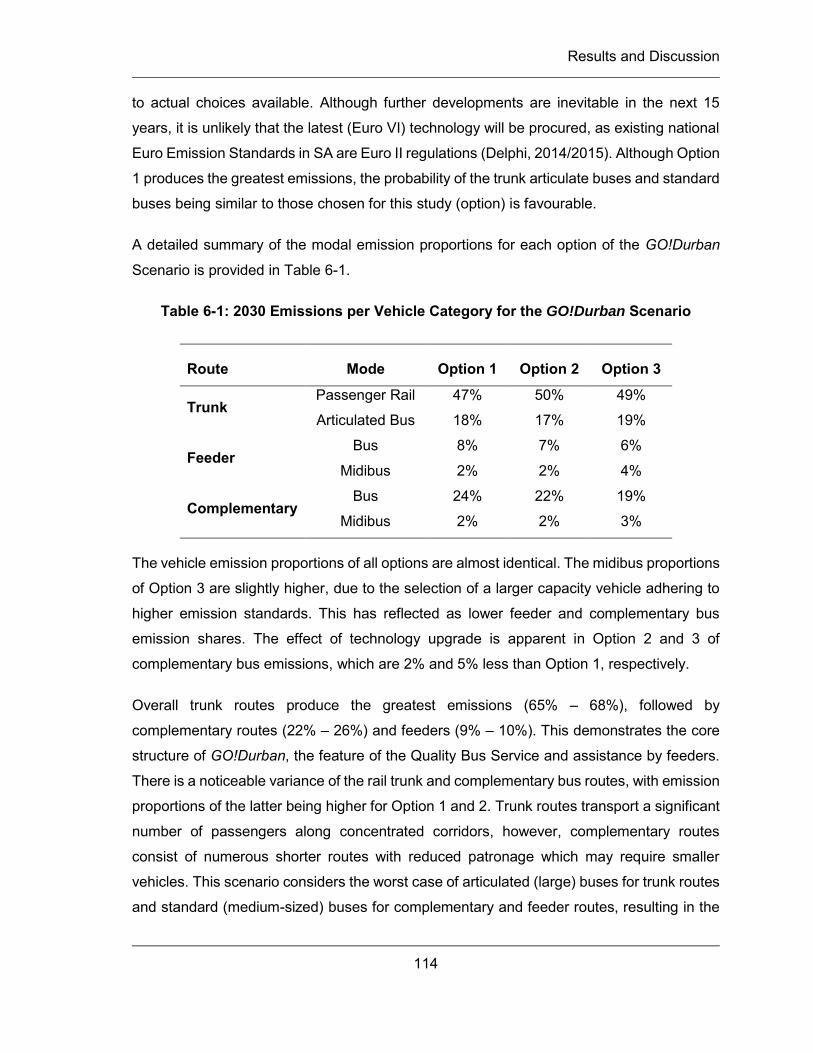
Results and Discussion
114
to actual choices available. Although further developments are inevitable in the next 15
years, it is unlikely that the latest (Euro VI) technology will be procured, as existing national
Euro Emission Standards in SA are Euro II regulations (Delphi, 2014/2015). Although Option
1 produces the greatest emissions, the probability of the trunk articulate buses and standard
buses being similar to those chosen for this study (option) is favourable.
A detailed summary of the modal emission proportions for each option of the GO!Durban
Scenario is provided in Table 6-1.
Table 6-1: 2030 Emissions per Vehicle Category for the GO!Durban Scenario
Route Mode Option 1 Option 2 Option 3
Trunk Passenger Rail 47% 50% 49%
Articulated Bus 18% 17% 19%
Feeder Bus 8% 7% 6%
Midibus 2% 2% 4%
Complementary Bus 24% 22% 19%
Midibus 2% 2% 3%
The vehicle emission proportions of all options are almost identical. The midibus proportions
of Option 3 are slightly higher, due to the selection of a larger capacity vehicle adhering to
higher emission standards. This has reflected as lower feeder and complementary bus
emission shares. The effect of technology upgrade is apparent in Option 2 and 3 of
complementary bus emissions, which are 2% and 5% less than Option 1, respectively.
Overall trunk routes produce the greatest emissions (65% – 68%), followed by
complementary routes (22% – 26%) and feeders (9% – 10%). This demonstrates the core
structure of GO!Durban, the feature of the Quality Bus Service and assistance by feeders.
There is a noticeable variance of the rail trunk and complementary bus routes, with emission
proportions of the latter being higher for Option 1 and 2. Trunk routes transport a significant
number of passengers along concentrated corridors, however, complementary routes
consist of numerous shorter routes with reduced patronage which may require smaller
vehicles. This scenario considers the worst case of articulated (large) buses for trunk routes
and standard (medium-sized) buses for complementary and feeder routes, resulting in the
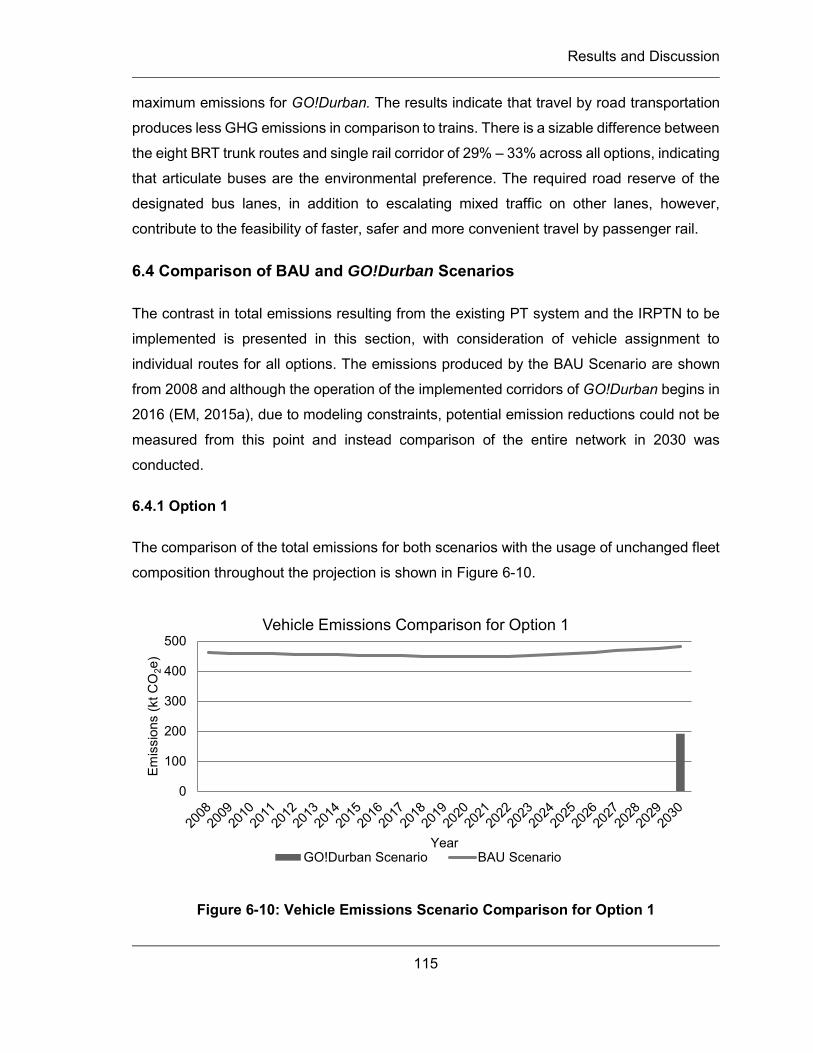
Results and Discussion
115
maximum emissions for GO!Durban. The results indicate that travel by road transportation
produces less GHG emissions in comparison to trains. There is a sizable difference between
the eight BRT trunk routes and single rail corridor of 29% – 33% across all options, indicating
that articulate buses are the environmental preference. The required road reserve of the
designated bus lanes, in addition to escalating mixed traffic on other lanes, however,
contribute to the feasibility of faster, safer and more convenient travel by passenger rail.
6.4 Comparison of BAU and GO!Durban Scenarios
The contrast in total emissions resulting from the existing PT system and the IRPTN to be
implemented is presented in this section, with consideration of vehicle assignment to
individual routes for all options. The emissions produced by the BAU Scenario are shown
from 2008 and although the operation of the implemented corridors of GO!Durban begins in
2016 (EM, 2015a), due to modeling constraints, potential emission reductions could not be
measured from this point and instead comparison of the entire network in 2030 was
conducted.
6.4.1 Option 1
The comparison of the total emissions for both scenarios with the usage of unchanged fleet
composition throughout the projection is shown in Figure 6-10.
Figure 6-10: Vehicle Emissions Scenario Comparison for Option 1
0
100
200
300
400
500
Emis
sion
s (k
t CO
2e)
Year
Vehicle Emissions Comparison for Option 1
GO!Durban Scenario BAU Scenario
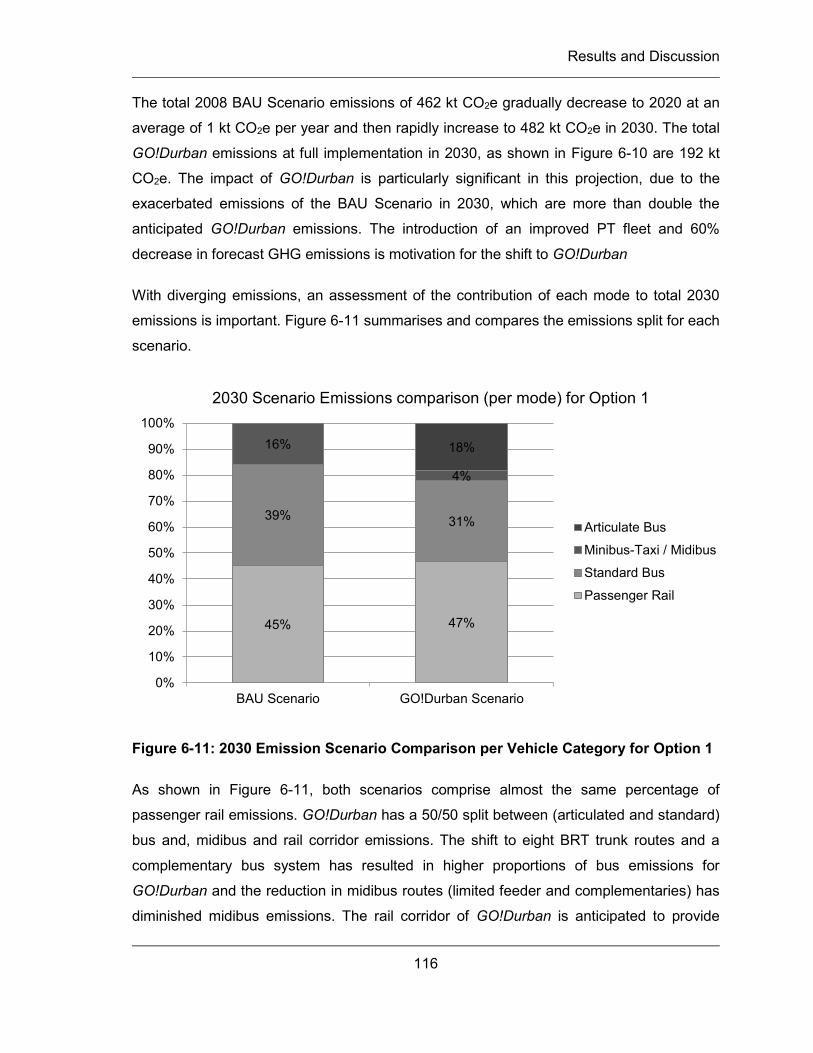
Results and Discussion
116
The total 2008 BAU Scenario emissions of 462 kt CO2e gradually decrease to 2020 at an
average of 1 kt CO2e per year and then rapidly increase to 482 kt CO2e in 2030. The total
GO!Durban emissions at full implementation in 2030, as shown in Figure 6-10 are 192 kt
CO2e. The impact of GO!Durban is particularly significant in this projection, due to the
exacerbated emissions of the BAU Scenario in 2030, which are more than double the
anticipated GO!Durban emissions. The introduction of an improved PT fleet and 60%
decrease in forecast GHG emissions is motivation for the shift to GO!Durban
With diverging emissions, an assessment of the contribution of each mode to total 2030
emissions is important. Figure 6-11 summarises and compares the emissions split for each
scenario.
Figure 6-11: 2030 Emission Scenario Comparison per Vehicle Category for Option 1
As shown in Figure 6-11, both scenarios comprise almost the same percentage of
passenger rail emissions. GO!Durban has a 50/50 split between (articulated and standard)
bus and, midibus and rail corridor emissions. The shift to eight BRT trunk routes and a
complementary bus system has resulted in higher proportions of bus emissions for
GO!Durban and the reduction in midibus routes (limited feeder and complementaries) has
diminished midibus emissions. The rail corridor of GO!Durban is anticipated to provide
45% 47%
39% 31%
16%
4%
18%
0%
10%
20%
30%
40%
50%
60%
70%
80%
90%
100%
BAU Scenario GO!Durban Scenario
2030 Scenario Emissions comparison (per mode) for Option 1
Articulate Bus
Minibus-Taxi / Midibus
Standard Bus
Passenger Rail
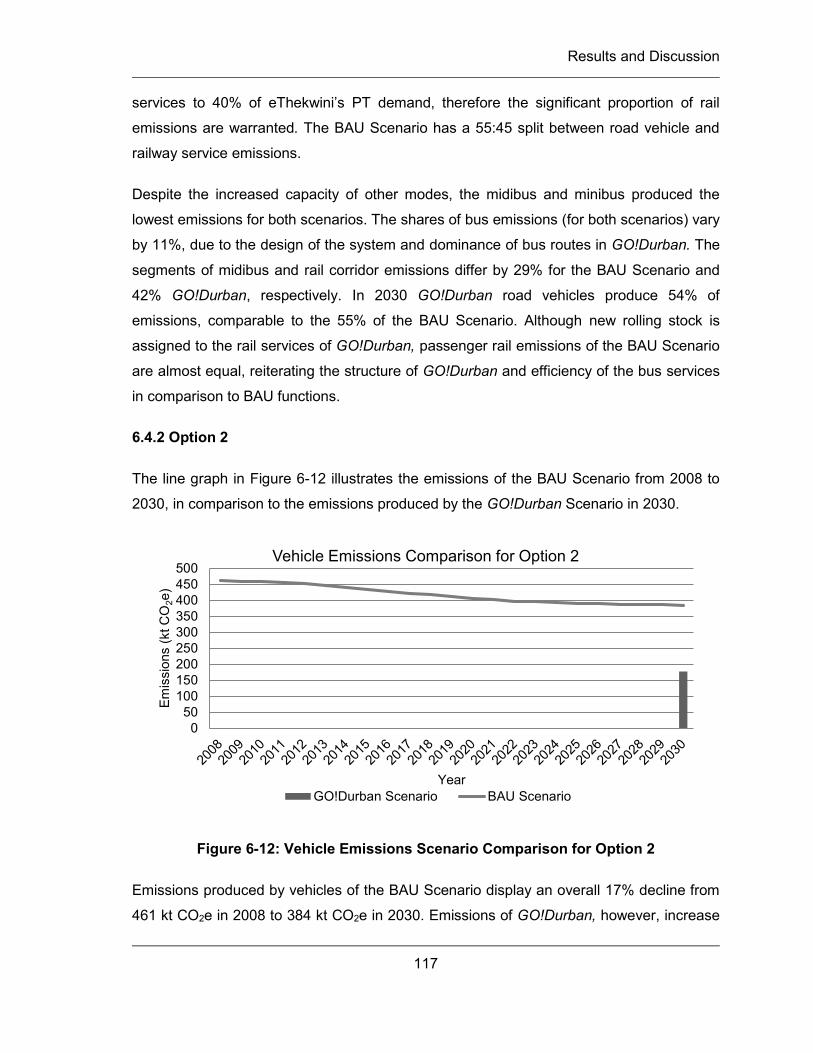
Results and Discussion
117
services to 40% of eThekwini’s PT demand, therefore the significant proportion of rail
emissions are warranted. The BAU Scenario has a 55:45 split between road vehicle and
railway service emissions.
Despite the increased capacity of other modes, the midibus and minibus produced the
lowest emissions for both scenarios. The shares of bus emissions (for both scenarios) vary
by 11%, due to the design of the system and dominance of bus routes in GO!Durban. The
segments of midibus and rail corridor emissions differ by 29% for the BAU Scenario and
42% GO!Durban, respectively. In 2030 GO!Durban road vehicles produce 54% of
emissions, comparable to the 55% of the BAU Scenario. Although new rolling stock is
assigned to the rail services of GO!Durban, passenger rail emissions of the BAU Scenario
are almost equal, reiterating the structure of GO!Durban and efficiency of the bus services
in comparison to BAU functions.
6.4.2 Option 2
The line graph in Figure 6-12 illustrates the emissions of the BAU Scenario from 2008 to
2030, in comparison to the emissions produced by the GO!Durban Scenario in 2030.
Figure 6-12: Vehicle Emissions Scenario Comparison for Option 2
Emissions produced by vehicles of the BAU Scenario display an overall 17% decline from
461 kt CO2e in 2008 to 384 kt CO2e in 2030. Emissions of GO!Durban, however, increase
050
100150200250300350400450500
Emis
sion
s (k
t CO
2e)
Year
Vehicle Emissions Comparison for Option 2
GO!Durban Scenario BAU Scenario
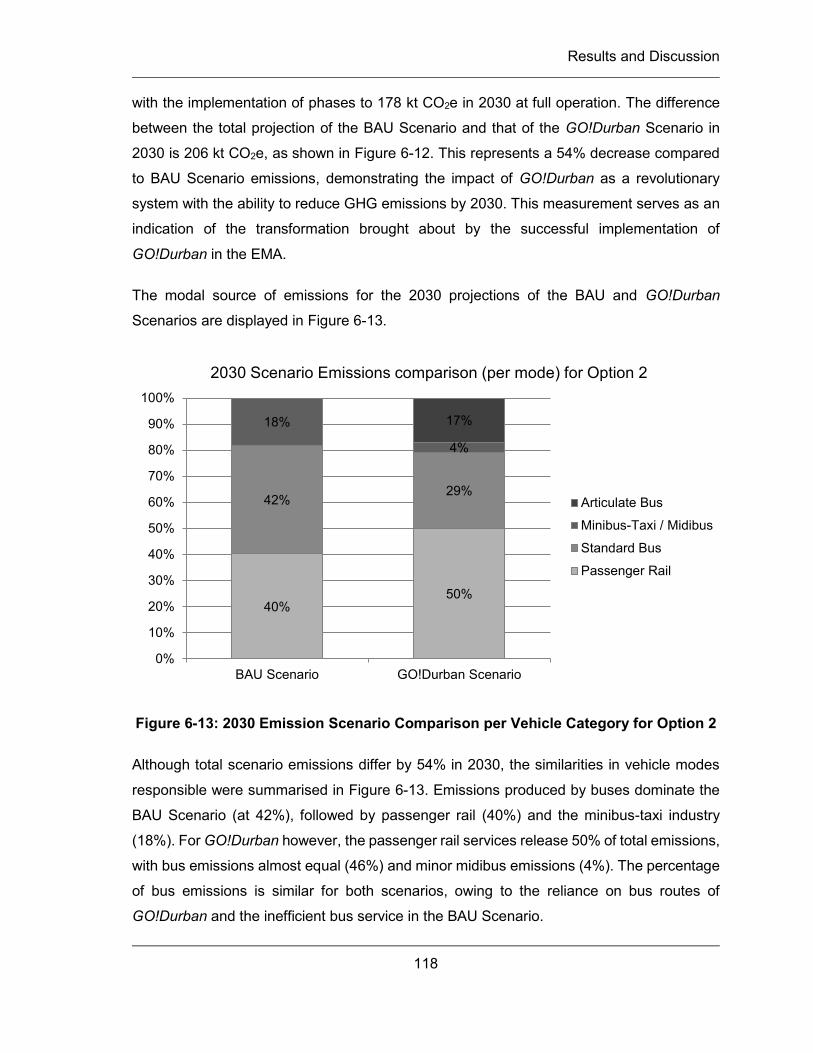
Results and Discussion
118
with the implementation of phases to 178 kt CO2e in 2030 at full operation. The difference
between the total projection of the BAU Scenario and that of the GO!Durban Scenario in
2030 is 206 kt CO2e, as shown in Figure 6-12. This represents a 54% decrease compared
to BAU Scenario emissions, demonstrating the impact of GO!Durban as a revolutionary
system with the ability to reduce GHG emissions by 2030. This measurement serves as an
indication of the transformation brought about by the successful implementation of
GO!Durban in the EMA.
The modal source of emissions for the 2030 projections of the BAU and GO!Durban
Scenarios are displayed in Figure 6-13.
Figure 6-13: 2030 Emission Scenario Comparison per Vehicle Category for Option 2
Although total scenario emissions differ by 54% in 2030, the similarities in vehicle modes
responsible were summarised in Figure 6-13. Emissions produced by buses dominate the
BAU Scenario (at 42%), followed by passenger rail (40%) and the minibus-taxi industry
(18%). For GO!Durban however, the passenger rail services release 50% of total emissions,
with bus emissions almost equal (46%) and minor midibus emissions (4%). The percentage
of bus emissions is similar for both scenarios, owing to the reliance on bus routes of
GO!Durban and the inefficient bus service in the BAU Scenario.
40%50%
42%29%
18%
4%
17%
0%
10%
20%
30%
40%
50%
60%
70%
80%
90%
100%
BAU Scenario GO!Durban Scenario
2030 Scenario Emissions comparison (per mode) for Option 2
Articulate Bus
Minibus-Taxi / Midibus
Standard Bus
Passenger Rail
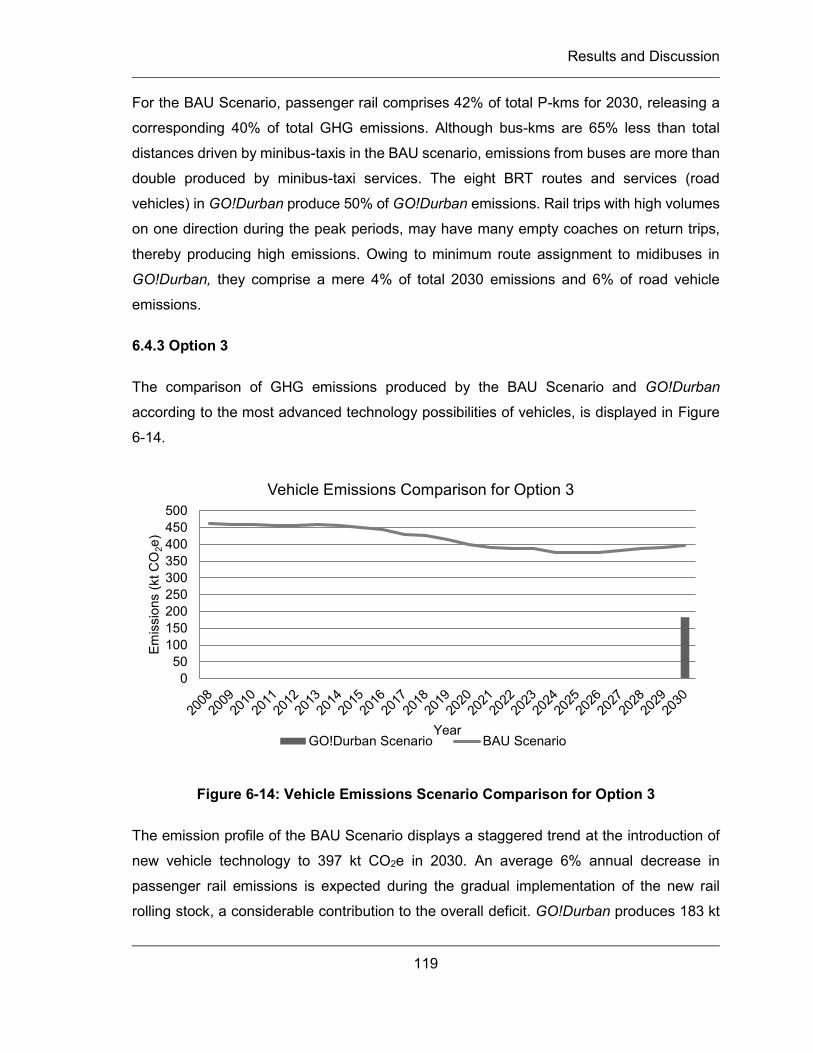
Results and Discussion
119
For the BAU Scenario, passenger rail comprises 42% of total P-kms for 2030, releasing a
corresponding 40% of total GHG emissions. Although bus-kms are 65% less than total
distances driven by minibus-taxis in the BAU scenario, emissions from buses are more than
double produced by minibus-taxi services. The eight BRT routes and services (road
vehicles) in GO!Durban produce 50% of GO!Durban emissions. Rail trips with high volumes
on one direction during the peak periods, may have many empty coaches on return trips,
thereby producing high emissions. Owing to minimum route assignment to midibuses in
GO!Durban, they comprise a mere 4% of total 2030 emissions and 6% of road vehicle
emissions.
6.4.3 Option 3
The comparison of GHG emissions produced by the BAU Scenario and GO!Durban
according to the most advanced technology possibilities of vehicles, is displayed in Figure
6-14.
Figure 6-14: Vehicle Emissions Scenario Comparison for Option 3
The emission profile of the BAU Scenario displays a staggered trend at the introduction of
new vehicle technology to 397 kt CO2e in 2030. An average 6% annual decrease in
passenger rail emissions is expected during the gradual implementation of the new rail
rolling stock, a considerable contribution to the overall deficit. GO!Durban produces 183 kt
050
100150200250300350400450500
Emis
sion
s (k
t CO
2e)
Year
Vehicle Emissions Comparison for Option 3
GO!Durban Scenario BAU Scenario
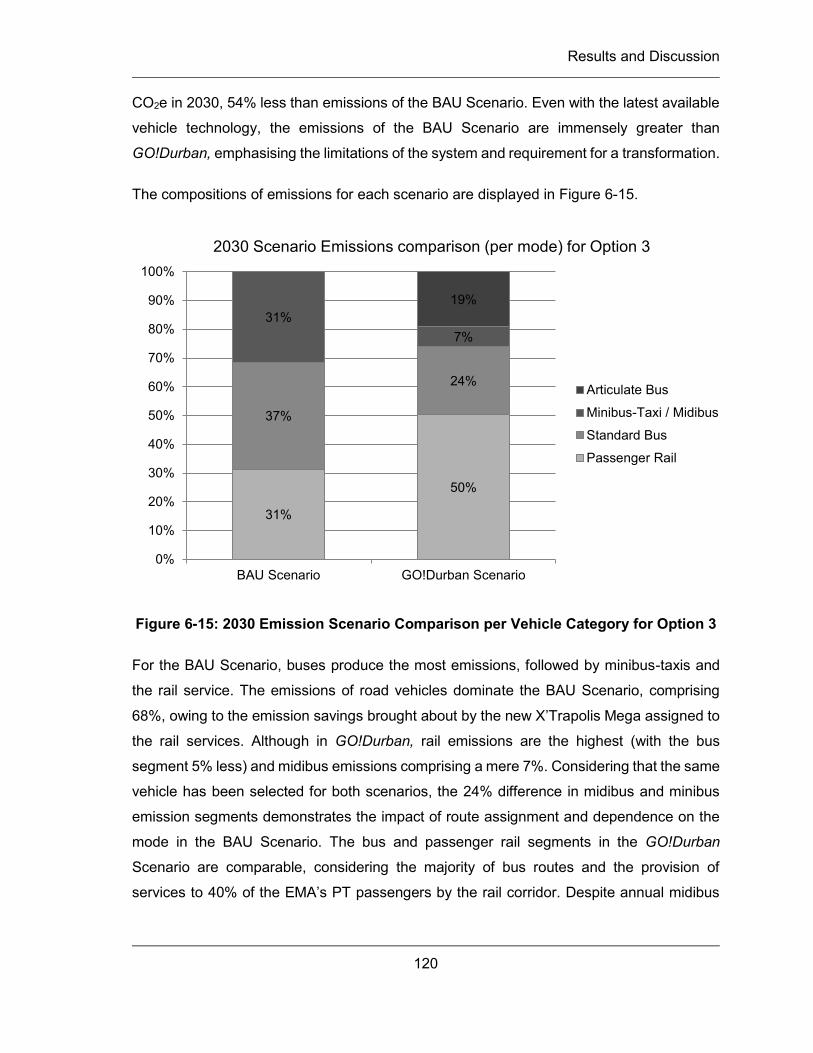
Results and Discussion
120
CO2e in 2030, 54% less than emissions of the BAU Scenario. Even with the latest available
vehicle technology, the emissions of the BAU Scenario are immensely greater than
GO!Durban, emphasising the limitations of the system and requirement for a transformation.
The compositions of emissions for each scenario are displayed in Figure 6-15.
Figure 6-15: 2030 Emission Scenario Comparison per Vehicle Category for Option 3
For the BAU Scenario, buses produce the most emissions, followed by minibus-taxis and
the rail service. The emissions of road vehicles dominate the BAU Scenario, comprising
68%, owing to the emission savings brought about by the new X’Trapolis Mega assigned to
the rail services. Although in GO!Durban, rail emissions are the highest (with the bus
segment 5% less) and midibus emissions comprising a mere 7%. Considering that the same
vehicle has been selected for both scenarios, the 24% difference in midibus and minibus
emission segments demonstrates the impact of route assignment and dependence on the
mode in the BAU Scenario. The bus and passenger rail segments in the GO!Durban
Scenario are comparable, considering the majority of bus routes and the provision of
services to 40% of the EMA’s PT passengers by the rail corridor. Despite annual midibus
31%
50%
37%
24%
31%7%
19%
0%
10%
20%
30%
40%
50%
60%
70%
80%
90%
100%
BAU Scenario GO!Durban Scenario
2030 Scenario Emissions comparison (per mode) for Option 3
Articulate Bus
Minibus-Taxi / Midibus
Standard Bus
Passenger Rail
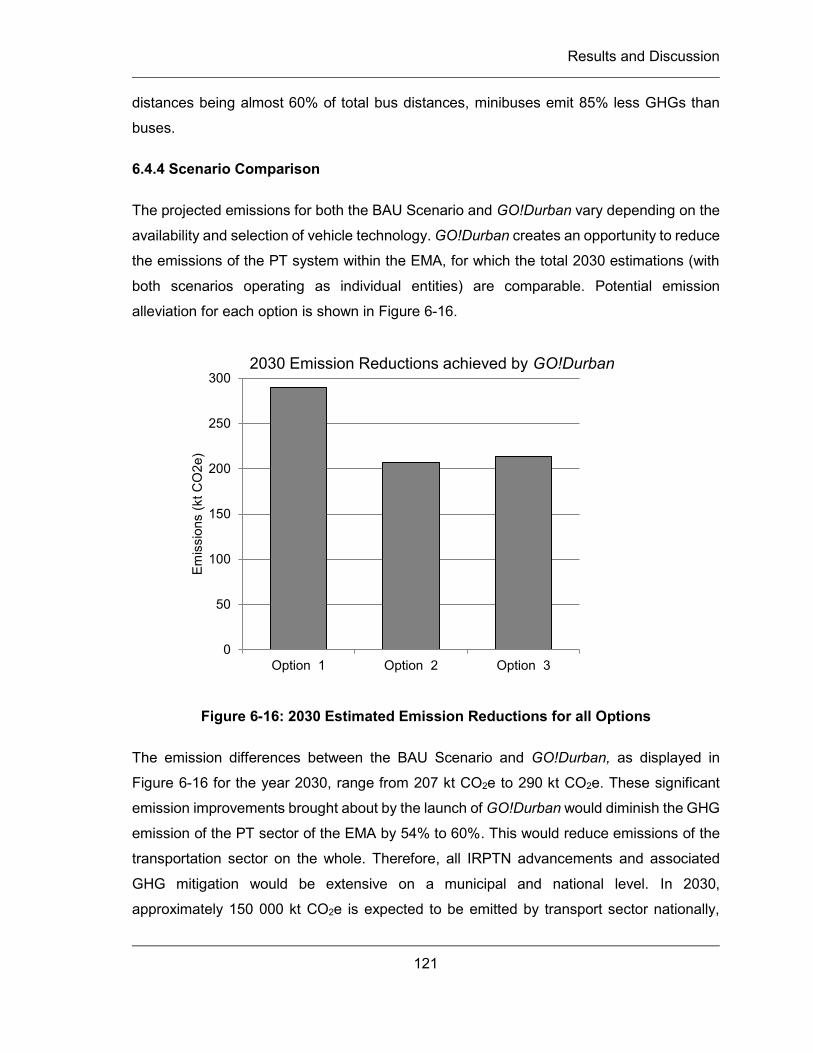
Results and Discussion
121
distances being almost 60% of total bus distances, minibuses emit 85% less GHGs than
buses.
6.4.4 Scenario Comparison
The projected emissions for both the BAU Scenario and GO!Durban vary depending on the
availability and selection of vehicle technology. GO!Durban creates an opportunity to reduce
the emissions of the PT system within the EMA, for which the total 2030 estimations (with
both scenarios operating as individual entities) are comparable. Potential emission
alleviation for each option is shown in Figure 6-16.
Figure 6-16: 2030 Estimated Emission Reductions for all Options
The emission differences between the BAU Scenario and GO!Durban, as displayed in
Figure 6-16 for the year 2030, range from 207 kt CO2e to 290 kt CO2e. These significant
emission improvements brought about by the launch of GO!Durban would diminish the GHG
emission of the PT sector of the EMA by 54% to 60%. This would reduce emissions of the
transportation sector on the whole. Therefore, all IRPTN advancements and associated
GHG mitigation would be extensive on a municipal and national level. In 2030,
approximately 150 000 kt CO2e is expected to be emitted by transport sector nationally,
0
50
100
150
200
250
300
Option 1 Option 2 Option 3
Emis
sion
s (k
t CO
2e)
2030 Emission Reductions achieved by GO!Durban
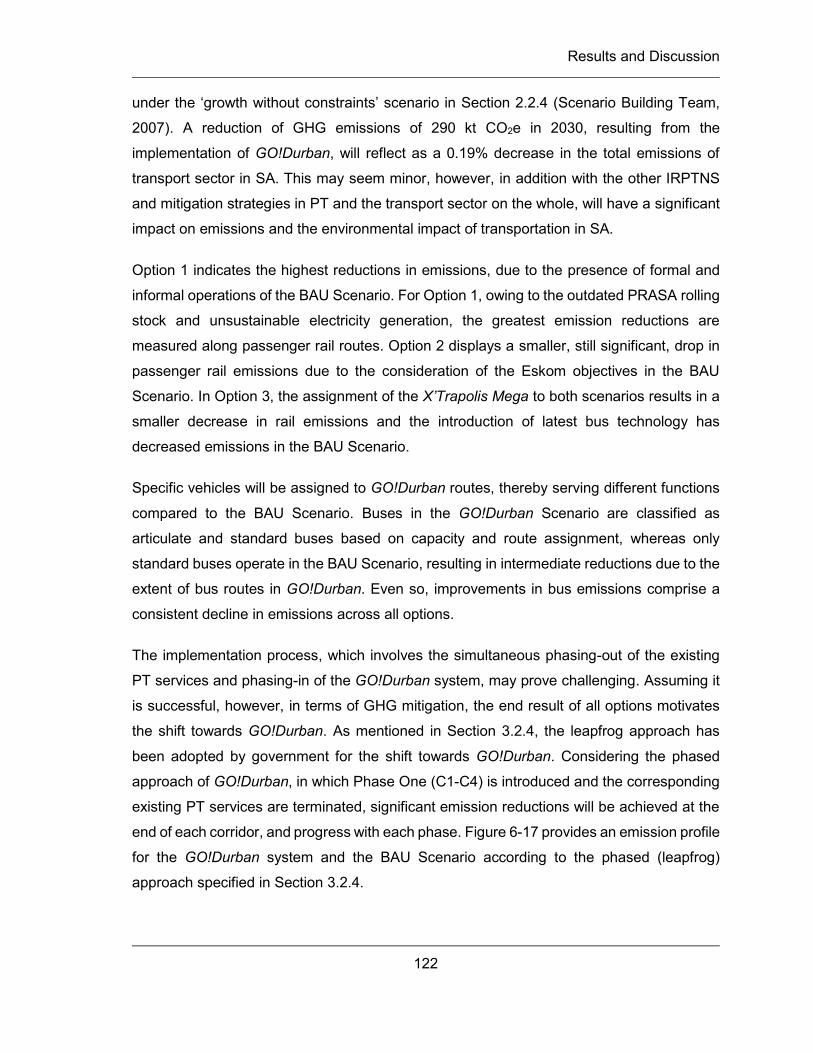
Results and Discussion
122
under the ‘growth without constraints’ scenario in Section 2.2.4 (Scenario Building Team,
2007). A reduction of GHG emissions of 290 kt CO2e in 2030, resulting from the
implementation of GO!Durban, will reflect as a 0.19% decrease in the total emissions of
transport sector in SA. This may seem minor, however, in addition with the other IRPTNS
and mitigation strategies in PT and the transport sector on the whole, will have a significant
impact on emissions and the environmental impact of transportation in SA.
Option 1 indicates the highest reductions in emissions, due to the presence of formal and
informal operations of the BAU Scenario. For Option 1, owing to the outdated PRASA rolling
stock and unsustainable electricity generation, the greatest emission reductions are
measured along passenger rail routes. Option 2 displays a smaller, still significant, drop in
passenger rail emissions due to the consideration of the Eskom objectives in the BAU
Scenario. In Option 3, the assignment of the X’Trapolis Mega to both scenarios results in a
smaller decrease in rail emissions and the introduction of latest bus technology has
decreased emissions in the BAU Scenario.
Specific vehicles will be assigned to GO!Durban routes, thereby serving different functions
compared to the BAU Scenario. Buses in the GO!Durban Scenario are classified as
articulate and standard buses based on capacity and route assignment, whereas only
standard buses operate in the BAU Scenario, resulting in intermediate reductions due to the
extent of bus routes in GO!Durban. Even so, improvements in bus emissions comprise a
consistent decline in emissions across all options.
The implementation process, which involves the simultaneous phasing-out of the existing
PT services and phasing-in of the GO!Durban system, may prove challenging. Assuming it
is successful, however, in terms of GHG mitigation, the end result of all options motivates
the shift towards GO!Durban. As mentioned in Section 3.2.4, the leapfrog approach has
been adopted by government for the shift towards GO!Durban. Considering the phased
approach of GO!Durban, in which Phase One (C1-C4) is introduced and the corresponding
existing PT services are terminated, significant emission reductions will be achieved at the
end of each corridor, and progress with each phase. Figure 6-17 provides an emission profile
for the GO!Durban system and the BAU Scenario according to the phased (leapfrog)
approach specified in Section 3.2.4.
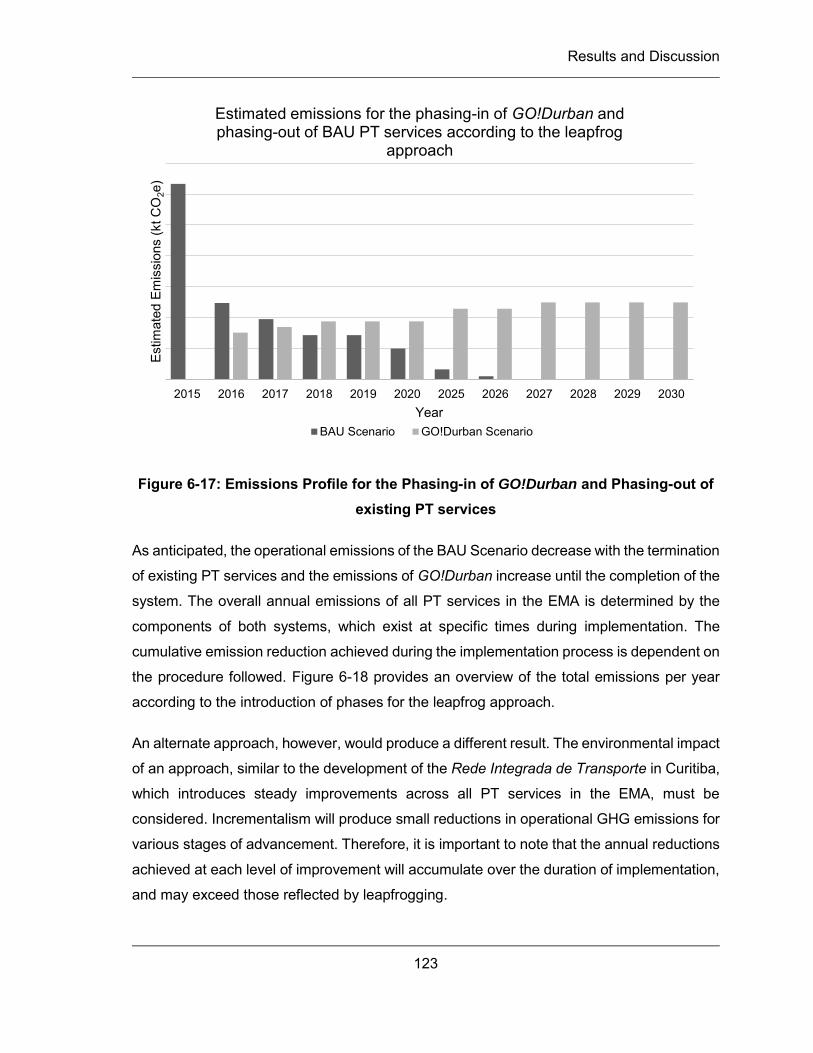
Results and Discussion
123
Figure 6-17: Emissions Profile for the Phasing-in of GO!Durban and Phasing-out of existing PT services
As anticipated, the operational emissions of the BAU Scenario decrease with the termination
of existing PT services and the emissions of GO!Durban increase until the completion of the
system. The overall annual emissions of all PT services in the EMA is determined by the
components of both systems, which exist at specific times during implementation. The
cumulative emission reduction achieved during the implementation process is dependent on
the procedure followed. Figure 6-18 provides an overview of the total emissions per year
according to the introduction of phases for the leapfrog approach.
An alternate approach, however, would produce a different result. The environmental impact
of an approach, similar to the development of the Rede Integrada de Transporte in Curitiba,
which introduces steady improvements across all PT services in the EMA, must be
considered. Incrementalism will produce small reductions in operational GHG emissions for
various stages of advancement. Therefore, it is important to note that the annual reductions
achieved at each level of improvement will accumulate over the duration of implementation,
and may exceed those reflected by leapfrogging.
2015 2016 2017 2018 2019 2020 2025 2026 2027 2028 2029 2030
Estim
ated
Em
issi
ons
(kt C
O2e
)
Year
Estimated emissions for the phasing-in of GO!Durban and phasing-out of BAU PT services according to the leapfrog
approach
BAU Scenario GO!Durban Scenario
Results and Discussion
124
Figure 6-18: Overview of Total Emissions of the PT Sector during the shift to GO!Durban
The overall emissions are shown to decrease rapidly with the implementation of phases to
2030. The results in this chapter present the ultimate emissions of the wall-to-wall network
for the year of 2030, in comparison to the BAU Scenario, had the existing PT system
continued to the year 2030. Although the implementation approach adopted will not alter the
emission reduction achieved for the year of 2030, the procedure will determine the total
emissions mitigated.
6.5 Sensitivity Analysis
This section presents the sensitivity to two parameters, namely fuel consumption and annual
distance driven by PT vehicles. The BAU and GO!Durban Scenarios were considered
independently to investigate the individual impact on the overall GHG reductions in the year
2030. The results for the energy consumption for the BAU Scenario displayed in Table 6-2.
0
50
100
150
200
250
300
350
2015 2016 2017 2018 2019 2020 2025 2026 2027 2028 2029 2030
Estim
ated
Em
issi
ons
(kt C
O2e
)
Year
Overview of total GHG emissions from PT during the switch to GO!Durban
BAU Scenario GO!Durban Scenario
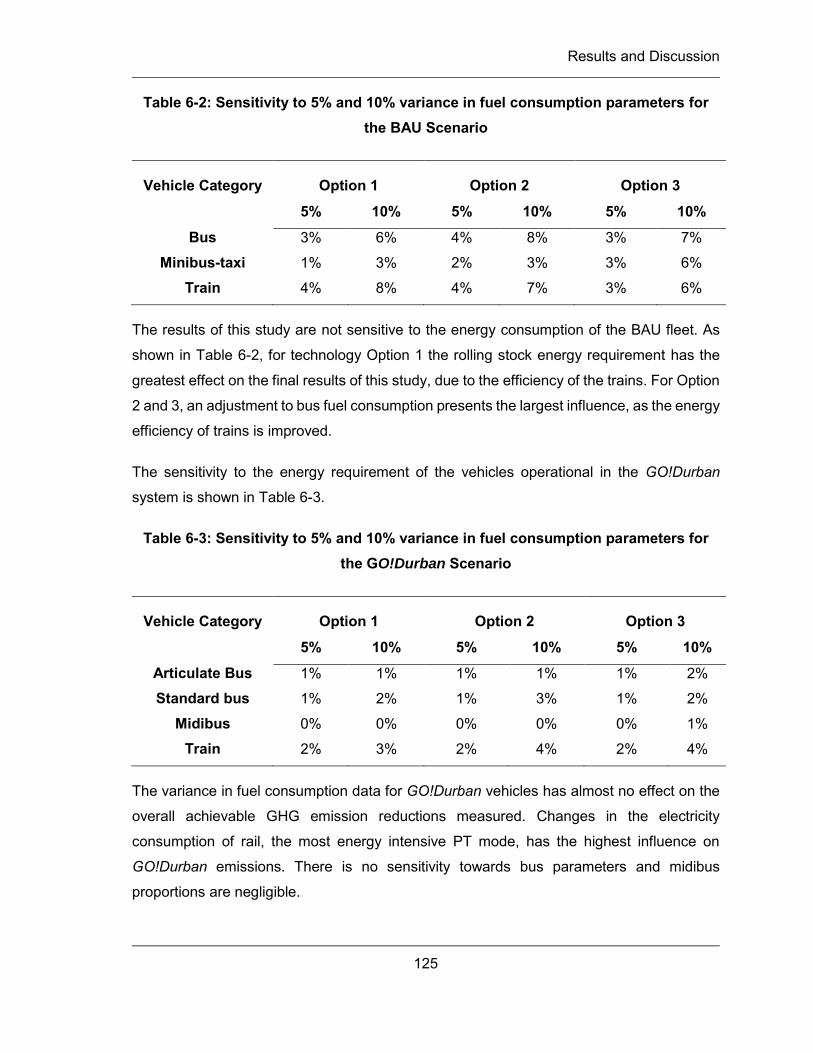
Results and Discussion
125
Table 6-2: Sensitivity to 5% and 10% variance in fuel consumption parameters for the BAU Scenario
Vehicle Category Option 1 Option 2 Option 3
5% 10% 5% 10% 5% 10%
Bus 3% 6% 4% 8% 3% 7%
Minibus-taxi 1% 3% 2% 3% 3% 6%
Train 4% 8% 4% 7% 3% 6%
The results of this study are not sensitive to the energy consumption of the BAU fleet. As
shown in Table 6-2, for technology Option 1 the rolling stock energy requirement has the
greatest effect on the final results of this study, due to the efficiency of the trains. For Option
2 and 3, an adjustment to bus fuel consumption presents the largest influence, as the energy
efficiency of trains is improved.
The sensitivity to the energy requirement of the vehicles operational in the GO!Durban
system is shown in Table 6-3.
Table 6-3: Sensitivity to 5% and 10% variance in fuel consumption parameters for the GO!Durban Scenario
Vehicle Category Option 1 Option 2 Option 3
5% 10% 5% 10% 5% 10%
Articulate Bus 1% 1% 1% 1% 1% 2%
Standard bus 1% 2% 1% 3% 1% 2%
Midibus 0% 0% 0% 0% 0% 1%
Train 2% 3% 2% 4% 2% 4%
The variance in fuel consumption data for GO!Durban vehicles has almost no effect on the
overall achievable GHG emission reductions measured. Changes in the electricity
consumption of rail, the most energy intensive PT mode, has the highest influence on
GO!Durban emissions. There is no sensitivity towards bus parameters and midibus
proportions are negligible.
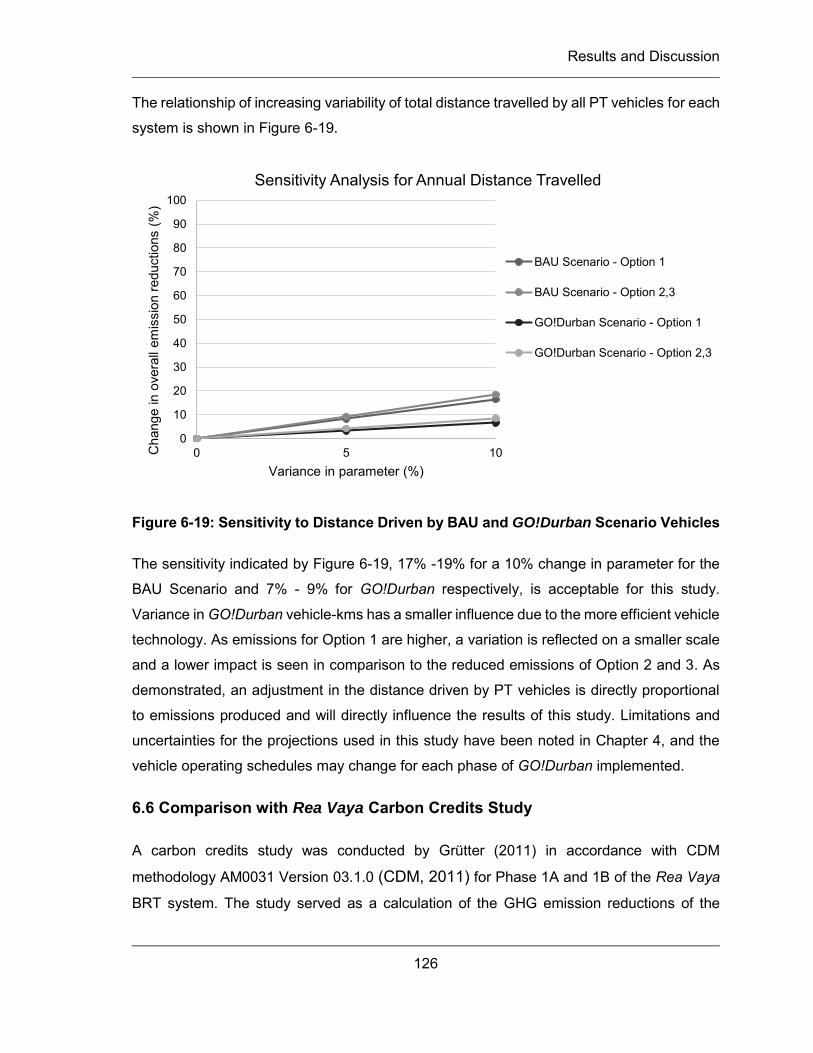
Results and Discussion
126
The relationship of increasing variability of total distance travelled by all PT vehicles for each
system is shown in Figure 6-19.
Figure 6-19: Sensitivity to Distance Driven by BAU and GO!Durban Scenario Vehicles
The sensitivity indicated by Figure 6-19, 17% -19% for a 10% change in parameter for the
BAU Scenario and 7% - 9% for GO!Durban respectively, is acceptable for this study.
Variance in GO!Durban vehicle-kms has a smaller influence due to the more efficient vehicle
technology. As emissions for Option 1 are higher, a variation is reflected on a smaller scale
and a lower impact is seen in comparison to the reduced emissions of Option 2 and 3. As
demonstrated, an adjustment in the distance driven by PT vehicles is directly proportional
to emissions produced and will directly influence the results of this study. Limitations and
uncertainties for the projections used in this study have been noted in Chapter 4, and the
vehicle operating schedules may change for each phase of GO!Durban implemented.
6.6 Comparison with Rea Vaya Carbon Credits Study
A carbon credits study was conducted by Grütter (2011) in accordance with CDM
methodology AM0031 Version 03.1.0 (CDM, 2011) for Phase 1A and 1B of the Rea Vaya
BRT system. The study served as a calculation of the GHG emission reductions of the
0
10
20
30
40
50
60
70
80
90
100
0 5 10Cha
nge
in o
vera
ll em
issi
on re
duct
ions
(%)
Variance in parameter (%)
Sensitivity Analysis for Annual Distance Travelled
BAU Scenario - Option 1
BAU Scenario - Option 2,3
GO!Durban Scenario - Option 1
GO!Durban Scenario - Option 2,3
Results and Discussion
127
Baseline (BAU) and Project Scenarios in the PT sector for the City of Johannesburg, and
also considered leakage emissions resulting from reduced congestion and increased
speeds. The Baseline Scenario assumes the continuation PT services, and considers the
passengers that would have used PT in absence of Rea Vaya. The Rea Vaya BRT
comprises two ROW bus routes and a complementary and feeder system. Emission
monitoring (which measured CO2, CH4 and N2O), began with the operation of Phase 1A on
30 August 2009. The Project (BRT) Scenario is based on actual fuel consumption from Rea
Vaya buses for Phase 1A and projections carried out for Phase 1B. (Grütter, 2011).
The results show the Baseline emissions at 60 kt CO2 e (2012) decreasing to 55 kt CO2 e
(2021) due to applicable technology improvements. Project emissions remain constant (for
the same system and scheduled services) at 18 CO2 e, representing a 69% decrease in
GHG emissions. A total GHG reduction of 398 kt CO2e is achieved over 10 years by the
implementation of Rea Vaya, at an average 37 kt CO2e per year (Grütter, 2011).
The GHG emission reductions of GO!Durban (ex-ante) and Rea Vaya (monitored) display a
similar trend of an achievable maximum of 60% and a 69%, respectively. The Project
Scenario of Phase 1A and 1B of Rea Vaya does not include emissions from Metrorail, the
Gautrain or other PT services in the City of Johannesburg, it only considers a fraction of
services in the municipality. In contrast, GO!Durban, is an extensive IRPTN spanning nine
corridors across four phases, with corridor consisting of the entire PRASA service. This
study calculated the emissions of the PT sector for the EM on the whole for three technology
scenarios.
The similarity in results serve as an indication of the achievable success of GO!Durban.
Although on a smaller scale, the transformation realised by Rea Vaya validates the results
of this dissertation and the potential of GO!Durban on a greater scale.
6.7 Summary
The results presented in this chapter were generated in accordance with the methodology
presented in Chapter 4. In 2030, the total GHG emission reductions brought about by the
implementation of GO!Durban, in comparison to the BAU Scenario range between 207 kt
CO2e and 290 kt CO2e, for varying vehicle technology options. Overall a maximum reduction
Results and Discussion
128
of 60% of GHG emissions is achievable in 2030 by the introduction of GO!Durban and
termination of existing PT services (BAU Scenario).
GHG emissions generation was not sensitive to the vehicle category and model chosen.
The role of vehicles has clearly been defined in GO!Durban, in vehicle assignment to routes.
As expected, these differ from the existing PT system and provide a transformational IRPTN
in the EMA. The X’Trapolis Mega rolling stock was selected and procured for GO!Durban,
however, considerable assumptions were required with regard to vehicle choice of buses.
For the purpose of this study, the vehicles selected for GO!Durban, comprise buses
operating in Rea Vaya and MyCiTi, therefore, the probability of procurement for GO!Durban
is favourable. The advice provided by Volvo and consultation with Piotrans was informative.
The major GHG contributor in the BAU Scenario is the outdated rolling stock used by
PRASA, which if upgraded alone would reduce emissions significantly. While Option 1
indicates the most emission reductions, the possibility of technology advancement in the
BAU Scenario has not been explored in this option. Option 2 explores the development of
vehicle technology up to 2030, for which considerable GHG reductions are observed in the
BAU Scenario. For Option 3, the vehicles being manufactured for MyCiTi were selected and
although, it is unlikely that Euro V Standard vehicles will be procured for the starting phases
of GO!Durban (considering SA’s current Euro II Emission Standard regulations), it serves
as an accurate estimate for 2030. Although midibuses require a greater road reserve due to
reduced passenger capacity, it has been shown that this vehicle category produces the least
emissions over all projections. The sustainability goals of Eskom to be achieved in electricity
generation have been included in this study, however, with transmission and distribution
losses at 10%, it is unclear whether Eskom will meet their targets to reduce CO2 emissions
by 2030.
This study does not include POVs, however, the emissions released due to anticipated
modal shifts and higher ridership of PT have been covered in the TMS projection. As the
modal shift towards PT increases, so too does the opportunity to improve overall
transportation emissions. Although a 20% shift to PT is explored in the GO!Durban Scenario,
the overall operational emissions of the system are significantly lower than BAU,
demonstrating the definite benefit of the system. Park and ride facilities enable a POV to
park at the stations and switch to PT (where people would have before travelled in POVs,
Results and Discussion
129
many with vehicle occupancy of one) for continuation of the trip in a GO!Durban vehicle.
Although the usage of NMT has not been measured, the significant increase in NMT facilities
as a component of GO!Durban promotes walking and cycling, which will further contribute
to emissions reductions.
The results of the carbon credits study conducted on Phase 1A and 1B of Rea Vaya
demonstrate the success that has already been accomplished in the City of Johannesburg.
The 69% reduction in GHG emissions caused by the introduction of the BRT system is
comparable with the 60% for GO!Durban measured by this study, and serves as a positive
indication of the achievable GHG decrease of GO!Durban, on a significantly larger scale.
These GHG mitigation schemes, in conjunction with MyCiTi and others nationally, have
successfully contributed to reducing the environmental impact of PT.
Similar to the cumulative savings achieved for Rea Vaya, the total emission reductions
achieved over the duration of implementation will be determined by the approach selected.
Although a leapfrog approach has been adopted for GO!Durban, it is important to note that
an incremental approach may result in the mitigation of greater GHG emissions during the
shift to GO!Durban, therefore a less significant environmental impact.
The gradual phasing-in of the IRPTN corridors and simultaneous phasing-out of the existing
minibus-taxis and buses is crucial for the success of the network. Concurrent systems will
result in greater emissions and competitive services will reduce patronage of GO!Durban.
The case of unsynchronised phasing programmes (the event of trunk routes coming online
without appropriate feeder and complementary routes, etc.) would result in altered
emissions, which have not been included in this study. It must be considered that the
introduction of a revolutionary network may have a rebound effect and in reducing the
number of minibus-taxis on the road, may in fact make POV usage appear more attractive.
Chapter 2 has explored options enforced in other countries to promote PT usage, which may
be considered for the EM as well.
Conclusions
130
CONCLUSIONS
The inefficient PT services offered in the EMA have prompted the implementation of an
IRPTN. GO!Durban containing eight BRT and one rail trunk route, feeders and
complementary routes will introduce a formalised PT system, for the provision of services in
the municipality. This study quantifies the current and potential GHG emissions in the PT
sector of the EMA by ex-ante GHG emission comparisons of the BAU Scenario and
GO!Durban. There is a shortage of carbon studies in the EMA and scenario analyses in
particular, which motivated this study.
To satisfy the aims and objectives of this dissertation, theoretical and case study approaches
were adopted. Clean Development Mechanism (CDM) AM0031 Large-scale Methodology:
Bus rapid transit projects Version 05.0.0 proved to be the most appropriate approach for the
case study. Fuel and energy consumption factors, applicable in a South African context have
aided in the accurate calculations of the carbon footprint of the PT sector (current and
future). The low-population growth BAU Scenario follows Phase One of the PTAP (DoT
RSA, 2007) and high growth projection (with stipulated modal shift of 20% towards PT) for
the GO!Durban Scenario applies all phases of the PTAP.
The anticipated CF of vehicle operations of GO!Durban in 2030 are 177 kt CO2e to 192 kt
CO2e for the latest Euro Emission Standard vehicle technologies. In comparison, the
projected emissions of the BAU Scenario are 384 kt CO2e to 482 kt CO2e. Even with
increased ridership of the GO!Durban Scenario (shift of 20% from POV to PT), the network
still emits less GHGs. Therefore, the expected operational emissions of GO!Durban in 2030
will be 54% to 60% lower than projected emissions of the existing PT system (BAU
Scenario), for the different vehicle technology options considered. The results of this ex-ante
study are comparable to the carbon credits study conducted on the Rea Vaya BRT system
in the City of Johannesburg, in which a 69% reduction in GHG emissions was monitored.
This indicates the achievable success of GO!Durban on a significantly larger scale, and the
accomplishment of GHG emissions in the transport sector.
In conclusion, the structure of GO!Durban has been determined according to travel demands
of the public, therefore, the success of the system must be ensured (through various
Conclusions
131
measures encouraging PT usage, including disincentives for POV usage) for GHG
mitigation. For the purpose of this study, the latest revision of the preliminary plans for
GO!Durban were used, however, these may be adjusted and improved upon during
implementation of the network. Considering the trunk route selection was done in
accordance with maximum travel demand, in effort to effectively transport passengers along
corridors, the major contributor to the operational emissions of the system is vehicle
selection with respect to latest available technology. The following recommendations have
been made:
The selection of latest Euro V vehicle technology for the bus routes, with potential
options including the or Volvo 6x2 B12MA (articulate bus) and Volvo B7R 8700 LE
(standard bus);
It is advisable that competent modelling of PT scenarios is conducted before the
implementation of PT interventions to precisely predict and indicate the ‘end product’
that will be realized. Therefore the following recommendations have been made:
o The optimum use of Emme software features, especially the environmental
GHG emission component for quantification and possible comparison with
other methods;
o The use of updated spatial development (NUDC) for the EM and the inclusion
of relevant future development (including Dig-Out Port) in transportation
modeling for appropriate results;
o The use of updated CPTR data that is validated and accurate in transport
modelling programmes (as CPTR 2013 was not correct and CPTR 2004 has
to be used); and
o The investigation of the various stages of implementation to evaluate the
most appropriate path (order) to be followed.
Further studies investigating and evaluating incrementalism and leapfrogging for the
implementation of BRT and GO!Durban is advisable. The GHG emissions of each
approach could assist in decisions for the most suitable way forward.
This study serves as a first-of-its-kind benchmark for the GO!Durban system, upon which
further studies can be built. More studies on other IRPTNs to be implemented in SA
are recommended as a measure of success in reducing the GHG emissions of the
PT sector.
References
132
REFERENCES
AA – ALIVE ARRIVE. 2013. Bus Rapid Transit System (BRT) and Road Safety [Online].
Available: http://www.arrivealive.co.za/pages.aspx?i=2874 [Accessed 20 April
2013].
ALVINSYAH, S. & ZULKATI, A. 2005. Impact on the Existing Corridor due to Implementation
of New Public Transport Corridor (Case Study: Jakarta BRT Systems). Journal of
the Eastern Asia Society for Transportation Studies, vol. 6, pp. 467-479.
ARRHENIUS, E. & WALTZ, T. 1990. The Greenhouse Effect: Implications for Economic
Development, Washington DC, World Bank.
BALDO, G., MARINO, M. & MONTANI, M. 2009. The carbon footprint measurement toolkit
for the EU Ecolabel. The International Journal of Life Cycle Assessment, vol. 14, pp.
591–596.
BARKER, J. 2011. Public Transportation Improvement Program for eThekwini [Online].
Durban: eThekwini Municipality. Available: http://www.mile.org.za/QuickLinks/News/
Documents/IRPTN%20presentation.pdf [Accessed 22 March 2013].
BARKER, J. 2013. Integrated Rapid Public Transport Network. Proceedings of the 31st
Southern African Transport Conference, 8-11 July 2013, Pretoria. South Africa, pp.
1-23.
BHOTHA, D. 2013. Personal Communication. Training Service Planner, Metrorail,
Passenger Rail Agency of South Africa.
BOUTLER, P., BARLOW, T., MCCRAE, I. & LATHAM, S. 2009. Emission Factors 2009:
Final Summary Report. Berkshire: TRL Limited.
CAJIAO, J. 2013. Personal Communication. Chief Operational Officer, Piotrans, South
Africa.
CARBON TRUST. 2006. Carbon footprints in the supply chain: the next step for business
[Online]. London. Available: http://www.carbontrust.com/media/84932/ctc616-
carbon-footprints-in-the-supply-chain.pdf [Accessed 20 February 2013].
References
133
CHAN, S., MIRANDA-MORENO, L., ALAM, A. & HATZOPOULOU, M. 2013. Assessing the
impact of bus technology on greenhouse gas emissions along a major corridor: A
lifecycle analysis. Transportation Research Part D, vol. 20, pp. 7-11.
CHEN, X. & WANG, Z. 2012. Low-carbon scenario analysis on urban transport of one
metropolitan in China in 2020. Journal of Industrial Engineering and Management,
vol. 5, no. 2, pp. 344-353.
CHETTY, R. 2013. Personal Communication. Senior Manager, eThekwini Transport
Authority, South Africa.
CCT – CITY OF CAPE TOWN. 2013. MyCiTi IRT: Project information [Online]. Available:
https://www.capetown.gov.za/en/irt/Pages/default.aspx [Accessed 22 November
2014].
CITY OF JOHANNESBURG. 2013. Rea Vaya: Fast Facts [Online]. Available:
http://www.reavaya.org.za/welcome/fast-facts/144-media-releases/newsletters
[Accessed 2014 23 June].
CITY OF JOHANNESBURG. 2014. Rea Vaya up for Climate Leadership Award [Online].
Available: http://www.reavaya.org.za/news-archive/july-2014/1060-rea-vaya-up-for-
climate-leadership-award [Accessed 21 November 2014].
CITY OF TSHWANE. 2013. Bus Rapid Transit [Online]. Available: http://www.tshwane.
gov.za/Services/Transport/Bus%20Rapid%20Transit/Pages/default.aspx [Accessed
11 February 2013].
CDM – CLEAN DEVELOPMENT MECHANISM. 2011. Large-Scale Methodology, AM0031:
Bus rapid transit projects, Version 05.0.0. Switzerland: United Nations Framework
on Climate Change.
COHEN, J. 2008. Calming Traffic on Bogota's Killing Streets. Science, vol. 319, pp. 742-
743.
CORNELL UNIVERSITY. 2013. Biofuels [Online]. Available: http://www.greenchoices.
cornell.edu/energy/biofuels/ [Accessed 23 May 2014].
COX, P. 2010. Moving People: Sustainable Transport Development, London, Zed Books.
References
134
CROZET, Y. & LOPEZ-RUIZ, H.G. 2013. Macromotives and microbehaviours: Climate
change constriants and passenger mobility scenarios for France. Transport Policy, vol. 29, pp. 294–302.
CUENOT, F., FULTON, L. & STAUB, J. 2012. The prospect for modal shifts in passenger
transport worldwide and impacts on energy use and CO2. Energy Policy, vol. 41, pp.
98-106.
DMA – DAVID MCFARLANE AND ASSOCIATES. 2008. Prediction of Vehicle Emissions for
eThekwini Municipality using Emme 2. eThekwini: eThekwini Municipality.
DE JONG, R., AHMAN, M., JACOBS, R. & DUMITRESCU, E. 2009. Hybrid Electric
Vehicles: An overview of current technology and its application in developing and
transitional countries. Nairobi: United Nations Environment Programme.
DELPHI. 2014/2015. Worldwide Emission Standards Passenger Cars and Light Duty
Vehicles [Online]. Available: http://delphi.com/docs/default-source/old-delphi-files/
87b5fc76-3bbf-4568-a051-c83d1e4ad9a3-pdf.pdf?sfvrsn=1 [Accessed 5 August
2014].
DBIS – DEPARTMENT FOR BUSINESS INNOVATION AND SKILLS. 2011. Publicly
Available Specification 2050:2011. London: Department for Business, Innovation
and Skills.
DEA – DEPARTMENT OF ENVIRONMENTAL AFFAIRS. 2009. State of Air Report 2005,
Republic of South Africa.
DoT RSA – DEPARTMENT OF TRANSPORT REPUBLIC OF SOUTH AFRICA. 2007.
Public Transport Action Plan [Online]. Available: http://www.cityenergy.org.za/
uploads/resource_192.pdf [Accessed 5 May 2014].
DoT RSA – DEPARTMENT OF TRANSPORT REPUBLIC OF SOUTH AFRICA. 2010.
National Transport Master Plan NATMAP 2050: National Report Executive
Summary.
DoT RSA – DEPARTMENT OF TRANSPORT REPUBLIC OF SOUTH AFRICA. 2011. A
Guide to Low-Carbon Transport – Transportation, Climate Change and the UN
References
135
Framework Convention on Climate Change, Report prepared for the
17th Conference of Parties (COP17) in Durban 2011, [Online]. Available:
http://www.cityenergy.org.za/uploads/resource_217.pdf [Accessed 22 April 2013].
DIAS, T. 2013. Personal Communication. National Accounts Manager, MAN Truck and Bus,
South Africa.
ESKOM DISTRIBUTION. 2010. Energy Losses Management Programme. Johannesburg:
Eskom Holdings Limited.
ESKOM HOLDINGS LIMITED. 2011. The Eskom Factor Report. Johannesburg: Eskom
Holdings Limited.
EEO – ETHEKWINI ENERGY OFFICE. 2011. Summary Document: eThekwini Greenhouse
Gas Emissions Inventory 2011. Durban: eThekwini Municipality.
EM – ETHEKWINI MUNICIPALITY. 2014a. Integrated Development Plan: Annual Report
2014/2015. Durban: eThekwini Municipality.
EM – ETHEKWINI MUNICIPALITY. 2014b. Spatial Development Framework (SDF) Report
2014/15 Review. [Online]. Available: http://www.durban.gov.za/Resource_Centre/
reports/Framework_Planning/Documents/SDF_Full_Report_2014_2015_May_201
4.pdf [Accessed 22 October 2014].
EM – ETHEKWINI MUNICIPALITY. 2015a. GO!Durban moves ahead in 2015 [Online].
Available: http://www.godurban.co.za/category/media/ [Accessed 11 April 2015].
EM – ETHEKWINI MUNICIPALITY. 2015b. Implementation: Phase One [Online]. Available:
http://www.godurban.co.za/implementation/phase-one/ [Accessed 22 October
2014].
ETA – ETHEKWINI TRANSPORT AUTHORITY. 2005. Public Transport Plan. Durban:
eThekwini Transport Authority.
ETA – ETHEKWINI TRANSPORT AUTHORITY. 2012a. ETA Annual Report 2012. Durban:
eThekwini Transport Authority.
References
136
ETA – ETHEKWINI TRANSPORT AUTHORITY. 2012b. INRO Emme 2 Transport Modelling
Outputs.
EAMA – EUROPEAN AUTOMOBILE MANUFACTURERS' ASSOCIATION. 2014.
Differences between diesel and petrol [Online]. Available: http://www.acea.be/
news/article/differences-between-diesel-and-petrol [Accessed 2 November 2014].
EC – EUROPEAN COMMISSION. 2015a. Reducing CO2 emissions from passenger cars
[Online]. Available: http://ec.europa.eu/clima/policies/transport/vehicles/cars/index_
en.htm [Accessed 2 February 2015]
EC – EUROPEAN COMMISSION. 2015b. Reducing CO2 emissions from Heavy-Duty
Vehicles [Online]. Available: http://ec.europa.eu/clima/policies/transport/vehicles/
heavy/index_en.htm: [Accessed 2 February 2015]
GIBELA PRODUCT ENGINEERING. 2014. Summary of the PRASA X'Trapolis Mega
energy consumption, Internal Report, Gibela Rail Transport Consortium.
GOBA CONSULTING, MOTTMACDONALD & LMA. 2012a. Integrated Rapid Public
Transport Network Preliminary Design Report. vol, 4.
GOBA CONSULTING, MOTTMACDONALD & LMA. 2012b. IRPTN Operational Plan –
Passenger Demand Analysis. vol, 2.
GOODMAN, J., LAUBE, M. & SCHWENK, J. 2005. Curitiba's Bus System is Model for Rapid
Transit. Race, Poverty and the Environment Winter 2005/2006, pp. 75-77.
GRAY, G. & HOEL, L. 1992. Public Transportation Second Edition, New Jersey, Prentice
Hall, Inc.
GRÜTTER, J. 2011. VCS Project Document BRT Rea Vaya Phase 1A and 1B, South Africa,
Version 1.2. Reinach: Grütter Consulting.
HITGE, G. & VAN DIJK, E.N.R. 2012. Incremental Approach to Public Transport System
Improvements. Proceedings of the 31st Southern African Transport Conference, 9-
12 July 2012. Pretoria, South Africa, pp. 592-603.
References
137
INRO. 2013. INRO Emme Products. INRO Software [Online]. Available:
http://www.inrosoftware.com/assets/PDFs/emmebrochure.pdf [Accessed 24 March
2014].
IPCC – INTERGOVERNMENTAL PANEL ON CLIMATE CHANGE. 1996. Revised 1996
IPCC Guidelines for National Greenhouse Gas Inventories: Reference Manual.
Greenhouse Gas Inventory Reporting Instructions.
IPCC – INTERGOVERNMENTAL PANEL ON CLIMATE CHANGE. 2007. Climate Change
2007 Contribution of Working Group I to the Fourth Assessment Report of the IPCC
In: SOLOMON, S., QIN, D., MANNING, M., CHEN, Z., MARQUIS, M., AVERYT, K.,
M, T. & MILLER, H. (eds.) Climate Change 2007: The Physical Science Basis.
Cambridge: Cambridge University Press.
JACKSON, A. 2003. Public Transport in Durban - A brief history [Online]. Available:
http://www.fad.co.za/Resources/transport/transport.htm [Accessed 12 May 2013].
KRUGER, E. 2012. Current and Future Trends of the South African Car Parc, National
Association of Automobile Manufacturers of South Africa (NAAMSA). [Online].
Available: http://www.energy.gov.za/files/IEP/presentations/CurrentFutureTrends
_SA_CarParc_30MArch2012.pdf [Accessed 12 March 2013]
LE TREUT, H., SOMERVILLE, R., CUBASCH, U., DING, Y., MAURITZEN, C., MOKSSIT,
A., PETERSON, T. & PRATHER, M. 2007. Climate Change 2007: The Physical
Science Basis. Contribution of Working Group I to the Fourth Assessment Report:
Historical Overview of Climate Change Science. Cambridge: Cambridge University
Press.
LEVINSON, S., ZIMMERMAN, S., CLINGER, J. & RUTHERFORD, C. 2002. Bus Rapid
Transit: An Overview. Journal of Public Transportation, vol. 5, no. 2, pp. 1-29.
LINDQVIST, K. 2012. Emission standards for light and heavy road vehicles, Fact sheet 25.
Available: http://www.airclim.org/sites/default/files/documents/Factsheet-emission-
standards.pdf [Accessed 22 January 2015].
LITMAN, T. 2014. Public Transit. Victoria Transport Policy Institute [Online]. Available:
http://www.vtpi.org/railcrit.pdf [Accessed 29 May 2014].
References
138
LIU, X., HILDEBRANDT, D. & GLASSER, D. 2012. Environmental impacts of electric
vehicles in South Africa. South African Journal of Science, vol. 108, pp. 1-6.
LGH – LOCAL GOVERNMENT HANDBOOK. 2012. KwaZulu-Natal [Online]. Available:
http://www.localgovernment.co.za/provinces/view/4/kwazulu-natal [Accessed 2
October 2014].
LUTHULI, T. 2013. Personal Communication. Infrastructure Engineering Services
Manager, Passenger Rail Agency of South Africa.
MECA – MANUFACTURERS OF EMISSION CONTROLS ASSOCIATION. 2010.
Evaporative Emission Control Technologies for Gasoline Powered Vehicles.
Manufacturers of Emission Controls Association [Online]. Available:
http://www.meca.org/galleries/files/MECA_Evap_White_Paper_Final.pdf [Accessed
25 May 2014].
MASIKANE, Z. & MKHIZE, N. 2012. Bus commuters to benefit from new fleet [Online].
Available: http://showme.co.za/durban/news/bus-commuters-to-benefit-from-new-
fleet/ [Accessed 2 October 2013].
MATTHEWS, H., HENDRICKSON, C. & WEBER, C. 2008. The importance of carbon
footprint estimation boundaries. Environmental Science and Technology, vol. 42, pp.
5839-5842.
MBONAMBI, G. 2012. Huge transport shake-up for Durban [Online]. The Mercury Available:
http://www.iolproperty.co.za/roller/news/entry/huge_transport_shake_up_for.
MBONAMBI, G. 2013. Personal Communication. Senior Engineering Technician,
Passenger Rail Agency of South Africa.
MCCARTHY TOYOTA. 2013. Toyota Toolbox - New Cars. Toyota Zone. McCarthy Toyota.
MCDONNELL, S., FERREIRAM, S. & CONVERY, F. 2008. Using Bus Rapid Transit to
Mitigate Emissions of CO2 from Transport. Transport Reviews, vol 28, no. 6, pp.
735-756.
References
139
MCMICHAEL, A., CAMPBELL-LENDRUM, D., CORVALÁN, C., EBI, K., GITHEKO, A.,
SCHERAGA, J. & WOODWARD, A. 2003. Climate change and human health - risks
and responses, Geneva, World Health Organisation.
MEJIA-DUGAND, S., HJELM, O., BAAS, L. & RIOS, R. 2012. Lessons from the spread of
Bus Rapid Transit in Latin America. Journal of Cleaner Production, vol. 50, pp. 82-
90.
MERCEDES BENZ. 2014. Sprinter Fuel Consumption [Online]. Available:
http://www2.mercedes-benz.co.uk/content/media_library/unitedkingdom/mpc_
unitedkingdom/ng_vans/new_vans/downloads/sprinter_fuel_consumption.object-
Single-MEDIA.download.tmp/Sprinter%20Euro%205%2028%2005%2009%20-
%20VCA%20Fuel%20Database.pdf [Accessed 10 January 2015].
MOODLEY, G.Y., CHETTY, R., REDDY, J. & SIMMER, C. 2011. Developing the Integrated
Rapid Public Transport Network (IRPTN) for the eThekwini Municipal Area.
Proceedings of the 30th Southern African Transport Conference, 11-14 July 2011,
Pretoria, South Africa, pp. 499-514.
MOODLEY, G., MEINTSMA, J., VAN TONDER, M., KUPPAN, S. & BAKER, S. 2009.
eThekwini Municipal Wide Household Travel Interview Survey: Travel Behaviour
Findings. Proceedings of the 28th Southern African Transport Conference, 6-9 July
2009, Pretoria, South Africa, pp. 135-143.
MOODLEY, L. 2013. Personal Communication. Civil Engineer, eThekwini Transport
Authority, South Africa.
MOSTERT, J. 2013. Personal Communication. Communiciations Officer, Transport
Information Centre, Transport for Cape Town, South Africa
NAIDOO, M. 2014. Personal Communication. Co-acting Senior Manager, eThekwini Energy
Office, South Africa.
NAIR, P. & KUMAR, D. 2005. Transformation in road transport system in Bogota: an
overview. ICFAI Journal of Infrastructure, September, pp. 20-28.
References
140
NRCS – NATIONAL REGULATOR FOR COMPULSORY SPECIFICATIONS. 2014. Taxi
Recapitalisation [Online]. National Department of Transport Available:
http://www.transport.gov.za/PublicTransport/Taxis/TaxiRecaptilization.aspx
[Accessed 20 May 2014].
NDEBELE, S. 2011. Minister of Transport Mr Sibusiso Ndebele addresses launch of Non-
Motorised Transport legacy project [Online]. Department of Environmental Affairs.
[Accessed 11 February 2013].
NMBMM – NELSON MANDELA BAY METROPOLITAN MUNICIPALITY. 2015. Draft 2015
Metropolitan Spatial Development Framework (Review). Nelson Mandela Bay:
Nelson Mandela Bay Metropolitan Municipality.
NMBT – NELSON MANDELA BAY TOURISM. 2012. Nelson Mandela Bay Municipality
brings you Libhongolethu! [Online]. Available: http://www.nmbt.co.za/news/
nelson_mandela_bay_municipality_brings_you_libhongolethu.html#sthash.mTRVij
Qf.dpuf [Accessed 22 November 2014].
NMMM – NELSON MANDELA METROPOLITAN MUNICIPALITY. 2007. Implementation of
the PTP: implications of implementing a full BRT system, Draft 3. Nelson Mandela
Bay: Nelson Mandela Metropolitan Municipality.
NH DoT – NEW HAMPSHIRE DEPARTMENT OF TRANSPORT. 2012. Remaining Useful
Life of Transit Buses [Online]. New Hampshire Government. Available:
www.nh.gov/dot/org/commisioner/balanced-scorecard/department/documents/
2012_bs_performance_transit_buseage.pdf [Accessed 29 November 2014].
NGWENYA, B. 2013. Personal Communication. General Manager, City Fleet, eThekwini
Municipality, South Africa.
ONATU, G. 2011. A new approach to sustainable transport systems: A critical appraisal of
the Rapid Bus Transit System in South Africa. Journal of Sustainable Development
and Environmental Protection, vol. 1, no. 2, pp. 89-97.
OECD and IEA – ORGANISATION FOR ECONOMIC CO-OPERATION AND
DEVELOPMENT & INTERNATIONAL ENERGY AGENCY. 2009. Transport, Energy
and CO2: Moving towards sustainability. Paris: International Energy Agency.
References
141
PANDEY, D., AGRAWAL, M. & SHANKER PANDEY, J. 2011. Carbon Footprint: current
methods of estimation. Environmental Monitoring and Assessment, vol. 178, no. 1-
4, pp. 135-160.
PRASA – PASSENGER RAIL AGENCY OF SOUTH AFRICA. 2007. Metrorail - Rolling
Stock [Online]. Available: http://www.metrorail.co.za/RollingStock.html [Accessed 20
September 2013].
PRASA – PASSENGER RAIL AGENCY OF SOUTH AFRICA. 2010. PRASA Annual Report
2009/10. Johannesburg: Passenger Rail Agency of South Africa
PBL NEAA – PBL NETHERLANDS ENVIRONMENTAL ASSESSMENT AGENCY. 2014.
Trends in global CO2 emissions: 2014 Report. Hague: PBL Publishers.
PIOTRANS. 2011. Stakeholders [Online]. Available: http://www.reavaya.org.za/component/
content/article/156-february-2011/645-new-bus-operating-company-launched
[Accessed 22 August 2013].
PRETORIUS, T. & VANDERSCHUREN, M. 2012. Voluntary Transport Demand
Management: Route Choice Study in Port Elizabeth. Proceedings of the 31st
Southern African Transport Conference. 9-12 July 2012, Pretoria, South Africa, pp.
70-80.
PROZZI, J., NAUDE, C., SPERLING, D. & DELUCCHI, M. 2002. Transportation in
Developing Countries: Greenhouse gas scenarios for South Africa. Arlington: Pew
Center on Global Climate Change.
RSA – REPUBLIC OF SOUTH AFRICA. 2009. National Land Transport Act, Act 5 of 2009.
Cape Town: The Presidency, Republic of South Africa.
ROBERTS, D. 2008. Thinking globally, acting locally- institutionalising climate change at the
local government level in Durban, South Africa. International Institute for
Environment and Development (IIED), vol. 20, pp. 521-537.
RLM – RUSTENBURG LOCAL MUNICIPALITY. 2015. Rustenburg Rapid Transport
[Online]. Available: http://www.rustenburg.gov.za/?q=node/87 [Accessed 30
January 2015].
References
142
SCENARIO BUILDING TEAM. 2007. Long Term Mitigation Scenarios: Strategic Options for
South Africa. Pretoria: Department of Environment Affairs and Tourism.
SCHALEKAMP, H. & BEHRENS, R. 2010. Engaging paratransit on PT reform initiatives in
SA: A critique of policy and an investigation of appropriate engagement approaches.
Research in Transportation Economics, vol. 29, pp. 371-378.
SCHILZ, E. 2013. The People Mover [Online]. Available: http://durbangoldenmile.
blogspot.com/2013/06/the-people-mover.html [Accessed 2 March 2014].
SIYONGWANA, P. & BINZA, M. 2012. Challenges facing the transformation of the public
transport system in Nelson Mandela Bay, South Africa : history in the making. Journal
for Contemporary History, vol. 37, pp. 191-202.
SABC – SOUTH AFRICAN BROADCASTING CORPORATION. 2012. Calls made for
inquiry into PE’s BRT system [Online]. Available: http://www.sabc.co.za/news/
a/0006c3004cb4b13ca6a1e6b060346904/Calls-made-for-inquiry-into-
PE%E2%80%99s-BRT-system-20121309 [Accessed 22 November 2014].
STATISTICS SOUTH AFRICA. 2014. P0302 - Mid-year population estimates [Online].
Available: http://beta2.statssa.gov.za/publications/P0302/P03022014.pdf [Accessed
25 October 2014].
STEENBRINK, P. 1974. Optimization of Transport Networks, London, John Wiley and Sons.
TSA – TAXI SCRAPPING ADMINISTRATOR. 2009. Progress Statistics [Online]. Available:
www.scraptaxi.org/ScrappingStats.aspx [Accessed 30 October 2013].
THAMBIRAN, T. & DIAB, R. 2011. Air pollution and climate change co-benefit opportunities
in the road transport sector in Durban, South Africa. Atmospheric Environment, vol.
45, pp. 2683-2689.
TRANSPORT FOR CAPE TOWN. 2013. About MyCiTi [Online]. Available:
http://myciti.org.za/en/about/about-us/about-myciti/ [Accessed 3 August 2014].
TUFTS UNIVERSITY. 2015. Curitiba - How Did it Happen? [Online]. Available:
https://sites.tufts.edu/sustainablebrt/files/2015/04/Slide1.png [Accessed 2 April
2015].
References
143
US EPA – UNITED STATES ENVIRONMENTAL PROTECTION AGENCY. 2004.
MOBILE6.2 Model Run assumed IDLE Test, National Low Emission Vehicle
Standards, summer temperature 64-92 degrees, and United States average vehicle
operations.
US EPA – UNITED STATES ENVIRONMENTAL PROTECTION AGENCY: OFFICE OF
MOBILE SOURCES. 2005. Automobile Emissions: An Overview. Available:
http://www.epa.gov/otaq/consumer/05-autos.pdf [Accessed 15 October 2014].
URS NZL – URS NEW ZEALAND LIMITED. 2008. Petrol and Diesel in South Africa and the
impact on air quality [Online]. Available: www.sapia.co.za [Accessed 25 May 2014].
VENTER, C. 2013. The lurch towards formalisation: Lessons from implementation of BRT
in Johannesburg, South Africa. Research in Transport Economics 39, 114-120.
VUCHIC, V. 1981. Urban Public Transport: Systems and Technology, New Jersey, Prentice-
Hall Inc.
WALTERS, J. 2013. Overview of public transport policy developments in South Africa.
Research in Transportation Economics, vol. 39, pp. 34-45.
WIEDMANN, T. & MINX, J. 2008. A Definition of 'Carbon Footprint'. In: PERTSOVA, C. (ed.)
Ecological Economics Research Trends. New York: Nova Science Publishers.
WILKINSON, J. 2013. Personal Communication. General Manager, Tansnat Durban, South
Africa.
WÖHRNSCHIMMEL, H., ZUK, M., MARTINEZ-VILLA, G., CERON, J., CARDENAS, B.,
ROJAS-BRACHO, L. & FERNANDEZ-BREMAUNTZ, A. 2008. The impact of a Bus
Rapid Transit system on commuters exposure to benzene, CO, PM2.5 and PM10 in
Mexico City. Atmospheric Environment, vol. 42, pp. 8194-8203.
WRIGHT, L. & HOOK, W. 2007. Bus Rapid Transit: Planning Guide 2007. New York:
Institute for Transportation and Development Policy.
ZAHABI, S., MIRANDA-MORENA, L., PATTERSON, Z., BARLA, P. & HARDING, C. 2012.
Transportation Greenhouse Gas Emissions and its Relationship with Urban Form,
References
144
Transit Accessibility and Emerging Green Technologies: A Montreal case study.
Procedia - Social and Behavioural Sciences, vol. 54, pp. 996-978.
Appendices
A
APPENDIX A
NRCS TAXI RECAPITALISATION PROGRAMME LIST
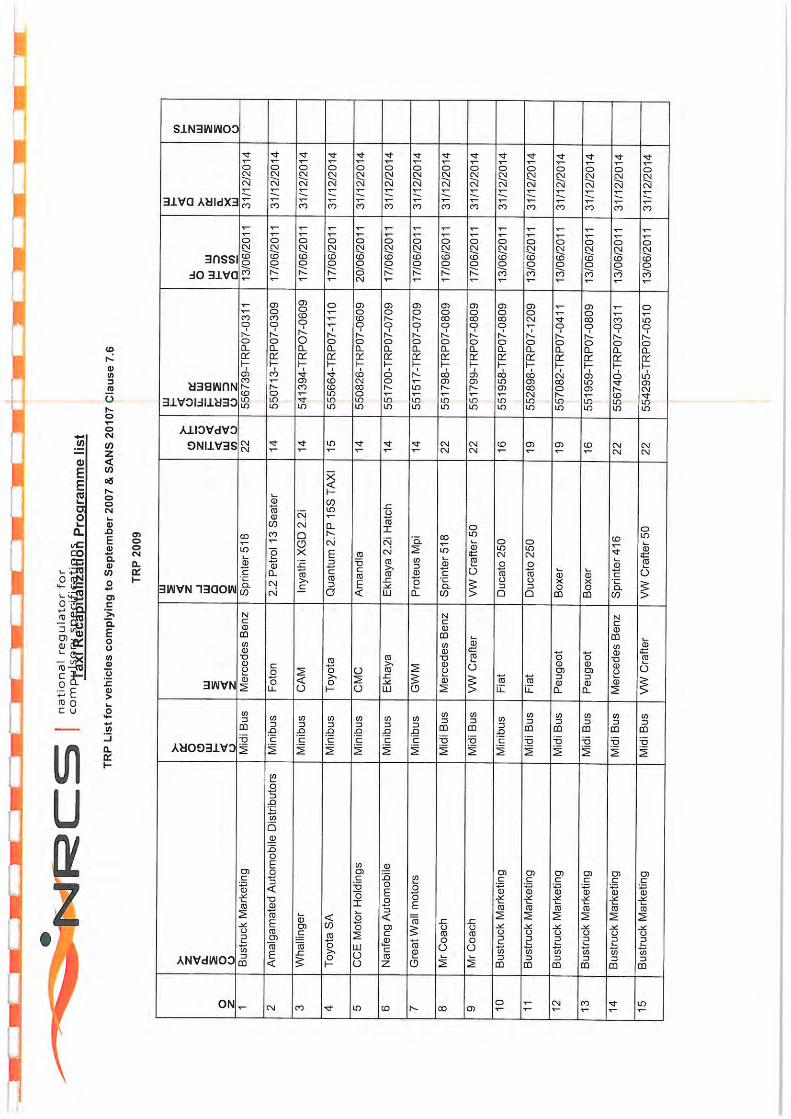
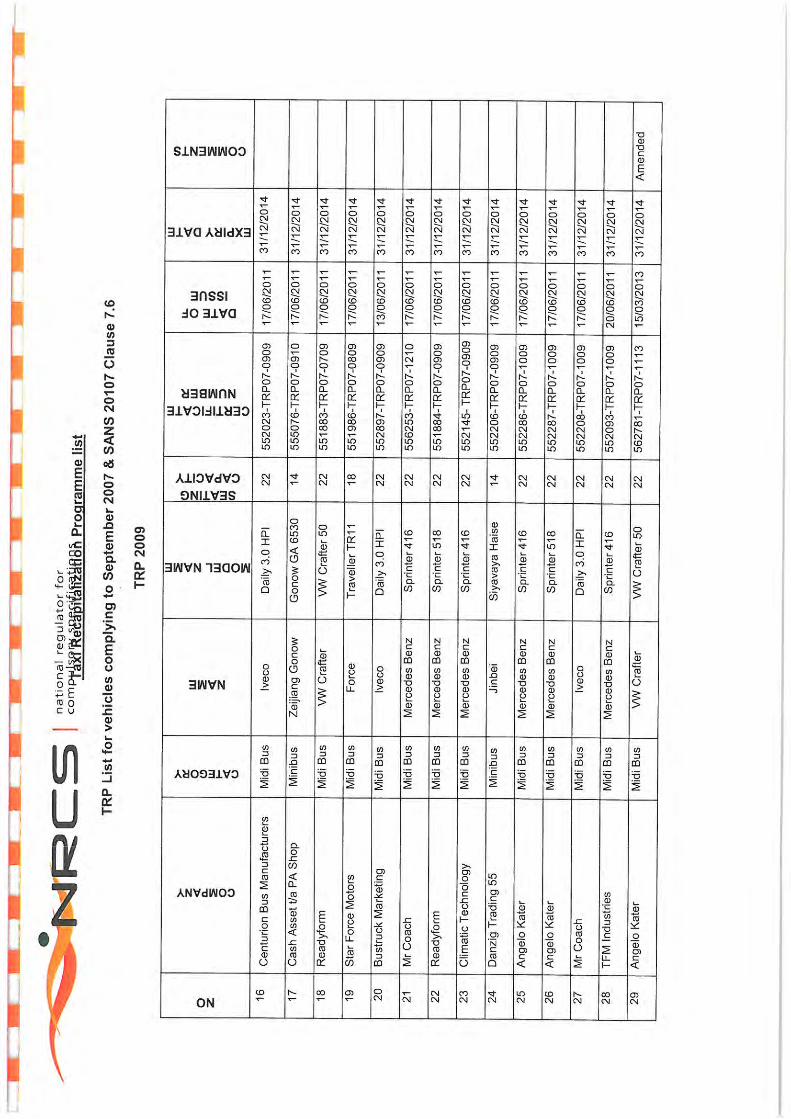
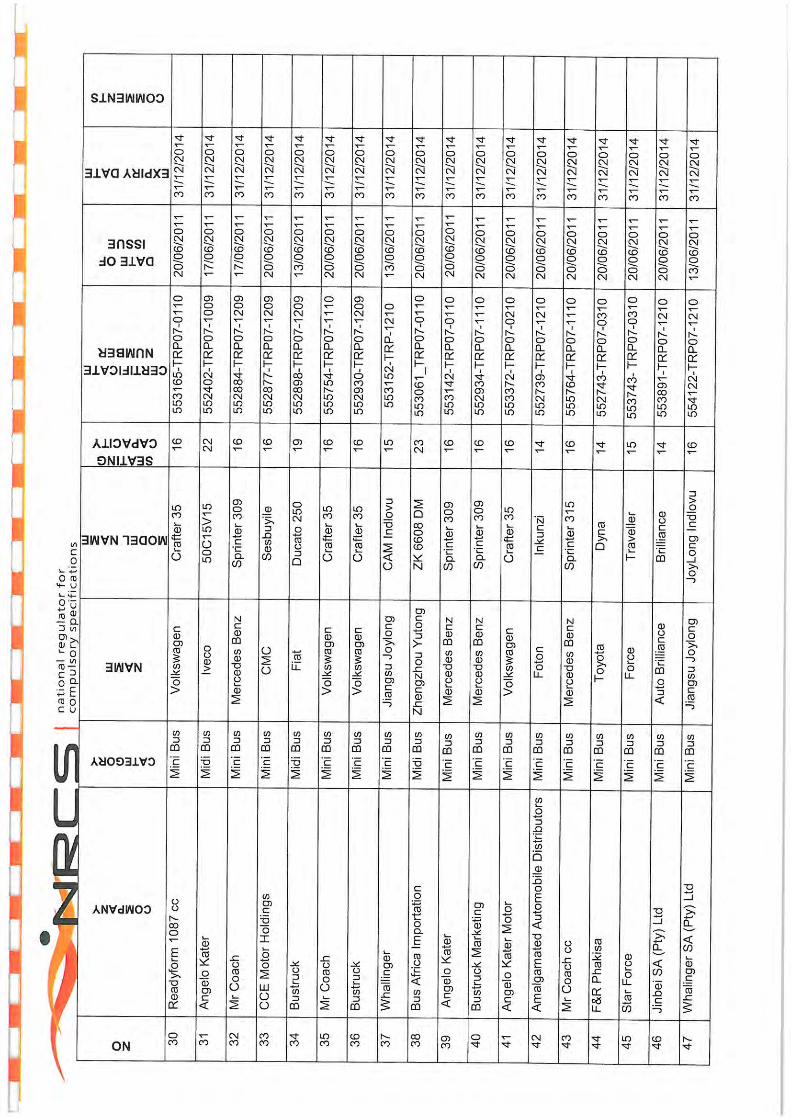
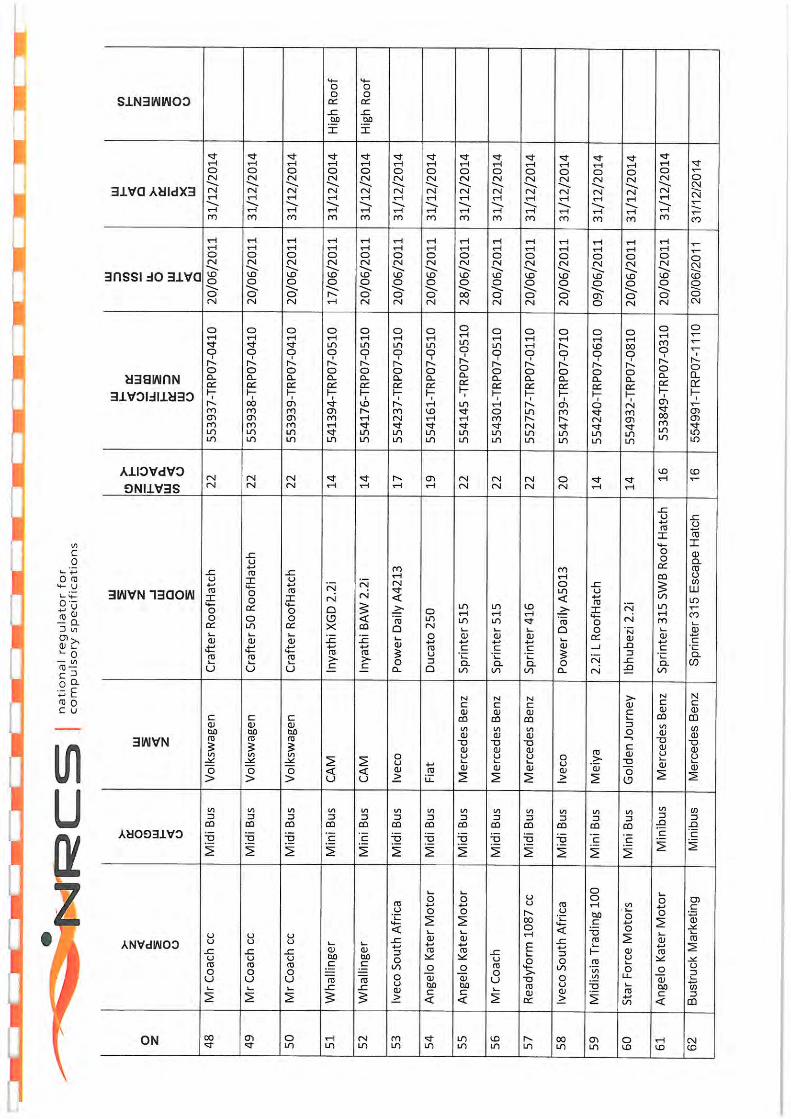
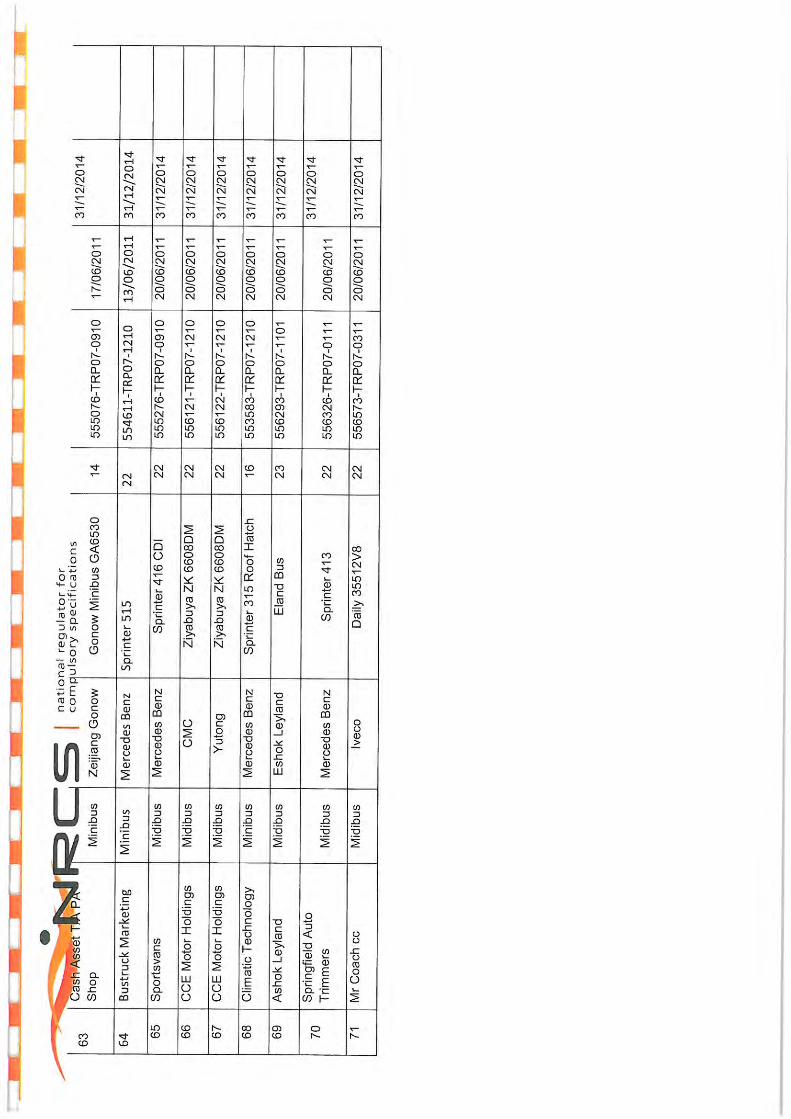
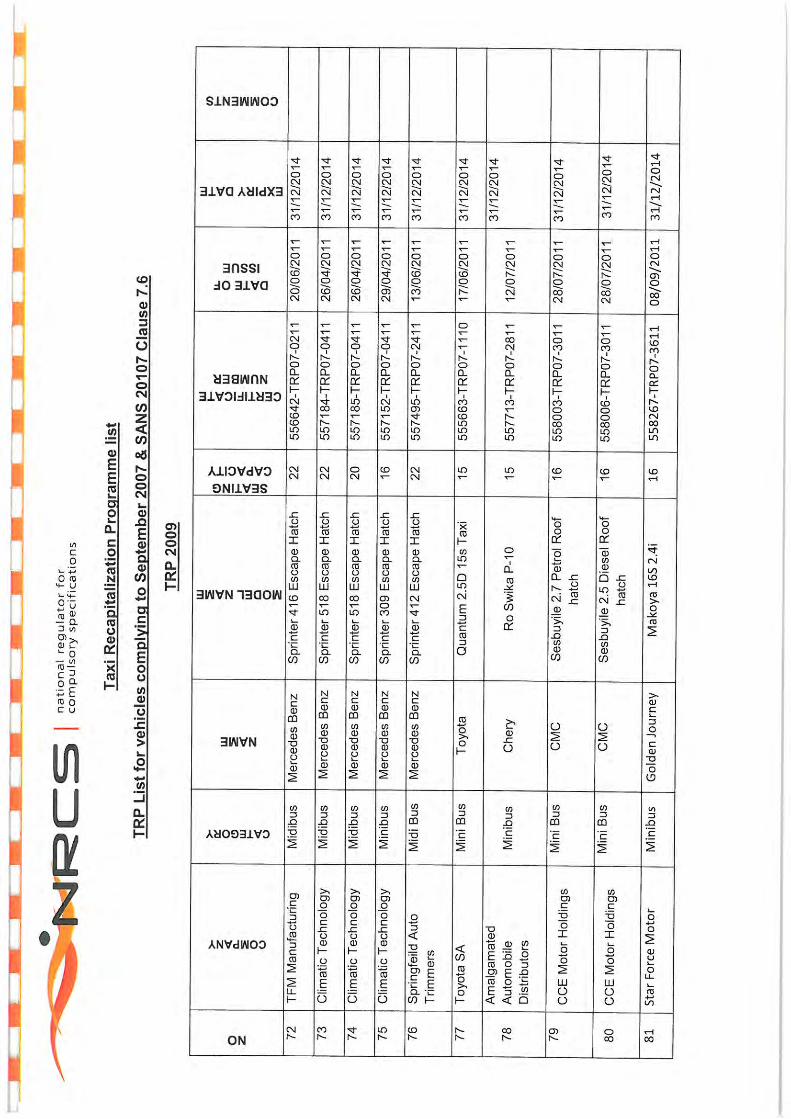
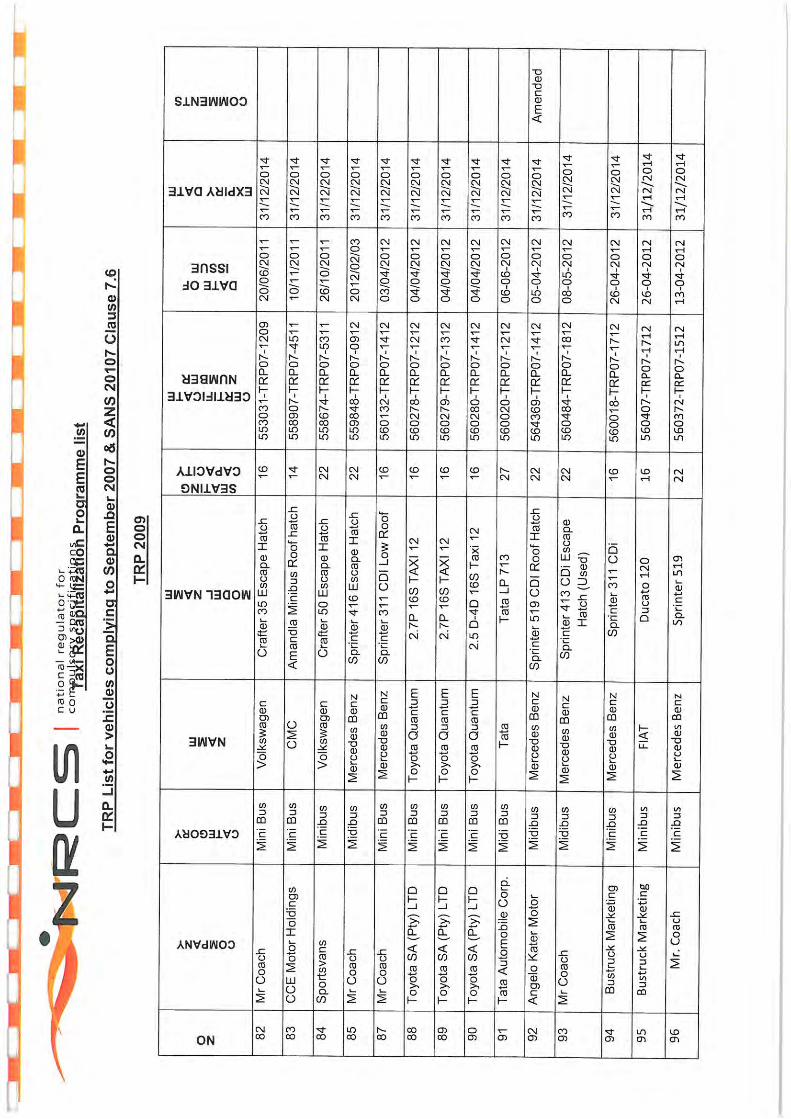
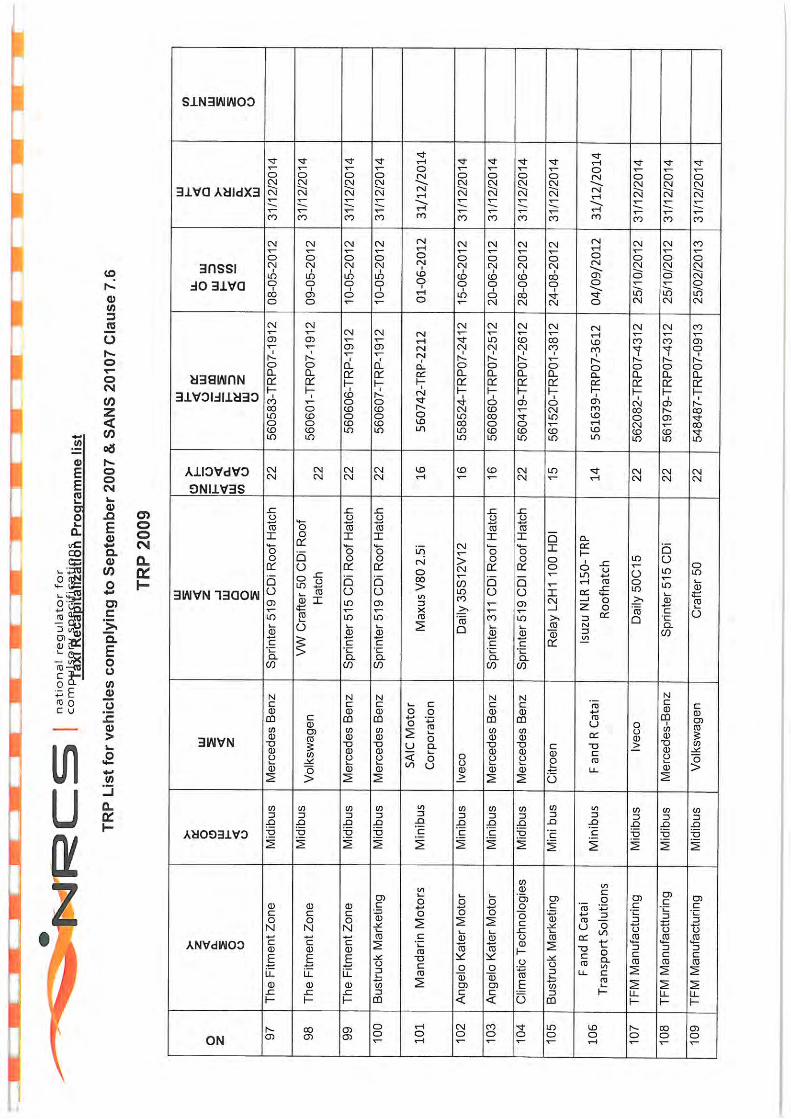
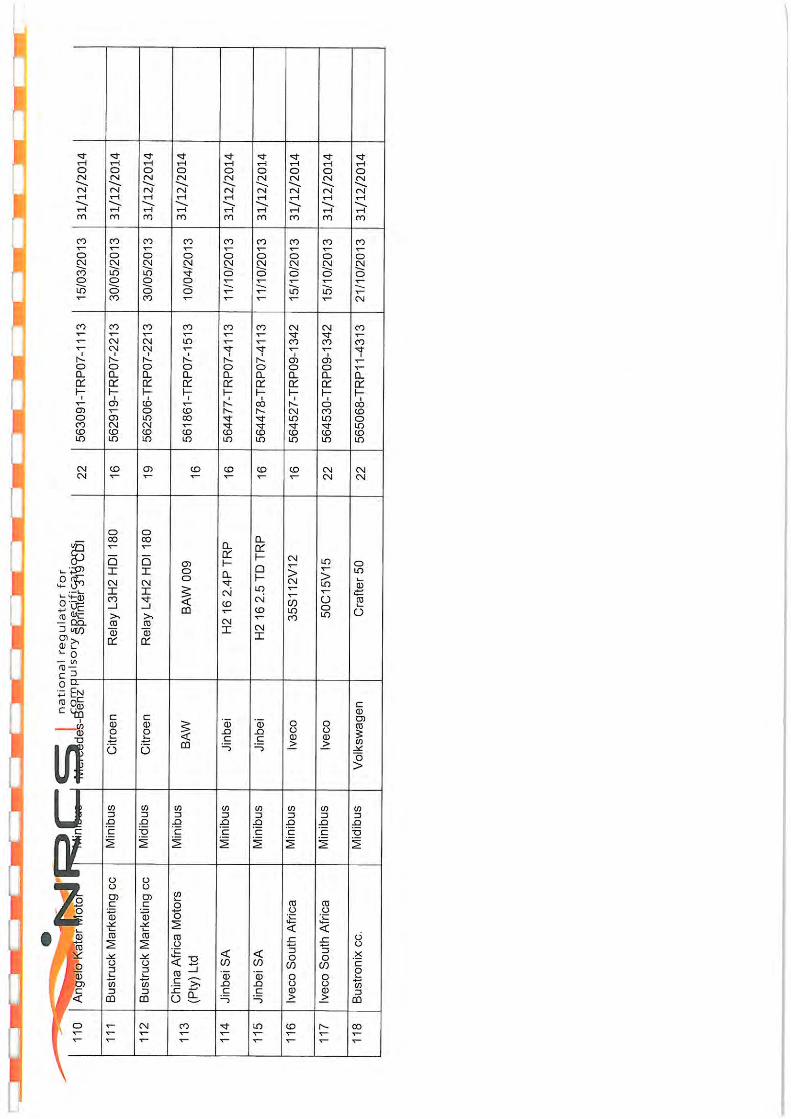
Appendices
B
APPENDIX B
SAMPLE CO2e EMISSION CALCULATION
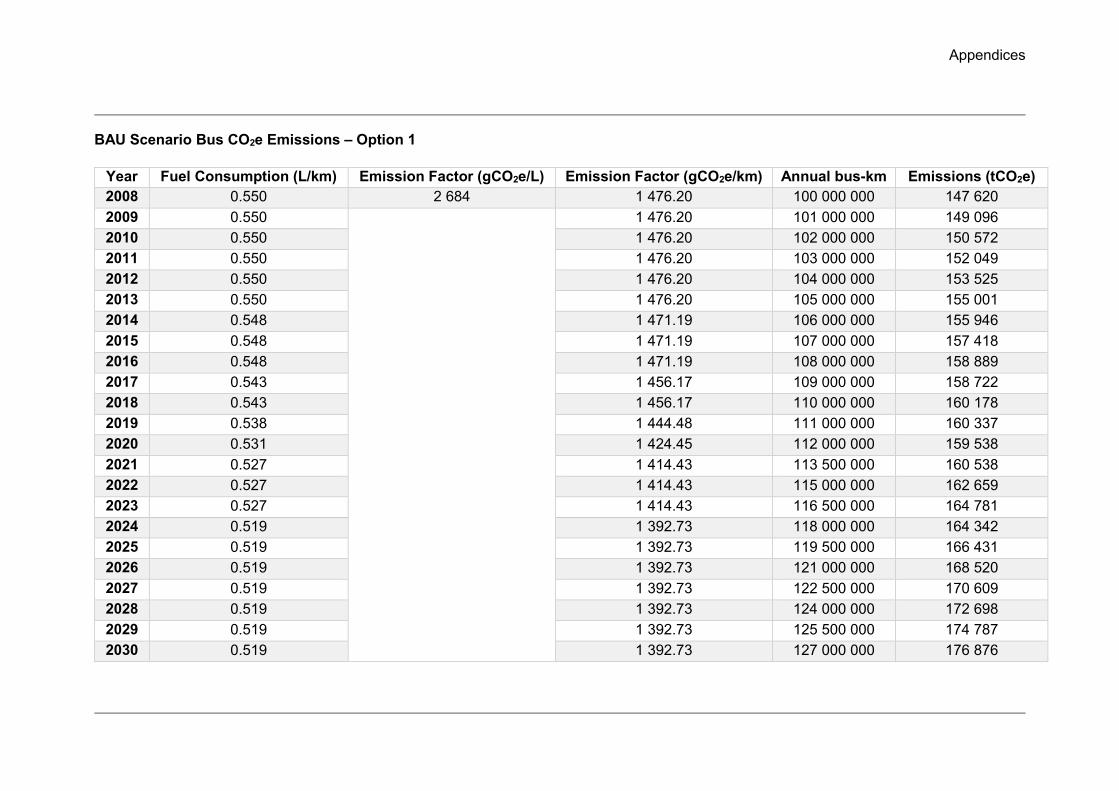
Appendices
BAU Scenario Bus CO2e Emissions – Option 1
Year Fuel Consumption (L/km) Emission Factor (gCO2e/L) Emission Factor (gCO2e/km) Annual bus-km Emissions (tCO2e) 2008 0.550 2 684 1 476.20 100 000 000 147 620 2009 0.550 1 476.20 101 000 000 149 096 2010 0.550 1 476.20 102 000 000 150 572 2011 0.550 1 476.20 103 000 000 152 049 2012 0.550 1 476.20 104 000 000 153 525 2013 0.550 1 476.20 105 000 000 155 001 2014 0.548 1 471.19 106 000 000 155 946 2015 0.548 1 471.19 107 000 000 157 418 2016 0.548 1 471.19 108 000 000 158 889 2017 0.543 1 456.17 109 000 000 158 722 2018 0.543 1 456.17 110 000 000 160 178 2019 0.538 1 444.48 111 000 000 160 337 2020 0.531 1 424.45 112 000 000 159 538 2021 0.527 1 414.43 113 500 000 160 538 2022 0.527 1 414.43 115 000 000 162 659 2023 0.527 1 414.43 116 500 000 164 781 2024 0.519 1 392.73 118 000 000 164 342 2025 0.519 1 392.73 119 500 000 166 431 2026 0.519 1 392.73 121 000 000 168 520 2027 0.519 1 392.73 122 500 000 170 609 2028 0.519 1 392.73 124 000 000 172 698 2029 0.519 1 392.73 125 500 000 174 787 2030 0.519 1 392.73 127 000 000 176 876
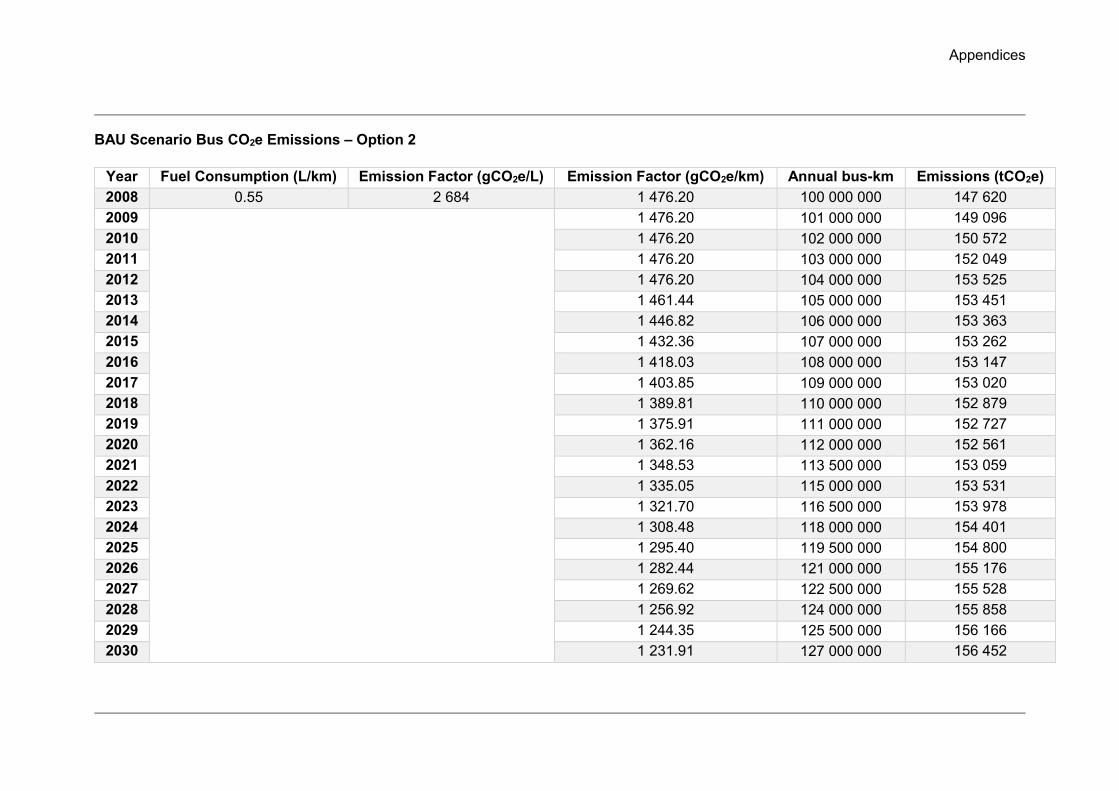
Appendices
BAU Scenario Bus CO2e Emissions – Option 2
Year Fuel Consumption (L/km) Emission Factor (gCO2e/L) Emission Factor (gCO2e/km) Annual bus-km Emissions (tCO2e) 2008 0.55 2 684 1 476.20 100 000 000 147 620 2009 1 476.20 101 000 000 149 096 2010 1 476.20 102 000 000 150 572 2011 1 476.20 103 000 000 152 049 2012 1 476.20 104 000 000 153 525 2013 1 461.44 105 000 000 153 451 2014 1 446.82 106 000 000 153 363 2015 1 432.36 107 000 000 153 262 2016 1 418.03 108 000 000 153 147 2017 1 403.85 109 000 000 153 020 2018 1 389.81 110 000 000 152 879 2019 1 375.91 111 000 000 152 727 2020 1 362.16 112 000 000 152 561 2021 1 348.53 113 500 000 153 059 2022 1 335.05 115 000 000 153 531 2023 1 321.70 116 500 000 153 978 2024 1 308.48 118 000 000 154 401 2025 1 295.40 119 500 000 154 800 2026 1 282.44 121 000 000 155 176 2027 1 269.62 122 500 000 155 528 2028 1 256.92 124 000 000 155 858 2029 1 244.35 125 500 000 156 166 2030 1 231.91 127 000 000 156 452
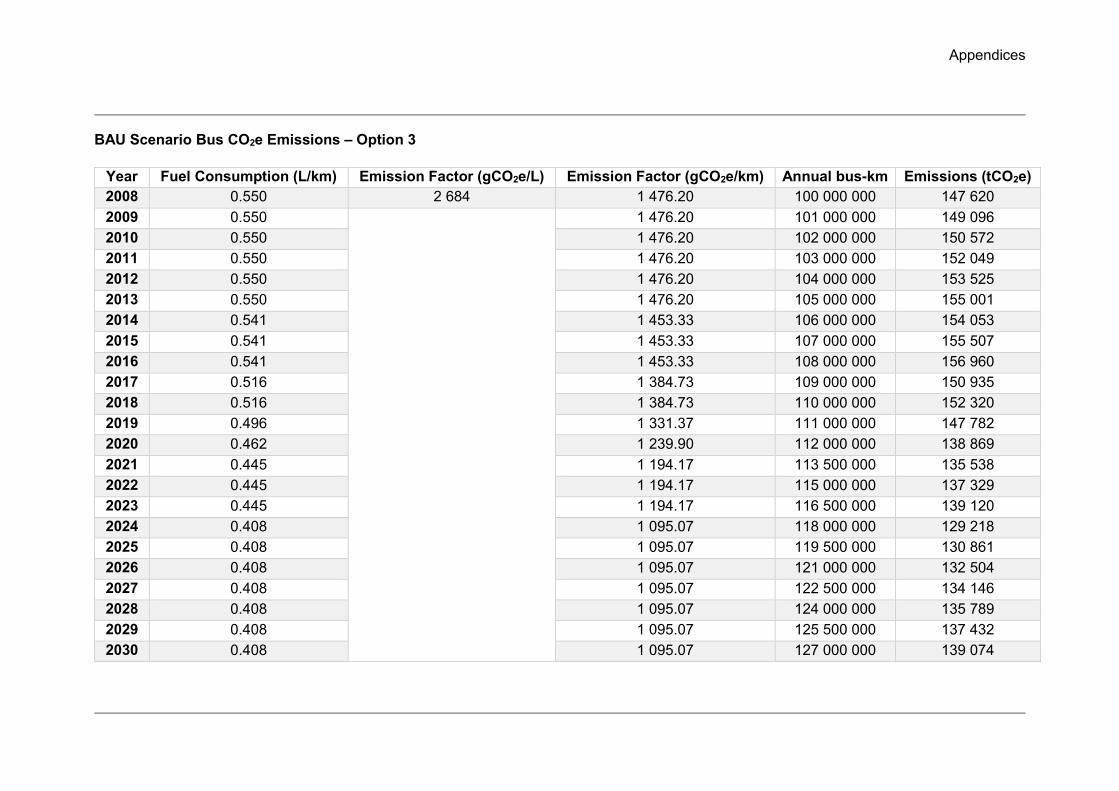
Appendices
BAU Scenario Bus CO2e Emissions – Option 3
Year Fuel Consumption (L/km) Emission Factor (gCO2e/L) Emission Factor (gCO2e/km) Annual bus-km Emissions (tCO2e) 2008 0.550 2 684 1 476.20 100 000 000 147 620 2009 0.550 1 476.20 101 000 000 149 096 2010 0.550 1 476.20 102 000 000 150 572 2011 0.550 1 476.20 103 000 000 152 049 2012 0.550 1 476.20 104 000 000 153 525 2013 0.550 1 476.20 105 000 000 155 001 2014 0.541 1 453.33 106 000 000 154 053 2015 0.541 1 453.33 107 000 000 155 507 2016 0.541 1 453.33 108 000 000 156 960 2017 0.516 1 384.73 109 000 000 150 935 2018 0.516 1 384.73 110 000 000 152 320 2019 0.496 1 331.37 111 000 000 147 782 2020 0.462 1 239.90 112 000 000 138 869 2021 0.445 1 194.17 113 500 000 135 538 2022 0.445 1 194.17 115 000 000 137 329 2023 0.445 1 194.17 116 500 000 139 120 2024 0.408 1 095.07 118 000 000 129 218 2025 0.408 1 095.07 119 500 000 130 861 2026 0.408 1 095.07 121 000 000 132 504 2027 0.408 1 095.07 122 500 000 134 146 2028 0.408 1 095.07 124 000 000 135 789 2029 0.408 1 095.07 125 500 000 137 432 2030 0.408 1 095.07 127 000 000 139 074


