Embed Size (px)
Citation preview
Lecture 3:Process flow analysis
Professor:Ricardo Caballero, M.Sc.
Operations Management
2Ricardo Caballero, M.Sc.
Process view
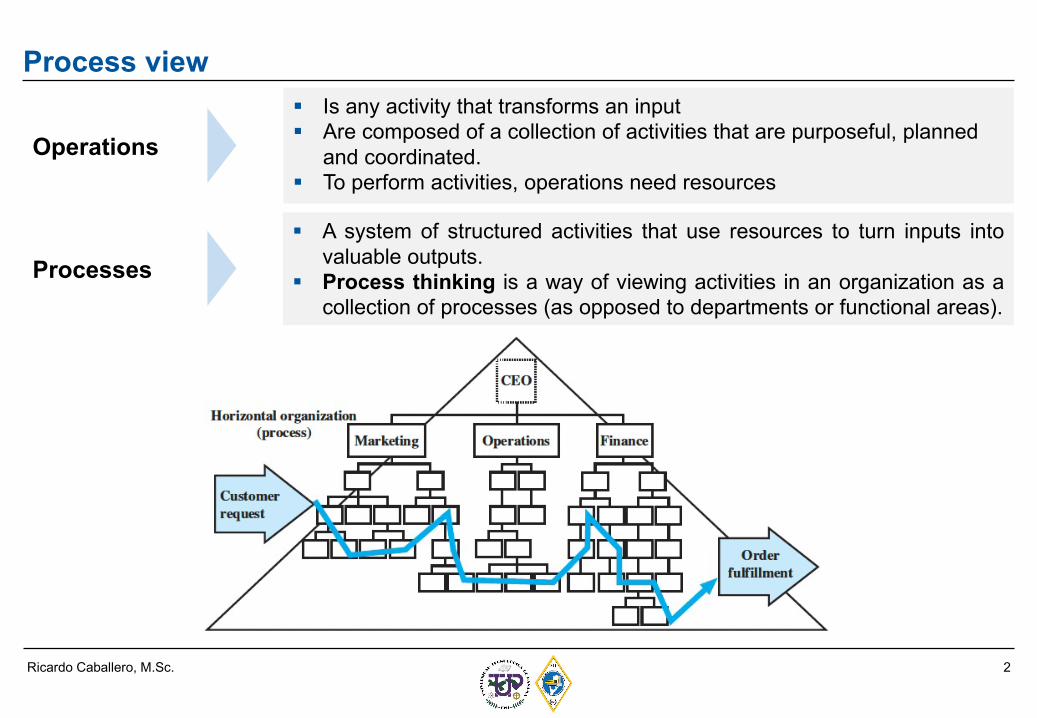
§ A system of structured activities that use resources to turn inputs intovaluable outputs.
§ Process thinking is a way of viewing activities in an organization as acollection of processes (as opposed to departments or functional areas).
§ Is any activity that transforms an input§ Are composed of a collection of activities that are purposeful, planned
and coordinated. § To perform activities, operations need resources
Operations
Processes
3Ricardo Caballero, M.Sc.
Process flow units
4Ricardo Caballero, M.Sc.
Principles of process performance: The Theory of Constraints
There are five basic principles at the heart of TOC:
1. Every process has a constraint.
2. Every process has variance that consumes capacity.
3. Every process must be managed as a system.
4. Performance measures are crucial to the process’s success.
5. Every process must continually improve.
Theory of Constraints (TOC) is a philosophy that suggests that any system always has atleast one constraint, otherwise it would generate an infinite amount of output, and thatconstraints generally determine the pace of an organization’s ability to achieve its goal,which is profit.
… a constraint will restrict the operation’s capacity. If this constraint is reduced, or even removed, capacity will increase. A constraint can be reduced by increasing the resource in the bottleneck.
5Ricardo Caballero, M.Sc.
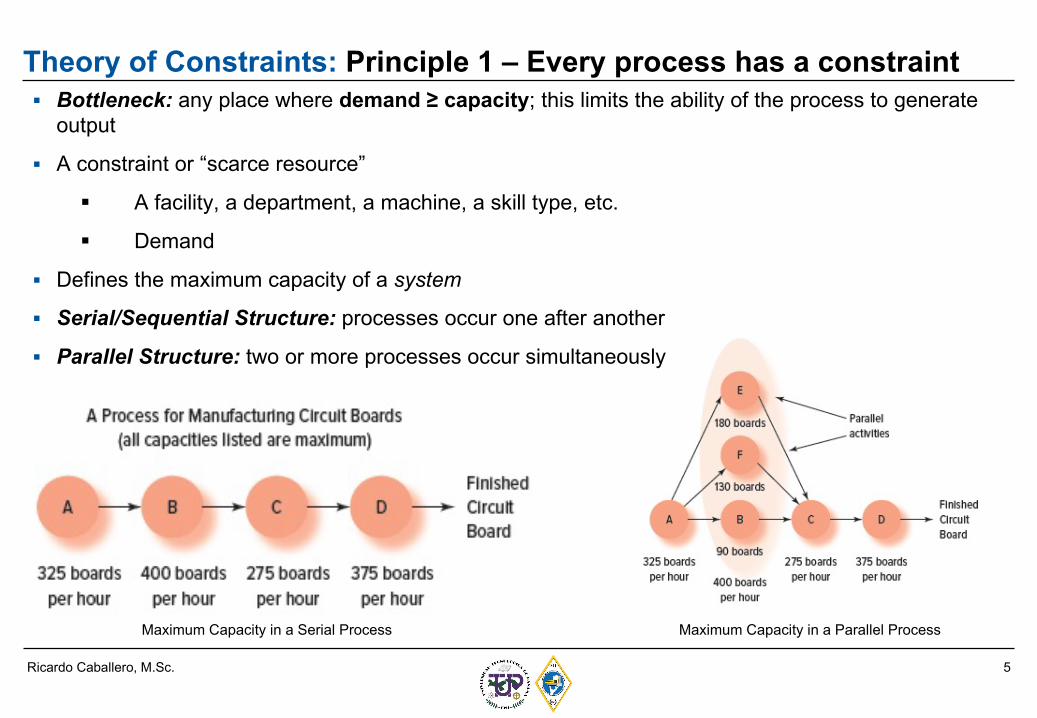
Theory of Constraints: Principle 1 – Every process has a constraint§ Bottleneck: any place where demand ≥ capacity; this limits the ability of the process to generate
output
§ A constraint or “scarce resource”
§ A facility, a department, a machine, a skill type, etc.
§ Demand
§ Defines the maximum capacity of a system
§ Serial/Sequential Structure: processes occur one after another
§ Parallel Structure: two or more processes occur simultaneously
Maximum Capacity in a Serial Process Maximum Capacity in a Parallel Process
6Ricardo Caballero, M.Sc.
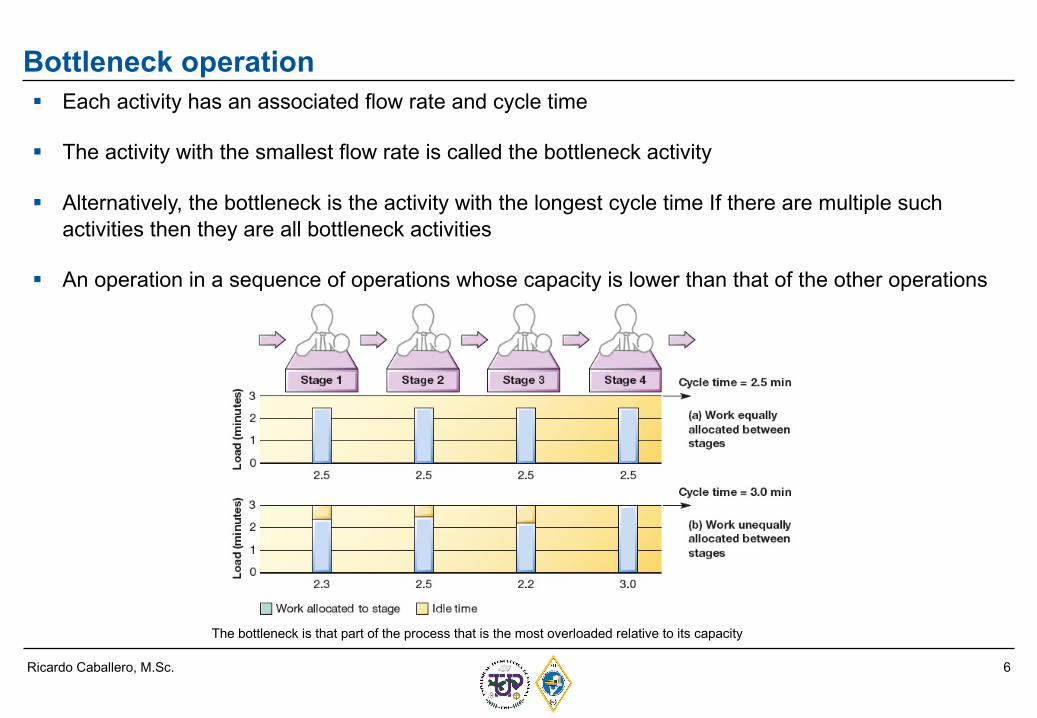
Bottleneck operation§ Each activity has an associated flow rate and cycle time
§ The activity with the smallest flow rate is called the bottleneck activity
§ Alternatively, the bottleneck is the activity with the longest cycle time If there are multiple such activities then they are all bottleneck activities
§ An operation in a sequence of operations whose capacity is lower than that of the other operations
The bottleneck is that part of the process that is the most overloaded relative to its capacity
7Ricardo Caballero, M.Sc.
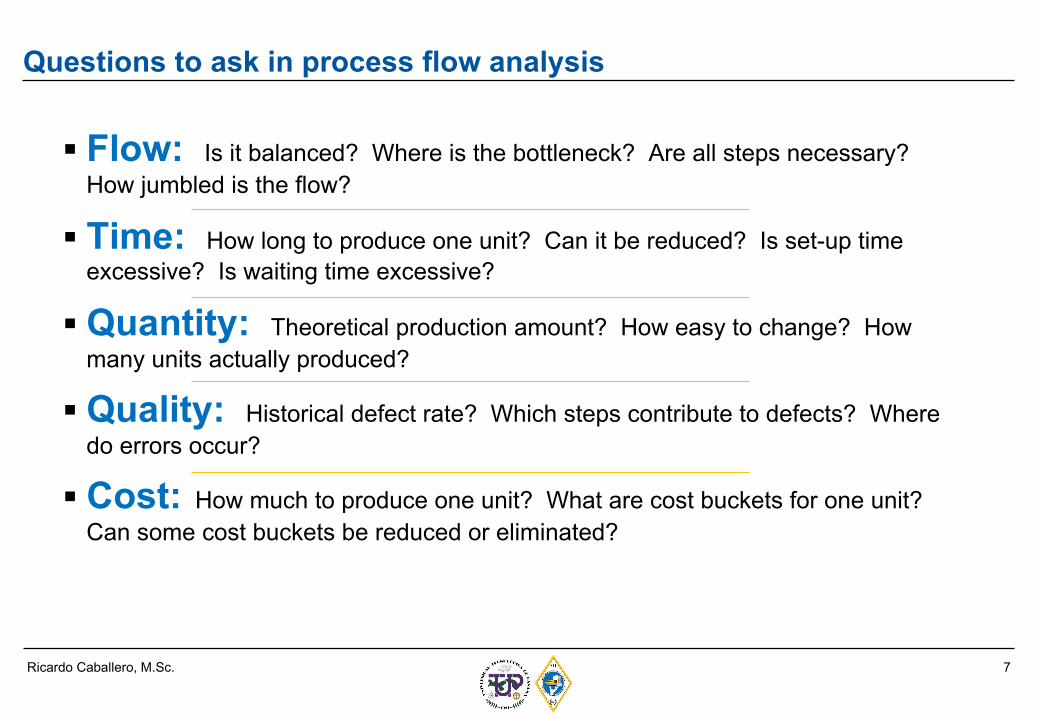
Questions to ask in process flow analysis
§ Flow: Is it balanced? Where is the bottleneck? Are all steps necessary? How jumbled is the flow?
§ Time: How long to produce one unit? Can it be reduced? Is set-up time excessive? Is waiting time excessive?
§ Quantity: Theoretical production amount? How easy to change? How many units actually produced?
§ Quality: Historical defect rate? Which steps contribute to defects? Where do errors occur?
§ Cost: How much to produce one unit? What are cost buckets for one unit? Can some cost buckets be reduced or eliminated?
8Ricardo Caballero, M.Sc.
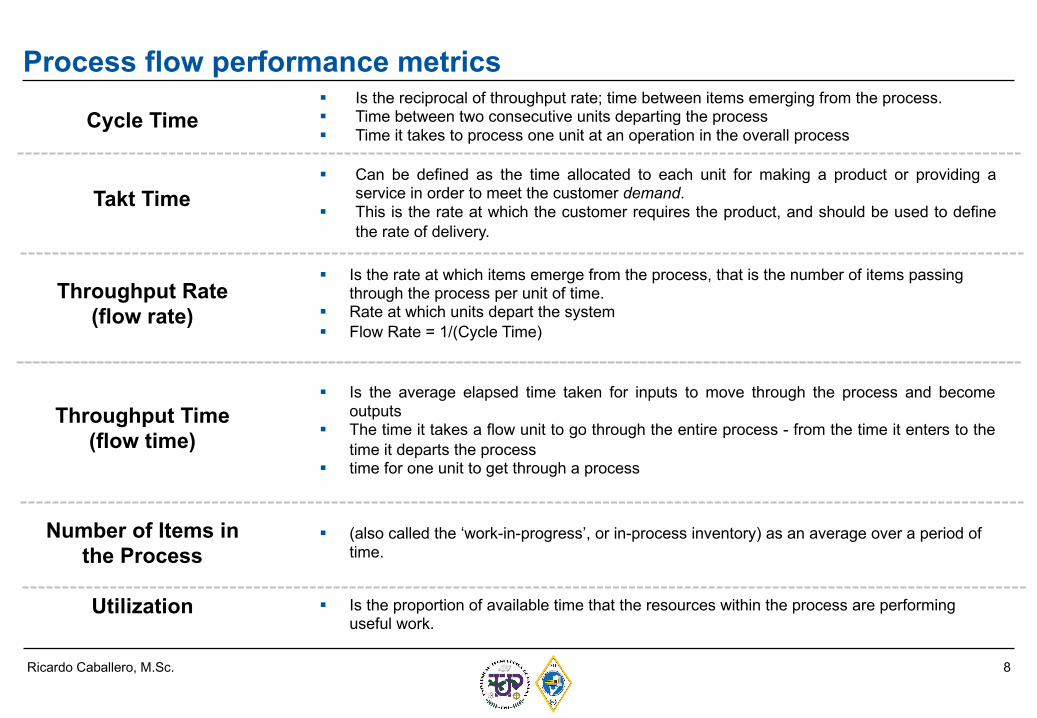
Process flow performance metrics
Cycle Time
Throughput Rate (flow rate)
Throughput Time (flow time)
§ Is the reciprocal of throughput rate; time between items emerging from the process.§ Time between two consecutive units departing the process§ Time it takes to process one unit at an operation in the overall process
§ Is the rate at which items emerge from the process, that is the number of items passing through the process per unit of time.
§ Rate at which units depart the system§ Flow Rate = 1/(Cycle Time)
§ Is the average elapsed time taken for inputs to move through the process and becomeoutputs
§ The time it takes a flow unit to go through the entire process - from the time it enters to thetime it departs the process
§ time for one unit to get through a process
Number of Items in the Process
Utilization § Is the proportion of available time that the resources within the process are performing useful work.
§ (also called the ‘work-in-progress’, or in-process inventory) as an average over a period of time.
Takt Time§ Can be defined as the time allocated to each unit for making a product or providing a
service in order to meet the customer demand.§ This is the rate at which the customer requires the product, and should be used to define
the rate of delivery.
9Ricardo Caballero, M.Sc.
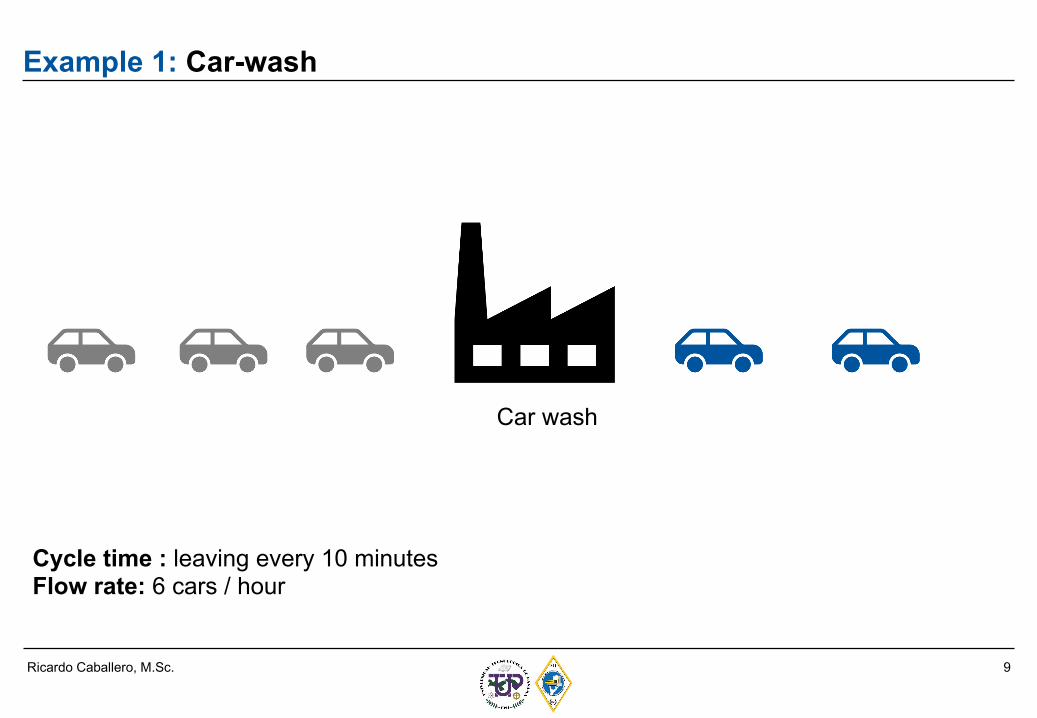
Example 1: Car-wash
Car wash
Cycle time : leaving every 10 minutesFlow rate: 6 cars / hour
10Ricardo Caballero, M.Sc.
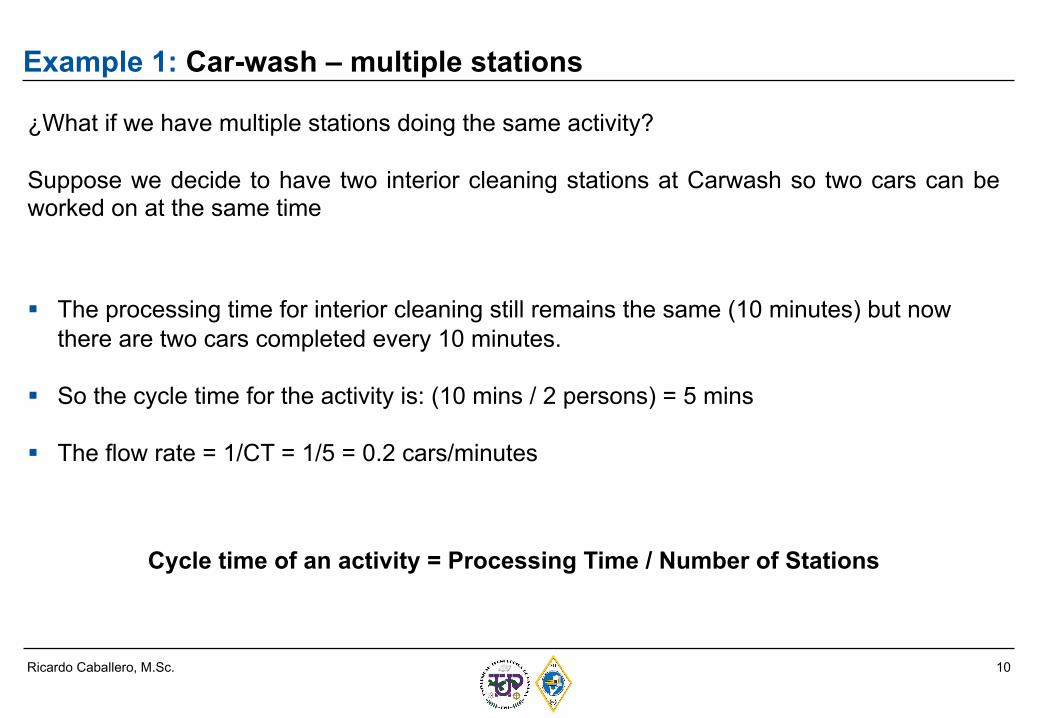
Example 1: Car-wash – multiple stations
¿What if we have multiple stations doing the same activity?
Suppose we decide to have two interior cleaning stations at Carwash so two cars can beworked on at the same time
Cycle time of an activity = Processing Time / Number of Stations
§ The processing time for interior cleaning still remains the same (10 minutes) but now there are two cars completed every 10 minutes.
§ So the cycle time for the activity is: (10 mins / 2 persons) = 5 mins
§ The flow rate = 1/CT = 1/5 = 0.2 cars/minutes
11Ricardo Caballero, M.Sc.
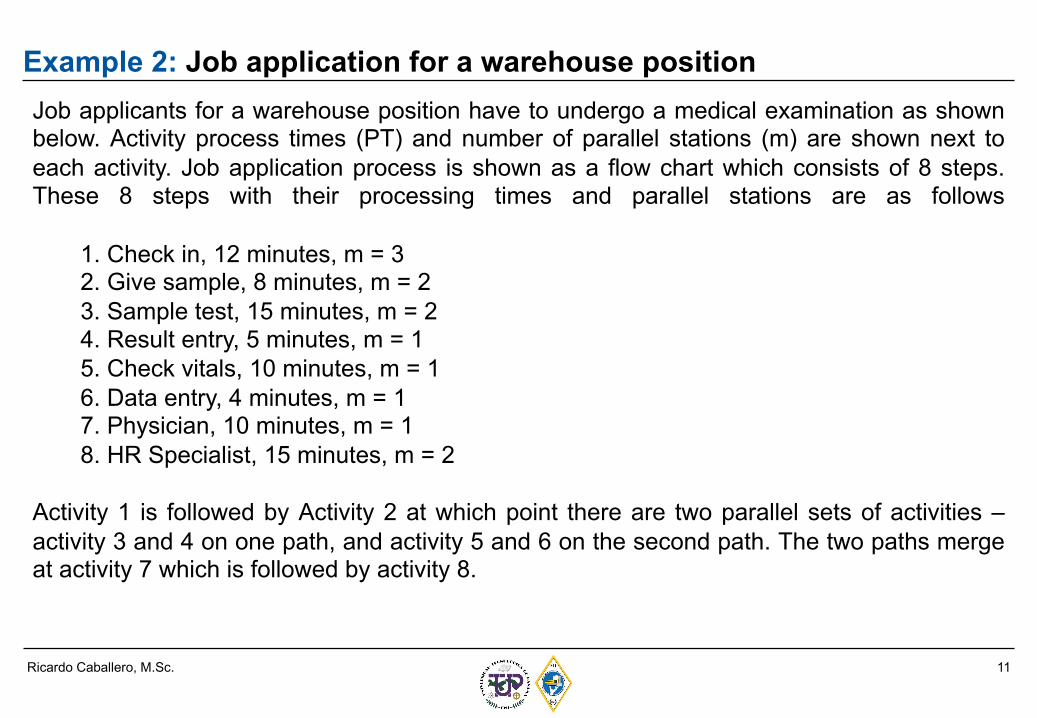
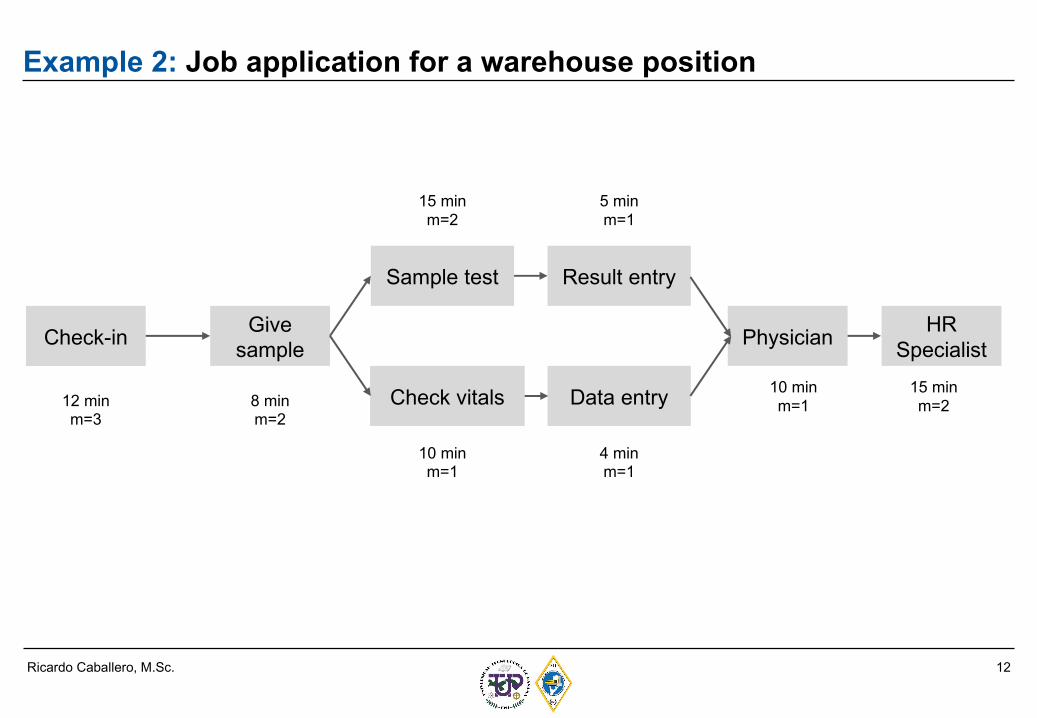
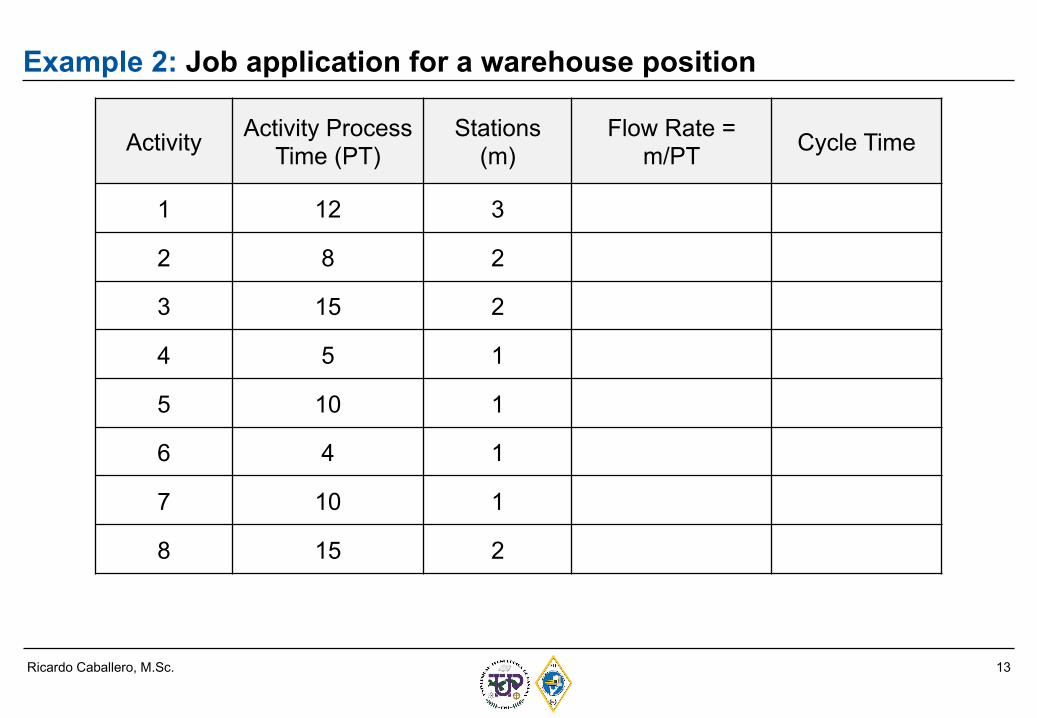
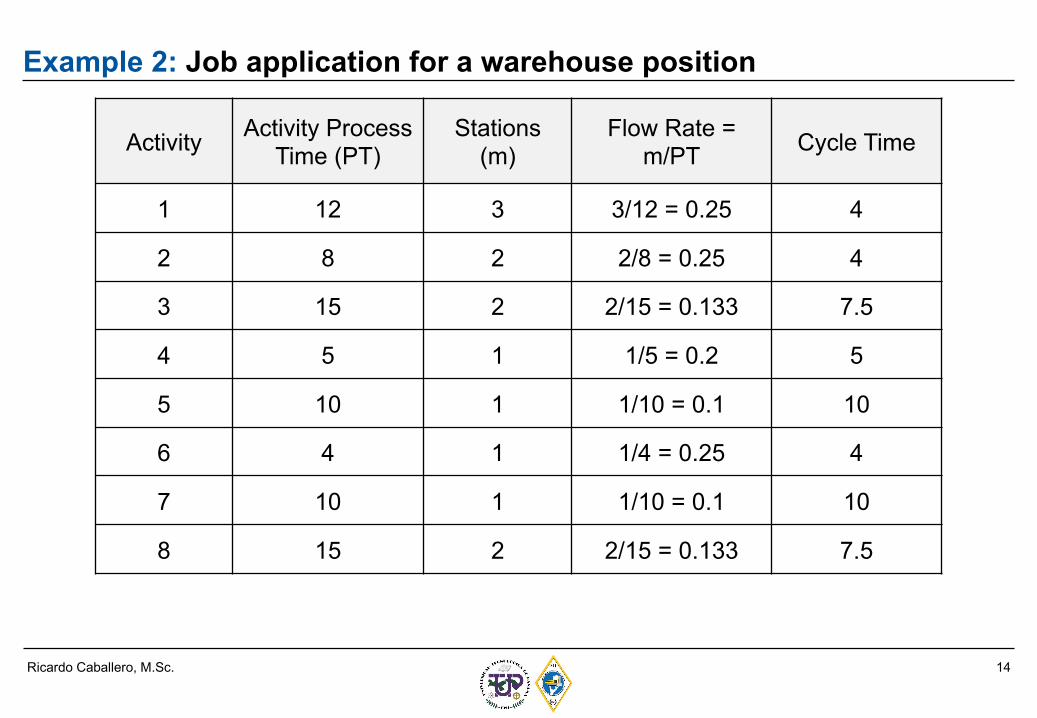
Example 2: Job application for a warehouse positionJob applicants for a warehouse position have to undergo a medical examination as shownbelow. Activity process times (PT) and number of parallel stations (m) are shown next toeach activity. Job application process is shown as a flow chart which consists of 8 steps.These 8 steps with their processing times and parallel stations are as follows
1. Check in, 12 minutes, m = 32. Give sample, 8 minutes, m = 23. Sample test, 15 minutes, m = 24. Result entry, 5 minutes, m = 15. Check vitals, 10 minutes, m = 16. Data entry, 4 minutes, m = 17. Physician, 10 minutes, m = 18. HR Specialist, 15 minutes, m = 2
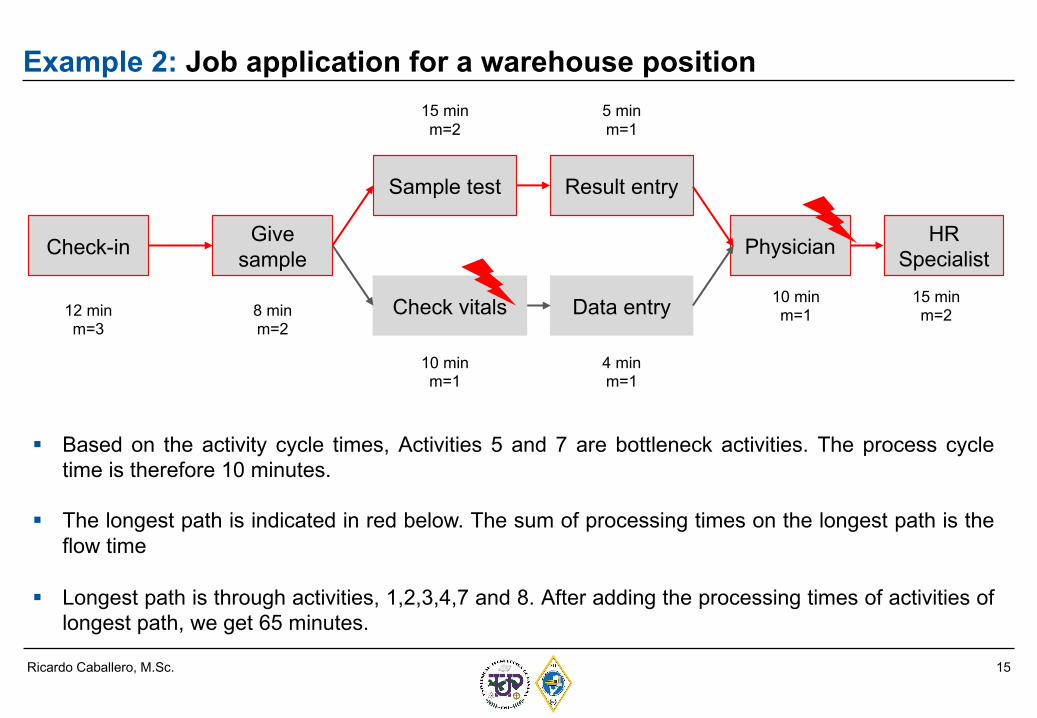
Activity 1 is followed by Activity 2 at which point there are two parallel sets of activities –activity 3 and 4 on one path, and activity 5 and 6 on the second path. The two paths mergeat activity 7 which is followed by activity 8.
12Ricardo Caballero, M.Sc.
Example 2: Job application for a warehouse position
Check-in Give sample
Sample test Result entry
Check vitals Data entry
Physician HR Specialist
12 minm=3
8 minm=2
15 minm=2
5 minm=1
10 minm=1
4 minm=1
10 minm=1
15 minm=2
13Ricardo Caballero, M.Sc.
Example 2: Job application for a warehouse position
Activity Activity Process Time (PT)
Stations (m)
Flow Rate = m/PT Cycle Time
1 12 3
2 8 2
3 15 2
4 5 1
5 10 1
6 4 1
7 10 1
8 15 2
14Ricardo Caballero, M.Sc.
Example 2: Job application for a warehouse position
Activity Activity Process Time (PT)
Stations (m)
Flow Rate = m/PT Cycle Time
1 12 3 3/12 = 0.25 4
2 8 2 2/8 = 0.25 4
3 15 2 2/15 = 0.133 7.5
4 5 1 1/5 = 0.2 5
5 10 1 1/10 = 0.1 10
6 4 1 1/4 = 0.25 4
7 10 1 1/10 = 0.1 10
8 15 2 2/15 = 0.133 7.5
15Ricardo Caballero, M.Sc.
Example 2: Job application for a warehouse position
Check-in Give sample
Sample test Result entry
Check vitals Data entry
Physician HR Specialist
12 minm=3
8 minm=2
15 minm=2
5 minm=1
10 minm=1
4 minm=1
10 minm=1
15 minm=2
§ Based on the activity cycle times, Activities 5 and 7 are bottleneck activities. The process cycletime is therefore 10 minutes.
§ The longest path is indicated in red below. The sum of processing times on the longest path is theflow time
§ Longest path is through activities, 1,2,3,4,7 and 8. After adding the processing times of activities oflongest path, we get 65 minutes.
16Ricardo Caballero, M.Sc.
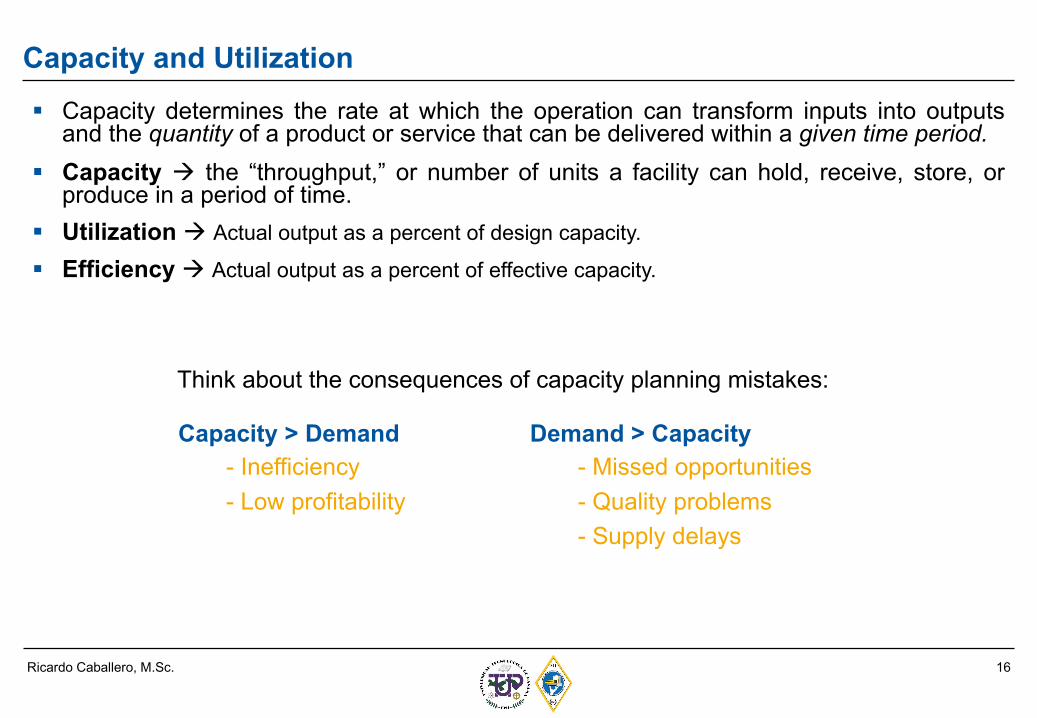
Capacity and Utilization§ Capacity determines the rate at which the operation can transform inputs into outputs
and the quantity of a product or service that can be delivered within a given time period.§ Capacity à the “throughput,” or number of units a facility can hold, receive, store, or
produce in a period of time.§ Utilization à Actual output as a percent of design capacity.
§ Efficiency à Actual output as a percent of effective capacity.
Demand > Capacity- Missed opportunities- Quality problems- Supply delays
Capacity > Demand- Inefficiency- Low profitability
Think about the consequences of capacity planning mistakes:
17Ricardo Caballero, M.Sc.
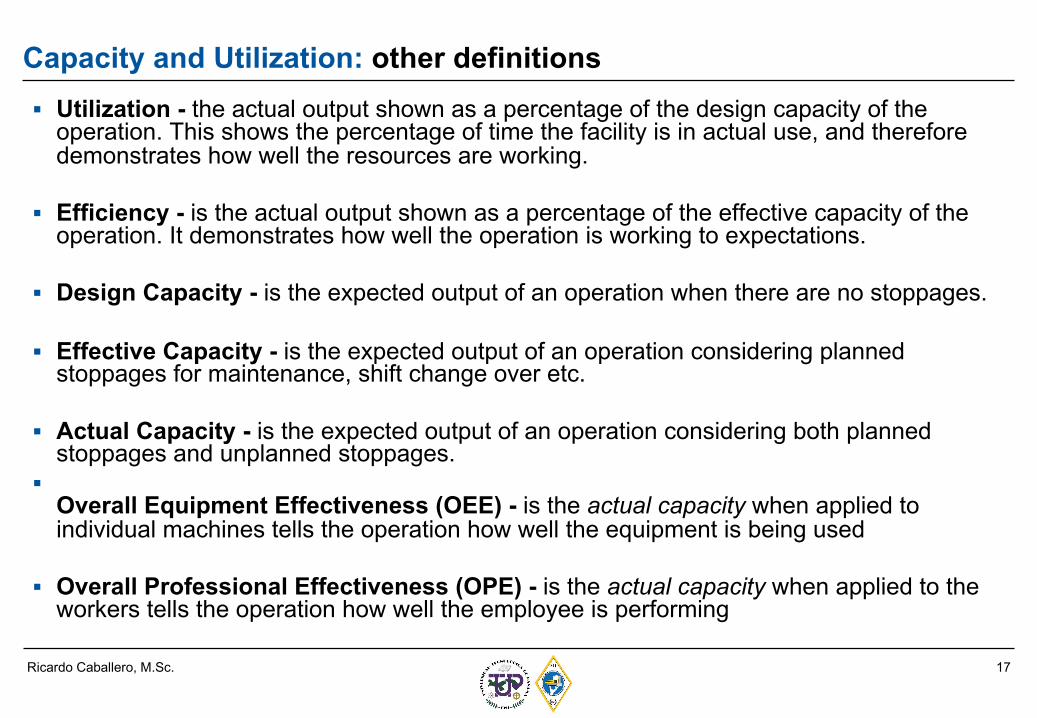
Capacity and Utilization: other definitions§ Utilization - the actual output shown as a percentage of the design capacity of the
operation. This shows the percentage of time the facility is in actual use, and therefore demonstrates how well the resources are working.
§ Efficiency - is the actual output shown as a percentage of the effective capacity of the operation. It demonstrates how well the operation is working to expectations.
§ Design Capacity - is the expected output of an operation when there are no stoppages.
§ Effective Capacity - is the expected output of an operation considering planned stoppages for maintenance, shift change over etc.
§ Actual Capacity - is the expected output of an operation considering both planned stoppages and unplanned stoppages.
§Overall Equipment Effectiveness (OEE) - is the actual capacity when applied to individual machines tells the operation how well the equipment is being used
§ Overall Professional Effectiveness (OPE) - is the actual capacity when applied to the workers tells the operation how well the employee is performing
18Ricardo Caballero, M.Sc.
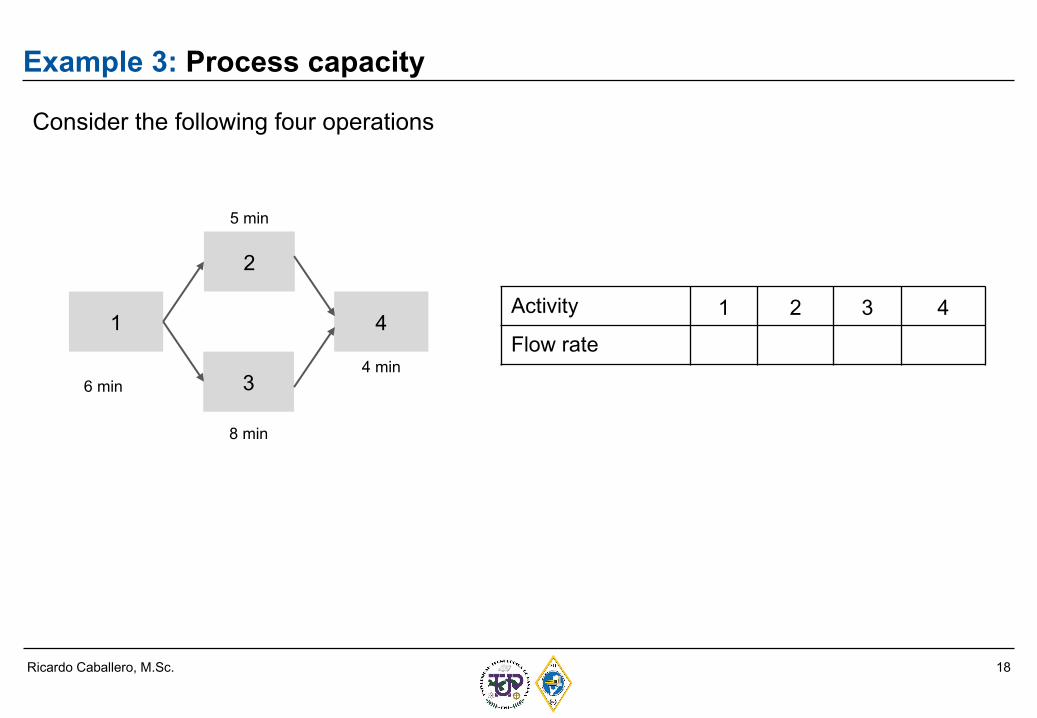
Example 3: Process capacity
Consider the following four operations
1
2
3
4
6 min
5 min
8 min
4 min
Activity 1 2 3 4
Flow rate
19Ricardo Caballero, M.Sc.
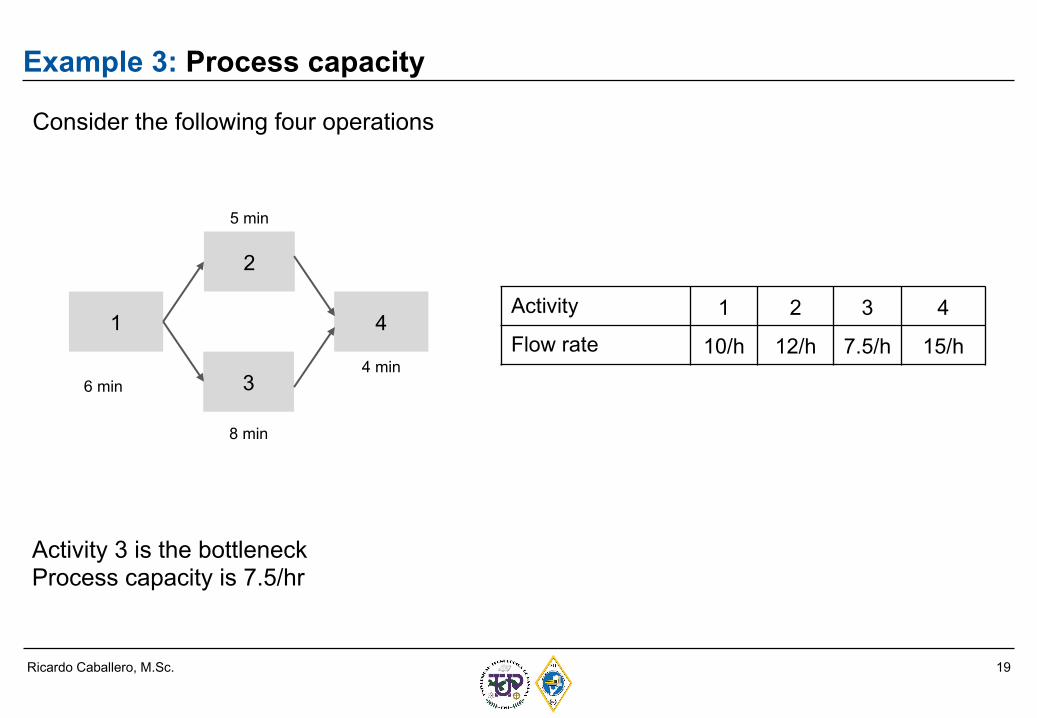
Example 3: Process capacity
Consider the following four operations
1
2
3
4
6 min
5 min
8 min
4 min
Activity 1 2 3 4
Flow rate 10/h 12/h 7.5/h 15/h
Activity 3 is the bottleneckProcess capacity is 7.5/hr
20Ricardo Caballero, M.Sc.
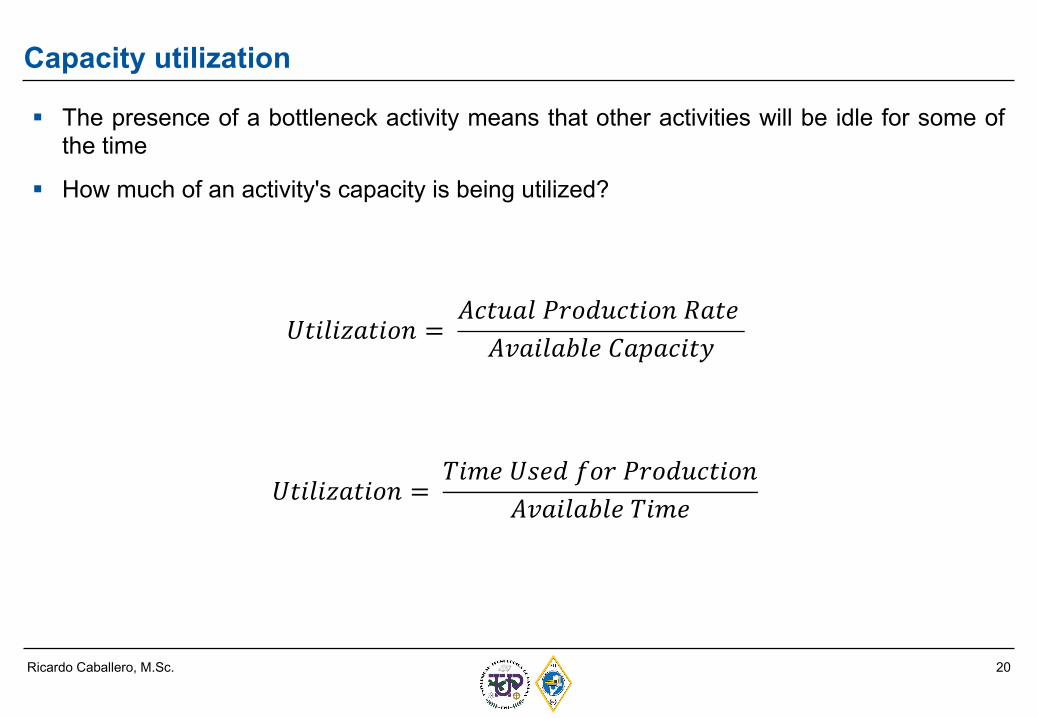
Capacity utilization
§ The presence of a bottleneck activity means that other activities will be idle for some ofthe time
§ How much of an activity's capacity is being utilized?
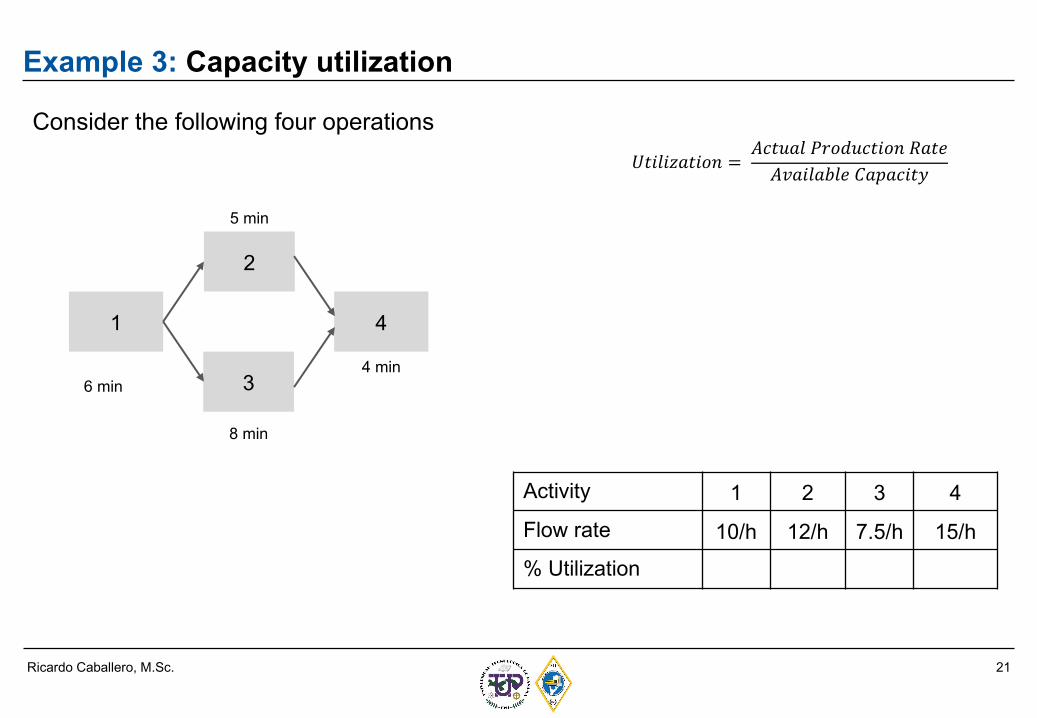
𝑈𝑡𝑖𝑙𝑖𝑧𝑎𝑡𝑖𝑜𝑛 =𝐴𝑐𝑡𝑢𝑎𝑙 𝑃𝑟𝑜𝑑𝑢𝑐𝑡𝑖𝑜𝑛 𝑅𝑎𝑡𝑒𝐴𝑣𝑎𝑖𝑙𝑎𝑏𝑙𝑒 𝐶𝑎𝑝𝑎𝑐𝑖𝑡𝑦
𝑈𝑡𝑖𝑙𝑖𝑧𝑎𝑡𝑖𝑜𝑛 =𝑇𝑖𝑚𝑒 𝑈𝑠𝑒𝑑 𝑓𝑜𝑟 𝑃𝑟𝑜𝑑𝑢𝑐𝑡𝑖𝑜𝑛
𝐴𝑣𝑎𝑖𝑙𝑎𝑏𝑙𝑒 𝑇𝑖𝑚𝑒
21Ricardo Caballero, M.Sc.
Example 3: Capacity utilization
Consider the following four operations
1
2
3
4
6 min
5 min
8 min
4 min
Activity 1 2 3 4
Flow rate 10/h 12/h 7.5/h 15/h
% Utilization
𝑈𝑡𝑖𝑙𝑖𝑧𝑎𝑡𝑖𝑜𝑛 =𝐴𝑐𝑡𝑢𝑎𝑙 𝑃𝑟𝑜𝑑𝑢𝑐𝑡𝑖𝑜𝑛 𝑅𝑎𝑡𝑒𝐴𝑣𝑎𝑖𝑙𝑎𝑏𝑙𝑒 𝐶𝑎𝑝𝑎𝑐𝑖𝑡𝑦
22Ricardo Caballero, M.Sc.
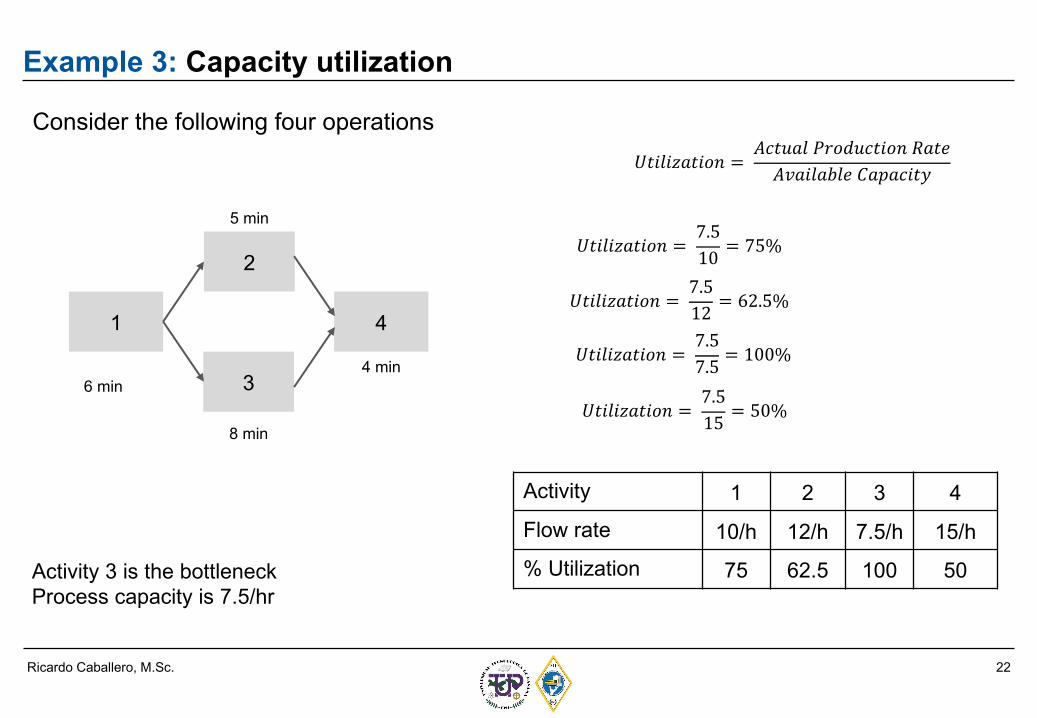
Example 3: Capacity utilization
Consider the following four operations
1
2
3
4
6 min
5 min
8 min
4 min
Activity 1 2 3 4
Flow rate 10/h 12/h 7.5/h 15/h
% Utilization 75 62.5 100 50
𝑈𝑡𝑖𝑙𝑖𝑧𝑎𝑡𝑖𝑜𝑛 =𝐴𝑐𝑡𝑢𝑎𝑙 𝑃𝑟𝑜𝑑𝑢𝑐𝑡𝑖𝑜𝑛 𝑅𝑎𝑡𝑒𝐴𝑣𝑎𝑖𝑙𝑎𝑏𝑙𝑒 𝐶𝑎𝑝𝑎𝑐𝑖𝑡𝑦
𝑈𝑡𝑖𝑙𝑖𝑧𝑎𝑡𝑖𝑜𝑛 =7.510
= 75%
Activity 3 is the bottleneckProcess capacity is 7.5/hr
𝑈𝑡𝑖𝑙𝑖𝑧𝑎𝑡𝑖𝑜𝑛 =7.512
= 62.5%
𝑈𝑡𝑖𝑙𝑖𝑧𝑎𝑡𝑖𝑜𝑛 =7.57.5
= 100%
𝑈𝑡𝑖𝑙𝑖𝑧𝑎𝑡𝑖𝑜𝑛 =7.515
= 50%
23Ricardo Caballero, M.Sc.
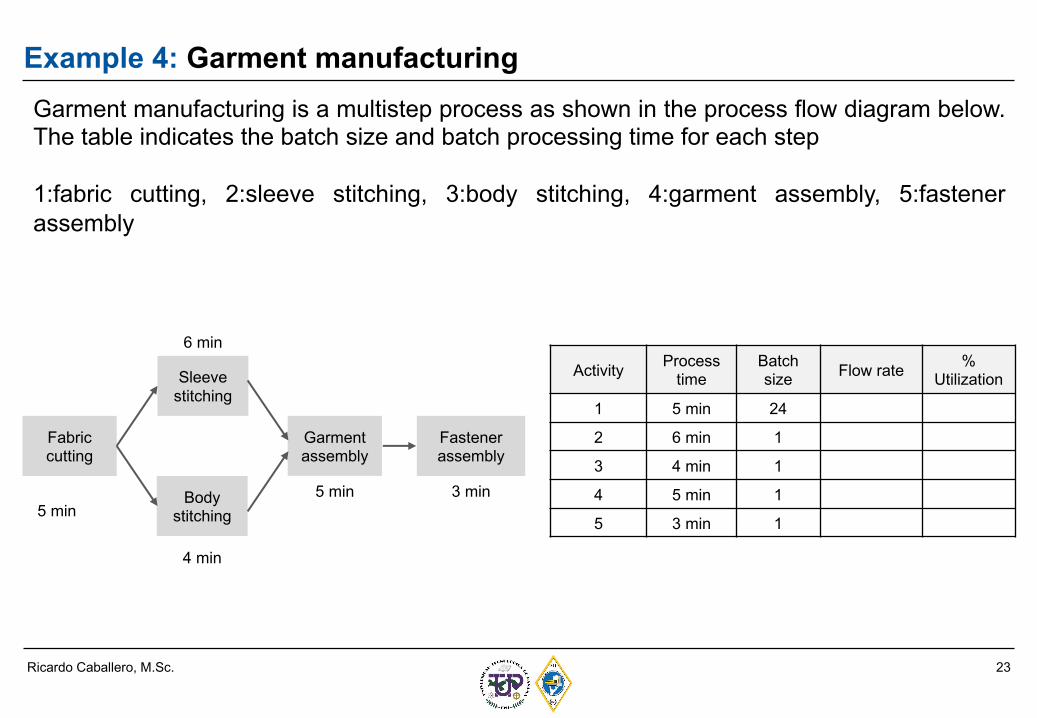
Example 4: Garment manufacturingGarment manufacturing is a multistep process as shown in the process flow diagram below.The table indicates the batch size and batch processing time for each step
1:fabric cutting, 2:sleeve stitching, 3:body stitching, 4:garment assembly, 5:fastenerassembly
Fabric cutting
Sleeve stitching
Body stitching
Garment assembly
5 min
6 min
4 min
5 min
Fastener assembly
3 min
Activity Process time
Batch size Flow rate %
Utilization
1 5 min 24
2 6 min 1
3 4 min 1
4 5 min 1
5 3 min 1
24Ricardo Caballero, M.Sc.
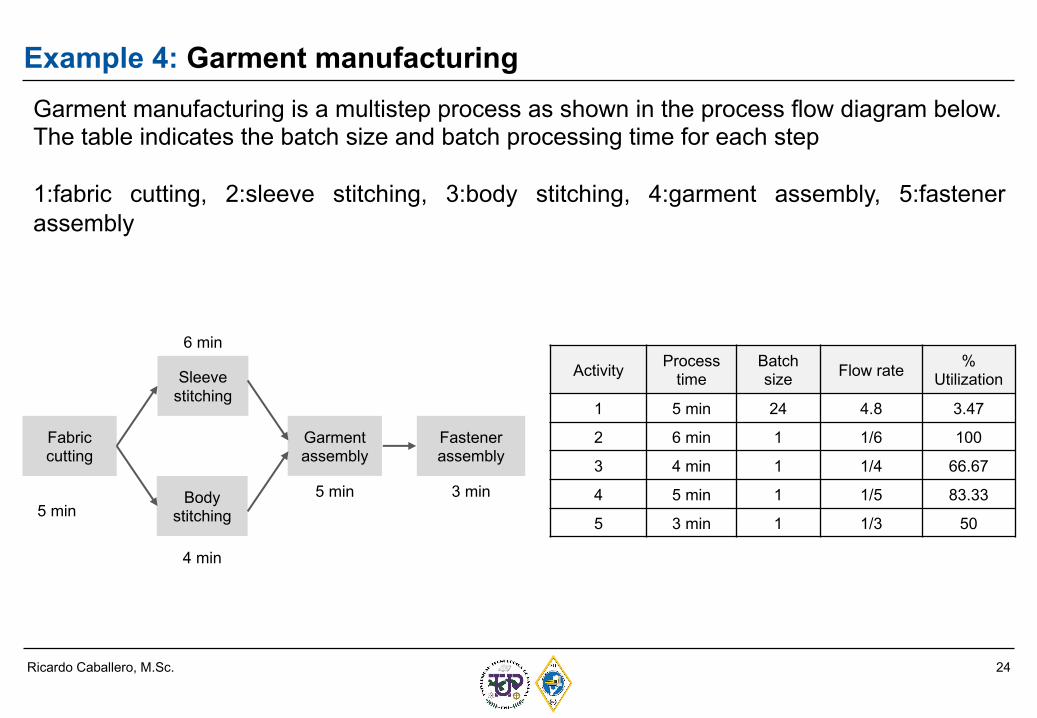
Example 4: Garment manufacturingGarment manufacturing is a multistep process as shown in the process flow diagram below. The table indicates the batch size and batch processing time for each step
1:fabric cutting, 2:sleeve stitching, 3:body stitching, 4:garment assembly, 5:fastenerassembly
Fabric cutting
Sleeve stitching
Body stitching
Garment assembly
5 min
6 min
4 min
5 min
Fastener assembly
3 min
Activity Process time
Batch size Flow rate %
Utilization
1 5 min 24 4.8 3.47
2 6 min 1 1/6 100
3 4 min 1 1/4 66.67
4 5 min 1 1/5 83.33
5 3 min 1 1/3 50
25Ricardo Caballero, M.Sc.
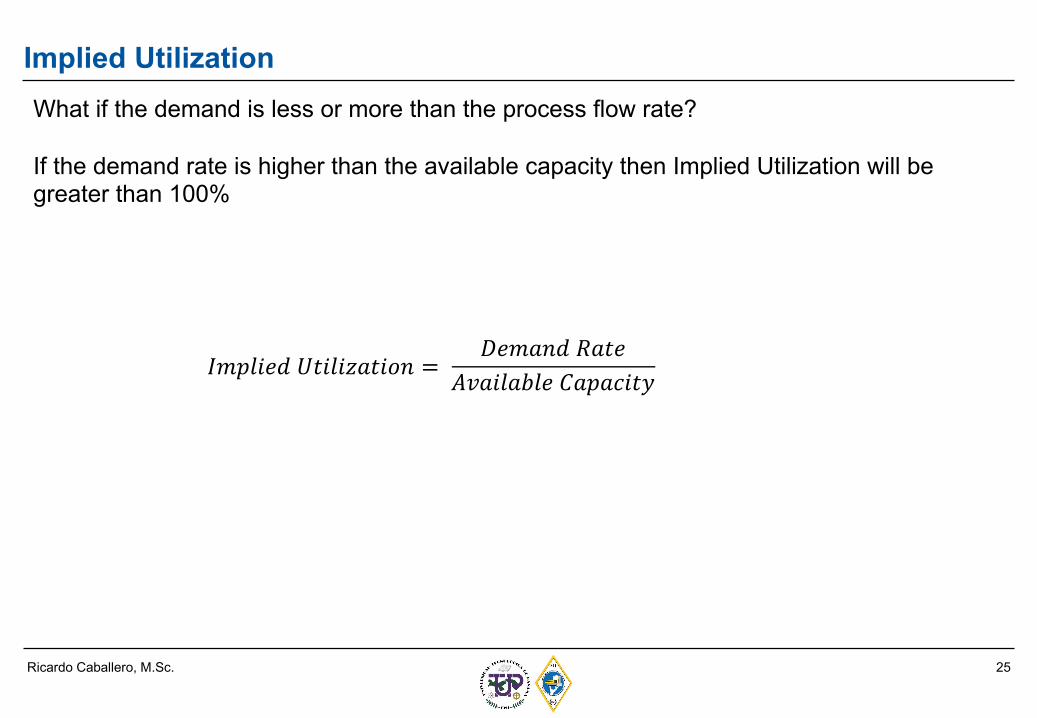
Implied UtilizationWhat if the demand is less or more than the process flow rate?
If the demand rate is higher than the available capacity then Implied Utilization will be greater than 100%
𝐼𝑚𝑝𝑙𝑖𝑒𝑑 𝑈𝑡𝑖𝑙𝑖𝑧𝑎𝑡𝑖𝑜𝑛 =𝐷𝑒𝑚𝑎𝑛𝑑 𝑅𝑎𝑡𝑒
𝐴𝑣𝑎𝑖𝑙𝑎𝑏𝑙𝑒 𝐶𝑎𝑝𝑎𝑐𝑖𝑡𝑦
26Ricardo Caballero, M.Sc.
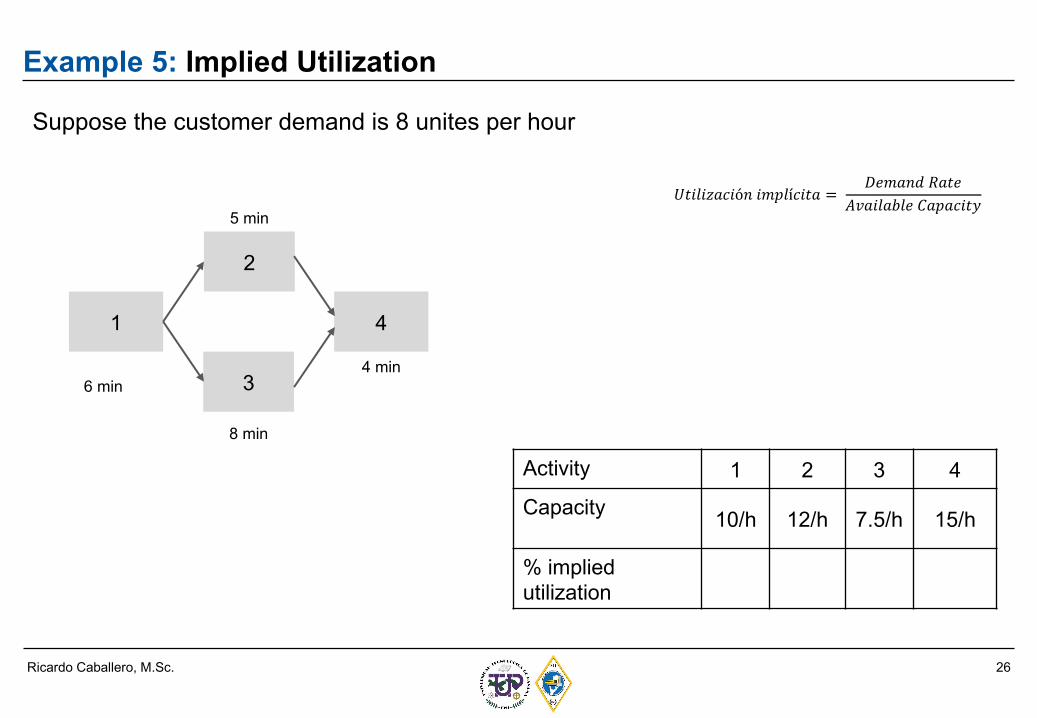
Example 5: Implied Utilization
Suppose the customer demand is 8 unites per hour
1
2
3
4
6 min
5 min
8 min
4 min
Activity 1 2 3 4
Capacity 10/h 12/h 7.5/h 15/h
% implied utilization
𝑈𝑡𝑖𝑙𝑖𝑧𝑎𝑐𝑖ó𝑛 𝑖𝑚𝑝𝑙í𝑐𝑖𝑡𝑎 =𝐷𝑒𝑚𝑎𝑛𝑑 𝑅𝑎𝑡𝑒
𝐴𝑣𝑎𝑖𝑙𝑎𝑏𝑙𝑒 𝐶𝑎𝑝𝑎𝑐𝑖𝑡𝑦
27Ricardo Caballero, M.Sc.
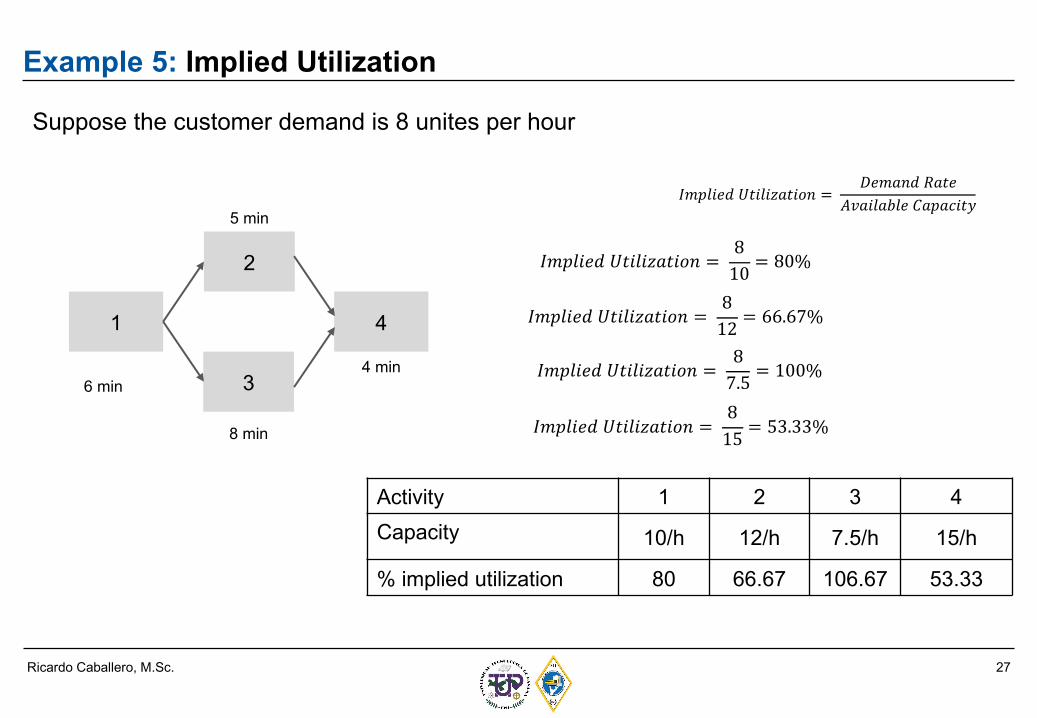
Example 5: Implied Utilization
Suppose the customer demand is 8 unites per hour
1
2
3
4
6 min
5 min
8 min
4 min
Activity 1 2 3 4Capacity 10/h 12/h 7.5/h 15/h
% implied utilization 80 66.67 106.67 53.33
𝐼𝑚𝑝𝑙𝑖𝑒𝑑 𝑈𝑡𝑖𝑙𝑖𝑧𝑎𝑡𝑖𝑜𝑛 =𝐷𝑒𝑚𝑎𝑛𝑑 𝑅𝑎𝑡𝑒
𝐴𝑣𝑎𝑖𝑙𝑎𝑏𝑙𝑒 𝐶𝑎𝑝𝑎𝑐𝑖𝑡𝑦
𝐼𝑚𝑝𝑙𝑖𝑒𝑑 𝑈𝑡𝑖𝑙𝑖𝑧𝑎𝑡𝑖𝑜𝑛 =810
= 80%
𝐼𝑚𝑝𝑙𝑖𝑒𝑑 𝑈𝑡𝑖𝑙𝑖𝑧𝑎𝑡𝑖𝑜𝑛 =812
= 66.67%
𝐼𝑚𝑝𝑙𝑖𝑒𝑑 𝑈𝑡𝑖𝑙𝑖𝑧𝑎𝑡𝑖𝑜𝑛 =87.5
= 100%
𝐼𝑚𝑝𝑙𝑖𝑒𝑑 𝑈𝑡𝑖𝑙𝑖𝑧𝑎𝑡𝑖𝑜𝑛 =815
= 53.33%
28Ricardo Caballero, M.Sc.
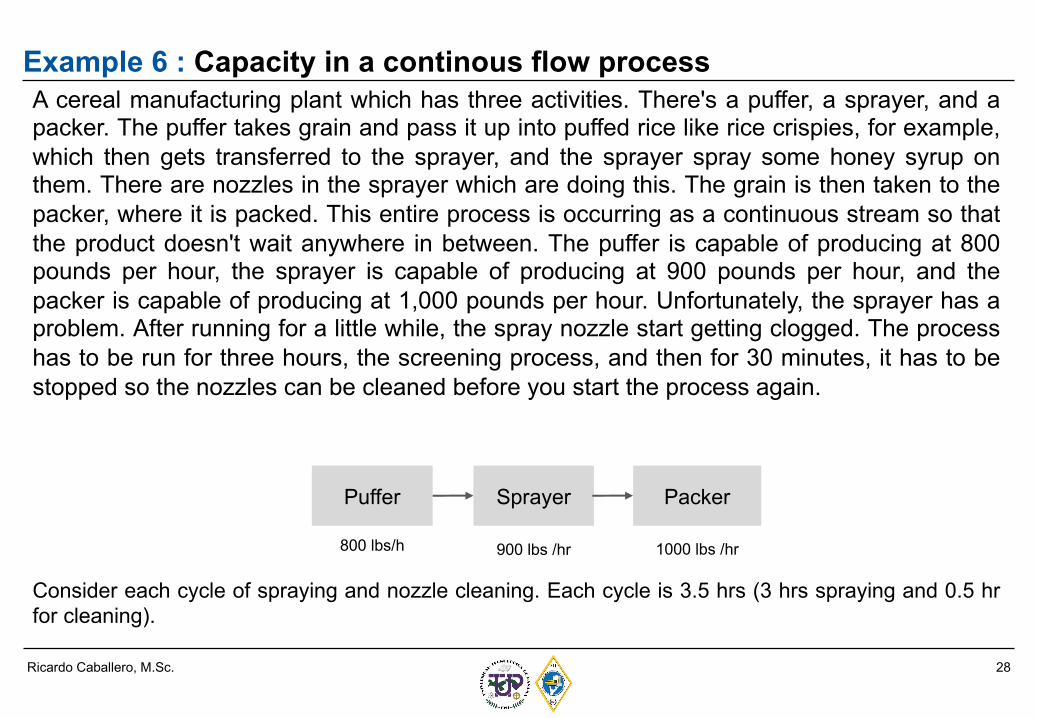
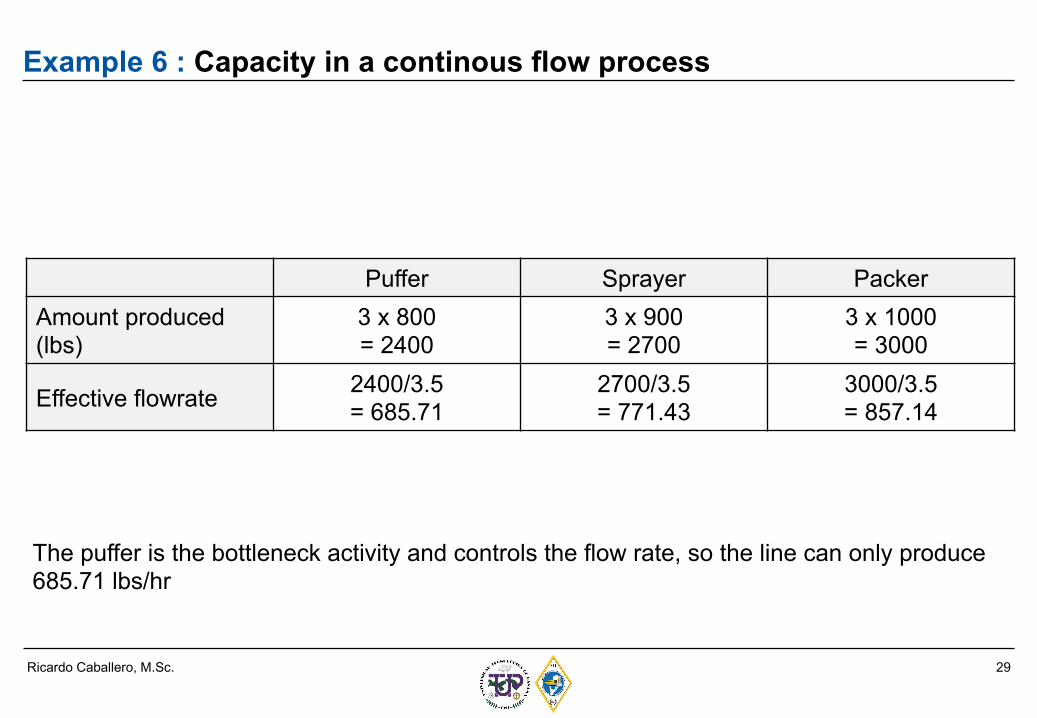
Example 6 : Capacity in a continous flow process
Puffer Sprayer Packer
800 lbs/h 900 lbs /hr 1000 lbs /hr
A cereal manufacturing plant which has three activities. There's a puffer, a sprayer, and apacker. The puffer takes grain and pass it up into puffed rice like rice crispies, for example,which then gets transferred to the sprayer, and the sprayer spray some honey syrup onthem. There are nozzles in the sprayer which are doing this. The grain is then taken to thepacker, where it is packed. This entire process is occurring as a continuous stream so thatthe product doesn't wait anywhere in between. The puffer is capable of producing at 800pounds per hour, the sprayer is capable of producing at 900 pounds per hour, and thepacker is capable of producing at 1,000 pounds per hour. Unfortunately, the sprayer has aproblem. After running for a little while, the spray nozzle start getting clogged. The processhas to be run for three hours, the screening process, and then for 30 minutes, it has to bestopped so the nozzles can be cleaned before you start the process again.
Consider each cycle of spraying and nozzle cleaning. Each cycle is 3.5 hrs (3 hrs spraying and 0.5 hrfor cleaning).
29Ricardo Caballero, M.Sc.
Example 6 : Capacity in a continous flow process
Puffer Sprayer PackerAmount produced (lbs)
3 x 800= 2400
3 x 900= 2700
3 x 1000= 3000
Effective flowrate 2400/3.5= 685.71
2700/3.5= 771.43
3000/3.5= 857.14
The puffer is the bottleneck activity and controls the flow rate, so the line can only produce 685.71 lbs/hr
30Ricardo Caballero, M.Sc.
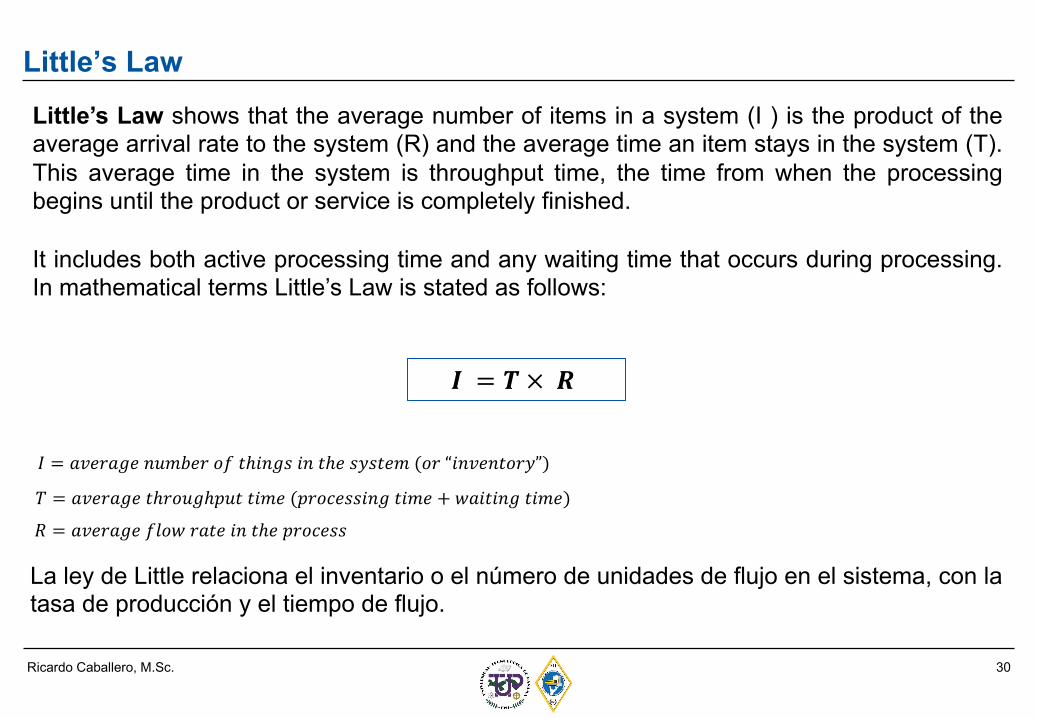
Little’s LawLittle’s Law shows that the average number of items in a system (I ) is the product of theaverage arrival rate to the system (R) and the average time an item stays in the system (T).This average time in the system is throughput time, the time from when the processingbegins until the product or service is completely finished.
It includes both active processing time and any waiting time that occurs during processing.In mathematical terms Little’s Law is stated as follows:
𝑰 = 𝑻 × 𝑹
La ley de Little relaciona el inventario o el número de unidades de flujo en el sistema, con latasa de producción y el tiempo de flujo.
𝐼 = 𝑎𝑣𝑒𝑟𝑎𝑔𝑒 𝑛𝑢𝑚𝑏𝑒𝑟 𝑜𝑓 𝑡ℎ𝑖𝑛𝑔𝑠 𝑖𝑛 𝑡ℎ𝑒 𝑠𝑦𝑠𝑡𝑒𝑚 (𝑜𝑟 “𝑖𝑛𝑣𝑒𝑛𝑡𝑜𝑟𝑦”)
𝑇 = 𝑎𝑣𝑒𝑟𝑎𝑔𝑒 𝑡ℎ𝑟𝑜𝑢𝑔ℎ𝑝𝑢𝑡 𝑡𝑖𝑚𝑒 (𝑝𝑟𝑜𝑐𝑒𝑠𝑠𝑖𝑛𝑔 𝑡𝑖𝑚𝑒 + 𝑤𝑎𝑖𝑡𝑖𝑛𝑔 𝑡𝑖𝑚𝑒)
𝑅 = 𝑎𝑣𝑒𝑟𝑎𝑔𝑒 𝑓𝑙𝑜𝑤 𝑟𝑎𝑡𝑒 𝑖𝑛 𝑡ℎ𝑒 𝑝𝑟𝑜𝑐𝑒𝑠𝑠
31Ricardo Caballero, M.Sc.
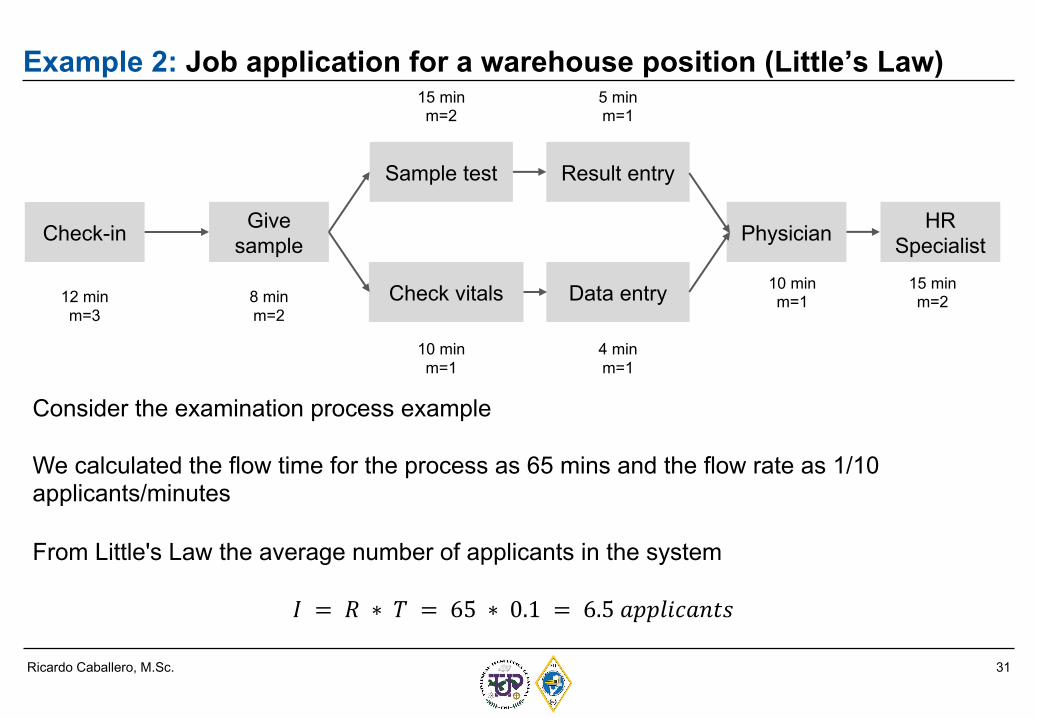
Example 2: Job application for a warehouse position (Little’s Law)
Check-in Give sample
Sample test Result entry
Check vitals Data entry
Physician HR Specialist
12 minm=3
8 minm=2
15 minm=2
5 minm=1
10 minm=1
4 minm=1
10 minm=1
15 minm=2
Consider the examination process example
We calculated the flow time for the process as 65 mins and the flow rate as 1/10 applicants/minutes
From Little's Law the average number of applicants in the system
𝐼 = 𝑅 ∗ 𝑇 = 65 ∗ 0.1 = 6.5 𝑎𝑝𝑝𝑙𝑖𝑐𝑎𝑛𝑡𝑠
32Ricardo Caballero, M.Sc.
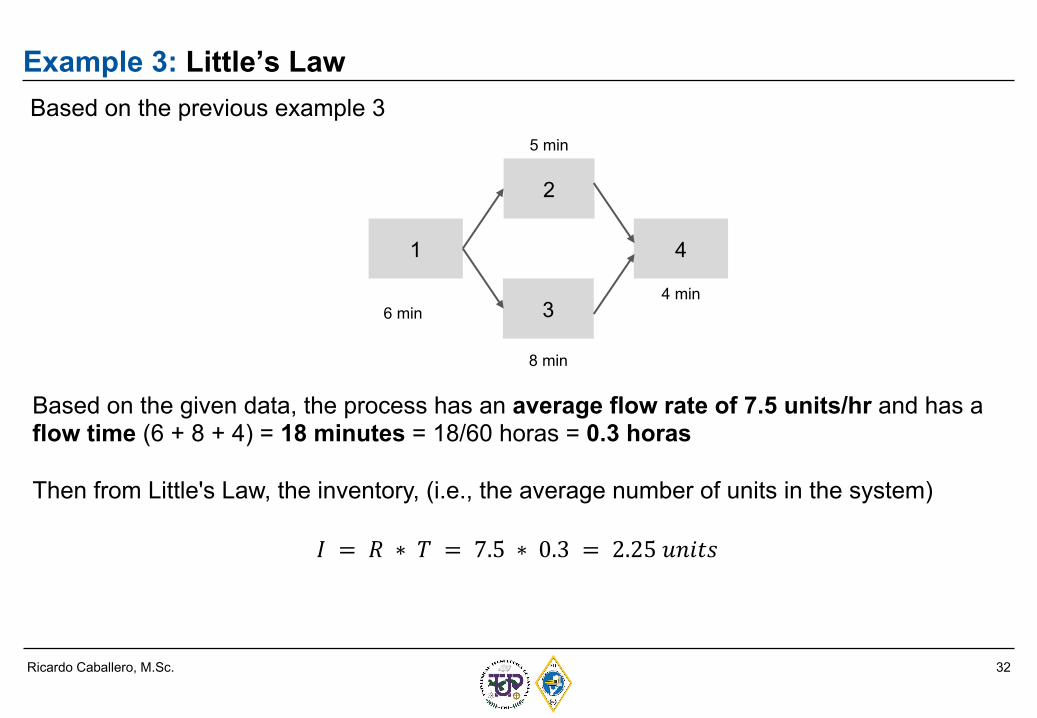
Example 3: Little’s LawBased on the previous example 3
1
2
3
4
6 min
5 min
8 min
4 min
Based on the given data, the process has an average flow rate of 7.5 units/hr and has a flow time (6 + 8 + 4) = 18 minutes = 18/60 horas = 0.3 horas
Then from Little's Law, the inventory, (i.e., the average number of units in the system)
𝐼 = 𝑅 ∗ 𝑇 = 7.5 ∗ 0.3 = 2.25 𝑢𝑛𝑖𝑡𝑠
33Ricardo Caballero, M.Sc.
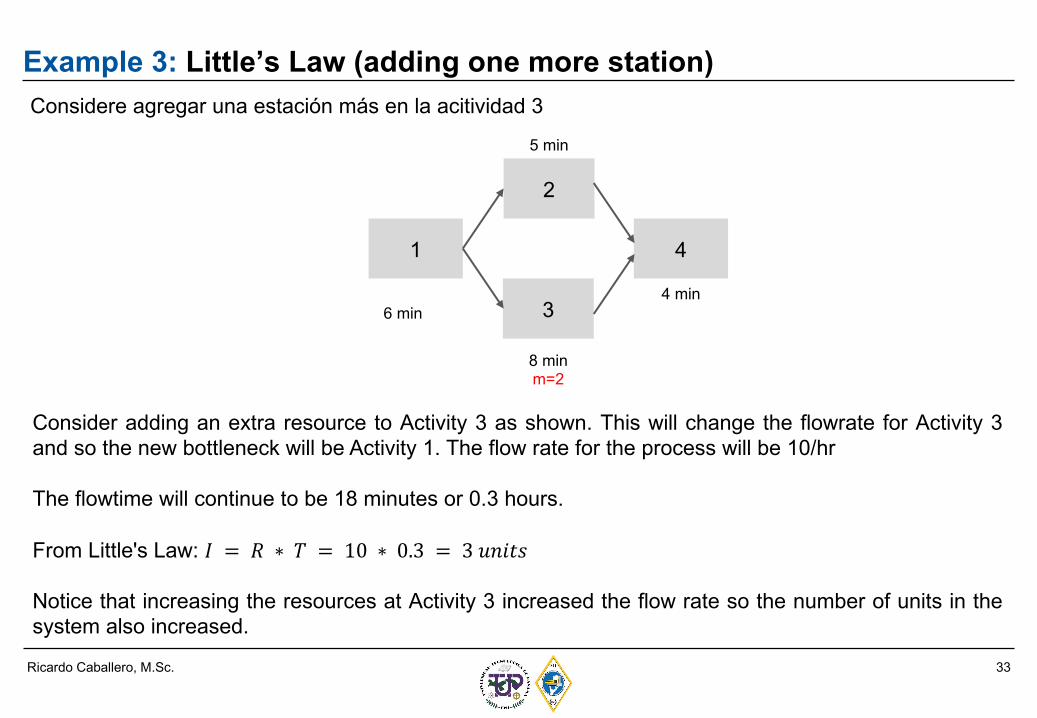
Example 3: Little’s Law (adding one more station)Considere agregar una estación más en la acitividad 3
1
2
3
4
6 min
5 min
8 minm=2
4 min
Consider adding an extra resource to Activity 3 as shown. This will change the flowrate for Activity 3and so the new bottleneck will be Activity 1. The flow rate for the process will be 10/hr
The flowtime will continue to be 18 minutes or 0.3 hours.
From Little's Law: 𝐼 = 𝑅 ∗ 𝑇 = 10 ∗ 0.3 = 3 𝑢𝑛𝑖𝑡𝑠
Notice that increasing the resources at Activity 3 increased the flow rate so the number of units in thesystem also increased.
34Ricardo Caballero, M.Sc.
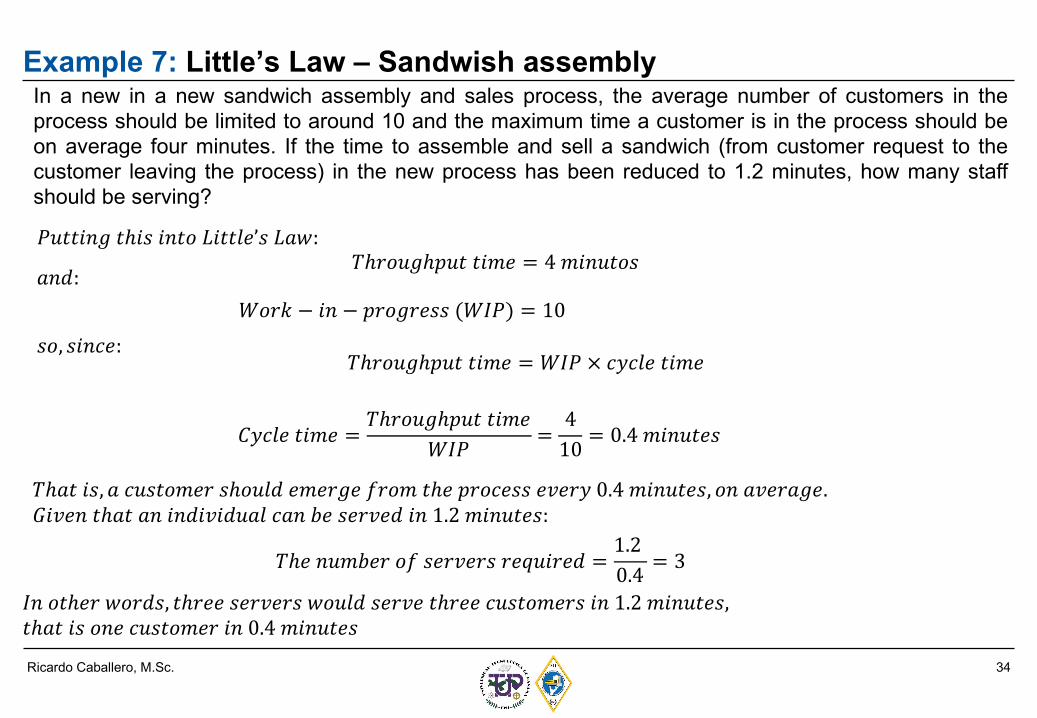
Example 7: Little’s Law – Sandwish assemblyIn a new in a new sandwich assembly and sales process, the average number of customers in theprocess should be limited to around 10 and the maximum time a customer is in the process should beon average four minutes. If the time to assemble and sell a sandwich (from customer request to thecustomer leaving the process) in the new process has been reduced to 1.2 minutes, how many staffshould be serving?
𝑃𝑢𝑡𝑡𝑖𝑛𝑔 𝑡ℎ𝑖𝑠 𝑖𝑛𝑡𝑜 𝐿𝑖𝑡𝑡𝑙𝑒’𝑠 𝐿𝑎𝑤:𝑇ℎ𝑟𝑜𝑢𝑔ℎ𝑝𝑢𝑡 𝑡𝑖𝑚𝑒 = 4 𝑚𝑖𝑛𝑢𝑡𝑜𝑠
𝑊𝑜𝑟𝑘 − 𝑖𝑛 − 𝑝𝑟𝑜𝑔𝑟𝑒𝑠𝑠 (𝑊𝐼𝑃) = 10𝑎𝑛𝑑:
𝑠𝑜, 𝑠𝑖𝑛𝑐𝑒:𝑇ℎ𝑟𝑜𝑢𝑔ℎ𝑝𝑢𝑡 𝑡𝑖𝑚𝑒 = 𝑊𝐼𝑃 × 𝑐𝑦𝑐𝑙𝑒 𝑡𝑖𝑚𝑒
𝐶𝑦𝑐𝑙𝑒 𝑡𝑖𝑚𝑒 =𝑇ℎ𝑟𝑜𝑢𝑔ℎ𝑝𝑢𝑡 𝑡𝑖𝑚𝑒
𝑊𝐼𝑃=410
= 0.4 𝑚𝑖𝑛𝑢𝑡𝑒𝑠
𝑇ℎ𝑎𝑡 𝑖𝑠, 𝑎 𝑐𝑢𝑠𝑡𝑜𝑚𝑒𝑟 𝑠ℎ𝑜𝑢𝑙𝑑 𝑒𝑚𝑒𝑟𝑔𝑒 𝑓𝑟𝑜𝑚 𝑡ℎ𝑒 𝑝𝑟𝑜𝑐𝑒𝑠𝑠 𝑒𝑣𝑒𝑟𝑦 0.4 𝑚𝑖𝑛𝑢𝑡𝑒𝑠, 𝑜𝑛 𝑎𝑣𝑒𝑟𝑎𝑔𝑒.𝐺𝑖𝑣𝑒𝑛 𝑡ℎ𝑎𝑡 𝑎𝑛 𝑖𝑛𝑑𝑖𝑣𝑖𝑑𝑢𝑎𝑙 𝑐𝑎𝑛 𝑏𝑒 𝑠𝑒𝑟𝑣𝑒𝑑 𝑖𝑛 1.2 𝑚𝑖𝑛𝑢𝑡𝑒𝑠:
𝑇ℎ𝑒 𝑛𝑢𝑚𝑏𝑒𝑟 𝑜𝑓 𝑠𝑒𝑟𝑣𝑒𝑟𝑠 𝑟𝑒𝑞𝑢𝑖𝑟𝑒𝑑 =1.20.4 = 3
𝐼𝑛 𝑜𝑡ℎ𝑒𝑟 𝑤𝑜𝑟𝑑𝑠, 𝑡ℎ𝑟𝑒𝑒 𝑠𝑒𝑟𝑣𝑒𝑟𝑠 𝑤𝑜𝑢𝑙𝑑 𝑠𝑒𝑟𝑣𝑒 𝑡ℎ𝑟𝑒𝑒 𝑐𝑢𝑠𝑡𝑜𝑚𝑒𝑟𝑠 𝑖𝑛 1.2 𝑚𝑖𝑛𝑢𝑡𝑒𝑠,𝑡ℎ𝑎𝑡 𝑖𝑠 𝑜𝑛𝑒 𝑐𝑢𝑠𝑡𝑜𝑚𝑒𝑟 𝑖𝑛 0.4 𝑚𝑖𝑛𝑢𝑡𝑒𝑠
35Ricardo Caballero, M.Sc.
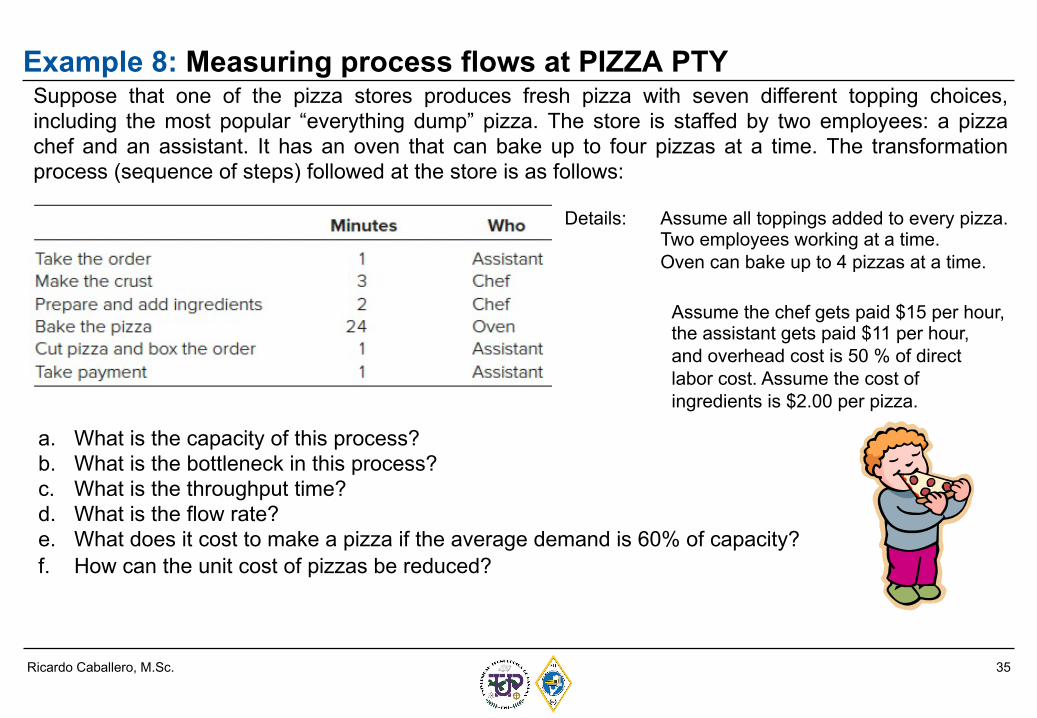
Example 8: Measuring process flows at PIZZA PTYSuppose that one of the pizza stores produces fresh pizza with seven different topping choices,including the most popular “everything dump” pizza. The store is staffed by two employees: a pizzachef and an assistant. It has an oven that can bake up to four pizzas at a time. The transformationprocess (sequence of steps) followed at the store is as follows:
a. What is the capacity of this process?b. What is the bottleneck in this process?c. What is the throughput time?d. What is the flow rate?e. What does it cost to make a pizza if the average demand is 60% of capacity?f. How can the unit cost of pizzas be reduced?
Details: Assume all toppings added to every pizza.Two employees working at a time.Oven can bake up to 4 pizzas at a time.
Assume the chef gets paid $15 per hour, the assistant gets paid $11 per hour, and overhead cost is 50 % of direct labor cost. Assume the cost of ingredients is $2.00 per pizza.
36Ricardo Caballero, M.Sc.
Example 8: Measuring process flows at PIZZA PTY
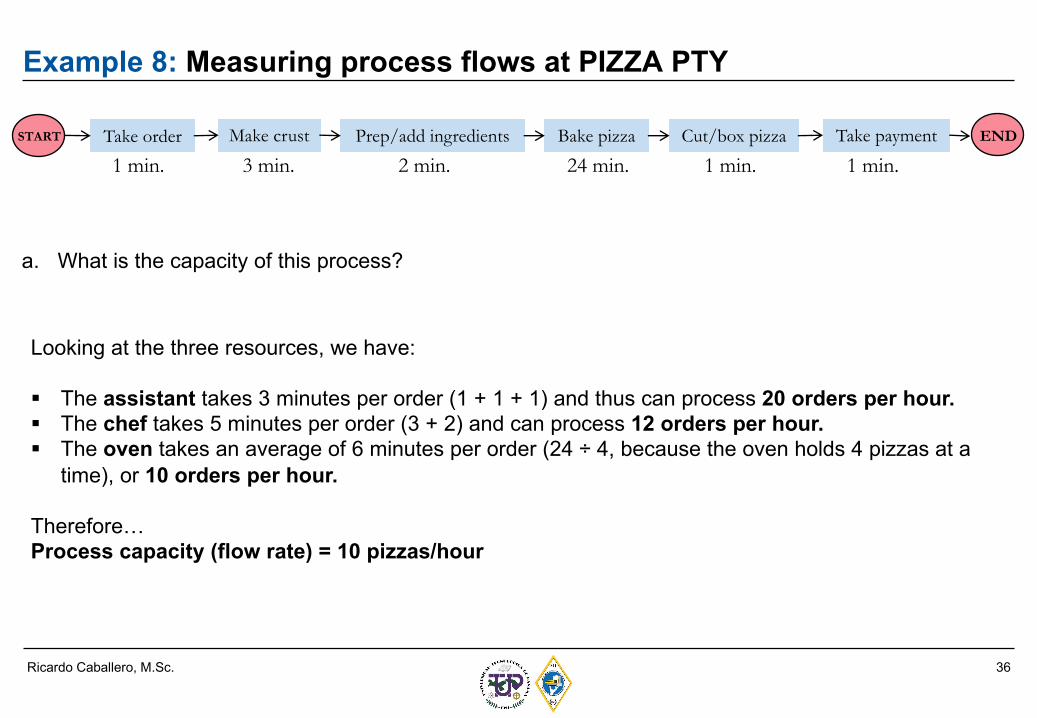
a. What is the capacity of this process?
Take order Make crust Prep/add ingredients Bake pizza Take paymentCut/box pizzaSTART END
1 min. 3 min. 2 min. 24 min. 1 min. 1 min.
Looking at the three resources, we have:
§ The assistant takes 3 minutes per order (1 + 1 + 1) and thus can process 20 orders per hour.§ The chef takes 5 minutes per order (3 + 2) and can process 12 orders per hour.§ The oven takes an average of 6 minutes per order (24 ÷ 4, because the oven holds 4 pizzas at a
time), or 10 orders per hour.
Therefore…Process capacity (flow rate) = 10 pizzas/hour
37Ricardo Caballero, M.Sc.
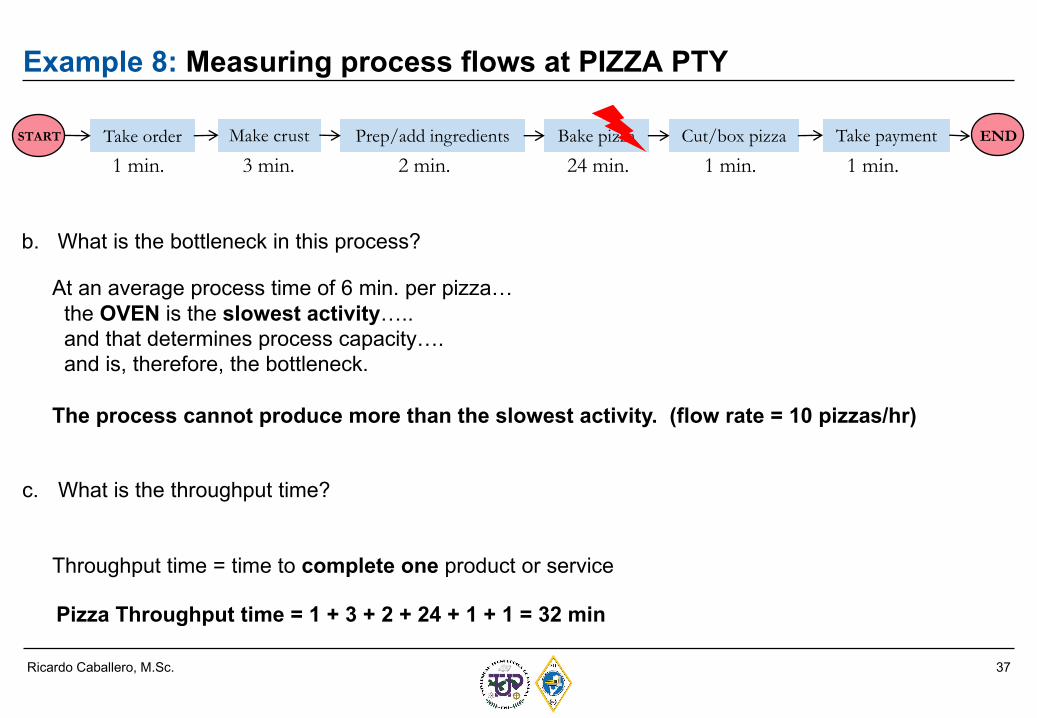
Example 8: Measuring process flows at PIZZA PTY
b. What is the bottleneck in this process?
Take order Make crust Prep/add ingredients Bake pizza Take paymentCut/box pizzaSTART END
1 min. 3 min. 2 min. 24 min. 1 min. 1 min.
At an average process time of 6 min. per pizza…the OVEN is the slowest activity….. and that determines process capacity….and is, therefore, the bottleneck.
The process cannot produce more than the slowest activity. (flow rate = 10 pizzas/hr)
c. What is the throughput time?
Throughput time = time to complete one product or service
Pizza Throughput time = 1 + 3 + 2 + 24 + 1 + 1 = 32 min
38Ricardo Caballero, M.Sc.
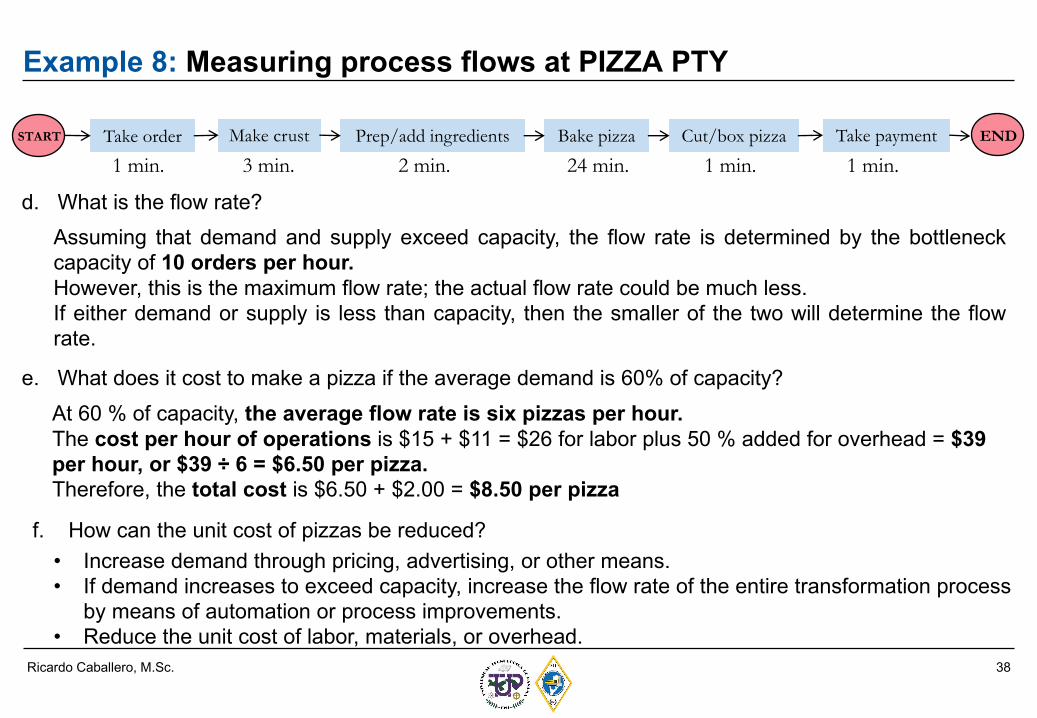
Example 8: Measuring process flows at PIZZA PTY
d. What is the flow rate?
Take order Make crust Prep/add ingredients Bake pizza Take paymentCut/box pizzaSTART END
1 min. 3 min. 2 min. 24 min. 1 min. 1 min.
Assuming that demand and supply exceed capacity, the flow rate is determined by the bottleneckcapacity of 10 orders per hour.However, this is the maximum flow rate; the actual flow rate could be much less.If either demand or supply is less than capacity, then the smaller of the two will determine the flowrate.
e. What does it cost to make a pizza if the average demand is 60% of capacity?At 60 % of capacity, the average flow rate is six pizzas per hour. The cost per hour of operations is $15 + $11 = $26 for labor plus 50 % added for overhead = $39 per hour, or $39 ÷ 6 = $6.50 per pizza. Therefore, the total cost is $6.50 + $2.00 = $8.50 per pizza
f. How can the unit cost of pizzas be reduced?• Increase demand through pricing, advertising, or other means.• If demand increases to exceed capacity, increase the flow rate of the entire transformation process
by means of automation or process improvements.• Reduce the unit cost of labor, materials, or overhead.
39Ricardo Caballero, M.Sc.
Example 9: Throughput efficiency of the processA vehicle licensing centre receives application documents, keys in details, checks theinformation provided on the application, classifies the application according to the type oflicence required, confirms payment and then issues and mails the licence. It is currentlyprocessing an average of 5,000 licences for eight hours every day. A recent spot checkfound 15,000 applications that were ‘in progress’ or waiting to be processed. The sum of allactivities that are required to process an application is 25 minutes.
What is the throughput efficiency of the process?
40Ricardo Caballero, M.Sc.
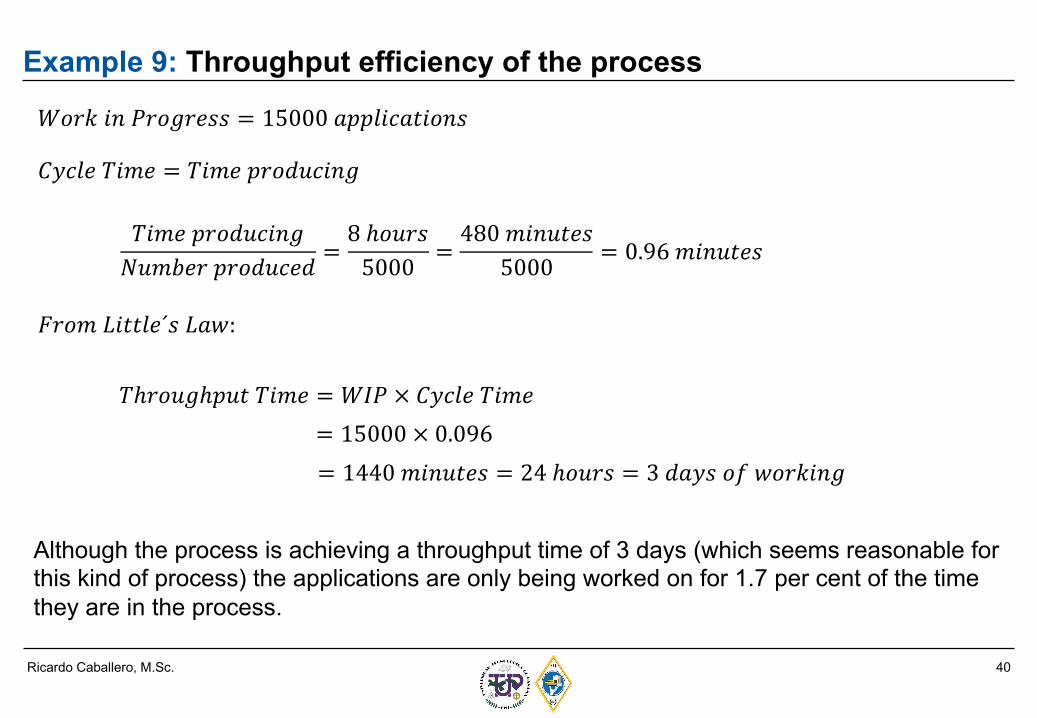
Example 9: Throughput efficiency of the process
Although the process is achieving a throughput time of 3 days (which seems reasonable for this kind of process) the applications are only being worked on for 1.7 per cent of the time they are in the process.
𝑊𝑜𝑟𝑘 𝑖𝑛 𝑃𝑟𝑜𝑔𝑟𝑒𝑠𝑠 = 15000 𝑎𝑝𝑝𝑙𝑖𝑐𝑎𝑡𝑖𝑜𝑛𝑠
𝐶𝑦𝑐𝑙𝑒 𝑇𝑖𝑚𝑒 = 𝑇𝑖𝑚𝑒 𝑝𝑟𝑜𝑑𝑢𝑐𝑖𝑛𝑔
𝑇𝑖𝑚𝑒 𝑝𝑟𝑜𝑑𝑢𝑐𝑖𝑛𝑔𝑁𝑢𝑚𝑏𝑒𝑟 𝑝𝑟𝑜𝑑𝑢𝑐𝑒𝑑 =
8 ℎ𝑜𝑢𝑟𝑠5000 =
480 𝑚𝑖𝑛𝑢𝑡𝑒𝑠5000 = 0.96 𝑚𝑖𝑛𝑢𝑡𝑒𝑠
𝐹𝑟𝑜𝑚 𝐿𝑖𝑡𝑡𝑙𝑒´𝑠 𝐿𝑎𝑤:
𝑇ℎ𝑟𝑜𝑢𝑔ℎ𝑝𝑢𝑡 𝑇𝑖𝑚𝑒 = 𝑊𝐼𝑃 × 𝐶𝑦𝑐𝑙𝑒 𝑇𝑖𝑚𝑒= 15000 × 0.096= 1440 𝑚𝑖𝑛𝑢𝑡𝑒𝑠 = 24 ℎ𝑜𝑢𝑟𝑠 = 3 𝑑𝑎𝑦𝑠 𝑜𝑓 𝑤𝑜𝑟𝑘𝑖𝑛𝑔
41Ricardo Caballero, M.Sc.
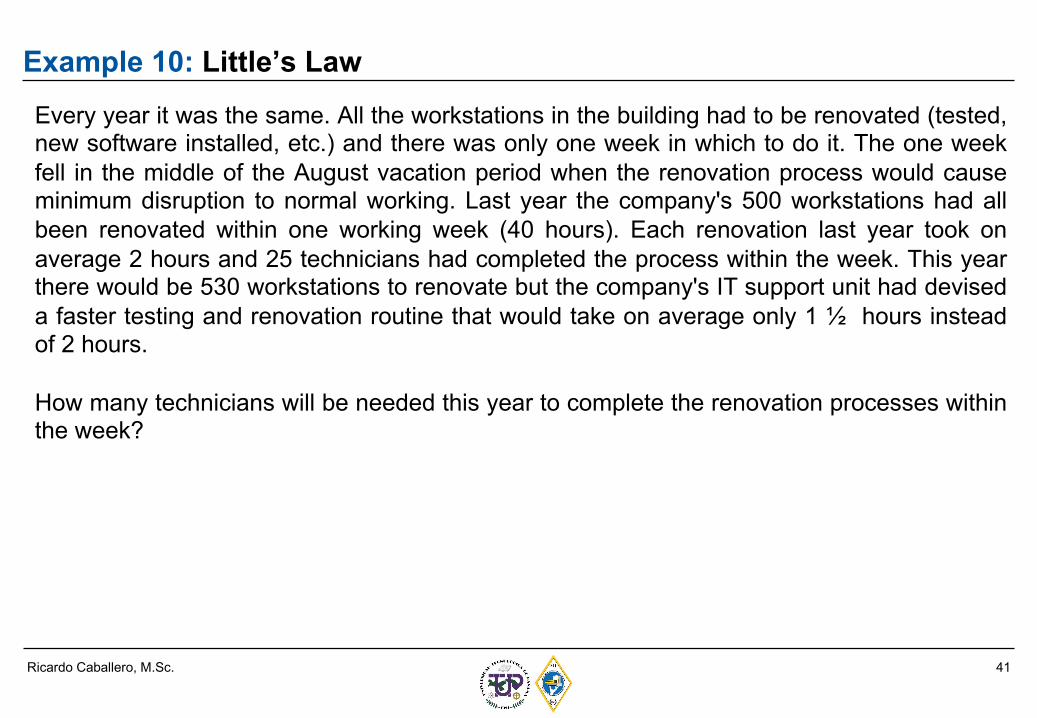
Example 10: Little’s LawEvery year it was the same. All the workstations in the building had to be renovated (tested,new software installed, etc.) and there was only one week in which to do it. The one weekfell in the middle of the August vacation period when the renovation process would causeminimum disruption to normal working. Last year the company's 500 workstations had allbeen renovated within one working week (40 hours). Each renovation last year took onaverage 2 hours and 25 technicians had completed the process within the week. This yearthere would be 530 workstations to renovate but the company's IT support unit had deviseda faster testing and renovation routine that would take on average only 1 ½ hours insteadof 2 hours.
How many technicians will be needed this year to complete the renovation processes withinthe week?
42Ricardo Caballero, M.Sc.
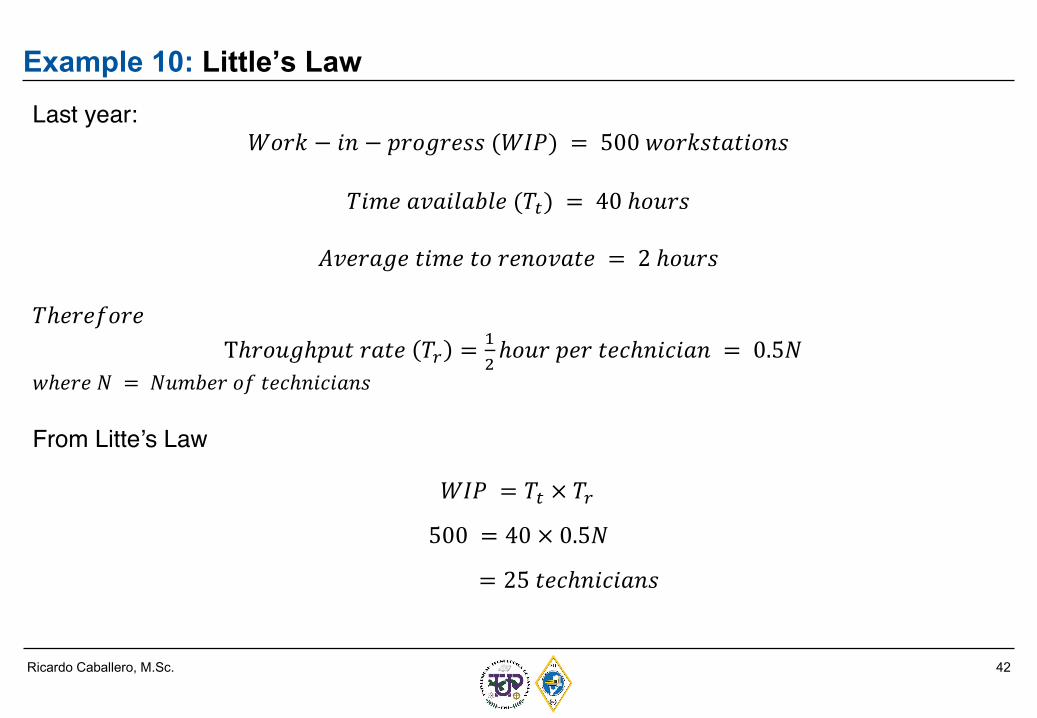
Example 10: Little’s LawLast year:
𝑊𝑜𝑟𝑘 − 𝑖𝑛 − 𝑝𝑟𝑜𝑔𝑟𝑒𝑠𝑠 (𝑊𝐼𝑃) = 500 𝑤𝑜𝑟𝑘𝑠𝑡𝑎𝑡𝑖𝑜𝑛𝑠
𝑇𝑖𝑚𝑒 𝑎𝑣𝑎𝑖𝑙𝑎𝑏𝑙𝑒 (𝑇!) = 40 ℎ𝑜𝑢𝑟𝑠
𝐴𝑣𝑒𝑟𝑎𝑔𝑒 𝑡𝑖𝑚𝑒 𝑡𝑜 𝑟𝑒𝑛𝑜𝑣𝑎𝑡𝑒 = 2 ℎ𝑜𝑢𝑟𝑠
𝑇ℎ𝑒𝑟𝑒𝑓𝑜𝑟𝑒Tℎ𝑟𝑜𝑢𝑔ℎ𝑝𝑢𝑡 𝑟𝑎𝑡𝑒 𝑇" = #
$ℎ𝑜𝑢𝑟 𝑝𝑒𝑟 𝑡𝑒𝑐ℎ𝑛𝑖𝑐𝑖𝑎𝑛 = 0.5𝑁
𝑤ℎ𝑒𝑟𝑒 𝑁 = 𝑁𝑢𝑚𝑏𝑒𝑟 𝑜𝑓 𝑡𝑒𝑐ℎ𝑛𝑖𝑐𝑖𝑎𝑛𝑠
From Litte’s Law
𝑊𝐼𝑃 = 𝑇! × 𝑇"500 = 40 × 0.5𝑁
= 25 𝑡𝑒𝑐ℎ𝑛𝑖𝑐𝑖𝑎𝑛𝑠
43Ricardo Caballero, M.Sc.
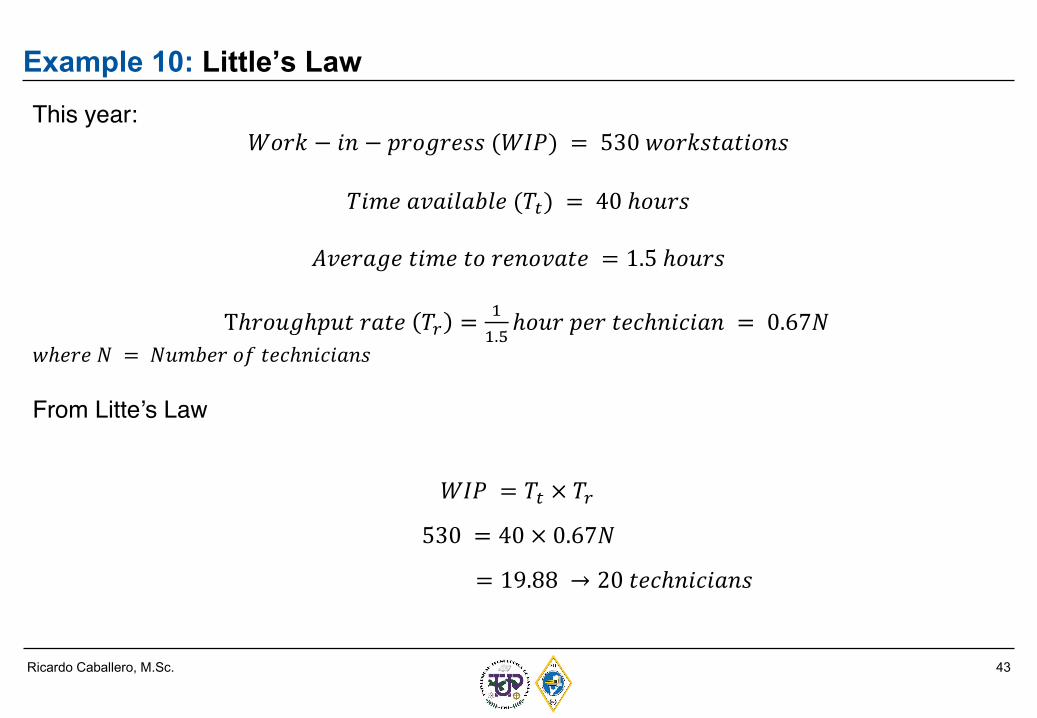
Example 10: Little’s LawThis year:
𝑊𝑜𝑟𝑘 − 𝑖𝑛 − 𝑝𝑟𝑜𝑔𝑟𝑒𝑠𝑠 (𝑊𝐼𝑃) = 530 𝑤𝑜𝑟𝑘𝑠𝑡𝑎𝑡𝑖𝑜𝑛𝑠
𝑇𝑖𝑚𝑒 𝑎𝑣𝑎𝑖𝑙𝑎𝑏𝑙𝑒 (𝑇!) = 40 ℎ𝑜𝑢𝑟𝑠
𝐴𝑣𝑒𝑟𝑎𝑔𝑒 𝑡𝑖𝑚𝑒 𝑡𝑜 𝑟𝑒𝑛𝑜𝑣𝑎𝑡𝑒 = 1.5 ℎ𝑜𝑢𝑟𝑠
Tℎ𝑟𝑜𝑢𝑔ℎ𝑝𝑢𝑡 𝑟𝑎𝑡𝑒 𝑇" = ##.&ℎ𝑜𝑢𝑟 𝑝𝑒𝑟 𝑡𝑒𝑐ℎ𝑛𝑖𝑐𝑖𝑎𝑛 = 0.67𝑁
𝑤ℎ𝑒𝑟𝑒 𝑁 = 𝑁𝑢𝑚𝑏𝑒𝑟 𝑜𝑓 𝑡𝑒𝑐ℎ𝑛𝑖𝑐𝑖𝑎𝑛𝑠
From Litte’s Law
𝑊𝐼𝑃 = 𝑇! × 𝑇"530 = 40 × 0.67𝑁
= 19.88 → 20 𝑡𝑒𝑐ℎ𝑛𝑖𝑐𝑖𝑎𝑛𝑠
44Ricardo Caballero, M.Sc.
§ Basse, F. (2018). Gestaltung eines adaptiven Änderungssystems für einen beherrschten Serienhochlauf. Disertacióndoctoral. Apprimus Verlag
§ Slack, N., et al. (2016) . Operations Management. Pearson§ Stevenson, W. (2015). Operations Management. McGraw-Hill§ Schroeder et al. (2018). Operations Management in Supply Chain. McGraw-Hill§ Render, B. & Heizer, J. (2014). Principios de administración de operaciones. Pearson§ Render, B. & Heizer, J. (2017). Operations Management: Sustainability and Supply Chain Management. Pearson§ Krajewski et al.(2013). Administración de operaciones, procesos y cadena de suministro. Pearson§ Chase, R. & Jacobs, F. (2014). Administración de operaciones, producción y cadena de suministro. McGraw – Hill§ Slack & Lewis (2016). Operations Strategy. Pearson§ Collier & Evans (2016). Administración de operaciones. Cengage§ Ulrich, K. & Eppinger S. (2013) . Diseño y Desarrollo de productos. McGraw-Hill§ Schuh, G. (2012). Innovationsmanagement - Handbuch Produktion und Management. Springer Verlag§ Meyers, F. & Stephens, M.. Diseño de instalaciones de manufactura y manejo de materiales. Pearson.§ Christopher (2016). Logistics and Supply Chain Management. Pearson§ Dumas, M. et al. (2018). Fundamentals of Process Management. Springer§ Peña & Rivera. (2016). Administración de procesos. Pearson§ Lovelock, C. et al. Administración de servicios. Pearson§ Johnston et al. Service Operations Management. Pearson§ Kumar, S. & Suresh, N. (2008). Production and Operations Management. New Age International Limited Publishers§ Cuatrecasas, L. (2012). Organización de la producción y dirección de operaciones. Ediciones Díaz de Santos, S.A.§ Gupta, S & Star, M. (2014). Production and operations – management systems. Taylor and Francis Group§ Fritzsimmons, J. & Fritzsimmons, M. Service Management. McGraw-Hill
References
45Ricardo Caballero, M.Sc.
§ Freivalds, A. & Niebel, B. Ingeniería Industrial – métodos estándares y diseño del trabajo. McGraw-Hill§ Kalpakjian, S. & Schmid, S. Manufactura, ingeniería y tecnología. Pearson§ Groover, M. Fundamentos de manufactura moderna. McGraw-Hill§ Render, B. (2016). Métodos cuantitativos para los Negocios. Editorial Pearson.§ Anderson, D. & Sweeny, D. (2019). Métodos Cuantitativos para los Negocios. Cengage§ Nahmias, S. (2007). Análisis de la Producción y las Operaciones. McGraw-Hill§ Schlick, C. Arbeitswissenschaft. Springer Verlag§ Rees, M. (2015). Business Risk and Simulation Modeling in Practice. John Wiley & Sons Ltd§ Winston, W. (2017) Microsoft Excel 2016 – Data Analysis and Busines Modeling. Microsoft press§ Swink et al. (2014). Managing operations across the supply chain. McGraw-Hill
References
46Ricardo Caballero, M.Sc.
Contact
Ricardo Caballero, M.Sc.
Junior Professor Faculty of Industrial EngineeringTechnological University of Panama
E-mail: [email protected]
https://www.academia.utp.ac.pa/ricardo-caballero


