Embed Size (px)
Citation preview

Club des Responsablesd’Infrastructures et de ProductionIT Infrastructure and Operations
Whit
e PA
PER
MAINFRAME IBM zSeries Mainframe Cost Control
IT INFRAsTRucTuRE& O P E R AT I O N s M A N A g E M E N TB e s t P r a c t i c e s
AuthorsLaurent Buscaylet, Frédéric DidierBernard Dietisheim, Bruno Koch, Fabrice Vallet
sponsored by september 2012

PAg
E 2

PAg
E 3
table contentsof
INTRODucTION 5
1. “z” POsITIONINg AND sTRATEgy wIThIN A cOMPANy 61.1 Role of the Mainframe in the eyes of cRIP’s Members 61.2 The Position of system z vs. Distributed systems (windows, uNIX, Linux) 61.3 system z - Banking/Finance/Insurance vs. general Industry sectors 71.4 Evolution strategies for system z 9
2. z PLATFORM OVERVIEw 112.1 Technical terms of reference 11
2.1.1 Servers 112.1.2 SAN & Networks 122.1.3 Storage 132.1.4 Backups 152.1.5 technical Architecture & Organization 162.1.6 Business Continuity 19
2.2 Mainframe software vendors (IsV’s) analysis & positioning 202.2.1 the Main Suppliers (ISV’s) 222.2.2 the Secondary Suppliers (ISV’s) 22
2.3 survey Results
3. z PLATFORM cOsT cONTROL 283.1 controling software cost 28
3.1.1 IBM Contractual Arrangements 283.1.2 ISV negotiation strategies: holistic/generic or piecemeal/ad-hoc 313.1.3 ISV contractual arrangements: licensing modes & billing 353.1.4 MLC: Controlling the billing level 38
3.1.4.1 The IBM billing method 383.1.4.2 The problem of smoothing (consolidating) peak loads 413.1.4.3 The methods and controls for controlling the software invoice 423.1.4.4 Survey feedback and recommendations 433.1.4.5 Other Cost Saving Options 48
3.2 Infrastructure cost Reduction 503.2.1 Grouping and Sharing Infrastructure 503.2.2 Use of specialty engines: zIIP, zAAP, IFL 54
3.3 controlling operational costs 553.3.1 Optimization, performance & technical/application component quality 553.3.2 Capacity Management, tools & methods 58
4. cONcLusION 67
5. APPENDIX - gLOssARy OF TEchNIcAL TERMs 68 AND AcRONyMs usED IN ThIs DOcuMENT
TABLE OF FIguREs 72
cRiP 73

PAg
E 4
Please enjoy!
Authors of this white Paper :Laurent Buscaylet PSA PEUGEOT-CITROËNFrédéric Didier ex-Crédit Foncier de FranceBernard Dietisheim RenaultBruno Koch ex-GCE Tech (Groupe Caisse d’Epargne), work group’s LeaderFabrice Vallet PSA PEUGEOT-CITROËN
Editor : Renaud Bonnet, cRiP
contributors to the Mainframe’s workgroup :Alexandre Babin La Banque PostaleSandra Belinguier La Banque PostaleRomain Capron MatmutHervé Combey La Banque PostaleThierry David i-BPMarie-Françoise Diver NatixisFrançois-Xavier Ducreux i-BPPierre Fenaroli La Banque PostalePatrice Rosier CNPHao ung Hoi Air FranceJérôme Viguier Air France
English translation :Michael Moss, Managing Director of Value-4IT Laurent Maneville, Global Business Manager, zCost Management
this white paper has been written among the CRIP (independent association of Mainframe customers) by a French users group from various lines of business such as industry, bank and insurance. topics chosen at the beginning of 2010 already represented one of the major concerns for these users.
Cost control has been a critical work axis. Solutions and tools are many; they are applicable to the majority of Mainframe users and allow to reach significant objectives in a very short term.
Capacity management remains the central and vital lever to manage, optimize and make one’s infrastructure evolve in an optimum way in mid-term. Involving various entities of the company (production, architecture …), and also final users, is necessary to its effective implementation. tools and processes enable to federate all parties, to obtain a consensus and most of all to have at one’s disposal elements accepted and recognized by everyone.
In today’s global economic context, practices (cost control, capacity management) promoted in this paper are still very topical and applicable to other global companies.After leading this group and writing up this white paper
in 2010-2011, I joined the zCost group in 2012; we are specialized in cost control and capacity management on Mainframe servers. Our purpose is to allow our customers to face the unprecedented economic challenges while making Mainframe and investments already made sustainable.
In line with the CRIP, zCost Management has translated this paper since we are convinced that this information will allow you to be more efficient on these topics, and will help you promote projects in your company.
Bruno KochzCost Services Managing Director
CRIP chose our company for the translation of this White Paper. We are proud to be their sponsor and to be able to help publishing such high quality works on a worldwide level, and therefore, to participate to the promotion of the Mainframe ecosystem.
Jacky hofbauerzCost Management Founder
Foreword

MA
INFR
AM
E :
IBM
zSe
ries
Mai
nfra
me
Cos
t Con
trol
PAg
E 5
Whit
ePA
PeR
Mainframe? What is left to say about the IBM Mainframe?
Firstly it is the most modern “dinosaur” and it is becoming increasingly modernized each year. having been introduced in April 1964, the IBM Mainframe is almost in its fifties but is still very trendy. You cannot believe it, can you?
And yet virtualization was possible on Mainframe at least thirty years earlier than on x86 servers. Consolidation and infrastructure sharing have been two of its major characteristics for a long time. Operations automation, workload balancing and capacity management have been daily tasks for twenty years or more. Shared storage service networks have been used and tape virtualization tools were used even before the invention of the SAN and VtL acronyms. Java has been reliably running on the IBM Mainframe for decades. Disaster Recovery, clustering and remote replication are obvious features. high availability is an intrinsic component. All of these great qualities explain why so many big organizations still use the IBM Mainframe for their core business.
Distributed Systems keep being inspired by this model, keep imitating it, reinventing it and trying to equal it. they try to provide the same service level as the Mainframe without really managing to do so; they almost provide “the same” features. take a look at the gap between virtualization on System z and on the most advanced Distributed Systems platform; admittedly it is decreasing, but still huge.
however, the IBM Mainframe platform is often distrusted; prices are considered too high by many. there is a sort of irrational and cognitive distortion in this criticism; z Series servers are hyper consolidated and their utilization rate would astonish UNIX administrators (and most likely infuriate their Windows colleagues!) and their environment is global by nature. the alleged high cost figures, above all for Software investment, confuse financial managers who do not see the great counterpart in terms of administration and operational ease. Furthermore, IBM Mainframe deployment, typically on a global infrastructure, is often compared to deployment on a few (or one) x86 servers; a classic mistake. Indeed, once an application is deployed, installed on many x86 servers which need to be administrated, backed up, operated, et al, which solution would be the most cost efficient?
Let’s admit that one of the unpleasant aspects of the IBM Mainframe is that Software licenses and contracts are incredibly complex; AWLC, IPLA, ULC, IWP, zNALC, SzLC, eWLC and other terms, how confusing! All of
these acronyms can be rather misleading; hence, understanding, analyzing, managing and negotiating Software contracts is almost a full-time job. A regrettable situation indeed, but then again Distributed Systems are following the same path; virtualization and multi-core processors add a lot of complexity. the true issue then seems to be consolidation and virtualization which generate software licensing difficulties rather than Mainframe itself; the glorious “one server, one OS, one application” era has come to an end.
this White Paper intends to set things right and prove that there are methods, best practices, leverages and even future prospects to keep controlling Software investments; indeed, one must control Mainframe costs instead of suffering them. Do not get it wrong though, control does not necessarily mean reduction; the goal is not to constrain the machine but to drive it in the desired way, monitor its evolution and optimize the ratio between its cost and the service provided, rather than just bearing its financial burden.
In order to do so, we must first strike a balance, indicating the position of Mainframe today in our companies and how it was integrated in the whole infrastructure. then we will review every single cost control method; you will see that there are many of them.
Our objective for this White Paper is to deliver a tool suggesting practical solutions. Let’s insist on a very important aspect; experience. this paper is the result from many meetings between the CRIP Mainframe z/OS Work Group and the results gathered during their investigations. the following commentary comes from real-life users experience and has been debated between many experienced Mainframe platform experts. every finding was actually implemented to validate its relevance. each comment, each nuance, each criticism or caution comes from actual difficulties met in the field, unexpected results or pleasant surprises highlight the gap between a brilliant idea and its complex implementation. We deliver you the results of our experience.
Intro duction

PAg
E 6
“z” POsITIONINg AND sTRATEgy wIThIN A cOMPANy1.1 Role of the Mainframe in the eyes of cRIP’s Members
Nowadays, the Mainframe platform is still used for an organizations core business. the 2010 survey carried out by the Work Group of CRIP’s members showed that this was true for all of the people surveyed, excepting one (who used System z only for business management applications). Furthermore, Mainframe and other computer resources are integrated most of the time; only two respondents keep the Mainframe platform isolated, and one respondent plans to integrate its z Server complex with other computer resources by 2014.
All the respondents whose Mainframe is used for core business applications said it will continue to be the case for the 2012-2014 period.
As far as average MSU consumption is concerned, the situations are very different. Four out of fifteen people surveyed consume between 1900 and 3000 MSUs, which makes them big users whereas the majority consumes between 200 and 500 MSUs; only one uses less than 50 MSUs (its Mainframe hosts about half of their applications).
In the foreseeable future, the general trend is a CPU consumption increase. For six of the respondents, the increase will be between 5 and 15% per year, and below 5% for three of them. On the other hand, only three firms plan to decrease their consumption, but by less than 5% a year. Lastly, two firms forecast constant consumption. therefore, the Mainframe platform is in good health, those who have one, usually use it increasingly.
however, if one looks at the relative position of Mainframe in comparison to Distributed Systems, the situation is somewhat different.
1.2 The Position of system z vs. Distributed systems (windows, uNIX, Linux)
Is the IBM Mainframe facing extinction, threatened as it is by the potential of Distributed Systems? We observed two complementary trends about this; Mainframe only applications are rapidly becoming rarer, whereas hybrid applications are only reducing very slowly.
this will not surprise anyone; none of the respondents are increasing their share of Mainframe only applications. Most of them (6 out of 11 who fully answered) are reducing their share; furthermore, only one of them plans to stop all of their Mainframe only applications by 2014. three respondents surveyed stated that their share of Mainframe applications stayed and would remain constant between 2006 and 2014, two of which run 60% of their applications on the z platform, which is significant. An overall average of the complete answers shows that the average share of Mainframe only applications would decrease from 28.6% to 19.25% between 2006 and 2014.
1

MA
INFR
AM
E :
IBM
zSe
ries
Mai
nfra
me
Cos
t Con
trol
PAg
E 7
WHiT
EPA
PER
On the whole, there is undoubtedly a drop in the share of applications running solely on System z, whereas the share of applications running solely on Distributed Systems increases.
Nevertheless, it is interesting to notice that the share of cross-platform applications, running partially on Mainframe and partially on Distributed Systems, tends to be constant. Where, it was 40% between 2006 and 2008, it is now stabilized at 36% for the 2009-2011 and 2012-2014 periods. this shows that the integration of Mainframe into the whole Information System is continuing, and that System z manages to collaborate with Distributed Systems by becoming data servers on the one hand and middleware servers on the other hand.
We had difficulty obtaining reliable answers to the question about the proportion of the It budget and the manpower allocated to the Mainframe environment; the low number of respondents did not allow accurate usage of these figures. however, all the internal discussions of the Work Group reached the same conclusion; Mainframe needs less people and its administration is less time-consuming than Distributed Systems. the Mainframe still has a reputation for being expensive though. Indeed, a cost focused approach is sometimes too restrictive to prove the economic benefits of Mainframe; in addition to the unit cost, many parameters such as the time spent for exploitation, the high security level provided, the high resource occupation level reached and the low storage quantity it requires, all need to be taken into account.
Regarding storage for example, the CRIP’s Storage Work Group provided the following figures (from the 2009 study, but they seem to still be valid); from the respondents, 4% of storage was allocated to Mainframe, versus 75% to SAN and 21% to NAS for Distributed Systems. Mainframe users allocated 13% of their storage capacity to Mainframe, versus 72% to SAN and 15% to NAS for Distributed Systems. therefore, comparing these figures with the percentage of applications running on each of these environments indicates that the Mainframe uses very little storage.
In times when energy concerns and data center occupancy problems are topical issues, let us be mindful that the Mainframe is the most frugal of environments. One of the Work Group’s members stated that in their company, the Mainframe occupied only 135 of the 4000 m² of the computer room, that is to say 3.5% of the whole surface area, while running 25% of the applications. Similarly, regarding energy consumption, the Mainframes consumed as “little” as two Distributed Systems clusters.
1.3 system z Banking/Finance/Insurance vs. general Industry sectors
Among CRIP’s members, there are two conflicting opinions concerning the importance, the purpose and the future of the IBM Mainframe platform, according to their respective business sector.
to cut a long story short, the Banking-Finance-Insurance sector does not plan to question the use of the Mainframe and even plans for increased usage, whereas General Industry sectors are reducing or stabilizing usage.this evolution is seemingly a consequence of the different business demands for the different sectors.

PAg
E 8
In the Banking-Finance-Insurance sector, transactional manipulation of huge date quantities is still the core activity. Indeed, it is important that data is highly centralized, frequently saved and maintained for perpetual integrity. In this context, using the IBM Mainframe platform as a centralized data server is the best solution. Furthermore, core business COBOL applications, some of which were written one or two decades ago, keep evolving, and are still deep-rooted in the platform. this fact encourages the deployment of new applications for the Mainframe as long as they depend on data access, already residing on the platform: thus the use of Mainframe is expanding in these sectors. Additionally, the Mainframe is also used to run middleware layers (application servers) as long as, once again, such processing manipulates centralized data.
In the general Industry sector, Distributed Systems are increasingly important. the IS management’s decisions, often oriented towards machines homogenization, exclude development of new applications within the Mainframe environment, even for core business applications, except for the growth of existing applications. the goal can then be towards “soft migration”, which in principle is not to run on the Mainframe either rewritten applications or replacement software products, with the aim of replacing homemade (bespoke) applications. however, we did not observe a wish to leave the Mainframe platform, since these strategic decisions run alongside with maintenance of the existing software and applications and regular renewal of the infrastructure, but a wish not to provide the Mainframe with additional functions. As discussed earlier, this can be shown by some of CRIP’s members’ with a gradual increase of installed power, but without new workloads; this phenomenon is considered by a member of the Work Group as the “future death” of the Mainframe.
this phenomenon is rather slow though, as it is hard to move an application which consumes hundreds or thousands of MIPS to a Distributed System, despite what non-Mainframe consultants promise. Mainframe teams sometimes have to underline that the cost of being forced to leave the platform would be outrageous. As one of the members summed up; “the life length of a CIO who wants to eliminate the Mainframe is often shorter than the actual migration length”.
these evolutions also generate skill issues. everyone acknowledges that Mainframe skills are becoming rarer. Some companies drop Mainframe development for lack of skills, while Linux or Windows skills are cheaper and more plentiful. even in companies which go on recruiting Mainframe developers, the age pyramid is an issue; teams are getting older. Reducing the impact of this trend is possible by deploying modern tools and environments (Java in particular) in order to eradicate as much as possible from the Mainframe platform. however this does not solve the operational problem.

MA
INFR
AM
E :
IBM
zSe
ries
Mai
nfra
me
Cos
t Con
trol
PAg
E 9
WHiT
EPA
PER
1.4 Evolution strategies for system z
the number of Mainframe applications is still high, for most of the big businesses. however, the applications hosted on this platform are getting old and they are naturally being renewed. Given that most of these applications are mission critical, this renewal is likely to be delicate and strategic choices must be made.
IBM seems aware that a lot of companies are facing this problem and try to boost the attractiveness and longevity of the Mainframe. there are many technical and commercial offers, even too many and they sometimes confuse customers; are they relevant and diversified enough to convince senior decision makers?
Firstly, IBM insist on what they call “new workloads”. Most of current Mainframe programs are written in COBOL and their user interface is limited. In the era of Web 2.0 and RIA (Rich Internet Applications), these technologies have no future and must adapt. this is why IBM wants Mainframe to run these new applications, for the viability of the platform to continue.
technically, Mainframe is still one step ahead in terms of virtualization, scalability and robustness. however, its cost, when compared to x86 Distributed Systems, is a consideration. Java, XML and DB2 specialized processors lower the financial impact this new workload generated, but this is not necessarily enough to convince end users.
In August 2009, IBM presented a new commercial offer dedicated to these new workloads; Solution edition. this financial package includes hardware, Software and Maintenance, whereas the previous zNALC offer was for Software only. It looks like a competitive offer, but IBM reserves its usage to new and specifically targeted projects (e.g. BI, SAP, CRM, et al.) with dedicated resources, which goes against the very functioning of the Mainframe platform, where resource utilization is the rule, and resource dedication the exception.
In 2011, a new billing offer focused on a premise of co-localization. this offer allows the usage of “qualifying” Software products (e.g. WebSphere) on existing partitions hosting traditional tP monitors like IMS and CICS without increasing the Workload License Charge (WLC). these products are said to be eligible for IWP (Integrated Workload Pricing) adjustment. Will this evolution change the game by authorizing the usage of new Java applications without increasing WLC on the Mainframe?
IBM keeps on investing in the Mainframe platform, which represents a high proportion (kept secret though) of both its hardware and Software sales. In 2010, a new generation of machines was released, the zenterprise. however, we continue to watch the outcome of this latest evolution from IBM.
the new zenterprise machine is able to host on the same platform heterogeneous technologies which are z/OS-PR/SM (z196), AIX/Power and Linux/x86 (with zBX). In early April 2011, IBM announced the ability to also run Windows on x86 in the zBX extensions. the Mainframe thus becomes a hyper-consolidation platform, able to stand as a datacenter-in-a-box, or to adapt to trendy obsessions such as a Mainframe cloud, a cloud which can manage high heterogeneousness.

PAg
E 10
As the CRIP Work Group underlined, this evolution is not only a matter of technology (the real capabilities of the platform must be validated), but also a matter of politics. Indeed, adopting zenterprise would imply more or less that the Mainframe administration team takes control of various systems; a path that is not really likely to be followed by their organizations.
Without doubt, the use of Mainframe as an overall consolidation platform is sometimes inhibited by facts. One member of the Work Group works in a company which has two datacenters, one for Distributed Systems and one for the Mainframe. they studied the benefits of Linux for System z and the possibility to consolidate Linux workloads in their Mainframe datacenter; their conclusion was that this would bring very little added value, because the Mainframe datacenter was not designed for such usage, and that such operation would require a partial infrastructure move from the Distributed Systems datacenter. Finally, consolidating Linux activities in the Distributed System datacenter seemed more logical. this case shows that one must not expect a trend evolution towards going back to Mainframe usage, but a requirement to get prepared for other platforms to evolve and run just like an IBM Mainframe. the terms Mainframe UNIX or Mainframe x86 are more and more used to talk about big systems (monolithic or distributed) which have high virtualization and consolidation rates. hence, eventually, there will be Mainframe-like systems, or a general “mainframization” of computer engineering. One of the CRIP Group’s members replied that “this trend may be reversed because the promises of Distributed Systems are far from being realistic and operational and by wanting to limit Mainframe usage, CIOs will end up wondering why they would not use the original version”.

MA
INFR
AM
E :
IBM
zSe
ries
Mai
nfra
me
Cos
t Con
trol
PAg
E 11
W
HiT
EPA
PER
z PLATFORM OVERVIEw
2.1 Technical terms of reference
Attention: the figures and data appearing in what follows come principally from a study completed in 2010 by the 15 members of the CRIP using Mainframe .
2.1.1 servers
InfrastructureAt the time of the study, the installed z System servers are generally of the latest iteration (z10). Although since then the more recent z196 server has replaced 30% of the install base.
therefore the z Platform technologically can be classified as current, for these primary reasons:• Concern for perpetual investment (I.e. for the most recent technology).• evolution (age) of servers, 5 years since their introduction (General Availability).• Bonus for new technology at the time of MLC software invoicing («technology • Dividend») @ ~3 to 5 % (IBM indicates ~10%) from one generation to the next.
they noted that for the z196 technology, this technology dividend bonus takes the form of a new system of invoicing called AWLC, replacing the classic VWLC. For any calculations made, the benefit for the client is of the same order as that determined for previous server generations, in spite of the optimistic announcements made by IBM. It is also necessary to note that the older server which changed the MIPS/MSU ratio carried forward for IBM software invoicing (MLC + OtC) while the new server charging mechanism, AWLC only applies to MLC.
specialty Processorsthese processors support some types of workloads (e.g. DB2, Java, Linux, et al) without adding MLC software cost. Moreover, their purchase cost is about 5 times less when compared with classical processors (see chapter 3.2.2 for more information on their mode of functioning and their advantages).
zIIP processors (DB2 DRDA) are the most commonly used (~50 % users), followed by the lesser used zAAP processors (Java). As for IFL (Linux) processors, they maintain an «exercise of style» nature and no customer (with one notable exception) has taken the step of deploying Production on IFL’s.
Globally, IBM reported significantly more flattering reports; approximately 30% of customers have at least one Mainframe IFL (late 2010). But IBM does not specify whether this IFL is used in Production or test. there is however a delay in this IFL implementation matter, specifically in France.
the addition of specialty processors allows for a modest investment, «giving breathing (white) space» to conventional General Purpose processors, and
2

PAg
E 12
therefore allowing to differ growth investment. therefore from this viewpoint, this is a good result, if the nature of the production workload is eligible.On the other hand the corresponding decrease in the MLC software invoice does not always follow, because the offset of activity in specialized search engines may have little or no impact on the peak load generating billing. Similarly, a second peak load may be generated, as high as that which has been moved. the evolution of peak loads (Rolling 4 hour) results from a complex and fragile balance, where changes are not always easy to anticipate.
Finally, there is a convergence of types of specialized processors; zAAP processors disappear in favor of zIIP. the latter can now accommodate either workload, both DB2 and Java.
sysplex Architecturethe overwhelming majority of users adopted Sysplex architecture in a «priceplex». this is to derive benefit from tariff conditions applying to IBM MLC billing software metrics (aggregated PSLC). this technique makes it possible to reduce the monthly software bill by about 30% compared to classical/conventional architectures.
An alternative to this architecture is sometimes witnessed; a single-server site and a backup site with a server-only backup processor (CBUs). this solution, which was unthinkable only a few years ago, can now have many benefits, given the increased reliability of equipment. however, it can cause problems of usability including outage management. even if it is not currently the most widespread, this solution can certainly not be ruled out, especially since it can deliver without any preconditions, the same tariff benefits as the priceplex architecture.
Customers that have implemented this architecture have seen a ~2% decline in MLC via simple consolidation. this perceived low percentage should nevertheless not be overlooked, given the overall volume of the budget that represents the MLC for heavy usage. this architecture is interesting in the economic and technical simplification it brings. however, we should nevertheless be aware of its limitations if we decide to adopt it.
2.1.2 sAN & Networks
Infrastructuretwo SAN equipment vendors (IhV’s) share the market; Brocade and Cisco. In contrast to activity observed on other platforms (FCoe distributed worldwide), no major technological innovation is delivered by these IhV’s. Only increased data flows (8 Gb currently, 16 Gb proposed) are on the roadmap.It seems like a safe bet that like the evolution of storage, these functions will appear later in the Mainframe world environments as other more «fashionable» trends. It is also true that current architectures are entirely satisfactory in terms of performance, in a Mainframe environment which inherently already demonstrates a high rate of consolidation.
connectivity ProtocolseSCON connectivity is clearly losing ground in favor of FICON, but remains present within some sites, used by some older and slower devices, currently still in use.

MA
INFR
AM
E :
IBM
zSe
ries
Mai
nfra
me
Cos
t Con
trol
PAg
E 13
W
HiT
EPA
PER
In terms of network protocols, SNA and the 3745 communications controller types have totally disappeared, in favor of tCP/IP and OSA cards.
2.1.3 storage
Infrastructurethree players share the Mainframe storage market; hDS the clear leader, followed by IBM and eMC².
Technological DevelopmentsIn terms of technological developments, the trends generally observed are:
• Replacement of 3.5 inch 15,000 rpm with 2.5 inch 10,000 rpm disks, which are cheaper to produce, for similarly equivalent performance.
• Replacement of Fiber Channel disks with SAS attachment.• the high-performance storage (SSD) made its appearance, but its price (3
times higher than conventional storage) now confines its usage as low, for very specific/niche applications.
• Conversely, larger capacity (600 GB+) midrange disks have evolved, reducing the cost of overall storage, especially for low access/performance requirements.
• Storage tiering therefore is commonplace in the Mainframe world, but all disk IhV’s agree that low-end SAtA type solutions are generally not suitable for primary storage (Level 0) Mainframe usage, requiring higher I/O rates, (except perhaps for DFhSM migration to Level 1-2). Therefore, Mainframe storage remains essentially as high-end storage.
Embedded storage Array software (Microcode)this software is mainly dedicated to performance (PAV, hyperPAV) and data security (copy synchronous or asynchronous) functionality. the usage of these products is both widespread and somewhat generic. PAV/hyperPAV functions are now staples of Mainframe storage. On the other hand, according to the IhV’s, the cost of these functions is significant, and greatly increase the cost of storage, both in terms of investment and operating costs.
Conversely, these software costs are the most easily negotiable and can be sources of significant price differences between suppliers, when the variety and range of software used is important.
Pooling with other environmentsPooling is technically possible for all storage IhV’s. however, usage is generally uncommon among users, for the following reasons:
• Distributed Systems storage volumetry is not on the same scale as Mainframe Storage.
• Complexity of administration and associated risk.• Indeterminable cost benefits.• Organizational (technical teams) issues.Conversely, while there are many similarities between Distributed Systems and Mainframe storage arrays, excepting connectivity, there is still a commonplace and significant price gap per GB between Distributed Systems and the most expensive Mainframe storage (high-end storage usage). this is often the

PAg
E 14
consequence of the inability of Puchase Directions to reduce the price gap between the two worlds during negotiations with providers. This remains an important customer cost reduction focus, for customers who have not already reached this price harmonization.
Mainframe disk storage geometry evolutionthe geometry and granularity of disk storage has changed dramatically in recent years, delivering geometries with increased capabilities:
• the legacy 3390-3 devices have almost disappeared in favor of the 3390-9 and especially 3390-27 devices, occupying most of the storage pools. Anecdotal commentary indicates limited and occasional usage of the 3390-18 device.
• the 3390-9 devices are typically reserved for specific usage (e.g. System disks). the more recent 3390-54 device is still not widely used. Some minor performance issues can be encountered with this device, especially when not benefitting from the latest generation host controllers. Nevertheless, it is likely that their use will become widespread, in spite of their unit capacity, which can pose significant utilization problems for the smaller users of disk storage pools.
Over time the 3390-3 device capacity has become too low to meet usage requirements, generating the following consequences:
• the number of volumes required for the storage pool (e.g. architectural constraints).
• the increase in multiple-volume and multiple-extents files and the associated increase in operational incidents related to lack of space (e.g. x37 abends).
today we can identify some trends:• Disk storage reorganization can be considered ideal when renewing disk
controllers. Nevertheless, it is possible to achieve this storage reorganization using non-disruptive data movement tools from the sellers (e.g. IBM, Innovation, tDMF, et al).
• the physical storage reorganization must be accompanied by a reorganization of the logical data management (e.g. DFSMS policy), including the reorganization of the associated storage pools. Additionally, due to the decrease of granularity, DFSMS features have evolved (e.g. Overflow Storage Group) that are now of great assistance.
• Finally, it is desirable to manage a maximum of two disk geometries, which makes it even more necessary to redesign the DFSMS policy management logic mentioned previously.
eAV (extended Address Volume) – Special Case:this new geometry that allows for extreme/exceptional usage as a single logical volume is still very rare for the following reasons:
• A limited number of applications are not suited to “traditional” disk device geometry, especially the 3390-54 device. thus it is anticipated that eAV usage will be niche, and only used for a minimal number of applications.
• Using eAV induces many software pre-requisites.• Migration is typically cumbersome and not transparent.• Limited experience and feedback from the field.

MA
INFR
AM
E :
IBM
zSe
ries
Mai
nfra
me
Cos
t Con
trol
PAg
E 15
W
HiT
EPA
PER
2.1.4 Backups
InfrastructureOracle (formerly Sun/Storagetek) is the major player in France, followed by IBM. however, Oracle functions and associated equipment are ageing, and renewal/replacement intentions are perceivable:
• Generally IBM usage was both stable and conservative (full Disk + tape virtualization).
• Oracle suffers from poor brand perception related to a controversial trade policy for other market sectors. In addition to this lack of confidence in the business relationship, Oracle are often criticized for a lack of direction and leadership in technical and commercial developments. however, Oracle still offers a noteworthy and interesting solution, somewhat similar in terms of positioning to that of IBM.
• eMC2 recently entered the Mainframe backup market, focusing on innovative technologies such as deduplication (see below). this IhV only provides disk virtualization solutions.
• At the time of writing this document, hDS is not currently active in the Mainframe backup market, but is expected to make an announcement (e.g. LUMINeX, deduplication) in the 2011-2012 timeframe.
Technological Developmentstape virtualization associated with large-capacity disk cache has been commonplace for many years and continues to exist. In addition, virtual tape technology made its appearance in the Mainframe world. this is actually SAtA controllers emulating Mainframe tape drives of variable capacity. the primary advantages are:
• Cost.• elimination of the problems associated with filling physical tape media, which
continue to grow in capacity. therefore virtualization is somewhat mandatory.• eradication of DFhSM ML1.• Improved backup times.• the possibility of deduplication. even the most ardent supporters admit that
this technology is much less interesting for the Mainframe when compared with other environments, due to the nature of the data managed. In any case, a detailed analysis of data types is essential before a decision can be made. Additionally, we must not lose sight that in the event of physical loss of data, data reconstruction can be more problematic, when compared with conventional storage, despite assurances to the contrary from suppliers. It will be interesting to monitor the first field experiences.
• Reduction of floor space and energy consumption.
Generally, the newer systems regardless of the underlying technology are simpler to manage from the perspective of the user.
the breakthrough for these systems was made possible by technological developments in remote synchronous and asynchronous replication. these techniques allow for separate sites, both local and distant, generating backup copies without the need to physically transport physical tapes to another location (site). this substantially simplifies and improves the reliability of DR/BC (Disaster

PAg
E 16
Recovery/Business Continuity) procedures. Below is a diagram describing the most commonly used architectures:
however, conventional physical tape systems and media continue to evolve, combined with high capacity virtual caches and AtL’s (e.g. IBM, Oracle) provide equivalent performance to tapeless virtual tape systems. Similarly, the capacity of physical tape continues to increase. these systems remain competitive and even essential when:
• the removable (physical tape) media is essential for job processing or security reasons.
• Data capacities are significant (e.g. n tB+).
Additionally, all virtual tape systems offer a sufficient number (I.e. 256+) of logical drives, eradicating the requirement to use products for tape pool management (e.g. CA-MIM).
In conclusion, our study found that virtual tape technology offers interesting innovations, allowing many users to lower backup costs. On these systems, disk controllers that can be considered as Distributed Systems, emulate traditional tape drives for compatibility reasons. this is the only reason that tape emulation is required, supporting legacy tape drive types, where the data is actually stored on disk (either intermediate or permanently); but for how long?
2.1.5 Technical Architecture & Organization
Technical Architecturethe most frequently encountered architecture consists of two data center campuses (two local sites separated by less than 20 km). this architecture allows the use of synchronous data replication systems between two sites, safeguarding a high level of security and continuity of service.
Some customers also have remote backup sites (e.g. ~500 km from primary
Figure 1: Sample high Availability Mainframe Configuration

MA
INFR
AM
E :
IBM
zSe
ries
Mai
nfra
me
Cos
t Con
trol
PAg
E 17
W
HiT
EPA
PER
site). Replication of data between the primary and the backup site is performed asynchronously. these backup sites are actually fallback sites, inactive during normal operation, and used in the context of a Disaster Recovery event (Disaster Recovery Planning - DRP) resulting from the partial or total destruction of the primary site.
technological and economic considerations influence the architectural choices made in this area, primarily for storage and backup, including:
• As part of a local two primary site architecture, it is generally customary to divide the data between the two sites to minimize the data flow and associated bandwidth between the sites. In this case, the synchronous data copies were also distributed to the other of the two sites. this configuration might be called cross synchronous copy (Figure 2).
Now that bandwidth is no longer a bottleneck, this technique tends to lose favor because it overly complicates the emergency procedures associated with primary storage unavailability. Moreover, it is incompatible with automated solutions such as GDPS (IBM). Consequently, it is now widely recognized that the best solution is to dedicate full disk copies, both for primary storage and the synchronous copy (Figure 3).
Figure 2: Cross Synchronous Copy – Classical Legacy Architecture
Figure 3: Campus Mode Synchronous Copy – New Architecture

PAg
E 18
Disadvantage: this mode requires to bring all storage arrays in line with the most powerful installed, or to tolerate slight performance degradation in Disaster Recovery mode. therefore this mode of operation is generally more expensive.
• the type of synchronous copy deployment is becoming widespread, and tends to be used for all data. this significantly simplifies the management and emergency procedures for a relatively low and acceptable incremental cost, recognizing the reduction of disk storage costs.
• Storage virtualization as implemented in the Distributed Systems world has little interest for the IBM Mainframe platform, primarily for the following reasons:
- Mainframe data volumes are considerably lower than in the Distributed Systems world, and therefore the number of disk controllers also.
- the Mainframe primarily uses high-end disk arrays. therefore it is not necessary to prioritize performance levels for different array with a virtualization layer.
- Access to data from one or more Mainframes and from multiple partitions (LPARs) is a native and completely standard function; thus it is unnecessary to add an extra layer of abstraction.
• the asynchronous duplication of backups is becoming widespread, gradually replacing the traditional physical tape backups. this has been made possible by the lower costs for backup equipment and telecom links, while these replications are mostly for remote sites.
• Generally, sharing equipment with other non-Mainframe platforms is quite uncommon, although the basic components, including storage requirements are similar. the savings achievable by this type of pooling are generally quite low in view of risks and constraints that would result. Moreover, Mainframe hardware is not always compatible, especially in terms of connectivity with other environments. the emergence of hybrid zentreprise (zBX) servers may modify this proposition somewhat, but for storage and backup, there is no way to anticipate radical change of the landscape in the short term.
DatacentersIn France, the outsourcing computer (hosting) companies and their subsidiaries are widely used and commonplace. there are also a significant proportion of businesses pooling their resources with other data centers. this obviously poses security problems, but holds the attention of many decision makers, because of cost savings delivered by sharing computer center running costs.
Outsourcing: yes or Nothe underlying position for firms considering this proposition regards the overall control of their information system. the risk of power loss is an aspect considered by some as essential, and dictates a decision in favor of direct management, regardless of other considerations.
Moreover, good Standard Performance «Benchmarks» (e.g. Compass) remove all arguments for an outsourcing solution (help yourself and heaven will help you). In total, just over half the companies participating in this study chose the latter.

MA
INFR
AM
E :
IBM
zSe
ries
Mai
nfra
me
Cos
t Con
trol
PAg
E 19
W
HiT
EPA
PER
Infrastructure: Leased or Ownedeven if it is not the majority, far from it, the rental of Mainframe infrastructure becomes an attractive alternative for some customers. It follows to a certain extent the same logic in terms of predictive multi-year budget, just like multi-year software contracts.
2.1.6 Business continuity
continuous Availability & high Availabilitythe continuous availability solution requires Sysplex architecture. however, this solution, although deployed by almost all users for financial reasons (priceplex, Please refer to section 2.1.1). however, the requirements for achieving continuous availability are reduced, primarily due to:
• the complexity of implementation and overall cost.• the cost of additional resources required for this architecture (~10%).• the complexity of real-life (Business As Usual) management.• the overall additional cost of such a high-availability solution, when compared
with a conventional solution.
experience shows that in the event of a major incident, the associated restart and emergency procedures are not always properly managed.
All these factors are obstacles for the implementation of this solution, which is deployed when a compelling need is evident. In particular, this type of architecture is found where the specific business needs or conditions dictate, for example, an online reservations (e.g. Air/Rail ticket) business.
Nevertheless, this issue of additional cost and complexity associated with cluster architectures exists for all platforms. however, the zSeries (z represents zero down time) Mainframe is performing very honorably in this area.
the requirement for continuous availability is found in all business sectors, but typically limited to a minority of application usages (e.g. Banking, Logistics/telecommunications/Utilities, et al.). Classical architectures still remain the most popular implementations, delivering a «high availability» service, due to:
• Reduced hardware failures linked to the progress made during the last 10 years in terms of intrinsic hardware reliability (MtBF – Mean time Between Failure).
• An increased number of technical changes can be implemented dynamically (I.e. without service interruption).
All of these advances allow for a considerable reduction in the overall number of maintenance or minor failure outages (~5 or less per year).
DRP (Disaster Recovery Plan)Firstly, our study reported that all the companies surveyed have a DRP, and therefore take into account the business continuity of their information systems that face major risks.

PAg
E 20
these Disaster Recovery Plans have obviously benefited greatly from the technological developments and architecture previously discussed (Please see Section 2.1.6). In particular, they demonstrate advantages in reliability, performance (RPO/RtO) and simplicity.
Currently the Mainframe platform is probably one of the best in this area (it even serves as a model for others). Some architectures deliver high availability with a zero time RPO (with two campuses mode sites) and an RtO of less than one minute.
Nevertheless, we observed the following:• Unavailability outages discovered during Disaster Recovery testing, documented
via SLA metrics are relaxed, from a user expectation viewpoint.• there remains a need to harmonize the Disaster Recovery performance for
different and heterogeneous platforms. At a juncture when applications are typically distributed across multiple platforms, following the loss of a data center, what interest is there in restarting the Mainframe within 24 hours if other non-Mainframe application components cannot be restarted for 5-10 days?
• Finally, while almost all companies organize Disaster Recovery tests to periodically check the reliability of procedures, it should be noted that Disaster Recovery test performance also considers human factors such as:- Staff training.- the performance impact when operating in stressful conditions.- teamwork, et al.
these factors, generally always considered, are only second rank concerns. however, there is still perhaps a significant margin for improvement in the performance of a Disaster Recovery Plans. the airline industry, where the importance of flight personnel training is paramount and mandatory to meet regulatory requirements, provides a notable counter-example. It has therefore been typical for this sector to extend such processes for It Operations teams.
2.2 Mainframe software vendors (IsV’s) analysis & positioning
warning:The following information summarizes the responses from the 15 companies participating in the CRIP survey of Spring 2010. The survey only covered infrastructure software (OS, DBMS, Transaction Monitors, Monitoring Tools, Etc.) and not the application software. Due to the lack of experience and time, it appears that our investigation has failed to detail some information, particularly for small ISV’s and the actual use of certain technologies (IMS software). We must capture this information with the due diligence required, in future to-do and comprehensive studies.
Background:For reference we are providing some context information. According to IDC, revenues for the hardware market and Mainframe operating systems totaled $8.5 Billion in 2009 (including $3 Billion for the european geographical area), whereas software
MA
INFR
AM
E :
IBM
zSe
ries
Mai
nfra
me
Cos
t Con
trol
PAg
E 21
W
HiT
EPA
PER
accounted for $24.5 Billion in the same year. Purchasing a european Mainframe server (hardware) thus equates to software with a ratio of ~1:3.
IBM is very discreet about breakdown of their revenues by product line. however, IDC estimated, again in 2009, that IBM controlled about 40% of this Mainframe software market, while our investigation seems to at least confirm this observation, if not finding that IBM revenue share was slightly higher.
Moreover, this software market has changed dramatically since the 1990’s before stabilizing for several reasons:
• the general technological context; the increase in Distributed Systems computing has decreased the demand for Mainframe solutions.
• the dramatic increase of Mergers & Acquisitions (M&A) in the software industry has reduced the number of suppliers (ISV’s), while expanding their software portfolios.
• the impact of company consolidation, streamlining their infrastructure, or in connection with Mergers & Acquisitions (M&A), reducing the number of data centers and enterprise users, which reduced the overall number of Mainframe account (customers).
• As a result of consolidation, customer organizations become fewer but significantly more important, relying on major suppliers, generating phenomenon of concentration (single or few suppliers), limiting their appeal to small ISV’s. A Mainframe customer of modest size dares to engage with a small supplier, while large Mainframe customers have been reluctant to do so because of the alleged risks inherent with small ISV’s; durability, ability to provide support, innovation ability, et al.
• the perception of risk associated with small ISV’s was exacerbated by the accelerating pace of evolution for the Mainframe platform required by IBM. Indeed, in the late 1990’s, IBM decided to perform a rapid turnover of versions for some Mainframe software products, including OS/390, which would evolve every six months. this state of affairs that lasted a few years was to inflict a heavy burden on some software vendors, even if only to retrofit these innovations into their products, or by only providing the minimum and necessary adjustments, for product compatibility.
• the buying patterns for major companies have evolved along with the introduction of multi-year global negotiations. they were aimed to provide greater bargaining leverage, but only applied to ISV’s with large enough software portfolios, for delivering the maximum benefit. Our companies are now concentrating upon logical time based purchases, isolated to a more generic response, unless dictated by specific technical considerations, but rather focused on stability, continuity of solutions, again to the detriment of smaller ISV’s. As a consequence of these new purchasing strategies, we now have a commonplace adoption of “shelfware”, software not used by the customer. thus global negotiations encourage the major ISV’s to deliver “top-up” products, in the hope that these shelfware products create extra maintenance revenue.
this ISV consolidation has seen a large number of ISV’s disappear, both large and small, creating very few software portfolios, sometimes expanded by products with

PAg
E 22
duplicate functionality. today the ISV landscape is largely stabilized, and tightly structured around a few very large vendors (e.g. ASG, BMC, CA, Compuware, IBM, SAS, et al).
2.2.1 The Main suppliers (IsV’s)
We can distinguish three categories of providers; the three who have an extensive range and appear almost inevitable, those who have a more specialized software portfolio and finally, niche players.
The 3 primary IsV’s:• IBM, CA and BMC can be found in this category. historically present in the
market, over time they have established comprehensive offerings and occupy a position of strength.
• IBM reigns supreme with Mainframe Operating Systems, except Linux, which represents only marginal activity, but also with transaction processing monitors (I.e. CICS & tPF) and databases (I.e. DB2 & IMS).
• Because of its history, CA has a strong position in the fields of security and database tools. however, security remains a competitive market.
• BMC has an especially strong foundation in the Systems Management discipline.
2.2.2 The secondary suppliers (IsV’s)
The large specialist IsV’s:Below are several ISV’s with a global presence and significant size, but rather specialized with two or three functional areas, perhaps as broad as the 3 main ISV’s:
• Compuware has a very strong presence in the tools of development aid, debugging, trace analysis, performance analysis, creation of test cases, data manipulation, analysis of incidents, et al. After gaining the leadership in these areas, several years ago, Compuware managed to preserve and strengthen their position, to the point of nearly establishing a position almost devoid of competitors.
• Although poorly represented in our survey, ASG has a significant software portfolio catalog in three areas; monitoring with tMON, Production (job) management with the acquisition of Cortex and application development assistance.
• Software AG is a significant German ISV that is well established globally (2nd in its home market, 4th in europe and in the top 25 globally), but has never established a good presence in France. Primarily they market a database (Adabas) and associated transaction monitor (with associated development environment), making Adabas one of the few competitors with the equivalent IBM offerings (I.e. CICS, DB2, IMS).
The niche IsV’s:they have one or several focused small functional areas and are typically well established:

MA
INFR
AM
E :
IBM
zSe
ries
Mai
nfra
me
Cos
t Con
trol
PAg
E 23
W
HiT
EPA
PER
• Axway reign supreme for Mainframe file transfers. Indeed they are the company that owned Interpel (Pelican) and bought CFt (Synchrony transfer), sometimes perceived as the only product on the market.
• Macro4 has developed competition for Compuware development tools, including development aid, debugging, trace analysis, data manipulation, et al.
• Infotel is an ISV dedicated to the market of databases, IMS and DB2 especially, with tools for administration and handling. this ISV is also very Franco-French.
• Beta Systems is a leading ISV in the areas of production automation and output management. It is surprising not to see this ISV in our survey, even if it is rather traditionally successful in Germany, Switzerland and the Nordic countries.
• Redhat and Suse-Novell are two ISV’s of Linux distributions that do not really belong to the family of Mainframe specialists, but provide IBM with the blessing of specific versions of their Linux OS for processing on z Series Mainframe platforms.
• Syncsort is the only active 3rd party ISV player in the field of sorting and data manipulation, competing with the IBM DFSORt offering.
Although they have not been the subject of this CRIP Study, we also make note of technical software infrastructure components associated with storage from eMC² and hDS, plus backup software from Oracle (Sun/Storagetek). Naturally residing on the Mainframe, such software is required for their associated storage infrastructure, primarily disk from eMC² and hDS and tape from Oracle (Sun/Storagetek).
Finally, we noted that there is a population of small specialized ISV’s, that once marketed quite common solutions, and now live on their install base and associated recurring maintenance revenues.
warning Reprise: Our investigation failed to highlight small ISV’s which we know of their existence and use of products. this was how we worked and the shaping of our questionnaire. An upcoming future survey will review these ISV’s, highlighting those that we have forgotten.
2.3 survey ResultsPresented by major software categories, as used by the CRIP members in order of importance:
> For Operating Systems
1. IBM with its ubiquitous and multiple generations of Mainframe Operating Systems.
2. Redhat with their version of zLinux.3. Novell-Suse with their version of zLinux.
> For Transaction Processing (TP) Monitors
In order of popularity, IBM with CICS, IMS and WebSphere.

PAg
E 24
A somewhat surprising result; originally there were some competitors in this market because the products required a high level of reliability and proved complicated to develop and maintain. In addition, IBM has literally swept the competition aside, by accelerating the pace of its updates to products and investing in its own environment.
> For Relational DataBase Management Subsystems (RDBMS)
1. IBM with DB2.2. Software AG with Adabas (observed with merit in this study).
IBM has completely conquered this functional area to the point of only observing very marginal competition. however, 20 years ago there were several databases for the Mainframe, including Adabas, Datacom, IDMS, and others. Now, it is almost all DB2, with residues of IMS/DB (DLI) and a few users of other products. In the late 1980’s, IBM had not yet delivered a relational database and there was no IBM SQL. IBM then partnered with Oracle to complement with the DB2 tool. By investing heavily to develop DB2 on the z Series platform, but also with all other major Operating Systems, after early challenges, and although expensive, IBM has maintained a differential technique with advantages in terms of features, performance and robustness. By passing this technical challenge, IBM has slowly eliminated competition over the years.
We were surprised not to include IMS/DB in this list. this product is still used, but as an historical legacy, for companies that wish to avoid migration costs, or in specific cases where the hierarchical database functions of IMS are particularly well suited.
> For the batch schedulers
1. IBM with tWS (formerly OPC).2. BMC with Control-M.3. CA with CA-7.
there is real and healthy competition in the market of batch schedulers, with many good products from credible ISV’s, some widely available. there are also several other products we haven’t referenced in this document, but quite popular, including CA Scheduler, ASG-Cortex family, and even lesser-known products, but still used.
> For Security Subsystems 1. IBM with RACF (Security Server). 2. CA with ACF2 and top Secret.
In this area, both providers IBM and CA are notoriously competitive. top Secret is very popular in France, but then ACF2 is more successful in the United States. CA has taken market shares from IBM at a time when RACF was not satisfactory for its users. IBM has since caught up, and taken market shares back from CA. Both IBM and CA security offerings are now technically very similar.

MA
INFR
AM
E :
IBM
zSe
ries
Mai
nfra
me
Cos
t Con
trol
PAg
E 25
W
HiT
EPA
PER
> For z/OS (MVS) Systems Monitoring
1. BMC with MainView for z/OS and CMF.2. IBM with Omegamon for z/OS and RMF.3. CA with Sysview (observed in this study).
Another fairly competitive market sector, where BMC remains the leader with their MainView offering, having previously purchased the product line from Boole & Babbage. For many years IBM did not invest in this area, whereas it was enough for IBM to provide basic tools, allowing users to select third-party vendors for more sophisticated software. Finally, IBM changed its direction and acquired Candle, and in particular, the Omegamon software suite, returning to this market. CA has some competitive products, but this activity of performance monitoring techniques, is not their core market.
> For CICS Systems Monitoring
1. BMC with MainView for CICS.2. IBM with Omegamon for CICS.3. ASG with tMON for CICS (observed with merit in this study).
> For IMS Systems Monitoring
1. IBM with Omegamon for IMS.2. BMC with MainView for IMS.
> For DB2 Systems Monitoring
1. BMC with MainView for DB2.2. IBM with Omegamon for DB2.3. CA with Insight (observed with merit in this study).4. ASG with tMON for DB2 (observed with merit in this study).
With regard to z/OS Systems Monitoring in general, there are three functional areas where BMC are strong, neck and neck with IBM, now marketing the Omegamon Candle products. It is somewhat of a surprise to see so few ASG tMON products referenced, while they enjoyed a wide circulation only a few years ago. ASG has probably suffered from its status as a small independent ISV, during the times of increasing consolidation. Additionally, during the last few years it appears that ASG has focused on Distributed Systems and Business Service Management (BSM) solutions.
> For DB2 Utilities
1. CA with a family of DB2 Database Management Solutions (Platinum, RC/Migrator, RC/Query, RC/Update, et al.)
2. IBM with DB2 utilities/tools & Optim (observed with merit in this study).3. Infotel MASteR-UtIL products.4. ASG with tMON for DB2 (observed with merit in this study).

PAg
E 26
this is still a very active market, for which CA has a dominant position since its acquisition of Platinum. IBM has entered this market more recently, but remains poorly represented because of the youth of its internally developed tools. Infotel is a small FrancoFrench ISV. BMC offers a comprehensive suite of tools functionally equivalent to that of CA, but we were surprised not to see their products represented from our survey results.
> For Networking Systems Monitoring
1. IBM with NetView and Omegamon for Mainframe Networks (IP).2. BMC with MainView for IP.3. ServicePilot with IPWatch (NBA, 360) for z/OS (observed with merit in this study).
Networking monitoring is an area where IBM has consistently provided tools for several decades, which explains the widespread usage of NetView.
> For Automation
1. IBM with tivoli System Automation (SA) for z/OS (plus GDPS for Disaster Recovery).
2. BMC with MainView AutoOPeRAtOR for z/OS.
We have listed two major products from our survey, although there are other solutions, such as those from CA, which did not appear in our study results.
> For Application Development
1. IBM (in order of popularity) with COBOL, Assembler, C, Java, FORtRAN, PL/I & QMF.2. Compuware with Xpediter and File-AID (DB2, CICS) family
(observed with merit in this study).3. Macro4 with traceMaster (observed with merit in this study).4. Software AG with Natural (observed with merit in this study).
Obviously IBM provides programming languages and compilers for their Mainframe platform. We then find Compuware, with a full suite of specialist tools for development aid. Macro4 entered the market with an offer that directly rivaled Compuware and this at a time when many customers were in serious trading (financial) difficulties. this ISV became a popular and niche supplier, where their positioning was successful, injecting competition into the sector. Please note; IBM recently introduced a comprehensive portfolio for software development assistance, which does not appear in this list, perhaps because of their relative immaturity. Software AG’s presence is explained by the existence of one Adabas user in our survey.
> For Configuration Management
1. CA with endevor.2. ASG with CCC/Life Cycle Manager.3. IBM with SCLM (observed with merit in this study).
MA
INFR
AM
E :
IBM
zSe
ries
Mai
nfra
me
Cos
t Con
trol
PAg
E 27
W
HiT
EPA
PER
In this market place, CA is the leader with a long history with one of the few existing products. ASG is an ISV with relative strength in Production/Configuration management. BMC has no products in this functional area, and usage of the IBM SCLM offering remains particularly low.
> For File Transfer
1. Axway with CFt (Synchrony transfer) and Interpel (Pelican).2. DDMS with tom
As previously explained, Axway has gained a position of dominance in the market, primarily via acquisition. the tom offering from DDMS has almost disappeared over time.
summary: stabilityFirstly, please note that not all sectors benefit from dynamic innovation for Mainframe software. While the function of Database Administration remains active due to the continuous technological innovations made to DB2, functions such as Configuration Management and Security move very slowly, with little worthwhile innovation. the Mainframe is a mature market, with products proficiently deployed, honed practices, with infrequent changes. Additionally, the maturity of Mainframe software products dictates that ISV’s are unlikely to change their business practices and so a customer is unlikely to displace an ISV, based on technical function alone. therefore, it is not uncommon for products to be deployed for 15, 20 or 25 years, and persist because their quality and relevance has been widely proven.
A few years ago, a significant event occurred, threatening this seeming state of equilibrium. IBM stated that if the Mainframe suffered from a perception of being cost prohibitive, it was not their fault, but the fault of ISVs who billed in a dishonest way so their tools were far too expensive. to encourage competition, IBM announced plans to develop their own offerings, through acquisitions or internal development of software in the areas previously not covered by IBM; therefore providing customers with solutions technically sound and financially viable. therefore Application Development and Database Administration tools were introduced, while the acquisition of Candle endowed the manufacturer with System Monitoring functionality. Some years later, it seems evident that the penetration of these IBM products remains low, especially as BMC, CA and Compuware have maintained their respective install bases. Once again, evidence of the remarkable stability for these ISV’s and their respective software portfolios.

PAg
E 28
z PLATFORM cOsT cONTROL
The Mainframe picture has been drawn in the previous two document sec-tions. We have identified the role of the Mainframe, we have outlined the technical environment and we identified its ecosystem of suppliers; all the jigsaw pieces are in place.
this following chapter is divided into three major sections, with several themes:
• Cost control for software. • Cost control for infrastructure. • Cost control for operations.
this identification and explanation for these themes are the result of work of the CRIP Mainframe group, work conducted from the experiences of each group member, from practices implemented and their associated results, with topics identified as important (if not major) for mastering Mainframe cost control.
Of course, there are certainly other practices and other topics. this subject is extensive and topical. We have no doubt that everyone uses their imagination and initiative in their business. however, we hope that the matters discussed below will help you explore new paths or to consolidate your existing efforts.
3.1 controling software cost
3.1.1 IBM contractual Arrangements
It is important to know the range of software licenses and associated contracts available from IBM. A proactive approach is needed to choose the best options.
Please remember that each software product is subject to a billing model described in a license, contracts are agreements offering greater trading tariff margins, potentially applying to several or more software products. All user companies have software licenses, but unfortunately, all do not negotiate contracts. Among these software contracts, the most prominent is undoubtedly eSSO (enterprise Services and Software Options), which we will discuss.
Over the years IBM has created a plethora of licensing models and contracts, which easily confuses their customers (See Figure 4 below). Potentially this modus operandi could be to gain the most revenue from their customers. this practice gives the Mainframe platform a bad image, which could lead senior business decision makers’ part with the IBM Mainframe in favor of simplistic and simple tariff models (including blanket licenses coming from the Distributed Systems world ; but be careful, the recent technological developments in the Distributed Systems world, namely virtualization, tends to add complexity to their licensing models). Moreover, this approach requires companies to acquire and maintain
3

MA
INFR
AM
E :
IBM
zSe
ries
Mai
nfra
me
Cos
t Con
trol
PAg
E 29
W
HiT
EPA
PER
specialized skills to manage these contracts and associated tariffs. this is not always the case, as some companies struggle to develop and maintain these skills. however, all members of the CRIP Working Group agree that detailed and further analysis is the only way to make sensible and prudent decisions.
Since the 2000s, the majority of Mainframe customers have moved towards as some might say «dependent» pricing. the IBM slogan then was «Pay only for what you need»; a beautiful promise. At first glance this type of software billing appears to be more favorable than those prevailing before, when the only machine power (e.g. MIPS) determined the amount of licenses and especially since the Mainframe configurations have «exploded» in size in recent years.
however, all is not as rosy as one might think, because this Monthly License Charge (MLC) bill is very complex with subtle nuances. Its underlying imperative seems appropriate, for customers to derive benefit. to conclude, all of the IBM software mentioned in the previous chapters, which have no direct competitors (I.e. z/OS, IMS, DB2, CICS, et al) are charged via the MLC mechanism, and specifically by an xWLC metric, machine by machine (or group of machines for customers eligible for PSLC Sysplex aggregation). there are also other types of billing metric, including base MLC, SALC and zNALC, but they are less widely used.
the following document chapters will highlight some tips and recommendations for mastering this seemingly devious WLC billing metric, to visibly reduce the cost borne by the Mainframe platform.
Other Mainframe software, for functions theoretically open to competition are charged as per an OtC (One time Charge + S&S – Service & Support) and «theoretically» are important, because in fact this type of billing metric is often seen encapsulated within a global business contract. typically this contract
Figure 4: IBM Mainframe Software Pricing timeline

PAg
E 30
framework is known as an eSSO (enterprise Services and Software Option), used by the respondents to our survey, and in fact, generally.the multi-year eSSO contract consists of several billable elements (Model dependent MLC, OtC, IPLA, Distributed Systems Software, et al) and corresponds to the overall approach we will discuss in the next chapter. In theory, this bundled approach allows the company to obtain a significant discount, but ultimately the contract may become very opaque and questionable, especially regarding the real benefits it delivers to the Mainframe platform. In fact:
• the zOtC (zSeries One time Charge) competitive (I.e. ISV) products become almost impossible to consider in a restrictive and arguably useless eSSO. Generally in this situation, an IBM zOtC product will be replaced by another IBM Distributed Systems product, while the desire should be to choose a competitive zSeries product from another ISV, without adding “shelfware” or useless products via the eSSO. Conversely, it becomes very difficult to know exactly how much such a product costs in these scenarios, as the eSSO is an overall figure, and explicit product costs are not identified.
• the low watermark MSU (CPU usage threshold) MLC is difficult to fix because if the resource amount is set too high, the customer may pay too much and if set too low, the associated discount rate is not very attractive. the only benefit of this low watermark threshold is that it allows, in principle, to determine the budget in advance except in case of uncontrolable over consumption.
• there is no doubt that the Distributed Systems IPLA products generate the real beneficiary discount, even if the actual prices of zOtC via an eSSO seem very attractive. however, the simple fact remains, the number of MLC eligible products remains low, when compared with the plethora of IPLA/zOtC products.
• It is difficult to withdraw from an eSSO agreement, unless there is an exceptional event, because policymakers prefer to renegotiate contract amendments rather than to challenge the underlying contract for fear of significant bill increases, especially for the Distributed Systems software.
the construction phase of this eSSO contract is therefore critical. We must negotiate as wisely as possible from the outset and be certain as possible with endorsements, OtC clarification prices, Sub-Capping, OtC metrics, exit clauses, MLC threshold flexibility, et al. Never has the saying “buyer beware” (caveat emptor) been more appropriate!
Finally, we must recognize that IBM has continued an attempt to innovate in the last decade or so for Mainframe software costs, in particular for new software like WebSphere. A new mechanism, IWP for WebSphere and latest generation zSeries Server (z196/z114) customers seems attractive and even easily competes with the Distributed Systems version of WebSphere, although this new «paradigm» message is not readily communicated or easily understood by customer decision-makers.

MA
INFR
AM
E :
IBM
zSe
ries
Mai
nfra
me
Cos
t Con
trol
PAg
E 31
W
HiT
EPA
PER
3.1.2 IsV negotiation strategies: holistic/generic or piecemeal/ad-hoc
Mainframe software can be broken down into three categories; business application software, which we do not discuss in this document, IBM system software (Operating Systems, transaction Processing Monitors and Databases), previously discussed, and finally other software systems. these software products can come from different types of supplier; IBM itself, major global ISV’s and lesser importance or niche ISV’s. two main strategies are available to the customer in their dealings with these suppliers, either rationalizing the number of ISV’s or managing multiple contracts.
A. The Overall ApproachUltimately the overall approach minimizes the number of contracts and suppliers. One is left with major contracts in terms of financial amounts, which include a lot of software. this approach may retain only one or two suppliers. to this end, the customer places a requirement that includes the maximum of software components and functionalities expected for the supplier to deliver. Such functions will include Operations, Monitoring, Performance Management, Data Management, et al. therefore the objective for each supplier is to encompass the widest possible spectrum of requirements.
the first consequence of this approach is to limit the choice to only three suppliers with an extensive software portfolio : BMC, CA or IBM. Arguably only these major ISV’s are indeed able to provide a large part of the software functions required, which limits the need of software from other providers. Inevitably this dismisses a great deal of other ISV’s.
the second consequence of this approach is to leverage from the size of the contract to create a lever for negotiations, mainly financial. this is a commercial buyer logic, it serves costs objectives. It is not a technician logic, so the technical performance of the software components is not the main focus. We must therefore accept this kind of approach does not deliver the best software product in terms of technical quality for each and every product, as we only can get what the supplier offers.
Benefits of this approach• Arguably the most important lever for negotiations; the more you buy from a
supplier, the more they discount with favorable terms. the buyer’s position is stronger than on a case-by-case basis.
• A compound impact of overall discount, related to the volume purchased.• the opportunity to negotiate with long durations of contract commitment in
order to get, even more benefits.• Access to billing practices that are more flexible when compared with a
piecemeal (case-by-case) transaction.
A common reason for adopting this approach is to safeguard against any increased MIPS/MSU usage for several years. Indeed, for many years this type of agreement was the only situation where suppliers agreed to a contract independent of the

PAg
E 32
installed Mainframe capacity. For the company, this meant that the growth of its platforms did not impact upon their software costs for at least three years, after which there was a new round of negotiations and adjustments. this type of agreement is especially interesting in contexts for the consolidation of Mainframe resources, either because of company merger or Merger & Acquisition (M&A) activities. these consolidation activities generate challenges for the customer, as they inherit new platforms, and must consolidate software, while CPU (MIPS/MSU) capacity planning is difficult, as the growth of the new workload is not necessarily known. therefore this type of agreement provides a protective tunnel contract, pending the timeframe when operations once again become better controlled.
this proposition is also an interesting model if the customer needs to make changes to software within the portfolio of a major ISV. Indeed, the holistic approach often gives access to the majority of a software portfolio from an ISV, allowing for a potential logical software interchange. Again, it is appropriate in a Merger & Acquisition (M&A) scenario to change some of the software installed. For example, a contract with the supplier gives access to 12 of its software products. If the customer replaces or eliminates one of these products, they have a “credit” to select an alternative product from the portfolio. For the ISV, this principle generates customer loyalty, and for the customer, more flexibility and cost savings.
constraints & limitsthis several year contractual agreement does not allow for «real time» changes associated with software cost, if the company situation changes. If optimizations deliver a decrease in CPU power for the Mainframe platform, the contract continues until completion, without adjustment. We must plan for this situation during the negotiation phase, always a delicate subject. the same applies for removal of software belonging to the enterprise (mass) contract, where the company continues to pay for all software associated with the contract, not just the used software. the customer does not benefit from their efforts in either of these cases until the end of the contract period. therefore this practice is double-edged, with pros and cons, as this type of contract protects in times of uncertainty, because it freezes the situation, but the financial flexibility is diminished.
the company must move very closely with relation to their chosen supplier, with a lot of software positioning from the same ISV. there is a risk of pseudo imprisonment, or no room for maneuver. hence this conundrum, by entering into such contracts, it is always important to define the end point, as soon as possible. this observation has both contractual and technical aspects.
Firstly in the contract, we must ask in advance from the supplier and upon signature of the contract, the question of what happens on the day of release (exit). We must negotiate the terms of potential cost in according to any evolution of MIPS/MSU installed. We must also consider alternative techniques or replacement products for the ISV’s software, knowing that if problems occur, we have an alternative. then the company will encounter again the issue of termination of this contract from 12 to 18 months in advance. What to do? Stay on this type of agreement?

MA
INFR
AM
E :
IBM
zSe
ries
Mai
nfra
me
Cos
t Con
trol
PAg
E 33
W
HiT
EPA
PER
Migrate to competitors? We must prepare for this deadline and anticipate the consequences of contractual change and associated technical choices. If these contracts had such a bad reputation in the past, it is precisely because users do not anticipate contract termination, with associated high risk and big financial penalties. An ironic scenario can be the consequence with a contract of this type over three years, where the company spent 18 months optimizing the Mainframe platform for this contract, and potentially the next 18 months to consider the means of escape, if ever the supplier relationships deteriorate to a point of no return.
We also have to assess the length of the contract. today, the typical duration is three years, which is a good pace for negotiations, but there are longer contracts, over four years, maybe generating more stability. Beyond four years, there are risks, because the context of enterprise computing changes rapidly.
Finally, in a situation of overall approach, one must ask whether the agreement covers contracts for the acquisition or rental of software. this question weighs heavily, am I the owner of software for which I pay a service, or simply a tenant with the right to use? In acquisition mode, the agreement covers the purchase price of the software package and the rate of maintenance. At the end of the software contract there is a reassessment to the evolution of MIPS and MSU, and agreement on an updated tariff. In rental mode, the buyer and the publisher agree on use rights, but at the end of the contract, software usage is in question, depending on renewal or not. In the case of acquisition, if the company decides to separate from their supplier, the software stays with the company, and they can continue using the software via a simple maintenance mode, without license code updates, or even maintenance-free time to allow for a plan of disengagement. In a rental agreement, if the relationship deteriorates, arguably and generally the software disappears. the lease contract may be attractive for customers with little budget, but this customer company can be at any time subject to change threat from their contracting software supplier.
the last constraint regards what kind of contract is required to maintain very good relations with the supplier, regularly working with them during the contract, and well before the renegotiation, benefitting from true relationship management.
B. The Piecemeal (case-by-case) Approachthis traditional and well known approach (best of breed) is to conduct tenders and benchmarks by functional area, and choose the best product, for the best price. the objective here is based upon on the systematic review of competitive market solutions and suppliers based on functional need and cost. this is a product rather than contract driven approach and should choose the solution that best fits the need. the company agrees to have so many suppliers, knowing that the contracts are not very difficult to follow in the Mainframe environment, and certainly far less complex than for Distributed Systems (which require asset numbers for processors, cores, hypervisors and virtual machine tasks, et al).

PAg
E 34
Advantages• Benefiting from continued competition between suppliers that drives them to
adjust their prices. Be careful though not to practice false competition by not always buying from the same ISV, as competitors will quickly realize it out and will not forget it the day when you need them.
• Functional coverage for the products best suited to customer requirements.• the ability to contact all suppliers (ISV’s), major, intermediate and niche.• Adapts the contractual model for each group or type of software. In a
comprehensive (enterprise or Mass) approach, there is a uniform licensing model, which is so imprecise, whereas a piecemeal approach can apply for a MSU license, for the partition, or on any other model (e.g. Value Units, Number of resources, et al), optimized as per usual.
• Immediate cost reduction during software rationalization; if the company ceases to use software, they stop paying for software rental or support.
• No global or generic concerns or significant risks for the overall Mainframe Information System in case of contractual problems, technical or business, with the supplier. the company is not challenged with replacing an entire software portfolio (maybe tens of software products), but just enters the piecemeal software selection process once again. this method has less complexity compared with a packaged (enterprise or Mass) contract, where the customer expended one or two years effort to implement all the software included in the contract.
Disadvantages• Obligation (duty-of-care) to manage relationships with many suppliers (ISV’s).• Levers for commercial negotiation are smaller when compared with a
packaged deal. the customer will prefer to negotiate deals based on large volumes, as opposed to piecemeal deals. therefore negotiations are more technically than contractually based.
• Difficulty in maintaining a greater technical consistency, particularly in regard to the consistency of software versions with z/OS and associated major subsystems. For zSeries, software companies are rapidly adopting new versions of Operating Systems and other major IBM Mainframe components, generating updated versions of other software products. With one major partner, this update requirement is simpler. With several suppliers, we must make an effort to maintain platform consistency, requiring more technical effort, and remain mindful of technical consistency for interrelated software products.
• Occasionally some ISV’s fall behind in the delivery of new versions and updates to their software products, generating currency and consistency challenges for the customer. Larger ISV’s generally have the resources to maintain currency and consistency, whereas a niche ISV may have more difficulties. We must be mindful of this type of interaction and integration of software, vis-à-vis z/OS and its major subsystems. the more software we technically integrate into our environment, the more it requires a supplier that is proactive and diligent to facilitate these changes.
• the non-homogeneity of the customer software environment generates greater difficulty in integrating technology and a proliferation of ergonomics.

MA
INFR
AM
E :
IBM
zSe
ries
Mai
nfra
me
Cos
t Con
trol
PAg
E 35
W
HiT
EPA
PER
this is especially true for Systems Management software operation. Sometimes we deprive ourselves of technical and functional synergies when we deploy a diversity of suppliers. therefore, with this type of approach, we must always be mindful to consider small groups of packaged applications from a single ISV, to deliver functional or technical uniformity.
As a conclusion to this chapter, beyond the choice between these two strategies, there are additional common practices to consider:
Practicing regular competitive tendering with ISV’s; it should be clearly noted that the customer is not duty bound to engage with an incumbent ISV, but able to replace them if necessary. Sometimes we even go through with the process, learning how to break ISV relationships, even if harmful, whether radical or not, and accept the effort of a migration job. Such a decision is costly, with significant effort required for Change Management, project days for training and technical activities, but sometimes the savings are several million ($ or €) per year. With regret, we must go there from time to time.
Another good practice, but unfortunately too rare; we should regularly test software and have a continuous process of creation and Proof-of-Concept (PoC), even when we are not terminating or renewing an incumbent software product. Maintaining a good knowledge of the software market for a few major components, by regular testing avoids, helps detect emerging ISV’s and products, for when the day of renewal or replacement arrives. In fact, this attitude is becoming scarce, and it’s unfortunate for both the contractual process and the technical approach.
this overall approach has obvious limitations. No ISV covers the entire functional requirements for a Mainframe system, or is missing a product in its portfolio, or their product is unsuitable or unusable. Some diversification of ISV’s is therefore inevitable. We must engage with and manage our suppliers, which is nothing embarrassing in itself, but requires us to be very careful with our attitude to ISV’s, for these software additions. An ISV will know they will only do a low volume of business with a company already engaged in a comprehensive (enterprise or mass) approach with one of their competitors, leading them to stiffen their business approach. A smaller niche ISV will demonstrate flexibility, because their ambitions are not necessarily unreasonable, whereas a bigger rival ISV will try to maximize the limited opportunity they’re presented with. It is better to get software additions with smaller niche as opposed to larger ISV’s.
3.1.3 IsV contractual arrangements: licensing modes & billing
In the introduction, please recall that software, rather than hardware, provides ample scope to bargain because of its financial model. Indeed, once developed, software costs nothing to manufacture. Costs of maintenance and evolution are supported by the installed user base, which means that each new customer brings additional revenue for the ISV. there is ample opportunity to negotiate, and sometimes even get the software for free, as the ISV will get revenue out of maintenance.

PAg
E 36
then remember the obvious; certain workload should not run on the zSeries platform. Particularly applications that use a lot of CPU cycles. historically, some companies processed scientific and technical computing applications (hPC) on the Mainframe. the Mainframe CPU cycle is expensive, so this is not a good idea.
Should I buy or rent? Regarding software, the general tendency is to consider the acquisition route as more attractive because of the lower support renewal rates. Over time the rental mode loses its appeal because of increasing cost (tCO). Whichever mode is chosen, you should check that the contract has perpetual use rights, including in case of termination, for maintenance. It always depends on the contracts. Some ISV’s consider that without maintenance payments, software use is restricted or prohibited (e.g. they will not issue new CPU based license codes).
Let’s summarize the issues associated with software licenses; the zSeries platform is often penalized because of its centralized nature. therefore all Mainframe environments (e.g. test, Production, et al.) generally comprise a single Mainframe platform, typically measured by global MIPS and MSU resources, generating an initial mass metric. this is often the number one argument in favor of the Distributed Systems platform. When installing software, the company compares the cost of platform acquisition. So the zSeries platform suffers from this effect of initial mass, whereas the deployment of a Distributed Systems environment can start inexpensively on a single server with low power. the whole game of ISV negotiation and associated customer creativity is to devise ways to erase this effect. Because in the Distributed Systems world, there is of course a drawback; the entry cost is low, but if the software is then deployed on a significant number of machines, costs explode, and the difficulties of monitoring and management appear.
We must be innovative with our suppliers, hence the importance of continued work over time, while avoiding making gestures with ISV’s that this is not a sustainable position. Let us be creative and innovate on how to be licensed and billed, exploring other paths than the classic billing method of installed MSU, disadvantageous because of the high entry cost, but also because the MSU increase may have no connection with software usage (e.g. CPU growth compared with business usage).
we can distinguish four models:
1. the IBM usage based model, with a principle of billing the customer, measuring the component activity where the invoice is proportional to the activity. Initially, the customer is committed to a volume of MSUs or MIPS, which is a subset of the environment (e.g. test, Production, et al.) MSU established by estimating what the software will consume. then the customer and ISV agree on how to measure the actual usage, when, how, how often, et al? In some cases, this measurement tool is bundled with the software. Sometimes the possibilities of measuring the activity of certain components fail technically. this model has the advantage of avoiding invoice payment as per the installed MSU or MIPS.

MA
INFR
AM
E :
IBM
zSe
ries
Mai
nfra
me
Cos
t Con
trol
PAg
E 37
W
HiT
EPA
PER
For the customer, this avoids the requirement to pay based on capacity. During its time, this billing method has raised many hopes, but did not completely achieve the desired results. For example, this billing method is practiced by Compuware for Development tools software products.
2. In the absence of MSU measurement tools for whatever technical reasons, we revisit the contractual agreement. For example, in the case of a development tool, installed on a Mainframe of 20,000 MIPS capacity, the customer believes its Development environment is 2,000 MIPS, proposing an invoice based on the 2,000 MIPS. this is known as confinement contract. this model applies well to functions and activities classified as isolated, becoming a source of controversy for functions more integrated or embedded into the entire environment (e.g. test, Production, et al.). In the case of Development, assessing the capacity of partitions is not complicated, but in the case of a database associated with a given application, which only uses 5% of the environment capacity, how to we determine the use of said database? It is then necessary to find other methods of assessment. For example, development activities and transient fusion-grouping contexts.
3. Another method is to perform by partitioning, separating functions to avoid globalizing costs. An application installed on an isolated partition will only be charged in proportion to that partition. this very practical solution works much better for enterprise application software than for technical software, more transverse by nature. It is also a preferred technique in the case of business mergers, avoiding software license payment based upon the totality of the Mainframe platform. this method is typically used for packaged applications.
4. the last method, now rarely used, but one that should be explored, being able to derive billing models based on work units (business usage) as opposed to Mainframe technical indicators. this approach is unfamiliar to users who do not think about this method during their negotiations (e.g. security software, billing per user, not per MIPS). therefore, if in the future the number of users increase, the software bill will also, which is perfectly legitimate since the goal is to protect the user. however if there is an increase in MIPS, there will be no increased costs, since the service remained constant. the challenge is to find the unit of work associated with product usage or associated business activity, as a way to measure, trace and audit this unit. We must be imaginative and creative. these are rarely used areas of discussion and negotiation with ISV’s, who are still fixed with traditional (I.e. CPU) computer culture. But as It Operations managers increasingly care about the impact of their activity on business, this type of agreement is on the agenda. For example our study encountered some technical software charged based upon the number of concurrent users, the number of CICS transactions per year, the number of business locations.
PAg
E 38
3.1.4 MLc: controlling the billing level
3.1.4.1 The IBM billing method
generalWith regard to billing, z/OS software can be separated into two large groups.
• A software acquisition method named zOtC (One time Charge) that we will not discuss in detail. the only important thing to remember is to start negotiating the purchase of software based on the real needs of the enterprise, as this type of product is generally eligible for sub-capacity, meaning that the company can invest proportionally, based on actual consumption, rather than the zSeries server capacity.
• Software that can be rented; based on a MLC (Monthly License Charge) metric. Most of these software products are eligible for tariff based usage VWLC (Variable Workload License Charge).
• there are also products leased at fixed cost (known as Flat MLC). these products are generally 3-5% of the total invoice amount: nothing more will be said about them in this white paper.
In the following sections, we focus exclusively on VWLC eligible products, which typically constitute the bulk of the high-cost software. For each software product, the amount payable is based upon associated partition activity. the z/OS system continuously records usage information on the partition (LPAR) where the software runs, including:
• cPu consumption (Msu/MIPs) at defined time intervals that can be used for Capacity Planning.
• Msu consumption (Millions of service units) per hour. the average elapsed time is recorded as well as the moving (rolling) average over the last 4 hours (R4hA MSU).
what is the difference between MIPs and Msu?the MIPS measurement is a unit directly related to processor power, whereas a MSU is a measurement of ‘Computing Power’ consumed to perform a task. (Years ago, MSU was the amount of processing work a computer can perform in one hour, today it is a measurement unit defined by IBM.)
Specifically, a program that in 1990, took an hour to run on a machine of that time period, maybe will run in 5 minutes on the latest z196. however, it will consume exactly the same number of MSU on these two machines. the ratio MIPS/MSU changes with each new generation of hardware, keeping this measurement stable over time (relatively speaking). therefore it is used to determine the power consumption and billable.

MA
INFR
AM
E :
IBM
zSe
ries
Mai
nfra
me
Cos
t Con
trol
PAg
E 39
W
HiT
EPA
PER
Metrics used in VwLc billing
With VWLC usage billing, the monthly billing level is established for each machine (CPC) for the peak of the sum of the average usage consumption. the period (time interval) chosen is the time when this sum reaches its highest level during a billing month.
calculation mode
For each eligible VWLC software product, we consider all partitions on each server where it processes. It denominates the R4hA (Rolling 4 hour Average) which is the moving 4 hour average of MSU consumption for each partition. the invoice is established upon the maximum value reached in the billing month by the sum of the R4hA for all partitions processing the software.
The following formula summarizes this method:
Figure 5: VWLC Rolling 4 hour Average (R4hA) Formula
NB: This is the maximum combined amount for all R4HA metrics, and not the sum of the maximum MSU usage achieved for each LPAR, which so proves far more advantageous to the customer.
In this case, the 900 MSU usage figure (970 MSU installed capacity) corresponds to the maximum MSU amount consumed by all partitions in Period 3. this example corresponds to the green curve in the above figure (graph), for one software product. So for many software products, there will be many more maximum MSU usage points for the associated software product.
this calculation is then performed for each physical zSeries server (CPC). the total MSU values obtained are then used to create a software invoice per server, or if in PSLC (Sysplex) aggregation mode, their combination is used to determine the overall software invoice.
ObservationsSoftware is billed based on the consumption of partitions where processed and not according to its own consumption, an essential difference, which can lead to paradoxical situations. For example, the CICS transaction Processing (tP) monitor has very reasonable CPU usage during the day, and has minimal usage overnight during batch processing. Yet, on a machine that reaches its maximum consumption during these batch periods (and it is the case for many of them), the billing will be based on a R4hA during the overnight batch processing, and thus higher.therefore, ideally maybe this software is not installed on all partitions, and instead we should monitor the maximum usage of R4hA metrics for several partition groups, to reduce cost.
Figure 6: VWLC Rolling 4 hour Average (R4hA) example

PAg
E 40
If we base all partitions on the underlying and base z/OS usage, then DB2, CICS, et al usage will follow, so perhaps a group of partitions for DB2, IMS, et al, might be a better option.
Finally, the use of tools and methods of controlling the software (SCRt) invoice, as described in the following chapters, will have a direct or indirect influence on software billing.
We should pay very close attention to the localization of software, where it is advantageous to focus some software on a limited number of partitions. But this may be a paradoxical approach, where Sysplex and continuous availability objectives must be recognized. It was forever thus, the business priorities dictate the choice.
there is a ~10:1 ratio between the highest (10) and lowest (1) incremental MSU cost related to installed capacity.
An example of z/OS pricing installed on a z196 (AWLC) in France:
Please note that the upper and lower thresholds for each level (MSU) are common for all VWLC products. however, unit prices vary from one product to another. the first cost is fixed, so the customer always pays the €4,146 cost, for 1, 2 or 3 MSU.
this incremental MSU cost reduction metric has the effect of minimizing operating costs related to increased MSU power (e.g. data center consolidation). Conversely, it also minimizes the cost savings when porting an application from one Mainframe to another, since in only applies to the incremental MSU metric, which is always a lower cost per MSU.
In any economic simulation of this type, we must be suspicious of any abuse and linear costs. It is therefore essential to ask IBM to simulate the cost evolution. they alone have the necessary data and tools to produce reliable cost figures.
Figure 7: MSU Pricing Structure – Declining Cost for Additional Incremental MSU Usage
Figure 8: z/OS via z196 & AWLC Incremental MSU Pricing example
Product Name Base Level 1
Level 2
Level 3
Level 4
Level 5
Level 6
Level 7
Level 8
MSU: Lowest level 1 4 46 176 316 576 876 1316 1976
MSU: highest level 3 45 175 315 575 875 1315 1975 MAX
z/OS V1 Base Cost E 4,146 385 315 226 120 92 64 48 38

MA
INFR
AM
E :
IBM
zSe
ries
Mai
nfra
me
Cos
t Con
trol
PAg
E 41
W
HiT
EPA
PER
Measurementthe previous review demonstrates a requirement to measure CPU consumption usage (metrics) for physical zSeries servers (CPS), as well as the evolution of the associated R4hA as per the distribution of software products on all partitions and servers.
The monthly invoice calculation based on scRT reportseach month, the customer provides IBM with a summary of the usage (MSU) consumption for each server and for each eligible VWLC product, , which acts as a basis for software invoicing.
these values are calculated by the methods described previously. For each hour in the billing month, the values used for the “MSU Billing” of each partition are added. the peak time in the month associated with the “highest amount” is used for billing purposes.
Below is an example graph showing the “billing” month, accumulated for each partition.
Figure 9: example Multiple LPAR MSU Usage for SCRt Report Submission
In this example, the highest value is for 28 July, from 12:00-13:00, at 767 MSU. It will therefore be the reference time for billing calculations from all partitions. A product eligible for xWLC (e.g. AWLC, eWLC, VWLC, et al) billing running on all partitions of the CPC will be charged based on the “MSU Billing” calculated for 28 July, from 12:00-13:00, at 767 MSU.
3.1.4.2 The problem of smoothing (consolidating) peak loads
As per the previous commentary, peak workloads not only have a direct influence on software invoice (operating costs), but also on the sizing of servers purchased (investment). It therefore seems compelling for two reasons to eradicate these peak loads.
Ideally, one could imagine to perform a better distribution of workloads over time (e.g. via the batch scheduler); a possible solution, if the peak load is primarily related to batch activity. however, such an implementation can be long and tedious, because it would impose a general review of production planning, and would generate for certain, unavoidable business constraints.
We ponder and perhaps still use these methods in marginal and the most extreme of situations.
this operation is even more problematic because operations control is rarely applied for transactional activity on zSeries servers, and must always deliver service commitments (SLA).
the solution is to make the most from all of the available resources, and this is the principle of operation for all computer resources available from the market, while we will review some available options, as follows.
the nature of the workload activity (Batch or On-Line/tP) during peak load times will determine the choice of tools to implement optimization:Peak load activity related to batch processing can be reduced by use of simple and rudimentary tools, whereas more sophisticated tools are required if the peak is originated from tP (on-line) activity.

PAg
E 42
3.1.4.3 The methods and controls for controlling the software invoice
here we describe the 3 primary existing systems and tools, from simple to more advanced: • Soft-Capping (DC: Defined Capacity) – Applied at the partition (LPAR) level. • Group Capacity Limit (GCL) – Applied to a partition (LPAR) group. • AutoSoftCapping (ASC) software – Applied to a group of partitions (LPAR) or server (CPC).
Soft-CappingSince 2004, it has been possible to smooth MSU consumption during a 4 hour period for any partition limit via an arbitrarily chosen value. A new metric is thus taken into account for calculating WLC billing after Soft-Capping activation. this is the “Defined Capacity” or “DC”. this value, expressed as MSU, is implemented via hMC at the partition level. the blue line from the graph below (Figure 11) represents a Soft-Capping example.
this dictates the MSU billing limit we wish not to be exceeded for the partition. the aggregated sum of DC MSU totals represents the limit of MSU for software billing.
> The rule of Soft-Capping:From the graph below (Figure 10), when the R4hA (green line) exceeds the DC (blue line), the system limits (Caps) instantaneous consumption IMSU (red line) at the DC level.
therefore, the SCRt calculation does not systematically retain the R4hA, but the smallest MSU amount, either R4hA or DC:
Figure 10: SCRt soft-capping calculation formula – R4hA or DC
In the graph below (Figure 11), the Billing amount (purple line) shows a level of 380 MSU as per the DC, whereas the R4hA reached 450 MSU.
Figure 11: Workload soft-capping example – R4hA vs. DC
therefore soft-capping is a static and manual metric, adapted for a specific partition (LPAR), but not for overall management (e.g. many LPAR’s, 1 CPC or many CPC’s).
Soft-Capping Adaptation: Group Capacity Limit (GCL)An evolution from the original soft-capping design emerged from the z9 and z/OS 1.8 architectures. It is now possible to define groups of partitions that are assigned limited consumption values (MSU). each partition within the group utilizing MSU resource, as per its associated PR/SM weight setting.
A basic way to use this mechanism is to define an isomorphic (e.g. GCL MSU applies to every LPAR in the LPAR group) group for each zSeries server (I.e. containing all of the server partitions) and assign a soft-capping value. It is a simplistic algorithm to reduce overall consumption, and thus the resulting software invoice. however, the daily usage of this algorithm is strictly reserved to highly skilled specialists.

MA
INFR
AM
E :
IBM
zSe
ries
Mai
nfra
me
Cos
t Con
trol
PAg
E 43
W
HiT
EPA
PER
AutoSoftCapping: an advanced software toolSince 2006, the AutoSoftCapping software product (from zCost Management) provides flexibility for IBM Mainframe soft-capping, for many models of servers (z900, z9, z10, z196) and regardless of the z/OS version (1.7 and onwards), or in other words, for any environment that supports soft-capping.
the underlying principle is to optimize the “Defined Capacity” available, by sharing MSU resources between the assigned Mainframe partitions. A sophisticated algorithm allows greater control and flexibility for MSU sharing, considering the MSU requirements for each partition, safeguarding at all times the maximum availability.
the software solution can also dynamically manage different activity profiles based on a specific period (e.g. end of month, every tuesday, et al), adapting soft-capping requirements on a partition-by-partition basis.
Finally, the reporting and graphical interface gives different users (I.e. Managers, Directors, technical, Operations, et al) shared visibility and an understandable level of soft-capping activity information in a z/OS complex.
AutoSoftCapping allows for: • Msu resource optimization and allocation between partitions. the limit introduced by this
Autosoftcapping algorithm is variable depending on the partition needs, dictated by MSU and priority. It becomes much less penalizing than the fixed limit introduced by the basic IBM (Defined Capacity) soft-capping metric. With AutoSoftCapping, when a partition does not reach the MSU ceiling which it is entitled to use, it allows other partitions to use the MSU quota it does not need.
• Billing control, the Defined Capacity MSU total is permanently controlled by AutoSoftCapping. this helps to keep it below the level required with simple IBM soft-capping, while achieving better performance.
• A simple and clear vision, with real-time behavior scores and billing level, with “reporting” based on simple and understandable graphs and tables, for all relevant Mainframe personnel, introducing a common language for the entire company.
Elements of comparison between these soft-capping tools • the basic soft-capping (Defined Capacity & Group Capacity Limit (GCL)) are features
incorporated within the IBM hardware architecture, available at no additional cost. the configuration of these products is dynamic (as per operational intervention/command) and accessible from the hMC SOO (Single Object Operation) mode, for example, the PR/SM weight parameter.
• the AutoSoftCapping product has increased automation and dynamic optimization benefits, and also provides dashboards for real-time control and management reporting. however, this software product is not free.
• From a productive pros and cons viewpoint, it is inefficient to use more that one of these soft-capping tools simultaneously. everyone must select their preferred mechanism, according to their objectives, budget, and human investment required to manage such systems. In particular, good practice usually advise not to use these soft capping products concurrently with the ancient hard capping, a far more restrictive mechanism which caps the instantaneous (and not the average) MSU consumption . Its use is generally limited to very special cases, especially associated with contractual obligations, vis-à-vis some software licensing models.
3.1.4.4 Survey feedback and recommendations
Now accepted as a general practice, as such, basic soft-capping does not need any specific commentary. We will now focus on alternative methods of MSU optimization, as follows.
case 1: using group capacity Limit (gcL)this method has the advantage of delivering more predictable MLC based software amounts, and in practice decreases MSU utilization by ~10% for customer workloads. the significant disadvantage is of course the risk of degrading the quality of service and associated delay in business deadlines and SLA metrics (e.g. batch processing, transaction response times, et al).

PAg
E 44
therefore the challenge is to control the GCL MSU parameter setting for cost optimization, without penalizing performance (business processing).
conditions for success: pre-requisitesAs we have demonstrated, the Group Capacity Limit (GCL) function controls the CPU globally available, with no possibility of knowing which workload will be penalized. this function is in fact artificially capping the server in a situation of duress or high-workload.
to avoid disaster, it is therefore mandatory to have a management policy setting effective and realistic priorities and to influence the level of MSU management for each partition.
In particular, for global constraint scenarios, the PR/SM partition weights for low-priority workloads (e.g. Development, test, et al) must be sufficiently low and activity below their usual consumption, to safeguard that Production partitions are not constrained. Similarly based upon a WLM score, workloads classified as “Discretionary” must be of sufficient priority for the system to make trade-offs in times of constraint. Once these conditions are met, the most effective way to use the Group Capacity Limit (GCL) typically exists by defining a GCL (capping) policy for all server partitions.
therefore soft-capping on specific partitions becomes irrelevant under these conditions (with exceptions, for example, when it is necessary to meet certain contractual obligations with respect to certain software vendors, including IBM). therefore this approach provides an extra level of cost-control, but the question of performance still remains.
Finally, it is essential to have tools in place to monitor the daily R4hA. this allows the measurement of Group Capacity Limit impact during its implementation, to identify when it occurs, and to what extent.
Standard Mainframe systems measurement tools (e.g. RMF, CMF, Monitors) can be used for this measurement. We can also build queries directly from SMF records, which is somewhat more of a laborious operation.
ImplementationSince there is no reliable predictive model for this GCL implementation process, the only implementation method is by taking small successive steps, which can be easily supplemented with careful monitoring. Our experience shows that if we follow this careful route, it safeguards us from any adverse consequences.
For example, we can start GCL implementation during a period of normal activity, with a value equal to the typical monthly peak load, gradually declining in steps of 5 MSU.
Observations & Recommendationsthe implementation of Group Capacity Limit (GCL) typically reduces the MSU resource requirement of zSeries servers.
Without doubt, GCL is constrained by its lack of flexibility and dynamism, but its basic function has interesting features. Diligent and careful implementation via the few basic precautions previously outlined can safely make a minimum MSU gain of ~5% (sometimes more depending on the customer workload).
this method demonstrates the possibility of lowering the MLC software bill, albeit in relatively small proportions (but still worthwhile), and so generally painless.
It is also a simple way and without additional cost to become familiar with soft-capping techniques. We can then evolve with more sophisticated tools, for additional cost, if further analysis demonstrates the cost reduction viability of such an approach.
case 2: using Autosoftcapping (Asc)the ASC software solution differs from GCL as per the following: • MSU distribution is based on the immediate (instantaneous) needs of a partitions score (and
not according to its PR/SM weight). • the soft-capping level for a server (CPC) may be variable, ranging between a minimum and
maximum value, contrary to GCL, which accepts only a fixed value. this allows for more

MA
INFR
AM
E :
IBM
zSe
ries
Mai
nfra
me
Cos
t Con
trol
PAg
E 45
W
HiT
EPA
PER
significant gains to be delivered. • this tool has a web interface to visualize the soft-capping situation in real time, with a
standard range of 36 hours (maximum 96 hours). • the objectives and definitions for soft-capping partitions and servers are managed and
implemented by the software (not via hMC that requires access rights via a particular profile).
• the tool supports multiple Mainframe servers from one unified focal point. • Profiles (policies), as per customer requirements, can be defined and activated automatically
via a schedule. • Depending on the scenarios encountered, alerts can be generated via the logs, and
communicated by email, SMS, et al, safeguarding better responsiveness and management of exception situations.
• Finally, a simulation tool is available from the supplier, identifying potential MSU. It contributes to a particular implementation of soft-capping, calm and controlled.
With the ASC tool, two modes of soft-capping management are possible: • Unconstrained (Minimal soft-capping, as per associated policy, during periods of high MSU
usage). • Constrained (Optimized soft-capping, as per associated policy, reducing cost, safeguarding
performance).
the gains achieved with ASC exceeded those achieved with GCL, in the same context, reaching ~12-15% MSU reduction.
For unconstrained mode, only achievable with ASC, below (Figure 12 & Figure 13) is an implementation example.
unconstrained soft-cappingthis mode’s main objective is to optimize MSU usage, and the associated WLC software bill, during maximum workload activity. In this mode, the Quality of Service (QoS) is preferred (no constraint applied to partitions). the MSU reduction will therefore be minimized for this high activity workload profile, but it remains achievable, without impacting performance.
the graph below shows the behavior of a z10 server with a capacity of ~3,500 MSU without soft-capping, from 30 September-02 October 2010 (peak billing period for September 2010).
Figure 12: Unconstrained workload example – R4hA vs. SCRt & IMSU analysis
this graphical analysis is characterized by the three following points: (1) the maximumR4hA value is 2,777 Msu, as per 01 October at 12:15. (2) MSU consumption (IMSU) falls quickly and sharply from 00:00 (end on-line day/tP activity). (3) For this profile, the billing level, calculated by the SCRt process will be established at
2,754 Msu as per the 01 October 12:00 time period.

PAg
E 46
Figure 13: ASC soft-capping workload example – R4hA vs. SCRt & IMSU analysis
the ASC tool will enable us to act upon and optimize this workload profile, due to its dynamic and variable soft-capping optimization abilities. By setting the ASC thresholds, Minimum at 2,000 Msu and Maximum at 2,800 Msu for the server (CPC), we observe the following behavior (Figure 13): (1) MSU consumption levels (IMSU) are not changed and so the R4hA remains unchanged. (2) With the implementation of soft-capping (DC), some partitions are capped (I.e. DC <R4hA),
but their level of consumption (IMSU) remained below the associated DC, this capping will have no impact (capping without constraint).
(3) With this change that lowers the DC during the period with the highest R4hA, the billing level reduces to 2,545 Msu, corresponding to the 01 October 11:00 time period. this represents a 209 Msu or ~7.5% decrease for the billing level.
Of course, this scenario is only possible if the activity profile of the machine is suitable. If the maximum activity peaked for 4 consecutive hours, it will be necessary to switch to constrained mode to reduce MSU consumption. this would generate significant soft-capping during the 01 October 11:00-12:00 time period. thus this is the trade off, as demonstrated in this example; obtaining additional MSU reduction gains, is at the expense (reduced performance) of the service.
Observations & RecommendationsSoft-capping, processed with the ASC tool, allows us to consider using alternative options to those associated with GCL, delivering bigger benefits.
Whatever technique or software is deployed, soft-capping implementation requires extensive analysis, and consultation with those who administer environments (technical, Design and Operations), and finally, a strong shared commitment by all in the company.
through the simulation tools available with ASC, it is possible to run implementation (simulation) scenarios of soft-capping from previous time periods, to refine the associated server and partition parameters, identify any benefits and/or performance constraints, to finally develop pragmatic and realistic MSU savings, to lower the WLC (SCRt) software bill. this advantageous software tool enables a rapid implementation of controlled soft-capping.
Finally, such tools are required to master MSU (CPU) consumption levels, and meet the expectations and the contractual commitments associated with some major software suppliers.

MA
INFR
AM
E :
IBM
zSe
ries
Mai
nfra
me
Cos
t Con
trol
PAg
E 47
W
HiT
EPA
PER
case 3: Investment (Procurement) PolicySome clients choose to invest in CPU engines in anticipation, for a period of three years, when purchasing zSeries Mainframe servers. this time period roughly corresponds to the lifetime of a generation of servers (e.g. z9, z10, z196/z144, et al).
Arguably, this policy allows for better price negotiations when buying from IBM. In each case, considering projected growth on one hand, the availability and value of money for each customer on the other hand, the calculation of profitability for such an option needs to be performed, and strategy adapted accordingly.
In this context, to avoid increasing the software bill, customers choose not to activate the dormant engines (CPUs) or associated partition until absolutely necessary and incrementally, and therefore this inactive resource cannot be counted in any z/OS resource usage measurements.
the optimized MSU management characteristics of ASC make it possible to deploy this additional CPU resource (engines), while limiting and controlling the software billing level. the use of dormant engines creates White Space (reserved capacity), which can be used to improve performance, as the R4hA threshold is not reached. this may include changing patterns of activity in both the on-line (tP) and batch processing, generating a positive impact on the activity profile and performance of the machine.
the possibilities associated with ASC definition parameters, and dynamic management of profiles (policies), allow granular management for MSU capacity additions at the beginning of every month (division of MSU brought by a processor).
the graph below (Figure 14) shows the results obtained with two Model 710 z10 Servers (I.e. 2* 875 MSU), for which an additional engine has been activated. the level of soft-capping, controlled by ASC, increases every month, in accordance with capacity planning.
Figure 14: ASC MSU usage profile – controlled growth as per the capacity plan
From this graph we can make the following 4 observations: (1) the MSU gains are qualified by the difference between the expected consumption without
ASC (I.e. machine capacity without use of soft-capping) and restrained consumption, as per SCRt, with soft-capping control.
(2) Accumulated MSU gains projected over one year (capacity plan) saved by the use of ASC and soft-capping.
1
3
4
2

PAg
E 48
(3) the software invoice linked to the CPU consumption for month n, will be regulated by an n+2 metric (2 months). So in this particular example, CPU consumption increased for November 2010 will be regulated in January 2011 (I.e. 2 month period - November 2010 to January 2011).
(4) the capacity upgrade (addition of a processor on both servers) was forecasted for November 2010.
Finally, when activating the additional engines (CPU’s), the savings and optimizations associated with the IBM SCRt software invoice can be somewhat offset by ISV software products, whose costs are based upon the installed MIPS metric, and was forever thus. they will generate additional costs for the customer to consider, as per normal, while ASC software-capping has optimized IBM MLC software costs, regardless.
soft-capping summaryFollowing this study, we have highlighted a number of mechanisms that generate cost savings. Obviously not all cases are suitable for all organizations. It is up to each company to determine the most suitable methods as per their own individual requirements.
however, prior to deploying any soft-capping approach, we note that the system must be able to resolve any contention scenario. In this instance, it is essential to have:An effective and clearly differentiated server wide PR/SM weight management policy.At partition or Sysplex level, a WLM policy that has sufficient flexibility (MSU resource allocation) as per the required discretionary policies, as and when required.
however, it is always best to leave the system the maximum amount of freedom, to implement simple rules. In particular, it is never desirable to implement safeguards intended to address complex problems, which can be imagined and consequently will prove counter-productive, being of no assistance. the rules (policies) put in place must be good enough to translate technical objectives, such as overall level of MSU consumption, prioritization for several workloads (e.g. Production vs. Non-Production, et al).
In terms of software tools, we must remember that: • Partition level soft-capping is easy to implement and simple to understand. It should be seen
as a tool for a comprehensive soft-capping policy available generally (e.g. Defined Capacity). • Group Capacity Limit (GCL) is a simple and basic tool for implementing a partition group
soft-capping policy. Used without specific precautions and without optimization, GCL will save ~5%-10% MSU. Its disadvantage is its static nature (not dynamic), and although simple to implement, its function and flexibility is limited.
• AutoSoftCapping (zCost Management) typically delivers a ~12-15% MSU reduction compared to MSU usage without soft-capping. It is more dynamic, automated, offering many interesting features. Its only consideration, unlike the previous soft-capping methods, is cost, it is not free. therefore a technical and financial benefits study is therefore required before deciding to purchase.
3.1.4.5 Other Cost Saving Options
As explained in section 3.1.4, the IBM MLC (WLC) billing model is better suited for larger customers. the MSU unit price decreases gradually as the number of MSU consumed increases. For low MSU usage customers, the MSU unit price is at its highest.
Saving options discussed so far focused mainly on the peak billing metric associated with R4hA. this method relates to MLC software, such as z/OS, active on all partitions of the server. For other software, only present on some partitions, monthly peaks as per R4hA are also recorded, almost certainly different from that of the machine (I.e. z/OS MSU usage value). the SCRt generation process captures all of these values (product peak MSU usage amounts).Below (Figure 15) is an extract from an SCRt report dated October 2010 for a z10 Server Model 710 detailing the specific MSU peaks for related z/OS software products as per “PRODUCt MAX CONtRIBUtORS”:

MA
INFR
AM
E :
IBM
zSe
ries
Mai
nfra
me
Cos
t Con
trol
PAg
E 49
W
HiT
EPA
PER
From this information we can individually analyze these MSU usage figures for the resulting software invoice to further determine optimization actions.
Below (Figure 16) a graphical example of analyzing the monthly software invoice for2 * z10 Model 717 servers deploying the VWLC pricing metric aggregated in Sysplex (coupled) mode:
Figure 16: VWLC SCRt MSU usage analysis for individual z/OS products
If we only consider the peak machine (z/OS) usage with a R4hA of 2,197 MSU, this might not be as interesting as other software products, such as IMS, which only resides in some partitions. however, in this example, we see that IMS has a R4hA of 1,473 MSU, representing 27% of the total software bill, higher than the z/OS R4hA which was 2,197 MSU, representing 24% of the total software bill.
Following this analysis, below are a set of actions implemented to lower the software bill without impacting performance: • the combination of the IMS and CICS software products on some partitions lowers the peak
R4hA for only these products. • Stopping the CICS and/or IMS overnight for the Development and Pre-Production partitions
moved the overnight R4hA peak (batch activity profile) to correspond with at least one of the on-line (tP) peaks (overall impact of lowering the R4hA for the software bill).
• Carefully choosing the order and timing of product upgrades/migration to different partitions, allows for some savings in view of the IBM SVC (software holiday) billing rules. Indeed, during the SVC, the client pays only the highest consumption from both of the installed versions (old and new) and costs for the new version. For example, let’s consider an IMS V9
Figure 15: SCRt extract – peak MSU usage for z/OS and related software products

PAg
E 50
to IMS V10 upgrade. Before the IMS upgrade, the customer pays for IMS V9 at 1,000 MSU, where multiple partitions contribute to IMS V9 costs. IMS migration is partition by partition. At the beginning of the upgrade, the customer will be IMS V9 at MSU 900 and IMS v10 at 100 MSU. they pay IMS V10 at 900 MSU for software billing. In mid-migration, IMS v9 is at 600 MSU and IMS V10 is at MSU 400, they then pay for IMS V10 at 600 MSU for software billing. At the end of migration, the have IMS V9 at 100 MSU and IMS V10 at 900 MSU 900, they then pay for IMS V10 at 900 MSU for software billing.
• We must also consider and carefully choose the type of MLC pricing depending on the software used. zNALC pricing allows for DB2 WebSphere software deployment, reducing the overall cost (zNALC MSU costs are much lower when compared with WLC). the IWP charging mechanism for software like WebSphere, can subtract the MSU consumption for one of the partitions on which it is active. this prevents overcharging for other related and eligible software such as IMS or CICS, if their peak consumption occurs during the on-line (tP) day.
• As part of a Sysplex (coupled) environment, it is also possible to allocate one or many partitions for the on-line (tP) or batch workloads. thus MSU usage from the batch workload and associated partitions is not associated with the on-line (tP) MSU workload and associated partition, where the IMS, CICS, MQ and WebSphere software products are required.
the combination of actions detailed previously, associated with rationalizing a zSeries Server environment in 2008, helped to lower the bill CRIP Working Group member by more than 20,000 MIPS.
the evolution of the annual MLC software bill (base of 100 in 2006) for the period 2006 -2011 is as follows:
Figure 17: IBM software MLC cost evolution during the 2006-2011 period
NB. A base of 100 is chosen for easy representation (base of 100 = 100%).
3.2 Infrastructure Cost Reduction
3.2.1 Grouping and Sharing Infrastructure
For several years, a trend towards infrastructure consolidation has been commonplace. this trend is particularly noticeable in the financial (e.g. Banking, Insurance, et al.) sector. each new generation of servers increases the architecture and performance when compared with the prior, generating new opportunities for infrastructure consolidation.From the simplest to the most extreme, we have detailed the different approaches taken and associated objectives. Although these methods are becoming more widely used, they induce major changes from a technical, financial and human viewpoint.3rd party hosting (Outsourcing)this approach is sometimes followed, usually by small and medium sized organizations. they

MA
INFR
AM
E :
IBM
zSe
ries
Mai
nfra
me
Cos
t Con
trol
PAg
E 51
W
HiT
EPA
PER
can benefit from the mass infrastructure provided by the host (outsourcing company). typically, it results in lower hardware and software prices, and can minimize some other costs (e.g. people).
From a software viewpoint, we can note a decrease of: • the IBM MLC software, if included in configuration eligible for PSLC pricing and using the same
versions of software as the other customers of outsourcer. • the contracts of other software suppliers are negotiated by the hosting company, with the right
of use by various customers (economies of scale).
From a hardware viewpoint, the savings are variable depending on the level of sharing. the company will typically maintain a dedicated infrastructure, but the acquisition will generally be negotiated by the hosting company. the client will realize additional savings for operating costs (e.g. energy, Facilities Management, et al) and the eradication or sometimes elimination of Data Centers, as the facility is now with the hosting company.
Although this solution sounds interesting, it still requires consideration for some important structural issues. the most significant is the loss of autonomy. the customer is no longer referenced by suppliers as a direct customer (e.g. Support, Billing, Information, et al), and this transition is not always easy to manage.
For hardware and software cost savings, it will be necessary (even essential) for the hosting company to synchronize their technical developments with other customers using their data center facilities (infrastructure). the hosting company has an important and even crucial role in this synchronization process. the more customers they have, the more complex the problems arising become (e.g. simultaneous technical upgrade, et al). therefore, it is not always easy being a “small” customer in this context. If there are significant technical differences between customers at the hosting company, the savings for each individual company might be lower than expected. the extreme situation is for an individual customer to be assessed on a case-by-case basis for technical upgrades, for financial reasons, and as a single small customer it can be hard to bear all of the costs associated with a specific choice.
Finally, do not forget the costs of hosting…
consolidation within the company - server sharingthis usually takes place in companies with multiple data centers. these companies are seeking to capitalize on existing investments and minimize the number of their data centers.
here, the target number of data centers can vary, for example: • Consolidation to a single data center; this involves a 3rd party organization site for a level
of business continuity and excellent service. Disaster Recovery activities are then tested periodically at the 3rd party site.
• Consolidation of 2 (or more) data centers; the Disaster Recovery Plan (DRP) testing is performed internally by the company.
the first step can be performed without server sharing. this is a simple consolidation of data centers where servers are transferred to the target data center. the savings realized are for data center operating costs, as well as real estate costs. however, in the absence of server sharing, there will be no software cost reduction (software billing per server maintained), except for a priceplex configuration consolidating the various servers (Before - Figure 18 & After - Figure 19).
the sharing of servers remains the most economically attractive solution. In this case, the matter is not only to consolidate the servers in one place, but above all, to reduce the number of servers, increasing the level of sharing. In some cases, server sharing may not be financially beneficial, ultimately proving to generate significant incremental software cost, related to the billing of certain physical server software (e.g. Software AG products). In this case, the only practicable solution is a priceplex configuration, without reducing the number of servers. this avoids the additional incremental software costs, while lowering IBM MLC costs by ~30%, benefiting from the PSLC aggregation (considering all the priceplex servers as one server in terms of MSU billing).
On the road to server sharing, it may be necessary to go through several stages of evolution for the existing infrastructure, either by upgrading or by changing servers. the latter solution is
PAg
E 52
also an opportunity to have better performance (new generation-faster servers) and benefiting from additional software invoice savings (e.g. technology dividend, AWLC, et al.). however, these activities require investment in equipment and relocation costs.
Finally, in a multi-server configuration, a Sysplex is required for PSLC eligible pricing. If this is not obtained naturally from existing Sysplex structures and partitions, we must consider building a Sysplex for software billing, commonly called a “billing Sysplex” or “priceplex”. Please note that this operation strictly limits hardware and software differences, and is generally not trivial to implement. the implementation of a billing Sysplex has impacts in terms of architecture, organization and operation, generating implementation costs.
Observing technical constraints, namely the feasibility of interconnecting multiple Sysplex structures, and the cost of implementing this type of project, it may be necessary to evolve via several intermediate configurations (and thus several pricing Sysplex configurations), before reaching the ideal and optimal configuration (an eligible PSLC Sysplex containing all servers).
consolidation in the extremeAs previously described, server sharing requires the presence of a PSLC eligible Sysplex structure to benefit from optimized cost via software billing.
With the continued increase in server capacity (e.g. z10 to ~32,000 MIPS, z196 to 53,000 MIPS, et al), a single-server solution eliminates the constraints associated with PSLC eligible pricing. there is no need to priceplex (server sharing) in a single-server environment.
this single server solution takes full advantage of multiple workloads, especially if peak loads from different partitions, previously distributed across multiple servers, do not occur at the same time, but are widespread. therefore the MSU resource for software billing purposes will always be less than the perfectly optimized (de facto) multi-server configuration.
On the other hand, we must consider the CPU power degradation generated by the increasing number of engines in a single server (coupling factor) configuration. to achieve like-for-like and equivalent CPU power, there must be more engines in a single server configuration than in a multi-server configuration.
Finally, this type of single-server configuration is only possible if it meets the requirements of service continuity (e.g. time to restart and switch activity to a backup server). therefore we must observe that such a configuration is incompatible with the demands of continuous availability. the answer can then be a multi-server Sysplex with data and load sharing, possibly supplemented by the GDPS or similar option, generating continuous availability for service continuity.
We must also consider the risks associated with choosing a configuration that is closer to the architectural limits of server in terms of number of engines and power. Unlikely as it is that these configurations will generate failures (such configurations are architected & coded not to fail), we must consider that this is a single point of failure. In this case, problem resolutions will inevitably take longer to implement.
Platform convergenceAfter the consolidation of data centers and sharing of servers for multiple information systems, the next step is to consider convergence of systems. this convergence is made possible by the merger of entities with similar activity profiles. Such cases are not uncommon in the finance (e.g. Banking) sector, and they also exist in the world of industry.
Convergence can be achieved by selecting a target information system and then transferring data and users to this system. this harmonization phase allows us to validate and limit the amount of software used, thus benefitting from economies of scale. therefore it facilitates the implementation of a standard Sysplex and thus PSLC eligible software pricing.

MA
INFR
AM
E :
IBM
zSe
ries
Mai
nfra
me
Cos
t Con
trol
PAg
E 53
W
HiT
EPA
PER
Implementation case studyStarting in 2007, research conducted over several years allowed the move from one configuration (Figure 18) to another (Figure 19):
Configuration April 2007
- 5 data centers - 8 servers- 6 information systems- 53 partitions- Mainframe server power: from 568 MIPS to 7,500 MIPS- CPU capacity total:24,138 MIPS
Figure 18: Server consolidation activity – before configuration of April 2007
Configuration April 2011
- 1 datacenter- 1 active Mainframe server with 1 backup server- 2 information systems (+ 1 in stand-by mode)- 30 partitions- Mainframe server power: total of 30,000 MIPS- CPU capacity total: 30,000 MIPS
Figure 19: Server consolidation activity – after configuration of April 2011
All of the activities highlighted above (Figure 19) have been implemented, as per:• Data center consolidation.• Infrastructure sharing.• Convergence of Information Systems.
While incorporating the increased workload capacity during this 5 year period (~12% per year), the total installed MIPS capacity was only ~20% in the same period. Meanwhile, in this same 5 year period, there has been a four-fold increase in the associated Mainframe server power (I.e. 7,500 to 30,000 MIPS).
the software billing savings in this case also live up to expectations, representing a ~50% decrease (Figure 20) in cost, while incorporating the annual workload growth activity.
Figure 20: Server consolidation activity – MLC software billing analysis
these software savings were generated from several initiatives:• Consolidation of Information Systems, reducing the number of technical environments and
Development environment costs.• Reduction in the number of partitions, better use of machine resources for the benefit of the
application workloads.• Consolidation and extreme infrastructure sharing, to optimize resource use for different activity
profiles.
Item Description April 2007 April 2011Number of MLC software
invoices5 1
Number of global MSU for billing
2,737 2,282
Billed Amount VAT/Month(Base 100)
100 50.35

PAg
E 54
3.2.2 Use of specialty engines: zIIP, zAAP, IFL
In recent years the Mainframe software landscape has changed considerably. It all started with the integration of MVS UNIX kernel APIs in 1994 (Open edition since 1998 and Unix System Services), which allowed the Mainframe platform to open up to new technology and “remain competitive” today.
Similarly, tCP/IP has changed the situation, having superseded the SNA network. thus the exchanges between the Mainframe and the Distributed Systems world became more commonplace, which generated the emergence of mixed applications, including the ability to access DB2 data via DRDA networking protocols.
the new middleware has complemented the traditional transaction Processing (tP) monitors such as IMS and CICS. the WebSphere Application Server is the most famous, opening the door to Mainframe Java technologies and more recently SOA, XML and Web 2.0.
Nevertheless, the Mainframe platform retains its dinosaur image. the obstacle for platform development is not inherently technical, but financial. Indeed, these new technologies replace many older environments, classified as Legacy. this increase is mainly due to use of the Java language, but also the C/C++ language, commonly preferred by suppliers (ISV’s) for software development instead of Assembler (hLASM). the dispersion of Mainframe customers across the network is also now more difficult to manage than the simple 3270 terminals (green screen) of the 1980’s.
to limit “clunkers” or flops, in the 2000’s IBM has been imaginative introducing specialized processors (CPU engines) for accommodating these new workloads. From a general point of view, these processors are in fact a creative business practice (not a technological feat, it is actually just modified System z microcode), although technically, only the MVS (z/OS) Dispatcher is capable of handling these new workload functions:
Figure 21: z/OS Dispatcher architecture schematic for zAAP specialty engine

MA
INFR
AM
E :
IBM
zSe
ries
Mai
nfra
me
Cos
t Con
trol
PAg
E 55
W
HiT
EPA
PER
Without these new specialty processors, where total Cost of Acquisition (tCA) was reduced by approximately a factor of 4 when compared to standard processors, it was not financially feasible to accommodate such new workload applications (e.g. DB2 DRDA, Web 2.0, et al.) on the Mainframe. however, the most important benefit concerns the software billing invoice. these processors are exempt from MLC cost (arguably software runs for no cost on a specialty engine), which also limits the overall General Purpose (CP) CPU usage impact for other system software partitions.
the zAAP processors are primarily intended for Java workloads, consuming ~40-70% of CPU usage, depending on the type of application. the ratio associated with Java/DB2, easily identifiable, is now becoming an important metric to consider during associated tuning activities.
the zIIP processors are also attractive for DB2 workloads (processing ~50% DRDA requests), but are also open to other software vendors (ISV’s), who can exploit this zIIP function, with prior agreement from IBM. CA, Syncsort, and others have exploited this function, offloading CPU usage to zIIP, but such usage remains low. however, the financial gain associated with DB2 workloads is far from negligible, which explains the adoption of this solution by a large number of businesses.
Nevertheless, the financial impact of these new applications is attractive and clearly visible. that’s why IBM continues its momentum and has announced two new interesting options for its latest z196 server: • technically, it is now possible to consolidate all workloads (e.g. Java, DB2, et al) on the zIIP
specialty engine, in conjunction with the zAAP engine, as and when required. • Commercially, there are new MLC pricing metrics, AWLC and IWP that can significantly
reduce software billing for these MLC eligible applications. this new mechanism allows MSU deduction associated with SCRt, generated by WebSphere with the conventional transaction processing (tP) monitors, IMS and CICS. this is a breakthrough that should allow a wider use of this application server function within the Mainframe environment, which still provides an unrivalled quality of service, and most advanced performance, especially when the application server is WebSphere, hosted in the same partition as the legacy database systems and associated transaction processing (tP) monitors.
On the software side, DB2 Version 10 offers new perspectives via XML databases. Indeed, requests will be handled by the native XML APIs now included in the MVS nucleus, improving performance by ~30%, while exploiting the zIIP specialty engine for optimized CPU usage.
3.3 Controlling operational costs
3.3.1 Optimization, performance & technical/application component quality
“The fault, dear Brutus, is not in our stars, But in ourselves…” - William Shakespeare (Julius Caesar).
Over a period of time, a quality approach tends to lose its importance, for various reasons, such as loss of technical team skills, personnel reductions, balancing the speed of project implementation, constrained schedules, et al. this situation is quite paradoxical, because the steady decline in development quality, to name it specifically, makes such an approach (quality) more essential than ever. however, we often prefer to make investments (hardware and software) associated with growth, which of course are a burden for our operating budgets, rather than optimizing our existing resources (do more with less).
Of course, sometimes good technicians perform punctual optimizations that can deliver spectacular results, but typically this is not a systematic approach, only occurring during operational crisis. Moreover, this work is seemingly neither valued nor recognized, as it once was. the task is further complicated with the merger or consolidation of several entities, further diluting the available skills.
the mode of operation described above may reach its limits, particularly in cases of significant fiscal constraint. In such cases it is important to lower operating costs and/or defer the maximum costs of investment.
A well-managed/executed quality approach meets this double objective, but it does not necessarily appeal or even be obvious to internal to policy makers. the idea to get help from a specialized supplier that has extensive experience and solid references in the matter thus come naturally.

PAg
E 56
Principle of the approachAfter a first set of measurements and analyzes carried out in situ by the specialist provider, it is clear that the customer has the potential for improvements. they are then able to present a commercial offer.
By agreement between the two parties, the provider will conduct a several month review process with the customer, proposing a number of optimizations. the customer then has the freedom to accept or reject these proposals, based on the expected benefit, the risk involved, the complexity of implementation or any other yardstick. It is then the responsibility of the customer to implement the proposed optimizations. If scheduled to do so, the service provider assists the customer with the necessary tools and implementation assistance.
the specialist provider offers optimization for both the technical foundation base (z/OS Operating System and major components such as DB2, IMS, CICS, WebSphere, DFhSM, et al.) and the application portfolio.
Optimizations for the application base code are usually in the majority and the specialist provider is committed wherever possible to offer only easy to implement optimizations (I.e. minor changes in application code). they know that complex optimizations are implementation prohibitive and have every chance of being rejected because of their burden and associated risk.
structuring the projectthe first difficulty encountered in the implementation of such a quality approach is to demonstrate its usefulness and profitability, compared to that of a conventional growth solution. Indeed, such an approach, excluding its intrinsic cost, generates an additional workload for technical teams (system & application), which they usually do not need, and whose cost must be considered.
therefore we must extensively explain, argue and convince for the need and cost effectiveness of the approach. An original or innovative business model can help, such as result based compensation for the specialist provider chosen. this can be both a guarantee of their commitment, and above all a guarantee of limiting the delivery cost. Additionally, these specialist providers generally have skill, experience and tools (e.g. data analysis/mining) that would be too expensive for the customer to develop and maintain at their own expense. So there is real value for the customer.
The primary key success factors (pros) and pitfalls to avoid (cons)
Financial & contractual considerations, before project initiation: • Carefully consider the contracts offered by the specialist provider, as the principle of pay
for performance may be accompanied by clauses limiting its scope, and thus ipso facto, removing all worthwhile substance. Good negotiation should occur prior to any agreement.
• Pay close attention to the expected savings evaluation process. Please remember that IBM MLC pricing has a sliding scale related to MSU cost (e.g. a 1:10 ratio between the lowest use/highest cost and highest use/lowest cost metric). So for higher MSU usage, the MSU cost savings will be marginal (the cheapest). So do not rely primarily on the average MSU, for example by dividing the bill by the number of VWLC MSU consumed. Such a linearization can then lead to significant disappointments, both in the evaluation of the savings and associated budget provision. this is essential, because the specialist provider anticipates savings that it expects to make for their customer, setting their prices accordingly.
In conclusion on this point, it is essential for IBM to confirm and validate the financial simulations projected. Although the judge and jury in this matter, IBM must somehow guarantee the figures provided are correct.
• For customers with a standard IBM eSSO contract; the MLC cost cannot fall below a minimum amount. Such a MSU reduction may limit or cancel the financial benefit of optimization. It may therefore be appropriate to align the specialist service with an eSSO contract renewal process.
• the financial compensation package and method for remunerating the specialist provider must be kept simple and legible, being contemporaneous with current financial processes.
Technical considerations, before project initiation: • In practical terms, we must also prepare an inventory with the specialist provider for
any measurement and diagnostic tools they require. this check is necessary to avoid any unpleasant surprises that either these tools exist within the customer, or that the specialist provider has included them in their delivery package, for no extra cost.

MA
INFR
AM
E :
IBM
zSe
ries
Mai
nfra
me
Cos
t Con
trol
PAg
E 57
W
HiT
EPA
PER
• It is also important to engage at the earliest, and before the start of the service, all those internal customer units (I.e. Systems Analysis, Development, Production Management, Systems Management, Operations, et al.), so that they can prepare for the extra workload inherent in this approach, actively participating in its implementation.
Project initiationGenerally, cost benefit is all the more substantial for the customer if they have an accurate view of performance issues related to their Production service, a view associated with reliable and complete analysis reports. equally the customer requires competent technical staff able to interact pragmatically with the specialist provider’s consultancy team. In short, if the customer technical team demonstrate maturity and competence in the area of optimization, the approach will be more beneficial, especially in the long term.
Similarly, a precise understanding of IBM MLC billing principles from the customer is absolutely essential, verifying the financial impact of proposed optimizations, and thus not choosing the wrong IBM MLC billing method.
Given these observations, we should pay attention to: • Do not forget that the specialist provider will focus on priority optimizations (cherry pick)
that will reduce the software bill. this is consistent in most cases with customer’s goals, but they may have to make some distinctions. For example, a simple optimization, but only detected and implemeted on processings impacting the peak load, hence the software billing, can be equally applicable to many other processings. therefore, it becomes a customer responsibility to monitor this change and generalize accordingly.
• Confine the scope of investigations by the specialist provider. to do so, outlines the optimizations possible, both currently and in the future, undertaken without assistance. It is infinitely more beneficial to work mainly on activities that the customer is not capable of handling with their own resources.
• Agree on a method for measuring benefits, and maintain control on it. • Indicate as much as possible the use of customer installed measurement tools, as opposed
to those tools preferred by the specialist provider. Procedures and tools used will be more easily controlled and reused later.
Implementation & optimization deploymentthe rapid implementation of optimizations is essential, because the resulting financial benefits directly impact project profitability. Moreover, they can give “breathing space” to currently experienced Production constraints.
As previously mentioned, to safeguard timely optimization benefits, it is essential to ensure the active participation of all Production operational decision-makers, from all of the technical teams.
As we progress through the deployment of optimizations, it is essential to lower the level of soft-capping, as per the associated gains realized to that point (I.e. MSU reduction). Otherwise the gains realized will not materialize with the associated software invoice, because the savings found might be absorbed, if we don’t make the required end-to-end changes.
Optimization methods – technical reviewthe proposed optimizations can be classified into three broad categories:
• those we know, but we do not implement due to time, or maybe because of negligence or laxity. Unfortunately, these are the most numerous. the real value of the specialist provider is then to quantify the technical and financial gains that we could obtain, and to eradicate the supposed complexity of implementation.
• those we could not have found ourselves, and for which the specialist provider, from their experience at other customer’s and associated expertise, adds real value.
• All that we are told informally in terms of good practice, we follow, but they are not necessarily specific optimizations. however, these avenues must be explored, allowing the client to eventually manage longer-term projects for these topics. this is often an opportunity to discover that some companies charge a high price for migration/optimization projects, whereas in fact, maybe migration/optimization can be performed quite easily and without spending a penny.
Overall, typically such optimization delivers the promised results. In very rare cases, results are below expectations, hence the importance of measurement, but also the competence of the

PAg
E 58
customer’s technical teams, which allow for a debate on equal footing with the specialist provider. these disappointments, fortunately rarely experienced, are typically linked to a rushed analysis service (so called routine errors).
BenefitsFor all that followed this approach, there was an MSU usage reduction (and therefore the MLC software invoice), dependent on the particular growth and initial conditions, but mainly to defer the usual and routine CPU capacity upgrade activities. this benefit is generally enjoyed for one year.
Durability of the approachthe proposed optimizations often highlight broader endemic organizational deficiencies, both technical and commercial. If the customer is to learn from this experience, correcting dysfunctions, they must also take steps to ensure that they do not reoccur. the challenge for the customer will then be to integrate and sustain the good practices imparted, applying them with rigor and determination. this may require resources (including human) that they must acquire.
If the customer fails to be proactive, they will have to rely for such a specialist service on a periodic basis to deliver such benefits, so as to correct other abuses that they have been unable to correct themselves.
In any event, the quality approach described here, beyond the benefits it provides, is a unique opportunity to rehabilitate, relegitimize and reclaim the field of expertise related to Mainframe performance, which sadly is seemingly opposed to the current dominant trend.
3.3.2 Capacity Management, tools & methods
Data center consolidation, infrastructure consolidation and It resource sharing has significantly changed the characteristics of Mainframe servers in recent years: • Increased capacity of installed Mainframe servers (+400% for some users). • Increase total installed MIPS capacity (~10% per year).
In parallel to changes in servers, environments (e.g. test, Production, et al.) and their associated partitions, Mainframe workload hosting techniques are also changing: • Adding Mainframe environments (e.g. test, Production, et al.) when sharing servers. • Removal of Mainframe environments (e.g. test, Production, et al.) when consolidating servers.
these Mainframe server evolutions with associated evolution sharing not only impacted the IBM MLC software invoice billing level, but also types of contracts implemented (e.g. eLA/SRA, eSSO, OIO, et al.)
the major objective resulting from these developments is a constant search for hardware and software cost optimization techniques. the rapid growth and associated hardware and software financial impacts for Mainframe datacenters generated the development of emerging professions such as the “Capacity Planner” and the “Software Cost Planner”.
to perpetuate this search for cost control and infrastructure, we require a process of Capacity Management for Mainframe operations that integrates all the problems and requirements.
this process can be realized as follows (Figure 22):
Figure 22: IBM Mainframe capacity management process

MA
INFR
AM
E :
IBM
zSe
ries
Mai
nfra
me
Cos
t Con
trol
PAg
E 59
W
HiT
EPA
PER
to explain this process, we have provided an example of Capacity Management implemented for an infrastructure consolidation project.
capacity Management – Role & scopeComprehensive management of Mainframe servers generally includes configuration management, change management, problem management, performance management and capacity management.
the role of the process presented here is limited to capacity management and associated Mainframe server configuration techniques. Please note; it is not intended to address other issues that pertain more to the responsibility of the operational teams or entities that manage and administer other functions processing on Mainframe servers.
the capacity management process is a unifying element for the various entities that administer and operate the Mainframe platform, who are obliged to provide services for their end-users. Without doubt, in any case, capacity management is not a substitute for performance management, which is a responsibility of these other entities (technical teams).
the capacity management function gathers annual resource requirements, documenting the upcoming key events, justifying these needs, as well as the growth rate to be considered for future years.
At this level, it is disappointing if we do not have access or links to the business plan of our end-users. It is even quite difficult to retrieve indicators of activity targets that may yet justify the need for entities and serve as a benchmark when changing workload behavior (pros & cons).
All of these elements are subsequently consolidated to establish, as per periodic updates, corresponding to the current situation, quarterly projections of 3-year resource requirements and defined server configurations to be associated with capacity requirements.
this Capacity Planning update activity takes place once a year, typically at the end of the 1st half of the year (or whenever the customer requires to do so as per their calendar), and at the end of this activity we can (figure 23): • Observe the 3-year trends and projections (accompanied by supporting and working hypotheses). • Define server configurations and scenarios. • Develop the capital budget and operating costs for the following year, both in terms of hardware
upgrades and IBM MLC software billing.
Figure 23: IBM Mainframe capacity cost planning process

PAg
E 60
this forecasting process with associated working hypothesis can be replayed during the year, as and if required, due to exceptional or unidentified changes. this can generate Mainframe configuration changes, hardware evolution and changes to the IBM MLC software bill.
Information from the capacity management process associated with 3 year projections is also used regularly as part of software contract renegotiation and software acquisition activities.Because capacity management forecasts are based on best endeavors estimates, it is essential to establish a regular monitoring of Mainframe behavior, reconciling estimate projections. Following the review, it may be necessary to modify a Mainframe partition or an environment (e.g. test, Production, et al.) in case of drift, configuration (redistribution of resources) or trigger a refresh of the capacity plan to accommodate the associated change (up or down) requirements. this latter situation may affect investment budgets or business operations for the current year.
We have outlined the scope (e.g. processes, procedures, tools, monitoring, et al.) of the capacity management process, allowing for optimal control of Mainframe data center hardware and software costs.
capacity Management: Process OverviewCPU (MIPS) Capacity Planningthe first step is to develop a document identifying requirements: • By environment (e.g. test, Production, et al.).
- Change assumptions during the next year as a minimum.- the growth rate (e.g. annual).- Requirements and their deadlines for the following year (and beyond if possible).
• For servers and associated partitions.- the current MIPS usage.- Specific MIPS requirement for the forthcoming year (and beyond if possible). In the absence
of a specific requirement, the growth rate will be applied.- the memory requirement, per partition.
From these requirements, it is possible to update the MIPS capacity requirements for the 2nd half of this year and establish quarterly projections for the next 3 years (Figure 24 & Figure 25), for example:
Figure 24: Sample 3 year IBM Mainframe server MIPS capacity forecast spreadsheet
Figure 25: Sample 3 year IBM Mainframe server MIPS capacity forecast histogram

MA
INFR
AM
E :
IBM
zSe
ries
Mai
nfra
me
Cos
t Con
trol
PAg
E 61
W
HiT
EPA
PER
these detailed requirements identifying MIPS per partition (Figure 26) are necessary to develop the PR/SM configuration parameters for the different Mainframe servers hosting these partitions. A similar table is also developed for Mainframe memory requirements.
Figure 26: Sample 3 year IBM Mainfram server/partition MIPS capacity forecast spreadsheet
server configuration developmentthe second step is to size and configure the Mainframe servers. this step checks that the Mainframe server capacity (Figure 27 & Figure 28) meets the forecasted requirements, identify any breaking points (specific server model MIPS capacity size) and to define the evolution of servers.
Figure 27: Sample 3 year IBM Mainframe z10 server MIPS capacity forecast spreadsheet
Figure 28: Sample 3 year IBM Mainframe z196 server MIPS capacity forecast spreadsheet
In the scenario presented previously (Figure 27 & Figure 28), the Mainframe server capacity is calculated with the IBM zPCR tool. this tool has the advantage of taking into account the impact of the number of partitions, logical engines and specialty engines on Mainframe server capacity. Capacity evolves according to these parameters.
Following the zPCR activity, actual capacity is then compared with the MIPS requirements forecasted in the Capacity Planning process, to highlight the available MIPS (free space) and identify any break points.In this example, we have highlighted a requirement to change Mainframe server technology in early 2013. At this stage, it is possible, even necessary, to perform simulations of configurations taking into account the different models of Mainframe servers, the number of servers in the data center (I.e. this example is for a single Mainframe server) and also the technology differences (e.g. z10, z196, et al.).
Once again, the zPCR tool is very useful and arguably mandatory to achieve these different configurations and comparisons.

PAg
E 62
All these elements will be taken into account when forecasting server configurations and requirements, to enact the scenario, integrating these decisions into the investment budget.
cPu (Msu) capacity PlanningPreviously we used the MIPS metric to detail the amount of CPU resource (resources required by the server configuration PR/SM set-up) made available to partitions and Mainframe environments (e.g. test, Production, et al.), while MSU are used for IBM MLC software billing purposes. So here we consider the notion of the R4hA (Rolling 4 hour Average) MSU usage, calculated monthly for the IBM SCRt tool. the calculation of this value can be generated in different ways according to the implementation or not of soft-capping.
the MSU Capacity Planning process outlined has been developed considering: • IBM MLC eligible software used on different active zSeries servers and associated partitions. • Forecasts for the evolution of activity on these MSU usage values. • Forecasts of the software products used and their associated version numbers. • Soft-capping implementation. • the current level of different IBM MLC billing software (starting point). • hardware technology changes that will impact MSU usage (e.g. z9/z10 technology dividend,
z196 AWLC, et al.).
From these elements, we perform the MSU Capacity Planning processing for the next three years. this table is categorized by product on a Quarterly (3 Monthly) basis. the values are calculated by determining an annual percentage (%) increase applied to the base (1st Quarter). the percentage (%) growth is calculated by taking into account the Capacity Planning MIPS and (especially) the company policy for software billing (e.g. soft-capping implementation, optimized software cost processes, contractual commitments, et al.).
this table (Figure 29) will therefore highlight the following: • Software changes (product additions, removals or version change). • MLC software billing levels, by product (e.g. z/OS, CICS, DB2, et al.). • MSU management techniques (e.g. soft-capping, et al.) • Forecasting the estimated budget for next year. • IBM eSSO contract management (or implementation) assistance.
Figure 29: Sample 3 year MSU capacity requirement, by MLC software product spreadsheet
Of course, a software upgrade generally involves a change in pricing and negotiating with IBM for an SVC (e.g. 1 year software holiday, to migrate software form one version to another).
the MSU Capacity Planning process only formalizes the billing period of two versions of a product. the impact of an SVC activity, allowing for only one version of the software to be chargeable during the migration (time to negotiate with IBM SVC), is not formalized in this table. this will be taken into account in the budget evaluation activity.
cPu (MIPs) capacity Planning Follow-Onthe MIPS Capacity Planning process is essential to establish a monitoring process, developed on assumptions, sometimes fluctuating, sustaining the process and delivering benefits. this process must be able to review current behavior of the Mainframe platform, from the forecast, and a minimum of historical information.
the findings associated with current period will identify possible changes (up or down); generating a requirement for more detailed analyzes to understand the origin of these changes. the result of this analysis and comparison with service indicators (e.g. Service Level Agreements or SLA), will allow to:
• Make corrections, for example at a Mainframe environment level (e.g. abnormally high CPU usage with no increase in activity), to return to a situation classified as normal.

MA
INFR
AM
E :
IBM
zSe
ries
Mai
nfra
me
Cos
t Con
trol
PAg
E 63
W
HiT
EPA
PER
• Make exceptional updates of Capacity Planning because new hypotheses will permanently change usage and associated forecasts. Modifications may be increasing (new requirement) or decreasing (e.g. requirements over-estimate, decreased activity, et al.).
• Modify investments and infrastructure developments roadmaps (e.g. anticipation of an upgrade, an actual upgrade or deferral, et al.).
this analysis is important to control any change to the Capacity Plan (detecting and correcting certain abnormalities in behavior), adjusting resource requirements at the right time and most importantly, to control and sustain investment.
historical information displays trends and allows for consistency checking over time (e.g. tendency to overstate requirements, et al.). Such information is always useful when updating the annual capacity plan.
In this example, on a monthly basis, peak MIPS usage for Mainframe servers and environments (e.g. test, Production, et al.) is measured. In the sample graph below, the peak is positioned between 10:00-12:00 during the on-line transaction Processing (tP) period:
Figure 30: Sample several year CPC peak MIPS usage for the on-line (tP) workload graph
this graph displays MIPS usage at a server (CPC) level and the maximum level of consumption reached in the month during the on-line (tP) day period. Since the measurements are made every ¼ hour (15 minute intervals), it’s not an instantaneous peak. Finally, this graph does not represent the amount of installed MIPS, only the usage level.

PAg
E 64
Figure 31: Sample several year PF2 partition peak MIPS usage for the on-line (tP) workload graph
In this example above (Figure 31), the PF2 partition has seen a significant phase of increased activity in June 2010 and an exceptional peak of activity in January 2011. the trend line based on the on-line (tP) peaks evolves upwards over time.
Figure 32: Sample several year PF10 partition peak MIPS usage for the on-line (tP) workload graph
In this example above (Figure 32), the PF10 partition has experienced a usage decline in 2010 and a complete shutdown during July 2011.CPU (MSU) Capacity Planning Follow-OnBy collecting data from various information sources (e.g. SCRt, SMF, et al.), it is possible to monitor the actual levels of MLC software billing, as per the usage of Mainframe servers (CPC) and partitions, establishing billing profiles and the peak day during the month.
the variable granularity of information allows us to verify the consistency of MSU Capacity Planning, identifying behavioral differences, adjusting (implementing if necessary) soft-capping levels and associated anticipated budgetary requirement (up or down).
Figure 33: Sample daily MSU R4hA peak for SCRt billing month (start of 2nd day-end of 1st day) graph
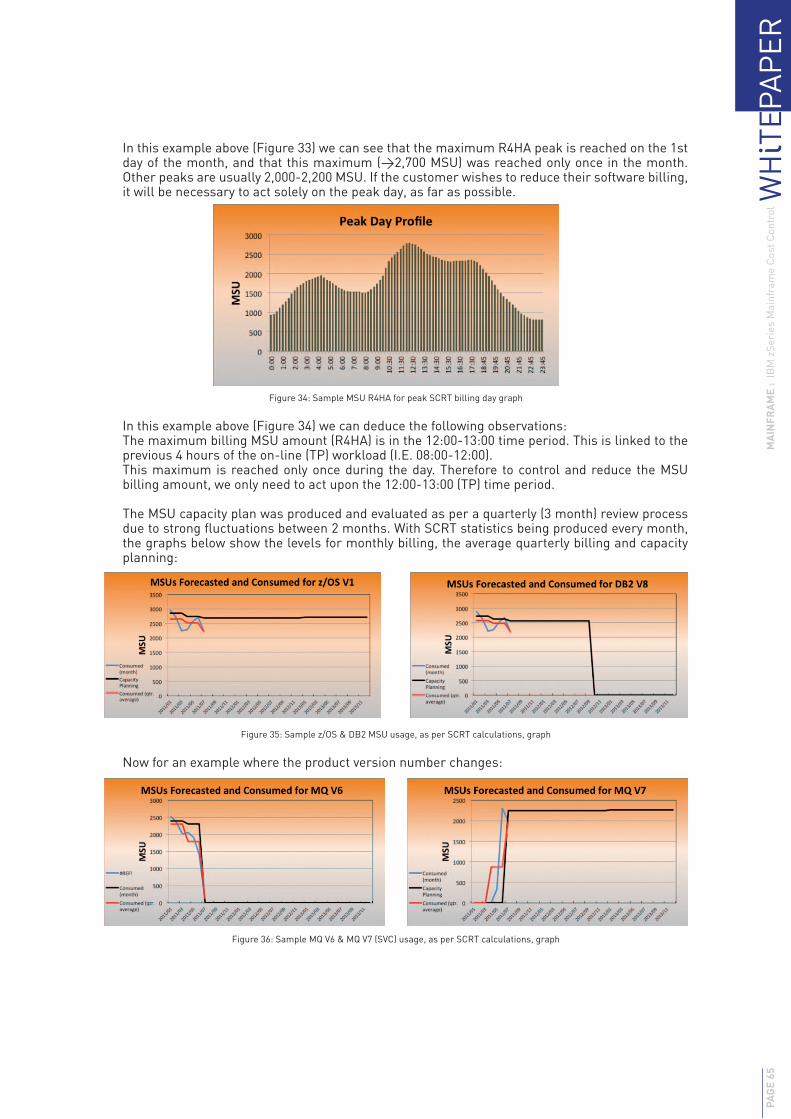
MA
INFR
AM
E :
IBM
zSe
ries
Mai
nfra
me
Cos
t Con
trol
PAg
E 65
W
HiT
EPA
PER
In this example above (Figure 33) we can see that the maximum R4hA peak is reached on the 1st day of the month, and that this maximum (>2,700 MSU) was reached only once in the month. Other peaks are usually 2,000-2,200 MSU. If the customer wishes to reduce their software billing, it will be necessary to act solely on the peak day, as far as possible.
Figure 34: Sample MSU R4hA for peak SCRt billing day graph
In this example above (Figure 34) we can deduce the following observations:the maximum billing MSU amount (R4hA) is in the 12:00-13:00 time period. this is linked to the previous 4 hours of the on-line (tP) workload (I.e. 08:00-12:00).this maximum is reached only once during the day. therefore to control and reduce the MSU billing amount, we only need to act upon the 12:00-13:00 (tP) time period.
the MSU capacity plan was produced and evaluated as per a quarterly (3 month) review process due to strong fluctuations between 2 months. With SCRt statistics being produced every month, the graphs below show the levels for monthly billing, the average quarterly billing and capacity planning:
Figure 35: Sample z/OS & DB2 MSU usage, as per SCRt calculations, graph
Now for an example where the product version number changes:
Figure 36: Sample MQ V6 & MQ V7 (SVC) usage, as per SCRt calculations, graph

PAg
E 66
the contribution per environment (e.g. test, Production, et al.) is determined (Figure 37) from the level of z/OS billing and the contribution of each partition. With partitions being attached to an environment, then it is easy to derive the relevant values and display the share for each environment. Such information can be used to define key MLC software, perhaps for chargeback processes.
Figure 37: Sample SCRt MSU & associated workload share (%) analysis table
Alerts and Warning Points Consumed CP MSU Gap
No alert, billing level consistent with Capacity Planning 2 716 2 743 -0,98%
z/OS MSUs per Platform
PF Consumed Contribution in %PF1 192 7%PF2 79 3%PF3 15 1%PF4 1 189 44%PF5 956 35%PF6 224 8%PF7 44 2%PF9 17 1%Total 2 716 100%

MA
INFR
AM
E :
IBM
zSe
ries
Mai
nfra
me
Cos
t Con
trol
PAg
E 67
W
HiT
EPA
PER
4 cONcLusION
having reached the end of this copious document, the reader will have understood that cost control is addressed in many ways and demands consideration from more than one angle. Because the cost is itself the product of a complex set of elements which aggregate and interact, it is necessary to unravel each aspect, one after another, and sometimes all together. Ultimately, for cost control, there are many economic levers, each only a part of a comprehensive solution, where construction takes time and must be adapted for the context of each individual user.
Some activities, for example, workload optimization, require us to have already reached a level of expertise and knowledge for analyzing resource used, allowing us to identify areas of weakness. Others, such as the consolidation of physical machines, are the first step of an extensive overhaul of many elements, including cascading and interlinked costs. Still others, such as negotiating new licensing models with suppliers (ISV’s), are constantly evolving, changing, or being reinvented. In this approach, it is readily apparent that there is always some leeway for improvements, still avenues to explore and work to deliver.
Better Mainframe platform cost control helps make them more competitive and ever-lasting. More importantly, it also helps create templates for tomorrow. If we return to our document introduction, if we review the Mainframe specialty, with its decades of seniority, often one step ahead, we can make a bet; in ten years, in five years, in three years, the cost control steps that we discussed in this document, will be replicated for Distributed System environments. they will ask the same questions and explore the same solutions. What we have articulated in this document, is not a history of the Mainframe, this is a history of computing.
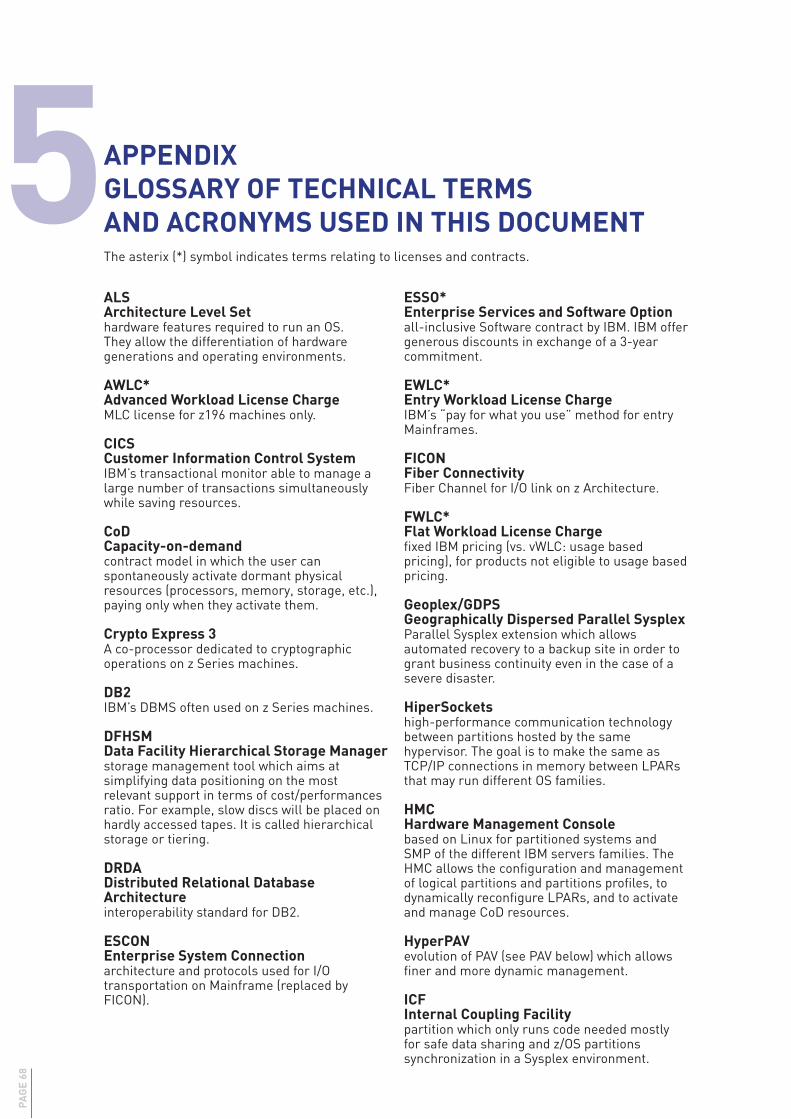
PAg
E 68
ALsArchitecture Level sethardware features required to run an OS. they allow the differentiation of hardware generations and operating environments.
AwLc*Advanced workload License chargeMLC license for z196 machines only.
cIcscustomer Information control systemIBM’s transactional monitor able to manage a large number of transactions simultaneously while saving resources.
coDcapacity-on-demandcontract model in which the user can spontaneously activate dormant physical resources (processors, memory, storage, etc.), paying only when they activate them.
crypto Express 3A co-processor dedicated to cryptographic operations on z Series machines.
DB2IBM’s DBMS often used on z Series machines.
DFhsMData Facility hierarchical storage Managerstorage management tool which aims at simplifying data positioning on the most relevant support in terms of cost/performances ratio. For example, slow discs will be placed on hardly accessed tapes. It is called hierarchical storage or tiering.
DRDADistributed Relational Database Architectureinteroperability standard for DB2.
EscONEnterprise system connectionarchitecture and protocols used for I/O transportation on Mainframe (replaced by FICON).
EssO*Enterprise services and software Optionall-inclusive Software contract by IBM. IBM offer generous discounts in exchange of a 3-year commitment.
EwLc*Entry workload License chargeIBM’s “pay for what you use” method for entry Mainframes.
FIcONFiber connectivityFiber Channel for I/O link on z Architecture.
FwLc*Flat workload License chargefixed IBM pricing (vs. vWLC: usage based pricing), for products not eligible to usage based pricing.
geoplex/gDPsgeographically Dispersed Parallel sysplexParallel Sysplex extension which allows automated recovery to a backup site in order to grant business continuity even in the case of a severe disaster.
hipersocketshigh-performance communication technologybetween partitions hosted by the same hypervisor. the goal is to make the same as tCP/IP connections in memory between LPARs that may run different OS families.
hMchardware Management consolebased on Linux for partitioned systems and SMP of the different IBM servers families. the hMC allows the configuration and management of logical partitions and partitions profiles, to dynamically reconfigure LPARs, and to activate and manage CoD resources.
hyperPAVevolution of PAV (see PAV below) which allows finer and more dynamic management.
IcFInternal coupling Facilitypartition which only runs code needed mostly for safe data sharing and z/OS partitions synchronization in a Sysplex environment.
5APPENDIXgLOssARy OF TEchNIcAL TERMs AND AcRONyMs usED IN ThIs DOcuMENTthe asterix (*) symbol indicates terms relating to licenses and contracts.

MA
INFR
AM
E :
IBM
zSe
ries
Mai
nfra
me
Cos
t Con
trol
PAg
E 69
W
HiT
EPA
PER
IFLIntegrated Facility for Linuxprocessor dedicated to Linux for System z. Its pricing is attractive.
IMsInformation Management systemhierarchical database developed in 1966 by IBM. It has become a comprehensive transaction management system since then and is still used today.
IPLA*International Product License Agreementan OtC type license (purchase and maintenance).
LinuxOperating System inspired by UNIX (it adopted its principles), developed on a cooperation model and which has a Free license (source code access, redistribution rights, modification sharing).
Linux for system zLinux OS for S/390 (Architecture 31-bit) or Linux for series (Architecture 64-bit) which works on Mainframes along with z/OS. It can use IFL processors in LPAR (z9, Z10), in native or with z/VM (hosts hundreds of servers) or FICON (FCP mode FCP) which allows access to SANs.
LPARLogical Partitionmakes a machine subset appear like a distinct server. On System z, they are managed by the hypervisor PR/SM. A Sysplex or a Parallel Sysplex can be composed of several LPARs. the isolation between LPARs on the same machine is such that they can be considered as distinct systems.
MLc*Monthly License chargelarge family of licenses invoiced monthly depending on the recorded MSU consumption.
MTBFMean Time Between Failurestatistical value which indicates the reliability of a system.
MwLc*Midrange workload License charge MLC license for VSe and twelve middleware products.
OOcOD*On Off capacity On Demandpricing model which allows the activation and deactivation of processors and memory units to absorb workload peaks. It is quarterly invoiced based on usage.
OsA Express 3interface card with 4 10 Gb ethernet ports 10 for System z10.
OTc*One time charge: basic licensing model including purchase and support.
PAVParallel Access Volumetechnology which allows concurrent processing of several I/O commands.
Platformstands for all the partitions dedicated to a well-functioning Information System. A Mainframe server usually hosts several platforms associated with different customers for an outsourcer, or to different types of activity (production, pre-production, development, etc.). Platform is a French term, which equates to environment (e.g. test, Production, DR, et al.) in english.
Power7 Bladeserver “blades” equipped with Power7 RISC processors by IBM which run their UNIX machines. Once installed on a zenterprise Blade Center extension linked to the Mainframe, these blades will work as a Mainframe subsystem. In this configuration, the Mainframe is still the main processing controller and delegates some tasks to Power7 blades.
PsLc*Parallel sysplex License chargelicense for Sysplex configurations (cluster), whether they include several machines or just one.
R4hARolling 4h Averageunit of measurement by IBM based on a partition’s or a platform’s resource usage during the last four hours (average of the 48 last instantaneous MSU measurements).
RPO Recovery Point Objectiveobjective for the maximum loss of data tolerated in case of an incident. It is typically a time duration: a 15-minute RPO means that the data recorded until 15 minutes before the disaster will be recovered.
RTORecovery Time Objectiverecovery length after a disaster or a disaster registration. It is typically a time duration: a 2-hour RtO means that two hours after the disaster or the disaster registration, the user service will have to be available again.

PAg
E 70
sALc* select Application License chargeMLC license only for WebSphere MQ on machines with some MLC licenses (AWLC, AeWLC, WLC or eWLC).
sAs serial Attached scsI computer interface which sets SCSI commands (very much used for storage) on a serial interface. It replaces parallel SCSI with better throughput and less physical constraints.
sATA serial Advanced Technology Attachmentcomputer interface to link mass storage peripherals (hard drives most of the time) to a system. S-AtA replaced AtA.
sLAservice Level AgreementA contract that determines the required service level between a provider and a customer. SLA also settles the attributes of a service contract (expected performance, practical details, etc.).
solution Edition*A package offering that includes hardware, Software and support around big functional blocks (security, development, Linux, SAP, WebSphere, etc.).
soft-capping*A feature which allows billing control based on Software usage. each LPAR has a maximum MSU consumption (called Defined Capacity) calculated on a 4-hour average (R4hA).
ssDsolid state Drivehard drive without moving parts, storage is no longer on rotating magnetic surfaces, but on memory chips.
sub capacity*possibility to invoice a Software product on part of a processor and not on a whole processor. Most of the MLC licenses have sub capacity options.
s&ssubscription and supportmaintenance for IBM IPLA Software products (zOtC).
sysplex & Parallel sysplexa System Complex or Sysplex is the association of several processors working as a unique system in a logical unit. Parallel Sysplex is the application of this model to several clustered machines (up to 32) working with only one system image for performance and/or availability purposes.
szLc* system z Lifecycle chargelicense for z/OS support only.
Vu*Value unitunit of value by IBM, relying on the number of MSUs, the number of engines, or other base units, and used for some Software product billing such as DB2, IMS and CICS or tivoli products for z/OS.
VwLc*Variable workload License charge
websphere MQthe new name for MQ Series, a communication service between applications in message mode which uses queues. these tools allows in particular information exchange and transaction execution between heterogeneous platforms (z/OS, UNIX, Windows, etc.).
wLc*workload License chargemonthly billing model based on usage for machines running z/OS or z/tPF in z/Architecture 64-bit mode.
zAAPsystem z Application Assist Processor specialized processor with a specific microcode, designed to undertake Java and XML processing. these processors do not modify the number of MSUs of the platform to which they are linked, preventing software cost increases. Since zAAPs were released, several ISV’s have modified their Software products to exploit their functions.
z/Architectureinternal architecture of recent z Series servers, 64-bit compatible.
zELc*zseries Entry License chargemonthly license for small Mainframe machines (zSeries 800, z890, z9 BC & z10 BC).
zIIPsystem z Integrated Information Processorspecialized processor with a specific microcode initially designed to relieve classic processors of some tasks linked to DB2 execution. zIIPs were extended to other tasks from IBM and non-IBM Software products.
zNALc* system z New Application License chargez/OS license with discounted price for LPARs which run some applications qualified by IBM, such as SAP, Siebel, PeopleSoft and others.

MA
INFR
AM
E :
IBM
zSe
ries
Mai
nfra
me
Cos
t Con
trol
PAg
E 71
W
HiT
EPA
PER
z/Osoperating system for Mainframes launched in 2000 and successor of an Operating System roadmap which was born in the 1960’s. z/OS is the successor of OS/390 and combines MVS (Multiple Virtual Storage) capacities with Unix System Services (USS) which allow UNIX programs execution on the platform.
z/TPF (Transaction Processing Facility) transactional only operation system (real time) for Mainframes, used mostly for application with a very high transactional throughput. For example, Airline or train companies booking system or credit card transactions.
z/VMmost recent generation of Mainframe hypervisors developed by IBM in the 1960’s.
z/VsEanother Mainframe OS by IBM, successor of DOS/360 which equipped the first machine generations.

PAg
E 72
Figure 1: Sample high Availability Mainframe Configuration 16
Figure 2: Cross Synchronous Copy – Classical Legacy Architecture 17
Figure 3: Campus Mode Synchronous Copy – New Architecture 17
Figure 4: IBM Mainframe Software Pricing timeline 29
Figure 5: VWLC Rolling 4 hour Average (R4hA) Formula 39
Figure 6: VWLC Rolling 4 hour Average (R4hA) example 39
Figure 7: MSU Pricing Structure – Declining Cost for Additional Incremental MSU Usage 40
Figure 8: z/OS via z196 & AWLC Incremental MSU Pricing example 40
Figure 9: example Multiple LPAR MSU Usage for SCRt Report Submission 41
Figure 10: SCRt soft-capping calculation formula – R4hA or DC 42
Figure 11: Workload soft-capping example – R4hA vs. DC 42
Figure 12: Unconstrained workload example – R4hA vs. SCRt & IMSU analysis 45
Figure 13: ASC soft-capping workload example – R4hA vs. SCRt & IMSU analysis 46
Figure 14: ASC MSU usage profile – controlled growth as per the capacity plan 47
Figure 15: SCRt extract – peak MSU usage for z/OS and related software products 49
Figure 16: VWLC SCRt MSU usage analysis for individual z/OS products 49
Figure 17: IBM software MLC cost evolution during the 2006-2011 period 50
Figure 18: Server consolidation activity – before configuration of April 2007 53
Figure 19: Server consolidation activity – after configuration of April 2011 53
Figure 20: Server consolidation activity – MLC software billing analysis 53
Figure 21: z/OS Dispatcher architecture schematic for zAAP specialty engine 54
Figure 22: IBM Mainframe capacity management process 58
Figure 23: IBM Mainframe capacity cost planning process 59
Figure 24: Sample 3 year IBM Mainframe server MIPS capacity forecast spreadsheet 60
Figure 25: Sample 3 year IBM Mainframe server MIPS capacity forecast histogram 60
Figure 26: Sample 3 year IBM Mainframe server/partition MIPS capacity forecast spreadsheet 61
Figure 27: Sample 3 year IBM Mainframe z10 server MIPS capacity forecast spreadsheet 61
Figure 28: Sample 3 year IBM Mainframe z196 server MIPS capacity forecast spreadsheet 61
Figure 29: Sample 3 year MSU capacity requirement, by MLC software product spreadsheet 62
Figure 30: Sample several year CPC peak MIPS usage for the on-line (tP) workload graph 63
Figure 31: Sample several year PF2 partition peak MIPS usage for the on-line (tP) workload graph 64
Figure 32: Sample several year PF10 partition peak MIPS usage for the on-line (tP) workload graph 64
Figure 33: Sample daily MSU R4hA peak for SCRt billing month (start of 2nd day-end of 1st day) graph 64
Figure 34: Sample MSU R4hA for peak SCRt billing day graph 65
Figure 35: Sample z/OS & DB2 MSU usage, as per SCRt calculations, graph 65
Figure 36: Sample MQ V6 & MQ V7 (SVC) usage, as per SCRt calculations, graph 65
Figure 37: Sample SCRt MSU & associated workload share (%) analysis table 66
table figuresof

MA
INFR
AM
E :
IBM
zSe
ries
Mai
nfra
me
Cos
t Con
trol
PAg
E 73
W
HiT
EPA
PER
Club des Responsables d’Infrastructure et de Production IT
Member of Digital Technology & Innovation
The DTI ALLIANCE (CRiP) is a community of CIOs, Chief IT Architects and senior IT infrastructure managemers from major European organisations. It is an executive peer network and a nonprofit organization aimed at providing a framework in which members can share knowledge and experience, collaborate on new technology evaluations and develop best practices guidelines, which are published as whitepapers. As of September 2012, more than 1.500 It Infrastructure & Operations professionals are part of the CRiP Alliance Social Network & Community:
- cRiP France created in 2007- cRiP Luxembourg created in oct 2011- cRiP switzerland to be created in 2012
As members of cRiP, It Infrastructure & Operations managers of major companies and public entities gain unparalleled insight into changing technologies, processes and evolving trends. they examine key issues, evaluate new practices and technologies, and unite these dynamic elements to improve decision making and accelerate time to market implementation. cRiP helps executive members to learn from the experience of their peers, and lead their teams with expanded skills, knowledge, and innovative agendas. 170 + companies are cRiP members. Companies are represented by their CtO (Chief technical Officer) or CIO (Chief Information officer). cRiP CtOs usually are in charge of Data Center facilities, Servers, Storage, Desktop, Network, Mobility, telecom, Middleware and Databases. Members are end Users only. cRiP is independent from any vendor or consulting organization and delivers agnostic information.
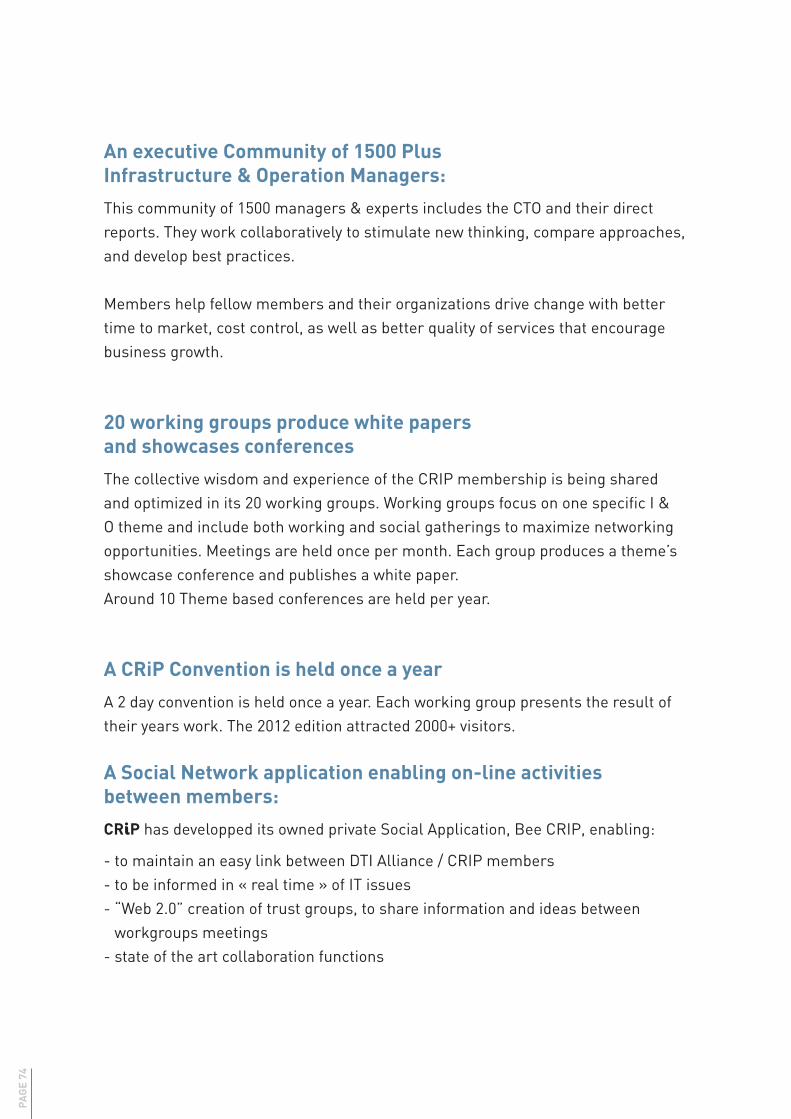
PAg
E 74
An executive community of 1500 Plus Infrastructure & Operation Managers:
this community of 1500 managers & experts includes the CtO and their direct reports. they work collaboratively to stimulate new thinking, compare approaches, and develop best practices.
Members help fellow members and their organizations drive change with better time to market, cost control, as well as better quality of services that encourage business growth.
20 working groups produce white papers and showcases conferences
the collective wisdom and experience of the CRIP membership is being shared and optimized in its 20 working groups. Working groups focus on one specific I & O theme and include both working and social gatherings to maximize networking opportunities. Meetings are held once per month. each group produces a theme’s showcase conference and publishes a white paper. Around 10 theme based conferences are held per year.
A cRiP convention is held once a year
A 2 day convention is held once a year. each working group presents the result oftheir years work. the 2012 edition attracted 2000+ visitors.
A social Network application enabling on-line activities between members:
cRiP has developped its owned private Social Application, Bee CRIP, enabling:
- to maintain an easy link between DtI Alliance / CRIP members- to be informed in « real time » of It issues- “Web 2.0” creation of trust groups, to share information and ideas between
workgroups meetings- state of the art collaboration functions

En application de la loi du 11 mars 1957, il est interdit de reproduire ; sous forme de copie, photocopie, reproduction, traduction ou conversion que ce soit mécanique ou électronique, intégralement ou partiellement le présent ouvrage, sur quelque support que ce soit, sans autorisation du CRiP.
Contactsclub des Responsables d’Infrastructures et de [email protected]

Cré
atio
n : f
red.
lam
eche
- w
ww
.ano
usde
joue
r.frwww.crip-asso.fr
15 rue vignon
75008 PAriS


