Embed Size (px)
Citation preview
Op
ium
po
pp
y cultivatio
n an
d su
stainab
le develo
pm
ent in
Sh
an S
tate, Myan
mar
2019
Opium poppy cultivation and sustainable development
in Shan State, Myanmar2019
Research
Socio-economic analysis

Table of Contents
Executive summary ........................................................................................................................................ iii
Challenges of isolation ............................................................................................................................... iii
New Insights ............................................................................................................................................... v
Implications for policy ............................................................................................................................... vi
Introduction ....................................................................................................................................................1
Prevalence and economic indicators of opium poppy cultivation in Shan State ............................................3
Estimates of the prevalence of opium poppy cultivation ...........................................................................3
Economic indicators of opium poppy cultivation .......................................................................................6
Challenges for achieving the Sustainable Development Goals (SDGs) in an opium poppy cultivation
environment in Shan State ...........................................................................................................................11
Challenges for achieving Sustainable Development Goal 1: “No Poverty” ..............................................11
Challenges for achieving Sustainable Development Goal 2 “Zero Hunger” .............................................16
Challenges for achieving Sustainable Development Goal 3: Good Health and Well‐being ......................20
Challenges for achieving Sustainable Development Goal 4: “Quality Education”. ..................................22
Challenges for achieving Sustainable Development Goal 5: “Gender equality” ......................................25
Challenges for achieving Sustainable Development Goal 6: “Clean Water and Sanitation” ....................29
Challenges for achieving Sustainable Development Goal 7: “Affordable and Clean Energy” ..................33
Challenges for achieving Sustainable Development Goal 8: “Decent Work and Economic Growth” ......35
Challenges for achieving Sustainable Development Goal 9: “Industry, innovation and infrastructure” .38
Challenges for achieving Sustainable Development Goal 10: “Reduced inequalities” ............................52
Challenges for achieving Sustainable Development Goal 12: “Responsible consumption and
production” ...............................................................................................................................................53
Challenges for achieving Sustainable Development Goal 13: “Climate Action” ......................................55
Challenges for achieving Sustainable Development Goal 15: “Life on land” ...........................................57
Challenges for achieving Sustainable Development Goal 16: “Peace, Justice, and Strong Institutions” .60
Summary of development gaps by region ................................................................................................62
Conclusions and lessons learned: Addressing diversity for promoting and enhancing resilience to opium
poppy cultivation in Shan State ....................................................................................................................65
Appendix 1. Description of SDG indicators included in the “spider” graphs of the Executive Summary and
Conclusions ...................................................................................................................................................67
Appendix 2. Survey Methodology .................................................................................................................69
Sampling procedure ..................................................................................................................................69
Survey organization ..................................................................................................................................69
Socio‐economic questionnaire design ......................................................................................................70
Surveyor training ......................................................................................................................................71
Conducting the survey ..............................................................................................................................72
Introducing the surveyors to headmen ....................................................................................................73
Data handling and collection ....................................................................................................................74
Data entry, data cleaning and quality control ..........................................................................................74
Limitations of the village survey ...............................................................................................................75
Appendix 3: Socio‐economic questionnaire 2018 ........................................................................................77
Appendix 4: Household questionnaire 2018 ................................................................................................89
Opium poppy cultivation and sustainable development in Shan State, Myanmar
i
Abbreviations
CCDAC Central Committee for Drug Abuse Control
GOUM Government of the Republic of the Union on Myanmar
ICMP UNODC Illicit Crop Monitoring Programme
RAB Research and Analysis Branch (UNODC)
PDMU Programme Management and Development Programme
SR Special Region
UNODC United Nations Office on Drugs and Crime
Acknowledgements
This report was prepared by the Research and Trend Analysis Branch (RAB), Division for Policy Analysis and
Public Affairs (DPA), United Nations Office on Drugs and Crime, under the supervision of Jean‐Luc Lemahieu,
Director of DPA, and Angela Me, Chief of RAB. In the field, supervision was undertaken by Jeremy Douglas,
Regional Representative, Southeast Asia and the Pacific.
Central Committee for Drug Abuse Control
Pol. Lt. Gen. Aung Win Oo Chief of Myanmar Police Force, Secretary of CCDAC
Pol. Brig. Gen. Win Naing Commander of Drug Enforcement Division, Joint Secretary of
CCDAC
Pol. Col. Oke Soe Tun Head of Project Management Department, CCDAC
The implementation of the survey would not have been possible without the support of the local
administrations and the dedicated work of 86 surveyors
UNODC Regional Office for Southeast Asia and the Pacific
Jeremy Douglas Regional Representative, Southeast Asia and the Pacific
Troels Vester Country Manager, Myanmar
Akara Umapornsakula Graphic Designer
San Lwin Htwe GIS Specialist and Survey Coordinator
Naing Lin Aung Data Analyst
UNODC Headquarter
Angela Me Chief, Research and Analysis Branch (RAB)
Anja Korenblik Chief, Programme Management and Development Unit (PDMU)
Coen Bussink Programme Officer, Team Leader, PDMU
Gary Chan Consultant, PDMU
Jaquelin Garcia Yi Research Officer, PDMU
Jonatan Isaksson Intern, PDMU
Lorenzo Vita Research Officer, PDMU
The implementation of Myanmar opium survey was made possible thanks to the financial support of the
Government of Japan and the United States of America.

Opium poppy cultivation and sustainable development in Shan State, Myanmar
ii
Opium poppy cultivation and sustainable development in Shan State, Myanmar
iii
Executive summary
Poppy‐growing villages face serious challenges to meet Sustainable Development Goals
About one in nine households in Shan State were directly involved in opium poppy cultivation in 2018, a
similar situation to 2016. This means opium poppy continues to be an integral part of the state’s economy.
The result is one of the findings from UNODC’s expanded data‐gathering operation in Myanmar. For the
first time, this report can draw on more than 1,500 households interviewed, as well as interviews with the
headmen in 599 villages. The extra information has enabled a socio‐economic analysis of opium cultivation
in the context of the Sustainable Development Goals (SDGs).
The research reveals that villages where opium poppy is cultivated have lower levels of development than
other villages. Disparities are most noticeable with regards to security, environment, job opportunities and
infrastructure. And there is a broad link between levels of development and poppy cultivation – East Shan
is the least developed area and has the highest levels of engagement in poppy cultivation. However, a
closer look shows that there are important variations within the region that are key to understanding drug
control and development challenges.
Non‐state groups control many poppy villages, suggesting a link between governance and opium poppy
cultivation
Poppy villages were in general more likely than non‐poppy villages to be under the control of militias and
other non‐state groups, according to surveys of village headmen. Some 18 per cent of poppy‐growing
villages were beyond government control, compared with 9 per cent of non‐poppy villages. This link was
strongest in North Shan, where reported conflicts between government and anti‐government forces were
most frequent. In North Shan, more than half of poppy villages were controlled by militias or other forces,
compared with 12 per cent of non‐poppy villages.
There was no significant difference in the level of perceived safety between poppy and non‐poppy villages
– less than half of village headmen said their village was ‘safe’ or ‘very safe’ regardless of the presence of
opium poppy.
Challenges of isolation
Poppy villages tend to be more cut off from main road network, restricting opportunities for
farmers
Villages where opium poppy is cultivated tend to be more remote than non‐poppy villages. The analysis
builds a picture of remoteness using indicators including access to paved roads and distance to the main
road network. There were signs of improvement between 2016 and 2018, most notably the proportion of
villages with access to paved roads increased from 29 per cent to 34 per cent for non‐poppy villages, and
from 16 per cent to 22 per cent for poppy villages. However, this means that poppy villages are still far less
likely to have access to paved roads.
As a result, farmers in poppy villages face longer travel times to the nearest market and less access. Longer
travel times result in higher transaction costs and potentially higher crop losses, which restricts the
opportunities for income‐generation from agriculture.
Opium poppy cultivation and sustainable development in Shan State, Myanmar
iv
Formal institutions are more difficult to access in poppy villages
Access to money, schools and medical facilities are all more difficult in poppy villages. For example, most
farmers who grow poppy said they needed money to fund a large expense, suggesting that they had no
access to financial institutions or other lines of credit.
While neither type of village was well served by medical facilities – just 19 per cent of poppy villages and
21 per cent of non‐poppy villages had a local clinic – residents of poppy villages with no clinic of their own
faced longer walks to the closest practice. In another indication of a serious development challenge,
sanitary facilities were found less frequently in poppy villages. One quarter of poppy village headmen
reporting that locals practised open defecation, compared with just 1 in 20 in non‐poppy villages. Although
the situation has improved, with more households having access to flushing toilets in 2018 than 2016, past
studies suggest that rural households without access to sanitation will still lose more working days to ill
health and spend more on health.
A similar picture emerges with schools. More than 30 per cent of villages had no local school, but average
walking times were longer for children from poppy villages. A more detailed analysis suggests an ingrained
disparity in education levels – more than half of the heads of poppy growing households had no education
at all, compared with 31 per cent in non‐poppy growing households.
Reliable sources of electricity are rarer in poppy villages
Farmers in non‐poppy villages are far more likely to have access to the main power grid – and this gap is
widening. Just 5 per cent of poppy villages had access to the public grid in 2018, a similar proportion to two
years earlier. By contrast, 31 per cent of non‐poppy villages had access to the public grid in 2018, jumping
from 22 per cent two years earlier. Although alternative sources of electricity such as solar panels are
becoming more widely available, one in six poppy villages still relies on candles for lighting.
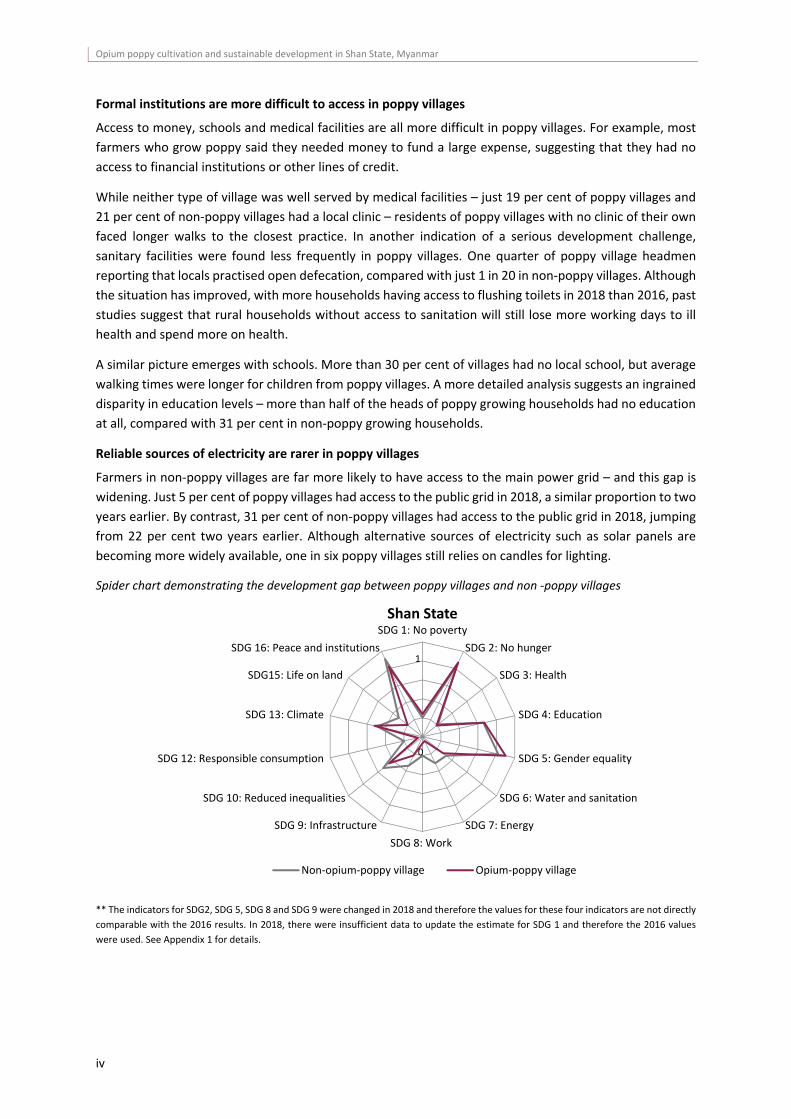
Spider chart demonstrating the development gap between poppy villages and non ‐poppy villages
** The indicators for SDG2, SDG 5, SDG 8 and SDG 9 were changed in 2018 and therefore the values for these four indicators are not directly
comparable with the 2016 results. In 2018, there were insufficient data to update the estimate for SDG 1 and therefore the 2016 values
were used. See Appendix 1 for details.
SDG 1: No poverty
SDG 2: No hunger
SDG 3: Health
SDG 4: Education
SDG 5: Gender equality
SDG 6: Water and sanitation
SDG 7: Energy
SDG 8: Work
SDG 9: Infrastructure
SDG 10: Reduced inequalities
SDG 12: Responsible consumption
SDG 13: Climate
SDG15: Life on land
SDG 16: Peace and institutions
Shan State
Non‐opium‐poppy village Opium‐poppy village
1
0
Opium poppy cultivation and sustainable development in Shan State, Myanmar
v
New Insights
Greater environmental strains
Most villages in Shan State depended on wood from local forests for cooking, particularly in poppy villages.
This pressure on local resources is reflected in the reported deterioration of forests. More village headmen
from poppy villages reported declining local forest quality in the last two years than their peers from non‐
poppy villages.
In addition, poppy growing households reported significantly worse soil quality. In North Shan 22 per cent
of non‐poppy growing households reported good quality of soil, compared with only 2 per cent among
poppy growing households. In South Shan, 8 per cent of non‐poppy growing households reported good soil
quality, compared with 2 per cent among poppy growing households
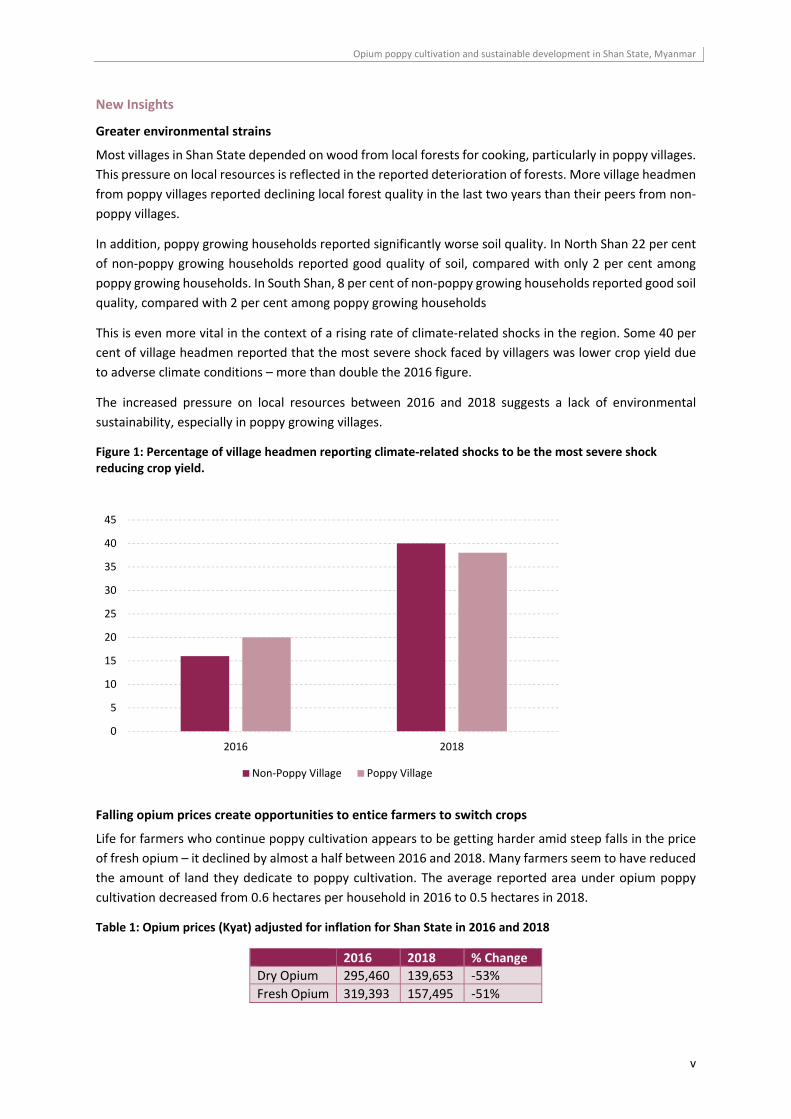
This is even more vital in the context of a rising rate of climate‐related shocks in the region. Some 40 per
cent of village headmen reported that the most severe shock faced by villagers was lower crop yield due
to adverse climate conditions – more than double the 2016 figure.
The increased pressure on local resources between 2016 and 2018 suggests a lack of environmental
sustainability, especially in poppy growing villages.
Figure 1: Percentage of village headmen reporting climate‐related shocks to be the most severe shock reducing crop yield.
Falling opium prices create opportunities to entice farmers to switch crops
Life for farmers who continue poppy cultivation appears to be getting harder amid steep falls in the price
of fresh opium – it declined by almost a half between 2016 and 2018. Many farmers seem to have reduced
the amount of land they dedicate to poppy cultivation. The average reported area under opium poppy
cultivation decreased from 0.6 hectares per household in 2016 to 0.5 hectares in 2018.
Table 1: Opium prices (Kyat) adjusted for inflation for Shan State in 2016 and 2018
2016 2018 % Change
Dry Opium 295,460 139,653 ‐53%
Fresh Opium 319,393 157,495 ‐51%
0
5
10
15
20
25
30
35
40
45
2016 2018
Non‐Poppy Village Poppy Village
Opium poppy cultivation and sustainable development in Shan State, Myanmar
vi
This trend gives momentum to those wanting to encourage farmers to switch to other crops. Several other
indicators support this argument. For example, average daily wages in villages that do not grow poppy
were significantly higher than those in poppy villages in 2018. UNODC’s assessment suggests a farm
labourer would earn US$3.7 a day in non‐poppy villages, falling to US$3.0 in poppy villages. Perhaps as a
result of higher wages, a larger proportion of people in non‐poppy villages reported being able to build up
savings. The gender pay gap, present in all villages, appeared to be widest among those engaged in non‐
farm labour in poppy villages with women earning 21 per cent less than men for this type of work.
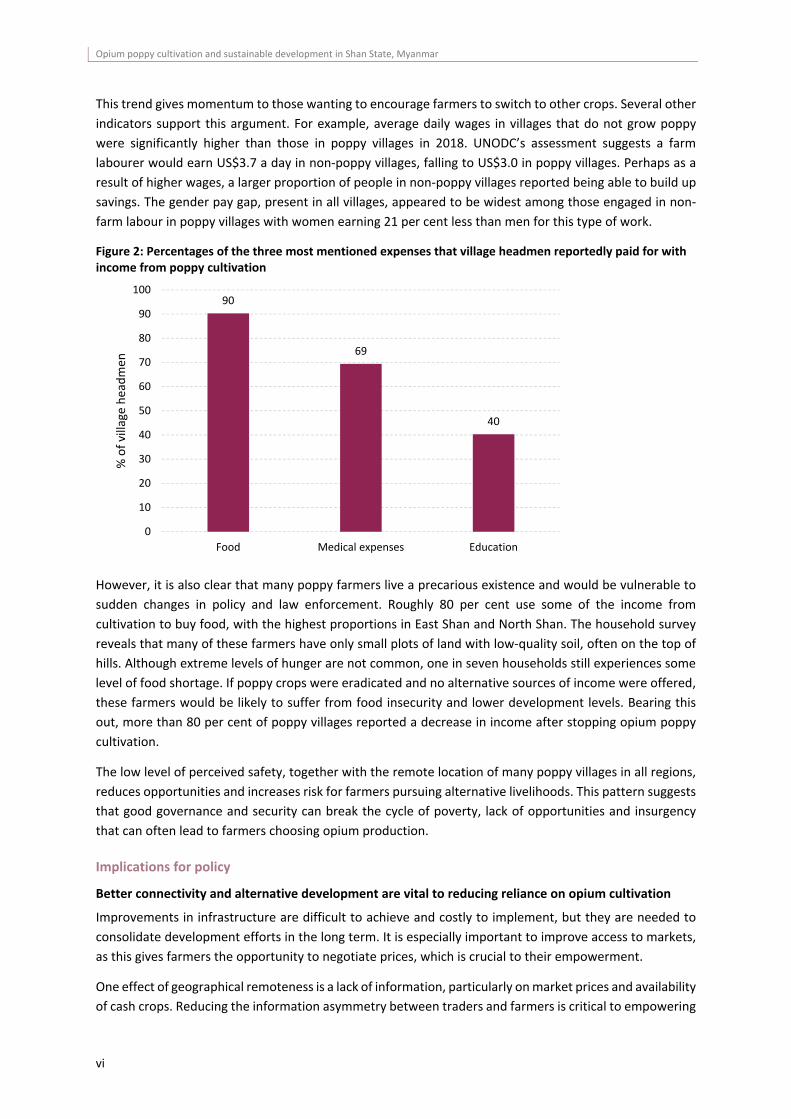
Figure 2: Percentages of the three most mentioned expenses that village headmen reportedly paid for with income from poppy cultivation
However, it is also clear that many poppy farmers live a precarious existence and would be vulnerable to
sudden changes in policy and law enforcement. Roughly 80 per cent use some of the income from
cultivation to buy food, with the highest proportions in East Shan and North Shan. The household survey
reveals that many of these farmers have only small plots of land with low‐quality soil, often on the top of
hills. Although extreme levels of hunger are not common, one in seven households still experiences some
level of food shortage. If poppy crops were eradicated and no alternative sources of income were offered,
these farmers would be likely to suffer from food insecurity and lower development levels. Bearing this
out, more than 80 per cent of poppy villages reported a decrease in income after stopping opium poppy
cultivation.
The low level of perceived safety, together with the remote location of many poppy villages in all regions,
reduces opportunities and increases risk for farmers pursuing alternative livelihoods. This pattern suggests
that good governance and security can break the cycle of poverty, lack of opportunities and insurgency
that can often lead to farmers choosing opium production.
Implications for policy
Better connectivity and alternative development are vital to reducing reliance on opium cultivation
Improvements in infrastructure are difficult to achieve and costly to implement, but they are needed to
consolidate development efforts in the long term. It is especially important to improve access to markets,
as this gives farmers the opportunity to negotiate prices, which is crucial to their empowerment.
One effect of geographical remoteness is a lack of information, particularly on market prices and availability
of cash crops. Reducing the information asymmetry between traders and farmers is critical to empowering
90
69
40
0
10
20
30
40
50
60
70
80
90
100
Food Medical expenses Education
% of village headmen
Opium poppy cultivation and sustainable development in Shan State, Myanmar
vii
farmers and breaking down the barriers that prevent licit crops from becoming a viable alternative to poppy.
The current low level of connectivity in poppy villages would need to be improved if farmers are to be
encouraged to grow other crops. In light of the reported stresses on local resources, implemented policies
should also consider environmental sustainability.
UNODC has been asked to increase its support to the Government of Myanmar in implementing an
alternative development strategy. UNODC has therefore developed several projects to improve short‐ and
medium‐term access to food and income.
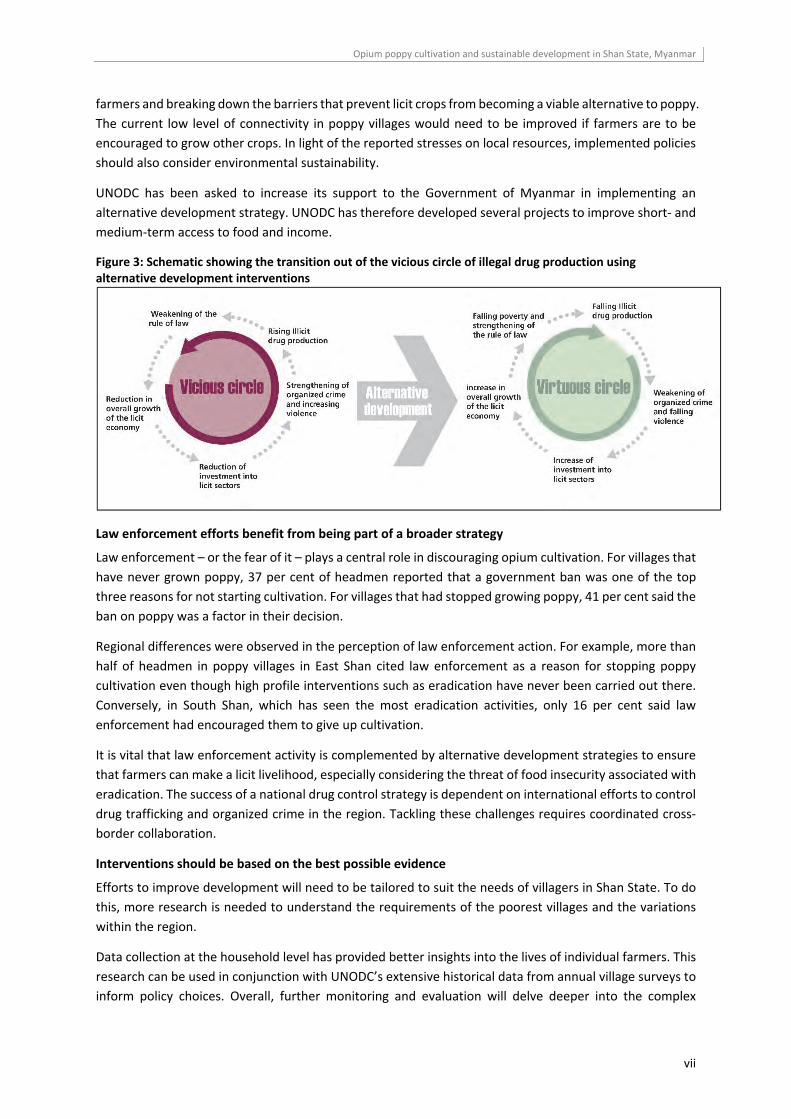
Figure 3: Schematic showing the transition out of the vicious circle of illegal drug production using alternative development interventions
Law enforcement efforts benefit from being part of a broader strategy
Law enforcement – or the fear of it – plays a central role in discouraging opium cultivation. For villages that
have never grown poppy, 37 per cent of headmen reported that a government ban was one of the top
three reasons for not starting cultivation. For villages that had stopped growing poppy, 41 per cent said the
ban on poppy was a factor in their decision.
Regional differences were observed in the perception of law enforcement action. For example, more than
half of headmen in poppy villages in East Shan cited law enforcement as a reason for stopping poppy
cultivation even though high profile interventions such as eradication have never been carried out there.
Conversely, in South Shan, which has seen the most eradication activities, only 16 per cent said law
enforcement had encouraged them to give up cultivation.
It is vital that law enforcement activity is complemented by alternative development strategies to ensure
that farmers can make a licit livelihood, especially considering the threat of food insecurity associated with
eradication. The success of a national drug control strategy is dependent on international efforts to control
drug trafficking and organized crime in the region. Tackling these challenges requires coordinated cross‐
border collaboration.
Interventions should be based on the best possible evidence
Efforts to improve development will need to be tailored to suit the needs of villagers in Shan State. To do
this, more research is needed to understand the requirements of the poorest villages and the variations
within the region.
Data collection at the household level has provided better insights into the lives of individual farmers. This
research can be used in conjunction with UNODC’s extensive historical data from annual village surveys to
inform policy choices. Overall, further monitoring and evaluation will delve deeper into the complex

Opium poppy cultivation and sustainable development in Shan State, Myanmar
viii
interactions between development, policy interventions and poppy cultivation. This will allow a better
understanding of what is happening in Shan State and how progress can be made towards meeting the
SDGs and reducing dependence on opium poppy cultivation.
Opium poppy cultivation and sustainable development in Shan State, Myanmar
1
Introduction
Since 1999, UNODC has been monitoring illicit crop cultivation areas and socio‐economic conditions in rural
villages in different supply countries. In most countries, the results indicate that illicit crop cultivation and
poverty are closely interlinked and coupled with other development issues, such as security and
governance1.
This report aims to contribute to this process by providing evidence to assist in improving the resilience of
rural communities to opium poppy cultivation. It also aims to identify socio‐economic differences between
villages that may be driving opium‐poppy cultivation and to evaluate the status of poppy and non‐poppy
villages (villages that cultivate opium poppy are hereafter referred to as “poppy villages” and villages that
do not as “non‐poppy villages”) in relation to the SDGs and their challenges for achieving the SDGs. This
report does not include estimates of opium poppy cultivation area, opium production (as reported in the
cultivation and production report2) or socio‐economic analyses outside Shan State.
In 2018, UNODC conducted a survey in a random sample of 599 villages in the opium poppy cultivation risk
area in Shan State3 and gathered socio‐economic and other relevant data to compare poppy villages and
non‐poppy villages. Since 2011, Myanmar has been undergoing a period of political transition and
Myanmar’s economy has been increasingly opened4. In a few years, almost every aspect of life has been
affected by fundamental economic and political reforms aimed at improving the living conditions of the
population5.
By disaggregating a range of socio‐economic village‐level data by opium poppy cultivation status and region
(and gender, where appropriate), this report highlights some major differences in living conditions among
farmers in Shan State6.
In launching the 2030 Agenda for Sustainable Development, Member States pledged to “leave no one
behind”. They recognized that the dignity of the individual is fundamental and that the goals and targets
should be met for all nations, peoples, and all segments of society. Furthermore, they declared their
endeavour to first reach those who are furthest behind. To support the implementation of the Sustainable
Development Agenda, a better understanding of the links between poverty, illicit drug cultivation,
production and trafficking is required6.
1 UNODC. 2016. World Drug Report. 2 UNODC. 2018. Myanmar Opium Survey 2018. 3 The sampling frame excludes the Western parts of South and North Shan (see methodology). 4 World Bank. 2014. Myanmar. Ending Poverty and Boosting shared Prosperity in a Time of Transition. 5 FAO/WFP, 2016. Special report from the crop and food security assessment mission to Myanmar. 6 UN Economic and Social Council. 2016. Progress towards the Sustainable Development Goals.
Opium poppy cultivation and sustainable development in Shan State, Myanmar
2
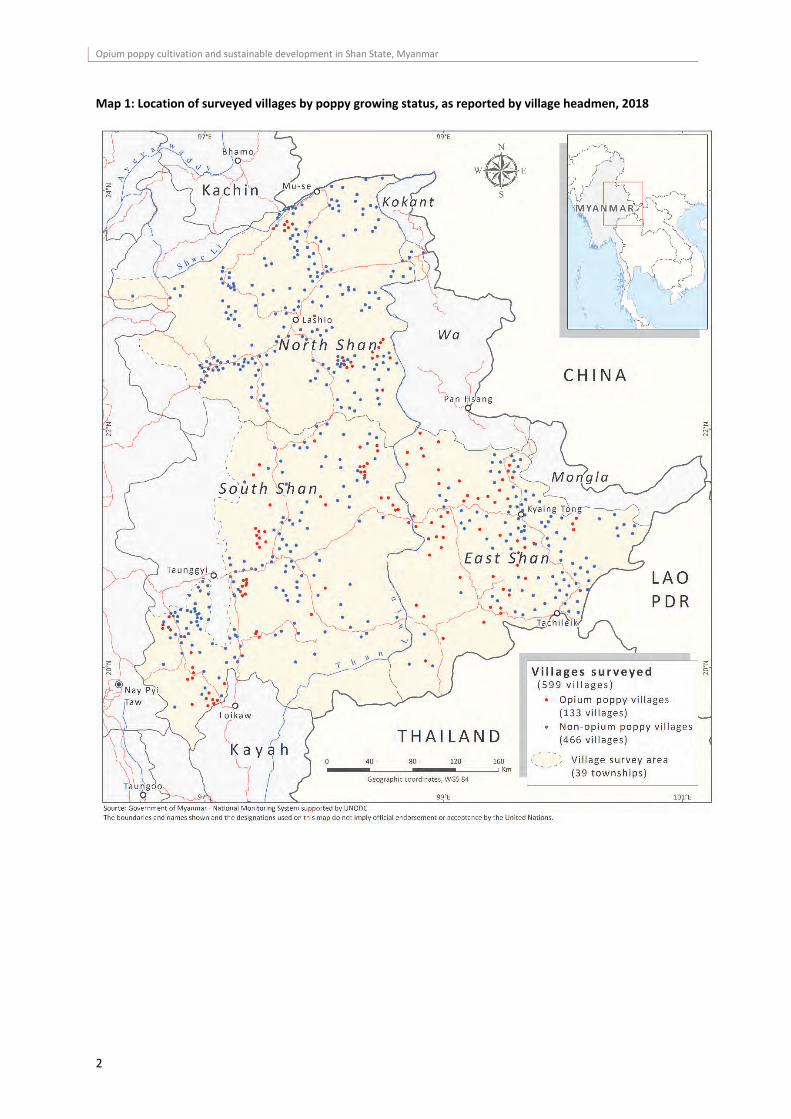
Map 1: Location of surveyed villages by poppy growing status, as reported by village headmen, 2018
Opium poppy cultivation and sustainable development in Shan State, Myanmar
3
Prevalence and economic indicators of opium poppy cultivation in Shan State
Estimates of the prevalence of opium poppy cultivation
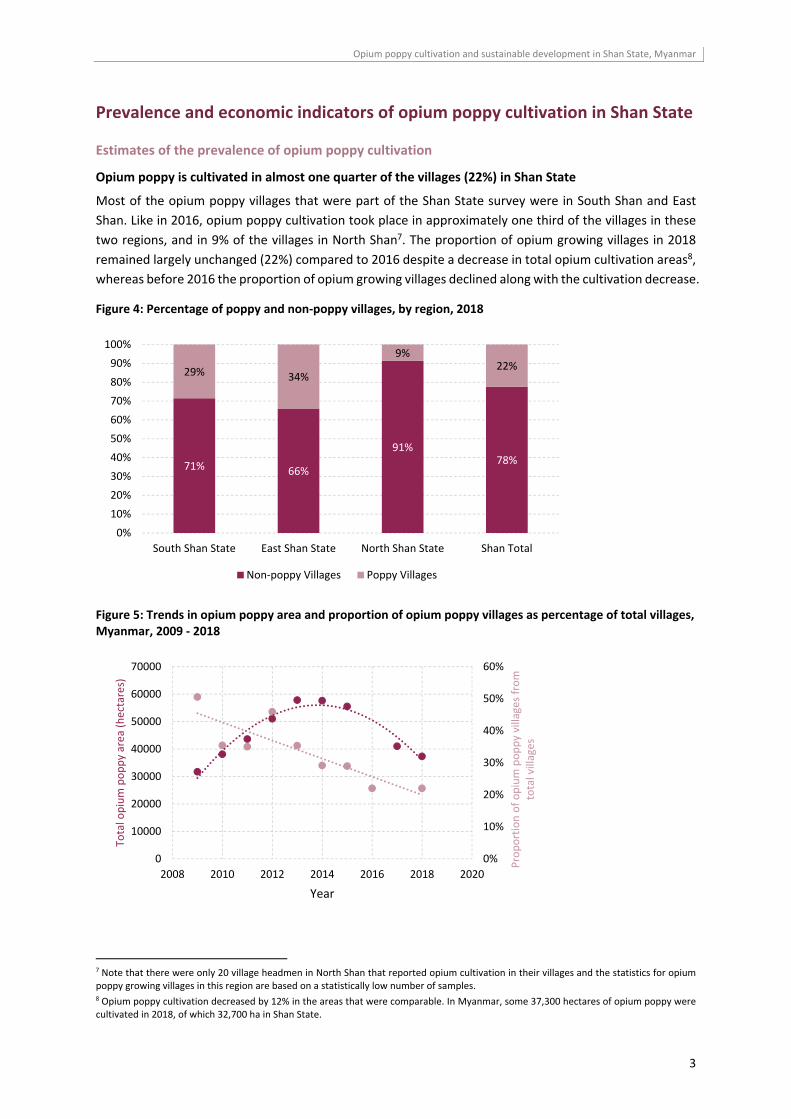
Opium poppy is cultivated in almost one quarter of the villages (22%) in Shan State
Most of the opium poppy villages that were part of the Shan State survey were in South Shan and East
Shan. Like in 2016, opium poppy cultivation took place in approximately one third of the villages in these
two regions, and in 9% of the villages in North Shan7. The proportion of opium growing villages in 2018
remained largely unchanged (22%) compared to 2016 despite a decrease in total opium cultivation areas8,
whereas before 2016 the proportion of opium growing villages declined along with the cultivation decrease.
Figure 4: Percentage of poppy and non‐poppy villages, by region, 2018
Figure 5: Trends in opium poppy area and proportion of opium poppy villages as percentage of total villages, Myanmar, 2009 ‐ 2018
7 Note that there were only 20 village headmen in North Shan that reported opium cultivation in their villages and the statistics for opium poppy growing villages in this region are based on a statistically low number of samples. 8 Opium poppy cultivation decreased by 12% in the areas that were comparable. In Myanmar, some 37,300 hectares of opium poppy were cultivated in 2018, of which 32,700 ha in Shan State.
71% 66%
91%78%
29% 34%
9%22%
0%
10%
20%
30%
40%
50%
60%
70%
80%
90%
100%
South Shan State East Shan State North Shan State Shan Total
Non‐poppy Villages Poppy Villages
2008 2010 2012 2014 2016 2018 2020
0%
10%
20%
30%
40%
50%
60%
0
10000
20000
30000
40000
50000
60000
70000
Proportion of opium poppy villages from
total villages
Total opium poppy area
(hectares)
Year
Opium poppy cultivation and sustainable development in Shan State, Myanmar
4
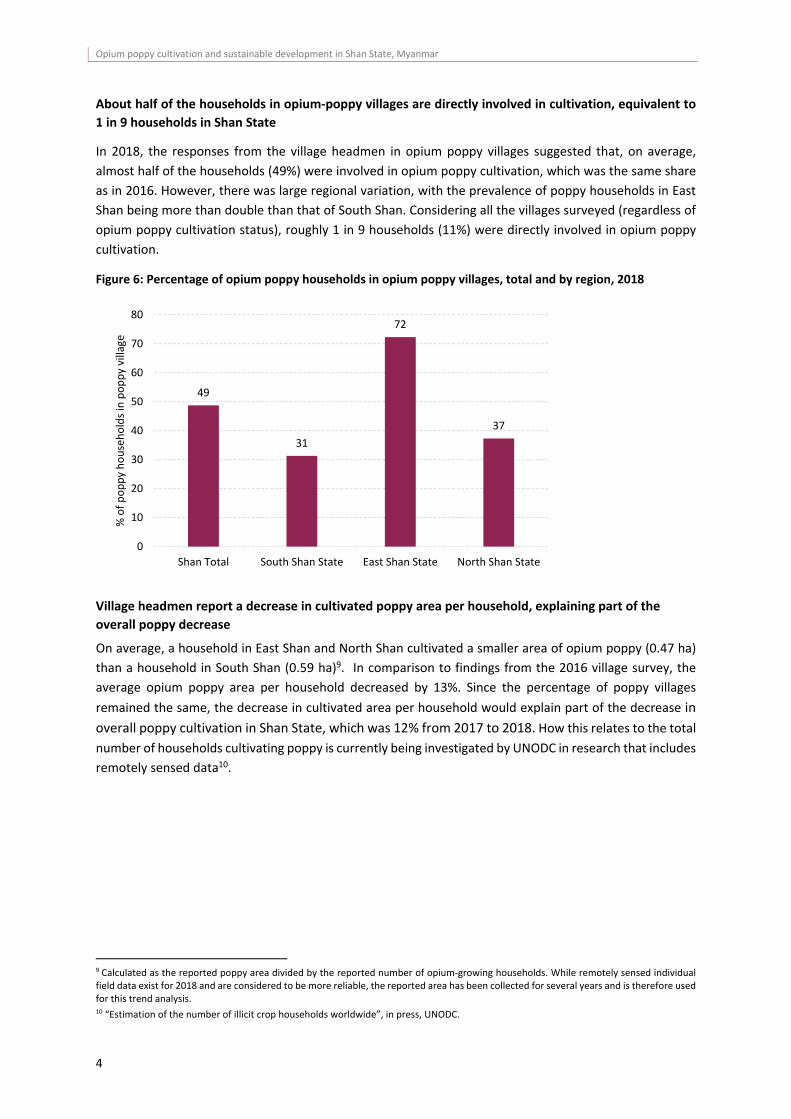
About half of the households in opium‐poppy villages are directly involved in cultivation, equivalent to
1 in 9 households in Shan State
In 2018, the responses from the village headmen in opium poppy villages suggested that, on average,
almost half of the households (49%) were involved in opium poppy cultivation, which was the same share
as in 2016. However, there was large regional variation, with the prevalence of poppy households in East
Shan being more than double than that of South Shan. Considering all the villages surveyed (regardless of
opium poppy cultivation status), roughly 1 in 9 households (11%) were directly involved in opium poppy
cultivation.
Figure 6: Percentage of opium poppy households in opium poppy villages, total and by region, 2018
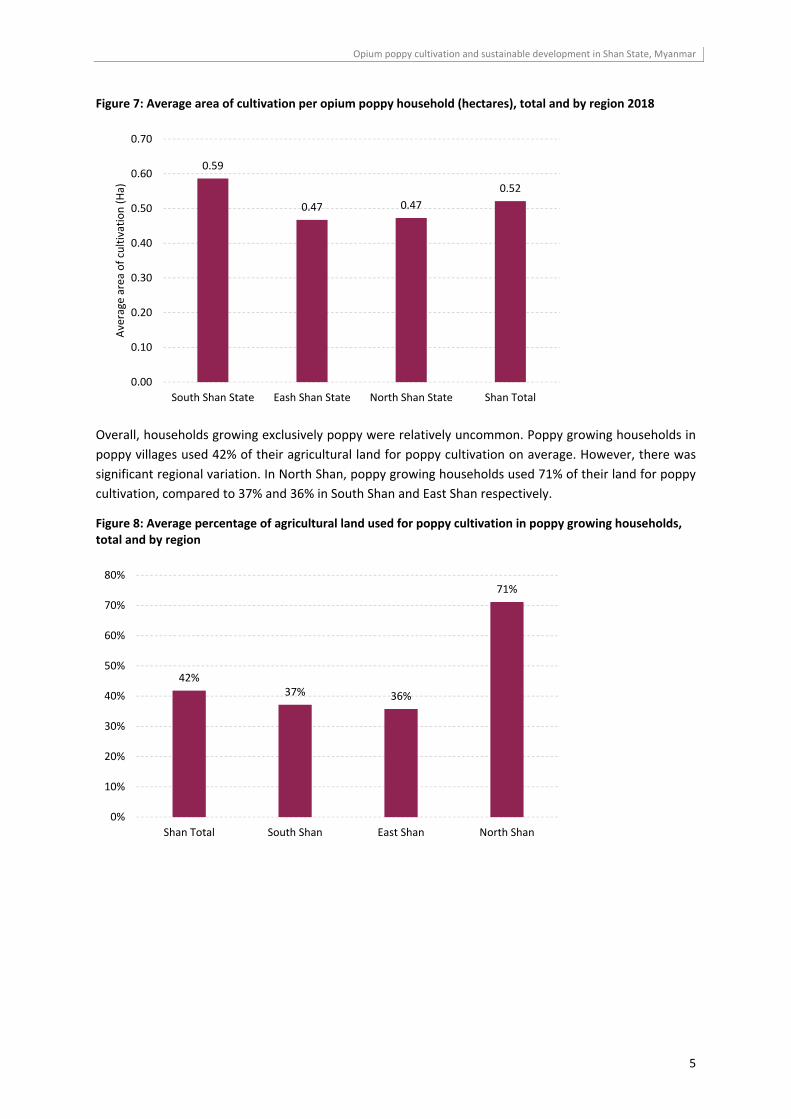
Village headmen report a decrease in cultivated poppy area per household, explaining part of the
overall poppy decrease
On average, a household in East Shan and North Shan cultivated a smaller area of opium poppy (0.47 ha)
than a household in South Shan (0.59 ha)9. In comparison to findings from the 2016 village survey, the
average opium poppy area per household decreased by 13%. Since the percentage of poppy villages
remained the same, the decrease in cultivated area per household would explain part of the decrease in
overall poppy cultivation in Shan State, which was 12% from 2017 to 2018. How this relates to the total
number of households cultivating poppy is currently being investigated by UNODC in research that includes
remotely sensed data10.
9 Calculated as the reported poppy area divided by the reported number of opium‐growing households. While remotely sensed individual field data exist for 2018 and are considered to be more reliable, the reported area has been collected for several years and is therefore used for this trend analysis. 10 “Estimation of the number of illicit crop households worldwide”, in press, UNODC.
49
31
72
37
0
10
20
30
40
50
60
70
80
Shan Total South Shan State East Shan State North Shan State
% of poppy households in poppy village
Opium poppy cultivation and sustainable development in Shan State, Myanmar
5
Figure 7: Average area of cultivation per opium poppy household (hectares), total and by region 2018
Overall, households growing exclusively poppy were relatively uncommon. Poppy growing households in
poppy villages used 42% of their agricultural land for poppy cultivation on average. However, there was
significant regional variation. In North Shan, poppy growing households used 71% of their land for poppy
cultivation, compared to 37% and 36% in South Shan and East Shan respectively.
Figure 8: Average percentage of agricultural land used for poppy cultivation in poppy growing households, total and by region
0.59
0.47 0.47
0.52
0.00
0.10
0.20
0.30
0.40
0.50
0.60
0.70
South Shan State Eash Shan State North Shan State Shan Total
Average area of cultivation (Ha)
42%37% 36%
71%
0%
10%
20%
30%
40%
50%
60%
70%
80%
Shan Total South Shan East Shan North Shan
Opium poppy cultivation and sustainable development in Shan State, Myanmar
6
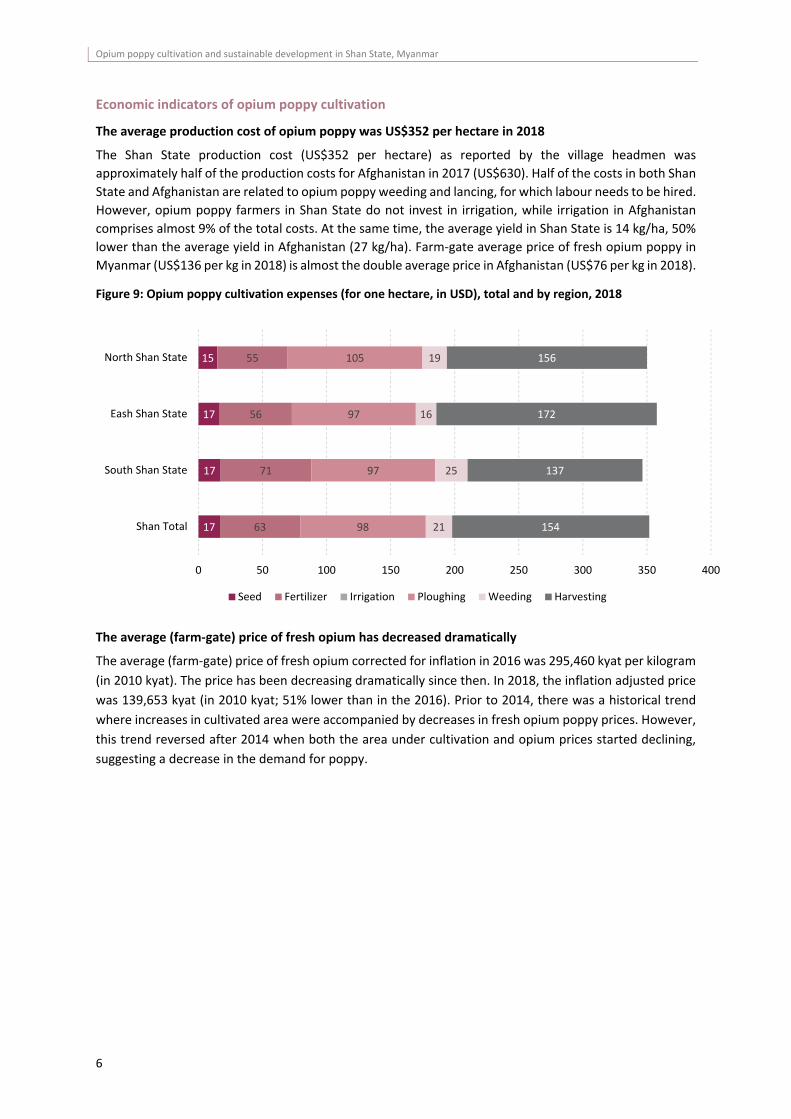
Economic indicators of opium poppy cultivation
The average production cost of opium poppy was US$352 per hectare in 2018
The Shan State production cost (US$352 per hectare) as reported by the village headmen was
approximately half of the production costs for Afghanistan in 2017 (US$630). Half of the costs in both Shan
State and Afghanistan are related to opium poppy weeding and lancing, for which labour needs to be hired.
However, opium poppy farmers in Shan State do not invest in irrigation, while irrigation in Afghanistan
comprises almost 9% of the total costs. At the same time, the average yield in Shan State is 14 kg/ha, 50%
lower than the average yield in Afghanistan (27 kg/ha). Farm‐gate average price of fresh opium poppy in
Myanmar (US$136 per kg in 2018) is almost the double average price in Afghanistan (US$76 per kg in 2018).
Figure 9: Opium poppy cultivation expenses (for one hectare, in USD), total and by region, 2018
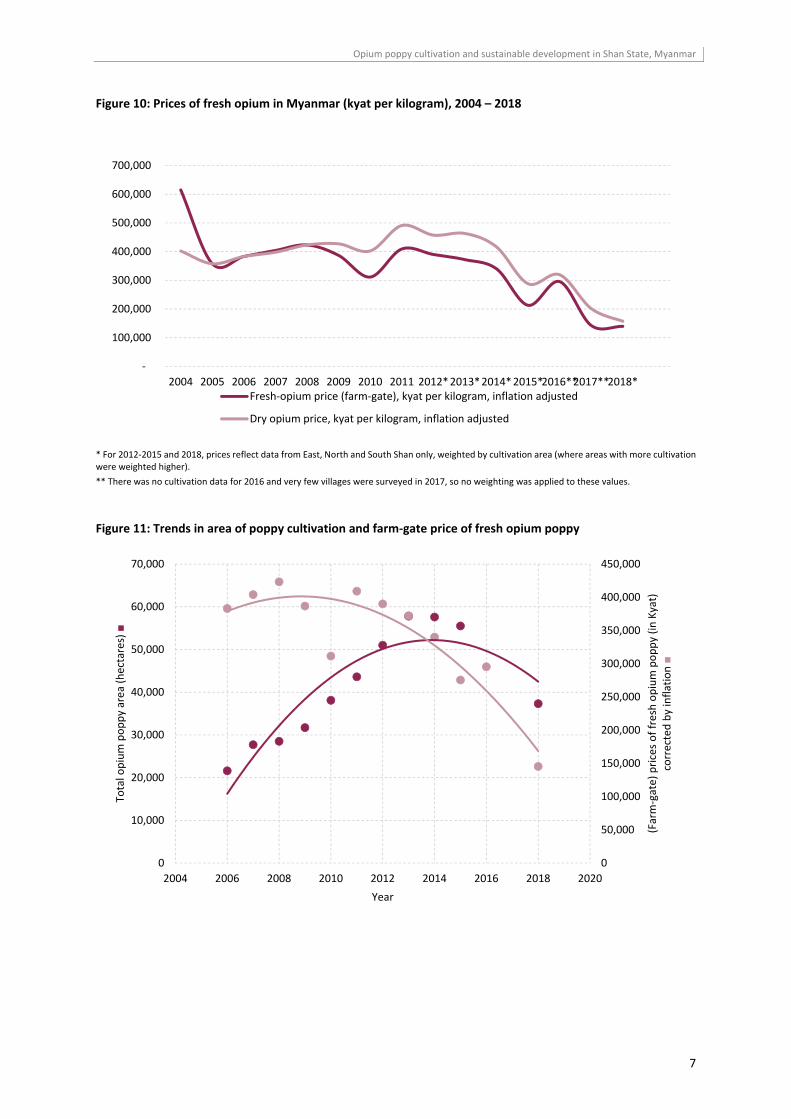
The average (farm‐gate) price of fresh opium has decreased dramatically
The average (farm‐gate) price of fresh opium corrected for inflation in 2016 was 295,460 kyat per kilogram
(in 2010 kyat). The price has been decreasing dramatically since then. In 2018, the inflation adjusted price
was 139,653 kyat (in 2010 kyat; 51% lower than in the 2016). Prior to 2014, there was a historical trend
where increases in cultivated area were accompanied by decreases in fresh opium poppy prices. However,
this trend reversed after 2014 when both the area under cultivation and opium prices started declining,
suggesting a decrease in the demand for poppy.
17
17
17
15
63
71
56
55
98
97
97
105
21
25
16
19
154
137
172
156
0 50 100 150 200 250 300 350 400
Shan Total
South Shan State
Eash Shan State
North Shan State
Seed Fertilizer Irrigation Ploughing Weeding Harvesting
Opium poppy cultivation and sustainable development in Shan State, Myanmar
7
Figure 10: Prices of fresh opium in Myanmar (kyat per kilogram), 2004 – 2018
* For 2012‐2015 and 2018, prices reflect data from East, North and South Shan only, weighted by cultivation area (where areas with more cultivation were weighted higher).
** There was no cultivation data for 2016 and very few villages were surveyed in 2017, so no weighting was applied to these values.
Figure 11: Trends in area of poppy cultivation and farm‐gate price of fresh opium poppy
‐
100,000
200,000
300,000
400,000
500,000
600,000
700,000
2004 2005 2006 2007 2008 2009 2010 2011 2012*2013*2014*2015*2016**2017**2018*Fresh‐opium price (farm‐gate), kyat per kilogram, inflation adjusted
Dry opium price, kyat per kilogram, inflation adjusted
0
50,000
100,000
150,000
200,000
250,000
300,000
350,000
400,000
450,000
0
10,000
20,000
30,000
40,000
50,000
60,000
70,000
2004 2006 2008 2010 2012 2014 2016 2018 2020
(Farm‐gate) prices of fresh opium poppy (in Kyat)
corrected by inflation ■
Total opium poppy area
(hectares) ■
Year
Opium poppy cultivation and sustainable development in Shan State, Myanmar
8
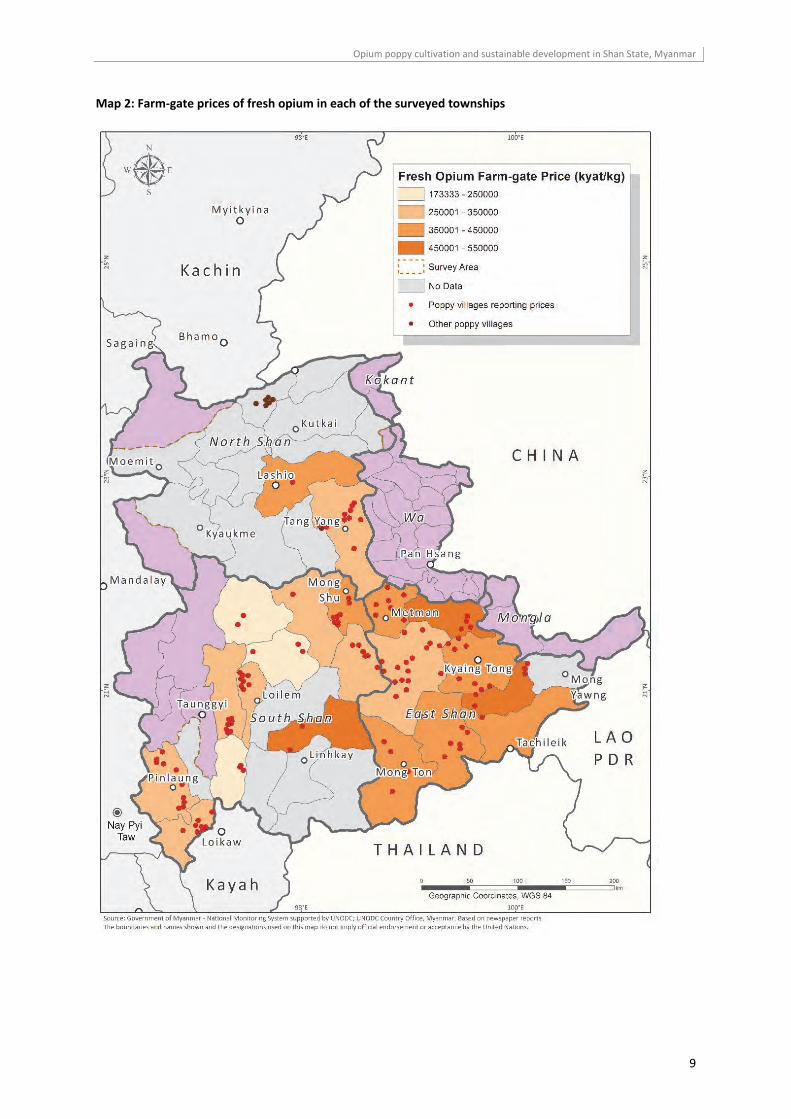
The farm‐gate prices of opium, as reported by village headmen, exhibit a spatial pattern in Shan State. The
prices in South Shan are generally low, with the exception of the Mongnai township north of Linhkay (it
should be noted that only two poppy villages were surveyed here). The farm‐gate prices are increasingly
higher towards the east and the highest prices are reported in the townships bordering the Special Regions
Wa and Mongla, suggesting a higher demand in these areas.
Opium poppy cultivation and sustainable development in Shan State, Myanmar
9
Map 2: Farm‐gate prices of fresh opium in each of the surveyed townships
Opium poppy cultivation and sustainable development in Shan State, Myanmar
10
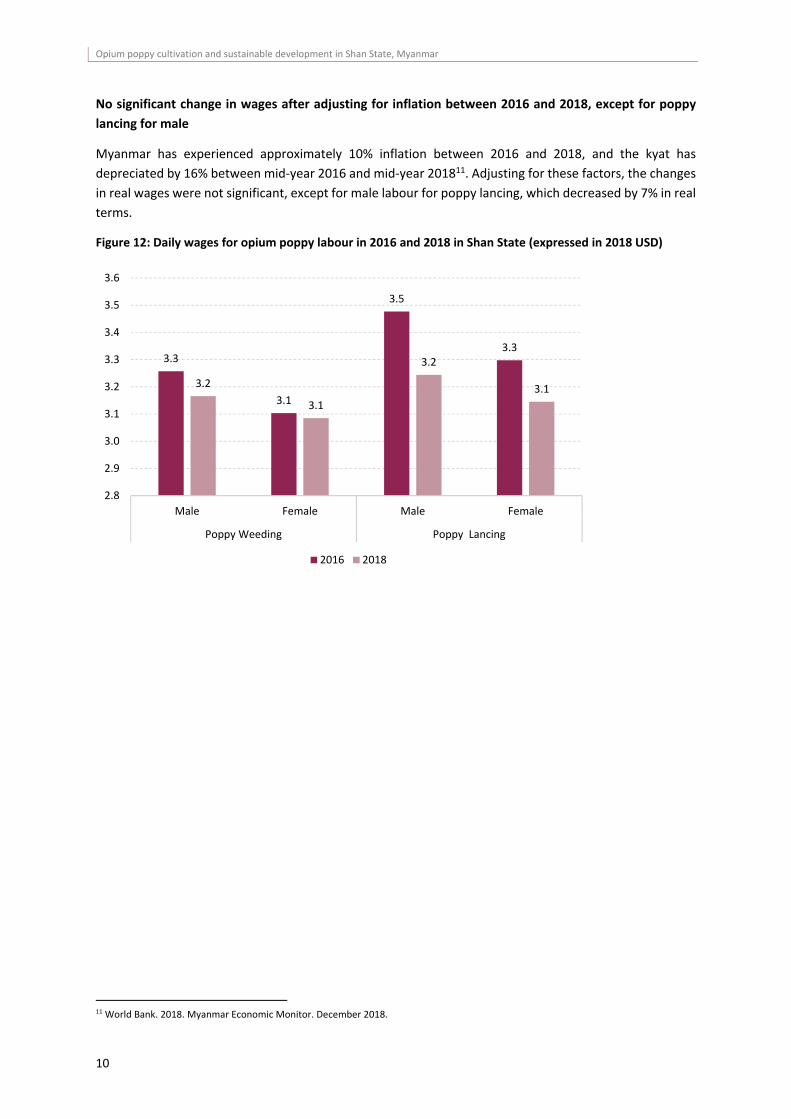
No significant change in wages after adjusting for inflation between 2016 and 2018, except for poppy
lancing for male
Myanmar has experienced approximately 10% inflation between 2016 and 2018, and the kyat has
depreciated by 16% between mid‐year 2016 and mid‐year 201811. Adjusting for these factors, the changes
in real wages were not significant, except for male labour for poppy lancing, which decreased by 7% in real
terms.
Figure 12: Daily wages for opium poppy labour in 2016 and 2018 in Shan State (expressed in 2018 USD)
11 World Bank. 2018. Myanmar Economic Monitor. December 2018.
3.3
3.1
3.5
3.3
3.2
3.1
3.2
3.1
2.8
2.9
3.0
3.1
3.2
3.3
3.4
3.5
3.6
Male Female Male Female
Poppy Weeding Poppy Lancing
2016 2018
Opium poppy cultivation and sustainable development in Shan State, Myanmar
11
Challenges for achieving the Sustainable Development Goals (SDGs) in an
opium poppy cultivation environment in Shan State
The 17 Sustainable Development Goals have 169 targets to be achieved by 2030, with 232 associated global
indicators 12. It is expected that the goals and targets will stimulate action over the next decade in areas of
critical importance for humanity and the planet. The SDGs will focus development policy globally and the
actions of public, private and community sectors by reflecting an overarching ambition of creating a more
equal, sustainable, inclusive and secure world.
The SDGs are intended to be action oriented and universally applicable, while reflecting the complex and
interconnected challenges of global development. They are intended to cover different realities and to
respect national policies and priorities. Each of the goals and targets must reflect national and local
conditions while facilitating the sharing of experiences, including successes, challenges and lessons learned
at the global level.
Poverty and opium poppy cultivation are interlinked. This section seeks to understand the specific local
challenges for achieving the SDGs in an opium poppy cultivation environment, mainly by comparing the
circumstances in poppy and non‐ poppy villages, which can help to understand the difficulties faced by
these two different types of villages in Shan State.
Challenges for achieving Sustainable Development Goal 1: “No Poverty”
SDG 1 calls for an end to poverty in all its manifestations by 2030. This SDG reflects the growing acceptance
that poverty is a multidimensional concept that reflects multiple deprivations in various aspects of life.
Eradicate extreme poverty13
In 2016, income per household and individual was calculated based on the village survey. In 2018, income
was measured in both the household survey and village survey, but the estimates from these two surveys
were not consistent, indicating that more research will be needed to refine the measure. In this report,
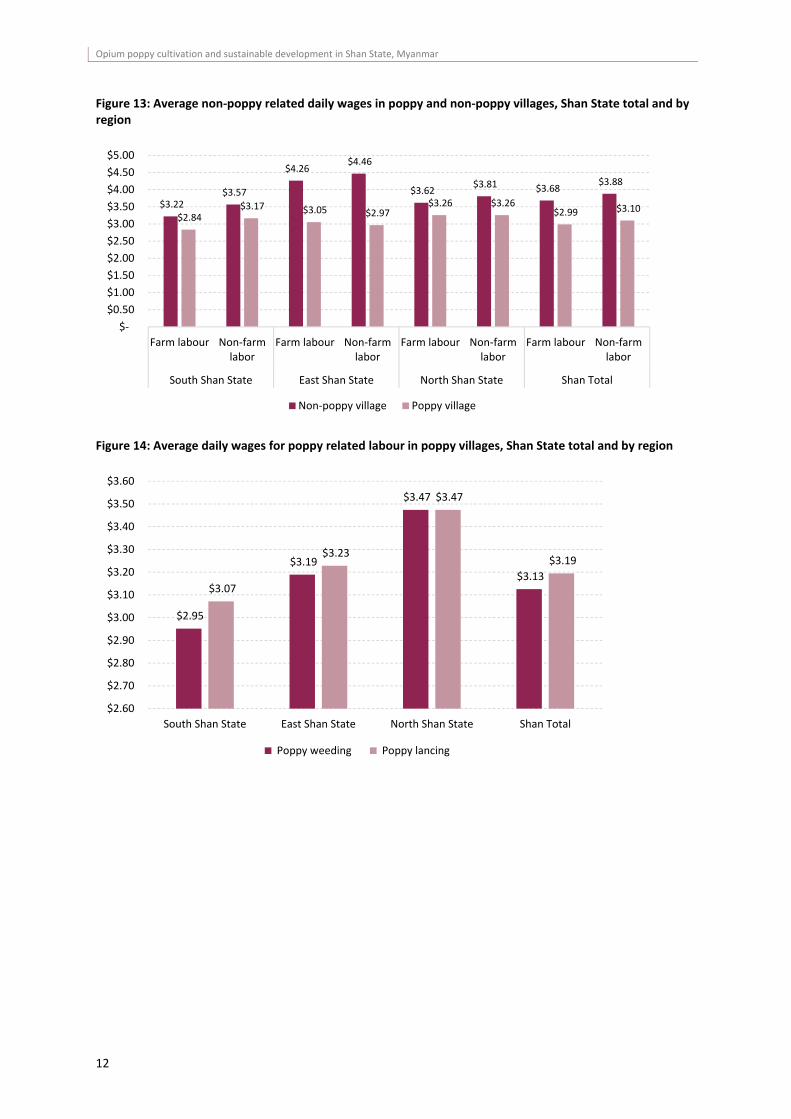
daily wages were used as a proxy measure for poverty. In 2018, average daily wages in Shan State were
below US$5, regardless of whether the job was poppy related or not. Overall, wages in non‐poppy villages
were significantly higher. Within poppy villages, apart from poppy lancing labour being slightly better paid
than other farm labour, there was no substantial difference between other type of labours. These patterns
were generally observed across all three regions of Shan State. There was one notable regional difference
– the daily wages in non‐poppy villages in East Shan were much higher than in North and South Shan, while
daily wages in poppy villages in East Shan were relatively similar to those in North and South Shan. Overall,
there was no significant change in daily wages between 2016 and 2018, after adjusting for inflation and
depreciation of Myanmar kyat.
12 Source (accessed May 20, 2019): https://unstats.un.org/sdgs/indicators/indicators‐list/ 13 This corresponds to Target 1.1 “by 2030, eradicate extreme poverty for all people everywhere, currently measured as people living on less than $1.25 a day”
Opium poppy cultivation and sustainable development in Shan State, Myanmar
12
Figure 13: Average non‐poppy related daily wages in poppy and non‐poppy villages, Shan State total and by region
Figure 14: Average daily wages for poppy related labour in poppy villages, Shan State total and by region
$3.22 $3.57
$4.26 $4.46
$3.62 $3.81 $3.68
$3.88
$2.84 $3.17 $3.05 $2.97
$3.26 $3.26 $2.99 $3.10
$‐
$0.50
$1.00
$1.50
$2.00
$2.50
$3.00
$3.50
$4.00
$4.50
$5.00
Farm labour Non‐farmlabor
Farm labour Non‐farmlabor
Farm labour Non‐farmlabor
Farm labour Non‐farmlabor
South Shan State East Shan State North Shan State Shan Total
Non‐poppy village Poppy village
$2.95
$3.19
$3.47
$3.13 $3.07
$3.23
$3.47
$3.19
$2.60
$2.70
$2.80
$2.90
$3.00
$3.10
$3.20
$3.30
$3.40
$3.50
$3.60
South Shan State East Shan State North Shan State Shan Total
Poppy weeding Poppy lancing
Opium poppy cultivation and sustainable development in Shan State, Myanmar
13
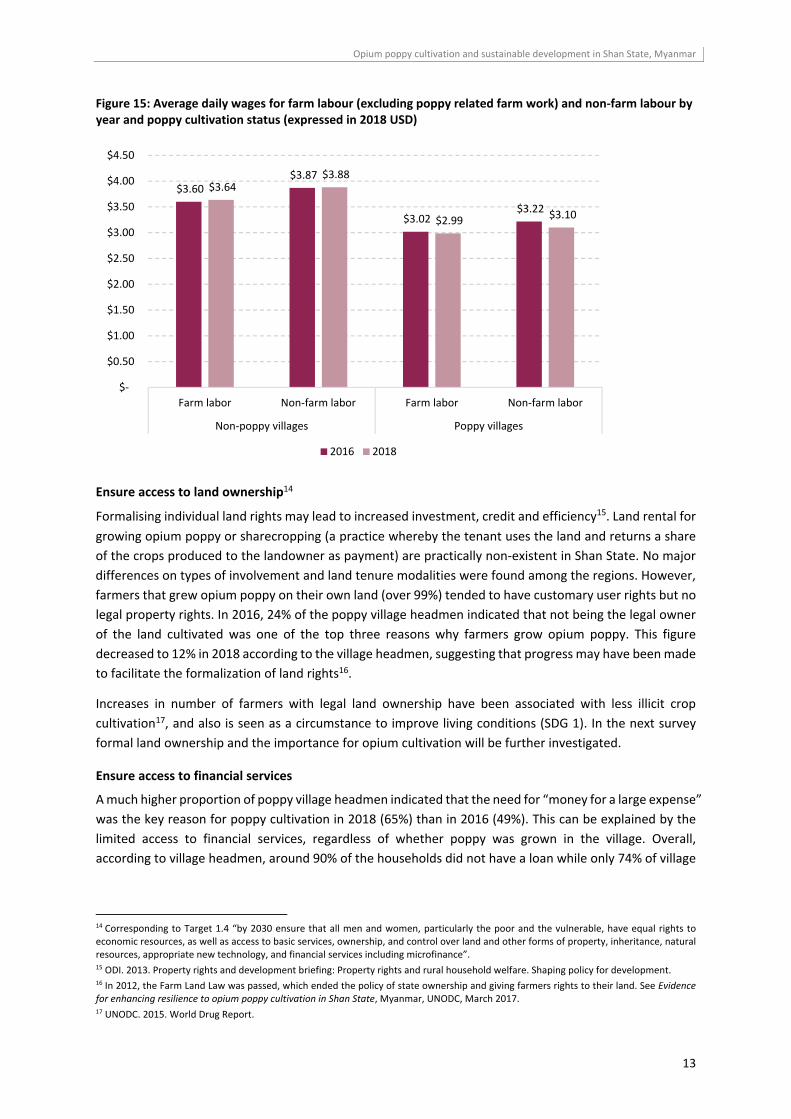
Figure 15: Average daily wages for farm labour (excluding poppy related farm work) and non‐farm labour by year and poppy cultivation status (expressed in 2018 USD)
Ensure access to land ownership14
Formalising individual land rights may lead to increased investment, credit and efficiency15. Land rental for
growing opium poppy or sharecropping (a practice whereby the tenant uses the land and returns a share
of the crops produced to the landowner as payment) are practically non‐existent in Shan State. No major
differences on types of involvement and land tenure modalities were found among the regions. However,
farmers that grew opium poppy on their own land (over 99%) tended to have customary user rights but no
legal property rights. In 2016, 24% of the poppy village headmen indicated that not being the legal owner
of the land cultivated was one of the top three reasons why farmers grow opium poppy. This figure
decreased to 12% in 2018 according to the village headmen, suggesting that progress may have been made
to facilitate the formalization of land rights16.
Increases in number of farmers with legal land ownership have been associated with less illicit crop
cultivation17, and also is seen as a circumstance to improve living conditions (SDG 1). In the next survey
formal land ownership and the importance for opium cultivation will be further investigated.
Ensure access to financial services
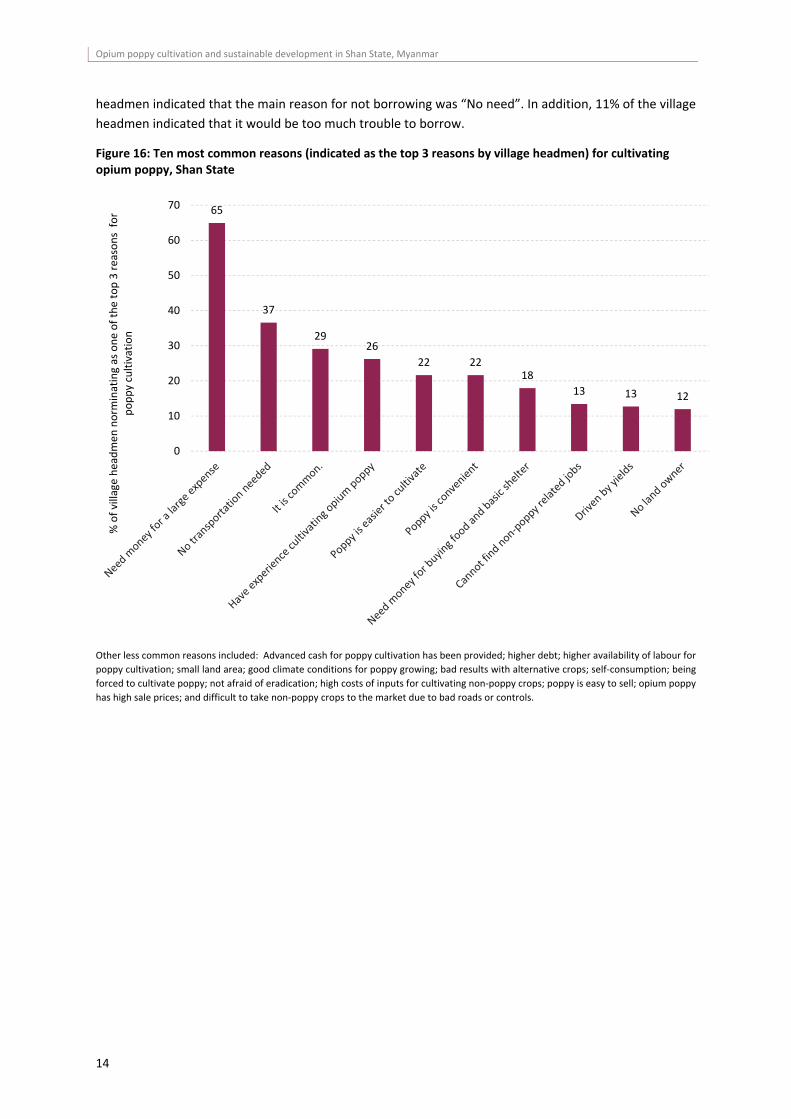
A much higher proportion of poppy village headmen indicated that the need for “money for a large expense”
was the key reason for poppy cultivation in 2018 (65%) than in 2016 (49%). This can be explained by the
limited access to financial services, regardless of whether poppy was grown in the village. Overall,
according to village headmen, around 90% of the households did not have a loan while only 74% of village
14 Corresponding to Target 1.4 “by 2030 ensure that all men and women, particularly the poor and the vulnerable, have equal rights to economic resources, as well as access to basic services, ownership, and control over land and other forms of property, inheritance, natural resources, appropriate new technology, and financial services including microfinance”. 15 ODI. 2013. Property rights and development briefing: Property rights and rural household welfare. Shaping policy for development. 16 In 2012, the Farm Land Law was passed, which ended the policy of state ownership and giving farmers rights to their land. See Evidence for enhancing resilience to opium poppy cultivation in Shan State, Myanmar, UNODC, March 2017. 17 UNODC. 2015. World Drug Report.
$3.60 $3.87
$3.02 $3.22
$3.64 $3.88
$2.99 $3.10
$‐
$0.50
$1.00
$1.50
$2.00
$2.50
$3.00
$3.50
$4.00
$4.50
Farm labor Non‐farm labor Farm labor Non‐farm labor
Non‐poppy villages Poppy villages
2016 2018
Opium poppy cultivation and sustainable development in Shan State, Myanmar
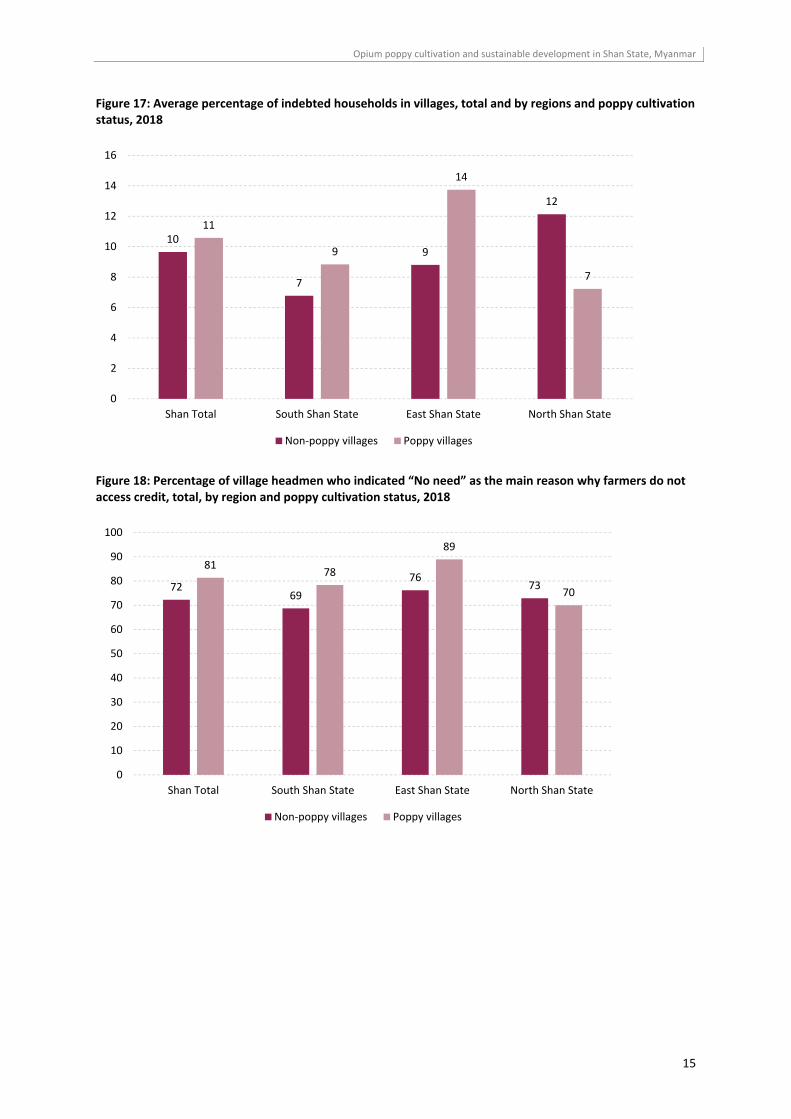
14
headmen indicated that the main reason for not borrowing was “No need”. In addition, 11% of the village
headmen indicated that it would be too much trouble to borrow.
Figure 16: Ten most common reasons (indicated as the top 3 reasons by village headmen) for cultivating opium poppy, Shan State
Other less common reasons included: Advanced cash for poppy cultivation has been provided; higher debt; higher availability of labour for
poppy cultivation; small land area; good climate conditions for poppy growing; bad results with alternative crops; self‐consumption; being
forced to cultivate poppy; not afraid of eradication; high costs of inputs for cultivating non‐poppy crops; poppy is easy to sell; opium poppy
has high sale prices; and difficult to take non‐poppy crops to the market due to bad roads or controls.
65
37
2926
22 2218
13 13 12
0
10
20
30
40
50
60
70
% of village headmen
norm
inating as one of the top 3 reasons for
poppy cultivation
Opium poppy cultivation and sustainable development in Shan State, Myanmar
15
Figure 17: Average percentage of indebted households in villages, total and by regions and poppy cultivation status, 2018
Figure 18: Percentage of village headmen who indicated “No need” as the main reason why farmers do not access credit, total, by region and poppy cultivation status, 2018
10
7
9
12
11
9
14
7
0
2
4
6
8
10
12
14
16
Shan Total South Shan State East Shan State North Shan State
Non‐poppy villages Poppy villages
7269
7673
8178
89
70
0
10
20
30
40
50
60
70
80
90
100
Shan Total South Shan State East Shan State North Shan State
Non‐poppy villages Poppy villages
Opium poppy cultivation and sustainable development in Shan State, Myanmar
16
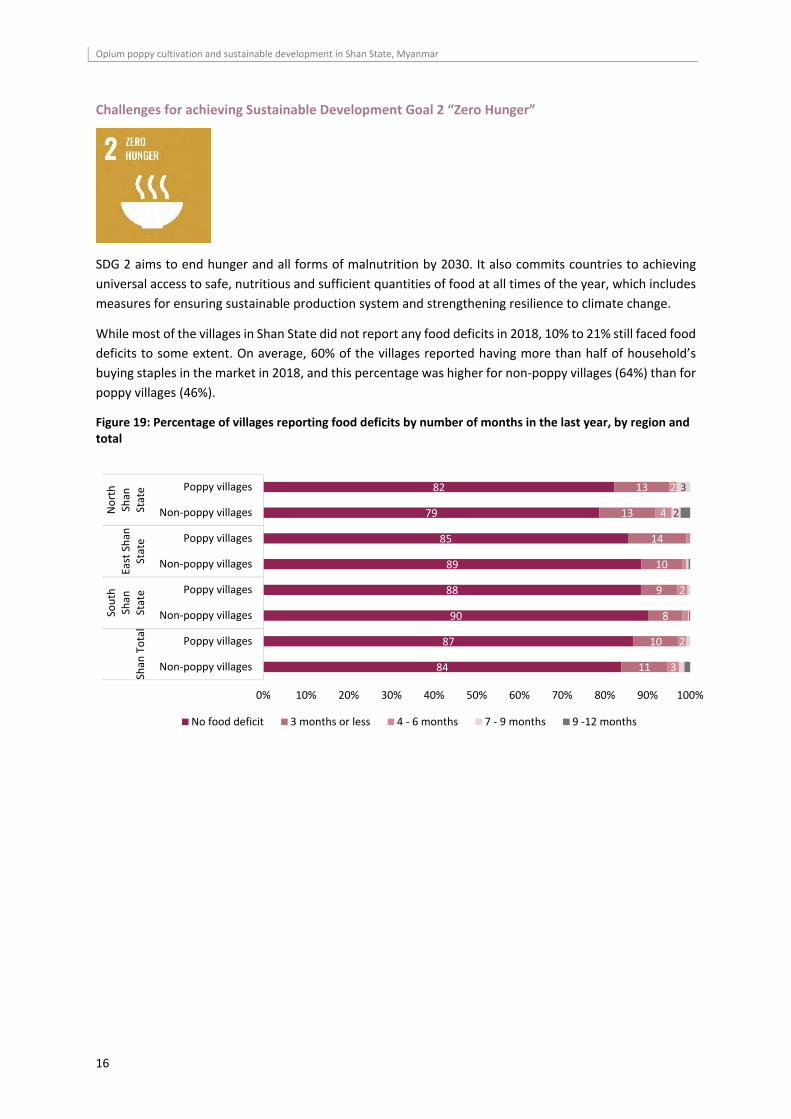
Challenges for achieving Sustainable Development Goal 2 “Zero Hunger”
SDG 2 aims to end hunger and all forms of malnutrition by 2030. It also commits countries to achieving
universal access to safe, nutritious and sufficient quantities of food at all times of the year, which includes
measures for ensuring sustainable production system and strengthening resilience to climate change.
While most of the villages in Shan State did not report any food deficits in 2018, 10% to 21% still faced food
deficits to some extent. On average, 60% of the villages reported having more than half of household’s
buying staples in the market in 2018, and this percentage was higher for non‐poppy villages (64%) than for
poppy villages (46%).
Figure 19: Percentage of villages reporting food deficits by number of months in the last year, by region and total
84
87
90
88
89
85
79
82
11
10
8
9
10
14
13
13
3
2
2
4
2
2
3
0% 10% 20% 30% 40% 50% 60% 70% 80% 90% 100%
Non‐poppy villages
Poppy villages
Non‐poppy villages
Poppy villages
Non‐poppy villages
Poppy villages
Non‐poppy villages
Poppy villages
Shan
Total
South
Shan
State
East Shan
State
North
Shan
State
No food deficit 3 months or less 4 ‐ 6 months 7 ‐ 9 months 9 ‐12 months
Opium poppy cultivation and sustainable development in Shan State, Myanmar
17
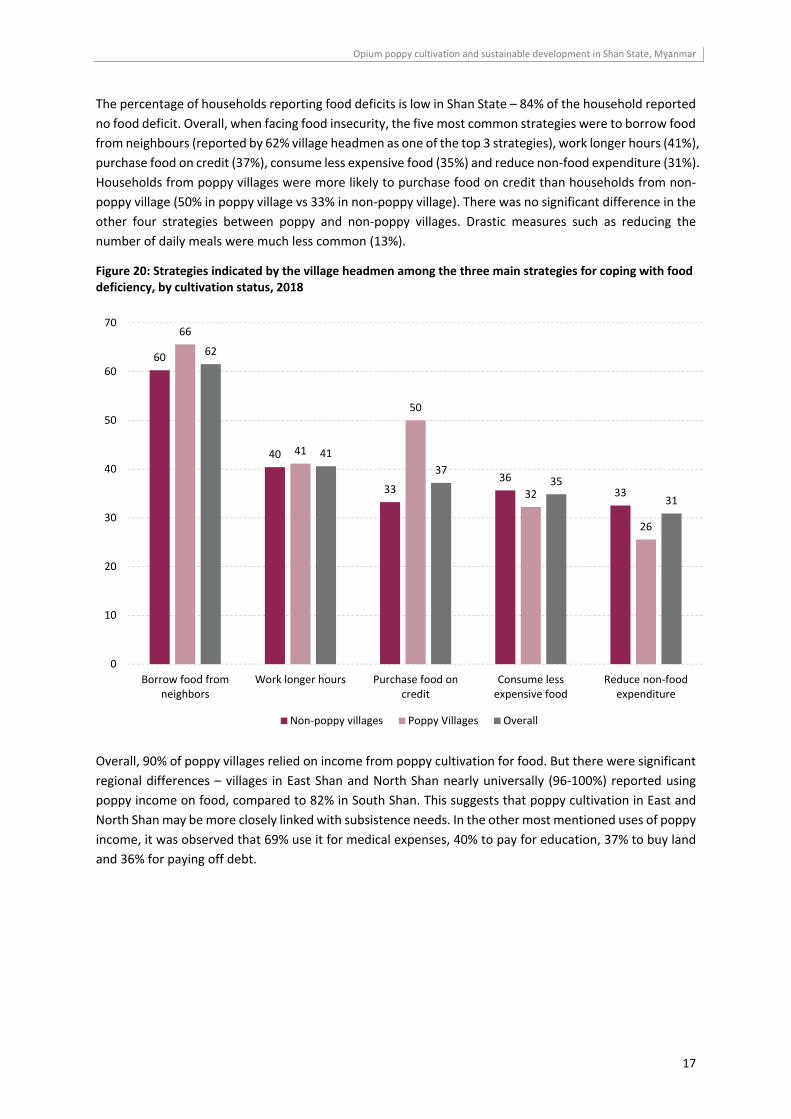
The percentage of households reporting food deficits is low in Shan State – 84% of the household reported
no food deficit. Overall, when facing food insecurity, the five most common strategies were to borrow food
from neighbours (reported by 62% village headmen as one of the top 3 strategies), work longer hours (41%),
purchase food on credit (37%), consume less expensive food (35%) and reduce non‐food expenditure (31%).
Households from poppy villages were more likely to purchase food on credit than households from non‐
poppy village (50% in poppy village vs 33% in non‐poppy village). There was no significant difference in the
other four strategies between poppy and non‐poppy villages. Drastic measures such as reducing the
number of daily meals were much less common (13%).
Figure 20: Strategies indicated by the village headmen among the three main strategies for coping with food deficiency, by cultivation status, 2018
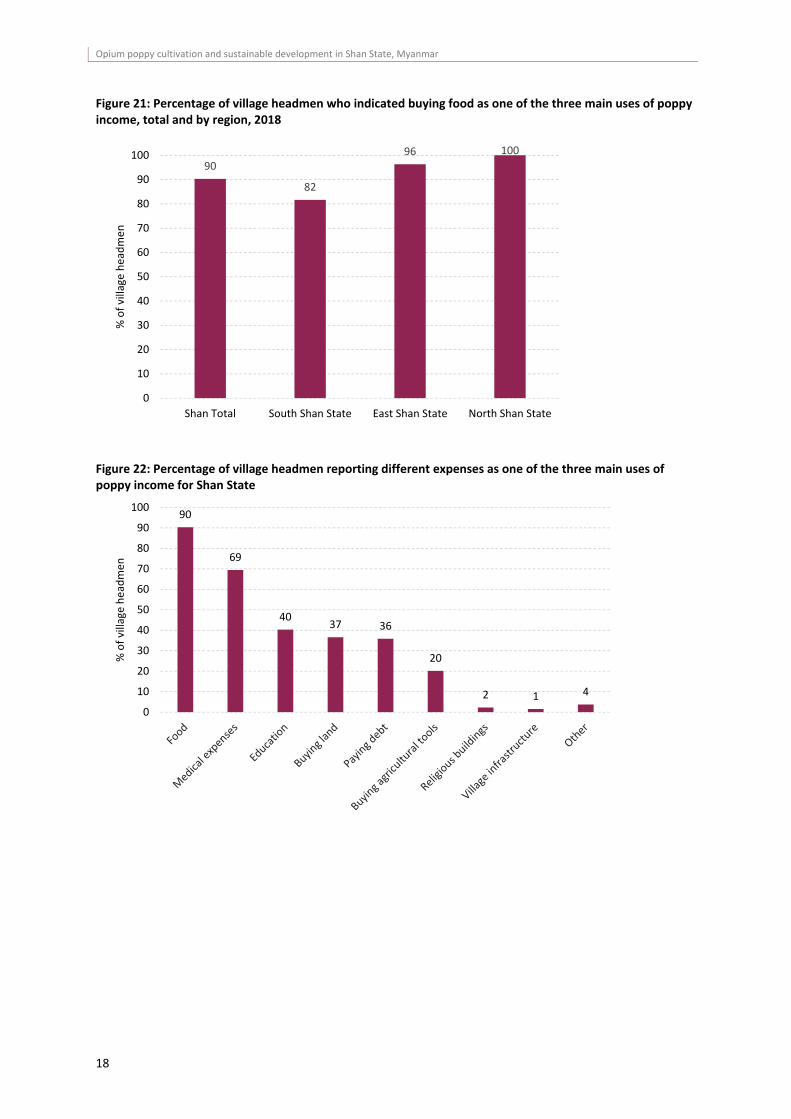
Overall, 90% of poppy villages relied on income from poppy cultivation for food. But there were significant
regional differences – villages in East Shan and North Shan nearly universally (96‐100%) reported using
poppy income on food, compared to 82% in South Shan. This suggests that poppy cultivation in East and
North Shan may be more closely linked with subsistence needs. In the other most mentioned uses of poppy
income, it was observed that 69% use it for medical expenses, 40% to pay for education, 37% to buy land
and 36% for paying off debt.
60
40
3336
33
66
41
50
32
26
62
41
3735
31
0
10
20
30
40
50
60
70
Borrow food fromneighbors
Work longer hours Purchase food oncredit
Consume lessexpensive food
Reduce non‐foodexpenditure
Non‐poppy villages Poppy Villages Overall
Opium poppy cultivation and sustainable development in Shan State, Myanmar
18
Figure 21: Percentage of village headmen who indicated buying food as one of the three main uses of poppy income, total and by region, 2018
Figure 22: Percentage of village headmen reporting different expenses as one of the three main uses of poppy income for Shan State
90
82
96 100
0
10
20
30
40
50
60
70
80
90
100
Shan Total South Shan State East Shan State North Shan State
% of village headmen
90
69
4037 36
20
2 1 4
0
10
20
30
40
50
60
70
80
90
100
% of village headmen
Opium poppy cultivation and sustainable development in Shan State, Myanmar
19
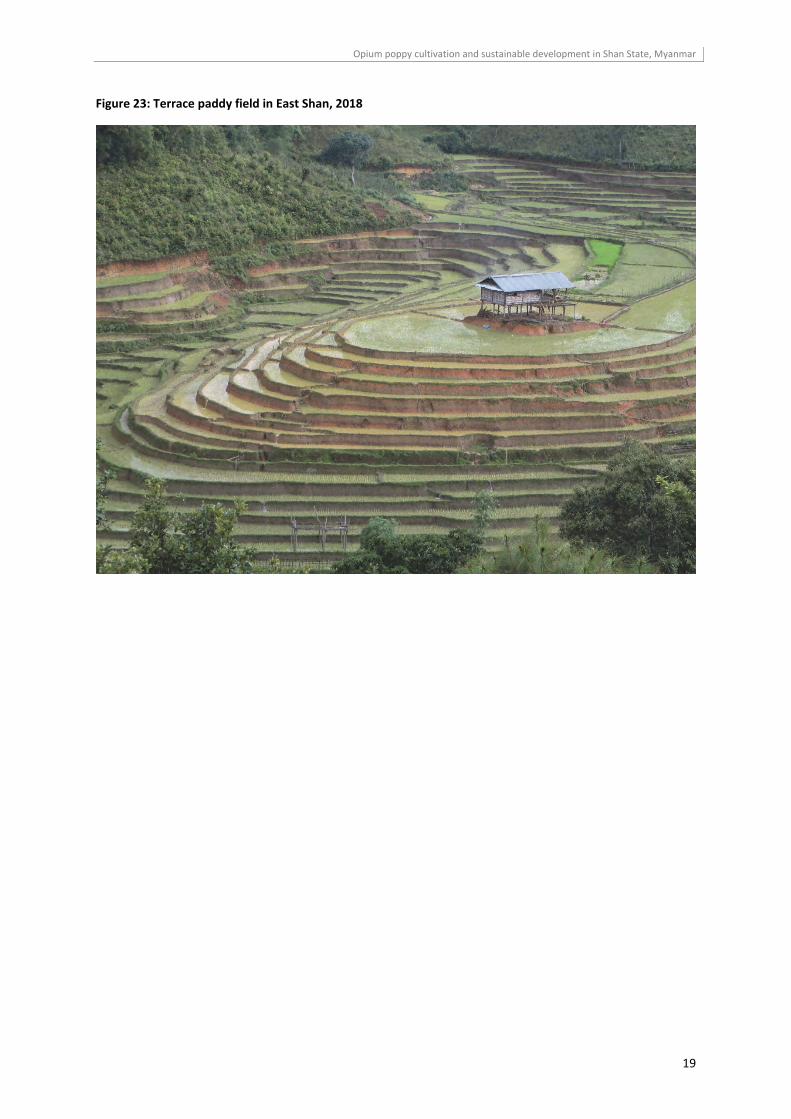
Figure 23: Terrace paddy field in East Shan, 2018
Opium poppy cultivation and sustainable development in Shan State, Myanmar
20
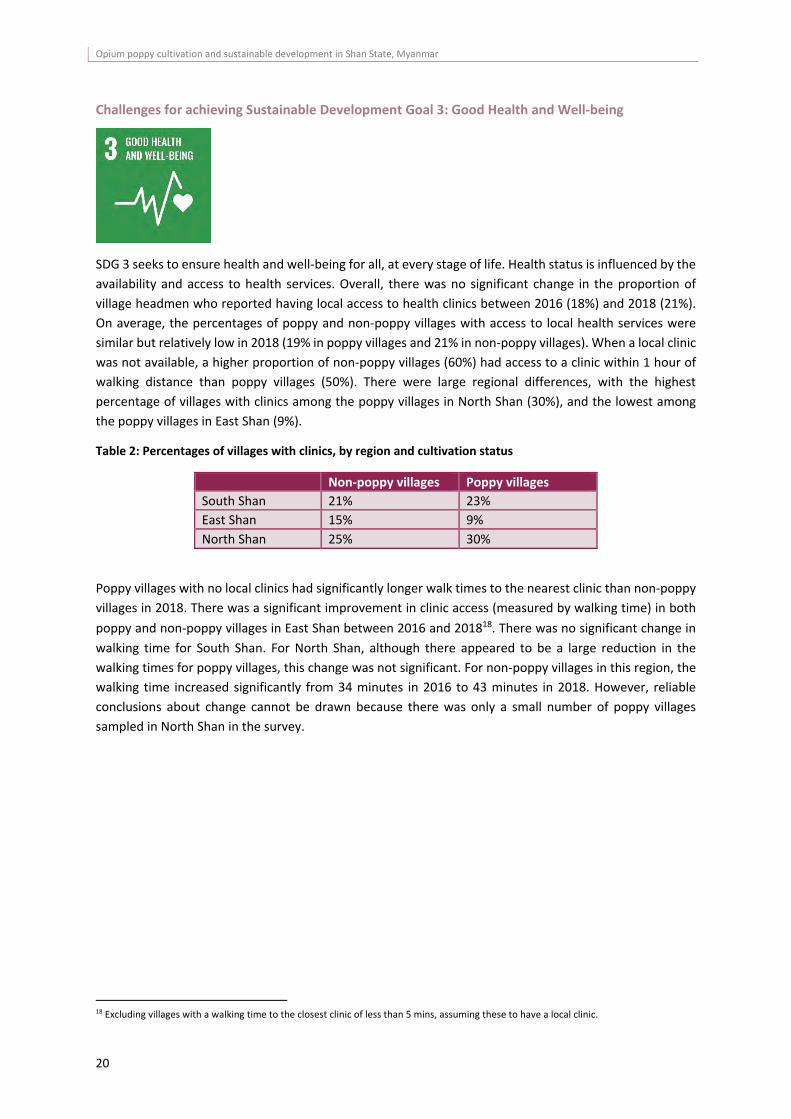
Challenges for achieving Sustainable Development Goal 3: Good Health and Well‐being
SDG 3 seeks to ensure health and well‐being for all, at every stage of life. Health status is influenced by the
availability and access to health services. Overall, there was no significant change in the proportion of
village headmen who reported having local access to health clinics between 2016 (18%) and 2018 (21%).
On average, the percentages of poppy and non‐poppy villages with access to local health services were
similar but relatively low in 2018 (19% in poppy villages and 21% in non‐poppy villages). When a local clinic
was not available, a higher proportion of non‐poppy villages (60%) had access to a clinic within 1 hour of
walking distance than poppy villages (50%). There were large regional differences, with the highest
percentage of villages with clinics among the poppy villages in North Shan (30%), and the lowest among
the poppy villages in East Shan (9%).
Table 2: Percentages of villages with clinics, by region and cultivation status
Non‐poppy villages Poppy villages
South Shan 21% 23%
East Shan 15% 9%
North Shan 25% 30%
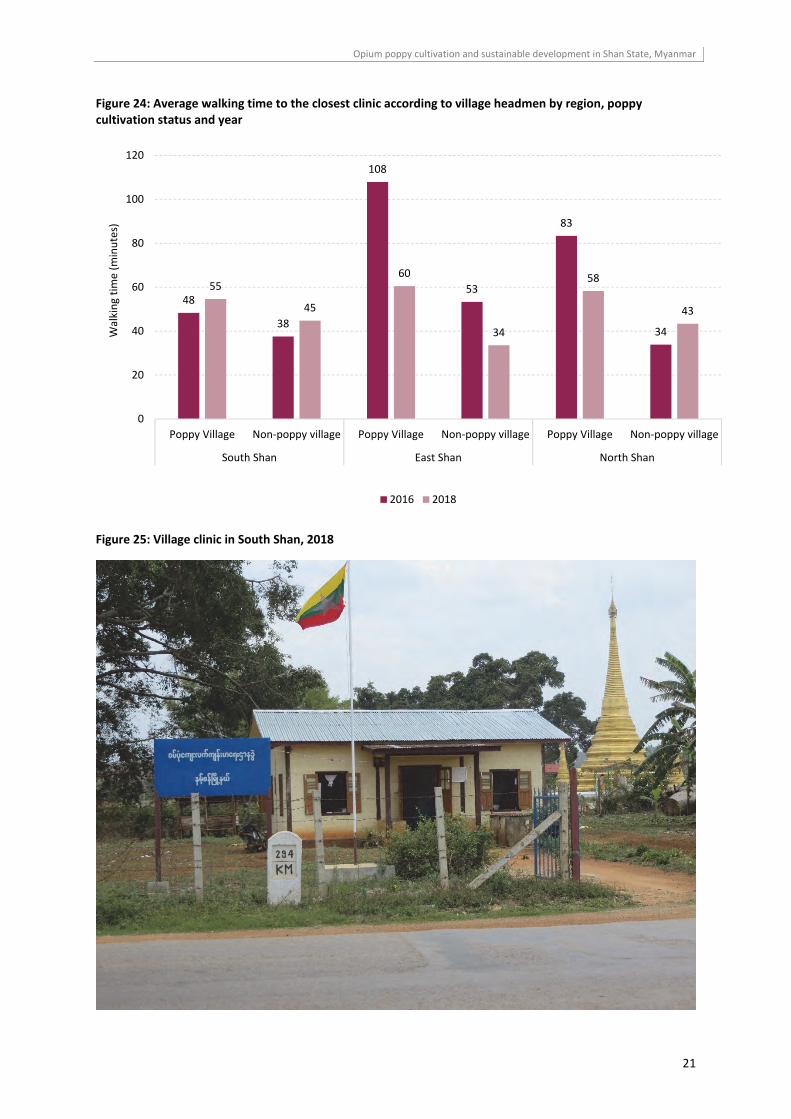
Poppy villages with no local clinics had significantly longer walk times to the nearest clinic than non‐poppy
villages in 2018. There was a significant improvement in clinic access (measured by walking time) in both
poppy and non‐poppy villages in East Shan between 2016 and 201818. There was no significant change in
walking time for South Shan. For North Shan, although there appeared to be a large reduction in the
walking times for poppy villages, this change was not significant. For non‐poppy villages in this region, the
walking time increased significantly from 34 minutes in 2016 to 43 minutes in 2018. However, reliable
conclusions about change cannot be drawn because there was only a small number of poppy villages
sampled in North Shan in the survey.
18 Excluding villages with a walking time to the closest clinic of less than 5 mins, assuming these to have a local clinic.
Opium poppy cultivation and sustainable development in Shan State, Myanmar
21
Figure 24: Average walking time to the closest clinic according to village headmen by region, poppy cultivation status and year
Figure 25: Village clinic in South Shan, 2018
48
38
108
53
83
34
55
45
60
34
58
43
0
20
40
60
80
100
120
Poppy Village Non‐poppy village Poppy Village Non‐poppy village Poppy Village Non‐poppy village
South Shan East Shan North Shan
Walking time (m
inutes)
2016 2018
Opium poppy cultivation and sustainable development in Shan State, Myanmar
22
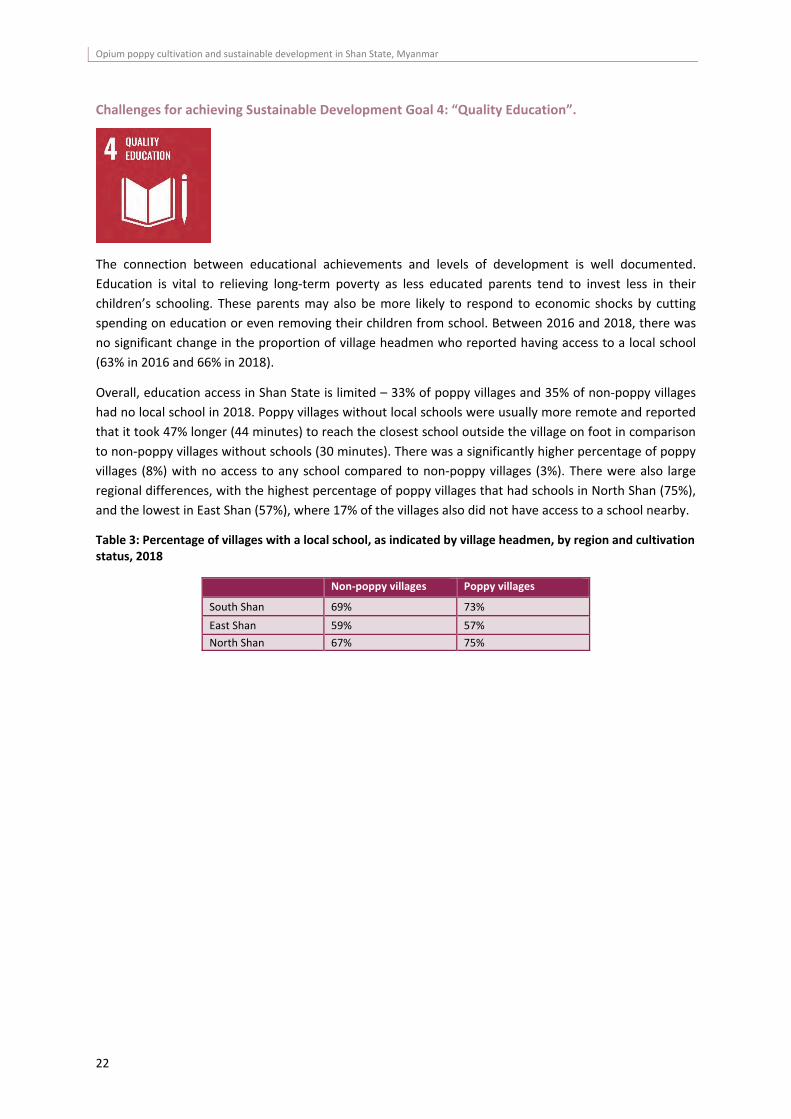
Challenges for achieving Sustainable Development Goal 4: “Quality Education”.
The connection between educational achievements and levels of development is well documented.
Education is vital to relieving long‐term poverty as less educated parents tend to invest less in their
children’s schooling. These parents may also be more likely to respond to economic shocks by cutting
spending on education or even removing their children from school. Between 2016 and 2018, there was
no significant change in the proportion of village headmen who reported having access to a local school
(63% in 2016 and 66% in 2018).
Overall, education access in Shan State is limited – 33% of poppy villages and 35% of non‐poppy villages
had no local school in 2018. Poppy villages without local schools were usually more remote and reported
that it took 47% longer (44 minutes) to reach the closest school outside the village on foot in comparison
to non‐poppy villages without schools (30 minutes). There was a significantly higher percentage of poppy
villages (8%) with no access to any school compared to non‐poppy villages (3%). There were also large
regional differences, with the highest percentage of poppy villages that had schools in North Shan (75%),
and the lowest in East Shan (57%), where 17% of the villages also did not have access to a school nearby.
Table 3: Percentage of villages with a local school, as indicated by village headmen, by region and cultivation status, 2018
Non‐poppy villages Poppy villages
South Shan 69% 73%
East Shan 59% 57%
North Shan 67% 75%
Opium poppy cultivation and sustainable development in Shan State, Myanmar
23
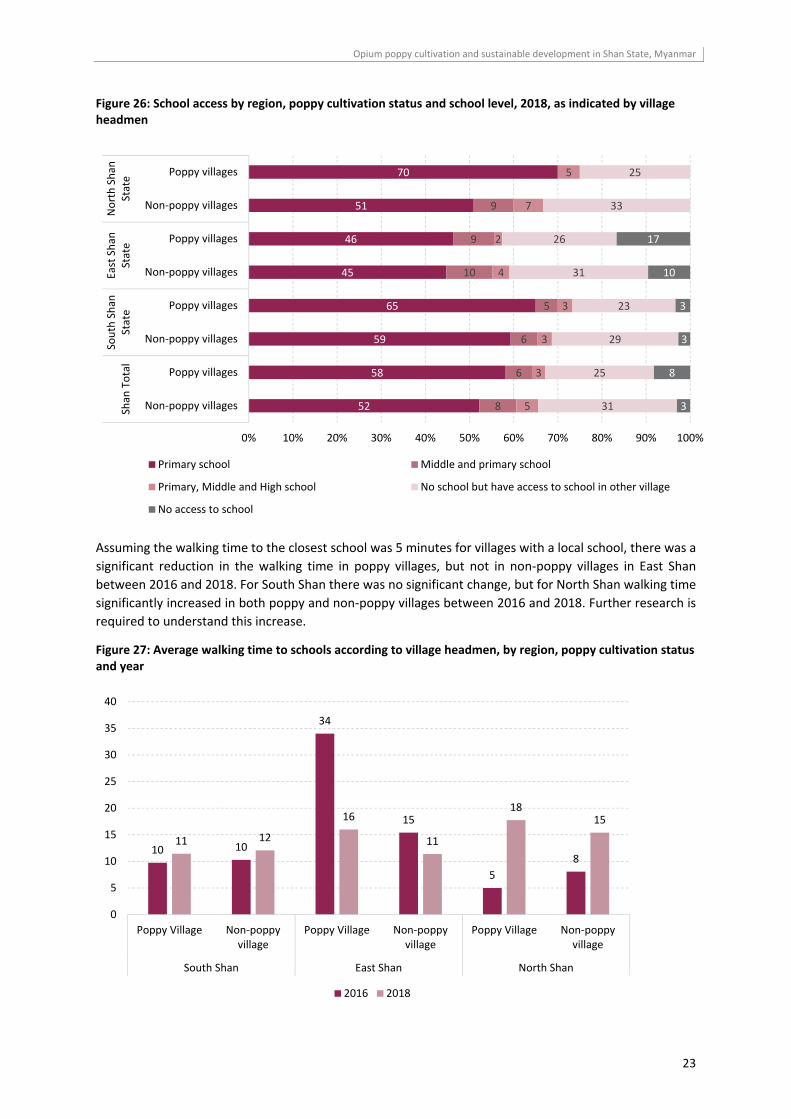
Figure 26: School access by region, poppy cultivation status and school level, 2018, as indicated by village headmen
Assuming the walking time to the closest school was 5 minutes for villages with a local school, there was a
significant reduction in the walking time in poppy villages, but not in non‐poppy villages in East Shan
between 2016 and 2018. For South Shan there was no significant change, but for North Shan walking time
significantly increased in both poppy and non‐poppy villages between 2016 and 2018. Further research is
required to understand this increase.
Figure 27: Average walking time to schools according to village headmen, by region, poppy cultivation status and year
52
58
59
65
45
46
51
70
8
6
6
5
10
9
9
5
3
3
3
4
2
7
5
31
25
29
23
31
26
33
25
3
8
3
3
10
17
0% 10% 20% 30% 40% 50% 60% 70% 80% 90% 100%
Non‐poppy villages
Poppy villages
Non‐poppy villages
Poppy villages
Non‐poppy villages
Poppy villages
Non‐poppy villages
Poppy villages
Shan
Total
South Shan
State
East Shan
State
North Shan
State
Primary school Middle and primary school
Primary, Middle and High school No school but have access to school in other village
No access to school
10 10
34
15
5
8
11 12
16
11
1815
0
5
10
15
20
25
30
35
40
Poppy Village Non‐poppyvillage
Poppy Village Non‐poppyvillage
Poppy Village Non‐poppyvillage
South Shan East Shan North Shan
2016 2018
Opium poppy cultivation and sustainable development in Shan State, Myanmar
24
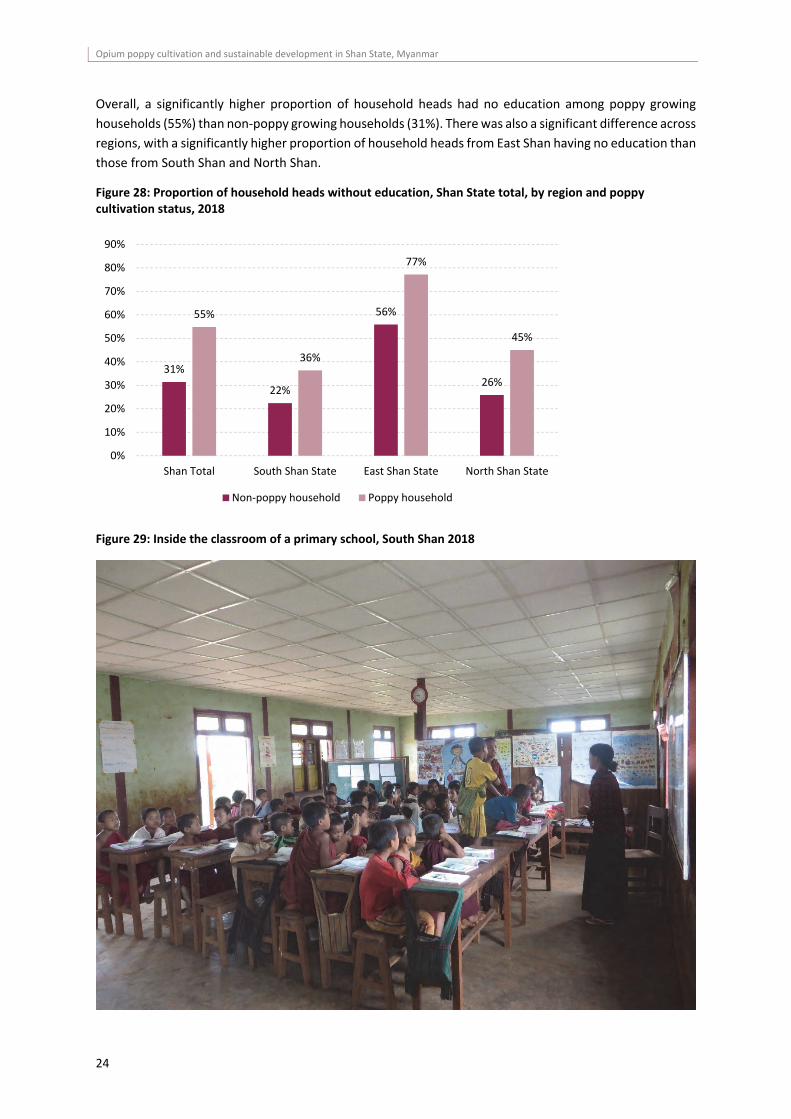
Overall, a significantly higher proportion of household heads had no education among poppy growing
households (55%) than non‐poppy growing households (31%). There was also a significant difference across
regions, with a significantly higher proportion of household heads from East Shan having no education than
those from South Shan and North Shan.
Figure 28: Proportion of household heads without education, Shan State total, by region and poppy cultivation status, 2018
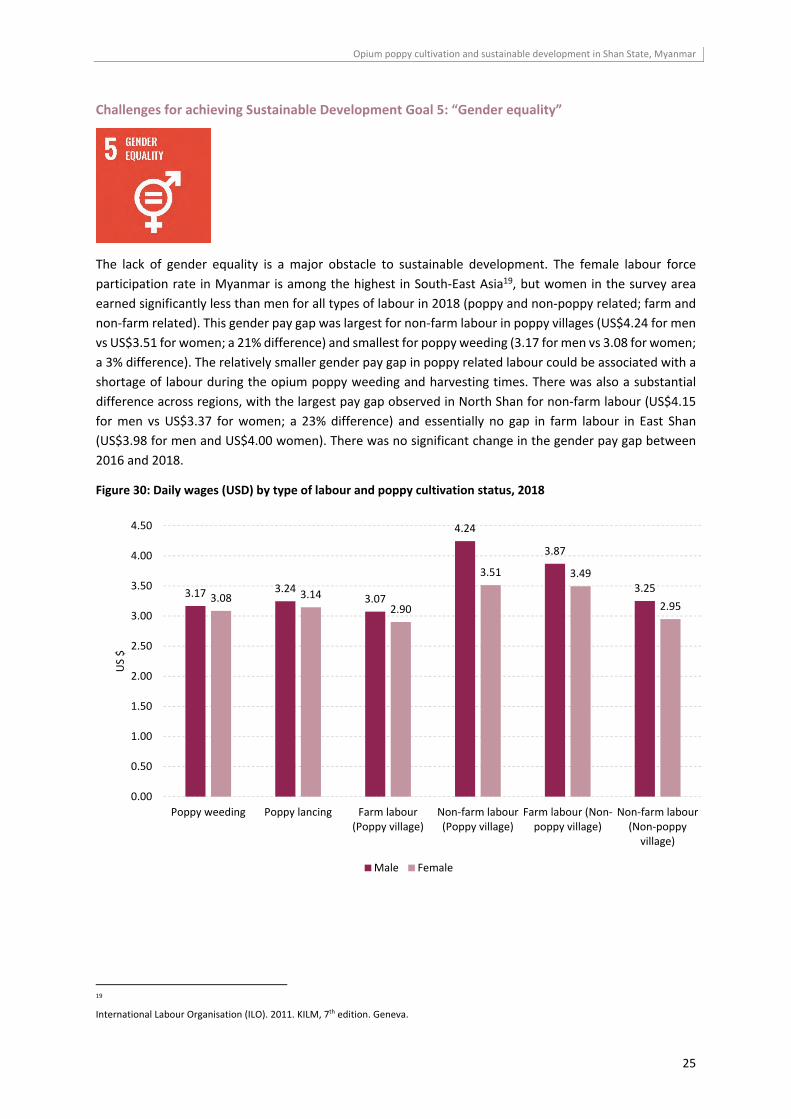
Figure 29: Inside the classroom of a primary school, South Shan 2018
31%
22%
56%
26%
55%
36%
77%
45%
0%
10%
20%
30%
40%
50%
60%
70%
80%
90%
Shan Total South Shan State East Shan State North Shan State
Non‐poppy household Poppy household
Opium poppy cultivation and sustainable development in Shan State, Myanmar
25
Challenges for achieving Sustainable Development Goal 5: “Gender equality”
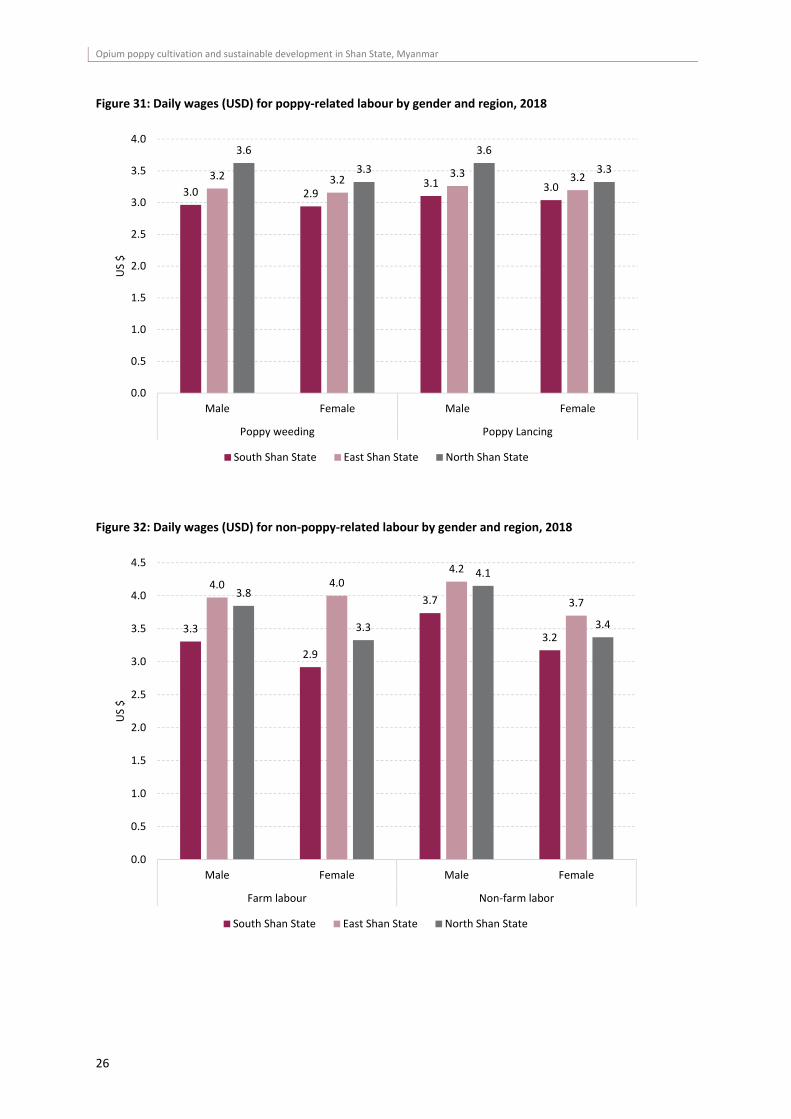
The lack of gender equality is a major obstacle to sustainable development. The female labour force
participation rate in Myanmar is among the highest in South‐East Asia19, but women in the survey area
earned significantly less than men for all types of labour in 2018 (poppy and non‐poppy related; farm and
non‐farm related). This gender pay gap was largest for non‐farm labour in poppy villages (US$4.24 for men
vs US$3.51 for women; a 21% difference) and smallest for poppy weeding (3.17 for men vs 3.08 for women;
a 3% difference). The relatively smaller gender pay gap in poppy related labour could be associated with a
shortage of labour during the opium poppy weeding and harvesting times. There was also a substantial
difference across regions, with the largest pay gap observed in North Shan for non‐farm labour (US$4.15
for men vs US$3.37 for women; a 23% difference) and essentially no gap in farm labour in East Shan
(US$3.98 for men and US$4.00 women). There was no significant change in the gender pay gap between
2016 and 2018.
Figure 30: Daily wages (USD) by type of labour and poppy cultivation status, 2018
19
International Labour Organisation (ILO). 2011. KILM, 7th edition. Geneva.
3.17 3.243.07
4.24
3.87
3.253.08 3.14
2.90
3.51 3.49
2.95
0.00
0.50
1.00
1.50
2.00
2.50
3.00
3.50
4.00
4.50
Poppy weeding Poppy lancing Farm labour(Poppy village)
Non‐farm labour(Poppy village)
Farm labour (Non‐poppy village)
Non‐farm labour(Non‐poppyvillage)
US $
Male Female
Opium poppy cultivation and sustainable development in Shan State, Myanmar
26
Figure 31: Daily wages (USD) for poppy‐related labour by gender and region, 2018
Figure 32: Daily wages (USD) for non‐poppy‐related labour by gender and region, 2018
3.0 2.93.1 3.0
3.2 3.23.3 3.2
3.6
3.3
3.6
3.3
0.0
0.5
1.0
1.5
2.0
2.5
3.0
3.5
4.0
Male Female Male Female
Poppy weeding Poppy Lancing
US $
South Shan State East Shan State North Shan State
3.3
2.9
3.7
3.2
4.0 4.04.2
3.73.8
3.3
4.1
3.4
0.0
0.5
1.0
1.5
2.0
2.5
3.0
3.5
4.0
4.5
Male Female Male Female
Farm labour Non‐farm labor
US $
South Shan State East Shan State North Shan State
Opium poppy cultivation and sustainable development in Shan State, Myanmar
27
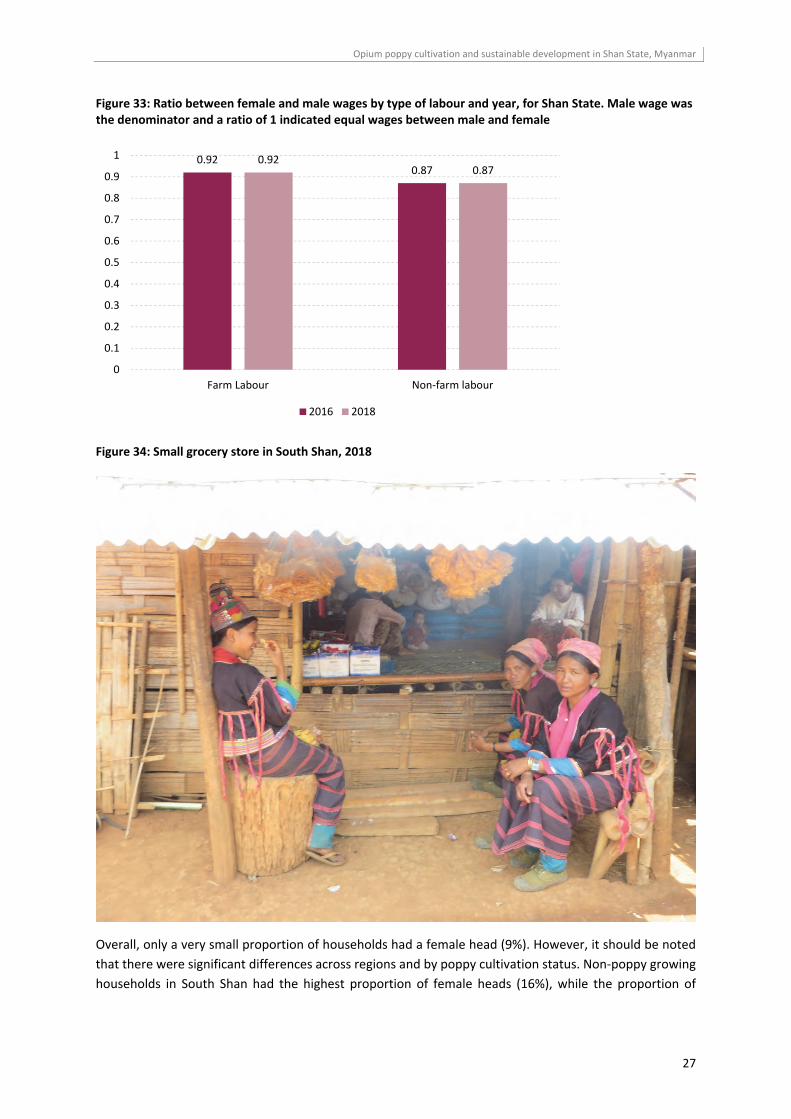
Figure 33: Ratio between female and male wages by type of labour and year, for Shan State. Male wage was the denominator and a ratio of 1 indicated equal wages between male and female
Figure 34: Small grocery store in South Shan, 2018
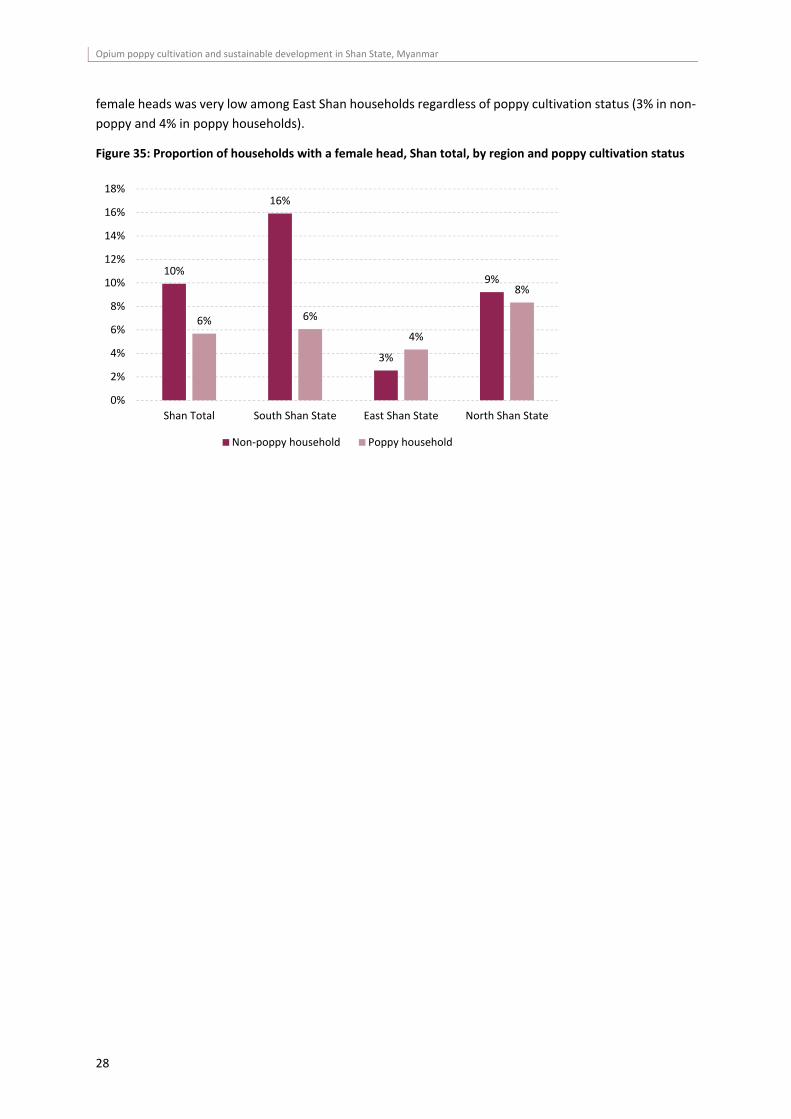
Overall, only a very small proportion of households had a female head (9%). However, it should be noted
that there were significant differences across regions and by poppy cultivation status. Non‐poppy growing
households in South Shan had the highest proportion of female heads (16%), while the proportion of
0.920.87
0.920.87
0
0.1
0.2
0.3
0.4
0.5
0.6
0.7
0.8
0.9
1
Farm Labour Non‐farm labour
2016 2018
Opium poppy cultivation and sustainable development in Shan State, Myanmar
28
female heads was very low among East Shan households regardless of poppy cultivation status (3% in non‐
poppy and 4% in poppy households).
Figure 35: Proportion of households with a female head, Shan total, by region and poppy cultivation status
10%
16%
3%
9%
6% 6%
4%
8%
0%
2%
4%
6%
8%
10%
12%
14%
16%
18%
Shan Total South Shan State East Shan State North Shan State
Non‐poppy household Poppy household
Opium poppy cultivation and sustainable development in Shan State, Myanmar
29
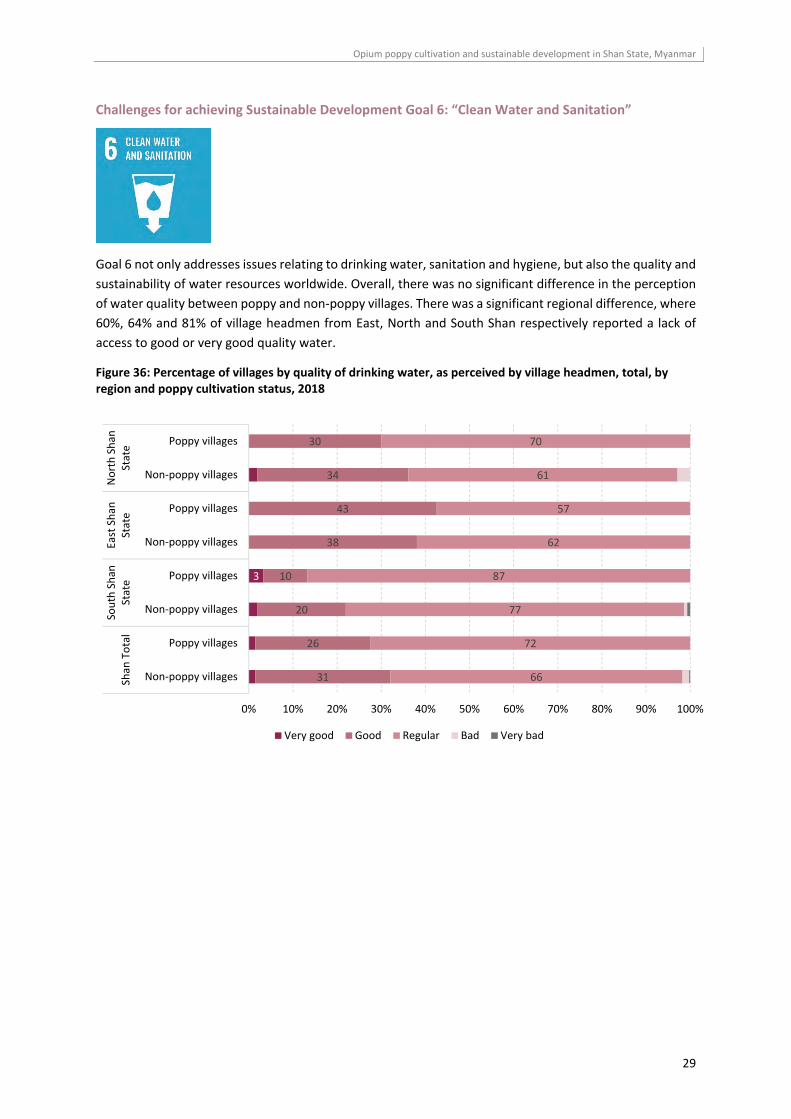
Challenges for achieving Sustainable Development Goal 6: “Clean Water and Sanitation”
Goal 6 not only addresses issues relating to drinking water, sanitation and hygiene, but also the quality and
sustainability of water resources worldwide. Overall, there was no significant difference in the perception
of water quality between poppy and non‐poppy villages. There was a significant regional difference, where
60%, 64% and 81% of village headmen from East, North and South Shan respectively reported a lack of
access to good or very good quality water.
Figure 36: Percentage of villages by quality of drinking water, as perceived by village headmen, total, by region and poppy cultivation status, 2018
3
31
26
20
10
38
43
34
30
66
72
77
87
62
57
61
70
0% 10% 20% 30% 40% 50% 60% 70% 80% 90% 100%
Non‐poppy villages
Poppy villages
Non‐poppy villages
Poppy villages
Non‐poppy villages
Poppy villages
Non‐poppy villages
Poppy villages
Shan
Total
South Shan
State
East Shan
State
North Shan
State
Very good Good Regular Bad Very bad
Opium poppy cultivation and sustainable development in Shan State, Myanmar
30
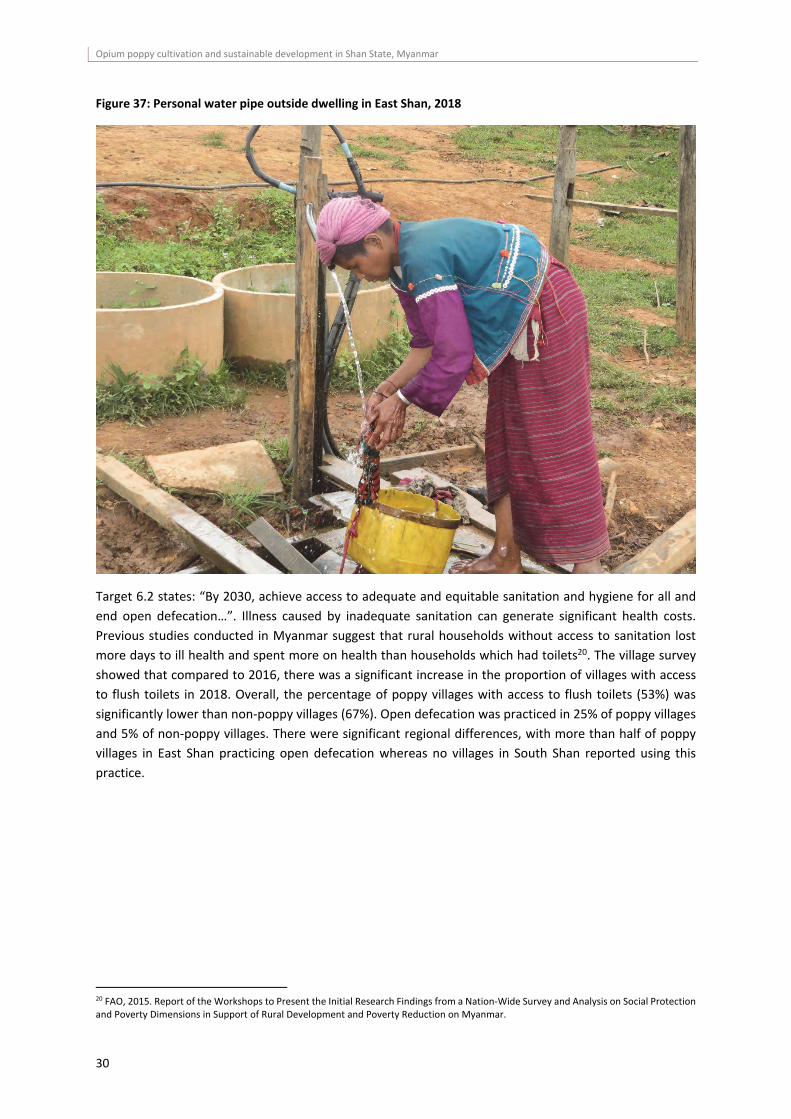
Figure 37: Personal water pipe outside dwelling in East Shan, 2018
Target 6.2 states: “By 2030, achieve access to adequate and equitable sanitation and hygiene for all and
end open defecation…”. Illness caused by inadequate sanitation can generate significant health costs.
Previous studies conducted in Myanmar suggest that rural households without access to sanitation lost
more days to ill health and spent more on health than households which had toilets20. The village survey
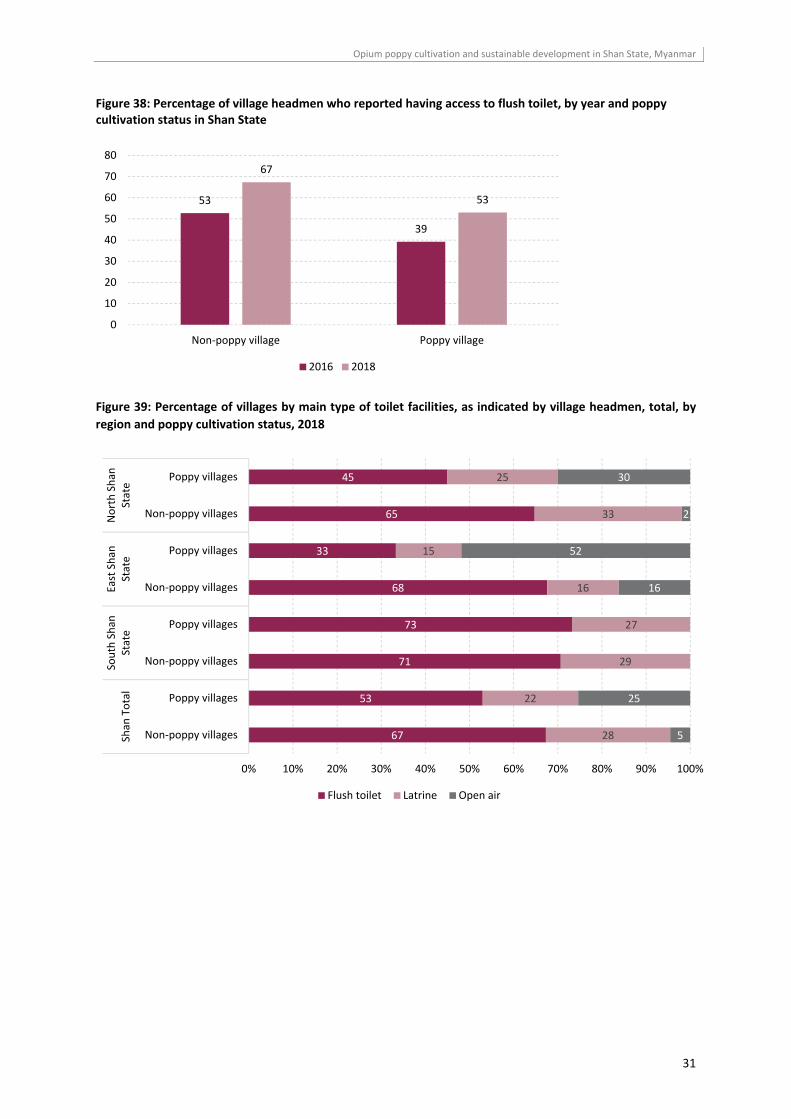
showed that compared to 2016, there was a significant increase in the proportion of villages with access
to flush toilets in 2018. Overall, the percentage of poppy villages with access to flush toilets (53%) was
significantly lower than non‐poppy villages (67%). Open defecation was practiced in 25% of poppy villages
and 5% of non‐poppy villages. There were significant regional differences, with more than half of poppy
villages in East Shan practicing open defecation whereas no villages in South Shan reported using this
practice.
20 FAO, 2015. Report of the Workshops to Present the Initial Research Findings from a Nation‐Wide Survey and Analysis on Social Protection and Poverty Dimensions in Support of Rural Development and Poverty Reduction on Myanmar.
Opium poppy cultivation and sustainable development in Shan State, Myanmar
31
Figure 38: Percentage of village headmen who reported having access to flush toilet, by year and poppy cultivation status in Shan State
Figure 39: Percentage of villages by main type of toilet facilities, as indicated by village headmen, total, by
region and poppy cultivation status, 2018
53
39
67
53
0
10
20
30
40
50
60
70
80
Non‐poppy village Poppy village
2016 2018
67
53
71
73
68
33
65
45
28
22
29
27
16
15
33
25
5
25
16
52
2
30
0% 10% 20% 30% 40% 50% 60% 70% 80% 90% 100%
Non‐poppy villages
Poppy villages
Non‐poppy villages
Poppy villages
Non‐poppy villages
Poppy villages
Non‐poppy villages
Poppy villages
Shan
Total
South Shan
State
East Shan
State
North Shan
State
Flush toilet Latrine Open air
Opium poppy cultivation and sustainable development in Shan State, Myanmar
32
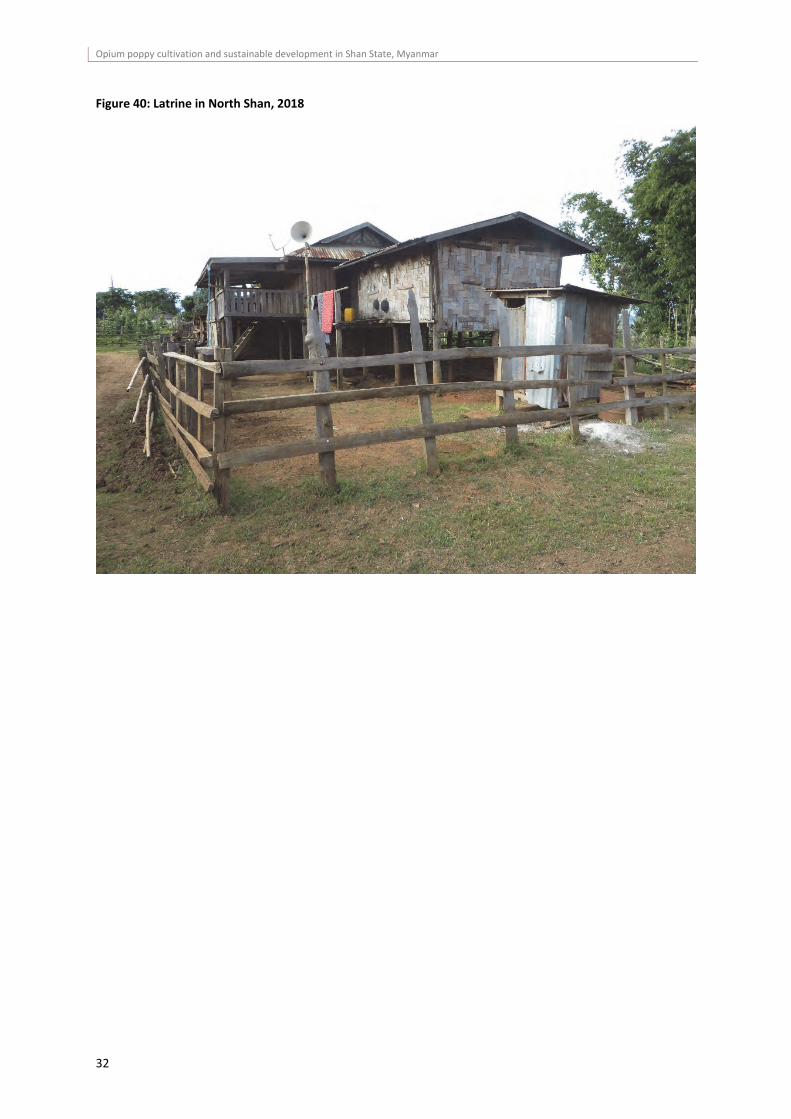
Figure 40: Latrine in North Shan, 2018
Opium poppy cultivation and sustainable development in Shan State, Myanmar
33
Challenges for achieving Sustainable Development Goal 7: “Affordable and Clean Energy”
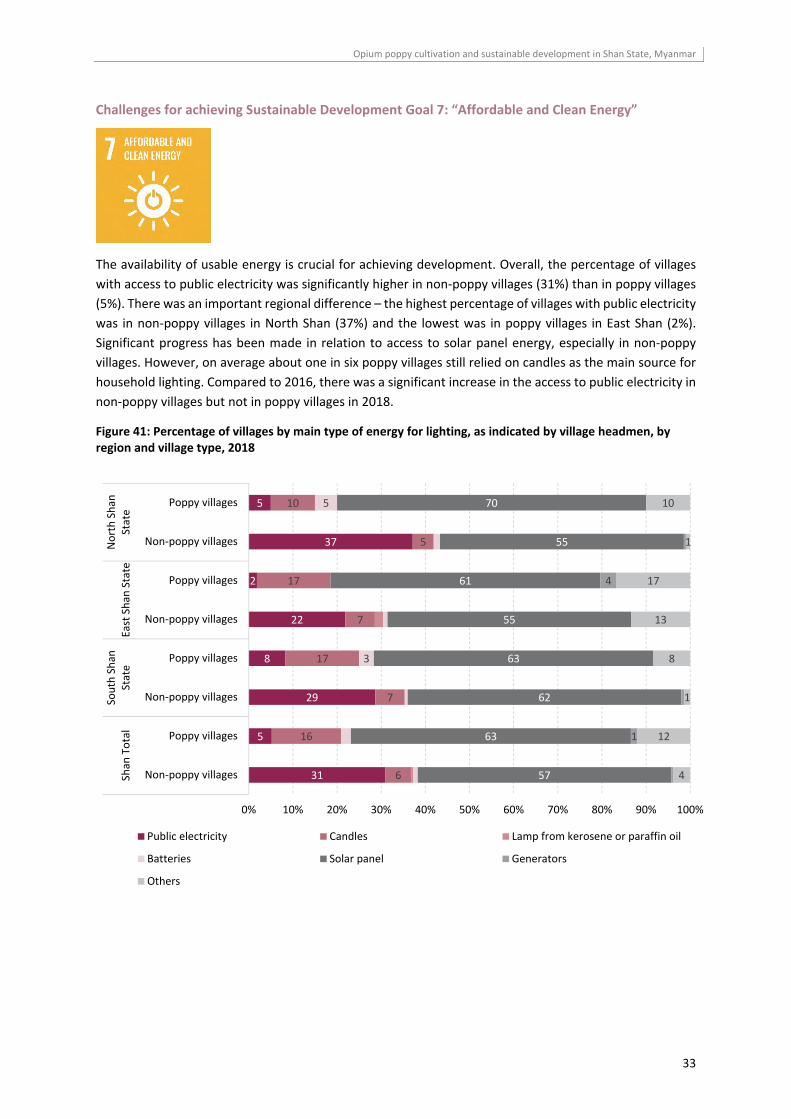
The availability of usable energy is crucial for achieving development. Overall, the percentage of villages
with access to public electricity was significantly higher in non‐poppy villages (31%) than in poppy villages
(5%). There was an important regional difference – the highest percentage of villages with public electricity
was in non‐poppy villages in North Shan (37%) and the lowest was in poppy villages in East Shan (2%).
Significant progress has been made in relation to access to solar panel energy, especially in non‐poppy
villages. However, on average about one in six poppy villages still relied on candles as the main source for
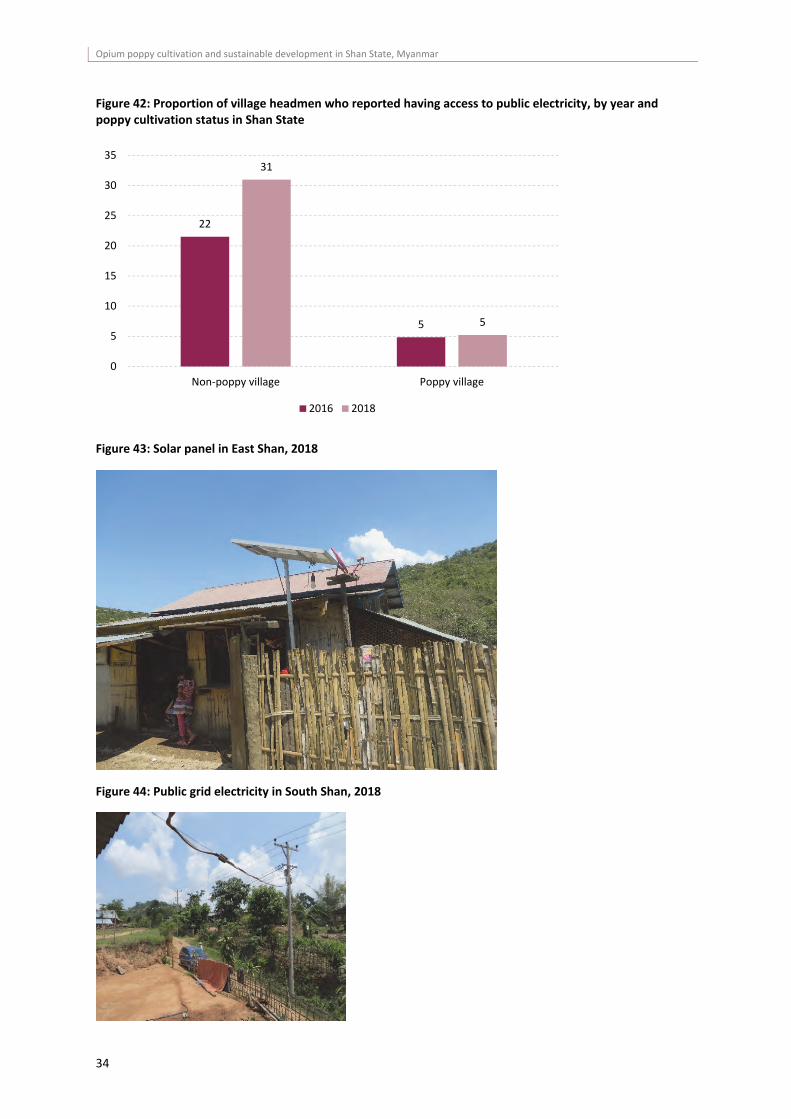
household lighting. Compared to 2016, there was a significant increase in the access to public electricity in
non‐poppy villages but not in poppy villages in 2018.
Figure 41: Percentage of villages by main type of energy for lighting, as indicated by village headmen, by region and village type, 2018
31
5
29
8
22
2
37
5
6
16
7
17
7
17
5
10
3
5
57
63
62
63
55
61
55
70
1
4
4
12
1
8
13
17
1
10
0% 10% 20% 30% 40% 50% 60% 70% 80% 90% 100%
Non‐poppy villages
Poppy villages
Non‐poppy villages
Poppy villages
Non‐poppy villages
Poppy villages
Non‐poppy villages
Poppy villages
Shan
Total
South Shan
State
East Shan
State
North Shan
State
Public electricity Candles Lamp from kerosene or paraffin oil
Batteries Solar panel Generators
Others
Opium poppy cultivation and sustainable development in Shan State, Myanmar
34
Figure 42: Proportion of village headmen who reported having access to public electricity, by year and poppy cultivation status in Shan State
Figure 43: Solar panel in East Shan, 2018
Figure 44: Public grid electricity in South Shan, 2018
22
5
31
5
0
5
10
15
20
25
30
35
Non‐poppy village Poppy village
2016 2018
Opium poppy cultivation and sustainable development in Shan State, Myanmar
35
Challenges for achieving Sustainable Development Goal 8: “Decent Work and Economic Growth”
SDG 8 aims to achieve full and productive employment and decent work for all women and men. Livelihood
diversity has been strongly linked to higher economic status, lower poverty rates, and higher levels of social
capital. Diversification of livelihoods has long been promoted as a key element of increasing resilience to
opium poppy cultivation and reducing vulnerability to poverty in rural households.
Availability of stable and well‐remunerated non‐opium poppy‐related jobs
One of the most acute problems in remote areas is the lack of stable and reasonably well remunerated
employment opportunities. Casual labour is still an important source of income in rural areas worldwide,
and it is the main source of income for a third of the rural population in Myanmar21. Adequate availability
of off‐season employment can help to improve material conditions in Shan State. The lack of non‐poppy‐
related job opportunities was indicated as one of the top three reasons for the cultivation of opium poppy
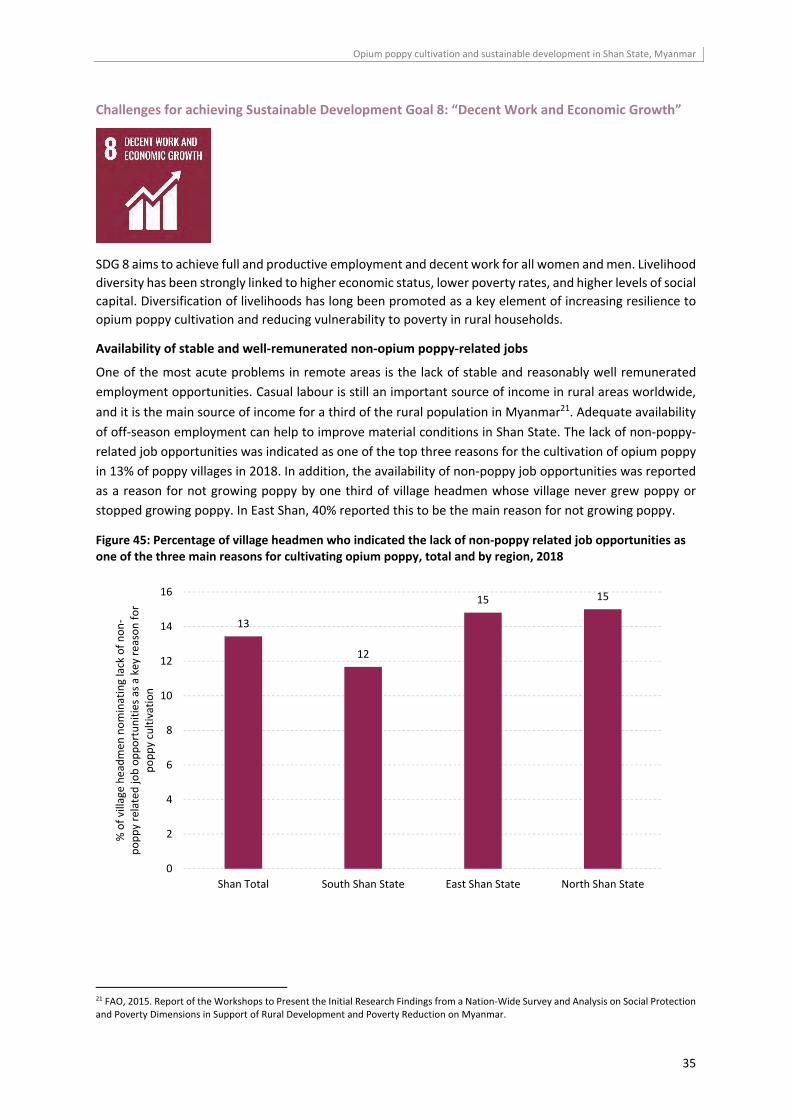
in 13% of poppy villages in 2018. In addition, the availability of non‐poppy job opportunities was reported
as a reason for not growing poppy by one third of village headmen whose village never grew poppy or
stopped growing poppy. In East Shan, 40% reported this to be the main reason for not growing poppy.
Figure 45: Percentage of village headmen who indicated the lack of non‐poppy related job opportunities as one of the three main reasons for cultivating opium poppy, total and by region, 2018
21 FAO, 2015. Report of the Workshops to Present the Initial Research Findings from a Nation‐Wide Survey and Analysis on Social Protection and Poverty Dimensions in Support of Rural Development and Poverty Reduction on Myanmar.
13
12
15 15
0
2
4
6
8
10
12
14
16
Shan Total South Shan State East Shan State North Shan State
% of village headmen
nominating lack of non‐
poppy related job opportunities as a key reason for
poppy cultivation
Opium poppy cultivation and sustainable development in Shan State, Myanmar
36
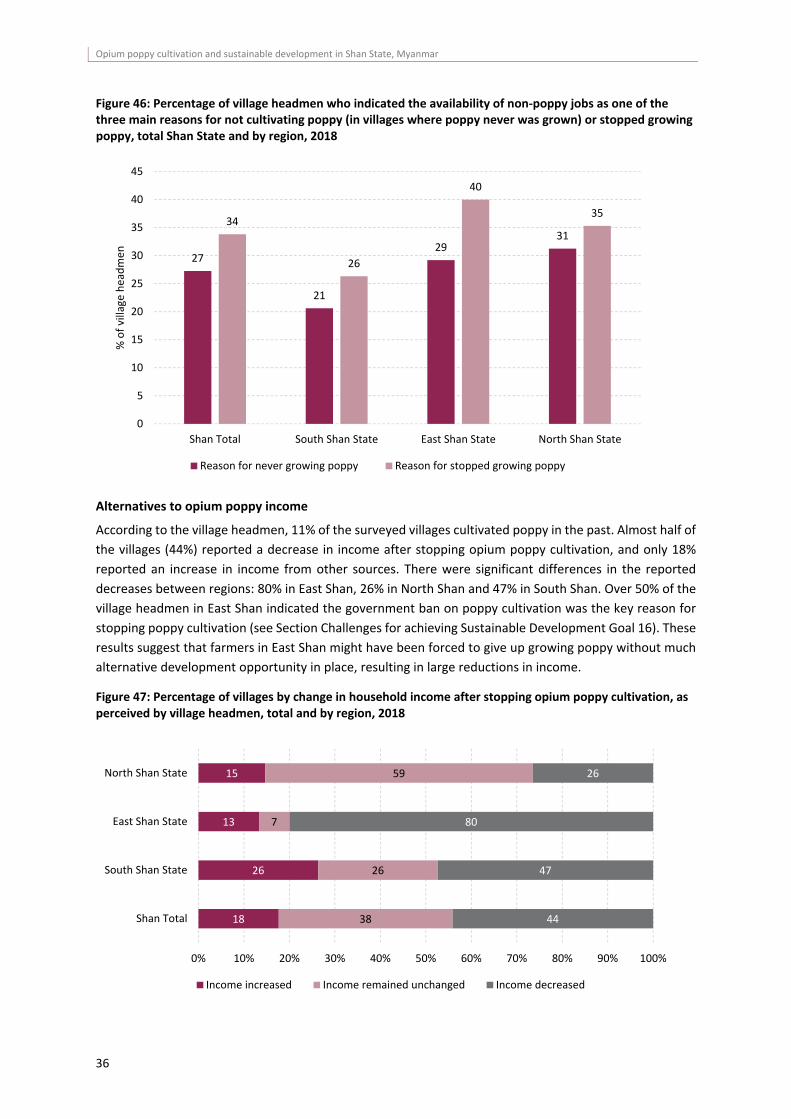
Figure 46: Percentage of village headmen who indicated the availability of non‐poppy jobs as one of the three main reasons for not cultivating poppy (in villages where poppy never was grown) or stopped growing poppy, total Shan State and by region, 2018
Alternatives to opium poppy income
According to the village headmen, 11% of the surveyed villages cultivated poppy in the past. Almost half of
the villages (44%) reported a decrease in income after stopping opium poppy cultivation, and only 18%
reported an increase in income from other sources. There were significant differences in the reported
decreases between regions: 80% in East Shan, 26% in North Shan and 47% in South Shan. Over 50% of the
village headmen in East Shan indicated the government ban on poppy cultivation was the key reason for
stopping poppy cultivation (see Section Challenges for achieving Sustainable Development Goal 16). These
results suggest that farmers in East Shan might have been forced to give up growing poppy without much
alternative development opportunity in place, resulting in large reductions in income.
Figure 47: Percentage of villages by change in household income after stopping opium poppy cultivation, as perceived by village headmen, total and by region, 2018
27
21
2931
34
26
40
35
0
5
10
15
20
25
30
35
40
45
Shan Total South Shan State East Shan State North Shan State
% of village headmen
Reason for never growing poppy Reason for stopped growing poppy
18
26
13
15
38
26
7
59
44
47
80
26
0% 10% 20% 30% 40% 50% 60% 70% 80% 90% 100%
Shan Total
South Shan State
East Shan State
North Shan State
Income increased Income remained unchanged Income decreased
Opium poppy cultivation and sustainable development in Shan State, Myanmar
37
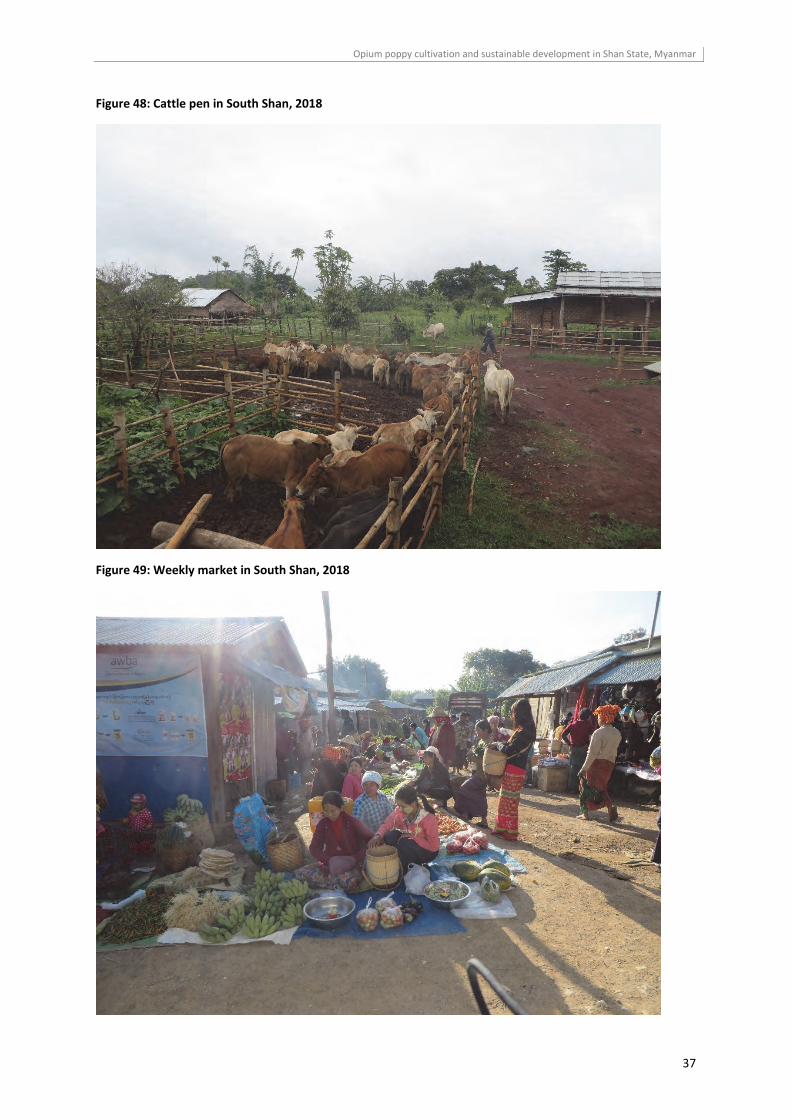
Figure 48: Cattle pen in South Shan, 2018
Figure 49: Weekly market in South Shan, 2018
Opium poppy cultivation and sustainable development in Shan State, Myanmar
38
Challenges for achieving Sustainable Development Goal 9: “Industry, innovation and
infrastructure”
SDG 9 encompasses infrastructure and industrialization. Infrastructure is essential to the operation of a
society, and industrialization and innovation drive economic growth, creating job opportunities and
reducing income poverty. Access to roads and markets, communication technology, new agricultural
practices and farmers’ empowerment could improve productivity and profits made by farmers in Shan
State.
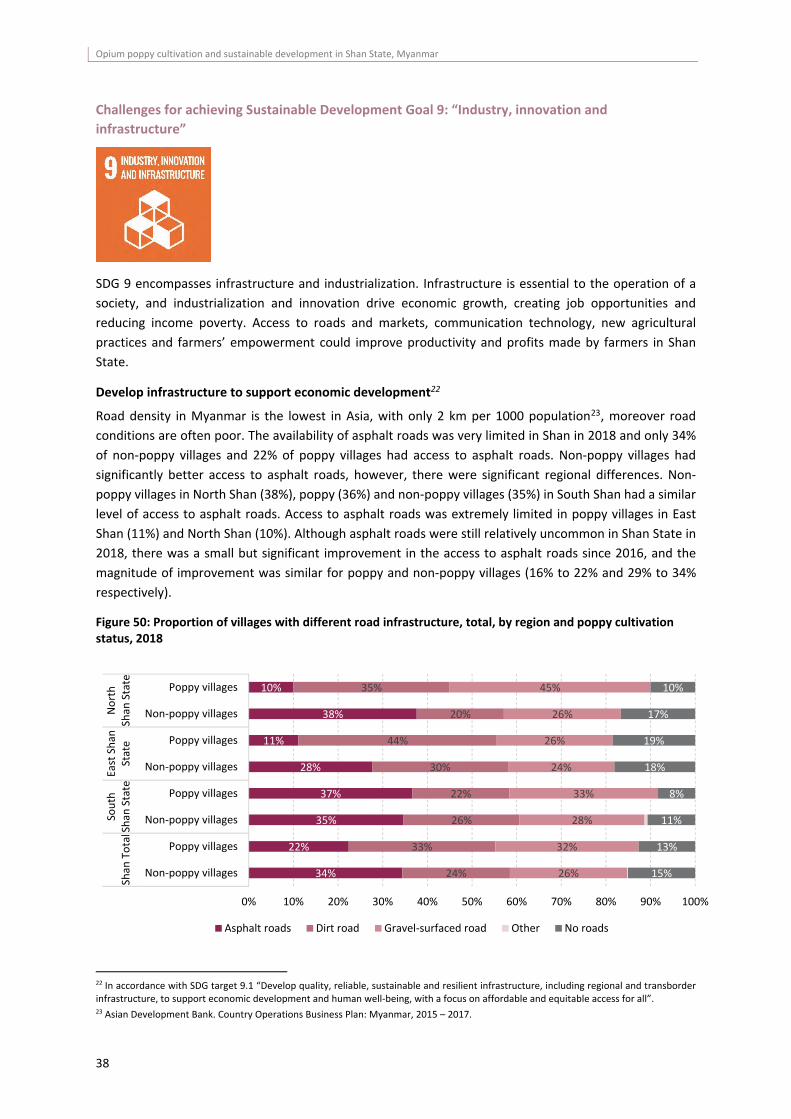
Develop infrastructure to support economic development22
Road density in Myanmar is the lowest in Asia, with only 2 km per 1000 population23, moreover road
conditions are often poor. The availability of asphalt roads was very limited in Shan in 2018 and only 34%
of non‐poppy villages and 22% of poppy villages had access to asphalt roads. Non‐poppy villages had
significantly better access to asphalt roads, however, there were significant regional differences. Non‐
poppy villages in North Shan (38%), poppy (36%) and non‐poppy villages (35%) in South Shan had a similar
level of access to asphalt roads. Access to asphalt roads was extremely limited in poppy villages in East
Shan (11%) and North Shan (10%). Although asphalt roads were still relatively uncommon in Shan State in
2018, there was a small but significant improvement in the access to asphalt roads since 2016, and the
magnitude of improvement was similar for poppy and non‐poppy villages (16% to 22% and 29% to 34%
respectively).
Figure 50: Proportion of villages with different road infrastructure, total, by region and poppy cultivation status, 2018
22 In accordance with SDG target 9.1 “Develop quality, reliable, sustainable and resilient infrastructure, including regional and transborder infrastructure, to support economic development and human well‐being, with a focus on affordable and equitable access for all”. 23 Asian Development Bank. Country Operations Business Plan: Myanmar, 2015 – 2017.
34%
22%
35%
37%
28%
11%
38%
10%
24%
33%
26%
22%
30%
44%
20%
35%
26%
32%
28%
33%
24%
26%
26%
45%
15%
13%
11%
8%
18%
19%
17%
10%
0% 10% 20% 30% 40% 50% 60% 70% 80% 90% 100%
Non‐poppy villages
Poppy villages
Non‐poppy villages
Poppy villages
Non‐poppy villages
Poppy villages
Non‐poppy villages
Poppy villages
Shan
Total
South
Shan
State
East Shan
State
North
Shan
State
Asphalt roads Dirt road Gravel‐surfaced road Other No roads
Opium poppy cultivation and sustainable development in Shan State, Myanmar
39
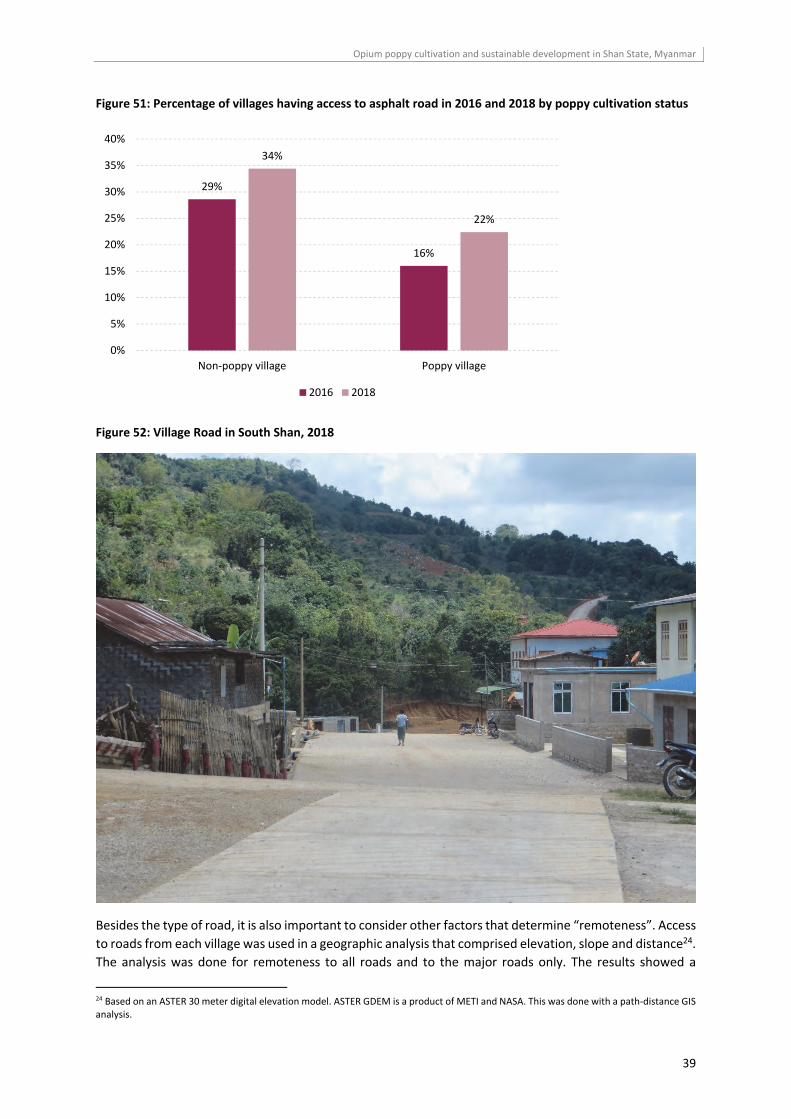
Figure 51: Percentage of villages having access to asphalt road in 2016 and 2018 by poppy cultivation status
Figure 52: Village Road in South Shan, 2018
Besides the type of road, it is also important to consider other factors that determine “remoteness”. Access
to roads from each village was used in a geographic analysis that comprised elevation, slope and distance24.
The analysis was done for remoteness to all roads and to the major roads only. The results showed a
24 Based on an ASTER 30 meter digital elevation model. ASTER GDEM is a product of METI and NASA. This was done with a path‐distance GIS analysis.
29%
16%
34%
22%
0%
5%
10%
15%
20%
25%
30%
35%
40%
Non‐poppy village Poppy village
2016 2018
Opium poppy cultivation and sustainable development in Shan State, Myanmar
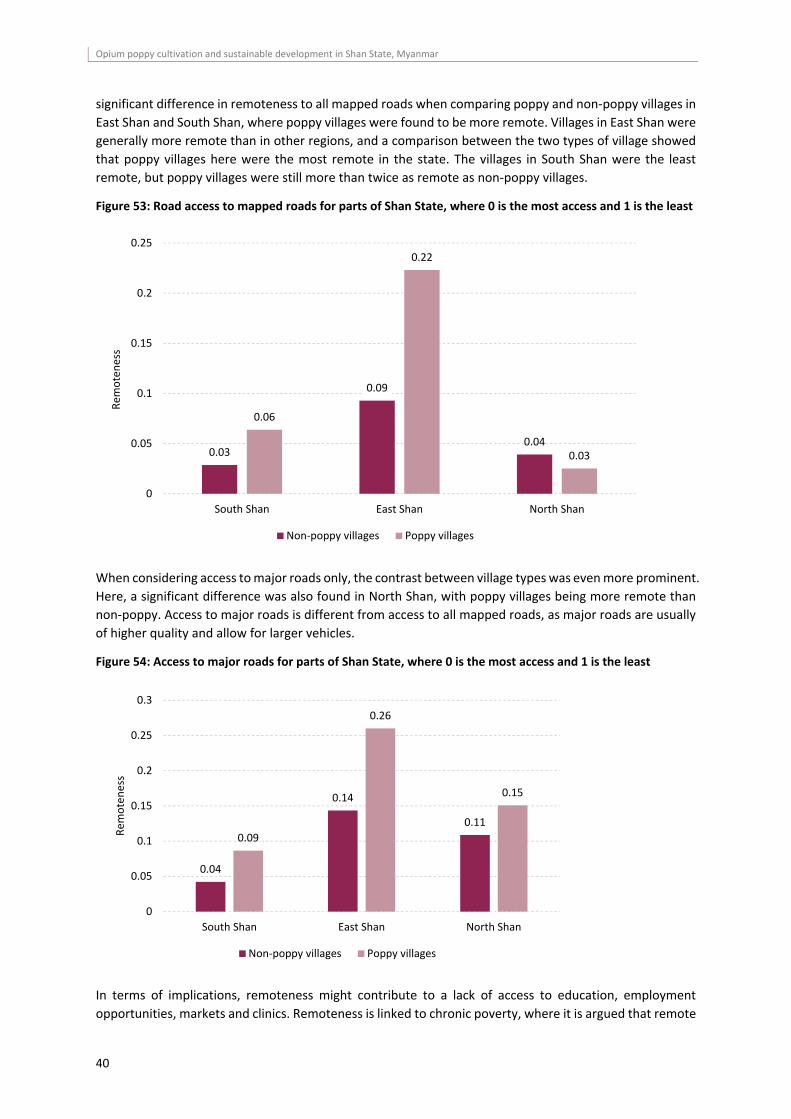
40
significant difference in remoteness to all mapped roads when comparing poppy and non‐poppy villages in
East Shan and South Shan, where poppy villages were found to be more remote. Villages in East Shan were
generally more remote than in other regions, and a comparison between the two types of village showed
that poppy villages here were the most remote in the state. The villages in South Shan were the least
remote, but poppy villages were still more than twice as remote as non‐poppy villages.
Figure 53: Road access to mapped roads for parts of Shan State, where 0 is the most access and 1 is the least
When considering access to major roads only, the contrast between village types was even more prominent.
Here, a significant difference was also found in North Shan, with poppy villages being more remote than
non‐poppy. Access to major roads is different from access to all mapped roads, as major roads are usually
of higher quality and allow for larger vehicles.
Figure 54: Access to major roads for parts of Shan State, where 0 is the most access and 1 is the least
In terms of implications, remoteness might contribute to a lack of access to education, employment
opportunities, markets and clinics. Remoteness is linked to chronic poverty, where it is argued that remote
0.03
0.09
0.04
0.06
0.22
0.03
0
0.05
0.1
0.15
0.2
0.25
South Shan East Shan North Shan
Remoteness
Non‐poppy villages Poppy villages
0.04
0.14
0.11
0.09
0.26
0.15
0
0.05
0.1
0.15
0.2
0.25
0.3
South Shan East Shan North Shan
Remoteness
Non‐poppy villages Poppy villages
Opium poppy cultivation and sustainable development in Shan State, Myanmar
41
populations have less access to opportunities that can improve their economic situation25. While there was
already a lack of well‐remunerated employment opportunities, improving connectivity is crucial in
providing access to the opportunities that do exist. The results show that poppy villages had worse access
than non‐poppy villages, which contributed to their increased vulnerability. Results showing longer walk
times to health clinics, presented earlier, concluded that poppy villages often had worse access than non‐
poppy. Finally, worse access to education was also reported in poppy villages. These are both consequences
of remoteness and can be improved through increased connectivity. Also affected by remoteness is market
access, which is critical for increasing incomes and enhancing food security among the rural population in
Shan State. Improvements to the road network help to lower transaction costs and minimize crop losses,
giving farmers more opportunities for income generation from the increased farm‐gate profits and lowered
farm costs. As the rural population in Myanmar derives most of its income from agriculture, good access
to markets ‐ a place to sell and buy agricultural and other products ‐ is imperative for obtaining sufficient
household income. Most of villages in Shan (99%) relied on external markets, and it took significantly longer
for villagers from poppy villages to go to markets than villagers from non‐poppy villages.
25 Minot, N., Epprecht, M., Tran, T.T.A. and Le, Q.T., 2003. Income diversification and poverty in the northern uplands of Vietnam—
patterns, trends and policy implications. Technical Report, International Food Policy Research Institute (IFPRI), Washington, DC.
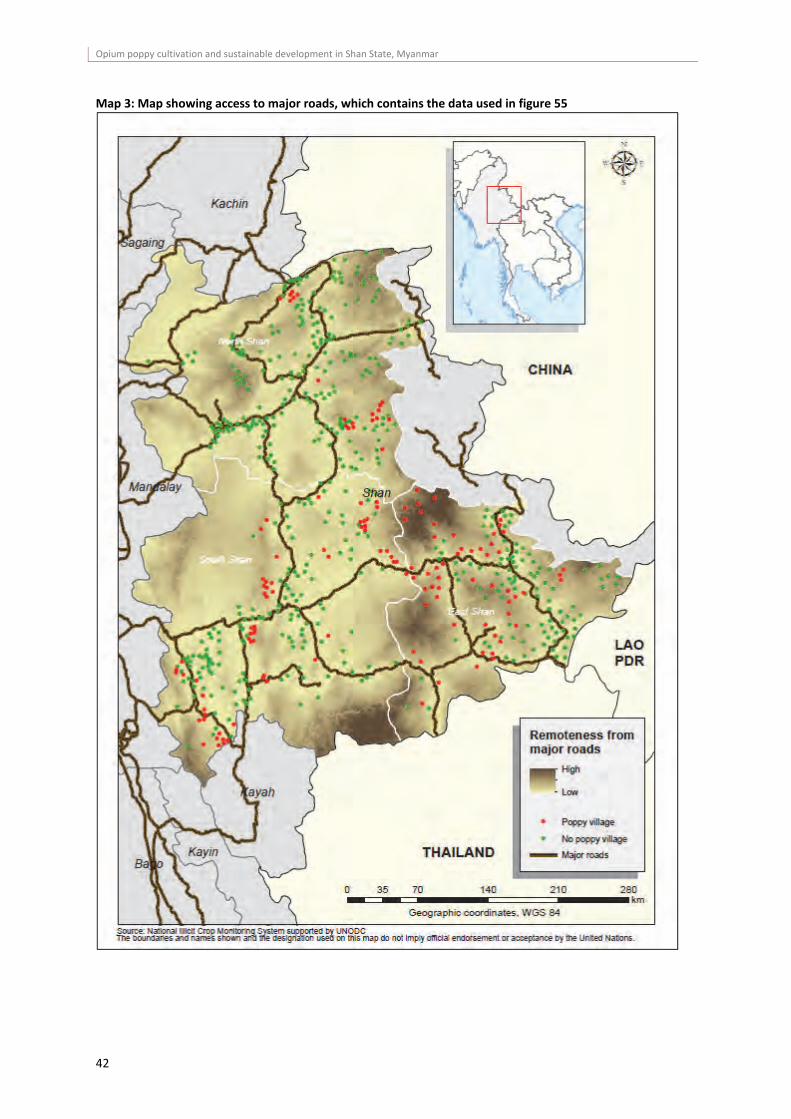
Opium poppy cultivation and sustainable development in Shan State, Myanmar
42
Map 3: Map showing access to major roads, which contains the data used in figure 55
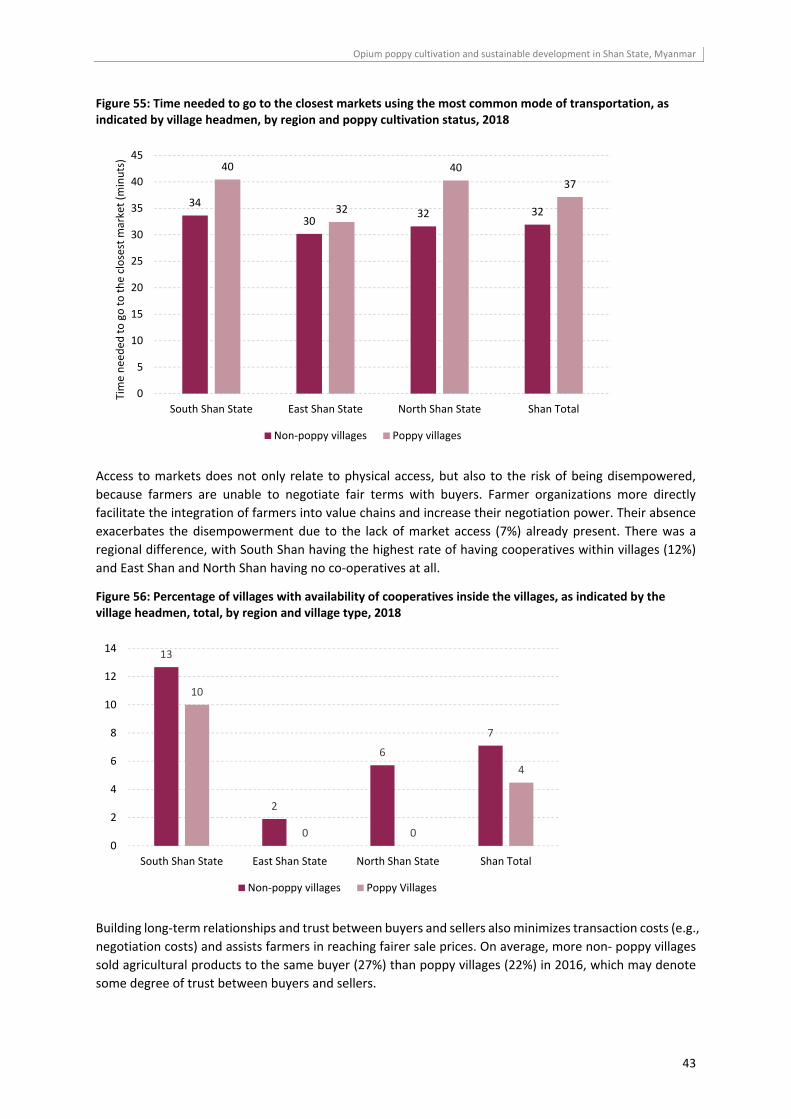
Opium poppy cultivation and sustainable development in Shan State, Myanmar
43
Figure 55: Time needed to go to the closest markets using the most common mode of transportation, as indicated by village headmen, by region and poppy cultivation status, 2018
Access to markets does not only relate to physical access, but also to the risk of being disempowered,
because farmers are unable to negotiate fair terms with buyers. Farmer organizations more directly
facilitate the integration of farmers into value chains and increase their negotiation power. Their absence
exacerbates the disempowerment due to the lack of market access (7%) already present. There was a
regional difference, with South Shan having the highest rate of having cooperatives within villages (12%)
and East Shan and North Shan having no co‐operatives at all.
Figure 56: Percentage of villages with availability of cooperatives inside the villages, as indicated by the village headmen, total, by region and village type, 2018
Building long‐term relationships and trust between buyers and sellers also minimizes transaction costs (e.g.,
negotiation costs) and assists farmers in reaching fairer sale prices. On average, more non‐ poppy villages
sold agricultural products to the same buyer (27%) than poppy villages (22%) in 2016, which may denote
some degree of trust between buyers and sellers.
34
3032 32
40
32
40
37
0
5
10
15
20
25
30
35
40
45
South Shan State East Shan State North Shan State Shan Total
Time needed
to go to the closest m
arket (m
inuts)
Non‐poppy villages Poppy villages
13
2
6
7
10
0 0
4
0
2
4
6
8
10
12
14
South Shan State East Shan State North Shan State Shan Total
Non‐poppy villages Poppy Villages
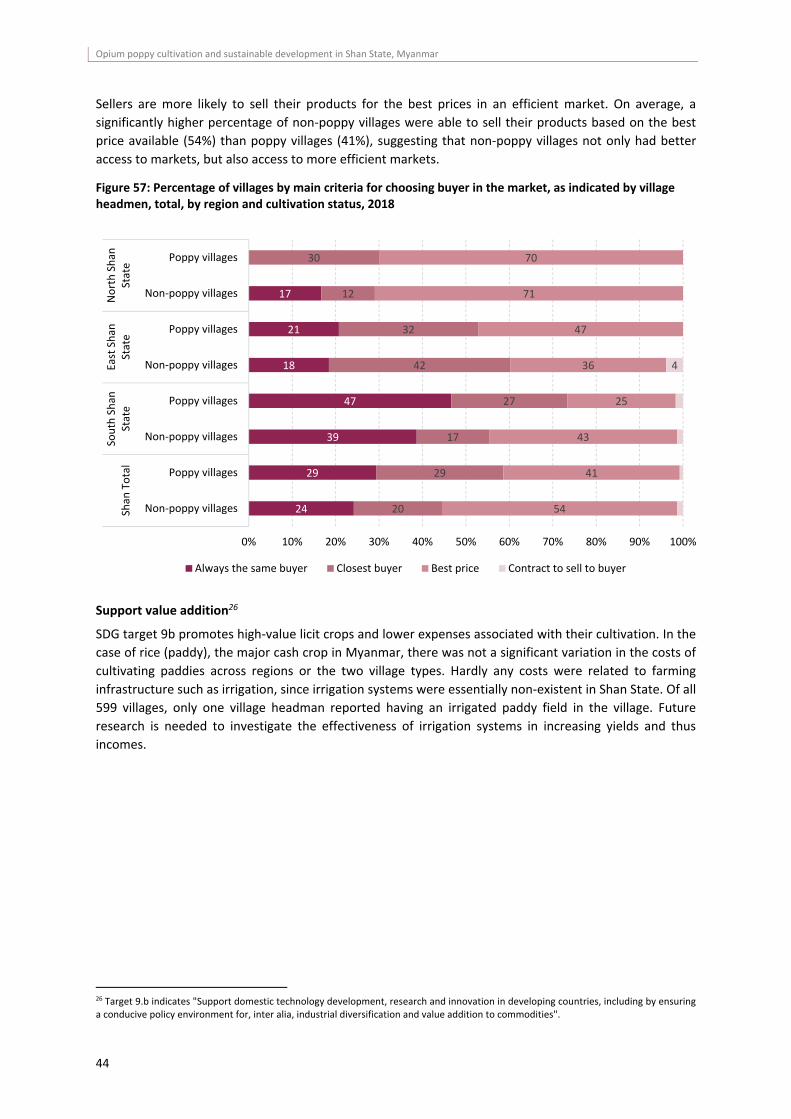
Opium poppy cultivation and sustainable development in Shan State, Myanmar
44
Sellers are more likely to sell their products for the best prices in an efficient market. On average, a
significantly higher percentage of non‐poppy villages were able to sell their products based on the best
price available (54%) than poppy villages (41%), suggesting that non‐poppy villages not only had better
access to markets, but also access to more efficient markets.
Figure 57: Percentage of villages by main criteria for choosing buyer in the market, as indicated by village headmen, total, by region and cultivation status, 2018
Support value addition26
SDG target 9b promotes high‐value licit crops and lower expenses associated with their cultivation. In the
case of rice (paddy), the major cash crop in Myanmar, there was not a significant variation in the costs of
cultivating paddies across regions or the two village types. Hardly any costs were related to farming
infrastructure such as irrigation, since irrigation systems were essentially non‐existent in Shan State. Of all
599 villages, only one village headman reported having an irrigated paddy field in the village. Future
research is needed to investigate the effectiveness of irrigation systems in increasing yields and thus
incomes.
26 Target 9.b indicates "Support domestic technology development, research and innovation in developing countries, including by ensuring a conducive policy environment for, inter alia, industrial diversification and value addition to commodities".
24
29
39
47
18
21
17
20
29
17
27
42
32
12
30
54
41
43
25
36
47
71
70
4
0% 10% 20% 30% 40% 50% 60% 70% 80% 90% 100%
Non‐poppy villages
Poppy villages
Non‐poppy villages
Poppy villages
Non‐poppy villages
Poppy villages
Non‐poppy villages
Poppy villages
Shan
Total
South Shan
State
East Shan
State
North Shan
State
Always the same buyer Closest buyer Best price Contract to sell to buyer
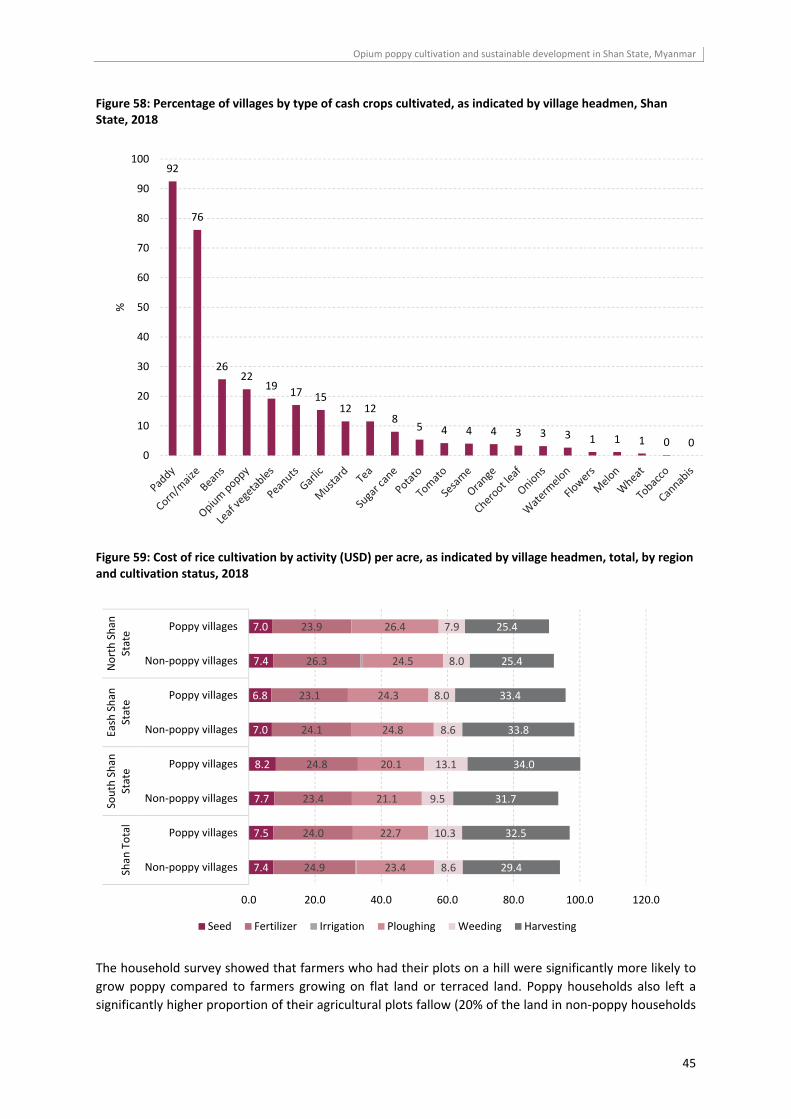
Opium poppy cultivation and sustainable development in Shan State, Myanmar
45
Figure 58: Percentage of villages by type of cash crops cultivated, as indicated by village headmen, Shan State, 2018
Figure 59: Cost of rice cultivation by activity (USD) per acre, as indicated by village headmen, total, by region and cultivation status, 2018
The household survey showed that farmers who had their plots on a hill were significantly more likely to
grow poppy compared to farmers growing on flat land or terraced land. Poppy households also left a
significantly higher proportion of their agricultural plots fallow (20% of the land in non‐poppy households
92
76
2622
1917 15
12 128
5 4 4 4 3 3 3 1 1 1 0 00
10
20
30
40
50
60
70
80
90
100
%
7.4
7.5
7.7
8.2
7.0
6.8
7.4
7.0
24.9
24.0
23.4
24.8
24.1
23.1
26.3
23.9
23.4
22.7
21.1
20.1
24.8
24.3
24.5
26.4
8.6
10.3
9.5
13.1
8.6
8.0
8.0
7.9
29.4
32.5
31.7
34.0
33.8
33.4
25.4
25.4
0.0 20.0 40.0 60.0 80.0 100.0 120.0
Non‐poppy villages
Poppy villages
Non‐poppy villages
Poppy villages
Non‐poppy villages
Poppy villages
Non‐poppy villages
Poppy villages
Shan
Total
South Shan
State
Eash Shan
State
North Shan
State
Seed Fertilizer Irrigation Ploughing Weeding Harvesting
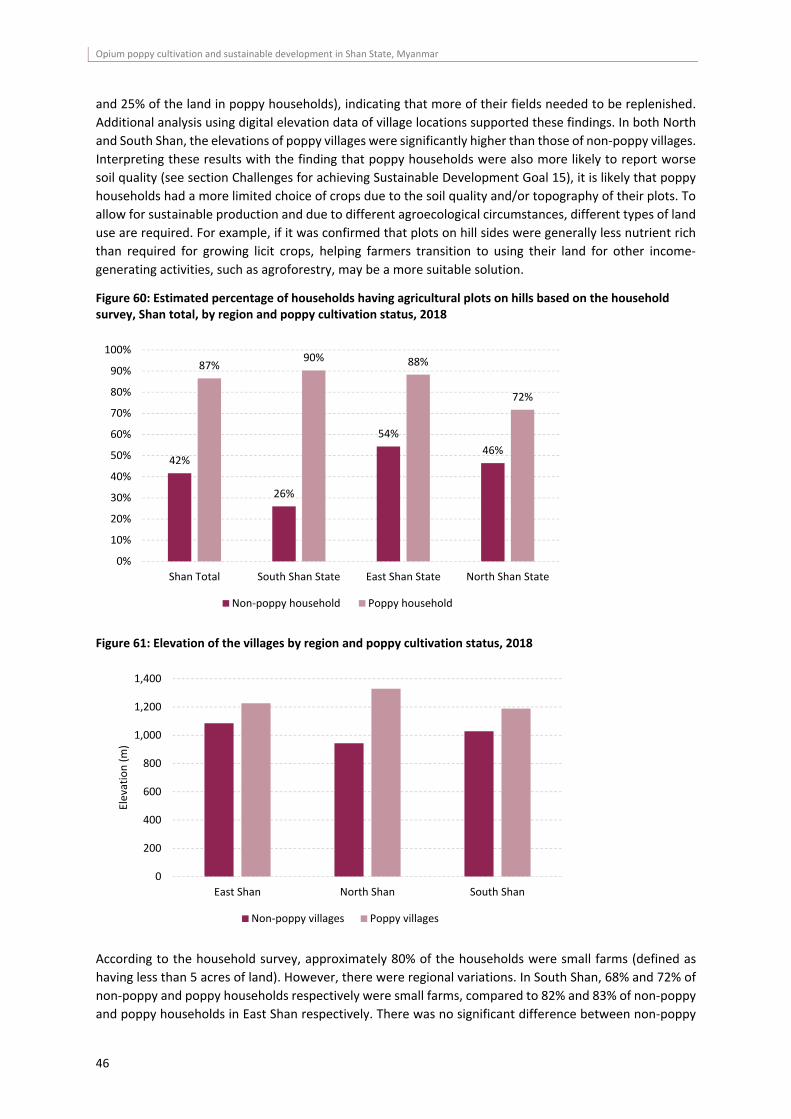
Opium poppy cultivation and sustainable development in Shan State, Myanmar
46
and 25% of the land in poppy households), indicating that more of their fields needed to be replenished.
Additional analysis using digital elevation data of village locations supported these findings. In both North
and South Shan, the elevations of poppy villages were significantly higher than those of non‐poppy villages.
Interpreting these results with the finding that poppy households were also more likely to report worse
soil quality (see section Challenges for achieving Sustainable Development Goal 15), it is likely that poppy
households had a more limited choice of crops due to the soil quality and/or topography of their plots. To
allow for sustainable production and due to different agroecological circumstances, different types of land
use are required. For example, if it was confirmed that plots on hill sides were generally less nutrient rich
than required for growing licit crops, helping farmers transition to using their land for other income‐
generating activities, such as agroforestry, may be a more suitable solution.
Figure 60: Estimated percentage of households having agricultural plots on hills based on the household survey, Shan total, by region and poppy cultivation status, 2018
Figure 61: Elevation of the villages by region and poppy cultivation status, 2018
According to the household survey, approximately 80% of the households were small farms (defined as
having less than 5 acres of land). However, there were regional variations. In South Shan, 68% and 72% of
non‐poppy and poppy households respectively were small farms, compared to 82% and 83% of non‐poppy
and poppy households in East Shan respectively. There was no significant difference between non‐poppy
42%
26%
54%
46%
87%90% 88%
72%
0%
10%
20%
30%
40%
50%
60%
70%
80%
90%
100%
Shan Total South Shan State East Shan State North Shan State
Non‐poppy household Poppy household
0
200
400
600
800
1,000
1,200
1,400
East Shan North Shan South Shan
Elevation (m)
Non‐poppy villages Poppy villages
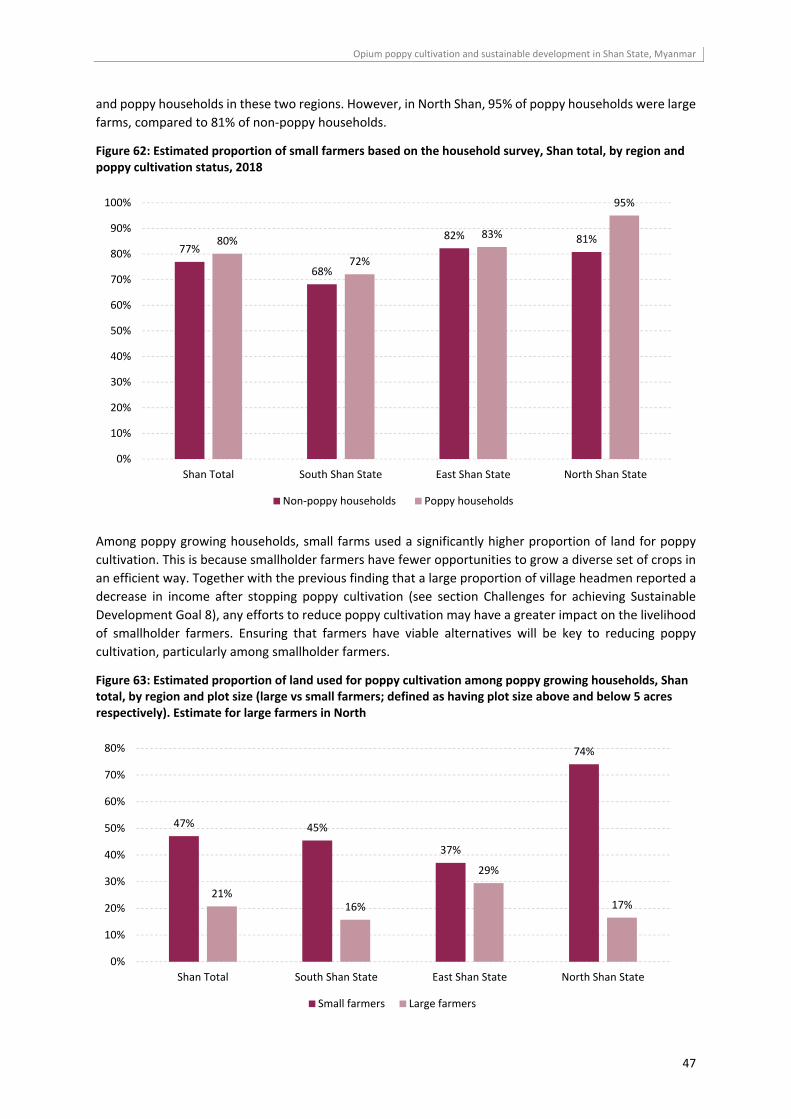
Opium poppy cultivation and sustainable development in Shan State, Myanmar
47
and poppy households in these two regions. However, in North Shan, 95% of poppy households were large
farms, compared to 81% of non‐poppy households.
Figure 62: Estimated proportion of small farmers based on the household survey, Shan total, by region and poppy cultivation status, 2018
Among poppy growing households, small farms used a significantly higher proportion of land for poppy
cultivation. This is because smallholder farmers have fewer opportunities to grow a diverse set of crops in
an efficient way. Together with the previous finding that a large proportion of village headmen reported a
decrease in income after stopping poppy cultivation (see section Challenges for achieving Sustainable
Development Goal 8), any efforts to reduce poppy cultivation may have a greater impact on the livelihood
of smallholder farmers. Ensuring that farmers have viable alternatives will be key to reducing poppy
cultivation, particularly among smallholder farmers.
Figure 63: Estimated proportion of land used for poppy cultivation among poppy growing households, Shan total, by region and plot size (large vs small farmers; defined as having plot size above and below 5 acres respectively). Estimate for large farmers in North
77%
68%
82% 81%80%
72%
83%
95%
0%
10%
20%
30%
40%
50%
60%
70%
80%
90%
100%
Shan Total South Shan State East Shan State North Shan State
Non‐poppy households Poppy households
47% 45%
37%
74%
21%16%
29%
17%
0%
10%
20%
30%
40%
50%
60%
70%
80%
Shan Total South Shan State East Shan State North Shan State
Small farmers Large farmers
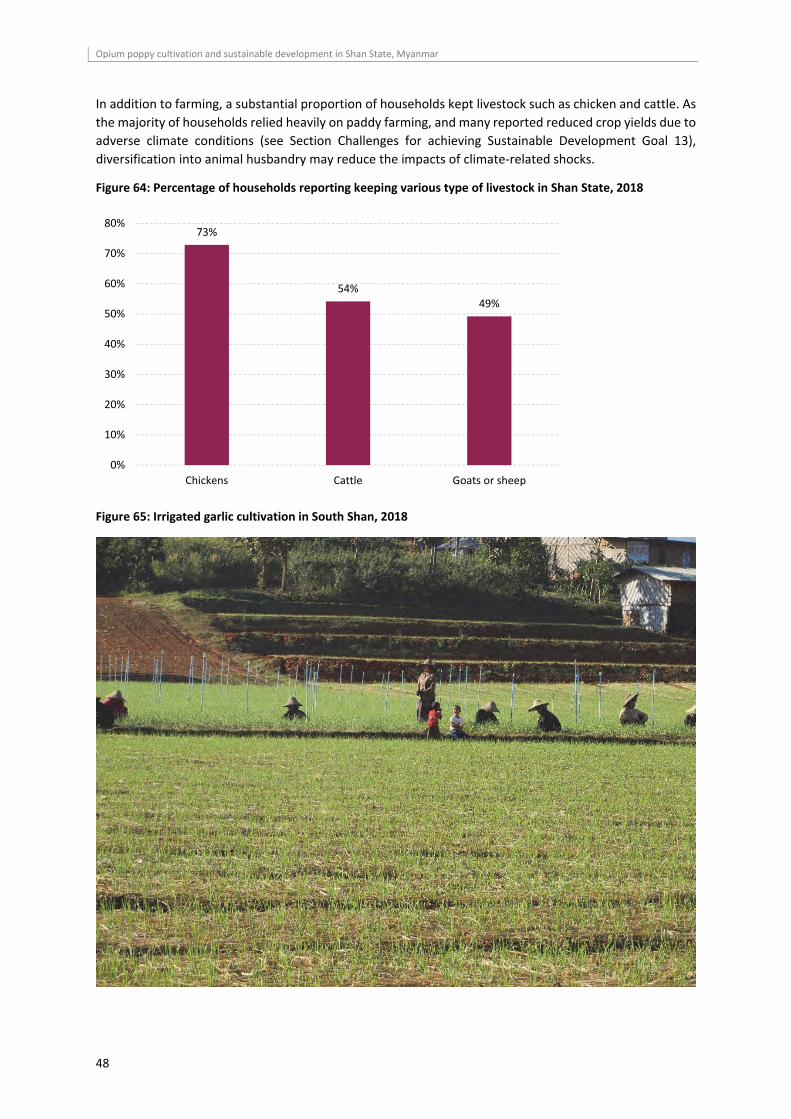
Opium poppy cultivation and sustainable development in Shan State, Myanmar
48
In addition to farming, a substantial proportion of households kept livestock such as chicken and cattle. As
the majority of households relied heavily on paddy farming, and many reported reduced crop yields due to
adverse climate conditions (see Section Challenges for achieving Sustainable Development Goal 13),
diversification into animal husbandry may reduce the impacts of climate‐related shocks.
Figure 64: Percentage of households reporting keeping various type of livestock in Shan State, 2018
Figure 65: Irrigated garlic cultivation in South Shan, 2018
73%
54%
49%
0%
10%
20%
30%
40%
50%
60%
70%
80%
Chickens Cattle Goats or sheep
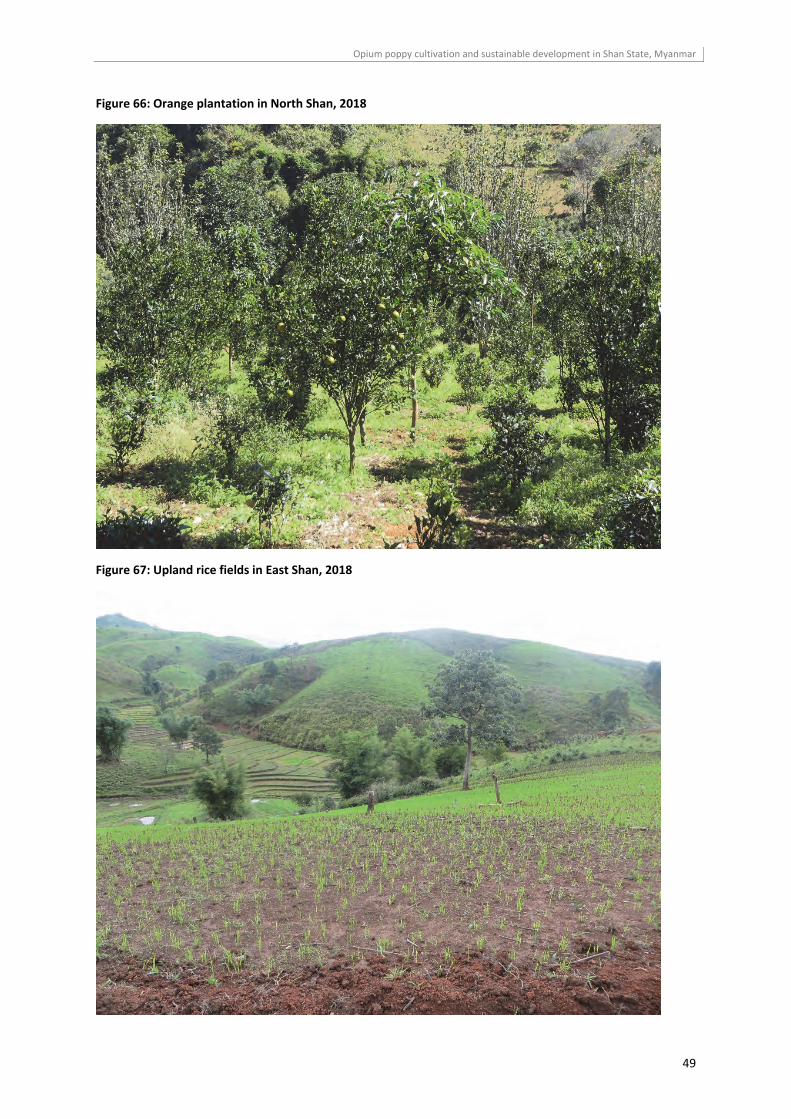
Opium poppy cultivation and sustainable development in Shan State, Myanmar
49
Figure 66: Orange plantation in North Shan, 2018
Figure 67: Upland rice fields in East Shan, 2018
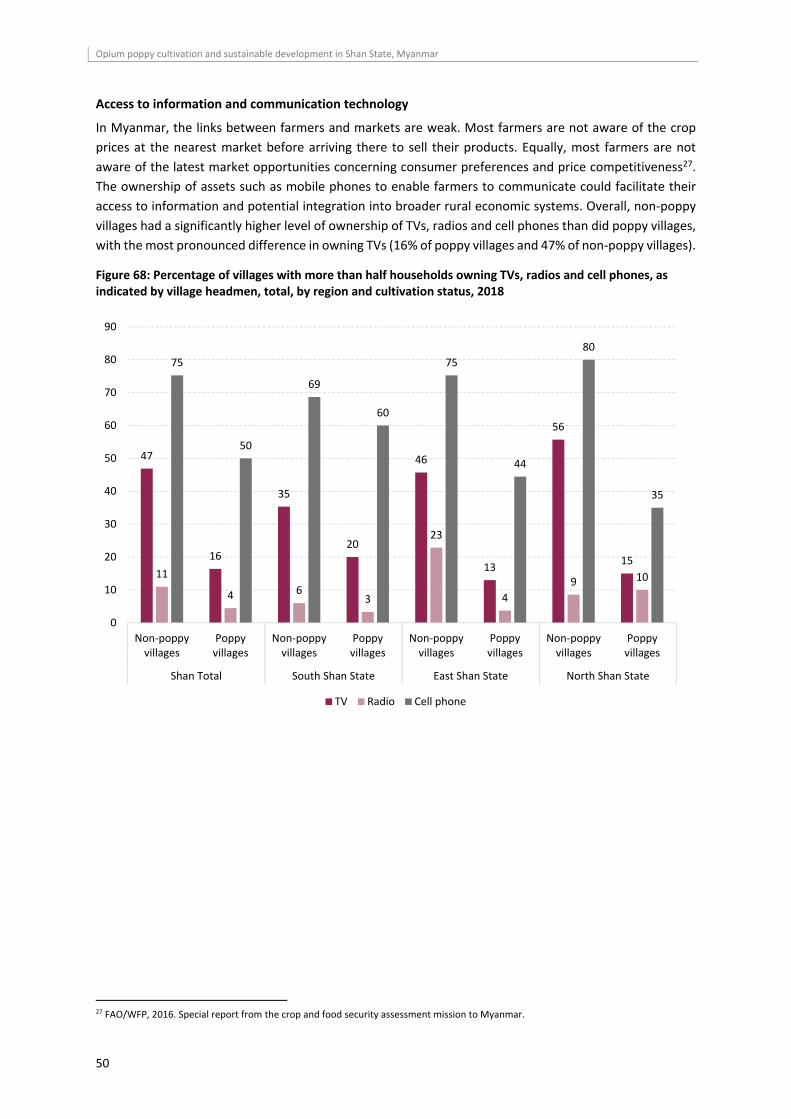
Opium poppy cultivation and sustainable development in Shan State, Myanmar
50
Access to information and communication technology
In Myanmar, the links between farmers and markets are weak. Most farmers are not aware of the crop
prices at the nearest market before arriving there to sell their products. Equally, most farmers are not
aware of the latest market opportunities concerning consumer preferences and price competitiveness27.
The ownership of assets such as mobile phones to enable farmers to communicate could facilitate their
access to information and potential integration into broader rural economic systems. Overall, non‐poppy
villages had a significantly higher level of ownership of TVs, radios and cell phones than did poppy villages,
with the most pronounced difference in owning TVs (16% of poppy villages and 47% of non‐poppy villages).
Figure 68: Percentage of villages with more than half households owning TVs, radios and cell phones, as indicated by village headmen, total, by region and cultivation status, 2018
27 FAO/WFP, 2016. Special report from the crop and food security assessment mission to Myanmar.
47
16
35
20
46
13
56
1511
4 63
23
4
9 10
75
50
69
60
75
44
80
35
0
10
20
30
40
50
60
70
80
90
Non‐poppyvillages
Poppyvillages
Non‐poppyvillages
Poppyvillages
Non‐poppyvillages
Poppyvillages
Non‐poppyvillages
Poppyvillages
Shan Total South Shan State East Shan State North Shan State
TV Radio Cell phone
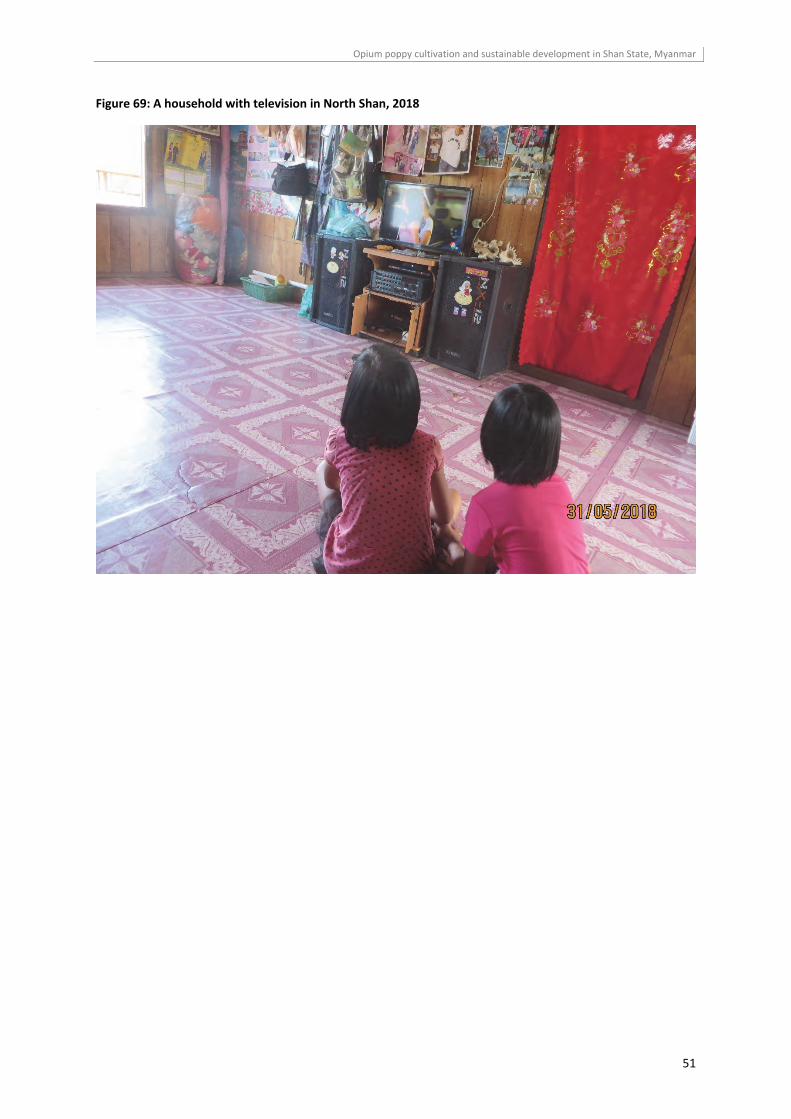
Opium poppy cultivation and sustainable development in Shan State, Myanmar
51
Figure 69: A household with television in North Shan, 2018
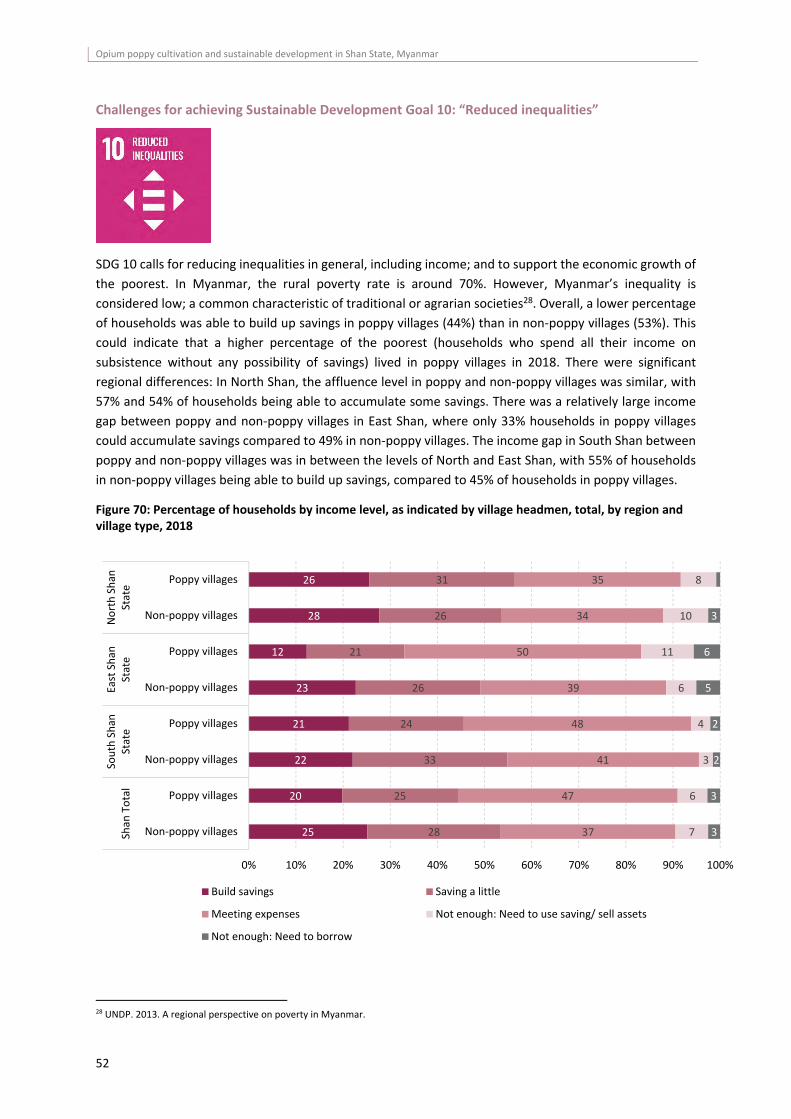
Opium poppy cultivation and sustainable development in Shan State, Myanmar
52
Challenges for achieving Sustainable Development Goal 10: “Reduced inequalities”
SDG 10 calls for reducing inequalities in general, including income; and to support the economic growth of
the poorest. In Myanmar, the rural poverty rate is around 70%. However, Myanmar’s inequality is
considered low; a common characteristic of traditional or agrarian societies28. Overall, a lower percentage
of households was able to build up savings in poppy villages (44%) than in non‐poppy villages (53%). This
could indicate that a higher percentage of the poorest (households who spend all their income on
subsistence without any possibility of savings) lived in poppy villages in 2018. There were significant
regional differences: In North Shan, the affluence level in poppy and non‐poppy villages was similar, with
57% and 54% of households being able to accumulate some savings. There was a relatively large income
gap between poppy and non‐poppy villages in East Shan, where only 33% households in poppy villages
could accumulate savings compared to 49% in non‐poppy villages. The income gap in South Shan between
poppy and non‐poppy villages was in between the levels of North and East Shan, with 55% of households
in non‐poppy villages being able to build up savings, compared to 45% of households in poppy villages.
Figure 70: Percentage of households by income level, as indicated by village headmen, total, by region and village type, 2018
28 UNDP. 2013. A regional perspective on poverty in Myanmar.
25
20
22
21
23
12
28
26
28
25
33
24
26
21
26
31
37
47
41
48
39
50
34
35
7
6
3
4
6
11
10
8
3
3
2
2
5
6
3
0% 10% 20% 30% 40% 50% 60% 70% 80% 90% 100%
Non‐poppy villages
Poppy villages
Non‐poppy villages
Poppy villages
Non‐poppy villages
Poppy villages
Non‐poppy villages
Poppy villages
Shan
Total
South Shan
State
East Shan
State
North Shan
State
Build savings Saving a little
Meeting expenses Not enough: Need to use saving/ sell assets
Not enough: Need to borrow
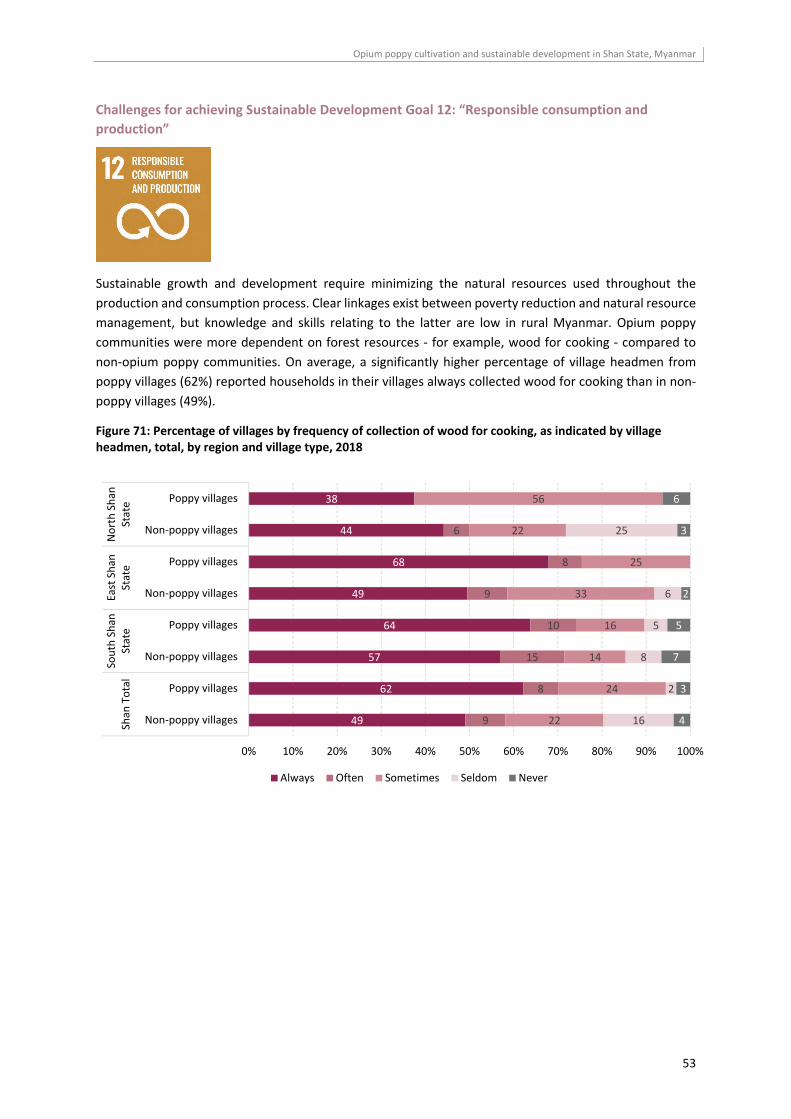
Opium poppy cultivation and sustainable development in Shan State, Myanmar
53
Challenges for achieving Sustainable Development Goal 12: “Responsible consumption and
production”
Sustainable growth and development require minimizing the natural resources used throughout the
production and consumption process. Clear linkages exist between poverty reduction and natural resource
management, but knowledge and skills relating to the latter are low in rural Myanmar. Opium poppy
communities were more dependent on forest resources ‐ for example, wood for cooking ‐ compared to
non‐opium poppy communities. On average, a significantly higher percentage of village headmen from
poppy villages (62%) reported households in their villages always collected wood for cooking than in non‐
poppy villages (49%).
Figure 71: Percentage of villages by frequency of collection of wood for cooking, as indicated by village headmen, total, by region and village type, 2018
49
62
57
64
49
68
44
38
9
8
15
10
9
8
6
22
24
14
16
33
25
22
56
16
2
8
5
6
25
4
3
7
5
2
3
6
0% 10% 20% 30% 40% 50% 60% 70% 80% 90% 100%
Non‐poppy villages
Poppy villages
Non‐poppy villages
Poppy villages
Non‐poppy villages
Poppy villages
Non‐poppy villages
Poppy villages
Shan
Total
South Shan
State
East Shan
State
North Shan
State
Always Often Sometimes Seldom Never
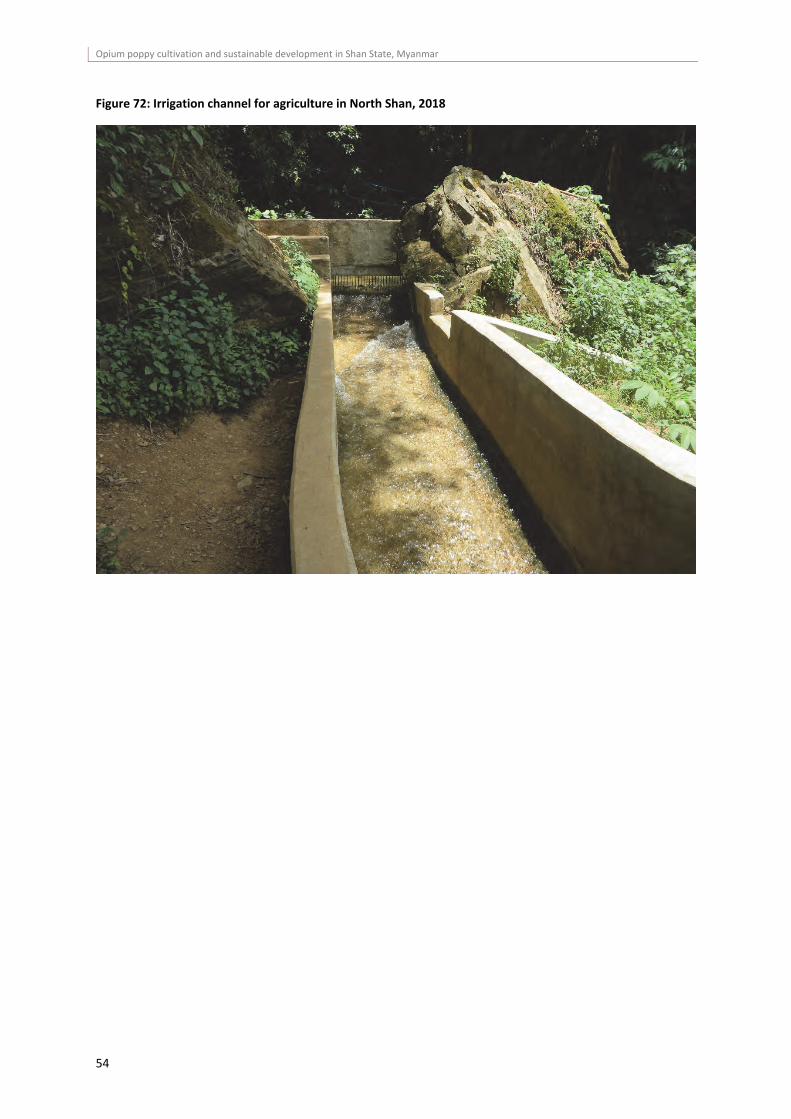
Opium poppy cultivation and sustainable development in Shan State, Myanmar
54
Figure 72: Irrigation channel for agriculture in North Shan, 2018
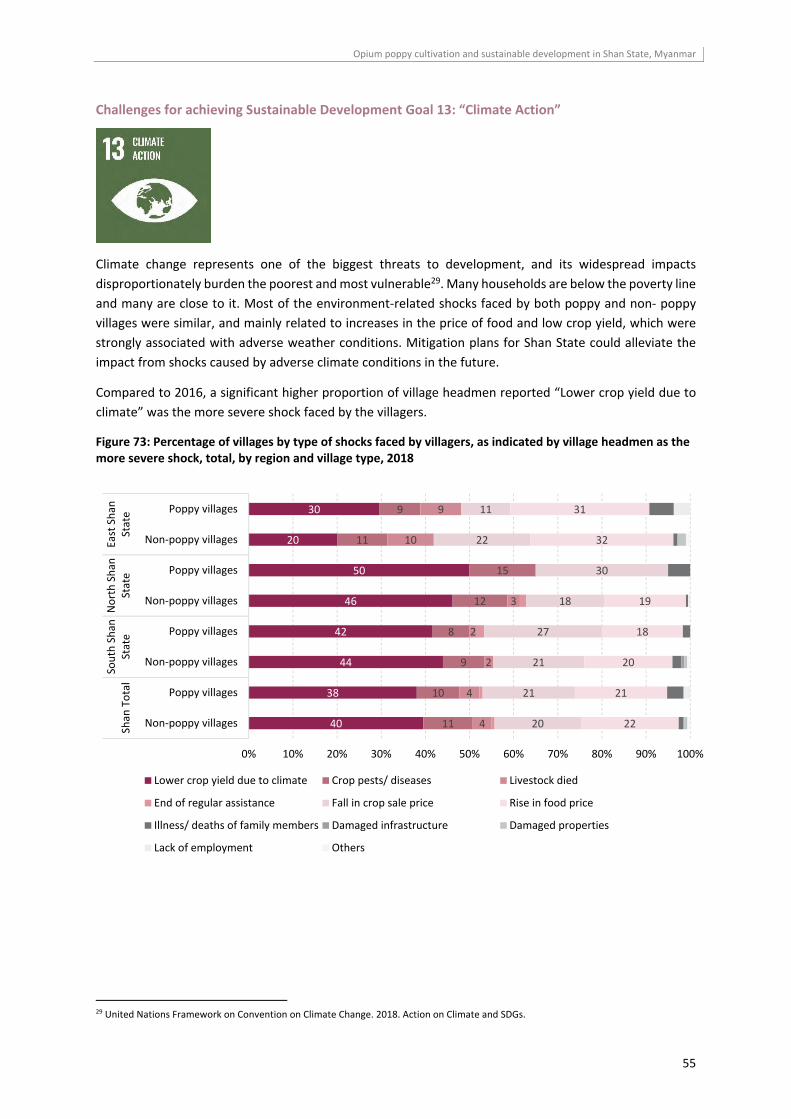
Opium poppy cultivation and sustainable development in Shan State, Myanmar
55
Challenges for achieving Sustainable Development Goal 13: “Climate Action”
Climate change represents one of the biggest threats to development, and its widespread impacts
disproportionately burden the poorest and most vulnerable29. Many households are below the poverty line
and many are close to it. Most of the environment‐related shocks faced by both poppy and non‐ poppy
villages were similar, and mainly related to increases in the price of food and low crop yield, which were
strongly associated with adverse weather conditions. Mitigation plans for Shan State could alleviate the
impact from shocks caused by adverse climate conditions in the future.
Compared to 2016, a significant higher proportion of village headmen reported “Lower crop yield due to
climate” was the more severe shock faced by the villagers.
Figure 73: Percentage of villages by type of shocks faced by villagers, as indicated by village headmen as the more severe shock, total, by region and village type, 2018
29 United Nations Framework on Convention on Climate Change. 2018. Action on Climate and SDGs.
40
38
44
42
46
50
20
30
11
10
9
8
12
15
11
9
4
4
2
2
3
10
9
20
21
21
27
18
30
22
11
22
21
20
18
19
32
31
0% 10% 20% 30% 40% 50% 60% 70% 80% 90% 100%
Non‐poppy villages
Poppy villages
Non‐poppy villages
Poppy villages
Non‐poppy villages
Poppy villages
Non‐poppy villages
Poppy villages
Shan
TotalSouth Shan
State
North Shan
State
East Shan
State
Lower crop yield due to climate Crop pests/ diseases Livestock died
End of regular assistance Fall in crop sale price Rise in food price
Illness/ deaths of family members Damaged infrastructure Damaged properties
Lack of employment Others
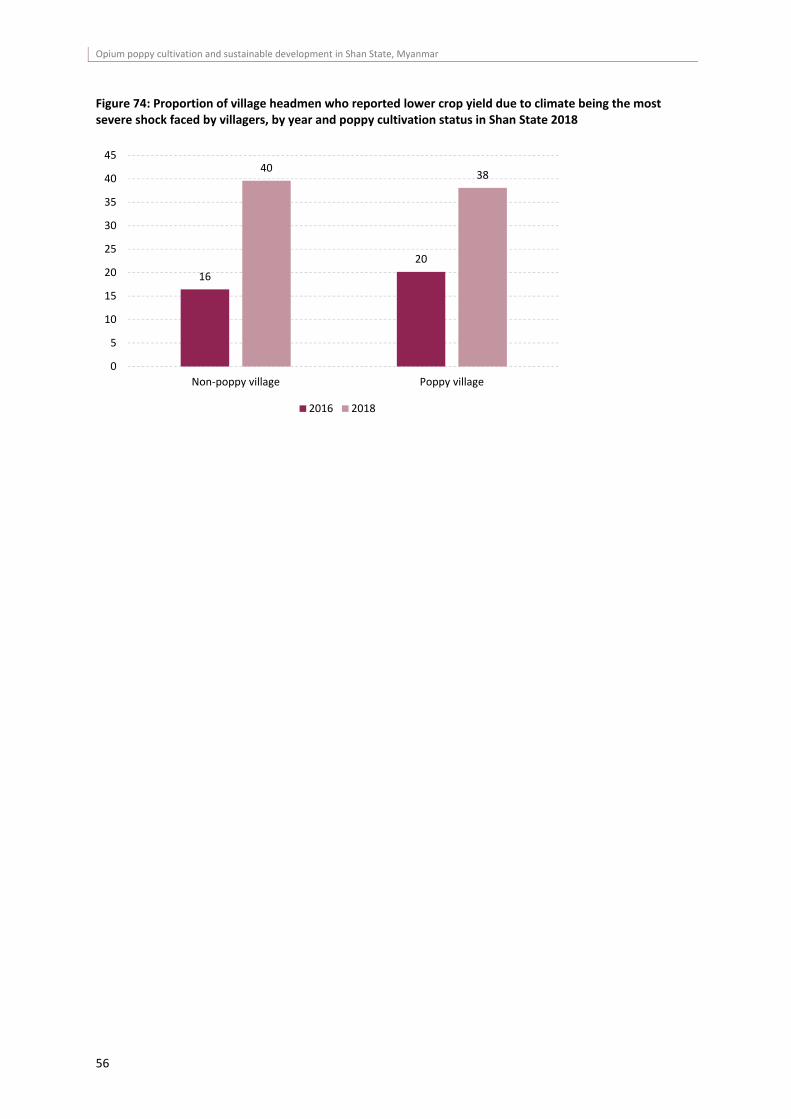
Opium poppy cultivation and sustainable development in Shan State, Myanmar
56
Figure 74: Proportion of village headmen who reported lower crop yield due to climate being the most severe shock faced by villagers, by year and poppy cultivation status in Shan State 2018
16
20
4038
0
5
10
15
20
25
30
35
40
45
Non‐poppy village Poppy village
2016 2018
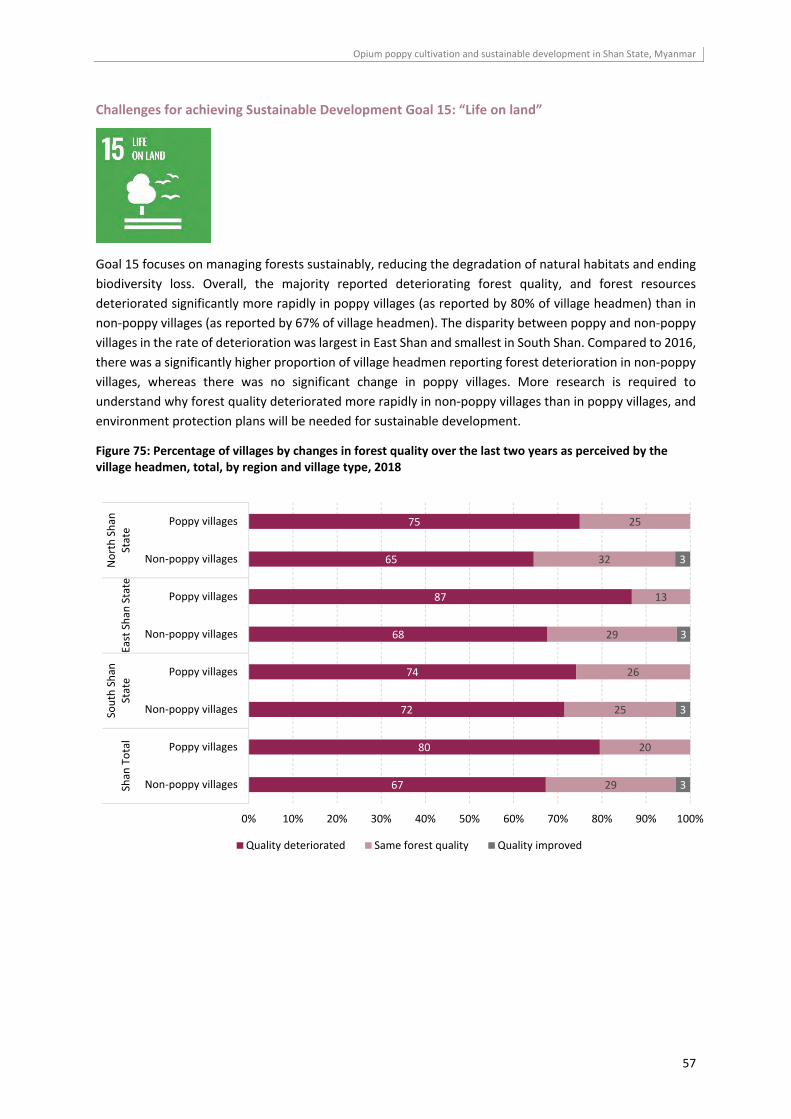
Opium poppy cultivation and sustainable development in Shan State, Myanmar
57
Challenges for achieving Sustainable Development Goal 15: “Life on land”
Goal 15 focuses on managing forests sustainably, reducing the degradation of natural habitats and ending
biodiversity loss. Overall, the majority reported deteriorating forest quality, and forest resources
deteriorated significantly more rapidly in poppy villages (as reported by 80% of village headmen) than in
non‐poppy villages (as reported by 67% of village headmen). The disparity between poppy and non‐poppy
villages in the rate of deterioration was largest in East Shan and smallest in South Shan. Compared to 2016,
there was a significantly higher proportion of village headmen reporting forest deterioration in non‐poppy
villages, whereas there was no significant change in poppy villages. More research is required to
understand why forest quality deteriorated more rapidly in non‐poppy villages than in poppy villages, and
environment protection plans will be needed for sustainable development.
Figure 75: Percentage of villages by changes in forest quality over the last two years as perceived by the village headmen, total, by region and village type, 2018
67
80
72
74
68
87
65
75
29
20
25
26
29
13
32
25
3
3
3
3
0% 10% 20% 30% 40% 50% 60% 70% 80% 90% 100%
Non‐poppy villages
Poppy villages
Non‐poppy villages
Poppy villages
Non‐poppy villages
Poppy villages
Non‐poppy villages
Poppy villages
Shan
Total
South Shan
State
East Shan
State
North Shan
State
Quality deteriorated Same forest quality Quality improved
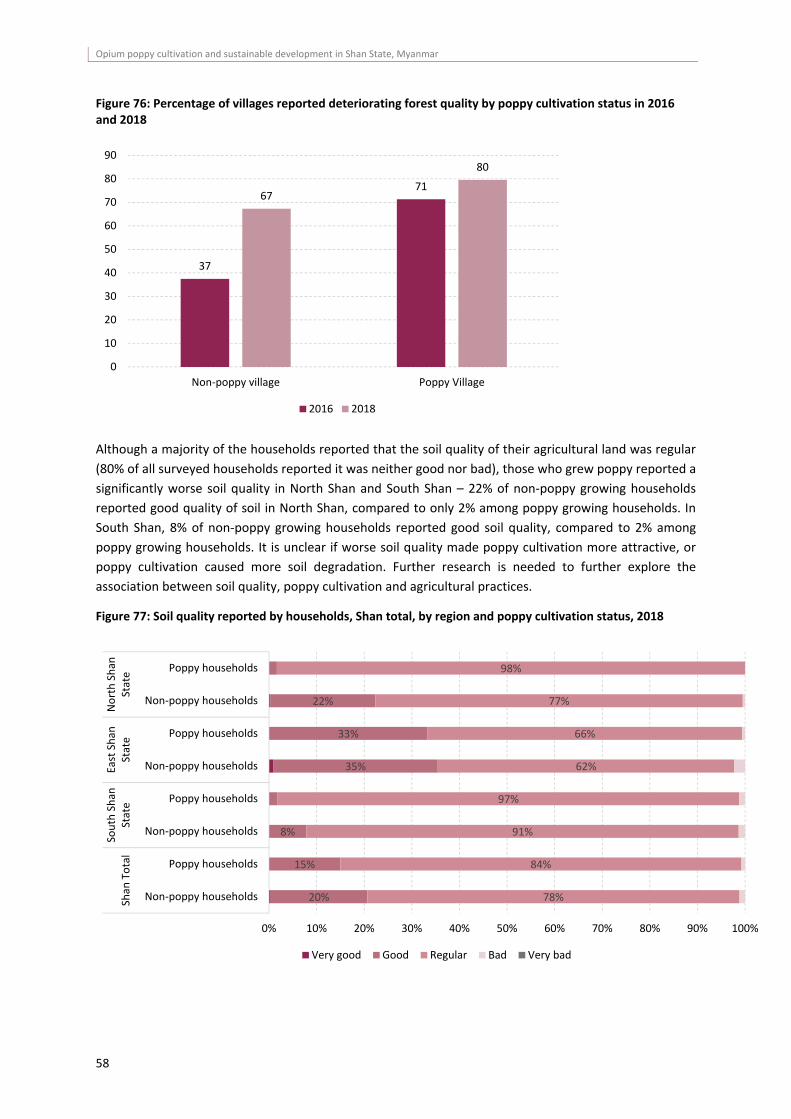
Opium poppy cultivation and sustainable development in Shan State, Myanmar
58
Figure 76: Percentage of villages reported deteriorating forest quality by poppy cultivation status in 2016 and 2018
Although a majority of the households reported that the soil quality of their agricultural land was regular
(80% of all surveyed households reported it was neither good nor bad), those who grew poppy reported a
significantly worse soil quality in North Shan and South Shan – 22% of non‐poppy growing households
reported good quality of soil in North Shan, compared to only 2% among poppy growing households. In
South Shan, 8% of non‐poppy growing households reported good soil quality, compared to 2% among
poppy growing households. It is unclear if worse soil quality made poppy cultivation more attractive, or
poppy cultivation caused more soil degradation. Further research is needed to further explore the
association between soil quality, poppy cultivation and agricultural practices.
Figure 77: Soil quality reported by households, Shan total, by region and poppy cultivation status, 2018
37
7167
80
0
10
20
30
40
50
60
70
80
90
Non‐poppy village Poppy Village
2016 2018
20%
15%
8%
35%
33%
22%
78%
84%
91%
97%
62%
66%
77%
98%
0% 10% 20% 30% 40% 50% 60% 70% 80% 90% 100%
Non‐poppy households
Poppy households
Non‐poppy households
Poppy households
Non‐poppy households
Poppy households
Non‐poppy households
Poppy households
Shan
Total
South Shan
State
East Shan
State
North Shan
State
Very good Good Regular Bad Very bad
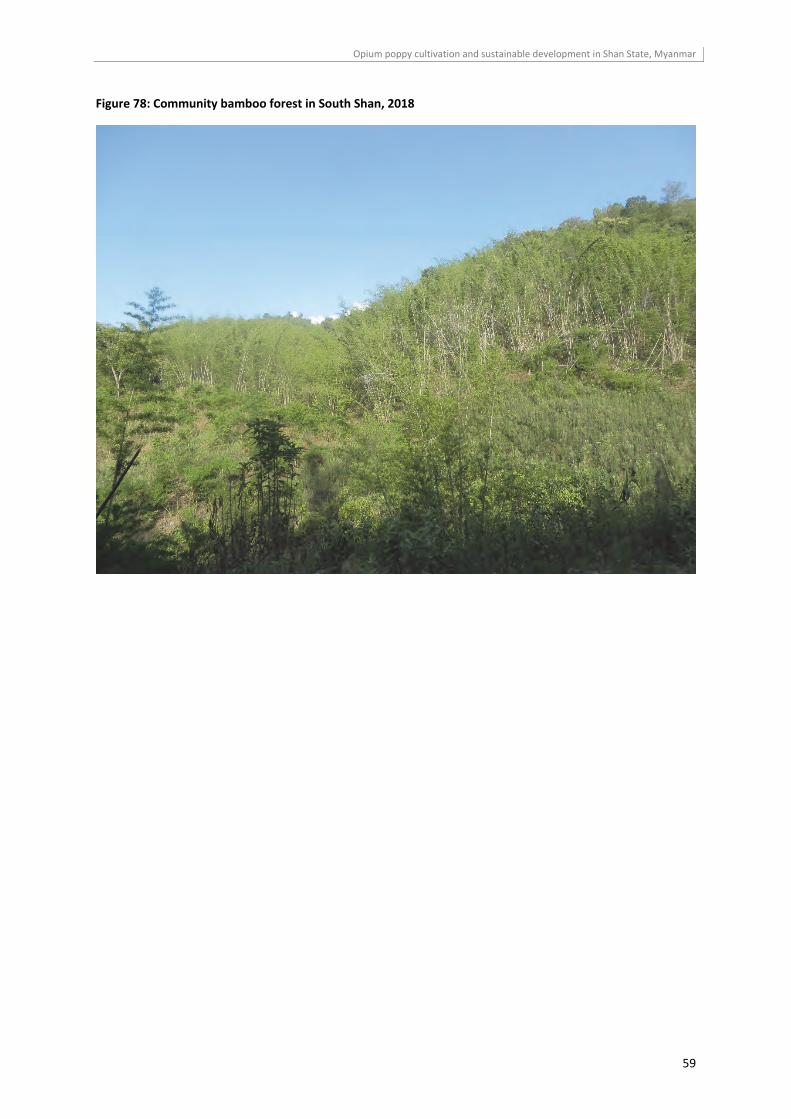
Opium poppy cultivation and sustainable development in Shan State, Myanmar
59
Figure 78: Community bamboo forest in South Shan, 2018
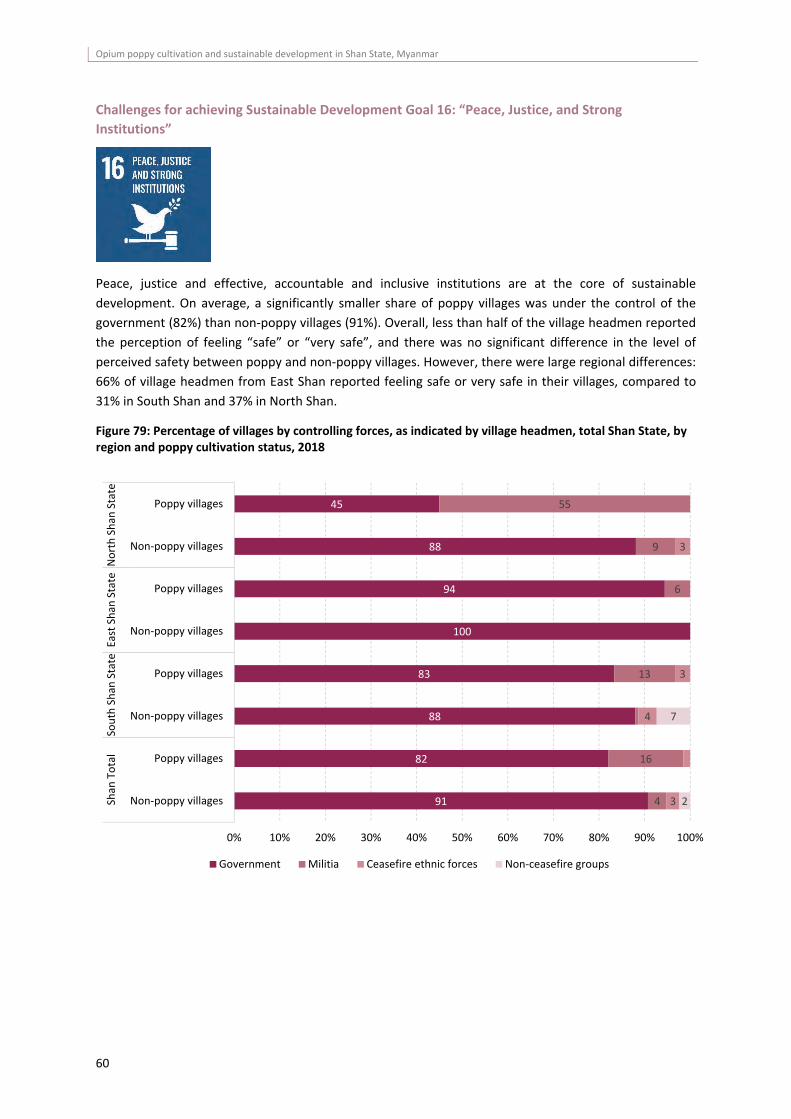
Opium poppy cultivation and sustainable development in Shan State, Myanmar
60
Challenges for achieving Sustainable Development Goal 16: “Peace, Justice, and Strong
Institutions”
Peace, justice and effective, accountable and inclusive institutions are at the core of sustainable
development. On average, a significantly smaller share of poppy villages was under the control of the
government (82%) than non‐poppy villages (91%). Overall, less than half of the village headmen reported
the perception of feeling “safe” or “very safe”, and there was no significant difference in the level of
perceived safety between poppy and non‐poppy villages. However, there were large regional differences:
66% of village headmen from East Shan reported feeling safe or very safe in their villages, compared to
31% in South Shan and 37% in North Shan.
Figure 79: Percentage of villages by controlling forces, as indicated by village headmen, total Shan State, by region and poppy cultivation status, 2018
91
82
88
83
100
94
88
45
4
16
13
6
9
55
3
4
3
3
2
7
0% 10% 20% 30% 40% 50% 60% 70% 80% 90% 100%
Non‐poppy villages
Poppy villages
Non‐poppy villages
Poppy villages
Non‐poppy villages
Poppy villages
Non‐poppy villages
Poppy villages
Shan
Total
South Shan
State
East Shan
State
North Shan
State
Government Militia Ceasefire ethnic forces Non‐ceasefire groups
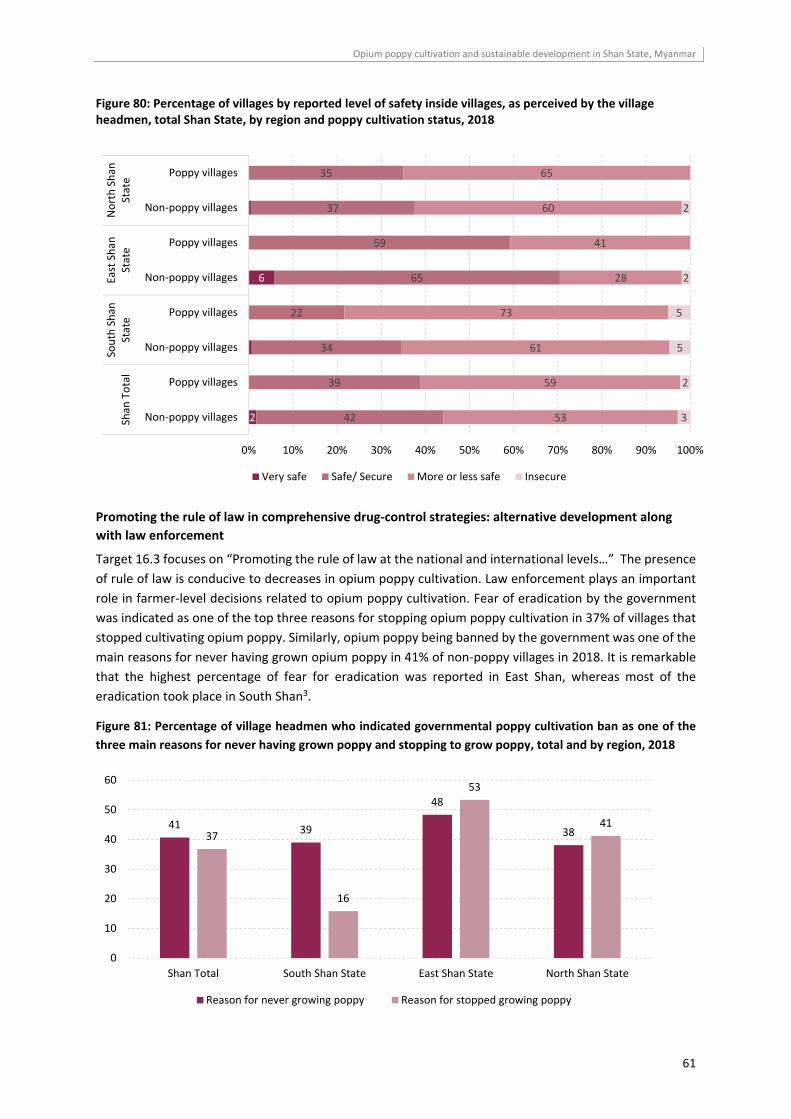
Opium poppy cultivation and sustainable development in Shan State, Myanmar
61
Figure 80: Percentage of villages by reported level of safety inside villages, as perceived by the village headmen, total Shan State, by region and poppy cultivation status, 2018
Promoting the rule of law in comprehensive drug‐control strategies: alternative development along
with law enforcement
Target 16.3 focuses on “Promoting the rule of law at the national and international levels…” The presence
of rule of law is conducive to decreases in opium poppy cultivation. Law enforcement plays an important
role in farmer‐level decisions related to opium poppy cultivation. Fear of eradication by the government
was indicated as one of the top three reasons for stopping opium poppy cultivation in 37% of villages that
stopped cultivating opium poppy. Similarly, opium poppy being banned by the government was one of the
main reasons for never having grown opium poppy in 41% of non‐poppy villages in 2018. It is remarkable
that the highest percentage of fear for eradication was reported in East Shan, whereas most of the
eradication took place in South Shan3.
Figure 81: Percentage of village headmen who indicated governmental poppy cultivation ban as one of the
three main reasons for never having grown poppy and stopping to grow poppy, total and by region, 2018
2
6
42
39
34
22
65
59
37
35
53
59
61
73
28
41
60
65
3
2
5
5
2
2
0% 10% 20% 30% 40% 50% 60% 70% 80% 90% 100%
Non‐poppy villages
Poppy villages
Non‐poppy villages
Poppy villages
Non‐poppy villages
Poppy villages
Non‐poppy villages
Poppy villages
Shan
Total
South Shan
State
East Shan
State
North Shan
State
Very safe Safe/ Secure More or less safe Insecure
41 39
48
3837
16
53
41
0
10
20
30
40
50
60
Shan Total South Shan State East Shan State North Shan State
Reason for never growing poppy Reason for stopped growing poppy
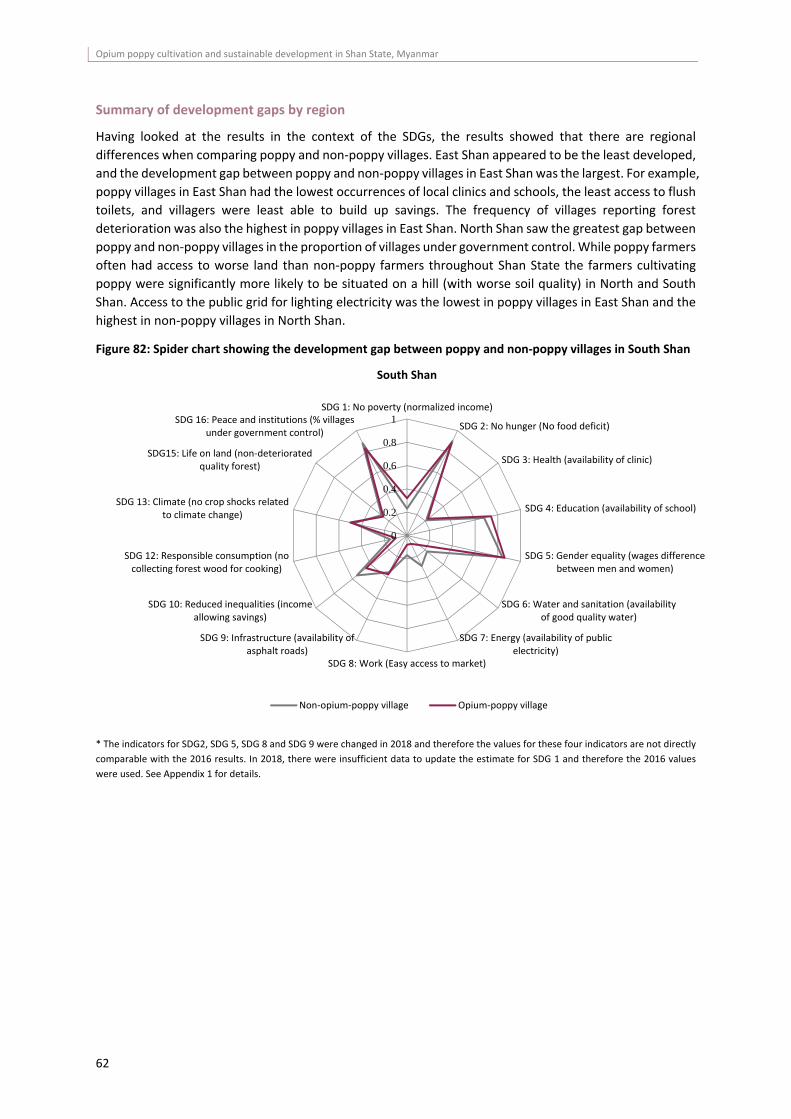
Opium poppy cultivation and sustainable development in Shan State, Myanmar
62
Summary of development gaps by region
Having looked at the results in the context of the SDGs, the results showed that there are regional
differences when comparing poppy and non‐poppy villages. East Shan appeared to be the least developed,
and the development gap between poppy and non‐poppy villages in East Shan was the largest. For example,
poppy villages in East Shan had the lowest occurrences of local clinics and schools, the least access to flush
toilets, and villagers were least able to build up savings. The frequency of villages reporting forest
deterioration was also the highest in poppy villages in East Shan. North Shan saw the greatest gap between
poppy and non‐poppy villages in the proportion of villages under government control. While poppy farmers
often had access to worse land than non‐poppy farmers throughout Shan State the farmers cultivating
poppy were significantly more likely to be situated on a hill (with worse soil quality) in North and South
Shan. Access to the public grid for lighting electricity was the lowest in poppy villages in East Shan and the
highest in non‐poppy villages in North Shan.
Figure 82: Spider chart showing the development gap between poppy and non‐poppy villages in South Shan
* The indicators for SDG2, SDG 5, SDG 8 and SDG 9 were changed in 2018 and therefore the values for these four indicators are not directly
comparable with the 2016 results. In 2018, there were insufficient data to update the estimate for SDG 1 and therefore the 2016 values
were used. See Appendix 1 for details.
0
0.2
0.4
0.6
0.8
1SDG 1: No poverty (normalized income)
SDG 2: No hunger (No food deficit)
SDG 3: Health (availability of clinic)
SDG 4: Education (availability of school)
SDG 5: Gender equality (wages differencebetween men and women)
SDG 6: Water and sanitation (availabilityof good quality water)
SDG 7: Energy (availability of publicelectricity)
SDG 8: Work (Easy access to market)
SDG 9: Infrastructure (availability ofasphalt roads)
SDG 10: Reduced inequalities (incomeallowing savings)
SDG 12: Responsible consumption (nocollecting forest wood for cooking)
SDG 13: Climate (no crop shocks relatedto climate change)
SDG15: Life on land (non‐deterioratedquality forest)
SDG 16: Peace and institutions (% villagesunder government control)
South Shan
Non‐opium‐poppy village Opium‐poppy village
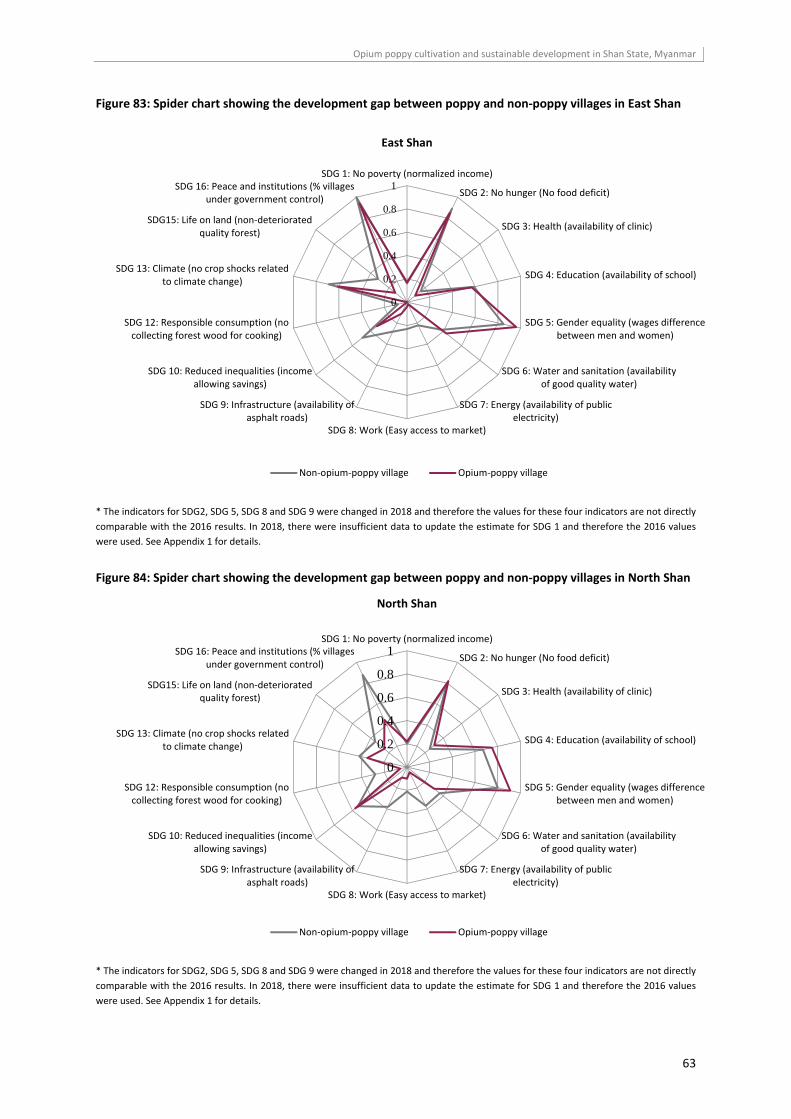
Opium poppy cultivation and sustainable development in Shan State, Myanmar
63
Figure 83: Spider chart showing the development gap between poppy and non‐poppy villages in East Shan
* The indicators for SDG2, SDG 5, SDG 8 and SDG 9 were changed in 2018 and therefore the values for these four indicators are not directly
comparable with the 2016 results. In 2018, there were insufficient data to update the estimate for SDG 1 and therefore the 2016 values
were used. See Appendix 1 for details.
Figure 84: Spider chart showing the development gap between poppy and non‐poppy villages in North Shan
* The indicators for SDG2, SDG 5, SDG 8 and SDG 9 were changed in 2018 and therefore the values for these four indicators are not directly
comparable with the 2016 results. In 2018, there were insufficient data to update the estimate for SDG 1 and therefore the 2016 values
were used. See Appendix 1 for details.
0
0.2
0.4
0.6
0.8
1SDG 1: No poverty (normalized income)
SDG 2: No hunger (No food deficit)
SDG 3: Health (availability of clinic)
SDG 4: Education (availability of school)
SDG 5: Gender equality (wages differencebetween men and women)
SDG 6: Water and sanitation (availabilityof good quality water)
SDG 7: Energy (availability of publicelectricity)
SDG 8: Work (Easy access to market)
SDG 9: Infrastructure (availability ofasphalt roads)
SDG 10: Reduced inequalities (incomeallowing savings)
SDG 12: Responsible consumption (nocollecting forest wood for cooking)
SDG 13: Climate (no crop shocks relatedto climate change)
SDG15: Life on land (non‐deterioratedquality forest)
SDG 16: Peace and institutions (% villagesunder government control)
East Shan
Non‐opium‐poppy village Opium‐poppy village
0
0.2
0.4
0.6
0.8
1SDG 1: No poverty (normalized income)
SDG 2: No hunger (No food deficit)
SDG 3: Health (availability of clinic)
SDG 4: Education (availability of school)
SDG 5: Gender equality (wages differencebetween men and women)
SDG 6: Water and sanitation (availabilityof good quality water)
SDG 7: Energy (availability of publicelectricity)
SDG 8: Work (Easy access to market)
SDG 9: Infrastructure (availability ofasphalt roads)
SDG 10: Reduced inequalities (incomeallowing savings)
SDG 12: Responsible consumption (nocollecting forest wood for cooking)
SDG 13: Climate (no crop shocks relatedto climate change)
SDG15: Life on land (non‐deterioratedquality forest)
SDG 16: Peace and institutions (% villagesunder government control)
North Shan
Non‐opium‐poppy village Opium‐poppy village

Opium poppy cultivation and sustainable development in Shan State, Myanmar
64
Opium poppy cultivation and sustainable development in Shan State, Myanmar
65
Conclusions and lessons learned: Addressing diversity for promoting and
enhancing resilience to opium poppy cultivation in Shan State
In 2018, poppy villages faced great challenges in terms of income poverty (see SDG1), as daily wages were
15‐30% lower than in non‐poppy villages. In addition, poppy growers cultivated less poppy area and fresh
opium prices declined by nearly 50% between 2016 and 2018. This provides an opportunity to encourage
farmers to switch to other, licit crops.
In general, there were large development gaps between poppy and non‐poppy villages: poppy villages had
a more limited access to health services (SDG 3), sanitation facilities (SDG 6), public grid access (SDG 7) and
communication technology (SDG 9). There was a significant improvement in the access to flush toilets and
asphalt roads in both poppy and non‐poppy villages between 2016 and 2018, but access to health services
remained low and unchanged.
East Shan had the highest proportion of poppy villages among the three regions in Shan State and, within
its poppy villages, 72% of the households were directly involved in poppy cultivation compared to 31% in
South Shan and 37% in North Shan. East Shan also has some of the most adverse conditions among poppy
villages in terms of, for example, travel time to clinics and schools (contributing to the highest levels of
uneducated village headmen), the proportion of households with debts, conditions for infrastructure
demonstrated by the high use of open‐air toilets, low availability of public electricity and asphalt roads.
Creating non‐poppy related jobs (SDG 8) would likely be most impactful in East Shan, as 40% of poppy
villages that stopped cultivating poppy here reported the availability of non‐poppy related jobs to be one
of the main reasons for ending their poppy cultivation.
Besides disparities in living quality, poppy villages were also more remote than non‐poppy villages in all
regions. This remoteness may deny them the same access to markets that non‐poppy villages enjoy (SDG
9). Market access can provide more favourable prices, which might make licit crops more attractive.
Connectivity is also important for providing access to non‐poppy related job opportunities, which are
lacking in poppy villages. Poppy growers may also prefer remoteness, as it is more difficult for law
enforcement to access the fields for eradication. On the other hand, farmers in remote areas might be in
greater need of cash, driving them into poppy cultivation. Poppy villages also had less asphalt roads than
non‐poppy villages. A lack of infrastructure affects access to clinics and schools (SDG 3 ‐ 4) for villages that
do not have them in the village itself, and it took longer to walk to them for those living in poppy villages.
Moving forward, improving connectivity and infrastructure will be necessary for development and poverty
reduction in the long term.
Generally, female daily wages were lower than male daily wages for similar work (SDG 5), denoting gender
inequalities in both types of villages.
A significantly higher proportion of non‐poppy villages were under government control than were poppy
villages (SDG 16). Governance and security continue to be found inversely associated with opium poppy
growing, as non‐opium poppy villages had better governance and enhanced security levels. It seems that
these low levels are a cause and a consequence of opium poppy cultivation. Opium poppy starts in villages
with relatively low levels of governance and security, and opium poppy cultivation decreases the
governance and security of the villages. Sustainable development without opium poppy cultivation
requires good governance and security to break the vicious circle of poverty, lack of opportunities and
insurgency, which are likely to be key components driving opium production.
The fear of law enforcement influences the decision of farmers to grow poppy and might suppress opium
cultivation in Shan State (SDG 16). However, the survey shows the continued need for an income for
subsistence. Although food deficits were relatively uncommon, most households in poppy villages relied
heavily on poppy income for food. Any abrupt loss of income from poppy without offering alternatives is
Opium poppy cultivation and sustainable development in Shan State, Myanmar
66
likely to cause food insecurity in many poppy villages (SDG 2). Over 80% of poppy villages reported a
decrease in income after stopping poppy cultivation. Opportunities that can help farmers maintain their
level of income after stopping poppy cultivation are needed to sustain the effort of poppy eradication. In
combination with a substantial decrease in the opium prices in Myanmar in recent years, there is an
opportunity to promote alternative income sources, such as licit cash crops and non‐farm job
opportunities.
Poppy villages depend more directly on natural resources than non‐poppy villages. For example, they were
more inclined to collect firewood for cooking (SDG 12) and reported a greater degradation of the local
forest quality (SDG 15). Although, on average, non‐poppy villages still reported better forest quality than
poppy villages, their forest quality had deteriorated as well. This suggests a need for implementing natural
resource awareness activities and management plans that consider the sustainable use of resources.
The analysis showed that East Shan had the lowest levels of development among the regions and the
highest levels of engagement in poppy cultivation. Efforts to attain the SDGs need to be accompanied by
enhanced resilience to opium poppy cultivation. This report is building an evidence base and sharing
lessons learned to further our understanding of the needs of poppy and non‐poppy villages across Shan
State, and their current SDG status. Further monitoring and evaluations must continue with these efforts
and focus on the relationship between poverty and opium poppy cultivation. The analysis should continue
to be complemented with disaggregated data at household level for a better understanding at the level of
the individual farmer.
While the SDGs are interlinked and interdependent, there are certain SDGs that are more urgent. The
evidence suggests that improvements in infrastructure and services can help reduce the costs of living in
opium poppy villages, and therefore decrease the dependency of those communities on opium poppy
income. This holds particularly true in East and North Shan as the development gaps between poppy and
non‐poppy villages were relatively large here. These improvements need to be accompanied by the
provision of income diversification opportunities, the strengthening of institutions and governance, as well
as the promotion of support to the rule of law.
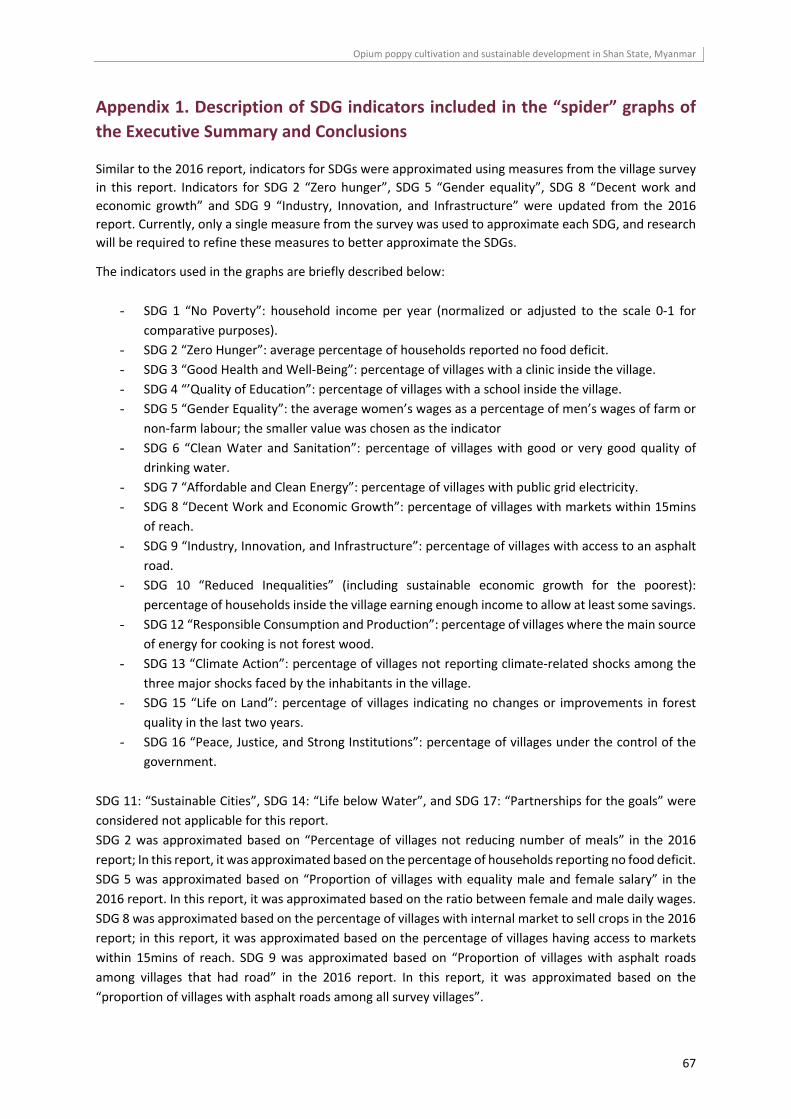
Opium poppy cultivation and sustainable development in Shan State, Myanmar
67
Appendix 1. Description of SDG indicators included in the “spider” graphs of
the Executive Summary and Conclusions
Similar to the 2016 report, indicators for SDGs were approximated using measures from the village survey
in this report. Indicators for SDG 2 “Zero hunger”, SDG 5 “Gender equality”, SDG 8 “Decent work and
economic growth” and SDG 9 “Industry, Innovation, and Infrastructure” were updated from the 2016
report. Currently, only a single measure from the survey was used to approximate each SDG, and research
will be required to refine these measures to better approximate the SDGs.
The indicators used in the graphs are briefly described below:
- SDG 1 “No Poverty”: household income per year (normalized or adjusted to the scale 0‐1 for
comparative purposes).
- SDG 2 “Zero Hunger”: average percentage of households reported no food deficit.
- SDG 3 “Good Health and Well‐Being”: percentage of villages with a clinic inside the village.
- SDG 4 “’Quality of Education”: percentage of villages with a school inside the village.
- SDG 5 “Gender Equality”: the average women’s wages as a percentage of men’s wages of farm or
non‐farm labour; the smaller value was chosen as the indicator
- SDG 6 “Clean Water and Sanitation”: percentage of villages with good or very good quality of
drinking water.
- SDG 7 “Affordable and Clean Energy”: percentage of villages with public grid electricity.
- SDG 8 “Decent Work and Economic Growth”: percentage of villages with markets within 15mins
of reach.
- SDG 9 “Industry, Innovation, and Infrastructure”: percentage of villages with access to an asphalt
road.
- SDG 10 “Reduced Inequalities” (including sustainable economic growth for the poorest):
percentage of households inside the village earning enough income to allow at least some savings.
- SDG 12 “Responsible Consumption and Production”: percentage of villages where the main source
of energy for cooking is not forest wood.
- SDG 13 “Climate Action”: percentage of villages not reporting climate‐related shocks among the
three major shocks faced by the inhabitants in the village.
- SDG 15 “Life on Land”: percentage of villages indicating no changes or improvements in forest
quality in the last two years.
- SDG 16 “Peace, Justice, and Strong Institutions”: percentage of villages under the control of the
government.
SDG 11: “Sustainable Cities”, SDG 14: “Life below Water”, and SDG 17: “Partnerships for the goals” were
considered not applicable for this report.
SDG 2 was approximated based on “Percentage of villages not reducing number of meals” in the 2016
report; In this report, it was approximated based on the percentage of households reporting no food deficit.
SDG 5 was approximated based on “Proportion of villages with equality male and female salary” in the
2016 report. In this report, it was approximated based on the ratio between female and male daily wages.
SDG 8 was approximated based on the percentage of villages with internal market to sell crops in the 2016
report; in this report, it was approximated based on the percentage of villages having access to markets
within 15mins of reach. SDG 9 was approximated based on “Proportion of villages with asphalt roads
among villages that had road” in the 2016 report. In this report, it was approximated based on the
“proportion of villages with asphalt roads among all survey villages”.

Opium poppy cultivation and sustainable development in Shan State, Myanmar
68
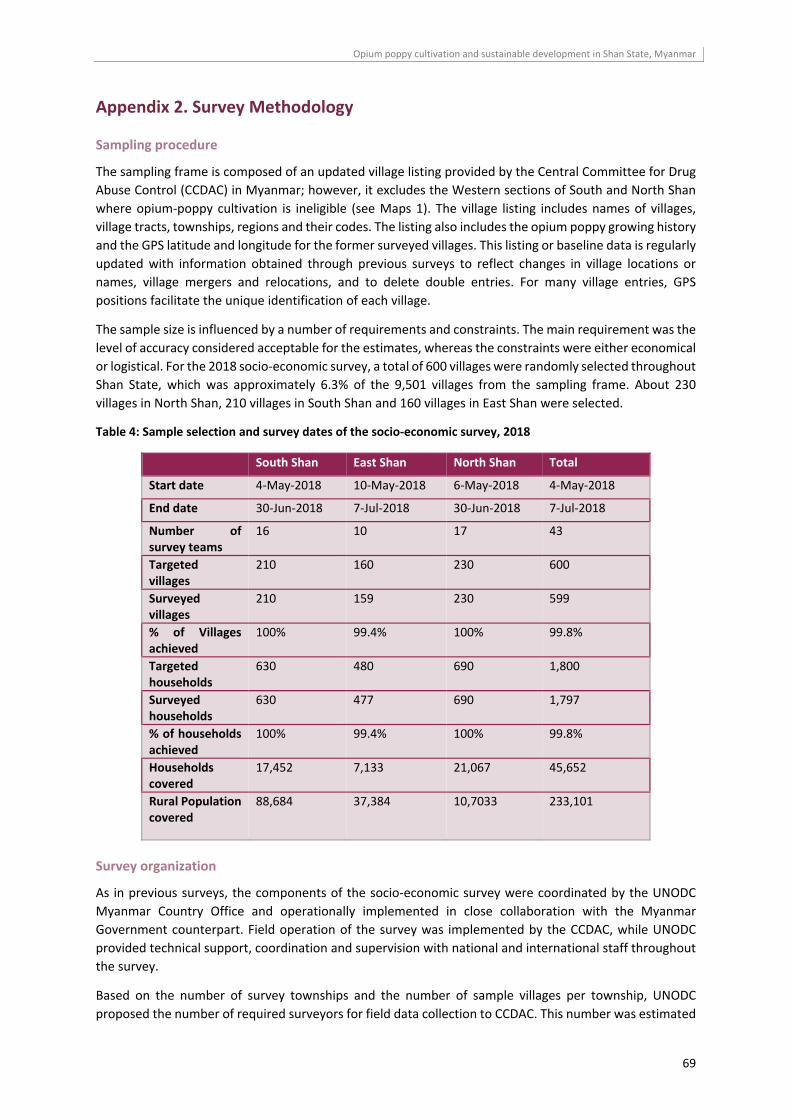
Opium poppy cultivation and sustainable development in Shan State, Myanmar
69
Appendix 2. Survey Methodology
Sampling procedure
The sampling frame is composed of an updated village listing provided by the Central Committee for Drug
Abuse Control (CCDAC) in Myanmar; however, it excludes the Western sections of South and North Shan
where opium‐poppy cultivation is ineligible (see Maps 1). The village listing includes names of villages,
village tracts, townships, regions and their codes. The listing also includes the opium poppy growing history
and the GPS latitude and longitude for the former surveyed villages. This listing or baseline data is regularly
updated with information obtained through previous surveys to reflect changes in village locations or
names, village mergers and relocations, and to delete double entries. For many village entries, GPS
positions facilitate the unique identification of each village.
The sample size is influenced by a number of requirements and constraints. The main requirement was the
level of accuracy considered acceptable for the estimates, whereas the constraints were either economical
or logistical. For the 2018 socio‐economic survey, a total of 600 villages were randomly selected throughout
Shan State, which was approximately 6.3% of the 9,501 villages from the sampling frame. About 230
villages in North Shan, 210 villages in South Shan and 160 villages in East Shan were selected.
Table 4: Sample selection and survey dates of the socio‐economic survey, 2018
South Shan East Shan North Shan Total
Start date 4‐May‐2018 10‐May‐2018 6‐May‐2018 4‐May‐2018
End date 30‐Jun‐2018 7‐Jul‐2018 30‐Jun‐2018 7‐Jul‐2018
Number of survey teams
16 10 17 43
Targeted villages
210 160 230 600
Surveyed villages
210 159 230 599
% of Villages achieved
100% 99.4% 100% 99.8%
Targeted households
630 480 690 1,800
Surveyed households
630 477 690 1,797
% of households achieved
100% 99.4% 100% 99.8%
Households covered
17,452 7,133 21,067 45,652
Rural Population covered
88,684 37,384 10,7033 233,101
Survey organization
As in previous surveys, the components of the socio‐economic survey were coordinated by the UNODC
Myanmar Country Office and operationally implemented in close collaboration with the Myanmar
Government counterpart. Field operation of the survey was implemented by the CCDAC, while UNODC
provided technical support, coordination and supervision with national and international staff throughout
the survey.
Based on the number of survey townships and the number of sample villages per township, UNODC
proposed the number of required surveyors for field data collection to CCDAC. This number was estimated
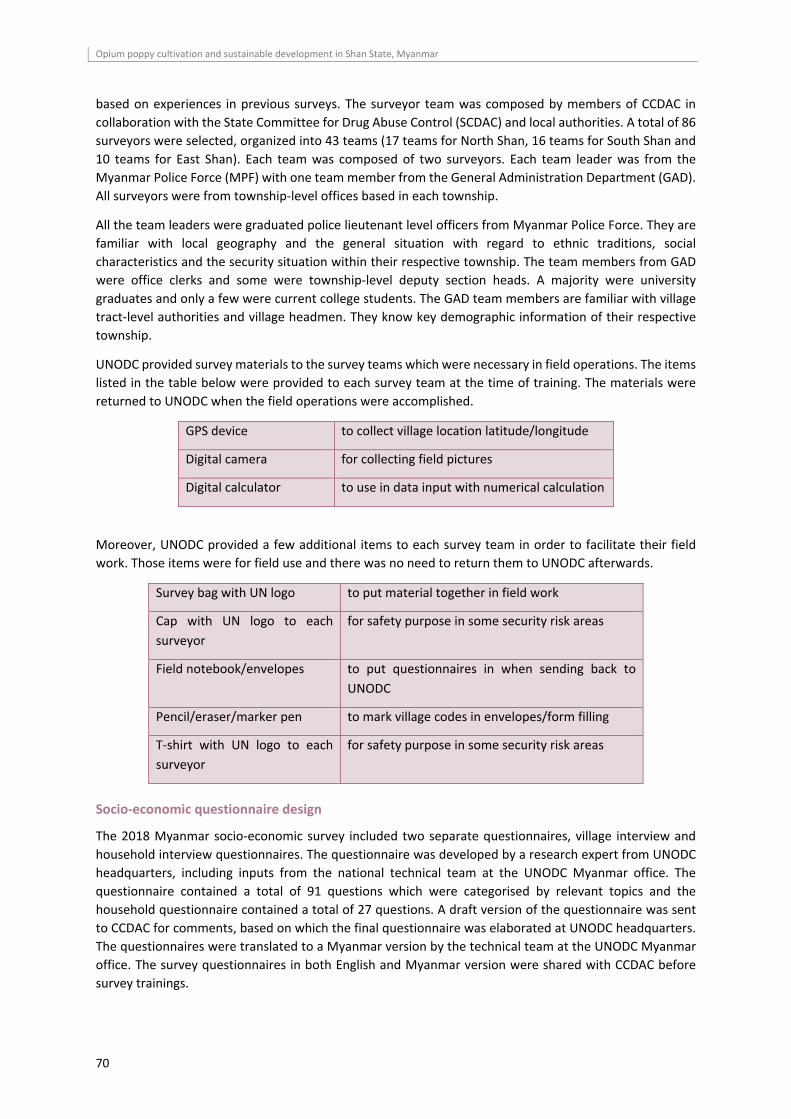
Opium poppy cultivation and sustainable development in Shan State, Myanmar
70
based on experiences in previous surveys. The surveyor team was composed by members of CCDAC in
collaboration with the State Committee for Drug Abuse Control (SCDAC) and local authorities. A total of 86
surveyors were selected, organized into 43 teams (17 teams for North Shan, 16 teams for South Shan and
10 teams for East Shan). Each team was composed of two surveyors. Each team leader was from the
Myanmar Police Force (MPF) with one team member from the General Administration Department (GAD).
All surveyors were from township‐level offices based in each township.
All the team leaders were graduated police lieutenant level officers from Myanmar Police Force. They are
familiar with local geography and the general situation with regard to ethnic traditions, social
characteristics and the security situation within their respective township. The team members from GAD
were office clerks and some were township‐level deputy section heads. A majority were university
graduates and only a few were current college students. The GAD team members are familiar with village
tract‐level authorities and village headmen. They know key demographic information of their respective
township.
UNODC provided survey materials to the survey teams which were necessary in field operations. The items
listed in the table below were provided to each survey team at the time of training. The materials were
returned to UNODC when the field operations were accomplished.
GPS device to collect village location latitude/longitude
Digital camera for collecting field pictures
Digital calculator to use in data input with numerical calculation
Moreover, UNODC provided a few additional items to each survey team in order to facilitate their field
work. Those items were for field use and there was no need to return them to UNODC afterwards.
Survey bag with UN logo to put material together in field work
Cap with UN logo to each
surveyor
for safety purpose in some security risk areas
Field notebook/envelopes to put questionnaires in when sending back to
UNODC
Pencil/eraser/marker pen to mark village codes in envelopes/form filling
T‐shirt with UN logo to each
surveyor
for safety purpose in some security risk areas
Socio‐economic questionnaire design
The 2018 Myanmar socio‐economic survey included two separate questionnaires, village interview and
household interview questionnaires. The questionnaire was developed by a research expert from UNODC
headquarters, including inputs from the national technical team at the UNODC Myanmar office. The
questionnaire contained a total of 91 questions which were categorised by relevant topics and the
household questionnaire contained a total of 27 questions. A draft version of the questionnaire was sent
to CCDAC for comments, based on which the final questionnaire was elaborated at UNODC headquarters.
The questionnaires were translated to a Myanmar version by the technical team at the UNODC Myanmar
office. The survey questionnaires in both English and Myanmar version were shared with CCDAC before
survey trainings.
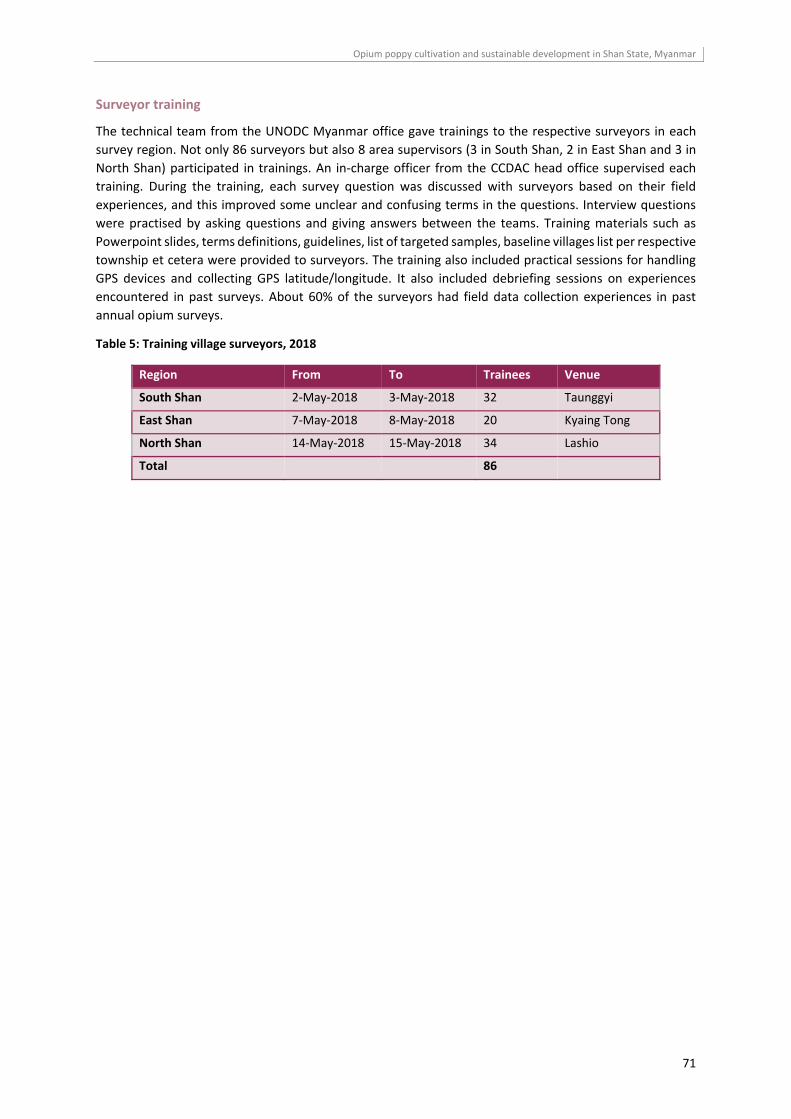
Opium poppy cultivation and sustainable development in Shan State, Myanmar
71
Surveyor training
The technical team from the UNODC Myanmar office gave trainings to the respective surveyors in each
survey region. Not only 86 surveyors but also 8 area supervisors (3 in South Shan, 2 in East Shan and 3 in
North Shan) participated in trainings. An in‐charge officer from the CCDAC head office supervised each
training. During the training, each survey question was discussed with surveyors based on their field
experiences, and this improved some unclear and confusing terms in the questions. Interview questions
were practised by asking questions and giving answers between the teams. Training materials such as
Powerpoint slides, terms definitions, guidelines, list of targeted samples, baseline villages list per respective
township et cetera were provided to surveyors. The training also included practical sessions for handling
GPS devices and collecting GPS latitude/longitude. It also included debriefing sessions on experiences
encountered in past surveys. About 60% of the surveyors had field data collection experiences in past
annual opium surveys.
Table 5: Training village surveyors, 2018
Region From To Trainees Venue
South Shan 2‐May‐2018 3‐May‐2018 32 Taunggyi
East Shan 7‐May‐2018 8‐May‐2018 20 Kyaing Tong
North Shan 14‐May‐2018 15‐May‐2018 34 Lashio
Total 86
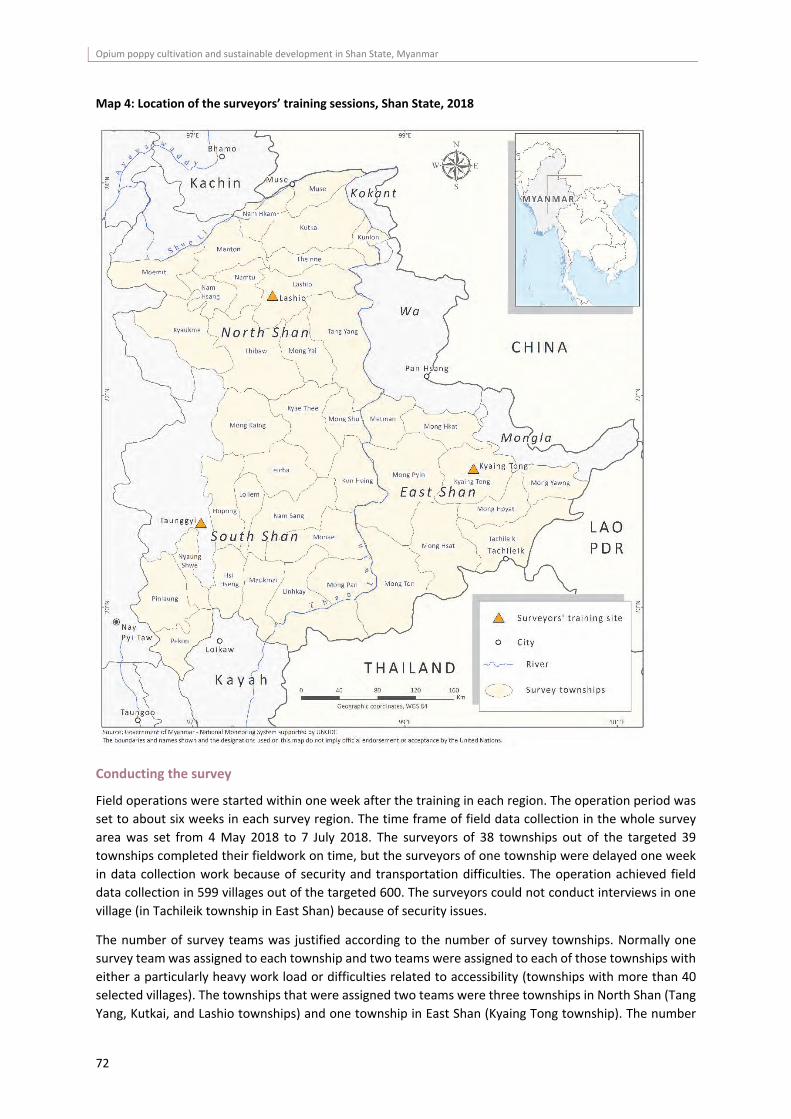
Opium poppy cultivation and sustainable development in Shan State, Myanmar
72
Map 4: Location of the surveyors’ training sessions, Shan State, 2018
Conducting the survey
Field operations were started within one week after the training in each region. The operation period was
set to about six weeks in each survey region. The time frame of field data collection in the whole survey
area was set from 4 May 2018 to 7 July 2018. The surveyors of 38 townships out of the targeted 39
townships completed their fieldwork on time, but the surveyors of one township were delayed one week
in data collection work because of security and transportation difficulties. The operation achieved field
data collection in 599 villages out of the targeted 600. The surveyors could not conduct interviews in one
village (in Tachileik township in East Shan) because of security issues.
The number of survey teams was justified according to the number of survey townships. Normally one
survey team was assigned to each township and two teams were assigned to each of those townships with
either a particularly heavy work load or difficulties related to accessibility (townships with more than 40
selected villages). The townships that were assigned two teams were three townships in North Shan (Tang
Yang, Kutkai, and Lashio townships) and one township in East Shan (Kyaing Tong township). The number
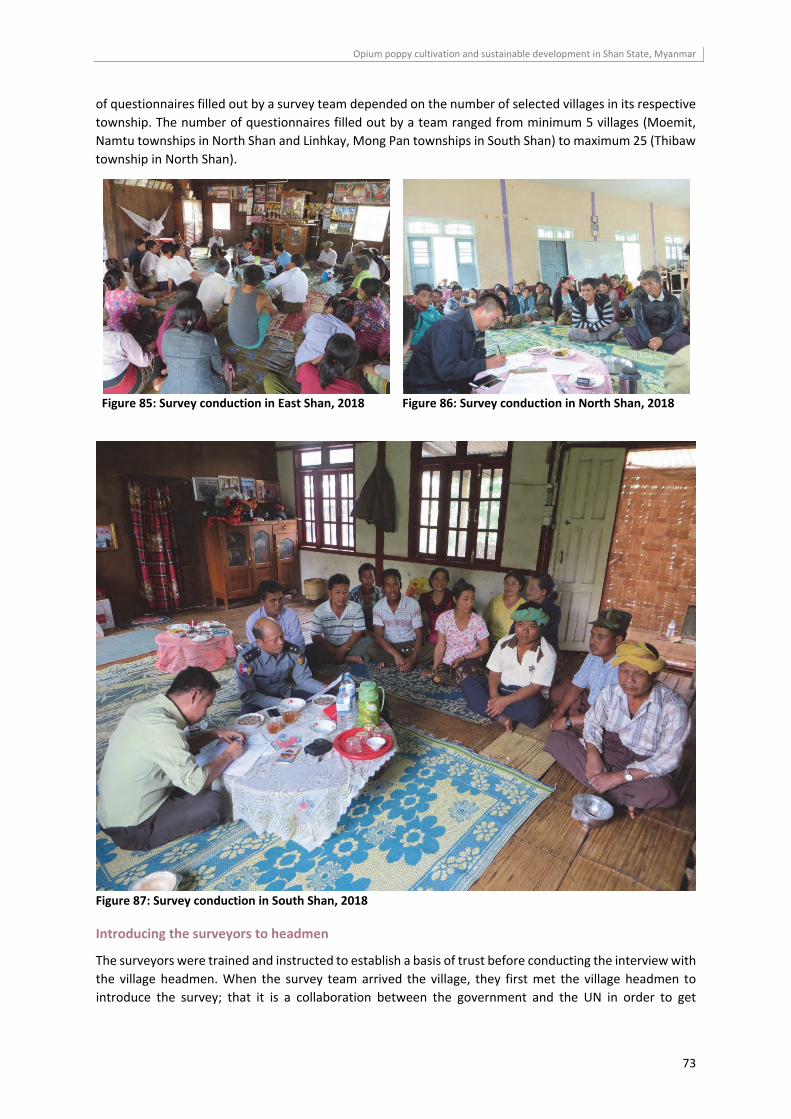
Opium poppy cultivation and sustainable development in Shan State, Myanmar
73
of questionnaires filled out by a survey team depended on the number of selected villages in its respective
township. The number of questionnaires filled out by a team ranged from minimum 5 villages (Moemit,
Namtu townships in North Shan and Linhkay, Mong Pan townships in South Shan) to maximum 25 (Thibaw
township in North Shan).
Figure 85: Survey conduction in East Shan, 2018 Figure 86: Survey conduction in North Shan, 2018
Figure 87: Survey conduction in South Shan, 2018
Introducing the surveyors to headmen
The surveyors were trained and instructed to establish a basis of trust before conducting the interview with
the village headmen. When the survey team arrived the village, they first met the village headmen to
introduce the survey; that it is a collaboration between the government and the UN in order to get
Opium poppy cultivation and sustainable development in Shan State, Myanmar
74
attention by the headmen. The team explained to the headmen the purposes of data collection, how
important the field data is for making planning regarding development concerns and the kinds of questions
which would be made in the interview. The team leader, a police officer, explained and pledged that the
answers would be protected and used only for analytical purpose to reflect the real situation. The surveyors
were trained to prepare answers corresponding with any possible questions by the headmen and villagers.
In order to ease the interviewing, and base on cultural norms in Myanmar, the surveyor team urged village
headmen to form a group of villagers including women who were interested and willing to attend the
interview. The size and formation of the group was not specifically defined.
After establishing a basis of trust between surveyors and the group, the interview was started. A majority
of the survey interviews took place at the house of village headmen or at the village monastery. One of the
survey team members asked questions and another wrote down the answers on the questionnaire form.
They recorded the village location ‐ latitude/longitude and field pictures ‐ and also crosschecked villagers’
answers with available information. The surveyors were instructed to write down the answers to the
questionnaire form in front of the villagers. Similarly, the survey team conducted household interviews
with the heads of selected households. Household interviews took place at the house of selected
household. Annual opium surveys were conducted for the last 10 years, and most of the village headmen
in survey regions had more or less already heard about this survey interview and they knew it did not cause
distress to villagers.
Data handling and collection
During the survey field operation time, the area supervisors monitored and checked survey teams’ field
work in their respective areas. There were three 8 area supervisors – 3 in South Shan, 2 in East Shan and 3
in North Shan. When the field data collection was completed, each team put the questionnaires in one A4
envelope per village tract and sealed it. All sealed A4 envelopes were put together into an A3 envelope and
sealed again. Each survey team sent the sealed A3 envelope/envelopes to the respective regional
supervisors who are heads of Drug Enforcement Units (former Anti‐Narcotic Task Forces) at Taunggyi in
South Shan, Lashio in North Shan and Kyaing Tong in East Shan. The survey materials were packaged and
sent along with the questionnaire envelopes to the region supervisors. The regional supervisors collected
the sealed envelopes and material packages sent by each survey team. Each regional supervisor prepared
a large package including the questionnaire envelopes and materials from his region and sent it to the
UNODC Myanmar office at Yangon. The surveyed questionnaires from 38 townships were received on time
but the questionnaires from one township (East Shan) were received two weeks later than targeted date
because of transportation difficulties.
Data entry, data cleaning and quality control
Data entry was conducted by UNODC technical team at the UNODC Myanmar office. Data entry was carried
out from 1 July to 14 August 2018. The technical team successively carried out data verification and data
cleaning. Whenever any confusing or unclear answer was observed, the technical team contacted the
respective survey teams and asked for clarification. After the data cleaning, the technical team prepared a
data tabulation as instructed by the research expert from UNODC headquarters. The full dataset of village
survey, an MS Excel table, contained 626 columns and 599 rows without blank cells. The full dataset of
household survey, another MS Excel table, contained 191 columns and 1,797 rows without blank cells. The
full dataset was shared with the CCDAC head office before data analysis. All statistical comparisons in the
analysis were done using a significance level of 0.05.
Opium poppy cultivation and sustainable development in Shan State, Myanmar
75
Limitations of the village survey
The main limitations in the data collection and analysis were:
- The socio‐economic interviews were conducted in groups that consisted of village headmen and villagers. It is unclear exactly how these groups were formed, and thus, whether the information obtained would be the same if individual households were chosen randomly.
- The data obtained were aggregated at the village level. The data collected cannot be used to draw conclusions about why individual people grow opium poppy or work in the poppy trade.
- This was the first instance of interviewing households for the Myanmar survey. It surveyed three households per village (not random, but convenience selection). Based on these initial results and on the feedback from surveyors (i.e., on how difficult is to collect the data, among others), a more random household sampling can be proposed for the next years.
- The interviewers were trained and instructed to establish a basis of trust before conducting the interview. However, since law enforcement was part of the group, a certain effect on the interview answers cannot be excluded (“social desirability” or reluctance to talk freely about illicit activities).

Opium poppy cultivation and sustainable development in Shan State, Myanmar
76
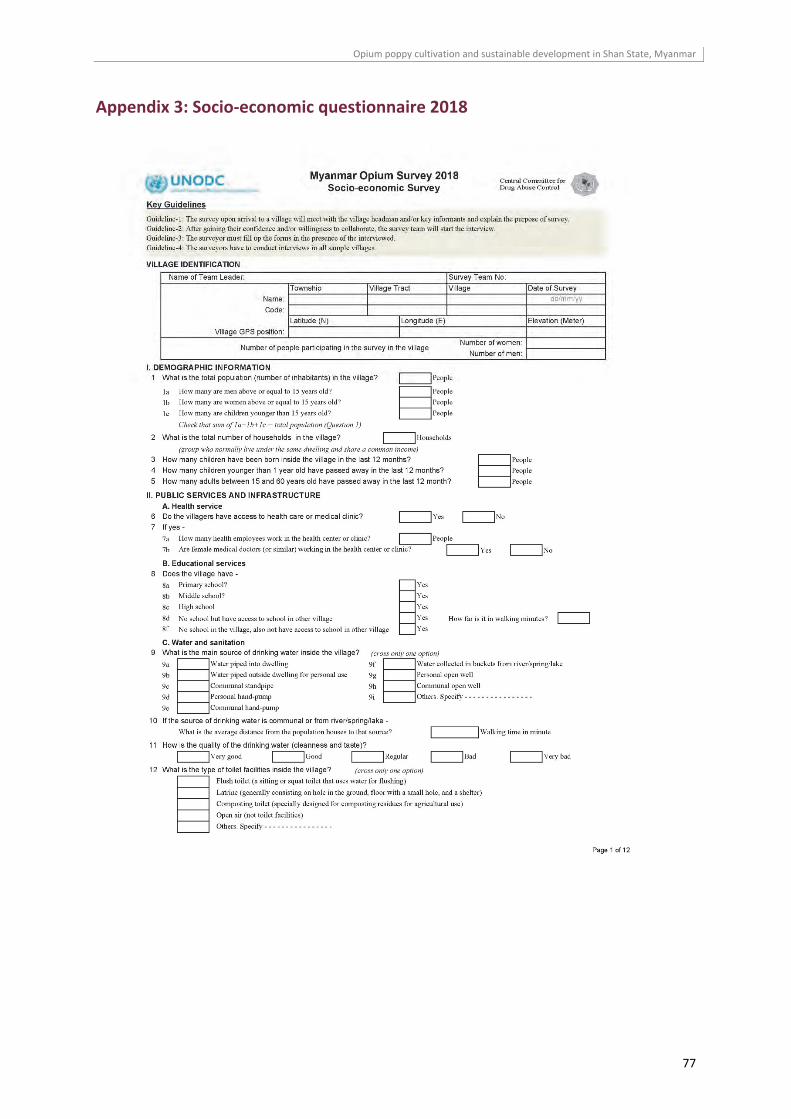
Opium poppy cultivation and sustainable development in Shan State, Myanmar
77
Appendix 3: Socio‐economic questionnaire 2018
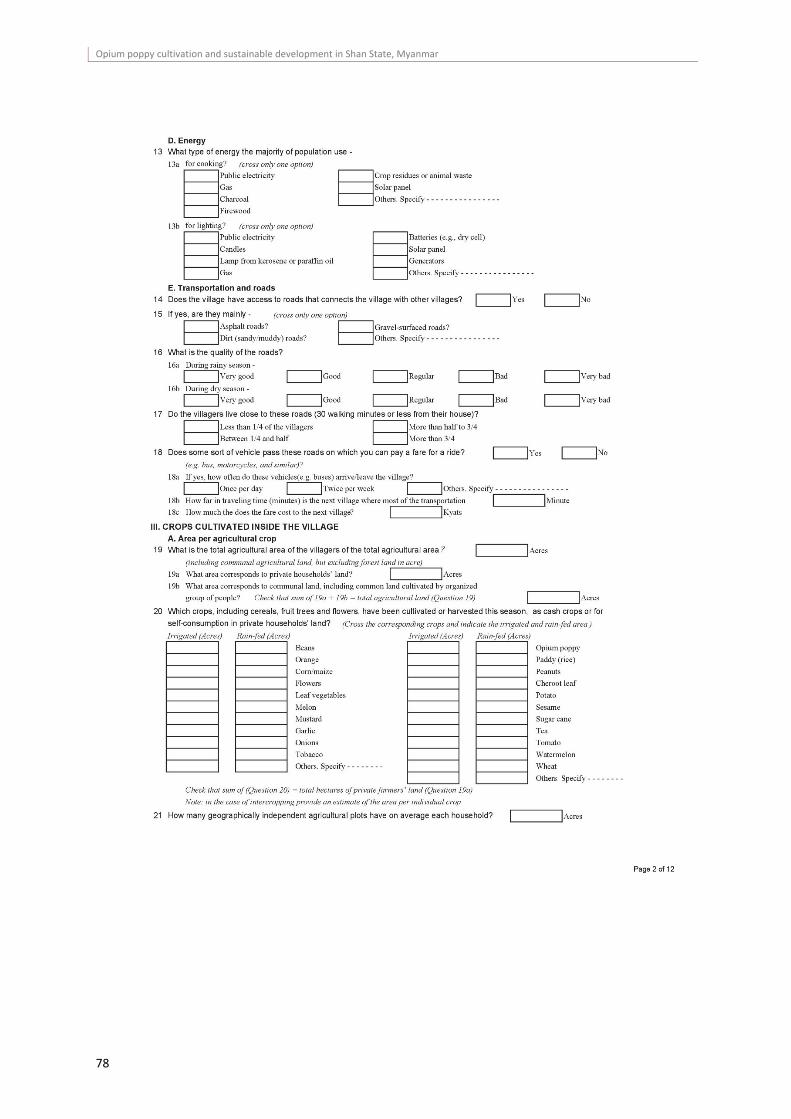
Opium poppy cultivation and sustainable development in Shan State, Myanmar
78
Opium poppy cultivation and sustainable development in Shan State, Myanmar
79
Opium poppy cultivation and sustainable development in Shan State, Myanmar
80
Opium poppy cultivation and sustainable development in Shan State, Myanmar
81
Opium poppy cultivation and sustainable development in Shan State, Myanmar
82
Opium poppy cultivation and sustainable development in Shan State, Myanmar
83
Opium poppy cultivation and sustainable development in Shan State, Myanmar
84
Opium poppy cultivation and sustainable development in Shan State, Myanmar
85
Opium poppy cultivation and sustainable development in Shan State, Myanmar
86
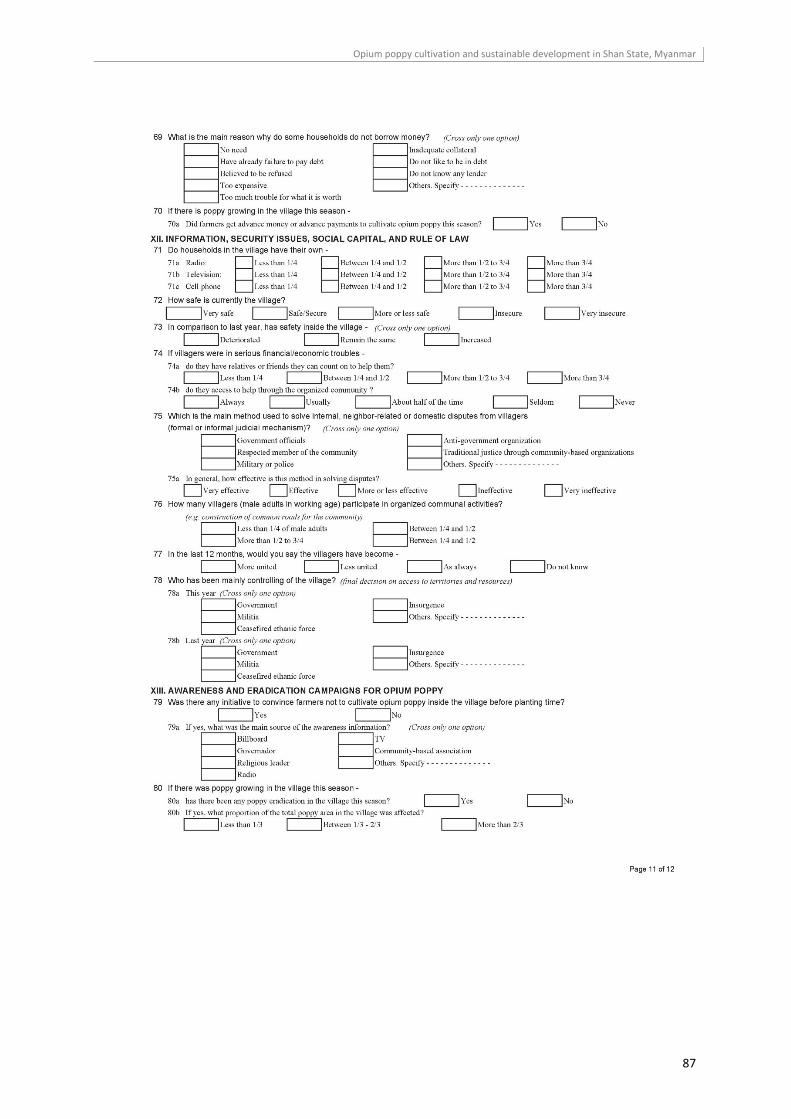
Opium poppy cultivation and sustainable development in Shan State, Myanmar
87
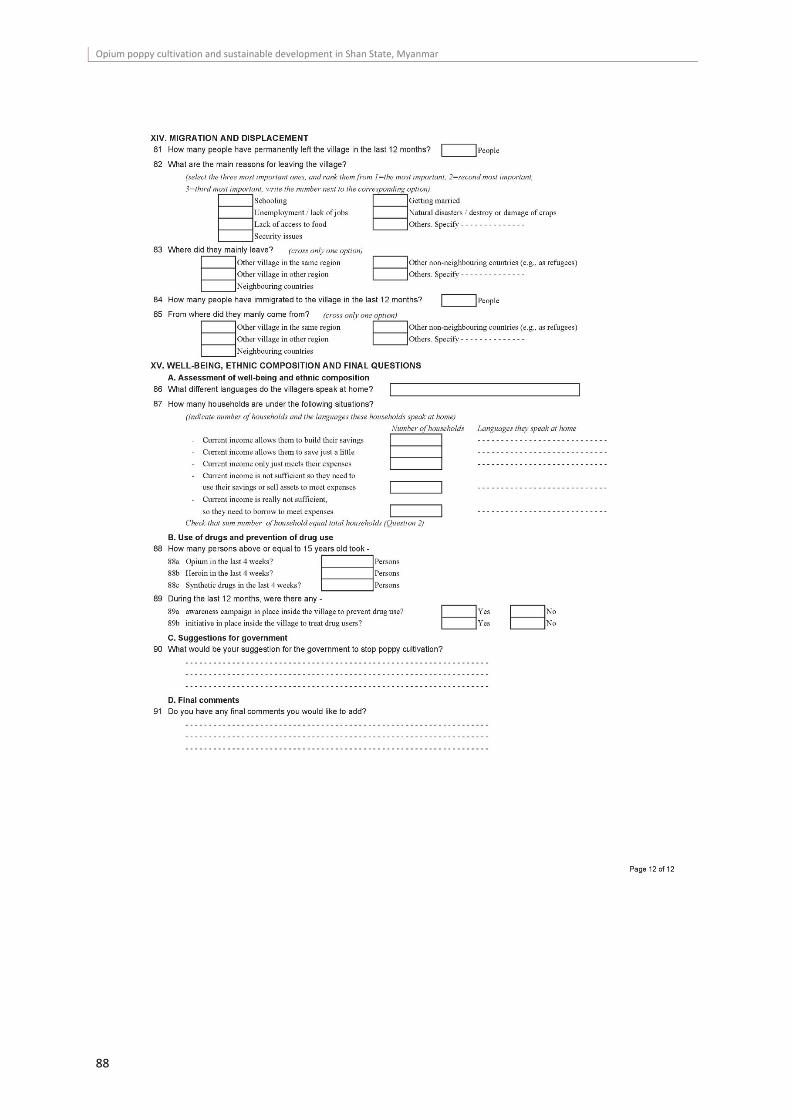
Opium poppy cultivation and sustainable development in Shan State, Myanmar
88
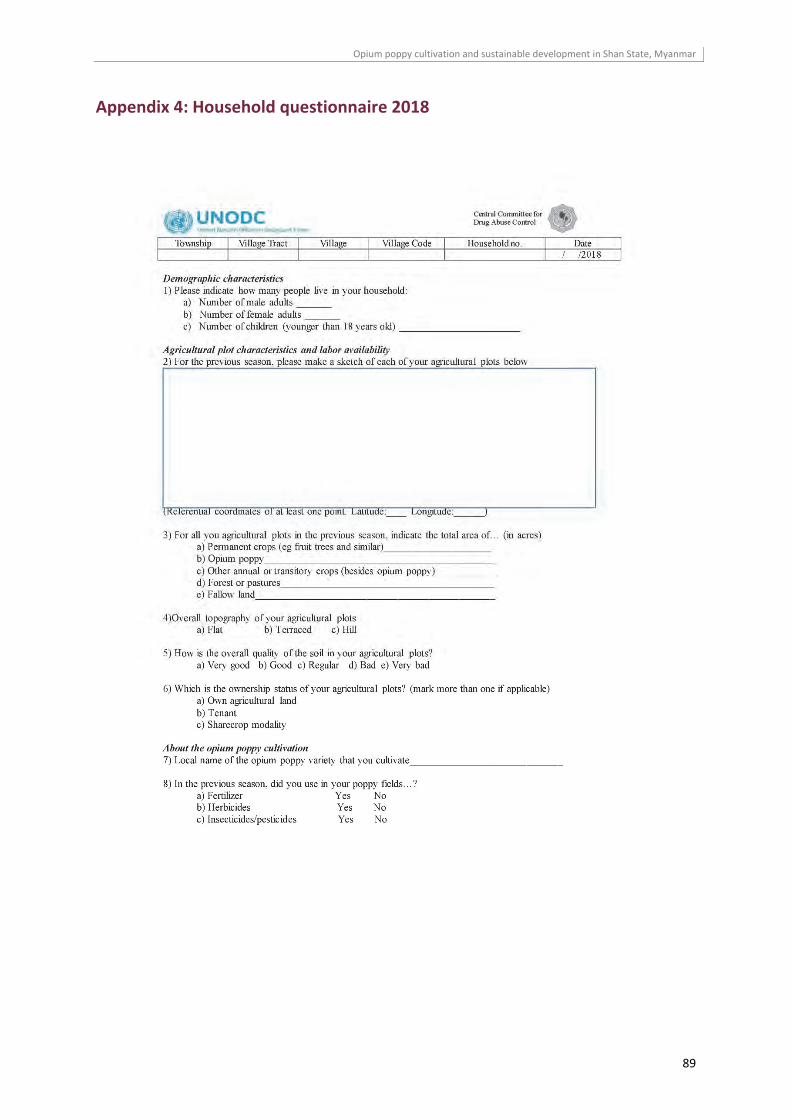
Opium poppy cultivation and sustainable development in Shan State, Myanmar
89
Appendix 4: Household questionnaire 2018
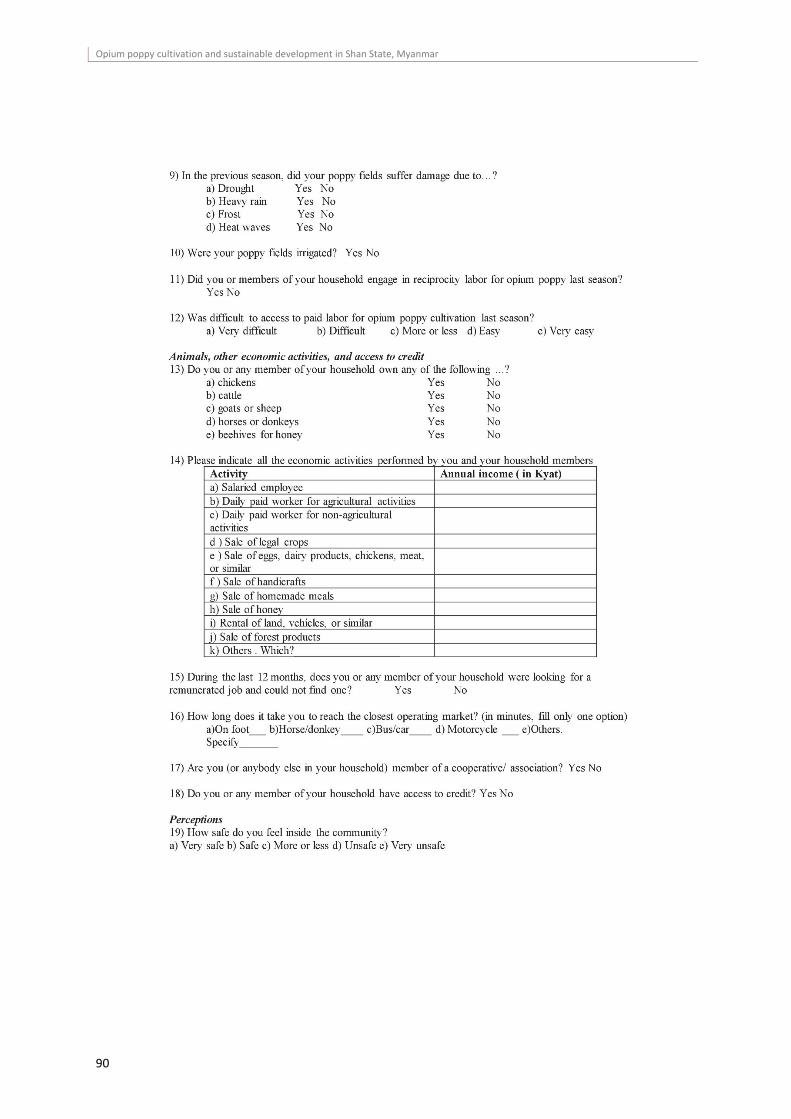
Opium poppy cultivation and sustainable development in Shan State, Myanmar
90
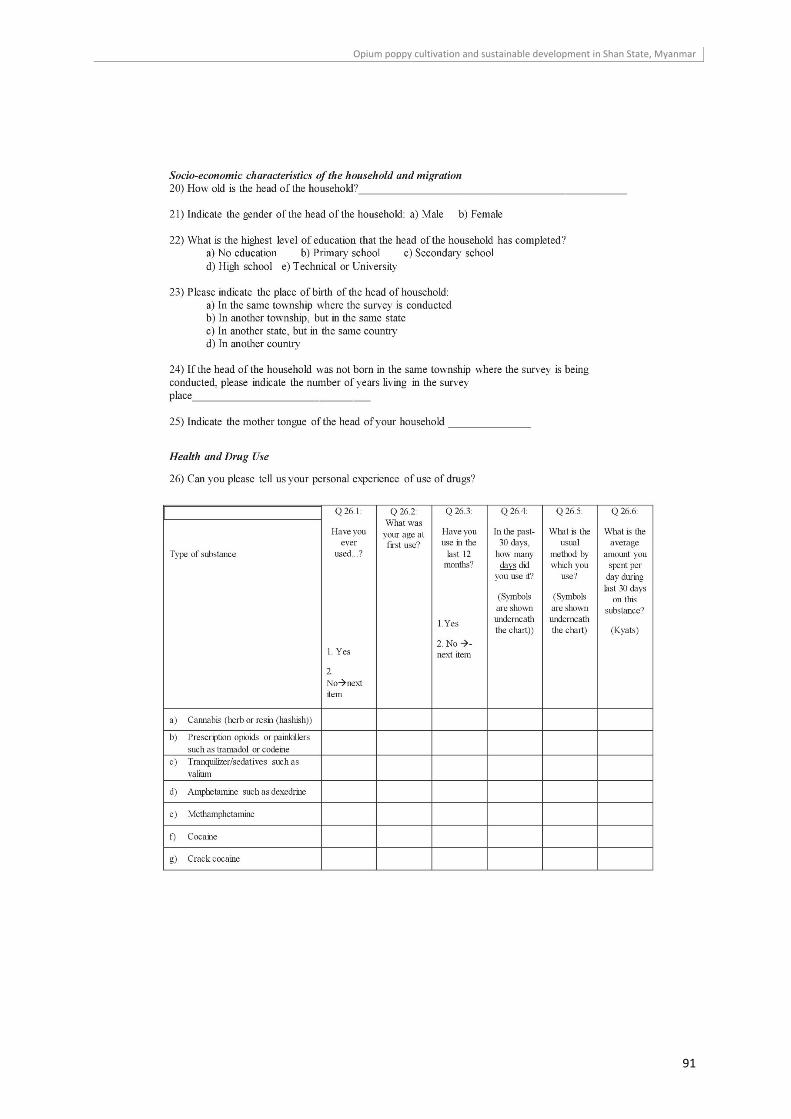
Opium poppy cultivation and sustainable development in Shan State, Myanmar
91
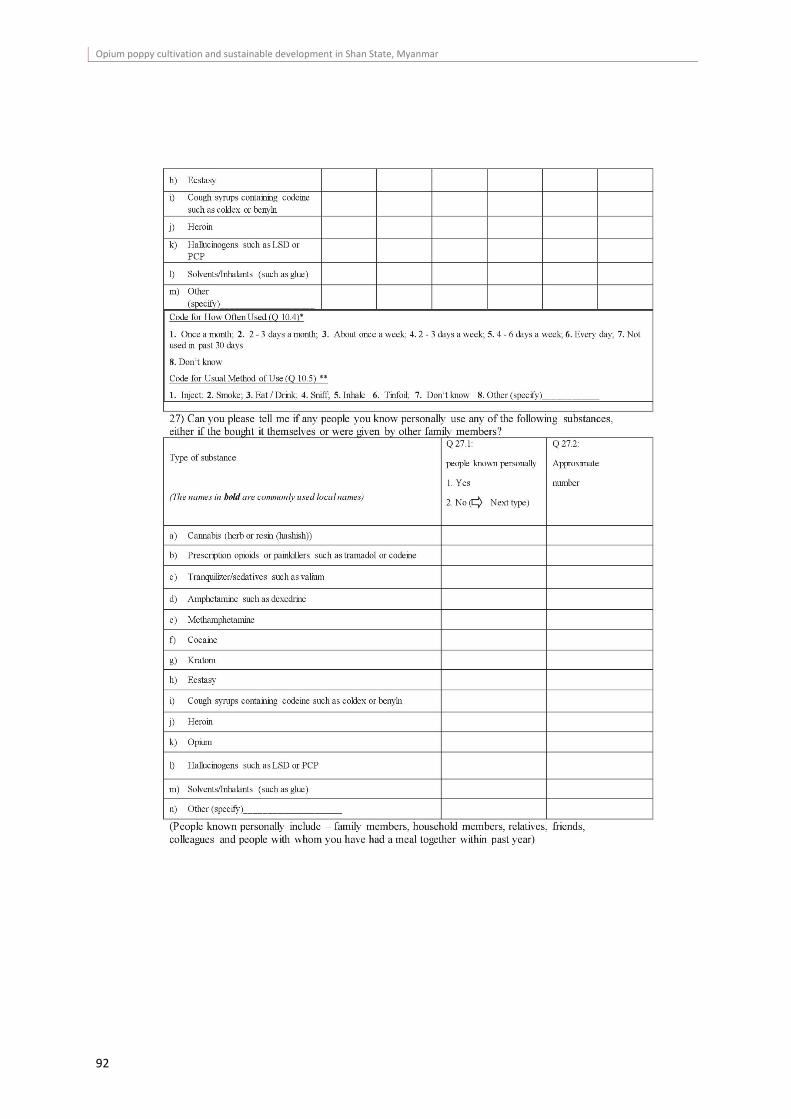
Opium poppy cultivation and sustainable development in Shan State, Myanmar
92


Vienna International Centre, PO Box 500, 1400 Vienna, Austria Tel.: (+43-1) 26060-0, Fax: (+43-1) 26060-5866, www.unodc.org
Op
ium
po
pp
y cultivatio
n an
d su
stainab
le develo
pm
ent in
Sh
an S
tate, Myan
mar
2019


