Embed Size (px)
Citation preview

Appl Phys BDOI 10.1007/s00340-010-4022-x
Optical characterization of photopolymers materials:theoretical and experimental examination of primaryradical generation
S. Liu · M.R. Gleeson · J. Guo · J.T. Sheridan
Received: 16 November 2009 / Revised version: 29 January 2010© Springer-Verlag 2010
Abstract Several studies of the time varying photon ab-sorption effects, which occur during the photo-initiationprocess in photopolymer materials, have been presented.Three primary mechanisms have been identified: (i) the dyeabsorption, (ii) recovery, and (iii) bleaching. Based on ananalysis of these mechanisms, the production of primaryradicals can be physically described and modelled. In freeradical photo-polymerization systems, the excited dye mole-cules induce the production of the primary radicals, R•,which is a key factor in determining how much monomeris polymerized. This, in turn, is closely related to the refrac-tive index modulation formed during holographic recording.In this article, by modifying the composition of a polyviny-lalcohol/acrylamide based photopolymer material, i.e. ex-cluding any co-initiator, the photo-kinetic behaviour of thematerial is greatly simplified. In this way, the rate constantof intersystem crossing, kst, in going from the excited sin-glet state dye to the excited triple state dye can be deter-mined. kst is then available to be applied in a full model ofthe photo-initiation process making it possible to accuratelypredict the time varying concentration of primary radicalsgenerated during exposure.
S. Liu · M.R. Gleeson · J. Guo · J.T. Sheridan (�)School of Electrical, Electronic and Mechanical Engineering,Communications and Optoelectronic Research Centre,SFI Strategic Research Cluster in Solar Energy Conversion,College of Engineering, Mathematical and Physical Sciences,University College Dublin, Belfield, Dublin 4, Republic of Irelande-mail: [email protected]: +353-1-2830921
1 Introduction
Photopolymer materials have recently received a great dealof attention in areas such as holographic data storage [1, 2],hybrid optoelectronics and self-trapping of light [3–9]. Pho-topolymer materials are the recording media of choice be-cause of their ability to record low loss, environmentallystable holographic gratings. Along with this growing inter-est in applications involving photo-polymerization there hasdeveloped a need for a comprehensive and physically realis-tic theoretical representation.
Several models of the photochemical kinetics occurringduring the photo-initiation processes have been proposedthat describe the time varying photo-absorptive behaviourof various photosensitive dyes [10–14]. These models, de-scribing the temporal variation of the photosensitizer (dye)concentration in a polyvinylalcohol/acrylamide (PVA/AA)based photopolymer, as a function of exposure have been ap-plied to characterize two different types of photosensitizer,Methylene Blue and Erythrosine B [11, 12]. In a recentlyproposed model of this material, in order to simplify themodelling of intersystem crossing from the excited singletstate dye to the excited triplet state dye, a bulk parameter,Ψ , was introduced [12]. It was assumed that during expo-sure a constant fraction Ψ of the ground state molecules arealways available to be converted into the singlet state, while(1 −Ψ ) of them are available to be converted into the tripletexcited state.
In order to overcome the limitations of this model, a morephysical representation of intersystem crossing, occurring ata rate constant, kst, is necessary. To find this rate constant,we first simplify the material composition, and using an ap-propriate model estimate its value experimentally. In thisway, the generation of primary radicals can be more cor-rectly modelled as part of the full photo-initiation processes,with kst appropriately included.
S. Liu et al.
This paper is organized as follows. In Sect. 2, we beginby examining the photochemical process, in the case whenthe co-initiator, i.e. Electron Donor, ED, is not included inthe standard PVA/AA photopolymer material composition[10–16]. This is done in order to reduce the complexity ofthe photo-initiation process, and therefore to permit an esti-mation of the rate of inter-system crossing, kst. A flow chartis also presented that succinctly summarizes the correspond-ing chemical reactions. In Sect. 3, the photo-absorptive be-haviour of two types of photosensitizer, Methylene Blue(MB) and Erythrosine B (EB), of the same molarity in equiv-alent PVA/AA layers without the electron donor present,are experimentally examined. In Sect. 4, the full theoret-ical model of the photo-initiation processes, including kst,is presented. The resulting predictions are validated using arange of experimental results preformed with the standardPVA/AA composition (i.e. with ED included). Finally, inSect. 5, a brief conclusion is given.
2 Analysis of the photochemical processes
During free-radical photo-polymerization, the strength ofthe grating formed during holographic recording depends ongenerating sufficient photo-initiation, i.e. production of ini-tializing radicals, R•. In previous work [12], due to the dif-ficulty of modelling intersystem crossing, only approximateestimates of the singlet and the triplet state dye concentra-tion could be made. In this paper, we start from an alterna-tive perspective: we begin by simplifying the PVA/AA mate-rial composition, thus reducing the complexity of the modelneeded to describe the photo-kinetics. In order to analysethe photo-initiation processes, the resulting simplified dyekinetics is presented using a flow chart presented in Fig. 1.All possible reactions which can take place in the absenceof the electron donor, ED, are listed.
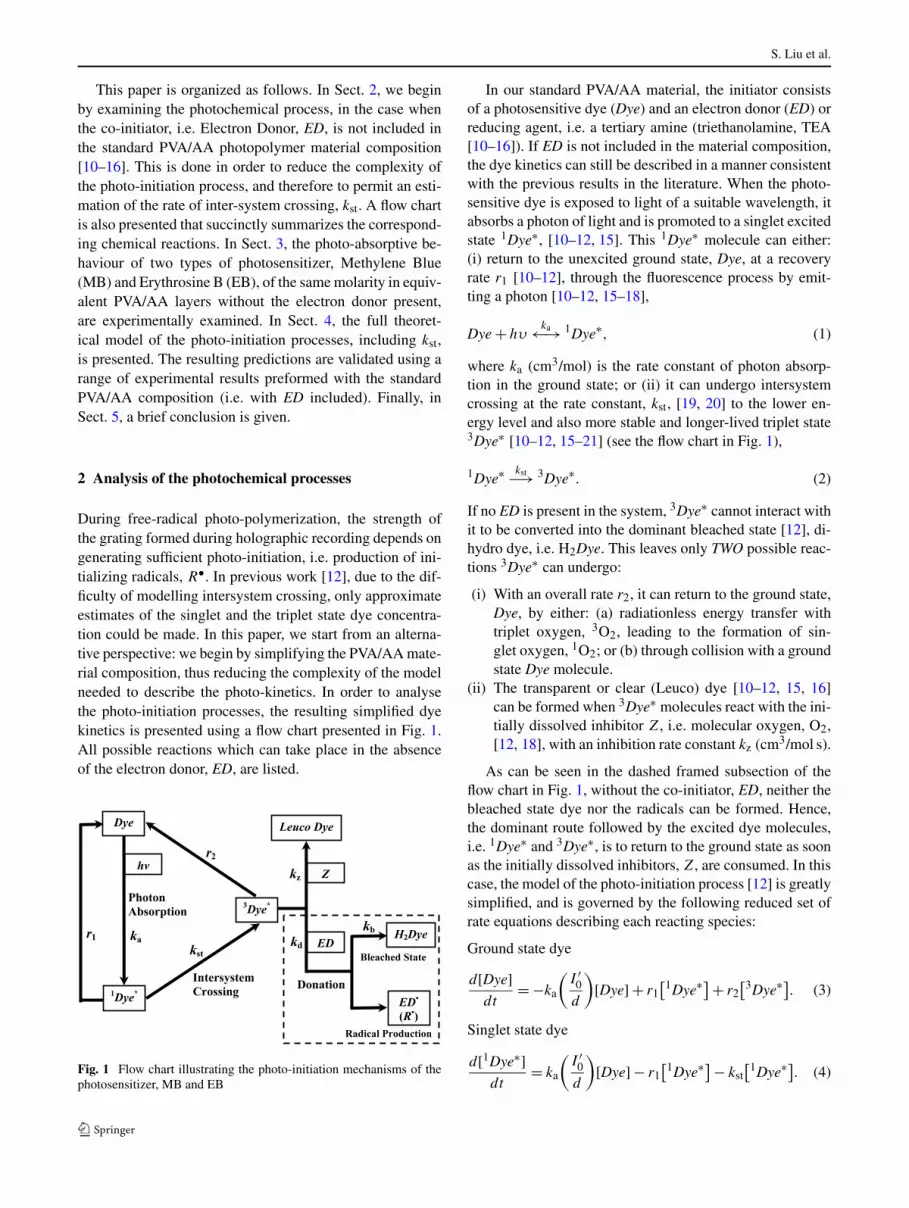
Fig. 1 Flow chart illustrating the photo-initiation mechanisms of thephotosensitizer, MB and EB
In our standard PVA/AA material, the initiator consistsof a photosensitive dye (Dye) and an electron donor (ED) orreducing agent, i.e. a tertiary amine (triethanolamine, TEA[10–16]). If ED is not included in the material composition,the dye kinetics can still be described in a manner consistentwith the previous results in the literature. When the photo-sensitive dye is exposed to light of a suitable wavelength, itabsorbs a photon of light and is promoted to a singlet excitedstate 1Dye∗, [10–12, 15]. This 1Dye∗ molecule can either:(i) return to the unexcited ground state, Dye, at a recoveryrate r1 [10–12], through the fluorescence process by emit-ting a photon [10–12, 15–18],
Dye + hυka←→ 1Dye∗, (1)
where ka (cm3/mol) is the rate constant of photon absorp-tion in the ground state; or (ii) it can undergo intersystemcrossing at the rate constant, kst, [19, 20] to the lower en-ergy level and also more stable and longer-lived triplet state3Dye∗ [10–12, 15–21] (see the flow chart in Fig. 1),
1Dye∗ kst−→ 3Dye∗. (2)
If no ED is present in the system, 3Dye∗ cannot interact withit to be converted into the dominant bleached state [12], di-hydro dye, i.e. H2Dye. This leaves only TWO possible reac-tions 3Dye∗ can undergo:
(i) With an overall rate r2, it can return to the ground state,Dye, by either: (a) radiationless energy transfer withtriplet oxygen, 3O2, leading to the formation of sin-glet oxygen, 1O2; or (b) through collision with a groundstate Dye molecule.
(ii) The transparent or clear (Leuco) dye [10–12, 15, 16]can be formed when 3Dye∗ molecules react with the ini-tially dissolved inhibitor Z, i.e. molecular oxygen, O2,[12, 18], with an inhibition rate constant kz (cm3/mol s).
As can be seen in the dashed framed subsection of theflow chart in Fig. 1, without the co-initiator, ED, neither thebleached state dye nor the radicals can be formed. Hence,the dominant route followed by the excited dye molecules,i.e. 1Dye∗ and 3Dye∗, is to return to the ground state as soonas the initially dissolved inhibitors, Z, are consumed. In thiscase, the model of the photo-initiation process [12] is greatlysimplified, and is governed by the following reduced set ofrate equations describing each reacting species:
Ground state dye
d[Dye]dt
= −ka
(I ′
0
d
)[Dye] + r1
[1Dye∗] + r2[3Dye∗]. (3)
Singlet state dye
d[1Dye∗]dt
= ka
(I ′
0
d
)[Dye] − r1
[1Dye∗] − kst[1Dye∗]. (4)
Optical characterization of photopolymers materials: theoretical and experimental examination
Triplet state dye
d[3Dye∗]dt
= kst[1Dye∗] − r2
[3Dye∗] − kz[3Dye∗][Z]. (5)
Inhibitor
d[Z]dt
= −kz[3Dye∗][Z]. (6)
Bleached or Leuco dye
dAb(t)
dt= kz
[3Dye∗][Z]. (7)
Recovered dye
dAr(t)
dt= r1
[1Dye∗] + r2[3Dye∗]. (8)
In (3) and (4) I ′0 = I0(
λNahc
)Tsf (Einstein/cm2 s), where
I0 (mW/cm2) is the incident intensity, λ (nm) is the wave-length of the incident light, Na (mol−1) is Avogadro’s con-stant, c (m/s) is the speed of light, h (J s) is Plank’s con-stant and Tsf is the correction factor to account for Fresneland scattering losses [10–12]. In order to model the photo-initiation processes in the simplified material which containsno ED, the following modifications to the standard materialmodel [15] are as follows:
(1) In (3)–(5): When the ground state dye molecule inter-acts with a photon, it will only be converted into thesinglet state, i.e. the generation of 1Dye∗. 1Dye∗ is thenremoved at the rate constant of intersystem crossing, kst,leading to the generation of 3Dye∗.
(2) In (6) and (7): The initially dissolved inhibitors, Z, nowonly react with 3Dye∗, to form another bleached dyestate, Leuco dye [10–12, 15, 16].
(3) In (8): The regenerated (or recovered) dye concentra-tion, Ar(t), is represented as a combination of the re-covered singlet and triplet dye concentrations, whichare generated at rates r1, r2. The absence of ED fromthe PVA/AA system, could possibly affect the valuesof these recovery rates r1 and r2. It is plausible thatbecause of: (a) the elimination of radiationless energytransfer [10–12, 15, 16] between 1Dye∗ and ED, r1
might be increased, i.e. fewer mechanisms are availablefor 1Dye∗ to returns to Dye; (b) furthermore, the exclu-sion of the electron donation [10–12, 15, 16] between3Dye∗ and ED, means that much more 3Dye∗ will returnto the ground state, Dye. Consequently, the collisionsbetween these excited triplet dye molecules, 3Dye∗, be-comes dominant, since they do not interact with the EDmolecules. Therefore, the change in the recovery mech-anism for 3Dye∗ might increase r2 significantly. This is-sue is discussed in more detail in the following sections.
In the next section, the predictions of this simplifiedmodel of the photo-initiation process when no ED is presentare examined.
3 Model validation by experiment
In order to demonstrate the validity of the model and de-termine the rate of intersystem crossing, kst, experimentsare performed to determine the photo-absorptive behaviourof two common types of photosensitive dye used in thePVA/AA material, i.e. Erythrosine B (EB) and MethyleneBlue (MB).
A standard experimental setup is used [10–12, 22, 23].A normally incident plane wave exposes the photopolymermaterial layer of thickness, d ≈ 100 µm, and simultaneouslythe time evolution of the transmission curve is monitored.An incident intensity, I0 = 4 mW/cm2 converted to the ap-propriate units of Einstein/cm2 s, [10–12] is used for botha wavelength of λ = 532 nm for EB, and λ = 633 nm forMB, and for exposures of duration, texp = 350 s. Each expo-sure was repeated at least three times in order to test repro-ducibility. We recall that for the results presented here, theelectron donor, i.e. triethanolamine (TEA), is not included.In the standard PVA/AA material (see Table 3 in [23]), theelectron donor (TEA) makes up approximately 48.6% ofthe total volume. Therefore, simply removing the electrondonor causes a relative increase in the initial photosensi-tizer concentration [11, 12] in the layer, i.e. A0 is almosttwice as larger as in the original material. Hence, mater-ial layers of the same thickness have a stronger initial ab-sorbance. We note that, in the cases studied here, A0(EB) =2.44×10⁻⁶ mol/cm3, and A0(MB) = 4.22×10⁻⁶ mol/cm3.
The light incident upon the photopolymer material layer,after correcting for the scattering and Fresnel losses, can bebroken down into: (i) the light that is absorbed, Ia(t), whichis described using the Lambert–Beer law [10–12, 21–23];and (ii) the light that is transmitted, IT(t), i.e. I0Tsf = Ia(t)+IT(t), where Tsf the transmission fraction which corrects forthe boundary and scatter losses. The normalized transmit-tance, T (t) = IT(t)/I0, can then be expressed as:
T (t) = Tsf exp[−εA(t)d
], (9)
where εEB = 1.42 × 108 cm2/mol and εMB = 7.89 ×107 cm2/mol are the molar absorption coefficients previ-ously estimated in the literature [11]; and A(t) is the vary-ing concentration of ground state dye, i.e. [Dye], which isavailable for photon absorption, which can be found us-ing (3). T (t) in (9) can be numerically fit to the experimentaltransmission data. Typical examples are presented in Figs. 2and 3. Examining these figures, we see that:

S. Liu et al.
Fig. 2 Fits to the experimental data of normalized transmission curvefor EB (with no ED)
Fig. 3 Fits to the experimental data of normalized transmission curvefor MB (with no ED)
(i) The initial transmission T0 at t = 0 is reduced from thestandard transmission curve (i.e. T0 ≈ 0.2 when ED isincluded, see Fig. 2(a) in [11]), due to the fact that theinitial photosensitizer concentration A0 is increased.
(ii) The steady state value at which the transmission satu-rates, Tsat, is also significantly reduced compared to thestandard transmission curve (i.e. Tsat ≈ Tsf ≈ 0.76 whenED is included), and the time taken for the transmis-sion to reach its saturated value, Tsat, is much longer(i.e. texp = 150 s for I0 = 4 mW/cm2 when ED is in-cluded). As discussed above, many more 3Dye∗ mole-cules are generated in this system, which are availableto recover rather than be transformed into the bleachedstate, H2Dye, due to the absence of ED. This indicatesthat the energy transfer from 3Dye∗ to 3O2 (initiallydissolved and also continuously diffusing in from theboundary when the layer is not cover plated during ex-posure) has become quite active [24],
3Dye∗ + 3O2 → Dye + 1O2. (10)
However, 3Dye∗ can also quench 1O2 to become a cou-pled species, i.e. a primary couple [24], which can bringthe triplet dye back into the singlet state, presented bythe following reaction in (11),
3Dye∗ + 1O2 → 1Dye∗ − 3O2. (11)
This mechanism results in the production of extra sin-glet state dye molecules, hence the fluorescence processis more active, i.e. decomposition of 1Dye∗ − 3O2 pro-duces an extra contribution to the recovery mechanismof 1Dye∗ which returns it to Dye [11, 12],
1Dye∗ − 3O2 → Dye + hυ + 3O2. (12)
Based on this analysis, it is reasonable to predict that bothrecovery rates r1 and r2 for 1Dye∗ and 3Dye∗ will be signif-icantly increased compare to those in the standard PVA/AAmaterial composition. Therefore, during photon absorption,more excited dye molecules return (recover) to the groundstate, which enhances the absorptivity, so the overall amountof the ground state dye removed is much less than in the casewhen ED is included, thus the saturated transmission value,Tsat, decreases.
Furthermore, comparing Figs. 2 and 3, we note that thesteady state transmission value of EB is much lower thanfor MB, i.e. Tsat(EB) ≈ 0.18 < Tsat(MB) ≈ 0.58. This is notsurprising and can be explained as follows:
(a) As previously verified [11, 12], EB Dye molecules havea higher absorbtivity than the MB Dye molecules, i.e.the estimated values of both the absorption coefficient,ε, and the rate constant of absorption, ka, of EB arehigher than those of MB [11, 12].
(b) Furthermore, the inhibition [25–28] reaction between3Dye∗ and Z (i.e. molecular oxygen) in the MB casetakes place at a much faster rate constant than forEB [11, 12], i.e. kz(MB) = 6.94 × 107 cm3/mol s >
kz(EB) = 1.6 × 106 cm3/mol s. Thus, as soon as the ex-cited MB triplet dye molecules are generated, they aremore likely to be consumed by the inhibitors (i.e. mole-cular oxygen, O2) rapidly, rather than reacting with thetriplet state oxygen, 3O2. Compared to EB, the quench-ing process in the MB system is much less dominantin contributing to the recovery or regeneration of theground state dye.
The combined effects of the photochemical reactions aregoverned by the set of first-order coupled differential equa-tions, in (3)–(8), which are presented in Sect. 2. The aimis to apply the predictions of these equations, combinedwith a nonlinear fitting algorithm, to fit the experimentallyobtained transmission curves presented in Figs. 2 and 3.In the simplified model, we begin by choosing to fix therate constants at their previously determined values [12],
Optical characterization of photopolymers materials: theoretical and experimental examination
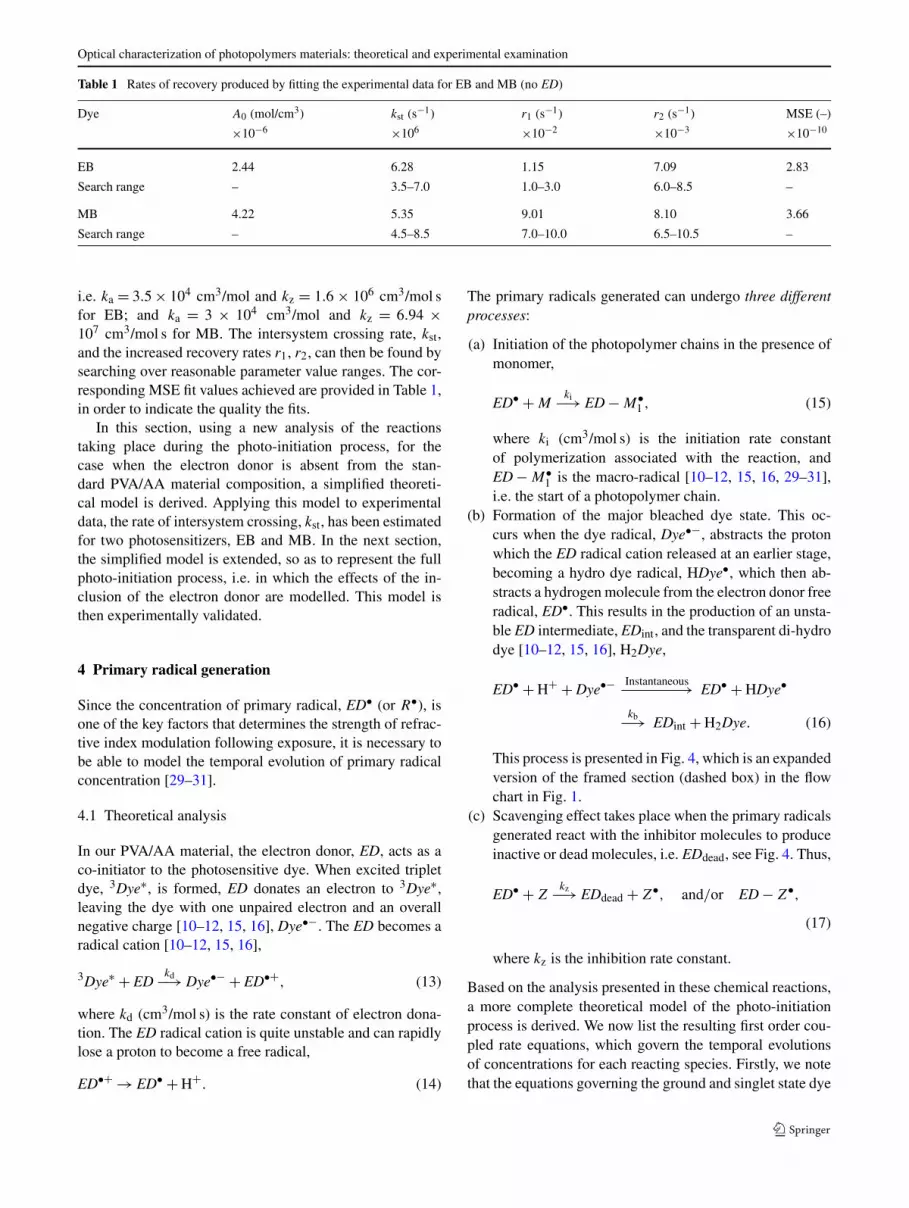
Table 1 Rates of recovery produced by fitting the experimental data for EB and MB (no ED)
Dye A0 (mol/cm3) kst (s−1) r1 (s−1) r2 (s−1) MSE (–)
×10−6 ×106 ×10−2 ×10−3 ×10−10
EB 2.44 6.28 1.15 7.09 2.83
Search range – 3.5–7.0 1.0–3.0 6.0–8.5 –
MB 4.22 5.35 9.01 8.10 3.66
Search range – 4.5–8.5 7.0–10.0 6.5–10.5 –
i.e. ka = 3.5 × 104 cm3/mol and kz = 1.6 × 106 cm3/mol sfor EB; and ka = 3 × 104 cm3/mol and kz = 6.94 ×107 cm3/mol s for MB. The intersystem crossing rate, kst,and the increased recovery rates r1, r2, can then be found bysearching over reasonable parameter value ranges. The cor-responding MSE fit values achieved are provided in Table 1,in order to indicate the quality the fits.
In this section, using a new analysis of the reactionstaking place during the photo-initiation process, for thecase when the electron donor is absent from the stan-dard PVA/AA material composition, a simplified theoreti-cal model is derived. Applying this model to experimentaldata, the rate of intersystem crossing, kst, has been estimatedfor two photosensitizers, EB and MB. In the next section,the simplified model is extended, so as to represent the fullphoto-initiation process, i.e. in which the effects of the in-clusion of the electron donor are modelled. This model isthen experimentally validated.
4 Primary radical generation
Since the concentration of primary radical, ED• (or R•), isone of the key factors that determines the strength of refrac-tive index modulation following exposure, it is necessary tobe able to model the temporal evolution of primary radicalconcentration [29–31].
4.1 Theoretical analysis
In our PVA/AA material, the electron donor, ED, acts as aco-initiator to the photosensitive dye. When excited tripletdye, 3Dye∗, is formed, ED donates an electron to 3Dye∗,leaving the dye with one unpaired electron and an overallnegative charge [10–12, 15, 16], Dye•−. The ED becomes aradical cation [10–12, 15, 16],
3Dye∗ + EDkd−→ Dye•− + ED•+, (13)
where kd (cm3/mol s) is the rate constant of electron dona-tion. The ED radical cation is quite unstable and can rapidlylose a proton to become a free radical,
ED•+ → ED• + H+. (14)
The primary radicals generated can undergo three differentprocesses:
(a) Initiation of the photopolymer chains in the presence ofmonomer,
ED• + Mki−→ ED − M•
1 , (15)
where ki (cm3/mol s) is the initiation rate constantof polymerization associated with the reaction, andED − M•
1 is the macro-radical [10–12, 15, 16, 29–31],i.e. the start of a photopolymer chain.
(b) Formation of the major bleached dye state. This oc-curs when the dye radical, Dye•−, abstracts the protonwhich the ED radical cation released at an earlier stage,becoming a hydro dye radical, HDye•, which then ab-stracts a hydrogen molecule from the electron donor freeradical, ED•. This results in the production of an unsta-ble ED intermediate, EDint, and the transparent di-hydrodye [10–12, 15, 16], H2Dye,
ED• + H+ + Dye•− Instantaneous−−−−−−−→ ED• + HDye•
kb−→ EDint + H2Dye. (16)
This process is presented in Fig. 4, which is an expandedversion of the framed section (dashed box) in the flowchart in Fig. 1.
(c) Scavenging effect takes place when the primary radicalsgenerated react with the inhibitor molecules to produceinactive or dead molecules, i.e. EDdead, see Fig. 4. Thus,
ED• + Zkz−→ EDdead + Z•, and/or ED − Z•,
(17)
where kz is the inhibition rate constant.
Based on the analysis presented in these chemical reactions,a more complete theoretical model of the photo-initiationprocess is derived. We now list the resulting first order cou-pled rate equations, which govern the temporal evolutionsof concentrations for each reacting species. Firstly, we notethat the equations governing the ground and singlet state dye

S. Liu et al.
Fig. 4 Flow chart of primary radical generation (with ED)
concentrations are unchanged from (3) and (4). In the caseof the Triplet dye:
d[3Dye∗]dt
= kst[1Dye∗] − r2
[3Dye∗]
− kz[3Dye∗][Z] − 2kd
[3Dye∗][ED]. (18)
Electron donor:
d[ED]dt
= −2kd[3Dye∗][ED]. (19)
Hydro dye radical:
d[HDye•]dt
= 2kd[3Dye∗][ED] − kb[HDye•][ED•]. (20)
Primary radical:
d[ED•]dt
= 2kd[3Dye∗][ED] − ki[M][ED•]
− kb[HDye•][ED•] − kz[Z][ED•]. (21)
Inhibitor:
d[Z]dt
= −kz[3Dye∗][Z] − kz[ED•][Z]. (22)
Bleached dye:
dAb(t)
dt= kz
[3Dye∗][Z] + kb[HDye•][ED•]. (23)
Finally, the equations governing the recovered dye concen-tration are unchanged from (8).
As can been seen, the full model includes all major re-actions taking place during photo-initiation, including theinteraction between the dye molecules and electron donors.This has resulted in several differences with the simplifiedmodel, which must be emphasized:
(1) Once again, as reported in the literature, the primaryradicals are generated in pairs [10–12, 15, 16, 29–31],therefore, it is assumed that two molecules of ED areinvolved in each reaction with 3Dye∗, see (19) and (21).
(2) In (20), the transient state dye, hydro dye radical(HDye•) appears. It produces the dominant bleacheddye state, di-hydro dye (H2Dye).
(3) In (22), the inhibitor now takes account of the scaveng-ing effect, which was previously excluded due to the ab-sence of ED in (6).
(4) In (23), the bleached dye concentration now includesthe contribution from the second transparent dye state,di-hydro dye (H2Dye), which was absent in (7).
In order to validate this model, it is necessary to compareits predictions to the corresponding experimental results. Inthis way, estimates of the various rate constants associatedwith each of the chemical reactions can be determined.
4.2 Experimental work
The description of the experiments below is split into threesubsections: (1) absorption, (2) recovery and (3) bleaching.
4.2.1 Absorption
In the standard PVA/AA material composition, during pho-ton absorption, the inclusion of the ED should not directlyaffect the reactivity between the ground state dye moleculesand the photons. Moreover, the absorptivity is a propertyof the individual photosensitizer. Under the same experi-mental conditions described in Sect. 3, and applying thesame fitting algorithm to the experimentally obtained trans-mission curves, the rate constants of photon absorption foreach dye are extracted. As expected, they remain very sim-ilar to the values previously reported [12], i.e. ka(EB) =3.5 × 104 cm3/mol and ka(MB) = 3 × 104 cm3/mol.
4.2.2 Recovery
As discussed in Sect. 2, the excited states of the dye mole-cules, 1Dye∗ and 3Dye∗, both interact with ED, whichcauses them either to recover or bleach. Therefore in thestandard material composition, the recovery rates, r1 and r2,are no longer the same as those reported in Sect. 3. This oc-curs because each of these rates only represents the com-bined effects of multiple reactions which take place for

Optical characterization of photopolymers materials: theoretical and experimental examination
Fig. 5 Combination of (a) fits to experimental data of EB concen-tration during exposure for different exposure times: t1 = 5 s (solidcurve), t2 = 10 s (long dashed curve), t3 = 20 s (dashed curve), andt4 = 50 s (short dashed curve), and (b) fits to experimental data ofrecovery versus post-exposure time off (tOFF) of EB (with ED)
1Dye∗ and 3Dye∗ during the recovery process, i.e. the pres-ence of ED causes radiationless energy transfer and for-mation of H2Dye to occur for both the 1Dye∗ and the3Dye∗ molecules.
Thus in this section, r1 and r2 must be re-estimated, us-ing the full model. Experimental work was carried out byapplying carefully timed, normally incident exposures of in-tensity I0 = 4 mW/cm2, converted to appropriate units ofEinstein/cm2 s, at λ = 532 nm for EB, and λ = 633 nmfor MB, to uncover plated photopolymer layers of thickness100 µm, for four particular exposure times, i.e. t1 = 5 s,t2 = 10 s, t3 = 20 s, and t4 = 50 s. Applying these expo-sures, four fractions of the maximum intensity transmittedthrough the layer at saturation are examined: T1 ≈ Tsf/4,T2 ≈ Tsf/2, T3 ≈ 3Tsf/4, and T4 ≈ Tsf. These, in turn, corre-spond to four dye concentrations in the ground state: A(t1),A(t2), A(t3), and A(t4). The transmittances of the layerswere then measured for a wide range of recovery times, i.e.1 min ≤ tOFF ≤ 90 min. The resulting decreases in the trans-mittance being converted into the corresponding increases inthe recovered dye concentration. The temporal evolutions ofthe recovery for the four exposures can then be compared.The results are presented in Figs. 5 and 6 for EB and MB,respectively.
Fig. 6 Combination of (a) fits to experimental data of MB concen-tration during exposure for different exposure times: t1 = 5 s (solidcurve), t2 = 10 s (long dashed curve), t3 = 20 s (dashed curve), andt4 = 50 s (short dashed curve), and (b) fits to experimental data ofrecovery versus post-exposure time off (tOFF) of MB (with ED)
In order to model the temporal evolution of the post ex-posure processes, the incident intensity I ′
0 (Einstein/cm2 s),appearing in (3) and (4), is set to zero when t > texp. Theexperimental data can then be well fit by the numerical so-lution of A(t), (or [Dye]), both during and post-exposures.In Figs. 5(a) and 6(a), the consumption of the dye concen-tration predicted by the model, i.e. the decaying part of eachcurve, agrees well with the experimental data. In each ofthe four cases the predictions match the experimental re-sults for the full continuous exposure case, i.e. the full de-caying curve for 0 < t ≤ texp = 150 s. Once the exposuresend, i.e. (3) becomes (8), the transmittance decreases as theconcentration of dye slowly increases. This is presented inFigs. 5(b) and 6(b), for the recovery of both EB and MBover the entire post-exposure period, i.e. for tOFF � texp,results are presented for the four exposure times, wheretOFF1 = 60 s is the first post-exposure time. The behavioursof EB and MB have much in common, as can be observedfrom Figs. 5 and 6, as in both cases appreciable recoverydoes occur over long periods.
Examining the four cases we note that the longer the pho-tosensitizer is exposed, the greater the number of dye mole-cules that become excited. However, significant differencesdo exist, the availability of oxygen, including that which dif-

S. Liu et al.
Table 2 Rates of recovery produced by fitting the experimental data for EB and MB (with ED)
texp (s) r1 (EB) (s−1) r2 (EB) (s−1) MSE (–) r1 (MB) (s−1) r2 (MB) (s−1) MSE (–)
×10−3 ×10−4 ×10−14 ×10−3 ×10−4 ×10⁻¹⁴
t1 = 5 1.32 9.00 8.01 3.20 1.31 4.24
t2 = 10 1.28 8.71 9.16 2.60 0.66 3.23
t3 = 20 1.29 8.89 6.39 1.38 0.41 8.20
t4 = 50 1.31 9.06 7.88 0.93 0.28 9.38
fuses into the layer [11, 26–28], allows the MB to almostrecover to its initial concentration post-exposure with onlya small amount being bleached, i.e. the differences betweenthe saturated values and A0, the initial dye concentration,see Fig. 6. The larger the number of MB dye molecules ex-cited, the longer the time required for them to recover even ifoxygen is available, i.e. the recovery rate of MB decreases.This is especially obvious when the material layer is uncoverplated [11, 26–28]. The extracted recovery rates for eachparticular exposure are presented in Table 2. However, forthe corresponding case of EB, the longer the photosensitizeris initially exposed, the lower the maximum concentrationto which it can recover, and the estimated recovery rates arevery similar for the different exposure times, see Table 2.This is primarily due to the weaker reactivity between theexcited EB dye molecules and oxygen [11, 12], and the ac-tive bleaching process, which is explained in more detail inthe following section.
4.2.3 Bleaching
In this section, in order to quantify the bleaching processfor both EB and MB, the bleached dye concentration as afunction of the exposure time, Ab(t) in (23), is calculatedand used to fit the experimental data.
To describe the bleaching process, the recovery processesdiscussed above must first be well understood. As illus-trated in Figs. 5(b) and 6(b), the amount of photosensi-tizer bleached depends on the exposure time. As a result ofthe bleaching process, 100% recovery cannot be achieved,which means that a certain amount of the excited dye doesnot return to its ground state. Thus, for the exposure timesexamined, we can predict that as tOFF approaches infinity,i.e. once the recovery processes are complete, the dye con-centration cannot recover to its initial value, A0.
The bleaching experiments were also carried out by ap-plying normally incident exposures of intensity 4 mW/cm2
converted to Einstein/cm2 s at λ = 532 nm for EB, andλ = 633 for MB, to the uncover plated photopolymer layersof thickness 100 µm, for a much larger range of exposuretimes, i.e. 5 s ≤ texp ≤ 250 s, and for a fixed post-exposuretime off, tOFF ≈ 12 hours. The resulting experimental datasets give the bleached photosensitizer concentration as a
Fig. 7 The bleached EB concentration as a function of the exposuretime
Fig. 8 The bleached MB concentration as a function of the exposuretime
function of the exposure times. Figures 7 and 8 contain thepredictions for Ab(t), for EB and MB, respectively, whichare consistent with the experimentally obtained data.
As discussed in (23), Ab(t), is the sum of the transpar-ent state dye concentrations, i.e. the bleached Leuco anddi-hydro forms. The initially dissolved inhibitor, Z, has
Optical characterization of photopolymers materials: theoretical and experimental examination
a relatively low concentration, Z0 = 1.6 × 10⁻⁷ mol/cm3
[10–14, 30]. Therefore, as soon as 3Dye∗ molecules areformed, they rapidly react with the dissolved oxygen presentat a rate constant, which is estimated to be kz(EB) = 1.6 ×106 cm3/mol s and kz(MB) = 6.94 × 107 cm3/mol s. Thusthe Leuco dye is primarily and rapidly formed during theinitial stages of exposure. This causes a rapid initial in-crease in the bleached dye concentration. Only once the in-hibitors are consumed is a significant amount of di-hydrodye, H2Dye formed. This then is the dominant bleachingprocess until all the hydro dye radicals, HDye•, have reactedwith the primary radicals, (see (16)), at the estimated rateconstants of kb(EB) = 3.98 × 104 cm3/mol s and kb(MB) =5.66 × 104 cm3/mol s.
As can be observed in both Figs. 7 and 8, Ab(t) in-creases with increased exposure. Examining the parame-ter values extracted from the data, the maximum bleachedEB dye concentration, A0 is asymptotically approached,i.e. Ab(t → ∞) → A0. Thus 100% bleaching of the EBdye appears possible, with all recovered dye being even-tually bleached, if the layer is exposed for a sufficientlylong time. Correspondingly for MB, the formation of theLeuco dye takes place with a relatively faster inhibition rateconstant (over a shorter period, tLeuco ≈ 20 s), and witha lower bleached concentration eventually being formed,compared to the equivalent EB case. After tLeuco, the forma-tion of di-hydro dye, H2Dye, begins to dominate the bleach-ing process, with Ab(t) continuing to increase towards itsasymptotic limit, i.e. Ab(t → ∞) → A0/6, this appears tobe the case because, as noted, MB strongly reacts with oxy-gen [32]. Thus more excited MB dye molecules are contin-ually recovering to the ground state, following the reactionwith the oxygen present in the layer (both during exposureand post-exposure), than are transformed into the transpar-ent bleached states.
5 Primary radical generation
Based on the theoretical analysis and experimental workpresented in the previous sections, the temporal evolutionof primary radical generation, ED• (or R•), can now be ac-curately described. Once again, it must be emphasized thatthe primary radical production is a key factor in determin-ing the amount of polymerization and thus of index modula-tion, �n. We note that this is important for holographic datastorage and hybrid optoelectronic circuit applications.
In (21), the primary radical concentration, ED•, is pro-duced by the reaction between 3Dye∗ and ED, at the rateconstant of electron donation, kd. Simultaneously, ED• isalso being removed as it initiates photopolymer chains,forms the major bleached dye state, H2Dye, and is scav-enged by the dissolved inhibitor. We note that there is a high
concentration of ED in the system, i.e. the initial concentra-tion of the electron donor is ED0 = 3.18 × 10⁻³ mol/cm3,almost 1000 times larger than the initial dye concentra-tion, A0. The reasons given for this include: (i) High EDconcentration enables high efficiency or probability thatthe ED will come into proximity with the 3Dye∗ mole-cules formed, i.e. accelerating the process by which the3Dye∗ molecules react with the ED molecules; (ii) Andas mentioned before, every 3Dye∗ molecule requires twoED molecules to produce a pair of radicals, as describedin (21).
In this study, the generation of 3Dye∗ has been mod-elled assuming intersystem crossing from 1Dye∗ at a rateconstant, kst. The production of ED•, i.e. 2kd[ED][3Dye∗]in (21), can then be determined. In order to extract thevalue of kd appearing in (19)–(21), satisfactory fits to boththe experimental data of transmission curve using (9) andto the bleaching process using (23) must be obtained si-multaneously. This is necessary because (a) the temporalevolution of the concentration of 3Dye∗ affects the pho-ton absorption, see Fig. 1, and (b) the production of ED•which is associated with kd is directly linked to the for-mation of H2Dye. Therefore, based on this, the rate con-stants governing the electron donations by ED to 3Dye∗are estimated to be kd(EB) = 3.86 × 102 cm3/mol s andkd(MB) = 7.82 × 102 cm3/mol s.
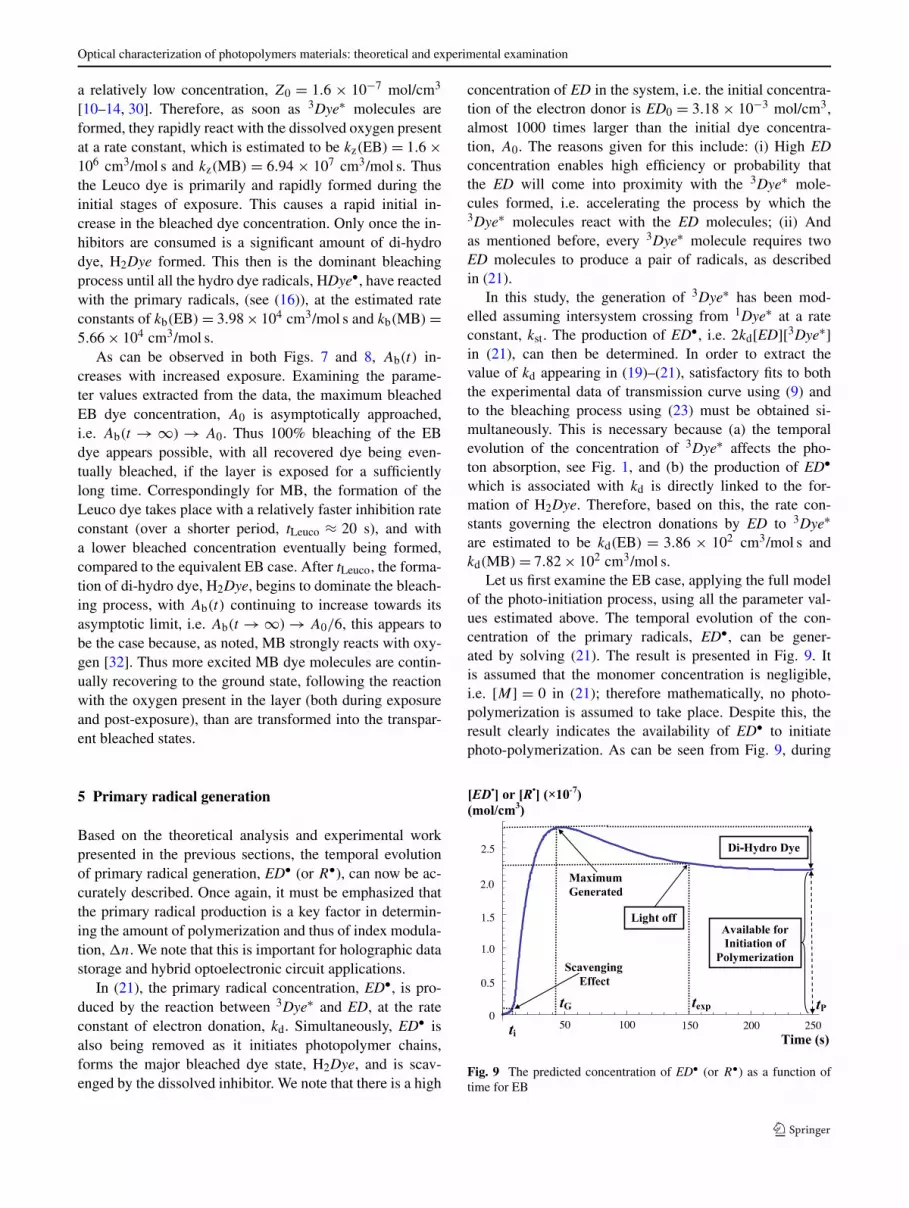
Let us first examine the EB case, applying the full modelof the photo-initiation process, using all the parameter val-ues estimated above. The temporal evolution of the con-centration of the primary radicals, ED•, can be gener-ated by solving (21). The result is presented in Fig. 9. Itis assumed that the monomer concentration is negligible,i.e. [M] = 0 in (21); therefore mathematically, no photo-polymerization is assumed to take place. Despite this, theresult clearly indicates the availability of ED• to initiatephoto-polymerization. As can be seen from Fig. 9, during
Fig. 9 The predicted concentration of ED• (or R•) as a function oftime for EB

S. Liu et al.
Table 3 Parameter values from fits to experimental data for MB and EB (with ED)
Dye ka (cm3/mol) kd (cm3/mol s) kz (cm3/mol s) kb (cm3/mol s) kst (s−1) MSE (–)
×104 ×102 ×107 ×104 ×106 ×10−10
EB 3.50 3.86 0.16 3.98 9.28 1.36
Search range 1.0–4.0 1.0–4.5 0.08–0.35 2.5–5.5 6.0–9.5 –
MB 3.00 7.82 6.94 5.66 3.35 7.31
Search range 1.0–4.0 6.0–9.5 3.5–8.0 3.0–6.5 2.0–5.5 –
the initial stages of the exposure, i.e. 0 ≤ ti texp = 150 s(exposure time for standard PVA/AA material), the gen-eration of ED• is significantly inhibited by the originallydissolved oxygen. The scavenging effect, included in (17),takes place at a rate constant kz. Following the resultinginitial inhibition period, ti, the generation of ED• starts toprogressively increase towards a maximum value at timetG. After tG the concentration of ED• molecules decreases.With no monomer present, this is solely due to the formationof the transparent di-hydro dye, H2Dye, as discussed in rela-tion to (16), which continues to take place post-exposure, i.e.t � texp. Finally, as can be observed when the curve reachesits steady state value at time t = tP in Fig. 9, there is a sig-nificant amount of ED• remaining. Thus, the availability ofED• concentration to initiate photo-polymerization can beinvestigated.
For the corresponding MB case, the general behaviour ofthe ED• concentration is almost identical to that for EB, seeFig. 9. However, because fewer 3Dye∗ molecules are gen-erated in the MB system, fewer are available to react withthe electron donor, i.e. kst(EB) > kst(MB). Given the sameexposure time, fewer 3Dye∗ molecules can be formed, thusless ED• is produced. Therefore, (1) the inhibitor scaveng-ing effect takes less time to end; (2) at the correspondingtime tP in Fig. 9, the amount of di-hydro dye formed is re-duced, i.e. there is less bleaching of MB dye, see Fig. 8;and (3) a lower concentration of the primary radicals remainavailable to initiate photopolymer chains.
Furthermore, from the comparisons of these two typesof photosensitizer, the generation of primary radicals can beaffected by the different reactivities between the ED mole-cules and the different excited dye molecules. This is impor-tant in the photo-initiation process, especially if one wishesto optimize the interaction between the electron donor andphotosensitizer, i.e. in order to identity the optimal con-centrations of the electron donor and the photosensitizerto maximize the achievable refractive index modulation.Therefore, to optimize a free-radical polymerization process[13, 14, 16, 23, 30, 31, 33], it is clear that a detailed modelof dye kinetics, such as photon absorption, photosensitizerrecovery and bleaching is necessary.
6 Discussion and conclusion
In this paper, the possible photochemical mechanisms whichoccur during the photo-initiation mechanisms in a simpli-fied PVA/AA based photopolymer material when the co-initiator, electron donor (ED) is not included have beenanalysed in detail. A flow chart has been presented in Fig. 1summarizing the reactions taking place. Then a set of rateequations have been proposed to provide an appropriatemodel, i.e. (3)–(8). In this way, the rate constant of intersys-tem crossing, kst, has been estimated, by fitting the modelto experimental results for the two types of photosensitizerexamined.
The resulting value of kst has then been used in a morecomplete photo-initiation model when ED is included (seeSect. 4), i.e. in (3), (4), (8), (18)–(23). Primary radical gener-ation in this case is also detailed using a flow chart in Fig. 4.This full model is then validated experimentally. The photo-absorptive behaviours of equivalent standard PVA/AA lay-ers (ED included), containing identical molarities of the MBand EB photosensitizers, are examined. Predictions of thetemporal evolution of the primary radical concentrations arethen presented in Fig. 9 using (21), which includes all themajor reactions involved in the generation and removal ofprimary radicals. The parameter values associated with eachreaction or mechanism are determined (for both photosensi-tizers), by performing fits to the experimental data sets de-scribing transmission, photosensitizer recovery and bleach-ing. The results are presented in Tables 1–3.
The applicability of these procedures to characterise avariety of photopolymer materials has been demonstrated.Very recently, techniques similar to those reported here havebeen used to examine photo-initiation in an epoxy resin pho-topolymer containing the dye Irgacure 784 [34].
Much remains to be done. This new model of the photo-initiation process must be incorporated into the Non-localPhoto-polymerization Driven Diffusion (NPDD) model[13, 14, 16, 23, 30, 31, 33], allowing a more complete mod-elling of free radical photo-polymerization. Such a modelcan then be profitably applied to the study of photopolymerbased holographic data storage [1, 2], hybrid optoelectronicsfabrication and the self-trapping of light [3–9].
Optical characterization of photopolymers materials: theoretical and experimental examination
Acknowledgements We acknowledge the financial support of En-terprise Ireland, Science Foundation Ireland, and the Irish ResearchCouncil for Science Engineering, and Technology under the NationalDevelopment Plan. One of the authors (SL) would also like to acknowl-edge the support of the Optical Society of America through an OSAEducational Scholarship and Activity Grant.
References
1. L. Dhar, A. Hale, H.E. Katz, M.L. Schilling, M.G. Schnoes, F.C.Schilling, Opt. Lett. 24, 487 (1999)
2. R.R. McLeod, A.J. Daiber, M.E. McDonald, T.L. Robertson,T. Slagle, S.L. Sochava, L. Hesselink, Appl. Opt. 44, 3197 (2005)
3. A.C. Sullivan, M.W. Grabowski, R.R. McLeod, Appl. Opt. 46, 295(2007)
4. C. Ye, R.R. McLeod, Opt. Lett. 33, 2575 (2008)5. A. Sato, M. Scepanovic, R. Kostuk, Appl. Opt. 42, 778 (2003)6. Y. Luo, P.J. Gelsinger, J.K. Barton, G. Barbastathis, R.K. Kostuk,
Opt. Lett. 33, 566 (2008)7. S. Schultz, E. Glytsis, T. Gaylord, Appl. Opt. 39, 1223 (2000)8. C.P. Jisha, V.C. Kishore, B.M. John, V.C. Kuriakose, K. Porsezian,
C. Sudha Kartha, Appl. Opt. 47, 6502 (2008)9. O. Kashin, E. Tolstik, V. Matusevich, R. Kowarschik, J. Opt. Soc.
Am. B 26, 2152 (2009)10. M.R. Gleeson, S. Liu, S. O’Duill, J.T. Sheridan, J. Appl. Phys.
104, 064917 (2008)11. S. Liu, M.R. Gleeson, J.T. Sheridan, J. Opt. Soc. Am. B 26, 528
(2009)12. S. Liu, M.R. Gleeson, D. Sabol, J.T. Sheridan, J. Appl. Phys. 106,
104911 (2009)13. M.R. Gleeson, J.T. Sheridan, J. Opt. Soc. Am. B 26, 1736 (2009)14. M.R. Gleeson, S. Liu, R.R. McLeod, J.T. Sheridan, J. Opt. Soc.
Am. B 26, 1746 (2009)15. J.R. Lawrence, F.T. O’Neill, J.T. Sheridan, Optik 112, 449 (2001)16. M.R. Gleeson, J.V. Kelly, D. Sabol, C.E. Close, S. Liu, J.T. Sheri-
dan, J. Appl. Phys. 102, 023108 (2007)
17. J.B. Birk, Organic Molecular Photophysics, 2nd edn. (Wiley, NewYork, 1975)
18. E.K.L. Yeow, S.M. Melnikov, T.D.M. Bell, F.C. De Schryver,J. Hofkens, J. Phys. Chem. A 110, 1726 (2005)
19. P. Venkateswarlu, M.C. George, Y.V. Rao, H. Jagannath,G. Chakrapani, A. Miahnahri, J. Phys. 28, 59 (1987)
20. P. Sathy, R. Philip, V.P.N. Nampoori, C.P.G. Vallabhan, J. Phys. DAppl. Phys. 27, 2019 (1994)
21. N.J. Turro, Modern Molecular Photochemistry (University Sci-ence, Mill Valley, 1991), p. 103
22. L. Carretero, S. Blaya, R. Mallavia, R. Madrigal, A. Belendez,A. Fimia, Appl. Opt. 37, 4496 (1998)
23. M.R. Gleeson, D. Sabol, S. Liu, C.E. Close, J.V. Kelly, J.T. Sheri-dan, J. Opt. Soc. Am. B 25, 396 (2008)
24. R.T. Bailey, F.R. Cruickshank, G. Deans, R.N. Gillanders, M.C.Tedford, Anal. Chem. Acta 487, 101 (2003)
25. A. Fimia, N. Lopez, F. Mateos, R. Sastre, J. Pineda, F. Amatguerri,J. Mod. Opt. 40, 699 (1993)
26. A.K. O’Brien, C.N. Bowman, Macromol. Theory Simul. 15, 176(2006)
27. M.R. Gleeson, J.V. Kelly, C.E. Close, F.T. O’Neill, J.T. Sheridan,J. Opt. Soc. Am. B 23, 2079 (2006)
28. A.V. Galstyan, S. Hakobyan, S. Harbour, T. Galstian, http://elc.org/Documents/T._V_Galstian_2004_05_05_11_13_17.pdf(2004)
29. G. Odian, Principles of Polymerization (Wiley, New York, 1991)30. M.R. Gleeson, S. Liu, J.T. Sheridan, Optik (Stuttgart) (2009, ac-
cepted)31. M.D. Goodner, C.N. Bowman, Macromolecules 32, 6552 (1999)32. M.C. Cole, InPhase Technologies, Longmont, Colorado, USA.
Private Communications (2007)33. M.R. Gleeson, J.T. Sheridan, J. Opt. A Pure Appl. Opt. 10, 024008
(2008)34. D. Sabol, M.R. Gleeson, S. Liu, J.T. Sheridan, J. Appl. Phys. 107,
053113 (2010)


