Embed Size (px)
Citation preview

This article was downloaded by:[Ingenta Content Distribution TandF titles]On: 26 June 2008Access Details: [subscription number 791939330]Publisher: Taylor & FrancisInforma Ltd Registered in England and Wales Registered Number: 1072954Registered office: Mortimer House, 37-41 Mortimer Street, London W1T 3JH, UK
Journal of Modern OpticsPublication details, including instructions for authors and subscription information:http://www.informaworld.com/smpp/title~content=t713191304
Optical detection of phase transitions in potassiumniobateB. Yang ab; P. D. Townsend a; M. Maghrabi ca Engineering and Information Technology, Pevensey Building, University of Sussex,Brighton, UKb Physics Department, Normal University, Beijing, Chinac CPES, Pevensey Building, University of Sussex, Brighton, UK
Online Publication Date: 01 February 2001
To cite this Article: Yang, B., Townsend, P. D. and Maghrabi, M. (2001) 'Opticaldetection of phase transitions in potassium niobate', Journal of Modern Optics,48:2, 319 — 331
To link to this article: DOI: 10.1080/09500340108232460URL: http://dx.doi.org/10.1080/09500340108232460
PLEASE SCROLL DOWN FOR ARTICLE
Full terms and conditions of use: http://www.informaworld.com/terms-and-conditions-of-access.pdf
This article maybe used for research, teaching and private study purposes. Any substantial or systematic reproduction,re-distribution, re-selling, loan or sub-licensing, systematic supply or distribution in any form to anyone is expresslyforbidden.
The publisher does not give any warranty express or implied or make any representation that the contents will becomplete or accurate or up to date. The accuracy of any instructions, formulae and drug doses should beindependently verified with primary sources. The publisher shall not be liable for any loss, actions, claims, proceedings,demand or costs or damages whatsoever or howsoever caused arising directly or indirectly in connection with orarising out of the use of this material.

Dow
nloa
ded
By:
[Ing
enta
Con
tent
Dis
tribu
tion
Tand
F tit
les]
At:
12:0
9 26
Jun
e 20
08
JOURNAL OF MODERN OPTICS, 2001, VOL. 48, NO. 2, 319-331
Optical detection of phase transitions in potassium niobate
B. YANGtS, P. D. TOWNSEND? and M. MAGHRABIS t Engineering and Information Technology, Pevensey Building, University of Sussex, Brighton, BN1 9QH, U K $ Physics Department, Normal University, Beijing, 100875, China 0 CPES, Pevensey Building, University of Sussex, Brighton, BN1 9QH, U K
(Received 23 December 1999; revision received 5 June 2000)
Abstract. Luminescence data from potassium niobate crystals are reported which show intensity and/or wavelength variations on heating, or cooling, through the phase transition temperatures. The luminescence signals can clearly identify the structural changes between the various crystalline phases. The transition temperatures differ between heating and cooling. They were recorded near 247 and 491 K (heating) or 220 and 478K (cooling). The hysteresis indicates the presence of metastable material, (e.g. a supercooled structure). The data resolve the previously cited differences in transition temperatures for KNb03 from different laboratories. The luminescence signals show further details in the variations of spectra, intensity and transition discontinuities of the luminescence which are related to material quality between samples, even from a single supplier. The luminescence data underline the sensitivity of these crystals to structural damage from electron, X-ray or thermal treatments and offer the opportunity to assess crystalline quality prior to device fabrication.
Introduction Potassium niobate is potentially of considerable interest for photonic and
electro-optic applications since it displays very large non-linear and electro-optic coefficients. Excellent performance figures have been noted by several groups of authors [ 1 4 ] and the material can be readily modified into waveguide geometry by helium ion implantation [5-lo]. Despite the very obvious high performance of the material its development into device structures is severely limited by the difficul- ties of crystal growth, although several research groups and commercial companies have had sufficient success to establish the potential of the material. Inevitably with any crystal which is still limited by the fabrication stage the cited performance properties are likely to be variable as a result of either extrinsic impurities or intrinsic defects such as vacancies or dislocations. The material has been used with processing techniques such as ion beam implantation to make high quality optical waveguides, which benefit from its high second harmonic efficiency. However a major problem for KNb03 is that in normal practice [9] it is customary to remove the undesirable defect structures associated with ion beam implantation by a simple furnace heat treatment. With most other optical waveguide materials one typically anneals to above say 300°C in order to remove localized defects which
Journal of Modern Optics ISSN 0 9 5 0 3 4 0 print/lSSN 1362-3044 online 0 2001 Taylor & Francis Ltd http://www.tandf.co.uk/journals

Dow
nloa
ded
By:
[Ing
enta
Con
tent
Dis
tribu
tion
Tand
F tit
les]
At:
12:0
9 26
Jun
e 20
08
320 B . Yung et al.
give optical absorption. However, for KNb03 the key optical responses require the orthorhombic phase which exists at room temperature. Heating to 300°C converts the material to the tetragonal phase and, while the transition is reversible on cooling, there are severe problems in re-establishing a single domain poled crystal. Failure to do this can result either in multi-domains, random poling or even fragmentation of the sample.
Journal articles and manufacturers brochures cite significant variations [8, 1 1- 131 for the various phase transition temperatures, as shown in table 1. The table includes values from the present experiments, which will be discussed later, and it is now possible to rationalize the apparent differences of the order of 20 degrees. At the outset of this work some variations were in fact expected since phase stability is likely to be sensitive to many factors. These include impurities, additions of traces of dopants used as stabilisers, methods of crystal growth, position within the boule, and possible surface damage introduced during cutting and polishing. Conse- quently, even for the same crystal the surface and bulk values might differ (as reported here). If control via doping is possible then there is a clear benefit from depressing the temperature of the rhombohedra1 to orthorhombic transition below temperatures which might be encountered in ambient excursions. Similarly increasing the orthorhombic to tetragonal transition temperature would be ad- vantageous. It should be noted that in the earlier studies, using X-ray structural characterization, the temperatures quoted represent the thermodynamic transition temperatures, whereas in dynamic heating or cooling situations the phases may exist in a metastable form, either above or below the numbers indicated. Such alterations could have many consequences for processing in device applications.
Current objectives The aim in the present work has been to investigate this material with a
technique which is sensitive to phase changes and which responds to variations in intrinsic, or extrinsic, levels of impurities, and/or changes in stoichiometry and dislocations etc. Such responses to impurities and defects are often provided by the luminescence properties. Further, changes in bulk crystallography will inevitably alter the emission wavelengths, efficiency of excitation and recombination, excited state lifetimes and polarization of both intrinsic and impurity emission bands. Detection of signals during X-ray excitation while heating the crystal will reveal a combination of radioluminescence and thermoluminescence (TL) signals, whereas during cooling the TL components are suppressed. Focusing on surface features is possible by the use of cathodoluminescence (CL) and changes in electron energy offers some information on the depth scale of the changes. Simple TL experiments show a spike in the emission intensity if the signal occurs where there is a transition temperature. A recent demonstration of the TL technique using ammonium bromide [14] clearly revealed all four phase transitions, both as discontinuities in wavelength of emission and in intensity. Such changes are not confined to bulk effects but respond equally well to localized inclusions or extended defect complexes with excellent examples ranging from T m doped germano-silicate optical fibres [15], and rare earth emissions sites in radiation dosimeters [16, 171 to fullerenes [18, 191.
Polychromatic measurements of the TL from KNb03 following irradiation at 80K show several normal glow peaks on which are superposed several very sharp

Dow
nloa
ded
By:
[Ing
enta
Con
tent
Dis
tribu
tion
Tand
F tit
les]
At:
12:0
9 26
Jun
e 20
08
Optical detection of phase transitions in KNbO3 321
luminescence intensity spikes at -263 K [13, 201. While this feature is likely to be the result of a phase transition occurring during emission from a normal broad TL glow peak with a maximum near 250 K, confirmation is required for two reasons. First, earlier examples had suggested that having rapidly removed trapped charges during a phase transition the higher temperature side of the glow peak operates with a depleted set of trapped charges and so is of greatly reduced intensity. For KNb03 this does not appear to be the case following the 263K TL intensity spikes. Secondly, there is a small possibility that since there are several spikes these may be an artifact of electrical breakdown. The material is likely to show pyro- electric signals and, as TL systems invariably heat the sample from just one side, they generate temperature gradients which result in pyroelectric discharges. For example in LiNb03 the true T L signals are weak but the pyroelectric potential results in intense surface discharges which emit light [21-231. Similar features have been noted from L i I03 at low temperature [19]. Overall the pyroelectrically generated breakdown luminescence results in a spiky set of semi-random signals. Hence detailed measurements for KNb03 have been attempted for the two lower phase transitions employing wavelength analysis of RLTL during both heating and cooling, as well as for TL and CL. Pyroelectric signal spikes occur in both heating and cooling. Several previously unexpected features became apparent as, well as considerable variations in spectra and intensity between samples, even from one set of crystals.
Experiments Nominally undoped 5 x 3 x 1 mm3 Chinese KNb03 samples were purchased
from Photox, (Oxford, UK). The samples were polished but not poled. The bulk transparency range of these samples is 400-4500nm, and the phase transition temperatures are quoted by the company as being at -50°C (223 K), 200°C and 430°C (NB these values differ from earlier references, as shown in table 1). The luminescence emissions were recorded on the Sussex high-sensitivity wavelength multiplexed system [24]. This has two detectors covering the detection ranges 200-440 and 380-800 nm. The resolution used here was only 10 nm as the emission bands in KNb03 are broad and weak. Samples could be irradiated in vacuum in situ by a Philips tungsten X-ray tube, or by an electron gun for C L studies. All the recorded data were corrected for the spectral response of the detector systems. The RLTL, CL and low temperature T L heating and cooling rates were normally 6" min-' , but because of weak signal problems some high temperature TL was run at higher rates. In view of the measured differences in the temperatures of the signals during heating and cooling a further set of experiments were made with rates from 1 - 10" min-' to minimize temperature gradient effects.
Results 1. Emissions below room temperature. Typical low temperature TL results of KNb03 samples, which were X-ray irradiated with a dose of 80 Gy at 35 K are given in figures 1 (a) - (d) . The heating rate was 6 Kmin-'. An isometric plot, shown in figure 1 ( a ) , offers an overview of the pattern of signals in which there are standard glow peaks at low temperature that extend over broad spectral regions, plus a weak but clearly defined anomalous signal near 240K. Self

Dow
nloa
ded
By:
[Ing
enta
Con
tent
Dis
tribu
tion
Tand
F tit
les]
At:
12:0
9 26
Jun
e 20
08
322 B. Yang et al.
Figure 1. (a) Isometric plot of TL intensity at low temperature; (b) emission spectra from several temperature intervals; ( c ) glow curves versus wavelength and (d) a demonstration of the luminescence anomaly at the phase transition.
absorption at the band edge limits the useful bulk emission to wavelengths longer than -400nm. Figure 1 (b) records an emission band at 320 and 400nm (which must arise in the near surface layer) and bands from the bulk material peaked at about 450, 600 and 700nm. Detailed analysis of the component features of the bands was not attempted, in part because they are weak, but also because in detail they are sample dependent. Figure 1 (b) emphasizes that the relative intensities between these emission bands change with temperature and this influences the apparent position and number of glow peaks, figure l(c). Within the detector range from 420-800 nm the thermoluminescence peaks are variously, as a function of the wavelength of measurement, from 50 to 75K, but for all wavelengths there is a peak near 135K. Of relevance to the phase transition investigation, figure 1 (d) shows that across the entire spectrum, from 200-

Dow
nloa
ded
By:
[Ing
enta
Con
tent
Dis
tribu
tion
Tand
F tit
les]
At:
12:0
9 26
Jun
e 20
08
Optical detection of phase transitions in KNb03 323
800nm, a spectacularly narrow sharp peak occurs at 247 K in this example. Note the perspective of the isometric plot has been altered, compared with figure 1 (a), in order to emphasize this feature. No other TL signals were reproducibly detected above 180 K.
The low temperature radioluminescence (RL) and cathodoluminescence (CL) signals were recorded during both heating and cooling. The RL results, with a 20 Gy min-' X-ray dose rate and 6 K min-' temperature rate of change, are given in figures 2 and 3. Intense R L signals were recorded during cooling from 300 to 35 K and data are presented in the isometric plot in figure 2 ( a ) . Signal attenuation with 10% transmission neutral density filters was used in this measurement, because below lOOK the emission intensities were too strong for the detectors. In contrast, filtered signals from 19Cb300K are, as shown in figure 2 ( a ) , too weak to be studied. The results from another 28Ck190 K measurement, without any neutral
Figure 2. ( a ) Intense radioluminescence signals during cooling and (b) a magnified view of weaker signals. (c) Spectra from different temperature ranges.

Dow
nloa
ded
By:
[Ing
enta
Con
tent
Dis
tribu
tion
Tand
F tit
les]
At:
12:0
9 26
Jun
e 20
08
3 24
3 600 480
W W ’ 2
5 120
.g 240 rA
c,
U c
0
B. Yang et al.
’ - 500-530nm - - = 71 0-740nm ’
I ’
’
0 800
‘g 650 d 2 500
5 350 W
.- rA
8 200 c,
Y c
ma--
’ ”. ’
y - recorded during cooling . Y,. .. = - - recorded during heating -.
’ ..... ...... ......
*
n
3 35 d 30 - 25 2 .I 22 2 20 0 E 15 c,
U
I90 210 230 250
Temperature (K) Figure 3. (a) Differences in RL intensity as a function of temperature during cooling; (b)
the contrast between heating and cooling and (c) cooling data for CL excitation.
density filters are given in figure 2(b), which clearly shows an intensity anomaly from the RL luminescence near 220 K. A compilation of spectral differences from the various temperature ranges are shown in figure 2(c). The RL intensity of emissions with the wavelength lower than 420 nm is very weak, for the same reason as in the T L case. It is clear in figure 2 (c) that from 420-800 nm, there are three or four RL emission bands recorded and the relative intensities vary with the temperature.
While a sudden change in the intensity is detected for any RL emission at around 220 K it should be noted that there are subtle differences between signals at different wavelengths. The plots of the RL intensity of the 500-530nm and 710- 740 nm emission regions with temperature during cooling are shown in figure 3 (a) by the solid line and the dots, respectively. Initially, ignoring the intensity spike
Dow
nloa
ded
By:
[Ing
enta
Con
tent
Dis
tribu
tion
Tand
F tit
les]
At:
12:0
9 26
Jun
e 20
08
Optical detection of phase transitions in KNbO3 325
feature at 218 K, it is seen that when the sample was cooled down the intensity of the 500-530 nm emissions became obviously higher, but that of the 710-740 nm emissions became lower. The reverse occurs during heating for RL/TL of several samples. Equally apparent is that the intensity spike moves to a much higher temperature of 240 K during the R L heating measurements. This difference between heating and cooling is emphasized by the data shown in figure 3(b). Note that at a heating rate of 6 Kmin-' the temperature errors, even allowing for temperature gradients within a sample, are probably less than lo, as emphasized by the sharpness of the spike features. Reproducibility was better than 2".
Cathodoluminescence with electrons in the 10 to 20 keV range only directly excite the crystal to depths of about a micron (energy transport by charge or exciton diffusion may stimulate slightly greater depths of the near surface layer). Consequently the signals can contain significant contributions from short wave- length emission (which are not reabsorbed by the crystal). This was evident for the CL recorded here and the emission bands near 300,420 and 450 nm are all strongly displayed. Discontinuous changes in intensity are clearly apparent and during cooling examples of the data are shown in figure 3 (c). The most obvious feature is that the signals at the UV and red ends of the spectrum show a discontinuity in the opposite sense from those in the green emission region. Similar differences are seen during heating, although the features occur at a temperature some 20" higher. In a few cases there was an indication of a possible higher temperature discontinuity (i.e near 240K in some cooling runs).
2. Emissions above room temperature. During the heating from 30 to 400"C, TL signals were recorded from the KNbOJ samples X-irradiated at 30°C. The normal T L bands were only just above the noise level, except for a small, but very sharp, peak at 219°C. This peak signature was observed from 420-750nm, with the highest intensity at about 540nm, but the signals are too weak for further detailed analysis. RL signals were also recorded between 30 and 300°C during both heating and cooling at several rates and for various X-ray dose rates. An isometric plot of the 270-180°C R L measurements is given in figure 4(a). The related X-ray dose rate was 40 Gy min-'; the temperature was changed at a rate of 6°C min-'. Wavelength slices taken from the isometric plot, figure 4(a), are shown in figure 4(b) for the temperature ranges 185-195°C and 230-240°C. The composition of the higher temperature RL band is broadly similar to that at the lower temperature. However, the relative intensity between the components is not obviously changed during cooling or heating between 30 and 300°C. The RL isometric spectra clearly emphasize the sudden changes in intensity which occur near 220°C during heating, are indicated by an example shown in figure 4(c). This figure also shows the significant change in temperature during the cooling cycle (i.e. down to -200°C).
Similar data are observed for the C L experiments but detailed analysis of the spectra has not been made in this case as a background signal from luminescence of the electron gun has not been removed. There is also the possibility of photo- luminescence signals arising from the UV emission from the electron gun filament. However, the key point of a discontinuity is again evident across the spectral range, as shown in figure 5(a) taken during a heating cycle. There is identical in behaviour to that seen for the low temperature data, where the discontinuities are characterized by differences in transition temperature during a cooling or a

Dow
nloa
ded
By:
[Ing
enta
Con
tent
Dis
tribu
tion
Tand
F tit
les]
At:
12:0
9 26
Jun
e 20
08
326 B. Yung et al.
c' 250
3 200
% 150 v
b 100
- 1851Q5°C ' - 9 - * 230-24OoC
I ' * -
200 300 400 500 600 700 800
Wavelength (nm) 225 - recorded during cooling - - recorded during heating -
Temperature ("C)
Ei '--I loo 180 200 220 240 260 280
Figure 4. (a) High temperature RL data as an isometric plot with (b) as wavelength analysed data and (c) intensity changes during heating and cooling cycles.
heating cycle. Additionally there are intensity spikes over the entire wavelength range during the transition. A further, and unexpected feature, is shown by figure 5 (b) in which the ratio of the CL plateau levels of intensity differ for heating and cooling (i.e. the plateau levels decrease in each direction).
It should be noted that there are differences between the relative intensities and details of the emission spectra of different samples. The absolute TL, CL or RL intensity and relative intensities between the emission bands are quite different from one sample to another. Even in the same sample, the absolute and relative intensities are dependent on changes caused by the irradiations and the thermal cycling. These features have not been pursued here as they appear to be independent, and of secondary importance, from the main objective, which

Dow
nloa
ded
By:
[Ing
enta
Con
tent
Dis
tribu
tion
Tand
F tit
les]
At:
12:0
9 26
Jun
e 20
08
Optical detection of phase transitions in KNbO3
420-
n
'g 370'
c,
d a
2
v
-@ 320
Q E 270
327
'
'
I
x n g - recorded during cooling heating
:+hw-+,-
I I I I I
Temperature ("C)
Figure 5 . ( a ) CL isometric data and (b) intensity changes which differ during heating and cooling cycles.
is recording the anomalies that appear in the region of the phase transition temperatures.
Discussion The primary objective of this experiment was to see if it is feasible to monitor
phase transitions in KNb03 by the luminescence response. Quite clearly this can be done using any of the techniques of T L , or R L and CL as a function of temperature. It is also apparent that there is considerable variation in response between samples, and indeed in some cases the changes in signal levels were barely discernible. Nevertheless the appearance of consistent transition temperatures was much less sample sensitive. Further, the thermal cycling and/or ionization caused

Dow
nloa
ded
By:
[Ing
enta
Con
tent
Dis
tribu
tion
Tand
F tit
les]
At:
12:0
9 26
Jun
e 20
08
328 B. Yang et al.
by the X-rays or electron beams altered the signals, and in some cases destroyed them. These observations thus reflect directly on the variations of quality of the samples. The high degree of damage sensitivity to ionization was partially expected, since in the earlier route to optical waveguide formation by ion beam amorphization of a buried layer it was found that the crystals are damaged extremely readily by the ion beam. In that situation it was a favourable property, but such a response points to either instabilities in the lattice structure or inherent strains or impurities which stabilize ionic displacements. Such sensitivity to ionization implies the samples are likely to have a high degree of variability as a result of intrinsic defects, particularly from the inevitable local variations in stoichiometry, or strains generated during the growth process. Associated with these growth problems will be a sensitivity to extrinsic imperfections (i.e. impurities) and macroscopic defects such as dislocations and grain boundaries.
While the specimens were single crystals they were not deliberately poled in a single direction, as it was assumed that thermal cycling through phase transitions would lose this homogeneity of orientation. One can therefore speculate that some of the features observed relate to changes in the degree of sample poling that would occur with differences in strain or grain size. Conversely, the clarity of the transitions, as sensed by luminescence, may be useful in the future as a monitor of poling quality.
A further aspect of a readily damaged material is that during the rapid restructuring which occurs during a phase transition different parts of the crystal may exhibit different stability and this will be influenced by the incorporation of vacancies or other intrinsic defects. Features which might reveal this behaviour are: (i) differences in the phase transition temperatures for materials grown in different laboratories; (ii) a sudden release of luminescence energy during the phase transition (both in heating and cooling) as electrons and holes, or even ions are liberated from normal locations; (iii) differences in the apparent transition temperatures during the dynamic events of heating and cooling. For KNb03 each of these features is observed, as was shown by the data within figures 1 to 5 .
The response of the luminescence changes in KNb03 can be contrasted with those of other materials which have been examined by these luminescence routes. For example in the ammonium bromide case [14] the transition temperatures were consistent in both cooling and heating and they displayed far larger differences in intensity and movement of the emission bands as a result of changing phase. Additionally there was no evidence of the luminescence ‘spike’ which is so clearly characteristic of the events in KNb03 . Indeed, the good agreement between the crystallographic and luminescence values for the ammonium bromide transition temperatures was sufficient that it was used in the present work to check the temperature calibration of the equipment. This therefore removed doubts as to the origin of differences in temperature of the KNb03 signals, and their correlation with cited phase transition temperatures. A further difference between the bromide and the niobate is that in the former all wavelengths responded in the same sense and the changes were independent of direction. This is not the case here, where for example the green signals decreased while the UV and red signals increased. Such effects need more detailed modelling and would require consid- eration of factors such as pressure effects, changes in band structure, thermal or irradiation induced lattice defect sites, and the associated changes in recombination transition probabilities.

Dow
nloa
ded
By:
[Ing
enta
Con
tent
Dis
tribu
tion
Tand
F tit
les]
At:
12:0
9 26
Jun
e 20
08
Optical detection of phase transitions in KNbO3 329
An unexpected feature reported here is that for the same crystals there is a hysteresis effect in which the transition spikes etc occur at higher temperatures during heating than in cooling. The first possibility is that this is an unfortunate experimental artefact caused by temperature gradients within the material. This is unlikely, since the temperature 'spikes' are less than 2" wide, and so it seems improbable that one could generate the observed 20" differences as a result of poor thermal conduction. Nevertheless, a series of measurements were made with rates of 1 , 3 , 6 and 10" min-'. These produced identical hysteresis effects with an error range of -1". The sharpness of the transitions during heating was always over -2" degree range, but at the lower heating rates there was a slightly broader span of -5" for the 220 K cooling step. In several cases the step was in two stages separated by about 2" within this temperate range. Hysteresis is therefore unequivocally demonstrated for these KNb03 phase transitions. Conceptually this is not a problem since there are considerable structural relaxations involved in a material which is of interest precisely because it has extremely strong non-linear responses resulting from intense internal electric fields and non-centrosymmetric structure. Relaxation and restructuring during the transitions will inevitably allow a burst of high mobility charge release that in turn allows the appearance of a luminescence 'spike'. The equilibrium luminescence efficiency of adjacent phases will differ, hence the plateau levels alter on crossing the transition temperature. Lumines- cence efficiency is sensitive to the many competing factors discussed above which can therefore offer an explanation of the observed data.
For a material such as KNb03, which is extremely difficult to fabricate, it is not surprising that the various samples differ slightly in their precise transition temperature in the surface or the bulk, and that they have very varied lumines- cence responses. More importantly it is a fortunate characteristic that the desirable non-linear properties are sufficiently robust to appear in each case, even if the materials are probably still far from optimum in their performance in photonic applications.
Table 1 indicates that in the literature different phase transition temperatures are cited by different authors and suppliers, even for X-ray crystallographic type observations. Additionally, we have found no references to hysteresis. It is thus necessary to examine more cautiously the tabulated values. Although the earlier T L report [13] cites agreement with the 263 K transition, closer examination of their original data [20] reveals that the 'transition' event was in fact a multiple feature. Several authors merely quote 'literature' values and in practice the experimental techniques used are not consistent. Hewat [ l l ] used neutron diffrac- tion recorded at increasingly higher temperatures, whereas the Chinese material from Photox [12] used X-ray diffraction data recorded during cooling (private communication, 2000). Both routes involve extremely long times and considerable experimental care and skill to acquire the data. For materials which are radiation sensitive there is also a further inhibition about making measurements in the reverse temperature direction. Consequently the presence of the hysteresis had not been noted and the variations in cited transition temperatures have presumably been ascribed to differences in samples or experimental calibrations.
Data from the current experiments suggest that surface transitions, sensed by CL, may differ slightly from those of the bulk material seen by RL and T L . These are minor effects but may be relevant to indicate that surface structures have undergone some relaxations. This has consequences for the use of K N b 0 3 in
Dow
nloa
ded
By:
[Ing
enta
Con
tent
Dis
tribu
tion
Tand
F tit
les]
At:
12:0
9 26
Jun
e 20
08
330 B. Yung et al.
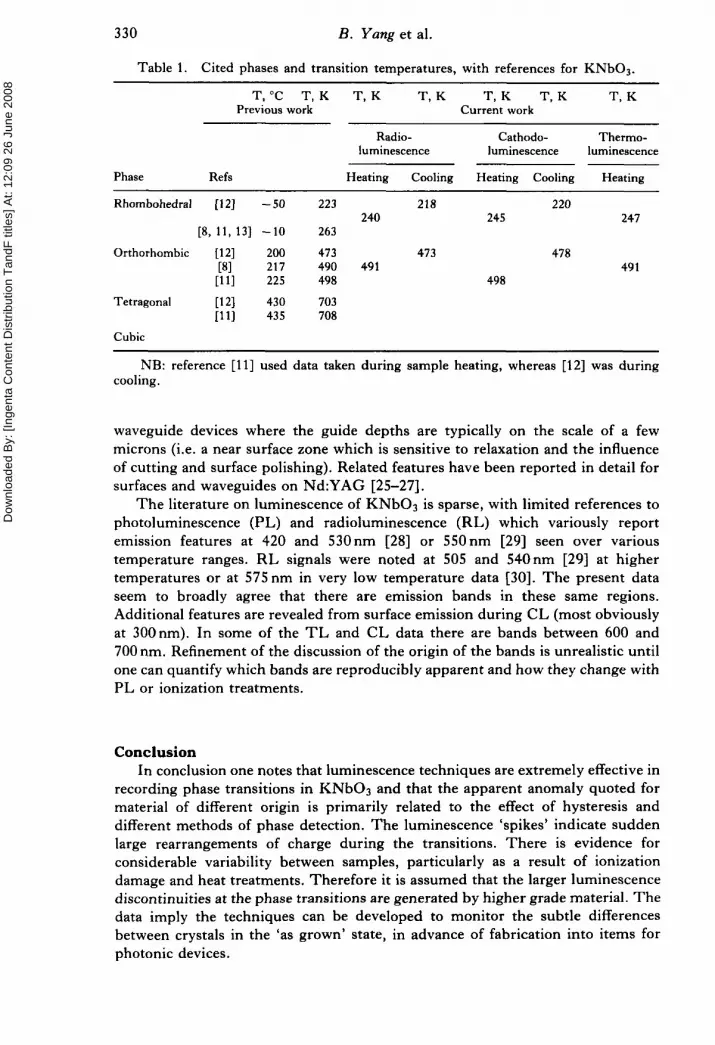
Table 1. Cited phases and transition temperatures, with references for KNb03.
T, “C T, K T, K T, K T, K T, K T, K Previous work Current work
Radio- Cathodo- Therrno- luminescence luminescence luminescence
Phase Refs Heating Cooling Heating Cooling Heating
Rhombohedra1 [12] -50
[8, 1 1 , 131 -10
Orthorhombic [12] 200 [8] 217 [ l l ] 225
Tetragonal [12] 430 [ l l ] 435
Cubic
223 218 220
263
473 473 478 490 491 49 1 498 498
703 708
240 245 247
NB: reference [ll] used data taken during sample heating, whereas [12] was during cooling.
waveguide devices where the guide depths are typically on the scale of a few microns (i.e. a near surface zone which is sensitive to relaxation and the influence of cutting and surface polishing). Related features have been reported in detail for surfaces and waveguides on Nd:YAG [25-271.
The literature on luminescence of KNb03 is sparse, with limited references to photoluminescence (PL) and radioluminescence (RL) which variously report emission features at 420 and 530nm [28] or 550nm [29] seen over various temperature ranges. RL signals were noted at 505 and 540nm [29] at higher temperatures or at 575nm in very low temperature data [30]. The present data seem to broadly agree that there are emission bands in these same regions. Additional features are revealed from surface emission during CL (most obviously at 300nm). In some of the TL and CL data there are bands between 600 and 700 nm. Refinement of the discussion of the origin of the bands is unrealistic until one can quantify which bands are reproducibly apparent and how they change with PL or ionization treatments.
Conclusion In conclusion one notes that luminescence techniques are extremely effective in
recording phase transitions in KNb03 and that the apparent anomaly quoted for material of different origin is primarily related to the effect of hysteresis and different methods of phase detection. The luminescence ‘spikes’ indicate sudden large rearrangements of charge during the transitions. There is evidence for considerable variability between samples, particularly as a result of ionization damage and heat treatments. Therefore it is assumed that the larger luminescence discontinuities at the phase transitions are generated by higher grade material. The data imply the techniques can be developed to monitor the subtle differences between crystals in the ‘as grown’ state, in advance of fabrication into items for photonic devices.

Dow
nloa
ded
By:
[Ing
enta
Con
tent
Dis
tribu
tion
Tand
F tit
les]
At:
12:0
9 26
Jun
e 20
08
Optical detection of phase transitions in KNbO3 331
Acknowledgments
financial support. W e are grateful to the EPSRC and the Hashemite University of Jordan for
References [l] GUNTER, P., 1974, Optics Cornmun., 11, 285. [2] BAUMERT, J. C., GUNTER, P., and MELCHIOR, H., 1985, Optics Commun., 48, 213. [3] GUNTER, P., and HUIGNARD, J. (Eds), 1988, Photorefractive Materials and their
[4] FLUCK, D., and GUNTER, P., J. Selected Topics Quant. Electron., in press. [5] BREMER, T., HEILAND, W., HELLERMAN, B., HERTEL, P., KRATZIG, E., and KOLLEWE,
[6] ZHANG, L., CHANDLER, P. J., and TOWNSEND, P. D., 1990, Ferroelectrics Lett . , 11, 89. [7] FLUCK, D., GUNTER, P., IRMSCHER, R., and BUCHAL, C., 1991, Appl Phys. Lett . , 59,
Applications, Topics in Applied Physics, 61 (Berlin: Springer).
D., 1988, Ferroelectrics Lett., 9, 11.
9 9 1 9 J L I J .
[8] FLUCK, D., BINDER, B., KUPFER, M., LOOSER, H., BUCHAL, C., and GUNTER, P., 1992,
[9] TOWNSEND, P. D., CHANDLER, P. J., and ZHANG, L., 1994 Optical Effects of Ion
[lo] PLISK, T., SOLCIA, C., FLUCK, D., GUNTER, P., BECKERS, L., and BUCHAL, C., 1997,
[ l l ] HEWAT, A. W., 1973, J. Phys. C, 6, 2559. [12] PHOTOX Optical Systems, Oxford, UK. Data sheets for KNb03. [13] GRIGORJEVA, L. G., MILLERS, D. K., POPOV, A. I., KOTOMIN, E. A., and POLZIK, E. S.,
[14] TOWNSEND, P. D., ROWLANDS, A. P., and CORRADI, G., 1997, Rad. Meas., 27, 31. [15] TOWNSEND, P. D., WOOD, R. A., BROCKLESBY, W., BROWN, R. S., and TOWNSEND, J. E.,
1996, Rad. Protect. Dosimetry, 65, 363. [16] KARALI, T., ROWLANDS, A. P., TOWNSEND, P. D., PROKIC, M., and OLIVARES, J., 1998,
J. Phys. D , 31, 754. [17] KARALI, T., TOWNSEND, P. D., PROKIC, M., and ROWLANDS, A. P., 1999, Rad. Protect
Dosimetry, 84, 281. [18] ROWLANDS, A. P., TERRONES, M., KORDATOS, K., and TOWNSEND, P. D., 1998, in
Luminescence Materials V I , edited by C. R. Ronda and T. Welker (Pennington, USA: Electrochemical Society), 97/29, 129.
Optics Commun., 90, 304.
Implantation (Cambridge: Cambridge University Press).
J. Appl. Phys., 81, 1099.
1997, J. Luminescence, 72-74, 672.
[19] ROWLANDS, A. P., 1998, Doctoral thesis, Sussex. [20] POPOV, A. I., EGLITIS, R. I., KOTOMIN, E. A., GRIGORJEVA, L. G., and MILLERS, D. K.,
1996, Proceedings of the ESF Workshop on Oxide Crystals, Budapest, September 1996.
[21] MIRZA, K. A., TOWNSEND, P. D., and DESTEFANIS, G. L., 1978, Phys. Status Solidi A , 47, K63.
[22] SCRIPSICK, M., TOWNSEND, P. D., and HALLIBURTON, L. E., 1986, Rad. Effects, 98, 259.
[23] TOMITA, A., FUKUDA, Y., and TAKEUCHI, N., 1992, Phys. Status Solidi A , 134, 279. [24] LUFF, B. J., and TOWNSEND, P. D., 1993, Meas. Sci. Technol., 4, 65. [25] PETO, A., TOWNSEND, P. D., HOLE, D. E., and HARMER, S., 1997, J. Mod. Opt . , 44,
1217. [26] VAZQUEZ, G. V., RAMS, J. R., TOWNSEND, P. D., and HOLE, D. E., 1999, Opt .
[27] TOWNSEND, P. D., 1999, Rad. Effects, 150, 127. [28] BLASSE, G., and DEHAART, L. G. J., 1986, Mater. Chem. Phys, 14, 481. [29] ZALDO, C., GUNTER, P., and AREND, H., 1987, Crystal Lattice Defects, 15, 123. [30] POPOV, A. I., and BALANZANT, E., 2000, Nucl. Instrum. Meth. B , 166/167, 305.
Commun., 167, 171.


