Embed Size (px)
Citation preview

Ecological Modelling 145 (2001) 225–241
Optimal strategies for the use of reindeer rangelands
Erling Moxnes a,*, O� je Danell b, Eldar Gaare c, Jouko Kumpula d
a Foundation for Research in Economics and Business Administration, SNF, Brei�iks�eien 40, N-5045 Bergen, Norwayb Swedish Uni�ersity of Agricultural Sciences, PO Box 7023, S-750 07 Uppsala, Sweden
c NINA/NIKU, Tungasletta 2, N-7005 Trondheim, Norwayd Finnish Game and Fisheries Research Institute, Reindeer Research Station, FIN-999010 Kaamanen, Finland
Received 14 November 2000; received in revised form 15 June 2001; accepted 29 June 2001
Abstract
The problem of optimal adaptation of reindeer herds to rangelands under uncertain environmental conditions andmeasurement errors is studied by stochastic dynamic programming (SDP) and by stochastic optimisation in policyspace (SOPS). The study expands on earlier studies by including measurement error, body weights, alternatives tolichen in winter pastures, wastage of lichen by cratering reindeer, and by including both summer and winter pasturesin the same model. The analysis shows that it is important to get precise estimates of lichen growth, alternatives tolichen are only important if their digestibility is above a minimum level, variable costs only matter for the optimalherd size when summer grazing is limiting, modest discounting has little effect, the policy is not sensitive to the degreeof natural variation, while the value of reindeer husbandry is significantly reduced by increasing climatic variation, thepolicy is sensitive to measurement error, and there is a considerable value of higher precision in measurements.© 2001 Elsevier Science B.V. All rights reserved.
Keywords: Reindeer; Management; Harvesting strategies; Uncertainty; Measurement error
www.elsevier.com/locate/ecolmodel
1. Introduction
We consider the problem of optimal adaptationof reindeer herds (Rangifer t. tarandus) to avail-able rangelands. This problem is complicated bydynamics, uncertain environmental variation inrange quality, and by measurement errors. Thesefactors are all likely to degrade the quality ofdecision making if they are not properly dealt
with. That current practices at times could beimproved, is indicated by many reports on over-grazing, as well as by experimental investigationsshowing tendencies towards systematic mispercep-tions of the dynamic interactions of herds andgrazelands (Moxnes, 1998b,c, 2000).
A model is developed to find optimal manage-ment strategies by the use of stochastic dynamicprogramming (SDP), and by stochastic optimisa-tion in policy space (SOPS) when measurementerrors are considered. We build on earlier mod-elling studies (Gaare and Skogland, 1980; Moxneset al., 1993; Virtala, 1992, 1996). A large numberof empirical investigations from various countries
* Corresponding author. Tel.: +47-5595-9526/5558-4119;fax: +47-5595-9439.
E-mail address: [email protected] (E. Moxnes).
0304-3800/01/$ - see front matter © 2001 Elsevier Science B.V. All rights reserved.
PII: S 0304 -3800 (01 )00393 -3

E. Moxnes et al. / Ecological Modelling 145 (2001) 225–241226
are used. We produce our own estimates of envi-ronmental variation. We do not consider herdstructures, geographical distributions of range-lands, or competition among reindeer herders.Focus is on optimal planning for a reindeer herd-ing district.
Of particular relevance is the work by Virtala(1996). We expand on his study in several direc-tions. Through a series of sensitivity test we findthat the inclusion of summer rangelands is impor-tant for the optimal policy. Explicit modelling ofreindeer slaughter weight is not important. Ran-dom errors in measurements of lichen are foundto be important. The inclusion of naturally avail-able alternatives to lichens in the winter is foundto be of little importance for the optimal policy,unless the digestibility of the alternatives is suffi-ciently high. Sensitivity tests are also used toquantify the importance of other key assumptionsabout natural variation, variable costs, discount-ing, calving rates, survival rates, and the relation-ship between the lichen stock and its growth rate.Some of these factors are clearly much moreimportant to quantify with precision than others.Hence, our findings indicate to what extent ourresults can be generalised and they suggest priori-ties for further research.
2. Model
Here, we give a description of the model suffi-cient to replicate our analysis. Further discussionsof details and data are found in Moxnes et al.(1998). All parameter values are shown in Table1.
We want to maximise the expected net presentvalue V of reindeer husbandry in a given herdingdistrict
V=E� �
�
t=0
1(1+r)t�t
n, (1)
where V is the expected value of the sum ofdiscounted yearly profits �t. A discount rate rgreater than 0 implies that less weight is put onfuture profits. We build on an assumption thatthe reindeer herders in our district operate in amarket system where profits can be invested or
consumed. Hence fluctuations in profits do notautomatically lead to fluctuations in consumption.If we had modelled a pastoralist with no access tomarkets, another criterion should have been cho-sen, putting explicit weight on the availability ofmeat for personal consumption in each year. Withour assumptions, the discount rate r reflects theinvestment or borrowing opportunities elsewhere.Hence, in our analysis, we expect solutions whereherders invest in reindeer as long this gives ahigher return than alternative investments, andvice versa.
Yearly profits
�t=p [wmwtHt+wcwt(1−bb)Kt/(1+r)]
−c(Rt−Ht) (2)
equal the difference between incomes from salesof meat and costs. Incomes are determined by theprice p times meat production in brackets. Costsare given by a unit cost c times the escapementRt−Ht, which is the number of reindeer Rt minusslaughtering Ht. Ht is the decision variable. Byassuming c equal to 0 (and p equal to 1), ourproblem collapses to a maximisation of meat pro-duction rather than profits.
Meat production is composed of the slaughter-ing of both breeding stock and calves. Breedingstock is defined as adult females and males. Meatproduction from the breeding stock is made up byslaughtering Ht multiplied by the average weight.The average weight is the product of a standardcarcass weight per breeding stock wm and a gen-eral weight index wt reflecting the general condi-tion of all animals. Meat production from calvesis the product of the number of calves Kt, thefraction being slaughtered, 1−bb, the averagecarcass weight of calves wc, and the general weightindex wt. Meat production from calves is adjustedby the discount rate r. This reflects that while thebreeding stock is assumed to be slaughtered at thebeginning of the year (we define the year to beginin the autumn), calves are slaughtered at the endof the same year (the next autumn).
The total number of calves
Kt=bfkt�t(Rt−Ht) (3)
is given by the product of the fraction of femalesin the breeding stock bf, the average calving frac-

E. Moxnes et al. / Ecological Modelling 145 (2001) 225–241 227
tion kt for the females, the survival rate for thebreeding stock �t, and the escapement Rt−Ht.
The number of reindeer before next year’sslaughtering
Rt+1=�t(Rt−Ht)+bbKt (4)
is made up of the surviving breeding stock plusthe calves that are not slaughtered. Hence, thebreeding stock is composed of all age classesincluding the 1-year-olds. As we do not considerthe problem of herd structuring, the fraction ofcalves being added to the breeding stock bb isconstant. By assuming that nearly all femalecalves enter the breeding stock at all times, maxi-mal flexibility is ensured in that growth can be
maximised by setting Ht equal to 0. All stockreductions are made by Ht.
The calving rate measures calves surviving untilautumn slaughtering. The calving fraction kt forfemales is given as a logistic function of averagetotal body weight (Fig. 1(a); Eloranta and Niemi-nen, 1986; Lenvik and Aune, 1988; Moxnes et al.,1993):
kt=kmax
1+ (wTwt�kt/whk)�k(5)
Total body weight equals a maximum bodyweight without rumen fill wT times the weightindex wt. The parameter whk represents the weightat which the calving rate is one-half of kmax. The
Table 1Model parameters
ValueDescription UnitSymbol
A haArea in winter grazings normally covered by lichen 1500�1Exponent 1 for the lichen growth function 1.5�2 2.5Exponent 2 for the lichen growth function��G −2.0Exponent for the feeding level of summer grazings
−10Exponent for the recruitment function �k
�L 2.0Exponent for the loss of lichen�sExponent for the lichen share in winter food −2.0
−7Exponent for the survival function �v
bfFraction of the breeding stock being female 0.9��Gh 300Summer grazings per animal cutting feeding level in half kg DM/year/reindeerbbFraction of calves entering the breeding stock 0.5cCost per reindeer 0.2 1000 NOK/year/rcLCarrying capacity in areas norm covered by lichen 6000 kg DM/ha
0.35Minimum feeding level for winter rangelands �0
GTotal amount of summer grazings with appropriate quality 600 tonne DM/yeargmaxMaximum growth of lichen per ha 320 kg DM/ha/year
300 kg DM/year/deerhmaxMaximum intake of lichen per animal per yearkmax 0.9Maximum calving percentage for femaleslmax 4.5Maximum relative loss of lichen due to grazing
Minimum relative loss of lichen due to grazing lmin 0.5Price of reindeer meat p 0.045 1000 NOK/kg & per yearDiscount rate r 0.05Minimum lichen share with no effect on feeding level sL0 0.82
0.9sLmaxMaximum lichen sharesLhLichen per hectare cutting feeding level in half 500 kg DM/ha
Maximum survival �max 1.0kg/reindeer20Standard meat weight per calf wc
whkWeight cutting calving in half 57 kg/reindeerWeight cutting survival in half whv kg/reindeer41
wm 40 kg/reindeerStandard meat weight per breeding stockwminMinimum weight index 0.6
kg/reindeerwTNormal body weight per breeding stock 72.3
E. Moxnes et al. / Ecological Modelling 145 (2001) 225–241228
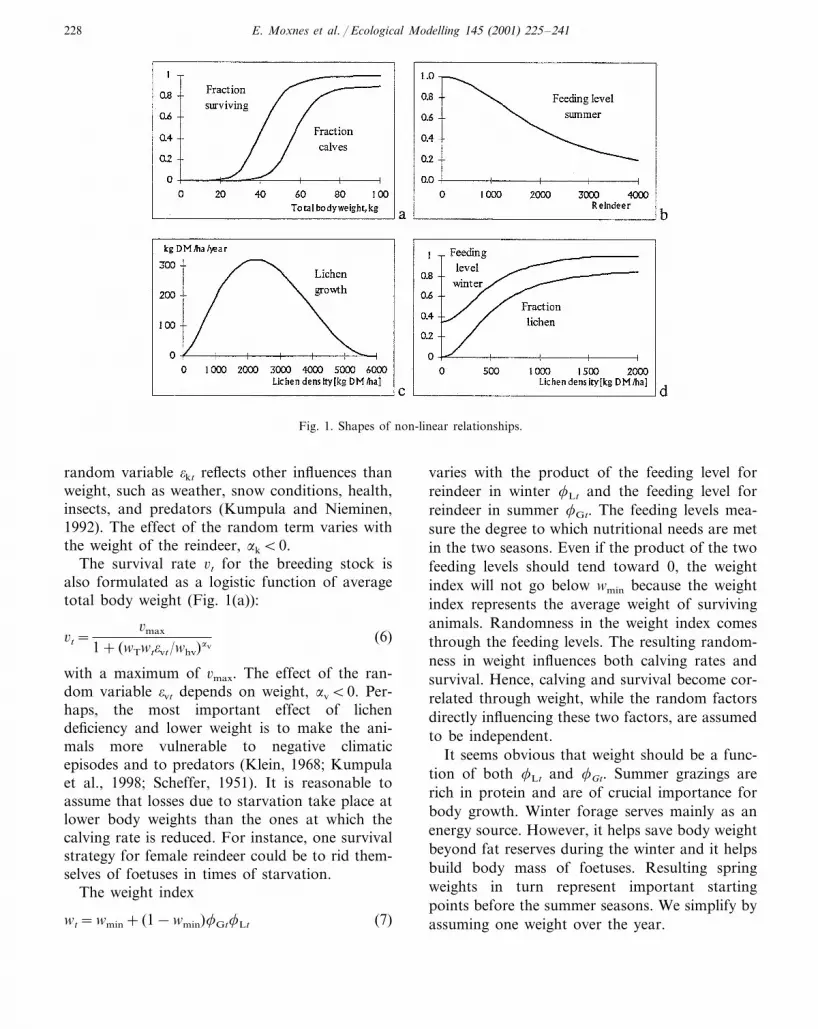
Fig. 1. Shapes of non-linear relationships.
random variable �kt reflects other influences thanweight, such as weather, snow conditions, health,insects, and predators (Kumpula and Nieminen,1992). The effect of the random term varies withthe weight of the reindeer, �k�0.
The survival rate �t for the breeding stock isalso formulated as a logistic function of averagetotal body weight (Fig. 1(a)):
�t=�max
1+ (wTwt�vt/whv)�v(6)
with a maximum of �max. The effect of the ran-dom variable �vt depends on weight, �v�0. Per-haps, the most important effect of lichendeficiency and lower weight is to make the ani-mals more vulnerable to negative climaticepisodes and to predators (Klein, 1968; Kumpulaet al., 1998; Scheffer, 1951). It is reasonable toassume that losses due to starvation take place atlower body weights than the ones at which thecalving rate is reduced. For instance, one survivalstrategy for female reindeer could be to rid them-selves of foetuses in times of starvation.
The weight index
wt=wmin+ (1−wmin)�Gt�Lt (7)
varies with the product of the feeding level forreindeer in winter �Lt and the feeding level forreindeer in summer �Gt. The feeding levels mea-sure the degree to which nutritional needs are metin the two seasons. Even if the product of the twofeeding levels should tend toward 0, the weightindex will not go below wmin because the weightindex represents the average weight of survivinganimals. Randomness in the weight index comesthrough the feeding levels. The resulting random-ness in weight influences both calving rates andsurvival. Hence, calving and survival become cor-related through weight, while the random factorsdirectly influencing these two factors, are assumedto be independent.
It seems obvious that weight should be a func-tion of both �Lt and �Gt. Summer grazings arerich in protein and are of crucial importance forbody growth. Winter forage serves mainly as anenergy source. However, it helps save body weightbeyond fat reserves during the winter and it helpsbuild body mass of foetuses. Resulting springweights in turn represent important startingpoints before the summer seasons. We simplify byassuming one weight over the year.

E. Moxnes et al. / Ecological Modelling 145 (2001) 225–241 229
From the literature it seems clear that bothspring and autumn weights are important forcalving rates (Cameron et al., 1993; Eloranta andNieminen, 1986; Gaare and Skogland, 1980; Ko-jola and Helle, 1993; Kojola et al., 1995;Kumpula et al., 1998; Kumpula and Nieminen,1992; Lenvik and Aune, 1988; Ouellet et al., 1997;White et al., 1981). For survival, it seems likelythat winter conditions dominate (Kumpula et al.,1998). Carcass slaughter weights primarily reflectsummer conditions (Kumpula et al., 1998;Kumpula and Nieminen, 1992; White et al., 1981;White and Luick, 1984). However, winter condi-tions also matter for slaughter weights, particu-larly for calves, which make up a large fraction ofslaughtered animals (Eloranta and Nieminen,1986; Jacobsen et al., 1981; Kojola et al., 1995;Kumpula et al., 1998).
Eq. (7) also represents an approximation withrespect to the timing of effects. The summerrangelands of greatest importance for losses, calv-ing rates, and breeding stock slaughter weights arethe ones in the preceding summer. Thus ideally,weight should be a function of the feeding level inthe preceding year ending in the autumn, �Gt−1.Only the slaughter weights of calves are correctlyformulated as a function of the feeding level ofthe current year, �Gt. The introduction of alagged feeding level would both complicate opti-misation and presentation of results. Moxnes etal. (1998) found no important effects of the sim-plification made, also see the section on measure-ment error in this paper.
The feeding level for summer rangelands
�Gt=�Gt
1+ ((G/(Rt−Ht))/��Gh)��G(8)
is given by a logistic function of the availability ofsummer grazings G per escapement Rt−Ht, asshown in Fig. 1(b). The feeding level concept(Andersen and Ursin, 1977), corresponds to thefunctional response concept by Holling (1965). Tothe extent that there is a lack of high qualityplants, the animals will add lower quality plantsto their diet. However, the lower quality impliesthat weight growth is hampered. This compensat-ing mechanism should imply that the feeding levelis not quite inversely related to the amount of
high quality fodder per animal. The parameter��Gh denotes the amount of high quality summerrangelands per animal, which cuts the feedinglevel in half. The random variable �Gt denotesvariations in the feeding level, ��G�0.
An effect of reindeer density on the feedinglevel for summer rangelands seems obvious (Helleand Kojola, 1994), although limited data may notalways reveal the effect (Kumpula and Nieminen,1992; Tyler, 1998). Yearly variations are typicallydue to variations in grazing quality and insectharassment. The model does not capture possiblelong-term adaptations and changes in quality ofsummer rangelands due to grazing pressure.
Ideally, the feeding level for summer rangelandsshould depend on the breeding stock plus calves.However, without a lagged version of the weightindex, adding calves in Eq. (8) would produce aset of non-linear simultaneous equations. Thesteady-state error caused by ignoring calves canbe counteracted by adjusting G. Moxnes et al.(1998) found no important effect on optimal poli-cies of this simplification.
The second state variable of the model is lichenLt, measured in kg dry matter (DM). Major spe-cies of fruticose lichen growing on the ground areCetraria ni�alis, Cladonia arbuscula coll., Cladoniastellaris and Stereocaulon paschale. Lichen repre-sents the major source of winter fodder in themodel. In addition to lichen, reindeer also eatshrubs, dead foliage of graminoids, and mosses inwinter. Lichen next year
Lt+1=Lt+gt−ht (9)
differs from last year’s lichen level Lt due toyearly growth gt and yearly grazing ht.
To comply with standard notations in the liter-ature, growth of lichen
gt=Agmax
(�1/(�1+�2))�1(�2/(�1+�2))�2
�Lt/AcL
��1
�1−
Lt/AcL
��2
�Lt (10)
is calculated as growth per hectare before thisspecific growth rate is multiplied with the numberof hectares A in the district (Fig. 1(c)). We defineA as the subarea naturally covered by lichen, i.e.the area with lichen mat. The ecological carrying

E. Moxnes et al. / Ecological Modelling 145 (2001) 225–241230
capacity of lichen cL is also defined in terms of kgDM/ha. Our definition of lichen is such that cL
(6000 kg DM/ha) falls between 3000 kg DM/haindicated in Helle et al. (1990) and 12 000 kgDM/ha used in Dahle et al. (1998).
The maximum sustainable yield per hectaregmax is based on data in Dahle et al. (1998). Bychoosing �1��2, the growth function will beskewed. The lichen level which maximises growthis Lmsy=cLA(�1/(�1+�2)). Indications of the de-gree of skewness can be found in Igoshina (1939),Lyftingsmo (1965), Karenlampi (1971), Andreyev(1977), Helle et al. (1990), Kumpula et al. (2000).By reducing �1 and �2 simultaneously, the growthfunction will become wider, and vice versa. Thegrowth function is not explicit about the competi-tion between lichen, moss, grass etc. (Gaare,1995). Reindeer grazing does not influence therelative growth of the remaining part of the plant(Gaare, 1986; Igoshina, 1939; Karenlampi, 1971).
Karenlampi (1971) finds that rainfall is thedominant climatic factor influencing relativelichen growth. The relationship seems to be alinear one over the observed range of rainfall,0–3.5 mm/day, with around 95% of the variationexplained. This relationship can be used to esti-mate the coefficient of variation for the randomvariable �Lt from time-series data for rainfall.
Removal of lichen due to reindeer grazing
ht=hmaxsLt(Rt−Ht)(1+ lt)min(1,��t) (11)
depends on the maximum intake of lichen perreindeer hmax times the fraction of winter foddercoming from lichen sLt times the reindeer escape-ment. In addition, removal is increased bywastage of lichen lt caused by grazing reindeer.Here, lt is defined as the fraction of lichen that isreally lost due to grazing, for instance by endingup in lakes and rivers. It does not include lichen,which fastens in a new locations and continues togrow there. The hmax used reflects data shown inDahle et al. (1998). The random factor ��t denotesvariations in the availability of winter forage dueto weather conditions. The min-function impliesthat it is only harsh conditions that matter.
The share of winter fodder coming from lichenis given as a logistic function of the density oflichen, Lt/A (Fig. 1(d)):
sLt=sLmax
1+ (Lt/A/sLh)�s(12)
The chosen relationship is consistent with dietdata (lichen, dwarf shrubs, and mosses) for differ-ent lichen levels shown in Kojola et al. (1995),�s�0.
The winter feeding level
�Lt=min�
1,�0+ (1−�0)sLt
sL0
�min(1,��t) (13)
is assumed to depend on both the lichen share andthe digestibility of alternative fodder, which isassumed to be limited only by its quality. Whenthe lichen share sLt is low, the animals are notable to process all the alternative food they need.Hence, the feeding level drops towards a lowerlimit �0 (Robbins, 1993). When sLt is greater thansL0, the indicated feeding level is 1.0. The randomfactor ��t is the same as in Eq. (11). Fig. 1(d)shows the feeding level as a function of lichendensity Lt/A and not the lichen share sLt.
Finally, the fraction of lichen that is wasted andlost due to reindeer grazing
lt= lmin+ (lmax− lmin)�Lt/A
cL
��L
(14)
is assumed to increase with the density of lichen,Lt/A, relative to the carrying capacity of lichen, cL
(Gaare, 1995; Gaare and Skogland, 1980), �L�0.For zero lichen the loss fraction is at its mini-mum, lmin, and at the carrying capacity it equalslmax.
The parameters values used in the model arecompiled in Table 1. They reflect findings in thereferred literature typical of subcontinental rein-deer husbandry. The two parameters denoting thesize of the area, A and G are chosen to reflectsummer and winter areas with capacities ofaround 1000 reindeer. The important parametersof our analysis are those that characterise rela-tionships, not those that denote the size and pro-ductivity of the area or the consumption perreindeer.
Table 2 shows data for the random variables,which were all assumed normally and indepen-dently distributed with means 1.0. The estimatesare based on data and Monte Carlo simulationsdescribed in Moxnes et al. (1998).

E. Moxnes et al. / Ecological Modelling 145 (2001) 225–241 231
Table 2Means and standard deviations for normally distributed ran-dom variables
Mean S.D.Symbol
���Feeding level in winter 1.0 0.10�Gt 1.0 0.08Availability and quality of
summer rangelands1.0Calving 0.07�kt
1.0�Lt 0.28Growth of lichen1.0Survival 0.12�vt
variables weight and calving, which are non-lin-ear, stochastic functions of underlying states. Tosimplify, we replaced the expected value by thedeterministic value of profits. In Moxnes et al.(1998), this simplification was found to be of littleimportance for policies.
When measurement errors were introduced, weapplied a method termed ‘SOPS’ (see Moxnes,1998d for details). In short, this method trans-forms the problem of SDP into a problem ofstatic non-linear optimisation, i.e. maximise
W(�)= �M
m=1
� �T
t=0
1(1+r)t�t(Ht,R� t,L� t,�)
n, (16)
where W(�) is a Monte Carlo estimate of theexpected net present value V over M individualsimulations, and where � is a vector of parametersin a management strategy Ht(R� t,L� t,�). A non-lin-ear search routine (Fletcher–Powell) is used tosearch for the vector � which maximises W(�). R� t
and L� t represent estimators for the actual states Rt
and Lt.The random variables �it of the model were
changed to �itmn. Thus, besides varying with time,the random variables varied over Monte Carloruns m and over replications n of the entireparameter search. Each search n produced one ofN=30 stochastic solutions to the problem. Theten searches with the highest W-values were usedto calculate average values and standard devia-tions for W and �. Each search started from arandomly chosen set of initial policy parameters�0 (drawn from uniform distributions). In prelimi-nary searches, a wide range for �0 was used tosearch for the global optimum and to rule outlocal optima. The N searches started from morenarrow ranges for �0 to gain precision. EachMonte Carlo run started out with randomly cho-sen initial levels of R0 and L0. For both R and L,lower limits, R0min and L0min prevented extinction.Exact parameters are shown in Table 3.
3. Methods
Except for the case with measurement error, weused SDP, to find optimal policies (Bertsekas,1987). Central in this method is the dynamicprogramming equation
V(Rt,Lt)
=max[E{�t(Rt,Lt,Ht)}+�E{V(Rt+1,Lt+1)}].(15)
The problem is solved backwards in time, start-ing with assumptions about next period’s expectedvalues E{V(Rt+1,Lt+1)}. Then maximisation iscarried out for period t. An optimal policyHt(Rt,Lt) is found. The same procedure is re-peated at time t−1 and so forth, until the policyfunction no longer changes and we have found atime-independent, steady-state policy H(Rt,Lt).
We used a Markov transition matrix to denotethe probability of going from each possible es-capement Xt−Ht to each possible future stateXt+1, where Xt is a state vector (Rt,Lt). A gridwith 30×30 cells defines the possible states. Thetransition matrix was found by Monte Carlo sim-ulations with 10 000 replications. Because theprofit �t is not a direct function of state variablesRt and Lt, it is not straight-forward to calculateexpected current profits E{�t(Rt,Lt,Ht)}. Eq. (2)shows that profits depend on the intermediate
Table 3Parameter values when using SOPS
NameValueName ValueValueName NameValue
E{�Lt} 0.0T 50 R0 50–2050 R0min 2M vL100 0/500/1000L0 A (50–5050) L0min 10A

E. Moxnes et al. / Ecological Modelling 145 (2001) 225–241232
A challenge with this method is to make anappropriate prior choice of the functional form ofthe policy function. According to Moxnes(1998d), the policy for the case without measure-ment error is likely to serve as a fairly goodapproximation as long as measurements arefiltered and the measurement error is limited.Since our problem is non-linear, we rely on anapproximation when using a Kalman filter. Weassume that the number of reindeer is measuredperfectly such that the filter is reduced to a one-di-mensional one for lichen:
L� t=L� t+K(YLt−L� t), (17)
where
YLt=�Lt+A�Lt. (18)
Here, L� t represents the expected value of lichenaccording to the resource dynamics. Since expec-tations are not easily found in a model withnumerous non-linearities and sources of variation,we simplified by using deterministic predictionsbased on Eqs. (9)– (12) and (14), ignoring therandom terms. K is a policy parameter denotingthe amplification of the Kalman filter. Thus, K istreated like the other policy parameters �. Mea-surements were assumed to deviate from actualvalues of Lt by a random additive term A�Lt,where A is the size of the area. Hence, �Lt denoteserrors measured in kg DM/ha. The error wasnormally distributed with standard deviation vL
(Table 3).
4. Results and discussion
First, we find the optimal policy for the de-scribed model, later referred to as the referencecase. Then we perform sensitivity test. These testshelp us understand the model and they reveal theimportance of correct parameter estimates.
4.1. The reference case
The upper two panels of Fig. 2 show the opti-mal policy for the reference case. The left panelshows that the optimal strategy is nearly a con-stant escapement policy for the herd size. This
means that for each level of lichen, slaughteringwill bring the herd to nearly the same targetindependent of how large the herd is at the outset.Minor deviations from this rule are caused by thefact that weight, calving and survival depends onharvest Ht. A test where the slaughter weight wt
is kept constant leads to perfect constantescapement.
We utilise the fact that the policy is nearlyconstant escapement to simplify the exposition ofthe results. Thus, the policy is summarised by thetarget escapement for reindeer (TER). In the leftpanel, the targets are where slaughtering becomeszero for each level of lichen. The panel on theright-hand side shows the TER as a function oflichen. Minor irregularities are caused by the dis-cretisation of reindeer, lichen and slaughtering.Tests with smaller discretisation intervals showthis.
The TER is shown together with the equi-librium herd size. The latter is the herd, whichwould eat and waste exactly the yearly growth oflichen at the different lichen levels. This curvediffers from the growth curve shown in Fig. 1(c).For instance, the equilibrium herd size increasesas lichen tends towards zero because at this pointeach reindeer finds and eats very little lichen (Fig.1(d)). It is depressed at high levels of lichenbecause of extensive wastage (Eq. (14)). While thegrowth curve has its maximum at 2.25 tonnesDM/ha, the equilibrium herd size reaches its max-imum at 1.6 tonnes DM/ha, i.e. at 29% lowerlichen density.
From the two curves we see that the TER issmaller than the equilibrium herd as long as thedensity of lichen is below 1.5 tonnes DM/ha.Hence, in this area, the level of lichen grows.Above 1.5, the TER exceeds the equilibrium leveland the level of lichen is reduced. The target levelfor lichen is where the two curves intersect. Thishappens for a herd size just below 1000 animals.The target is a lichen density of around 1.5 tonnesDM/ha, which is 33% less than the density, whichmaximises lichen growth. The main reason forthis difference is the assumed wastage of lichen byreindeer.
The net present value V depends on the initialconditions. Here, and in later calculations, we

E. Moxnes et al. / Ecological Modelling 145 (2001) 225–241 233
Fig. 2. Optimal policies. Thick line: TER; thin line: equilibrium herd size.

E. Moxnes et al. / Ecological Modelling 145 (2001) 225–241234
refer to the value V*, which denotes the value foran initial herd size of 1050 animals and an initiallichen density of 1.92 tonnes DM/ha. In the refer-ence case, V* equals NOK 9.4 million.
Virtala (1996) has carried out a similar type ofanalysis with a more simplified model. Most im-portantly, he does not consider summer range-lands, the weight of reindeer, wastage of lichen,and uncertainty in other variables than lichenavailability. Different from our model, he assumesthat lichen grazing per animal depends on thedensity of reindeer and he assumes that the sur-vival and the calving functions have the samehalf-values. In spite of these differences, he finds apolicy, which is qualitatively similar to our policybelow the target level for lichen. Quantitatively,his TER drops more quickly with the lichen levelthan ours. Above the target level for lichen, hismodel suggests a rapid increase in the TER aslichen increases. Our solution has an upper limitfor the TER mainly because of the limiting sum-mer grazings.
4.2. The size of summer grazings
To test the above assertion about the limitingeffect of summer grazings we repeat the optimisa-tion with two different amounts of summer range-lands. The result is shown in the second row ofFig. 2. In the left panel, G is increased by 25%, inthe right panel it is decreased by 40%.
When 25% more summer grazings becomesavailable, the TER increases for high levels oflichen. Below the target level for lichen, the TERbecomes only slightly lower than in the referencecase. The target for lichen remains the same. Aslong as lichen is kept close to this level, thenumber of reindeer will not be much affected bylarger summer grazings. The expected value V*improves from NOK 9.4 million in the referencecase to NOK 10.7 million. The 14% increase isconsiderably smaller than the increase in summergrazings of 25%. The increased value is caused byhigher weights of the reindeer and larger herdsizes during periods with lichen densities aboveaverage.
When summer grazings are decreased by 40%,they put a much tighter limit on the herd size. The
TER is reduced to around 650 animals. In thiscase, the maximum growth of lichen is no longera limiting factor. The target for lichen increasesfrom 1.5 to 3.0 tonnes DM/ha. Hence, with limit-ing summer grazings, lichen rangelands will begrazed too little to produce its maximum growth.Only if lichen is reduced far below what is eco-nomically sensible, lichen growth becomes a limit-ing factor, i.e. below 1.0 ton DM/ha. The valueV* decreases to NOK 6.5 million. The 31% reduc-tion is less than the 40% reduction in summergrazings. The value is likely to drop in proportionto the size of the summer grazings, once the idlesummer grazings in the reference case have beenutilised.
4.3. Slaughter weight
To maximise profits or meat production, adap-tation to summer rangelands should strike a bal-ance between the number of slaughtered animalsand their slaughter weights. This is because moreanimals imply lower weights. To test the impor-tance of variable slaughter weights we set theweight index wt in Eq. (2) equal to a constant (0.8or 1.0). We keep the effect of wt on calving andsurvival. Thus, the model becomes more similarto the model used by Virtala (1996), who assumesa direct effect of lichen on calving and survival,while disregarding slaughter weights.
The perhaps surprising result is that the policyis virtually unchanged from the reference case (forwhich reason it is not shown in Fig. 2). The likelyexplanation is that the trade-off between the num-ber of slaughtered animals and their weights issimilar to and dominated by the trade-off betweenthe total herd size and calving and survival ratios.The larger the herd size, the lower the calving andsurvival ratios. Hence, at some herd size the num-ber of slaughtered animals is maximised. The testindicates that the location of this maximum is notmuch changed by taking explicit notice of slaugh-ter weights.
4.4. Natural �ariation
According to the certainty equivalence princi-ple, stochastic variation is of no importance for

E. Moxnes et al. / Ecological Modelling 145 (2001) 225–241 235
the optimal policy if the model is linear and thecriterion quadratic (Bertsekas, 1987). Since ourmodel is non-linear, stochastic variation couldmatter. To investigate this question we find opti-mal policies for the case where all standard devia-tions are reduced by 75% and for the case whenthey are all increased by 50%.
Within the accuracy of our method, we detectno important differences in the policies. The dif-ferent non-linearities are either of little impor-tance or they tend to cancel the effects of eachother. Virtala (1996) found significantly higherTERs in the case of stochastic variation than in adeterministic case (below the target for lichen).Clearly, the additional assumptions made in ourmodel remove this effect. Virtala’s results aresimilar to ours in that he finds virtually no effectof stochastic variation on the target level forlichen.
That policies are insensitive to stochastic varia-tion, does not mean that the value is insensitive.V* increases from NOK 9.4 in the reference caseto NOK 12.0 million when variation is dimin-ished, and it drops to NOK 7.5 million whenvariation is augmented, respectively up by 17%and down by 20%. These numbers indicate poten-tial costs of climate change in case climate changeleads to stronger variations in weather conditionsas has been suggested.
4.5. Variable costs
As noted before, by setting variable costs cequal to 0, we maximise meat production ratherthan profits. We test the effects of setting c equalto 0 and of doubling variable costs from NOK200 to NOK 400 per animal per year. The result-ing policies are quite similar to the ones for thecase with respectively large and small summergrazings in the second row of Fig. 2. (In the caseof higher costs, the target for reindeer is 900rather than 650 as shown in the figure.)
Setting variable costs equal to 0 has no de-tectable effect on the target for lichen. Lichen isstill the limiting resource. When costs are in-creased, it becomes less profitable to utilise mar-ginal summer grazings. For instance, it may no
longer be profitable to transport animals to re-mote pastures since the costs may outweigh thegains in terms of increased meat production andrevenues. Thus, variable costs can be of impor-tance for the optimal policy if summer grazingsare sufficiently close to being the limiting factor.In this case it matters whether one views theproblem as one of profit maximisation (includingcosts) or maximisation of meat production (nottaking account of variable costs).
4.6. Discounting
Discounting implies that an investment in onemore animal in the breeding stock is profitableonly if it leads to a discounted future incomestream which is at least as big as the current valueof the invested animal. The income stream willreflect what happens to the pastures and with theother animals due to increased competition forfood. If the investment is not profitable accordingto this test, the animal should be sold and theincome invested elsewhere earning a return requal to 5% p.a.
In connection with the debate about sustainabledevelopment of renewable resources, the mereidea of discounting is often questioned. To inves-tigate the consequences of leaving out discountingin the case of reindeer management, we find theoptimal policy for this case. The left panel in thethird row of Fig. 2 shows that the TER is shiftedonly slightly to the right compared to the refer-ence case. Thus, it seems rather wasteful to debatewhether the discount rate should be 0 or 5% p.a.,a rate which is often used for social planning.
Increases in the discount rate on the otherhand, can have strong effects on the optimalpolicy. In the right panel we have used a discountrate equal to 33% p.a., which is considered a highdiscount rate also for private enterprises. Usually,such a discount rate leads to (near to) depletion ofrenewable resources (Clark, 1973). Accordingly,we find that the TER is considerably lowered.However, this reduction in reindeer serves to re-duce the grazing pressure on lichen, which is notharvested by others than reindeer. The same is not

E. Moxnes et al. / Ecological Modelling 145 (2001) 225–241236
found in two-species fisheries where the prey spe-cies has a commercial value of its own (Moxnes,1998a). Hence, one cannot make the argumentthat strong historical reductions in lichen densitiesare due to high discount rates used by economi-cally rational planners.
4.7. Cal�ing’s dependence on weight
Earlier we found that the formulation forslaughter weight did not matter for the policy,because calving (and survival) dominated the lo-cation of the TER. Here, we test the importanceof the calving function (Fig. 1(a)). First we reducethe weight whk at which calving is cut in half,from 57 to 53 kg. Next, we increase it to 61 kg.The policies are similar to the ones for differentsummer grazings in the second row of Fig. 2(‘reduced weight’ to the left).
There is virtually no effect on the policy as longas lichen is equal to or below its target level. Forlarge lichen levels, where summer grazings arelimiting, reindeer targets change. In the case whencalving takes place at 4 kg lower body weights,the target increases from 1200 in the referencecase to around 1400. When calving takes place at4 kg higher weights, the reindeer target drops to1000 animals. This proves our earlier claim thatcalving is more important than slaughter weightsfor the location of the TER. Values of V* are,respectively, NOK 11.1 and NOK 7.4 million(plus 24 and minus 22% relative to the referencecase).
4.8. Sur�i�al’s dependence on weight
A similar test to the one above has been madefor the body weight, whv, which cuts survival inhalf. The same variation as in the previous test ofplus and minus 4 kg is used. The effects onreindeer targets are similar, however, somewhatsmaller than in the previous case. This should beexpected since in a system with stochastic varia-tions, suppressed survival is less frequent thansuppressed calving (Fig. 1(a)). Percentage changesin the value V* are also smaller, respectively, plus12 and minus 18%.
4.9. Digestibility of alternati�e winter fodder
Recall that the feeding level is a measure of thedegree to which nutritional needs for the reindeerare met. In the winter season the feeding leveldepends on the availability of lichen and on thedigestibility of alternative food sources. The mini-mum feeding level for winter grazings �0 denotesthe feeding level when no lichen is available andthe animals have to resort to alternative foodsources (Eq. (13) and Fig. 1(d)).
A reduction of �0 (from 0.35 to 0.1) corre-sponds to assuming that the alternative foodsource has a very low digestibility. The left panelof the fourth row of Fig. 2 indicates only a minorreduction in the TER around lichen levels of 1 tonDM/ha as compared to the reference case. Thelower minimum feeding level makes it slightlymore important to stay away from low lichenlevels, as one should expect. The value V* is onlyreduced by 0.01% compared to the reference caseindicating that the policy is successful in keepingthe lichen density at sufficiently high levels.
Next, we consider an increase in the minimumfeeding level. First note that if we had assumedalternative food sources to have the same qualityas lichen, i.e. �0 equal to 1.0, the policy wouldbecome independent of lichen altogether. Sincethis is trivial, we investigate a case where alterna-tive food sources are of lower quality than lichen,�0 equal to 0.8, however, considerably higherthan in the reference case (0.35).
The right panel shows a radical change in thepolicy at very low levels of lichen. The TER infact exceeds the equilibrium herd size, drivinglichen towards extinction. The rationale for this isthat when lichen density gets below 600 kg DM/ha, it no longer pays to wait for lichen to berebuilt. It is more profitable to increase the herdsize and to be satisfied with a winter food sourceof somewhat lower quality than lichen. This wasnot a profitable option in the reference case be-cause of the much lower quality of alternativefood. This is illustrated by obtained values of Vfor an alternative set of initial conditions of 1050animals and only 83 kg DM/ha of lichen, V �. Inthe reference case, V � is only NOK 1.2 million inspite of rebuilding of lichen. In the present case,

E. Moxnes et al. / Ecological Modelling 145 (2001) 225–241 237
V � is NOK 5.5 million, clearly higher than in thereference case.
Two more comments are pertinent. First, if oneis uncertain about the digestibility of alternativefodder, driving lichen towards extinction entails ahigh risk in case �0 turns out to be for instance0.35 rather than an assumed 0.8. Second, thepolicy is sensitive to the choice of discount rate.Without discounting, it will always be profitableto rebuild lichen as long as �0 is less than 1.
4.10. The skewness of the growth cur�e for lichen
Fig. 1(c) shows that the growth curve for lichenpeaks at 2.25 tonnes/ha, or at 37% of the carryingcapacity. Current estimates of where the peak issituated are uncertain. Therefore, we make a cou-ple of sensitivity tests to see if precision is needed.(The height of the growth curve produces a simplescaling effect, similar to the size of summer graz-ings, which we have already tested.)
First we reduce �1 from 1.5 to 0.8, which bringsthe peak of the lichen growth curve from 2.25 to1.45 tonnes DM/ha. In this case, the major effectis seen in the curve for the equilibrium herd size.The left panel in the fifth row of Fig. 2 shows thatit moves to the left and becomes very high at lowlichen densities. The latter is because lichengrowth increases relative to lichen grazing peranimal. This permits a significantly higher TER atlow lichen levels than in the reference case. Thetarget for lichen is hardly changed at all. This alsoimplies that there is virtually no effect on V*.
In the right panel we have increased �1 to 2.2,bringing the growth peak to 2.8 tonnes DM/ha,nearly half the carrying capacity. The equilibriumcurve peaks at around 2.3 tonnes DM/ha. (Due tonumerical inaccuracies we have decreased the stepsize, while the same number of grid points hasbeen used. This reduces considerably the size ofthe unrealistic peak in reindeer escapement at lowlichen densities that would otherwise result.) Thelow equilibrium herd size at low lichen levelsimplies that the TER becomes considerably lowerthan in the reference case. The target for lichenincreases only slightly.
A comparison of the TER in the two panelsreveals that the position of the growth peak for
lichen is important for the slaughtering strategybelow the target for lichen. For instance, at 1.0tonne DM/ha, the TER varies from 180 to 900animals. If the situation in the right panel is thecorrect one, it would be disastrous to follow thepolicy for the reference case. Hence, it is veryimportant to know the position of the peak of thegrowth curve in case of severe overgrazing.
From this test, we can deduce that wastage oflichen by reindeer is important to the extent thatit influences the skewness of the curve for theequilibrium herd size. Wastage is also importantto the extent that it makes lichen more of alimiting resource.
4.11. Measurement error
When measurement error is introduced, stan-dard SDP can no longer be used to find theoptimal policy. Therefore, we use SOPS. Whenusing this method we have to make a prior choiceof policy function
Ht=�1{Rt−max[�2,min(�3+�4Lt,�5)]}�0,(19)
where �i represents policy parameters, Rt is thenumber of reindeer, and Lt is the amount oflichen. The policy in Eq. (19) is a good approxi-mation to the policy found for the reference case.The expression within the max-function representsthe TER as a function of the lichen level. Theparameter �1 equals 1.0 in case of a constantescapement policy. We search for values of theparameters �i that maximise the expected netpresent value, W (Eq. (16)), first without error.
The method replicates well the solution for thereference case (Moxnes et al., 1998). Since SOPSis less restrictive than SDP, we use this opportu-nity to improve the model. Recall that whendiscussing Eqs. (7) and (8) we pointed out that wehad ignored time lags and the presence of calvesin summer grazings. Thus, we introduce laggedversions of the feeding levels, �Gt−1 and �Lt−1.Both lagged variables are entered into the slaugh-ter weight for breeding stock. The lagged feedinglevel for summer grazings is entered into theweight influencing calving and survival. Thissolves the simultaneous equation problem and

E. Moxnes et al. / Ecological Modelling 145 (2001) 225–241238
allows us to add the calves to the breeding stockon the summer grazings. To approximate theearlier balance between summer and winter graz-ings, we increase the amount of summer grazingsG by 78%. The definition of the slaughteringweight for calves is maintained. Ideally, the intro-duction of two new state variables implies thatthe slaughtering policy should be made a functionof these as well as of reindeer and lichen. How-ever, tests in Moxnes et al. (1998) indicate thatlittle is gained by this complication. It is left out.
The lower left panel in Fig. 2 shows the near-to-optimal policy for the extended model. Thesolution is almost identical to the solution foundby SDP for the reference model. Table 4 showsaverage policy parameters for the ten searchesgiving the highest values of W, together withstandard deviations for these averages. Allparameters and W are determined with highprecision.
Table 4 also shows the results for two differentstandard deviations for the measurements oflichen, vL equal to 500 and 1000 kg DM/ha. The
lower right panel in Fig. 2 shows the policy forthe case with vL equal to 1000 kg DM/ha. Themajor effect of measurement error is to reducethe reindeer target at high lichen levels, �5, from1149 to 994. The target for lichen is hardly influ-enced.
According to Table 4, measurement error im-plies that the strategy is no longer a constantescapement policy, �1�1.0. An excessive herdsize is no longer reduced towards the target inone step. Rather, it is approached somewhatmore carefully, taking notice of the possibilitythat the lichen measurements could be erroneous.This effect is also found in fishery models (Clarkand Kirkwood, 1986). Notice, however, the effectof measurement error on the policy is reduced bythe fact that we allow for filtering (Moxnes,1998d). The table shows that the lichen measure-ments are quite heavily filtered, the Kalman co-efficient K is around 0.3 for both error levels, i.e.more weight is put on the prediction L� t than onthe latest measurement YLt in Eq. (17). Thus,filtering is also an important part of the policy.
Table 4Policy parameters �i and net present value W, extended model using SOPS
WK�5�4�3�2�1
No measurement error, �L=0 kg/ha1.00 106Average −323 11490.00054 8.07–
49 0.0290.00S.D. –40.00002
Measurement error, �L=500 kg/ha0.00060 1092Average 0.280.97 8.02164 −324
700.03 0.00004 10 0.03 0.0218S.D.
Measurement error, �L=1000 kg/ha0.82 −295 0.00062 994 0.35 7.87Average 157
0.0000712123 0.030.05 0.02S.D. 22
Table 5Simulated values W using policies that are fixed or adjusted to the error level, M=10 000
‘No measurement error’ policyMeasurement error, vL Adjusted policy
W % Reduction W % Reduction
07.89 7.890 06.34 20 7.83 0.85005.64 29 7.68 2.71000

E. Moxnes et al. / Ecological Modelling 145 (2001) 225–241 239
The value of the adjusted policy including filter-ing is considerable. Table 5 shows losses of 20 and29% due to measurement errors for the respectivelevels of measurement error when the ‘no mea-surement error’ policy is used (first policy in Table4). When the policies are adjusted to the levels ofmeasurement errors (latter two policies in Table4), losses due to measurement errors are reducedto 0.8 and 2.7%. Keeping in mind that measure-ment errors are bound to reduce W somewhat, wealso conclude from this test that the potential forvalue improvement by further refinement of thepolicy is minuscule.
Finally, we estimate the value of precision inmeasurements. This value can be calculated fromthe values of W in Table 5. For the case with anadjusted policy, we see that the value increases byNOK 0.06 million or 0.8% when precision im-proves from a standard deviation of 500 kg DM/ha to 0. The corresponding value gain when thestandard deviation is reduced from 1000 to 500 kgDM/ha is NOK 0.15 million or 1.9% of the totalvalue. Similar relative values of accuracy arefound for the prey species in a two-species fisherymodel (Moxnes, 1998a). For the case with ‘nomeasurement error’ policy, the same improve-ments in measurement accuracy would be worthmuch more, respectively 20 and 9% of the totalvalue. However, in this case, most of the esti-mated value of accuracy is due to the use of aninappropriate policy function. Naturally, thevalue of precision is reduced if summer grazingsbecome more of a limiting resource (Moxnes etal., 1998).
If the value of accuracy is worth 1.5% of thevalue of reindeer husbandry, this corresponds toNOK 6000/year for a herd size of 1000 reindeer(using a discount rate of 5%). In case the value ofaccuracy is worth 9%, this corresponds to NOK36 000/year for a herd size of 1000 reindeer etc.
If the efforts needed to improve precision costless than these amounts, the efforts are worth-while. If the costs of accuracy are higher, how-ever, we cannot immediately conclude that effortsto improve precision represent a loss. First, moreaccurate measurements could remove doubt anddiscussion about lichen conditions and help focusthe debate on policy improvements. Second, as
long as model parameter estimates are uncertain,better measurements of lichen (and other vari-ables) would help reduce this uncertainty.
5. Conclusions
Optimal management policies for a reindeerdistrict have been found. Sensitivity tests showthat if lichen is the limiting resource, it does notmatter if one maximises meat production orprofits. When summer grazings are limiting, vari-able costs do matter. The skewness of the rela-tionship between lichen density and lichen growthis important for the optimal policy when lichendensity is low. Hence, investigations of lichengrowth should receive high priority. Random er-rors in measurements of lichen are also importantfor the optimal policy. While there can be aconsiderable value of more precise measurements,it is even more important to adapt the policy tothe degree of error. Normal discounting is notimportant. Thus, one could just as well maximisesustainable yearly profits as the net present value.Heavy discounting implies strong reductions inthe number of reindeer (a valuable predator). Ittends to protect lichen (a prey with little alterna-tive value). The optimal policy is somewhat sensi-tive to the estimate of the weight at which calvingand survival rates are cut in half. It is hardlysensitive at all to the explicit modelling of slaugh-ter weights. Nor is the policy sensitive to thedegree of natural variation. The value of reindeerhusbandry on the other hand, is significantly re-duced by increasing climatic variation. The im-portance of alternative winter fodder depends onits digestibility. If the digestibility is low, as itcould be expected to be in subcontinental reindeerhusbandry, alternative fodder is not important forthe policy. When the digestibility of winter fodderis above a certain limit, as it can be in oceanicconditions, it matters at low lichen densities. Iflichen density gets below a certain limit, it be-comes profitable to deplete lichen and to becomedependent on the alternative food source. Thisconclusion is sensitive to discounting and theavailability of summer rangelands.

E. Moxnes et al. / Ecological Modelling 145 (2001) 225–241240
Acknowledgements
This research has been financed by NordiskMinisterrad. Thanks to Hans-Kolbein Dahle forvaluable inputs and for coordinating the project.
References
Andersen, K.P., Ursin, E., 1977. A multispecies extension tothe Beverton and Holt theory of fishing with accounts ofphosphorus circulation and primary production. Medd.Danm. Fisk-og Havunders. 7, 319–435.
Andreyev, V.N., 1977. Reindeer pastures in the subarcticterritories of the USSR. In: Krause, W. (Ed.), Applicationof Vegetation Science to Grassland Husbandry. W. Junk,The Hague, pp. 277–309.
Bertsekas, D.P., 1987. Dynamic Programming. Deterministicand Stochastic Models. Prentice-Hall, New Jersey.
Cameron, R.D., Smith, W.T., Fancy, S.G., Gerhart, K.L.,White, R.G., 1993. Calving success of female caribou inrelation to body weight. Canadian Journal of Zoology 71,480–486.
Clark, C.W., 1973. The economics of overexploitation. Science181, 630–634.
Clark, C.W., Kirkwood, G.P., 1986. On uncertain renewableresource stocks: optimal harvest policies and the value ofstock surveys. Journal of Environmental Economics andManagement 13, 235–244.
Dahle, H.K., Danell, O� ., Gaare, E., Nieminen, M., 1998.Reindrift i Nordvest-Europa i 1998 – BiologiskeMuligheter og Begrensninger. NMR.
Eloranta, E., Nieminen, M., 1986. Calving of the experimentalreindeer herd in Kaamanen during 1970–85. Rangifer(Special Issue No. 1) 115–121.
Gaare, E., 1986. Does grazing influence growth of the reindeerlichen Cladina mitis? Rangifer (Special Issue No. 1) 357–358.
Gaare, E., 1995. Rein-beite og miljø i Barents Euro ArticRegion (BEAR). Rangifer-Proceedings: Nordic Workshopon Reindeer Research 15 (1), 25–27.
Gaare, E., Skogland, T., 1980. Lichen-Reindeer interactionstudied in a simple case model. Trondheim: Direktoratetfor Naturforvaltning.
Helle, T., Kilpela, S.S., Aikio, P., 1990. Lichen ranges animaldensities and production in Finnish reindeer management.Rangifer (Special Issue No. 3) 115–121.
Helle, T., Kojola, I., 1994. Body mass variation in semidomes-ticated reindeer. Canadian Journal of Zoology 72, 681–688.
Holling, C.S., 1965. The functional response of predators toprey density and its role in mimicry and population regula-tions. Memoirs of the Entomological Society of Canada45, 1–60.
Igoshina, K.N., 1939. The growth of fodder lichens on theUral north. Trudy Instituta Polarnogo Zemledelia, Zhivot-novodstva i Promyslovogo Khozyaistva. Ser. ‘‘Olenevod-stvo’’. No. 8. Leningrad. (Not the current Igoshina 1939).
Jacobsen, E., Bjarghov, R.S., Skjenneberg, S., 1981. Supple-mentary feeding of female reindeer on lichen diet duringthe last part of pregnancy. Acta Agriculturae Scandinavica31, 81–86.
Karenlampi, L., 1971. Studies on the relative growth rate ofsome fruticose lichen. Reports from Kevo subartic station7, 33–39.
Klein, D.R., 1968. The introduction, increase, and crash ofreindeer on St. Matthew island. Journal of Wildlife Man-agement 32 (2), 350–367.
Kojola, I., Helle, T., 1993. Regional differences in density-de-pendent mortality and reproduction in Finnish reindeer.Rangifer 13 (1), 33–38.
Kojola, I., Helle, T., Niskanen, M., Aikio, P., 1995. Effects oflichen biomass on winter diet, body mass and reproductionof semi-domesticated reindeer Rangifer t. tarandus in Fin-land. Wildlife Biology 1 (1), 33–38.
Kumpula, J., Colpaert, A., Nieminen, M., 1998. Reproductionand productivity of semidomesticated reindeer in NorthernFinland. Canadian Journal of Zoology 76, 269–277.
Kumpula, J., Colpaert, A., Nieminen, M., 2000. Condition,potential recovery rate and productivity of lichen (Cladoniaspp.) ranges in the Finnish Reindeer management area.Arctic 53 (2), 152–160.
Kumpula, J., Nieminen, M., 1992. Pastures, calf productionand carcass weights of reindeer calves in the Oraniemico-operative, Finnish Lapland. Rangifer 12 (2), 93–104.
Lenvik, D., Aune, I., 1988. Selection strategy in domesticreindeer. Early mortality in reindeer calves related to ma-ternal body weight. Norsk Landbruksforskning 2, 71–76.
Lyftingsmo, E., 1965. Norske Fjellbeite: Det Kongelige Sel-skap for Norges vel.
Moxnes, E., 1998a. Catch policy for a predator-prey system:measurement error and value of accuracy. SNF Report56/98. SNF, Bergen.
Moxnes, E., 1998b. Not only the tragedy of the commons,misperceptions of bioeconomics. Management Science 44(9), 1234–1248.
Moxnes, E., 1998c. Overexploitation of renewable resources:the role of misperceptions. Journal of Economic Behaviorand Organization 37 (1), 107–127.
Moxnes, E., 1998d. Uncertain measurements of renewableresources: approximations, harvest policies, and value ofaccuracy. SNF Report 51/98. SNF, Bergen. Journal ofEnvironmental Economics and Management.
Moxnes, E., 2000. Not only the tragedy of the commons:misperceptions of feedback and policies for sustainabledevelopment. System Dynamics Review 16 (4), 325–348.
Moxnes, E., Danell, O� ., Gaare, E., Kumpula, J., 1998. Rein-deer husbandry: Natural variation and measurement error.SNF 59/98. SNF, Bergen.

E. Moxnes et al. / Ecological Modelling 145 (2001) 225–241 241
Moxnes, E., Sara, A.N., Solbakken, J.I., Stenseth, N.C., 1993.Reindrift og beitegrunnlag. En modellanalyse. SNF-report35/93. SNF, Bergen.
Ouellet, J.P., Heard, D.C., Boutin, S., Mulders, R., 1997. Acomparison of body condition and reproduction of caribouon two predator-free Arctic islands. Canadian Journal ofZoology-Revue Canadienne de Zoologie 75 (1), 11–17.
Robbins, C.T., 1993. Wildlife Feeding and Nutrition. AcademicPress, New York.
Scheffer, V.B., 1951. The rise and fall of a reindeer herd. TheScientific Monthly 75, 356–362.
Tyler, N.J.C., 1998. Reindeer Pastures at Disequilibrium.Tromsø: Department of Biology, University of Tromsø.
Virtala, M., 1992. Optimal management of a plant-herbivoresystem – Lichen and Reindeer in Northern Finland. Ecolog-ical Modelling 60 (3-4), 233–255.
Virtala, M., 1996. Harvesting a lichen-reindeer system in anuncertain environment. Ecological Modelling 89, 209–224.
White, R.G., Bunnell, F.L., Gaare, E., Skogland, T., Hubert,B., 1981. Ungulates on Arctic ranges. In: Bliss, L.C., Heal,O.W., More, J.J. (Eds.), Tundra Ecosystems: A Compara-tive Analysis, Cambridge University Press, Cambridge, pp.397–483.
White, R.G., Luick, J.R., 1984. Platicity and constraints in thelactational strategy of reindeer and caribou. Symposium ofthe Zoological Society of London 51, 215–232.


