Embed Size (px)
Citation preview
Zero :JurnalSains, Matematika, dan Terapan E-ISSN : 2580-5754
P-ISSN : 2580-569X
Vol. 5, No. 2, December 2021,
pp. 22-36 22
Journal homepage: http://jurnal.uinsu.ac.id/index.php/zero/index
Optimization of Coca-Cola Product Distribution Routes at PT. Graha Prima
Mentari Medan With Ant Colony Optimization
Pridolin Tarigan1
, Abil Mansyur2
, 1,3
Department of Mathematics, Universitas Negeri Medan, Medan, Indonesia
Article Info ABSTRACT
Article history:
PT Graha Prima Mentari is a company engaged in the service sector, namely
as the official distributor of Coca-Cola. PT. Graha Prima Mentari has
Distribution Centers spread across various cities including those located in the
cities of Cirebon, Indramayu, Tasikmalaya, Pekanbaru, Medan, Denpasar,
Rembang and others. For branches in the city of Medan PT. Graha Prima
Mentari is located at Jalan Gatot Subroto KM 6.7 No. 100 Fields. PT. Graha
Prima Mentari has 13 transportation cars that operate from Monday to
Saturday and serve 6 areas, namely Medan Barat, Medan Sunggal, Medan
Helvetia, Medan Selayang, Medan Tuntungan and Medan Petisah.
The problem that occurs is that the company has not determined the optimal
route which results in additional costs for the distribution of goods. This study
aims to minimize the distance by using the ant colony optimization method.
The result obtained is that the distribution distance is reduced by 52 km from
the previous distance of 93.1 km to 41.1 km and saves distribution costs of
Rp.49,000.
Keywords:
Distribution, Optimization, ACO Method and Mathlab.
This is an open access article under the CC BY-SAlicense.
Corresponding Author:
PridolinTarigan, Department of Mathematics, Universitas Negeri Medan, Medan, Indonesia Email: [email protected]
1. INTRODUCTION
Human needs for drinking water continue to increase so that more and more drinking
water producers are growing to meet these needs. Until now, the number of domestic
bottled drinking water industries has reached 700 units with 2000 trademarks.
Manufacturers make bottled drinking water with the aim of making it easier for consumers
to obtain and easier to distribute [1].
Distribution is an activity to move products from suppliers to consumers in a supply
chain. Distribution in the distribution of products and services must be in accordance with
the resources and capabilities possessed by a company to achieve the expected economic
size of a company. In mineral water distribution activities, the distribution process will be
seen with the use of vehicles as a means of transporting goods that have different loading
capacities and distances in determining the route that the vehicle takes in one way [2].
PT. Graha Prima Mentari is the largest authorized Coca-Cola dealer in Indonesia. PT.
Graha Prima Mentari me Cirebon, Indramayu, Tasikmalaya, Pekanbaru, Medan, Denpasar,
Rembang and others. For a branch in the city of Medan, PT. Graha Prima Mentari is
located at Jalan Gatot Subroto KM 6.7 No. 100 Medan. The product distribution process at
Zero: Jurnal Sains, Matematika dan Terapan
Optimization of Coca-Cola Product Distribution Routes at PT. Graha Prima Mentari Medan With Ant Colony Optimization( PridolinTarigan)
23
PT. Graha Mentari now uses the company's transport car which is allocated for each distribution area. The initial process of product distribution is for stores, wholesalers, or
retailers to make requests to the company's marketing department, then the marketing
department issues a delivery order (DO) according to consumer demand. Next is the stage
of sorting the coca-cola, which is sorted according to each customer's order, starting in the
morning at 08.00 WIB, after that is checking the orders that will be sent to each customer.
The check includes the type of coca-cola product and the quantity ordered by each
customer. Usually every vehicle distributes Coca-Cola to customers starting at 08.30WIB.
Each vehicle has a different number of customer destinations and distribution channels.
When distributing coca-cola to customers, each driver is accompanied by a kernet on duty
to assist the driver in the process of unloading coca-cola upon arrival at the customer's
location. The quantity of products carried by each customer's vehicle is adjusted to the capacity of each request. In determining the route initially, the sales have determined in
advance which customers the orders will be delivered to first, so the driver only follows
what the sales give [3].
Until now PT. Graha Prima Mentari has 13 transportation cars that operate from
Monday to Saturday, while on Sundays the company does not operate. PT. Graha Prima
Mentari serves 6 areas per day, namely Medan Barat, Medan Sunggal, Medan Helvetia,
Medan Selayang, Medan Tuntungan and Medan Petisah. With the service of one car per
area. Therefore, this distributor faces problems in the shipping process, especially the
distribution route. . According to the marketing side of the company's car carrier and
driver, every day the driver and assistant distributes products to 15 points with an average
of 50 shops for one distribution area. Meanwhile, the planning for the distribution of products to consumers is still based on the subjective decisions of the driver and the
assistant. As a result, the distance and time of product distribution are less than optimal
which will cause the distributor to have to pay for transportation operations. For
transportation PT. GrahaMentari costs 9 km/l times the current price of fuel [4].
The traveling salesman problem or often abbreviated as TSP is the problem of finding
a tour cycle that visits all cities exactly once in a given city set and returns to the city of
origin. Until now, many researchers have tried to find approaches to solve CSR problems.
One of them is using the Ant Colony Optimization algorithm. According to (Irsyadi et al.
2019), Ant Colony Optimization is an algorithm that is inspired by the natural life of ants
regarding the habits of ants in searching for food. Naturally the ant colony is able to find
the shortest route on the way from the nest to places of food sources. The ant colony is able
to find the shortest route between the nest and the food source based on the footprints on the trajectory that has been traversed. The more ants that pass through a path, the clearer
the footprints will be. This causes the path that the ants pass in a small number, the longer
the density of the ants that pass through it will decrease, or even will not be passed at all.
And conversely, the path traversed by ants in large numbers, the longer the density of ants
passing through it will increase, or even all ants will go through that path. Considering the
principle of the algorithm based on the behavior of the ant colony in finding the shortest
travel distance, ant colony is very appropriate to be used for solving optimization problems,
one of which is determining the shortest path. Research on the ACO algorithm has been
carried out by (Dorigo, et al.)
Based on the paper they wrote, Ant Colony Optimization (ACO) has a much better
performance than other algorithms. One of the data in the paper with 75 cities, ACO only requires 3,480 tour simulations to find the best tour path, while the genetic algorithm
requires 80,000 tour simulation times to find the best tour path, and other algorithms such
as Evolutionary Programming (EP) and Simulated Annealing (SA) requires even more
simulation tours. In a study (Subekti2019) entitled Economic Dispath in a Java-Bali 500
Kv Thermal Generator System Using the Hybrid Particle Swarm Optimization-Ant Colony
Optimization Method, it was found that the total operational costs generated by ant colony
optimization were better than Hybrid Particle Swarm Optimization, namely Rp.
.207,597,372,Rp590,408,594,Rp908,285,285 using the AntColonyOptimization method.
E-ISSN : 2580-5754; P-ISSN : 2580-569X
Zero: Jurnal Sains, Matematika dan Terapan
24
2. RESEARCH METHODE
The types of research carried out in this study are the Quantitative Research Method
in which the research is in the form of observation and open interviews to obtain data in the
form of numbers.
In this study, the population studied were trucks transporting coca-cola products and
the samples studied were 13 trucks that were used to transport coca-cola products.
The method used in analyzing the data in this study is a quantitative descriptive
method. After the data is collected, the researcher performs calculations using the ACO (Ant Colony optimization) method to find the closest travel route to save truck fuel which
will save the company's expenses. -steps of data analysis as follows:
1. Setting parameter values
2. Find the distance between the vertices
3. Determine the route of visit
4. Calculating inter-node visibility
5. Calculating the value of the intensity of the footprints between nodes for the
next cycle
6. Calculating probability value
7. Matlab Programming
Matlab programming computations are carried out as a tool in order to search for the
shortest path using the AntColony Optimization method.
3. RESULT AND ANALYSIS
Data
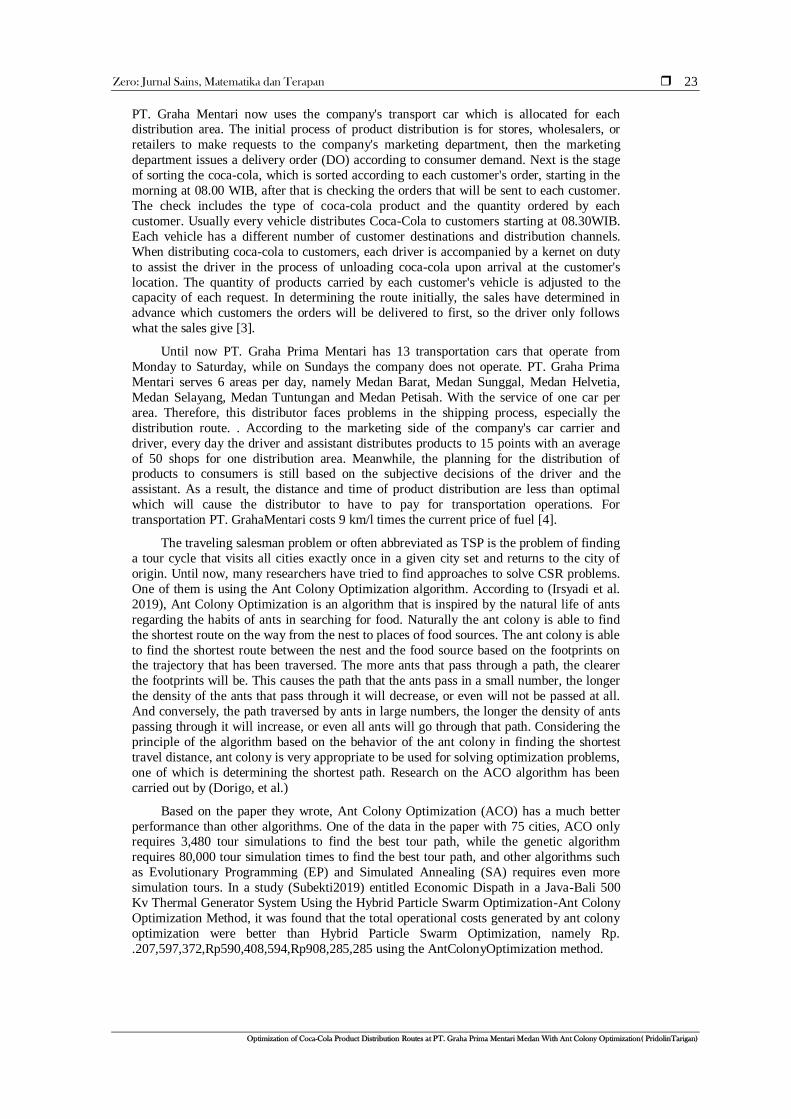
The data obtained is data taken from PT. Graha Prima Mentari, West Medan Branch.
Goods distributed from PT. Graha Prima Mentari which is located on Jl. Gatot Subroto
KM 6.7 No 100 to the store. The purpose of the store and distribution costs obtained are
as follows:
Table 4.1: Code Name and Address
N
o
Name shop Address
1 Warung buk nur Jl.Guru Patimpus
No1A
Gelug Medan
2 UA and CO Jl.Pasundan No.78 Sei
Putih Medan
3 Toko Santa Jl.Medan Marendal
PTDN 2 Petu Deli
Serdang
4 Jawak Seragih Jl. PTPN II No 1
Simp Seja Medan
5 Warung Gelora Jl.Kongsi No5
Patumbak Deli
Serdang
Zero: Jurnal Sains, Matematika dan Terapan
Optimization of Coca-Cola Product Distribution Routes at PT. Graha Prima Mentari Medan With Ant Colony Optimization( PridolinTarigan)
25
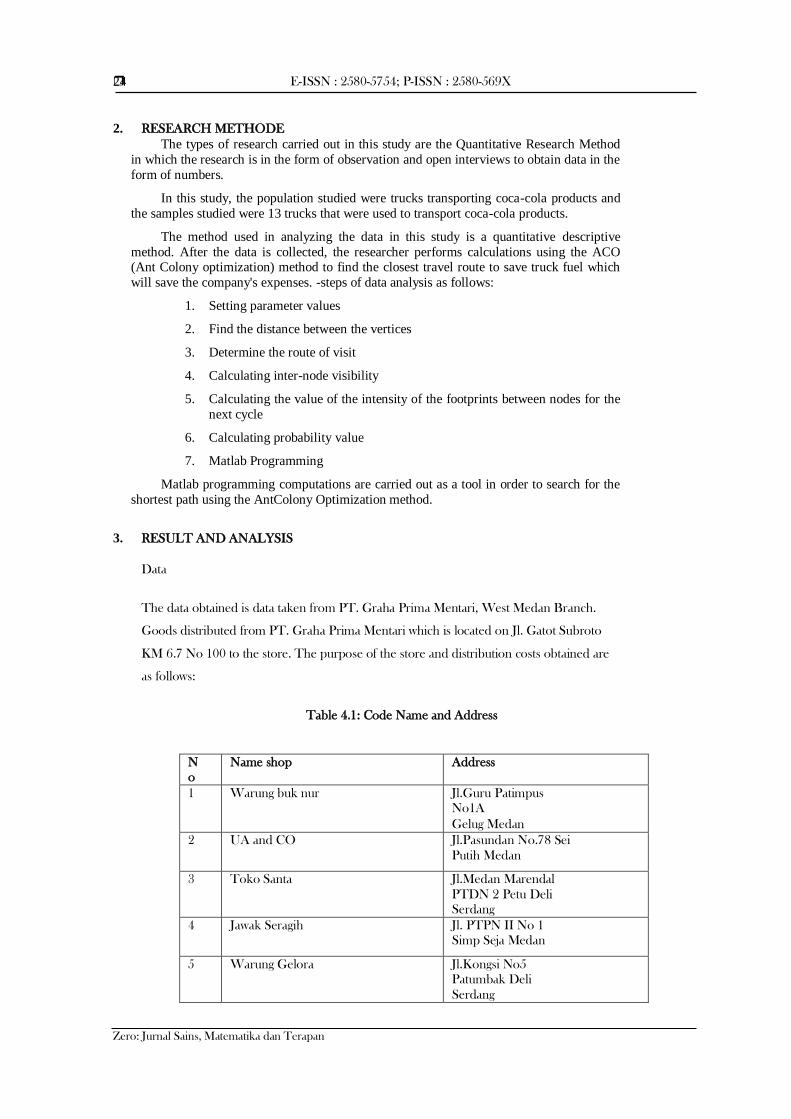
6 CV Kilau Permata Sejati Jl.Sisimanga raja No
43 A
Medan
7 Café BNN Jl. Musi Raya No
1214 Gedung medan
Table 4.2: distribution costs and vehicle types
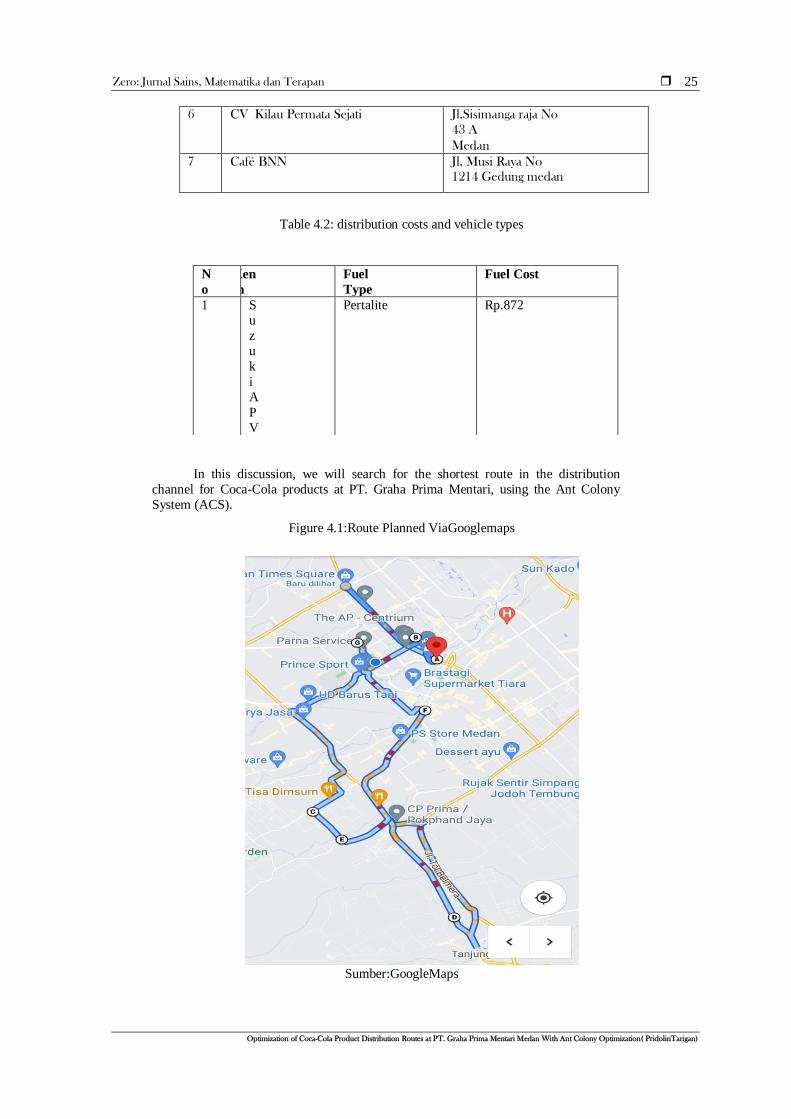
In this discussion, we will search for the shortest route in the distribution
channel for Coca-Cola products at PT. Graha Prima Mentari, using the Ant Colony
System (ACS).
Figure 4.1:Route Planned ViaGooglemaps
Sumber:GoogleMaps
N
o
JenisKen
daraan
Fuel
Type
Fuel Cost
1 S
u
z
u
k
i
A
P
V
Pertalite Rp.872
E-ISSN : 2580-5754; P-ISSN : 2580-569X
Zero: Jurnal Sains, Matematika dan Terapan
26
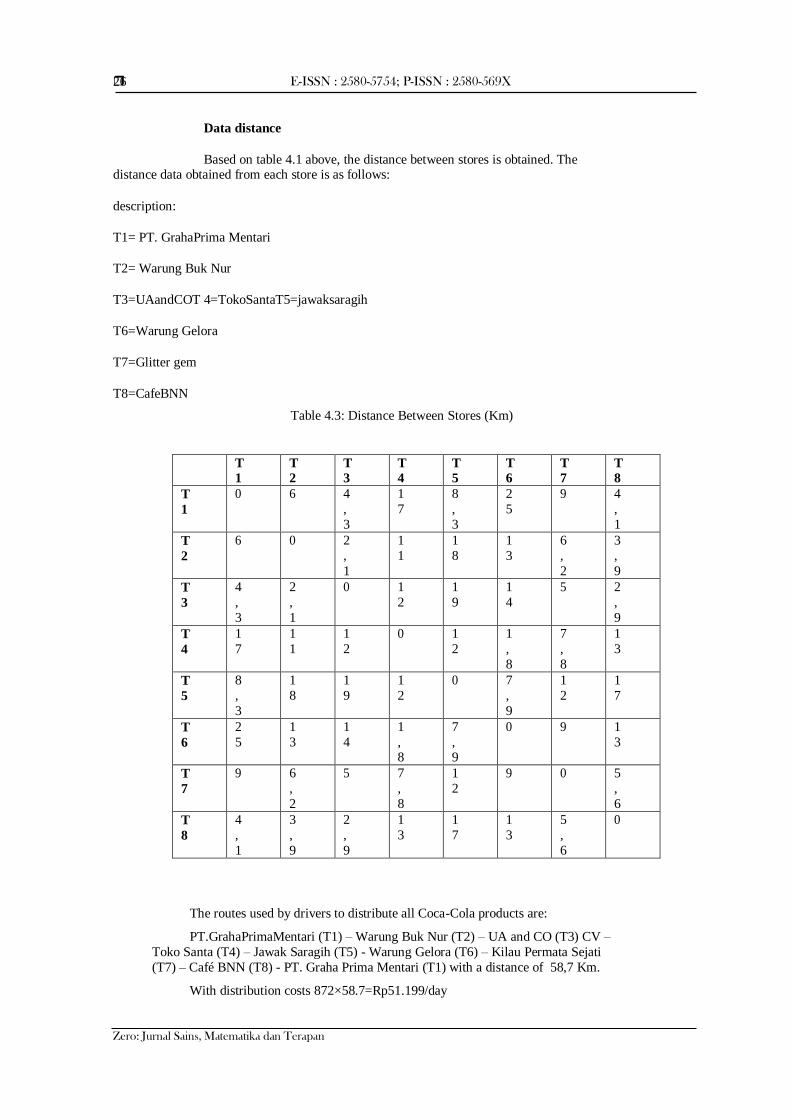
Data distance
Based on table 4.1 above, the distance between stores is obtained. The distance data obtained from each store is as follows:
description:
T1= PT. GrahaPrima Mentari
T2= Warung Buk Nur
T3=UAandCOT 4=TokoSantaT5=jawaksaragih
T6=Warung Gelora
T7=Glitter gem
T8=CafeBNN
Table 4.3: Distance Between Stores (Km)
T
1
T
2
T
3
T
4
T
5
T
6
T
7
T
8
T
1
0 6 4
,
3
1
7
8
,
3
2
5
9 4
,
1
T
2
6 0 2
,
1
1
1
1
8
1
3
6
,
2
3
,
9
T
3
4
,
3
2
,
1
0 1
2
1
9
1
4
5 2
,
9
T
4
1
7
1
1
1
2
0 1
2
1
,
8
7
,
8
1
3
T
5
8
,
3
1
8
1
9
1
2
0 7
,
9
1
2
1
7
T
6
2
5
1
3
1
4
1
,8
7
,9
0 9 1
3
T
7
9 6
,
2
5 7
,
8
1
2
9 0 5
,
6
T
8
4
,
1
3
,
9
2
,
9
1
3
1
7
1
3
5
,
6
0
The routes used by drivers to distribute all Coca-Cola products are:
PT.GrahaPrimaMentari (T1) – Warung Buk Nur (T2) – UA and CO (T3) CV –
Toko Santa (T4) – Jawak Saragih (T5) - Warung Gelora (T6) – Kilau Permata Sejati
(T7) – Café BNN (T8) - PT. Graha Prima Mentari (T1) with a distance of 58,7 Km.
With distribution costs 872×58.7=Rp51.199/day
Zero: Jurnal Sains, Matematika dan Terapan
Optimization of Coca-Cola Product Distribution Routes at PT. Graha Prima Mentari Medan With Ant Colony Optimization( PridolinTarigan)
27
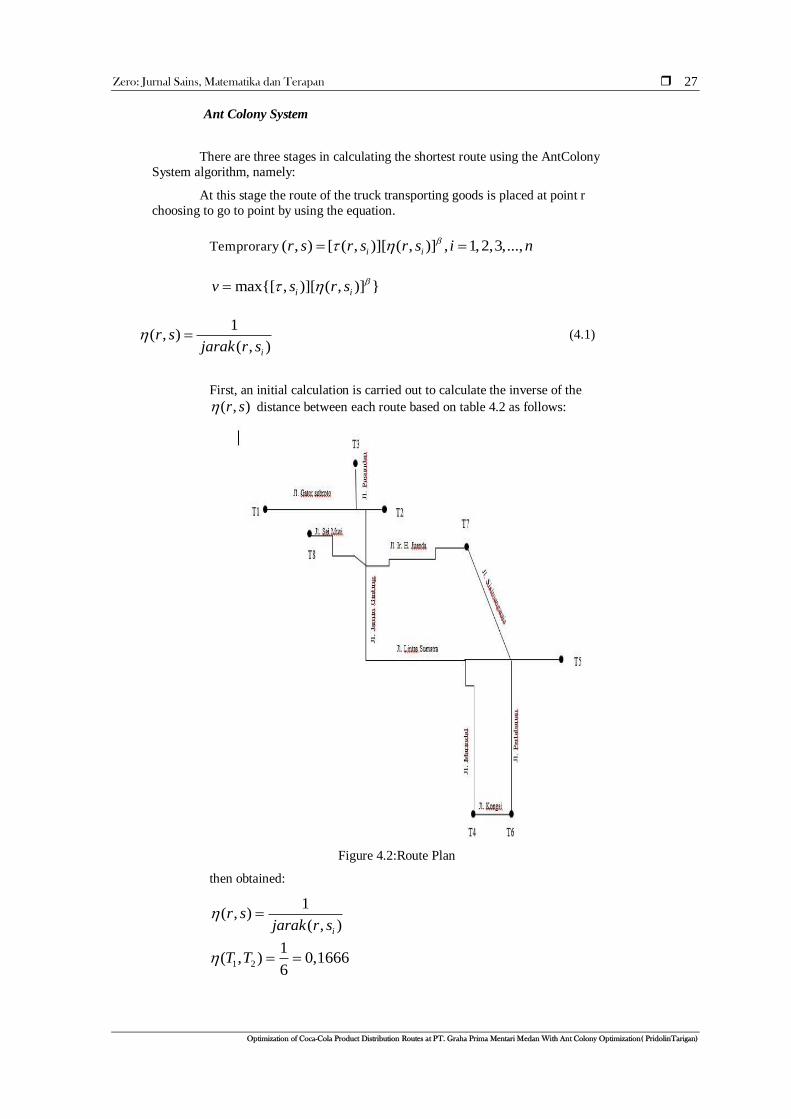
Ant Colony System
There are three stages in calculating the shortest route using the AntColony
System algorithm, namely:
At this stage the route of the truck transporting goods is placed at point r
choosing to go to point by using the equation.
Temprorary ( , ) [ ( , )][ ( , )] , 1,2,3,...,i ir s r s r s i n
max{[ , )][ ( , )] }i iv s r s
1( , )
( , )i
r sjarak r s
(4.1)
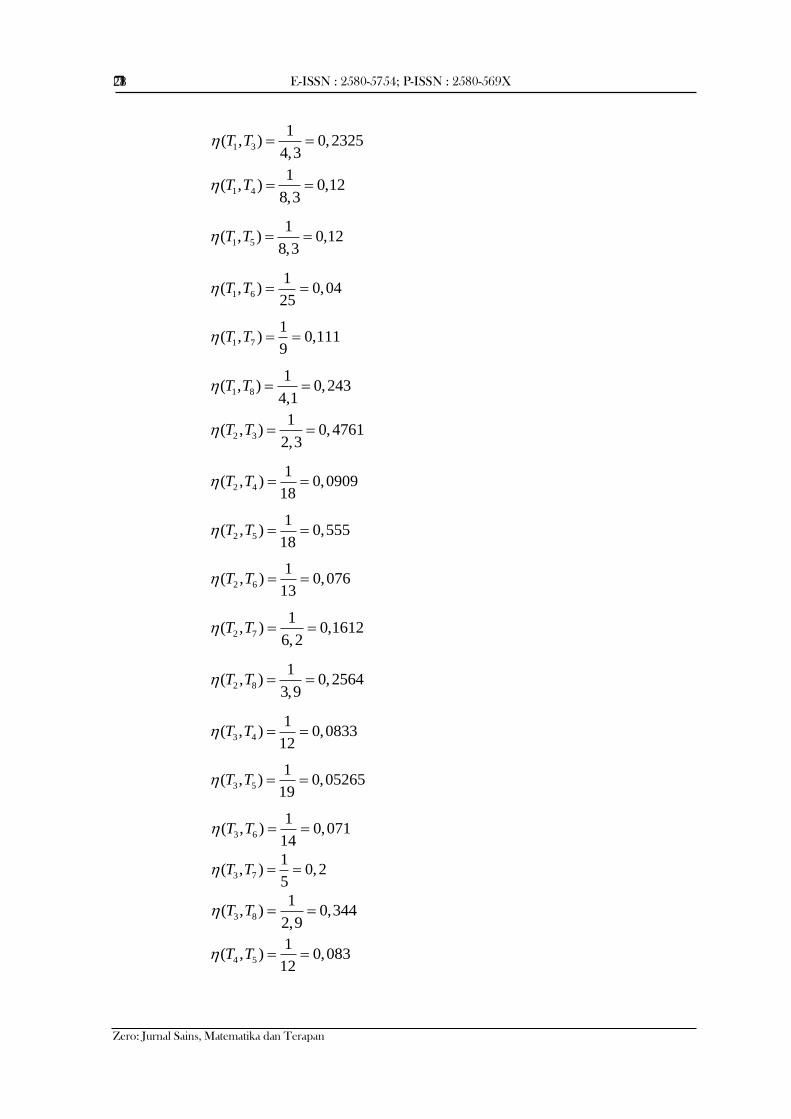
First, an initial calculation is carried out to calculate the inverse of the
( , )r s distance between each route based on table 4.2 as follows:
Figure 4.2:Route Plan
then obtained:
1( , )
( , )i
r sjarak r s
1 2
1( , ) 0,1666
6T T
E-ISSN : 2580-5754; P-ISSN : 2580-569X
Zero: Jurnal Sains, Matematika dan Terapan
28
1 3
1( , ) 0,2325
4,3T T
1 4
1( , ) 0,12
8,3T T
1 5
1( , ) 0,12
8,3T T
1 6
1( , ) 0,04
25T T
1 7
1( , ) 0,111
9T T
1 8
1( , ) 0,243
4,1T T
2 3
1( , ) 0,4761
2,3T T
2 4
1( , ) 0,0909
18T T
2 5
1( , ) 0,555
18T T
2 6
1( , ) 0,076
13T T
2 7
1( , ) 0,1612
6,2T T
2 8
1( , ) 0,2564
3,9T T
3 4
1( , ) 0,0833
12T T
3 5
1( , ) 0,05265
19T T
3 6
1( , ) 0,071
14T T
3 7
1( , ) 0,2
5T T
3 8
1( , ) 0,344
2,9T T
4 5
1( , ) 0,083
12T T
Zero: Jurnal Sains, Matematika dan Terapan
Optimization of Coca-Cola Product Distribution Routes at PT. Graha Prima Mentari Medan With Ant Colony Optimization( PridolinTarigan)
29
4 6
1( , ) 0,055
1,8T T
4 7
1( , ) 0,1265
7,8T T
4 8
1( , ) 0,076
13T T
5 6
1( , ) 0,1265
7,9T T
5 7
1( , ) 0,0833
12T T
5 8
1( , ) 0,0588
17T T
6 7
1( , ) 0,1111
9T T
6 8
1( , ) 0,0769
13T T
7 8
1( , ) 0,1785
5,6T T
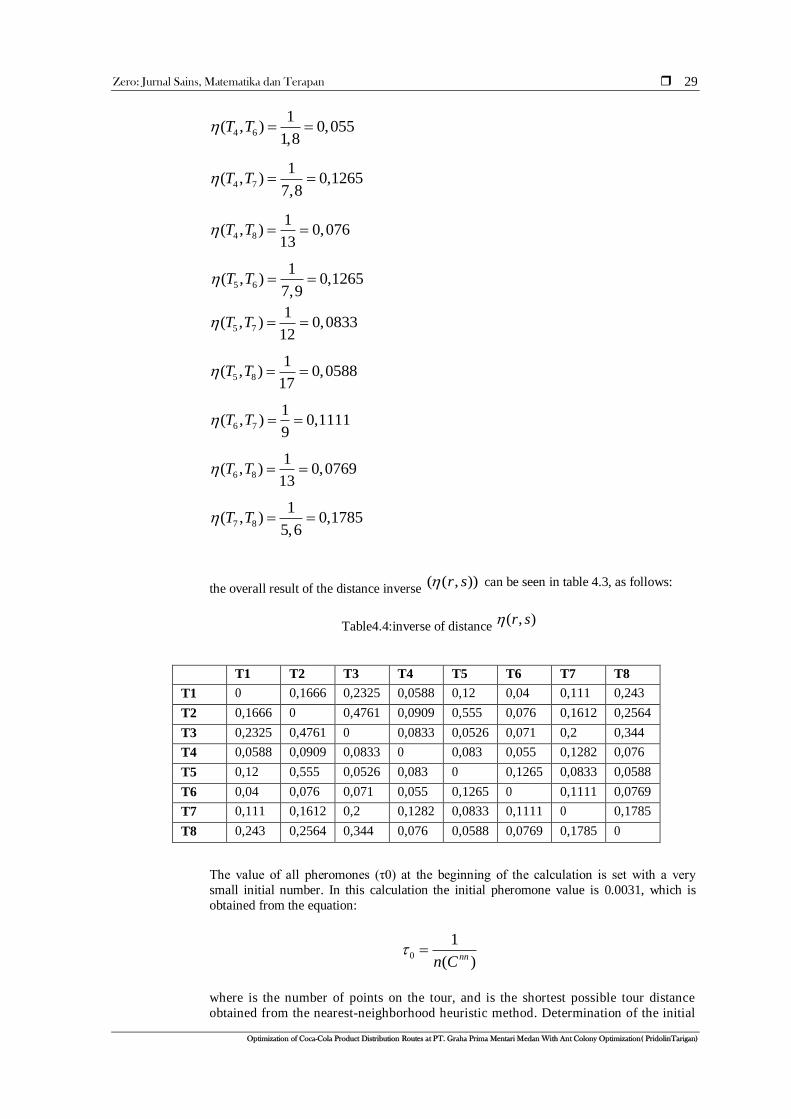
the overall result of the distance inverse ( ( , ))r s can be seen in table 4.3, as follows:
Table4.4:inverse of distance ( , )r s
T1 T2 T3 T4 T5 T6 T7 T8
T1 0 0,1666 0,2325 0,0588 0,12 0,04 0,111 0,243
T2 0,1666 0 0,4761 0,0909 0,555 0,076 0,1612 0,2564
T3 0,2325 0,4761 0 0,0833 0,0526 0,071 0,2 0,344
T4 0,0588 0,0909 0,0833 0 0,083 0,055 0,1282 0,076
T5 0,12 0,555 0,0526 0,083 0 0,1265 0,0833 0,0588
T6 0,04 0,076 0,071 0,055 0,1265 0 0,1111 0,0769
T7 0,111 0,1612 0,2 0,1282 0,0833 0,1111 0 0,1785
T8 0,243 0,2564 0,344 0,076 0,0588 0,0769 0,1785 0
The value of all pheromones (τ0) at the beginning of the calculation is set with a very
small initial number. In this calculation the initial pheromone value is 0.0031, which is
obtained from the equation:
0
1
( )nnn C
where is the number of points on the tour, and is the shortest possible tour distance
obtained from the nearest-neighborhood heuristic method. Determination of the initial
E-ISSN : 2580-5754; P-ISSN : 2580-569X
Zero: Jurnal Sains, Matematika dan Terapan
30
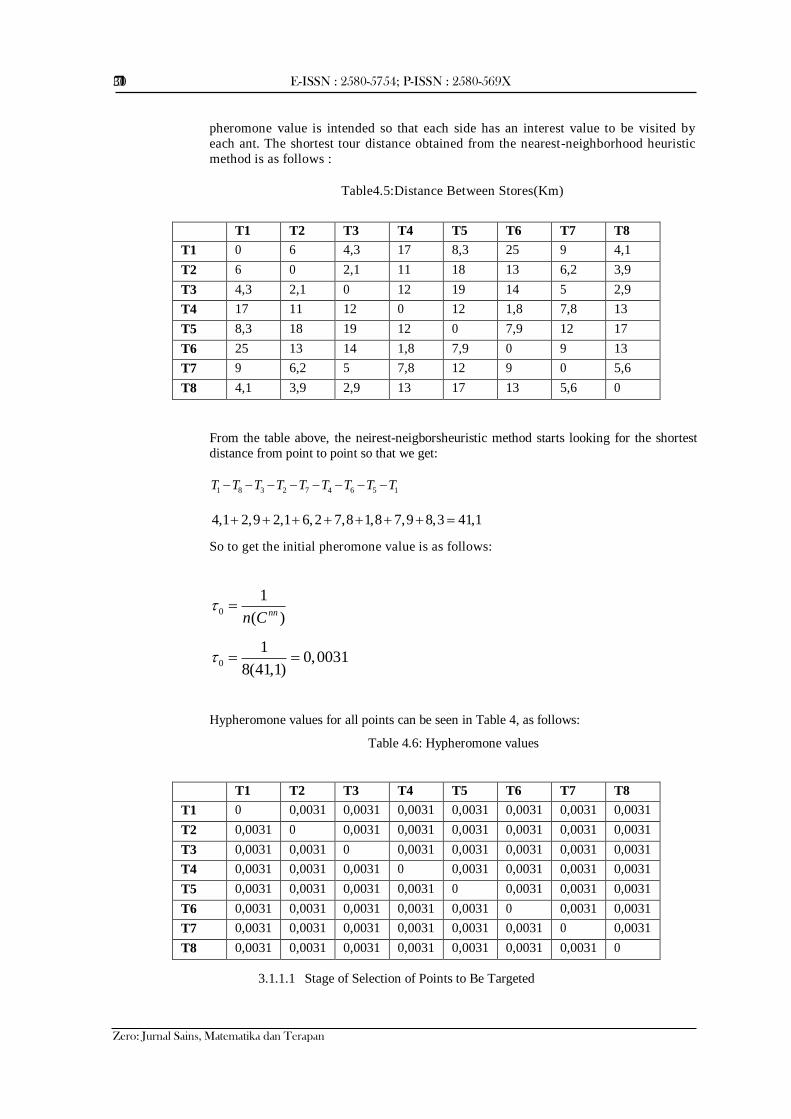
pheromone value is intended so that each side has an interest value to be visited by
each ant. The shortest tour distance obtained from the nearest-neighborhood heuristic
method is as follows :
Table4.5:Distance Between Stores(Km)
T1 T2 T3 T4 T5 T6 T7 T8
T1 0 6 4,3 17 8,3 25 9 4,1
T2 6 0 2,1 11 18 13 6,2 3,9
T3 4,3 2,1 0 12 19 14 5 2,9
T4 17 11 12 0 12 1,8 7,8 13
T5 8,3 18 19 12 0 7,9 12 17
T6 25 13 14 1,8 7,9 0 9 13
T7 9 6,2 5 7,8 12 9 0 5,6
T8 4,1 3,9 2,9 13 17 13 5,6 0
From the table above, the neirest-neigborsheuristic method starts looking for the shortest
distance from point to point so that we get:
1 8 3 2 7 4 6 5 1T T T T T T T T T
4,1 2,9 2,1 6,2 7,8 1,8 7,9 8,3 41,1
So to get the initial pheromone value is as follows:
0
1
( )nnn C
0
10,0031
8(41,1)
Hypheromone values for all points can be seen in Table 4, as follows:
Table 4.6: Hypheromone values
T1 T2 T3 T4 T5 T6 T7 T8
T1 0 0,0031 0,0031 0,0031 0,0031 0,0031 0,0031 0,0031
T2 0,0031 0 0,0031 0,0031 0,0031 0,0031 0,0031 0,0031
T3 0,0031 0,0031 0 0,0031 0,0031 0,0031 0,0031 0,0031
T4 0,0031 0,0031 0,0031 0 0,0031 0,0031 0,0031 0,0031
T5 0,0031 0,0031 0,0031 0,0031 0 0,0031 0,0031 0,0031
T6 0,0031 0,0031 0,0031 0,0031 0,0031 0 0,0031 0,0031
T7 0,0031 0,0031 0,0031 0,0031 0,0031 0,0031 0 0,0031
T8 0,0031 0,0031 0,0031 0,0031 0,0031 0,0031 0,0031 0
3.1.1.1 Stage of Selection of Points to Be Targeted
Zero: Jurnal Sains, Matematika dan Terapan
Optimization of Coca-Cola Product Distribution Routes at PT. Graha Prima Mentari Medan With Ant Colony Optimization( PridolinTarigan)
31
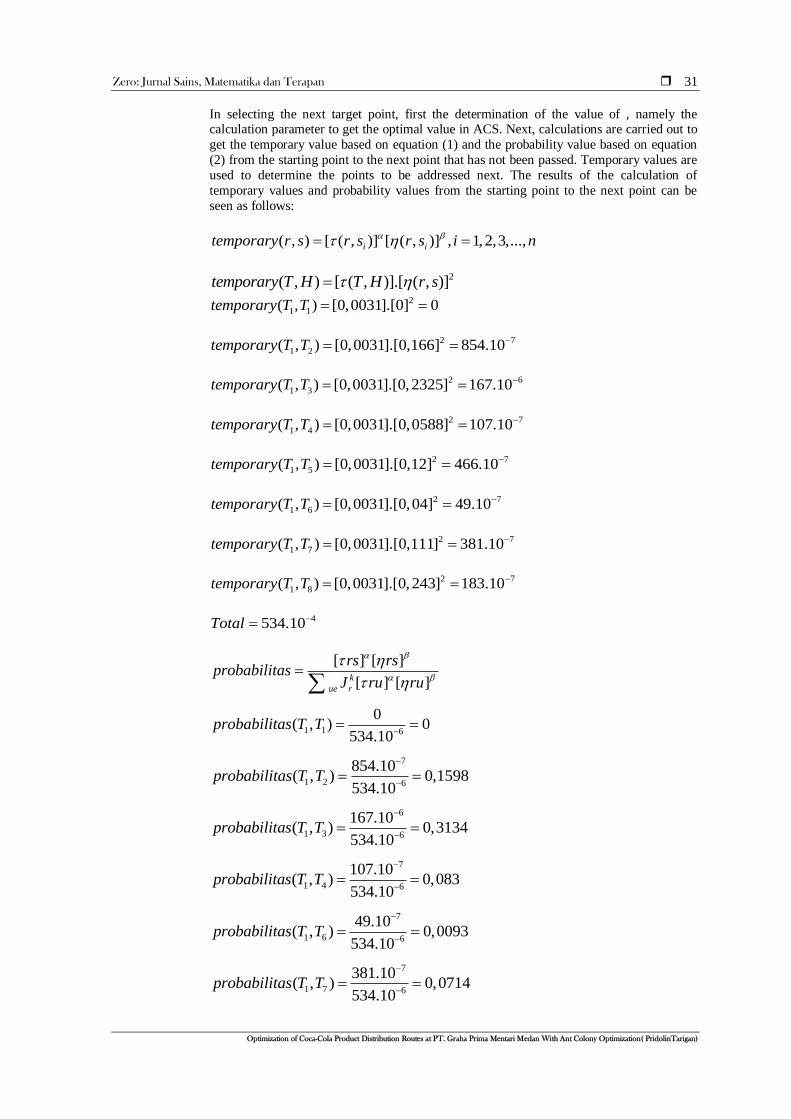
In selecting the next target point, first the determination of the value of , namely the calculation parameter to get the optimal value in ACS. Next, calculations are carried out to
get the temporary value based on equation (1) and the probability value based on equation
(2) from the starting point to the next point that has not been passed. Temporary values are
used to determine the points to be addressed next. The results of the calculation of
temporary values and probability values from the starting point to the next point can be
seen as follows:
( , ) [ ( , )] [ ( , )] , 1,2,3,...,i itemporary r s r s r s i n
2( , ) [ ( , )].[ ( , )]temporary T H T H r s
2
1 1( , ) [0,0031].[0] 0temporary T T
2 7
1 2( , ) [0,0031].[0,166] 854.10temporary T T
2 6
1 3( , ) [0,0031].[0,2325] 167.10temporary T T
2 7
1 4( , ) [0,0031].[0,0588] 107.10temporary T T
2 7
1 5( , ) [0,0031].[0,12] 466.10temporary T T
2 7
1 6( , ) [0,0031].[0,04] 49.10temporary T T
2 7
1 7( , ) [0,0031].[0,111] 381.10temporary T T
2 7
1 8( , ) [0,0031].[0,243] 183.10temporary T T
4534.10Total
[ ] [ ]
[ ] [ ]k
ue r
rs rsprobabilitas
J ru ru
1 1 6
0( , ) 0
534.10probabilitas T T
7
1 2 6
854.10( , ) 0,1598
534.10probabilitas T T
6
1 3 6
167.10( , ) 0,3134
534.10probabilitas T T
7
1 4 6
107.10( , ) 0,083
534.10probabilitas T T
7
1 6 6
49.10( , ) 0,0093
534.10probabilitas T T
7
1 7 6
381.10( , ) 0,0714
534.10probabilitas T T
E-ISSN : 2580-5754; P-ISSN : 2580-569X
Zero: Jurnal Sains, Matematika dan Terapan
32
6
1 8 6
183.10( , ) 0,3424
534.10probabilitas T T
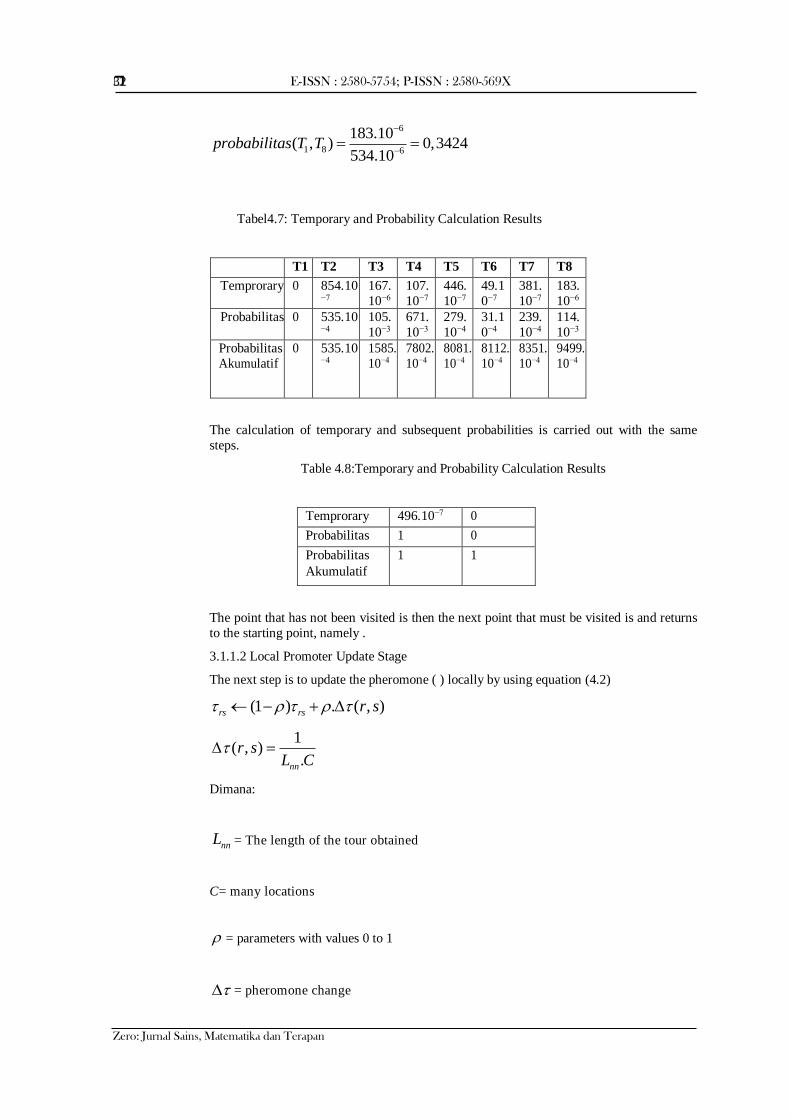
Tabel4.7: Temporary and Probability Calculation Results
T1 T2 T3 T4 T5 T6 T7 T8
Temprorary 0 854.10−7
167.
10−6
107.
10−7
446.
10−7
49.1
0−7
381.
10−7
183.
10−6
Probabilitas 0 535.10−4
105.
10−3
671.
10−3
279.
10−4
31.1
0−4
239.
10−4
114.
10−3
Probabilitas
Akumulatif
0 535.10−4
1585.
10−4
7802.
10−4
8081.
10−4
8112.
10−4
8351.
10−4
9499.
10−4
The calculation of temporary and subsequent probabilities is carried out with the same
steps.
Table 4.8:Temporary and Probability Calculation Results
Temprorary 496.10−7 0
Probabilitas 1 0
Probabilitas
Akumulatif
1 1
The point that has not been visited is then the next point that must be visited is and returns
to the starting point, namely .
3.1.1.2 Local Promoter Update Stage
The next step is to update the pheromone ( ) locally by using equation (4.2)
(1 ) . ( , )rs rs r s
1( , )
.nn
r sL C
Dimana:
nnL = The length of the tour obtained
C= many locations
= parameters with values 0 to 1
= pheromone change
Zero: Jurnal Sains, Matematika dan Terapan
Optimization of Coca-Cola Product Distribution Routes at PT. Graha Prima Mentari Medan With Ant Colony Optimization( PridolinTarigan)
33
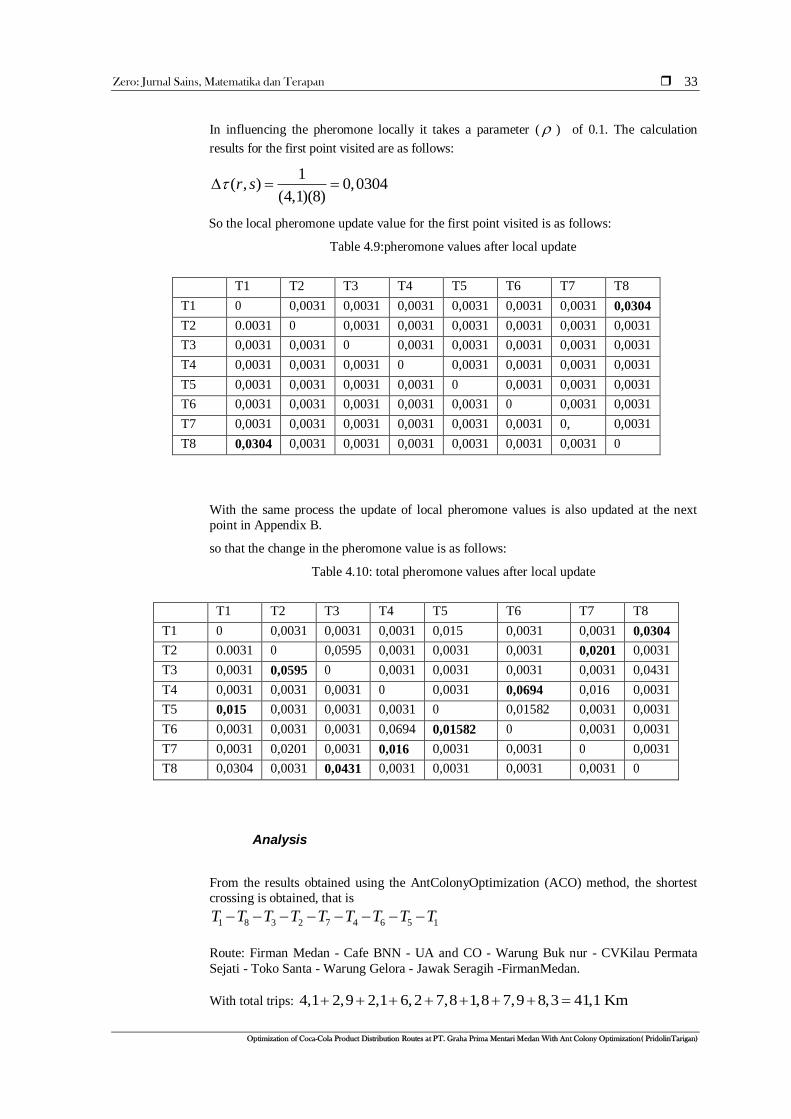
In influencing the pheromone locally it takes a parameter ( ) of 0.1. The calculation
results for the first point visited are as follows:
1( , ) 0,0304
(4,1)(8)r s
So the local pheromone update value for the first point visited is as follows:
Table 4.9:pheromone values after local update
T1 T2 T3 T4 T5 T6 T7 T8
T1 0 0,0031 0,0031 0,0031 0,0031 0,0031 0,0031 0,0304
T2 0.0031 0 0,0031 0,0031 0,0031 0,0031 0,0031 0,0031
T3 0,0031 0,0031 0 0,0031 0,0031 0,0031 0,0031 0,0031
T4 0,0031 0,0031 0,0031 0 0,0031 0,0031 0,0031 0,0031
T5 0,0031 0,0031 0,0031 0,0031 0 0,0031 0,0031 0,0031
T6 0,0031 0,0031 0,0031 0,0031 0,0031 0 0,0031 0,0031
T7 0,0031 0,0031 0,0031 0,0031 0,0031 0,0031 0, 0,0031
T8 0,0304 0,0031 0,0031 0,0031 0,0031 0,0031 0,0031 0
With the same process the update of local pheromone values is also updated at the next
point in Appendix B.
so that the change in the pheromone value is as follows:
Table 4.10: total pheromone values after local update
T1 T2 T3 T4 T5 T6 T7 T8
T1 0 0,0031 0,0031 0,0031 0,015 0,0031 0,0031 0,0304
T2 0.0031 0 0,0595 0,0031 0,0031 0,0031 0,0201 0,0031
T3 0,0031 0,0595 0 0,0031 0,0031 0,0031 0,0031 0,0431
T4 0,0031 0,0031 0,0031 0 0,0031 0,0694 0,016 0,0031
T5 0,015 0,0031 0,0031 0,0031 0 0,01582 0,0031 0,0031
T6 0,0031 0,0031 0,0031 0,0694 0,01582 0 0,0031 0,0031
T7 0,0031 0,0201 0,0031 0,016 0,0031 0,0031 0 0,0031
T8 0,0304 0,0031 0,0431 0,0031 0,0031 0,0031 0,0031 0
Analysis
From the results obtained using the AntColonyOptimization (ACO) method, the shortest
crossing is obtained, that is
1 8 3 2 7 4 6 5 1T T T T T T T T T
Route: Firman Medan - Cafe BNN - UA and CO - Warung Buk nur - CVKilau Permata
Sejati - Toko Santa - Warung Gelora - Jawak Seragih -FirmanMedan.
With total trips: 4,1 2,9 2,1 6,2 7,8 1,8 7,9 8,3 41,1 Km
E-ISSN : 2580-5754; P-ISSN : 2580-569X
Zero: Jurnal Sains, Matematika dan Terapan
34
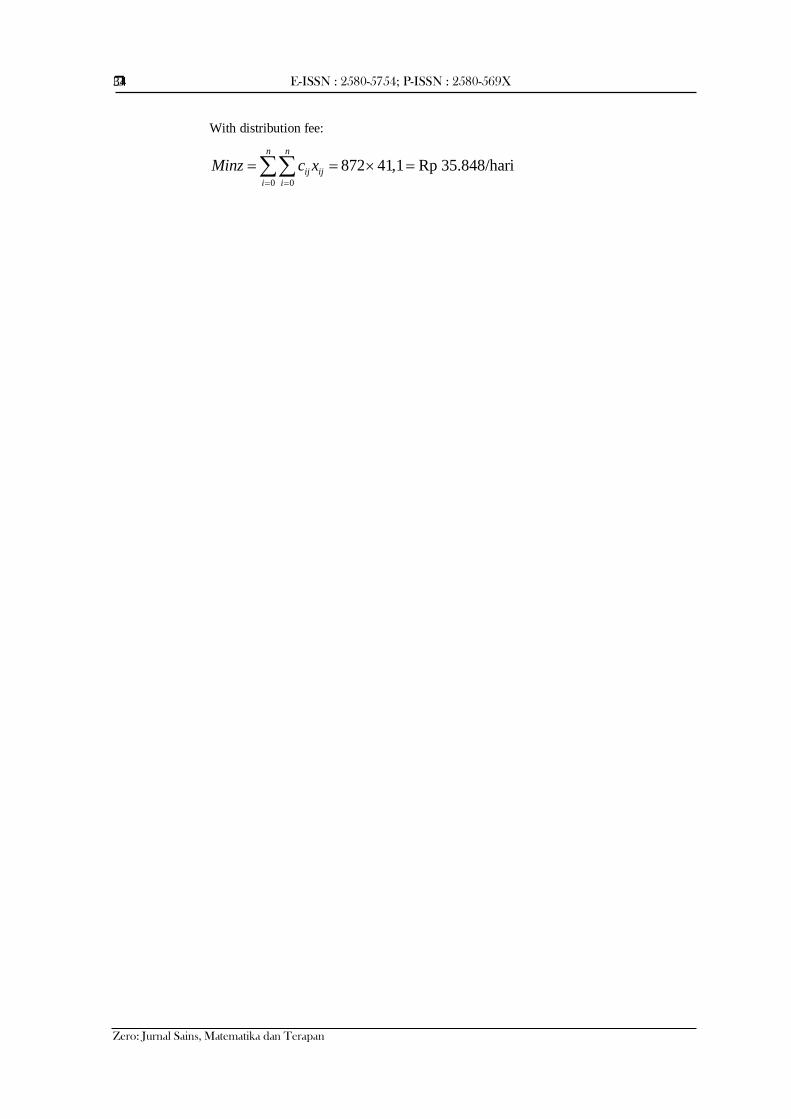
With distribution fee:
0 0
872 41,1 Rp 35.848/harin n
ij ij
i i
Minz c x
Zero: Jurnal Sains, Matematika dan Terapan
Optimization of Coca-Cola Product Distribution Routes at PT. Graha Prima Mentari Medan With Ant Colony Optimization( PridolinTarigan)
35
4. CONCLUSION
Based on the research results, the following conclusions can be drawn:
1. The route taken by the driver in distributing coca cola products, namely from Firman
Medan ( T1 ) to Warung Buk Nur ( T2 ) continued to UA and CO (T3 ) continued to
Santa Shop (T4 ) then to Java Saragih (T5 ) continued to Warung Gelora ( T6) then to
CV Kilau Permata Sejati ( T7) continued to Cafe BNN (T8 ) and returned to the
starting point with Firman Medan (T1 ) 58.7 Km and the distance traveled using the ant
colony optimization method, especially in finding the shortest route at PT. Graha Prima
Mentari West Medan branch with the distribution sequence starting from the starting
point, namely Firman Medan (T1 ) to Cafe BNN (T8 ) then UA and CO (T3 ) then to
Warung Buk Nur (T2 ) then CV Kilau Permata Sejati ( nta ) then to Tokosa (T7 )
continue to Warung Gelora (T4 ) then go to Jawak Seragih (T6 ) and return to the
starting point of Firman Medan (T5 ) resulting in a distance of 41.1 Km so that the
difference obtained is 17.6 km.
2. The cost of distribution using the company's route is Rp. 51.199/day and distribution
costs using the ant colony optimization method of Rp. 35,848/day so that the difference
in distribution costs is Rp. 15,351/ day
REFERENCES
[1] Arman Ade SM, R. E., dan Febriana, N., (2017): OptimasiRuteDistribusi Air Minum
Quelle DenganAlgoritma Clarke and Wright Saving Dan Model Vechile Routing
Problem, ITN Malang, .
[2] Akbar, F., dan Sumiati (2016):
PenentuanRuteDistribusiTehBotolMenggunakanMetode Travelling Salesman
Problem(TSP) UntukMeminimasiBiayadistribusi, Teknik Industri UPNV, .
[3] Irsyadi, M., Iskandar, I., dan Tiraz, F. G., (2019):
OptimasijalurPengangkutanSampahMenggunakanMetode Ant Colony optimization Di
Kota PekanBaru, CoreIT, 5(1).
[4] Bullnheimer, B., Hartl, R. F., dan Strauss (1997): A new rank based version of the Ant System-A computational study, Technical report, Institute of Management Science,
University of Vienna, Austria.
[5] Dorigo, M., dan Gambardella, L., (1997): Ant colonies for the traveling salesman problem, Tech.Rep/IRIDIA/1996-003, Universit Libre de Bruxelles, Belgium.
[6] Maniezzo, V., Dorigo, M., dan Colorni, A., (1996): The Ant System: Optimization by a
colony of cooperating agents, IEEE Transactions on Systems, Man, and Cybernetics,
Belgium.
[7] NemhauserG.L, K. Aardal, R. F., dan R.Weismantel (2005): Discrete Optimization,
Handbook in operation Research and Management Science 12, North Holland,
Institute of Management Science, University of Vienna, Austria.
[8] Rinindya, N., W.W., A., dan Cholissodin, I., (2016): Optimasi Multiple Travelling
Salesman Problem Pada Pendistribusian Air MinumMenggunakanAlgoritme Particle
Swarm Optimization, Pengem- banganTeknologiInformasi dan IlmuKomputer, 1(9),
842–848.
[9] Subekti, E., (2019): Economic Dispath Pada PembakitTermalSistem 500 KvJawa-Bali
DenganMetodeHibrid Particle Swarm Optimization- Ant Colony Optimization,
UNIVERSITAS BRAWIJAYA, .
E-ISSN : 2580-5754; P-ISSN : 2580-569X
Zero: Jurnal Sains, Matematika dan Terapan
36
[10] Taufiq, M., Amin, S., dan Dwijanto (2019):
MenentukanRuteTerpendekDenganMemanfaatkanMetodeHeuristikBerbasisAlgoritma
A, Matematika, 42(1), 43–51.
[11] Uliyani, S., (2018): AnalisisPerbandinganrelokasiSectionalizer Pada
PenyulangPujonUntukMeningkatkanKeandalanSistemDistribusiMenggunakan Ant
Colony Optimization Dan Simulated Annealing Method, UNIVERSITAS BRAWIJAYA, .via, R., Yasin, H., dan Santoso, R., (2019): Pencarian Jalur Terpendek


