Embed Size (px)
Citation preview

RESEARCH
ARTIC
LE
Copyright © 2015 American Scientific PublishersAll rights reservedPrinted in the United States of America
Journal ofAdvanced Microscopy Research
Vol. 10, 1–11, 2015
Optimization of End Milling Parameters for Al/SiC byResponse Surface Methodology
M. Vamsi Krishna1�∗ and M. Anthony Xavior21Department of Mechanical Engineering, Madanapalle Institute of Technology and Science,
Madanapalle 517325, Andhra Pradesh, India2School of Mechanical and Building Sciences, Vellore Institute of Technology University,
Vellore 632014, Tamil Nadu, India
For industrial applications, the ceramics composites are machined in large scale using end millingprocess. Due the abrasive reinforcement particle of composite, the failure in tool life and surfacequality are possible. This research work focuses on developing the mathematical models of cut-ting force (FR), Metal Removal Rate (MRR) and surface roughness (Ra) and to optimize it. TheResponse Surface Methodology (RSM) with the L31 empirical model was used for conducting thebasic trials on Al/SiC composites of various compositions. The XRD, EDS, optical microscopicimages of Al/SiC composites were analyzed and the SEM morphology of the machined sampleswas studied. The models developed for predicting responses were tested by analysis of variance(ANOVA) to evaluate its adequacy. The optimal configuration of machining parameters was identifiedwhich yields 31.9326 mm3/s, 1.4443 �m and 41.4364 N of MRR, Ra and FR respectively.
Keywords: Milling, Optimization, Aluminium, Composites, Polycrystalline Diamond Tool.
1. INTRODUCTIONGenerally, the ceramic composites are aluminium basedcomposites which are reinforced with ceramic particleslike Si3N4, A12O3, B4C, TiC, etc.
1–5 The Al/SiC compos-ites are most preferable for the industrial applications dueto its low density and high strength.6
The machining of ceramic composites was difficultbecause of its non-homogeneous, anisotropic and rein-forced by abrasive materials.7 The machined compositemay experience a significant damage and high wear rateon the cutting tools. The machining of composite materialswas depending on several conditions like material proper-ties, relative content of the reinforcement and the responseto the machining process.8
Fei et al.9 studied the compound machining of the engi-neering materials to increase the efficiency of the machin-ing method. It was concluded that the machine can besuggested based on the efficiency of output parameters butoptimizing all the outputs in a single machine mode wastedious.
End milling is a vital and common machining pro-cess because of its flexibility and capability to pro-duce various profiles even with the curved surfaces.It has the ability to remove material with good surface
∗Author to whom correspondence should be addressed.
quality and the milled surfaces are largely used to matethe aerospace, automobile, biomedical and manufacturingindustries applications.10 It has wide use in these industriesbecause of its good performance in processing difficult-to-machine materials.11
The major aims of the machining process are improvingthe surface roughness quality and maximizing the mate-rial removal rate (MRR) with optimal cutting force. Tra-ditionally, trial-and-error and heuristic approaches wereemployed to obtain the optimal machining parameters.It was well recognized that these methods were time con-suming and lead to long machining periods with largemachining cost.12
Design of Experiments (DOE) is a powerful analysistool for modelling and analyzing the influence of controlfactors on output performance. The traditional experimen-tal design is difficult to be used especially when dealingwith large number of experiments and when the numberof machining parameters increased.13 The most importantstage in the design of experiment lies in the selection ofthe control factors.14
Oktem et al.15 had focused on the development of aneffective methodology to determine the optimum cuttingconditions leading to minimum surface roughness (Ra)in milling by coupling the Response Surface Methodol-ogy (RSM) with the developed genetic algorithm (GA).Afazov et al.16 studied the micro milling conditions which
J. Adv. Microsc. Res. 2015, Vol. 10, No. 3 2156-7573/2015/10/001/011 doi:10.1166/jamr.2015.1264 1

RESEARCH
ARTIC
LE
Optimization of End Milling Parameters for Al/SiC by Response Surface Methodology Krishna and Xavior
Fig. 1. XRD pattern of Al/SiC composite.
Fig. 2. EDS spectrum of Al/SiC composite.
influence the cutting force for optimizing the process sta-bility. Later, Emel et al.17 had done a work to optimizethe cutting fluids and the cutting parameters in end millingprocess using DOE. As a result, a new machining methodwith minimal machining cost and without environmentalimpacts was developed.
Fig. 3. Microstructure images of Al/SiC composite (a) 5 wt% (b) 10 wt% (c) 15 wt%.
The optimization of all the output parameters ofend milling process was a tedious. This research workfocuses on developing the mathematical models of cut-ting force (FR), Metal Removal Rate (MRR) and surfaceroughness (Ra) and to optimize it. And also the adequaciesin predicting the responses by the developed models wereanalyzed along with experimental results and the deviationfrom the optimal configuration was evaluated.
2. MATERIALS AND METHODS2.1. MaterialsThe end milling tests were conducted with BATIBOI-NOMO universal milling machine. In the milling exper-iments, Al 6061/SiC composite material were used asthe work piece with varying reinforcement wt% of 5, 10and 15, which had the dimension of 100*100*10 mm3.Using the stir casting method, the Al/SiC composites weremanufactured with the SiC particle size of 37 �m. Formachining these composites for good machinability, thePoly Crystalline Diamond (PCD) tools were selected.18
The PCD coated tool of thickness 0.6 mm and 12 mm indiameter was used.
2.2. MeasurementsThe distribution of the reinforcement in the matrix, themicrostructure characterization was done using invertedmetallurgical microscope (NIKON MM 400/800). Thespecimens were cut from the central portion of thecomposites and well polished using velvet disc polish-ing machine with alumina. The Keller’s reagent was used
2 J. Adv. Microsc. Res. 10, 1–11, 2015

RESEARCH
ARTIC
LE
Krishna and Xavior Optimization of End Milling Parameters for Al/SiC by Response Surface Methodology
Fig. 4. Contour plots for MRR.
to remove the burrs and foreign particles from samplesurface.
The MRR was calculated using the Eq. (1) and the cut-ting forces was measured using the 3-axis milling tooldynamometer-Kistler 9257B. The force data were acquiredvia DAQ card and an amplifier, and it was processed byDynoware software. Using this force setup, three forcecomponents (Fx, Fy and Fz) were measured simultaneouslyand its resultant (FR) was calculated using Eq. (2). TheSurface roughness (Ra) of the machined surface was mea-sured using ROGOSOFT 90G Profilometer with the accu-racy of 0.001 �m.
MRR = l ∗b ∗DOCTime
(1)
FR =√F 2x +F 2
y +F 2z (2)
Fig. 5. SEM images of (a) minimum and (b) maximum MRR.
Where, l = length of the plate, b = breath of the plate,DOC = depth of cut, FR = Resultant cutting force, Fx, Fyand Fz = Cutting force along x, y and z-axis respectively.The Scanning electron microscope (SEM) images of the
machinied zone is examined through HITACHI—S3400SEM equipped with Energy Dispersive Spectrum (EDS)analysis.
3. RESULTS AND DISCUSSION3.1. Characterization3.1.1. X-ray Diffraction AnalysisThe X-ray diffraction (XRD) (Model: X’per PRO) patternof the Al/SiC composite was shown in Figure 1 and itmatches with the JCPDS file #04-0787.19 It exhibits strongorientation of (111) plane at 38.33� and weak orientation
J. Adv. Microsc. Res. 10, 1–11, 2015 3
RESEARCH
ARTIC
LE
Optimization of End Milling Parameters for Al/SiC by Response Surface Methodology Krishna and Xavior
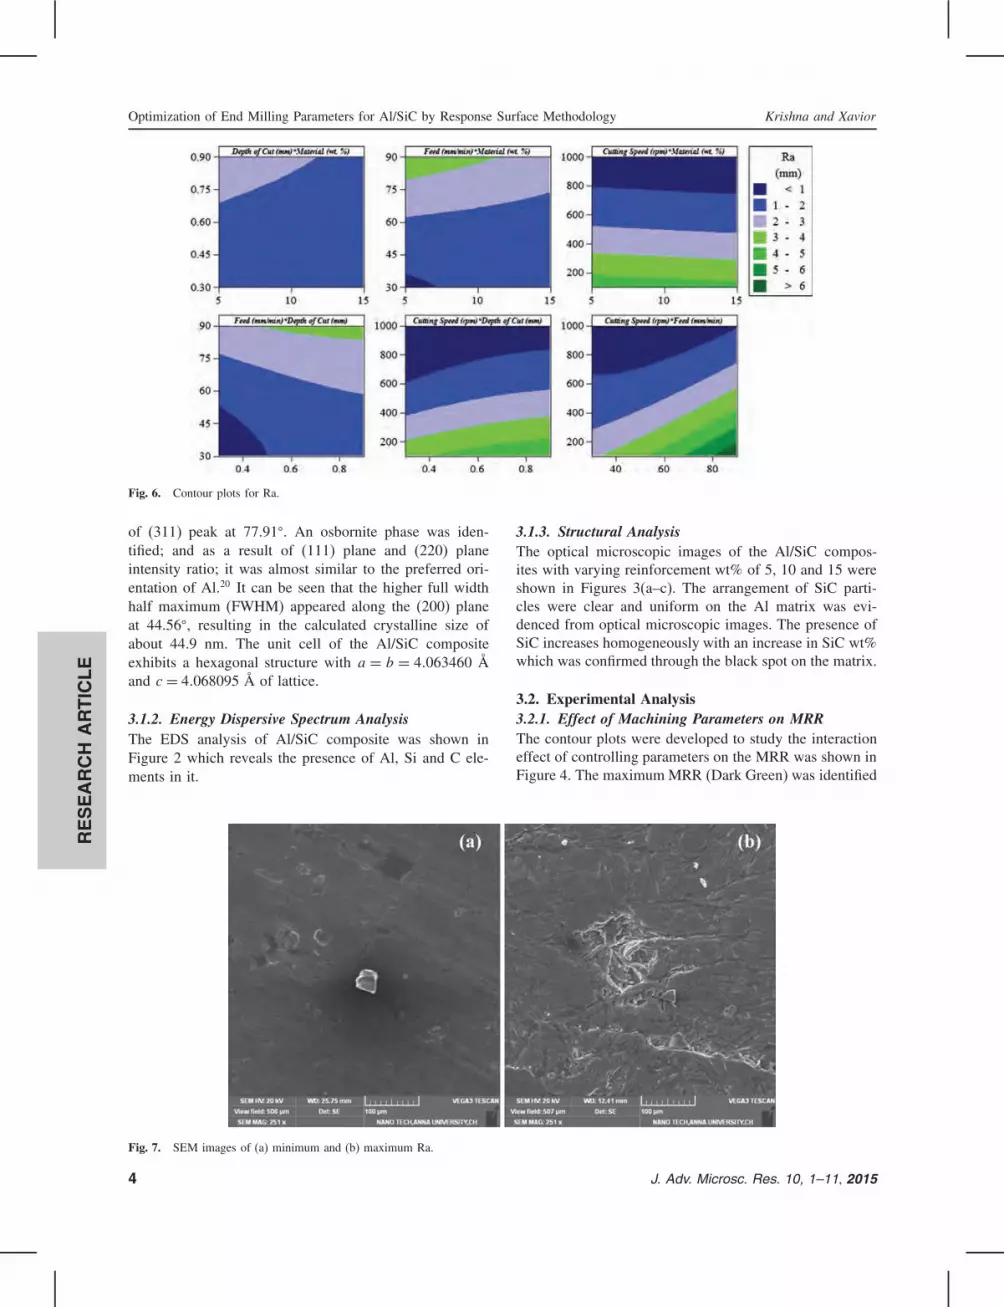
Fig. 6. Contour plots for Ra.
of (311) peak at 77.91�. An osbornite phase was iden-tified; and as a result of (111) plane and (220) planeintensity ratio; it was almost similar to the preferred ori-entation of Al.20 It can be seen that the higher full widthhalf maximum (FWHM) appeared along the (200) planeat 44.56�, resulting in the calculated crystalline size ofabout 44.9 nm. The unit cell of the Al/SiC compositeexhibits a hexagonal structure with a = b = 4�063460 Åand c = 4�068095 Å of lattice.
3.1.2. Energy Dispersive Spectrum AnalysisThe EDS analysis of Al/SiC composite was shown inFigure 2 which reveals the presence of Al, Si and C ele-ments in it.
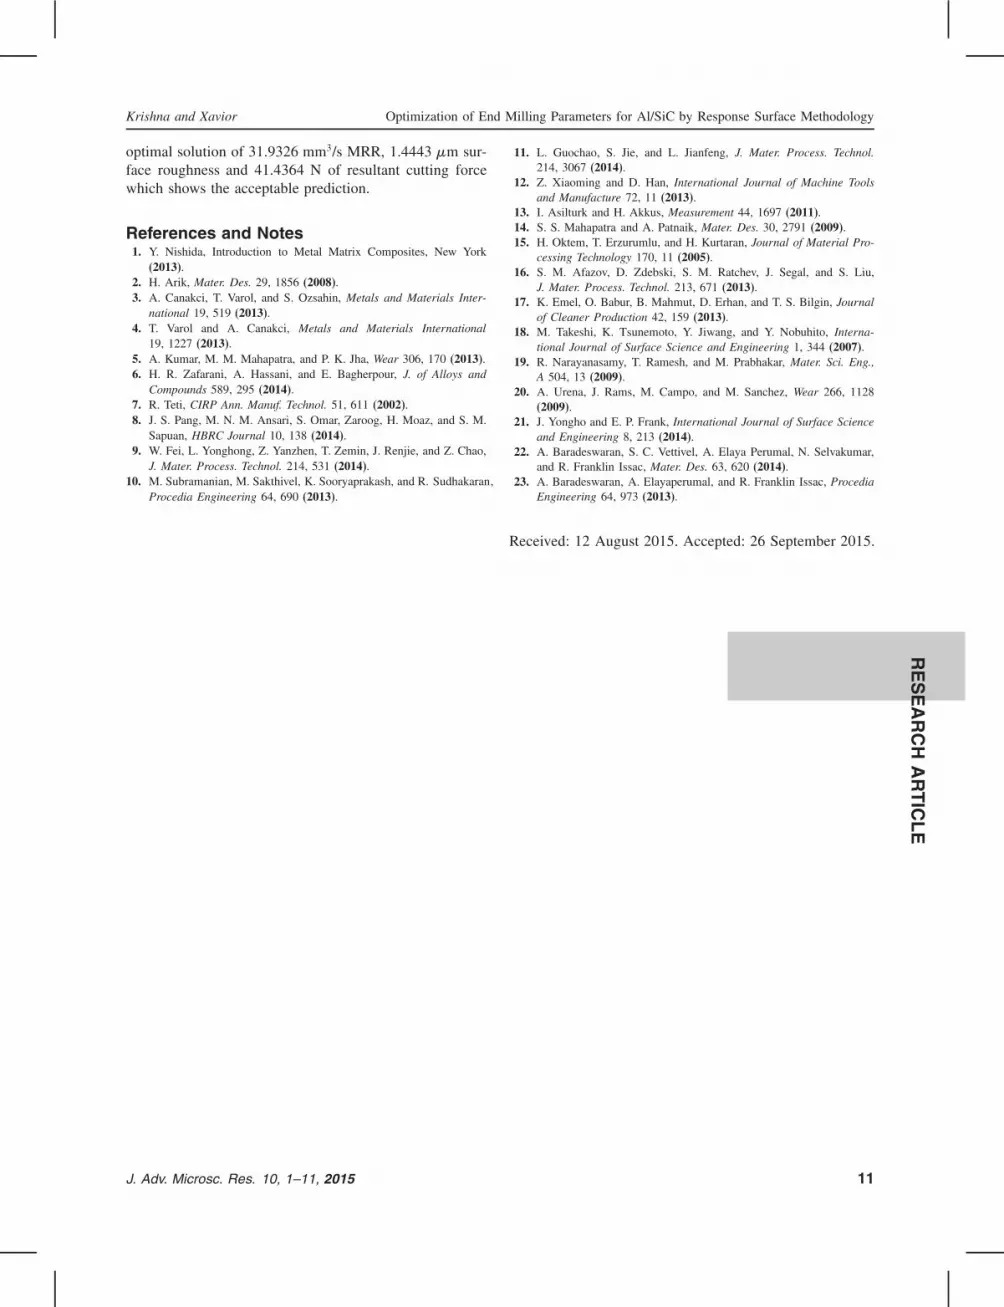
Fig. 7. SEM images of (a) minimum and (b) maximum Ra.
3.1.3. Structural AnalysisThe optical microscopic images of the Al/SiC compos-ites with varying reinforcement wt% of 5, 10 and 15 wereshown in Figures 3(a–c). The arrangement of SiC parti-cles were clear and uniform on the Al matrix was evi-denced from optical microscopic images. The presence ofSiC increases homogeneously with an increase in SiC wt%which was confirmed through the black spot on the matrix.
3.2. Experimental Analysis3.2.1. Effect of Machining Parameters on MRRThe contour plots were developed to study the interactioneffect of controlling parameters on the MRR was shown inFigure 4. The maximum MRR (Dark Green) was identified
4 J. Adv. Microsc. Res. 10, 1–11, 2015

RESEARCH
ARTIC
LE
Krishna and Xavior Optimization of End Milling Parameters for Al/SiC by Response Surface Methodology
Fig. 8. Contour plots for FR.
at high depth of cut and feed rate. The material and cut-ting speed factors doesn’t influence the MRR comparedto others. This result agrees with the results of Yonghoand Frank.21 The SEM morphology of the machined sur-face with maximum and minimum MRR were shown inFigure 5. The minimum MRR (Dark Blue) was identifiedat low depth of cut and feed rate with 15 wt% of SiCreinforcement.
3.2.2. Effect of Machining Parameters on RaThe interaction effect of controlling parameters on Ra(Fig. 6) exposes that the minimum Ra (Dark Blue) wasidentified well with the maximum cutting speed. Eventhough other parameters influence the Ra but the signifi-cant observation was found with the influence of cutting
Fig. 9. SEM images of (a) minimum and (b) maximum FR.
speed. The maximum Ra (Dark Green) was noticed athigh feed rate and its surface morphology was shown inFigure 7(b) and it confirms the increased Ra compared toFigure 7(a) experimentally.
3.2.3. Effect of Machining Parameters on FR
The minimum FR (Light Green) was noticed with lessfeed rate, reinforcement at high cutting speed as shownin Figure 8. The increase in FR will leads to decrease intool life but with minimum FR configuration, the MRRmay be less. Therefore, it was essential to find an optimalconfiguration with minimal FR which produces the maxi-mum MRR. The maximum FR (Dark Green) was observedwith high feed rate and its effect on machined surfacewas shown in Figure 9(b). The low FR also affects the
J. Adv. Microsc. Res. 10, 1–11, 2015 5

RESEARCH
ARTIC
LE
Optimization of End Milling Parameters for Al/SiC by Response Surface Methodology Krishna and Xavior
Table I. Parameters and levels in end milling.
Levels
S. No. Variable Parameter Units Low High
1. A Material (Wt%) 5 152. B Depth of cut (mm) 0�3 0�63. C Feed (mm/min) 30 904. D Cutting speed (rpm) 100 1000
machining quality; it was evidenced by SEM image shownin Figure 9(a).
3.3. Response Surface MethodologyThe RSM involves the study about responses based on thecombinations, estimating the coefficients, fitting the exper-imental data, predicting the response and checking the ade-quacy of the fitted model.22 Here, the responses are MRR,Ra and FR for the independent variables (input parameters)are reinforcement %, Depth of Cut, and Feed rate, CuttingSpeed (Table I). For this DOE, the three levels RSM designwith L31 array was done using MINITAB 16. The results ofthe output parameters after machining process were con-solidated for mathematical modelling the input parameters(Table II). The regression equations were formed for the
Table II. Analytical table of responses for the independent variables.
S. no. Material (wt%) Depth of cut (mm) Feed (mm/min) Cutting speed (rpm) MRR (mm3/s) Ra (�m) FR (N)
1 15 0.3 30 1000 4�5 0�5 36�682 10 0.6 60 550 12�44 2�41 264�83 10 0.6 60 550 12�44 2�41 264�84 10 0.6 60 550 12�44 2�41 264�85 15 0.3 90 100 24�28 4�92 314�036 10 0.6 30 550 7�2 0�52 94�967 10 0.6 60 550 12�44 2�41 264�88 10 0.6 90 550 20�57 2�32 25�829 5 0.3 90 1000 10�29 0�69 49�3310 15 0.9 90 1000 36 0�95 88�9111 15 0.9 90 100 30�86 6�15 501�6512 5 0.9 90 100 27 9�06 752�1213 5 0.9 90 1000 31�76 1�24 43�2114 10 0.6 60 550 12�44 2�41 264�815 10 0.9 60 550 11�37 1�13 122�1616 10 0.6 60 100 12�13 3�51 365�6417 10 0.6 60 1000 13�12 0�01 44�8618 10 0.6 60 550 12�44 2�41 264�819 15 0.6 60 550 8 1�25 111�0720 10 0.6 60 550 12�44 2�41 264�821 15 0.3 90 1000 8 1�25 111�0722 10 0.3 60 550 3�6 0�62 88�9123 15 0.3 30 100 3�6 2�76 35�6224 5 0.6 60 550 8�37 0�78 51�0125 5 0.9 30 1000 10�8 2�25 57�8126 15 0.9 30 100 4�77 4�82 278�1427 15 0.9 30 1000 4�25 0�78 7�2828 5 0.3 90 100 1�87 7�57 501�6529 5 0.3 30 100 2�4 1�84 373�0730 5 0.3 30 1000 4 0�35 4�8731 5 0.9 30 100 10�8 2�01 178�72
individual responses based on the controlling parameters.From this mathematical model, the predicted models wereestimated and the models are validated through ANOVA.
3.3.1. Mathematical Models of the ResponsesBased on the uncoded data from the given input trails,the mathematical models of the responses were estimated.The MRR in the form of regression equation was statedin Eq. (3), which states that the factor B influences morecompared to other factors. In Eqs. (4) and (5) were theregression equations of Ra and FR respectively, which alsodeclare that the factors B (depth of cut) influences highlyin all the configuration results.
MRR = 1�25478+1�75719∗A+33�8615∗B−0�688283∗C−0�0103421∗D−0�0749221∗A2−28�5895∗B2
+0�00425216∗C2+1�27E−05∗D2
−1�09583∗A∗B+0�0162917∗A∗C−7�09E−04∗A∗D+0�451806∗B∗C+0�00682407∗B∗D+2�78E−07∗C ∗D (3)
6 J. Adv. Microsc. Res. 10, 1–11, 2015

RESEARCH
ARTIC
LE
Krishna and Xavior Optimization of End Milling Parameters for Al/SiC by Response Surface Methodology
5.02.50.0–2.5–5.0
99
90
50
10
13020100
5.0
2.5
0.0
–2.5
–5.0
630–3–6
8
6
4
2
0
5.0
2.5
0.0
–2.5
–5.0
(a) (b)Normal Probability Plot of the Residuals Residuals Versus the Fitted Values
(c) (d)Histogram of the Residuals Residuals Versus the Order of the Data
Observation OrderResidual
Residual Fitted Value
Perc
ent
Res
idua
l
Freq
uenc
y
Res
idua
l
30282624222018161412108642
Fig. 10. Input data analysis of plot for MRR.
Ra = −1�26391+0�138958∗A+4�77893∗B+0�0573958∗C−0�00338567∗D+0�000519467∗A2−1�41126∗B2
+0�00046443∗C2+0�00000374314∗D2
−0�0154167∗A∗B−0�0030125∗A∗C+0�0000347222∗A∗D−0�0132639∗B∗C
210–1–2 86420
1
0
–1
1.20.80.40.0–0.4–0.8–1.2
8
6
4
2
030282624222018161412108642
1
0
–1
(a) (b)Normal Probability Plot of the Residuals Residuals Versus the Fitted Values
(c) (d)Histogram of the Residuals Residuals Versus the Order of the Data
Observation OrderResidual
Residual Fitted Value
Perc
ent
Res
idua
l
Freq
uenc
y
Res
idua
l
99
90
50
10
1
Fig. 11. Input data analysis of plot for Ra.
−0�00138426∗B∗D−0�0000763426∗C∗D
(4)
FR = 45�5807+2�53377∗A+50�2841∗B+10�8129∗C−0�653551∗D−1�23815∗A2
−71�7649∗B2−0�0573376∗C2
J. Adv. Microsc. Res. 10, 1–11, 2015 7

RESEARCH
ARTIC
LE
Optimization of End Milling Parameters for Al/SiC by Response Surface Methodology Krishna and Xavior
Residual
Perc
ent
2001000–100–200
99
90
50
10
1
Fitted Value
Res
idua
l
6004503001500
100
0
–100
–200
Freq
uenc
y
100500–50–100–150–200
8
6
4
2
0
Observation OrderR
esid
ual
Residual30282624222018161412108642
100
0
–100
–200
(a) (b)
(c) (d)
Normal Probability Plot of the Residuals Residuals Versus the Fitted Values
Histogram of the Residuals Residuals Versus the Order of the Data
Fig. 12. Input data analysis of plot for FR.
Table III. Predicted responses for new design points using modelfor MRR.
Point Fit SE fit Confidence limit Prediction limit
1 1�7334 2.68465 �−3�9578�7�4246� �−7�2983�10�7652�2 11�3406 0.98137 �9�2602�13�4211� �4�0255�18�6558�3 11�3406 0.98137 �9�2602�13�4211� �4�0255�18�6558�4 11�3406 0.98137 �9�2602�13�4211� �4�0255�18�6558�5 18�3345 2.68465 �12�6433�24�0257� �9�3028�27�3663�6 7�4837 2.29411 �2�6204�12�3470� �−1�0506�16�0180�7 11�3406 0.98137 �9�2602�13�4211� �4�0255�18�6558�8 22�8515 2.29411 �17�9882�27�7148� �14�3171�31�3858�9 6�9956 2.68465 �1�3044�12�6869� �−2�0361�16�0274�10 32�2256 2.68465 �26�5344�37�9169� �23�1939�41�2574�11 33�0115 2.68465 �27�3203�38�7027� �23�9797�42�0433�12 26�3334 2.68465 �20�6422�32�0246� �17�3017�35�3652�13 31�9326 2.68465 �26�2414�37�6238� �22�9008�40�9644�14 11�3406 0.98137 �9�2602�13�4211� �4�0255�18�6558�15 14�6048 2.29411 �9�7415�19�4681� �6�0705�23�1391�16 13�6293 2.29411 �8�7660�18�4925� �5�0949�22�1636�17 14�1859 2.29411 �9�3226�19�0492� �5�6516�22�7202�18 11�3406 0.98137 �9�2602�13�4211� �4�0255�18�6558�19 10�4104 2.29411 �5�5471�15�2737� �1�8760�18�9447�20 11�3406 0.98137 �9�2602�13�4211� �4�0255�18�6558�21 13�8637 2.68465 �8�1725�19�5549� �4�8319�22�8955�22 2�9304 2.29411 �−1�9329�7�7937� �−5�6040�11�4647�23 6�2193 2.68465 �0�5281�11�9105� �−2�8125�15�2510�24 8�5248 2.29411 �3�6615�13�3881� �−0�0095�17�0591�25 13�3123 2.68465 �7�6211�19�0035� �4�2805�22�3441�26 4�6312 2.68465 �−1�0600�10�3224� �−4�4006�13�6630�27 3�8304 2.68465 �−1�8608�9�5216� �−5�2014�12�8621�28 5�0815 2.68465 �−0�6097�10�7727� �−3�9503�14�1133�29 2�7412 2.68465 �−2�9500�8�4324� �−6�2906�11�7730�30 4�6404 2.68465 �−1�0508�10�3316� �−4�3914�13�6721�31 7�7281 2.68465 �2�0369�13�4194� �−1�3036�16�7599�
Table IV. Predicted responses for new design points using modelfor Ra.
Point Fit SE fit Confidence limit Prediction limit
1 1.01225 0�86773 �−0�82726�2�85175� �−1�90699�3�9315�2 1.76016 0�3172 �1�08773�2�43259� �−0�60422�4�1245�3 1.76016 0�3172 �1�08773�2�43259� �−0�60422�4�1245�4 1.76016 0�3172 �1�08773�2�43259� �−0�60422�4�1245�5 5.69947 0�86773 �3�85997�7�53897� �2�78023�8�6187�6 1.18648 0�7415 �−0�38542�2�75838� �−1�57197�3�9449�7 1.76016 0�3172 �1�08773�2�43259� �−0�60422�4�1245�8 3.16981 0�7415 �1�59791�4�74172� �0�41136�5�9283�9 1.18613 0�86773 �−0�65337�3�02564� �−1�73310�4�1054�10 0.43502 0�86773 �−1�40448�2�27452� �−2�48421�3�3543�11 6.61266 0�86773 �4�77316�8�45216� �3�69343�9�5319�12 7.93447 0�86773 �6�09497�9�77397� �5�01523�10�8537�13 1.44433 0�86773 �−0�39517�3�28383� �−1�47490�4�3636�14 1.76016 0�3172 �1�08773�2�43259� �−0�60422�4�1245�15 2.04537 0�7415 �0�47346�3�61727� �−0�71308�4�8038�16 4.46759 0�7415 �2�89569�6�03950� �1�70914�7�2260�17 0.5687 0�7415 �−1�00320�2�14061� �−2�18975�3�3272�18 1.76016 0�3172 �1�08773�2�43259� �−0�60422�4�1245�19 1.66537 0�7415 �0�09346�3�23727� �−1�09308�4�4238�20 1.76016 0�3172 �1�08773�2�43259� �−0�60422�4�1245�21 0.26933 0�86773 �−1�57017�2�10883� �−2�64990�3�1886�22 1.22092 0�7415 �−0�35098�2�79283� �−1�53752�3�9794�23 2.31988 0�86773 �0�48038�4�15939� �−0�59935�5�2391�24 1.88092 0�7415 �0�30902�3�45283� �−0�87752�4�6394�25 0.85725 0�86773 �−0�98226�2�69675� �−2�06199�3�7765�26 3.71058 0�86773 �1�87108�5�55008� �0�79135�6�6298�27 1.65544 0�86773 �−0�18406�3�49494� �−1�26379�4�5747�28 6.92877 0�86773 �5�08927�8�76827� �4�00954�9�8480�29 1.74169 0�86773 �−0�09781�3�58119� �−1�17754�4�6609�30 0.12155 0�86773 �−1�71795�1�96105� �−2�79768�3�0408�31 3.22488 0�86773 �1�38538�5�06439� �0�30565�6�1441�
8 J. Adv. Microsc. Res. 10, 1–11, 2015

RESEARCH
ARTIC
LE
Krishna and Xavior Optimization of End Milling Parameters for Al/SiC by Response Surface Methodology
Table V. Predicted response for new design points using model for FR.
Point Fit SE fit Confidence limit Prediction limit
1 58�452 88�3517 �−128�845�245�749� �−238�783�355�687�2 194�274 32�2968 �125�808�262�740� �−46�467�435�015�3 194�274 32�2968 �125�808�262�740� �−46�467�435�015�4 194�274 32�2968 �125�808�262�740� �−46�467�435�015�5 314�112 88�3517 �126�815�501�409� �16�877�611�347�6 68�934 75�499 �−91�117�228�984� �−211�931�349�798�7 194�274 32�2968 �125�808�262�740� �−46�467�435�015�8 216�407 75�499 �56�356�376�458� �−64�457�497�271�9 34�589 88�3517 �−152�708�221�886� �−262�646�331�824�10 100�447 88�3517 �−86�850�287�745� �−196�788�397�683�11 509�309 88�3517 �322�012�696�606� �212�074�806�544�12 639�853 88�3517 �452�556�827�150� �342�618�937�088�13 41�436 88�3517 �−145�861�228�734� �−255�799�338�671�14 194�274 32�2968 �125�808�262�740� �−46�467�435�015�15 216�781 75�499 �56�731�376�832� �−64�083�497�645�16 445�864 75�499 �285�813�605�914� �164�999�726�728�17 129�197 75�499 �−30�854�289�248� �−151�667�410�061�18 194�274 32�2968 �125�808�262�740� �−46�467�435�015�19 133�656 75�499 �−26�395�293�706� �−147�208�414�520�20 194�274 32�2968 �125�808�262�740� �−46�467�435�015�21 26�345 88�3517 �−160�952�213�642� �−270�890�323�580�22 158�849 75�499 �−1�202�318�900� �−122�015�439�713�23 93�369 88�3517 �−93�929�280�666� �−203�867�390�604�24 192�985 75�499 �32�934�353�035� �−87�879�473�849�25 −32�767 88�3517 �−220�064�154�530� �−330�002�264�468�26 202�386 88�3517 �15�089�389�683� �−94�849�499�621�27 46�374 88�3517 �−140�923�233�671� �−250�861�343�609�28 511�911 88�3517 �324�614�699�208� �214�676�809�146�29 271�037 88�3517 �83�740�458�335� �−26�198�568�273�30 46�566 88�3517 �−140�731�233�863� �−250�669�343�801�31 312�8 88�3517 �125�502�500�097� �15�565�610�035�
+0�000460524∗D2+11�2092∗A∗B−0�03355∗A∗C+0�0210617∗A∗D+2�39389∗B∗C−0�22425∗B∗D−0�00468241∗C∗D
(5)
3.3.2. Checking of Data and Adequacy of ModelThe normality of the data was assessed by means of thenormal probability plot.23 The normal probability plot ofthe residuals, residuals versus the fitted values, histogramof the residuals and residuals versus the order of the datafor the MRR, Ra and FR were shown in Figures 10–12respectively. The normal probability plot for the responsesreveals that the residuals fall in a straight line. This meansthe errors were distributed normally. The independenceof the data was tested, by plotting a graph between the
Table VI. Adequacy of the models.
S. no. Response Std. deviation R2 (%) R2�adj� (%)
1. MRR 3�308 92.7 86.42. Ra 1�069 86.6 84.93. FR 108�9 89.4 81.4
Table VII. ANOVA for MRR.
Source DF Seq SS Adj SS Adj MS F P
Regression 14 2234�93 2234�93 159�638 14�59 0Linear 4 1693�47 1693�47 423�367 38�68 0Square 4 83�78 83�78 20�944 1�91 0�157Interaction 6 457�68 457�68 76�28 6�97 0�001Residual error 16 175�11 175�11 10�944Lack-of-fit 10 175�11 175�11 17�511Pure error 6 0 0 0Total 30 2410�03
residuals, and the run order for the responses which con-firms that there was no predictable pattern, because all therun residues lay on or between the levels.Using the regression equation, the predicted responses
for the new design points were tabulated in Tables III–V.From Tables III–V, the predicted points were within 95%of confidence limit and it nearly equal with the predictedlimit plots. The adequacy of the responses were tabulatedin Table VI with R2 and R2
�adj� values. These indicate thatthe model fits the data well and R2 was in agreement withR2
�adj� which supports the prediction capacity of the model.In all the models, both the values were good and above80% which makes a fitness in predicting solutions.
3.3.3. ANOVAThe ANOVA for MRR, Ra and FR were tabulated inTables VII–IX respectively. In all forms of regression, theP values of the responses were less than the F valueand also it was less than 0.05 i.e., the level of significantwas 95%. It confirms that the developed models were ade-quate, and the predicted values were in good agreementwith the measured data.
Table VIII. ANOVA for Ra.
Source DF Seq SS Adj SS Adj MS F P
Regression 14 118�318 118�3183 8�4513 7�39 0Linear 4 89�375 89�375 22�3438 19�54 0Square 4 7�788 7�7882 1�9471 1�7 0�198Interaction 6 21�155 21�155 3�5258 3�08 0�033Residual error 16 18�293 18�2934 1�1433Lack-of-fit 10 18�293 18�2934 1�8293Pure error 6 0 0 0Total 30 136�612
Table IX. ANOVA for FR.
Source DF Seq SS Adj SS Adj MS F P
Regression 14 731762 731762 52269 4�41 0�003Linear 4 580060 580060 145015 12�23 0Square 4 24819 24819 6205 0�52 0�22Interaction 6 126884 126884 21147 1�78 0�166Residual error 16 189652 189652 11853Lack-of-fit 10 189652 189652 18965Pure error 6 0 0 0Total 30 921414
J. Adv. Microsc. Res. 10, 1–11, 2015 9

RESEARCH
ARTIC
LE
Optimization of End Milling Parameters for Al/SiC by Response Surface Methodology Krishna and Xavior
Fig. 13. Overlay plots of responses.
3.3.4. Combined Effects of the Controlling FactorsThe combined effects of the controlling parameters of theresponses MRR, Ra and FR were shown in Figure 13. Theincrease in cutting speed with increasing reinforcement,depth of cut and feed rate, the optimal configuration wasnoticeable. The increase in material will increase the FRwhich leads severe damage in tool, the surface roughnessincrease with the decrease in the cutting speed and theMRR increases with increasing depth of cut and feed rate.The feasible zone (white) was identified with high depthof cut, feed rate, cutting speed and low reinforcement.
HiCurLo
OptimalD
1.0000
FR (N)Minimum
y = 41.4364d = 1.0000
Ra (mm)Minimum
y = 1.4443d = 1.0000
MRR (mm3Maximum
y = 31.9326d = 1.0000
Depth of0.90
[0.90]0.30
Feed (mm90.0
[90.0000]30.0
Cutting1000.0
[1000.0000]100.0
Material15.0[5.0]5.0
Fig. 14. Optimal configurations for optimal response.
3.3.5. OptimizationThe optimal configuration of input parameters and itsresponses were identified from the Figure 14. The opti-mal configuration was 5 wt% reinforced material withmachining parameter of high depth of cut 0.9 mm, feedrate of 90 mm/min and cutting speed 1000 rpm whichprovides the global optimal solution of 31.9326 mm3/sMRR, 1.4443 �m surface roughness and 41.4364 N ofresultant cutting force for desirability of 98.6%, 99.1%and 94.5% respectively. For the same optimal condition,the experimental result was 31.76 mm3/s MRR, 1.24 �mRa and 43.2 N FR which was 0.5%, 14% and 4% devia-tion from the predicted results which shows the acceptableprediction.
4. CONCLUSIONSThe Al/SiC composite with varying reinforcement compo-sition was done to study its machining nature was suc-cessful. The Al/SiC composite was characterized usingXRD, EDS and optical microscopic images which inferredthe structural changes in orientation and surface due rein-forcement particle. The influence of machining parame-ters on the responses was discussed and the effects wereevidenced through SEM images. Using RSM, the opti-mal configuration of machining parameter which providesoptimal response was identified. The optimal configurationwas 5 wt% reinforced material with machining parame-ter of high depth of cut 0.9 mm, feed rate of 90 mm/minand cutting speed 1000 rpm which provides the global
10 J. Adv. Microsc. Res. 10, 1–11, 2015
RESEARCH
ARTIC
LE
Krishna and Xavior Optimization of End Milling Parameters for Al/SiC by Response Surface Methodology
optimal solution of 31.9326 mm3/s MRR, 1.4443 �m sur-face roughness and 41.4364 N of resultant cutting forcewhich shows the acceptable prediction.
References and Notes1. Y. Nishida, Introduction to Metal Matrix Composites, New York
(2013).2. H. Arik, Mater. Des. 29, 1856 (2008).3. A. Canakci, T. Varol, and S. Ozsahin, Metals and Materials Inter-
national 19, 519 (2013).4. T. Varol and A. Canakci, Metals and Materials International
19, 1227 (2013).5. A. Kumar, M. M. Mahapatra, and P. K. Jha, Wear 306, 170 (2013).6. H. R. Zafarani, A. Hassani, and E. Bagherpour, J. of Alloys and
Compounds 589, 295 (2014).7. R. Teti, CIRP Ann. Manuf. Technol. 51, 611 (2002).8. J. S. Pang, M. N. M. Ansari, S. Omar, Zaroog, H. Moaz, and S. M.
Sapuan, HBRC Journal 10, 138 (2014).9. W. Fei, L. Yonghong, Z. Yanzhen, T. Zemin, J. Renjie, and Z. Chao,
J. Mater. Process. Technol. 214, 531 (2014).10. M. Subramanian, M. Sakthivel, K. Sooryaprakash, and R. Sudhakaran,
Procedia Engineering 64, 690 (2013).
11. L. Guochao, S. Jie, and L. Jianfeng, J. Mater. Process. Technol.214, 3067 (2014).
12. Z. Xiaoming and D. Han, International Journal of Machine Toolsand Manufacture 72, 11 (2013).
13. I. Asilturk and H. Akkus, Measurement 44, 1697 (2011).14. S. S. Mahapatra and A. Patnaik, Mater. Des. 30, 2791 (2009).15. H. Oktem, T. Erzurumlu, and H. Kurtaran, Journal of Material Pro-
cessing Technology 170, 11 (2005).16. S. M. Afazov, D. Zdebski, S. M. Ratchev, J. Segal, and S. Liu,
J. Mater. Process. Technol. 213, 671 (2013).17. K. Emel, O. Babur, B. Mahmut, D. Erhan, and T. S. Bilgin, Journal
of Cleaner Production 42, 159 (2013).18. M. Takeshi, K. Tsunemoto, Y. Jiwang, and Y. Nobuhito, Interna-
tional Journal of Surface Science and Engineering 1, 344 (2007).19. R. Narayanasamy, T. Ramesh, and M. Prabhakar, Mater. Sci. Eng.,
A 504, 13 (2009).20. A. Urena, J. Rams, M. Campo, and M. Sanchez, Wear 266, 1128
(2009).21. J. Yongho and E. P. Frank, International Journal of Surface Science
and Engineering 8, 213 (2014).22. A. Baradeswaran, S. C. Vettivel, A. Elaya Perumal, N. Selvakumar,
and R. Franklin Issac, Mater. Des. 63, 620 (2014).23. A. Baradeswaran, A. Elayaperumal, and R. Franklin Issac, Procedia
Engineering 64, 973 (2013).
Received: 12 August 2015. Accepted: 26 September 2015.
J. Adv. Microsc. Res. 10, 1–11, 2015 11


