Embed Size (px)
Citation preview
University of St Augustine for Health Sciences University of St Augustine for Health Sciences
SOAR @ USA SOAR @ USA
Student Scholarly Projects Student Research
Spring 4-2-2021
Optimizing Operating Room Throughput Optimizing Operating Room Throughput
Amanda Brendel University of St. Augustine for Health Sciences, [email protected]
DOI:DOI: https://doi.org/10.46409/sr.HHQZ9838
This work is licensed under a Creative Commons Attribution 4.0 License.
Follow this and additional works at: https://soar.usa.edu/scholprojects
Part of the Perioperative, Operating Room and Surgical Nursing Commons
Recommended Citation Recommended Citation Brendel, A. (2021). Optimizing Operating Room Throughput. [Doctoral project, University of St Augustine for Health Sciences]. SOAR @ USA: Student Scholarly Projects Collection. https://doi.org/10.46409/sr.HHQZ9838
This Scholarly Project is brought to you for free and open access by the Student Research at SOAR @ USA. It has been accepted for inclusion in Student Scholarly Projects by an authorized administrator of SOAR @ USA. For more information, please contact [email protected], [email protected].
OPTIMIZING OPERATING ROOM THROUGHPUT 1
Optimizing Operating Room Throughput
Amanda Wrenn Brendel MSN, RN, NEA-BC
School of Nursing, University of St. Augustine for Health Sciences
This Manuscript Partially Fulfills the Requirements for the
Doctor of Nursing Practice Program and is Approved by:
Jennifer Mensik Kennedy PhD, MBA, RN, NEA-BC, FAAN
Stephen W. Lovern DNP, RN, NEA-BC
Date of Final Approval: March 21, 2021
OPTIMIZING OPERATING ROOM THROUGHPUT 3
Abstract
Practice Problem
Throughput is an instrumental aspect for hospitals to maximize patient capacity; therefore,
methods to improve patient flow should be consistently implemented. Surgical areas are a major
contributor to inpatient admissions and the subsequent revenue; however, without the appropriate
oversight, patient throughput can be negatively impacted.
PICOT
The PICOT question that guided this project was: In operating room patients who require
inpatient admission (P), how does the implementation of a standardized bed flow process (I),
compared to the current methods for care transitions (C), reduce perioperative delays and
improve hospital financial metrics (O), over a three-month period (T)?
Evidence
A review of the evidence revealed that streamlining operating room throughput was essential to
the quality of clinical care and patient safety as well as to improve efficiencies associated with
patient volumes, lengths of stay and hospital census.
Intervention
A dedicated bed flow manager was implemented in the project setting with the overall goal to
enhance throughput measures within the operating room.
Outcome
While the intervention did not achieve statistical significance as determined by the data analysis,
the results did demonstrate clinical significance as the organization was able to maximize
capacity and throughput during the Covid-19 pandemic.

OPTIMIZING OPERATING ROOM THROUGHPUT 4
Conclusion
The addition of a dedicated surgical bed flow manager was beneficial to the optimization,
standardization and systemization of the perioperative throughput process.
OPTIMIZING OPERATING ROOM THROUGHPUT 5
Optimizing Operating Room Throughput
Leaders and healthcare professionals across the world must continually navigate the
challenges associated with improving efficiencies within operating rooms (ORs) and recovery
areas. Highly coordinated workflows are integral to achieve positive patient outcomes and to
maintain the financial sustainability of healthcare organizations. Increasing operating room
utilization and functionality requires implementation of a process that accurately tracks patients
through each phase of the operative process and that facilitates interdepartmental collaboration.
Significance of the Practice Problem
ORs are essential for most healthcare organizations because surgical staff offer a variety
of services to meet the needs of diverse patient populations. Maintaining availability and
capacity within these surgical areas drives increased patient volumes as well as hospital
profitability. Rothstein and Raval (2018) described operating rooms as the financial hub of
hospitals. ORs are significant financial drivers for hospital systems, as surgical care represents
approximately one third of healthcare spending (Lee et al., 2019).
Successful identification of operational challenges can serve as a catalyst to improve OR
throughput. Both barriers and opportunities exist in scheduling and in patient care transitions.
Cox Bauer et al. (2016) found: (1) delays in patient arrivals and departures, (2) first cases of the
day not starting on time, and (3) tardy providers. They noted that each of these could increase the
cost of healthcare and therefore decrease profit margins for healthcare systems. Cox Bauer et al.
(2016) estimated a 500k annual loss caused by these inefficiencies, not including individual
physician fees. Somlo et al. (2018) described how maximizing efficiencies improved healthcare
quality, reduced organizational costs and increased the overall capacity for additional
procedures.
OPTIMIZING OPERATING ROOM THROUGHPUT 6
Comprehensive recognition of and planning to overcome each of these obstacles can
facilitate higher utilization of OR services, which will improve patient outcomes and overall
institutional profitability. High quality clinical care and patient safety should be the top priorities
for healthcare providers, especially those who manage surgical suites, as decreased throughput
has been shown to detrimentally impact patients as well as to increase their hospital length of
stay (Nelson et al., 2020). Pascual et al. (2014) revealed that improper or delayed admission
placement of acute surgical patients increased their safety risks during their hospital stay.
Similarly, Bing-Hua (2014) indicated that “prolonged waiting” in post anesthesia care units
(PACU), which he defined as greater than six hours, was associated with higher mortality in
postoperative patients.
Healthcare professionals must seek innovative ideas to adapt to the continual changes of
the healthcare landscape in order to achieve departmental and organizational success. Morris et
al. (2018), described how surgical leaders must prioritize the optimization of access, safety,
efficiency, and throughput. The surgical admission volume is rapidly expanding and currently
accounts for 22% of the 36 million US hospitalizations each year (Amir et al., 2017). Robust
plans should be reviewed and enacted to meet the growing needs of the surgical patient
population. The creation of a process that manages the complex throughput challenges of each
stage in the perioperative period could facilitate patient progression and access to care, which
would improve patient outcomes and increased patient satisfaction.
PICOT Question
The processes for procedure scheduling and care transitions for operating room patients
should be maximized to improve hospital throughput, especially for patients who require
inpatient admission as they commonly experience avoidable delays. Decreasing these
OPTIMIZING OPERATING ROOM THROUGHPUT 7
inefficiencies and addressing pertinent barriers may translate to positive patient outcomes and
greater financial gains for healthcare institutions. Therefore, the following PICOT question
guided this evidence-based project. In operating room patients who require inpatient admission
(P), how does the implementation of a standardized bed flow process (I), compared to the current
methods for care transitions (C), reduce perioperative delays and improve hospital financial
metrics (O), over a three-month period (T)?
Evidence-Based Practice Framework and Change Theory
The inclusion of a quality improvement framework and a proven change theory can assist
in outlining the key steps in a process change. Therefore, the continuous quality improvement
strategy of the Plan, Do, Study, Act (PDSA) approach and the well-known model of Lewin’s
change theory were utilized as guiding principles. Continuous quality improvement (CQI) efforts
are necessary to improve clinical quality and patient safety. They are also instrumental in
increasing system efficiencies, workflows and operational capacity within healthcare
organizations (McFadden et al., 2015). Similarly, the utilization of theoretical frameworks can
drive effective change and assist in the identification of the best approaches or tools for research
(Grol, et al., 2007).
The PDSA model is a cyclic process based on scientific methodology that guides quality
improvement and change management strategies (Leis & Shojania, 2017). Donnelly and Kirk
(2015) defined the four unique phases within the cycle: (1) plan by setting objectives, (2) do or
implement the initiative, (3) study and evaluate the data, and (4) act to ensure that improvements
are achieved. This model was applicable in an effort to build a process that standardized OR
throughput, as the PDSA model is commonly used for projects that must be implemented in real-
time work settings (Health and Human Services, 2011). The initial phase of planning was to set
OPTIMIZING OPERATING ROOM THROUGHPUT 8
clear objectives surrounding improvement of perioperative throughput. Next, the “Do” phase
encompassed the implementation of strategies, such as a standardized bed flow process, to meet
the outlined objectives. Third, the “Study” phase included collecting and analyzing perioperative
data. Examples included quantifying procedure delays, admission boarding times, and discharge
rates within PACU. Finally, the “Act” stage was used to verify that the goals and objectives were
achieved.
Kurt Lewin’s change theory consists of three distinct phases; each providing the change
management structure required for the alterations that occurred as a result of realigning OR
operations. Lewin's model of unfreezing, changing and refreezing is widely accepted as a change
management strategy and has proven successful in a variety of industries, including healthcare
(Cummings et al., 2016). The unfreezing phase occurred at the beginning of the project. This
phase consisted of the actions or behaviors that had to be unlearned in order to embrace the next
phase of change (Burns, 2004). The next phase, changing, occurred when the project was
implemented and the new process began: such as the standardized bed flow management
program. The last phase, refreezing, occurred following the transition and was signified by the
stabilization of groups when new behaviors were relatively safe from regression (Sarayreh et al.,
2013).
Evidence Search Strategy
A search of relevant literature was conducted to thoroughly address the PICOT question
and project plan. First, electronic databases were searched including Cumulative Index to
Nursing and Allied Health Literature (CINHL) Complete, Education Resources Information
Center (ERIC) and Medline. The following keywords and phrases were incorporated: (1)
operating room capacity; (2) patient flow or throughput; and (3) patient outcomes OR quality of
OPTIMIZING OPERATING ROOM THROUGHPUT 9
care OR health outcomes. Results of the search yielded greater than 100 articles. Therefore,
several filters, inclusion criteria and exclusion criteria were then applied via the advanced search
option to narrow the results. These included articles that were peer reviewed, from academic
journals, written in the English language, and published between the years 2010-2020. Major
headings consisted of “operating rooms,” “quality improvement,” “academic medical centers,”
and “efficiency and organization”. Articles were not limited to full text only as an attempt to
reduce bias in the results. Also, each subcategory such as geographical area, ages, gender and
page length was selected to include all pertinent documents. Lastly, filters were placed to apply
related terms as well as to search within the full text of the article in order to capture applicable
literature.
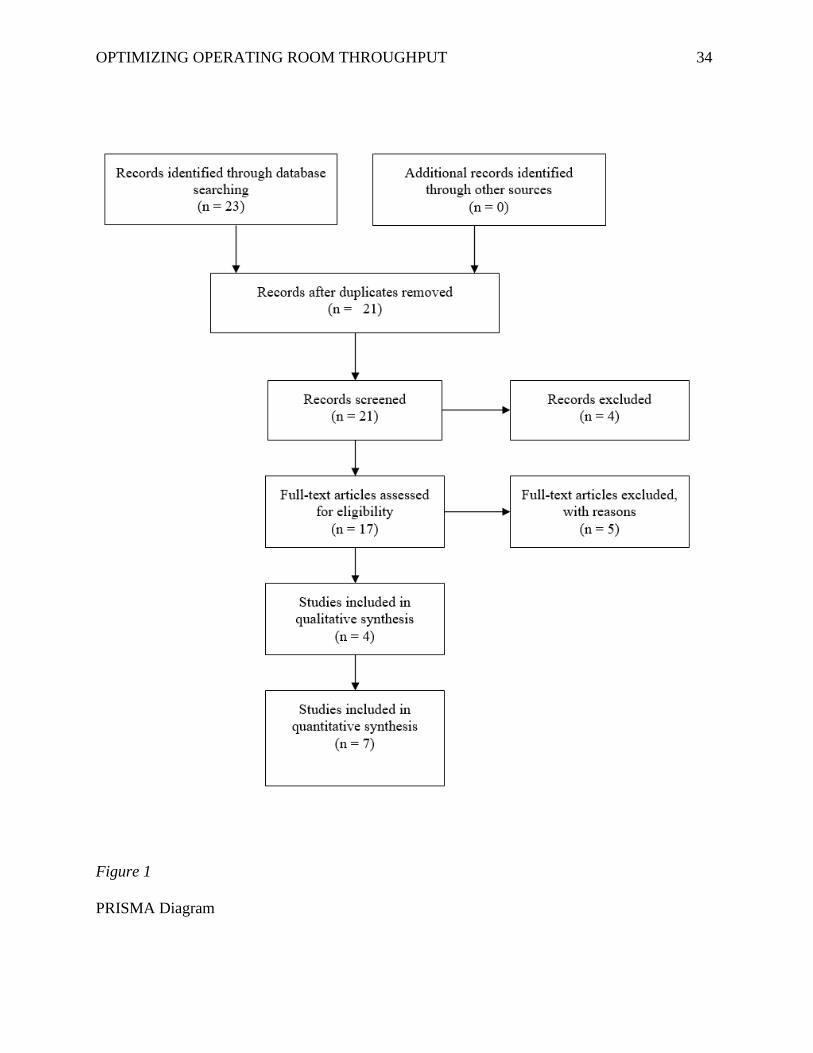
Evidence Search Results
The electronic search of three major databases using related key words resulted in 23
articles. After articles were excluded to remove duplicates, they were reviewed for applicability
to the PICOT question. Eleven articles remained. These were subsequently graded for level as
well as quality. Visual details summarizing the search are also displayed within Figure 1 (a
PRISMA diagram). The literature search yielded both qualitative and quantitative articles that
addressed the PICOT question.
The final evaluation resulted in 11 applicable articles surrounding the premise of the
PICOT as well as the project plan of optimizing OR throughput through the establishment of a
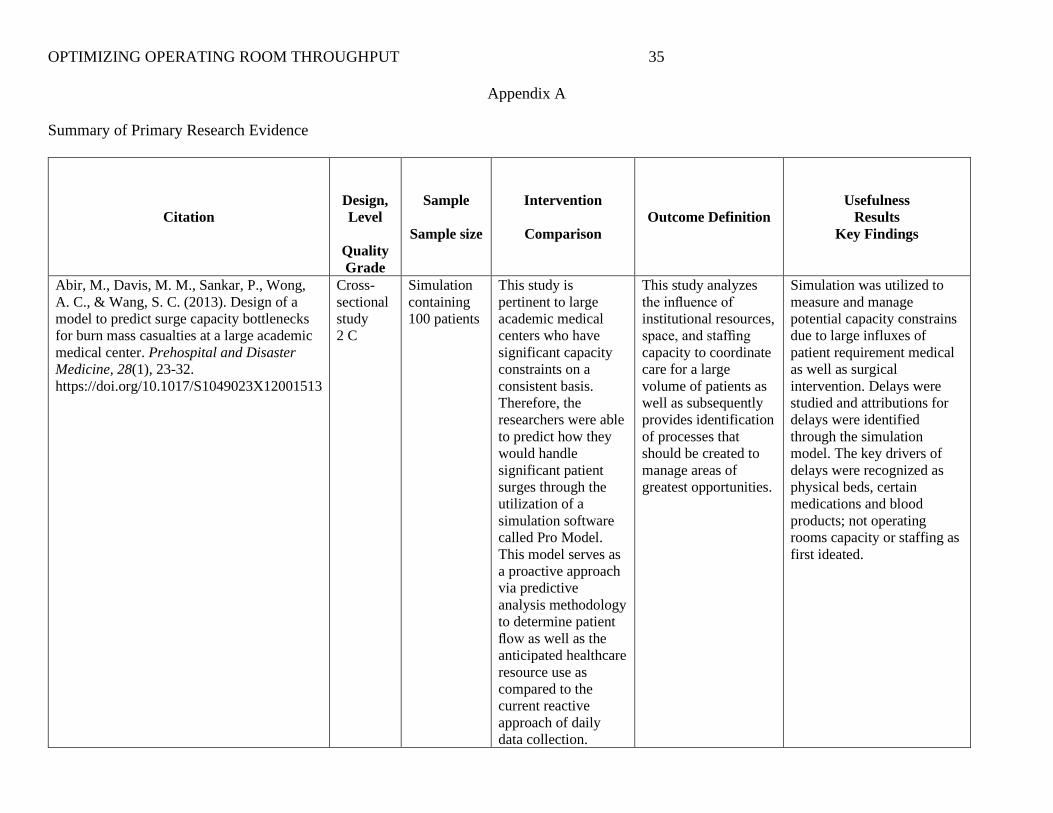
standardized bed flow process. The literature review and grading process was shown in
Appendix A, an evidence table, utilizing the Strength of Recommendation Taxonomy (SORT)
tool. The SORT tool “addresses the quality, quantity, and consistency of evidence” (Ebell et al.,
OPTIMIZING OPERATING ROOM THROUGHPUT 10
2004, p.550). It was highly beneficial in categorizing not only the level and strength of the
evidence, but also in determining which articles best reinforced the intended change.
The strength and level of evidence was determined through a patient centered framework
(Ebell et al., 2004). The strength of the evidence was defined through grades: A, B, or C.
Strength A is optimal; providing consistent and good-quality patient-oriented evidence (Ebell et
al., 2004). Strength B has limited quality and C is often based on consensus or opinion (Ebell et
al., 2004). During the review process, articles receiving an A or B were prioritized as substantial
evidence because they provided the greatest amount of specific information to answer the overall
project question and therefore support development of an effective solution. The quality of each
individual study was also measured in levels one through three. Level one studies demonstrated
good quality and were patient centered; Level two had limited quality, and Level three was the
lowest level of evidence (Ebell et al., 2004).
Synthesized themes were established upon completion of the evidence search, review,
and grading process and were subsequently illustrated in the evidence table (Appendix A).
Furthermore, the literature utilized to gather themes was founded upon patient centered evidence:
10 out of the 11 selected articles received a Level two rating and one study by Schwarz et al.,
(2011) received a Level one. Additionally, greater than half of the articles (eight out of 11)
scored strength grades of B, while the other three articles, Abir, et al., (2013), Knarr &
MacArthur (2012) as well as Madni et al. (2019) received a C.
Themes from the Evidence
Drawing themes from suitable literature was instrumental in substantiating a solid body
of evidence to guide the underpinnings of the proposed project and to serve as a catalyst for
successful implementation. In each of the 11 articles, improvement of OR throughput was the
OPTIMIZING OPERATING ROOM THROUGHPUT 11
primary goal which was further demonstrated through research-based evidence and best practice
recommendations. However, the individual focus, method and outlook of the many articles
varied slightly. They all supported the efforts to identify a comprehensive process, or portions of
a process, to optimize throughput within operative areas.
Choosing an environment that is similar to the implementation setting was often
important to gauge general feasibility. Articles that surrounded large academic medical centers
with similar capacity challenges held particular merit due to their commonality with the project
setting. All of the articles within the evidence table fell into this category because they were
trying to improve flow, throughput, or access to care for their patients in a setting where OR
resources were at a premium. Also, in all of these healthcare facilities, a process was
implemented to overcome the associated barriers applicable to their defined locations and
populations.
The majority of these studies utilized a pre and post study design approach to accurately
measure their applied process and findings. While a few articles (Abir et al., 2013; McKetta et
al., 2016; and Ozcan et al., 2017) spoke to their engagement in simulation strategies prior to the
initiative, the others applied a traditional implementation design. Every study reported benefit
and perceived success, despite their election to pilot with simulation prior.
Each article also discussed the benefits of improving OR throughput, although the
researchers concentrated on slightly different outcome measures. Kane et al. (2019) and McKetta
et al., (2016) focused on quality healthcare and patient satisfaction, while Jweinat et al., (2013)
examined how delays in the OR impacted length of stay and bed capacity for admitted patients.
O’Donnell et al., (2017), spoke to the causes for operative delays such as not adhering to first
case start times, OR and PACU hold durations, and lack of bed coordination. Costa Jr. et al.
OPTIMIZING OPERATING ROOM THROUGHPUT 12
(2015) and Madni et al. (2019) linked these efforts to the financial implications for healthcare
organizations as well as costs to individual patients.
On the other hand, Martinez et al. (2018), Ozcan, et al. (2017), Schwarz et al. (2001)
proposed solutions to streamline the associated delays through a systematic bed flow process.
Similarly, Jweinat et al. (2013), Kane et al. (2019) and Martinez et al. (2018) all supported the
use of a centralized process that embraces flow through interventions such as dedicated staff,
technology and visual aids to maximize the available OR resources. Lastly, Knarr and
MacArthur (2012), discussed the implications of combining each of these topics in their article,
which described the overall impact of optimizing throughput via a multifaceted approach based
upon an overarching process to proactively manage patient flow.
Practice Recommendations
Evidence supported the substantial benefits of improving perioperative throughput,
including those positively impacting the patients, the staff and the organization (Kane et al.,
2019; Madni et al., 2019; Schwarz et al., 2011). However, identifying the foundational practices
that would be most helpful to the individual health system was integral to operational success.
The themes identified within the literature supported the implementation of a systematic process
for perioperative bed management, especially within large medical centers containing substantial
surgery programs. The literature also supported the development of a standardized workflow to
ensure consistency and accountability among each of the teams.
Patient flow, bed allocation, and surgical schedule coordination were each instrumental
aspects of throughput that were carefully considered in order to streamline efficiencies (Jweinat,
et al., 2013). Therefore, a dedicated bed flow manager, also called a bed, nursing, or patient flow
coordinator, was integral to ensure a balance between each of these elements and to enhance
OPTIMIZING OPERATING ROOM THROUGHPUT 13
previous surgical flow processes (Hollis & Adame, 2013). Traditionally, these bed flow
managers have a background in nursing and often have experience in the specialty that they are
orchestrating. Perioperative bed flow managers are primarily responsible for optimizing the OR
schedule through the utilization of technology, such as interactive dashboards and visual aids
displaying real time data, as well as by the facilitation of open communication with operative and
inpatient staff in order to progress patients accurately and timely through each phase of care
(Kane et al., 2019; Martinez et al., 2018).
While, the addition of a perioperative bed flow manager was key in maximizing surgical
throughput, they also had a significant impact on the entire healthcare facility. These managers,
along with many others, were continually working to address hospital capacity challenges and to
remove barriers associated with access to care. Therefore, perioperative bed managers were
placed in environments, such as command centers or transfer centers, where they can collaborate
with other specialty care coordinators in order to promote a systemic approach to bed allocation.
Combination of these services offered a proactive approach in not only the oversight of
perioperative throughput, but also in the reduction of emergency department inpatient boarding
and in the prompt facilitation of transfers from outside hospitals or clinics (Kane et al., 2019).
Project Setting
While the project primarily impacted the throughput in the operating room setting, it also
had implications within the organization’s transfer and communication center. The hospital’s
main campus contained a 25-bed preoperative area, 25 operating rooms and 18 post anesthesia
recovery bays, which was considered undersized for a facility that performed greater than 1,200
procedures each month. However, the perioperative bed flow manager was physically stationed
OPTIMIZING OPERATING ROOM THROUGHPUT 14
within the transfer and communications center, which served as the hub of bed placement for the
entire health system.
The coordination of surgical patient flow was essential in meeting the mission and vision
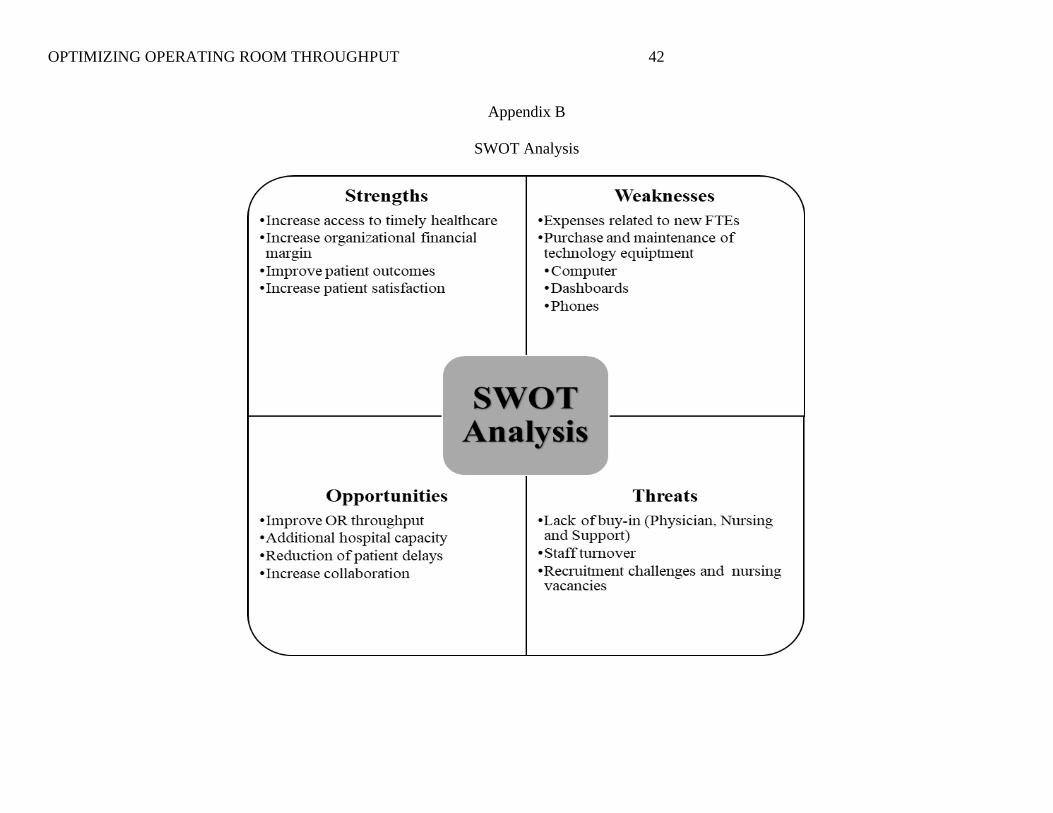
of the organization. An analysis of the project’s strengths, weaknesses, opportunities and threats
(SWOT) was completed (see Appendix B) to ensure full applicability. One strength was the
organization’s overall mission to improve the health of the communities they served, correlated
with the project’s mission to increase access to care for the surgical population. Initiation of
timely surgical care contributed to increased healthcare quality and promoted positive patient
outcomes. Similarly, the organization’s vision to provide better patient care and better
community health at a lower cost also related to the project in a variety of ways. Improving
efficiencies within the perioperative areas supported this vision by reducing both patient delays
and organizational financial expenditures.
The mission and vision of the project was also contingent on clear, open and concise
communication between the entire healthcare team. Interprofessional collaboration was a crucial
aspect to this project, especially due to the proximity and location of the key stakeholders. These
stakeholders included the patients, clinical staff and leaders from multiple specialties such as
surgical, inpatient nursing, human resources and technology services, as well as the perioperative
bed flow manager, all of which resided in a variety of locations. Therefore, the utilization of
tactics such as routine staff huddles, scheduled calls and visualization of real time dashboards
were essential to ensure accurate communication between the teams. This communication was
also important in sustaining and progressing the functionality of the bed flow manager following
project implementation. Additionally, the bed flow manager had responsibilities related to
communication and collaboration with representatives from other admitting areas such as the
OPTIMIZING OPERATING ROOM THROUGHPUT 15
Emergency Department and transferring facilities to ensure accuracy related to organizational
capacity and bed management.
Project Overview
Objectives and Goals
In order to align with the mission, vision and values of the health system, the
implementation of this project provided benefit to the surgical patient population as well as to the
entire organization through a multifaceted approach. The bed flow manager overseeing the
surgical areas followed the bell curve of procedure volumes, Monday-Thursday from 8am-6pm,
and had the primary job responsibilities of standardizing and streamlining workflows through
care coordination and interprofessional communication. The main project objectives were to
increase patient throughput and capacity within the operative areas while also monitoring
possible revenue increases related to the improved surgical flow. Project success was determined
through pre and post implementation measures inclusive of PACU hold times, the number of
patients boarding in PACU, and the total number of cases per day.
These measures were reviewed weekly by the project leader and were collected through
the utilization of the electronic patient tracking software (EPTS), a computerized tool utilized to
manage organizational capacity and the processes of patient admission, progression and
dispositions. Trending of occupied timers was a key function of software, offering real time data
streams through dashboard views, which were routinely monitored by the bed flow manager. The
EPTS had the ability to generate high level data as well as patient level data due to the patient
attribute functionality, this function ensured that the appropriate patients were captured during
the various processes of data collection, sorting and analysis. Similarly, accuracy of this data
collection process was increasingly achieved through the direct integration between the EPTS
OPTIMIZING OPERATING ROOM THROUGHPUT 16
and the electronic medical record (EMR). Each of these programs were computerized,
timestamped and offered autogenerated reporting capabilities; requiring zero manual entries or
calculations upon extrapolation, thereby decreasing the risk of human errors. Next, applicable
data was extracted from the EPTS and later converted into an Excel file, which also offered
visual indicators in the form of bar graphs for the dissemination presentation. Furthermore, the
data within the graphs were displayed by month so that a true comparison to the previous time
period could be established.
The short-term goals of the project included efficient implementation, staff buy-in and
achievement of desired results. For this to occur, the bed flow manager was successfully hired
and oriented to the new role. Next, operative staff were educated on their responsibilities and
updated workflows. Third, the bed flow manager was integrated into the transfer center through
open communication and familiarity with technology resources. Lastly, the bed flow manager
began to direct and monitor operative patient flow within the surgical suite as well as into their
inpatient bed assignment through the utilization of the EPTS and the EMR. On the other hand,
the long-term goals consisted of the continuation of the bed flow manager position, possibly with
extension of coverage and expansion of employees, as well as the sustainability of the
throughput gains achieved upon the early implementation period.
Risks and Unintended Consequences
There were very few risks and unintended consequences in this project as resources are
added to the impacted areas rather than removed or reallocated. However, there was a possibility
that even with the addition of a bed flow manager, that the throughput would not improve due to
circumstances outside of the scope of the project, thereby increasing the organizational spend
rather than improving revenue through the creation of access for surgical patients. Also, there
OPTIMIZING OPERATING ROOM THROUGHPUT 17
could have been minor issues surrounding alterations in provider workflows and perioperative
scheduling preferences as well as discontent among the inpatient units due to surgical patients
arriving to their floor earlier in the day than previous postoperative admissions. Therefore, key
stakeholders from respective areas were identified and included prior to project initiation in order
to promote engagement and advocacy.
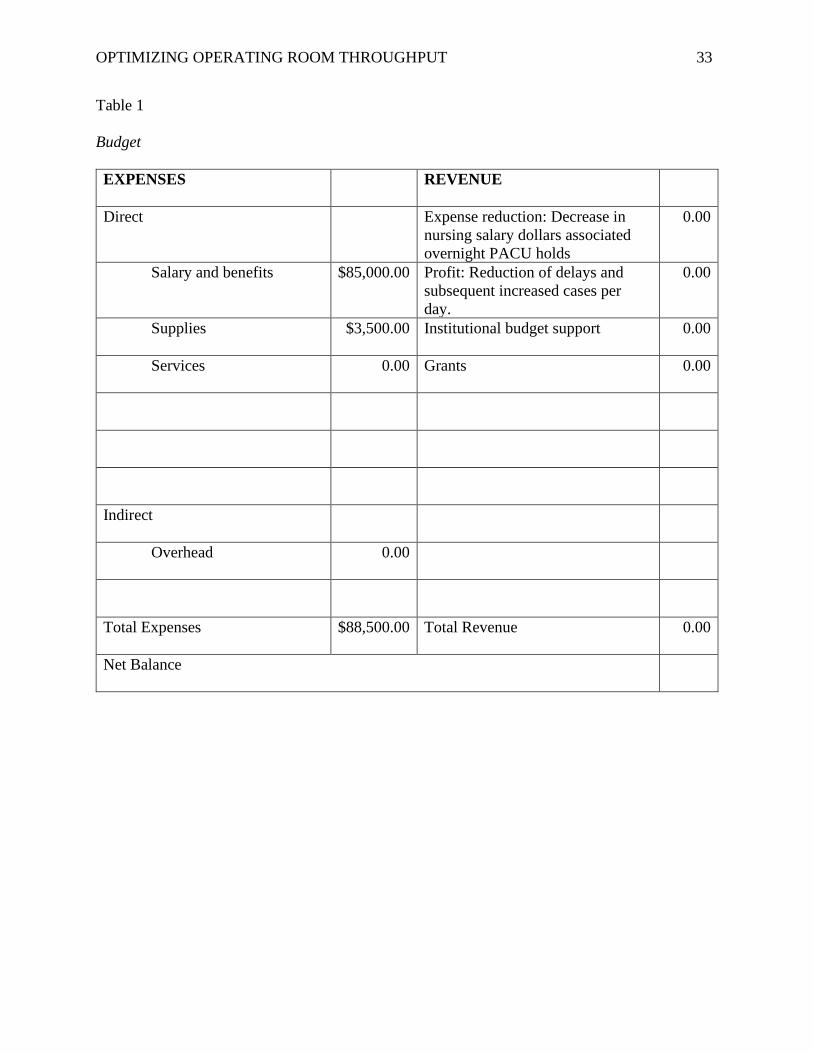
Implementation Plan with Timeline and Budget
It is important to account for each of the specific stages of a substantial project, including
the change management elements; therefore, the timeline and budget as well as the change
management overview were thoroughly evaluated. As mentioned previously, Kurt Lewin’s
change theory was utilized to comprehensively guide the change management strategy for
project implementation. Lewin’s time-tested theory described three unique phases of change
management inclusive of unfreezing, changing as well as refreezing and is highly effective in the
navigation of change for individuals, small groups, or entire organizations (Kaminski, 2011).
While Lewin’s theory can be applied in a variety of settings, it was significantly beneficial in the
healthcare setting due to aspects such as continual changes within daily operations, evolving
clinical practice standards and varying group sizes.
Unfreeze
Unfreezing is the first phase of Lewin’s theory. During this phase, the impacted
individuals, specifically the perioperative employees in this project, had to understand why the
change was necessary. Perioperative employees needed to have a comprehensive understanding
of why the new position was required as well as how delays and uncoordinated efforts lead to
poor outcomes. Understanding of these crucial elements was achieved through staff education
and leader rounding, both for employees working in the operative areas as well as those residing
OPTIMIZING OPERATING ROOM THROUGHPUT 18
in the transfer center. Burns (2004) described how this phase was where previous behaviors and
actions were unlearned in order to move forward. Similarly, Kaminski (2011) discussed how
leader and stakeholder transparency of the desired change via efforts such as education, team
building and brain storming sessions were key elements in progressing the target group through
the unfreezing stage.
Change
Project implementation occurred within the change phase of Lewin’s theory. The bed
flow manager began to track, trend and coordinate surgical patient flow through each area in the
perioperative process. The full list of the perioperative bed flow manager is outlined in Appendix
E; however, the primary objectives were to undertake the assignment of inpatient beds for
postoperative patients and subsequently monitor transition times as well as any associated
delays. Additionally, patient flow and throughput efforts were continuously monitored via the
PDSA model. According to Kaminski (2011), this phase is often considered the most time
consuming and costly phase for project leaders; however, it was the most productive stage within
the change management process.
Refreeze
Refreezing was the final stage in Lewin’s theory and ensured that the new process was
being upheld correctly. In this stage the new behaviors, processes, and responsibilities became
standard and the change was stabilized. The operative staff as well as the transfer center staff,
now routinely defer to the surgical bed flow manager for issues surrounding care transitions and
patient throughput. In this stage, staff members were held accountable for policy adherence,
avoidable delays or lack of pertinent communication; all of which were closely monitored
through the measurement of data and the associated outcomes. Similarly, Kaminski (2011),
OPTIMIZING OPERATING ROOM THROUGHPUT 19
described how this stage was essential in maintaining the desired change, as it was easy for
individuals to revert to previous practices; therefore, continued leadership and guidance was
required. As an example, weekly meetings to review the workflow and initiate minor
adjustments were necessary, such as aligning daily huddles and routine communications with
perioperative case volumes.
Timeline and Budget
The project timeline spanned over several months, beginning early fiscal year 2021 with
an evaluation approximately 90 days post implementation. The detailed project schedule is
depicted in Appendix C; however, the prolonged duration was largely contributed to literature
and evidence review, identification of stakeholders, approvals, education, process
implementation and data analysis. Similarly, the associated budget and specific expenditures are
listed within Table 1; however, the primary expense was associated with the salary and benefits
of a new position.
Project Leadership
Project success was primarily dependent on leadership involvement and their overall
accountability. This included components like playing an active role in facilitating
interprofessional communication, collaborating with other leaders from a variety of disciplines
such as human resources, inpatient nursing, finance and technology services as well as writing
staff expectation policies, education plans and workflow guidelines. As the responsible party for
this initiative, the project leader not only thoroughly accounted for each element within the
timeline and budget plan, but also ensured accurate and timely implementation at all stages of the
project. Lastly, proactive sustainability planning was essential to ensure that the project would
continue after the project manager departed. Therefore, prior to the official completion of the
OPTIMIZING OPERATING ROOM THROUGHPUT 20
project, a handoff inclusive of key points, data trends and potential issues was presented to
applicable leaders.
Results
Although they are interrelated, evaluation of the project was determined in two distinct
areas, (1) operational impact which was the primary goal and (2) financial impact which was a
downstream implication. The operational impact surrounded the ability to reduce delays and
increase accountability through the utilization of a bed flow manager. Overall, this measure was
primarily determined through a value known to the organization as an occupied timer, or the
duration of time that a postsurgical patient is unnecessarily held within the PACU in the presence
of clean and ready inpatient bed assignment. A second measure related to the number of patients
who boarded in the PACU for greater than the organizationally established threshold of 90
minutes was also incorporated for relevance. In order to extensively establish project results,
several aspects were considered including the patient population, data collection strategy, data
analysis and the protection of human rights, which are each further described in the sections
below.
Description of Participants
Participants of this study included the dedicated bed flow manager, a variety of indirect
clinical and non-clinical staff members who may have been working in the surgical areas or
within the transfer and communications center. Additionally, the recipients and target patient
population for this project were adult patients, greater than or equal to 18 years of age, who were
admitted through the hospital’s surgical services. Pediatric patients as well as same day surgery
patients were excluded due their procedures occurring outside of this bed flow. Specific
recruitment activities were not required as this patient population was already intact and
OPTIMIZING OPERATING ROOM THROUGHPUT 21
subsequently scheduled based on medical necessity as well as physician availability. During the
three-month implementation period, greater than 1,700 patients were managed through the
dedicated position. These patients ranged in their surgical need, acuity level, past medical
history, duration of procedure and overall medical complexity; however, they all required
inpatient admission post procedure.
Protection of Human Rights
Human rights and the privacy of each of the patient’s protected health information were
top priorities of this project. Therefore, data was collected on an organizationally owned device
and encrypted outside of the project manager. Additionally, presentations and visualizations
surrounding project results do not contain patient specific information, only monthly trends of
high-level operational data. Also, this project obtained approval from the practice setting’s
Institutional Review Board (IRB) as well as was reviewed by University of St. Augustine for
Health Sciences Doctor of Nursing Practice Evidence-Based Practice Review Council (EPRC)
and determined to not meet the requirements for research as defined in the Federal Register.
Data Collection Strategy
The data collected, both preintervention and postintervention, in this study was
performed by the project leader. The project leader was responsible for ensuring that data was
accurate, complete and was properly secured. Missing data may have impacted the validity of the
project; consequently, any missing data due to system downtime or software updates was
reviewed and removed. Historical data ranging from October 1, 2019 to December 31, 2019, due
to operative case load seasonality, was collected and reviewed to determine preintervention
performance; therefore, postintervention data points (Appendix D) were collected over the same
12-week time period within 2020.
OPTIMIZING OPERATING ROOM THROUGHPUT 22
Data Evaluation
A pre and post analysis was used to assess the impact of the intervention. In order to
compare pre intervention with post implementation data, a retrospective analysis was performed
using the average PACU hold times by minute as well as the average number of patients per day,
categorized by month, via the EPTS. Prior to project initiation, primary data was gathered from
the previous fiscal year period of October 1 through December 31 to determine baseline
performance of each measure.
Descriptive statistics containing quantitative data was utilized to communicate mean times
surrounding unnecessary PACU holds in minutes, the average number of patient cases per day and
the average number of patients boarding greater than 90 minutes within the PACU. Each of these
measures were utilized to evaluate the effectiveness of the bed flow manager in the reduction of
delays and increased patient flow. Additionally, the comparison of two independent test groups
was required to accurately determine success. Specifically, the pre-implementation period without
a bed flow manager versus the post intervention implementation period were compared; therefore,
an independent t-test was utilized via the Intellectus Statistics Software (2021).
Data Analysis
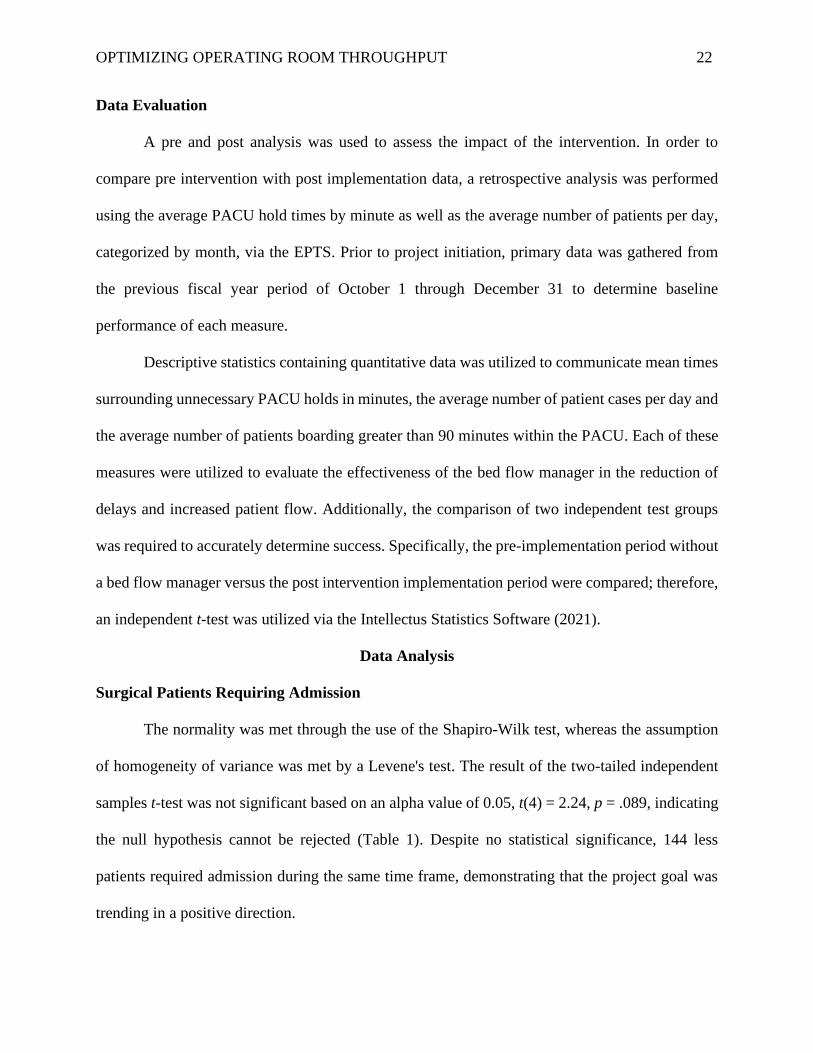
Surgical Patients Requiring Admission
The normality was met through the use of the Shapiro-Wilk test, whereas the assumption
of homogeneity of variance was met by a Levene's test. The result of the two-tailed independent
samples t-test was not significant based on an alpha value of 0.05, t(4) = 2.24, p = .089, indicating
the null hypothesis cannot be rejected (Table 1). Despite no statistical significance, 144 less
patients required admission during the same time frame, demonstrating that the project goal was
trending in a positive direction.
OPTIMIZING OPERATING ROOM THROUGHPUT 23
Table 1
Two-Tailed Independent Samples t-Test for Number of Surgical Patients Requiring Admission Each Month by Intervention Status
Pre-
Intervention Post
Intervention
Variable M SD M SD t p d
Surgical Patients Requiring
Admission_ 717.33 97.57 575.33 50.56 2.24 .089 1.83
Note. N = 6. Degrees of Freedom for the t-statistic = 4. d represents Cohen's d.
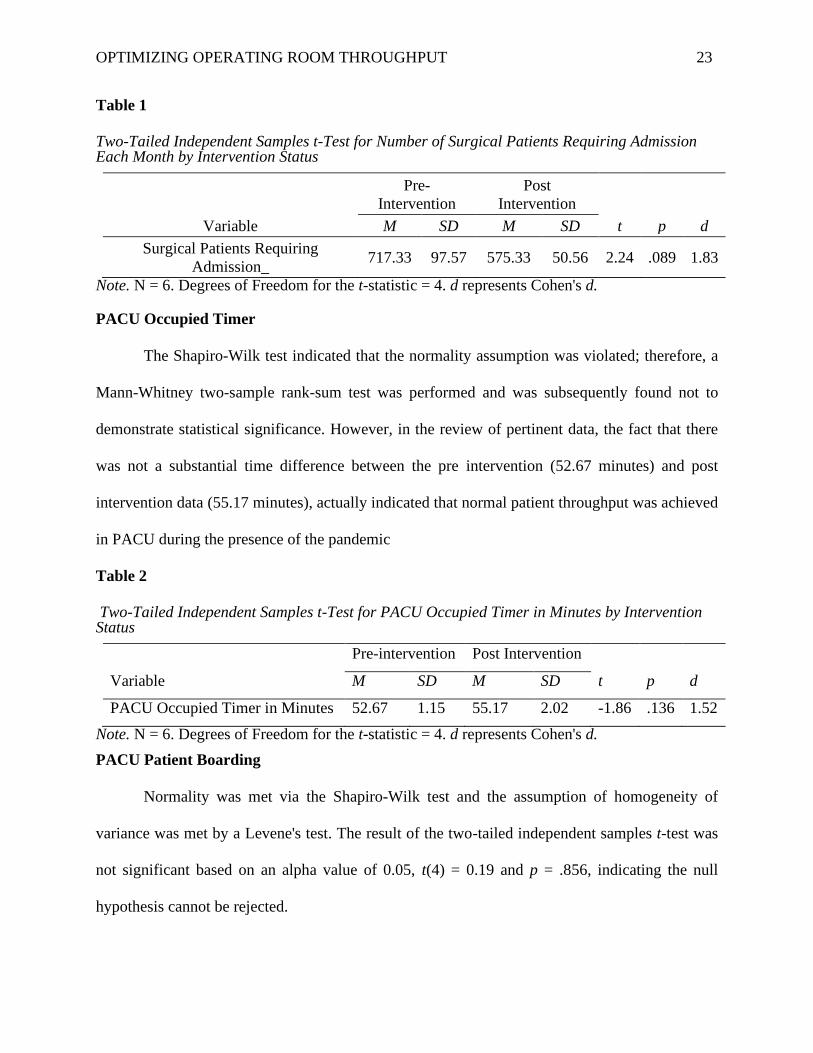
PACU Occupied Timer
The Shapiro-Wilk test indicated that the normality assumption was violated; therefore, a
Mann-Whitney two-sample rank-sum test was performed and was subsequently found not to
demonstrate statistical significance. However, in the review of pertinent data, the fact that there
was not a substantial time difference between the pre intervention (52.67 minutes) and post
intervention data (55.17 minutes), actually indicated that normal patient throughput was achieved
in PACU during the presence of the pandemic
Table 2
Two-Tailed Independent Samples t-Test for PACU Occupied Timer in Minutes by Intervention Status
Pre-intervention Post Intervention
Variable M SD M SD t p d
PACU Occupied Timer in Minutes 52.67 1.15 55.17 2.02 -1.86 .136 1.52
Note. N = 6. Degrees of Freedom for the t-statistic = 4. d represents Cohen's d.
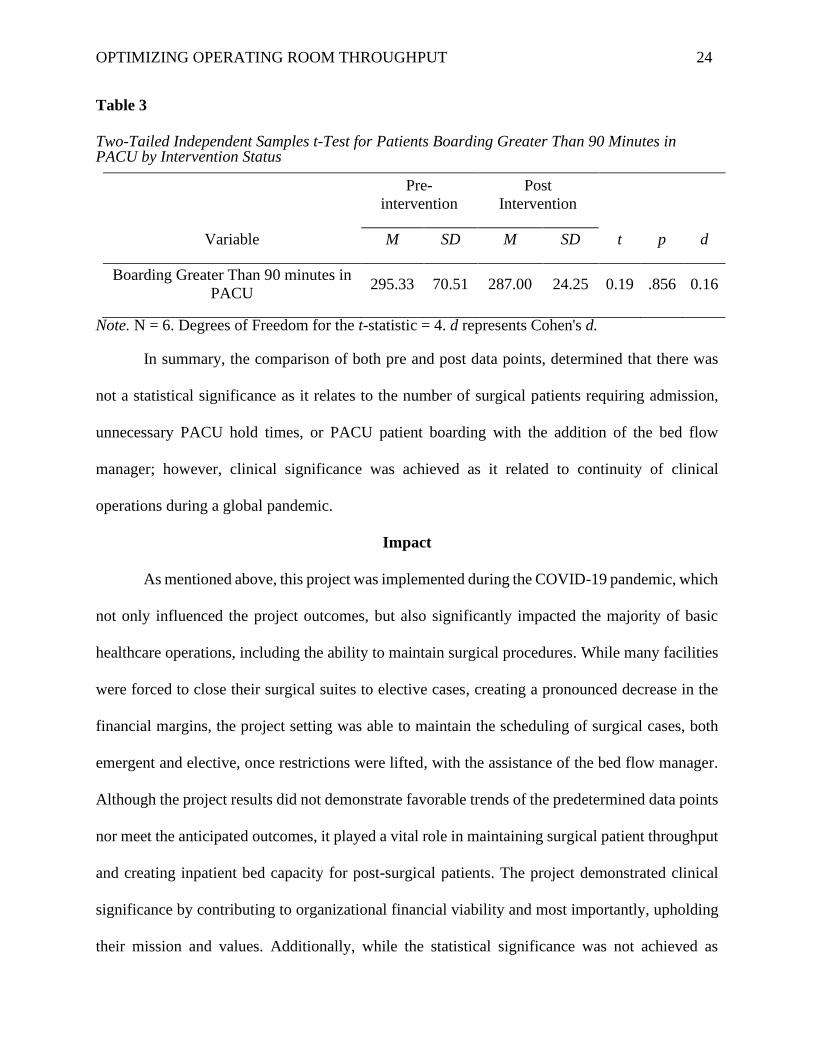
PACU Patient Boarding
Normality was met via the Shapiro-Wilk test and the assumption of homogeneity of
variance was met by a Levene's test. The result of the two-tailed independent samples t-test was
not significant based on an alpha value of 0.05, t(4) = 0.19 and p = .856, indicating the null
hypothesis cannot be rejected.
OPTIMIZING OPERATING ROOM THROUGHPUT 24
Table 3
Two-Tailed Independent Samples t-Test for Patients Boarding Greater Than 90 Minutes in PACU by Intervention Status
Pre-
intervention Post
Intervention
Variable M SD M SD t p d
Boarding Greater Than 90 minutes in
PACU 295.33 70.51 287.00 24.25 0.19 .856 0.16
Note. N = 6. Degrees of Freedom for the t-statistic = 4. d represents Cohen's d.
In summary, the comparison of both pre and post data points, determined that there was
not a statistical significance as it relates to the number of surgical patients requiring admission,
unnecessary PACU hold times, or PACU patient boarding with the addition of the bed flow
manager; however, clinical significance was achieved as it related to continuity of clinical
operations during a global pandemic.
Impact
As mentioned above, this project was implemented during the COVID-19 pandemic, which
not only influenced the project outcomes, but also significantly impacted the majority of basic
healthcare operations, including the ability to maintain surgical procedures. While many facilities
were forced to close their surgical suites to elective cases, creating a pronounced decrease in the
financial margins, the project setting was able to maintain the scheduling of surgical cases, both
emergent and elective, once restrictions were lifted, with the assistance of the bed flow manager.
Although the project results did not demonstrate favorable trends of the predetermined data points
nor meet the anticipated outcomes, it played a vital role in maintaining surgical patient throughput
and creating inpatient bed capacity for post-surgical patients. The project demonstrated clinical
significance by contributing to organizational financial viability and most importantly, upholding
their mission and values. Additionally, while the statistical significance was not achieved as
OPTIMIZING OPERATING ROOM THROUGHPUT 25
planned, the ongoing clinical significance of the dedicated role was noted by key stakeholders;
aligning with the themes of current evidence. These results further assisted in the development of
a sustainability and ongoing evaluation plan as well as the formulation of future recommendations
and a comprehensive study conclusion.
Sustainability and Ongoing Evaluation
In order for the project to have continued support, a robust plan for sustainability and
ongoing evaluation was essential. For sustainability purposes, general employee management has
transitioned to the organization’s transfer and communication center, which currently employs
similar positions. Also, specific job responsibilities, which were created by the project leader, have
been complied and listed within Appendix E as well as provided to the direct supervisor, for future
leadership reference. Additionally, for consistency among employees, daily oversight and
accountability is now assigned to the center’s charge nurse. Ongoing evaluation and alterations
will also be conducted by the management team within the transfer and communications center,
while continually seeking input and constructive feedback from the surgical leadership team.
Future Recommendations and Limitations
Insight gained from ongoing evaluations will be utilized to make future recommendations
for the project. Recommendations such as the expansion of coverage hours for the current surgical
department as well as the replication of services into other specialty areas or surgical suites within
the healthcare organization should each be considered with the further progression of positive
results. There are very few limitations to this project; however, the pandemic implication is likely
the most noteworthy. The COVID-19 pandemic placed severe constraints on patient throughput
due to hospital capacity and restricted resources, contributing to prolonged lengths of stay and
deviation from historical operational functionality. Also, there should be a consideration for the
OPTIMIZING OPERATING ROOM THROUGHPUT 26
financial burden of the project, although it was minimal. While there no costs associated with many
aspects of the project, there are ongoing expenses that should be routinely appraised. Labor costs
as well as fees surrounding the upkeep and maintenance of the technology requirements are each
a reoccurring expense that could be viewed as limitations and subsequently restrict the ongoing
success and sustainability of the project.
Plans for Dissemination
Upon project completion, dissemination of results was communicated to the practicum
preceptor as well as other target audiences. First, the preceptor received an electronic
presentation, that outlined key elements of the intervention as well as historical data compared to
postimplementation data. This presentation also included the results of the project as well as
discussion surrounding sustainability measures and future recommendations. Next, the
presentation was provided to many of the key stakeholders as well as escalated through
organizational leadership. A brief version of the presentation was presented at the monthly
leadership meeting for the transfer and communication center, as this department is responsible
for system wide direction pertaining to patient throughput policies as well as is the reviewing
body for all large-scale operational process changes. Additionally, project results were shared
with system regional leaders to deem applicability for replication within their facilities.
This paper may be submitted to several different journals in hopes to assist other
professionals who are seeking improvements to hospital throughput and patient flow. Journals
considered for submission include the Association of periOperative Registered Nurses (AORN)
and the Journal of PeriAnesthesia Nursing, both of which are specific to surgical care. However,
the Journal of Nursing Administration (JONA), which is appealing to healthcare leaders, the
target audience of this study, would take priority for submission. Also, to assist in the peer
OPTIMIZING OPERATING ROOM THROUGHPUT 27
review process prior to submission, the project preceptor as well as a representative from the
facilities’ research council will be given a copy for intensive edits.
Conclusion
Hospital throughput and capacity management are key aspects in improving patient
safety as well as the overall quality of healthcare. Surgical admissions are a substantial
contributor to the hospital census; therefore, perioperative throughput initiatives should be
methodically considered, researched and implemented. The addition of a dedicated surgical bed
flow manager, who was embedded within the organizational transfer center, standardized and
streamlined the perioperative bed flow process as well as improved interdepartmental
communication. While effective project implementation was not demonstrated by a decrease in
the PACU hold times nor by an increase in operative procedures per day, it did demonstrate
clinical significance during the COVID-19 pandemic.
OPTIMIZING OPERATING ROOM THROUGHPUT 28
References
Abir, M., Davis, M. M., Sankar, P., Wong, A. C., & Wang, S. C. (2013). Design of a model to
predict surge capacity bottlenecks for burn mass casualties at a large academic medical
center. Prehospital and Disaster Medicine, 28(1), 23-32.
https://doi.org/10.1017/S1049023X12001513
Amir, K. J., Wellikson, L., & Whinney, C. (2017). Hospital medicine and perioperative care: A
framework for high quality, high value collaborative care. Journal of Hospital Medicine,
12(4), 277. Retrieved from https://mdedge-files-live.s3.us-east-
2.amazonaws.com/files/s3fs-public/jhm012040277.pdf
Bing-Hua, Y. U. (2014). Delayed admission to intensive care unit for critically surgical patients
is associated with increased mortality. The American Surgery Journal, 208(2), 268-274.
https://doi.org/10.1016/j.amjsurg.2013.08.044
Burnes, B. (2004). Kurt Lewin and the planned approach to change: A re‐appraisal. Journal of
Management Studies, 41(6), 977-1002. https://doi.org/10.1111/j.1467-6486.2004.00463.x
Carilion Clinic (2020). About Carilion Clinic. Retrieved from
https://www.carilionclinic.org/about-carilion-clinic#our-values
Costa Jr, A. D. S., Leao, L. E. V., Novais, M. A. P. D., & Zucchi, P. (2015). An assessment of
the quality indicators of operative and non-operative times in a public university hospital.
Health Economics and Management, 13(4), 594-599. https://dx.doi.org/10.1590/S1679-
45082015GS3289
Cox Bauer, C. M., Greer, D. M., Vander Wyst, K. B., & Kamelle, S. A. (2016). First-case
operating room delays: Patterns across urban hospitals of a single health care system.
OPTIMIZING OPERATING ROOM THROUGHPUT 29
Journal of Patient Centered Research and Reviews, 3(3), 125-132.
https://doi.org/10.17294/2330-0698.1265
Cummings, S., Bridgman, T., & Brown, K. G. (2016). Unfreezing change as three steps:
Rethinking Kurt Lewin’s legacy for change management. Human Relations, 69(1), 33-60.
https://doi.org/10.1016/j.jik.2016.07.002
Donnelly, P., & Kirk, P. (2015). Use the PDSA model for effective change management.
Education for Primary Care, 26(4), 279-281.
https://doi.org/10.1080/14739879.2015.11494356
Ebell, M. H., Siwek, J., Weiss, B., Woolf, S., Susman, J., Ewigman, B., & Bowman, M. (2004).
Strength of Recommendation Taxonomy (SORT): A patient-centered approach to
grading medical literature. American Family Physicians, 69(3), 549-556.
https://www.aafp.org/afp/2004/0201/p548.html
Grol, R., Bosch, M., Hulscher, M., Eccles, M., & Wensing, M. (2007). Planning and studying
improvement in patient care: The use of theoretical perspectives. The Milbank Quarterly,
85(1), 93-138. https://doi.org/10.1111/j.1468-0009.2007.00478.x
Jweinat, J., Damore, P., Morris, V., D’Aquila, R., Bacon, S., & Balcezak, T. J. (2013). The safe
patient flow initiative: A collaborative quality improvement journey at Yale-New Haven
Hospital. The Joint Commission Journal on Quality and Patient Safety, 39(10), 447-459.
https://doi.org/10.1016/S1553-7250(13)39058-8
Hollis, L., & Adame, B. (2013). It's a bird, it’s a plane, it’s a super charge nurse: Improving
surgical flow through the use of innovative technologies. Journal of PeriAnesthesia
Nursing, 28(3), 23. https://doi.org/10.1016/j.jopan.2013.04.068
OPTIMIZING OPERATING ROOM THROUGHPUT 30
Kaminski, J. (2011). Theory applied to informatics – Lewin’s Change Theory. CJNI: Canadian
Journal of Nursing Informatics, 6 (1). Retrieved from
http://cjni.net/Journal_original/Winter2011/cjni.net-
_Theory_applied_to_informatics_%96_Lewin%92s_Change_Theory___CJNI_Journal_.
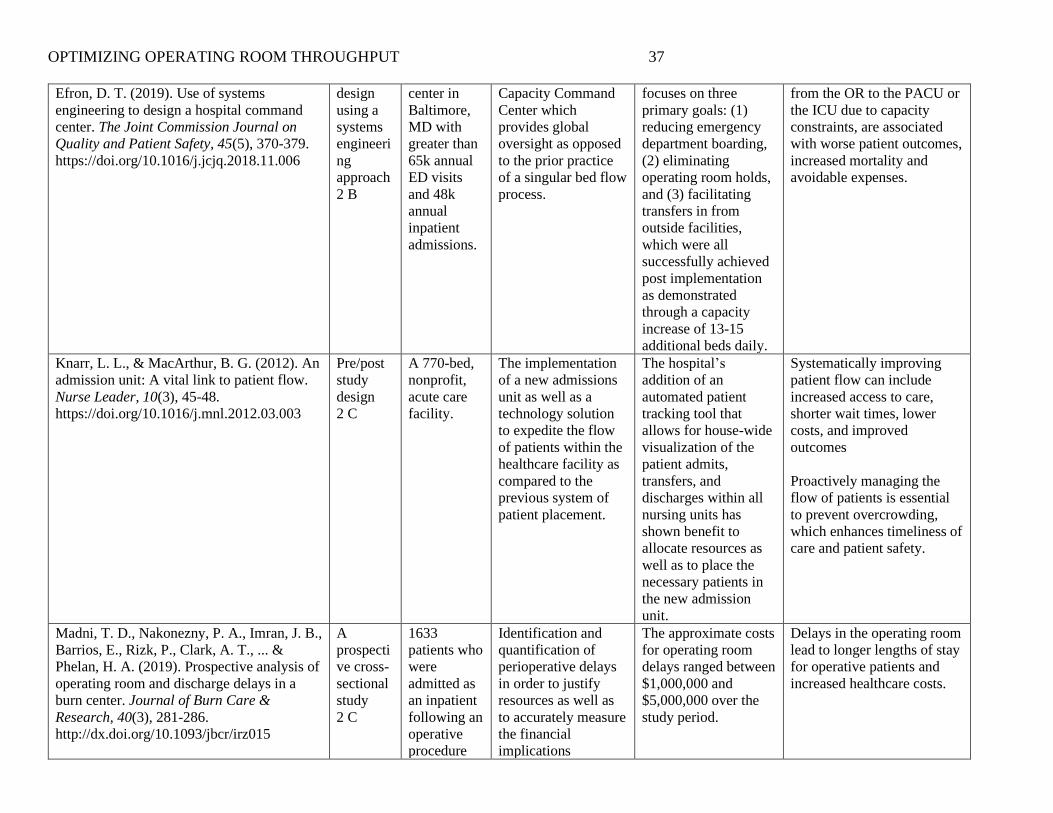
Kane, E. M., Scheulen, J. J., Püttgen, A., Martinez, D., Levin, S., Bush, B. A., ... & Efron, D. T.
(2019). Use of systems engineering to design a hospital command center. The Joint
Commission Journal on Quality and Patient Safety, 45(5), 370-379.
https://doi.org/10.1016/j.jcjq.2018.11.006
Knarr, L. L., & MacArthur, B. G. (2012). An admission unit: A vital link to patient flow. Nurse
Leader, 10(3), 45-48. https://doi.org/10.1016/j.mnl.2012.03.003
Lee, D. J., Ding, J., & Guzzo, T. J. (2019). Improving operating room efficiency. Current
Urology Reports, 20(6), 28. https://doi.org/10.1007/s11934-019-0895-3
Leis, J. A., & Shojania, K. G. (2017). A primer on PDSA: Executing plan–do–study–act cycles
in practice, not just in name. BMJ Quality & Safety, 26(7), 572-577.
http://dx.doi.org/10.1136/bmjqs-2016-006245
Madni, T. D., Nakonezny, P. A., Imran, J. B., Barrios, E., Rizk, P., Clark, A. T., ... & Phelan, H.
A. (2019). Prospective analysis of operating room and discharge delays in a burn center.
Journal of Burn Care & Research, 40(3), 281-286. http://dx.doi.org/10.1093/jbcr/irz015
Martinez, D. A., Kane, E. M., Jalalpour, M., Scheulen, J., Rupani, H., Toteja, R., ... & Levin, S.
R. (2018). An electronic dashboard to monitor patient flow at the Johns Hopkins
Hospital: Communication of key performance indicators using the Donabedian model.
Journal of Medical Systems, 42(8), 133. https://doi.org/10.1007/s10916-018-0988-4
OPTIMIZING OPERATING ROOM THROUGHPUT 31
McFadden, K. L., Stock, G. N., & Gowen III, C. R. (2015). Leadership, safety climate, and
continuous quality improvement: Impact on process quality and patient safety. Health
Care Management Review, 40(1), 24-34.https/doi.org/
10.1097/HMR.0000000000000006
McKetta, D., Day, T. E., Jones, V., Perri, A., & Nicolson, S. C. (2016). Managing disruptions to
patient flow capacity: Rapid-cycle improvement in a pediatric cardiac procedure
complex. The Joint Commission Journal on Quality and Patient Safety, 42(7), 321-324.
https://doi.org/10.1016/S1553-7250(16)42044-1
Morris, A. J., Sanford, J. A., Damrose, E. J., Wald, S. H., Kadry, B., & Macario, A. (2018).
Overlapping surgery: A case study in operating room throughput and efficiency.
Anesthesiology Clinics, 36(2), 161-176. https://doi.org/10.1016/j.anclin.2018.01.002
Nelson, S. E., Sandberg, W. S., Clifton, J. C., Cui, Y., Shotwell, M. S., & Wanderer, J. P. (2020).
Holding some postoperative patients overnight in the post anesthesia care unit as a tactic
to deal with hospital congestion is associated with increased resource length of stay.
Perioperative Care and Operating Room Management, 21, 100-111.
https://doi.org/10.1016/j.pcorm.2020.100111
O’Donnell, B., Walsh, K., Murphy, A., McElroy, B., Iohom, G., & Shorten, G. D. (2017). An
evaluation of operating room throughput in a stand-alone soft-tissue trauma operating
theatre. Romanian Journal of Anesthesia and Intensive Care, 24(1), 13.
https://doi.org/10.21454/rjaic.7518.241.wal
Ozcan, Y. A., Tanfani, E., & Testi, A. (2017). Improving the performance of surgery-based
clinical pathways: A simulation-optimization approach. Health Care Management
Science, 20(1), 1-15. https://doi.org/10.1007/s10729-016-9371-5
OPTIMIZING OPERATING ROOM THROUGHPUT 32
Pascual, J. L., Blank, N. W., Holena, D. N., Robertson, M. P., Diop, M., Allen, S. R., ... Reilly,
P. M. (2014). There’s no place like home: Boarding surgical ICU patients in other ICUs
and the effect of distances from the home unit. Journal of Trauma and Acute Care
Surgery, 76(4), 1096-1102. https://doi.org/10.1097/TA.0000000000000180
Rothstein, D. H., & Raval, M. V. (2018). Operating room efficiency. Seminars in Pediatric
Surgery, 27(2), 79-85. https://doi.org/10.1053/j.sempedsurg.2018.02.004
Sarayreh, B. H., Khudair, H., & Barakat, E. A. (2013). Comparative study: The Kurt Lewin of
change management. International Journal of Computer and Information Technology,
2(4), 626-629.
https://d1wqtxts1xzle7.cloudfront.net/33293215/Paper020413.pdf?1395622085=&respon
secontentdisposition=inline%3B+filename%3DComparative_Study_The_Kurt_Lewin_of
_Chan.pdf
Schwarz, P., Pannes, K. D., Nathan, M., Reimer, H. J., Kleespies, A., Kuhn, N., ... & Zugel, N.
P. (2011). Lean processes for optimizing OR capacity utilization: Prospective analysis
before and after implementation of value stream mapping (VSM). Langenbeck's Archives
of Surgery, 396(7), 1047. https://doi.org/10.1007/s00423-011-0833-4
Somlo, D. R., Repenning, N. P., & Mangi, A. A. (2018). In-hospital delays result in worse
patient outcomes and higher cost after cardiac surgery. The Annals of Thoracic Surgery,
106(4), 1143-1149. https://doi.org/10.1016/j.athoracsur.2018.05.033
US Department of Health and Human Services (2011). Quality Improvements. Health Resources
and Services Administration. Retrieved from
https://www.hrsa.gov/sites/default/files/quality/toolbox/pdfs/qualityimprovement.pdf
OPTIMIZING OPERATING ROOM THROUGHPUT 33
Table 1
Budget
EXPENSES REVENUE
Direct Expense reduction: Decrease in
nursing salary dollars associated
overnight PACU holds
0.00
Salary and benefits $85,000.00 Profit: Reduction of delays and
subsequent increased cases per
day.
0.00
Supplies $3,500.00 Institutional budget support 0.00
Services 0.00 Grants 0.00
Indirect
Overhead 0.00
Total Expenses $88,500.00 Total Revenue 0.00
Net Balance
OPTIMIZING OPERATING ROOM THROUGHPUT 34
Figure 1
PRISMA Diagram
OPTIMIZING OPERATING ROOM THROUGHPUT 35
Appendix A
Summary of Primary Research Evidence
Citation
Design,
Level
Quality
Grade
Sample
Sample size
Intervention
Comparison
Outcome Definition
Usefulness
Results
Key Findings
Abir, M., Davis, M. M., Sankar, P., Wong,
A. C., & Wang, S. C. (2013). Design of a
model to predict surge capacity bottlenecks
for burn mass casualties at a large academic
medical center. Prehospital and Disaster
Medicine, 28(1), 23-32.
https://doi.org/10.1017/S1049023X12001513
Cross-
sectional
study
2 C
Simulation
containing
100 patients
This study is
pertinent to large
academic medical
centers who have
significant capacity
constraints on a
consistent basis.
Therefore, the
researchers were able
to predict how they
would handle
significant patient
surges through the
utilization of a
simulation software
called Pro Model.
This model serves as
a proactive approach
via predictive
analysis methodology
to determine patient
flow as well as the
anticipated healthcare
resource use as
compared to the
current reactive
approach of daily
data collection.
This study analyzes
the influence of
institutional resources,
space, and staffing
capacity to coordinate
care for a large
volume of patients as
well as subsequently
provides identification
of processes that
should be created to
manage areas of
greatest opportunities.
Simulation was utilized to
measure and manage
potential capacity constrains
due to large influxes of
patient requirement medical
as well as surgical
intervention. Delays were
studied and attributions for
delays were identified
through the simulation
model. The key drivers of
delays were recognized as
physical beds, certain
medications and blood
products; not operating
rooms capacity or staffing as
first ideated.
OPTIMIZING OPERATING ROOM THROUGHPUT 36
Costa Jr, A. D. S., Leao, L. E. V., Novais, M.
A. P. D., & Zucchi, P. (2015). An assessment
of the quality indicators of operative and
non-operative times in a public university
hospital. Health Economics and
Management. 13(4), 594-599.
https://dx.doi.org/10.1590/S1679-
45082015GS3289
A
descripti
ve cross-
sectional
study
2 B
8,420
operations
occurring
from
January
2011 to
January
2012. The
operations
performed
in the same
operating
room,
between
7:00 am and
5:00 pm
Monday –
Friday,
excluding
holidays.
Data collection and
research surrounds
OR phases of care
and durations of
procedures as well as
idle times compared
to literature and
standard of other like
medical centers.
Delays frequently
occurred in the
operating room and
had a significant
impact on patient flow
and resource
utilization.
Determination of the
time indicators of the
operating room is
essential in improving
efficiency.
Idle operating rooms come at
a high cost due to the waste
of available resources. In the
United States, the average
cost for a surgical procedure
is estimated at $900.00 to
$1,200.00 per hour.
Additionally, the idle time of
an empty OR has substantial
financial impact; each
minute wasted can vary from
$60.00 to $100.00.
The logistics of the
perioperative and admission
periods as well as the
coordination of care among
the interdisciplinary teams
are needed to support a high
functioning OR.
Jweinat, J., Damore, P., Morris, V.,
D’Aquila, R., Bacon, S., & Balcezak, T. J.
(2013). The safe patient flow initiative: A
collaborative quality improvement journey at
Yale-New Haven Hospital. The Joint
Commission Journal on Quality and Patient
Safety, 39(10), 447-459.
https://doi.org/10.1016/S1553-
7250(13)39058-8
Pre/post
study
design
2 B
Organizatio
nal wide
throughput
and quality
process
implemente
d from
October
2008 to
September
2009 (one
fiscal year)
The implementation
of the utilization of a
bed management
process combined
with an
organizational wide
method to
standardizing the
discharge process,
use status boards for
visual control, and to
improving accuracy
and timeliness of data
entry compared to the
absence of a defined
process to measure
patient flow and
efficiency.
Improvements were
noted in clinical,
operational, and
financial outcomes by
embracing five key
components of
demand capacity
management: real-
time communication,
inter/intradepartmental
and interdisciplinary
collaboration, staff
empowerment,
standardization of best
practices, and
institutional memory.
Between FY 2008 and FY
2011, the site experienced an
84% improvement in
discharges by 11:00 am,
average length of stay
decreased from 5.23 to 5.05
days, thereby
accommodating an
additional 45 inpatients on a
daily basis which contributed
to a positive operating
margin.
Kane, E. M., Scheulen, J. J., Püttgen, A.,
Martinez, D., Levin, S., Bush, B. A., ... &
Pre/post
study
1,131 bed
tertiary care
The creation and
implementation of a
The command center
and bed process
OR exit holds, in which
patients are unable to move
OPTIMIZING OPERATING ROOM THROUGHPUT 37
Efron, D. T. (2019). Use of systems
engineering to design a hospital command
center. The Joint Commission Journal on
Quality and Patient Safety, 45(5), 370-379.
https://doi.org/10.1016/j.jcjq.2018.11.006
design
using a
systems
engineeri
ng
approach
2 B
center in
Baltimore,
MD with
greater than
65k annual
ED visits
and 48k
annual
inpatient
admissions.
Capacity Command
Center which
provides global
oversight as opposed
to the prior practice
of a singular bed flow
process.
focuses on three
primary goals: (1)
reducing emergency
department boarding,
(2) eliminating
operating room holds,
and (3) facilitating
transfers in from
outside facilities,
which were all
successfully achieved
post implementation
as demonstrated
through a capacity
increase of 13-15
additional beds daily.
from the OR to the PACU or
the ICU due to capacity
constraints, are associated
with worse patient outcomes,
increased mortality and
avoidable expenses.
Knarr, L. L., & MacArthur, B. G. (2012). An
admission unit: A vital link to patient flow.
Nurse Leader, 10(3), 45-48.
https://doi.org/10.1016/j.mnl.2012.03.003
Pre/post
study
design
2 C
A 770-bed,
nonprofit,
acute care
facility.
The implementation
of a new admissions
unit as well as a
technology solution
to expedite the flow
of patients within the
healthcare facility as
compared to the
previous system of
patient placement.
The hospital’s
addition of an
automated patient
tracking tool that
allows for house-wide
visualization of the
patient admits,
transfers, and
discharges within all
nursing units has
shown benefit to
allocate resources as
well as to place the
necessary patients in
the new admission
unit.
Systematically improving
patient flow can include
increased access to care,
shorter wait times, lower
costs, and improved
outcomes
Proactively managing the
flow of patients is essential
to prevent overcrowding,
which enhances timeliness of
care and patient safety.
Madni, T. D., Nakonezny, P. A., Imran, J. B.,
Barrios, E., Rizk, P., Clark, A. T., ... &
Phelan, H. A. (2019). Prospective analysis of
operating room and discharge delays in a
burn center. Journal of Burn Care &
Research, 40(3), 281-286.
http://dx.doi.org/10.1093/jbcr/irz015
A
prospecti
ve cross-
sectional
study
2 C
1633
patients who
were
admitted as
an inpatient
following an
operative
procedure
Identification and
quantification of
perioperative delays
in order to justify
resources as well as
to accurately measure
the financial
implications
The approximate costs
for operating room
delays ranged between
$1,000,000 and
$5,000,000 over the
study period.
Delays in the operating room
lead to longer lengths of stay
for operative patients and
increased healthcare costs.
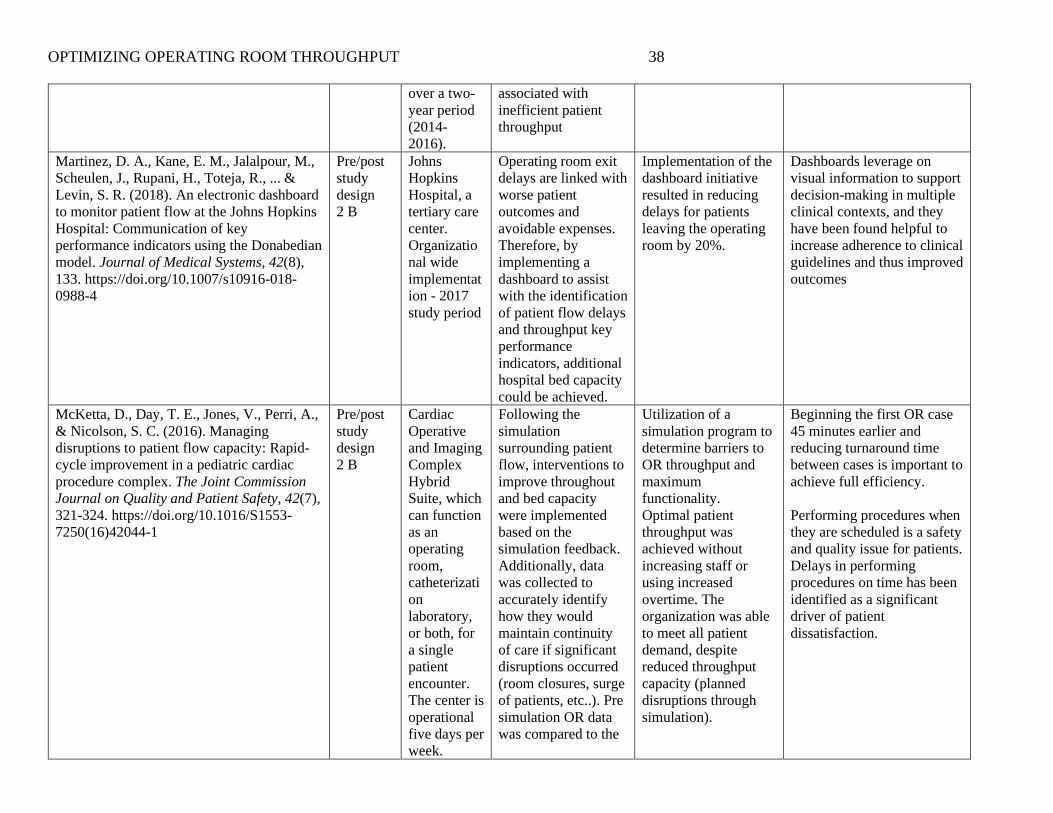
OPTIMIZING OPERATING ROOM THROUGHPUT 38
over a two-
year period
(2014-
2016).
associated with
inefficient patient
throughput
Martinez, D. A., Kane, E. M., Jalalpour, M.,
Scheulen, J., Rupani, H., Toteja, R., ... &
Levin, S. R. (2018). An electronic dashboard
to monitor patient flow at the Johns Hopkins
Hospital: Communication of key
performance indicators using the Donabedian
model. Journal of Medical Systems, 42(8),
133. https://doi.org/10.1007/s10916-018-
0988-4
Pre/post
study
design
2 B
Johns
Hopkins
Hospital, a
tertiary care
center.
Organizatio
nal wide
implementat
ion - 2017
study period
Operating room exit
delays are linked with
worse patient
outcomes and
avoidable expenses.
Therefore, by
implementing a
dashboard to assist
with the identification
of patient flow delays
and throughput key
performance
indicators, additional
hospital bed capacity
could be achieved.
Implementation of the
dashboard initiative
resulted in reducing
delays for patients
leaving the operating
room by 20%.
Dashboards leverage on
visual information to support
decision-making in multiple
clinical contexts, and they
have been found helpful to
increase adherence to clinical
guidelines and thus improved
outcomes
McKetta, D., Day, T. E., Jones, V., Perri, A.,
& Nicolson, S. C. (2016). Managing
disruptions to patient flow capacity: Rapid-
cycle improvement in a pediatric cardiac
procedure complex. The Joint Commission
Journal on Quality and Patient Safety, 42(7),
321-324. https://doi.org/10.1016/S1553-
7250(16)42044-1
Pre/post
study
design
2 B
Cardiac
Operative
and Imaging
Complex
Hybrid
Suite, which
can function
as an
operating
room,
catheterizati
on
laboratory,
or both, for
a single
patient
encounter.
The center is
operational
five days per
week.
Following the
simulation
surrounding patient
flow, interventions to
improve throughout
and bed capacity
were implemented
based on the
simulation feedback.
Additionally, data
was collected to
accurately identify
how they would
maintain continuity
of care if significant
disruptions occurred
(room closures, surge
of patients, etc..). Pre
simulation OR data
was compared to the
Utilization of a
simulation program to
determine barriers to
OR throughput and
maximum
functionality.
Optimal patient
throughput was
achieved without
increasing staff or
using increased
overtime. The
organization was able
to meet all patient
demand, despite
reduced throughput
capacity (planned
disruptions through
simulation).
Beginning the first OR case
45 minutes earlier and
reducing turnaround time
between cases is important to
achieve full efficiency.
Performing procedures when
they are scheduled is a safety
and quality issue for patients.
Delays in performing
procedures on time has been
identified as a significant
driver of patient
dissatisfaction.
OPTIMIZING OPERATING ROOM THROUGHPUT 39
post simulation
feedback period.
O’Donnell, B., Walsh, K., Murphy, A.,
McElroy, B., Iohom, G., & Shorten, G. D.
(2017). An evaluation of operating room
throughput in a stand-alone soft-tissue
trauma operating theatre. Romanian Journal
of Anesthesia and Intensive Care, 24(1), 13.
https://doi.org/10.21454/rjaic.7518.241.wal
Prospecti
ve
pre/post
study
design
2 B
800 bed
tertiary
referral
academic
medical
center. 58-
day study
period
Data was collected to
determine causes of
non-operative time
and miscellaneous
delays within the OR.
Processes determined
by the data collection
would then be
implemented to
increase OR
throughput and
minimize delays.
The primary objective
of this study was to
increase the operating
room throughput by
one additional surgical
case per standard
working day (9
hours).
Additional attending
anesthesiologist
coverage did not
impact non-operative
time and to achieve
improvement in the
primary outcome
measure additional
nursing/physician
support staff is
required.
However,
improvements were
seen in secondary
outcome measures
such as the duration of
recovery room stay
and the ability to
bypass the recovery
room. To achieve
improvement in the
primary outcome
measure additional
nursing/physician
support staff is
required.
On average two hours of
operating room time were
lost per day due to avoidable
delays, mostly case
cancellations.
Ozcan, Y. A., Tanfani, E., & Testi, A.
(2017). Improving the performance of
surgery-based clinical pathways: A
simulation-optimization approach. Health
Retrospe
ctive
Case
Study
Data was
retrospective
ly for 1 year
(January 1
Utilization of
simulation to
determine true OR
capability by
Simulation analysis
indicated that the
current system
performance was not
Simulation found that
increasing both the number
of surgical patients and the
bed utilization rate by adding
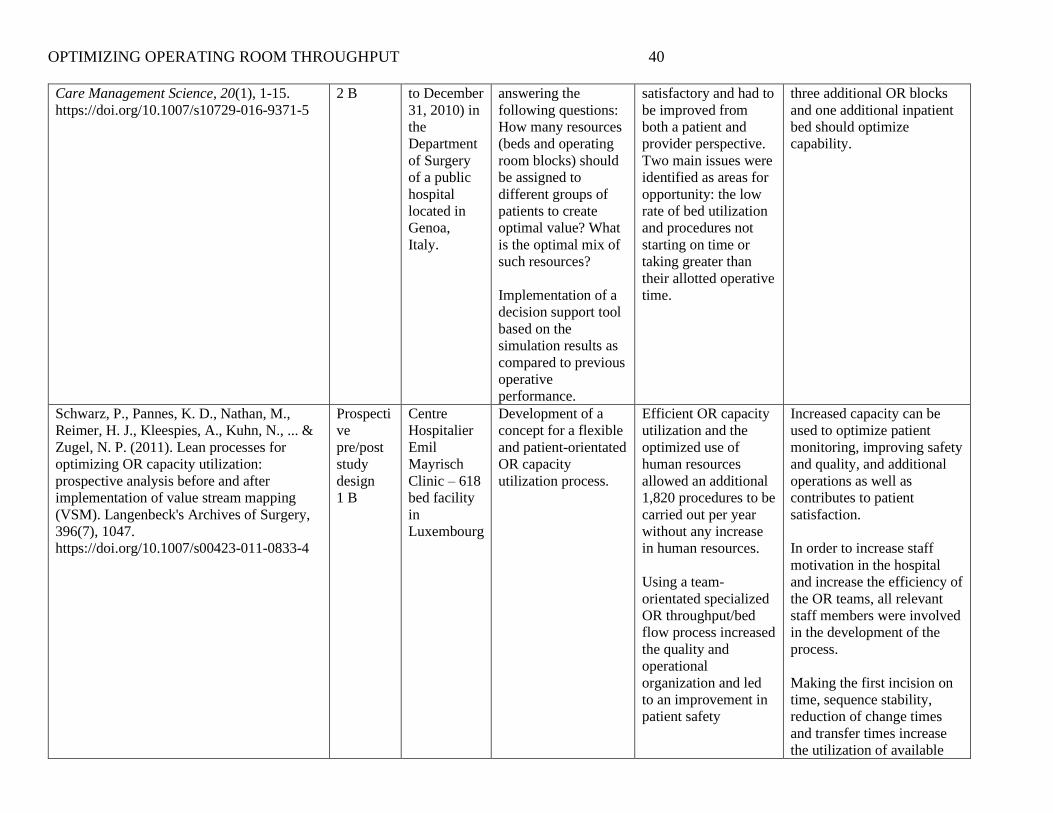
OPTIMIZING OPERATING ROOM THROUGHPUT 40
Care Management Science, 20(1), 1-15.
https://doi.org/10.1007/s10729-016-9371-5
2 B to December
31, 2010) in
the
Department
of Surgery
of a public
hospital
located in
Genoa,
Italy.
answering the
following questions:
How many resources
(beds and operating
room blocks) should
be assigned to
different groups of
patients to create
optimal value? What
is the optimal mix of
such resources?
Implementation of a
decision support tool
based on the
simulation results as
compared to previous
operative
performance.
satisfactory and had to
be improved from
both a patient and
provider perspective.
Two main issues were
identified as areas for
opportunity: the low
rate of bed utilization
and procedures not
starting on time or
taking greater than
their allotted operative
time.
three additional OR blocks
and one additional inpatient
bed should optimize
capability.
Schwarz, P., Pannes, K. D., Nathan, M.,
Reimer, H. J., Kleespies, A., Kuhn, N., ... &
Zugel, N. P. (2011). Lean processes for
optimizing OR capacity utilization:
prospective analysis before and after
implementation of value stream mapping
(VSM). Langenbeck's Archives of Surgery,
396(7), 1047.
https://doi.org/10.1007/s00423-011-0833-4
Prospecti
ve
pre/post
study
design
1 B
Centre
Hospitalier
Emil
Mayrisch
Clinic – 618
bed facility
in
Luxembourg
Development of a
concept for a flexible
and patient-orientated
OR capacity
utilization process.
Efficient OR capacity
utilization and the
optimized use of
human resources
allowed an additional
1,820 procedures to be
carried out per year
without any increase
in human resources.
Using a team-
orientated specialized
OR throughput/bed
flow process increased
the quality and
operational
organization and led
to an improvement in
patient safety
Increased capacity can be
used to optimize patient
monitoring, improving safety
and quality, and additional
operations as well as
contributes to patient
satisfaction.
In order to increase staff
motivation in the hospital
and increase the efficiency of
the OR teams, all relevant
staff members were involved
in the development of the
process.
Making the first incision on
time, sequence stability,
reduction of change times
and transfer times increase
the utilization of available
OPTIMIZING OPERATING ROOM THROUGHPUT 41
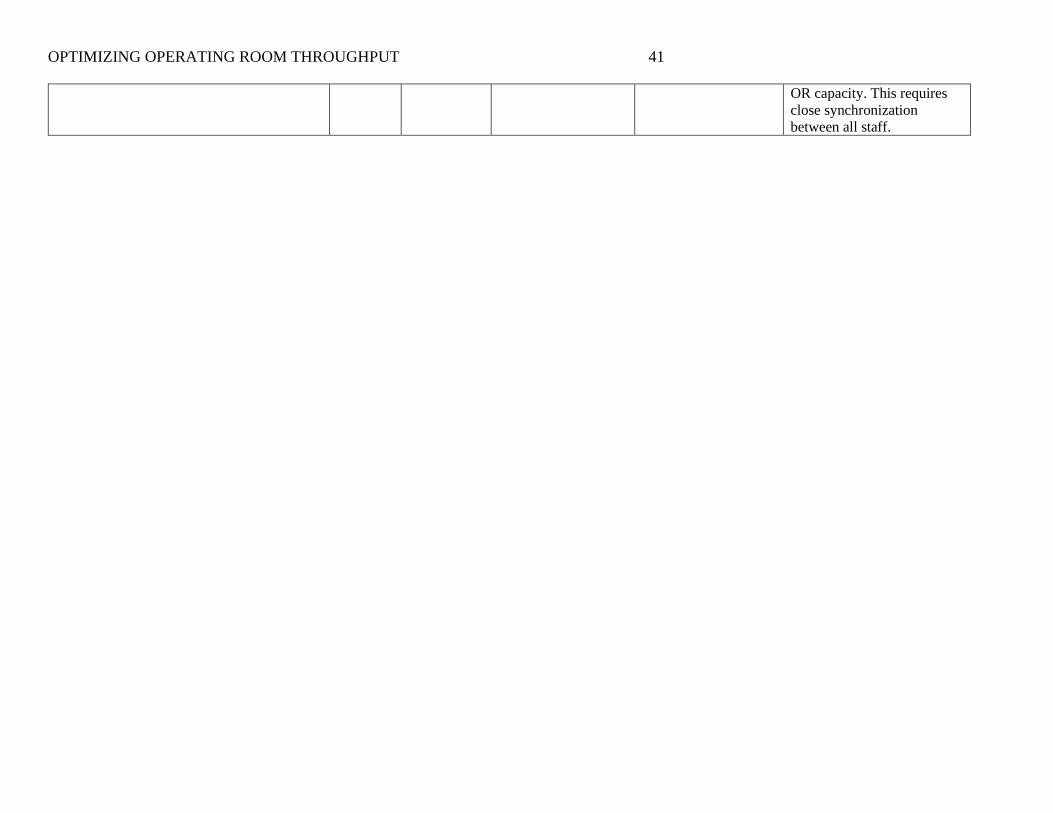
OR capacity. This requires
close synchronization
between all staff.
OPTIMIZING OPERATING ROOM THROUGHPUT 42
Appendix B
SWOT Analysis
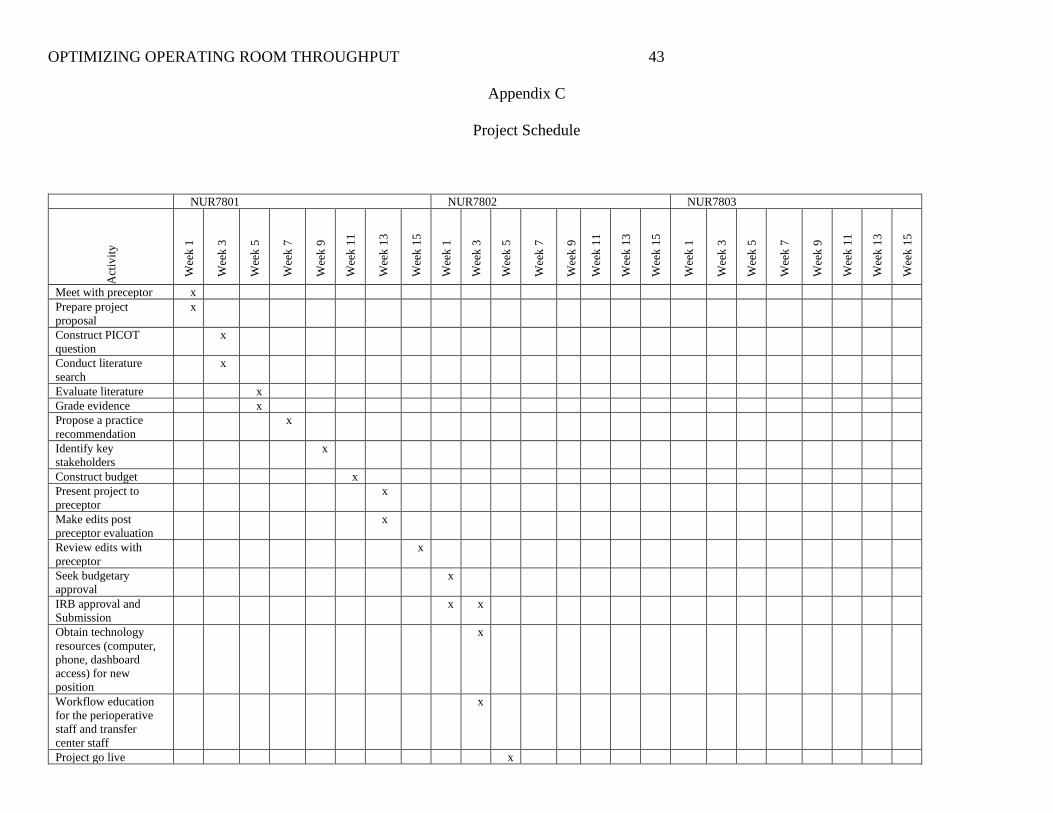
OPTIMIZING OPERATING ROOM THROUGHPUT 43
Appendix C
Project Schedule
NUR7801 NUR7802 NUR7803
Act
ivit
y
Wee
k 1
Wee
k 3
Wee
k 5
Wee
k 7
Wee
k 9
Wee
k 1
1
Wee
k 1
3
Wee
k 1
5
Wee
k 1
Wee
k 3
Wee
k 5
Wee
k 7
Wee
k 9
Wee
k 1
1
Wee
k 1
3
Wee
k 1
5
Wee
k 1
Wee
k 3
Wee
k 5
Wee
k 7
Wee
k 9
Wee
k 1
1
Wee
k 1
3
Wee
k 1
5
Meet with preceptor x
Prepare project
proposal
x
Construct PICOT
question
x
Conduct literature
search
x
Evaluate literature x
Grade evidence x
Propose a practice
recommendation
x
Identify key
stakeholders
x
Construct budget x
Present project to
preceptor
x
Make edits post
preceptor evaluation
x
Review edits with
preceptor
x
Seek budgetary
approval
x
IRB approval and
Submission
x x
Obtain technology
resources (computer,
phone, dashboard
access) for new
position
x
Workflow education
for the perioperative
staff and transfer
center staff
x
Project go live x
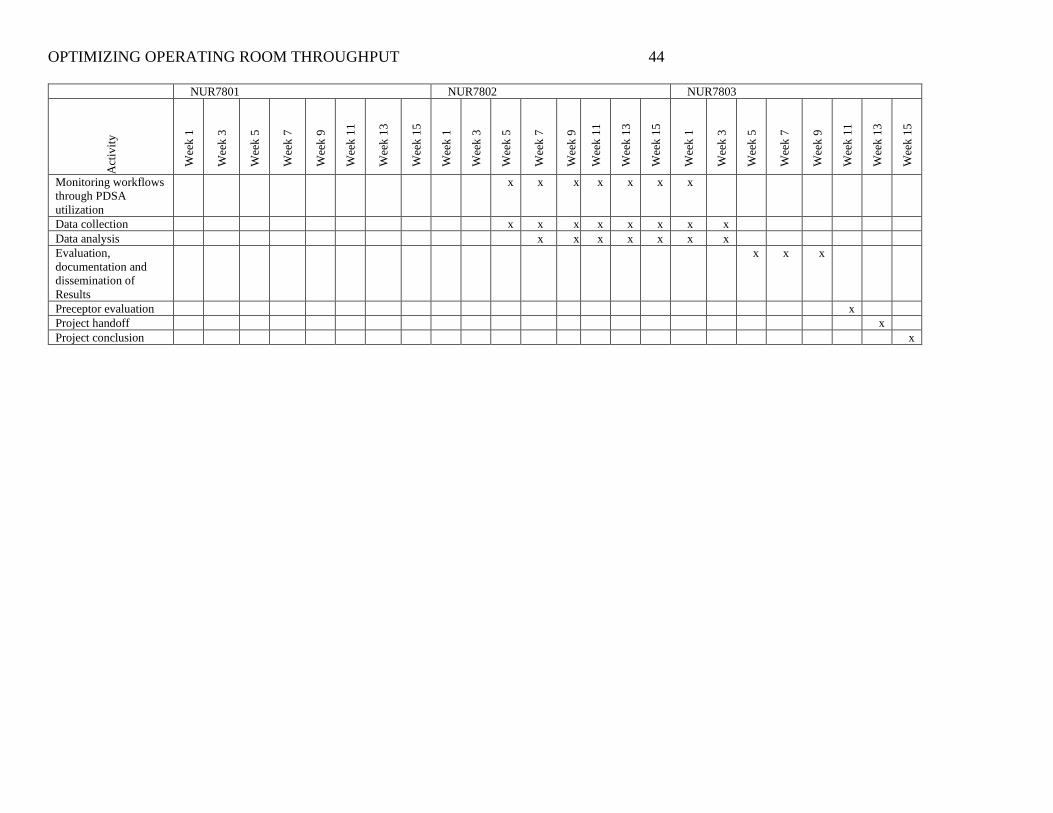
OPTIMIZING OPERATING ROOM THROUGHPUT 44
NUR7801 NUR7802 NUR7803
Act
ivit
y
Wee
k 1
Wee
k 3
Wee
k 5
Wee
k 7
Wee
k 9
Wee
k 1
1
Wee
k 1
3
Wee
k 1
5
Wee
k 1
Wee
k 3
Wee
k 5
Wee
k 7
Wee
k 9
Wee
k 1
1
Wee
k 1
3
Wee
k 1
5
Wee
k 1
Wee
k 3
Wee
k 5
Wee
k 7
Wee
k 9
Wee
k 1
1
Wee
k 1
3
Wee
k 1
5
Monitoring workflows
through PDSA
utilization
x x x x x x x
Data collection x x x x x x x x
Data analysis x x x x x x x
Evaluation,
documentation and
dissemination of
Results
x x x
Preceptor evaluation x
Project handoff x
Project conclusion x
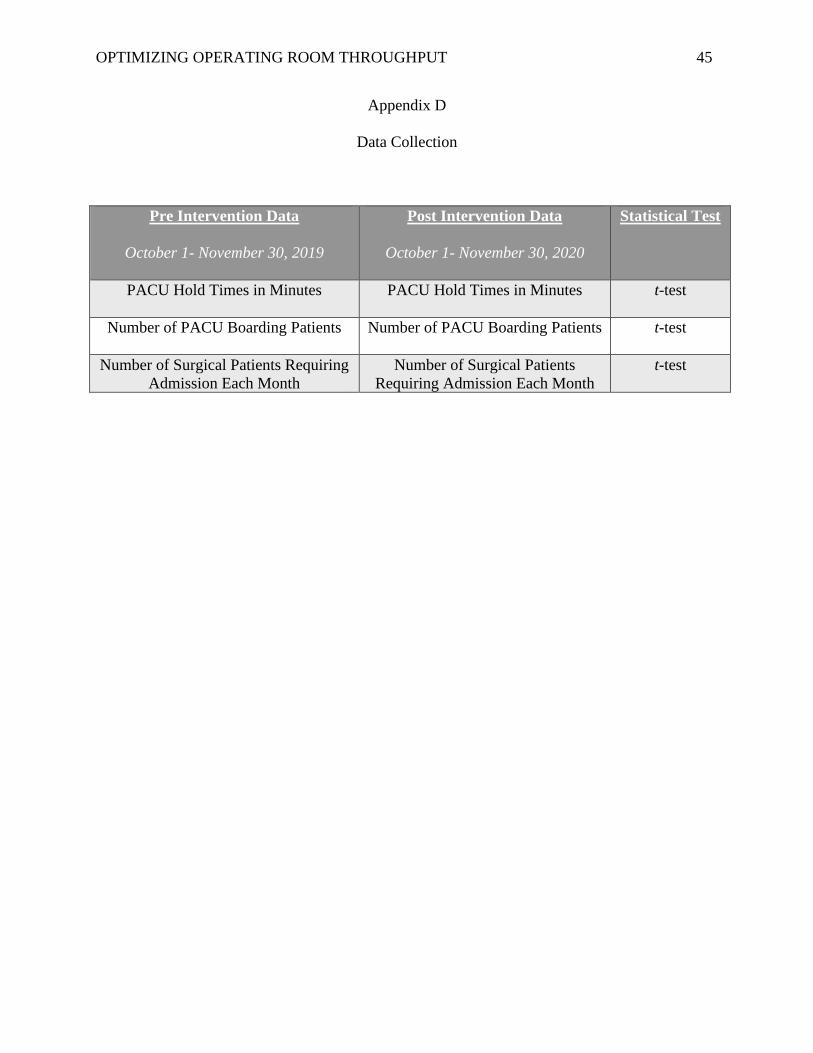
OPTIMIZING OPERATING ROOM THROUGHPUT 45
Appendix D
Data Collection
Pre Intervention Data
October 1- November 30, 2019
Post Intervention Data
October 1- November 30, 2020
Statistical Test
PACU Hold Times in Minutes PACU Hold Times in Minutes t-test
Number of PACU Boarding Patients Number of PACU Boarding Patients t-test
Number of Surgical Patients Requiring
Admission Each Month
Number of Surgical Patients
Requiring Admission Each Month
t-test
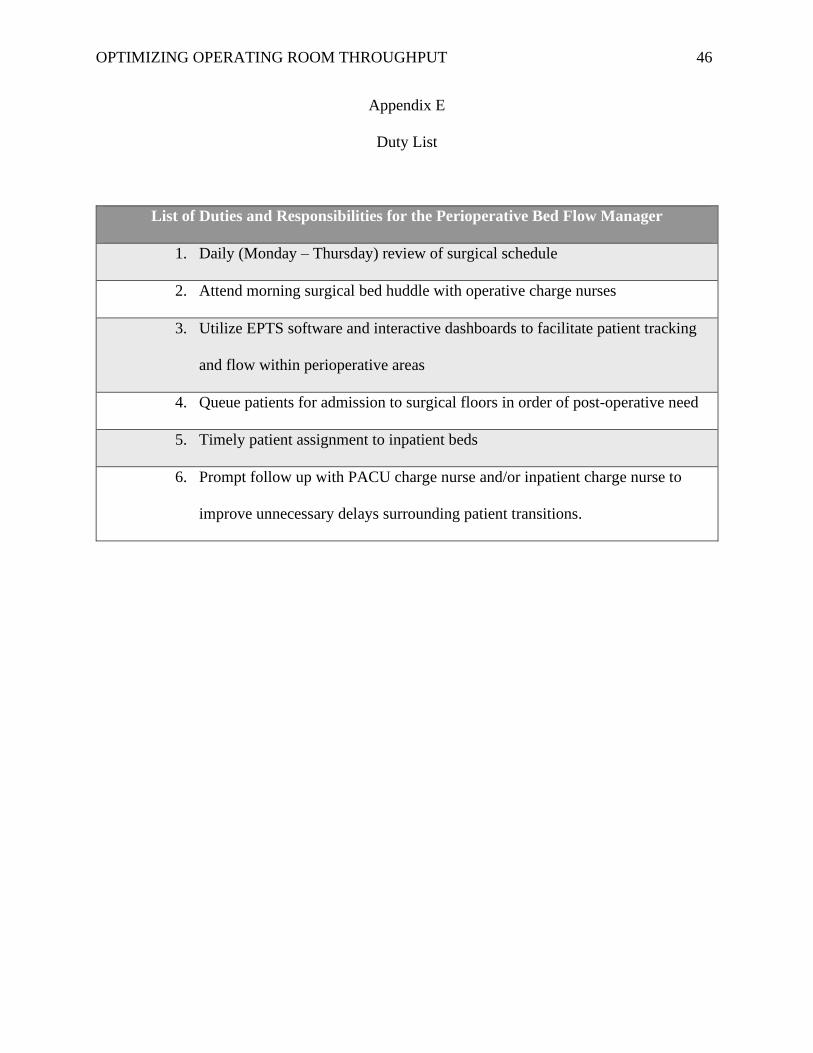
OPTIMIZING OPERATING ROOM THROUGHPUT 46
Appendix E
Duty List
List of Duties and Responsibilities for the Perioperative Bed Flow Manager
1. Daily (Monday – Thursday) review of surgical schedule
2. Attend morning surgical bed huddle with operative charge nurses
3. Utilize EPTS software and interactive dashboards to facilitate patient tracking
and flow within perioperative areas
4. Queue patients for admission to surgical floors in order of post-operative need
5. Timely patient assignment to inpatient beds
6. Prompt follow up with PACU charge nurse and/or inpatient charge nurse to
improve unnecessary delays surrounding patient transitions.