Embed Size (px)
Citation preview
© 2020 SCTE•ISBE and NCTA. All rights reserved. 1
Optimizing the 10G Transition to Full-Duplex DOCSIS® 4.0
A Technical Paper prepared for SCTE•ISBE by
Richard S Prodan, Ph.D. Engineering Fellow
Comcast Cable 1401 Wynkoop Street #300
720-512-3742 [email protected]
© 2020 SCTE•ISBE and NCTA. All rights reserved. 2
Table of Contents Title Page Number
1. Introduction .......................................................................................................................................... 4 2. Cable Network Design ........................................................................................................................ 4 3. The 10G Transition Path to Full-Duplex DOCSIS ............................................................................... 6 4. Preparing the Transition from Sub-Split to Mid-Split ........................................................................... 6 5. Completing the Transition to Mid-Split or Upgrading to High-Split ................................................... 13 6. Accomodating Legacy MoCA in 1.2 GHz System Upgrades ............................................................ 16 7. Upgrading to Full Duplex DOCSIS for the Node + 0 Architecture .................................................... 22 8. Optimizing Full Duplex Architecture and Operation .......................................................................... 26
8.1. FDX Modem Downstream Legacy Band Receive Power .................................................... 26 8.2. FDX Modem FDX Band Receive Power .............................................................................. 28 8.3. Signal-to-Echo Ratio Optimization ....................................................................................... 30
9. Conclusion ......................................................................................................................................... 33 Abbreviations .............................................................................................................................................. 35
Bibliography & References.......................................................................................................................... 36
List of Figures
Title Page Number Figure 1 – Conventional Node + N network architecture .............................................................................. 4 Figure 2 – RF Spectrum: Sub-Split STB Compatible – 750 MHz Plant ........................................................ 5 Figure 3 – RF Spectrum: Mid-Split – 750 MHz Plant .................................................................................... 5 Figure 4 – RF Spectrum: High-Split – 1 GHz Plant ...................................................................................... 5 Figure 5 – Remote PHY Architecture ............................................................................................................ 6 Figure 6 – In-home video and data connection to the cable plant ................................................................ 7 Figure 7 – Spurious emissions below diplex filter cut-off .............................................................................. 7 Figure 8 – Percentage of STBs ≤ CIR and CNIR........................................................................................ 10 Figure 9 – Node Sub-Split Video Transmit Power Boost in the Mid-Split Band ......................................... 12 Figure 10 – High-Split CM ACI into Neighbor Legacy STB ........................................................................ 14 Figure 11 – Percentage of STBs ≤ CACIR ................................................................................................. 16 Figure 12 – MoCA Non-Overlapping Channel & DOCSIS 3.1 Downstream Frequency Limit .................... 17 Figure 13 – MoCA 2.0 Field Trial Results of Percentage of Outlets vs. MAC Rate .................................... 18 Figure 14 – Analysis of MoCA Susceptibility into DOCSIS 3.1 ................................................................... 20 Figure 15 – MoCA 2.0 Transmitter to DOCSIS 3.1 Receiver RF Isolation ................................................. 21 Figure 16 – MoCA 2.0 in 1.1 mode Transmitter to DOCSIS 3.1 Receiver RF Isolation ............................. 21 Figure 17 – FDX Interference Analysis Model in the Node + 0 Network .................................................... 22 Figure 18 – Configurable FDX Allocated Spectrum Bandwidths ................................................................ 23 Figure 19 – RF Spectrum: FDX with Sub-Split, Mid-Split and High-Split – 1.1 GHz Plant ......................... 24 Figure 20 – RF Spectrum: FDX with Sub-Split, Mid-Split and High-Split – 1.2 GHz Plant ......................... 25 Figure 21 – RF Spectrum: Full FDX with Sub-Split, Mid-Split and High-Split – 1.2 GHz Plant (Compliant
with DOCSIS 4.0 Spec) ....................................................................................................................... 25 Figure 22 – RF Spectrum: Full FDX with Sub-Split, Mid-Split and High-Split – 1.2 GHz Plant (Non-
Compliant with DOCSIS 4.0 Spec) ..................................................................................................... 26
© 2020 SCTE•ISBE and NCTA. All rights reserved. 3
Figure 23 – Specification Topic, CPE Architecture: Option A vs Option B Discussion............................... 27 Figure 24 – CM Architecture with Filter Response Avoiding Legacy Downstream Loss ............................ 27 Figure 25 – FDX Remote PHY Node Functional Block Diagram ................................................................ 28 Figure 26 – FDX Node RF Level with FDX Band Downstream Level Boosted +7 dB ................................ 29 Figure 27 – FDX Node RF Level with FDX Band Downstream Level Boosted +4 dB ................................ 29 Figure 28 – Upstream Node Signal/Interference Ratio vs FDX Downstream Band PSD Boost (Top:
+4 dB Boost, Middle: No Boost – Linear, Bottom: -4 dB Attenuation) ................................................ 31 Figure 29 – Downstream CM Signal/Interference Ratio vs FDX Downstream Band PSD Boost (Top:
+4 dB Boost, Middle: No Boost – Linear, Bottom: -4 dB Attenuation) ................................................ 32
List of Tables Title Page Number Table 1 – Mid-Split Spurious Emissions of Sub-Split Upstream Carriers ..................................................... 8 Table 2 – Set-Top Box Video Interference Threshold .................................................................................. 8 Table 3 – Analysis of Percentage of STBs Below Threshold SNR ............................................................. 11 Table 4 – Analysis of Percentage of STBs Below Threshold SNR with 6 dB Power Boost ....................... 12 Table 5 – High-Split CM Carrier/ACI Ratio at STB Impaired Video Threshold ........................................... 14 Table 6 – Analysis of Percentage of STBs Below Video Threshold CACIR ............................................... 15 Table 7 – MoCA Extended Band D Frequency Plan .................................................................................. 18 Table 8 – DOCSIS 3.1 RF Specifications ................................................................................................... 19 Table 9 – MoCA RF Specifications ............................................................................................................. 19
© 2020 SCTE•ISBE and NCTA. All rights reserved. 4
1. Introduction Comcast has been deploying optical fiber deeper into its infrastructure, in “Node + 0” /, “N+0” mid-split configurations to support the ever-increasing demand for higher speeds and throughput to customers. The first step was the transition from traditional Node + N sub-split networks, with 5 to 42 MHz upstream and 1002 MHz downstream bandwidth, to current mid-split Node + 0 networks with 5 to 85 MHz upstream and 1218 MHz downstream bandwidth.
Future Node + 0 networks will transition to Full-Duplex (FDX) DOCSIS, to significantly increase the upstream bandwidth to multi-gigabit speeds with high throughput. This will not be accomplished in one giant leap, but rather a transition from mid-split to high-split networks. The first step will be a shift to a 5 to 204 MHz upstream and 1218 MHz downstream bandwidth, supporting a 1 Gbps upstream tier and multi-Gbps downstream. As demand for multi-gigabit services grows, FDX can be deployed, with overlapping bidirectional spectrum from 108 to 204 MHz that eventually increases up to the full 108 to 684 MHz FDX limit plus legacy DOCSIS 3.0 to the 1002 MHz limit and legacy DOCSIS 3.1to the 1218 MHz limit.
This paper will discuss considerations that need to be addressed in the transition. Scenarios will be described, as well as some node and modem architectures that provide flexible signal support to optimize the end-to-end performance, toward 10G Full-Duplex operation of the network.
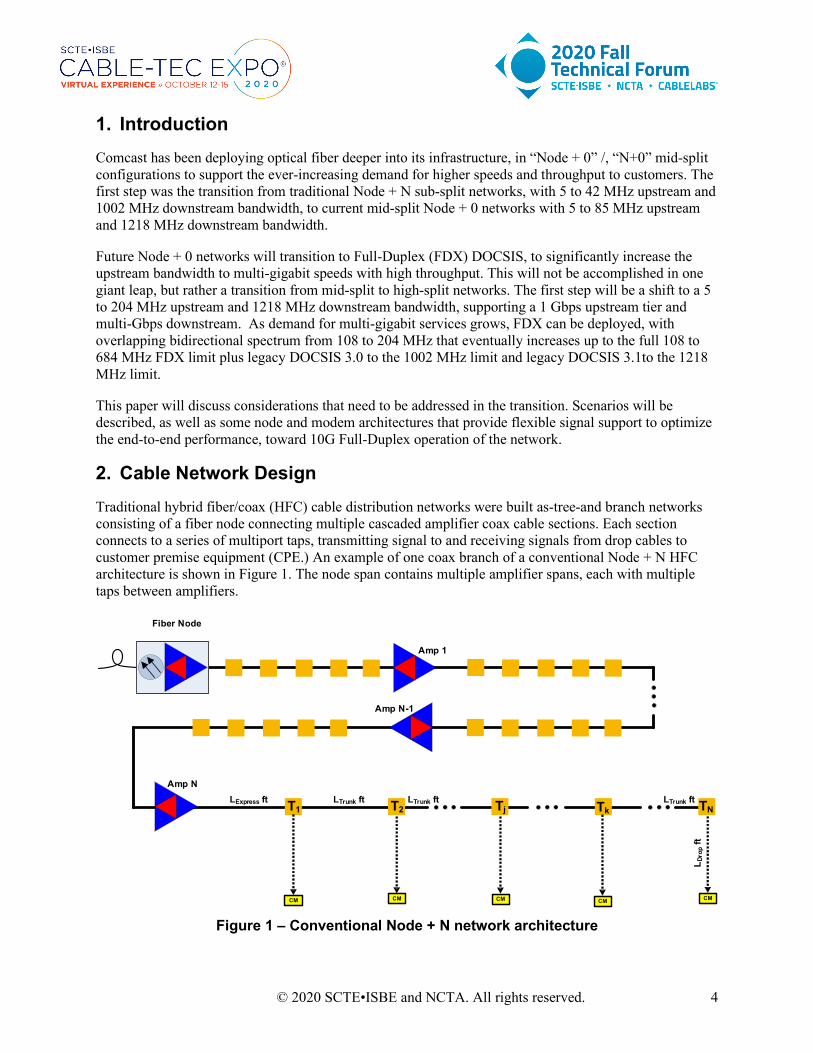
2. Cable Network Design Traditional hybrid fiber/coax (HFC) cable distribution networks were built as-tree-and branch networks consisting of a fiber node connecting multiple cascaded amplifier coax cable sections. Each section connects to a series of multiport taps, transmitting signal to and receiving signals from drop cables to customer premise equipment (CPE.) An example of one coax branch of a conventional Node + N HFC architecture is shown in Figure 1. The node span contains multiple amplifier spans, each with multiple taps between amplifiers.
Figure 1 – Conventional Node + N network architecture
Fiber Node
Amp N
Amp N-1
Amp 1
T2 Tj Tk TN
L Dro
p ft
LExpress ft LTrunk ftT1
CM CM CM
LTrunk ft LTrunk ft
CMCM
© 2020 SCTE•ISBE and NCTA. All rights reserved. 5
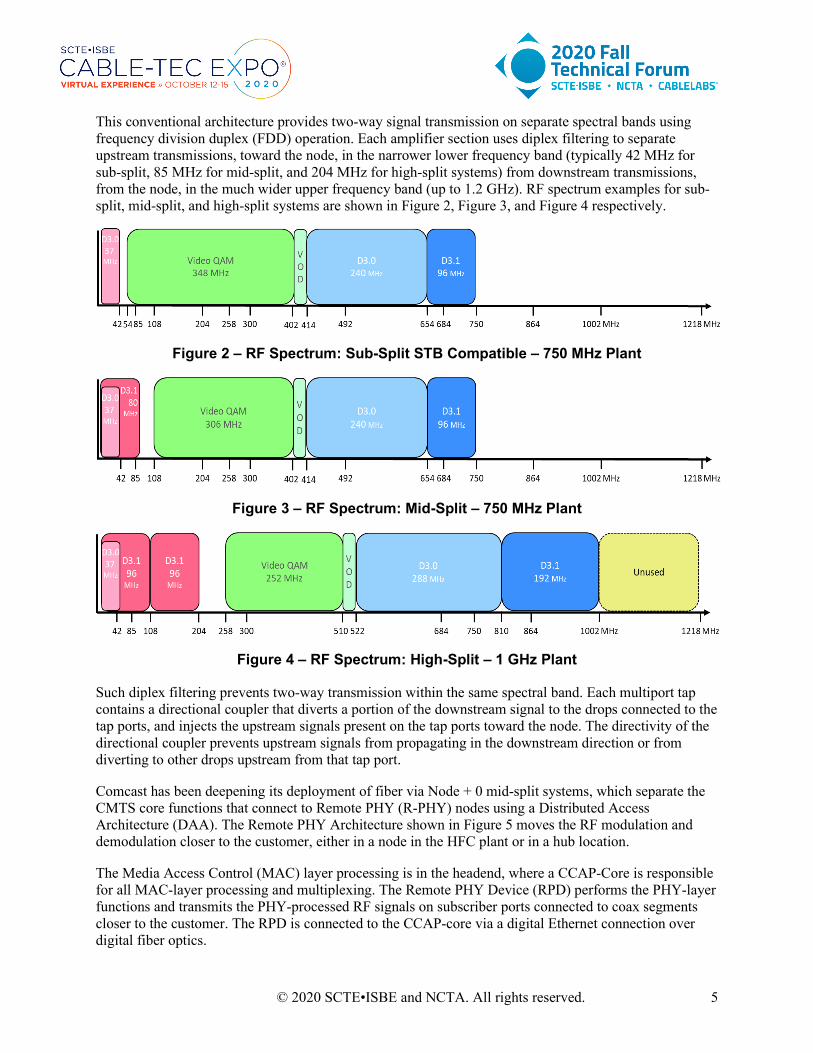
This conventional architecture provides two-way signal transmission on separate spectral bands using frequency division duplex (FDD) operation. Each amplifier section uses diplex filtering to separate upstream transmissions, toward the node, in the narrower lower frequency band (typically 42 MHz for sub-split, 85 MHz for mid-split, and 204 MHz for high-split systems) from downstream transmissions, from the node, in the much wider upper frequency band (up to 1.2 GHz). RF spectrum examples for sub-split, mid-split, and high-split systems are shown in Figure 2, Figure 3, and Figure 4 respectively.
Figure 2 – RF Spectrum: Sub-Split STB Compatible – 750 MHz Plant
Figure 3 – RF Spectrum: Mid-Split – 750 MHz Plant
Figure 4 – RF Spectrum: High-Split – 1 GHz Plant
Such diplex filtering prevents two-way transmission within the same spectral band. Each multiport tap contains a directional coupler that diverts a portion of the downstream signal to the drops connected to the tap ports, and injects the upstream signals present on the tap ports toward the node. The directivity of the directional coupler prevents upstream signals from propagating in the downstream direction or from diverting to other drops upstream from that tap port.
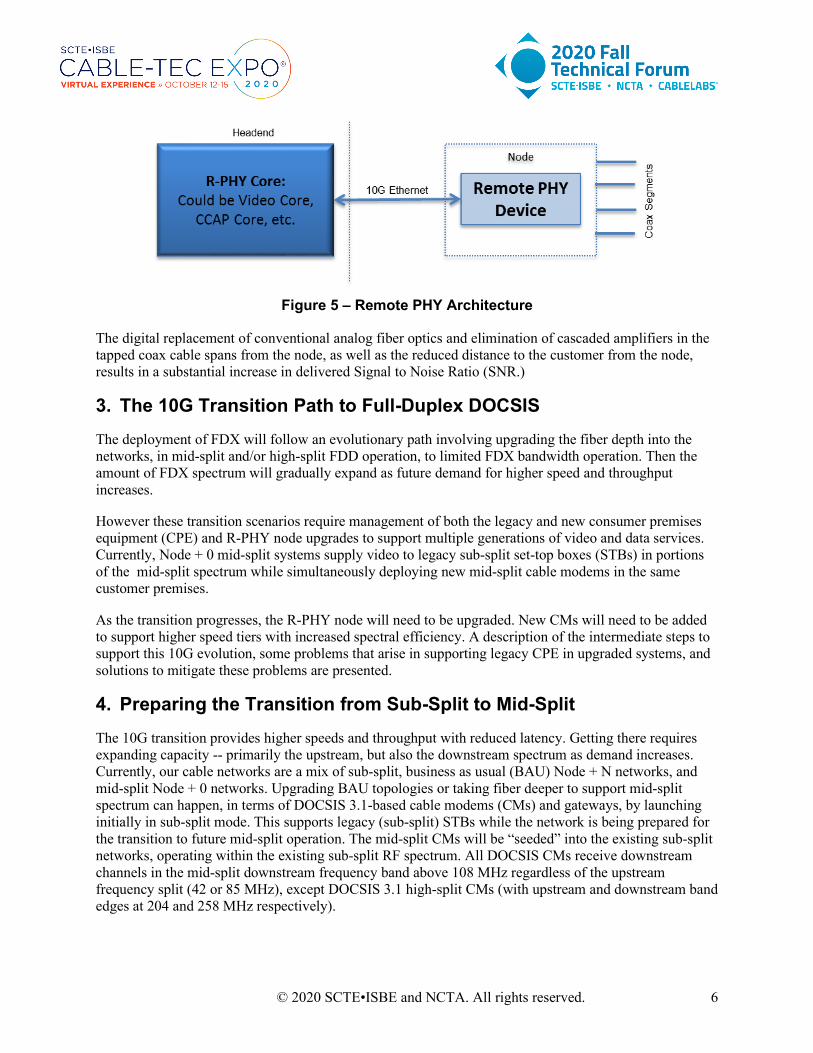
Comcast has been deepening its deployment of fiber via Node + 0 mid-split systems, which separate the CMTS core functions that connect to Remote PHY (R-PHY) nodes using a Distributed Access Architecture (DAA). The Remote PHY Architecture shown in Figure 5 moves the RF modulation and demodulation closer to the customer, either in a node in the HFC plant or in a hub location.
The Media Access Control (MAC) layer processing is in the headend, where a CCAP-Core is responsible for all MAC-layer processing and multiplexing. The Remote PHY Device (RPD) performs the PHY-layer functions and transmits the PHY-processed RF signals on subscriber ports connected to coax segments closer to the customer. The RPD is connected to the CCAP-core via a digital Ethernet connection over digital fiber optics.
© 2020 SCTE•ISBE and NCTA. All rights reserved. 6
Figure 5 – Remote PHY Architecture
The digital replacement of conventional analog fiber optics and elimination of cascaded amplifiers in the tapped coax cable spans from the node, as well as the reduced distance to the customer from the node, results in a substantial increase in delivered Signal to Noise Ratio (SNR.)
3. The 10G Transition Path to Full-Duplex DOCSIS The deployment of FDX will follow an evolutionary path involving upgrading the fiber depth into the networks, in mid-split and/or high-split FDD operation, to limited FDX bandwidth operation. Then the amount of FDX spectrum will gradually expand as future demand for higher speed and throughput increases.
However these transition scenarios require management of both the legacy and new consumer premises equipment (CPE) and R-PHY node upgrades to support multiple generations of video and data services. Currently, Node + 0 mid-split systems supply video to legacy sub-split set-top boxes (STBs) in portions of the mid-split spectrum while simultaneously deploying new mid-split cable modems in the same customer premises.
As the transition progresses, the R-PHY node will need to be upgraded. New CMs will need to be added to support higher speed tiers with increased spectral efficiency. A description of the intermediate steps to support this 10G evolution, some problems that arise in supporting legacy CPE in upgraded systems, and solutions to mitigate these problems are presented.
4. Preparing the Transition from Sub-Split to Mid-Split The 10G transition provides higher speeds and throughput with reduced latency. Getting there requires expanding capacity -- primarily the upstream, but also the downstream spectrum as demand increases. Currently, our cable networks are a mix of sub-split, business as usual (BAU) Node + N networks, and mid-split Node + 0 networks. Upgrading BAU topologies or taking fiber deeper to support mid-split spectrum can happen, in terms of DOCSIS 3.1-based cable modems (CMs) and gateways, by launching initially in sub-split mode. This supports legacy (sub-split) STBs while the network is being prepared for the transition to future mid-split operation. The mid-split CMs will be “seeded” into the existing sub-split networks, operating within the existing sub-split RF spectrum. All DOCSIS CMs receive downstream channels in the mid-split downstream frequency band above 108 MHz regardless of the upstream frequency split (42 or 85 MHz), except DOCSIS 3.1 high-split CMs (with upstream and downstream band edges at 204 and 258 MHz respectively).
© 2020 SCTE•ISBE and NCTA. All rights reserved. 7
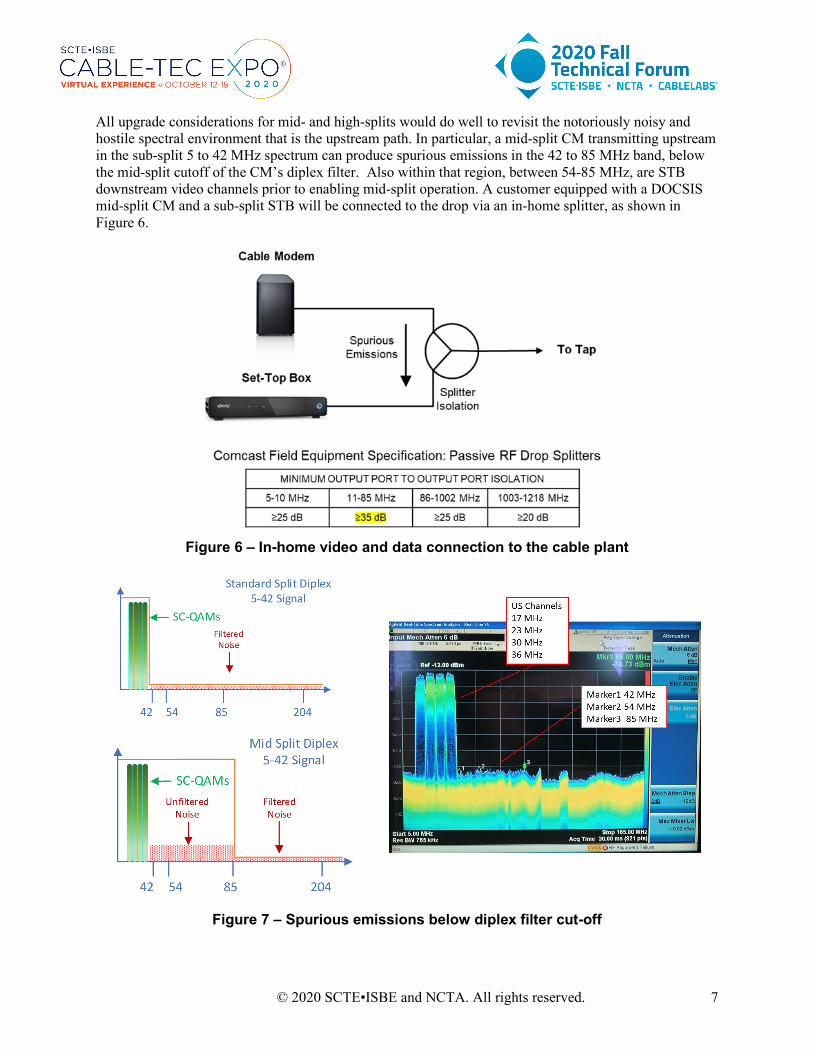
All upgrade considerations for mid- and high-splits would do well to revisit the notoriously noisy and hostile spectral environment that is the upstream path. In particular, a mid-split CM transmitting upstream in the sub-split 5 to 42 MHz spectrum can produce spurious emissions in the 42 to 85 MHz band, below the mid-split cutoff of the CM’s diplex filter. Also within that region, between 54-85 MHz, are STB downstream video channels prior to enabling mid-split operation. A customer equipped with a DOCSIS mid-split CM and a sub-split STB will be connected to the drop via an in-home splitter, as shown in Figure 6.
Figure 6 – In-home video and data connection to the cable plant
Figure 7 – Spurious emissions below diplex filter cut-off
© 2020 SCTE•ISBE and NCTA. All rights reserved. 8
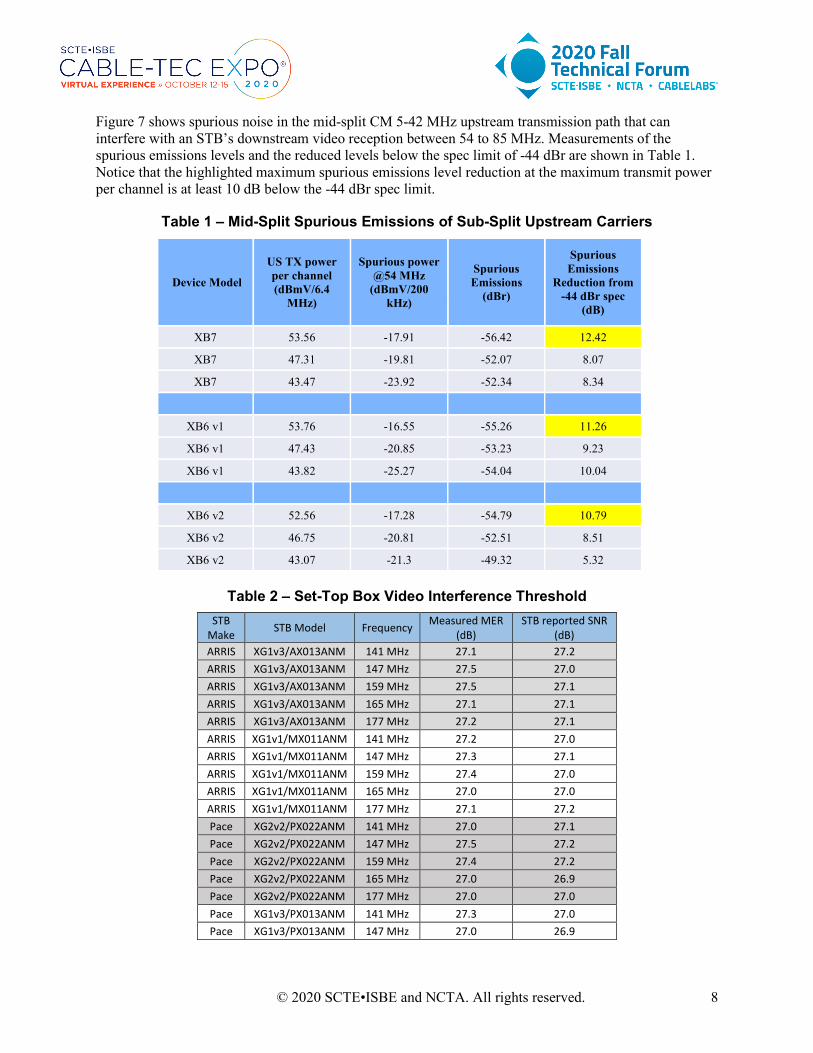
Figure 7 shows spurious noise in the mid-split CM 5-42 MHz upstream transmission path that can interfere with an STB’s downstream video reception between 54 to 85 MHz. Measurements of the spurious emissions levels and the reduced levels below the spec limit of -44 dBr are shown in Table 1. Notice that the highlighted maximum spurious emissions level reduction at the maximum transmit power per channel is at least 10 dB below the -44 dBr spec limit.
Table 1 – Mid-Split Spurious Emissions of Sub-Split Upstream Carriers
Device Model
US TX power per channel (dBmV/6.4
MHz)
Spurious power @54 MHz
(dBmV/200 kHz)
Spurious Emissions
(dBr)
Spurious Emissions
Reduction from -44 dBr spec
(dB)
XB7 53.56 -17.91 -56.42 12.42
XB7 47.31 -19.81 -52.07 8.07
XB7 43.47 -23.92 -52.34 8.34
XB6 v1 53.76 -16.55 -55.26 11.26
XB6 v1 47.43 -20.85 -53.23 9.23
XB6 v1 43.82 -25.27 -54.04 10.04
XB6 v2 52.56 -17.28 -54.79 10.79
XB6 v2 46.75 -20.81 -52.51 8.51
XB6 v2 43.07 -21.3 -49.32 5.32
Table 2 – Set-Top Box Video Interference Threshold STB
Make STB Model Frequency Measured MER (dB)
STB reported SNR (dB)
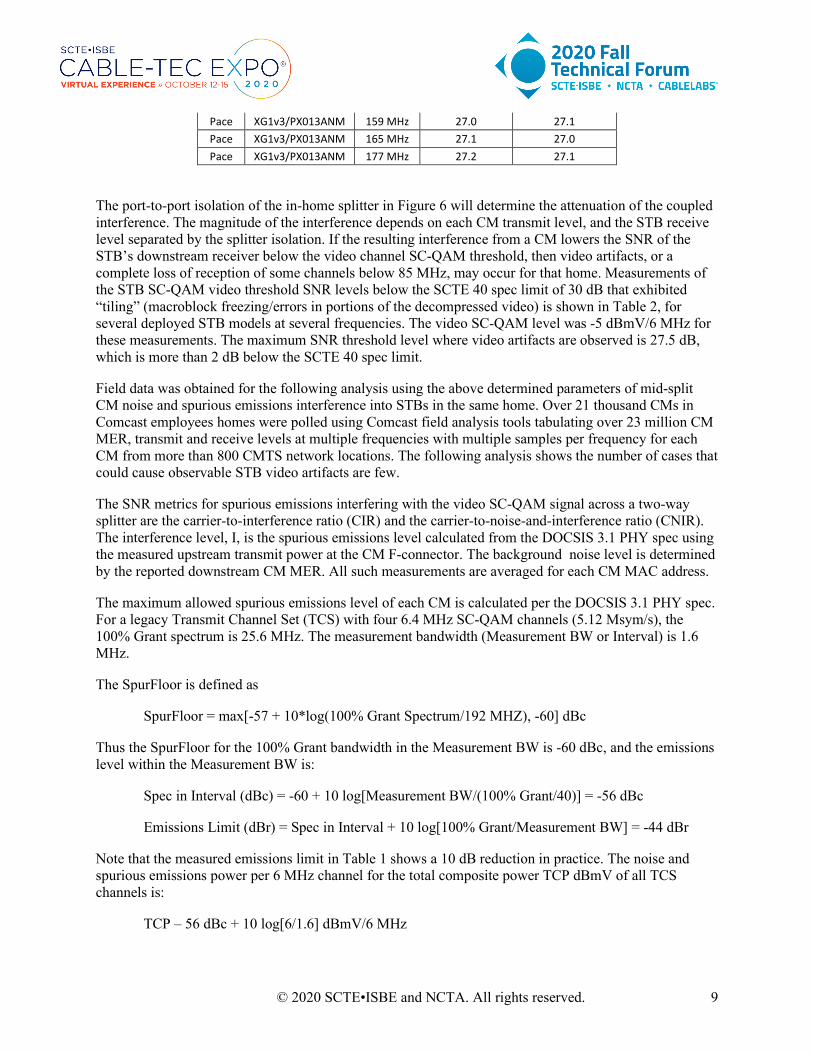
ARRIS XG1v3/AX013ANM 141 MHz 27.1 27.2 ARRIS XG1v3/AX013ANM 147 MHz 27.5 27.0 ARRIS XG1v3/AX013ANM 159 MHz 27.5 27.1 ARRIS XG1v3/AX013ANM 165 MHz 27.1 27.1 ARRIS XG1v3/AX013ANM 177 MHz 27.2 27.1 ARRIS XG1v1/MX011ANM 141 MHz 27.2 27.0 ARRIS XG1v1/MX011ANM 147 MHz 27.3 27.1 ARRIS XG1v1/MX011ANM 159 MHz 27.4 27.0 ARRIS XG1v1/MX011ANM 165 MHz 27.0 27.0 ARRIS XG1v1/MX011ANM 177 MHz 27.1 27.2 Pace XG2v2/PX022ANM 141 MHz 27.0 27.1 Pace XG2v2/PX022ANM 147 MHz 27.5 27.2 Pace XG2v2/PX022ANM 159 MHz 27.4 27.2 Pace XG2v2/PX022ANM 165 MHz 27.0 26.9 Pace XG2v2/PX022ANM 177 MHz 27.0 27.0 Pace XG1v3/PX013ANM 141 MHz 27.3 27.0 Pace XG1v3/PX013ANM 147 MHz 27.0 26.9
© 2020 SCTE•ISBE and NCTA. All rights reserved. 9
Pace XG1v3/PX013ANM 159 MHz 27.0 27.1 Pace XG1v3/PX013ANM 165 MHz 27.1 27.0 Pace XG1v3/PX013ANM 177 MHz 27.2 27.1
The port-to-port isolation of the in-home splitter in Figure 6 will determine the attenuation of the coupled interference. The magnitude of the interference depends on each CM transmit level, and the STB receive level separated by the splitter isolation. If the resulting interference from a CM lowers the SNR of the STB’s downstream receiver below the video channel SC-QAM threshold, then video artifacts, or a complete loss of reception of some channels below 85 MHz, may occur for that home. Measurements of the STB SC-QAM video threshold SNR levels below the SCTE 40 spec limit of 30 dB that exhibited “tiling” (macroblock freezing/errors in portions of the decompressed video) is shown in Table 2, for several deployed STB models at several frequencies. The video SC-QAM level was -5 dBmV/6 MHz for these measurements. The maximum SNR threshold level where video artifacts are observed is 27.5 dB, which is more than 2 dB below the SCTE 40 spec limit.
Field data was obtained for the following analysis using the above determined parameters of mid-split CM noise and spurious emissions interference into STBs in the same home. Over 21 thousand CMs in Comcast employees homes were polled using Comcast field analysis tools tabulating over 23 million CM MER, transmit and receive levels at multiple frequencies with multiple samples per frequency for each CM from more than 800 CMTS network locations. The following analysis shows the number of cases that could cause observable STB video artifacts are few.
The SNR metrics for spurious emissions interfering with the video SC-QAM signal across a two-way splitter are the carrier-to-interference ratio (CIR) and the carrier-to-noise-and-interference ratio (CNIR). The interference level, I, is the spurious emissions level calculated from the DOCSIS 3.1 PHY spec using the measured upstream transmit power at the CM F-connector. The background noise level is determined by the reported downstream CM MER. All such measurements are averaged for each CM MAC address.
The maximum allowed spurious emissions level of each CM is calculated per the DOCSIS 3.1 PHY spec. For a legacy Transmit Channel Set (TCS) with four 6.4 MHz SC-QAM channels (5.12 Msym/s), the 100% Grant spectrum is 25.6 MHz. The measurement bandwidth (Measurement BW or Interval) is 1.6 MHz.
The SpurFloor is defined as
SpurFloor = max[-57 + 10*log(100% Grant Spectrum/192 MHZ), -60] dBc
Thus the SpurFloor for the 100% Grant bandwidth in the Measurement BW is -60 dBc, and the emissions level within the Measurement BW is:
Spec in Interval (dBc) = -60 + 10 log[Measurement BW/(100% Grant/40)] = -56 dBc
Emissions Limit (dBr) = Spec in Interval + 10 log[100% Grant/Measurement BW] = -44 dBr
Note that the measured emissions limit in Table 1 shows a 10 dB reduction in practice. The noise and spurious emissions power per 6 MHz channel for the total composite power TCP dBmV of all TCS channels is:
TCP – 56 dBc + 10 log[6/1.6] dBmV/6 MHz
© 2020 SCTE•ISBE and NCTA. All rights reserved. 10
The data analysis method is as follows:
Calculate the average MER, transmit and receive level for each modem over all upstream and downstream frequencies per MAC address.
Calculate the average emissions level for each average transmit level for each CM MAC address.
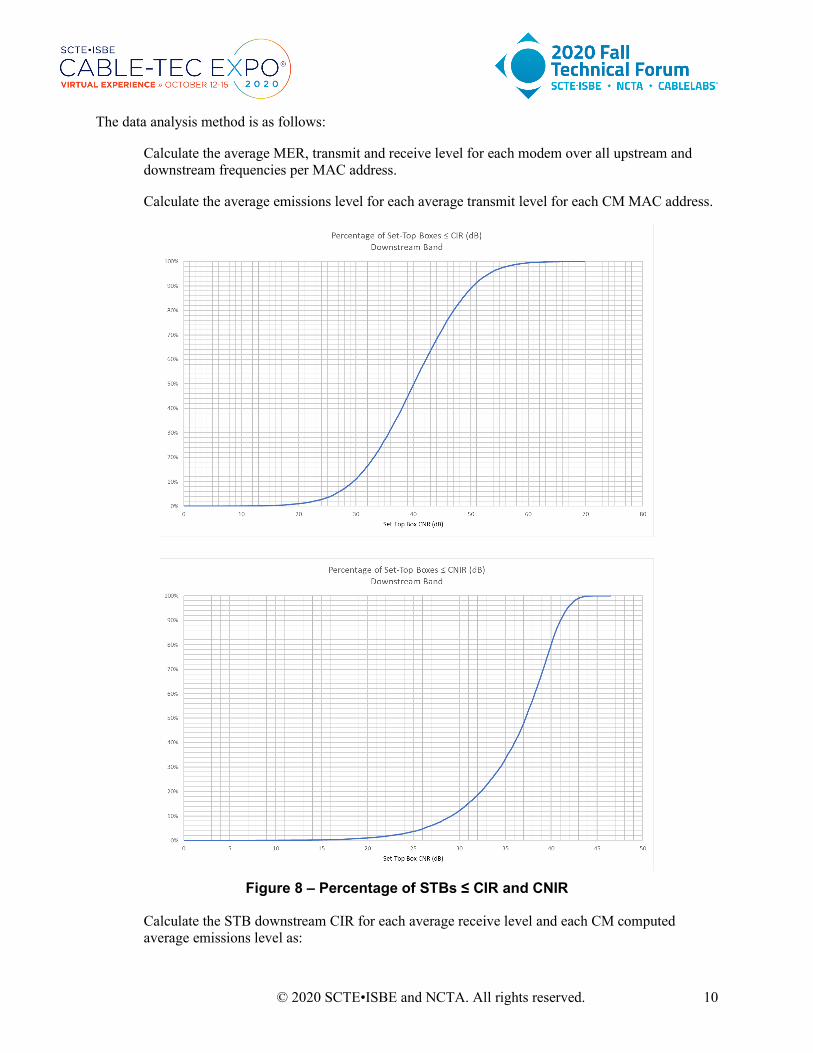
Figure 8 – Percentage of STBs ≤ CIR and CNIR
Calculate the STB downstream CIR for each average receive level and each CM computed average emissions level as:
© 2020 SCTE•ISBE and NCTA. All rights reserved. 11
CIR = DS Average Receive – US Average Emissions + Splitter Isolation CNIR = -10 log(10-CIR/10 + 10-MER/10).
Sort the calculated STB CIR and CNIR levels in ascending order (plotted in Figure 8).
Calculate the percentage of CMs ≤ each STB CIR and CNIR level as:
%CMs ≤ CIR value = Number of CIR entries ≤ CIR / Total Number of CIR values*100 %CMs ≤ CNIR value = Number of CNIR entries ≤ CNIR / Total Number of CNIR values*100
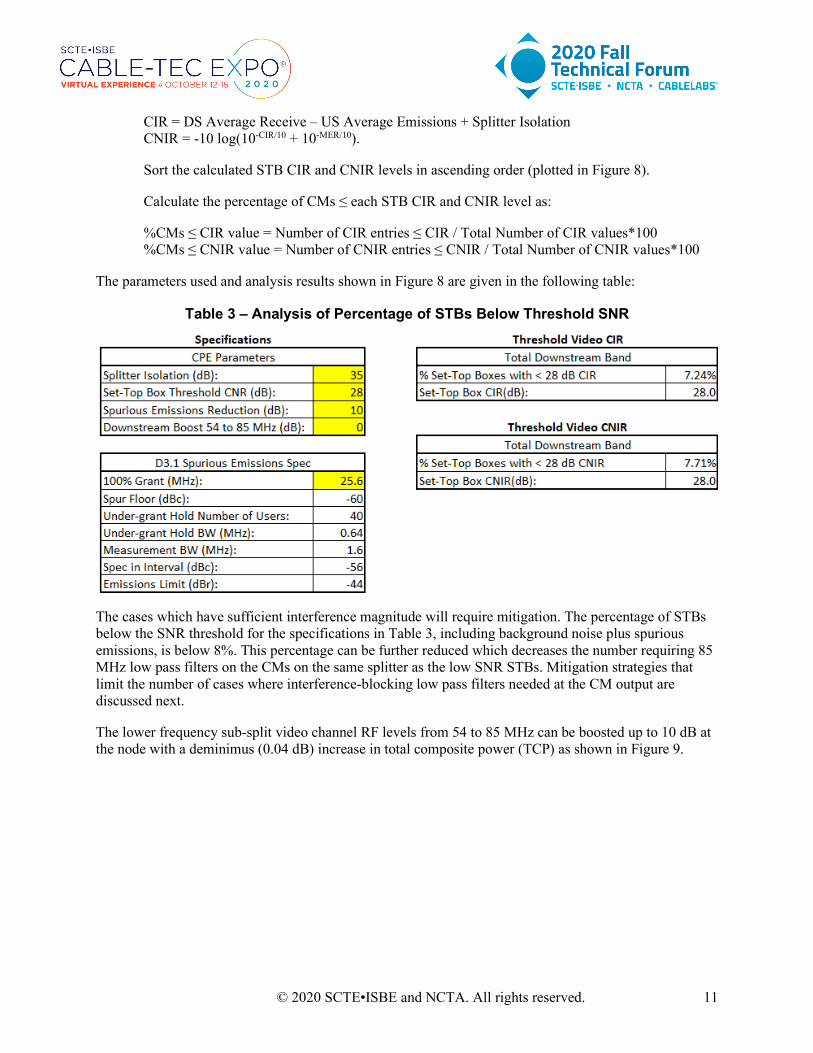
The parameters used and analysis results shown in Figure 8 are given in the following table:
Table 3 – Analysis of Percentage of STBs Below Threshold SNR
The cases which have sufficient interference magnitude will require mitigation. The percentage of STBs below the SNR threshold for the specifications in Table 3, including background noise plus spurious emissions, is below 8%. This percentage can be further reduced which decreases the number requiring 85 MHz low pass filters on the CMs on the same splitter as the low SNR STBs. Mitigation strategies that limit the number of cases where interference-blocking low pass filters needed at the CM output are discussed next.
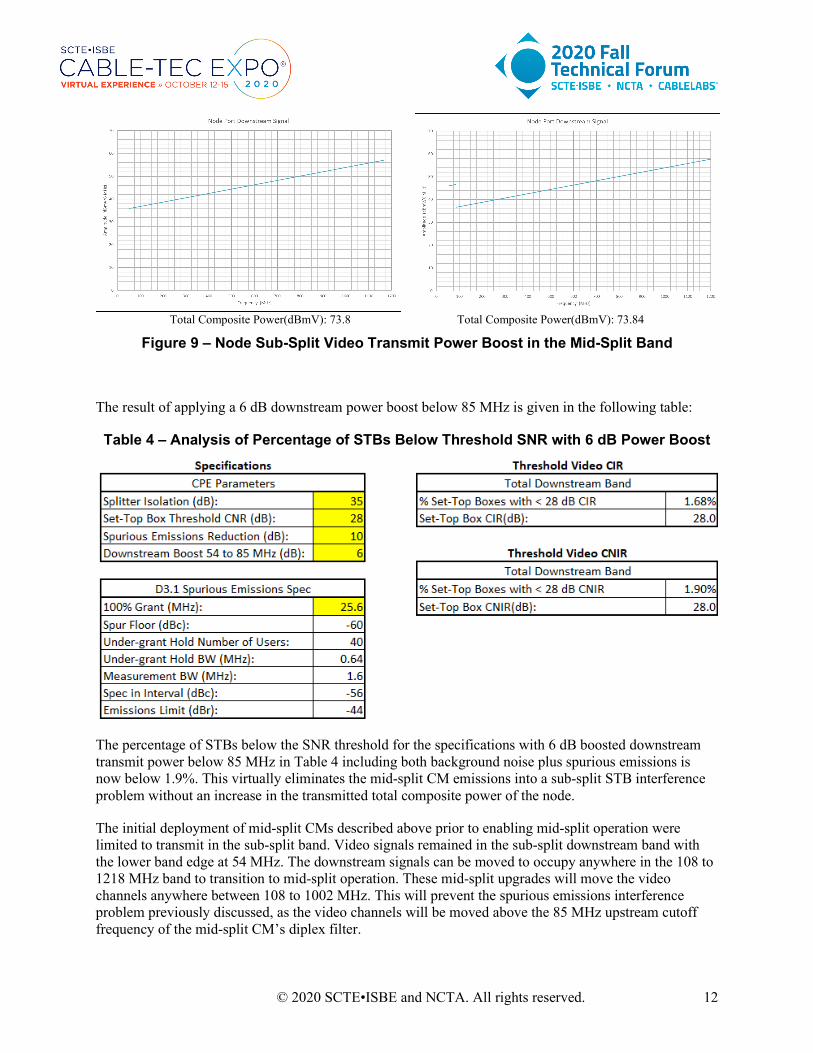
The lower frequency sub-split video channel RF levels from 54 to 85 MHz can be boosted up to 10 dB at the node with a deminimus (0.04 dB) increase in total composite power (TCP) as shown in Figure 9.
© 2020 SCTE•ISBE and NCTA. All rights reserved. 12
Total Composite Power(dBmV): 73.8 Total Composite Power(dBmV): 73.84
Figure 9 – Node Sub-Split Video Transmit Power Boost in the Mid-Split Band
The result of applying a 6 dB downstream power boost below 85 MHz is given in the following table:
Table 4 – Analysis of Percentage of STBs Below Threshold SNR with 6 dB Power Boost
The percentage of STBs below the SNR threshold for the specifications with 6 dB boosted downstream transmit power below 85 MHz in Table 4 including both background noise plus spurious emissions is now below 1.9%. This virtually eliminates the mid-split CM emissions into a sub-split STB interference problem without an increase in the transmitted total composite power of the node.
The initial deployment of mid-split CMs described above prior to enabling mid-split operation were limited to transmit in the sub-split band. Video signals remained in the sub-split downstream band with the lower band edge at 54 MHz. The downstream signals can be moved to occupy anywhere in the 108 to 1218 MHz band to transition to mid-split operation. These mid-split upgrades will move the video channels anywhere between 108 to 1002 MHz. This will prevent the spurious emissions interference problem previously discussed, as the video channels will be moved above the 85 MHz upstream cutoff frequency of the mid-split CM’s diplex filter.
© 2020 SCTE•ISBE and NCTA. All rights reserved. 13
However, the sub-split STBs will encounter a different problem after the transition enabling mid-split operation or when upgrading to high-split operation. This is discussed in the next section.
5. Completing the Transition to Mid-Split or Upgrading to High-Split Node + 0 networks have been and continue to be deployed in a mid-split frequency division duplex (FDD) configuration, where upstream signals can occupy the 5 to 85 MHz band and downstream signals can occupy the 108 to 1218 MHz band. This will increase the upper frequency limit of the upstream signal path from the Node + N sub-split 42 MHz limit, to 85 MHz. This represents more than a 2x (43 MHz) increase, and an increase in capacity by more than 2x when CPE based on DOCSIS 3.1 1024-QAM OFDMA replacing CPE based on DOCSIS 3.0 64-QAM SC-QAM in the additional 43 MHz bandwidth, for over 500 Mbps total throughput.
The next upgrade transition will be to high-split networks, with upstream signals occupying the 5 to 204 MHz band. That yields an additional 119 MHz of upstream bandwidth, for over 1.5 Gbps total throughput. The downstream signals can occupy the 258 to 1218 MHz band. These high-split upgrades will move the video channels above 258 MHz prior to enabling high-split operation. This will prevent the spurious emissions interference problem previously discussed, as the video channels will be moved above the upstream cutoff frequency of the CM’s diplex filter.
However, the legacy STBs will still have a sub-split diplex filter instead of the upgraded CM high-split diplex filter. Thus the cutoff frequency (54 MHz) of the sub-split STB’s diplex filter will see signals in the 54 to 204 MHz upstream band from the high-split CMs. These signals will be adjacent to the 258 MHz-and-above STB video channels. If the CM’s transmit power adjacent to the downstream video channels is strong enough, this can cause adjacent channel interference (ACI) which could impair the STB-delivered video channels.
This ACI scenario will also occur in the transition to mid-split operation previously described, but in the 54 to 85 MHz upstream band from the mid-split CMs. These signals will be adjacent to the 108 MHz-and-above STB video channels. The ACI power will be lower for the same power spectral density as the upstream bandwidth is limited to 85 MHz in the mid-split case. The total ACI power will be less than one-third of the high-split ACI power. Thus neighbor video interference is much less likely for mid-split operation.
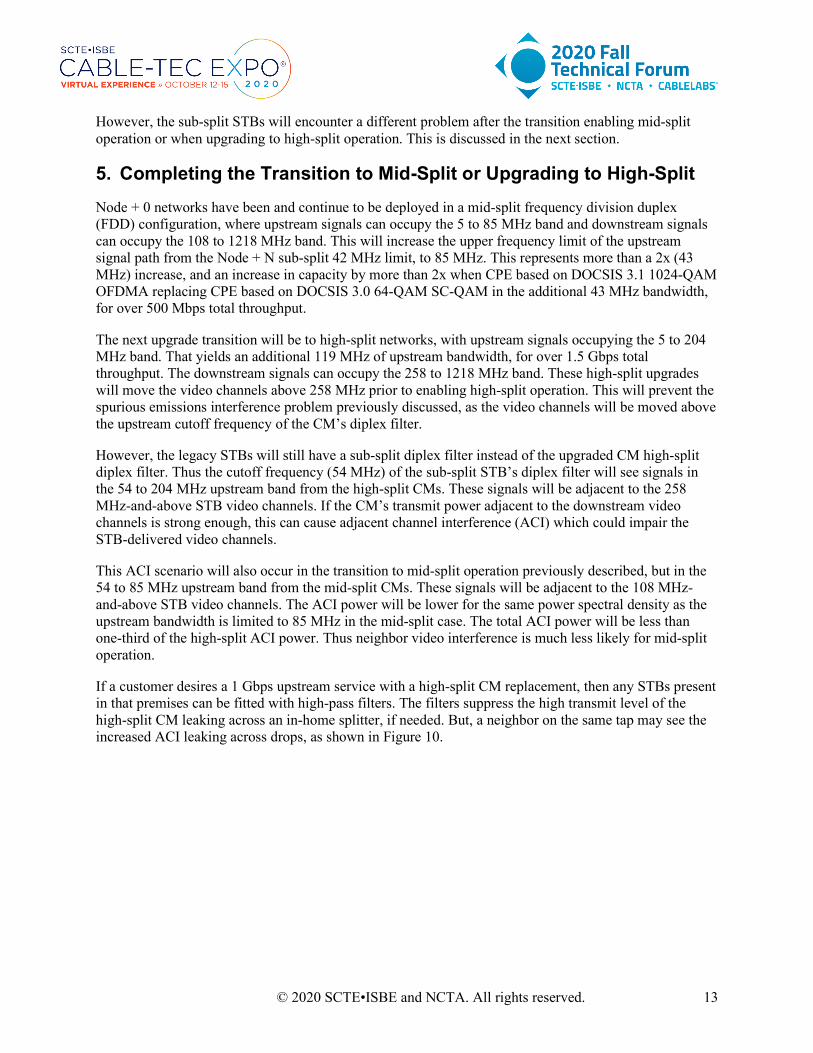
If a customer desires a 1 Gbps upstream service with a high-split CM replacement, then any STBs present in that premises can be fitted with high-pass filters. The filters suppress the high transmit level of the high-split CM leaking across an in-home splitter, if needed. But, a neighbor on the same tap may see the increased ACI leaking across drops, as shown in Figure 10.
© 2020 SCTE•ISBE and NCTA. All rights reserved. 14
Figure 10 – High-Split CM ACI into Neighbor Legacy STB
Table 5 – High-Split CM Carrier/ACI Ratio at STB Impaired Video Threshold Model Measured Peak Power of
Interferer (dBmV/96 MHz) Measured Delta Peak to 6 MHz Video SC-QAM (dBc)
Corrected Power Delta (dBc)
Downstream Power (dBmV/6 MHz)
RNG150CNM 27.95 -34.5 -22.5 -5 DCT700 27.12 -35.79 -23.79 -5 DC50Xu 30.1 -36.27 -24.27 -5 SARNG100 26.35 -32.52 -20.52 -5 DC60Xu 29.17 -35.78 -23.78 -5 HD-DTA100u 28.36 -38.26 -26.26 -5
AX013ANM 30.03 -36.17 -24.17 -5 PX013ANM 30.01 -35.99 -23.99 -5 PX022ANM 28.98 -38.16 -26.16 -5 DCT2524 31.08 -37.85 -25.85 -5 DCX3200 25.09 -32.58 -20.58 -5 RNG110C 30.71 -37.82 -25.82 -5
RNG110RF 28.14 -35.62 -23.62 -5 DCI105COM 27.35 -36.08 -24.08 -5
The port-to-port isolation of the tap, plus the drop cable and in-home splitter insertion losses in Figure 10, determines the path loss between neighbors, which determines the attenuation of the CM-coupled ACI. The magnitude of the interference depends on each CM’s transmit level, and the STB’s receive level separated by this path loss. If the resulting ACI level from a CM exceeds the STB downstream receiver susceptibility threshold, then video artifacts or complete loss of reception of some channels above 258 MHz (that are adjacent to the CM’s upstream transmit signal interference below 204 MHz) may occur for that customer. Measurements of the STB Carrier/ACI Ratio (CACIR) video threshold levels that exhibited “tiling” (macroblock freezing/errors in portions of the decompressed video) are shown in Table
© 2020 SCTE•ISBE and NCTA. All rights reserved. 15
5 for several deployed STB models at several frequencies. The video SC-QAM receive level was -5 dBmV/6 MHz for these measurements. The maximum CACIR STB threshold level where video artifacts are observed is below -20 dB across all models tested.
The same 23 million CM transmit and receive level statistics from the field are used for the analysis of the percentage of STBs with CM ACI resulting in CACIR below the -20 dB threshold of impaired video reception. The following analysis shows an estimated upper bound on the number of cases which have sufficient CM interference magnitude impairing STB video reception.
The data analysis method is as follows:
Calculate the average transmit and receive level per channel for each modem (per MAC address) over all upstream and downstream frequencies.
Estimate the isolation between neighbors (i.e. path loss Ploss) as: Ploss = Tap Port-to-Port Isolation + 2*(Drop Cable Attenuation + Splitter Insertion Loss)
Calculate the average ACI level for each average transmit level for each CM MAC address as: ACI = CM Transmit Level - Ploss
Calculate the STB CACIR for each average downstream receive level and average upstream transmit level as: CACIR = CM Receive Level - ACI
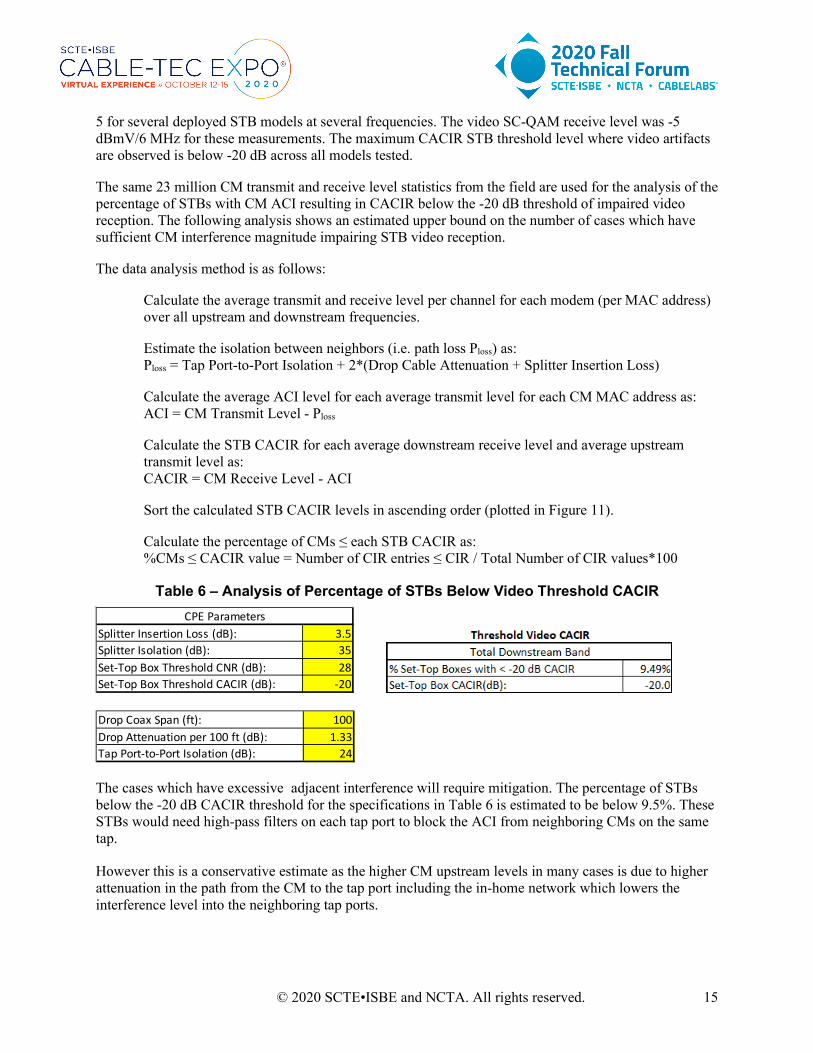
Sort the calculated STB CACIR levels in ascending order (plotted in Figure 11).
Calculate the percentage of CMs ≤ each STB CACIR as: %CMs ≤ CACIR value = Number of CIR entries ≤ CIR / Total Number of CIR values*100
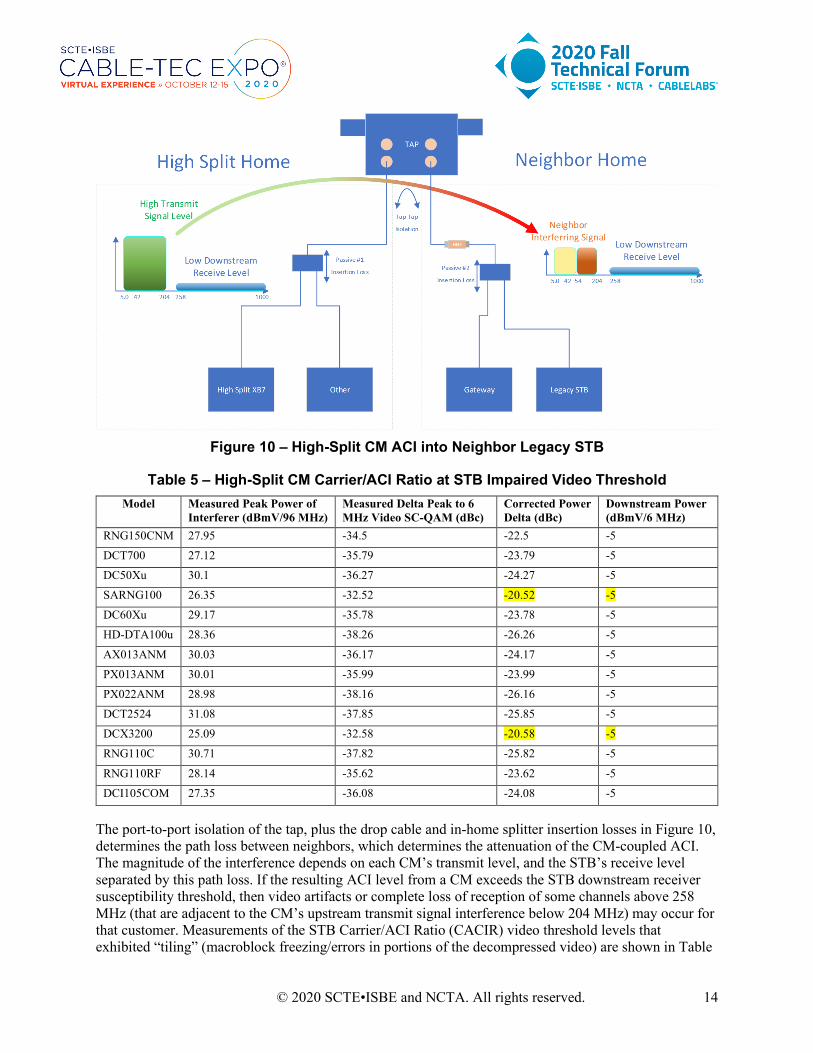
Table 6 – Analysis of Percentage of STBs Below Video Threshold CACIR
The cases which have excessive adjacent interference will require mitigation. The percentage of STBs below the -20 dB CACIR threshold for the specifications in Table 6 is estimated to be below 9.5%. These STBs would need high-pass filters on each tap port to block the ACI from neighboring CMs on the same tap.
However this is a conservative estimate as the higher CM upstream levels in many cases is due to higher attenuation in the path from the CM to the tap port including the in-home network which lowers the interference level into the neighboring tap ports.
Splitter Insertion Loss (dB): 3.5Splitter Isolation (dB): 35Set-Top Box Threshold CNR (dB): 28Set-Top Box Threshold CACIR (dB): -20
CPE Parameters
Drop Coax Span (ft): 100Drop Attenuation per 100 ft (dB): 1.33Tap Port-to-Port Isolation (dB): 24
© 2020 SCTE•ISBE and NCTA. All rights reserved. 16
Figure 11 – Percentage of STBs ≤ CACIR
6. Accomodating Legacy MoCA in 1.2 GHz System Upgrades Legacy STBs have an SC-QAM upper frequency limit of 1002 MHz. In these legacy designs, the MoCA channels are situated starting with a lower band edge frequency of 1125 MHz. Mid-split and high-split systems with DOCSIS 3.1 CMs, as well as forthcoming DOCSIS 4.0 FDX CMs, can support an extended OFDM upper frequency limit above 1002 MHz to 1218 MHz. In order to utilize this additional DOCSIS bandwidth, MoCA channels have to migrate to higher channel frequencies.
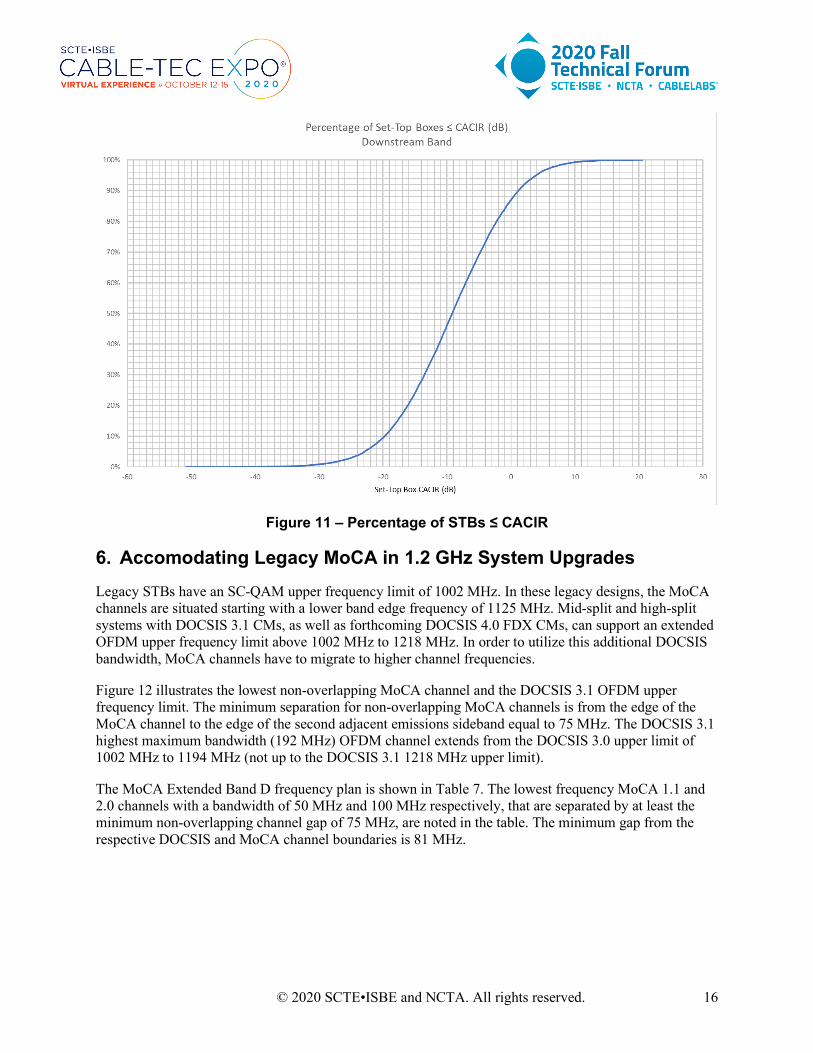
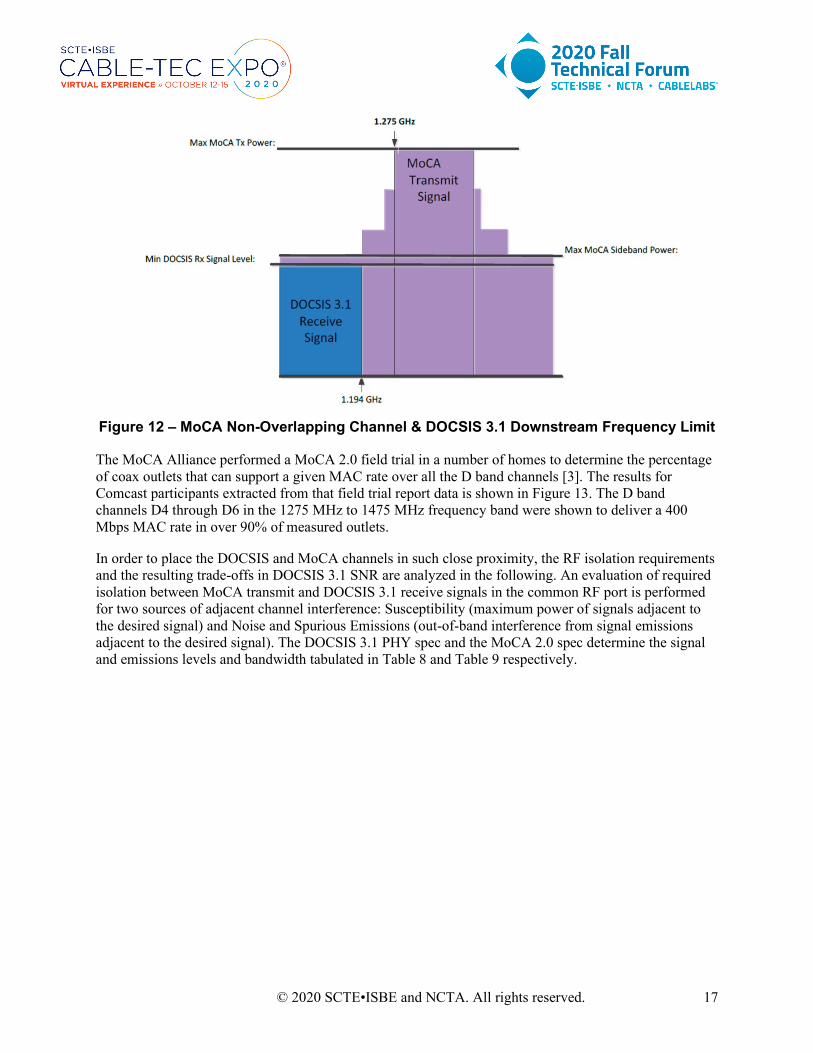
Figure 12 illustrates the lowest non-overlapping MoCA channel and the DOCSIS 3.1 OFDM upper frequency limit. The minimum separation for non-overlapping MoCA channels is from the edge of the MoCA channel to the edge of the second adjacent emissions sideband equal to 75 MHz. The DOCSIS 3.1 highest maximum bandwidth (192 MHz) OFDM channel extends from the DOCSIS 3.0 upper limit of 1002 MHz to 1194 MHz (not up to the DOCSIS 3.1 1218 MHz upper limit).
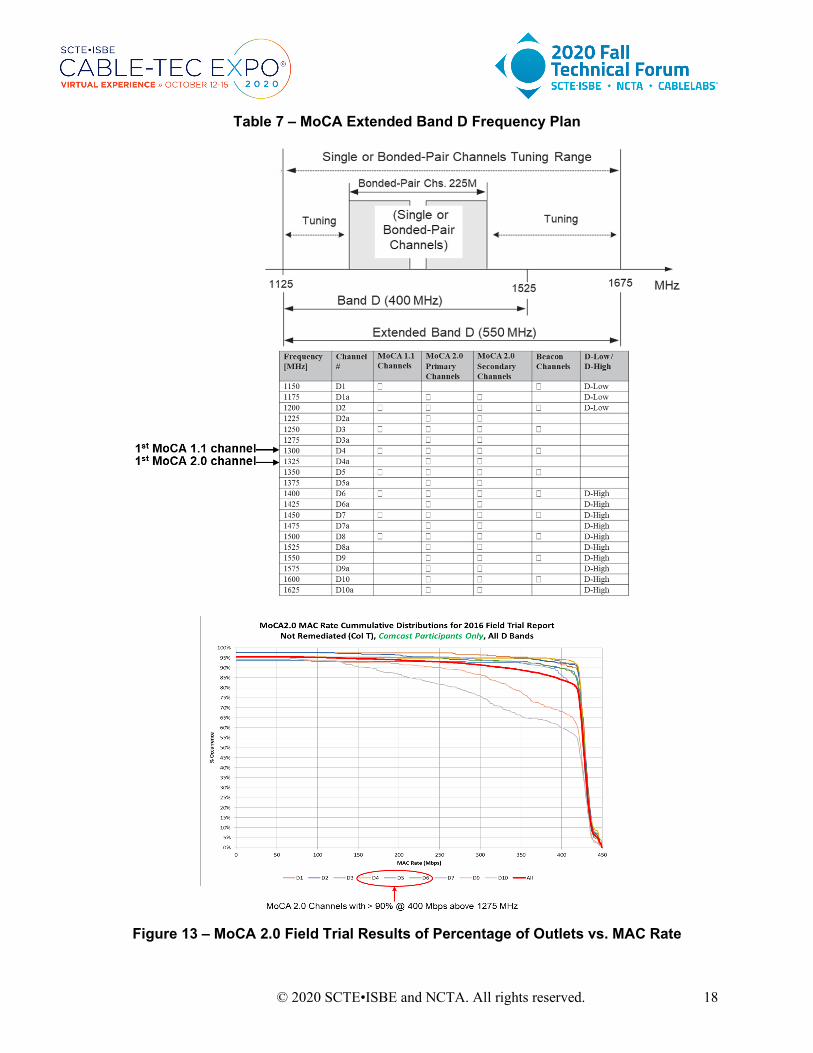
The MoCA Extended Band D frequency plan is shown in Table 7. The lowest frequency MoCA 1.1 and 2.0 channels with a bandwidth of 50 MHz and 100 MHz respectively, that are separated by at least the minimum non-overlapping channel gap of 75 MHz, are noted in the table. The minimum gap from the respective DOCSIS and MoCA channel boundaries is 81 MHz.
© 2020 SCTE•ISBE and NCTA. All rights reserved. 17
Figure 12 – MoCA Non-Overlapping Channel & DOCSIS 3.1 Downstream Frequency Limit
The MoCA Alliance performed a MoCA 2.0 field trial in a number of homes to determine the percentage of coax outlets that can support a given MAC rate over all the D band channels [3]. The results for Comcast participants extracted from that field trial report data is shown in Figure 13. The D band channels D4 through D6 in the 1275 MHz to 1475 MHz frequency band were shown to deliver a 400 Mbps MAC rate in over 90% of measured outlets.
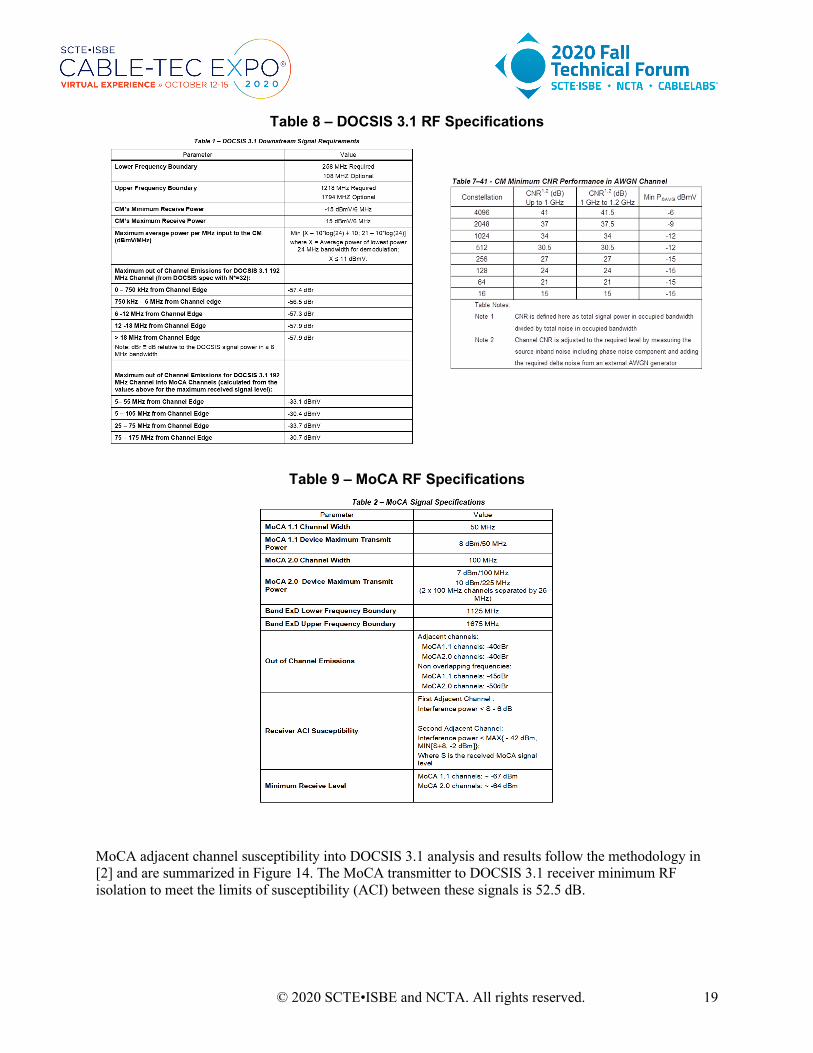
In order to place the DOCSIS and MoCA channels in such close proximity, the RF isolation requirements and the resulting trade-offs in DOCSIS 3.1 SNR are analyzed in the following. An evaluation of required isolation between MoCA transmit and DOCSIS 3.1 receive signals in the common RF port is performed for two sources of adjacent channel interference: Susceptibility (maximum power of signals adjacent to the desired signal) and Noise and Spurious Emissions (out-of-band interference from signal emissions adjacent to the desired signal). The DOCSIS 3.1 PHY spec and the MoCA 2.0 spec determine the signal and emissions levels and bandwidth tabulated in Table 8 and Table 9 respectively.
© 2020 SCTE•ISBE and NCTA. All rights reserved. 18
Table 7 – MoCA Extended Band D Frequency Plan
Figure 13 – MoCA 2.0 Field Trial Results of Percentage of Outlets vs. MAC Rate
© 2020 SCTE•ISBE and NCTA. All rights reserved. 19
Table 8 – DOCSIS 3.1 RF Specifications
Table 9 – MoCA RF Specifications
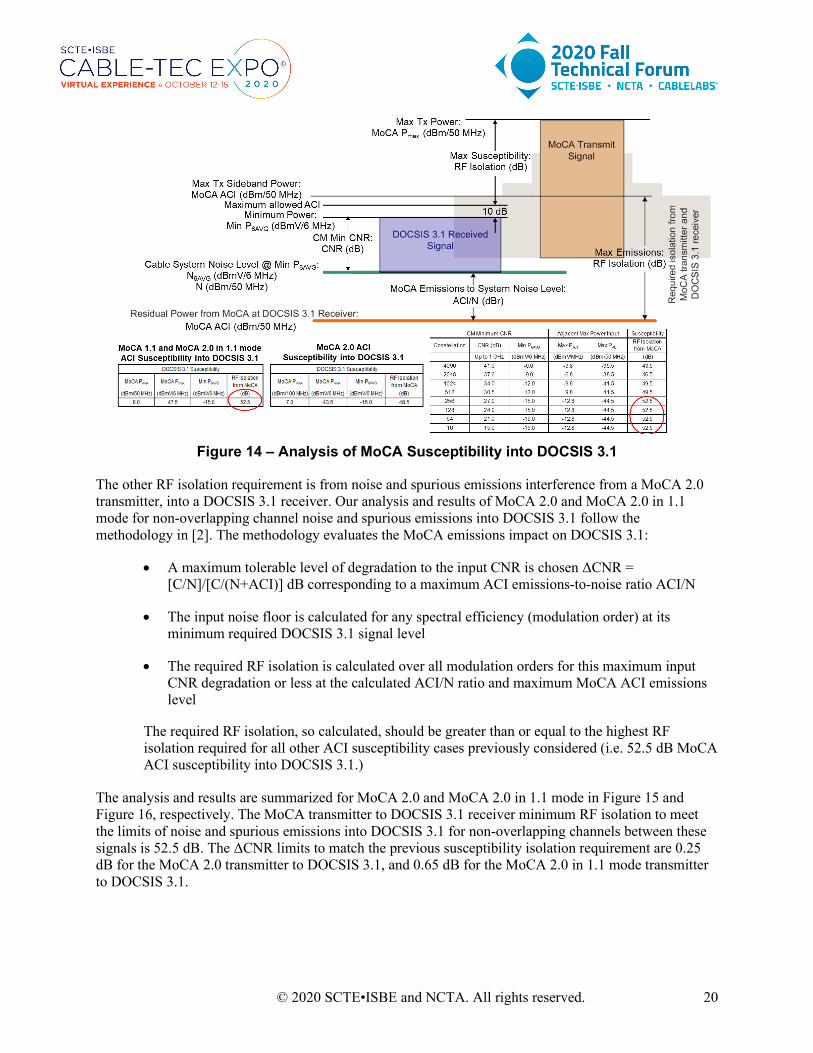
MoCA adjacent channel susceptibility into DOCSIS 3.1 analysis and results follow the methodology in [2] and are summarized in Figure 14. The MoCA transmitter to DOCSIS 3.1 receiver minimum RF isolation to meet the limits of susceptibility (ACI) between these signals is 52.5 dB.
© 2020 SCTE•ISBE and NCTA. All rights reserved. 20
Figure 14 – Analysis of MoCA Susceptibility into DOCSIS 3.1
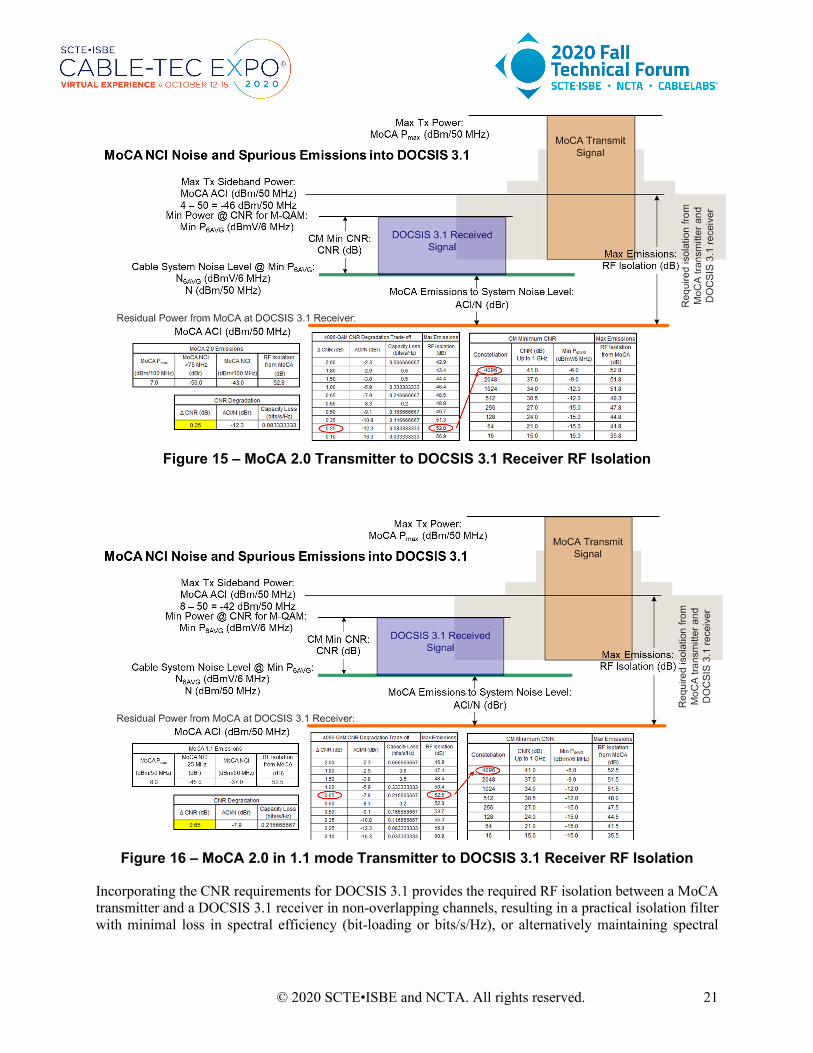
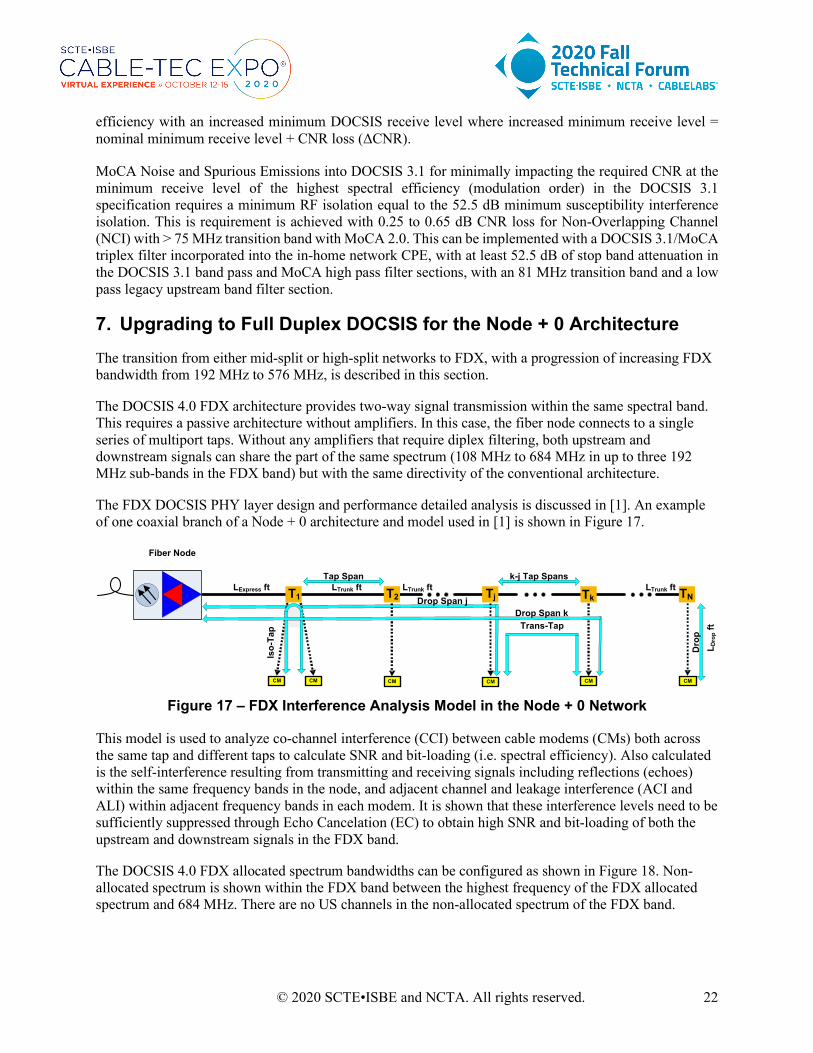
The other RF isolation requirement is from noise and spurious emissions interference from a MoCA 2.0 transmitter, into a DOCSIS 3.1 receiver. Our analysis and results of MoCA 2.0 and MoCA 2.0 in 1.1 mode for non-overlapping channel noise and spurious emissions into DOCSIS 3.1 follow the methodology in [2]. The methodology evaluates the MoCA emissions impact on DOCSIS 3.1:
• A maximum tolerable level of degradation to the input CNR is chosen ΔCNR = [C/N]/[C/(N+ACI)] dB corresponding to a maximum ACI emissions-to-noise ratio ACI/N
• The input noise floor is calculated for any spectral efficiency (modulation order) at its minimum required DOCSIS 3.1 signal level
• The required RF isolation is calculated over all modulation orders for this maximum input CNR degradation or less at the calculated ACI/N ratio and maximum MoCA ACI emissions level
The required RF isolation, so calculated, should be greater than or equal to the highest RF isolation required for all other ACI susceptibility cases previously considered (i.e. 52.5 dB MoCA ACI susceptibility into DOCSIS 3.1.)
The analysis and results are summarized for MoCA 2.0 and MoCA 2.0 in 1.1 mode in Figure 15 and Figure 16, respectively. The MoCA transmitter to DOCSIS 3.1 receiver minimum RF isolation to meet the limits of noise and spurious emissions into DOCSIS 3.1 for non-overlapping channels between these signals is 52.5 dB. The ΔCNR limits to match the previous susceptibility isolation requirement are 0.25 dB for the MoCA 2.0 transmitter to DOCSIS 3.1, and 0.65 dB for the MoCA 2.0 in 1.1 mode transmitter to DOCSIS 3.1.
© 2020 SCTE•ISBE and NCTA. All rights reserved. 21
Figure 15 – MoCA 2.0 Transmitter to DOCSIS 3.1 Receiver RF Isolation
Figure 16 – MoCA 2.0 in 1.1 mode Transmitter to DOCSIS 3.1 Receiver RF Isolation
Incorporating the CNR requirements for DOCSIS 3.1 provides the required RF isolation between a MoCA transmitter and a DOCSIS 3.1 receiver in non-overlapping channels, resulting in a practical isolation filter with minimal loss in spectral efficiency (bit-loading or bits/s/Hz), or alternatively maintaining spectral
© 2020 SCTE•ISBE and NCTA. All rights reserved. 22
efficiency with an increased minimum DOCSIS receive level where increased minimum receive level = nominal minimum receive level + CNR loss (ΔCNR).
MoCA Noise and Spurious Emissions into DOCSIS 3.1 for minimally impacting the required CNR at the minimum receive level of the highest spectral efficiency (modulation order) in the DOCSIS 3.1 specification requires a minimum RF isolation equal to the 52.5 dB minimum susceptibility interference isolation. This is requirement is achieved with 0.25 to 0.65 dB CNR loss for Non-Overlapping Channel (NCI) with > 75 MHz transition band with MoCA 2.0. This can be implemented with a DOCSIS 3.1/MoCA triplex filter incorporated into the in-home network CPE, with at least 52.5 dB of stop band attenuation in the DOCSIS 3.1 band pass and MoCA high pass filter sections, with an 81 MHz transition band and a low pass legacy upstream band filter section.
7. Upgrading to Full Duplex DOCSIS for the Node + 0 Architecture The transition from either mid-split or high-split networks to FDX, with a progression of increasing FDX bandwidth from 192 MHz to 576 MHz, is described in this section.
The DOCSIS 4.0 FDX architecture provides two-way signal transmission within the same spectral band. This requires a passive architecture without amplifiers. In this case, the fiber node connects to a single series of multiport taps. Without any amplifiers that require diplex filtering, both upstream and downstream signals can share the part of the same spectrum (108 MHz to 684 MHz in up to three 192 MHz sub-bands in the FDX band) but with the same directivity of the conventional architecture.
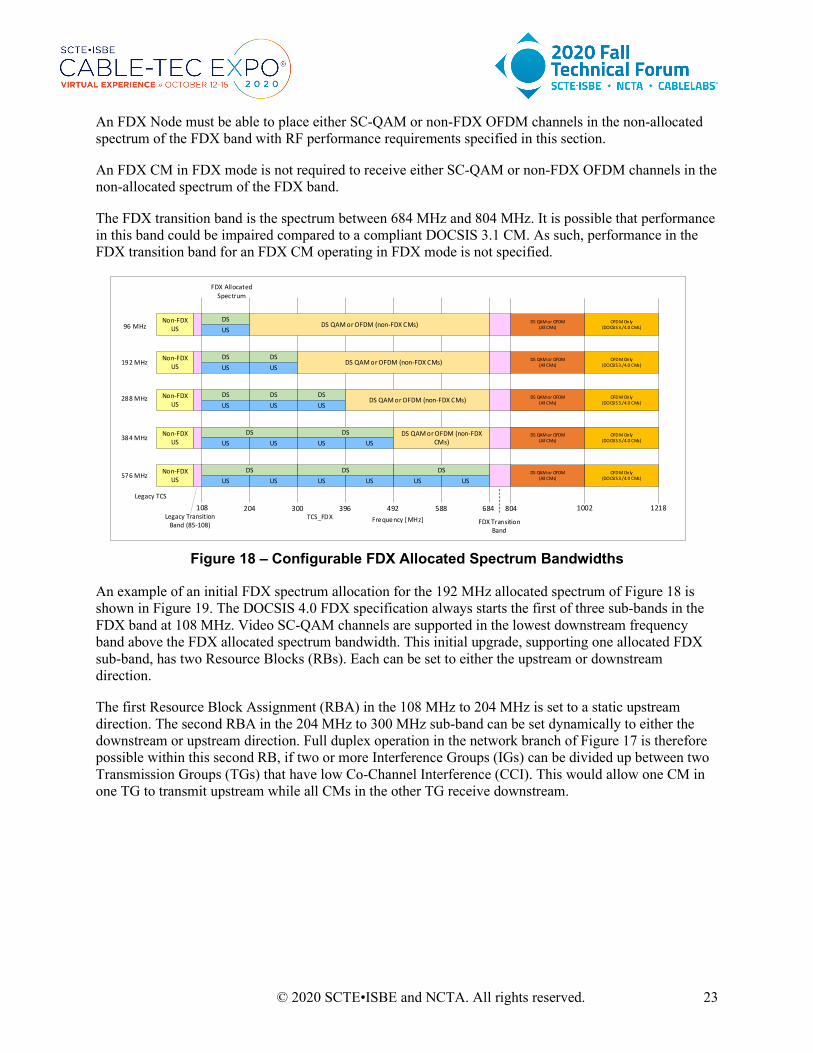
The FDX DOCSIS PHY layer design and performance detailed analysis is discussed in [1]. An example of one coaxial branch of a Node + 0 architecture and model used in [1] is shown in Figure 17.
Figure 17 – FDX Interference Analysis Model in the Node + 0 Network
This model is used to analyze co-channel interference (CCI) between cable modems (CMs) both across the same tap and different taps to calculate SNR and bit-loading (i.e. spectral efficiency). Also calculated is the self-interference resulting from transmitting and receiving signals including reflections (echoes) within the same frequency bands in the node, and adjacent channel and leakage interference (ACI and ALI) within adjacent frequency bands in each modem. It is shown that these interference levels need to be sufficiently suppressed through Echo Cancelation (EC) to obtain high SNR and bit-loading of both the upstream and downstream signals in the FDX band.
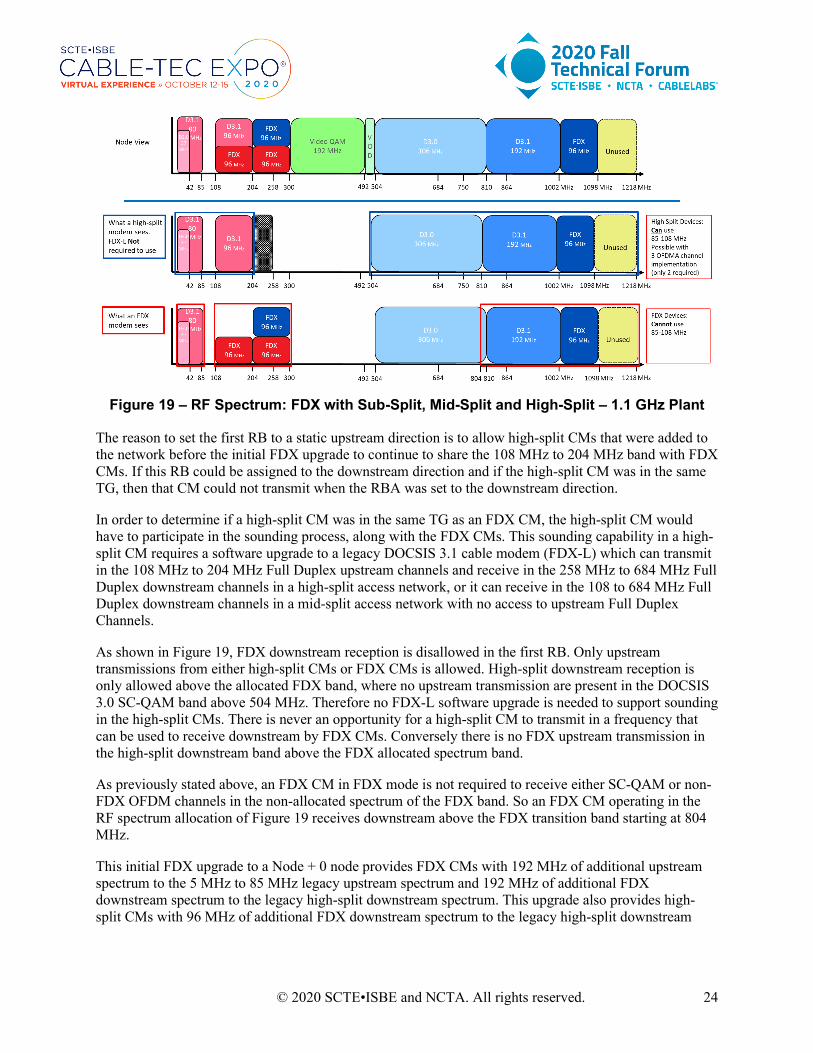
The DOCSIS 4.0 FDX allocated spectrum bandwidths can be configured as shown in Figure 18. Non-allocated spectrum is shown within the FDX band between the highest frequency of the FDX allocated spectrum and 684 MHz. There are no US channels in the non-allocated spectrum of the FDX band.
Tap Span
Drop Span j T2 Tj Tk TN
k-j Tap Spans
L Dro
p ft
Fiber Node
LExpress ft LTrunk ft
Trans-Tap
Dro
p
T1
Iso-
Tap
CM CM CM CM CM CM
LTrunk ft LTrunk ft
Drop Span k
© 2020 SCTE•ISBE and NCTA. All rights reserved. 23
An FDX Node must be able to place either SC-QAM or non-FDX OFDM channels in the non-allocated spectrum of the FDX band with RF performance requirements specified in this section.
An FDX CM in FDX mode is not required to receive either SC-QAM or non-FDX OFDM channels in the non-allocated spectrum of the FDX band.
The FDX transition band is the spectrum between 684 MHz and 804 MHz. It is possible that performance in this band could be impaired compared to a compliant DOCSIS 3.1 CM. As such, performance in the FDX transition band for an FDX CM operating in FDX mode is not specified.
96 MHz
192 MHz
288 MHz
384 MHz
576 MHz
108 300 492 684
Non-FDX US
1002
FDX Allocated Spectrum
Frequency [MHz]
DSUS US
DSUS US
DSUS US
DS QAM or OFDM(All CMs)
Non-FDX US
DSUS US
DSUS US
Non-FDX US
DSUS
DSUS
DSUS
Non-FDX US
DSUS
DSUS
Non-FDX US
DSUS
DS QAM or OFDM (non-FDX CMs)
DS QAM or OFDM (non-FDX CMs)
DS QAM or OFDM (non-FDX CMs)
DS QAM or OFDM (non-FDX CMs)
DS QAM or OFDM(All CMs)
DS QAM or OFDM(All CMs)
DS QAM or OFDM(All CMs)
DS QAM or OFDM(All CMs)
804
FDX Transition Band
Legacy Transition Band (85-108)
Legacy TCS
TCS_FDX1218
OFDM Only(DOCSIS 3./4.0 CMs)
OFDM Only(DOCSIS 3./4.0 CMs)
OFDM Only(DOCSIS 3./4.0 CMs)
OFDM Only(DOCSIS 3./4.0 CMs)
OFDM Only(DOCSIS 3./4.0 CMs)
204 396 588
Figure 18 – Configurable FDX Allocated Spectrum Bandwidths
An example of an initial FDX spectrum allocation for the 192 MHz allocated spectrum of Figure 18 is shown in Figure 19. The DOCSIS 4.0 FDX specification always starts the first of three sub-bands in the FDX band at 108 MHz. Video SC-QAM channels are supported in the lowest downstream frequency band above the FDX allocated spectrum bandwidth. This initial upgrade, supporting one allocated FDX sub-band, has two Resource Blocks (RBs). Each can be set to either the upstream or downstream direction.
The first Resource Block Assignment (RBA) in the 108 MHz to 204 MHz is set to a static upstream direction. The second RBA in the 204 MHz to 300 MHz sub-band can be set dynamically to either the downstream or upstream direction. Full duplex operation in the network branch of Figure 17 is therefore possible within this second RB, if two or more Interference Groups (IGs) can be divided up between two Transmission Groups (TGs) that have low Co-Channel Interference (CCI). This would allow one CM in one TG to transmit upstream while all CMs in the other TG receive downstream.
© 2020 SCTE•ISBE and NCTA. All rights reserved. 24
Figure 19 – RF Spectrum: FDX with Sub-Split, Mid-Split and High-Split – 1.1 GHz Plant
The reason to set the first RB to a static upstream direction is to allow high-split CMs that were added to the network before the initial FDX upgrade to continue to share the 108 MHz to 204 MHz band with FDX CMs. If this RB could be assigned to the downstream direction and if the high-split CM was in the same TG, then that CM could not transmit when the RBA was set to the downstream direction.
In order to determine if a high-split CM was in the same TG as an FDX CM, the high-split CM would have to participate in the sounding process, along with the FDX CMs. This sounding capability in a high-split CM requires a software upgrade to a legacy DOCSIS 3.1 cable modem (FDX-L) which can transmit in the 108 MHz to 204 MHz Full Duplex upstream channels and receive in the 258 MHz to 684 MHz Full Duplex downstream channels in a high-split access network, or it can receive in the 108 to 684 MHz Full Duplex downstream channels in a mid-split access network with no access to upstream Full Duplex Channels.
As shown in Figure 19, FDX downstream reception is disallowed in the first RB. Only upstream transmissions from either high-split CMs or FDX CMs is allowed. High-split downstream reception is only allowed above the allocated FDX band, where no upstream transmission are present in the DOCSIS 3.0 SC-QAM band above 504 MHz. Therefore no FDX-L software upgrade is needed to support sounding in the high-split CMs. There is never an opportunity for a high-split CM to transmit in a frequency that can be used to receive downstream by FDX CMs. Conversely there is no FDX upstream transmission in the high-split downstream band above the FDX allocated spectrum band.
As previously stated above, an FDX CM in FDX mode is not required to receive either SC-QAM or non-FDX OFDM channels in the non-allocated spectrum of the FDX band. So an FDX CM operating in the RF spectrum allocation of Figure 19 receives downstream above the FDX transition band starting at 804 MHz.
This initial FDX upgrade to a Node + 0 node provides FDX CMs with 192 MHz of additional upstream spectrum to the 5 MHz to 85 MHz legacy upstream spectrum and 192 MHz of additional FDX downstream spectrum to the legacy high-split downstream spectrum. This upgrade also provides high-split CMs with 96 MHz of additional FDX downstream spectrum to the legacy high-split downstream
© 2020 SCTE•ISBE and NCTA. All rights reserved. 25
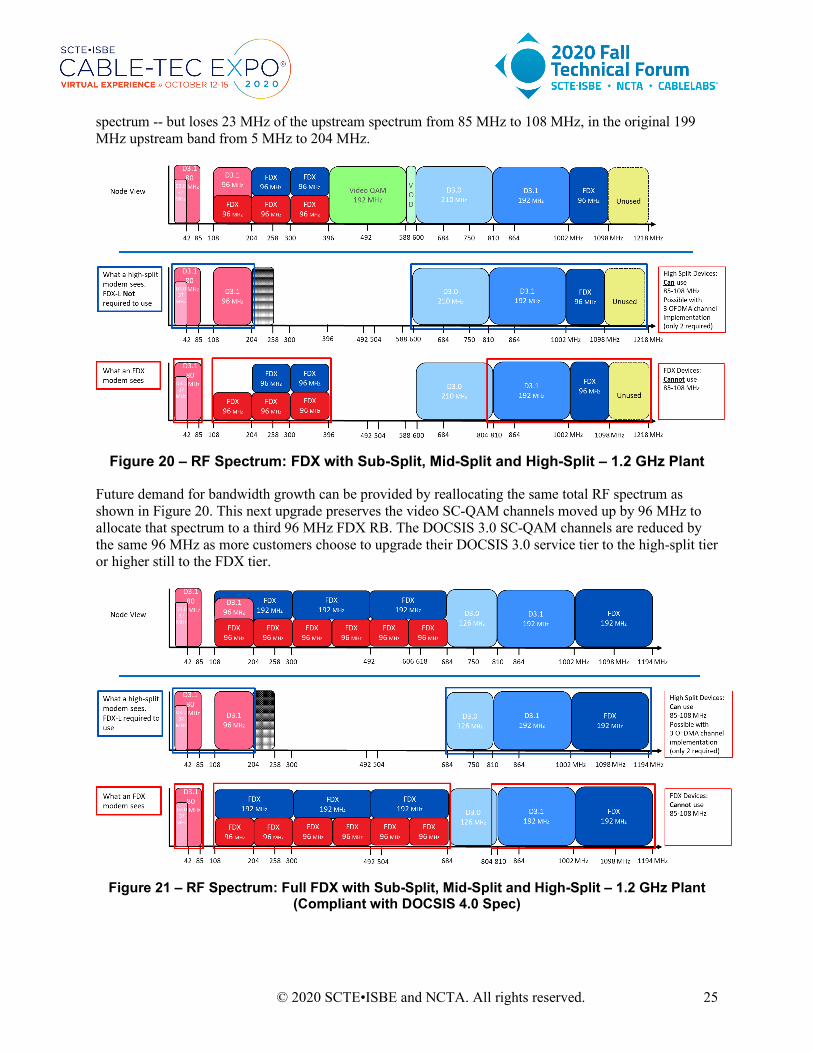
spectrum -- but loses 23 MHz of the upstream spectrum from 85 MHz to 108 MHz, in the original 199 MHz upstream band from 5 MHz to 204 MHz.
Figure 20 – RF Spectrum: FDX with Sub-Split, Mid-Split and High-Split – 1.2 GHz Plant
Future demand for bandwidth growth can be provided by reallocating the same total RF spectrum as shown in Figure 20. This next upgrade preserves the video SC-QAM channels moved up by 96 MHz to allocate that spectrum to a third 96 MHz FDX RB. The DOCSIS 3.0 SC-QAM channels are reduced by the same 96 MHz as more customers choose to upgrade their DOCSIS 3.0 service tier to the high-split tier or higher still to the FDX tier.
Figure 21 – RF Spectrum: Full FDX with Sub-Split, Mid-Split and High-Split – 1.2 GHz Plant
(Compliant with DOCSIS 4.0 Spec)
© 2020 SCTE•ISBE and NCTA. All rights reserved. 26
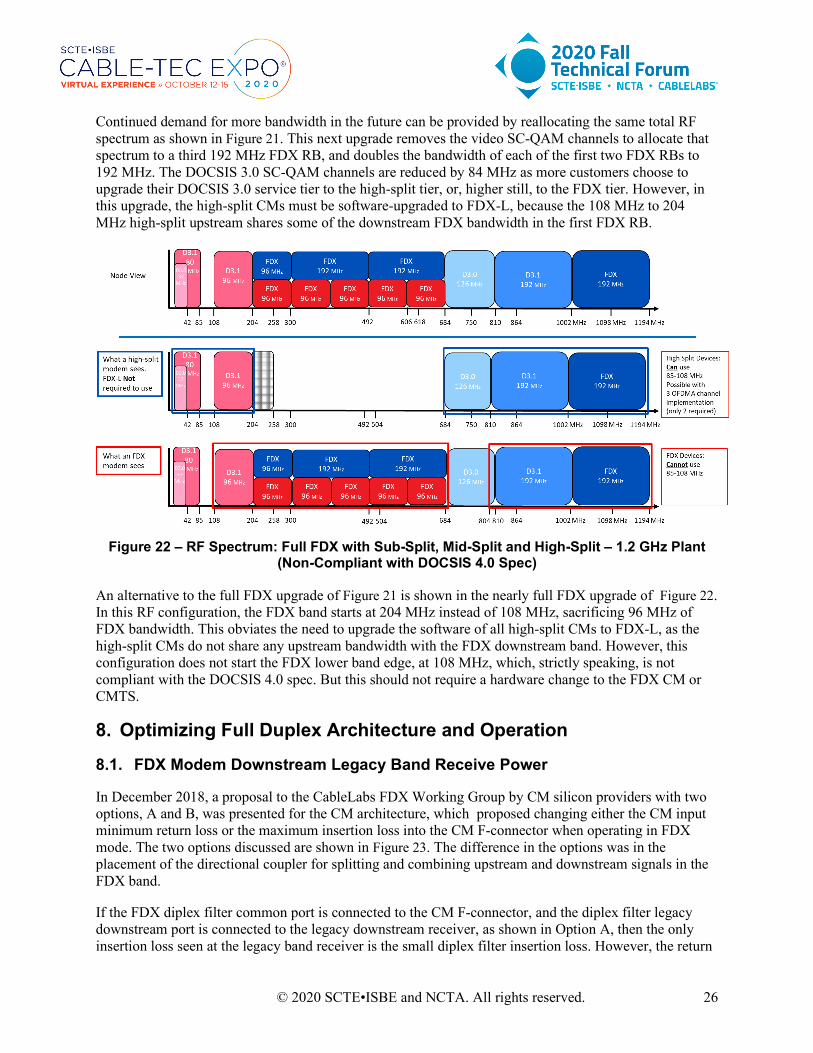
Continued demand for more bandwidth in the future can be provided by reallocating the same total RF spectrum as shown in Figure 21. This next upgrade removes the video SC-QAM channels to allocate that spectrum to a third 192 MHz FDX RB, and doubles the bandwidth of each of the first two FDX RBs to 192 MHz. The DOCSIS 3.0 SC-QAM channels are reduced by 84 MHz as more customers choose to upgrade their DOCSIS 3.0 service tier to the high-split tier, or, higher still, to the FDX tier. However, in this upgrade, the high-split CMs must be software-upgraded to FDX-L, because the 108 MHz to 204 MHz high-split upstream shares some of the downstream FDX bandwidth in the first FDX RB.
Figure 22 – RF Spectrum: Full FDX with Sub-Split, Mid-Split and High-Split – 1.2 GHz Plant
(Non-Compliant with DOCSIS 4.0 Spec)
An alternative to the full FDX upgrade of Figure 21 is shown in the nearly full FDX upgrade of Figure 22. In this RF configuration, the FDX band starts at 204 MHz instead of 108 MHz, sacrificing 96 MHz of FDX bandwidth. This obviates the need to upgrade the software of all high-split CMs to FDX-L, as the high-split CMs do not share any upstream bandwidth with the FDX downstream band. However, this configuration does not start the FDX lower band edge, at 108 MHz, which, strictly speaking, is not compliant with the DOCSIS 4.0 spec. But this should not require a hardware change to the FDX CM or CMTS.
8. Optimizing Full Duplex Architecture and Operation
8.1. FDX Modem Downstream Legacy Band Receive Power
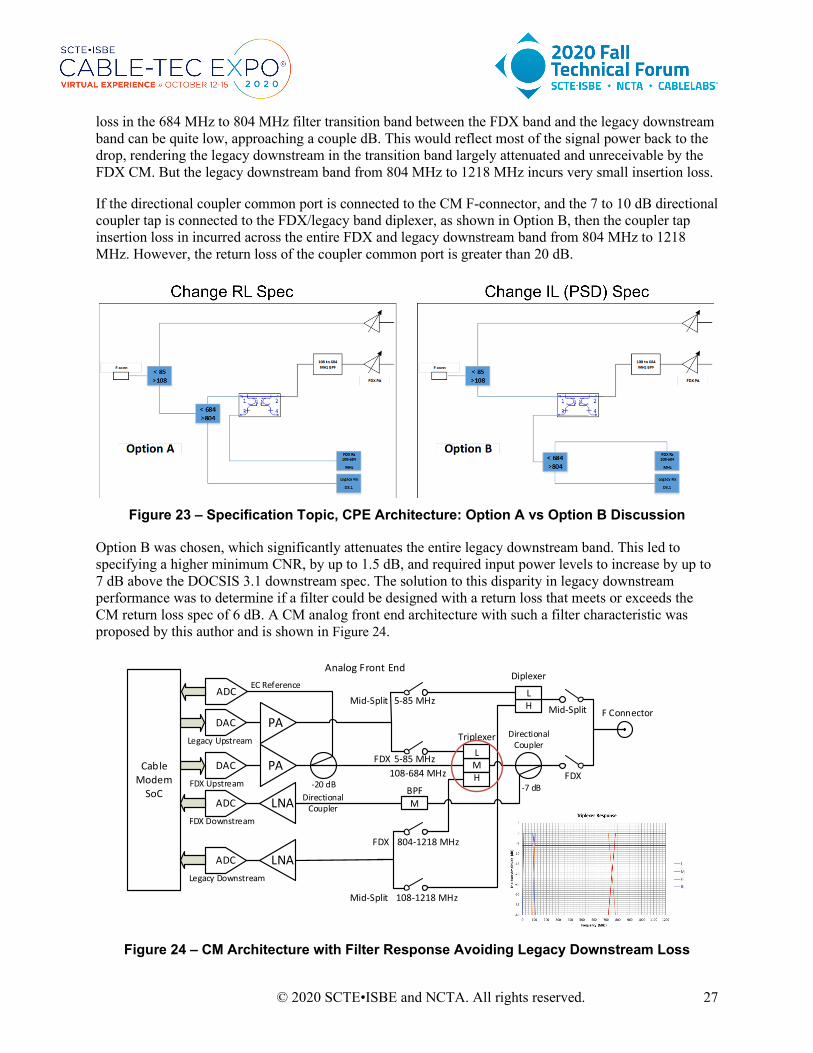
In December 2018, a proposal to the CableLabs FDX Working Group by CM silicon providers with two options, A and B, was presented for the CM architecture, which proposed changing either the CM input minimum return loss or the maximum insertion loss into the CM F-connector when operating in FDX mode. The two options discussed are shown in Figure 23. The difference in the options was in the placement of the directional coupler for splitting and combining upstream and downstream signals in the FDX band.
If the FDX diplex filter common port is connected to the CM F-connector, and the diplex filter legacy downstream port is connected to the legacy downstream receiver, as shown in Option A, then the only insertion loss seen at the legacy band receiver is the small diplex filter insertion loss. However, the return
© 2020 SCTE•ISBE and NCTA. All rights reserved. 27
loss in the 684 MHz to 804 MHz filter transition band between the FDX band and the legacy downstream band can be quite low, approaching a couple dB. This would reflect most of the signal power back to the drop, rendering the legacy downstream in the transition band largely attenuated and unreceivable by the FDX CM. But the legacy downstream band from 804 MHz to 1218 MHz incurs very small insertion loss.
If the directional coupler common port is connected to the CM F-connector, and the 7 to 10 dB directional coupler tap is connected to the FDX/legacy band diplexer, as shown in Option B, then the coupler tap insertion loss in incurred across the entire FDX and legacy downstream band from 804 MHz to 1218 MHz. However, the return loss of the coupler common port is greater than 20 dB.
Figure 23 – Specification Topic, CPE Architecture: Option A vs Option B Discussion
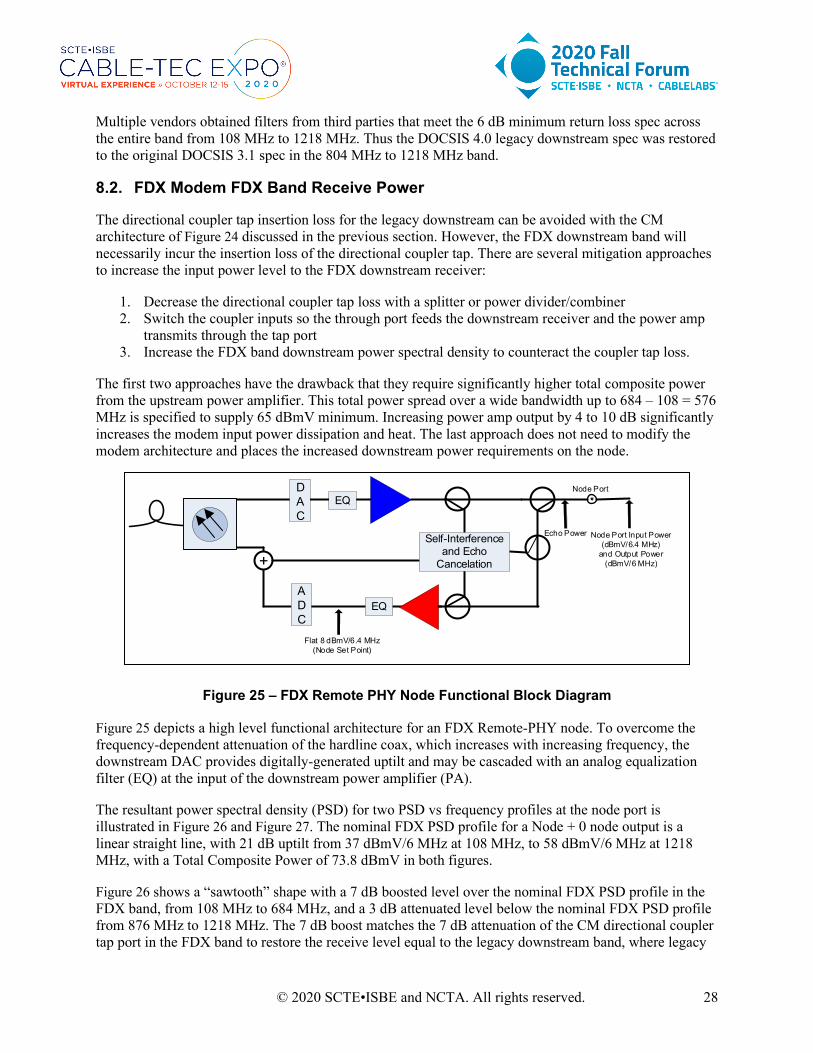
Option B was chosen, which significantly attenuates the entire legacy downstream band. This led to specifying a higher minimum CNR, by up to 1.5 dB, and required input power levels to increase by up to 7 dB above the DOCSIS 3.1 downstream spec. The solution to this disparity in legacy downstream performance was to determine if a filter could be designed with a return loss that meets or exceeds the CM return loss spec of 6 dB. A CM analog front end architecture with such a filter characteristic was proposed by this author and is shown in Figure 24.
Mid-Split
FDX
LMH
LH
DAC
DAC
ADC
ADC
PA
LNA
LNA
PA
Cable Modem
SoC
5-85 MHz108-684 MHz
804-1218 MHz
108-1218 MHz
5-85 MHz
Diplexer
Triplexer
-7 dBDirectional
Coupler
F Connector
ADC
-20 dB
EC Reference
Legacy Upstream
FDX Upstream
FDX Downstream
Legacy Downstream
FDX
Mid-Split
Mid-Split
FDX
Analog Front End
MBPF
Directional Coupler
Figure 24 – CM Architecture with Filter Response Avoiding Legacy Downstream Loss
© 2020 SCTE•ISBE and NCTA. All rights reserved. 28
Multiple vendors obtained filters from third parties that meet the 6 dB minimum return loss spec across the entire band from 108 MHz to 1218 MHz. Thus the DOCSIS 4.0 legacy downstream spec was restored to the original DOCSIS 3.1 spec in the 804 MHz to 1218 MHz band.
8.2. FDX Modem FDX Band Receive Power
The directional coupler tap insertion loss for the legacy downstream can be avoided with the CM architecture of Figure 24 discussed in the previous section. However, the FDX downstream band will necessarily incur the insertion loss of the directional coupler tap. There are several mitigation approaches to increase the input power level to the FDX downstream receiver:
1. Decrease the directional coupler tap loss with a splitter or power divider/combiner 2. Switch the coupler inputs so the through port feeds the downstream receiver and the power amp
transmits through the tap port 3. Increase the FDX band downstream power spectral density to counteract the coupler tap loss.
The first two approaches have the drawback that they require significantly higher total composite power from the upstream power amplifier. This total power spread over a wide bandwidth up to 684 – 108 = 576 MHz is specified to supply 65 dBmV minimum. Increasing power amp output by 4 to 10 dB significantly increases the modem input power dissipation and heat. The last approach does not need to modify the modem architecture and places the increased downstream power requirements on the node.
Figure 25 – FDX Remote PHY Node Functional Block Diagram
Figure 25 depicts a high level functional architecture for an FDX Remote-PHY node. To overcome the frequency-dependent attenuation of the hardline coax, which increases with increasing frequency, the downstream DAC provides digitally-generated uptilt and may be cascaded with an analog equalization filter (EQ) at the input of the downstream power amplifier (PA).
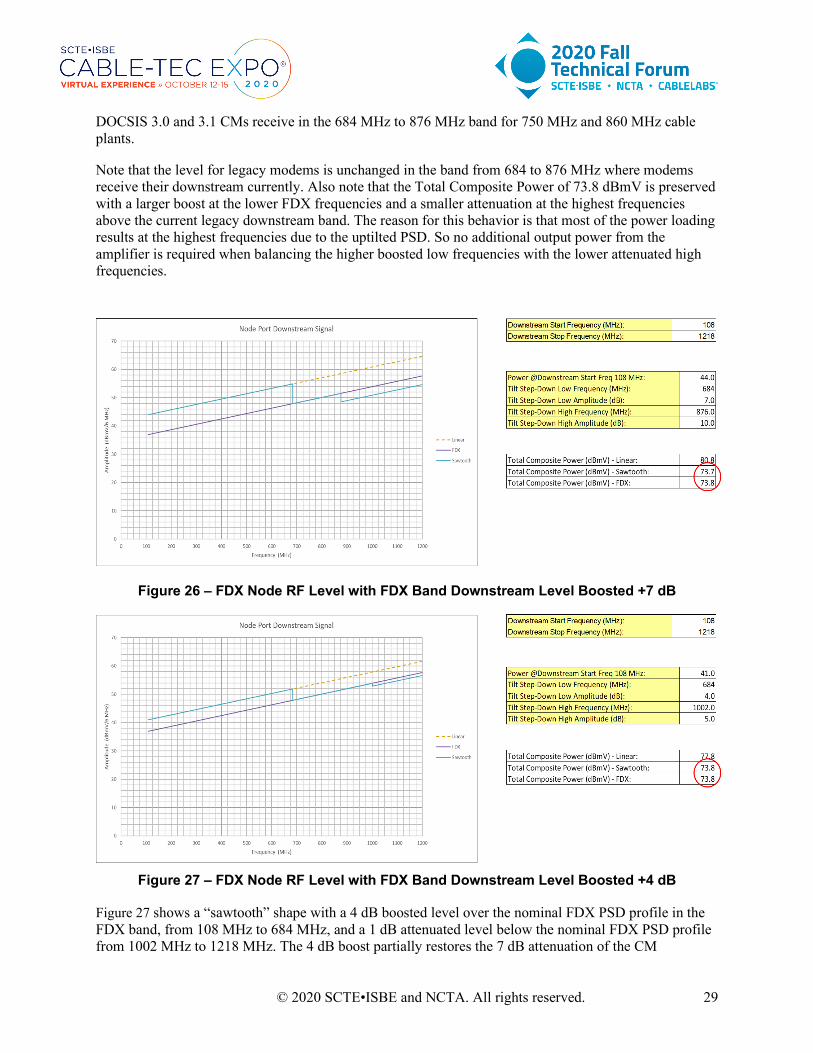
The resultant power spectral density (PSD) for two PSD vs frequency profiles at the node port is illustrated in Figure 26 and Figure 27. The nominal FDX PSD profile for a Node + 0 node output is a linear straight line, with 21 dB uptilt from 37 dBmV/6 MHz at 108 MHz, to 58 dBmV/6 MHz at 1218 MHz, with a Total Composite Power of 73.8 dBmV in both figures.
Figure 26 shows a “sawtooth” shape with a 7 dB boosted level over the nominal FDX PSD profile in the FDX band, from 108 MHz to 684 MHz, and a 3 dB attenuated level below the nominal FDX PSD profile from 876 MHz to 1218 MHz. The 7 dB boost matches the 7 dB attenuation of the CM directional coupler tap port in the FDX band to restore the receive level equal to the legacy downstream band, where legacy
DAC
EQ
EQ
Self-Interference and Echo
Cancelation
ADC
Node Port Input Power (dBmV/6.4 MHz)
and Output Power (dBmV/6 MHz)
Flat 8 dBmV/6.4 MHz (Node Set Point)
Echo Power
Node Port
+
© 2020 SCTE•ISBE and NCTA. All rights reserved. 29
DOCSIS 3.0 and 3.1 CMs receive in the 684 MHz to 876 MHz band for 750 MHz and 860 MHz cable plants.
Note that the level for legacy modems is unchanged in the band from 684 to 876 MHz where modems receive their downstream currently. Also note that the Total Composite Power of 73.8 dBmV is preserved with a larger boost at the lower FDX frequencies and a smaller attenuation at the highest frequencies above the current legacy downstream band. The reason for this behavior is that most of the power loading results at the highest frequencies due to the uptilted PSD. So no additional output power from the amplifier is required when balancing the higher boosted low frequencies with the lower attenuated high frequencies.
Figure 26 – FDX Node RF Level with FDX Band Downstream Level Boosted +7 dB
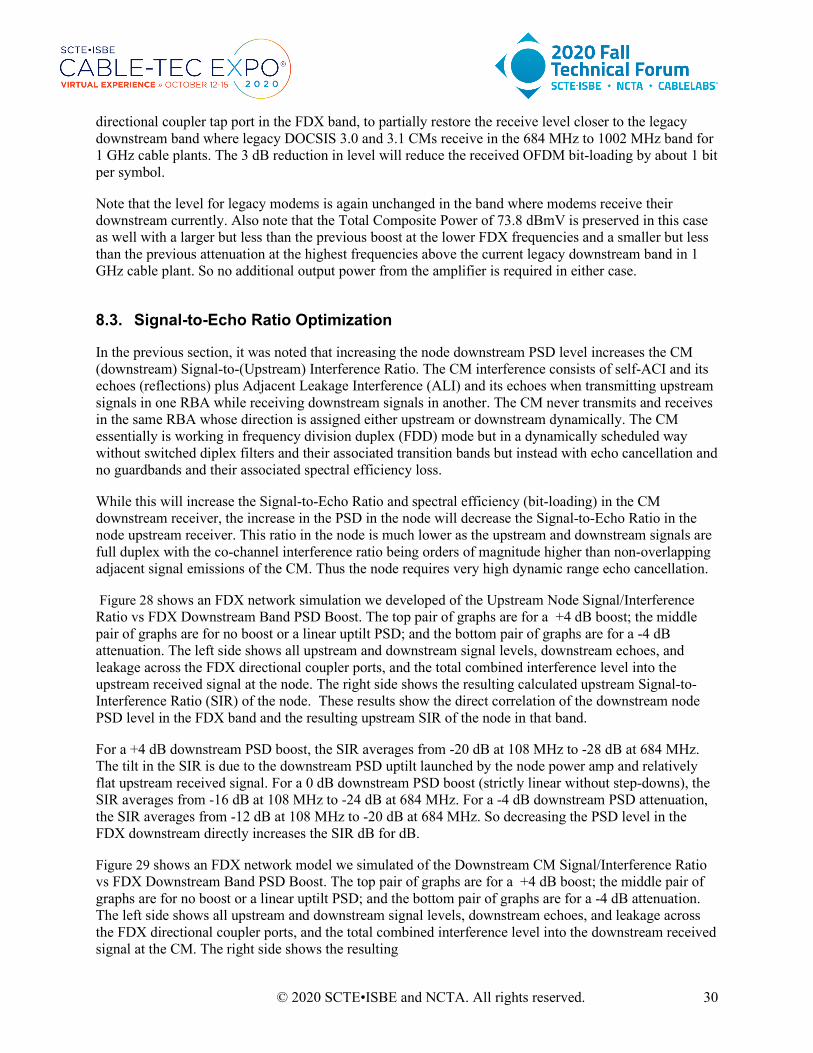
Figure 27 – FDX Node RF Level with FDX Band Downstream Level Boosted +4 dB
Figure 27 shows a “sawtooth” shape with a 4 dB boosted level over the nominal FDX PSD profile in the FDX band, from 108 MHz to 684 MHz, and a 1 dB attenuated level below the nominal FDX PSD profile from 1002 MHz to 1218 MHz. The 4 dB boost partially restores the 7 dB attenuation of the CM
© 2020 SCTE•ISBE and NCTA. All rights reserved. 30
directional coupler tap port in the FDX band, to partially restore the receive level closer to the legacy downstream band where legacy DOCSIS 3.0 and 3.1 CMs receive in the 684 MHz to 1002 MHz band for 1 GHz cable plants. The 3 dB reduction in level will reduce the received OFDM bit-loading by about 1 bit per symbol.
Note that the level for legacy modems is again unchanged in the band where modems receive their downstream currently. Also note that the Total Composite Power of 73.8 dBmV is preserved in this case as well with a larger but less than the previous boost at the lower FDX frequencies and a smaller but less than the previous attenuation at the highest frequencies above the current legacy downstream band in 1 GHz cable plant. So no additional output power from the amplifier is required in either case.
8.3. Signal-to-Echo Ratio Optimization
In the previous section, it was noted that increasing the node downstream PSD level increases the CM (downstream) Signal-to-(Upstream) Interference Ratio. The CM interference consists of self-ACI and its echoes (reflections) plus Adjacent Leakage Interference (ALI) and its echoes when transmitting upstream signals in one RBA while receiving downstream signals in another. The CM never transmits and receives in the same RBA whose direction is assigned either upstream or downstream dynamically. The CM essentially is working in frequency division duplex (FDD) mode but in a dynamically scheduled way without switched diplex filters and their associated transition bands but instead with echo cancellation and no guardbands and their associated spectral efficiency loss.
While this will increase the Signal-to-Echo Ratio and spectral efficiency (bit-loading) in the CM downstream receiver, the increase in the PSD in the node will decrease the Signal-to-Echo Ratio in the node upstream receiver. This ratio in the node is much lower as the upstream and downstream signals are full duplex with the co-channel interference ratio being orders of magnitude higher than non-overlapping adjacent signal emissions of the CM. Thus the node requires very high dynamic range echo cancellation.
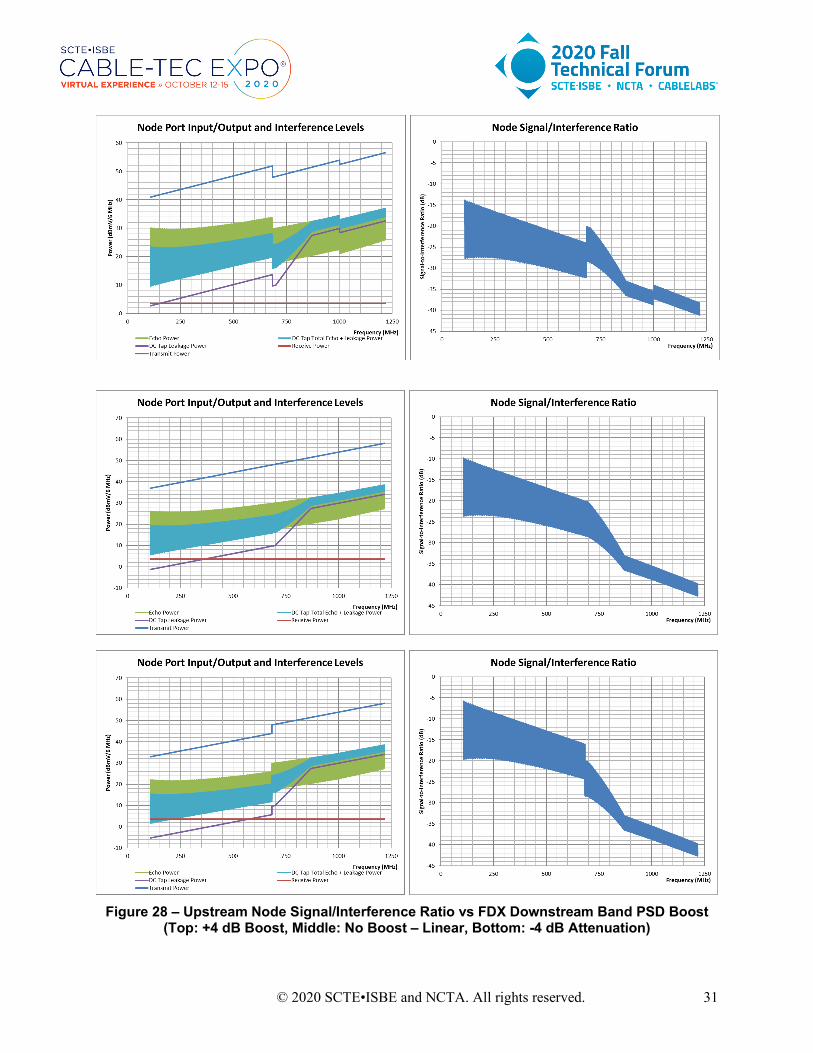
Figure 28 shows an FDX network simulation we developed of the Upstream Node Signal/Interference Ratio vs FDX Downstream Band PSD Boost. The top pair of graphs are for a +4 dB boost; the middle pair of graphs are for no boost or a linear uptilt PSD; and the bottom pair of graphs are for a -4 dB attenuation. The left side shows all upstream and downstream signal levels, downstream echoes, and leakage across the FDX directional coupler ports, and the total combined interference level into the upstream received signal at the node. The right side shows the resulting calculated upstream Signal-to-Interference Ratio (SIR) of the node. These results show the direct correlation of the downstream node PSD level in the FDX band and the resulting upstream SIR of the node in that band.
For a +4 dB downstream PSD boost, the SIR averages from -20 dB at 108 MHz to -28 dB at 684 MHz. The tilt in the SIR is due to the downstream PSD uptilt launched by the node power amp and relatively flat upstream received signal. For a 0 dB downstream PSD boost (strictly linear without step-downs), the SIR averages from -16 dB at 108 MHz to -24 dB at 684 MHz. For a -4 dB downstream PSD attenuation, the SIR averages from -12 dB at 108 MHz to -20 dB at 684 MHz. So decreasing the PSD level in the FDX downstream directly increases the SIR dB for dB.
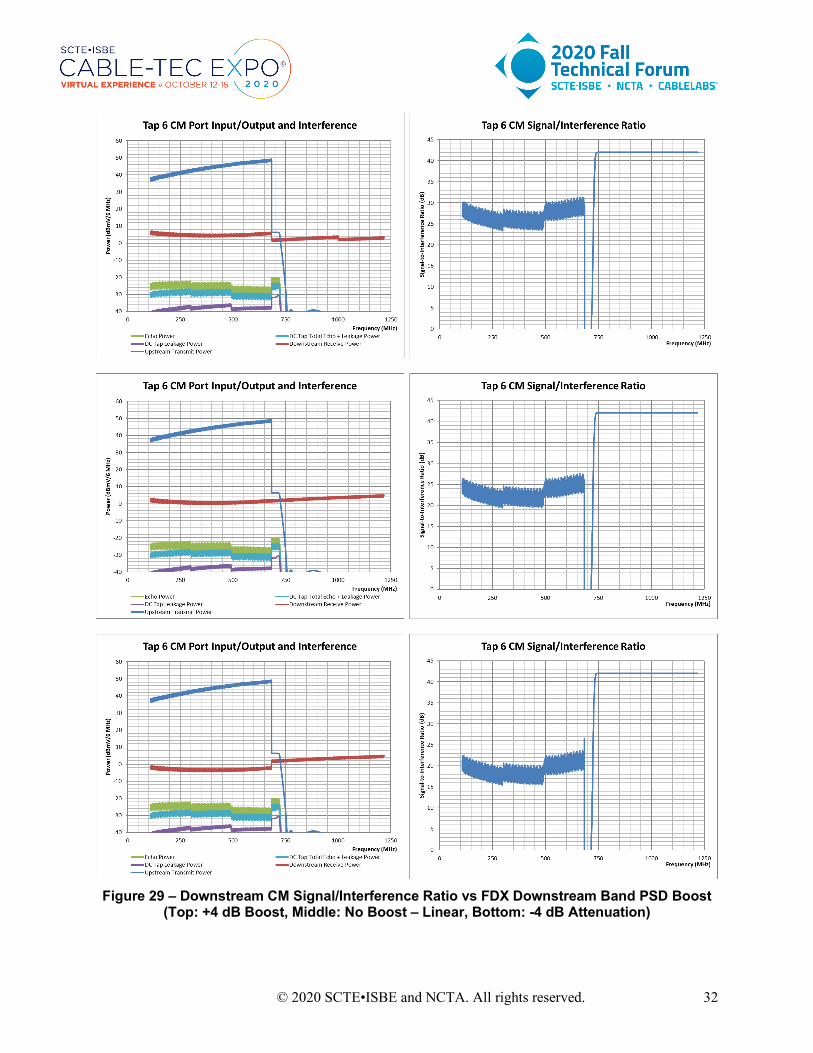
Figure 29 shows an FDX network model we simulated of the Downstream CM Signal/Interference Ratio vs FDX Downstream Band PSD Boost. The top pair of graphs are for a +4 dB boost; the middle pair of graphs are for no boost or a linear uptilt PSD; and the bottom pair of graphs are for a -4 dB attenuation. The left side shows all upstream and downstream signal levels, downstream echoes, and leakage across the FDX directional coupler ports, and the total combined interference level into the downstream received signal at the CM. The right side shows the resulting
© 2020 SCTE•ISBE and NCTA. All rights reserved. 31
Figure 28 – Upstream Node Signal/Interference Ratio vs FDX Downstream Band PSD Boost
(Top: +4 dB Boost, Middle: No Boost – Linear, Bottom: -4 dB Attenuation)
© 2020 SCTE•ISBE and NCTA. All rights reserved. 32
Figure 29 – Downstream CM Signal/Interference Ratio vs FDX Downstream Band PSD Boost
(Top: +4 dB Boost, Middle: No Boost – Linear, Bottom: -4 dB Attenuation)
© 2020 SCTE•ISBE and NCTA. All rights reserved. 33
calculated downstream Signal-to-Interference Ratio (SIR) of the CM. These results show the direct correlation of the downstream node PSD level in the FDX band and the resulting downstream SIR of the CM in that band.
Unlike the node where the full duplex upstream and downstream signals are present in the same spectrum in the FDX band, with the high downstream launch power in the same spectrum as the upstream received signals render the SNR in negative territory, the CM operates in FDD mode. In this case, one of the three FDX sub-bands receives the downstream signal while the other two sub-bands are transmitting upstream, causing adjacent noise and emissions. And, there are echoes into the downstream receiving sub-band resulting in a positive (but low) SNR. Thus the echo cancellation in the node must have a cancellation depth of the interference in excess of 50 dB, while the CM, without self-induced co-channel interference instead requires a cancellation depth of adjacent channel interference of only around 20 dB. The details of such an analysis can be found in [1].
For a +4 dB downstream PSD boost, the SIR averages from 23 dB to 31 dB across the FDX band. For a 0 dB downstream PSD boost (strictly linear without step-downs), the SIR averages from 20 dB to 27 dB across the FDX band. For a -4 dB downstream PSD attenuation, the SIR averages from 16 dB to 24 dB across the FDX band. So decreasing the PSD level in the FDX downstream directly decreases the SIR approximately dB for dB for the CM.
This end-to-end FDX system analysis demonstrates the trade-off one can make for improving the reception on the CM side while degrading the reception on the other (node) side, and vice versa, using a different stepped PSD downstream profile at the node, tailored to the desired directional bit-loading increase while lowering the PSD slightly in the highest frequencies to maintain a constant total composite power in the node. The choice depends on the objective desired – higher spectral efficiency and bit-loading of the chosen signal direction (upstream or downstream) at the expense of the other virtually dB for dB. Note that 3 dB change in SNR corresponds to one bit per symbol difference in bit-loading.
9. Conclusion The transition from conventional sub-split Node + N systems to mid-split Node + 0 systems enables several steps toward the ultimate goal of FDX DOCSIS 4.0 that will significantly increase the upstream bandwidth to multi-gigabit speeds with high throughput. The first step in this transition has been described, starting from conventional sub-split cable systems to mid-split systems to high-split systems and eventually to a phased approach to enabling FDX DOCSIS. The RF spectrum to support both legacy video and data services and the separation of the CMTS core functions that connect to Remote PHY (R-PHY) nodes using a Distributed Access Architecture (DAA) enables this transition in both conventional and Node + 0 networks.
The path to higher speed networks, while supporting legacy video and data consumer premises equipment was explained. Lab and field data was analyzed together to provide the confidence in layering these technologies in an evolutionary fashion. Some mitigation strategies involving signal design launched from the R-PHY node and their effectiveness were explained. Cable Modem architectures to optimize both FDX and legacy DOCSIS signals were explained. Accommodation of legacy video set-top boxes and in-home networking with MoCA in order to fully utilize the 1.2 GHz design bandwidth of our cable systems has been shown.
All of these intermediate steps prepare for the initial introduction of FDX technology in a phased deployment as capacity and speed demands continue to grow. Configurable FDX allocation of RF spectrum will continue to support legacy SC-QAM video, SC-QAM based DOCSIS 3.0, and
© 2020 SCTE•ISBE and NCTA. All rights reserved. 34
OFDM/OFDMA based DOCSIS 3.1 in a compatible and compliant way with an evolutionary path to transition to all IP video with FDX DOCSIS 4.0. Some optimizations of RF spectrum allocation and the conditioning of transmission and reception of FDX signals to improve the effectiveness of the echo cancellation technologies have been proposed. The evolutionary path to 10G networks using FDX DOCSIS 4.0 will enable our networks to grow with the ever increasing demand to support both existing and future services for our customers.
© 2020 SCTE•ISBE and NCTA. All rights reserved. 35
Abbreviations
ACI adjacent channel interference ALI Adjacent leakage interference BAU Business as usual CACIR Carrier/ACI Ratio CCI Co-channel interference CIR Carrier-to-Interference Ratio CM Cable modem CMTS cable modem termination system CNR Carrier to noise ratio CPE Customer premise equipment DAA Distributed Access Architecture DOCSIS Data Over Cable Service Interface Specification EC Echo Canceller FDD Frequency Division Duplex FDX Full Duplex DOCSIS FDX-L A legacy DOCSIS 3.1 cable modem which can transmit in the 108
MHz to 204 MHz Full Duplex upstream channels and receive in the 258 MHz to 684 MHz Full Duplex downstream channels in a high-split access network, or it can receive in the 108 to 684 MHz Full Duplex downstream channels in a mid-split access network with no access to upstream Full Duplex Channels.
HFC Hybrid Fiber-Coax IG Interference Group MER Modulation error ratio MHz Megahertz MoCA Multimedia over Coax Alliance OFDM Orthogonal Frequency Division Multiplexing PA Power amplifier PSD Power spectral density PHY Physical RB Resource Block RBA Resource Block Assignment R-PHY Remote Physical (layer) SC-QAM Single Carrier Quadratude Amplitude Modulation SNR Signal to Noise Ratio STB Set-top Box TCS Transmit Channel Set TG Transmission Group
© 2020 SCTE•ISBE and NCTA. All rights reserved. 36
Bibliography & References [1] Richard S. Prodan, Full Duplex DOCSIS PHY Layer Design and Analysis for the Fiber Deep Architecture, 2017 SCTE-ISBE Cable-Tec Expo Fall Technical Forum, Denver, CO.
[2] SCTE 235, Operational Practice for the Coexistence of DOCSIS 3.1 Signals and MoCA Signals in the Home Environment, 2017.
[3] Multimedia over Coax Alliance, MoCA 2.0 Field Trial Report, 2016.


